Embed Size (px)
Citation preview

Evolution of the barrier islands in Mississippi during and following Hurricane Katrina
i
IMPACTS OF HURRICANE KATRINA ON THE GEOMORPHOLOGY
OF THE MISSISSIPPI BARRIER ISLANDS
A research report submitted to:
National Park Service
Prepared By:
Dr. Chris Houser
Stuart Hamilton
Dr. Klaus Meyer-Arendt
Department of Environmental Studies
University of West Florida
11000 University Parkway
Pensacola, Florida, USA
32514
Signature Date
Evolution of the barrier islands in Mississippi during and following Hurricane Katrina
TABLE OF CONTENTS
LIST OF TABLES......................................................................................................................................................II LIST OF FIGURES ....................................................................................................................................................II SUMMARY OF RESULTS .......................................................................................................................................V STUDY OVERVIEW ...................................................................................................................................................1 METHODOLOGY .......................................................................................................................................................8
DATA ANALYSIS........................................................................................................................................................9 IMPACTS TO PETIT BOIS ISLAND .....................................................................................................................10
VOLUME CHANGE ...................................................................................................................................................10 SHORELINE CHANGE................................................................................................................................................10 ELEVATION CHANGE ...............................................................................................................................................16 MORPHOLOGY CHANGE...........................................................................................................................................20 BATHYMETRY CHANGES .........................................................................................................................................21
IMPACTS TO HORN ISLAND................................................................................................................................28 VOLUME CHANGE ...................................................................................................................................................28 SHORELINE CHANGE................................................................................................................................................33 ELEVATION CHANGE ...............................................................................................................................................34 MORPHOLOGY CHANGE...........................................................................................................................................38 BATHYMETRY CHANGES .........................................................................................................................................41
IMPACTS TO SHIP ISLAND ..................................................................................................................................46 VOLUME CHANGE ...................................................................................................................................................46 ELEVATION CHANGE ...............................................................................................................................................50 MORPHOLOGY CHANGE...........................................................................................................................................50 BATHYMETRY CHANGES .........................................................................................................................................53
REFERENCES..........................................................................................................................................................56
i
Evolution of the barrier islands in Mississippi during and following Hurricane Katrina
LIST OF TABLES Table 1. Canonical correlation coefficients (r) between the pre- and post-storm profiles for Petit Bois Island, with the largest coefficients (strongest relationships) highlighted…………………………………….21 Table 2. Canonical correlation coefficients (r) between the pre- and post-storm profiles for Horn Island, with the largest coefficients (strongest relationships) highlighted……………………………………………..39 LIST OF FIGURES Figure 1. Relationship between average pre-storm elevation and (a) post-storm elevation and (b) elevation change (post-pre elevation) for Petit Bois, Ship and Horn Islands. Also shown is the relationship for Santa Rosa Island for Hurricane Ivan…………………………………………………………..vii Figure 2. Relationship between average pre-storm elevation and (a) volume change and (b) shoreline change (post-pre elevation) for Petit Bois, Ship and Horn Islands. Also shown is the relationship for Santa Rosa Island for Hurricane Ivan……………………………………………………………………………viii Figure 3. Pre- and post-storm bathymetry for the eastern end of Petit Bois Island showing the landward (northern) migration of the nearshore terrace and loss in elevation……………………………………………ix Figure 4. Hurricane Impact levels of Sallenger (2000)………………………………………………………….1 Figure 5. Map of the Mississippi barrier islands…………………………………………………………………5
Figure 6. Alongshore variation in wave height and surge height at (a0 Petit Bois Island, (b) Horn Island and (c) Ship Island…………………………………………………………………………………………………...7 Figure 7. (A) Alongshore variation (by transect) in volume change for Petit Bois Island from West to East. The alongshore variation has been smoothed using a 3-point moving average. Positive change represents accretion and negative change represents erosion. (B) Alongshore variation (by transect) in shoreline position for Petit Bois Island from West to East. The alongshore variation has been smoothed using a 3-point moving average. Positive change represents accretion and negative change represents erosion……………………………………………………………………………………………………………….12 Figure 8. Oblique aerial photographs of morphological change to Petit Bois Island following Hurricane Katrina. Photographs were taken November 30, 2005 and all photographs from the aerial survey are provided on the accompanying compact disc…………………………………………………………………...13 Figure 9. Pre-storm LiDAR data for Petit Bois Island………………………………………………………….14 Figure 10. Post-storm LiDAR data for Petit Bois Island……………………………………………………….15 Figure 11. Scatter plot of alongshore variation (by transect) in island volume change with shoreline position for Petit Bois. For both variables, a positive change represents accretion and negative represents erosion………………………………………………………………………………………………….16 Figure 12. (a) Alongshore variation in pre- and post-storm elevation and (b) the relationship between volume change and the change in average elevation (post-pre-storm elevation)…………………………..17 Figure 13. (a) Relationship between pre-storm elevation and elevation change. Also shown (b) is the relationship between pre-storm elevation and change in profile volume……………………………………..18 Figure 14. (a) Relationship between pre-storm elevation and post-storm elevation. Also shown (b) is the relationship between pre-storm elevation and shoreline change……………………………………………...19
ii

Evolution of the barrier islands in Mississippi during and following Hurricane Katrina
Figure 15. Characteristic (a) pre-storm and (b) post-storm cross-shore profiles for Petit Bois Island…...22 Figure 16. Alongshore factor scores for the pre-storm and post-storm characteristic profiles……………23 Figure 17. Comparison of cross-island profiles (factor scores) for the pre- and post-storm eigenvalues with strong correlations identified through canonical correlation analysis……………………………………24 Figure 18. (a) Characteristic offshore profiles for Petit Bois Island and (b) alongshore factor scores for the characteristic profiles…………………………………………………………………………………………..25 Figure 19. Alongshore variation in the distance of the nearshore bar offshore relative to (a) the depth to the bar crest and (b) the average pre-storm elevation of the island…………………………………………..26 Figure 20. Alongshore variation in the distance of the nearshore bar offshore relative to (a) shoreline change and (b) the change in profile volume……………………………………………………………………27 Figure 21. Alongshore variation (by transect) in volume change for Horn Island from West to East. The alongshore variation has been smoothed using a 3-point moving average. Positive change represents accretion and negative change represents erosion…………………………………………………………….28 Figure 22. Oblique aerial photographs of morphological change to Horn Island following Hurricane Katrina. Photographs were taken November 30, 2005 and all photographs from the aerial survey are provided on the accompanying compact disc…………………………………………………………………...30 Figure 23. Pre-storm LiDAR data for Horn Island……………………………………………………………..31 Figure 24. Post-storm LiDAR data for Horn Island…………………………………………………………….32 Figure 25. Pre- and post-storm locations of beachface ridges……………………………………………….33 Figure 26. Alongshore variation (by transect) in shoreline position for Horn Island from West to East. The alongshore variation has been smoothed using a 3-point moving average. Positive change represents accretion and negative change represents erosion……………………………………………….34 Figure 27. Scatter plot of alongshore variation (by transect) in island volume change with shoreline position for Horn Island. For both variables, a positive change represents accretion and negative represents erosion………………………………………………………………………………………………….35 Figure 28. (a) Alongshore variation in pre- and post-storm elevation and (b) the relationship between volume change and the change in average elevation (post-pre-storm elevation)…………………………..36 Figure 29. (a) Relationship between pre-storm elevation and elevation change. Also shown (b) is the relationship between pre-storm elevation and change in profile volume……………………………………..37 Figure 30. (a) Relationship between pre-storm elevation and post-storm elevation. Also shown (b) is the relationship between pre-storm elevation and shoreline change……………………………………………...38 Figure 31. Characteristic (a) pre-storm and (b) post-storm cross-shore profiles for Horn Island………...40 Figure 32. Alongshore factor scores for the pre-storm and post-storm characteristic profiles……………41 Figure 33. Comparison of cross-island profiles (factor scores) for the pre- and post-storm eigenvalues with strong correlations identified through canonical correlation analysis……………………………………42
iii

Evolution of the barrier islands in Mississippi during and following Hurricane Katrina
Figure 34. (a) Characteristic offshore profiles for Horn Island and (b) alongshore factor scores for the characteristic profiles……………………………………………………………………………………………….44 Figure 35. Alongshore variation in the distance of the nearshore bar offshore relative to (a) the depth to the bar crest and (b) the average pre-storm elevation of the island…………………………………………..45 Figure 36. Alongshore variation in the distance of the nearshore bar offshore relative to (a) shoreline change and (b) the change in profile volume……………………………………………………………………46 Figure 37. Alongshore variation (by transect) in volume change for Ship Island from West to East. The alongshore variation has been smoothed using a 3-point moving average. Positive change represents accretion and negative change represents erosion…………………………………………………………….47 Figure 38. Oblique aerial photographs of morphological change to Ship Island Island following Hurricane Katrina. Photographs were taken November 30, 2005 and all photographs from the aerial survey are provided on the accompanying compact disc…………………………………………………………………...48 Figure 39. Pre-storm LiDAR data for Ship Island……………………………………………………………...49 Figure 40. Post-storm LiDAR data for Ship Island…………………………………………………………….50 Figure 41. (a) Alongshore variation in pre- and post-storm elevation for Ship Island……………………..51 Figure 42. Relationship between (a) profile volume change and the change in average elevation (post-pre-storm average elevation), and (b) pre-storm average elevation and volume change………………….52 Figure 43. (a) Relationship between pre-storm elevation and elevation change. Also shown (b) is the relationship between pre-storm elevation and change in profile volume……………………………………..53 Figure 44. Characteristic (a) pre-storm and (b) post-storm cross-shore profiles for Ship Island…………55 Figure 45. Characteristic (a) pre-storm and (b) post-storm cross-shore profiles for Ship Island…………56
iv

Evolution of the barrier islands in Mississippi during and following Hurricane Katrina
SUMMARY OF RESULTS
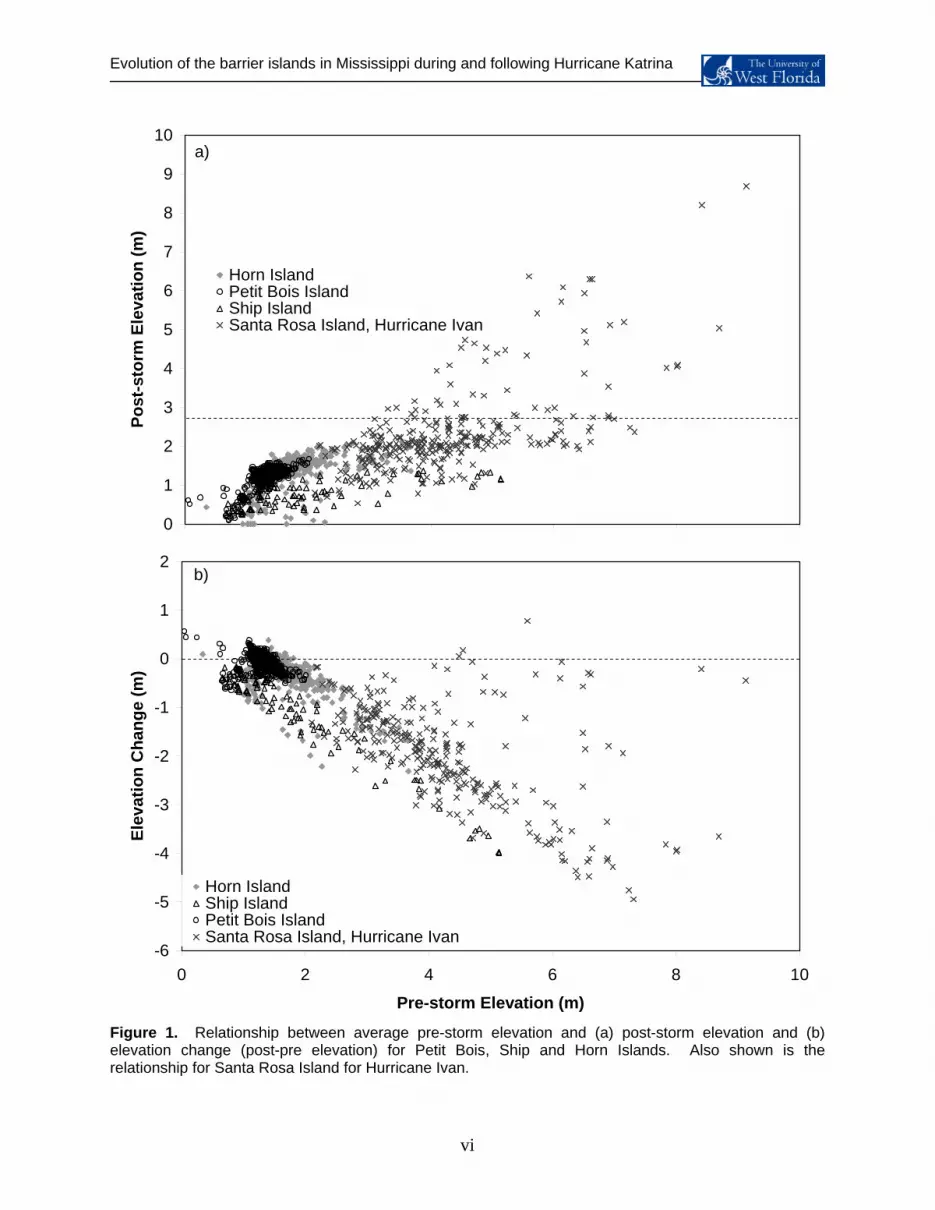
On all three islands, the morphological impact of Hurricane Katrina depended on the pre-storm average
elevation as predicted by the Sallenger (2000) model of hurricane impacts. Specifically, the shoreline
change, overwash penetration (see Morton, 2007) and volume change were inversely related to the pre-
storm average elevation (Figures 1 and 2). The sediment eroded from the areas of higher average
elevation (during swash and dune impact) was deposited on the shoreface as a nearshore bar. In these
areas, the backbarrier island morphology remained intact, fronted by a short overwash terrace. In areas
where the average pre-storm elevation was at a local minimum, the island experienced overwash early in
the storm (ie. limited swash and dune impact), leading to sediment losses to the backbarrier, with some
sediment deposited in the sound. These areas had limited bar development.
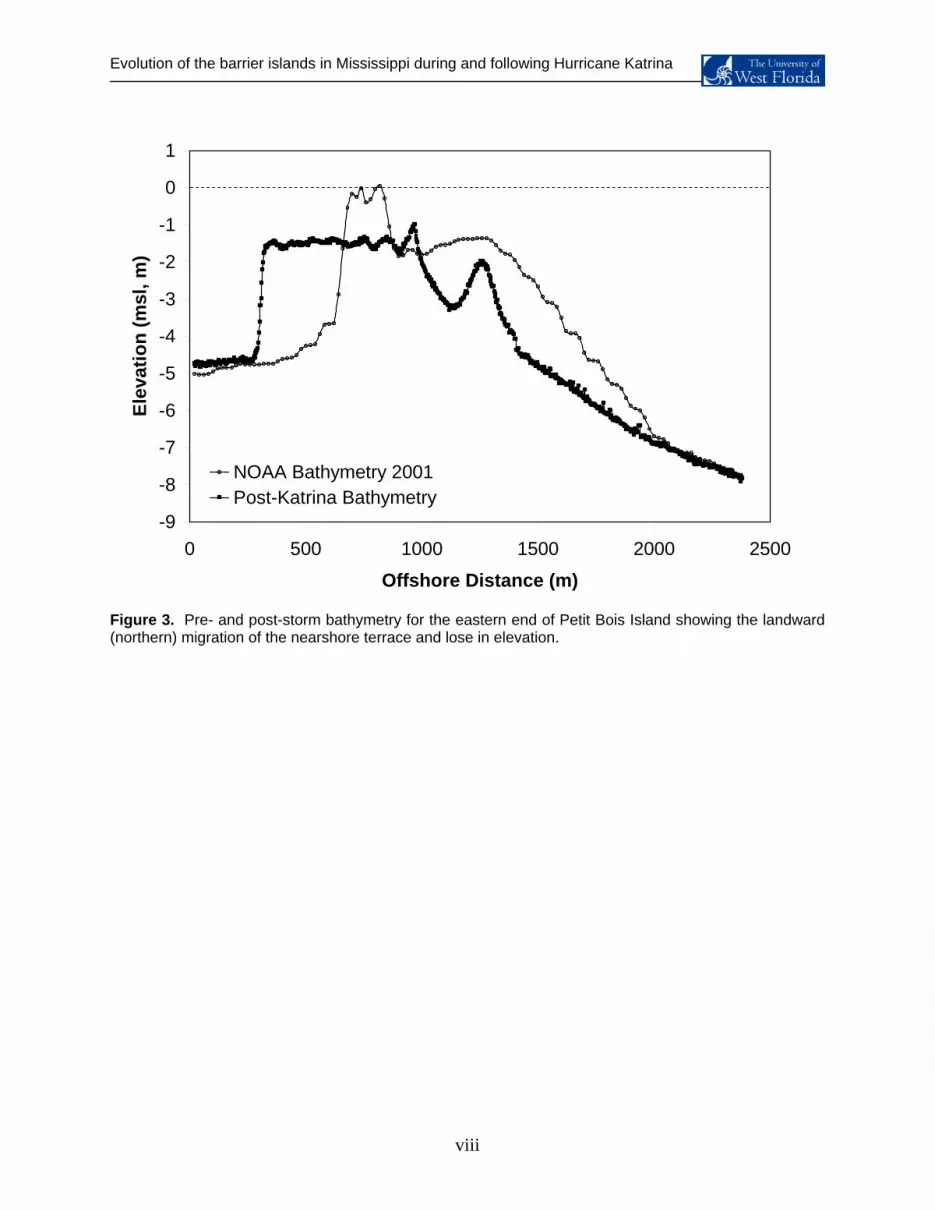
Some of the greatest change in island morphology occurred at the eastern ends of Horn and Petit Bois
Islands and at both ends of Ship Island. The eastern end of each islands were eroded and there was a
reorientation of the island to the dominant wave direction (from the SE). One of the most dramatic
changes (outside the loss of land on Ship Island) was the migration of the spit terraces on the eastern
end of Petit Bois Island. Based on 2001 NOAA bathymetry data, it appears that the spit terrace
decreased in elevation by ~1.5 m and migrated to the north by ~315 m (Figure 3). As the nearshore bar
on this terrace continues to migrate landward (to the north), it is anticipated that a small spit will emerge
on the terrace as was present in the 2001 bathymetry. In contrast, the western end of Petit Bois and
Horn Islands accreted (in volume and shoreline position) through alongshore sediment delivery from the
east.
Based on the results of this study, there was little change in the sediment volume for Petit Bois and Horn
Islands. Most of the sediment eroded from the beachface and dune systems was deposited on the
shoreface as bars and recovery will depend on the onshore migration of these features. The length of
time for bar migration and beachface recovery along the Gulf Coast remains poorly understood.
Sediment volume on Petit Bois and Horn Islands was only lost from the islands were the overwash
terraces extended to backbarrier shoreline. This sediment is most likely lost from the system through cold
front erosion, although it is possible that the sediment is distributed alongshore. In contrast, significant
changes in volume were observed on Ship Island due to the lower elevation of the island were it was
eroded during Hurricane Camille and only partly recovered and due to the higher storm surge and wave
height on the island. The sediment was deposited along the backbarrier shoreline and into Mississippi
Sound, which will limit the potential for post-storm recovery.
v
Evolution of the barrier islands in Mississippi during and following Hurricane Katrina
0
1
2
3
4
5
6
7
8
9
10
0 2 4 6 8
Pre-storm Elevation (m)
Post
-sto
rm E
leva
tion
(m)
Horn IslandPetit Bois IslandShip IslandSanta Rosa Island, Hurricane Ivan
a)
10
-6
-5
-4
-3
-2
-1
0
1
2
0 2 4 6 8
Pre-storm Elevation (m)
Elev
atio
n C
hang
e (m
)
Horn IslandShip IslandPetit Bois IslandSanta Rosa Island, Hurricane Ivan
b)
10
Figure 1. Relationship between average pre-storm elevation and (a) post-storm elevation and (b) elevation change (post-pre elevation) for Petit Bois, Ship and Horn Islands. Also shown is the relationship for Santa Rosa Island for Hurricane Ivan.
vi

Evolution of the barrier islands in Mississippi during and following Hurricane Katrina
-1000
-800
-600
-400
-200
0
200
0 2 4 6 8Pre-Storm Elevation (m)
Volu
me
Cha
nge
(m3 m
-1)
Horn IslandShip IslandPetit Bois IslandSanta Rosa Island, Hurricane Ivan
Accretion
Erosion
a)
10
-300
-250
-200
-150
-100
-50
0
50
100
150
200
0 2 4 6 8Pre-Storm Elevation (m)
Shor
elin
e C
hang
e (m
)
Horn IslandPetit Bois IslandSanta Rosa Island, Hurricane Ivan
Accretion
Erosion
b)
10
Figure 2. Relationship between average pre-storm elevation and (a) volume change and (b) shoreline change (post-pre elevation) for Petit Bois, Ship and Horn Islands. Also shown is the relationship for Santa Rosa Island for Hurricane Ivan.
vii
Evolution of the barrier islands in Mississippi during and following Hurricane Katrina
viii
-9
-8
-7
-6
-5
-4
-3
-2
-1
0
1
0 500 1000 1500 2000 2500
Offshore Distance (m)
Elev
atio
n (m
sl, m
)
NOAA Bathymetry 2001Post-Katrina Bathymetry
Figure 3. Pre- and post-storm bathymetry for the eastern end of Petit Bois Island showing the landward (northern) migration of the nearshore terrace and lose in elevation.

Evolution of the barrier islands in Mississippi during and following Hurricane Katrina
STUDY OVERVIEW
Hurricanes and tropical storms produce elevated water levels and large waves, capable of eroding the
beachface and causing overwash and barrier breaching. In general, the morphological response of a
barrier island can include:
1. shoreface erosion and bar formation and migration (also known as the Bruun Rule) 2. erosion alongshore by longshore transport 3. migration onshore via roll-over or over stepping (net sediment transfer landward)
The Bruun rule is a simple two-dimensional model of shoreline response to sea level change (including
surge), in which the equilibrium profile remains unchanged as the shoreline moves in response to rising
sea level (Cooper and Pilkey, 2004). Sand that moves from the upper portion of the beach profile
accumulates at the lower portion of the profile, thus maintaining shoreline geometry. However, this type
of response assumes that 1) geology does not play a role in shoreline shape, 2) sediment is only moved
by waves, and 3) there is no significant movement beyond the depth of closure, the seaward limit of
sediment transport. (USACE, 2002). When water levels exceed the height of the foredune or the beach
ridge, the island experiences overwash. Sallenger (2000) describes this translation from offshore erosion
during swash and impact regimes to overwash as a balance between the elevation of the storm surge
relative to the vertical geometry of the coast, (Figure 4) which in turn depends on the extent and height of
foredune or beach ridge development (Thieler and Young, 1991; Sallenger, 2000).
Impact Level 1: No Net Change to the System
Impact Level 2: Net Dune Erosion
Impact Level 3: Net Onshore Transport, Order 100 meters
Figure 4. Hurricane Impact levels of Sallenger (2000).
1

Evolution of the barrier islands in Mississippi during and following Hurricane Katrina
The swash regime occurs during periods of low wave energy. Impacts in the swash regime are restricted
to the swash zone, the zone between to the foreshore of the beach seaward of the foredune. As a
consequence, the foreshore is eroded and sand transported offshore, and is returned (slowly) to the
beach during periods of low wind and wave energy (Sallenger, 2000). When the storm tide (astronomical
tide plus storm surge) increases, it will eventually collide with the base of the foredune (Dlow), and
sediment is eroded offshore. During particularly strong storms, sand can be moved offshore beyond the
point where it will be transported under non-storm conditions (Sallenger, 2000).
The overwash regime occurs when the run-up height exceeds the dune crest (Rhigh > Dheight), and water
and sediment flow landward across the barrier. Although there is some loss of sediment offshore as the
dune is first impacted, most of the sediment eroded from the dune is deposited landward as overwash
(Sallenger 2000). This sediment can be only returned to the recovering foredune through aeolian
transport from landward offshore winds originating on land and blowing offshore (Leatherman, 1979). If
sediment is not returned to the beachface from the overwash or new sediment is made available from
alongshore or the shelf, the island will experience a net landward migration or roll-over. The inundation
regime occurs when surge levels greatly exceed the height of the foredune, such that the island is
completely submerged. This can lead to island overstepping.
A good example of the importance of vertical geometry on the morphological response during an extreme
storm is the impact of Hurricane Camille on Dauphin Island (Morton and Sallenger 2003). Prior to the
storm, island elevation varied from 2 to 3 m with the largest dunes on the eastern end of the island. The
maximum surge during Hurricane Camille reached 2.8 m; such that the eastern end of the island was in a
“collision regime.” Morphologic changes due to overwash gradually changed westward along the island
where overwash and surge impacts progressively increased. The western end of the island not only had
smaller dunes but also a steeper bathymetric gradient. In these areas, beach erosion via direct wave
impact was magnified because storm waves energy was not dissipated offshore with the presence of
shallow water or a nearshore bar (Thorton et al. 2006). The smaller dunes provided less protection and
more sediment was transported landward as overwash (Morton and Sallenger 2003).
While the Sallenger model focuses on the foredune height, the alongshore extent and presence of
secondary dunes can also be important. Topographic relief such as dunes and swales confine the surge
into channels or low interdune areas and accelerate flow (Morton 2002; Leatherman 1977). Sediment
transport within these areas can be further amplified by the shallow flows and high wind stress (Morton
and Sallenger 2003). As found by Houser et al. (in press), overwash penetration and offshore erosion
was increased in areas with discontinuous foredunes through lateral erosion, and decreased in areas
where secondary dunes were present. Overwash penetration on Santa Rosa Island, Florida, following
2

Evolution of the barrier islands in Mississippi during and following Hurricane Katrina
Hurricane Ivan (2004) varied with the cross-island geometry and specifically with the presence of
secondary dunes.
The shoreline of the Gulf Islands National Seashore along the Mississippi coast suffered significant beach
erosion and widespread overwash and breaching. The impact of Hurricane Katrina on the barrier island
chain depended on the vertical geometry of the coast, which in turn depends on the extent and height of
foredune development (Sallenger, 2000). The erosion sustained by the islands during past extreme
storms such as Hurricane Camille (1969) and more recently Hurricanes Ivan and Dennis has precluded
growth of the islands. The anticipated increase in the frequency of extreme storms with the warming of
Atlantic sea-surface temperatures (Keim et al., 2004) will reduce the time available for the barrier island to
recover. The erosion sustained by the barrier islands along the Mississippi coast during Hurricane
Katrina will condition the response of the islands to future extreme storms and will therefore affect their
longer-term evolution. The ability of a barrier island to redevelop and the time required for that rebuilding depends on the
availability of sediment. Recent evidence suggests that the barrier islands along the northern Gulf of
Mexico can conserve mass during catastrophic hurricanes through the generation of overwash fans
(Stone et al., 2004). These overwash fans are, however, eroded during the passage of cold-fronts (Stone
and Morgan, 1993; Armbruster et al., 1995; Chaney and Stone, 1996; Armbruster, 1997; Stone et al.,
2004; McBride and Byrnes, 1997) that generate strong northerly winds and steep high-frequency waves
(Kraus et al., 1991). Despite recent studies documenting the immediate impact of extreme storms and
the post-storm erosion of overwash deposits on the barrier islands of the Gulf of Mexico, the mechanisms
responsible for post-storm changes in the island volume and the sediment transport pathways along the
backbarrier have not been examined.
Island recovery can also occur through sediment delivery from alongshore and the onshore migration and
eventual welding of nearshore bars created during the storm event. The model of Wright and Short
(1984) is the most commonly cited morphometric model. It describes three basic forms and process
signatures within a continuum of beach states from dissipative to reflective. In this model, beach states
are differentiated with respect to the dimensionless fall velocity (Ω):
TwH
s
b=Ω
Wright and Short proposed that the beach would be dissipative when Ω > 6, intermediate when 1 < Ω < 6,
and reflective when Ω < 1. To develop their model, Wright and Short (1984) used a morphological
database spanning more than 6 years, consisting of pre- and post-storm surveys from a number of
3

Evolution of the barrier islands in Mississippi during and following Hurricane Katrina
environmentally different beaches in Australia. It was found that over the longer term, a given beach will
tend to exhibit a modal (or most frequently recurrent) state, which depends on the modal wave conditions,
around which a spread of higher or lower waves may prevail (Wright and Short, 1984). Recovery from
the nearshore bar occurs via bar migration onshore when waves are shoaling and breaking landward of
the bar crest (Plant et al., 2001; Houser and Greenwood, 2005). Transport of sediment onshore is
associated with the oscillatory skewness and skewed accelerations that develop as the wave breaks
(Houser and Greenwood, 2005). Unlike offshore migration during storms, beachface recovery requires
an extended period of low-wave activity to enable bar migration onshore and ultimately bar attachment to
the beachface.
Mississippi Barrier Islands The Mississippi barrier islands are arranged east to west as follows: Petit Bois, Horn, East Ship, West
Ship, and Cat Islands (Figure 5). Presently, these islands are part of the Gulf Islands National Seashore
and are managed by the National Park Service. The National Park Service is currently updating its 1979
historical management plan to a plan that will adequately address issues facing the islands for the next
15-20 years (National Park Service 2006).
The islands originated during the Pleistocene period in response to water level changes (Otvos, 1979).
The framework of the islands (from northwest Florida to the Mississippi delta) consists of numerous low-
profile, well-preserved sand beach ridges and swales (Waller and Malbrough, 1976). The arrangement of
these ridges and swales relates to the origins of sediment supply for the islands, suggesting that the
beach ridge topography was formed during a period of abundant sediment supply. The present sand
supplies are the result of spit growth supplied by sediments derived from the east by sediment discharged
by the Apalachicola River, and locally by the Mobile River and Mississippi River (Schmid, 2003; Waller
and Malbrough, 1976). Since formation, the islands have experienced significant lateral migration to the
west while remaining approximately the same distance offshore. In systems with multiple subparallel
barriers, longshore currents can transport sand from adjacent islands, which serve as a new source of
sediment for recovery (Leatherman, 1979). However, the physical disconnect between islands and the
dredging of the passes may have reduced or even completely removed the longshore source of
sediment.
Island formation in Mississippi has been attributed to two mechanisms. The first suggests that sediment
was transported from Mobile Bay area to an offshore continental shelf source (Shepard 1960). This
offshore sediment source provided sediment supply to the islands via onshore bar progression (Shepard
1960). The second mechanism involves broad shoals composed of soft and unconsolidated sands
between Mobile Bay and Pensacola which supplied sands to the west across the Mobile tidal inlet (Kwon,
4

Evolution of the barrier islands in Mississippi during and following Hurricane Katrina
Figure 5. Map of the Mississippi barrier islands.
1975) as prevailing easterly winds enhanced longshore currents (Waller and Malbrough, 1976). Through
time, silt and muddy sand layers originating from the Mobile Point Peninsula and Dauphin Island
consolidated to form emerging islands formed between eastern Dauphin Island and New Orleans (Otvos,
1979). Otvos (1979) collect core-hole data and used comparisons of microfauna to demonstrate that the
mainland shore of the islands remained unbarred in the Mid-Late Holocene period. This suggests that
the Mississippi barrier islands emerged from shoals in their present locations and shifted west with
longshore sediment transport over time (Otvos, 1979). In contrast to the Mississippi mainland coast, an
acoustic survey of the Horn and Petit Bois shore found that present passes within the Mississippi Sound
were not inherited from Late Pleistocene stream entrenchment (Otvos, 1979). Prevailing winds are out of
the east and enhance longshore currents that move sediment westward (Waller and Malbrough, 1976).
Soil samples from the islands reveal a progressive decrease in median grain size to the west (Waller and
Malbrough, 1976). The combination of a decreasing sediment size and the westward lateral drift trend of
the islands further enforces the idea of that sediment is transported alongshore from the Mobile Bay.
Six hurricanes (category 3 or greater on the Saffir-Simpson Scale) have made landfall in the Mississippi
5

Evolution of the barrier islands in Mississippi during and following Hurricane Katrina
area since 1969. These hurricanes include; Camile (1969), Frederic (1979), Elena (1985), Andrew
(1992), and Ivan (2004) (NOAA, 2006). Most recently, Hurricane Katrina made landfall as a category 3
with sustained winds of 59.2 ms-1 near Buras, Louisiana, on August 29, 2005 (Knabb et al., 2005). The
storm had an eye wall radius of 13-48 km and hurricane force winds extending out 135 km to the east and
west. Peak winds of 77.2 ms-1 were recorded on August 28 about 306 km southeast of the mouth of the
Mississippi River (Knabb et al., 2005). The storm created a storm surge that extended from Western
Louisiana and into the Florida Panhandle (Knabb et al., 2005); surge levels were between 3-5 m along
the eastern Mississippi coast from Gulfport to Pascagoula (Knabb et al., 2005). The extreme surge levels
are attributed to the storm’s large horizontal size, with the surge being further increased by the large
waves (and set-up) created the previous day when the storm reached a category 5 level (Knabb et al.,
2005). Measurements taken by the National Data Buoy Center (NDBC, 2005) suggested a significant
wave height (defined as the average of the one-third highest waves) of 9 m with a wave period of 17 s as
early in the storm measured at buoy 42040, (approximately 115 km south of Dauphin Island, Alabama;
Knabb et al., 2005). The alongshore variation in predicted wave and surge heights are presented for
each island in Figure 6.
0
1
2
3
4
5
6
Wav
e H
eigh
t (m
) and
Sur
ge H
eigh
t (m
)
Wave HeightSurge Height
a)
6

Evolution of the barrier islands in Mississippi during and following Hurricane Katrina
0
1
2
3
4
5
6W
ave
Hei
ght (
m) a
nd S
urge
Hei
ght (
m)
Wave HeightSurge Height
b)
0
1
2
3
4
5
6
Wav
e H
eigh
t (m
) and
Sur
ge H
eigh
t (m
)
Wave HeightSurge Height
c)
Figure 6. Alongshore variation in wave height and surge height at (a) Petit Bois Island, (b) Horn Island and (c) Ship Island.
7

Evolution of the barrier islands in Mississippi during and following Hurricane Katrina
METHODOLOGY
Changes to the barrier islands of the Gulf Islands National Seashore in Mississippi (Petit Bois, Horn, East
Ship and West Ship) will be characterized by documenting conditions relative to the pre-storm
morphology and the role of past extreme storms in shaping the morphology. This analysis will be
completed through LIDAR elevation maps (pre- and post-storm) provided by the National Oceanographic
and Atmospheric Administration (NOAA). In the past, research involving morphologic change to barrier
islands was limited to data collected by surveying techniques and aerial photo interpretation. These
methods produced coarse resolutions and were highly time-consuming (White and Wang, 2003). The
Laser Imaging Detection and Ranging System (LiDAR) is an active remote sensing application (Zhang et
al., 2005), that uses a high-frequency laser directed at the earth’s surface through an opening in the
bottom of an overhead aircraft. The laser system records the time difference between emissions of the
laser beam and the reception of the reflected laser signal in the aircraft (Meredith et al., 1999). A rotating
oscillatory mirror mounted to the front of the laser allows it to swath back and forth, providing a large
coverage swath area below the plane (Zhang et al., 2005). The system uses the combination of a high-
speed scanning system and a high-repeating laser-pulse frequency to determine x, y, and z values
across the terrain below, thus producing a data set of high spatial resolution in little time (White and
Wang, 2003). The aircraft position is monitored by a GPS receiver mounted to the aircraft and a second
GPS station mounted to the ground is used for differential corrections (Zhang et al., 2005).
LiDAR elevation points were interpolated into digital elevation models (DEM), using the inverse distance
weighted method (IDW) with a power of ten and using the six nearest neighbours. The IDW interpolation
assumes that the interpolating surface should be influenced most by nearby points and should be less
influenced by distant points. Specifically, the interpolated surface is a weighted average of the points,
and the weight of each point decreases with distance. Because both elevation and depth are spatially
autocorrelated, using a weighted distance interpolation method explicitly accounts for interrelationships
between points. The interpolation yielded a root mean-square error of 0.16 for the pre-storm data set and
a root mean square error (the difference between the interpolated value and the actual value) of 0.10 for
the post-storm data set. Subaerial profiles were created from transects exported from DEMs. Elevation
profiles were constructed through the use of the LiDAR Data Handler tool within ArcMap, which exports
elevation data from the DEM. Points were exported from the DEM at 2 m intervals along transects.
Transects were spaced at 40 m intervals along the island and provided a cross-shore elevation reference
from the Gulf shoreline inland to the limit of the LIDAR data or tree line. Pre-storm LiDAR data for the
island extended to transect 24 at the eastern tip of the island. Post-storm LiDAR data were limited in
capturing the eastern end of the island and data was unavailable beyond transect 20.
Subaqueous changes to the island were examined through bathymetric profiles on both the Gulf and
sound sides of the islands as well as the inlets between each island. Pre-storm bathymetric profiles were
8

Evolution of the barrier islands in Mississippi during and following Hurricane Katrina
constructed using bathymetric data from 1975 obtained from NOAA Hydrographic surveys; however, gulf-
side data for the middle portion of the island were unavailable. The NOAA survey was collected using
single beam sonar across the entire portion of the Mississippi Sound and for portions of the Gulf side of
the Mississippi barrier islands. Bathymetry points were interpolated using the inverse distance weighted
method, with a power of two, using the eight nearest neighbors. The interpolation yielded a root mean-
square error of 0.59. Pre-storm bathymetric profiles were extracted at 7.5 m cross-shore intervals from
the model using the NOAA LiDAR Data Handler tool within ArcMap. Post-storm bathymetric data were
collected with the use of a Lowrance depth finder unit (model LMS-339) following the storm. Data were
collected on June 1 and 2. Post-storm transects were collected at 400 m (ten times the distance of the
land transects) intervals along the shoreline and extended from the shoreline to a distance of 1 km
offshore on the Gulf side and to a distance of 500 m on the sound side. Transect intervals of 400 m
provided a scale that indicated alongshore bathymetric variability, while offshore data collection distances
of 1 km and 500 m indicated closure of pre- and post-storm bathymetric profiles. A similar bathymetric
model was created using the post-storm sonar data. Tide variations during the collection of bathymetric
data were subtracted from the data based on tide data collected at the NOAA Pascagoula tide station
based on NAVD 1983.
Data Analysis
The analysis of pre-storm and post-storm data obtained from both the subaerial and subaqueous portions
of the islands was examined through the use of empirical orthogonal functions (EOF) analysis. EOF
analysis identified patterns in how the island responded to the storm and related changes to pre-storm
morphology both subaerial and subaqueous. EOF analysis is similar to principal component analysis
(PCA), except that the variable is examined through space rather than through time (Aubrey, 1979). The
eigenvalues correspond to a statistically optimal description of the data with respect to how the variance
is concentrated in the modes (Larson et al., 2003). EOF analysis allows a user to reduce the number of
variables and to detect structures in the interactions between variables. This allows variables to be
classified and can identify redundancies and associations in the data (Houser et al., in press). EOF
analysis has previously been used in coastal geomorphology to describe nearshore bar behavior (Larson
et al., 2003; Houser and Greenwood 2005) and morphological controls on hurricane impacts (Houser et
al. in press).
The relationships between pre- and post-storm topographies (bathymetric and aerial) were examined
through canonical correlation analysis (CCA). This analysis identifies patterns that occur simultaneously
in two different data sets and describes the nature of those patterns (Houser et al., submitted).
9
Evolution of the barrier islands in Mississippi during and following Hurricane Katrina
IMPACTS TO PETIT BOIS ISLAND
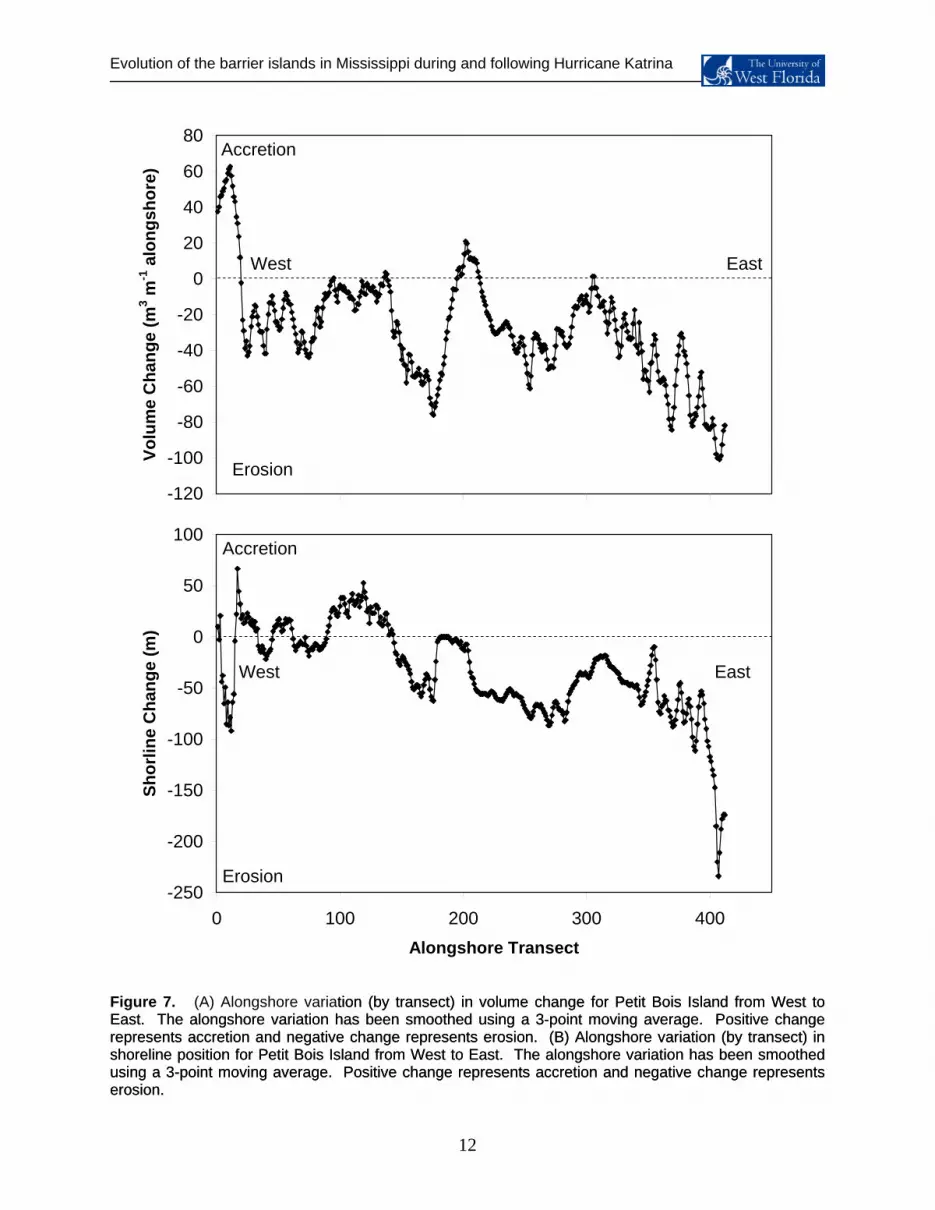
Oblique aerial photographs of the post-storm morphology are presented in Figure 8, and the pre- and
post-LiDAR images for Petit Bois Island are provided in Figures 9 and 10. The pre- and post-storm
average elevation of the island across each of the survey transects are provided in Figure 12. While
areas with large elevations were reduced in height, there were several areas of the island where the post-
storm average elevation increased, suggesting accretion during or immediately following the storm. A
review of the detailed analysis is provided in the following sections.
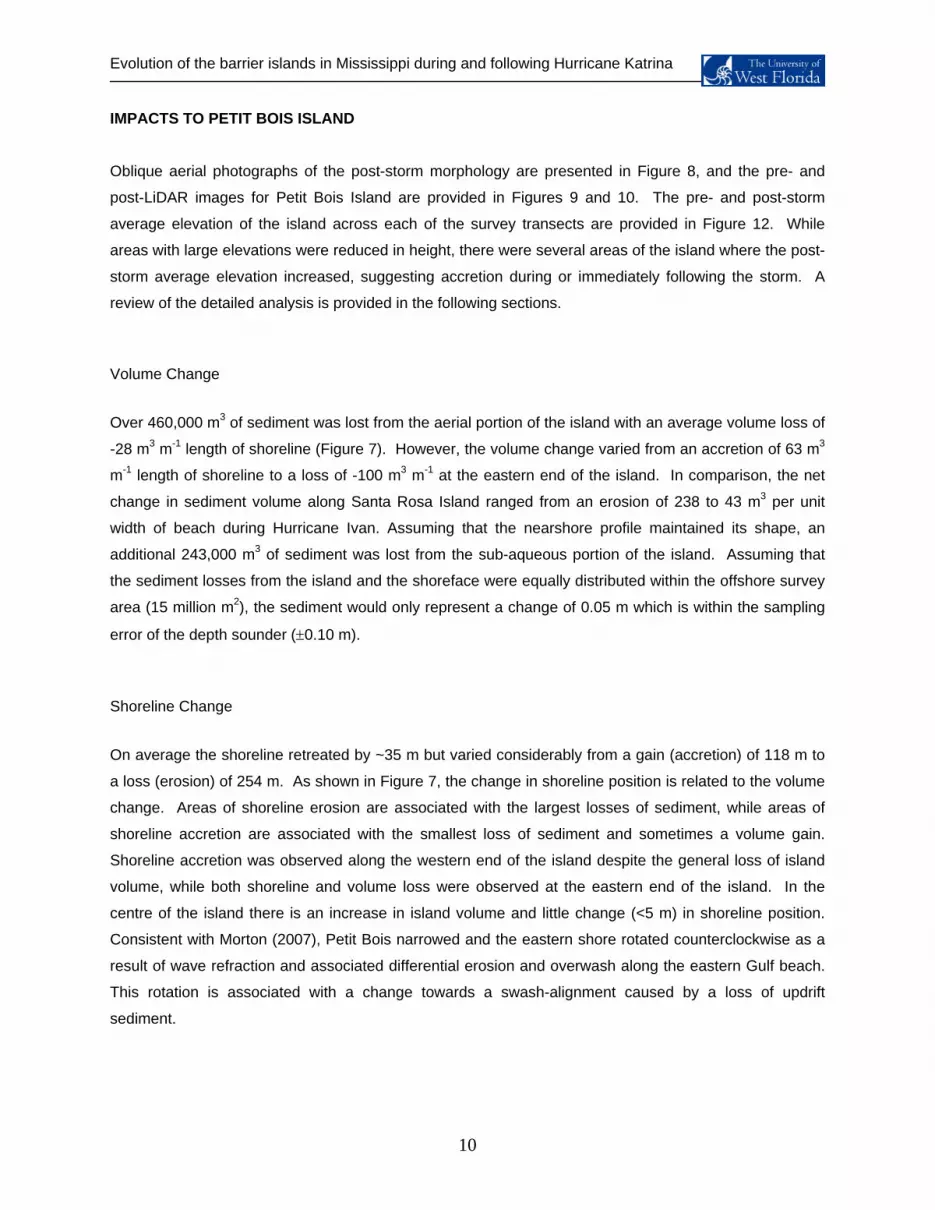
Volume Change
Over 460,000 m3 of sediment was lost from the aerial portion of the island with an average volume loss of
-28 m3 m-1 length of shoreline (Figure 7). However, the volume change varied from an accretion of 63 m3
m-1 length of shoreline to a loss of -100 m3 m-1 at the eastern end of the island. In comparison, the net
change in sediment volume along Santa Rosa Island ranged from an erosion of 238 to 43 m3 per unit
width of beach during Hurricane Ivan. Assuming that the nearshore profile maintained its shape, an
additional 243,000 m3 of sediment was lost from the sub-aqueous portion of the island. Assuming that
the sediment losses from the island and the shoreface were equally distributed within the offshore survey
area (15 million m2), the sediment would only represent a change of 0.05 m which is within the sampling
error of the depth sounder (±0.10 m).
Shoreline Change
On average the shoreline retreated by ~35 m but varied considerably from a gain (accretion) of 118 m to
a loss (erosion) of 254 m. As shown in Figure 7, the change in shoreline position is related to the volume
change. Areas of shoreline erosion are associated with the largest losses of sediment, while areas of
shoreline accretion are associated with the smallest loss of sediment and sometimes a volume gain.
Shoreline accretion was observed along the western end of the island despite the general loss of island
volume, while both shoreline and volume loss were observed at the eastern end of the island. In the
centre of the island there is an increase in island volume and little change (<5 m) in shoreline position.
Consistent with Morton (2007), Petit Bois narrowed and the eastern shore rotated counterclockwise as a
result of wave refraction and associated differential erosion and overwash along the eastern Gulf beach.
This rotation is associated with a change towards a swash-alignment caused by a loss of updrift
sediment.
10

Evolution of the barrier islands in Mississippi during and following Hurricane Katrina
11
Evolution of the barrie
r islands in Mississippi during and following Hurricane Katrina
12
Figure 7. (A) Alongshore variation (by transect) in volume change for Petit Bois Island from West to East. The alongshore variation has been smoothed using a 3-point moving average. Positive change represents accretion and negative change represents erosion. (B) Alongshore variation (by transect) in shoreline position for Petit Bois Island from West to East. The alongshore variation has been smoothed using a 3-point moving average. Positive change represents accretion and negative change represents erosion.
tion (by transect) in volume change for Petit Bois Island from West to East. The alongshore variation has been smoothed using a 3-point moving average. Positive change represents accretion and negative change represents erosion. (B) Alongshore variation (by transect) in shoreline position for Petit Bois Island from West to East. The alongshore variation has been smoothed using a 3-point moving average. Positive change represents accretion and negative change represents erosion.
-120
-100
-80
0 100 200 300Alongshore Transect
Volu
me
C -60
-40
-20
0
20
40
60
80
400
hang
e (m
3 m-1
alo
ngsh
ore)
Erosion
Accretion
EastWest
-250
-200
-150
-100
-50
0
50
100
0 100 200 300Alongshore Transect
Shor
line
Cha
nge
(m)
Erosion
Accretion
West East
400
Evolution of the barrier islands in Mississippi during and following Hurricane Katrina
Figure 8. Oblique aerial photographs of morphological change to Petit Bois Island following Hurricane Katrina. Photographs were taken November 30, 2005 and all photographs from the aerial survey are provided on the accompanying compact disc.
13

Evolution of the barrier islands in Mississippi during and following Hurricane Katrina
Figure 9. Pre-storm LiDAR data for Petit Bois Island.
14

Evolution of the barrier islands in Mississippi during and following Hurricane Katrina
15
Figure 10. Post-storm LiDAR data for Petit Bois Island.
Evolution of the barrier islands in Mississippi during and following Hurricane Katrina
-120
-100
-80
-60
-40
-20
0
20
40
60
80
-300 -200 -100 0 100 200Shoreline Change (m)
Volu
me
Cha
nge
(m3 m
-1 a
long
shor
e)Western End of Island
Eastern End of Island
Middle of Island
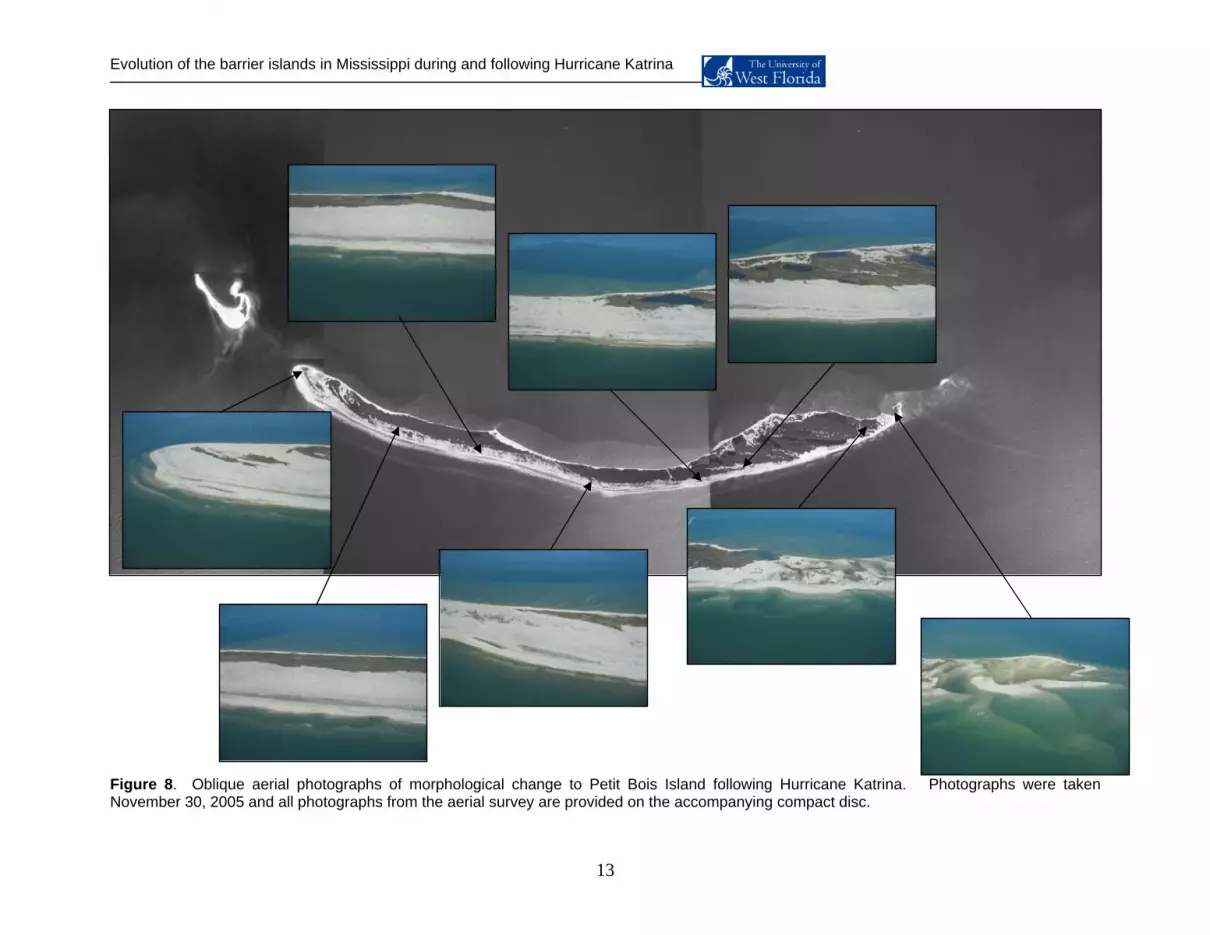
Figure 11. Scatter plot of alongshore variation (by transect) in island volume change with shoreline position for Petit Bois. For both variables, a positive change represents accretion and negative represents erosion.
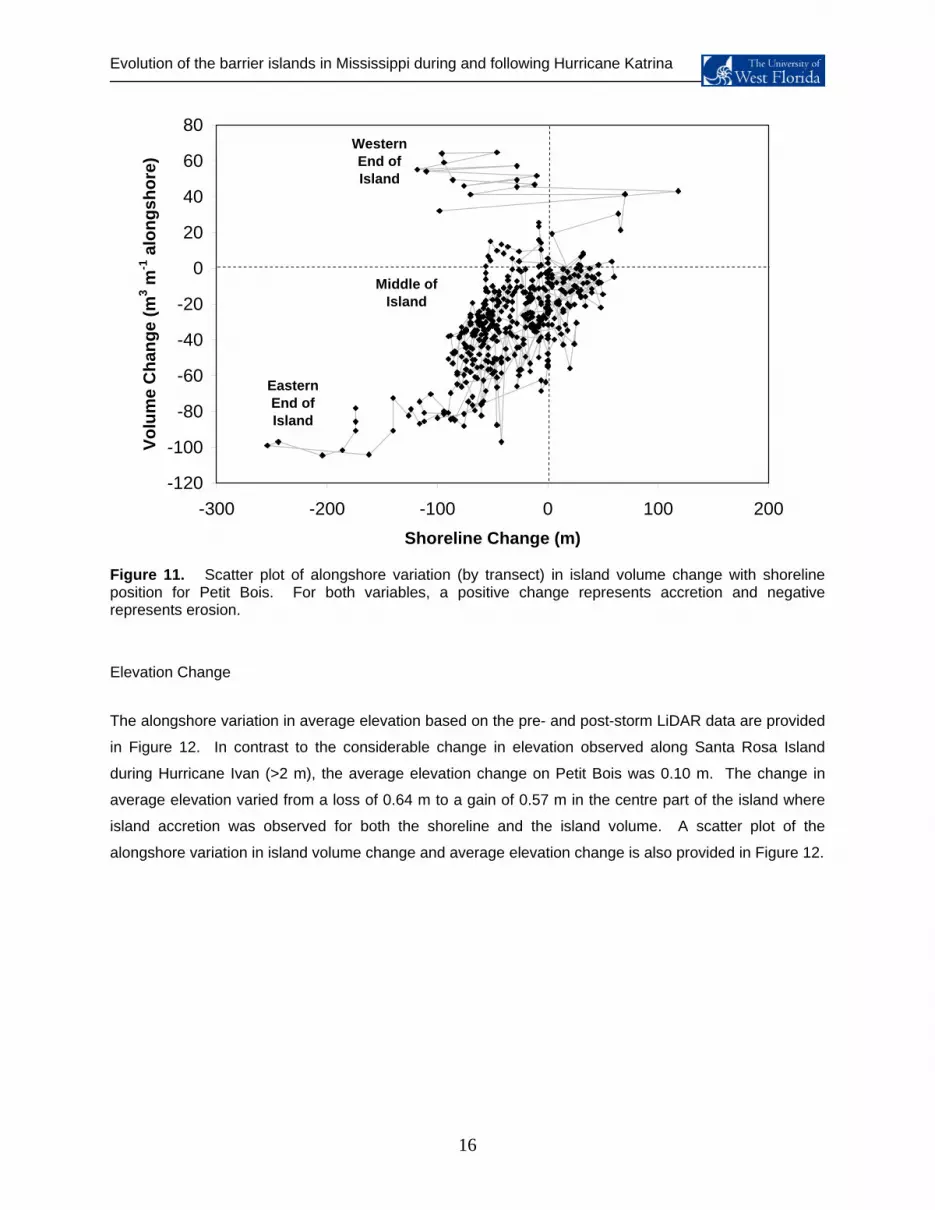
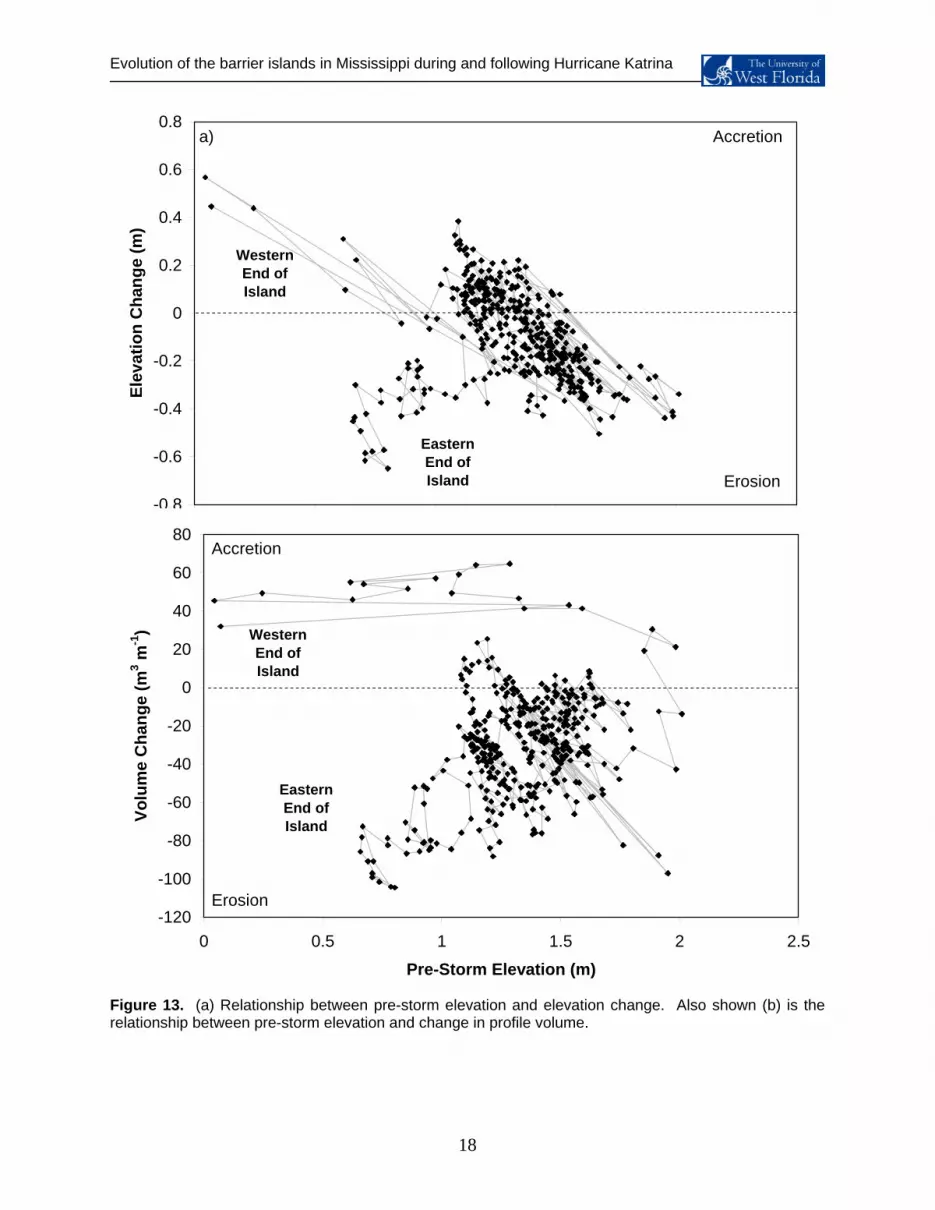
Elevation Change
The alongshore variation in average elevation based on the pre- and post-storm LiDAR data are provided
in Figure 12. In contrast to the considerable change in elevation observed along Santa Rosa Island
during Hurricane Ivan (>2 m), the average elevation change on Petit Bois was 0.10 m. The change in
average elevation varied from a loss of 0.64 m to a gain of 0.57 m in the centre part of the island where
island accretion was observed for both the shoreline and the island volume. A scatter plot of the
alongshore variation in island volume change and average elevation change is also provided in Figure 12.
16

Evolution of the barrier islands in Mississippi during and following Hurricane Katrina
0.0
0.5
1.0
1.5
2.0
2.5
0 100 200 300 400Alongshore Transect
Elev
atio
n (m
,asl
)
Pre-StormPost-Storm
Gain in Average Elevation
EastWest
-0.8
-0.6
-0.4
-0.2
0.0
0.2
0.4
0.6
-150 -100 -50 0 50 100
Volume Change (m3 m-1 alongshore)
Cha
nge
in A
vera
ge E
leva
tion
(m) Western
End of Island
Eastern End of Island
Middle of Island
Figure 12. (a) Alongshore variation in pre- and post-storm elevation and (b) the relationship between volume change and the change in average elevation (post-pre-storm elevation).
17
Evolution of the barrier islands in Mississippi during and following Hurricane Katrina
Figure 13. (a) Relationship between pre-storm elevation and elevation change. Also shown (b) is the relationship between pre-storm elevation and change in profile volume.
-0.8
-0.6
-0.4
-0.2
0
0.2
0.4
0.6
0 0.5 1 1.5 2 2.5
Pre-Storm Elevation (m)
Elev
atio
n C
hang
e (m
)0.8
Accretion
Erosion
Western End of Island
Eastern End of Island
a)
-120
-100
-80
-60
-40
-20
0
20
40
60
80
0 0.5 1 1.5 2 2.5
Pre-Storm Elevation (m)
Volu
me
Cha
nge
(m3 m
-1)
Accretion
Erosion
Western End of Island
Eastern End of Island
18
Evolution of the barrier islands in Mississippi during and following Hurricane Katrina
19
0
0.2
0.4
0.6
0.8
1
1.2
1.4
1.6
1.8
0 0.5 1 1.5 2 2
Pre-Storm Elevation (m)
Post
-Sto
rm E
leva
tion
(m)
Western end of Island
Eastern end of Island
.5
-300
-250
-200
-150
-100
-50
0
50
100
150
0 0.5 1 1.5 2 2
Pre-Storm Elevation (m)
Shor
elin
e C
hang
e (m
)
Accretion
Erosion
Western End of Island
Eastern End of Island
.5
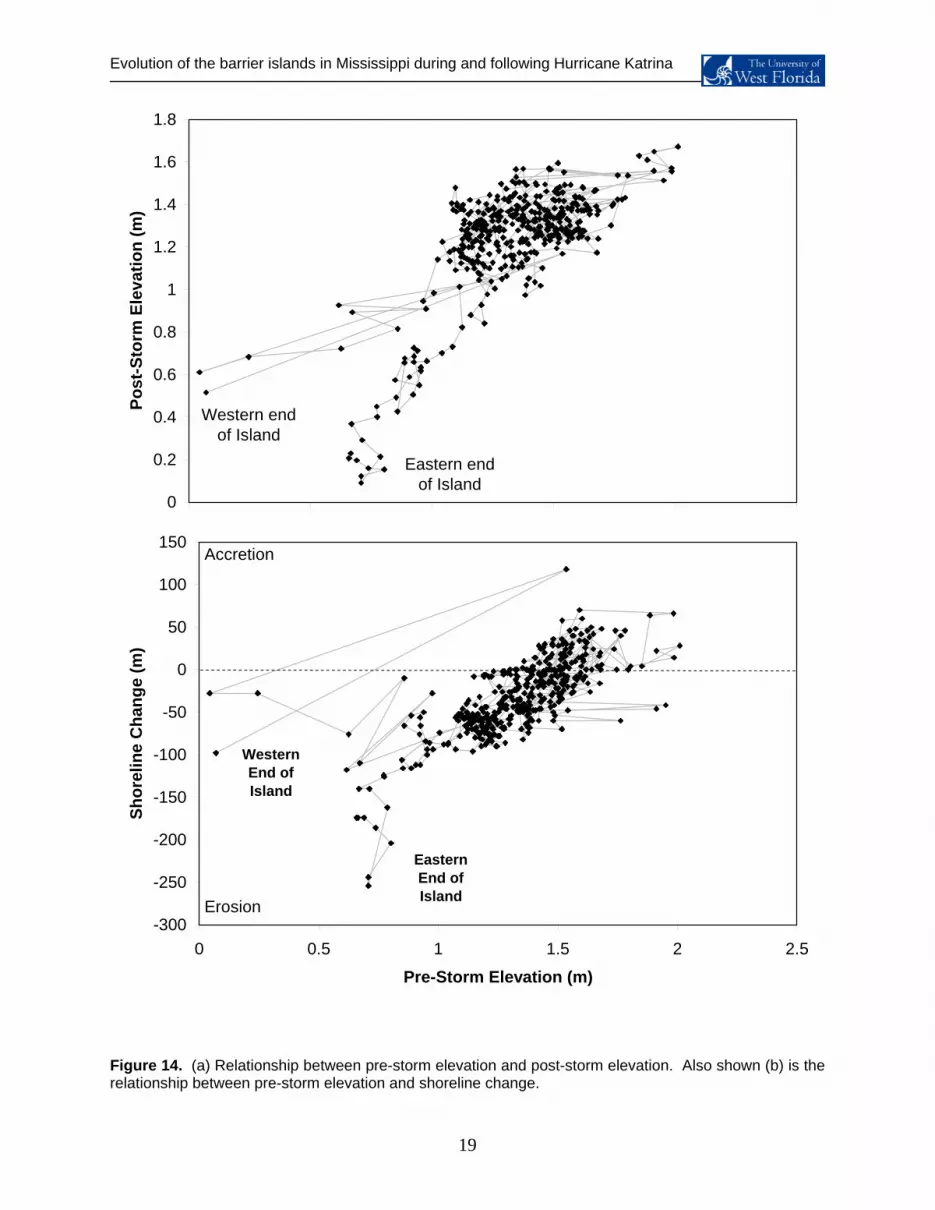
Figure 14. (a) Relationship between pre-storm elevation and post-storm elevation. Also shown (b) is the relationship between pre-storm elevation and shoreline change.

Evolution of the barrier islands in Mississippi during and following Hurricane Katrina
Morphology Change
Based on the scree plots, both the pre- and post-storm data sets found six eigenmodes to be statistically
significant with the percent of total variance explain at 81% and 92%, respectively. The primary
eigenmode (E1) for the pre-storm morphology explains 31% of the variance and shows a large and wide
ridge ~150 m landward of the average shoreline (Figure 15a). The second eigenmode (E2) explains 28%
of the variance and exhibits a small ridge ~120 m from the shoreline with a higher than average
backbarrier elevation. The third eigenmode (E3) exhibits a large ridge ~90 from the shoreline, which is
dominated by a large berm and swale ~40 from the average shoreline. The fourth eigenmode (E4)
exhibits a large ridge ~120 from the shoreline, and a secondary ridge with greater elevation ~250 m from
the average shoreline. The fifth eigenmode (E5) also exhibits a large ridge ~120 from the shoreline, and
a secondary ridge with greater elevation ~320 m from the average shoreline. The sixth eigenmode (E6)
is characterized by the largest ridge at ~120 m from the shoreline.
In contrast to the pre-storm morphology, the post-storm morphology (for all eigenmodes) is characterized
by a single ridge at different distances from the new average shoreline. The primary eigenmode (E1) for
the post-storm morphology explains 65% of the variance and shows a large and wide ridge ~188 m
landward of the average post-storm shoreline (Figure 15a). The second eigenmode (E2) explains 34% of
the variance and exhibits a small ridge ~190 m from the shoreline with a small ridge ~375 m landward.
The third eigenmode (E3) exhibits a large ridge ~276 from the shoreline. The fourth eigenmode (E4)
exhibits a large ridge ~190 from the shoreline that grades into a higher than average shoreline elevation
that suggests accretion. The fifth eigenmode (E5) also exhibits a large ridge ~190 from the shoreline,
and a secondary ridge with greater elevation ~330 m from the average shoreline. The sixth eigenmode
(E6) is characterized by the largest ridge at ~242 m from the shoreline.
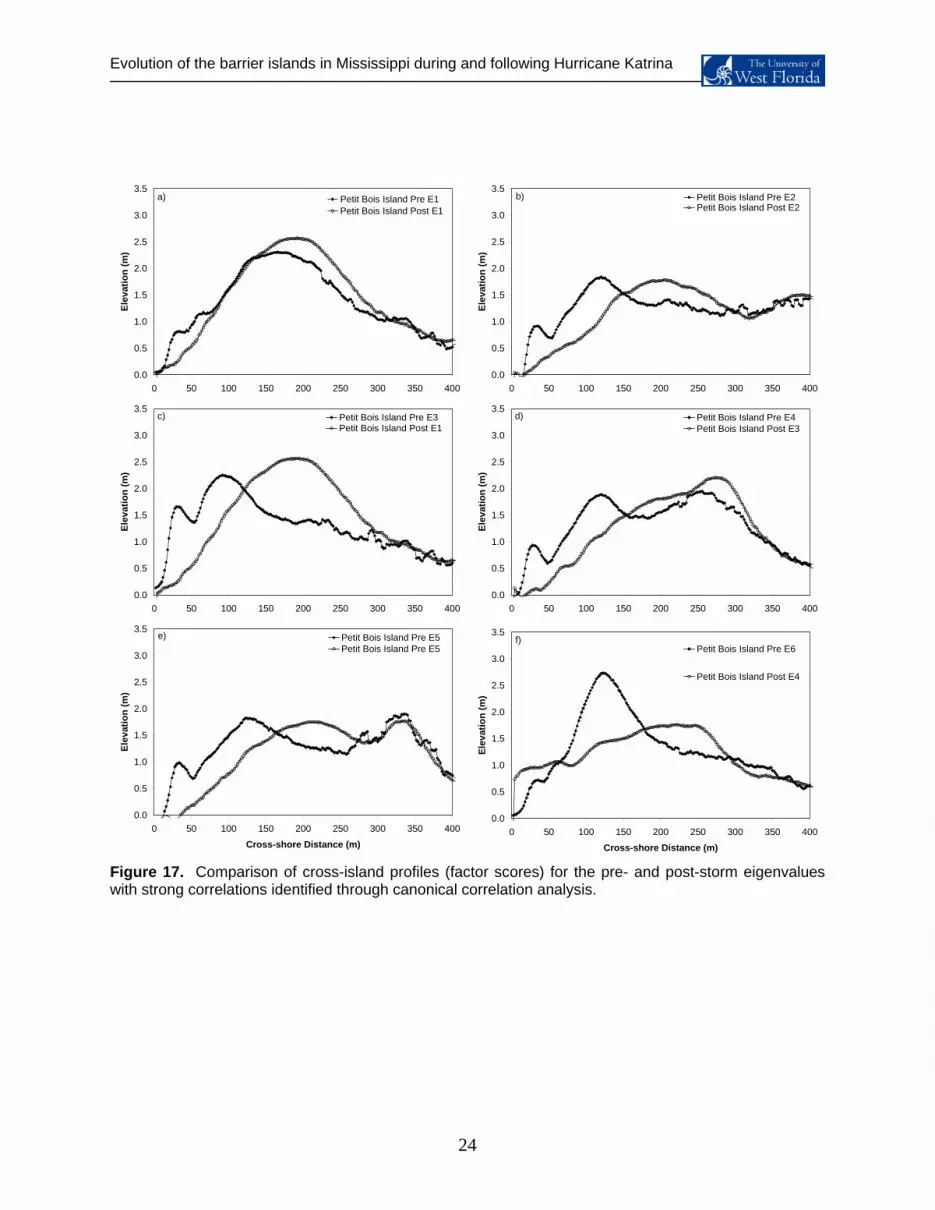
The alongshore variation in the pre- and post-storm eigenmodes is presented as factor scores in Figure
16. Consistent with the shoreline, volume and elevation data, there appears to be 3 parts to the island:
western, middle and eastern. The western section of the island (transects 1-164) is characterized by pre-
storm E1, E6 and E4, while the eastern section of the island (transects 289-400) is characterized by pre-
storm E2, E3 and E5. The middle section of the island is characterized by pre-storm E3. Canonical
correlation analysis between the factor scores for the pre- and post-storm morphology yields a correlation
of 0.73 (ρ<0.05). Results of the analysis are presented in Table 1 below. The correlated pairs are plotted
in Figure 17.
20

Evolution of the barrier islands in Mississippi during and following Hurricane Katrina
Table 1. Canonical correlation coefficients (r) between the pre- and post-storm profiles for Petit Bois land, with the largest coefficients (strongest relationships) highlighted. Is
Post-storm Profiles E1 E2 E3 E4 E5 E6
E1 0.48 -0.11 0.11 0.22 -0.11 0.18 E2 0.21 0.82 -0.11 -0.07 0.02 0.01 E3 0.42 -0.15 -0.32 -0.25 -0.30 0.07 E4 0.26 0.02 0.60 -0.06 0.03 -0.07 E5 0.17 0.13 0.17 -0.11 0.55 0.01
Pre-Storm
Profiles
E6 0.35 0.00 0.02 0.53 -0.09 -0.08
Bathymetry Changes
The characteristic post-storm bathymetry profiles are shown in Figure 18a and the alongshore variation
s factor scores) is shown in Figure 18b. In general, there is a change from a relatively steep offshore
st, shoreline retreat and volume
ss were at a local minimum and some accretion was observed where the average pre-storm elevation
(a
profile at the western end of the island to a more dissipative profile at the eastern end of the island. This
change in profile shape is accompanied by a change in bar position from far offshore and deep (Bathy
E4) to close onshore and shallow (E1). Each of the bars exhibited a steep onshore face suggesting some
onshore migration during or following Hurricane Katrina.
The distance of the bar offshore and the depth to the bar crest were positively correlated, such that water
depths over the bar increased as the distance between the bar and the shoreline increased. The position
of the bar exhibits an alongshore variation at a spacing of ~72 transects. In general, the bar is offshore
where the average pre-storm elevation is at a local minimum. At these locations the shoreline was
observed to retreat and there was net loss of sediment volume. In contra
lo
was relatively large. At these locations, the post-storm bar was relatively close to shore and the depth to
the bar crest was at a local minimum. These results suggest that where the average pre-storm elevation
was large, sediment was deposited on the inner-shoreface as a nearshore bar. Intervening areas also
suggest that sediment was deposited from these areas on the shoreface. The sediment lost in the
intervening (low elevation) areas was deposited in the backbarrier as overwash fans that in some
locations extended into the sound (see Figure 8). The overwash and loss of shoreline and profile volume
was worst at the eastern end of the island, which was the updrift end of the island.
21

Evolution of the barrier islands in Mississippi during and following Hurricane Katrina
Figure 15. Characteristic (a) pre-storm and (b) post-storm cross-shore profiles for Petit Bois Island.
0.5
1.0
1.5
2.5
3.0
3.5ev
atio
n (
a) Pre Petit Bois Island E1Pre Petit Bois Island E2Pre Petit Bois Island E3Pre Petit Bois Island E4Pre Petit Bois I d E5slanPre Petit Bois I d E6slan
2.0
m)
lE
0.00 50 100 150 200 250 300 350 400
Cross-shore Distance (m)3.0
3.5Petit Bois Island Post E1Petit Bois Island Post E2Petit Bois Island Post E3
b)
0.0
0.5
1.0
1.5
2.0
2.5
0 50 100 150 200 250 300 350 400
Cross-shore Distance (m)
Elev
atio
n (m
)
Petit Bois Island Post E4Petit Bois Island Post E5Petit Bois Island Post E1
22

Evolution of the barrier islands in Mississippi during and following Hurricane Katrina
23
Figure 16. Alongshore factor scores for the pre-storm and post-storm characteristic profiles.
-4
-2
0
2
4
6
8
0 50 100 150 200 250 300 350 400Transect
Fact
or S
core
Pre Petit Bois Island E1Pre Petit Bois Island E2Pre Petit Bois Island E3Pre Petit Bois Island E4Pre Petit Bois Island E5Pre Petit Bois Island E6
a)
-4
-2
0
2
4
6
8
0 50 100 150 200 250 300 350 400Transect
Fact
or S
core
Post Petit Bois Island E1Post Petit Bois Island E2Post Petit Bois Island E3Post Petit Bois Island E4Post Petit Bois Island E5Post Petit Bois Island E6
b)
Evolution of the barrier islands in Mississippi during and following Hurricane Katrina
Figure 17. Comparison of cross-island profiles (factor scores) for the pre- and post-storm eigenvalues with strong correlations identified through canonical correlation analysis.
0.0
0.5
1.0
1.5
2.0
2.5
3.0
3.5
0 50 100 150 200 250 300 350 400
Cross-shore Distance (m)
Elev
atio
n (m
)
Petit Bois Island Pre E1Petit Bois Island Post E1
a)
0.0
0.5
1.0
1.5
2.0
2.5
3.0
3.5
0 50 100 150 200 250 300 350 400
Cross-shore Distance (m)
Elev
atio
n (m
)
Petit Bois Island Pre E2Petit Bois Island Post E2
b)
0.0
0.5
1.0
1.5
2.0
2.5
3.0
3.5
0 50 100 150 200 250 300 350 400
Cross-shore Distance (m)
Elev
atio
n (m
)
Petit Bois Island Pre E3Petit Bois Island Post E1
c)
0.0
0.5
1.0
1.5
2.0
2.5
3.0
3.5
0 50 100 150 200 250 300 350 400
Cross-shore Distance (m)
Elev
atio
n (m
)
Petit Bois Island Pre E4Petit Bois Island Post E3
d)
0.0
0.5
1.0
1.5
2.0
2.5
3.0
3.5
0 50 100 150 200 250 300 350 400
Cross-shore Distance (m)
Elev
atio
n (m
)
Petit Bois Island Pre E5Petit Bois Island Pre E5
e)
0.0
0.5
1.0
1.5
2.0
2.5
3.0
3.5
0 50 100 150 200 250 300 350 400
Cross-shore Distance (m)
Elev
atio
n (m
)
Petit Bois Island Pre E6
Petit Bois Island Post E4
f)
24

Evolution of the barrier islands in Mississippi during and following Hurricane Katrina
Figure 18.the characteristic profiles.
(a) Characteristic offshore profiles for Petit Bois Island and (b) alongshore factor scores for
-60
-50
50
-40
-30
-20
-10
0
10
20
30
40
0 50 100 150 200 250 300 350 400Transect
Fact
or S
core
Petit Bois Bathy E1Petit Bois Bathy E2Petit Bois Bathy E3Petit Bois Bathy E4Petit Bois Bathy E5Petit Bois Bathy E6
-8.0
-7.0
-6.0
-5.0
-4.0
-3.0
-2.0
-1.0
0.0
-1000 -800 -600 -400 -200 0
Cross-shore Distance (m)
Elev
atio
n (m
)Petit Bois Bathy E1Petit Bois Bathy E2Petit Bois Bathy E3Petit Bois Bathy E4Petit Bois Bathy E5Petit Bois Bathy E6
25

Evolution of the barrier islands in Mississippi during and following Hurricane Katrina
Figure 19. Alongshore variation in the distance of the nearshore bar offshore relative to (a) the depth to
0
50
100
150
200
250
300
350
400
450
0 50 100 150 200 250 300 350 400
Transect
Dis
tanc
e O
ffsho
re (m
)
0.0
0.5
1.0
1.5
2.0
2.5
Dep
th to
Bar
Cre
st (m
)
Distance OffshoreDepth to Crest
a)
0
50
100
150
200
250
300
350
400
450
0 50 100 150 200 250 300 350 400
Transect
Dis
tanc
e O
ffsho
re (m
)
0.0
0.5
1.0
1.5
2.0
2.5
Ave
rage
Pre
-Sto
rm H
eigh
t (m
)
Distance OffshorePre-Storm Height
b)
the bar crest and (b) the average pre-storm elevation of the island.
26

Evolution of the barrier islands in Mississippi during and following Hurricane Katrina
0
50
100
150
200
250
300
350
400
450
0 50 100 150 200 250 300 350 400
Transect
Dis
tanc
e O
ffsho
re (m
)
-150
-100
-50
0
50
100
150
Shor
elin
e C
hang
e (m
)
Distance OffshoreShoreline Change
a) Accretion
Erosion
0
50
100
150
200
250
300
350
400
450
0 50 100 150 200 250 300 350 400
Dis
tanc
e O
ffsho
re (m
)
-80
-60
-40
-20
0
20
40
60
Volu
me
Cha
nge
(m3 m
-1)
Distance OffshoreVolume Change
b)
Nearshore Terrace with
no bars
Transect
Figure 20. Alongshore variation in the distance of the nearshore bar offshore relative to (a) shoreline change and (b) the change in profile volume.
27
Evolution of the barrier islands in Mississippi during and following Hurricane Katrina
IMPACTS TO HORN ISLAND
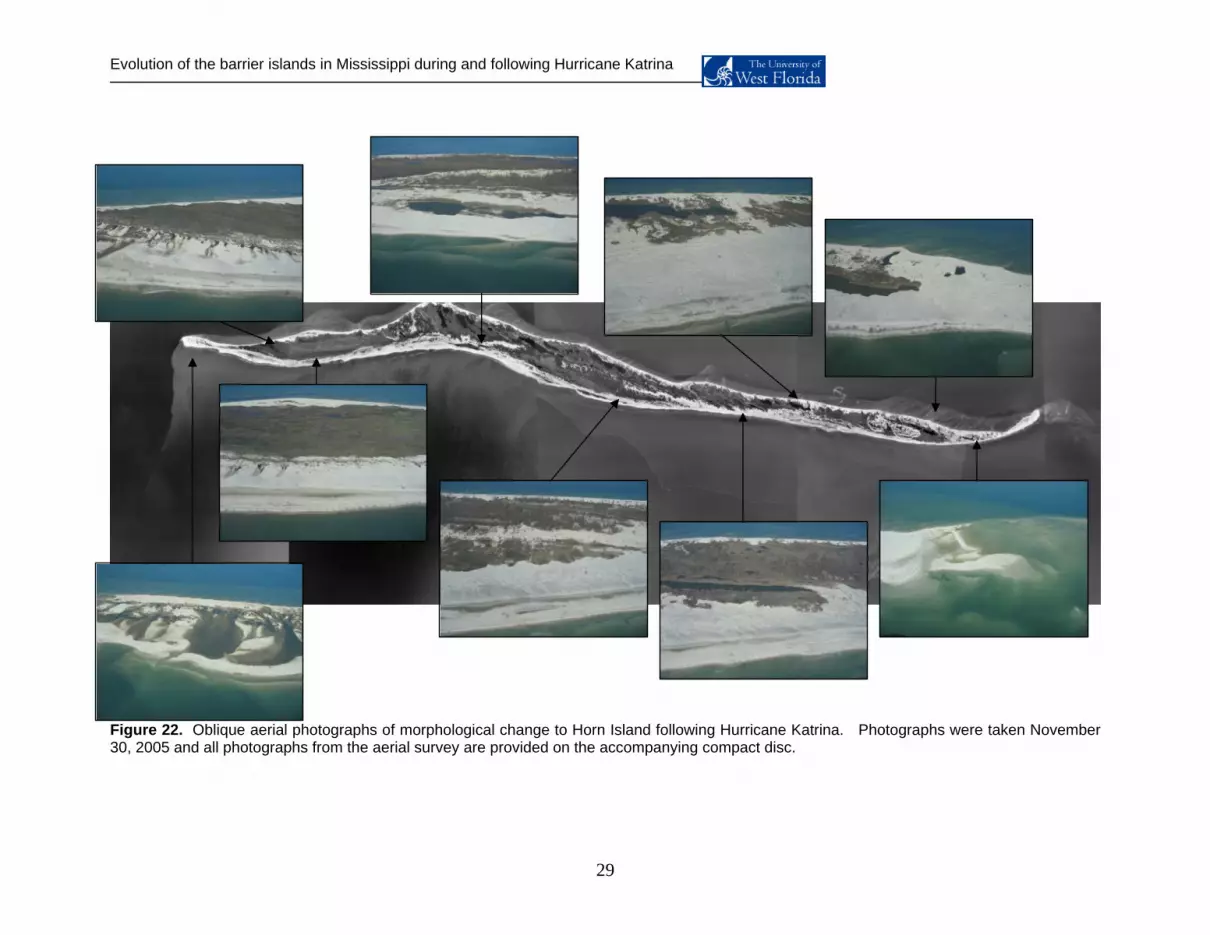
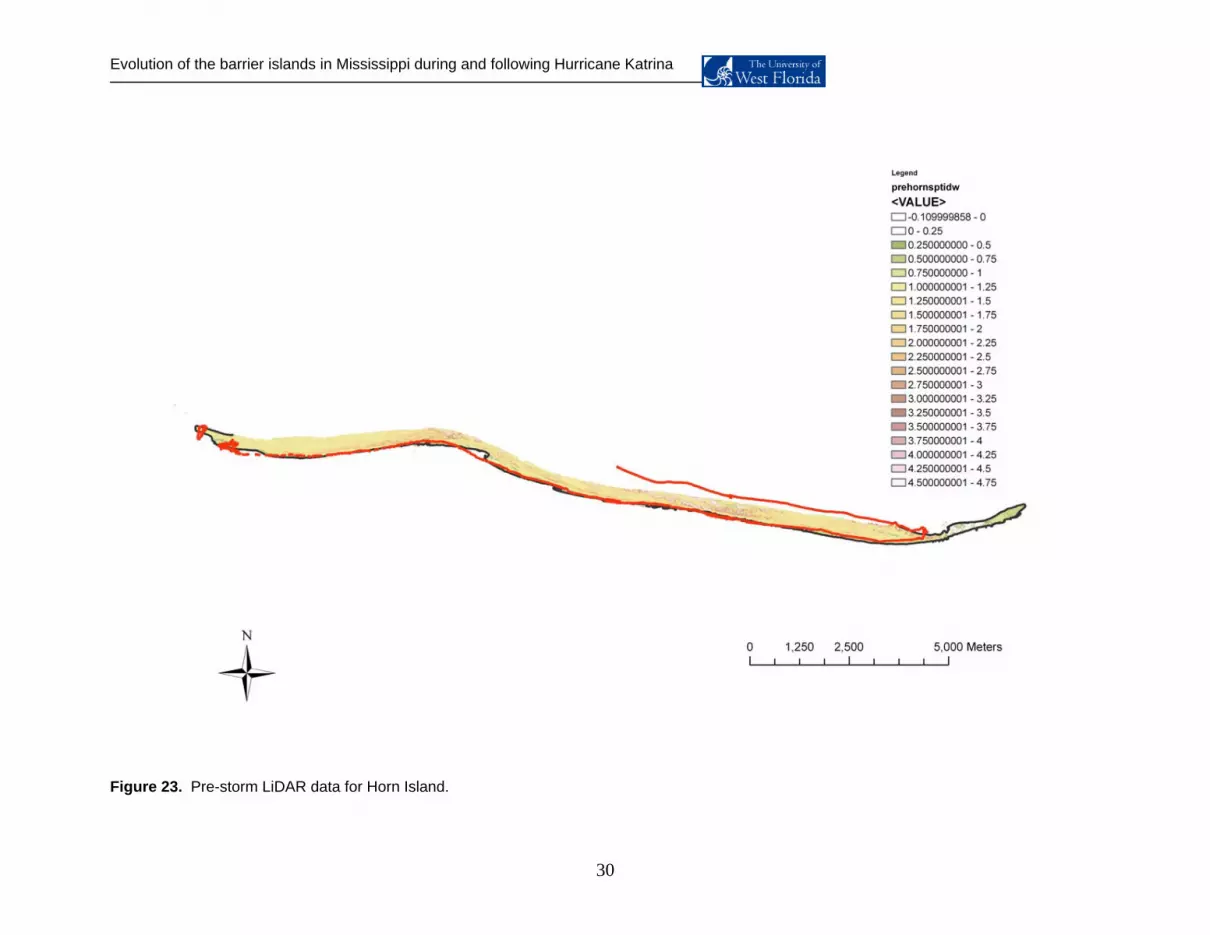
Oblique aerial photographs of the post-storm morphology are presented in Figure 22, and the pre- and
post-LiDAR images for Horn Island are provided in Figures 23 and 24. Similar to Petit Bois Island, areas
with large elevations were reduced in height, but there were several areas of the island where the post-
storm average elevation increased, suggesting accretion during or immediately following the storm. A
review of the detailed analysis is provided in the following sections.
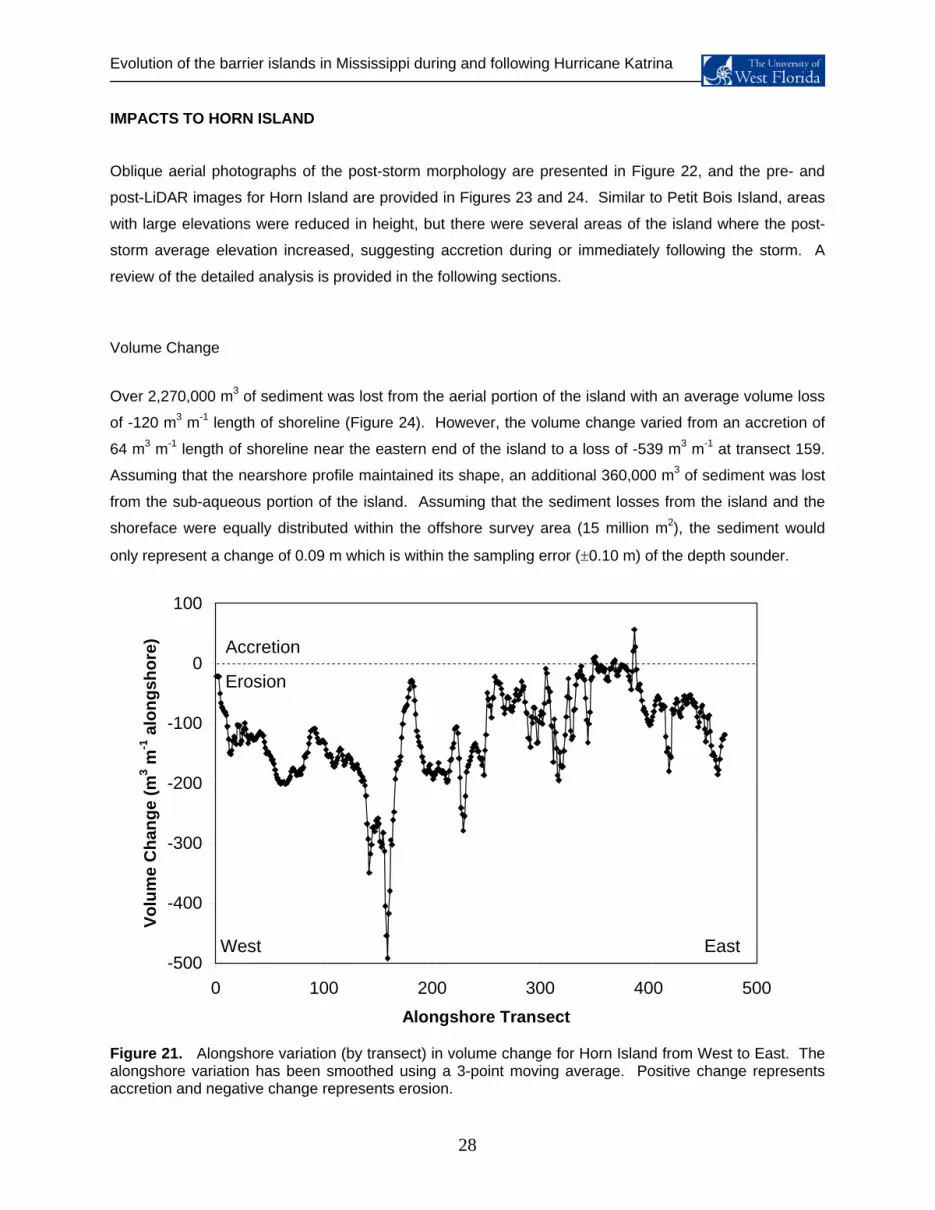
Volume Change
Over 2,270,000 m3 of sediment was lost from the aerial portion of the island with an average volume loss
of -120 m3 m-1 length of shoreline (Figure 24). However, the volume change varied from an accretion of
64 m3 m-1 length of shoreline near the eastern end of the island to a loss of -539 m3 m-1 at transect 159.
Assuming that the nearshore profile maintained its shape, an additional 360,000 m3 of sediment was lost
from the sub-aqueous portion of the island. Assuming that the sediment losses from the island and the
shoreface were equally distributed within the offshore survey area (15 million m2), the sediment would
only represent a change of 0.09 m which is within the sampling error (±0.10 m) of the depth sounder.
ion.
-500
-400
-300
-200
-100
0
100
0 100 200 300 400 500Alongshore Transect
Volu
me
Cha
nge
(m3 m
-1 a
long
shor
e)
West East
Accretion
Erosion
Figure 21. Alongshore variation (by transect) in volume change for Horn Island from West to East. The alongshore variation has been smoothed using a 3-point moving average. Positive change represents accretion and negative change represents eros
28
Evolution of the barrier islands in Mississippi during and following Hurricane Katrina
Figure 230, 2005 a
2. Oblique aerial photographs of morphological change to Horn Islan na. Photographs ber nd all photographs from the aerial survey are provided on the accom
d following Hurricane Katripanying compact disc.
were taken Novem
29
Evolution of the barrier islands in Mississippi during and following Hurricane Katrina
Figure 23. Pre-storm LiDAR data for Horn Island.
30

Evolution of the barrier islands in Mississippi during and following Hurricane Katrina
Figure 24. Post-storm LiDAR data for Horn Island.
31

Evolution of the barrier islands in Mississippi during and following Hurricane Katrina
Figure 25. Pre- and post-storm locations of beachface ridges.
32

Evolution of the barrier islands in Mississippi during and following Hurricane Katrina
33
Shoreline Change
On average the shoreline retreated by ~3 m but varied considerably from a gain (accretion) of 174 m to a
loss (erosion) of 136 m (Figure 26). Unlike Petit Bois, the change in shoreline position is not related to
the volume change. Areas of shoreline erosion are not consistently associated with the largest losses of
sediment, while areas of shoreline accretion are not associated with the smallest loss of sediment and
sometimes a volume gain. Whereas Petit Bois had an alongshore trend from erosion (in the east) to
accretion (in the west), Horn Island exhibits some erosion in the east and accretion in the west, with
considerable (and almost periodic) variability through the middle transects. Both shoreline change and
volume change exhibit statistically significant variations at alongshore length scales of ~3000 and 1700
m. At the 3000 m length scale, volume and shoreline change are in-phase (and positively correlated), but
the variables are in quadrature (out-of-phase) at the 1700 m length scale. In other words, areas of large
volume change are to the east of areas with large shoreline change at the 1700 m length scale.
-150
-100
-50
0
50
100
150
200
0 100 200 300 400 50Alongshore Transect
Shor
line
Cha
nge
(m)
Erosion
Accretion
EastWest
0
Figure 26. Alongshore variation (by transect) in shoreline position for Horn Island from West to East. The alongshore variation has been smoothed using a 3-point moving average. Positive ch represents accretion and negative change represents erosion.
ange

Evolution of the barrier islands in Mississippi during and following Hurricane Katrina
-600
-500
100
-200 -150 -100 -50 0 50 100 150 200Shoreline Change (m)
Volu
-400
-300
-200
-100
0
me
Cha
nge
(m3 m
-1 a
long
shor
e)
Figure 27. Scatter plot of alongshore variation (by transect) in island volume change with shoreline position for Horn Island. For both variables, a positive change represents accretion and negative represents erosion.
Elevation Change
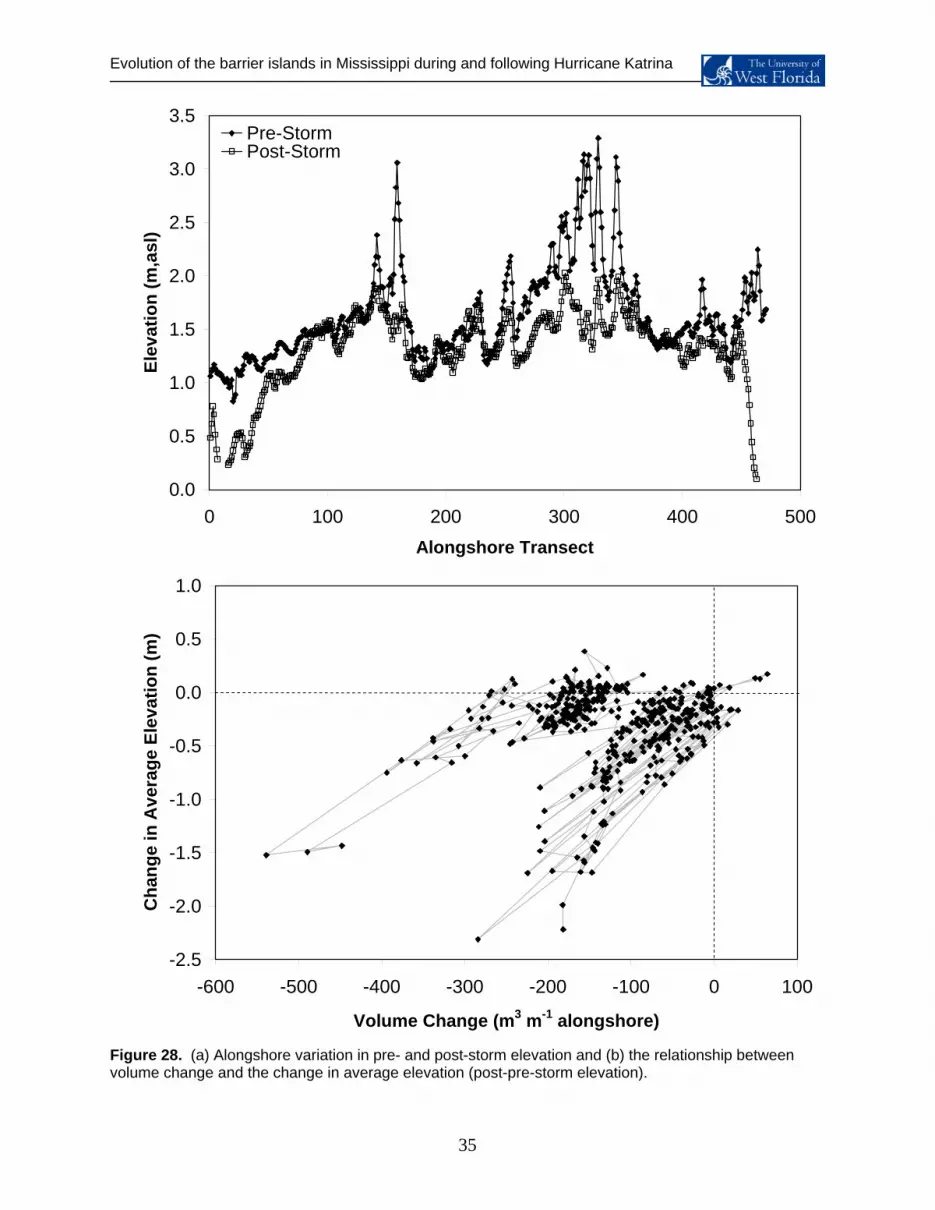
The alongshore variation in average elevation based on the pre- and post-storm LiDAR data are provided
in Figure 28. The change in average elevation varied from a loss of 2.3 m to a gain of 0.38 m at the
eastern end of the island. The loss in average elevation tended to be greatest at the western end of the
island and near the middle (transects 250-350) where large dune features had been present before the
storm. A scatter plot of the alongshore variation in island volume change and average elevation change is
provided in Figure 28. While there appears to be 2 separate populations, both suggest that a greater loss
in average elevation is associated with larger volume losses. In this respect, change in elevation is
coherent and in-phase with changes in volume change at all length scales.
.
34
Evolution of the barrier islands in Mississippi during and following Hurricane Katrina
0.0
0.5
1.0
1.5
2.0
2.5
3.0
0 100 200 300 400 500Alongshore Transect
Elev
atio
n (m
,asl
)
3.5Pre-StormPost-Storm
-0.5
-2.5
-2.0
-1.5
-1.0
-600 -500 -400 -300 -200 -100
Cha
nge
in
0.0
1.0
0 100
Volume Change (m3 m-1 alongshore)
Ave
rage
Ele
vati
0.5
on (m
)
Figure 28. (a) Alongshore variation in pre- and post-storm elevation and (b) the relationship between volume change and the change in average elevation (post-pre-storm elevation).
35

Evolution of the barrier islands in Mississippi during and following Hurricane Katrina
Figure 29. (a) Relationship between pre-storm elevation and elevation change. Also shown (b) is the relationship between pre-storm elevation and change in profile volume.
0.0
0.5
1.0
1.5
2.0
2.5
0.0 0.5 1.0 1.5 2.0 2.5 3.0 3.5 4.0
Pre-storm Elevation (m)
Post
-sto
rm E
leva
tion
(m)
-2.5
-2.0
-1.5
-1.0
-0.5
0.0
0.5
1.0
0.0 0.5 1.0 1.5 2.0 2.5 3.0 3.5 4.0
Pre-storm Elevation (m)
Elev
atio
n C
hang
e (m
)
Accretion
Erosion
Western end of Island
Eastern end of Island
36

Evolution of the barrier islands in Mississippi during and following Hurricane Katrina
-600
-500
-400
-300
-200
-100
0
100
0.0 0.5 1.0 1.5 2.0 2.5 3.0 3.5 4.0
Pre-storm Elevation (m)
Volu
me
Cha
nge
(m3 m
-1)
150
200
-200
-150
-100
-50
0
50
100
0.0 0.5 1.0 1.5 2.0 2.5 3.0 3.5 4.0
Pre-storm Elevation (m)
Shor
elin
e C
hang
e (m
)
Figure 30. (a) Relationship between pre-storm elevation and post-storm elevation. Also shown (b) is the relationship between pre-storm elevation and shoreline change.
37

Evolution of the barrier islands in Mississippi during and following Hurricane Katrina
Morphology Change
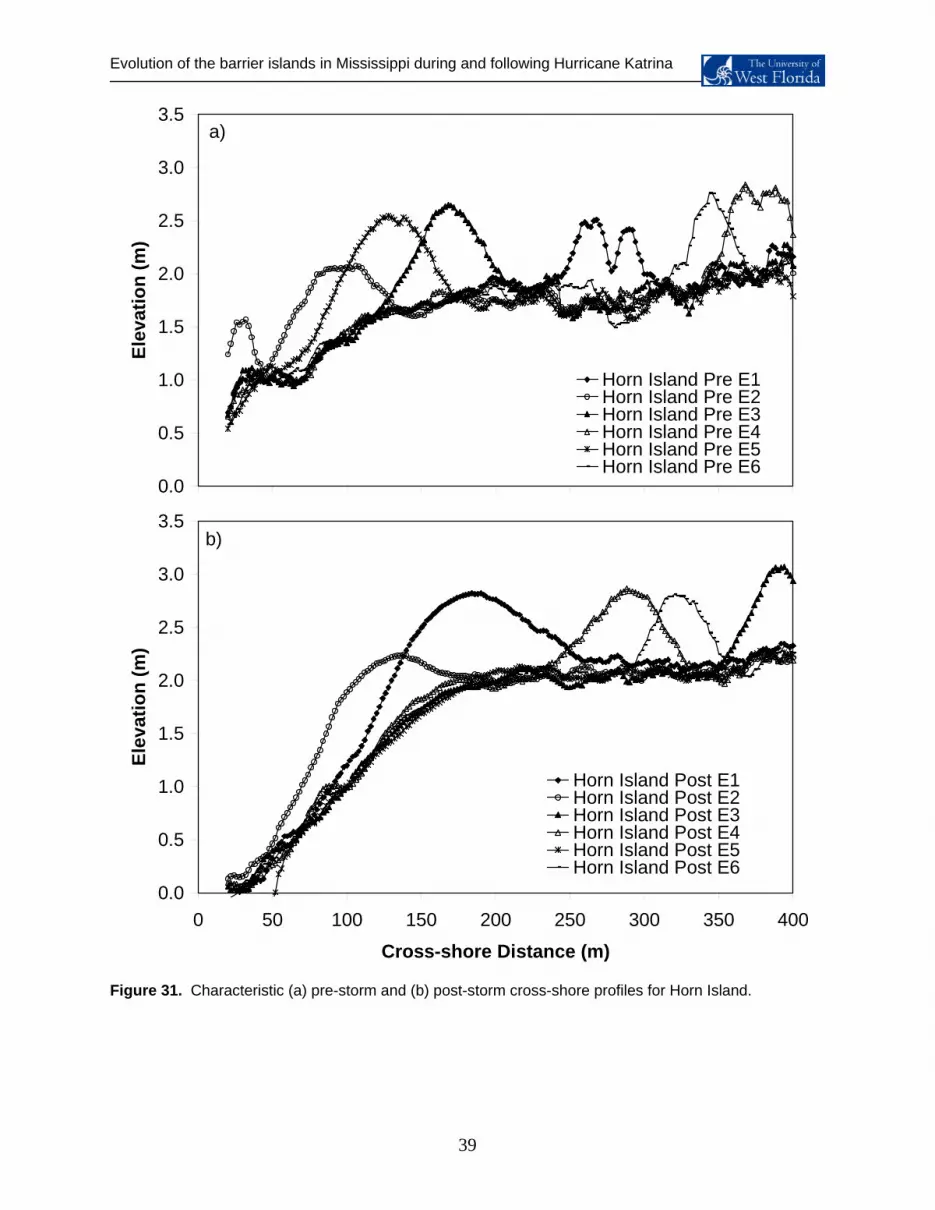
Based on the scree plots, both the pre- and post-storm data sets found six eigenmodes to be statistically
significant with the percent of total variance explain at 75% and 86%, respectively. The primary
eigenmode (E1) for the pre-storm morphology explains 32% of the variance and shows a large and wide
ridge ~260 m landward of the average shoreline (Figure 31a). The second eigenmode (E2) explains 28%
of the variance and exhibits a small ridge ~86 m from the shoreline with a large berm and swale at ~30 m
from the shoreline. The third eigenmode (E3) exhibits a large ridge 170 m from the shoreline while the
fourth and sixth eigenmodes (E4 and E6) only exhibit secondary ridges ~370 and 350 m from the
shoreline. The fifth eigenmode (E5) exhibits a large ridge ~125 m from the average shoreline.
In contrast to the pre-storm morphology, but similar to Petit Bois, the post-storm morphology (for all
eigenmodes) is characterized by a single ridge at different distances from the new average shoreline.
The primary eigenmode (E1) for the post-storm morphology explains 62% of the variance and shows a
large and wide ridge ~182 m landward of the average post-storm shoreline (Figure31b). The second
eigenmode (E2) explains 32% of the variance and exhibits a small ridge ~134 m from the shoreline. The
third eigenmode (E3) exhibits a large ridge ~392 from the shoreline. The fourth eigenmode (E4) exhibits
a large ridge ~288 while the fifth eigenmode (E5) has no ridge. The sixth eigenmode (E6) is
characterized by the largest ridge at ~322 m from the shoreline.
The alongshore variation in the pre- and post-storm eigenmodes is presented as factor scores in Figures
32. Unlike Petit Bois, there does not seem to be a well-defined alongshore pattern Canonical correlation
analysis between the factor scores for the pre- and post-storm morphology yields a correlation of 0.73
(ρ<0.05). Results of the analysis are presented in Table 2 below and the correlated pairs are plotted in
Figure 33.
Table 2. Canonical correlation coefficients (r) between the pre- and post-storm profiles for Horn Island, with the largest coefficients (strongest relationships) highlighted.
Post-storm Profiles E1 E2 E3 E4 E5 E6
E1 0.11 0.22 0.47 0.25 0.14 0.01 E2 0.04 -0.11 0.03 -0.18 0.17 -0.07 E3 0.07 -0.16 -0.10 0.51 -0.08 0.15 E4 0.58 -0.09 -0.15 0.00 -0.12 0.06 E5 0.12 -0.04 0.12 0.06 -0.14 0.01
Pre-Storm
Profiles
E6 0.01 -0.06 0.03 0.17 -0.10 0.40
38
Evolution of the barrier islands in Mississippi during and following Hurricane Katrina
3.5a)
1.5
2.0
2.5
3.0El
evat
ion
(m)
Horn Island Pre E11.0
0.0
0.5
0 50 100 150 200 250 300 350 400
Cross-shore Distance (m)
Horn Island Pre E2Horn Island Pre E3Horn Island Pre E4Horn Island Pre E5Horn Island Pre E6
Figure 31. Characteristic (a) pre-storm and st-storm s-shore es for H and.
(b) po cros profil orn Isl
0.0
1.0
50 20 250
Cr hore nce (
E
3.0
3.5b)
1.5
2.0
2.5
leva
tion
(m)
Horn Island Post E1Horn Island Post E2Horn Island Post E3Horn Island Post E40.5 Horn Island Post E5Horn Island Post E6
0 100 150 0 300 350 400
oss-s Dista m)
39

Evolution of the barrier islands in Mississippi during and following Hurricane Katrina
40
-15
-10
-5
0
5
10
15
20Fa
ctor
Sco
re
Horn Island Pre E1Horn Island Pre E2Horn Island Pre E3Horn Island Pre E4Horn Island Pre E5
a)
-200 100 200 300 400 500
Transect
Horn Island Pre E6
-20
-15
-10
-5
0
5
10
15
20
0 100 200 300 400 500
Fact
or S
core
Horn Island Post E1Horn Island Post E2Horn Island Post E3Horn Island Post E4Horn Island Post E5Horn Island Post E6
b)
Transect
Figure 32. Alongshore factor scores for the pre-storm and post-storm characteristic profiles.

Evolution of the barrier islands in Mississippi during and following Hurricane Katrina
Figure 33. Comparison of cross-island profiles (factor scores) for the pre- and post-storm eigenvalues with strong correlations identified through canonical correlation analysis.
Bathymetry Changes
The characteristic post-storm bathymetry profiles are shown in Figure 34a and the alongshore variation
(as factor scores) is shown in Figure 34b. In general, there is a change from a relatively dissipative
(gentle) offshore profile at the western end of the island to a more reflective profile at the eastern end of
the island with a large prominent bar. This change in profile shape is accompanied by a change in bar
morphology from no bar (Bathy E1) to a pronounced bar that is distant from the shoreline (E4). Each of
the bars exhibited a steep onshore face suggesting some onshore migration during or following Hurricane
Katrina.
Similar to the average pre-storm elevation and shoreline and volume change, the distance and depth of
the bar crest offshore exhibit an alongshore variation at a spacing of ~120 transects. Within a distance of
~130 m. When the bar is further offshore it is relatively symmetric but becomes increasingly asymmetric
as it approaches the shore. Where the bar is relatively far offshore and well developed (large in height
0.0
0.5
1.0
1.5
2.0
2.5
3.0
3.5
0 50 100 150 200 250 300 350 400
Cross-shore Distance (m)
Elev
atio
n (m
)
Horn Island Pre E3Horn Island Post E1
b)
r=0.47
0.0
0.5
1.0
1.5
2.0
2.5
3.0
3.5
0 50 100 150 200 250 300 350 400
Cross-shore Distance (m)
Elev
atio
n (m
)
Horn Island Pre E6Horn Island Post E5
d)
r=0.40
0.0
0.5
1.0
1.5
2.0
2.5
3.0
3.5
0 50 100 150 200 250 300 350 400
Cross-shore Distance (m)
Elev
atio
n (m
)
Horn Island Pre E1Horn Island Post E4
a)
r=0.58
0.0
0.5
1.0
1.5
2.0
2.5
3.0
3.5
0 50 100 150 200 250 300 350 400
Cross-shore Distance (m)
Elev
atio
n (m
)
Horn Island Pre E4Horn Island Post E3
c)
r=0.50
30 transects (from west to east), the bar increases in height by ~1.4 m at which point it moves inshore by
41
Evolution of the barrier islands in Mississippi during and following Hurricane Katrina
and asymmetric), the shoreline accreted during the storm (Figure 35a), the volume loss is at a local
minimum (Figure 36b) and the average pre-storm elevation is at a local maximum (Figure 35b). Where
the bar is close to shore and depth over the crest is relatively deep (a small bar), the shoreline tended to
erode, the volume loss is at a local maximum and the average pre-storm elevation is at a local minimum.
Similar to Petit Bois, these results suggest that where the average pre-storm elevation was large,
sediment was deposited on the inner-shoreface as a nearshore bar. Like Petit Bois Island, the sediment
lost in the intervening (low elevation) areas was deposited in the backbarrier as overwash fans that in
some locations extended into the sound (see Figure 22). The overwash and loss of shoreline and profile
volume was worst at the eastern end of the island, which was the updrift end of the island.
42
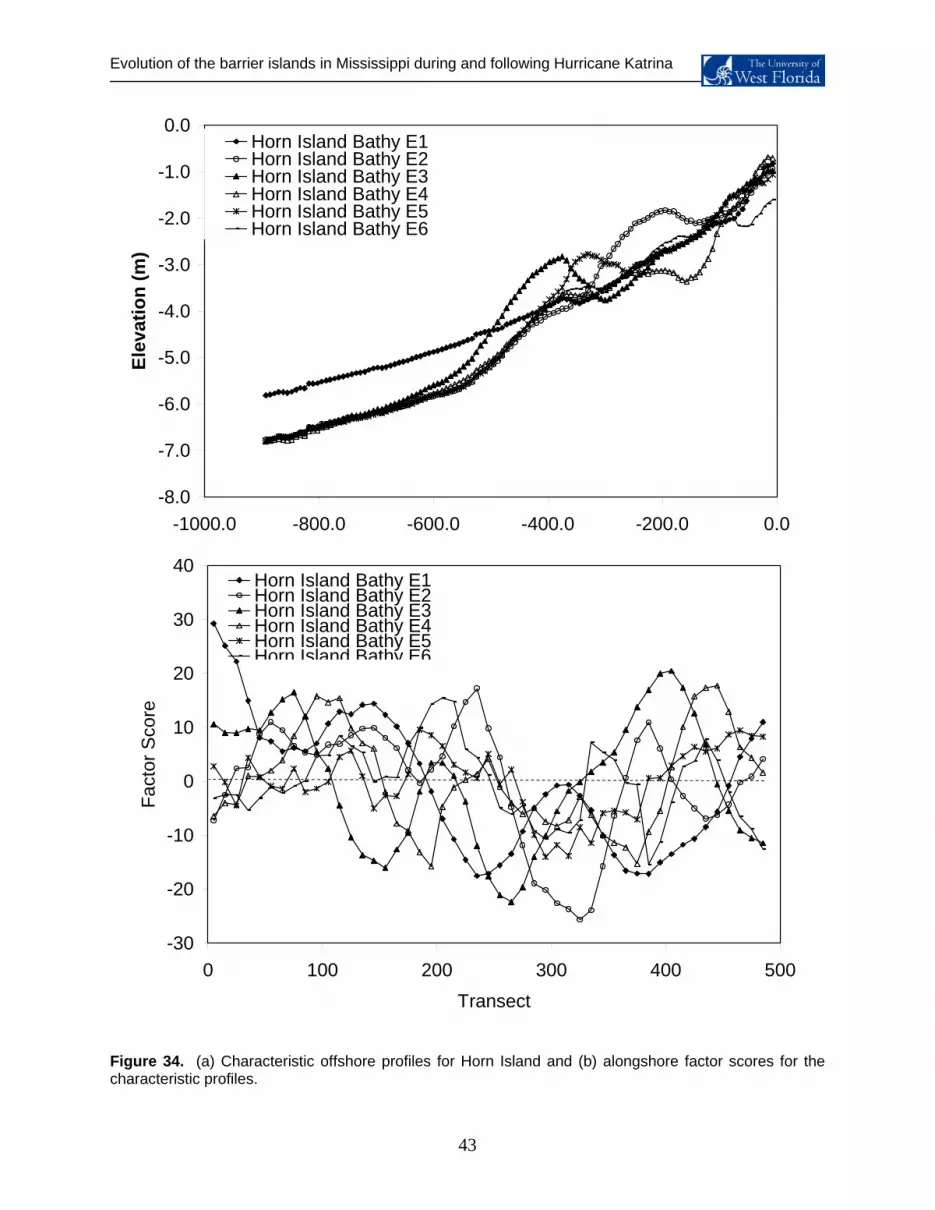
Evolution of the barrier islands in Mississippi during and following Hurricane Katrina
Figure 34. (a) Characteristic offshore profiles for Horn Island and (b) alongshore factor scores for the characteristic profiles.
-8.0
-7.0
-6.0
-5.0
-1000.0 -800.0 -600.0 -400.0 -200.0 0.0
Cross-shore Distance (m)
El
-4.0
-3.0
-2.0
-1.0
0.0ev
atio
n (m
)Horn Island Bathy E1Horn Island Bathy E2Horn Island Bathy E3Horn Island Bathy E4Horn Island Bathy E5Horn Island Bathy E6
-30
-20
-10
0
10
20
30
40
0 100 200 300 400 500Transect
Fact
or S
core
Horn Island Bathy E1Horn Island Bathy E2Horn Island Bathy E3Horn Island Bathy E4Horn Island Bathy E5Horn Island Bathy E6
43
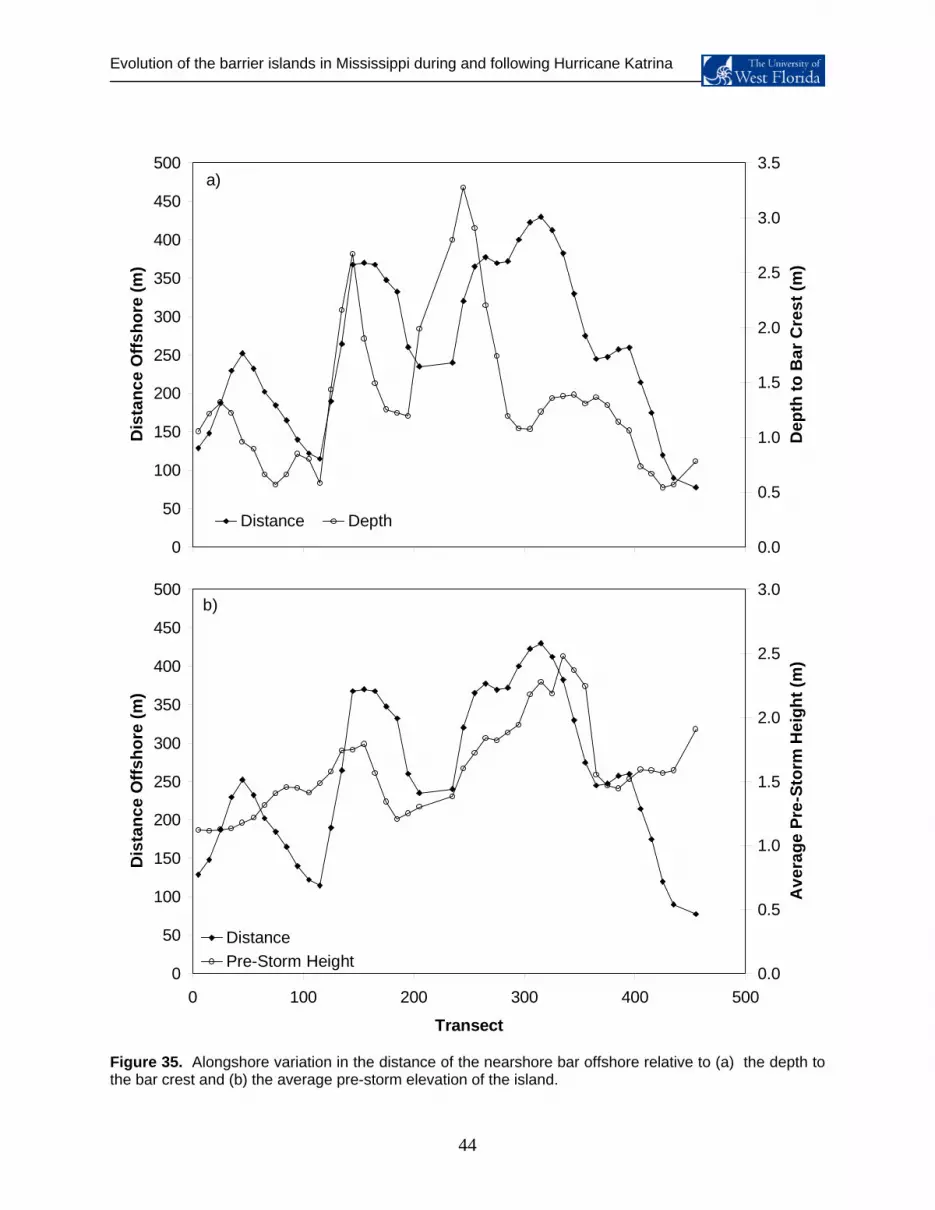
Evolution of the barrier islands in Mississippi during and following Hurricane Katrina
00 100 200 300 400 500
Transect
0.0
0
50
100
150
200
250
300
350
400
450
500
0 100 200 300 400 500
Transect
Dis
tanc
e O
ffsho
re (m
)
0.0
0.5
1.0
1.5
2.0
2.5
3.0
Ave
rage
Pre
-Sto
rm H
eigh
t (m
)
DistancePre-Storm Height
b)
50
100
150
200
250
300
350
400
450
500D
ista
nce
Offs
hore
(m)
0.5
1.0
1.5
2.0
2.5
3.0
3.5
Dep
th to
Bar
Cre
st (m
)
Distance Depth
a)
Figure 35. Alongshore variation in the distance of the nearshore bar offshore relative to (a) the depth to the bar crest and (b) the average pre-storm elevation of the island.
44

Evolution of the barrier islands in Mississippi during and following Hurricane Katrina
0
50
100
150
200
250
300
350
400
450
500
0 100 200 300 400 500
Transect
Dis
tanc
e O
ffsho
re (m
)
-100
-80
-60
-40
-20
0
20
40
60
80
100
Shor
elin
e C
hang
e (m
)
Distance OffshoreShoreline Change
a) Accretion
Erosion
400
450
500
-50
0b)
0
50
100
150
200
250
300
350
0 100 200 300 400 500
Transect
Dis
tanc
e O
ffsho
re (m
)
-300
-250
-200
-150
-100
Volu
me
Cha
nge
(m3 m
-1)
DistanceVolume
Figure 36. Alongshore variation in the distance of the nearshore bar offshore relative to (a) shoreline change and (b) the change in profile volume.
45
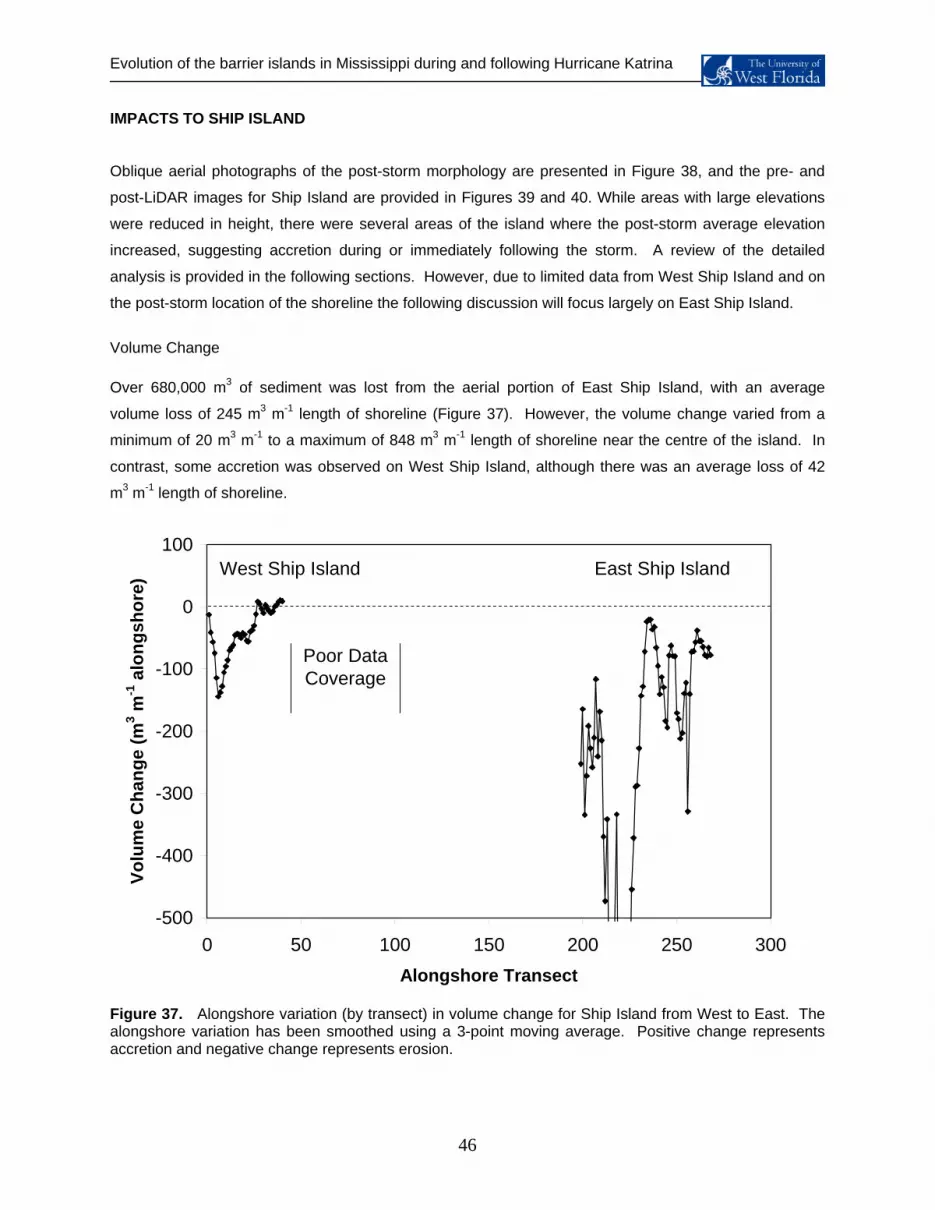
Evolution of the barrier islands in Mississippi during and following Hurricane Katrina
46
IMPACTS TO SHIP ISLAND
Oblique aerial photographs of the post-storm morphology are presented in Figure 38, and the pre- and
post-LiDAR images for Ship Island are provided in Figures 39 and 40. While areas with large elevations
were reduced in height, there were several areas of the island where the post-storm average elevation
increased, suggesting accretion during or immediately following the storm. A review of the detailed
analysis is provided in the following sections. However, due to limited data from West Ship Island and on
the post-storm location of the shoreline the following discussion will focus largely on East Ship Island.
Volume Change Over 680,000 m3 of sediment was lost from the aerial portion of East Ship Island, with an average
volume loss of 245 m3 m-1 length of shoreline (Figure 37). However, the volume change varied from a
minimum of 20 m3 m-1 to a maximum of 848 m3 m-1 length of shoreline near the centre of the island. In
contrast, some accretion was observed on West Ship Island, although there was an average loss of 42
m3 m-1 length of shoreline.
ion.
Figure 37. Alongshore variation (by transect) in volume change for Ship Island from West to East. The alongshore variation has been smoothed using a 3-point moving average. Positive change represents accretion and negative change represents eros
-500
-400
-300
-200
-100
0
100
0 50 100 150 200 250 300Alongshore Transect
Volu
me
Cha
nge
(m3 m
-1 a
long
shor
e)
West Ship Island East Ship Island
Poor Data Coverage
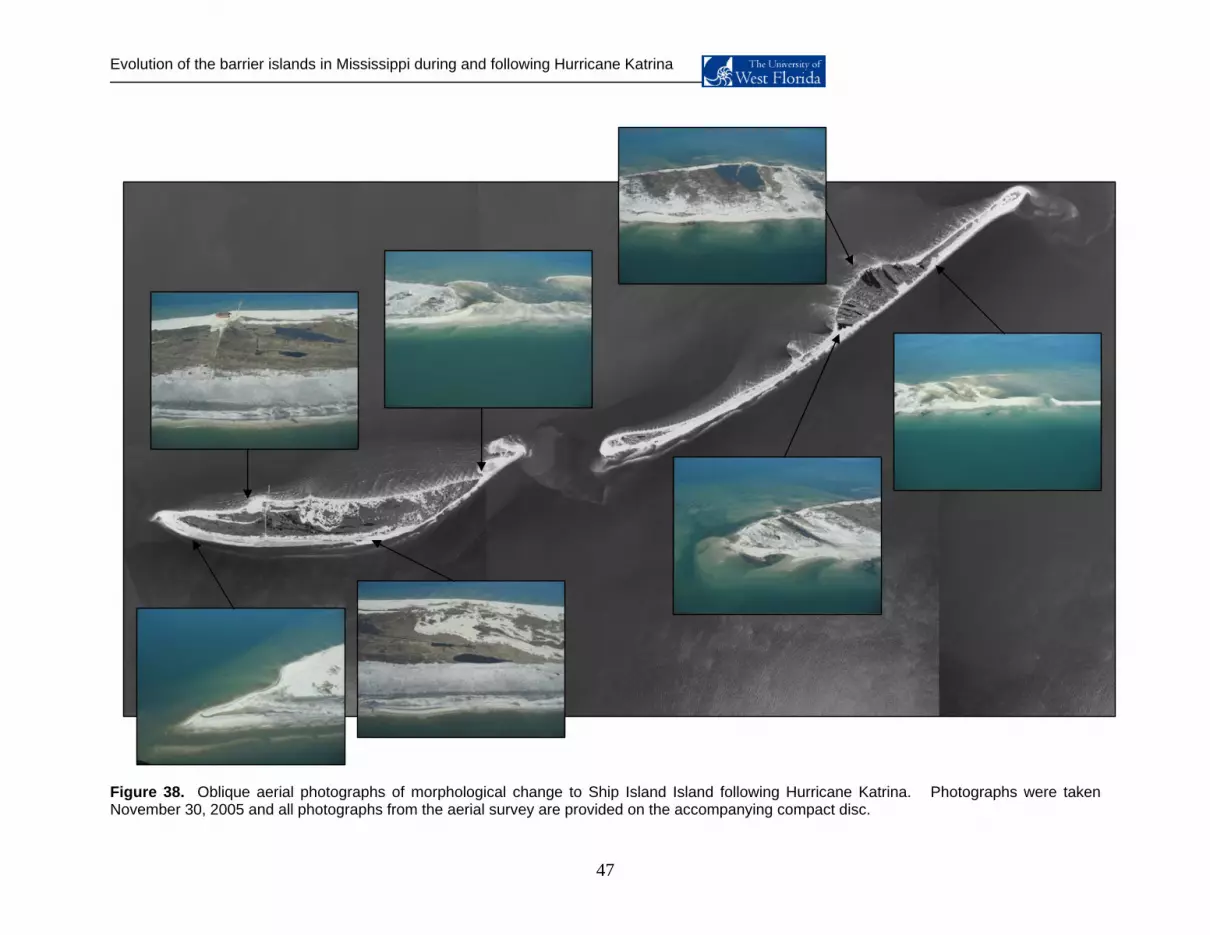
Evolution of the barrier islands in Mississippi during and following Hurricane Katrina
Figure 38. O
er 30,blique aerial photographs of morphological change to Ship Island Island fo ne Katri taken
Novemb 2005 and all photographs from the aerial survey are provided on the accomp disc. llowing Hurrica
anying compactna. Photographs were
47

Evolution of the barrier islands in Mississippi during and following Hurricane Katrina
F igure 39. Pre-storm LiDAR data for Ship Island.
48
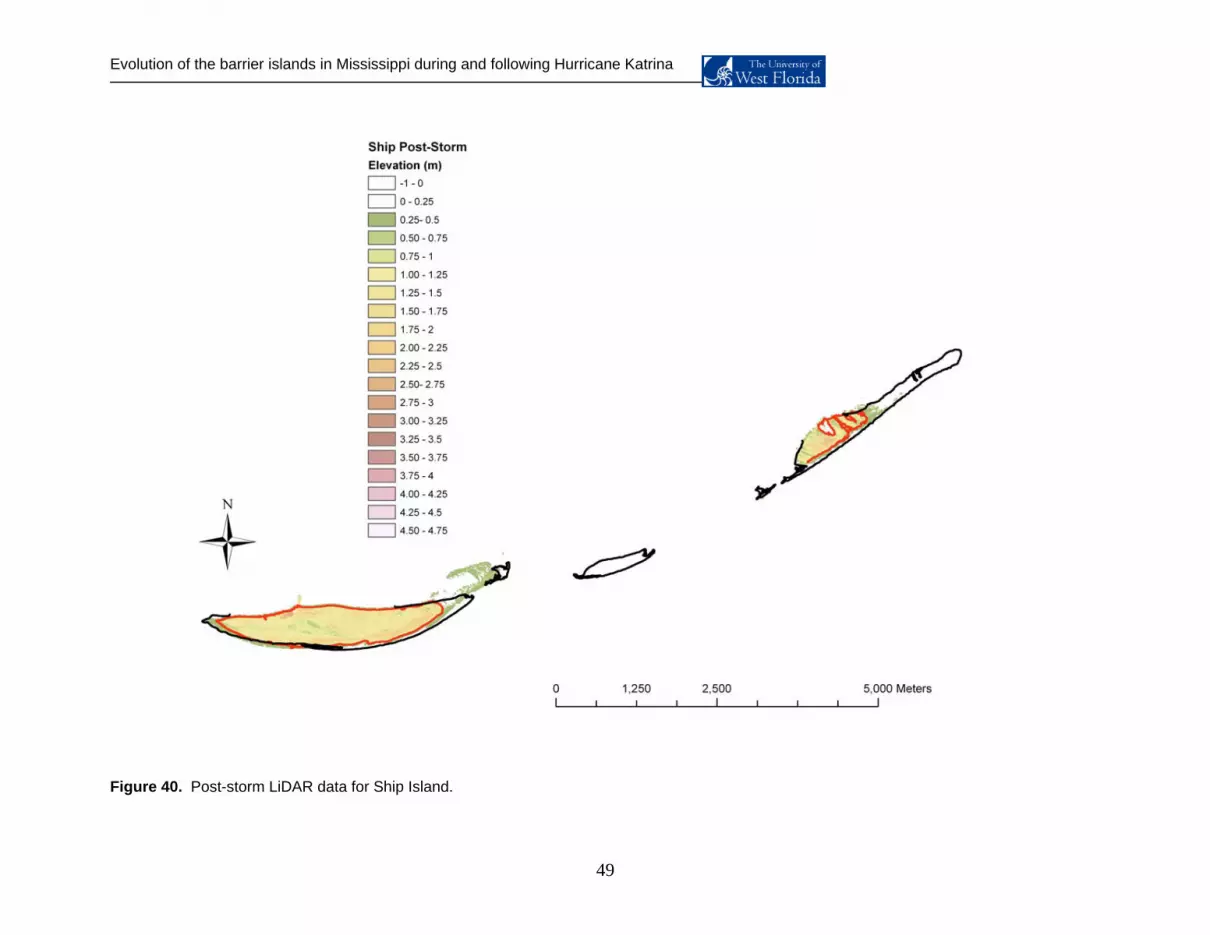
Evolution of the barrier islands in Mississippi during and following Hurricane Katrina
49
Figure 40. Post-storm LiDAR data for Ship Island.

Evolution of the barrier islands in Mississippi during and following Hurricane Katrina
Elevation Change
The alongshore variation in average elevation based on the pre- and post-storm LiDAR data are provided
in Figure 41. The change in average elevation on East Ship Island varied from a loss of 3.9 m to a loss of
0.17 m. The loss in average elevation was greatest on East Ship Island where large dune features had
been present before the storm. A scatterplot of the alongshore variation in island volume change and
average elevation change is provided in Figure 42.
0.0
0.5
1.0
1.5
2.0
2.5
3.0
3.5
4.0
4.5
5.0
5.5
0 50 100 150 200 250 3Alongshore Transect
Elev
atio
n (m
,asl
)
Pre-StormPost-Storm
00
Figure 41. (a) Alongshore variation in pre- and post-storm elevation for Ship Island.
Morphology Change
Based on the scree plots, both the pre- and post-storm datasets have six eigenmodes that are statistically
significant, with the percent of total variance explained at 74% and 76% respectively. The primary
eigenmode (E1) for the pre-storm data explains 43% of the variance and shows a large and side e in
the centre of the island at ~225 m from the shoreline. All eigenmodes exhibit this same ridge, b ith
smaller amplitude and with other ridges landward and seaward of this central ridge.
ridg
ut w
50

Evolution of the barrier islands in Mississippi during and following Hurricane Katrina
Figure 42. Relationship between (a) profile volume change and the change in average elevation (post-pre storm average elevation), and (b) pre-storm average elevation and volume change.
-4.5
-4.0
-3.5
-3.0
-2.5
-0.5
0.0
-1000 -800 -600 -400 -200 0 200
Volume Change (m3 m-1 alongshore)
Cha
nge
in
-2.0
-1.5
-1.0
Ave
rage
Ele
vatio
n (m
)
-900
-800
-600
-500
-400
-300
-200
-100
0
100
lum
e C
hang
e (m
3 m-1
)Vo
-700
0.0 1.0 2.0 3.0 4.0 5.0 6.0
Pre-storm Elevation (m)
51
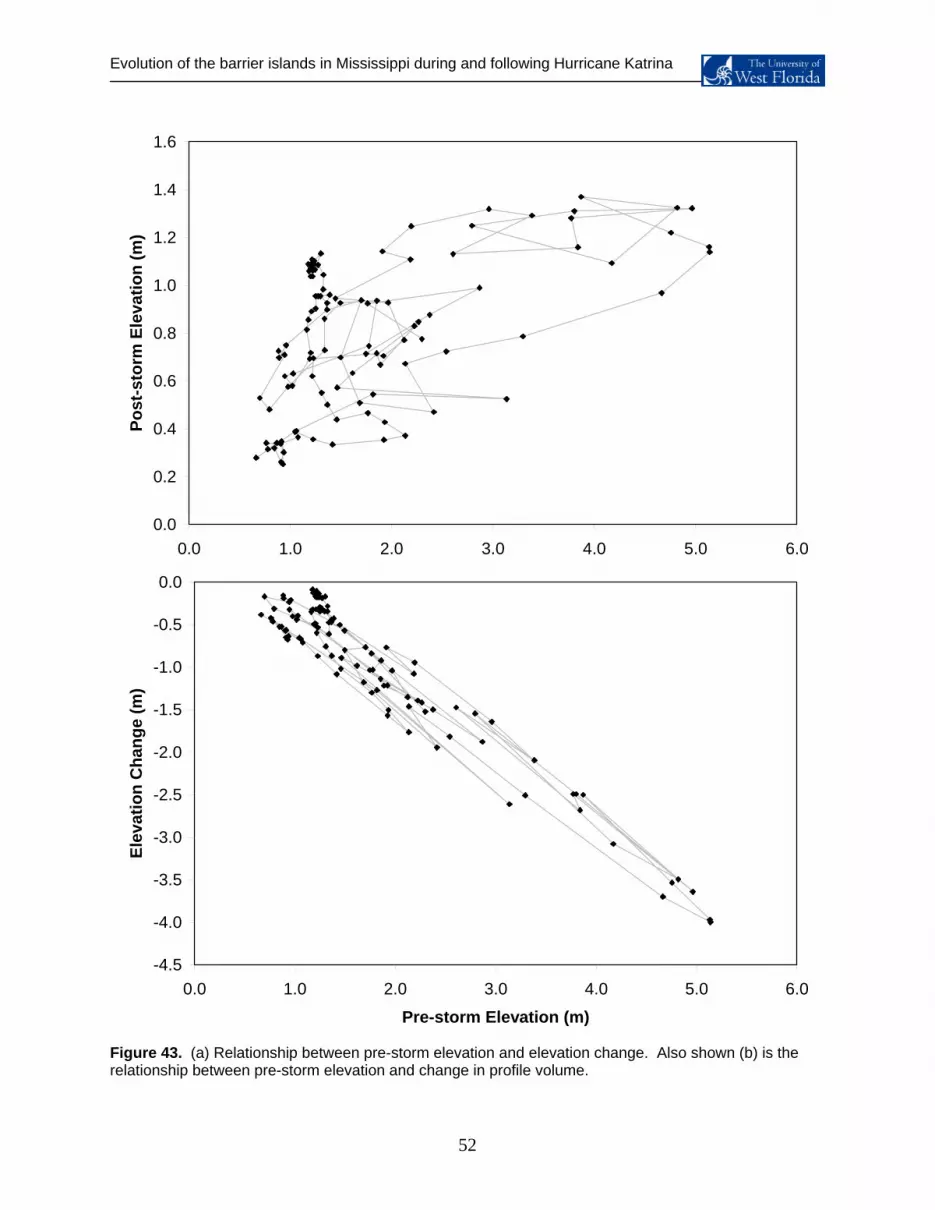
Evolution of the barrier islands in Mississippi during and following Hurricane Katrina
0.0
0.2
0.4
0.6
0.8
1.0
1.2
1.4
1.6
0.0 1.0 2.0 3.0 4.0 5.0 6.0
Pre-storm Elevation (m)
Post
-sto
rm E
leva
tion
(m)
Figure 43. (a) Relationship between pre-storm elevation and elevation change. Also shown (b) is the relationship between pre-storm elevation and change in profile volume.
-4.5
-4.0
-3.5
-3.0
-2.5
-2.0
-1.5
-1.0
-0.5
0.0
0.0 1.0 2.0 3.0 4.0 5.0 6.0
Pre-storm Elevation (m)
Elev
atio
n C
hang
e (m
)
52
Evolution of the barrier islands in Mississippi during and following Hurricane Katrina
53
Similar to the other islands and in sharp contrast with the pre-storm morphology, the post-storm
eigenmodes are characterized by a single storm ridge at varying distances from the shoreline. The
primary eigenmode (E1) is characterized by a single ridge at a distance of 125 m from the pre-storm
shoreline. The second eigenmode is characterized by a ridge ~375 m from the pre-storm shoreline, while
E3 is characterized by a ridge at the shoreline. The remaining eigenmodes (E4, E5 and E6) have ridges
at 225, 125 and 325 m from the pre-storm shoreline respectively.
No discernable alongshore patterns were observed in either the pre-storm or the post-storm morphology
for Ship Island in general or East Ship Island alone. No statistically significant relationships were
observed using Canonical Correlation Analysis between the pre- and post-storm characteristic profiles.
Bathymetry Changes Unlike Petit Bois and Horn Islands, the offshore bathymetry of Ship Island is not characterized by a
nearshore system and the analysis used for the other islands could not be used for Ship Island. The
offshore bathymetry transects for both West and East Ship Island are presented in Figure 45.

Evolution of the barrier islands in Mississippi during and following Hurricane Katrina
0.0
0.5
1.0
1.5
2.0
2.5
3.0
3.5
4.0
0 50 100 150 200 250 300 350 400
Cross-shore Distance (m)
Elev
atio
n (m
)
Ship Island Pre E1Ship Island Pre E2Ship Island Pre E3Ship Island Pre E4Ship Island Pre E5Ship Island Pre E6
a)
0.0
0.5
1.0
1.5
2.0
2.5
3.0
3.5
0 50 100 150 200 250 300 350 400
Cross-shore Distance (m)
Elev
atio
n (m
)
4.0Ship Island Post E1Ship Island Post E2
b)
Ship Island Post E3Ship Island Post E4Ship Island Post E5Ship Island Post E6
Figure 44. Characteristic (a) pre-storm and (b) post-storm cross-shore profiles for Ship Island.
54
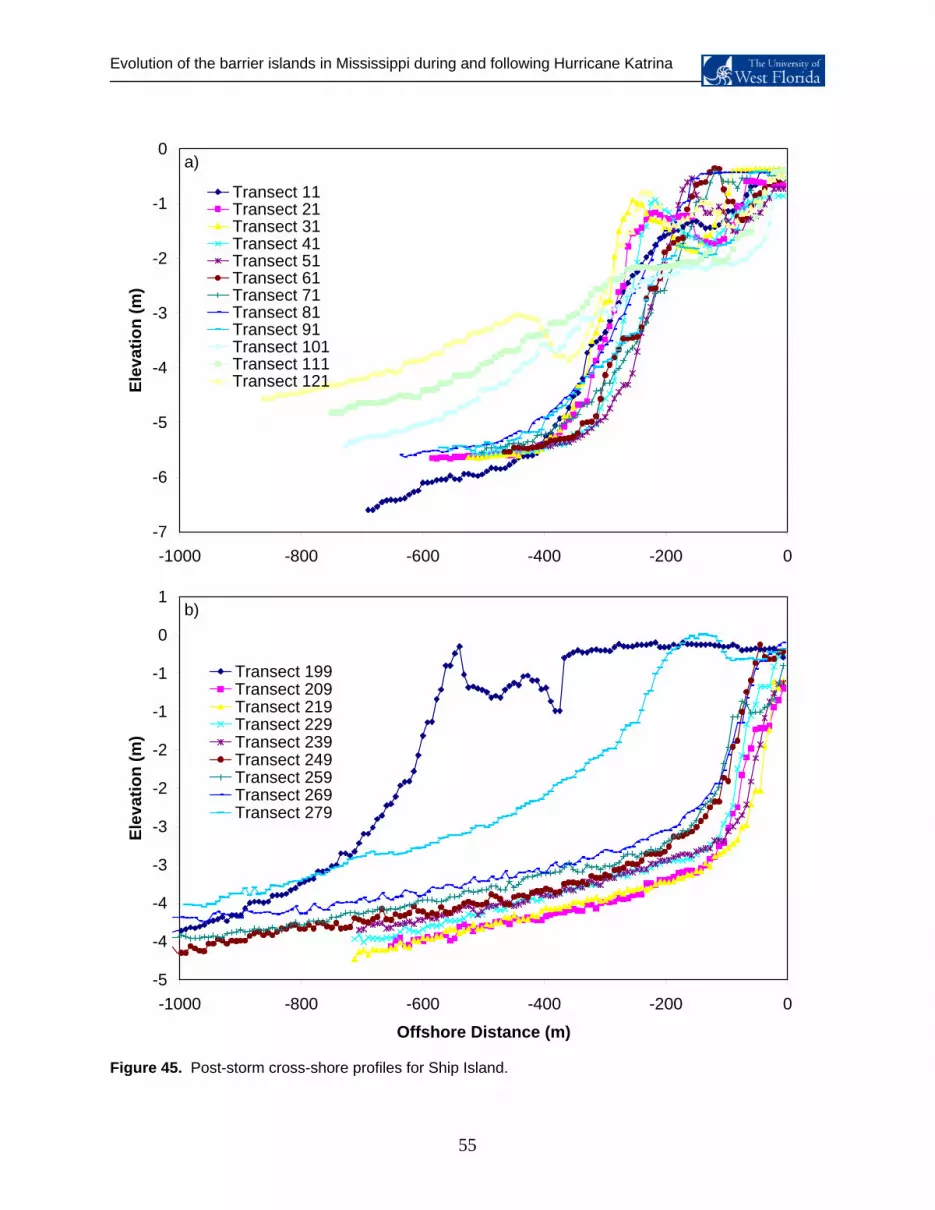
Evolution of the barrier islands in Mississippi during and following Hurricane Katrina
-2
-1
0a)
Transect 11Transect 21Transect 31Transect 41Transect 51Transect 61Transect 71
-5
(m)
Transect 81Transect 91Transect 101Transect 111Transect 121
-4
-3
Elev
atio
n
-7
-6
-1000 -800 -600 -400 -200 0
Offshore Distance (m)
Figure 45. Post-storm cross-shore profiles for Ship Island.
-5
-4
-4
-3
-3
-2
-2
-1
-1
0
1
-1000 -800 -600 -400 -200 0
Offshore Distance (m)
Elev
atio
n (m
)
Transect 199Transect 209Transect 219Transect 229Transect 239Transect 249Transect 259Transect 269Transect 279
b)
55
Evolution of the barrier islands in Mississippi during and following Hurricane Katrina
REFERENCES
Armbruster, C.K., 1997 Morphologic responses of a low-energy micro-tidal beach to winter cold front
passages: north shore Santa Rosa Island, Florida. M. S. Thesis, Department of Geography and
Anthropology, Louisiana State University, Baton Rouge, Louisiana, 166 pp.
Armbruster, C.K., Stone, G.W., Xu, J.P., 1995. Episodic atmospheric forcing and bayside
foreshore erosion: Santa Rosa Island Florida. Transactions-Gulf Coast Association of Geological
Societies XLV, 31-37.
Aubrey D., 1979. Seasonal patterns of Onshore/Offshore Movement. Journal of Geophysical Research
84: 6347-6354.
Chaney, P.L and Stone, G.W., 1996. Soundside shoreline erosion and implications for winter cold front
forcing: West Ship Island, Mississippi. Shore and Beach, 64, 27-33.
Cooper, J. A and Pilkey, O., 2004. “Sea-level Rise and Shoreline Retreat: Time to Abandon the
Bruun Rule.” Global and Planetary Change 43: 157-171.
Houser, C. and Greenwood, B., 2005. “Hydrodynamics and Sediment Transport Within the Inner Surf
Zone of a Lacustrine Multiple Barred Nearshore.” Marine Geology 218 (2005): 37-63.
Houser, C., Hamilton, S., Meyer-Arendt, K., and Oravetz, J., 2007. EOF Analysis of Morphological
response to Hurricane Ivan. Coastal Sediments, 2007.
Keim, B.D., Muller, R.A., and Stone, G.W., 2004. Spatial and temporal variability of coastal storms in the
North Atlantic Basin. Marine Geology, 210, 7-15.
Knabb, R, Rhome, J., and Brown, D., 2005. “Tropical Cyclone Report: Hurricane Katrina 23-30 August
2005.” Miami: National Hurricane Center, 2005
Kraus, N.C., Larson, M., and Kriebel, D.L., 1991. Evaluation of beach erosion and accretion predictors.
Proceedings of Coastal Sediments 1991. ASCE Press, New York, 572-587.
Kwon, D. “Barrier Islands of the Northern Gulf of Mexico Coast: Sediment Sources and Development.”
Louisiana State University, Coastal Studies Series 25 (1975): 51.
56
Evolution of the barrier islands in Mississippi during and following Hurricane Katrina
57
Larson, M., Capobianco, M., Jansen, H., Rozynski, G., Southgate, H., Stive, M., Wijnberg, K., and
Hulscher, S., “Analysis and Modeling of Field Data on Coastal Morphological Evolution Over Yearly and
Decadal Time Scales. Part 1: Background and Linear Techniques.” Journal of Coastal Research 19.4
(2003): 760-775.
Leatherman, S., 1977. Overwash Hydraulics and Sediment Transport.” Coastal Sediments:135-148.
Leatherman, S.P., 1979. Landward Migration of Nauset Spit: Relative Rates and Mechanisms. NPS-
CRU-UMass Report.
McBride, R.A. and Byrnes, M.R., 1997. Regional variations in shore response along barrier island
systems of the Mississippi River Delta Plain; historical change and future prediction. Journal of Coastal
Research, 13, 628-655.
Meredith, A., .Eslinger, D., Aurin, D. 1999. An evaluation of Hurricane Induced Erosion Along the North
Carolina Coast Using Airborne LiDAR Surveys. Charleston: Coastal Service Center Technical Report
CSC/99031-PUB, 1999.
Morton, R. 2002. Factors controlling Storm Impacts on Coastal Barrier and Beaches: A Preliminary Basis
for Real Time Forecasting. Journal of Coastal Research 18.3: 486-501.
Morton, R.A., and Sallenger, A.H., 2003. Morphological impacts of extreme storms on sandy beaches
and barriers. Journal of Coastal Research, 19, 560-573.
Otvos, E., 1979, Barrier island evolution and history of migration, North Central Gulf Coast, in S. P.
Leatherman, ed., Barrier Islands: New York, Academic Press, 325 p.
Plant, M. Freilich, and R. Holman. “The role of morphological feedback in surf zone sand bar response.”
Journal of Geophysical Research 106 (2001): 959-971.
Sallenger, A. H., 2000, Storm impact scale for barrier islands. J. Coastal Research, 16, 890-895.
Schmidt, Keil “East Ship Island Evolution, Morphology, and Hurricane Response 1994 to 2001.”
Mississippi Department of Environmental Quality, Open File Report 134. 2003.
Shepard, F. “Gulf Coast Barriers.” Recent Sediments Northwest Gulf of Mexico. American Association of
Petroleum Geologists, 1960. 197-220.
Evolution of the barrier islands in Mississippi during and following Hurricane Katrina
Stone, G.W. and Morgan, J.P., 1993. Implications for a constant rate of relative sea-level rise during the
st millennium along the Northern Gulf of Mexico: Santa Rosa Island, Florida. Shore and Beach, 61, 24-
f extratropical and tropical
yclones on the short-term evolution of barrier islands along the northern Gulf of Mexico, USA. Marine
ng, R. S. 1991. "Quantitative evaluation of coastal geomorphic changes in South
arolina After Hurricane Hugo." In: Finkl, C.W. and Pilkey, O.H. (eds.), Impacts of Hurricane Hugo:
horton, E., Sallenger, A., Conforto Sesto, J., Egley, L., McGee, T., and Parons. R., 2006. Sand Mining
.S. Army Corps of Engineers. Coastal Engineering Manual: Engineer Manual 1110-2-1100. USACE:
aller, T. and L. Malbrough, 1976. “Temporal Changes in the Offshore Islands of Mississippi.” Water
hite, S., and Wang, Y., 2003. “Utilizing DEMs derived from LiDAR data to analyze morphologic change
hang, K., Whitman, D., Leatherman, S., and Robertson, W., 2005. “Quantification of Beach Changes
la
28.
Stone, G.W., Liu, B., Pepper, D.A., and Wang, P., 2004. The importance o
c
Geology, 210, 63-78.
Thieler, E.R., and You
C
September 10-22, 1989, Journal of Coastal Research Special Issue #8: 187-200.
T
Impacts on Long-term Dune Erosion in Southern Monterey Bay. Marine Geology 229 (2006): 45-58.
U
Washington, D.C. 2002.
W
Resources Research Institute, Mississippi State University.
W
in the North Carolina coastline.” Remote Sensing of Environment 85: 39-47.
Z
Caused by Hurricane Floyd Along Florida's Atlantic Coast Using Airborne Laser Surveys.” Journal of
Coastal Research 21.1: 123.
58


