Embed Size (px)
Citation preview
ADDIS ABABA SCIENCE AND TECHNOLOGY UNIVERSITY
COLLEGE OF ARCHITECTURE AND CIVIL ENGINEERING
ROAD AND TRANSPORTATION ENGINEERING PROGRAM
IMPACT OF TRUCK OVERLOADING ON PAVEMENT SERVICE LIFE
(A CASE IN AWASH – MILLE ROAD)
By
Miftah Musbah (GSR 0153/06)
ADVISOR: DR. BIKILA TEKLU
March, 2017
i
APPROVAL PAGE
This Msc thesis entitled with “Impact of Truck overloading on pavement service life” has
been approved by the following examiners in partial fulfillment of the requirement for the
degree of Master of Science in Road and Transport Engineering.
Date of Defense: February 27, 2017
Principal Advisor
1. Dr. Bikila Teklu _______ ______
Signature Date
Members of the Examining board:
1. Dr. Esayas G/Yohannis _______ ________
External Examiner Signature Date
2. Mr. Brook Abate ________ _______
Internal Examiner Signature Date
3. Mr. Addisu Bekele _______ ________
Head , Civil Engineering Department Signature Date
4. Dr. Brook Abate _______ ________
Dean, College of Architecture Signature Date
and Civil Engineering
ii
CERTIFICATION
I, the undersigned, certify that I read and hear by recommend for acceptance by Addis Ababa
Science and Technology University a thesis entitled "Impact of truck overloading on
pavement service life” in partial fulfillment of the requirement for the degree of Master of
Engineering in Road and Transport Engineering.
____________________________
Dr. Bikila Teklu
Principal Advisor

iii
DECLARATION AND COPY RIGHT
Miftah Musbah Mohammed, declare that this thesis is my own original work that has not
been presented and will not be presented by me to any other University for similar or any
other degree award.
_____________________________
Signature
This thesis is copy right material protected under the Berne Convention , the copy right act
1999 and other international and national enactments in that behalf, on intellectual property.
It may not be reproduced by any means, in full or in part, except for short extract in fair
dealing for research or private study, critical scholarly review or discourse with an
acknowledgement, without written permission of the college of Architecture and Civil
Engineering, on the behalf of both the author and Addis Ababa Science and Technology
University.
iv
Table of Contents
1 Introduction ...................................................................................................................... 1
1.1 Background ................................................................................................................. 1
1.2 Statement of the Problem ............................................................................................ 3
1.3 Objectives of the Research ......................................................................................... 4
1.3.1 General objective ................................................................................................. 5
1.3.2 Specific objectives ............................................................................................... 5
1.3.3 Research Questions ............................................................................................. 5
1.4 Organization of the Thesis .......................................................................................... 5
2 Litrature Review .............................................................................................................. 7
2.1 Introduction ................................................................................................................. 7
2.2 Impact of Overloading ................................................................................................ 7
2.2.1 Impact on Pavement ............................................................................................ 7
2.2.2 Impact on Traffic Safety ...................................................................................... 9
2.2.3 Impact on Transport Industry ............................................................................ 10
2.3 Axle load Management in Ethiopia .......................................................................... 11
2.3.1 Incidence of Overloading .................................................................................. 11
2.4 Effect of Vehicle Technology ................................................................................... 12
2.4.1 Axle Configuration ............................................................................................ 12
2.4.2 Tire Type ........................................................................................................... 12
2.4.3 Tire Pressure ...................................................................................................... 13
2.4.4 Lift Axle ............................................................................................................ 14
2.4.5 Loading Configuration ...................................................................................... 15
2.5 Pavement design techniques ..................................................................................... 15
2.5.1 Early design systems, the CBR method ............................................................ 15
2.5.2 AASHTO design method .................................................................................. 16
2.5.3 Mechanistic Empirical design method .............................................................. 17
2.6 Damage analysis ....................................................................................................... 19
2.7 Asphalt stiffness value .............................................................................................. 20
2.8 Resilient Modulus ..................................................................................................... 23
2.8.1 Axle Load Survey .............................................................................................. 25
v
2.8.2 KENLAYER Software ...................................................................................... 27
3 Materials and research methods ................................................................................... 28
3.1 General ...................................................................................................................... 28
3.2 Study Area ................................................................................................................ 28
3.3 Climate ...................................................................................................................... 29
3.3.1 Temperature ....................................................................................................... 29
3.3.2 Rain fall ............................................................................................................. 30
3.4 Sub grade Investigation ............................................................................................ 31
3.5 Resilient Modulus ..................................................................................................... 31
3.6 Asphalt Concrete Stiffness ........................................................................................ 32
3.7 Contact Pressure ....................................................................................................... 32
3.8 Design vehicle and wheel configuration ................................................................... 34
3.9 Overloading scenario ................................................................................................ 34
3.9.1 Overloading status ............................................................................................. 34
3.9.2 Selected loads for analysis ................................................................................. 34
3.10 KENPAV software ................................................................................................ 34
3.11 Damage ratio ......................................................................................................... 35
4 Results and Discussion ................................................................................................... 36
4.1 Sub grade investigation ............................................................................................. 36
4.2 Resilient Modulus ..................................................................................................... 36
4.3 Asphalt concrete stiffness ......................................................................................... 37
4.4 Contact Pressure ....................................................................................................... 40
4.5 Design Vehicle and wheel configuration .................................................................. 41
4.6 Overloading scenario ................................................................................................ 42
4.6.1 Overloading Status ............................................................................................ 42
4.6.2 Selected Loads for analysis ............................................................................... 47
4.7 Stress and Strain ........................................................................................................ 47
4.8 The impact of axle load increase on pavement strains and Damaging Ratios .......... 50
4.9 The impact of axle load increase on pavement Fatigue and Rutting lives ............... 54
4.10 Impact of axle load increase on the pavement service life .................................... 57
5 Conclusion and Recommendation ................................................................................ 59
vi
6 Bibliography ................................................................................................................... 61
List of Tables
Table 2-1 : Spectra of overloading ......................................................................................... 11
Table 2-2 : Fatigue model coefficients based on different agencies ....................................... 20
Table 2-3 : Rutting model coefficients from different agencies .............................................. 20
Table 2-4 : Suggested layer coefficients for existing AC pavement layers materials ............ 22
Table 4-1: Marshal test results ................................................................................................ 37
Table 4-2 : Estimating Elastic Modulus of Asphalt Layer ...................................................... 39
Table 4-3 : Overloading scenario on the front axles of various vehicle classes ...................... 43
List of Figures
Figure 2-1: Damaging effect of overloading ............................................................................. 8
Figure 2-2 : Scenario of road serviceability decrease due to overloading vehicle .................... 9
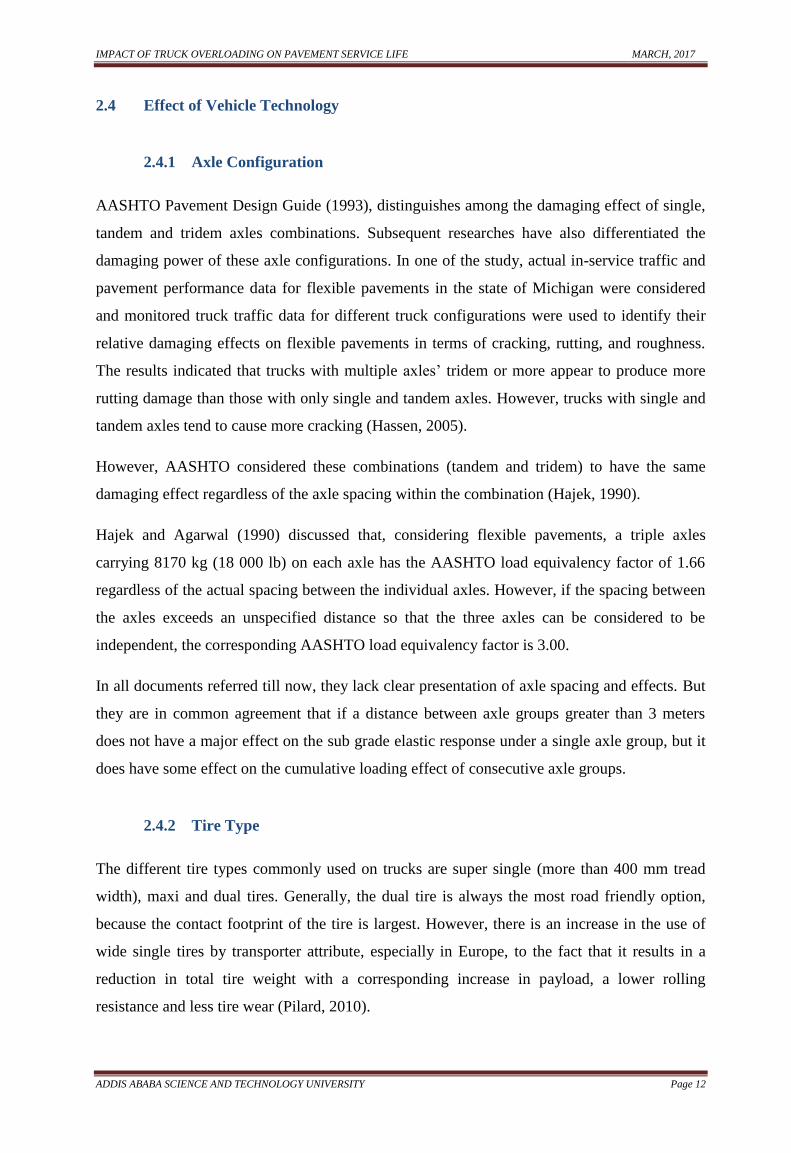
Figure 2-3 : Tire contact pressure ........................................................................................... 14
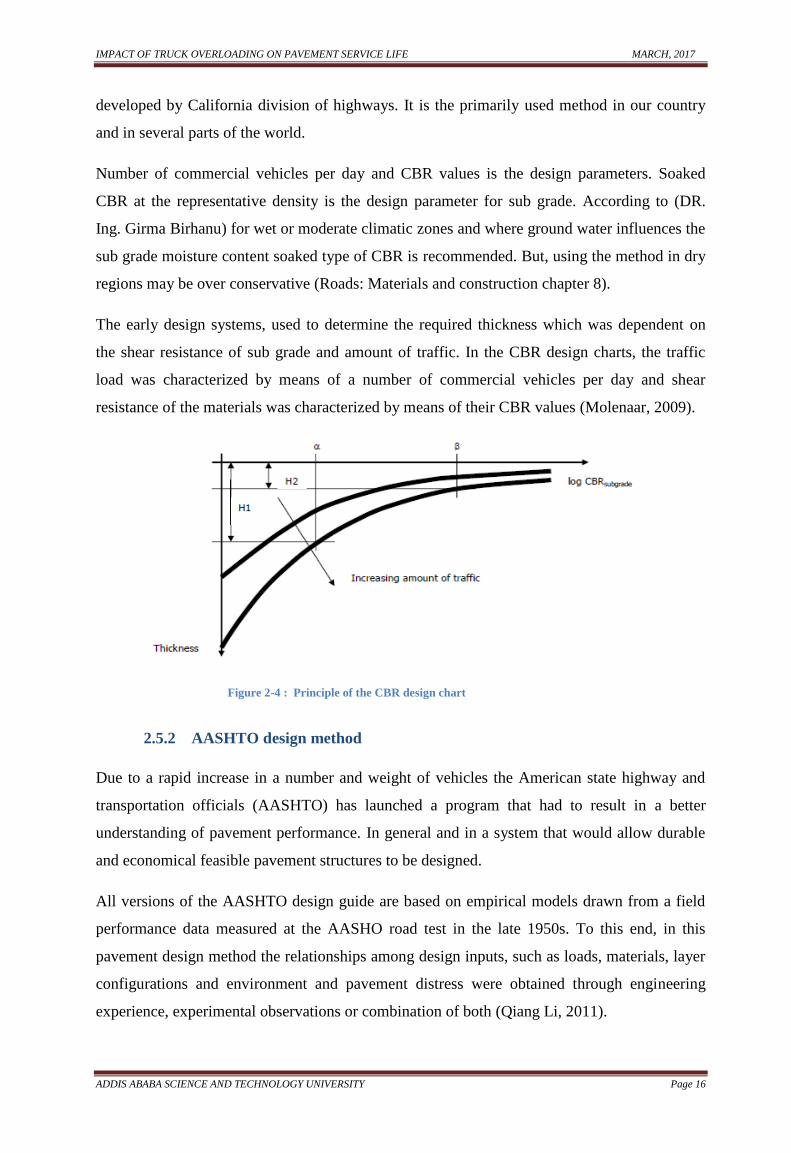
Figure 2-4 : Principle of the CBR design chart ...................................................................... 16
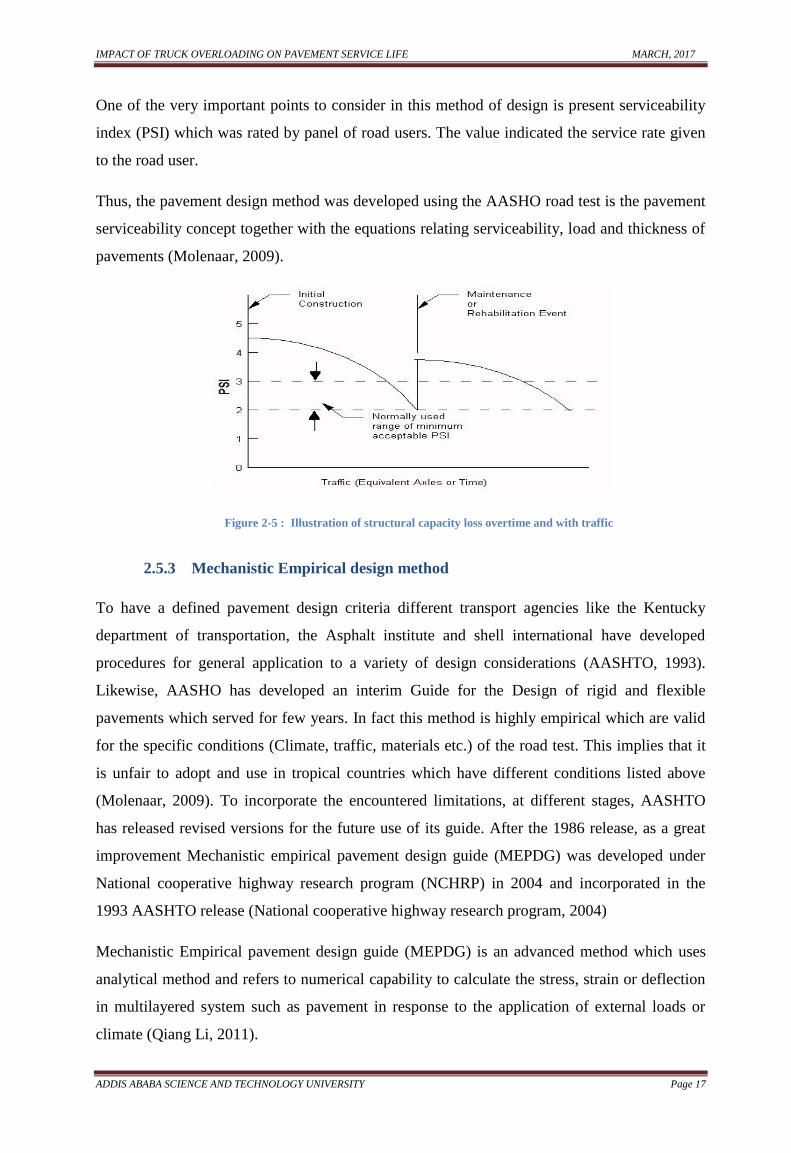
Figure 2-5 : Illustration of structural capacity loss overtime and with traffic ........................ 17
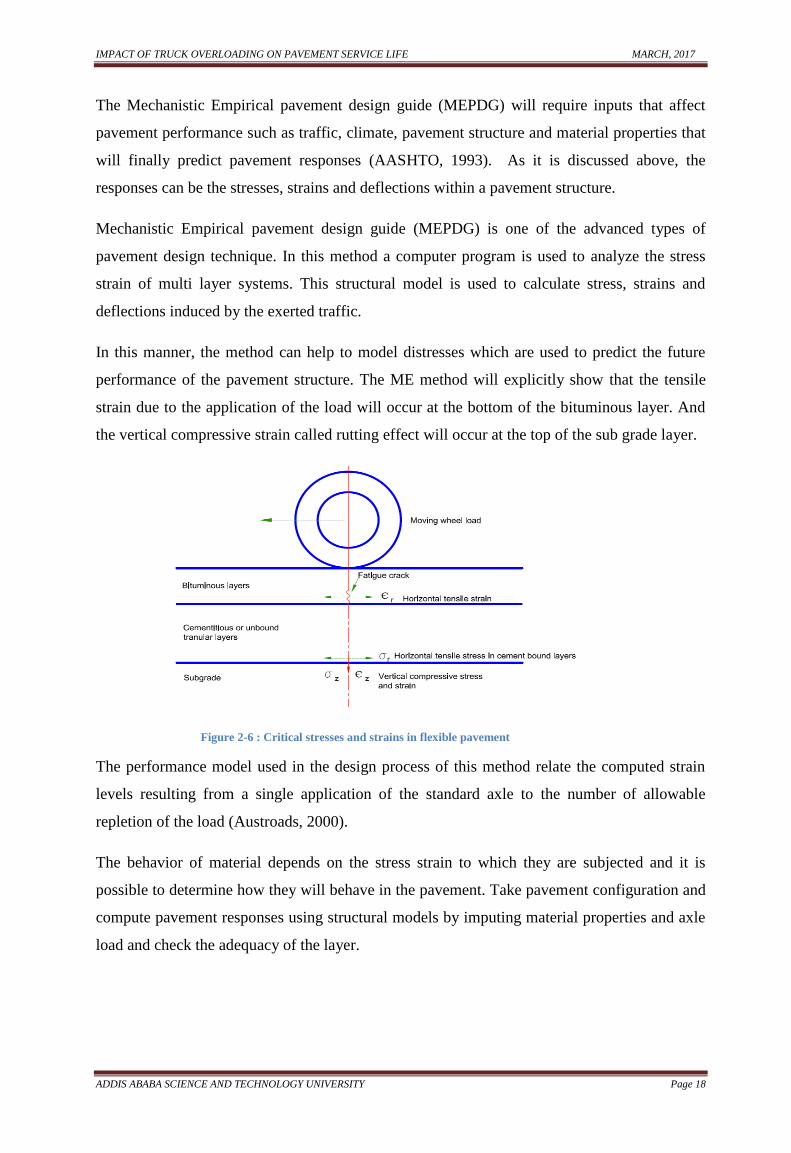
Figure 2-6 : Critical stresses and strains in flexible pavement ................................................ 18
Figure 2-7 : Correlation chart for estimating resilient modulus of HMA ............................... 21
Figure 2-8 : Structural layer vs layer coefficient for HMA .................................................... 22
Figure 2-9 : Stress due to a moving load ................................................................................. 23
Figure 2-10 : FWD deflection data .......................................................................................... 24
Figure 2-11 : Variation in granular sub base modulus ............................................................ 25
Figure 3-1 : Location map of the study road ........................................................................... 29
Figure 3-2 : Mean monthly minimum and maximum temperature ......................................... 30
Figure 3-3 : Mean rainfall data ............................................................................................... 30
Figure 3-4 : Test pit excavation .............................................................................................. 31
Figure 3-5 : Measuring contact pressure at Awash stationary weighing bridge .................... 33
Figure 3-6 : KENPAV main Menu .......................................................................................... 35
Figure 4-1 : Executing marshal laboratory test ....................................................................... 37
Figure 4-2 : Contact pressure .................................................................................................. 40
Figure 4-3 : Selected design vehicle type ................................................................................ 41
Figure 4-4 : Wheel configuration of the selected design vehicle type .................................... 41
Figure 4-5 : Percentage of load distribution of axles .............................................................. 42
Figure 4-6 : Comparison between allowable and actual axle load (Axle 1) ........................... 44
Figure 4-7 : Comparison between allowable and actual axle load (Axle 2) ........................... 44
Figure 4-8 : Comparison between allowable and actual axle load (Axle 3) ........................... 45
Figure 4-9 : Comparison between allowable and actual axle load (Axle 4) ........................... 45
Figure 4-10 : Comparison between allowable and actual axle load (Axle 5) ......................... 46
Figure 4-11 : Comparison between allowable and actual axle load (Axle 6) ......................... 46
vii
Figure 4-12 : The relationship between deflection and depth ................................................. 48
Figure 4-13 : The relationship between vertical stress and depth ........................................... 49
Figure 4-14 : The relationship between horizontal strain and depth ....................................... 50
Figure 4-15 : The relationship between axle load and tensile strain ....................................... 52
Figure 4-16 : The relationship between axle load and compressive strain .............................. 52
Figure 4-17 : The relationship between axle load and Fatigue damage ratio ......................... 53
Figure 4-18 : The relationship between axle load and rutting damage ratio ........................... 54
Figure 4-19 : The relationship between axle load and pavement fatigue life ......................... 55
Figure 4-20 : The relationship between axle load and pavement rutting life .......................... 56
Figure 4-21 : Axle load vs the difference between rutting and fatigue lives for different AC
moduli ...................................................................................................................................... 56
Figure 4-22 : Effect of axle load increase on pavement service life ....................................... 57
viii
Abbreviations
AASHTO American Association of State Highway & Transportation Officials
AADT Average Annual Daily Traffic
EAC East Africa Community
EALF Equivalent Axle Load Factor
EF Equivalent Factor
ERA Ethiopian Roads Authority
ESAL Equivalent Single Axle Load
GDP Gross Domestic Product
GVM Gross Vehicle Mass
JICA Japan International Cooperation Agency
SADC Southern African Development Community
SSATP Sub-Saharan Africa Transport Policy Program
TRL Transport Research Laboratory
VOC Vehicle Operating Cost
CBR California Bearing Ratio
PSI Present Serviceability Index
HMA Hot Mix Asphalt
DCP Dynamic Cone Penetrometer
ESA Equivalent Axle Load
IRI International Roughness Index
MR Resilient Modulus
CR Contact Radius
MEPDG Mechanistic Empirical Pavement Design Guide
FWD Falling Weight Deflectometer
AC Asphalt Concrete
NCHRP National Cooperative Highway Research Program
PCC Portland cement Concrete

ix
Acknowledgement
In doing this thesis, I would like to express my deepest gratitude to my advisor Dr. Bikila
Teklu, for his guidance, support and supervision throughout this research work.
Again I would like to extend my heartfelt thanks to my friends Gizachew Tilahun and Hussen
Feko who has been supporting and encouraging me in doing this research.
In addition, I would like to acknowledge Ethiopian Roads Authority (ERA) for giving me the
opportunity in pursuing this MSC study. I also want to appreciate ERA‟s vehicle size and
weight limit team including their subordinate staff. At last my appreciation goes to for ERA‟s
staff working at Awash weighing station for providing any information I need. And Ethiopian
Road Construction Corporation (ERCC) for their keen support in providing me equipments
that can help me to take material samples from the existing pavement.
Finally, I would like to thank my sincere wife Maria Yahya and staffs of college of
Architecture and civil Engineering, Addis Ababa Science and Technology University, who
gave me a considerable support and encouragement from the beginning to end of the thesis
work.
x
Abstract
Truck overloading may cause excessive damage to the road infrastructure and will incur a
significant increase in annual expenditure on roads for a road controlling authority and requires
budgeting for. However, truck drivers violate the load regulation by neglecting the damage
occurs on road. Thus, this study aims to reveal the existing truck overload situation and study
the negative impact on pavement service life. The impact of overloading with respect to tire
type and contact pressure will be dealt in depth. Axle load survey, secondary material
property, and data for damage quantifiers are collected from the site visit and the concerned
office. Some material quality investigations, like sub grade extension is carried out in
laboratory data is used for the analysis was also collected. The research uses KENPAV
software to calculate pavement critical responses such as stress, strain and deflection based
on layer material properties and climatic conditions. The research tries to device mechanism
to minimize the overloading situation in the country.
Since the route is the only route heading to the port Djibouti, It entertains an intense traffic
flow to and from the port. Truck overloading is the problem found in the entire country;
however, the situation is severe on Awash – Mille road. To this fact, the location is preferred
to be a primary choice for this study. Due to this reason and resource limitation (time and
budget) the study is restricted on this specific site. However, End outcomes obtained from
this study will help as a representative to indicate the seriousness of truck overloading on
pavement service life in our country.
On the road under study (Awash-Mille), heavy truck and articulated trucks are dominant
types, of which its second tandem axle dual wheel arrangement is critical combination since
it takes about 20.6% of gross vehicle weight.
The research finds up to 1.86% of front axles are over the legal limit. Nevertheless, on
average 29% of rear axles are still over the legal limit.
As a result of this externally applied load. The induced pavement deflection, vertical stress
and horizontal stress have minimum value in low temperature season than at high
temperature season.
Pavement life or number of load repetitions to failure obtained from either fatigue or rutting
models. While, in our case it was governed by rutting failure.
The research ultimately concludes that, increase in axle load limit, decreases pavement
service life. Hence, when the axle load increase from 10 Tons to 12 Tones the pavement
service life decreases to about 64% of the value for a pavement of having lower AC modulus
xi
(during high temperature season). While, pavement service life decreases to about 80% for a
pavement having strongest AC modulus (during low temperature season).
Due to the Ethiopian government‟s effort to minimize over loading problem, a lot of punitive
measures has been set out. But, there were vehicles who frequently contravene the load
regulation. Accordingly, because of those vehicles which increased axle load from 10 Tons to
12 Tones, the pavement would approximately have a chance to provide (remaining life) two
third of its service life compared to 10 tones axle load during high temperature season.
However, it loses only one fifth of its service life during low temperature season.
The strength of asphalt stiffness has significant effect on the load carrying capacity of the
pavement. The more the asphalt stiffness increases, the more it becomes durable (Long
serving) and vice versa. To avoid the detrimental effect of axle load increase beyond the
permissible limit, different mitigation measures has shown at the end of this document. In
view of this, as a developing country with a limited resources, a durable / long serving/ road
is necessitated to minimize the associated early maintenance cost. We demand a road in good
condition and better transportation system. Having a road free of damage is economically
worthwhile and establishes a comfortable and safe transportation system.
KEYWORDS: Heavy vehicles, Mechanistic –Empirical (ME), Rut depth, Fatigue cracking,
Design period.
IMPACT OF TRUCK OVERLOADING ON PAVEMENT SERVICE LIFE MARCH, 2017
ADDIS ABABA SCIENCE AND TECHNOLOGY UNIVERSITY Page 1
1 INTRODUCTION
1.1 Background
Transport policy in Ethiopia relates predominantly to road transport, given the importance of
this mode to the economy and the mostly rural population. The critical role of road sector
development in supporting implementation of strategic development programmers has come
to be recognized in the design of government economic and social development policies.
Correspondingly, the design of road sector policies and strategies is now firmly oriented
towards supporting the achievement of development goals. In the expansion of transport
system various challenges are encountered, the major one is truck overloading.
To tackle the problem of truck overloading, Axle load limits restrict how much weight can be
carried on an axle, pair of axle, and on the vehicle or vehicle combination (Ministry of
Transport, 2012). In Ethiopia, formal concerns over the impacts of axle load on road
infrastructure were first addressed in the 1962, Vehicle Size and Weight Regulations No.
261/1962. As per this regulation, no axle of a vehicle shall carry a gross load in excess of 8
tones, and the total gross weight by a group of two or more axles shall not exceeded 14.5
tones where the distance between the said axles is not greater than 2.15m. In 1990, the weight
limits have been revised, which increased to 8 tones and 10 tones for steering and rear axles
respectively. Gross weight with the load imposed on the highway by a group of two axles
where the distance between the said axles is not more than 1300mm, the maximum load
imposed shall not exceed 17 tones (Ministry of Transport, 2012). Under this regulation, any
person who contravenes or fails to comply is liable to convection to the penalties through
judicial procedures.
The Road and Transport Authority (RTA) have the responsibility to determine axle load and
vehicle size limits. Whereas, the Ethiopian Roads Authority (ERA), have the responsibility to
construct and maintain the road infrastructure and to enforce axle load as per the
proclamation No.80/1997 stated for the reestablishment of road authorities. Load surveys
carried out in various countries, it has been found that up to 70 per cent of commercial
vehicles are overloaded. Not only are the number of vehicles which are overloaded are large
but the magnitude of the loading is high (Rolt, 1981). According to the study carried out in
2011 by Daniel Legesse Alemu (2013), on Adama – Awash road only 4.5% of the total daily
truck and truck trailers en route passing along weight and size controlling station. However,
IMPACT OF TRUCK OVERLOADING ON PAVEMENT SERVICE LIFE MARCH, 2017
ADDIS ABABA SCIENCE AND TECHNOLOGY UNIVERSITY Page 2
they are allowed to abuse the regulation for 95.5% of their trips. Due to this over loading
effect, pavements will fail before the intended service /operational/ life. To this effect, it has
necessitated the government more capital infusion to preserve the asset by undertaking
remedial measures. According to WSP International and Transport Research Laboratory
(1999) study “The costs of constructing and maintaining the road to the VOC (Vehicle
operating cost) are very large indeed, often amounting to 10% of GDP (Gross domestic
product), and hence it is the aim of the government to minimize them (WSP International and
Transport Research Laboratory, 1999).
It is practically impossible to completely avoid truck overloading. Truck over loading also
exist in developed country like US and Canada, However, the overloading percentage in
developed country is 2 – 5% while in developing countries it can reach as high as 80% (Chan,
2008).
In our country many truck drivers were observed to violate the limit by carrying excess loads
in order to decrease the transportation cost. According to the working paper presented by
WSP in association with TRL (1999), “some 20% of heavy vehicles axles are overloaded, in
extreme cases, up to 170 % over the legal limit.
Here are the alleged factors that influence truck loading: - Change in vehicle composition,
traffic volume, economic growth, trucks efficiency, price of construction materials, especially
petroleum products and vehicle technology are some of them.
One of the difficulty that Ethiopian Roads Authority facing is the rapidly growing amount of
freight carried by road becoming as a result of economic growth. Predictions of road freight
doubling or moreover ten year periods have been made by ERA. Additionally, there has been
a recent trend towards more innovative heavy vehicle designs, and network owners like ERA
are being faced with the need to make predictions of long term effect of these new vehicles
on their network.
Basically inadequate design thickness, using sub-standard material (using marginal material
without treatment) and inadequate drainage systems are the common cause of pavement
distress. A classical example to this is the Koforidua by-pass road constructed in Ghana,
where the design life was 15 years but it failed in less than Six (6) months after being opened
to vehicular traffic (Francis, 2013). Likewise, overloading is also among the most important
IMPACT OF TRUCK OVERLOADING ON PAVEMENT SERVICE LIFE MARCH, 2017
ADDIS ABABA SCIENCE AND TECHNOLOGY UNIVERSITY Page 3
causes of flexible pavement failures. The situation will also worsen in countries like Ethiopia;
where there is a noticeable fast economic growth is recorded.
Pavement distresses like fatigue, cracking and deformation are the direct result of truck
overloading. This has a significant effect to reduce the intended service life of the road. In
addition, pavement failure is not only dependent on the loads but also on contact area over
which the wheel load is distributed has a contribution in pavement failure.
Road safety is an integral part of road transport system. Even though contemporarily dealt
research paper was not found on the impact of truck overloading and safety, other countries
experience have shown that overloading could affect the road safety due to the need in an
increased braking distance, increased severity of accidents, decrease stability and increased
likely hood of mechanical failure (WSP International and Transport Research Laboratory,
1999).
This study will therefore, aim to assess the current over loading situations and investigate its
impact on the pavement service life by taking Awash – Mille road as study area. Especial
emphasis is required to as road transport is the dominant mode of conveyance of goods in the
country.
1.2 Statement of the Problem
Ethiopia is one of the rapidly economically growing countries in East Africa. Due to this fact,
the transportation demand in the past few years have persistently kept increasing. Awash-
Mille is the main corridor linking Ethiopia with neighboring Djibouti for the use of port. The
road entertains an intense traffic demand in which many trucks violate the maximum load
limit specified by the Road and Transport authority (10 Tones for rear axle) by carrying
additional weights to decrease transportation cost. Truck overloading remains one of the
primary contributors to the pavement distress under the study area beside the effect of
material quality and climatic condition. In spite of the government‟s continuous effort to
improve the road condition, no significant change is observed. As it is the only route heading
to the port, the interruption of traffic is unimaginable and results with a tremendous economic
loss. Accordingly, the importance of this road makes the maintenance work very difficult and
expensive. In developing countries like Ethiopia where resources are limited, construction of
road infrastructure is huge investment and should at least provide a service up to a reasonably
accepted time limit with a minimum cost of maintenance. Thus, this study will address the
IMPACT OF TRUCK OVERLOADING ON PAVEMENT SERVICE LIFE MARCH, 2017
ADDIS ABABA SCIENCE AND TECHNOLOGY UNIVERSITY Page 4
impact of truck overloading on pavement service life and show the effect of climate on the
asphalt stiffness and its capacity due to a continuously increasing imposed load.
Overall, there remain a number of gaps that this study will take time to address including:
Truck Over loading has taken a great attention as a cause for pavement premature failure. To
this effort, former researches have deeply indicated the existence of truck overloading and its
impact on pavement service life of Adama – Awash road segment. But, this research needs to
widely demonstrate the actual peak overloading scenario of the corridor. And, fill the gap that
overlooked by others regarding the scale /Magnitude/ of pavement service life reduction for
every incremental stage of axle loading. Finally, this study considers pavement material
properties along the study road.
Even if the construction of new roads is widely undertaking in many parts of the country,
most of them are observed to fail before their intended design period. Other than overloading
and using substandard material quality, no emphasis is given to the effect of tire contact
pressure on pavement.
As vehicular transport is the dominant mode of transportation system of the country, it is
heavily reliant on long distance trucking both for import and exports purposes. In this process
vehicle overloading is common incidence. Overloaded vehicles are expected to contribute an
enormous damage to pavements which cripple the proper service rendered by our road
infrastructure. So, to optimize the problem, there is a continuous need to check whether the
currently working permissible axle load limit can fairly represent the actual loading scenario
or not.
Most researches carried out on pavement service life in our country have overlooked to
consider the effect of climate /Seasonal/ variation on the asphalt stiffness that ultimately
affects the load carrying capacity of a pavement.
1.3 Objectives of the Research
The research is intended to obtain a better understanding of the effect of truck overloading on
pavement service life in the study area, and to point out some of the counter measures that
has to be taken by ERA nationally to minimize the impact of overloading effect on pavement
service age.
IMPACT OF TRUCK OVERLOADING ON PAVEMENT SERVICE LIFE MARCH, 2017
ADDIS ABABA SCIENCE AND TECHNOLOGY UNIVERSITY Page 5
1.3.1 General objective
To investigate the impact of truck overloading on pavement service life and device
recommendations to reduce its negative effect.
1.3.2 Specific objectives
To assess the characteristics of commercial vehicles, and the current truck
overloading status in the corridor.
To assess the impact of overloading on pavement service life. Meanwhile, it is
possible to show the effect of asphalt stiffness value on the prevailing axle load
carrying capacity.
To explicitly show the pavement critical responses caused by truck overloading by
using KENPAV software.
1.3.3 Research Questions
To this end, the research will attempt to answer the following questions in the study area:
In relation to the General objective:
Does truck over loading has a direct impact on the pavement service life? If so, how
much is the magnitude of its effect?
In relation to the Specific objective:
Is there any truck over loading operating on the corridor?
What will be the maximum limit of truck over loading with respect to the regulation?
Can our pavement accommodate this over loading effect?
What counter measure has to be taken in the design mechanism to minimize its effect?
1.4 Organization of the Thesis
This research is organized into five chapters. A brief introduction is presented in Chapter 1
(this chapter) followed by Chapter 2 which reported the findings of literature review
undertaken during the preparation of this research to identify gaps. Chapter 3 focuses on the
research materials and methods. Chapter 4 discusses about results and discussion.

IMPACT OF TRUCK OVERLOADING ON PAVEMENT SERVICE LIFE MARCH, 2017
ADDIS ABABA SCIENCE AND TECHNOLOGY UNIVERSITY Page 6
Finally Chapter 5 presents a summarized conclusion and the possible mitigation measures for
the overloading problem.
IMPACT OF TRUCK OVERLOADING ON PAVEMENT SERVICE LIFE MARCH, 2017
ADDIS ABABA SCIENCE AND TECHNOLOGY UNIVERSITY Page 7
2 LITRATURE REVIEW
2.1 Introduction
Literature review on various topics relevant to the study was conducted. It included
researching the impact of truck overloading on road infrastructure and traffic safety so as to
demonstrate the need for overload control. A literature review of similar studies and
Regulations were conducted to gain a better understanding of the aspects involved in axle load
limits and its control in Ethiopia, and identify any gaps. In addition, this study required a
review of the effects of vehicle technology on axle load limit determination. Available
pavement design methods and management tools were also reviewed for selecting applicable
methods for analysis.
2.2 Impact of Overloading
2.2.1 Impact on Pavement
Wear or damage to a road pavement is not purely a function of the amount of traffic but rather
the wheel or axle loading from that traffic. Light cars and other smaller vehicles have little
effect on a pavement whilst heavily loaded trucks have a major impact. The American
Association of State Highway & Transportation Officials (AASHTO) road tests that were
carried out during the years 1959 – 1961 established that, the life of a given road is
approximately proportional to the fourth power of the axle load for the same number of passes
(AASHTO, 1993).
The damage is exponential, which is often measured in terms of an Equivalent Axle Load
Factor (EALF) or simply Equivalent Factor (EF). It defines the damage per pass to pavement
by the axle in question relative to the damage per pass of a standard axle load, usually the 8160
kg single axle load (Huang, 2004). The relationship to determine Equivalency Factors (EF) is:
EF = (Axle load/8160)n where the axle load is in kilograms Equation 1
It is known that the value of the exponent is generally taken to be about 4.5 (Ethiopian Roads
Authority, 2002a). This means that just doubling the axle load beyond the standard limit will
result in damaging effect of 22 times. However, there is considerable uncertainty as to its exact
value „n‟ under different conditions. A partial analysis of the AASHO Road Test showed that
the power can vary from 2.4 up to 6.6 under extreme conditions (J.Rolt, 1981). Further
experimental and research work undertaken since the AASHTO road test has indicated that the
IMPACT OF TRUCK OVERLOADING ON PAVEMENT SERVICE LIFE MARCH, 2017
ADDIS ABABA SCIENCE AND TECHNOLOGY UNIVERSITY Page 8
power law exponent is related to pavement type (granular, cemented) and mode of distress
(rutting, fatigue, sub-grade deformation) and may vary from less than 1 to more than 18
(Pilard, 2010).
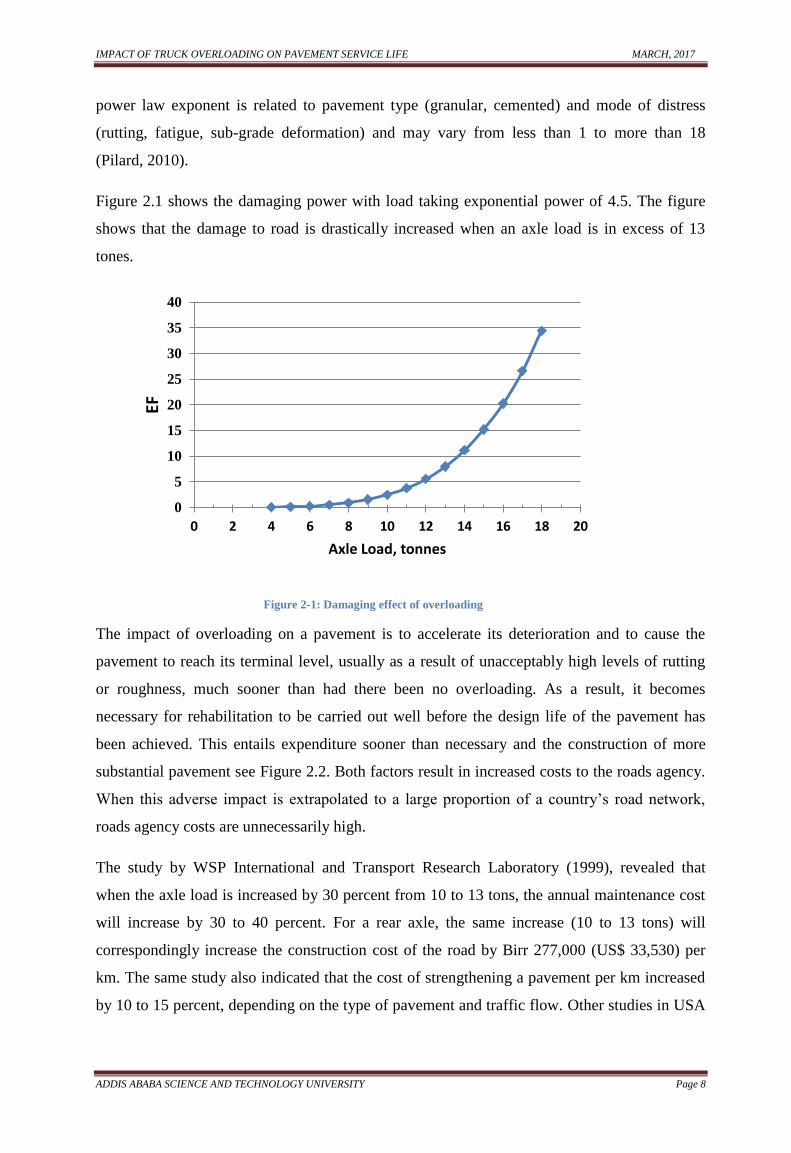
Figure 2.1 shows the damaging power with load taking exponential power of 4.5. The figure
shows that the damage to road is drastically increased when an axle load is in excess of 13
tones.
Figure 2-1: Damaging effect of overloading
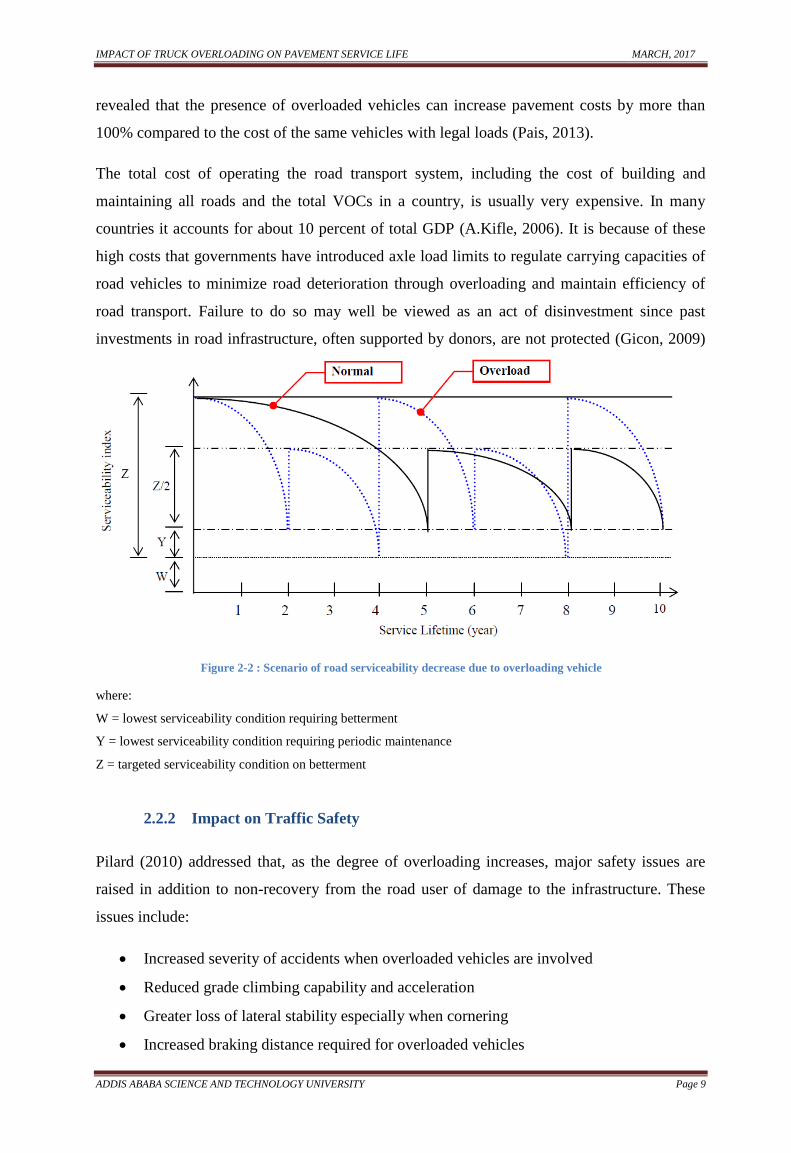
The impact of overloading on a pavement is to accelerate its deterioration and to cause the
pavement to reach its terminal level, usually as a result of unacceptably high levels of rutting
or roughness, much sooner than had there been no overloading. As a result, it becomes
necessary for rehabilitation to be carried out well before the design life of the pavement has
been achieved. This entails expenditure sooner than necessary and the construction of more
substantial pavement see Figure 2.2. Both factors result in increased costs to the roads agency.
When this adverse impact is extrapolated to a large proportion of a country‟s road network,
roads agency costs are unnecessarily high.
The study by WSP International and Transport Research Laboratory (1999), revealed that
when the axle load is increased by 30 percent from 10 to 13 tons, the annual maintenance cost
will increase by 30 to 40 percent. For a rear axle, the same increase (10 to 13 tons) will
correspondingly increase the construction cost of the road by Birr 277,000 (US$ 33,530) per
km. The same study also indicated that the cost of strengthening a pavement per km increased
by 10 to 15 percent, depending on the type of pavement and traffic flow. Other studies in USA
0
5
10
15
20
25
30
35
40
0 2 4 6 8 10 12 14 16 18 20
EF
Axle Load, tonnes
IMPACT OF TRUCK OVERLOADING ON PAVEMENT SERVICE LIFE MARCH, 2017
ADDIS ABABA SCIENCE AND TECHNOLOGY UNIVERSITY Page 9
revealed that the presence of overloaded vehicles can increase pavement costs by more than
100% compared to the cost of the same vehicles with legal loads (Pais, 2013).
The total cost of operating the road transport system, including the cost of building and
maintaining all roads and the total VOCs in a country, is usually very expensive. In many
countries it accounts for about 10 percent of total GDP (A.Kifle, 2006). It is because of these
high costs that governments have introduced axle load limits to regulate carrying capacities of
road vehicles to minimize road deterioration through overloading and maintain efficiency of
road transport. Failure to do so may well be viewed as an act of disinvestment since past
investments in road infrastructure, often supported by donors, are not protected (Gicon, 2009)
Figure 2-2 : Scenario of road serviceability decrease due to overloading vehicle
where:
W = lowest serviceability condition requiring betterment
Y = lowest serviceability condition requiring periodic maintenance
Z = targeted serviceability condition on betterment
2.2.2 Impact on Traffic Safety
Pilard (2010) addressed that, as the degree of overloading increases, major safety issues are
raised in addition to non-recovery from the road user of damage to the infrastructure. These
issues include:
Increased severity of accidents when overloaded vehicles are involved
Reduced grade climbing capability and acceleration
Greater loss of lateral stability especially when cornering
Increased braking distance required for overloaded vehicles
IMPACT OF TRUCK OVERLOADING ON PAVEMENT SERVICE LIFE MARCH, 2017
ADDIS ABABA SCIENCE AND TECHNOLOGY UNIVERSITY Page 10
Increased vehicle emissions, noise and ground-borne vibrations
Pilard (2010) further found that, the severity of road accidents in Africa is extremely high –
estimated to be some 30 to 50 times higher that the United Kingdom or the USA. Many of
these accidents are caused by overloaded commercial vehicles. The cost of overloading is
estimated to consume some 1 to 2 percent of GNP in Africa (Transport research laboratory,
1991). A study in province of Kwazulu – Natal, South Africa, particularly showed that the
direct and indirect costs as a result of accidents in the province were estimated to be US$ 13.3
million per year (Panordogen, 2000)
The Coalition against Bigger Trucks (CABT) cited key findings, referring sources, from point
of view of higher crash risk, stability problems, braking issues, and slower acceleration:
Multi-trailer trucks – doubles and triple-trailer trucks could be expected to experience
an 11% higher overall fatal crash rate than single-trailer combinations.
Heavier trucks tend to have a higher center of gravity because the additional weight is
stacked vertically. Raising the center of gravity increases the risk of rollovers.
Triple-trailer trucks are more likely to experience trailer sway and the “crack the whip”
effect.
Increasing truck weight is likely to lead to even more brake maintenance problems and
longer stopping distances.
Heavier and longer trucks are likely to have poorer power-to-weight ratios which mean
that they accelerate more slowly and have trouble maintaining speed on upgrades.
Increasing the speed differential between trucks and other traffic increases the risk of
accidents.
2.2.3 Impact on Transport Industry
Pilard (2010) acknowledged that, overloading places transporters who abide by the regulations
at a disadvantage as they are not able to compete with those transporters that overload. This
has an adverse, knock-on effect on the industry as some transporters then resort to overloading
in order to be able to compete with those who overload. The net effect is that a transporter‟s
survival in a harshly competitive market is often related to how successful he is at getting away
with overloading. Not surprisingly, overloading has become big business as in most cases the
fines imposed by magistrates in a court of law remain unrealistically low compared with the
higher profit made by the operator in transporting a heavier load (Pilard, 2010).
IMPACT OF TRUCK OVERLOADING ON PAVEMENT SERVICE LIFE MARCH, 2017
ADDIS ABABA SCIENCE AND TECHNOLOGY UNIVERSITY Page 11
2.3 Axle load Management in Ethiopia
2.3.1 Incidence of Overloading
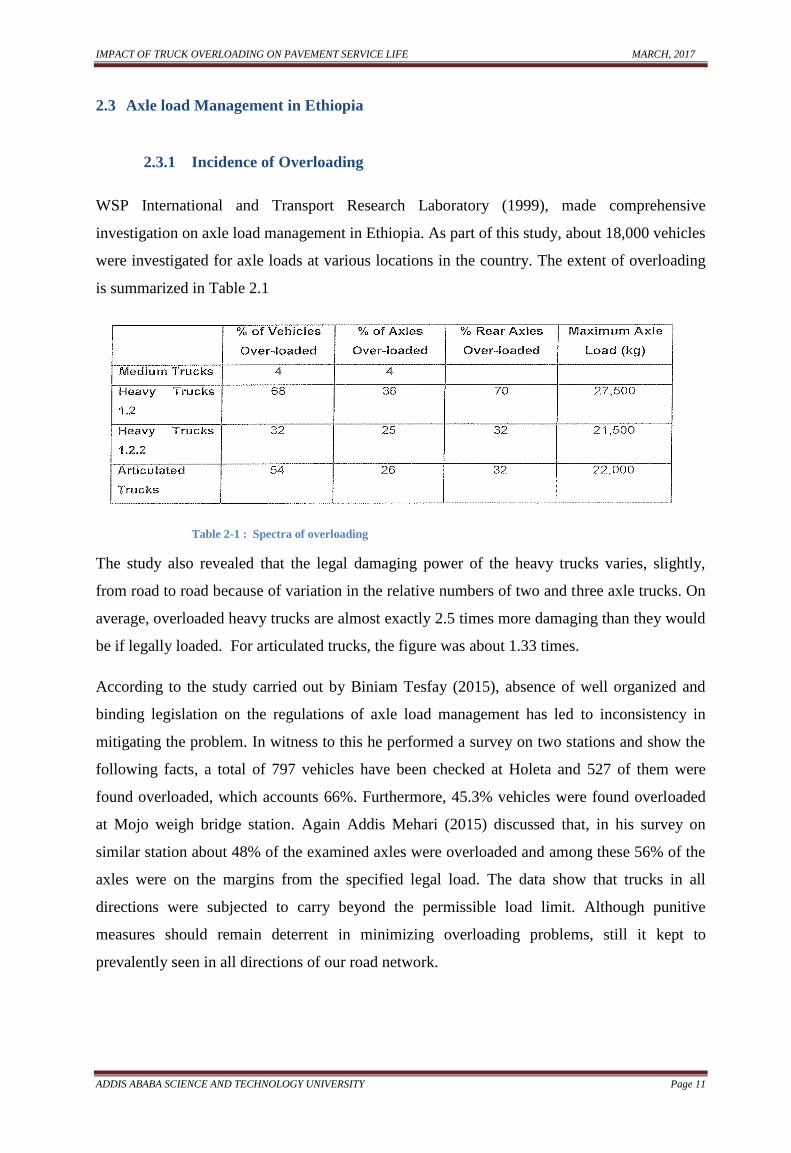
WSP International and Transport Research Laboratory (1999), made comprehensive
investigation on axle load management in Ethiopia. As part of this study, about 18,000 vehicles
were investigated for axle loads at various locations in the country. The extent of overloading
is summarized in Table 2.1
Table 2-1 : Spectra of overloading
The study also revealed that the legal damaging power of the heavy trucks varies, slightly,
from road to road because of variation in the relative numbers of two and three axle trucks. On
average, overloaded heavy trucks are almost exactly 2.5 times more damaging than they would
be if legally loaded. For articulated trucks, the figure was about 1.33 times.
According to the study carried out by Biniam Tesfay (2015), absence of well organized and
binding legislation on the regulations of axle load management has led to inconsistency in
mitigating the problem. In witness to this he performed a survey on two stations and show the
following facts, a total of 797 vehicles have been checked at Holeta and 527 of them were
found overloaded, which accounts 66%. Furthermore, 45.3% vehicles were found overloaded
at Mojo weigh bridge station. Again Addis Mehari (2015) discussed that, in his survey on
similar station about 48% of the examined axles were overloaded and among these 56% of the
axles were on the margins from the specified legal load. The data show that trucks in all
directions were subjected to carry beyond the permissible load limit. Although punitive
measures should remain deterrent in minimizing overloading problems, still it kept to
prevalently seen in all directions of our road network.
IMPACT OF TRUCK OVERLOADING ON PAVEMENT SERVICE LIFE MARCH, 2017
ADDIS ABABA SCIENCE AND TECHNOLOGY UNIVERSITY Page 12
2.4 Effect of Vehicle Technology
2.4.1 Axle Configuration
AASHTO Pavement Design Guide (1993), distinguishes among the damaging effect of single,
tandem and tridem axles combinations. Subsequent researches have also differentiated the
damaging power of these axle configurations. In one of the study, actual in-service traffic and
pavement performance data for flexible pavements in the state of Michigan were considered
and monitored truck traffic data for different truck configurations were used to identify their
relative damaging effects on flexible pavements in terms of cracking, rutting, and roughness.
The results indicated that trucks with multiple axles‟ tridem or more appear to produce more
rutting damage than those with only single and tandem axles. However, trucks with single and
tandem axles tend to cause more cracking (Hassen, 2005).
However, AASHTO considered these combinations (tandem and tridem) to have the same
damaging effect regardless of the axle spacing within the combination (Hajek, 1990).
Hajek and Agarwal (1990) discussed that, considering flexible pavements, a triple axles
carrying 8170 kg (18 000 lb) on each axle has the AASHTO load equivalency factor of 1.66
regardless of the actual spacing between the individual axles. However, if the spacing between
the axles exceeds an unspecified distance so that the three axles can be considered to be
independent, the corresponding AASHTO load equivalency factor is 3.00.
In all documents referred till now, they lack clear presentation of axle spacing and effects. But
they are in common agreement that if a distance between axle groups greater than 3 meters
does not have a major effect on the sub grade elastic response under a single axle group, but it
does have some effect on the cumulative loading effect of consecutive axle groups.
2.4.2 Tire Type
The different tire types commonly used on trucks are super single (more than 400 mm tread
width), maxi and dual tires. Generally, the dual tire is always the most road friendly option,
because the contact footprint of the tire is largest. However, there is an increase in the use of
wide single tires by transporter attribute, especially in Europe, to the fact that it results in a
reduction in total tire weight with a corresponding increase in payload, a lower rolling
resistance and less tire wear (Pilard, 2010).
IMPACT OF TRUCK OVERLOADING ON PAVEMENT SERVICE LIFE MARCH, 2017
ADDIS ABABA SCIENCE AND TECHNOLOGY UNIVERSITY Page 13
Theoretical studies, developed after the practical evidences, have confirmed that the super
single tires have caused more damage to pavements. Regression analysis made by Engineers,
lne (1993) showed that, the super single tires were 2.18 times as damaging as the dual tires.
Similar study in Brazil revealed that the super single tires result in maintenance and
construction costs that are higher than the costs associated to conventional dual wheels (Jose
L.Femandes, 1995).
Our regulation does not deal specifically with the use of wide single tires. However, the Japan
Internaational cooperation Agency (2011), study team recommended the following mass limits to
be adopted for super single tires: (a) 8.5 tones for a single axle fitted with two 385/65R22.5
tires, (b) 9 tones for a single axle fitted with two 425/65R22.5 or 445/65R22.5 tires, and (c) 10
tones for a single axle fitted with four conventional tires. The recommendation has got
acceptance by EAC member countries.
2.4.3 Tire Pressure
Conventional estimation of traffic for pavement design purposes is usually based only on axle
loads. However, tire pressure is also an important parameter that can influence pavement
performance, particularly those constructed with natural gravel, unbound bases. Technical
developments in the manufacture of tires have also made it possible to apply higher tire
inflation pressure than before. As a result, tire pressures have risen steadily over the years and
are now considerably higher (of the order of 800 to 1000 kPa) than those used in the AASHTO
Road Test (550 kPa) which provides the basis for many empirical pavement design methods. It
is noteworthy that in the European Union, tire pressures of 800 kPa are legislated (Pilard,
2010).
The effect of high tire pressures is to generate high shear stresses in the upper layers of
pavements. This is not normally a problem where pavements have been well designed and
constructed. However, in certain situations, e.g. steep grades or in poorly drained areas where
moisture sensitive, low-strength materials are used, it can be problematic and can result in the
cracking of surface layers, rutting from plastic deformation of the base layer, shoving (shear
failure) of the base and breakdown of weak aggregates. A study in Brazil showed that the
maintenance and construction costs related to the lower tire inflation pressure (80 psi) are
significantly lower than the costs related to the higher tire inflation pressure (120 psi) (Jose
L.Femandes, 1995).
IMPACT OF TRUCK OVERLOADING ON PAVEMENT SERVICE LIFE MARCH, 2017
ADDIS ABABA SCIENCE AND TECHNOLOGY UNIVERSITY Page 14
Our regulation does not deal specifically with the limitation of tire pressure. In practice,
enforcement of tire pressure is problematic in the ESA region and hence it is better to take into
account in designing road pavements (Pilard, 2010).
Figure 2-3 : Tire contact pressure
2.4.4 Lift Axle
The purpose of a lift axle is to provide additional support when a truck is carrying a load that is
heavier than was originally intended. Lift axles allow a truck to carry greater payloads or cargo
for a small increase in vehicle cost. Lift axles can be raised or lowered based on the weight
being carried. Specifically, a lift axle is an additional axle located on the truck and has the
ability to be raised or lowered based on the GVW (Gross vehicle weight). Most automatic lift
axle systems are operated by the usage of a hydraulic or air pressure bag technology in the axle
configuration, which regulates the lowering of the lift axle (Chung C., 2011)
Drawbacks to the usage of lift axles were identified in the National Cooperative Highway
Research Program (NCHRP) Report 575 (Sivakumar) include:
Lift axles, when deployed, reduce the turning capabilities of the truck and may cause
the truck to jackknife on slippery roads. If the axles are raised through the turn the
truck‟s stability is compromised and the chance of rollover is increased.
The proportion of the load carried by the lift axle is often controlled by the driver. If the
axle is deployed too far, it may carry too much of the load. If the axle is not deployed
far enough, the other axles may be overloaded.
Enforcing compliance with lift axle regulations is very difficult. Lowering retractable
axles when approaching a weigh facility and then raising the lift axles after clearing the
weigh facility is not uncommon. Regulatory agencies sometimes require the controls
for raising and lowering the lift axles to be located outside the cab to inhibit this
IMPACT OF TRUCK OVERLOADING ON PAVEMENT SERVICE LIFE MARCH, 2017
ADDIS ABABA SCIENCE AND TECHNOLOGY UNIVERSITY Page 15
practice. Some states have banned the use of lift (or retractable) axles for the reasons
cited above.
Vehicle steering is also a concern with lift-axle equipped trucks. Some axles are non steerable
where steering around corners and on curves becomes difficult. The only way to ease
maneuverability would be to raise the non-steerable axle when turning. However, when lifting
the axle to steer around corners or turns, this increases the likelihood of pavement damage
because the lift axle weight is then shifted to the other fixed axles. A study in Maryland
showed that for a truck with the lift axle lifted when it was supposed to be deployed, the
damage is about three times greater than the damage of a tridem-axle case (Chung C., 2011).
Our regulation does not deal specifically with the use of wide single tires. The Japan
Internaational cooperation Agency (2011), study team recommended that, liftable axle should
automatically be in the “down” position on the road pavement, if the adjacent fixed axle is
loaded to or above the legal maximum axle mass.
2.4.5 Loading Configuration
In the aforementioned section it is to be recalled that the study road section is subjected to high
traffic volume. The availed traffic incorporates vehicles with various loading pattern. The
mechanism used to distribute load are configured in a single axle with single tires, a single axle
with dual tires, tandem axle with dual tires and tridem axles with single tires.
Among the above specified mechanisms, the load distribution mechanisms which have a single
axle with dual tires are critical axles for two axle trucks. Again tandem axles with dual tires are
the critical axles for both three axle trucks and five axle trailers and standard axle (8.2 Tones).
In accordance with Huang (2004), Tires have to be oriented in the X and Y coordinates for the
ease of analysis. The two dual tires must be oriented in the Y direction with dual spacing of
YW. If YW is specified as 0 (Zero), the tandem or tridem axle loads are applied on a single
tire. Otherwise, if the YW is different from zero (YW ≠0) they are applied on dual tires.
2.5 Pavement design techniques
2.5.1 Early design systems, the CBR method
Pavement is provided to create a safe and comfortable riding surface on road with a minimum
cost of construction and maintenance works. The CBR pavement design method was
IMPACT OF TRUCK OVERLOADING ON PAVEMENT SERVICE LIFE MARCH, 2017
ADDIS ABABA SCIENCE AND TECHNOLOGY UNIVERSITY Page 16
developed by California division of highways. It is the primarily used method in our country
and in several parts of the world.
Number of commercial vehicles per day and CBR values is the design parameters. Soaked
CBR at the representative density is the design parameter for sub grade. According to (DR.
Ing. Girma Birhanu) for wet or moderate climatic zones and where ground water influences the
sub grade moisture content soaked type of CBR is recommended. But, using the method in dry
regions may be over conservative (Roads: Materials and construction chapter 8).
The early design systems, used to determine the required thickness which was dependent on
the shear resistance of sub grade and amount of traffic. In the CBR design charts, the traffic
load was characterized by means of a number of commercial vehicles per day and shear
resistance of the materials was characterized by means of their CBR values (Molenaar, 2009).
Figure 2-4 : Principle of the CBR design chart
2.5.2 AASHTO design method
Due to a rapid increase in a number and weight of vehicles the American state highway and
transportation officials (AASHTO) has launched a program that had to result in a better
understanding of pavement performance. In general and in a system that would allow durable
and economical feasible pavement structures to be designed.
All versions of the AASHTO design guide are based on empirical models drawn from a field
performance data measured at the AASHO road test in the late 1950s. To this end, in this
pavement design method the relationships among design inputs, such as loads, materials, layer
configurations and environment and pavement distress were obtained through engineering
experience, experimental observations or combination of both (Qiang Li, 2011).
IMPACT OF TRUCK OVERLOADING ON PAVEMENT SERVICE LIFE MARCH, 2017
ADDIS ABABA SCIENCE AND TECHNOLOGY UNIVERSITY Page 17
One of the very important points to consider in this method of design is present serviceability
index (PSI) which was rated by panel of road users. The value indicated the service rate given
to the road user.
Thus, the pavement design method was developed using the AASHO road test is the pavement
serviceability concept together with the equations relating serviceability, load and thickness of
pavements (Molenaar, 2009).
Figure 2-5 : Illustration of structural capacity loss overtime and with traffic
2.5.3 Mechanistic Empirical design method
To have a defined pavement design criteria different transport agencies like the Kentucky
department of transportation, the Asphalt institute and shell international have developed
procedures for general application to a variety of design considerations (AASHTO, 1993).
Likewise, AASHO has developed an interim Guide for the Design of rigid and flexible
pavements which served for few years. In fact this method is highly empirical which are valid
for the specific conditions (Climate, traffic, materials etc.) of the road test. This implies that it
is unfair to adopt and use in tropical countries which have different conditions listed above
(Molenaar, 2009). To incorporate the encountered limitations, at different stages, AASHTO
has released revised versions for the future use of its guide. After the 1986 release, as a great
improvement Mechanistic empirical pavement design guide (MEPDG) was developed under
National cooperative highway research program (NCHRP) in 2004 and incorporated in the
1993 AASHTO release (National cooperative highway research program, 2004)
Mechanistic Empirical pavement design guide (MEPDG) is an advanced method which uses
analytical method and refers to numerical capability to calculate the stress, strain or deflection
in multilayered system such as pavement in response to the application of external loads or
climate (Qiang Li, 2011).
IMPACT OF TRUCK OVERLOADING ON PAVEMENT SERVICE LIFE MARCH, 2017
ADDIS ABABA SCIENCE AND TECHNOLOGY UNIVERSITY Page 18
The Mechanistic Empirical pavement design guide (MEPDG) will require inputs that affect
pavement performance such as traffic, climate, pavement structure and material properties that
will finally predict pavement responses (AASHTO, 1993). As it is discussed above, the
responses can be the stresses, strains and deflections within a pavement structure.
Mechanistic Empirical pavement design guide (MEPDG) is one of the advanced types of
pavement design technique. In this method a computer program is used to analyze the stress
strain of multi layer systems. This structural model is used to calculate stress, strains and
deflections induced by the exerted traffic.
In this manner, the method can help to model distresses which are used to predict the future
performance of the pavement structure. The ME method will explicitly show that the tensile
strain due to the application of the load will occur at the bottom of the bituminous layer. And
the vertical compressive strain called rutting effect will occur at the top of the sub grade layer.
Figure 2-6 : Critical stresses and strains in flexible pavement
The performance model used in the design process of this method relate the computed strain
levels resulting from a single application of the standard axle to the number of allowable
repletion of the load (Austroads, 2000).
The behavior of material depends on the stress strain to which they are subjected and it is
possible to determine how they will behave in the pavement. Take pavement configuration and
compute pavement responses using structural models by imputing material properties and axle
load and check the adequacy of the layer.
IMPACT OF TRUCK OVERLOADING ON PAVEMENT SERVICE LIFE MARCH, 2017
ADDIS ABABA SCIENCE AND TECHNOLOGY UNIVERSITY Page 19
2.6 Damage analysis
The Mechanistic – Empirical pavement design (MEPD) method is used to calculate pavement
critical responses such as: stresses, strains and deflection based on layer material properties
and climatic conditions (Y.Richard Kim, 2011).
When a vehicle axle load exerts pressure on a pavement, it creates a bending effect on the
HMA layer, particularly the underlying layer is unable to support the applied load cracks will
be induced.
According to the research carried out by Salem (2008), during the exertion of an axle load on
flexible pavement one of the critical location subjected to tensile strain is the bottom of the
asphalt layer. The tensile strain at the bottom of the asphalt layer is related to the fatigue life of
asphalt pavement, Likewise, the applied load at the top of the pavement will have an effect of
vertical compressive strain on the top of the sub grade which helps to predict the amount of sub
grade rutting in HMA pavements due to the accumulated permanent deformations. It has been
reported by Wang H and IL. Al Qadi commonly a pavement with thin HMA layer fails in
tension due cracks initiated from the bottom of the pavement layer and move up. But, for thick
HMA, the tensile strain at the bottom of the HMA layer is less critical than the shear strain
near the pavement surface
The fatigue failure model is expressed in the following form:
Nf =f1t-f2 E1
-f 3 Equation 2
While the rutting is expressed in the following form:
Nf2 = f4 (v)-f5 Equation 3
Where :
Nf = the allowable number of load repetitions to prevent fatigue cracking from reaching a
certain limit defined by the agency (10 – 20 % of the pavement surface area).
Nf2 = the allowable number of load repetitions to prevent rutting from reaching a certain limit
defined by the agency (0.5 inch).
Et = the tensile strain at the bottom of the asphalt layer.
EV = the compressive vertical strain at the surface of sub grade.
E1 = the elastic modulus of the asphalt layer; f1, f2, f3, f4, f5 = regression coefficients.
IMPACT OF TRUCK OVERLOADING ON PAVEMENT SERVICE LIFE MARCH, 2017
ADDIS ABABA SCIENCE AND TECHNOLOGY UNIVERSITY Page 20
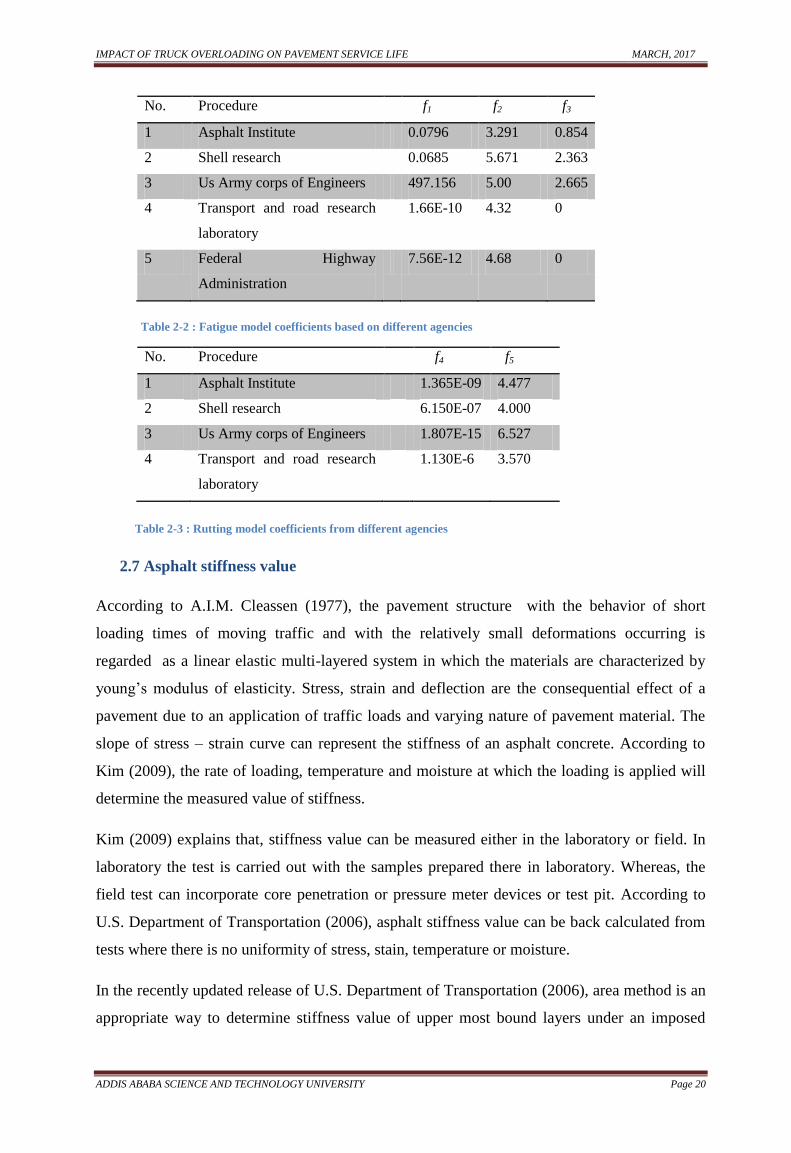
No. Procedure f1 f2 f3
1 Asphalt Institute 0.0796 3.291 0.854
2 Shell research 0.0685 5.671 2.363
3 Us Army corps of Engineers 497.156 5.00 2.665
4 Transport and road research
laboratory
1.66E-10 4.32 0
5 Federal Highway
Administration
7.56E-12 4.68 0
Table 2-2 : Fatigue model coefficients based on different agencies
No. Procedure f4 f5
1 Asphalt Institute 1.365E-09 4.477
2 Shell research 6.150E-07 4.000
3 Us Army corps of Engineers 1.807E-15 6.527
4 Transport and road research
laboratory
1.130E-6 3.570
Table 2-3 : Rutting model coefficients from different agencies
2.7 Asphalt stiffness value
According to A.I.M. Cleassen (1977), the pavement structure with the behavior of short
loading times of moving traffic and with the relatively small deformations occurring is
regarded as a linear elastic multi-layered system in which the materials are characterized by
young‟s modulus of elasticity. Stress, strain and deflection are the consequential effect of a
pavement due to an application of traffic loads and varying nature of pavement material. The
slope of stress – strain curve can represent the stiffness of an asphalt concrete. According to
Kim (2009), the rate of loading, temperature and moisture at which the loading is applied will
determine the measured value of stiffness.
Kim (2009) explains that, stiffness value can be measured either in the laboratory or field. In
laboratory the test is carried out with the samples prepared there in laboratory. Whereas, the
field test can incorporate core penetration or pressure meter devices or test pit. According to
U.S. Department of Transportation (2006), asphalt stiffness value can be back calculated from
tests where there is no uniformity of stress, stain, temperature or moisture.
In the recently updated release of U.S. Department of Transportation (2006), area method is an
appropriate way to determine stiffness value of upper most bound layers under an imposed
IMPACT OF TRUCK OVERLOADING ON PAVEMENT SERVICE LIFE MARCH, 2017
ADDIS ABABA SCIENCE AND TECHNOLOGY UNIVERSITY Page 21
surface load. The method is calibrated for both Asphalt concrete (AC) and Portland cement
concrete (PCC) pavement surface.
As per the report environmental temperature has an enormous effect on the elasticity modulus
of asphalt layer. It is underlined that elastic modulus of asphalt concrete layer is significantly
influenced by the pavement temperature, as the temperature increases; it causes expansion of
bitumen binder which will result in the subsequent bleeding and loss of stability, ultimately
decreases the modulus of asphalt concrete.
With this regard, MR of asphalt mixture varies depending upon change in temperature. So, it is
crucial to understand seasonal modulus values to take in to account the relative damage a
pavement is subjected to during each season of the year. A Guide for Design of pavement
structures (1993), States that “It would be important to test for difference between spring-wet
(rainy) and dry seasons, for those extreme cases, the retained modulus may be 20 to 30 %
percent of the normal modulus during the summer and fall periods”. Furthermore, the amount
of change of resilient modulus of asphalt layer with respect to change in temperature was
adopted from (Salem, 2008). Salem and Salem et.al. (2008), has studied the effect of
pavement temperature on the AC modulus. Consequently, he reported the AC modulus during
summer drops to about 20 percent (%) of its winter value due to the increase in pavement
temperature. Therefore, an asphalt pavement exhibits different stiffness value depending upon
climatic conditions from the strongest (Greatest) AC modulus during winter where the
pavement temperature is low and to the weakest (smallest) modulus during summer season.
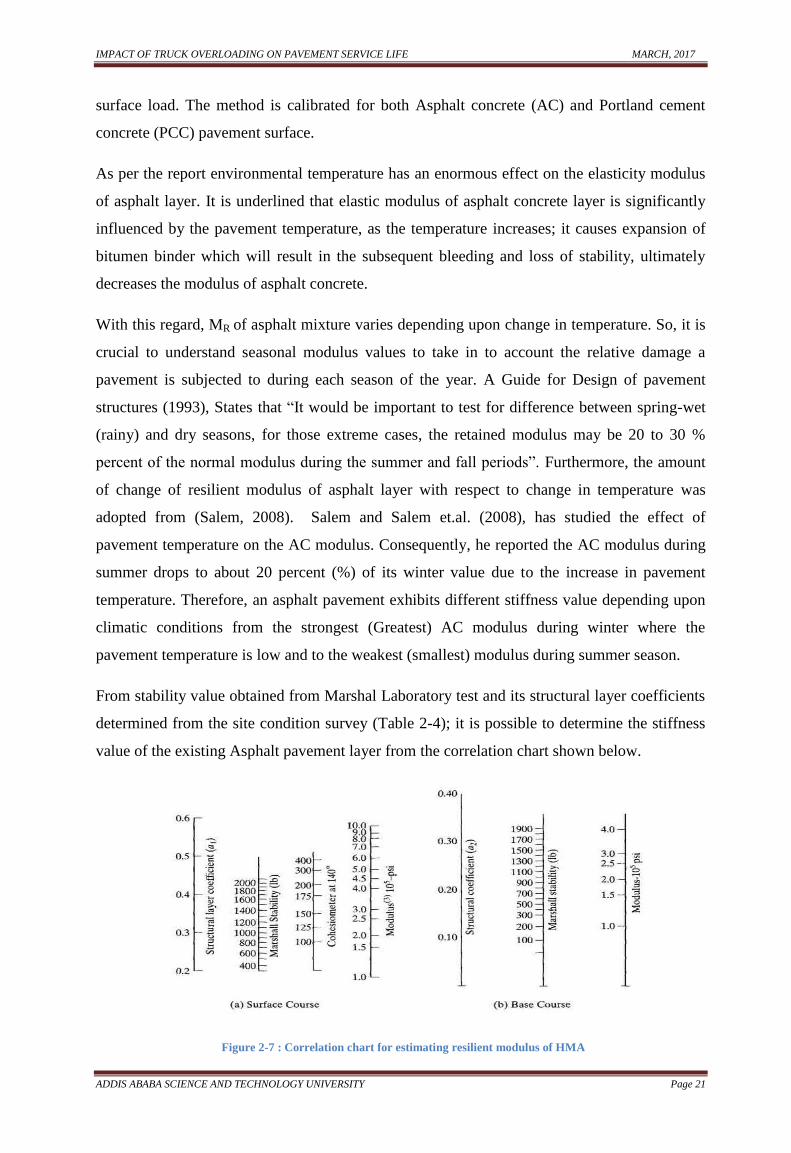
From stability value obtained from Marshal Laboratory test and its structural layer coefficients
determined from the site condition survey (Table 2-4); it is possible to determine the stiffness
value of the existing Asphalt pavement layer from the correlation chart shown below.
Figure 2-7 : Correlation chart for estimating resilient modulus of HMA
IMPACT OF TRUCK OVERLOADING ON PAVEMENT SERVICE LIFE MARCH, 2017
ADDIS ABABA SCIENCE AND TECHNOLOGY UNIVERSITY Page 22
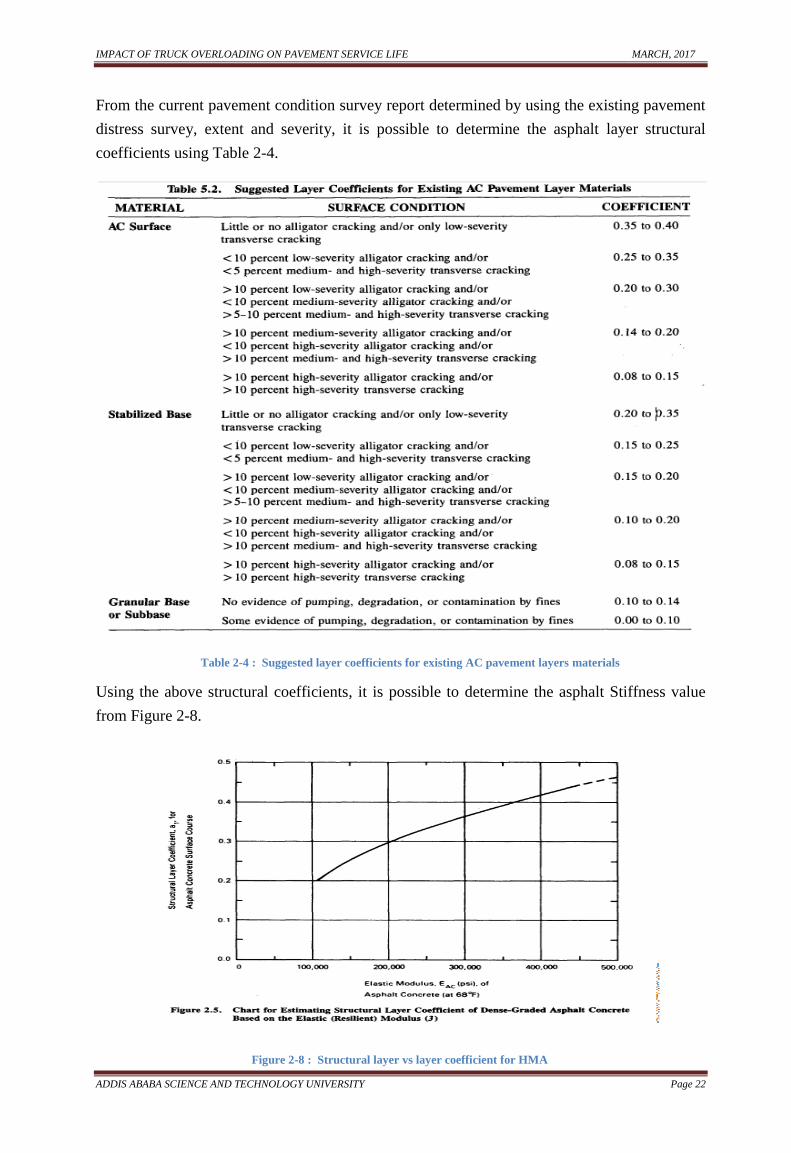
From the current pavement condition survey report determined by using the existing pavement
distress survey, extent and severity, it is possible to determine the asphalt layer structural
coefficients using Table 2-4.
Table 2-4 : Suggested layer coefficients for existing AC pavement layers materials
Using the above structural coefficients, it is possible to determine the asphalt Stiffness value
from Figure 2-8.
Figure 2-8 : Structural layer vs layer coefficient for HMA
IMPACT OF TRUCK OVERLOADING ON PAVEMENT SERVICE LIFE MARCH, 2017
ADDIS ABABA SCIENCE AND TECHNOLOGY UNIVERSITY Page 23
2.8 Resilient Modulus
Burmister (1943), developed a true layered elastic theory for a two layer system and extended
it to a three layer system. Burmister (1945) added the development of an advanced computer
application system that considers multi layer system with any number of layers with specified
modulus and Poisson ratio.
According to (Alene) Strength /Stiffness /of unbound granular materials increases with the
application of confinement /support in lateral direction/. Hence, an increase in compaction rate
of a material will also result in better mechanical properties.
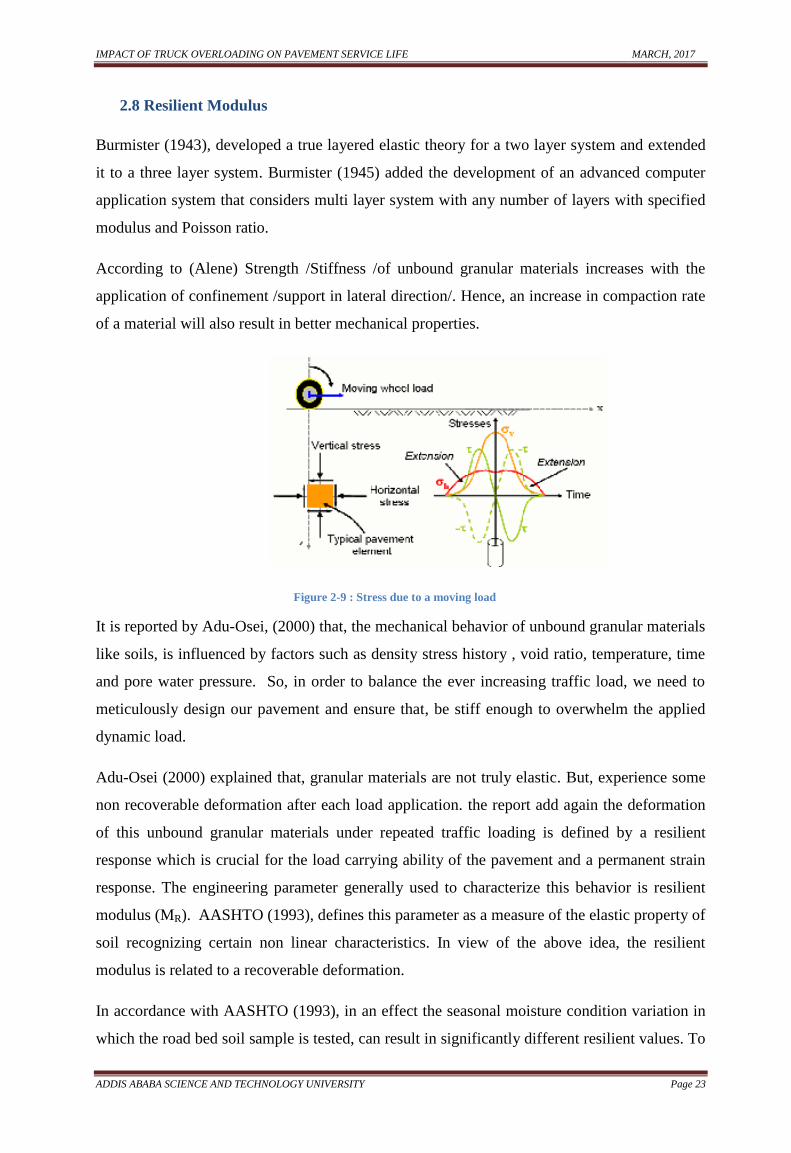
Figure 2-9 : Stress due to a moving load
It is reported by Adu-Osei, (2000) that, the mechanical behavior of unbound granular materials
like soils, is influenced by factors such as density stress history , void ratio, temperature, time
and pore water pressure. So, in order to balance the ever increasing traffic load, we need to
meticulously design our pavement and ensure that, be stiff enough to overwhelm the applied
dynamic load.
Adu-Osei (2000) explained that, granular materials are not truly elastic. But, experience some
non recoverable deformation after each load application. the report add again the deformation
of this unbound granular materials under repeated traffic loading is defined by a resilient
response which is crucial for the load carrying ability of the pavement and a permanent strain
response. The engineering parameter generally used to characterize this behavior is resilient
modulus (MR). AASHTO (1993), defines this parameter as a measure of the elastic property of
soil recognizing certain non linear characteristics. In view of the above idea, the resilient
modulus is related to a recoverable deformation.
In accordance with AASHTO (1993), in an effect the seasonal moisture condition variation in
which the road bed soil sample is tested, can result in significantly different resilient values. To
IMPACT OF TRUCK OVERLOADING ON PAVEMENT SERVICE LIFE MARCH, 2017
ADDIS ABABA SCIENCE AND TECHNOLOGY UNIVERSITY Page 24
overcome the prevalent seasonal effect of a pavement, an effective soil resilient modulus value
is devised which take in to account the combined effect of all seasonal influence coming as a
consequence.
Recently there is a great interest in many countries to use the Mechanistic Empirical
approaches to design and analyze pavements with the input of an advanced computer
programming system. To this end, the strength of sub grade is an important input for the
operation of this advanced technology like, KENPAVE program.
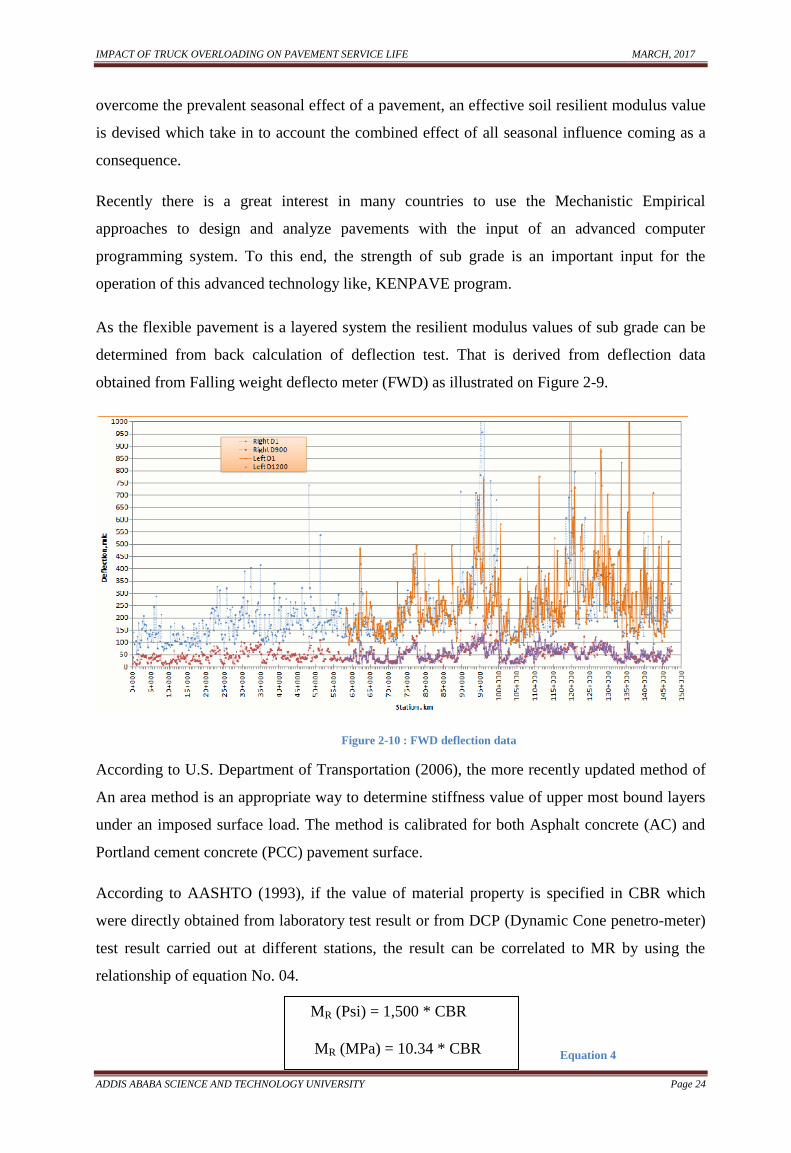
As the flexible pavement is a layered system the resilient modulus values of sub grade can be
determined from back calculation of deflection test. That is derived from deflection data
obtained from Falling weight deflecto meter (FWD) as illustrated on Figure 2-9.
Figure 2-10 : FWD deflection data
According to U.S. Department of Transportation (2006), the more recently updated method of
An area method is an appropriate way to determine stiffness value of upper most bound layers
under an imposed surface load. The method is calibrated for both Asphalt concrete (AC) and
Portland cement concrete (PCC) pavement surface.
According to AASHTO (1993), if the value of material property is specified in CBR which
were directly obtained from laboratory test result or from DCP (Dynamic Cone penetro-meter)
test result carried out at different stations, the result can be correlated to MR by using the
relationship of equation No. 04.
Equation 4
MR (Psi) = 1,500 * CBR
MR (MPa) = 10.34 * CBR
IMPACT OF TRUCK OVERLOADING ON PAVEMENT SERVICE LIFE MARCH, 2017
ADDIS ABABA SCIENCE AND TECHNOLOGY UNIVERSITY Page 25
Source: (Officials, 1993)
Where: 1 Psi = 6.90 KPa
Most importantly, at the time where CBR value of the sub grade may vary from station to
station. The possible minimum and maximum values will be taken to consider the extreme
scenarios. Consequently, two analyses with each CBR value will be dealt to look at two worst
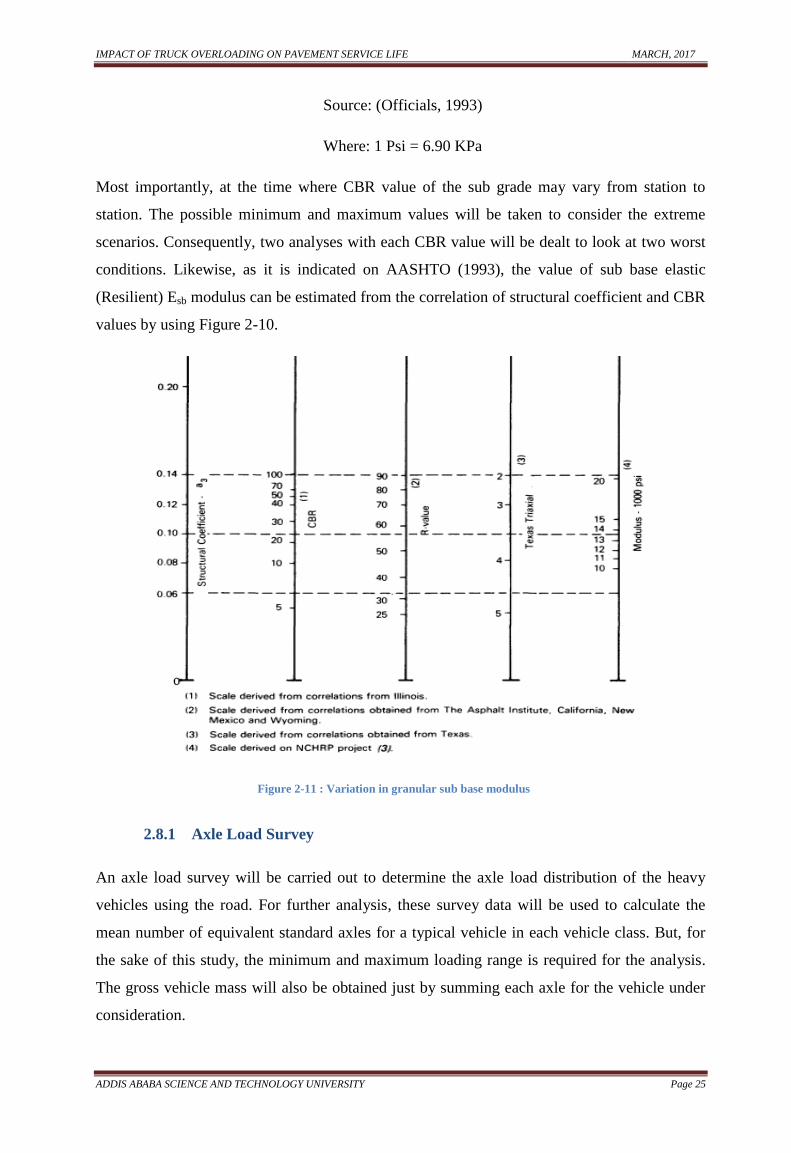
conditions. Likewise, as it is indicated on AASHTO (1993), the value of sub base elastic
(Resilient) Esb modulus can be estimated from the correlation of structural coefficient and CBR
values by using Figure 2-10.
Figure 2-11 : Variation in granular sub base modulus
2.8.1 Axle Load Survey
An axle load survey will be carried out to determine the axle load distribution of the heavy
vehicles using the road. For further analysis, these survey data will be used to calculate the
mean number of equivalent standard axles for a typical vehicle in each vehicle class. But, for
the sake of this study, the minimum and maximum loading range is required for the analysis.
The gross vehicle mass will also be obtained just by summing each axle for the vehicle under
consideration.
IMPACT OF TRUCK OVERLOADING ON PAVEMENT SERVICE LIFE MARCH, 2017
ADDIS ABABA SCIENCE AND TECHNOLOGY UNIVERSITY Page 26
The secondary survey data under consideration will be conducted at the outskirt of Awash
junction where all trucks are supposed to be captured. Vehicles selection is on the basis of
good practice recommended by (TRRL, 2004), which states that it not necessary to weigh
vehicles of less than 1.5 tones unladen weight. Planned sample size is also based on TRRL
recommendation. According to a Guide to axle load surveys and traffic counts for determining
traffic loading on pavements (2004), The minimum axle load measurement period is for Seven
days. The rate of axle load measurement for different commercial vehicle flows will depend on
different hourly flows. At low traffic flow rate all commercial vehicles could be weighed. But,
peak flow sampling may be required with say, every second, third or fourth vehicle being
weighed as per the table 6 of (TRRL, 2004).
Ideally an axle load survey should be carried out for seven consecutive days for 24 hours a day
(A Guide to axle load surveys and traffic counts for determining traffic loading on pavements,
2004). However, since it is not practicable to work at night, the survey time will be restricted
during day time for 12 hours for consecutive seven days. To offset such shortcoming the
sample size more than the minimum required will be collected. Data collected after three days
will also be examined carefully as the drivers of vehicles that are regularly overloaded quickly
become aware of the survey and either avoids the weighing site altogether or temporarily alter
their normal operating behavior.
Following the above discussion, the steps are basically intended to show the common practice
of the procedure. It is supposed that the stationary weighing bridge will be used to collect the
primary data. However, for the ease of the study, secondary data available at Awash Weigh
Station was collected for the analysis purpose. However, partially the data were verified on site
at Awash Weighing bridge by the researcher for three consecutive days. The overall steps have
the following challenges. (1) only loaded heavy tracks will be captured (2) data may
incorporate some sort of bias, and (3) even difficulty in getting permission. Any secondary
data will be incorporated after carefully verifying with previous other available data.
Additional useful information will be obtained from a semi structured interview survey of
drivers along with the axle load measurement. This will include: the main type of goods
carried, loading (empty, partial, full), axle spacing, and issues associated with vehicle
technology. This information will be collected randomly.
Axle load survey form will be prepared.
IMPACT OF TRUCK OVERLOADING ON PAVEMENT SERVICE LIFE MARCH, 2017
ADDIS ABABA SCIENCE AND TECHNOLOGY UNIVERSITY Page 27
2.8.2 KENLAYER Software
For pavements with three or more layers, computer program is strongly recommended for the
analysis of stresses and strains.
There are a lot of computer programs which carry out stress and strain like: BISAR,
KENPAVE, CIRCLY and WESLEA. However, BISAR and WESLEA only allow linear
elastic materials. And CIRCLY takes an isotropic behavior of materials in to account.
KENLAYER is a computer program that applies only to flexible pavements with no joints or
rigid layers (Huang, 2004). The system accounts the stress dependent behavior of unbound
granular materials and soils. According to the description by Huang (2004), the program is the
solution for an elastic multilayer system under a circular area. In addition, it is used for
pavements with rigid layers, such as PCC and composite pavements using the KENSLABs
program. It is applied to layered system under single, dual tandem or dual tridem wheels with
each layer behaving differently. Overall KENPAVE program is preferred from others program
due to its consideration of stress dependence nature of the material and the following facts:-
Solution for an elastic multilayer system under a circular load.
Superposition principles were used for multiple wheels.
Linear elastic, non linear elastic, or visco-elastic.
Damage analysis up to 12 periods.
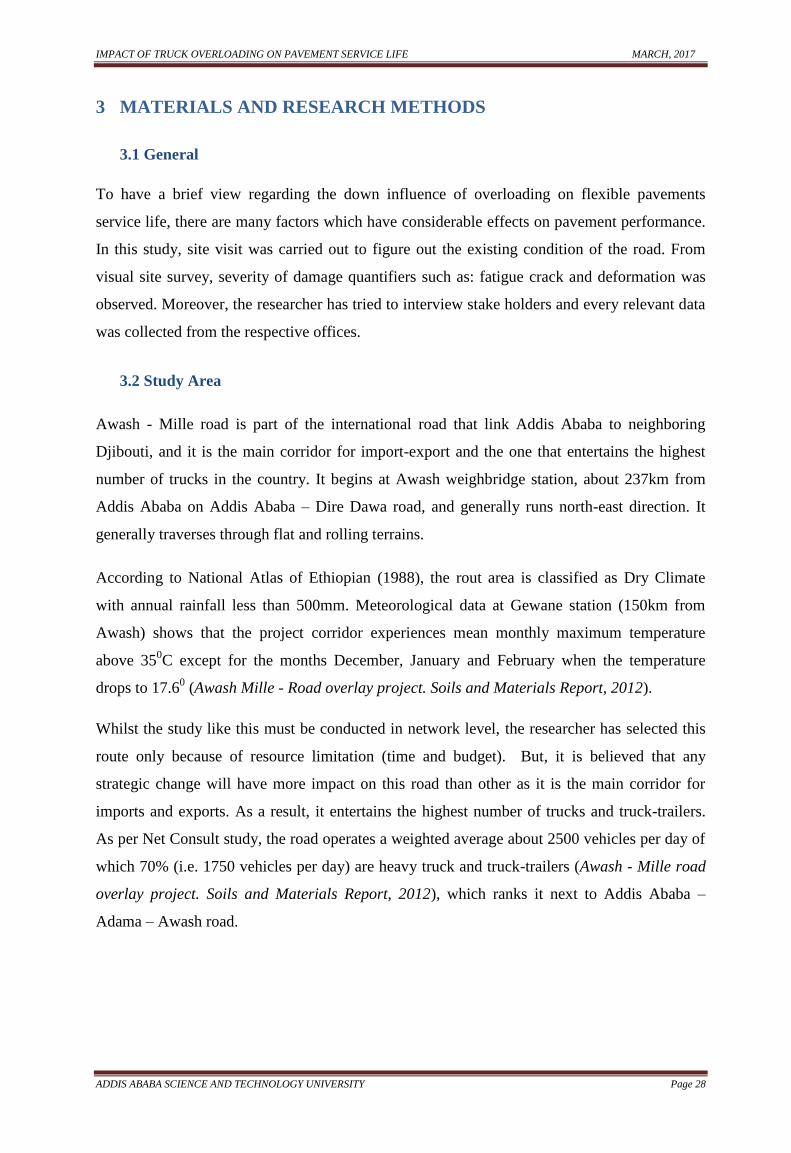
IMPACT OF TRUCK OVERLOADING ON PAVEMENT SERVICE LIFE MARCH, 2017
ADDIS ABABA SCIENCE AND TECHNOLOGY UNIVERSITY Page 28
3 MATERIALS AND RESEARCH METHODS
3.1 General
To have a brief view regarding the down influence of overloading on flexible pavements
service life, there are many factors which have considerable effects on pavement performance.
In this study, site visit was carried out to figure out the existing condition of the road. From
visual site survey, severity of damage quantifiers such as: fatigue crack and deformation was
observed. Moreover, the researcher has tried to interview stake holders and every relevant data
was collected from the respective offices.
3.2 Study Area
Awash - Mille road is part of the international road that link Addis Ababa to neighboring
Djibouti, and it is the main corridor for import-export and the one that entertains the highest
number of trucks in the country. It begins at Awash weighbridge station, about 237km from
Addis Ababa on Addis Ababa – Dire Dawa road, and generally runs north-east direction. It
generally traverses through flat and rolling terrains.
According to National Atlas of Ethiopian (1988), the rout area is classified as Dry Climate
with annual rainfall less than 500mm. Meteorological data at Gewane station (150km from
Awash) shows that the project corridor experiences mean monthly maximum temperature
above 350C except for the months December, January and February when the temperature
drops to 17.60 (Awash Mille - Road overlay project. Soils and Materials Report, 2012).
Whilst the study like this must be conducted in network level, the researcher has selected this
route only because of resource limitation (time and budget). But, it is believed that any
strategic change will have more impact on this road than other as it is the main corridor for
imports and exports. As a result, it entertains the highest number of trucks and truck-trailers.
As per Net Consult study, the road operates a weighted average about 2500 vehicles per day of
which 70% (i.e. 1750 vehicles per day) are heavy truck and truck-trailers (Awash - Mille road
overlay project. Soils and Materials Report, 2012), which ranks it next to Addis Ababa –
Adama – Awash road.
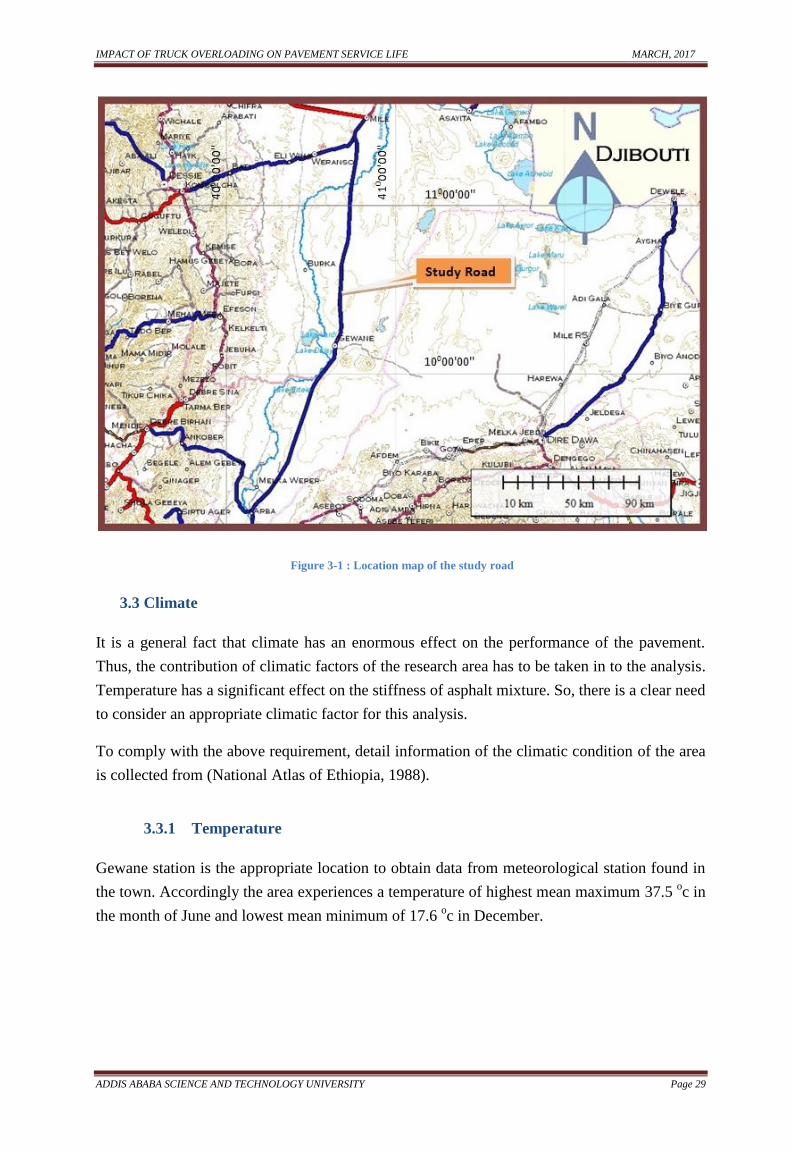
IMPACT OF TRUCK OVERLOADING ON PAVEMENT SERVICE LIFE MARCH, 2017
ADDIS ABABA SCIENCE AND TECHNOLOGY UNIVERSITY Page 29
Figure 3-1 : Location map of the study road
3.3 Climate
It is a general fact that climate has an enormous effect on the performance of the pavement.
Thus, the contribution of climatic factors of the research area has to be taken in to the analysis.
Temperature has a significant effect on the stiffness of asphalt mixture. So, there is a clear need
to consider an appropriate climatic factor for this analysis.
To comply with the above requirement, detail information of the climatic condition of the area
is collected from (National Atlas of Ethiopia, 1988).
3.3.1 Temperature
Gewane station is the appropriate location to obtain data from meteorological station found in
the town. Accordingly the area experiences a temperature of highest mean maximum 37.5 oc in
the month of June and lowest mean minimum of 17.6 oc in December.
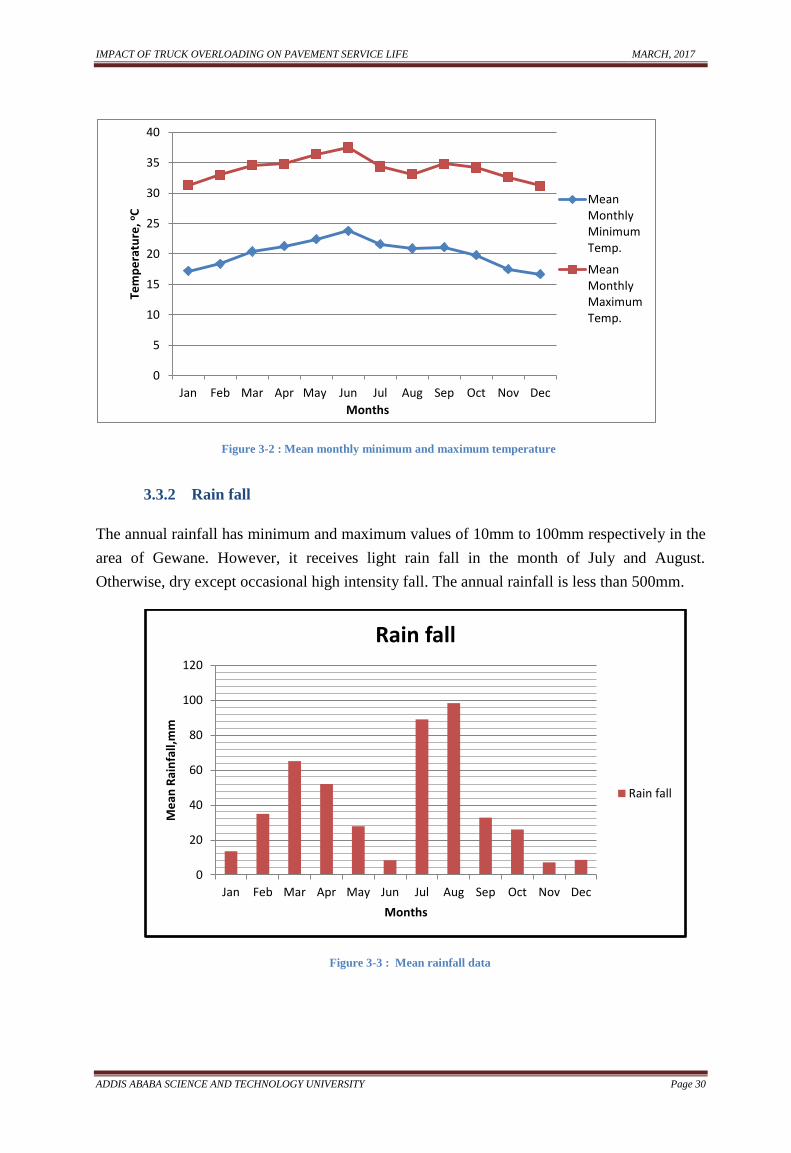
IMPACT OF TRUCK OVERLOADING ON PAVEMENT SERVICE LIFE MARCH, 2017
ADDIS ABABA SCIENCE AND TECHNOLOGY UNIVERSITY Page 30
Figure 3-2 : Mean monthly minimum and maximum temperature
3.3.2 Rain fall
The annual rainfall has minimum and maximum values of 10mm to 100mm respectively in the
area of Gewane. However, it receives light rain fall in the month of July and August.
Otherwise, dry except occasional high intensity fall. The annual rainfall is less than 500mm.
Figure 3-3 : Mean rainfall data
0
5
10
15
20
25
30
35
40
Jan Feb Mar Apr May Jun Jul Aug Sep Oct Nov Dec
Tem
pe
ratu
re, o
C
Months
MeanMonthlyMinimumTemp.
MeanMonthlyMaximumTemp.
0
20
40
60
80
100
120
Jan Feb Mar Apr May Jun Jul Aug Sep Oct Nov Dec
Me
an R
ain
fall,
mm
Months
Rain fall
Rain fall
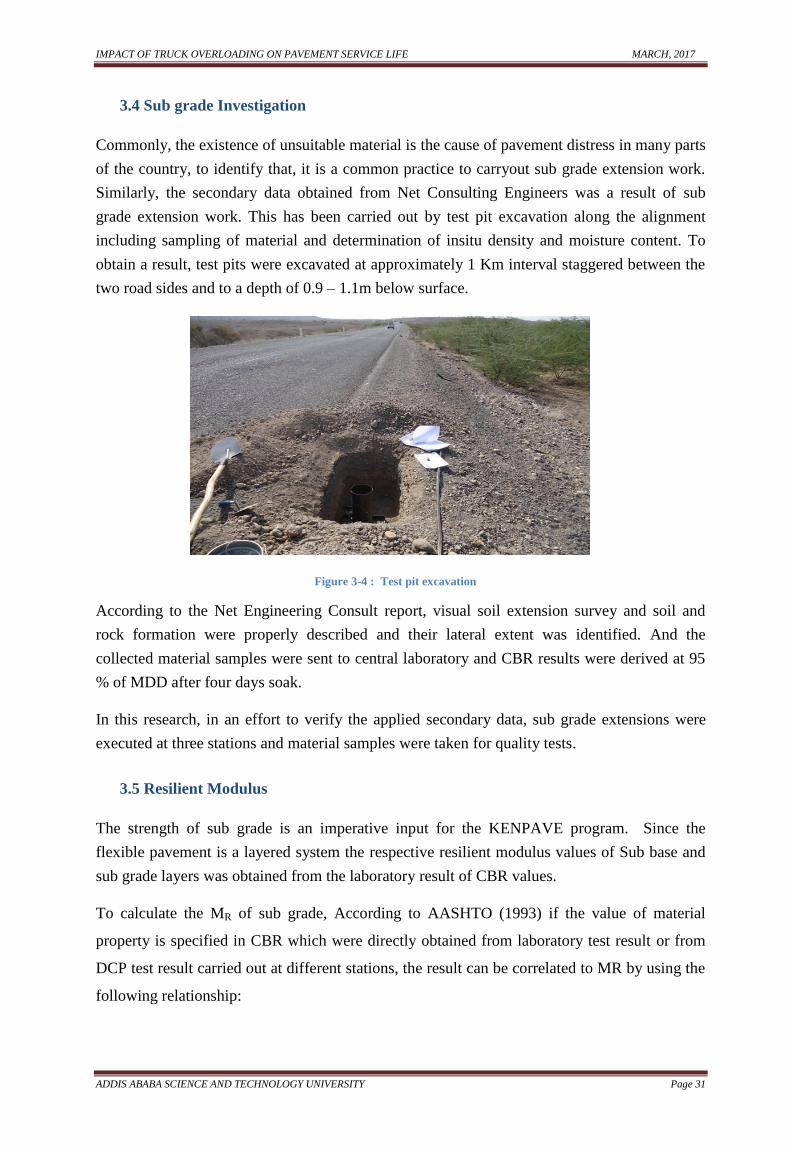
IMPACT OF TRUCK OVERLOADING ON PAVEMENT SERVICE LIFE MARCH, 2017
ADDIS ABABA SCIENCE AND TECHNOLOGY UNIVERSITY Page 31
3.4 Sub grade Investigation
Commonly, the existence of unsuitable material is the cause of pavement distress in many parts
of the country, to identify that, it is a common practice to carryout sub grade extension work.
Similarly, the secondary data obtained from Net Consulting Engineers was a result of sub
grade extension work. This has been carried out by test pit excavation along the alignment
including sampling of material and determination of insitu density and moisture content. To
obtain a result, test pits were excavated at approximately 1 Km interval staggered between the
two road sides and to a depth of 0.9 – 1.1m below surface.
Figure 3-4 : Test pit excavation
According to the Net Engineering Consult report, visual soil extension survey and soil and
rock formation were properly described and their lateral extent was identified. And the
collected material samples were sent to central laboratory and CBR results were derived at 95
% of MDD after four days soak.
In this research, in an effort to verify the applied secondary data, sub grade extensions were
executed at three stations and material samples were taken for quality tests.
3.5 Resilient Modulus
The strength of sub grade is an imperative input for the KENPAVE program. Since the
flexible pavement is a layered system the respective resilient modulus values of Sub base and
sub grade layers was obtained from the laboratory result of CBR values.
To calculate the MR of sub grade, According to AASHTO (1993) if the value of material
property is specified in CBR which were directly obtained from laboratory test result or from
DCP test result carried out at different stations, the result can be correlated to MR by using the
following relationship:
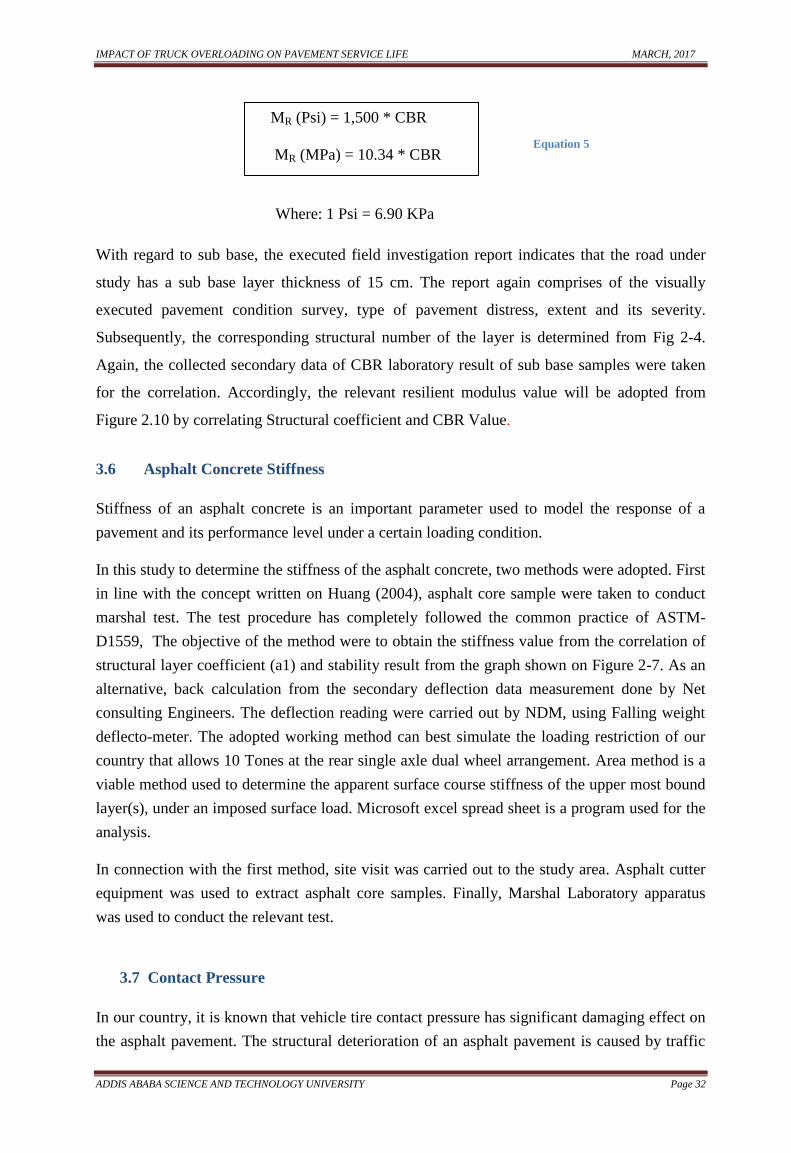
IMPACT OF TRUCK OVERLOADING ON PAVEMENT SERVICE LIFE MARCH, 2017
ADDIS ABABA SCIENCE AND TECHNOLOGY UNIVERSITY Page 32
Equation 5
Where: 1 Psi = 6.90 KPa
With regard to sub base, the executed field investigation report indicates that the road under
study has a sub base layer thickness of 15 cm. The report again comprises of the visually
executed pavement condition survey, type of pavement distress, extent and its severity.
Subsequently, the corresponding structural number of the layer is determined from Fig 2-4.
Again, the collected secondary data of CBR laboratory result of sub base samples were taken
for the correlation. Accordingly, the relevant resilient modulus value will be adopted from
Figure 2.10 by correlating Structural coefficient and CBR Value.
3.6 Asphalt Concrete Stiffness
Stiffness of an asphalt concrete is an important parameter used to model the response of a
pavement and its performance level under a certain loading condition.
In this study to determine the stiffness of the asphalt concrete, two methods were adopted. First
in line with the concept written on Huang (2004), asphalt core sample were taken to conduct
marshal test. The test procedure has completely followed the common practice of ASTM-
D1559, The objective of the method were to obtain the stiffness value from the correlation of
structural layer coefficient (a1) and stability result from the graph shown on Figure 2-7. As an
alternative, back calculation from the secondary deflection data measurement done by Net
consulting Engineers. The deflection reading were carried out by NDM, using Falling weight
deflecto-meter. The adopted working method can best simulate the loading restriction of our
country that allows 10 Tones at the rear single axle dual wheel arrangement. Area method is a
viable method used to determine the apparent surface course stiffness of the upper most bound
layer(s), under an imposed surface load. Microsoft excel spread sheet is a program used for the
analysis.
In connection with the first method, site visit was carried out to the study area. Asphalt cutter
equipment was used to extract asphalt core samples. Finally, Marshal Laboratory apparatus
was used to conduct the relevant test.
3.7 Contact Pressure
In our country, it is known that vehicle tire contact pressure has significant damaging effect on
the asphalt pavement. The structural deterioration of an asphalt pavement is caused by traffic
MR (Psi) = 1,500 * CBR
MR (MPa) = 10.34 * CBR
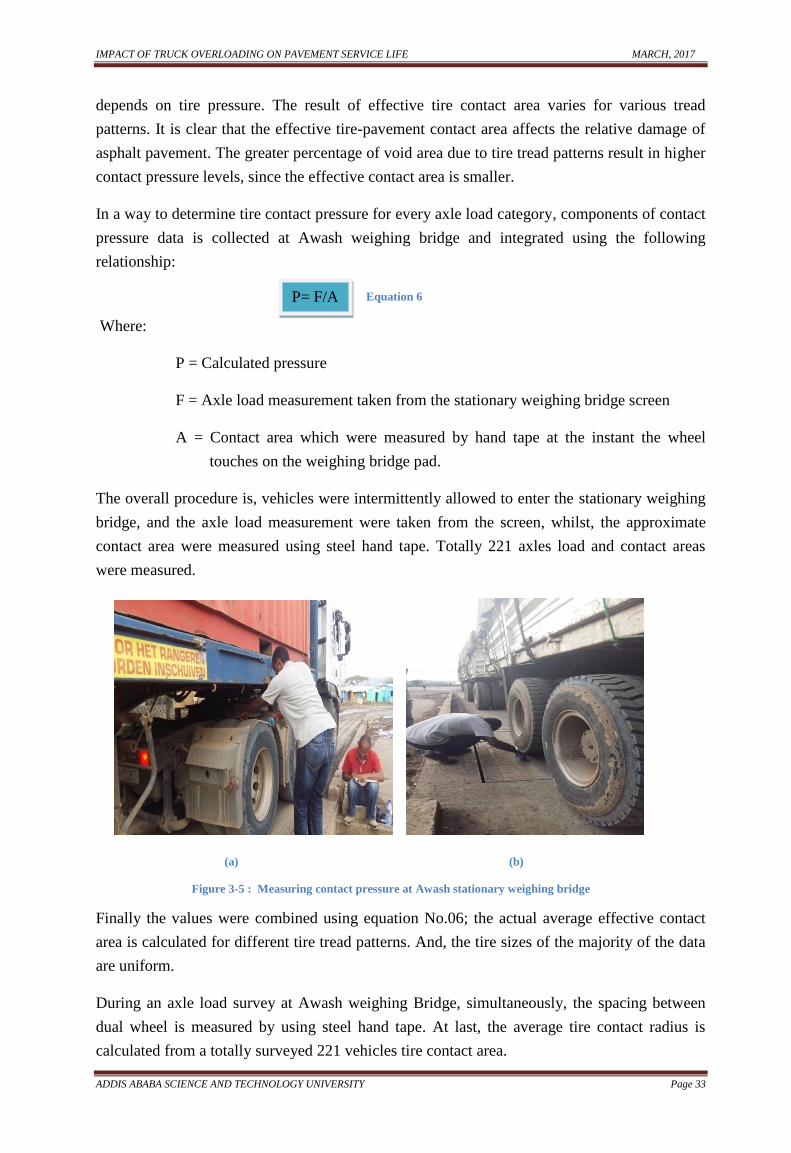
IMPACT OF TRUCK OVERLOADING ON PAVEMENT SERVICE LIFE MARCH, 2017
ADDIS ABABA SCIENCE AND TECHNOLOGY UNIVERSITY Page 33
depends on tire pressure. The result of effective tire contact area varies for various tread
patterns. It is clear that the effective tire-pavement contact area affects the relative damage of
asphalt pavement. The greater percentage of void area due to tire tread patterns result in higher
contact pressure levels, since the effective contact area is smaller.
In a way to determine tire contact pressure for every axle load category, components of contact
pressure data is collected at Awash weighing bridge and integrated using the following
relationship:
Equation 6
Where:
P = Calculated pressure
F = Axle load measurement taken from the stationary weighing bridge screen
A = Contact area which were measured by hand tape at the instant the wheel
touches on the weighing bridge pad.
The overall procedure is, vehicles were intermittently allowed to enter the stationary weighing
bridge, and the axle load measurement were taken from the screen, whilst, the approximate
contact area were measured using steel hand tape. Totally 221 axles load and contact areas
were measured.
(a) (b)
Figure 3-5 : Measuring contact pressure at Awash stationary weighing bridge
Finally the values were combined using equation No.06; the actual average effective contact
area is calculated for different tire tread patterns. And, the tire sizes of the majority of the data
are uniform.
During an axle load survey at Awash weighing Bridge, simultaneously, the spacing between
dual wheel is measured by using steel hand tape. At last, the average tire contact radius is
calculated from a totally surveyed 221 vehicles tire contact area.
P= F/A
IMPACT OF TRUCK OVERLOADING ON PAVEMENT SERVICE LIFE MARCH, 2017
ADDIS ABABA SCIENCE AND TECHNOLOGY UNIVERSITY Page 34
3.8 Design vehicle and wheel configuration
Awash –Mille is the road whereby, different classes of vehicles were operating on. From the
vehicle axle load survey data, the dominant type of vehicle class was identified. Instantly, this
would help to determine the critical axle configuration. Subsequently, from the vehicle load
distribution analysis, it was apparent to determine the critical axle used for the analysis.
3.9 Overloading scenario
3.9.1 Overloading status
The Awash weighing station, which is legally established to control trucks loading, is working
to reduce the timely increasing effect of the problem under discussion. Every loaded truck was
impelled to pass through the stationary weighing bridge, a vehicle who contravenes the load
regulation on each axle is charged instead to reduce the load. On the other hand, the daily axle
load measurement data show us the entire picture of the overloading scenario along the
corridor and the possible maximum range of axle load measurement recorded along the
corridor in order to consider the worst possible scenario of the load.
3.9.2 Selected loads for analysis
Secondary axle load survey data, which was conducted at the outskirt of Awash junction, was
considered. Associated with the fact that the survey was at Awash Weigh bridge station, all
trucks were captured except fuel trucks, which normally are not required to go into the station.
The survey of sampling covers large buses, truck, and Truck Trailers.
From the survey, the maximum possible axle load limit has been identified in order to
determine the load groups for the analysis.
3.10 KENPAV software
While carrying out stress-strain calculation in multilayer system, the use of computer program
for analysis is advantageous. Accordingly, to carry out this research KENPAV software was
used for the analysis. It is the second edition of pavement analysis and design. There are other
programs which can carry out stress analysis like: CHEVRON, WESLEA, ILLI-PAVE,
BISAR etc. But, KENPAVE is preferred from others program due to its consideration of stress
dependence nature of the material and the following reasons:-
Solution for an elastic multilayer system under a circular load
Superposition principle were used for multiple wheels
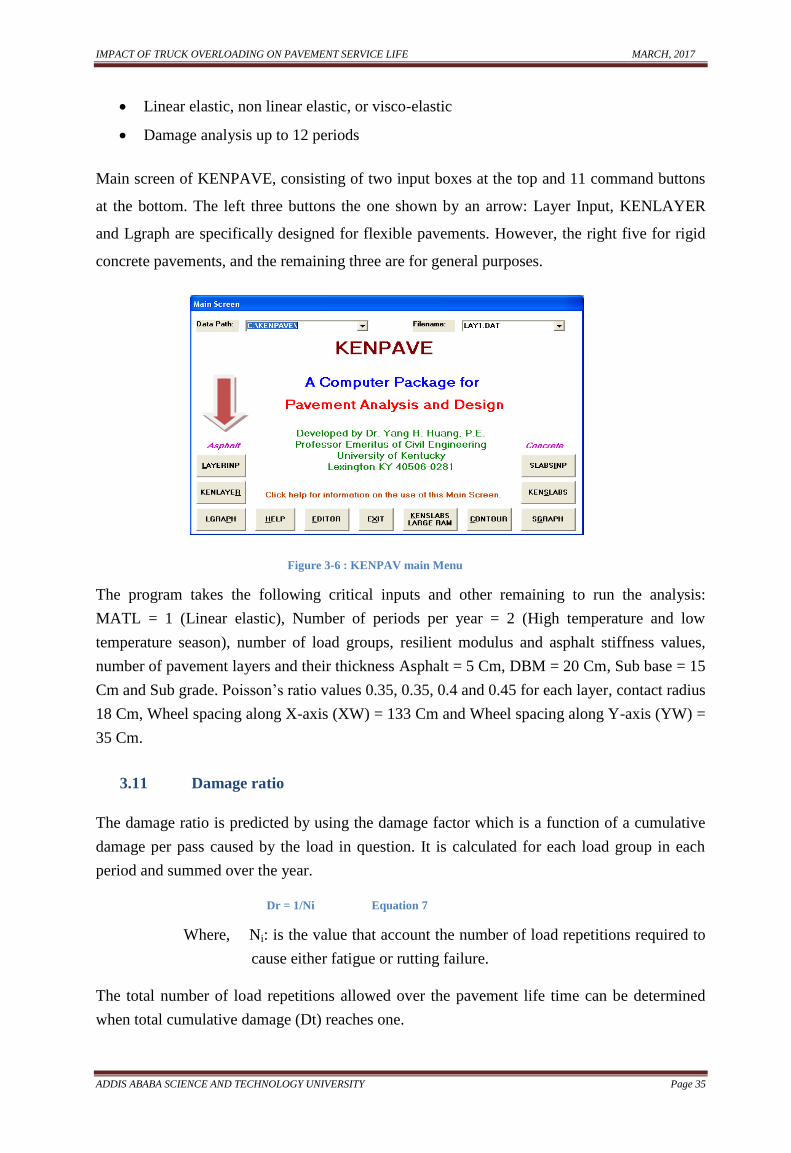
IMPACT OF TRUCK OVERLOADING ON PAVEMENT SERVICE LIFE MARCH, 2017
ADDIS ABABA SCIENCE AND TECHNOLOGY UNIVERSITY Page 35
Linear elastic, non linear elastic, or visco-elastic
Damage analysis up to 12 periods
Main screen of KENPAVE, consisting of two input boxes at the top and 11 command buttons
at the bottom. The left three buttons the one shown by an arrow: Layer Input, KENLAYER
and Lgraph are specifically designed for flexible pavements. However, the right five for rigid
concrete pavements, and the remaining three are for general purposes.
Figure 3-6 : KENPAV main Menu
The program takes the following critical inputs and other remaining to run the analysis:
MATL = 1 (Linear elastic), Number of periods per year = 2 (High temperature and low
temperature season), number of load groups, resilient modulus and asphalt stiffness values,
number of pavement layers and their thickness Asphalt = 5 Cm, DBM = 20 Cm, Sub base = 15
Cm and Sub grade. Poisson‟s ratio values 0.35, 0.35, 0.4 and 0.45 for each layer, contact radius
18 Cm, Wheel spacing along X-axis (XW) = 133 Cm and Wheel spacing along Y-axis (YW) =
35 Cm.
3.11 Damage ratio
The damage ratio is predicted by using the damage factor which is a function of a cumulative
damage per pass caused by the load in question. It is calculated for each load group in each
period and summed over the year.
Dr = 1/Ni Equation 7
Where, Ni: is the value that account the number of load repetitions required to
cause either fatigue or rutting failure.
The total number of load repetitions allowed over the pavement life time can be determined
when total cumulative damage (Dt) reaches one.
IMPACT OF TRUCK OVERLOADING ON PAVEMENT SERVICE LIFE MARCH, 2017
ADDIS ABABA SCIENCE AND TECHNOLOGY UNIVERSITY Page 36
4 RESULTS AND DISCUSSION
4.1 Sub grade investigation
Commonly, the existence of unsuitable material causes pavement distresss, so, to identify the
existence of the said material or not, Net consulting Engineers and Architects Plc, made study
to confirm whether this problematic soil is the contributing factor or not for pavement distress
along the road under study. Sub grade extension is the common practice to take material
sample. Accordingly, the consultant executed sub grade extension work. And it had excavated
test pit along the alignment including sampling of material and determination of insitu density
and moisture content. To obtain a reliable result, test pits were excavated at approximately 1
Km interval staggered between the two road sides and to a depth of 0.9 – 1.1m below surface.
According to the Awash - Mille road overlay project, Soils and Materials Report (2012), the
dominant (more than 50 %) of the soil type is brown silt/sandy silt, which is acceptable to use
as road bed material. Thus, the contributing effect of this problematic soil in this study road
section is negligible. Eventually, the researcher has executed sub grade extension at three
stations to verify its conformation with the collected secondary data and samples were taken
from the site for quality tests and the following CBR results were obtained 3.01%, 3.5% and
4.9%. Among these CBR value of 3.01% was selected for the analysis since it represents the
worst possible scenario of the analysis.
4.2 Resilient Modulus
The strength of sub grade is an important input for the KENPAVE program. Since the flexible
pavement is a layered system the respective resilient modulus values of Sub base and sub grade
layers was obtained from the laboratory result of CBR values.
To calculate the MR of sub grade, once CBR values were obtained from laboratory test result,
Equation No. 05 is used to determine the corresponding MR,
Therefore, from the CBR laboratory test result, the minimum CBR values of 3.01 % which
considered the worst possible scenario was selected for analysis purpose. Accordingly, the
corresponding modulus of resilient values was MR 31.05 MPa.
With regard to sub base, the executed field investigation report indicates that the road under
study has a sub base layer thickness of 15 cm. and it comprises of the pavement condition
survey, type of pavement distress, extent and its severity. Subsequently, the corresponding
structural number of the layer is determined from Table 2-4 to be 0.13. In accordance with the
researcher‟s witness, during the excavation of test pit, the visual assessment of sub base
material appeared to have a crushed aggregate. So, the collected secondary data of CBR
laboratory result of the samples were found in excess of 80%. To this end, the relevant
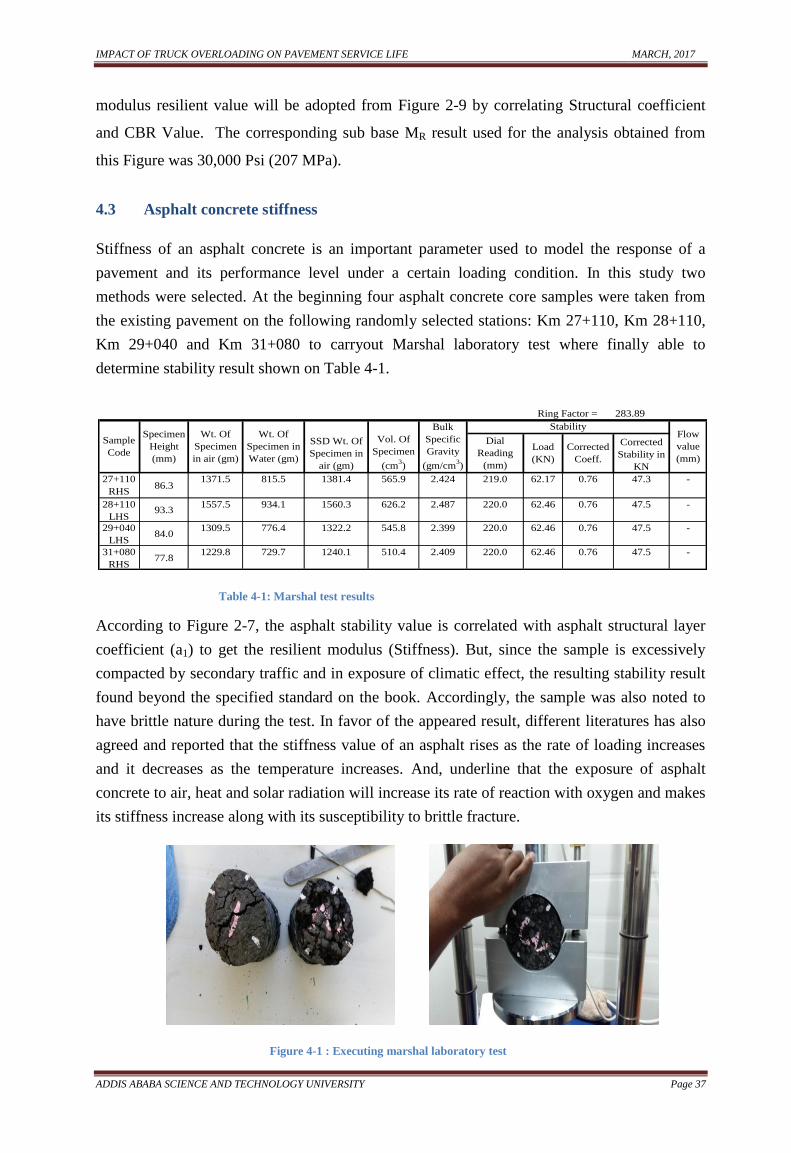
IMPACT OF TRUCK OVERLOADING ON PAVEMENT SERVICE LIFE MARCH, 2017
ADDIS ABABA SCIENCE AND TECHNOLOGY UNIVERSITY Page 37
modulus resilient value will be adopted from Figure 2-9 by correlating Structural coefficient
and CBR Value. The corresponding sub base MR result used for the analysis obtained from
this Figure was 30,000 Psi (207 MPa).
4.3 Asphalt concrete stiffness
Stiffness of an asphalt concrete is an important parameter used to model the response of a
pavement and its performance level under a certain loading condition. In this study two
methods were selected. At the beginning four asphalt concrete core samples were taken from
the existing pavement on the following randomly selected stations: Km 27+110, Km 28+110,
Km 29+040 and Km 31+080 to carryout Marshal laboratory test where finally able to
determine stability result shown on Table 4-1.
Table 4-1: Marshal test results
According to Figure 2-7, the asphalt stability value is correlated with asphalt structural layer
coefficient (a1) to get the resilient modulus (Stiffness). But, since the sample is excessively
compacted by secondary traffic and in exposure of climatic effect, the resulting stability result
found beyond the specified standard on the book. Accordingly, the sample was also noted to
have brittle nature during the test. In favor of the appeared result, different literatures has also
agreed and reported that the stiffness value of an asphalt rises as the rate of loading increases
and it decreases as the temperature increases. And, underline that the exposure of asphalt
concrete to air, heat and solar radiation will increase its rate of reaction with oxygen and makes
its stiffness increase along with its susceptibility to brittle fracture.
Figure 4-1 : Executing marshal laboratory test
283.89
27+110
RHS86.3
565.9 2.424 219.0 62.17 0.76 47.3 -
28+110
LHS93.3
626.2 2.487 220.0 62.46 0.76 47.5 -
29+040
LHS84.0
545.8 2.399 220.0 62.46 0.76 47.5 -
31+080
RHS77.8
510.4 2.409 220.0 62.46 0.76 47.5 -
Stability
Dial
Reading
(mm)
Load
(KN)
Corrected
Coeff.
Corrected
Stability in
KN
1309.5 776.4 1322.2
1229.8 729.7 1240.1
1371.5 815.5 1381.4
1557.5 934.1 1560.3
Sample
Code
Specimen
Height
(mm)
Wt. Of
Specimen
in air (gm)
Wt. Of
Specimen in
Water (gm)
SSD Wt. Of
Specimen in
air (gm)
Vol. Of
Specimen
(cm3)
Bulk
Specific
Gravity
(gm/cm3)
Flow
value
(mm)
Ring Factor =
IMPACT OF TRUCK OVERLOADING ON PAVEMENT SERVICE LIFE MARCH, 2017
ADDIS ABABA SCIENCE AND TECHNOLOGY UNIVERSITY Page 38
Due to this fact, the result with the first method was found unsatisfactory, because the stability
result was fallen out of the limit specified on the book. Thus, the second method (Back
analysis) is adopted to find stiffness value. In this method, area method is a viable method to
determine the apparent surface course stiffness of the upper most bound layer(s) under an
imposed surface load. Microsoft excel spread sheets containing all formula is used for the
analysis. Again this result has also resulted in unsatisfactory output.
Finally, the researcher has taken the condition survey carried out from Awash - Mille Road
overlay project, Soils and Materials Report (2012), to determine the asphalt stiffness value by
correlating with the structural coefficients of pavement obtained from the existing pavement
distress survey, extent and severity. Then, it is possible to derive average asphalt stiffness
value from shown on Table 4-2 by using Figure 2-7.
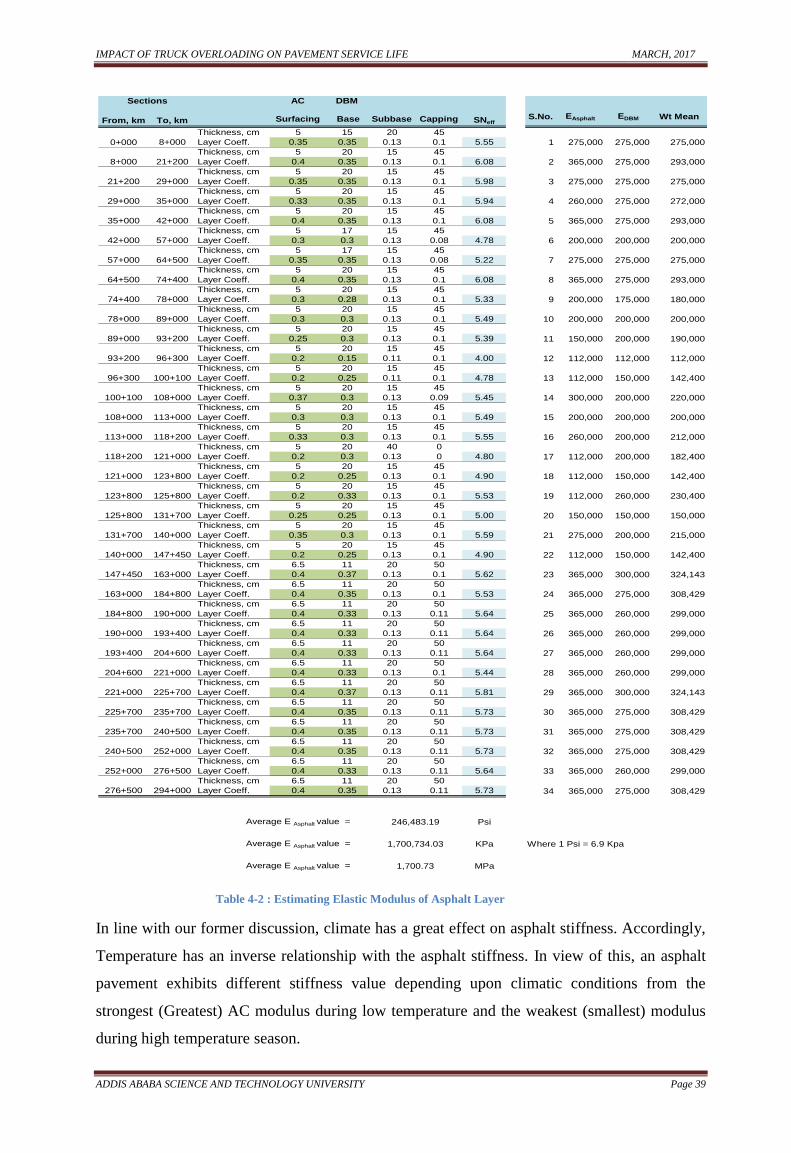
IMPACT OF TRUCK OVERLOADING ON PAVEMENT SERVICE LIFE MARCH, 2017
ADDIS ABABA SCIENCE AND TECHNOLOGY UNIVERSITY Page 39
Table 4-2 : Estimating Elastic Modulus of Asphalt Layer
In line with our former discussion, climate has a great effect on asphalt stiffness. Accordingly,
Temperature has an inverse relationship with the asphalt stiffness. In view of this, an asphalt
pavement exhibits different stiffness value depending upon climatic conditions from the
strongest (Greatest) AC modulus during low temperature and the weakest (smallest) modulus
during high temperature season.
AC DBM
From, km To, km Surfacing Base Subbase Capping SNeffS.No. EAsphalt EDBM Wt Mean
Thickness, cm 5 15 20 45
0+000 8+000 Layer Coeff. 0.35 0.35 0.13 0.1 5.55 1 275,000 275,000 275,000
Thickness, cm 5 20 15 45
8+000 21+200 Layer Coeff. 0.4 0.35 0.13 0.1 6.08 2 365,000 275,000 293,000
Thickness, cm 5 20 15 45
21+200 29+000 Layer Coeff. 0.35 0.35 0.13 0.1 5.98 3 275,000 275,000 275,000
Thickness, cm 5 20 15 45
29+000 35+000 Layer Coeff. 0.33 0.35 0.13 0.1 5.94 4 260,000 275,000 272,000
Thickness, cm 5 20 15 45
35+000 42+000 Layer Coeff. 0.4 0.35 0.13 0.1 6.08 5 365,000 275,000 293,000
Thickness, cm 5 17 15 45
42+000 57+000 Layer Coeff. 0.3 0.3 0.13 0.08 4.78 6 200,000 200,000 200,000
Thickness, cm 5 17 15 45
57+000 64+500 Layer Coeff. 0.35 0.35 0.13 0.08 5.22 7 275,000 275,000 275,000
Thickness, cm 5 20 15 45
64+500 74+400 Layer Coeff. 0.4 0.35 0.13 0.1 6.08 8 365,000 275,000 293,000
Thickness, cm 5 20 15 45
74+400 78+000 Layer Coeff. 0.3 0.28 0.13 0.1 5.33 9 200,000 175,000 180,000
Thickness, cm 5 20 15 45
78+000 89+000 Layer Coeff. 0.3 0.3 0.13 0.1 5.49 10 200,000 200,000 200,000
Thickness, cm 5 20 15 45
89+000 93+200 Layer Coeff. 0.25 0.3 0.13 0.1 5.39 11 150,000 200,000 190,000
Thickness, cm 5 20 15 45
93+200 96+300 Layer Coeff. 0.2 0.15 0.11 0.1 4.00 12 112,000 112,000 112,000
Thickness, cm 5 20 15 45
96+300 100+100 Layer Coeff. 0.2 0.25 0.11 0.1 4.78 13 112,000 150,000 142,400
Thickness, cm 5 20 15 45
100+100 108+000 Layer Coeff. 0.37 0.3 0.13 0.09 5.45 14 300,000 200,000 220,000
Thickness, cm 5 20 15 45
108+000 113+000 Layer Coeff. 0.3 0.3 0.13 0.1 5.49 15 200,000 200,000 200,000
Thickness, cm 5 20 15 45
113+000 118+200 Layer Coeff. 0.33 0.3 0.13 0.1 5.55 16 260,000 200,000 212,000
Thickness, cm 5 20 40 0
118+200 121+000 Layer Coeff. 0.2 0.3 0.13 0 4.80 17 112,000 200,000 182,400
Thickness, cm 5 20 15 45
121+000 123+800 Layer Coeff. 0.2 0.25 0.13 0.1 4.90 18 112,000 150,000 142,400
Thickness, cm 5 20 15 45
123+800 125+800 Layer Coeff. 0.2 0.33 0.13 0.1 5.53 19 112,000 260,000 230,400
Thickness, cm 5 20 15 45
125+800 131+700 Layer Coeff. 0.25 0.25 0.13 0.1 5.00 20 150,000 150,000 150,000
Thickness, cm 5 20 15 45
131+700 140+000 Layer Coeff. 0.35 0.3 0.13 0.1 5.59 21 275,000 200,000 215,000
Thickness, cm 5 20 15 45
140+000 147+450 Layer Coeff. 0.2 0.25 0.13 0.1 4.90 22 112,000 150,000 142,400
Thickness, cm 6.5 11 20 50
147+450 163+000 Layer Coeff. 0.4 0.37 0.13 0.1 5.62 23 365,000 300,000 324,143
Thickness, cm 6.5 11 20 50
163+000 184+800 Layer Coeff. 0.4 0.35 0.13 0.1 5.53 24 365,000 275,000 308,429
Thickness, cm 6.5 11 20 50
184+800 190+000 Layer Coeff. 0.4 0.33 0.13 0.11 5.64 25 365,000 260,000 299,000
Thickness, cm 6.5 11 20 50
190+000 193+400 Layer Coeff. 0.4 0.33 0.13 0.11 5.64 26 365,000 260,000 299,000
Thickness, cm 6.5 11 20 50
193+400 204+600 Layer Coeff. 0.4 0.33 0.13 0.11 5.64 27 365,000 260,000 299,000
Thickness, cm 6.5 11 20 50
204+600 221+000 Layer Coeff. 0.4 0.33 0.13 0.1 5.44 28 365,000 260,000 299,000
Thickness, cm 6.5 11 20 50
221+000 225+700 Layer Coeff. 0.4 0.37 0.13 0.11 5.81 29 365,000 300,000 324,143
Thickness, cm 6.5 11 20 50
225+700 235+700 Layer Coeff. 0.4 0.35 0.13 0.11 5.73 30 365,000 275,000 308,429
Thickness, cm 6.5 11 20 50
235+700 240+500 Layer Coeff. 0.4 0.35 0.13 0.11 5.73 31 365,000 275,000 308,429
Thickness, cm 6.5 11 20 50
240+500 252+000 Layer Coeff. 0.4 0.35 0.13 0.11 5.73 32 365,000 275,000 308,429
Thickness, cm 6.5 11 20 50
252+000 276+500 Layer Coeff. 0.4 0.33 0.13 0.11 5.64 33 365,000 260,000 299,000
Thickness, cm 6.5 11 20 50
276+500 294+000 Layer Coeff. 0.4 0.35 0.13 0.11 5.73 34 365,000 275,000 308,429
Average E Asphalt value = Psi
Average E Asphalt value = KPa Where 1 Psi = 6.9 Kpa
Average E Asphalt value = MPa
246,483.19
1,700,734.03
1,700.73
Sections
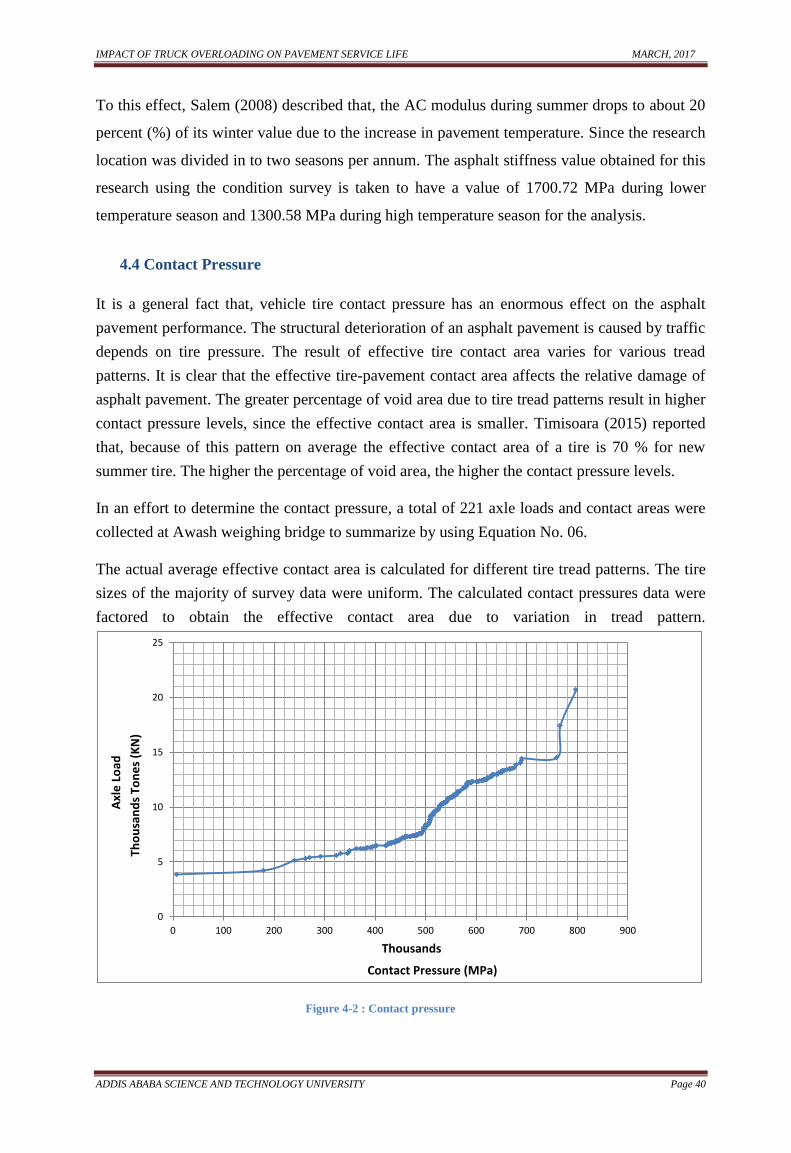
IMPACT OF TRUCK OVERLOADING ON PAVEMENT SERVICE LIFE MARCH, 2017
ADDIS ABABA SCIENCE AND TECHNOLOGY UNIVERSITY Page 40
To this effect, Salem (2008) described that, the AC modulus during summer drops to about 20
percent (%) of its winter value due to the increase in pavement temperature. Since the research
location was divided in to two seasons per annum. The asphalt stiffness value obtained for this
research using the condition survey is taken to have a value of 1700.72 MPa during lower
temperature season and 1300.58 MPa during high temperature season for the analysis.
4.4 Contact Pressure
It is a general fact that, vehicle tire contact pressure has an enormous effect on the asphalt
pavement performance. The structural deterioration of an asphalt pavement is caused by traffic
depends on tire pressure. The result of effective tire contact area varies for various tread
patterns. It is clear that the effective tire-pavement contact area affects the relative damage of
asphalt pavement. The greater percentage of void area due to tire tread patterns result in higher
contact pressure levels, since the effective contact area is smaller. Timisoara (2015) reported
that, because of this pattern on average the effective contact area of a tire is 70 % for new
summer tire. The higher the percentage of void area, the higher the contact pressure levels.
In an effort to determine the contact pressure, a total of 221 axle loads and contact areas were
collected at Awash weighing bridge to summarize by using Equation No. 06.
The actual average effective contact area is calculated for different tire tread patterns. The tire
sizes of the majority of survey data were uniform. The calculated contact pressures data were
factored to obtain the effective contact area due to variation in tread pattern.
Figure 4-2 : Contact pressure
0
5
10
15
20
25
0 100 200 300 400 500 600 700 800 900
Axl
e L
oad
Tho
usa
nd
s To
ne
s (K
N)
Contact Pressure (MPa)
Thousands
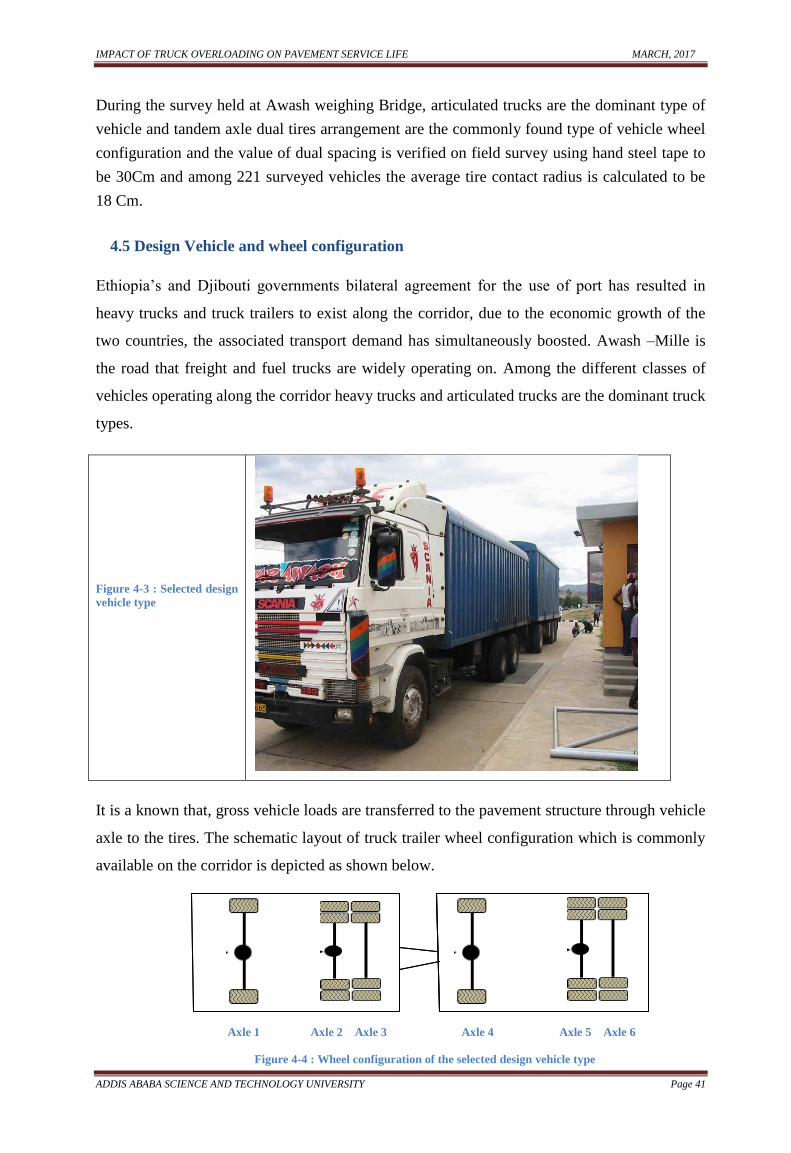
IMPACT OF TRUCK OVERLOADING ON PAVEMENT SERVICE LIFE MARCH, 2017
ADDIS ABABA SCIENCE AND TECHNOLOGY UNIVERSITY Page 41
During the survey held at Awash weighing Bridge, articulated trucks are the dominant type of
vehicle and tandem axle dual tires arrangement are the commonly found type of vehicle wheel
configuration and the value of dual spacing is verified on field survey using hand steel tape to
be 30Cm and among 221 surveyed vehicles the average tire contact radius is calculated to be
18 Cm.
4.5 Design Vehicle and wheel configuration
Ethiopia‟s and Djibouti governments bilateral agreement for the use of port has resulted in
heavy trucks and truck trailers to exist along the corridor, due to the economic growth of the
two countries, the associated transport demand has simultaneously boosted. Awash –Mille is
the road that freight and fuel trucks are widely operating on. Among the different classes of
vehicles operating along the corridor heavy trucks and articulated trucks are the dominant truck
types.
Figure 4-3 : Selected design
vehicle type
It is a known that, gross vehicle loads are transferred to the pavement structure through vehicle
axle to the tires. The schematic layout of truck trailer wheel configuration which is commonly
available on the corridor is depicted as shown below.
Axle 1 Axle 2 Axle 3 Axle 4 Axle 5 Axle 6
Figure 4-4 : Wheel configuration of the selected design vehicle type
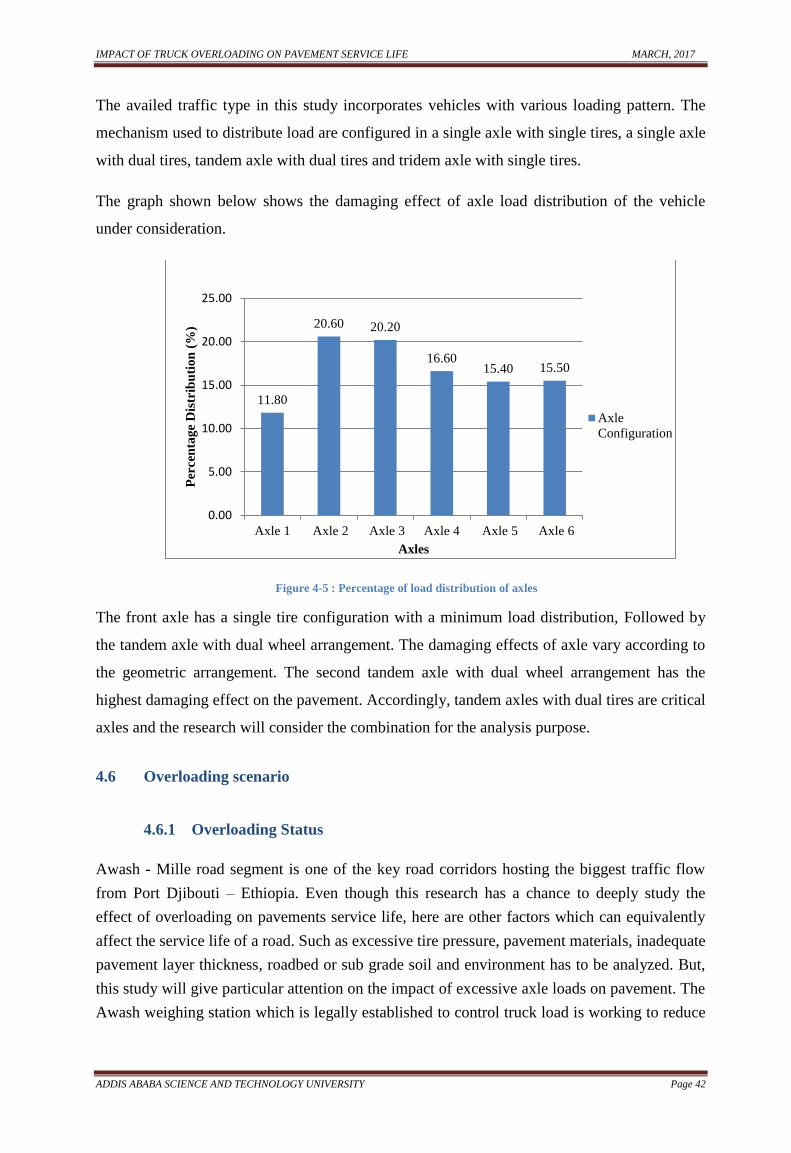
IMPACT OF TRUCK OVERLOADING ON PAVEMENT SERVICE LIFE MARCH, 2017
ADDIS ABABA SCIENCE AND TECHNOLOGY UNIVERSITY Page 42
The availed traffic type in this study incorporates vehicles with various loading pattern. The
mechanism used to distribute load are configured in a single axle with single tires, a single axle
with dual tires, tandem axle with dual tires and tridem axle with single tires.
The graph shown below shows the damaging effect of axle load distribution of the vehicle
under consideration.
Figure 4-5 : Percentage of load distribution of axles
The front axle has a single tire configuration with a minimum load distribution, Followed by
the tandem axle with dual wheel arrangement. The damaging effects of axle vary according to
the geometric arrangement. The second tandem axle with dual wheel arrangement has the
highest damaging effect on the pavement. Accordingly, tandem axles with dual tires are critical
axles and the research will consider the combination for the analysis purpose.
4.6 Overloading scenario
4.6.1 Overloading Status
Awash - Mille road segment is one of the key road corridors hosting the biggest traffic flow
from Port Djibouti – Ethiopia. Even though this research has a chance to deeply study the
effect of overloading on pavements service life, here are other factors which can equivalently
affect the service life of a road. Such as excessive tire pressure, pavement materials, inadequate
pavement layer thickness, roadbed or sub grade soil and environment has to be analyzed. But,
this study will give particular attention on the impact of excessive axle loads on pavement. The
Awash weighing station which is legally established to control truck load is working to reduce
11.80
20.60 20.20
16.60 15.40 15.50
0.00
5.00
10.00
15.00
20.00
25.00
Axle 1 Axle 2 Axle 3 Axle 4 Axle 5 Axle 6
Per
cen
tag
e D
istr
ibu
tio
n (
%)
Axles
Axle
Configuration
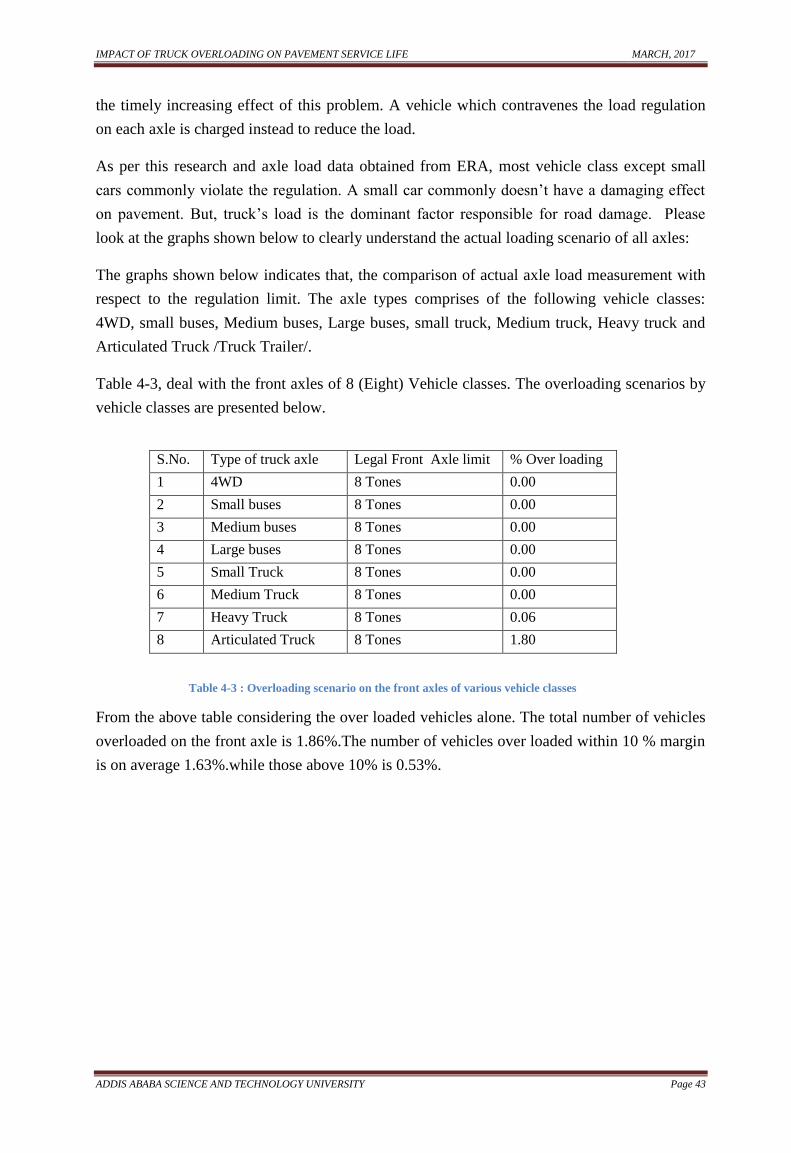
IMPACT OF TRUCK OVERLOADING ON PAVEMENT SERVICE LIFE MARCH, 2017
ADDIS ABABA SCIENCE AND TECHNOLOGY UNIVERSITY Page 43
the timely increasing effect of this problem. A vehicle which contravenes the load regulation
on each axle is charged instead to reduce the load.
As per this research and axle load data obtained from ERA, most vehicle class except small
cars commonly violate the regulation. A small car commonly doesn‟t have a damaging effect
on pavement. But, truck‟s load is the dominant factor responsible for road damage. Please
look at the graphs shown below to clearly understand the actual loading scenario of all axles:
The graphs shown below indicates that, the comparison of actual axle load measurement with
respect to the regulation limit. The axle types comprises of the following vehicle classes:
4WD, small buses, Medium buses, Large buses, small truck, Medium truck, Heavy truck and
Articulated Truck /Truck Trailer/.
Table 4-3, deal with the front axles of 8 (Eight) Vehicle classes. The overloading scenarios by
vehicle classes are presented below.
S.No. Type of truck axle Legal Front Axle limit % Over loading
1 4WD 8 Tones 0.00
2 Small buses 8 Tones 0.00
3 Medium buses 8 Tones 0.00
4 Large buses 8 Tones 0.00
5 Small Truck 8 Tones 0.00
6 Medium Truck 8 Tones 0.00
7 Heavy Truck 8 Tones 0.06
8 Articulated Truck 8 Tones 1.80
Table 4-3 : Overloading scenario on the front axles of various vehicle classes
From the above table considering the over loaded vehicles alone. The total number of vehicles
overloaded on the front axle is 1.86%.The number of vehicles over loaded within 10 % margin
is on average 1.63%.while those above 10% is 0.53%.
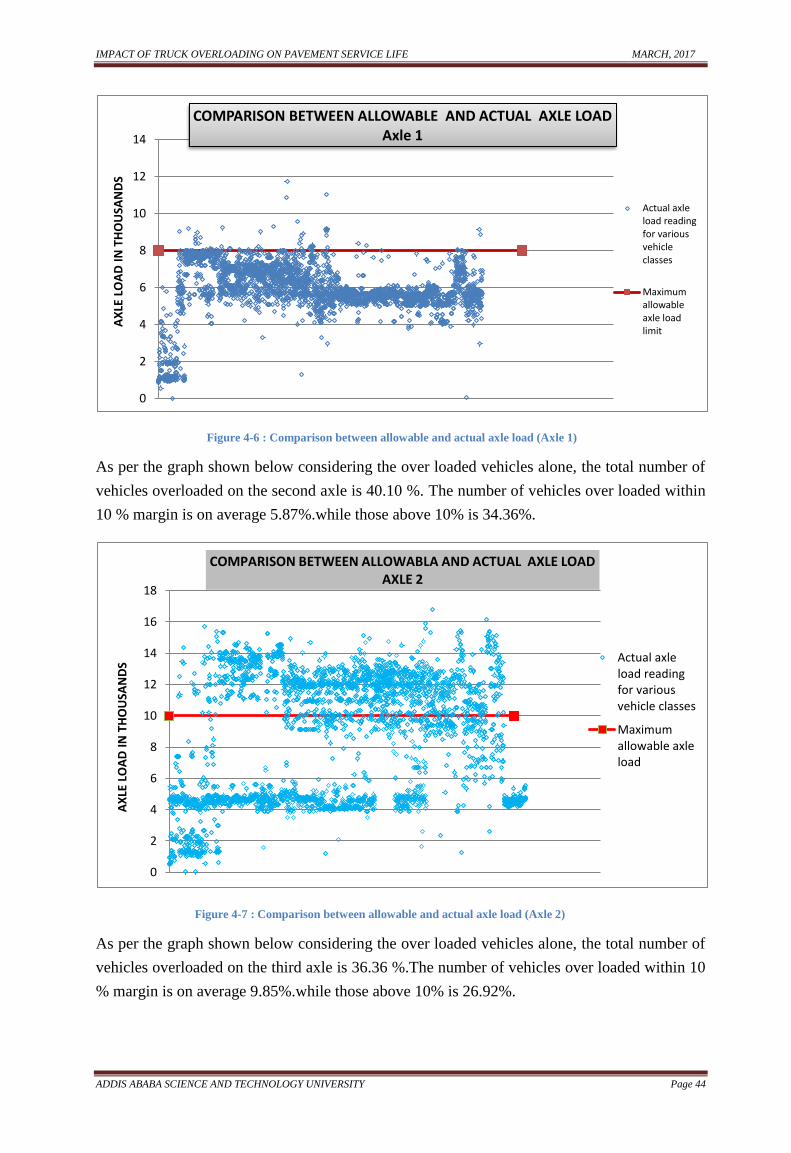
IMPACT OF TRUCK OVERLOADING ON PAVEMENT SERVICE LIFE MARCH, 2017
ADDIS ABABA SCIENCE AND TECHNOLOGY UNIVERSITY Page 44
Figure 4-6 : Comparison between allowable and actual axle load (Axle 1)
As per the graph shown below considering the over loaded vehicles alone, the total number of
vehicles overloaded on the second axle is 40.10 %. The number of vehicles over loaded within
10 % margin is on average 5.87%.while those above 10% is 34.36%.
Figure 4-7 : Comparison between allowable and actual axle load (Axle 2)
As per the graph shown below considering the over loaded vehicles alone, the total number of
vehicles overloaded on the third axle is 36.36 %.The number of vehicles over loaded within 10
% margin is on average 9.85%.while those above 10% is 26.92%.
0
2
4
6
8
10
12
14
AX
LE L
OA
D I
N T
HO
USA
ND
S
COMPARISON BETWEEN ALLOWABLE AND ACTUAL AXLE LOAD Axle 1
Actual axleload readingfor variousvehicleclasses
Maximumallowableaxle loadlimit
0
2
4
6
8
10
12
14
16
18
AX
LE L
OA
D I
N T
HO
USA
ND
S
COMPARISON BETWEEN ALLOWABLA AND ACTUAL AXLE LOAD AXLE 2
Actual axleload readingfor variousvehicle classes
Maximumallowable axleload
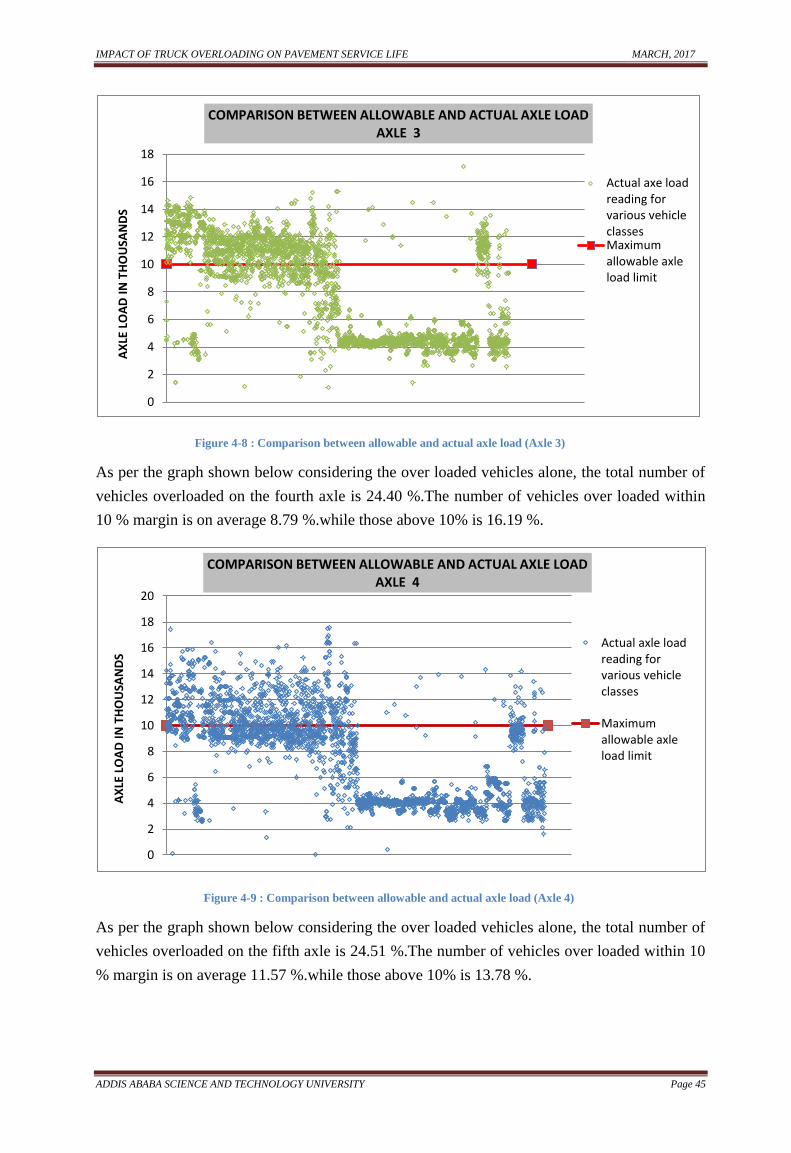
IMPACT OF TRUCK OVERLOADING ON PAVEMENT SERVICE LIFE MARCH, 2017
ADDIS ABABA SCIENCE AND TECHNOLOGY UNIVERSITY Page 45
Figure 4-8 : Comparison between allowable and actual axle load (Axle 3)
As per the graph shown below considering the over loaded vehicles alone, the total number of
vehicles overloaded on the fourth axle is 24.40 %.The number of vehicles over loaded within
10 % margin is on average 8.79 %.while those above 10% is 16.19 %.
Figure 4-9 : Comparison between allowable and actual axle load (Axle 4)
As per the graph shown below considering the over loaded vehicles alone, the total number of
vehicles overloaded on the fifth axle is 24.51 %.The number of vehicles over loaded within 10
% margin is on average 11.57 %.while those above 10% is 13.78 %.
0
2
4
6
8
10
12
14
16
18
AX
LE L
OA
D I
N T
HO
USA
ND
S COMPARISON BETWEEN ALLOWABLE AND ACTUAL AXLE LOAD
AXLE 3
Actual axe loadreading forvarious vehicleclassesMaximumallowable axleload limit
0
2
4
6
8
10
12
14
16
18
20
AX
LE L
OA
D I
N T
HO
USA
ND
S
COMPARISON BETWEEN ALLOWABLE AND ACTUAL AXLE LOAD AXLE 4
Actual axle loadreading forvarious vehicleclasses
Maximumallowable axleload limit
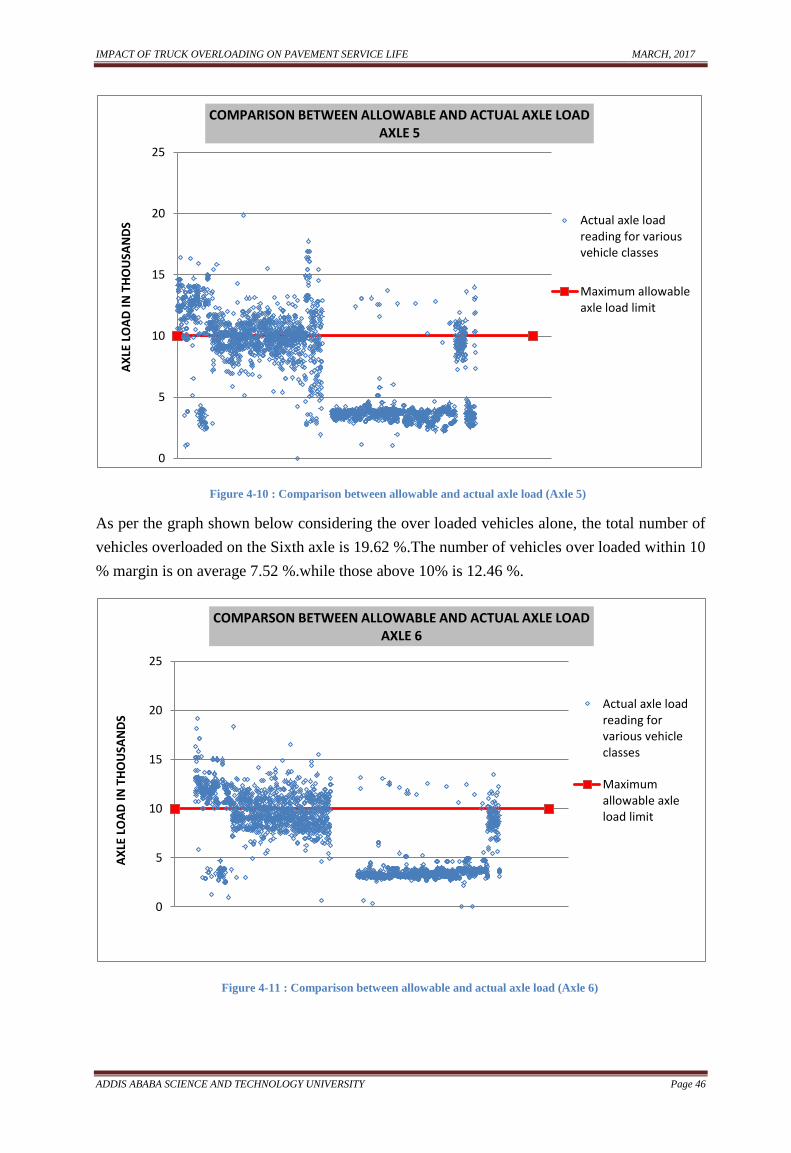
IMPACT OF TRUCK OVERLOADING ON PAVEMENT SERVICE LIFE MARCH, 2017
ADDIS ABABA SCIENCE AND TECHNOLOGY UNIVERSITY Page 46
Figure 4-10 : Comparison between allowable and actual axle load (Axle 5)
As per the graph shown below considering the over loaded vehicles alone, the total number of
vehicles overloaded on the Sixth axle is 19.62 %.The number of vehicles over loaded within 10
% margin is on average 7.52 %.while those above 10% is 12.46 %.
Figure 4-11 : Comparison between allowable and actual axle load (Axle 6)
0
5
10
15
20
25
AX
LE L
OA
D I
N T
HO
USA
ND
S COMPARISON BETWEEN ALLOWABLE AND ACTUAL AXLE LOAD
AXLE 5
Actual axle loadreading for variousvehicle classes
Maximum allowableaxle load limit
0
5
10
15
20
25
AX
LE L
OA
D I
N T
HO
USA
ND
S
COMPARSON BETWEEN ALLOWABLE AND ACTUAL AXLE LOAD AXLE 6
Actual axle loadreading forvarious vehicleclasses
Maximumallowable axleload limit
IMPACT OF TRUCK OVERLOADING ON PAVEMENT SERVICE LIFE MARCH, 2017
ADDIS ABABA SCIENCE AND TECHNOLOGY UNIVERSITY Page 47
4.6.2 Selected Loads for analysis
Secondary axle load survey data, which was conducted at the outskirt of Awash junction, was
taken for analysis. Because, most of the trucks were captured except fuel trucks, which
normally are not required to enter into the weighing station. The survey of sampling covers
large buses, truck, and Truck Trailers.
From the survey, the possible maximum range of axle loads has been identified. Accordingly,
it has been learned from the data that, axle load up to 20 tons were registered along the
corridor. Hence, the reading between the two extreme ends and the standard 8 Tones axle load
for steering axle load and 10 Tones the maximum allowed rear axle load are included in the
analysis, i.e., 12, 14, 16, 18 and 20 Tones are considered in the analysis.
4.7 Stress and Strain
The flexible pavement under study is a layered system which has an arrangement of better
materials on top and decrease as we go down. The overall system cannot be represented by a
homogeneous mass. The applied axle loads on the surface are assumed to be uniformly
distributed over a circular area. And the stresses, strains and deflections due to a concentrated
load can be integrated to obtain those due to a circular loaded area. In a layered system stress
can be emerged in an effect of overburden material or weight of overlying soil and due to
applied loads. Due to an applied wheel loads the pavement surface, the intensity of stress
increases directly under the loaded area.
Sub grade materials are not elastic and can undergo permanent deformation on stationary
loads. However, under the repeated moving loads the layer shows a recoverable deformation
which can be considered as elastic.
Although a pavement layer is composed of material with high quality on the top layer is to
reduce the direct transfer of stress on the sub grade to prevent critical pavement deformation.
The vertical compressive stress on the top of sub grade is an important factor in pavement
design.
To analyze the system, an advanced computer program called KENPAVE is used. The
program can help us compute all stress, strain and displacements at any point in the
multilayered system.
In this report the researcher was able to reveal that the deflection value under an increased
externally applied load, when the amount of load increases from minimum limit to maximum
load.
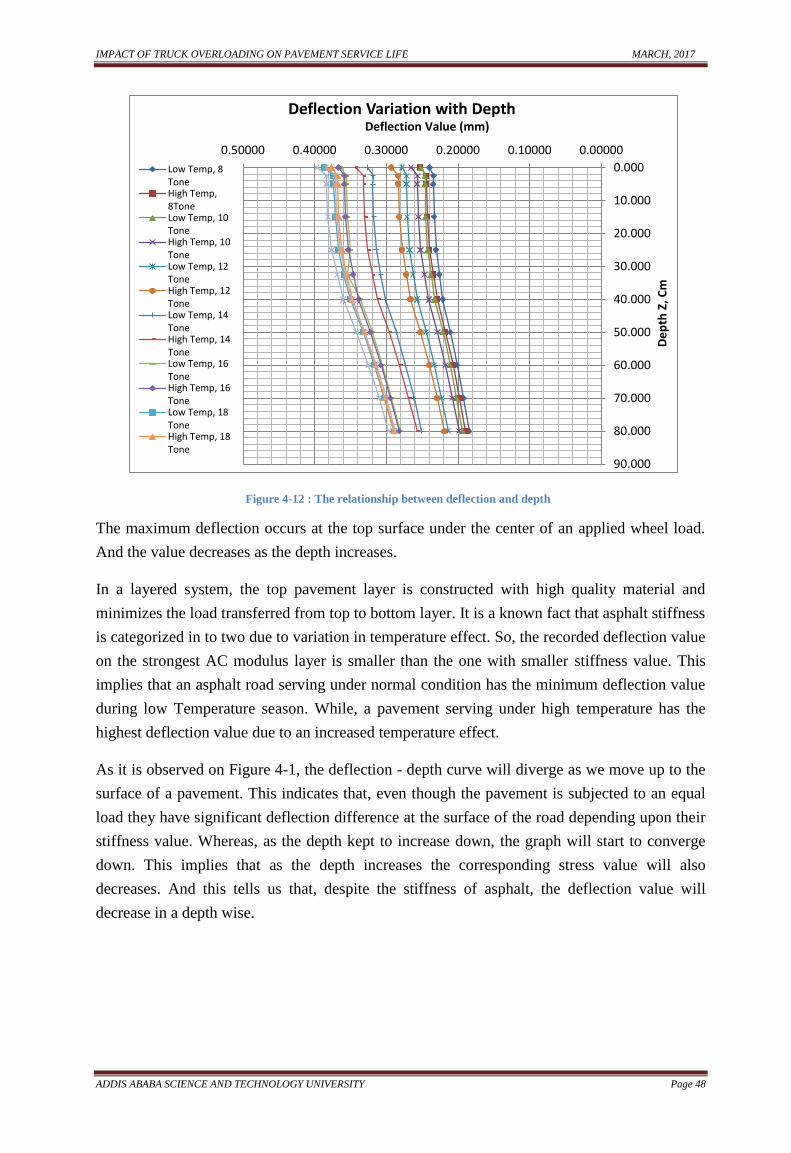
IMPACT OF TRUCK OVERLOADING ON PAVEMENT SERVICE LIFE MARCH, 2017
ADDIS ABABA SCIENCE AND TECHNOLOGY UNIVERSITY Page 48
Figure 4-12 : The relationship between deflection and depth
The maximum deflection occurs at the top surface under the center of an applied wheel load.
And the value decreases as the depth increases.
In a layered system, the top pavement layer is constructed with high quality material and
minimizes the load transferred from top to bottom layer. It is a known fact that asphalt stiffness
is categorized in to two due to variation in temperature effect. So, the recorded deflection value
on the strongest AC modulus layer is smaller than the one with smaller stiffness value. This
implies that an asphalt road serving under normal condition has the minimum deflection value
during low Temperature season. While, a pavement serving under high temperature has the
highest deflection value due to an increased temperature effect.
As it is observed on Figure 4-1, the deflection - depth curve will diverge as we move up to the
surface of a pavement. This indicates that, even though the pavement is subjected to an equal
load they have significant deflection difference at the surface of the road depending upon their
stiffness value. Whereas, as the depth kept to increase down, the graph will start to converge
down. This implies that as the depth increases the corresponding stress value will also
decreases. And this tells us that, despite the stiffness of asphalt, the deflection value will
decrease in a depth wise.
0.000
10.000
20.000
30.000
40.000
50.000
60.000
70.000
80.000
90.000
0.000000.100000.200000.300000.400000.50000
De
pth
Z, C
m
Deflection Value (mm) Deflection Variation with Depth
Low Temp, 8ToneHigh Temp,8ToneLow Temp, 10ToneHigh Temp, 10ToneLow Temp, 12ToneHigh Temp, 12ToneLow Temp, 14ToneHigh Temp, 14ToneLow Temp, 16ToneHigh Temp, 16ToneLow Temp, 18ToneHigh Temp, 18Tone
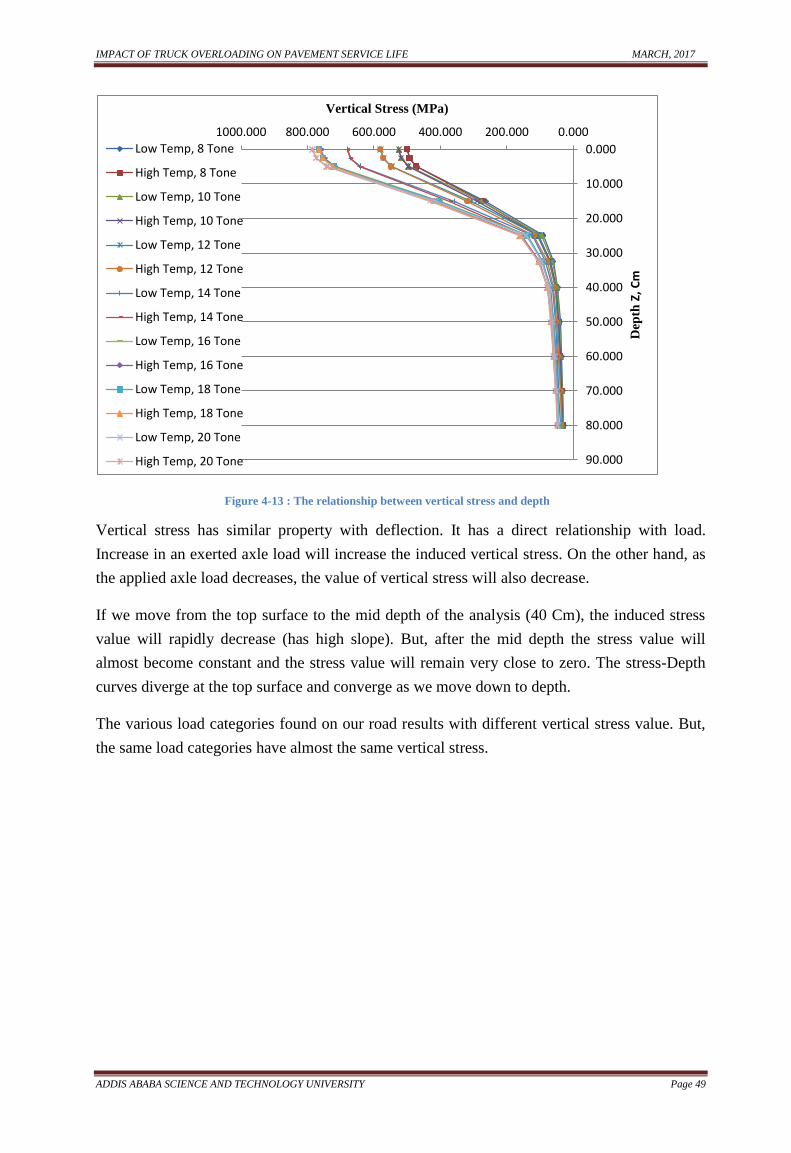
IMPACT OF TRUCK OVERLOADING ON PAVEMENT SERVICE LIFE MARCH, 2017
ADDIS ABABA SCIENCE AND TECHNOLOGY UNIVERSITY Page 49
Figure 4-13 : The relationship between vertical stress and depth
Vertical stress has similar property with deflection. It has a direct relationship with load.
Increase in an exerted axle load will increase the induced vertical stress. On the other hand, as
the applied axle load decreases, the value of vertical stress will also decrease.
If we move from the top surface to the mid depth of the analysis (40 Cm), the induced stress
value will rapidly decrease (has high slope). But, after the mid depth the stress value will
almost become constant and the stress value will remain very close to zero. The stress-Depth
curves diverge at the top surface and converge as we move down to depth.
The various load categories found on our road results with different vertical stress value. But,
the same load categories have almost the same vertical stress.
0.000
10.000
20.000
30.000
40.000
50.000
60.000
70.000
80.000
90.000
0.000200.000400.000600.000800.0001000.000
Dep
th Z
, Cm
Vertical Stress (MPa)
Low Temp, 8 Tone
High Temp, 8 Tone
Low Temp, 10 Tone
High Temp, 10 Tone
Low Temp, 12 Tone
High Temp, 12 Tone
Low Temp, 14 Tone
High Temp, 14 Tone
Low Temp, 16 Tone
High Temp, 16 Tone
Low Temp, 18 Tone
High Temp, 18 Tone
Low Temp, 20 Tone
High Temp, 20 Tone
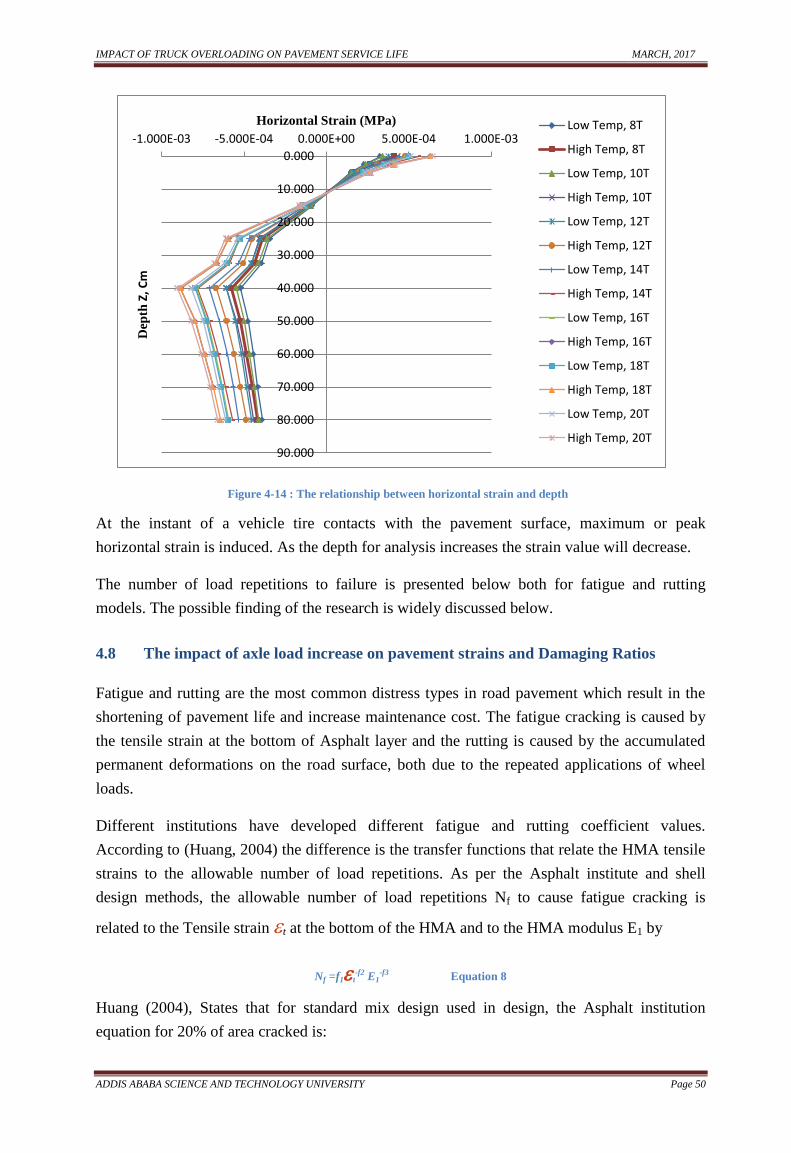
IMPACT OF TRUCK OVERLOADING ON PAVEMENT SERVICE LIFE MARCH, 2017
ADDIS ABABA SCIENCE AND TECHNOLOGY UNIVERSITY Page 50
Figure 4-14 : The relationship between horizontal strain and depth
At the instant of a vehicle tire contacts with the pavement surface, maximum or peak
horizontal strain is induced. As the depth for analysis increases the strain value will decrease.
The number of load repetitions to failure is presented below both for fatigue and rutting
models. The possible finding of the research is widely discussed below.
4.8 The impact of axle load increase on pavement strains and Damaging Ratios
Fatigue and rutting are the most common distress types in road pavement which result in the
shortening of pavement life and increase maintenance cost. The fatigue cracking is caused by
the tensile strain at the bottom of Asphalt layer and the rutting is caused by the accumulated
permanent deformations on the road surface, both due to the repeated applications of wheel
loads.
Different institutions have developed different fatigue and rutting coefficient values.
According to (Huang, 2004) the difference is the transfer functions that relate the HMA tensile
strains to the allowable number of load repetitions. As per the Asphalt institute and shell
design methods, the allowable number of load repetitions Nf to cause fatigue cracking is
related to the Tensile strain t at the bottom of the HMA and to the HMA modulus E1 by
Nf =f1t-f2 E1
-f3 Equation 8
Huang (2004), States that for standard mix design used in design, the Asphalt institution
equation for 20% of area cracked is:
0.000
10.000
20.000
30.000
40.000
50.000
60.000
70.000
80.000
90.000
-1.000E-03 -5.000E-04 0.000E+00 5.000E-04 1.000E-03D
epth
Z, C
m
Horizontal Strain (MPa) Low Temp, 8T
High Temp, 8T
Low Temp, 10T
High Temp, 10T
Low Temp, 12T
High Temp, 12T
Low Temp, 14T
High Temp, 14T
Low Temp, 16T
High Temp, 16T
Low Temp, 18T
High Temp, 18T
Low Temp, 20T
High Temp, 20T
IMPACT OF TRUCK OVERLOADING ON PAVEMENT SERVICE LIFE MARCH, 2017
ADDIS ABABA SCIENCE AND TECHNOLOGY UNIVERSITY Page 51
Nf = 0.0796(t)-3.291(E1)
-0.854 Equation 9
Shell Nf = 0.0685(t)-5.671(E1)
-2.363 Equation 10
The values of f2 and f3 are usually determined from fatigue tests on laboratory specimen.
Because f2 is much greater than f3, the effect of t on Nf is much greater than that of E1.
Therefore, in other models like TRL and Belgian road research the value of f3 is noted to be
zero (0). Hence, the term E1 may be neglected. This implies that the range of allowable number
of load repetitions will become very narrow (Conservative model) in TRL and Belgian road
research center. As we are in scarce of natural resources and financial constraint we can‟t
afford to construct the entire road with thick depth of asphalt pavement which will have
minimum fatigue capacity. In order to relax (widen) the gap for the allowable load repetitions
and to develop a very economical way of design, it is recommendable to consider the value of
E1. As a result of this, Asphalt institute is the best model found in agreement with the actual
scenario of our country to analyze the fatigue model.
In addition Huang (2004) discussed that, In Asphalt Institute and shell design methods, the
allowable number of load repetitions Nd to limit rutting is related to the vertical compressive
strain c on top of sub grade by
Nf2 = f4 (v)-f5 Equation 11
The values of f5 in many models are very close, whereas f4 varies a great deal. According to
Huang (2004), in the sub grade strain method, it is assumed that, if the sub grade compressive
strain is controlled, reasonable surface rut depths will not be exceeded. For example, designs
by the Asphalt Institute method are expected not to have a rut depth greater than 12.7mm
(Huang, 2004). and designs by TRRL procedure are expected not to have a rut depth of more
than 10.2mm (Huang, 2004). The shell method has a suggested procedure for estimating
permanent deformations.
The definition of pavement failure is different between developing and developed countries.
So, in light of our country‟s condition, it is unaffordable to construct a pavement with
minimum rut depth capacity on our entire road network. Hence the Asphalt institute model
which has a relaxed /wide range/ value of rut depth can represent well the scenario of country.
Thus, to analyze the available data, Asphalt institute, the most commonly and widely used
model is adopted in view of the above reasons:
Figure 4-15, shows increase in load intensity will have tremendous damaging effect on the
pavement. However, the damaging extent will vary depending on different AC Modulus. The
relationship between increasing axle load and tensile strain at the bottom of asphalt layer and
compressive strain at the top of the sub grade is shown on the graph below.
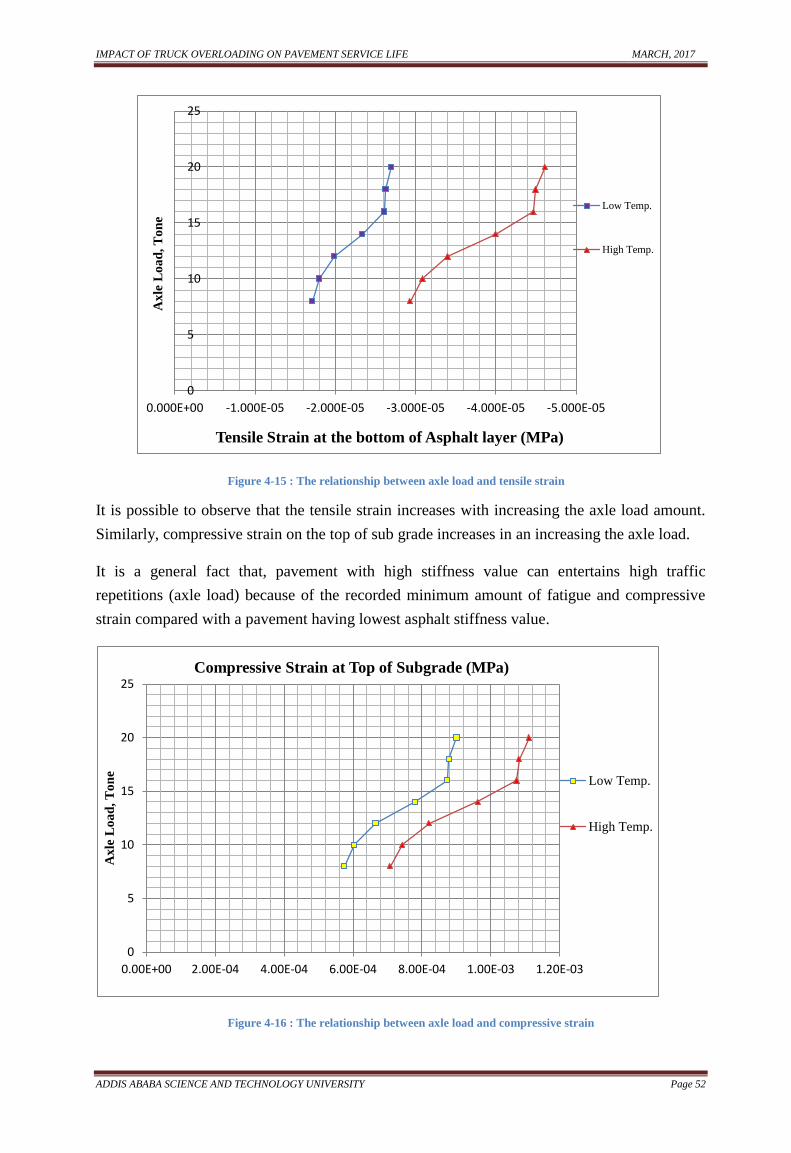
IMPACT OF TRUCK OVERLOADING ON PAVEMENT SERVICE LIFE MARCH, 2017
ADDIS ABABA SCIENCE AND TECHNOLOGY UNIVERSITY Page 52
Figure 4-15 : The relationship between axle load and tensile strain
It is possible to observe that the tensile strain increases with increasing the axle load amount.
Similarly, compressive strain on the top of sub grade increases in an increasing the axle load.
It is a general fact that, pavement with high stiffness value can entertains high traffic
repetitions (axle load) because of the recorded minimum amount of fatigue and compressive
strain compared with a pavement having lowest asphalt stiffness value.
Figure 4-16 : The relationship between axle load and compressive strain
0
5
10
15
20
25
-5.000E-05-4.000E-05-3.000E-05-2.000E-05-1.000E-050.000E+00
Axle
Lo
ad
, T
on
e
Tensile Strain at the bottom of Asphalt layer (MPa)
Low Temp.
High Temp.
0
5
10
15
20
25
0.00E+00 2.00E-04 4.00E-04 6.00E-04 8.00E-04 1.00E-03 1.20E-03
Axle
Lo
ad
, T
on
e
Compressive Strain at Top of Subgrade (MPa)
Low Temp.
High Temp.
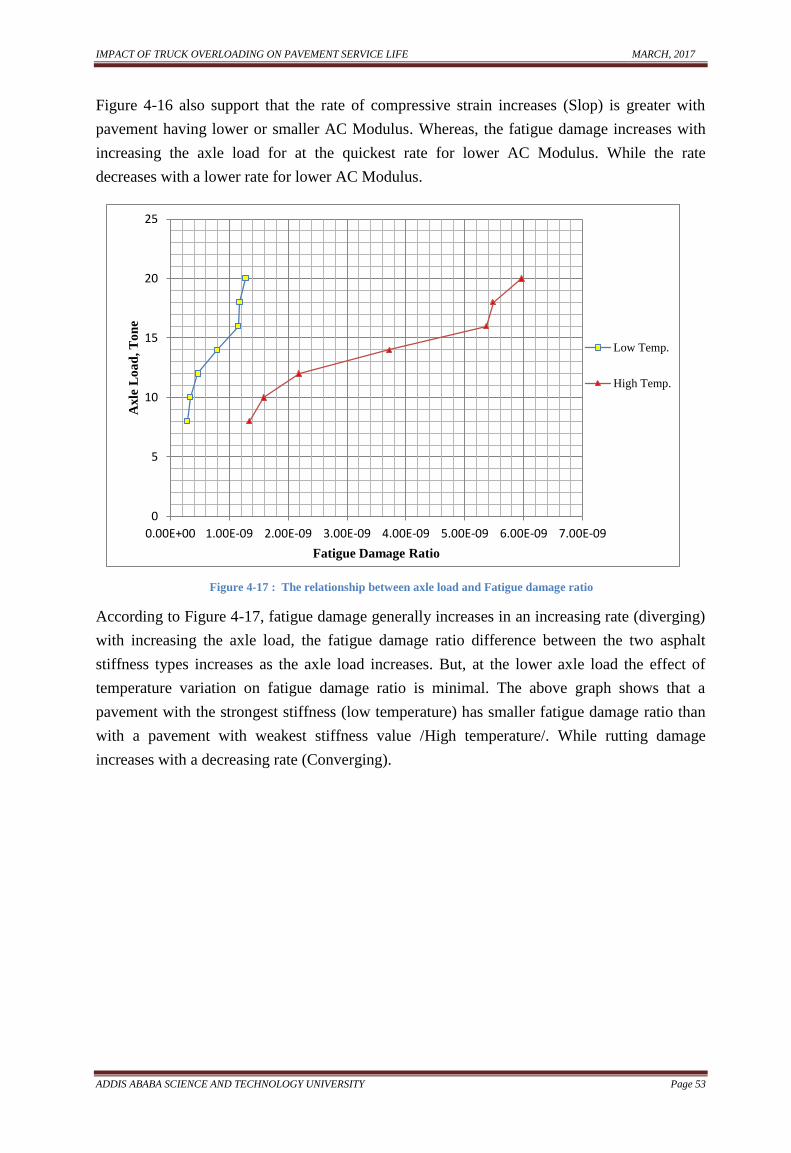
IMPACT OF TRUCK OVERLOADING ON PAVEMENT SERVICE LIFE MARCH, 2017
ADDIS ABABA SCIENCE AND TECHNOLOGY UNIVERSITY Page 53
Figure 4-16 also support that the rate of compressive strain increases (Slop) is greater with
pavement having lower or smaller AC Modulus. Whereas, the fatigue damage increases with
increasing the axle load for at the quickest rate for lower AC Modulus. While the rate
decreases with a lower rate for lower AC Modulus.
Figure 4-17 : The relationship between axle load and Fatigue damage ratio
According to Figure 4-17, fatigue damage generally increases in an increasing rate (diverging)
with increasing the axle load, the fatigue damage ratio difference between the two asphalt
stiffness types increases as the axle load increases. But, at the lower axle load the effect of
temperature variation on fatigue damage ratio is minimal. The above graph shows that a
pavement with the strongest stiffness (low temperature) has smaller fatigue damage ratio than
with a pavement with weakest stiffness value /High temperature/. While rutting damage
increases with a decreasing rate (Converging).
0
5
10
15
20
25
0.00E+00 1.00E-09 2.00E-09 3.00E-09 4.00E-09 5.00E-09 6.00E-09 7.00E-09
Axle
Lo
ad
, T
on
e
Fatigue Damage Ratio
Low Temp.
High Temp.
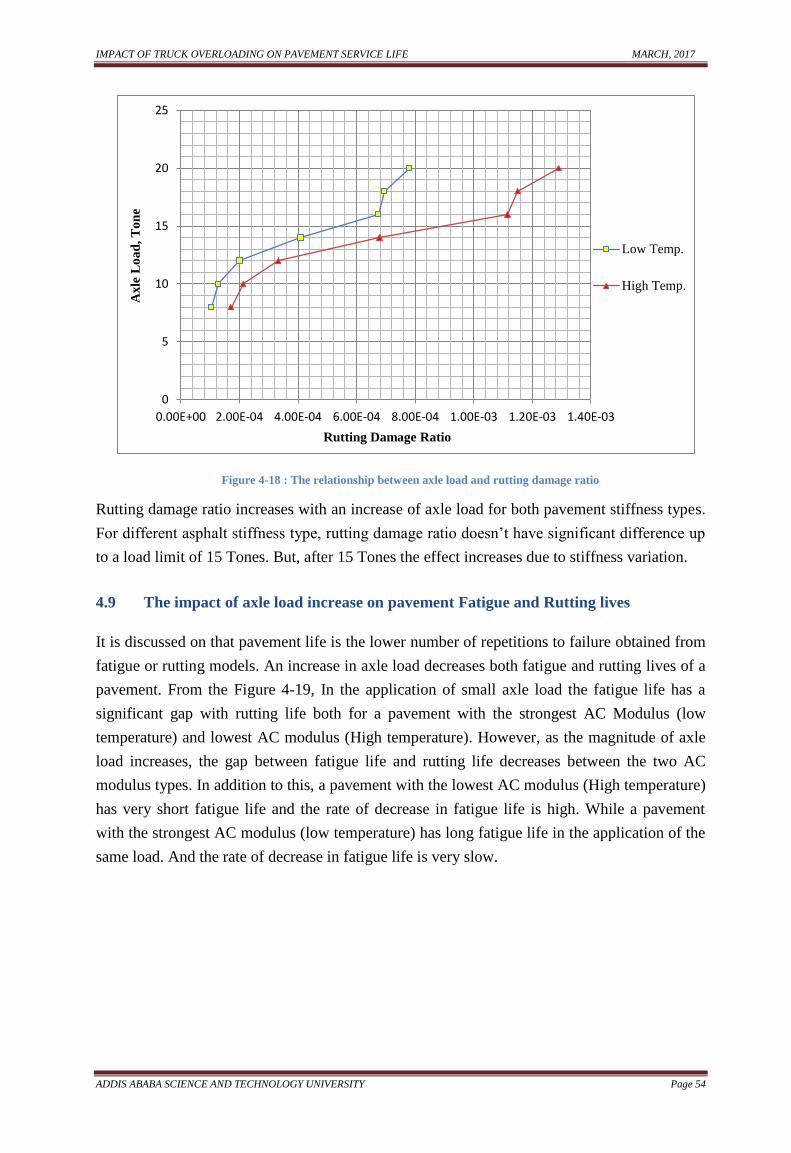
IMPACT OF TRUCK OVERLOADING ON PAVEMENT SERVICE LIFE MARCH, 2017
ADDIS ABABA SCIENCE AND TECHNOLOGY UNIVERSITY Page 54
Figure 4-18 : The relationship between axle load and rutting damage ratio
Rutting damage ratio increases with an increase of axle load for both pavement stiffness types.
For different asphalt stiffness type, rutting damage ratio doesn‟t have significant difference up
to a load limit of 15 Tones. But, after 15 Tones the effect increases due to stiffness variation.
4.9 The impact of axle load increase on pavement Fatigue and Rutting lives
It is discussed on that pavement life is the lower number of repetitions to failure obtained from
fatigue or rutting models. An increase in axle load decreases both fatigue and rutting lives of a
pavement. From the Figure 4-19, In the application of small axle load the fatigue life has a
significant gap with rutting life both for a pavement with the strongest AC Modulus (low
temperature) and lowest AC modulus (High temperature). However, as the magnitude of axle
load increases, the gap between fatigue life and rutting life decreases between the two AC
modulus types. In addition to this, a pavement with the lowest AC modulus (High temperature)
has very short fatigue life and the rate of decrease in fatigue life is high. While a pavement
with the strongest AC modulus (low temperature) has long fatigue life in the application of the
same load. And the rate of decrease in fatigue life is very slow.
0
5
10
15
20
25
0.00E+00 2.00E-04 4.00E-04 6.00E-04 8.00E-04 1.00E-03 1.20E-03 1.40E-03
Axle
Lo
ad
, T
on
e
Rutting Damage Ratio
Low Temp.
High Temp.
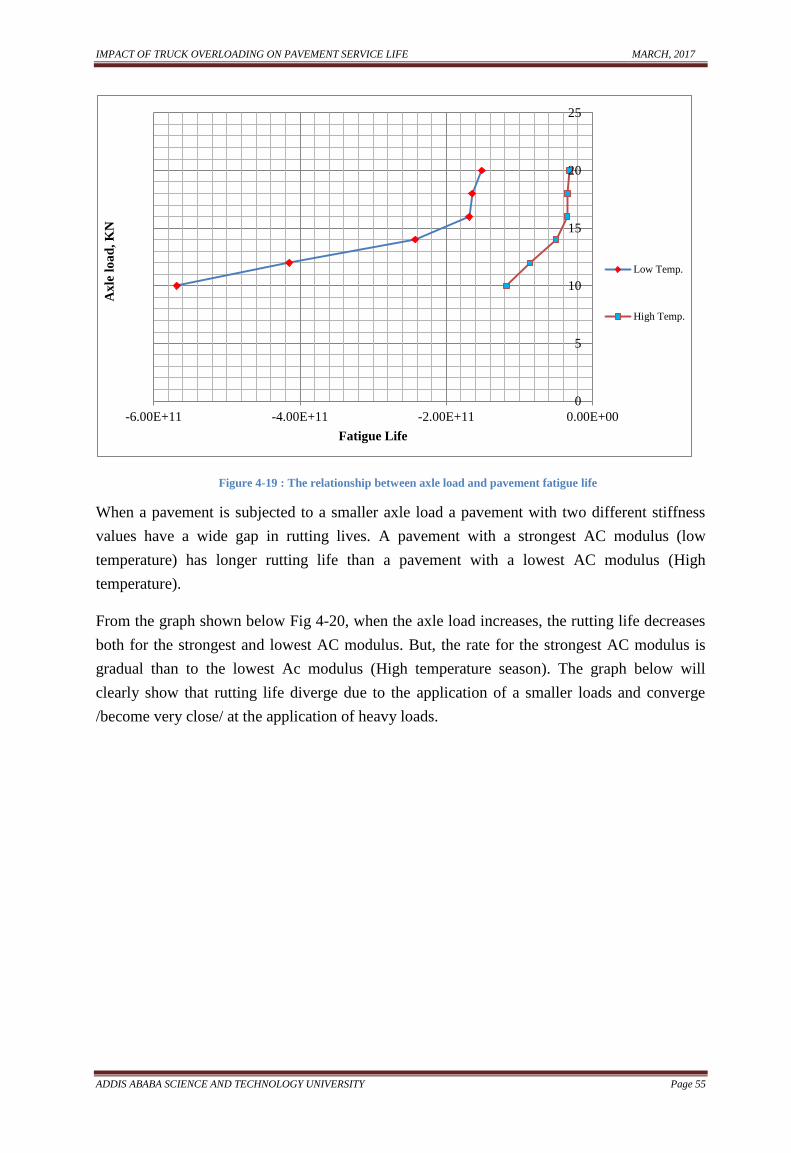
IMPACT OF TRUCK OVERLOADING ON PAVEMENT SERVICE LIFE MARCH, 2017
ADDIS ABABA SCIENCE AND TECHNOLOGY UNIVERSITY Page 55
Figure 4-19 : The relationship between axle load and pavement fatigue life
When a pavement is subjected to a smaller axle load a pavement with two different stiffness
values have a wide gap in rutting lives. A pavement with a strongest AC modulus (low
temperature) has longer rutting life than a pavement with a lowest AC modulus (High
temperature).
From the graph shown below Fig 4-20, when the axle load increases, the rutting life decreases
both for the strongest and lowest AC modulus. But, the rate for the strongest AC modulus is
gradual than to the lowest Ac modulus (High temperature season). The graph below will
clearly show that rutting life diverge due to the application of a smaller loads and converge
/become very close/ at the application of heavy loads.
0
5
10
15
20
25
-6.00E+11 -4.00E+11 -2.00E+11 0.00E+00
Axle
lo
ad
, K
N
Fatigue Life
Low Temp.
High Temp.
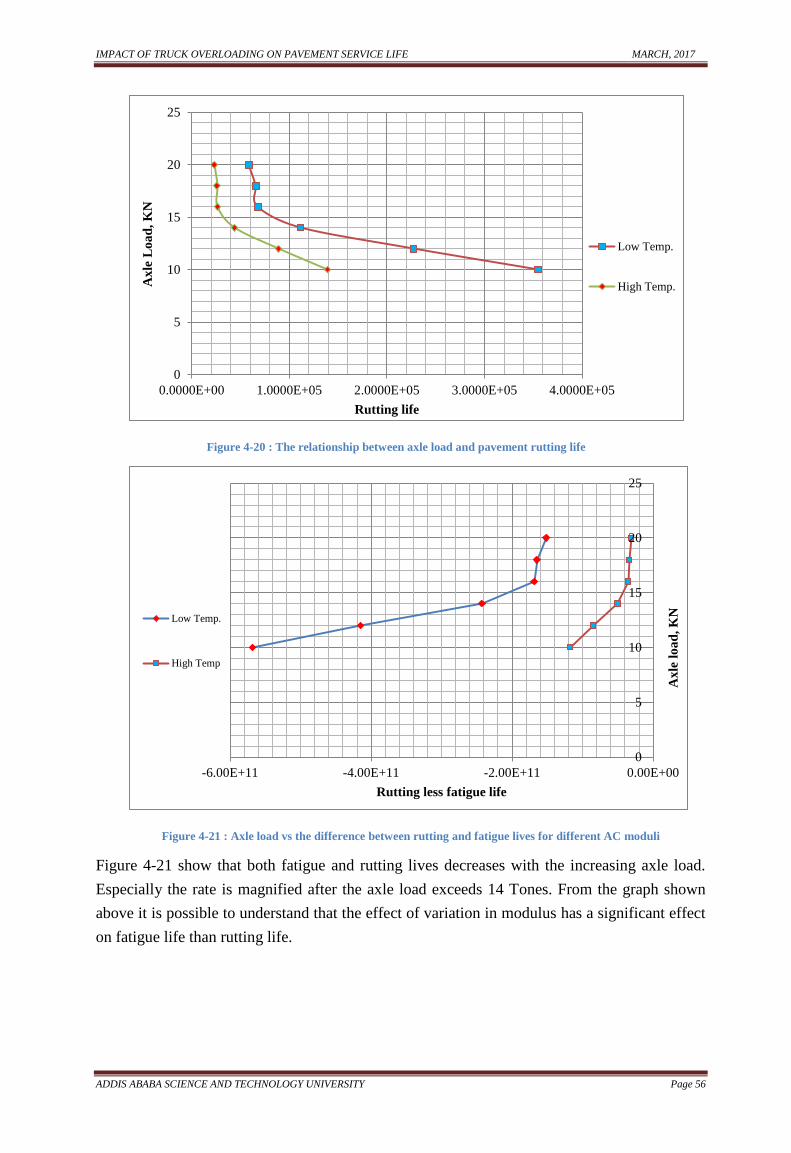
IMPACT OF TRUCK OVERLOADING ON PAVEMENT SERVICE LIFE MARCH, 2017
ADDIS ABABA SCIENCE AND TECHNOLOGY UNIVERSITY Page 56
Figure 4-20 : The relationship between axle load and pavement rutting life
Figure 4-21 : Axle load vs the difference between rutting and fatigue lives for different AC moduli
Figure 4-21 show that both fatigue and rutting lives decreases with the increasing axle load.
Especially the rate is magnified after the axle load exceeds 14 Tones. From the graph shown
above it is possible to understand that the effect of variation in modulus has a significant effect
on fatigue life than rutting life.
0
5
10
15
20
25
0.0000E+00 1.0000E+05 2.0000E+05 3.0000E+05 4.0000E+05
Axle
Lo
ad
, K
N
Rutting life
Low Temp.
High Temp.
0
5
10
15
20
25
-6.00E+11 -4.00E+11 -2.00E+11 0.00E+00
Axle
lo
ad
, K
N
Rutting less fatigue life
Low Temp.
High Temp
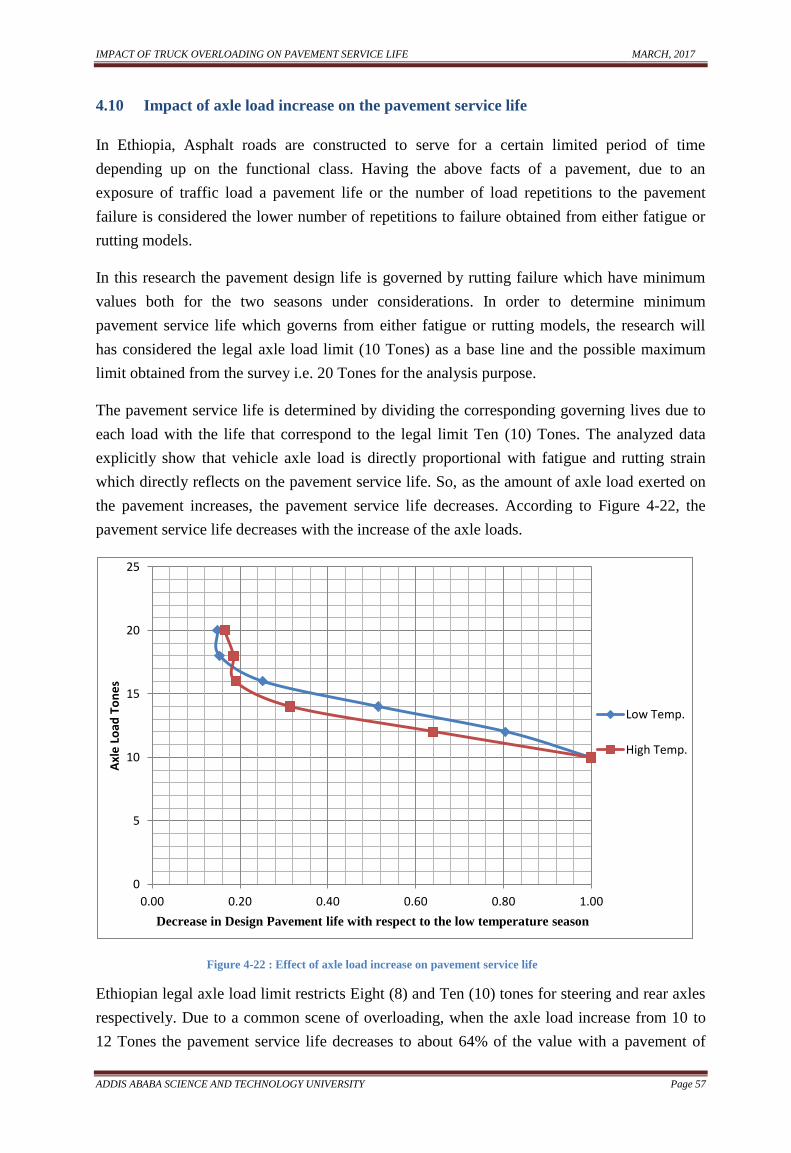
IMPACT OF TRUCK OVERLOADING ON PAVEMENT SERVICE LIFE MARCH, 2017
ADDIS ABABA SCIENCE AND TECHNOLOGY UNIVERSITY Page 57
4.10 Impact of axle load increase on the pavement service life
In Ethiopia, Asphalt roads are constructed to serve for a certain limited period of time
depending up on the functional class. Having the above facts of a pavement, due to an
exposure of traffic load a pavement life or the number of load repetitions to the pavement
failure is considered the lower number of repetitions to failure obtained from either fatigue or
rutting models.
In this research the pavement design life is governed by rutting failure which have minimum
values both for the two seasons under considerations. In order to determine minimum
pavement service life which governs from either fatigue or rutting models, the research will
has considered the legal axle load limit (10 Tones) as a base line and the possible maximum
limit obtained from the survey i.e. 20 Tones for the analysis purpose.
The pavement service life is determined by dividing the corresponding governing lives due to
each load with the life that correspond to the legal limit Ten (10) Tones. The analyzed data
explicitly show that vehicle axle load is directly proportional with fatigue and rutting strain
which directly reflects on the pavement service life. So, as the amount of axle load exerted on
the pavement increases, the pavement service life decreases. According to Figure 4-22, the
pavement service life decreases with the increase of the axle loads.
Figure 4-22 : Effect of axle load increase on pavement service life
Ethiopian legal axle load limit restricts Eight (8) and Ten (10) tones for steering and rear axles
respectively. Due to a common scene of overloading, when the axle load increase from 10 to
12 Tones the pavement service life decreases to about 64% of the value with a pavement of
0
5
10
15
20
25
0.00 0.20 0.40 0.60 0.80 1.00
Axl
e L
oad
To
ne
s
Decrease in Design Pavement life with respect to the low temperature season
Low Temp.
High Temp.
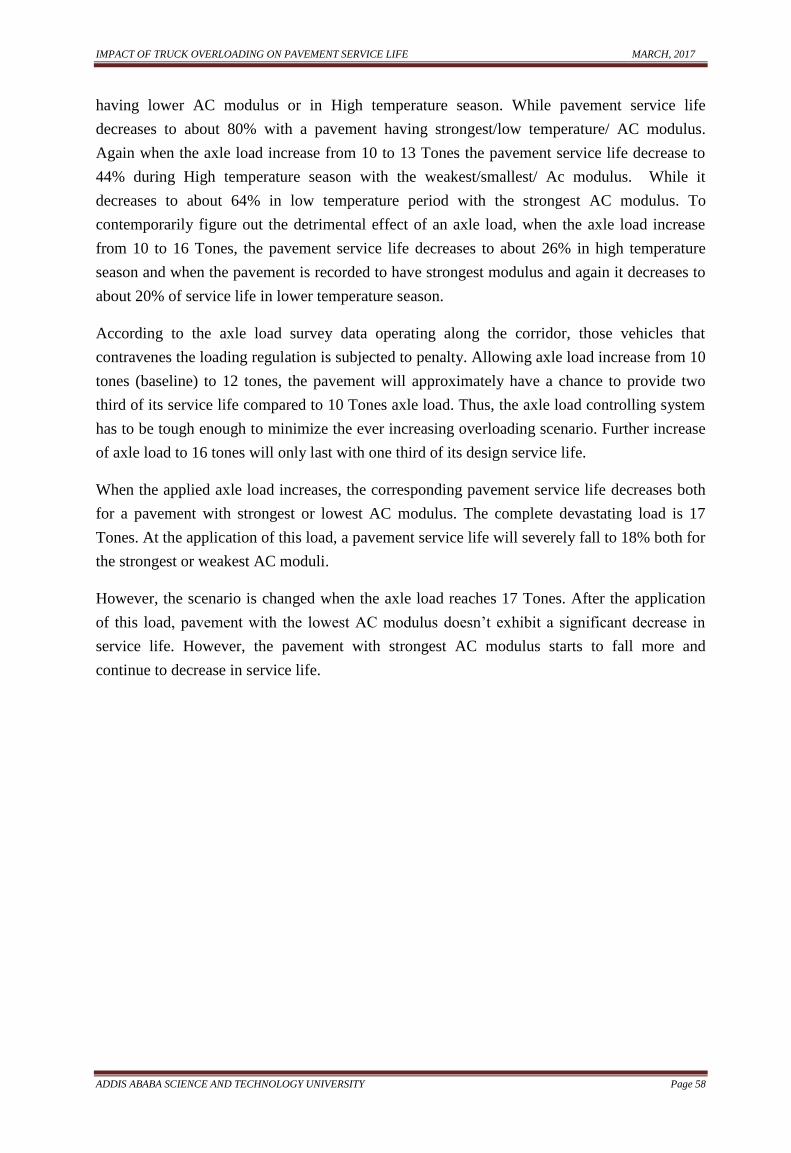
IMPACT OF TRUCK OVERLOADING ON PAVEMENT SERVICE LIFE MARCH, 2017
ADDIS ABABA SCIENCE AND TECHNOLOGY UNIVERSITY Page 58
having lower AC modulus or in High temperature season. While pavement service life
decreases to about 80% with a pavement having strongest/low temperature/ AC modulus.
Again when the axle load increase from 10 to 13 Tones the pavement service life decrease to
44% during High temperature season with the weakest/smallest/ Ac modulus. While it
decreases to about 64% in low temperature period with the strongest AC modulus. To
contemporarily figure out the detrimental effect of an axle load, when the axle load increase
from 10 to 16 Tones, the pavement service life decreases to about 26% in high temperature
season and when the pavement is recorded to have strongest modulus and again it decreases to
about 20% of service life in lower temperature season.
According to the axle load survey data operating along the corridor, those vehicles that
contravenes the loading regulation is subjected to penalty. Allowing axle load increase from 10
tones (baseline) to 12 tones, the pavement will approximately have a chance to provide two
third of its service life compared to 10 Tones axle load. Thus, the axle load controlling system
has to be tough enough to minimize the ever increasing overloading scenario. Further increase
of axle load to 16 tones will only last with one third of its design service life.
When the applied axle load increases, the corresponding pavement service life decreases both
for a pavement with strongest or lowest AC modulus. The complete devastating load is 17
Tones. At the application of this load, a pavement service life will severely fall to 18% both for
the strongest or weakest AC moduli.
However, the scenario is changed when the axle load reaches 17 Tones. After the application
of this load, pavement with the lowest AC modulus doesn‟t exhibit a significant decrease in
service life. However, the pavement with strongest AC modulus starts to fall more and
continue to decrease in service life.
IMPACT OF TRUCK OVERLOADING ON PAVEMENT SERVICE LIFE MARCH, 2017
ADDIS ABABA SCIENCE AND TECHNOLOGY UNIVERSITY Page 59
5 CONCLUSION AND RECOMMENDATION
In Ethiopia, due to the prevailing economic boost, the vehicular transport demand is increasing
from time to time. The import export service is mainly expedited through Awash - Mille road.
Along the corridor heavy truck and Articulated Trucks are the dominant types. According to
the research finding up to 1.86% of front axles are over the legal limit. Nevertheless, on
average 29.00% of the rear axles are still over the legal limit. The analyzed vehicle axle load
distribution show that, the second tandem axle with dual wheel arrangement has the highest
damaging effect on the pavement. In view of this, the second tandem axles with dual tires are
critical axles which takes 20.60 % gross vehicle weight. Hence, the above quoted figures
indicates that the legal axle load limit declared by the Transport Authority that is 8 tones for
steering and 10 tones for rear axles are far away from the actual scenario.
Practically it is impossible to avoid truck overloading. But, we can device a mechanism to
reduce the scale of the problem. Tire pressure is also one factor which has detrimental effect to
pavement.
When an axle load is subjected to a pavement, the critical location exposed to tensile strain is
the bottom of the asphalt layer. This can be related with the fatigue life of a pavement.
Similarly, it has an effect of vertical compressive strain on the top of sub grade, which can help
to predict the amount of sub grade rutting in HMA pavements due to accumulated permanent
deformations. Meanwhile, it is important to understand the effect of environmental temperature
on the elasticity modulus of asphalt layer. Some researchers report that AC modulus during
High temperature season drops to about 20% of its low temperature season value due to
increase in pavement temperature.
Increase in axle load will simultaneously increase the surface deflection on the asphalt
pavement. But, the intensity will decrease with regard to depth. Similarly, the induced vertical
stress decreases depth wise, even though it has some difference on the surface because of the
asphalt stiffness variation. And horizontal strain also decreases with respect to depth. Both
fatigue and rutting lives decreases with the increase of axle load. The analyses of the research
show that fatigue has longer life than rutting. The pavement life is governed by the lower
number of repetitions obtained from fatigue or rutting models, in our case, where rutting model
has governed.
To deeply elaborate the down influence of overloading on pavement life, the legal limit 10
Tone is used as a base line. Thus, the pavement service life has significantly fallen as the axle
load increase. The damaging effect was also worsening on the pavement with minimum AC
modulus. Due to an increase in axle load from 10 tones (baseline) to 12 tones, the pavement
will approximately have a chance to provide two third of its service life compared to 10 Tones
axle load. Further increase of axle load to 16 tones will only remain with one third of its design
service life.
IMPACT OF TRUCK OVERLOADING ON PAVEMENT SERVICE LIFE MARCH, 2017
ADDIS ABABA SCIENCE AND TECHNOLOGY UNIVERSITY Page 60
To minimize the apparent problem of overloading and its impact on the pavement service life,
the following recommendations are forwarded
The vehicle load regulation has strictly maintained to minimize the damage. One of the
drawbacks for the implementation is the location of weighing bridge. For example
vehicle coming from Djibouti port is enforced to enter a weighing-bridge at Awash
Arba Junction, after it has approximately damaged about 500 Km of asphalt road. Thus,
stationary weighing bridge has to be constructed at the proper location near to the
border. Again it is advised to equip the stationary weighing bridge with automatic
register that can capture and store the data to avoid the occurrence of an error and
deliberate manipulation of data.
Our design should rely on the actual scenario and again should consider the upcoming
traffic volume, load and complex axle configuration coming due to economic growth
and technological advancement in order to have long serving roads. Thus, this triggers
other researcher to go through in finding an advanced best complying type of design
method.
From the undertaken research, we tried to figure out that a pavement with strong AC
stiffness has the capacity to carry more axle loads than with the weak AC modulus.
Therefore, the research advises in our design methodology to adopt an asphalt concrete
mix types which can result in strong stiffness type.
Preserve and forward the necessary timely intervention/maintenance/ before a severe
damage happen to our infrastructure that costs us significant amount of money.
It is recommended to try to adopt an advanced method of pavement design, which
considers the effect of climate on pavement material.
IMPACT OF TRUCK OVERLOADING ON PAVEMENT SERVICE LIFE MARCH, 2017
ADDIS ABABA SCIENCE AND TECHNOLOGY UNIVERSITY Page 61
6 BIBLIOGRAPHY
A.I.M. Cleassen, J. E. (August 1977). Asphalt Pavement Design, The Shell method.
A.Kifle, T. A. (2006). " Cargo Transit Challenge in Ethiopia. The ARD - RAISE
Consortium.".
Adu-Osei, A. (December 2000). Characterization of unbound Granular layers in
flexible pavements.
Alemu, D. L. (October, 2013). Impact of over loading and role of legal axle load
enforcement.
Alene, D. A. (n.d.). Pavement analysis and Design Lecture note.
Austroads. (2000). The influence of multiple - axle group loads on flexible pavement
design.
Authority, E. R. (2013). Flexible pavement design manual .
Birhanu, D. I. (n.d.). Highway Engineering II lecture note.
Chan, Y. C. (2008). Truck overloading study in developing countries and strategies to
minimize its impact.
Chung C., T. (2011). " Examine impact to highways / Structures - vehicles equiped
with Lift Axles.".
Dr. Francis Achampong, D. B. (2013). Post construction failure analysis of road
pavements in Ghana.
Engineers, H. /. (lne 1993). " The effects of increased Truck tire Loads on Pavement.".
Ethiopian Roads Authority, E. (2002a). " Pavement Design Manual. ".
Fathali, J. S. (2007, November). Deterioration Analysis of flexible pavements under
overweight vehicles.
Gicon. (2009). " End Review of Zambia Axle load control program.".
Hajek, J. a. (1990). " Axle group spacing; Influence and infrastructure Damage.".
Hassen, K. C. (2005). "Effect of Heavy Multiple Axle Trucks on flexible pavement
Damage using in-service pavement performance data.". Journal of Transportation
Engineering,10,1061/(ASCE)0733-947X(2006) 132:10(763,763 - 770) .
Huang, Y. (2004). " Pavement Analysis and Design.".
IMPACT OF TRUCK OVERLOADING ON PAVEMENT SERVICE LIFE MARCH, 2017
ADDIS ABABA SCIENCE AND TECHNOLOGY UNIVERSITY Page 62
J.Rolt. (1981). Optimum axle loads of commercial vehicles in developing countries.
Japan Internaational cooperation Agency, J. (2011). Study for the harmonization of
vehicle overload controling the East African Community.". The East African Trade and
Transport facilitation project (EATTFP) .
Jose L.Femandes, J. A. (1995). Economic Impacts of Axle Load Limits and Heavy
vehicle configurations on performance of pavements in Brazil.Road Transport
Technology - 4.".
Kim, Y. R. (2009). Modeling of Asphalt Concrete.
Laboratory, T. R. (1991).
Laboratory, T. R. (2004). A Guide to axle load surveys and traffic counts for
determining traffic loading on pavements.
Medani, D. T. (n.d.). Pavement design and analysis.
Mehari, A. (October, 2015). Influence of overloaded freight transportation on
pavement life. Addis Ababa.
Ministry of Transport, T. (2012). "Consolidated Road Transport Laws of Ethiopia.".
Molenaar, P. d. (2009). Structural Design of Pavements, Design of flexible pavements.
Mulyono, A. P. (2010). Analysis of loss cost of road pavement distress due to
overloading freight transportation.
N.C.E.a.A., P. (2012). "Awash Mille - Road overlay project. Soils and Materials
Report.".
National cooperative highway research program, N. (2004).
Officials, A. A. (1993). " A Guide for Design of pavement structures.".
officials, A. A. (1993). AASTO Guide for Design of pavement structures.
Pais, J. S. (2013). " Impact of traffic overload on road pavement performance.".
Journal of Transportation Engineering 139(9): 873-879 .
Panordogen, S. J. (2000). An overload control strategy for province of KW Azululu -
Natal, South Africa. 6th international symposium on Heavy vehicle weights and
Dimensions."435 - 446.
Pilard, M. (2010). Overload control practices in Eastern and south Africa, Working
Paper No-91. Sub-Saharan Transport Policy.".
IMPACT OF TRUCK OVERLOADING ON PAVEMENT SERVICE LIFE MARCH, 2017
ADDIS ABABA SCIENCE AND TECHNOLOGY UNIVERSITY Page 63
Qiang Li, D. X. (2011). Mechanistic - Empirical Pavement design Guide , MEPDG.
Roads: Materials and construction chapter 8. (n.d.). Guidelines for human settlement
planning and design .
Rolt, J. (1981). "Optimum Axle loads of Commercial vehicles in Developing
countries.". Laboratory report LR 1002.TRL LTD .
Salem, H. (2008). Effect of excess axle weights on pavement life.
Sivakumar, B. M. (n.d.). "Legal Truck Loads and AASHTO Legal Loads for posting.
NCHRP Report 575. The National Academies.".
Tesfay, B. (January 2015). Implication of Axle load Limitation in Ethiopia. Addis
Ababa.
Timisoara, R. (2015). The determination and analysis of tire contact surface geometric
parameters. 151.
U.S. Department of Transportation, F. H. (February 2006). Guidelines for review and
evaluation of back calculation results.
WSP International and Transport Research Laboratory, T. (1999). " Axle load
management in Ethiopia, Ethiopian Roads Authority.".
Y.Richard Kim, F. M. (2011). Local Calibration of the MEPDG for flexible pavement
Design.

IMPACT OF TRUCK OVERLOADING ON PAVEMENT SERVICE LIFE MARCH, 2017
ADDIS ABABA SCIENCE AND TECHNOLOGY UNIVERSITY Page 64


