Embed Size (px)
Citation preview

Impact of selective grazing on plant production and qualitythrough floristic contrasts and current-year defoliationin a wet grassland
Nicolas Rossignol • Anne Bonis •
Jan-Bernard Bouzille
Received: 9 April 2010 / Accepted: 4 May 2011 / Published online: 13 May 2011
� Springer Science+Business Media B.V. 2011
Abstract Grazing impacts the structure and func-
tional properties of vegetation through floristic
changes (i.e., long-term effect) and current defolia-
tion (i.e., short-term effect). The aim of this study
was to assess the relative importance of these two
grazing effects on productivity (ANPP) and plant
quality (C/N ratio) among plant patches submitted to
a variety of grazing intensity for several years. Long-
term grazing effect was measured by comparing
ANPP and C/N ratio among plant patches with
contrasting floristic composition. Short-term impact
of grazing was measured by comparing ANPP and
C/N in plant patches, with and without defoliation.
Floristic contrasts led to a lower ANPP in highly
grazed patches than in lightly grazed ones. This result
may be related to the increasing proportion of
grazing-tolerant and grazing-avoiding species with
increasing grazing intensity. Vegetation C/N con-
trasts were recorded among grazed patches but did
not linearly relate to grazing intensity. Short-term
effect of current-year defoliation on ANPP was
limited as vegetation compensated for biomass
removal. No evidence for grazing-enhancement of
ANPP was found even at moderate grazing intensity.
Long-term floristic changes with grazing thus appeared
to be the main driving factor of variations in ANPP. In
contrast, C/N ratio showed no general and consistent
variation along the grazing gradient but varied consis-
tently depending on the community investigated, thus
suggesting an effect of the species pool available.
Keywords ANPP � Defoliation � Floristic
composition � Heterogeneous grazing �Vegetation mosaic � Vegetation quality
Introduction
Large herbivores play a major role in terrestrial
ecosystem functioning (Huntly 1991). The intensity
of grazing exerted by herbivores on grassland veg-
etation impacts the quantity and quality of available
forage. Grazing studies have reported contrasted
effects of herbivores on plant productivity and quality
of herbaceous pastures and the intensity of grazing is
considered as a key driver of change (Milchunas and
Lauenroth 1993; Baron et al. 2002; Louault et al.
2005). Contrasts in grazing intensity may be related
to stocking rates differences among paddocks but can
also occur within paddock, due to herbivore forage
selectivity. Such spatial variations of grazing
N. Rossignol (&) � A. Bonis � J.-B. Bouzille
UMR–CNRS 6553 ECOBIO, Universite de Rennes 1,
Campus de Beaulieu, 35042 Rennes Cedex, France
e-mail: [email protected]
Present Address:N. Rossignol
INRA, UR1213 Herbivores, Theix,
63122 Saint-Genes-Champanelle, France
123
Plant Ecol (2011) 212:1589–1600
DOI 10.1007/s11258-011-9932-0

intensity typically arise when herbivores recurrently
graze some areas of the grassland whereas other areas
are neglected (Adler et al. 2001). In temperate
herbaceous pastures, selective grazing was shown to
generate and maintain a mosaic of tall lightly grazed
plant patches and short highly grazed plant patches
(Bakker et al. 1984; Berg et al. 1997; Cid and
Brizuela 1998).
The effect of grazing on plant production and
quality is expected to vary between vegetation stands
submitted to different grazing intensities. Indeed, the
net impact of grazing on vegetation results from the
interaction between a long-term impact of grazing,
through herbivore-mediated floristic changes, and a
short-term impact of current defoliation which
induces physiological plant responses as well as
physical damages (Ferraro and Oesterheld 2002).
Both effects can act in similar or in opposite ways on
plant productivity and quality (McIntire and Hik
2005; Olofsson 2006) and it remains difficult to
predict the net effect of grazing on vegetation
properties.
Global studies have shown that grazing generally
promotes N-poor unpalatable species in nutrient-poor
systems (Pastor and Naiman 1992; Milchunas et al.
1995), while in nutrient-rich systems grazing pro-
motes fast-growing species with N-rich tissues
(McNaughton 1985; Holland et al. 1992). Changes
in species composition are driven by grazing intensity
as different plant groups will be promoted by
different grazing intensities and different types of
herbivores (Vesk and Westoby 2001; Diaz et al.
2007). In French temperate sub-humid pastures,
Louault et al. (2005) found that productive species,
competitive for light and with low tissue quality,
dominated in lightly grazed plots, while more inten-
sively grazed plots exhibited increased abundance of
grazing-tolerant and grazing-avoiding species. Such
long-term vegetation shifts with increasing grazing
intensity can also be accompanied by a decrease in
ANPP (Aboveground Net Primary Production)
because species adapted to grazing are generally less
productive (Milchunas and Lauenroth 1993). The
effect of grazing pressure on vegetation quality (e.g.,
N content, digestibility) would be less predictable as
grazing-adapted species could either display low
quality tissues (e.g., grazing-avoiding species) (Loi-
seau et al. 2005; Quetier et al. 2007) or high quality
tissues (e.g., grazing-tolerant species) (Briske 1996).
In contrast, current-year defoliation of herbaceous
plants (i.e., short-term effect of grazing) is expected
to enhance forage quality due to tissue renewal
(Polley and Detling 1989; Milchunas et al. 1995).
ANPP response to short-term impact of grazing (i.e.,
biomass removal) was shown to span from negative
to positive depending on defoliation intensity and
plant species (Ferraro and Oesterheld 2002) and N
resources (Hamilton et al. 1998). Current-year defo-
liation generally induces a positive effect on plant
growth, called compensatory growth. Ritchie et al.
(1998) suggested that increased ANPP is expected
when grazing both stimulates N cycling and promotes
grazing-tolerant plants with strong re-growth ability.
The study of Milchunas and Lauenroth (1993),
however, showed that grazing increased ANPP only
in a very restricted range of conditions and for
moderate intensities of grazing. Evidences for a
positive effect of herbivores on ANPP were also
found by Turner et al. (1993) and McNaughton
(1985).
Testing for multiple levels of grazing intensity is
needed to assess when plant responses to defoliation
counter balance or reinforce the modification of
vegetation properties due to vegetation changes while
such studies remain few (McIntire and Hik 2005).
Moreover, in most grazing studies, neither the
grazing intensity nor the compensatory growth due
to current-year defoliation was quantified (Milchunas
and Lauenroth 1993; McNaughton et al. 1996). In this
study the authors investigated long-term effects of
grazing (i.e., floristic changes) and short-term effects
of current-year defoliation on vegetation quality and
productivity over a range of lightly and highly grazed
patch types generated by selective grazing (Marion
et al. 2010) and found repeatedly within each of the
three plant communities occurring in the wet grass-
lands studied (Amiaud et al. 1998). Grazing intensity
exerted on each patch type was estimated by the
percentage of available forage consumed by herbi-
vores (McNaughton et al. 1996). Aboveground net
primary production (ANPP) of patch types was
estimated and C/N ratio of aboveground plant
biomass was measured as an indicator of vegetation
quality.
The authors hypothesized that (1) floristic con-
trasts will result in lower ANPP in highly grazed
patches than in lightly grazed ones; (2) current-year
defoliation will enhance ANPP in lightly grazed
1590 Plant Ecol (2011) 212:1589–1600
123
patches and decrease it in heavily grazed patches (3)
both long- and short-term grazing effects will have a
positive effect on plant quality which will be
evidenced by a decrease of plant C/N ratio.
Methods
Study area
The study area was a wet grazed grassland, situated in
the Marais Poitevin on the French Atlantic coast
(46�280 N; 1�130 W). The climate is a mild Atlantic
type. This wet grassland was reclaimed from tidal
salt-marshes in the 10th century and has since been
grazed by cattle and horses. The soil is characterized
by a clayey texture and a markedly hydromorphic
character. A topographical gradient consisting of
depressions, higher level flats and intermediate
slopes, with a maximum altitudinal range of 70 cm,
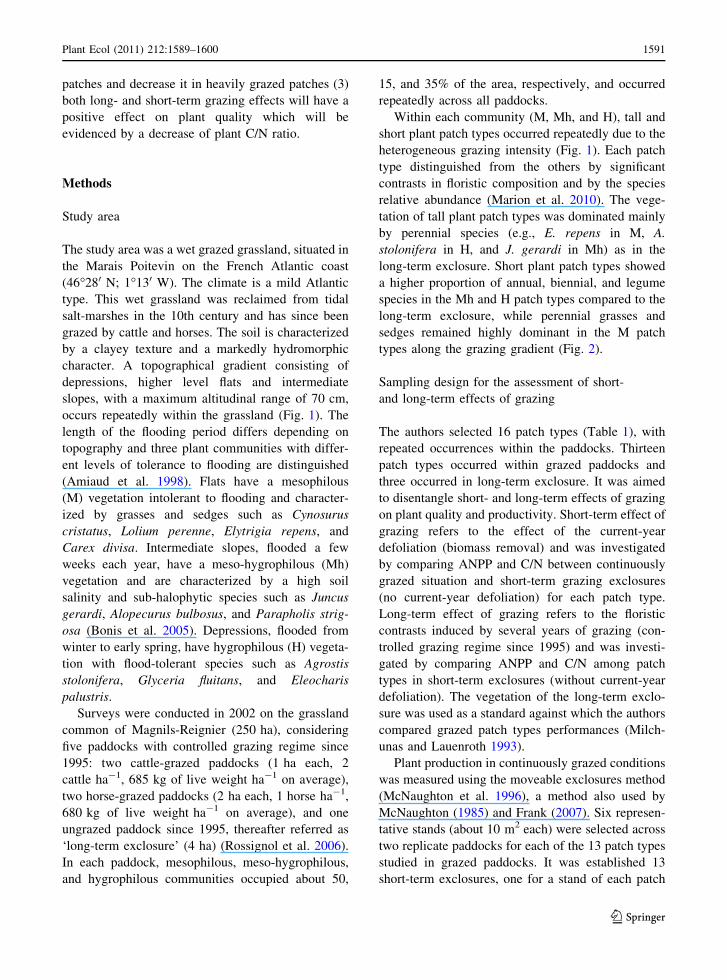
occurs repeatedly within the grassland (Fig. 1). The
length of the flooding period differs depending on
topography and three plant communities with differ-
ent levels of tolerance to flooding are distinguished
(Amiaud et al. 1998). Flats have a mesophilous
(M) vegetation intolerant to flooding and character-
ized by grasses and sedges such as Cynosurus
cristatus, Lolium perenne, Elytrigia repens, and
Carex divisa. Intermediate slopes, flooded a few
weeks each year, have a meso-hygrophilous (Mh)
vegetation and are characterized by a high soil
salinity and sub-halophytic species such as Juncus
gerardi, Alopecurus bulbosus, and Parapholis strig-
osa (Bonis et al. 2005). Depressions, flooded from
winter to early spring, have hygrophilous (H) vegeta-
tion with flood-tolerant species such as Agrostis
stolonifera, Glyceria fluitans, and Eleocharis
palustris.
Surveys were conducted in 2002 on the grassland
common of Magnils-Reignier (250 ha), considering
five paddocks with controlled grazing regime since
1995: two cattle-grazed paddocks (1 ha each, 2
cattle ha-1, 685 kg of live weight ha-1 on average),
two horse-grazed paddocks (2 ha each, 1 horse ha-1,
680 kg of live weight ha-1 on average), and one
ungrazed paddock since 1995, thereafter referred as
‘long-term exclosure’ (4 ha) (Rossignol et al. 2006).
In each paddock, mesophilous, meso-hygrophilous,
and hygrophilous communities occupied about 50,
15, and 35% of the area, respectively, and occurred
repeatedly across all paddocks.
Within each community (M, Mh, and H), tall and
short plant patch types occurred repeatedly due to the
heterogeneous grazing intensity (Fig. 1). Each patch
type distinguished from the others by significant
contrasts in floristic composition and by the species
relative abundance (Marion et al. 2010). The vege-
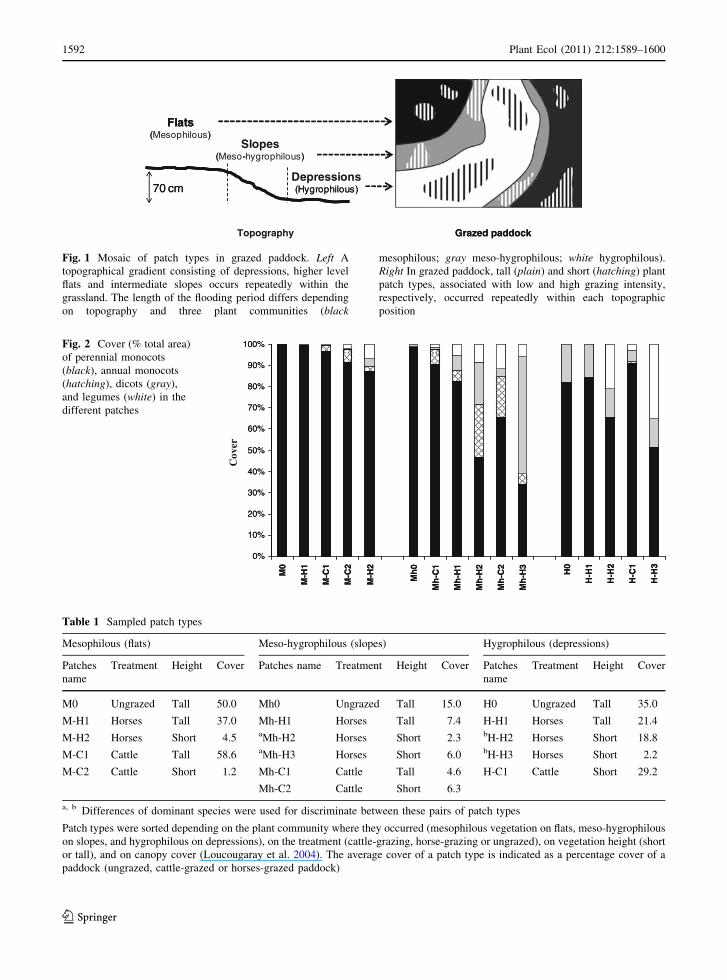
tation of tall plant patch types was dominated mainly
by perennial species (e.g., E. repens in M, A.
stolonifera in H, and J. gerardi in Mh) as in the
long-term exclosure. Short plant patch types showed
a higher proportion of annual, biennial, and legume
species in the Mh and H patch types compared to the
long-term exclosure, while perennial grasses and
sedges remained highly dominant in the M patch
types along the grazing gradient (Fig. 2).
Sampling design for the assessment of short-
and long-term effects of grazing
The authors selected 16 patch types (Table 1), with
repeated occurrences within the paddocks. Thirteen
patch types occurred within grazed paddocks and
three occurred in long-term exclosure. It was aimed
to disentangle short- and long-term effects of grazing
on plant quality and productivity. Short-term effect of
grazing refers to the effect of the current-year
defoliation (biomass removal) and was investigated
by comparing ANPP and C/N between continuously
grazed situation and short-term grazing exclosures
(no current-year defoliation) for each patch type.
Long-term effect of grazing refers to the floristic
contrasts induced by several years of grazing (con-
trolled grazing regime since 1995) and was investi-
gated by comparing ANPP and C/N among patch
types in short-term exclosures (without current-year
defoliation). The vegetation of the long-term exclo-
sure was used as a standard against which the authors
compared grazed patch types performances (Milch-
unas and Lauenroth 1993).
Plant production in continuously grazed conditions
was measured using the moveable exclosures method
(McNaughton et al. 1996), a method also used by
McNaughton (1985) and Frank (2007). Six represen-
tative stands (about 10 m2 each) were selected across
two replicate paddocks for each of the 13 patch types
studied in grazed paddocks. It was established 13
short-term exclosures, one for a stand of each patch
Plant Ecol (2011) 212:1589–1600 1591
123
70 cm
Flats(Mesophilous)
Slopes(Meso-hygrophilous)
Depressions(Hygrophilous)
Topography Grazed paddock
70 cm
Flats( )
( - )
(Hygrophilous)
Grazed paddock
Fig. 1 Mosaic of patch types in grazed paddock. Left A
topographical gradient consisting of depressions, higher level
flats and intermediate slopes occurs repeatedly within the
grassland. The length of the flooding period differs depending
on topography and three plant communities (black
mesophilous; gray meso-hygrophilous; white hygrophilous).
Right In grazed paddock, tall (plain) and short (hatching) plant
patch types, associated with low and high grazing intensity,
respectively, occurred repeatedly within each topographic
position
100%100%
10%
20%
30%
40%
50%
60%
70%
80%
90%
10%
20%
30%
40%
50%
60%
70%
80%
90%
Cov
er
0%
M0
M-H
1
M-C
1
M-C
2
M-H
2
Mh
0
Mh
-C1
Mh
-H1
Mh
-H2
Mh
-C2
Mh
-H3
H0
H-H
1
H-H
2
H-C
1
H-H
3
0%
M0
M-H
1
M-C
1
M-C
2
M-H
2
Mh
0
Mh
-C1
Mh
-H1
Mh
-H2
Mh
-C2
Mh
-H3
H0
H-H
1
H-H
2
H-C
1
H-H
3
Fig. 2 Cover (% total area)
of perennial monocots
(black), annual monocots
(hatching), dicots (gray),
and legumes (white) in the
different patches
Table 1 Sampled patch types
Mesophilous (flats) Meso-hygrophilous (slopes) Hygrophilous (depressions)
Patches
name
Treatment Height Cover Patches name Treatment Height Cover Patches
name
Treatment Height Cover
M0 Ungrazed Tall 50.0 Mh0 Ungrazed Tall 15.0 H0 Ungrazed Tall 35.0
M-H1 Horses Tall 37.0 Mh-H1 Horses Tall 7.4 H-H1 Horses Tall 21.4
M-H2 Horses Short 4.5 aMh-H2 Horses Short 2.3 bH-H2 Horses Short 18.8
M-C1 Cattle Tall 58.6 aMh-H3 Horses Short 6.0 bH-H3 Horses Short 2.2
M-C2 Cattle Short 1.2 Mh-C1 Cattle Tall 4.6 H-C1 Cattle Short 29.2
Mh-C2 Cattle Short 6.3
a, b Differences of dominant species were used for discriminate between these pairs of patch types
Patch types were sorted depending on the plant community where they occurred (mesophilous vegetation on flats, meso-hygrophilous
on slopes, and hygrophilous on depressions), on the treatment (cattle-grazing, horse-grazing or ungrazed), on vegetation height (short
or tall), and on canopy cover (Loucougaray et al. 2004). The average cover of a patch type is indicated as a percentage cover of a
paddock (ungrazed, cattle-grazed or horses-grazed paddock)
1592 Plant Ecol (2011) 212:1589–1600
123

type and floristic composition of patches was not
affected by the protection from grazing during the
study. Thirteen moveable exclosures were used to
withdraw vegetation from grazing for five successive
2-week periods. For each 2-week period, one stand
per patch type was protected from grazing and five
stands of each patch type were successively protected
during the study.
Aboveground net primary production and grazing
intensity
ANPP was measured for the three patch types in
long-term exclosure and for each of the thirteen
grazed patch types, inside and outside short-term
exclosures over five successive 2-week periods from
mid-April to end of June (i.e., during the main growth
period). In long- and short-term exclosures, ANPP
was calculated as the sum of increments in above-
ground biomass in four randomly located
25 9 25 cm2 quadrats sampled every 2 weeks, over
a 10-week period. In continuously grazed situation,
plant biomass was sampled using four quadrats
located within moveable exclosures that were moved
to new locations after 2 weeks. ANPP was calculated
as the sum of increments in aboveground biomass
during five successive periods of protection by a
moveable exclosure.
These moveable exclosures were also used to
determine the consumption (biomass uptake) by
summing differences in plant biomass measured
inside and outside moveable exclosures during each
2-week period. Grazing intensity was then calculated
as the percentage of available forage consumed over
a 10-week period with:
Grazing intensity ¼ consumption=
initial standing biomassþ ANPPð Þ:
All aboveground plant biomass samples were dried
(65�C, 48 h) before weighing.
C/N ratio
Carbon and nitrogen content of aboveground plant
biomass was measured at the peak standing crop in
grazed condition, in short-term and in long-term
exclosures, for all patch types. Three samples per
patch type were dried, ground, and analysed using a
CHN auto-analyser (Perkin Elmer).
Floristic composition
Plant species cover was recorded in July 2002 for
each patch type, using fifteen 25 9 25 cm2 quadrats.
Similarity of the floristic composition between grazed
patches and long-term exclosure was measured using
the Sørensen similarity index (Is) (Legendre and
Legendre 1998). The fifteen quadrats were averaged
for each patch type to calculate similarity indexes.
Data analysis
ANPP and C/N ratios of the patch types were
analysed using nested ANOVA with community
(M, Mh, H) as first level factor and the patch type
as nested factor (n = 64 for ANPP and n = 48 for
C/N). Datasets were analysed using ANOVA for each
community.
It was tested whether variation rates of C/N and
ANPP with grazing were related to grazing intensity
and whether these variation rates were similar or not
among patch types in the three communities. It was
calculated three indexes of relative changes of ANPP
or C/N with grazing: the net effect of grazing (NEG)
which accounts for both short- and long-term impact,
the long-term effect of grazing (LTEG) related to
floristic contrasts among patch types, and the short-
term effect of grazing (STEG) due to current-year
defoliation.
NEG¼ðcurrently grazed�average value of
long-term exclosureÞ=average value
of long-term exclosure
LTEG¼ðshort-term exclosures�average
value of long-term exclosureÞ=average value
of long-term exclosure
STEG¼ðcurrently grazed�average value of
short-term exclosuresÞ=average value
of short-term exclosure
Relative change indexes were calculated for each
replicate (n = 52 for ANPP and n = 39 for C/N) and
replicates were averaged to obtain one index value
for each patch type. The effects of community on
relative changes of ANPP and C/N ratio were
analysed using ANCOVA with grazing intensity as
covariate. For all analyses, the intensity of grazing
Plant Ecol (2011) 212:1589–1600 1593
123

refers to the value of the current intensity measured
on a patch type.
Floristic similarity between grazed patches and
long-term exclosure was analysed with community as
fixed factor and grazing intensity as covariate. The
sampling design of the study did not allow to
consider a potential effect of the paddocks in
statistical analyses. Analyses were conducted using
MINITAB 13.31 software (MINITAB Inc.).
Results
Heterogeneity of plant patches properties
within the grassland
Grazing intensity, measured as the percentage of
available forage consumed during the study, ranged
from 55 to 88% (Table 2). Hygrophilous patch types
sustained on average less grazing pressure than the
other patches with a maximum of 74% of the
production consumed while, intensively grazed patch
types in Mh and H displayed grazing intensity of 85%
(Mh-H3) and 88% (M-H2), respectively. Floristic
similarity between grazed patches and long-term
exclosure decreased along the grazing gradient
(Fig. 3) for all three communities (R2 = 0.672
F = 22.51 P = 0.001). The peak of standing crop
occurred in mid-June for all patch types and we
considered C/N values of plant biomass at this time.
ANPP and C/N ratios tended to decrease with
increasing grazing intensity, the trend being signifi-
cant for hygrophilous patch types only (Table 3).
Among patches, ANPP varied from 1.3–8.0 g
DM m-2 d-1 and C/N ratio from 17 to 31 (Fig. 4a,
b) with significant effects of the community and
patch type (Nested ANOVA with community as first-
level factor and patch as nested factor; P \ 0.05 for
all analyses and each factor).
Net effect of grazing
Net effect of grazing (NEG) on ANPP of patches was
strongly related to the intensity of grazing exerted on
each patch type (R2 = 0.464, P \ 0.01; Fig. 5c white
squares) without any significant effect of the com-
munities (Table 4). Lightly grazed patches displayed
ANPP values close to the ANPP of the long-term
exclosure vegetation; while intensively grazed
patches were significantly less productive than long-
term exclosure (Fig. 4a).
Although grazing decreased plant C/N (Table 3,
Fig. 4) overall, net effect of grazing on patch types
C/N was not significantly related to grazing intensity
(Table 4). Three mesophilous patch types (i.e., M-C1,
M-C2, and M-H2) displayed decreased C/N ratio
compared to vegetation in long-term exclosure but
had close C/N values within each other (Fig. 4b).
Hygrophilous grazed patch types tend to have lower
C/N than long-term exclosure but without statistical
differences (Fig. 4b). In meso-hygrophilous patch
types, variations of C/N ratio were important between
patch types and it was found both higher and lower
C/N values compared to long-term exclosure.
Although C/N ratios of patches tend to decrease from
lightly grazed patch types to intensively grazed ones,
intensively grazed patch type Mh-H3 did not fit with
this trend and showed a high value of C/N (Fig. 4b).
Table 2 Grazing intensity (% of available forage consumed ±SE) exerted on each patch type for the three plant community
Topography Patches name F
Mesophilous (Flats) M0a M-H1 M-C1 M-C2 M-H2
0 64.9 ± 4.9a 68.9 ± 12.7ab 86.8 ± 8.7b 88.2 ± 0.5b 2.95*
Meso-hygrophilous (Slopes) Mh0a Mh-C1 Mh-H1 Mh-H2 Mh-C2 Mh-H3
0 63.4 ± 2.8a 66.5 ± 3.0a 79.1 ± 6.0b 80.3 ± 4.9b 84.7 ± 4.6b 5.92**
Hygrophilous (Depressions) H0a H-H1 H-H2 H-C1 H-H3
0 55.1 ± 4.2a 63.6 ± 5.4ab 72.9 ± 1.6b 73.8 ± 7.4b 4.01*
a Ungrazed patches M0, Mh0, and H0 were not included in the ANOVAs
* P \ 0.05, **P \ 0.01
The last column indicates F-value of one-way ANOVA for each plant community occurring on distinct topographic position. The
same letters indicate the absence of significant differences within rows for grazing intensity (post-hoc Fisher’s tests)
1594 Plant Ecol (2011) 212:1589–1600
123

Impacts of short- and long-term effects of grazing
on plant patches properties
When protected from current-year defoliation, ANPP
variations among patch types were related to the
floristic contrasts due to long-term effect of grazing
only (LTEG, Fig. 4c). In short-term exclosures, patch
types generated by high intensities of grazing (Mh-
H2, Mh-C2, Mh-H3, and H-H3; Table 2) were found
less productive than vegetation in long-term exclo-
sure (Fig. 4c). Relative changes due to LTEG led to a
linear decrease of ANPP with grazing intensity
(Fig. 5c black squares) for all three communities
(Table 4). Short-term grazing effect linked to current-
year defoliation (STEG) tended to increase ANPP at
light intensity and to decrease it at heavy intensity
(Fig. 5a). This relation was weak (R2 = 0.04;
F = 0.47; P = 0.508) but contributed to accentuate
the linear decrease in ANPP due to long-term impact
of grazing with grazing intensity. Indeed, when
vegetation was continuously grazed, linear decrease
of ANPP with grazing intensity occurred with a
steeper slope than when vegetation was protected by
short-term grazing exclosures (Fig. 5c; white
squares). The limited impact of STEG on ANPP
showed that all patch types displayed good abilities to
compensate for loss of biomass due to current-year
defoliation, whatever its intensity. Full compensation
was mostly observed at low grazing intensity. As
grazing intensity increased, differences between net
effect and long-term effect of grazing grew. This
suggests that plants compensate only partially for
biomass losses at high grazing intensity (Fig. 5c).
Changes in vegetation quality (C/N ratio) with
grazing depended primarily on the plant community
(Table 4). No significant change of C/N ratio was
found with grazing intensity (R2 = 0.132, F = 1.67,
P = 0.223) (Fig. 5d black squares). However, floris-
tic changes with LTGE led to plant quality similar or
higher than vegetation in long-term exclosures
(Fig. 4d) while short-term effect of grazing (STEG,
Fig. 5b) spanned from negative (increased C/N) to
positive at heavy intensity (decreased C/N). The
effect of defoliation (STEG), combined with the
long-term effect of floristic changes, explained that
patch types with high plant quality were more
frequent in intensively grazed situations (Fig. 4b).
Discussion
Previous studies on extensively grazed grasslands of
the Marais Poitevin showed that grazing by large
herbivores generated a spatial heterogeneity of veg-
etation structure (Loucougaray et al. 2004; Marion
et al. 2010) and soil N mineralization rates (Rossignol
et al. 2006). It was shown here that herbivores also
induced spatial heterogeneity in vegetation properties
within the grassland studied. Both ANPP and plant
quality varied between patch types for all three plant
communities studied (M, Mh, and H). These evi-
dences strongly support the view that extensive
grazing promotes functional heterogeneity within
these grasslands.
It was found that selective grazing led to spatial
variations of grazing intensity between patch types
within each topographic position with hygrophilous
vegetation (in flooded depressions) receiving on
average less grazing pressure than the two other
positions. Herbivores were shown to graze preferen-
tially this position early in the season and to switch
toward slopes and flats as the productivity of these
two positions increase (Menard et al. 2002). It was
found a negative and linear relationship between
ANPP and grazing intensity which suggests that
variations of grazing intensity controlled the varia-
tions of ANPP. Grazing led to an overall increase of
Grazing intensity
Flo
rist
ic s
imila
rity
0
0.1
0.2
0.3
0.4
0.5
0.6
0.7
0.8
0.5 0.6 0.7 0.8 0.9 1
M-H1
M-H2
M-C2M-C1
Mh-C1
Mh-H1
Mh-H2
Mh-C2
Mh-H3
H-H1
H-H2H-H3
H-C1
R² = 0.6718p < 0.001
Fig. 3 Floristic similarity (Sørensen index) between grazed
patch types and long-term exclosure along grazing intensity
gradient. Linear regression was calculated among patches of
the three communities: mesophilous (triangles), meso-
hygrophilous (squares), and hygrophilous (circles). The
relation between floristic similarity and grazing intensity did
not differ with plant community: ANCOVA (n = 13) topo-
graphic position (df 2; F 0.47, n.s.) and grazing intensity as
covariate (df 1; F 13.28, P \ 0.01)
Plant Ecol (2011) 212:1589–1600 1595
123

Table 3 Mean ANPP and plant C/N for each topographic position (M, Mh, and H) for different durations of grazing protection
ANPP (g DM m-2 d-1) ± SD C/N Aboveground biomass ± SD
M Mh H M Mh H
Grazed 4.53 ± 2.10 a 3.29 ± 2.64 a 2.78 ± 1.58 a 23.70 ± 4.55 a 24.21 ± 4.78 a 21.21 ± 3.16 a
Short term exclosure 5.87 ± 2.09 ab 3.27 ± 2.24 a 3.05 ± 1.09 a 25.56 ± 7.70 a 21.52 ± 3.65 a 22.18 ± 4.00 a
Long-term exclosure 8.14 ± 0.22 b 7.50 ± 0.60 b 4.05 ± 1.12 a 31.48 ± 0.40 a 23.03 ± 1.20 a 27.12 ± 4.02 b
Grazed situation and short-term exclosure are the means of the patches occurring in each topographic position (The means were not
weighed by the proportion of tall and short plant patches in the area). Within each column, the difference between long- and short-
term exclosures reveals a long-term effect of grazing and the difference between short-term exclosures and grazed situations reveals a
short-term effect of current-year defoliation. The same letters indicate the absence of significant differences within columns (One-
way ANOVAs and post-hoc Tukey’s tests for each topographic position)
0
1
2
3
4
5
6
7
8
9
10
M0
M- H
1
M- C
1
M-C
2
M-H
2
Mh
0
Mh
-C1
Mh
-H1
Mh
- H2
Mh
- C2
Mh
-H3
H0
H-H
1
H-H
2
H-C
1
H-H
3
Tall Short Tall Short Tall Short
M Mh H
cc
a
b
bc
bc
abab
ba
c
c
a
ab
c
b
0
5
10
15
20
25
30
35
40
45
M0
M-H
1
M-C
1
M-C
2
M-H
2
Mh
0
Mh
-C1
Mh
- H1
Mh
-H2
Mh
-C2
Mh
-H3
H0
H-H
1
H-H
2
H-C
1
H-H
3
Tall Short Tall Short Tall Short
M Mh H
b
ab
b
ab
a
n.s.
ab
b
b
a
b
0
1
2
3
4
5
6
7
8
9
10
M0
M-H
1
M-C
1
M-C
2
M- H
2
Mh
0
Mh
-C1
Mh
- H1
Mh
-H2
Mh
-C2
Mh
-H3
H0
H-H
1
H-H
2
H-C
1
H-H
3
Tall Short Tall Short Tall Short
M Mh H
cn.s.
ab
b
a
ab
c
b
a
bb
b
Rat
ioC
/N
Rat
ioC
/N
AN
PP
(g D
M m
- 2d-
1 )A
NP
P(g
DM
m-2
d-1 )
Patch: p< 0.001 Patch: p< 0.001 Patch: p< 0.01 Patch: p< 0.001 Patch: p< 0.01 Patch: p= 0.181
Patch: p= 0.129 Patch: p< 0.001 Patch: p< 0.05 Patch: p< 0.05 Patch: p= 0.806 Patch: p= 0.05
0
5
10
15
20
25
30
35
M0
M-H
1
M-C
1
M-C
2
M-H
2
Mh
0
Mh
-C1
Mh
-H1
Mh
-H2
Mh
-C2
Mh
-H3
H0
H-H
1
H-H
2
H- C
1
H-H
3
Tall Short Tall Short Tall Short
M Mh H
b
aa
a
b
bc
a
bb
c
b
n.s.
0
1
2
3
4
5
6
7
8
9
10
M0
M- H
1
M- C
1
M-C
2
M-H
2
Mh
0
Mh
-C1
Mh
-H1
Mh
- H2
Mh
- C2
Mh
-H3
H0
H-H
1
H-H
2
H-C
1
H-H
3
Tall Short Tall Short Tall Short
M Mh H
cc
a
b
bc
bc
abab
ba
c
c
a
ab
c
b
0
5
10
15
20
25
30
35
40
45
M0
M-H
1
M-C
1
M-C
2
M-H
2
Mh
0
Mh
-C1
Mh
- H1
Mh
-H2
Mh
-C2
Mh
-H3
H0
H-H
1
H-H
2
H-C
1
H-H
3
Tall Short Tall Short Tall Short
M Mh H
b
ab
b
ab
a
n.s.
ab
b
b
a
b
0
1
2
3
4
5
6
7
8
9
10
M0
M-H
1
M-C
1
M-C
2
M- H
2
Mh
0
Mh
-C1
Mh
- H1
Mh
-H2
Mh
-C2
Mh
-H3
H0
H-H
1
H-H
2
H-C
1
H-H
3
Tall Short Tall Short Tall Short
M Mh H
cn.s.
ab
b
a
ab
c
b
a
bb
b
Rat
ioC
/N
Rat
ioC
/N
AN
PP
(g D
M m
- 2d-
1 )
Grazed
Short-term exclosures
AN
PP
(g D
M m
-2d-
1 )
Patch: p< 0.001 Patch: p< 0.001 Patch: p< 0.01 Patch: p< 0.001 Patch: p< 0.01 Patch: p= 0.181
Patch: p= 0.129 Patch: p< 0.001 Patch: p< 0.05 Patch: p< 0.05 Patch: p= 0.806 Patch: p= 0.05
0
5
10
15
20
25
30
35
M0
M-H
1
M-C
1
M-C
2
M-H
2
Mh
0
Mh
-C1
Mh
-H1
Mh
-H2
Mh
-C2
Mh
-H3
H0
H-H
1
H-H
2
H- C
1
H-H
3
Tall Short Tall Short Tall Short
M Mh H
b
aa
a
b
bc
a
bb
c
b
n.s.
A
C D
B
Fig. 4 ANPP (g Dry Matter m-2 d-1 ± SE), and C/N ratio
(±SE) between patch types in grazed situation (a and b, graybars) or in short-term exclosures (c and d, gray bars) and long-
term exclosure (black bars). Patch types are ranked in relation
to the grazing pressure within each topographic position. For
each topographic position, the differences between patch types
were tested using ANOVA (P-values are indicated on the
figure). The same letters indicate the absence of significant
differences within each topographic position (post-hoc Tukey’s
test)
1596 Plant Ecol (2011) 212:1589–1600
123

vegetation quality as in other grazed grasslands
(Milchunas et al. 1995; Sirotnak and Huntly 2000;
Olofsson and Oksanen 2002; Semmartin and Ghersa
2006) but without linear response to grazing intensity
variations.
Long-term grazing-induced vegetation changes
drive ANPP variations
The relation between ANPP and grazing intensity
appears to mainly result from floristic differences
generated by selective foraging along years. Selective
grazing by herbivores (Menard et al. 2002; Fleurance
et al. 2005) largely drives spatial heterogeneity in
vegetation structure (Adler et al. 2001; Parsons and
Dumont 2003) and can, therefore, influence overall
functioning of the ecosystem. While vegetation of the
-1
-0,8
-0,6
-0,4
-0,2
0
0,2
0,4
0,6
0,8
1
0,5 0,6 0,7 0,8 0,9 1
-1
-0,8
-0,6
-0,4
-0,2
0
0,2
0,4
0,6
0,8
1
0,5 0,6 0,7 0,8 0,9 1
-1
-0,8
-0,6
-0,4
-0,2
0
0,2
0,4
0,6
0,8
1
0,5 0,6 0,7 0,8 0,9 1
-1
-0,8
-0,6
-0,4
-0,2
0
0,2
0,4
0,6
0,8
1
0,5 0,6 0,7 0,8 0,9 1
Rel
ativ
e ch
ange
sR
elat
ive
chan
ges Short-term effect Short-term effect
Long-term effectNet effect
Long-term effectNet effect
R²= 0.270;p<0.05
R²= 0.464;p<0.01
C D
-1
-0,8
-0,6
-0,4
-0,2
0
0,2
0,4
0,6
0,8
1
0,5 0,6 0,7 0,8 0,9 1
-1
-0,8
-0,6
-0,4
-0,2
0
0,2
0,4
0,6
0,8
1
0,5 0,6 0,7 0,8 0,9 1
-1
-0,8
-0,6
-0,4
-0,2
0
0,2
0,4
0,6
0,8
1
0,5 0,6 0,7 0,8 0,9 1
-1
-0,8
-0,6
-0,4
-0,2
0
0,2
0,4
0,6
0,8
1
0,5 0,6 0,7 0,8 0,9 1
Grazing intensity Grazing intensity
Grazing intensity Grazing intensity
Ratio C/NANPPR
elat
ive
chan
ges
Rel
ativ
e ch
ange
s Short-term effectShort-term effect Short-term effectShort-term effect
Long-term effectNet effectLong-term effectNet effect
Long-term effectNet effectLong-term effectNet effect
R²= 0.270;p<0.05
R²= 0.464;p<0.01
A B
Fig. 5 Relative changes of ANPP and C/N with grazing
intensity. Short-term effect of grazing (STEG) on ANPP and
C/N ratio is expressed as the patches performances in grazed
situation compared to patches in short-term exclosures (a and
b). Long-term (c and d, black squares) and net effects (c and d,
white squares) of grazing are expressed as the performance of
patches in short-term exclosures or in grazed situation
compared to vegetation in long-term exclosures. Linear
regressions are indicated on the figures when significant (solidline long-term effect, dotted line net effect). Each point is the
mean of four replicates for the ANPP and the mean of three
replicates for C/N
Table 4 ANCOVA results testing for the changes of ANPP
and C/N of grazed patches relative to vegetation in long-term
exclosure
Source of variation d.f. Relative
changes
of ANPP
Relative
changes
of C/N
Community 2 2.70 6.14**
Grazing exposure 1 0.398 0.06
Community x grazing exposure 2 0.735 0.88
Grazing intensity (covariate) 1 12.09** 0.44
** P \ 0.01
The effects of grazing exposure (short-term exclosures
protected from current-year defoliation and continuously
grazed situations) and of plant community (mesophilous,
meso-hygrophilous or hygrophilous) were tested using
ANCOVA with the grazing intensity exerted on each patch
type as a covariate. F-values are in the table (ANPP: n = 26;
C/N: n = 26)
Plant Ecol (2011) 212:1589–1600 1597
123

three communities showed distinct floristic assem-
blages (Loucougaray et al. 2004), common trends of
vegetation changes with grazing were observed. In
long-term exclosure, all patch types were highly
dominated by tall perennial graminoid species which
are predicted to be strong competitors for light and
very productive in subhumid grasslands (Burke et al.
1998; Pucheta et al. 1998). Grazing was shown, in
various ecosystems, to generally favor annual plants
over perennial, short plants over tall plants, prostrate
over erect plants (McIntyre et al. 1995; Bullock et al.
2001; Diaz et al. 2007). Accordingly, along the grazing
gradient, competitive species were gradually replaced
by grazing-avoiding or grazing-tolerant species
(Briske 1996), like annual species, rosette species,
and legumes, which appeared less productive in this
system. Such floristic shifts could explain the observed
decline of productivity along grazing gradient.
Overall, the shift of species with increasing
grazing intensity, together with productivity changes
recorded for 1–2 ha large paddocks, were similar to
the impacts of grazing reported in larger grasslands
areas (Milchunas and Lauenroth 1993). At the local
scale studied, the authors indeed recorded as much
variation in vegetation structure, composition, and
properties (ANPP and C/N) than in large grasslands
areas.
Impact of in situ defoliation
Contrary to the expectations, ANPP was not signif-
icantly affected by short-term effect of grazing (i.e.,
current-year defoliation) and all patch types dis-
played compensatory growth abilities in response to
grazing. Such a good tolerance to grazing probably
results from the species-pool filtering by the eight
centuries-long history of grazing and most of the
species were thus likely to be grazing-tolerant
(Loucougaray et al. 2004; Bonis et al. 2005).
Ferraro and Oesterheld (2002) have reported that
plant productivity decreased less in grazing experi-
ments than in defoliation experiments conducted
under controlled conditions. Indeed, in grazing
experiments, other effects may counter-balance the
impact of biomass removal on productivity. First,
grazing prevents the canopy closure of vegetation and
then might create better light penetration (Holland
and Detling 1990). Second, compensatory growth of
defoliated plants leads to an increased demand for
nutrients (Hamilton et al. 1998) and can be supported
by nutrient returns through excreta (Maschinski and
Whitham 1989) which fits with the grazing-enhanced
soil N availability previously found in this grassland
(Rossignol et al. 2006). While the lowest effect of
current-year defoliation was found on lightly grazed
patch types, the authors did not find evidence that
plant regrowth after defoliation could enhance pro-
ductivity at moderate intensity of grazing as sug-
gested in previous studies (Milchunas and Lauenroth
1993; Ritchie et al. 1998).
Changes in plant biomass quality
The high abundance of grazing tolerant species in
these grasslands was also supported by Esmaeili et al.
(2009) and Benot et al. (2009) and can explain the
overall enhanced plant biomass quality with grazing
found in this study. However, plant quality of patch
types did not linearly increase with grazing intensity.
This suggests that the increase of plant quality due to
N-rich species was balanced by the presence of
unpalatable species with poorer tissue quality.
The consequences of herbivore-driven floristic
changes on plant biomass quality differed depending
on plant community, which is determined by topog-
raphy and flooding regime. Hence, an increased cover
of legumes occurred in heavily grazed patch types of
winter-flooded depressions and accordingly, high
grazing intensity led to vegetation with low C/N
ratio. In contrast, on slopes, replacement of compet-
itive perennial grasses by annual and dicots with
increasing grazing intensity is accompanied by the
stability in C/N ratio of aboveground biomass. This
result may be explained by the fact that grazed
patches were composed of a mixture of different life
forms showing either tolerant or escaping strategies
for responding to grazing. Accordingly Green and
Detling (2000) and Mikola et al. (2000) reported that
the impact of the grazing intensity on C/N ratio of
plant biomass is highly variable and depends on the
specific tolerance of plant species to grazing (Guitian
and Bardgett 2000).
Conclusions
Overall it was found a decrease in plant productivity
with increasing grazing intensity which resulted
1598 Plant Ecol (2011) 212:1589–1600
123

primarily from long-term effect of grazing through
floristic changes. In contrast, short-term effect of
defoliation was found of minor impact on ANPP,
without evidence of a positive effect of defoliation on
ANPP even at moderate intensities of grazing.
Vegetation, however, displayed a good tolerance to
defoliation along the grazing gradient which may be
explained by faster N cycle.
In the wet grasslands studied, grazing by cattle
and horses promoted the coexistence of tall produc-
tive plant patch types together with low swards with
high nutritive values at the scale of a management
unit (i.e., paddocks). Such grazing heterogeneity led
to functional changes among plant patches which
could contribute to the diversity of the forage
offered, both in quality and quantity. The results
thus highlight the importance of considering the
spatial heterogeneity of vegetation when evaluating
the ecological functioning and the agronomic value
of a pasture.
Acknowledgments This study was funded by the Parc
Interregional du Marais Poitevin. The authors particularly thank
Didier Naudon and Sebastien Cosson for their assistance. This is
part of the program GDR CNRS 2574 ‘‘UTILITERRES’’ and
program ECCO GEOTRAITS. A previous version of this
manuscript was improved by the comments made by Dr. JL Firn
and two anonymous reviewers. Thanks to Stephane Barbier,
Aurelie Josset, and Anthony Pingray for their help in the field.
References
Adler PB, Raff DA, Lauenroth WK (2001) The effect of
grazing on the spatial heterogeneity of vegetation. Oeco-
logia 128:465–479
Amiaud B, Bouzille J-B, Tournade F, Bonis A (1998) Spatial
patterns of soil salinities in old embanked marshlands in
Western France. Wetlands 18:482–494
Bakker JP, de Leeuw J, van Wieren SE (1984) Micro-patterns
in grassland vegetation created and sustained by sheep-
grazing. Vegetatio 55:153–161
Baron VS, Mapfumo E, Dick AC, Naeth MA, Okine EK,
Chanasyk DS (2002) Grazing intensity impacts on pasture
carbon and nitrogen flow. J Range Manag 55:535–541
Benot ML, Mony C, Puijalon S, Esmaeili MM, van Alphen JM,
Bouzille J-B, Bonis A (2009) Responses of clonal archi-
tecture to experimental defoliation: a comparative study
between ten grassland species. Plant Ecol 201:621–630
Berg G, Esselink P, Groeneweg M, Kiehl K (1997) Micro-
patterns in Festuca rubra-dominated salt-marsh vegeta-
tion induced by sheep grazing. Plant Ecol 132:1–14
Bonis A, Bouzille J-B, Amiaud B, Loucougaray G (2005) Plant
community patterns in old embanked grasslands and the
survival of the halophytic flora. Flora 200:74–87
Briske DD (1996) Strategies of plant survival in grazed sys-
tems: a functional interpretation. In: Hodgson J, Illius AW
(eds) The ecology and management of grazing systems.
CAB International, Wallingford, pp 37–68
Bullock JM, Franklin J, Stevenson MJ, Silvertown J, Coulson
SJ, Gregory SJ, Tofts R (2001) A plant trait analysis of
responses to grazing in a long-term experiment. J Appl
Ecol 38:253–267
Burke IC, Lauenroth WK, Vinton MA, Hook PB, Kelly RH,
Epstein HE, Aguiar MR, Robles MD, Aguilera MO,
Murphy KL, Gill RA (1998) Plant-soil interactions in
temperate grasslands. Biogeochemistry 42:121–143
Cid MS, Brizuela MA (1998) Heterogeneity in tall fescue
pastures created and sustained by cattle grazing. J Range
Manag 51:644–649
Diaz S, Lavorel S, McIntyre S, Falczuk V, Casanoves F,
Milchunas DG, Skarpe C, Rusch G, Sternberg M, Noy-
Meir I, Landsberg J, Zhang W, Clark H, Campbell BD
(2007) Plant traits responses to grazing—a global syn-
thesis. Glob Change Biol 12:1–29
Esmaeili MM, Bonis A, Bouzille J-B, Mony C, Benot M-L
(2009) Consequence of ramet defoliation on plant clonal
propagation and biomass allocation: example of five rhi-
zomatous grassland species. Flora 204:25–33
Ferraro DO, Oesterheld M (2002) Effect of defoliation on grass
growth. A quantitative review. Oikos 98:125–133
Fleurance G, Duncan P, Fritz H, Cabaret J, Gordon IJ (2005)
Importance of nutritional and anti-parasite strategies in
the foraging decisions of horses: an experimental test.
Oikos 110:602–612
Frank DA (2007) Drought effects on above- and belowground
production of a grazed temperate grassland ecosystem.
Oecologia 152:131–139
Green RA, Detling JK (2000) Defoliation-induced enhance-
ment of total aboveground nitrogen yield of grasses.
Oıkos 91:280–284
Guitian R, Bardgett RD (2000) Plant and soil microbial
responses to defoliation in temperate semi-natural grass-
land. Plant Soil 220:271–277
Hamilton EWI, Giovannini MS, Moses SA, Coleman JS,
McNaughton SJ (1998) Biomass and mineral element
responses of a Serengeti short-grass species to nitrogen
supply and defoliation: compensation requires a critical
[N]. Oecologia 116:407–418
Holland EA, Detling JK (1990) Plant response to herbivory and
belowground nitrogen cycling. Ecology 71:1040–1049
Holland EA, Parton WJ, Detling JK, Coppock DL (1992)
Physiological responses of plant populations to herbivory
and their consequences for ecosystem nutrient flow. Am
Nat 140:685–706
Huntly N (1991) Herbivores and the dynamics of communities
and ecosystems. Annu Rev Ecol Syst 22:477–503
Legendre P, Legendre L (1998) Numerical ecology. Elsevier,
Amsterdam
Loiseau P, Louault F, Le Roux X, Bardy M (2005) Does exten-
sification of rich grasslands alter the C and N cycles, directly
or via species composition? Basic Appl Ecol 6:275–287
Louault F, Pillar VD, Aufrere J, Garnier E, Soussana J-F
(2005) Plant traits and functional types in response to
reduced disturbance in a semi-natural grassland. J Vege-
tation Sci 16:151–160
Plant Ecol (2011) 212:1589–1600 1599
123

Loucougaray G, Bonis A, Bouzille J-B (2004) Effects of
grazing by horses and/or cattle on the diversity of coastal
grasslands in Western France. Biol Conserv 116:59–71
Marion B, Bonis A, Bouzille J-B (2010) How much do graz-
ing-induced heterogeneity impact plant diversity and
richness in wet grasslands? Ecoscience 17:229–239
Maschinski J, Whitham TG (1989) The continuum of plant
responses to herbivory, the influence of plant association,
nutrient availability and timing. Am Nat 134:1–19
McIntire EJB, Hik DS (2005) Influences of chronic and current
season grazing by collared pikas on above-ground bio-
mass and species richness in subarctic alpine meadows.
Oecologia 145:288–297
McIntyre S, Lavorel S, Tremont RM (1995) Plant life-history
attributes: their relationship to disturbance response in
herbaceous. J Ecol 83:31–44
McNaughton SJ (1985) Ecology of a grazing ecosystem: the
Serengeti. Ecol Monogr 55:259–294
McNaughton SJ, Milchunas DG, Frank DA (1996) How can
net primary productivity be measured in grazing ecosys-
tems? Ecology 77:974–977
Menard C, Duncan P, Fleurance G, Georges J-Y, Lila M (2002)
Comparative foraging and nutrition of horses and cattle in
European wetlands. J Appl Ecol 39:120–133
Mikola J, Barker GM, Wardle DA (2000) Linking above-
ground and below-ground effects in autotrophic micro-
cosms: effects of shading and defoliation on plant and soil
properties. Oıkos 89:577–587
Milchunas DG, Lauenroth WK (1993) Quantitative effects of
grazing on vegetation and soils over a global range of
environments. Ecol Monogr 63:327–366
Milchunas DG, Varnamkhasti AS, Lauenroth WK, Goetz H
(1995) Forage quality in relation to long-term grazing
history, current-year defoliation, and water resource.
Oecologia 101:366–374
Olofsson J (2006) Short- and long-term effects of changes in
reindeer grazing pressure on tundra heath vegetation.
J Ecol 94:431–440
Olofsson J, Oksanen L (2002) Role of litter decomposition for
the increased primary production in areas heavily grazed
by reindeer: a litterbag experiment. Oikos 96:507–515
Parsons AJ, Dumont B (2003) Spatial heterogeneity and
grazing processes. Animal Res 52:161–179
Pastor J, Naiman RJ (1992) Selective foraging and ecosystem
processes in boreal forests. Am Nat 139:690–705
Polley HW, Detling JK (1989) Defoliation, nitrogen and
competition: effects on plant growth and nitrogen nutri-
tion. Ecology 70:721–727
Pucheta E, Cabido M, Diaz S, Funes G (1998) Floristic com-
position, biomass, and aboveground net plant production
in grazed and protected sites in a mountain grassland of
central Argentina. Acta Oecologica 19:97–105
Quetier F, Thebault A, Lavorel S (2007) Plant traits in a state
and transition framework as markers of ecosystem
response to land-use change. Ecol Monogr 77:33–52
Ritchie ME, Tilman D, Knops JMH (1998) Herbivore effects
on plant and nitrogen dynamics in oak savanna. Ecology
79:165–177
Rossignol N, Bonis A, Bouzille J-B (2006) Consequence of
grazing pattern and vegetation structure on the spatial
variations of net N mineralisation in a wet grassland. Appl
Soil Ecol 31:62–72
Semmartin M, Ghersa CM (2006) Intraspecific changes in
plant morphology, associated with grazing, and effects on
litter quality, carbon and nutrient dynamics during
decomposition. Austral Ecol 31:99–105
Sirotnak JM, Huntly NJ (2000) Direct and indirect effects of
herbivores on nitrogen dynamics: voles in riparian areas.
Ecology 81:78–87
Turner CL, Seastedt TR, Dyer MI (1993) Maximization of
aboveground grassland production: the role of defoliation
frequency, intensity, and history. Ecol Appl 3:175–186
Vesk PA, Westoby M (2001) Predicting plant species’
responses to grazing. J Appl Ecol 38:897–909
1600 Plant Ecol (2011) 212:1589–1600
123


