Embed Size (px)
Citation preview
IEFCL -Train2 Fertilizer EIA Report
Chapter Four: Environmental Baseline 4-1
CHAPTER FOUR
DESCRIPTION OF THE ENVIRONMENT
4.1 GENERAL
The objective of the environmental baseline description is to establish the condition of
the various environmental components that are likely to be affected by the proposed
project against future occurrences as a result of the project activities. This would provide
the basis for determining the impacts of the proposed project on the environment as well
as the determination of mitigation measures. In this ESIA the environment is classified as
biophysical, social and health. The baseline conditions of the biophysical environment
(physical, chemical and biological) of the proposed field development project area, and
the socio-economic and health conditions of the communities within the project area are
described.
4.1.1 Baseline Data Acquisition Methods
The approach adopted was to obtain physical and biophysical baseline data from desktop,
field and laboratory studies, interviews and consultations with individuals /
representatives of the host communities of the proposed project area. For socio-
economic & health studies, structured questionnaires were administered to a probability
sample of households. This approach would provide adequate information for
establishing the baseline status of the environment of the study area. The study consisted
of a one-season field sampling campaign, which took place between 29 to 30th September,
2017 (Wet Season), while data collected from previous studies and compliance
monitoring authored by Indorama during the dry season were used as secondary data
(Appendix 1.3).
4.1.2 Description of Sampling Locations
The Sampling points were geo-referenced by means of Global Positioning System (GPS)
on the field. Judgment sampling was applied in the selection of study stations, taking into
account ecological features, geographical location of communities and control points in
apparently undisturbed areas. The universe of households was obtained from listing by
guides and assigned field assistants.
IEFCL -Train2 Fertilizer EIA Report
Chapter Four: Environmental Baseline 4-2
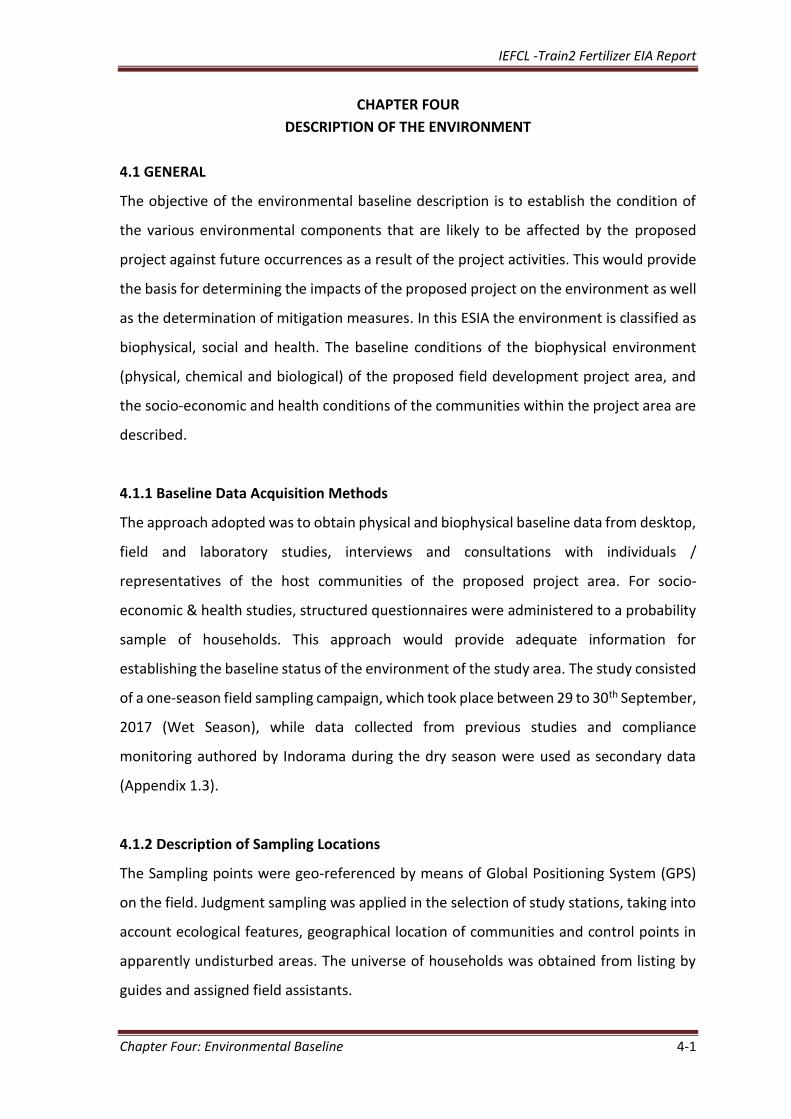
The map showing the study area with the sampling stations are shown in Appendix 4.1.
The Local Government Area and communities (Table 4.1.1) were identified within the
defined study boundary.
Table 4.1.1: Study Communities
4.1.3 Spatial Boundary for the Study
Data gathering for the baseline studies considered the following spatial boundaries:
2km radius for biophysical sampling
4km spatial boundary for socio-economic and health assessment
5km for Control samples
Geo-referencing of all sample stations.
4.1.4 Environmental components of the Study
A comprehensive description of the baseline conditions of the proposed project area was
undertaken. The scope covered:
Meteorology
Air Quality and Noise
Soil, Land use and land cover
Vegetation and Wildlife
Geology/Hydrogeology
Surface water and sediment quality
Groundwater Quality
Socio-economics
Human Health
STATE (1) LOCAL GOVERNMENT AREA (2) COMMUNITY (4)
Rivers State Eleme
Obio-Akpor
Aleto
Agbonchia
Akpajo
Elelenwo
IEFCL -Train2 Fertilizer EIA Report
Chapter Four: Environmental Baseline 4-3
4.1.5 Study Design and Methodology
The study approach included
Review of existing literature and secondary data
Ecological baseline data gathering in line with the approved Terms of Reference
(TOR) for the EIA
Biophysical Components
Field sampling and observations involved using standard methods such as:
In-situ measurements with appropriate equipment having certified calibration;
Laboratory analysis of samples using standard methods;
Quality assurance and quality control management principles.
Socioeconomics and Health Components
Key methods have been used:
Informant interviews;
Focus Group Discussion (FGD);
Direct observation;
Administration of structured questionnaires and Collection of secondary data.
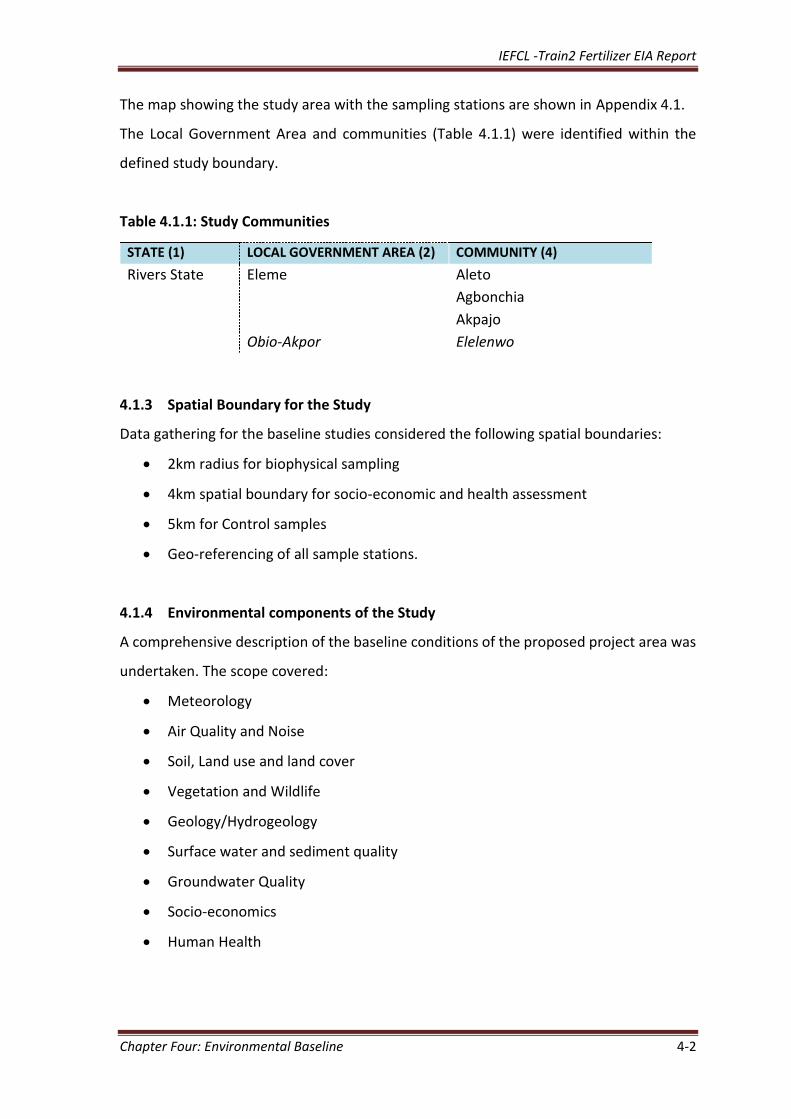
The field procedures adopted for data collection are summarized in Appendix 4.2 and the
instruments used for sampling, measurement and analysis are summarized in Table 4.1.2
below.
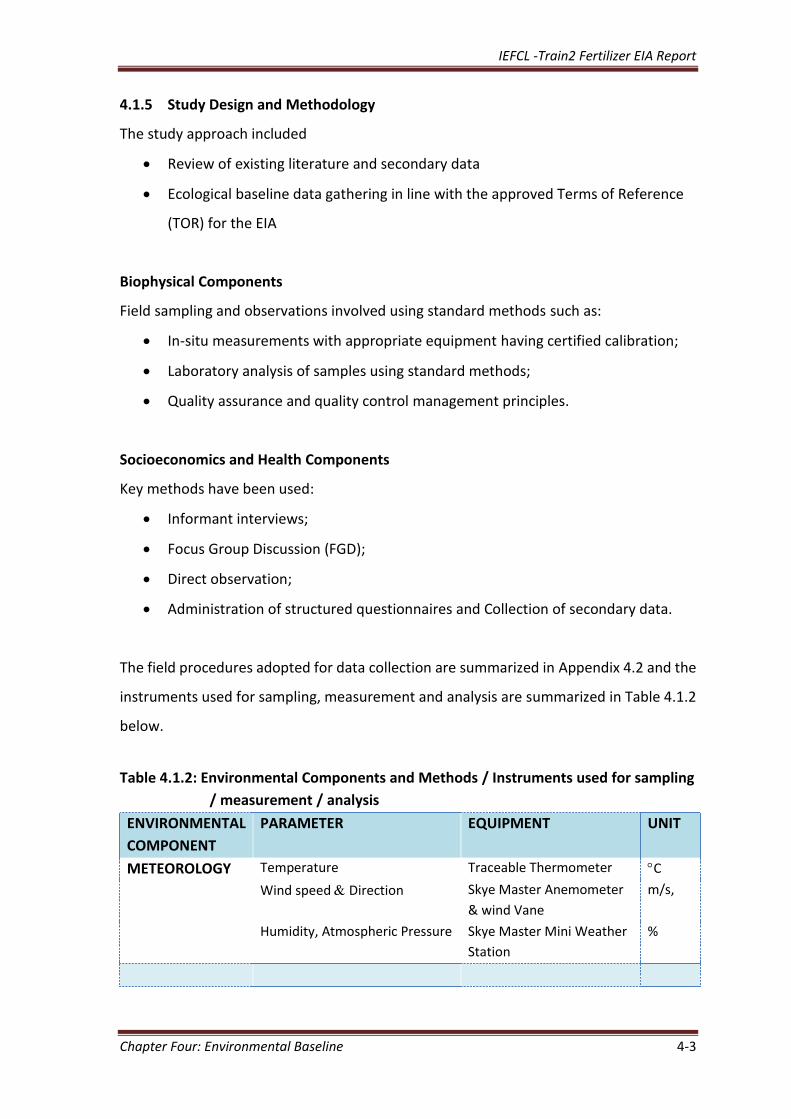
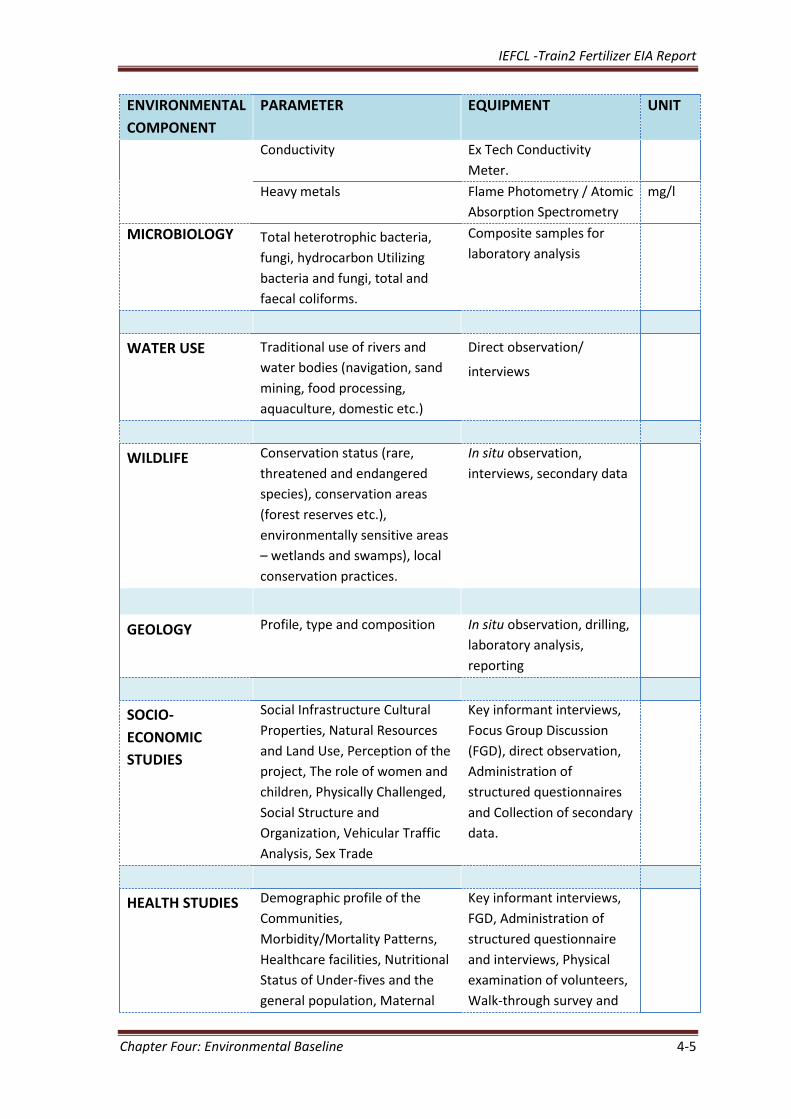
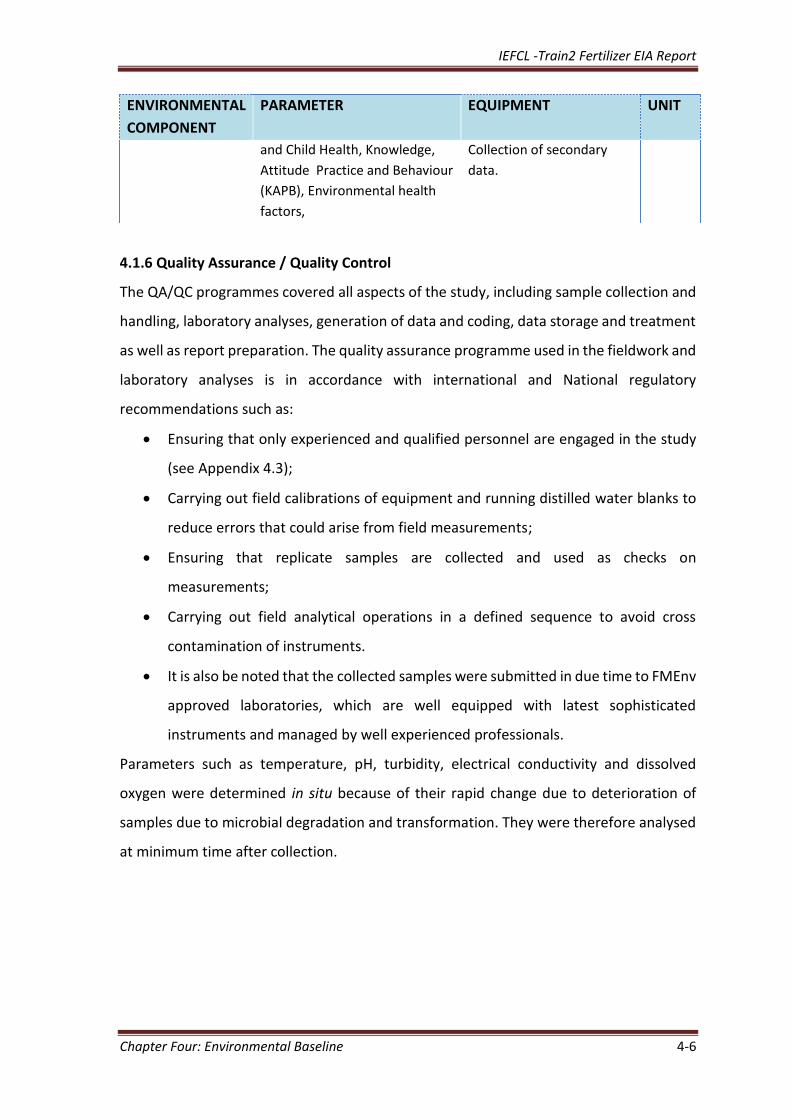
Table 4.1.2: Environmental Components and Methods / Instruments used for sampling
/ measurement / analysis
ENVIRONMENTAL
COMPONENT
PARAMETER EQUIPMENT UNIT
METEOROLOGY Temperature Traceable Thermometer C
Wind speed Direction Skye Master Anemometer
& wind Vane
m/s,
Humidity, Atmospheric Pressure Skye Master Mini Weather
Station
%
IEFCL -Train2 Fertilizer EIA Report
Chapter Four: Environmental Baseline 4-4
ENVIRONMENTAL
COMPONENT
PARAMETER EQUIPMENT UNIT
AIR QUALITY Suspended Particulate Matter Met One Instrument
Aerosol Mass Monitor
mg/m3
Nitrogen Oxides Testo 350 XL Gas Analyser ppm
Sulphur Oxides Testo 350 XL Gas Analyser ppm
Carbon Monoxides Testo 350 XL Gas Analyser ppm
VOC/HC Testo 350 XL Gas Analyser ppm
Heavy Metals Air metrics Minivol
Sampler/ Atomic
Absorption Spectrometry
ppm
NOISE Sound level Extech Sound Meter dB(A)
SOIL Sampling Stainless steel auger
pH Hannah pH meter
Electrical conductivity Hannah conductivity
meter.
µS/cm
Soil Texture Particle Size Matrix
Organic carbon Wet combustion method %
Heavy metals Digestion/Atomic
Absorption
Spectrophotometry
mg/kg
Total Hydrocarbon Content Extraction / IR
Spectrophotometry
mg/kg
VEGETATION Quadrant, Binoculars
GROUNDWATER
Niskin water sampler &
ISCO Borehole Sampler
Temperature Eco Testr pH/temperature
Meter
oC
pH Eco Testr pH meter
Total, Dissolved and Suspended
Solid
ExTech Conductivity/TDS
Meter
mg/l
Total Alkalinity HACH Digital Titration
method
mg/l
Dissolved Oxygen ExTech DO Meter mg/l
Biological oxygen Demand
(BOD5)
Winkler method mg/l
Total Hydrocarbon Content
(THC)
Extraction /
Spectrophotometer
mg/l
IEFCL -Train2 Fertilizer EIA Report
Chapter Four: Environmental Baseline 4-5
ENVIRONMENTAL
COMPONENT
PARAMETER EQUIPMENT UNIT
Conductivity Ex Tech Conductivity
Meter.
Heavy metals Flame Photometry / Atomic
Absorption Spectrometry
mg/l
MICROBIOLOGY Total heterotrophic bacteria,
fungi, hydrocarbon Utilizing
bacteria and fungi, total and
faecal coliforms.
Composite samples for
laboratory analysis
WATER USE Traditional use of rivers and
water bodies (navigation, sand
mining, food processing,
aquaculture, domestic etc.)
Direct observation/
interviews
WILDLIFE
Conservation status (rare,
threatened and endangered
species), conservation areas
(forest reserves etc.),
environmentally sensitive areas
– wetlands and swamps), local
conservation practices.
In situ observation,
interviews, secondary data
GEOLOGY Profile, type and composition In situ observation, drilling,
laboratory analysis,
reporting
SOCIO-
ECONOMIC
STUDIES
Social Infrastructure Cultural
Properties, Natural Resources
and Land Use, Perception of the
project, The role of women and
children, Physically Challenged,
Social Structure and
Organization, Vehicular Traffic
Analysis, Sex Trade
Key informant interviews,
Focus Group Discussion
(FGD), direct observation,
Administration of
structured questionnaires
and Collection of secondary
data.
HEALTH STUDIES Demographic profile of the
Communities,
Morbidity/Mortality Patterns,
Healthcare facilities, Nutritional
Status of Under-fives and the
general population, Maternal
Key informant interviews,
FGD, Administration of
structured questionnaire
and interviews, Physical
examination of volunteers,
Walk-through survey and
IEFCL -Train2 Fertilizer EIA Report
Chapter Four: Environmental Baseline 4-6
ENVIRONMENTAL
COMPONENT
PARAMETER EQUIPMENT UNIT
and Child Health, Knowledge,
Attitude Practice and Behaviour
(KAPB), Environmental health
factors,
Collection of secondary
data.
4.1.6 Quality Assurance / Quality Control
The QA/QC programmes covered all aspects of the study, including sample collection and
handling, laboratory analyses, generation of data and coding, data storage and treatment
as well as report preparation. The quality assurance programme used in the fieldwork and
laboratory analyses is in accordance with international and National regulatory
recommendations such as:
Ensuring that only experienced and qualified personnel are engaged in the study
(see Appendix 4.3);
Carrying out field calibrations of equipment and running distilled water blanks to
reduce errors that could arise from field measurements;
Ensuring that replicate samples are collected and used as checks on
measurements;
Carrying out field analytical operations in a defined sequence to avoid cross
contamination of instruments.
It is also be noted that the collected samples were submitted in due time to FMEnv
approved laboratories, which are well equipped with latest sophisticated
instruments and managed by well experienced professionals.
Parameters such as temperature, pH, turbidity, electrical conductivity and dissolved
oxygen were determined in situ because of their rapid change due to deterioration of
samples due to microbial degradation and transformation. They were therefore analysed
at minimum time after collection.
IEFCL -Train2 Fertilizer EIA Report
Chapter Four: Environmental Baseline 4-7
4.2 METEOROLOGY
4.2.1 Site Specific Micro Meteorology
The Climate assessment for the study environment tends to highlight the atmospheric
pattern of the study area. The assessment of climatic parameters such as rainfall,
temperature, wind speed & direction, relative humidity and cloud cover are important
baseline variables for any proposed or ongoing project activity in any place. According to
Ayoade (2008), the weather condition of study environment is determined by the
monsoon; a seasonal wind shift that brings rain (wet monsoon) via South-Westerly wind
between March and early November and usher in dry season (dry monsoon) via North-
Easterly wind between December and February. Rainfall is the main climatic variable and
there is marked alternation of wet and dry seasons in the study area. Two air masses
controls rainfall – moist Northward moving maritime air coming from the Atlantic Ocean
and the dry continental air coming from the African Landmass. The climate of Niger delta
is affected by ocean and atmospheric interactions both within and outside its
environment, in which the Inter‐Tropical Convergence Zone (ITCZ) plays a controlling
factor. The movement of the ITCZ is associated with the warm humid maritime Tropical
air mass with its South-Western winds and the hot and dry continental air mass with its
dry North-Easterly winds.
To establish the microclimatic baseline of the study area, a weather station was set up in
an open ground and allowed to run for 24 hours. The micro-meteorological data recorded
are summarized in Table 4.2.1.
IEFCL -Train2 Fertilizer EIA Report
Chapter Four: Environmental Baseline 4-8
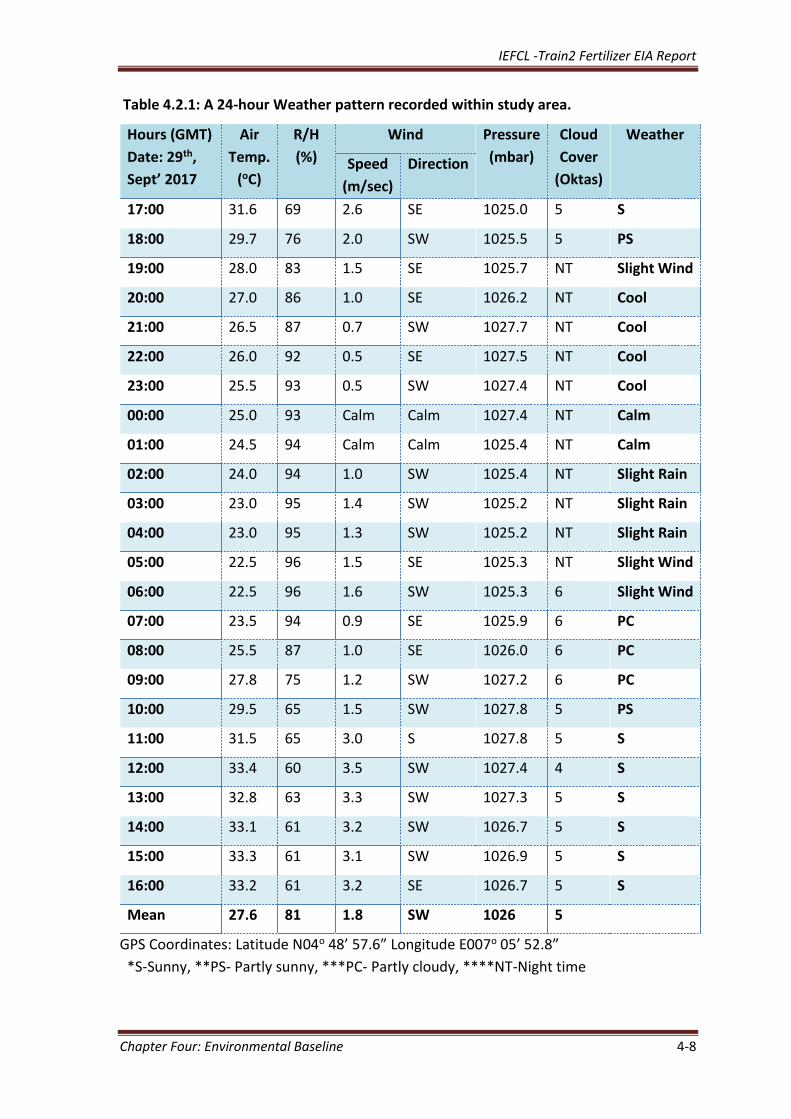
Table 4.2.1: A 24-hour Weather pattern recorded within study area.
Hours (GMT)
Date: 29th,
Sept’ 2017
Air
Temp.
(oC)
R/H
(%)
Wind Pressure
(mbar)
Cloud
Cover
(Oktas)
Weather
Speed
(m/sec)
Direction
17:00 31.6 69 2.6 SE 1025.0 5 S
18:00 29.7 76 2.0 SW 1025.5 5 PS
19:00 28.0 83 1.5 SE 1025.7 NT Slight Wind
20:00 27.0 86 1.0 SE 1026.2 NT Cool
21:00 26.5 87 0.7 SW 1027.7 NT Cool
22:00 26.0 92 0.5 SE 1027.5 NT Cool
23:00 25.5 93 0.5 SW 1027.4 NT Cool
00:00 25.0 93 Calm Calm 1027.4 NT Calm
01:00 24.5 94 Calm Calm 1025.4 NT Calm
02:00 24.0 94 1.0 SW 1025.4 NT Slight Rain
03:00 23.0 95 1.4 SW 1025.2 NT Slight Rain
04:00 23.0 95 1.3 SW 1025.2 NT Slight Rain
05:00 22.5 96 1.5 SE 1025.3 NT Slight Wind
06:00 22.5 96 1.6 SW 1025.3 6 Slight Wind
07:00 23.5 94 0.9 SE 1025.9 6 PC
08:00 25.5 87 1.0 SE 1026.0 6 PC
09:00 27.8 75 1.2 SW 1027.2 6 PC
10:00 29.5 65 1.5 SW 1027.8 5 PS
11:00 31.5 65 3.0 S 1027.8 5 S
12:00 33.4 60 3.5 SW 1027.4 4 S
13:00 32.8 63 3.3 SW 1027.3 5 S
14:00 33.1 61 3.2 SW 1026.7 5 S
15:00 33.3 61 3.1 SW 1026.9 5 S
16:00 33.2 61 3.2 SE 1026.7 5 S
Mean 27.6 81 1.8 SW 1026 5
GPS Coordinates: Latitude N04o 48’ 57.6” Longitude E007o 05’ 52.8”
*S-Sunny, **PS- Partly sunny, ***PC- Partly cloudy, ****NT-Night time
IEFCL -Train2 Fertilizer EIA Report
Chapter Four: Environmental Baseline 4-9
Rainfall Pattern
The study area is situated within the tropical wet climatic belt. In this belt, rainfall
variation is the most important parameter for the determination of season. In general,
two seasons are characteristic of the climate in the region, namely the dry and wet
seasons. In wet season, the annual distribution starts with the initial rains in March, which
ceases in late November. Typically, there are two major seasons, sometimes, heavier
rainfall than usual may occur and the rain is extended into the dry season and often the
August break may not even occur. Rainfall is the most important element of climate
change and water resources potential. It impacts almost all areas of human life such as
agriculture, health, transportation etc. The amount and distribution of rainfall in the study
area is such that it plays an important role in moving pollutants from the atmosphere to
other spheres of the environment. The mean annual rainfall for the study environment is
above 2300mm. The data retrieved from close meteorological station and shown in Table
4.2.2, present the mean monthly rainfall distribution for 30 years (1985-2015) in the study
area. Average highest rainfall peaks were attained in September (370mm), July (364mm)
and August (325mm). Lowest rainfall values were attained in January (15.3mm) and
December (19.2mm). It should be noted that rainfall is very important in managing
construction projects since it may cause erosion and erode soil particles from ground level
surfaces.
Air Temperature
Maximum and minimum onsite temperature has been 33.4C measured at 12:00GMT and
the minimum recorded was 22.5C at 05:00 & 0600 GMT (Table 4.2.1). Analysis from the
macro data shows that the months of July-September recorded lower temperatures (28-
29C) due to rainy periods while the months December to March recorded higher
temperatures (32-34C) due to intense solar radiation prevalent in the dry season (Table
4.2.2). Uko and Tamunobereton-Ari, (2013) noted that the average maximum and
minimum temperatures during the dry and wet seasons are within 31-33oC and 21-23oC
as well as 25-33oC and 18-23oC respectively. The degree of air temperature is dependent
on the amount of solar radiation received, atmospheric conditions, such as cloud cover
and humidity, which trap heat and this impacts on the stability pattern of the atmosphere
IEFCL -Train2 Fertilizer EIA Report
Chapter Four: Environmental Baseline 4-10
in the area. Port Harcourt exhibit a very stable stability class F at nights that inhibits
emission dispersion and slightly unstable/moderate stability classes C-B during the day
periods that enhances emission dispersions (Edokpa and Nwagbara 2017). Air
temperature also affects nearly all other weather parameters. For instance, air
temperature affects: the rate of evaporation, wind speed and direction, precipitation
patterns as well as the unstable, stable and neutral conditions of the atmospheric
environment. Measuring air temperature is critical to the proper identification of the
micro and macro environment of living organisms. It is especially critical for researchers
in the animal and biological sciences since ambient temperature can influence their
physiological, nutritional and behavioral status. The study environment is bounded
heavily by open vegetation areas and this modifies ambient temperature. Ansari (2003)
noted that the major parts of a healthy environment are vegetation associated with area.
He emphasized that vegetation improves the environment by lowering the maximum
temperature and increasing the minimum temperature most especially in locations of
increased elevation. When air passes through vegetation it cools and obtains moisture
which when mixed with the open environment reduces temperature thereby generating
was is referred to as local precipitation (Ansari, 2003). Ayoade (2004) highlighted that the
features which impact the distribution of temperature at any location include: the amount
of insulation received, nature of the surface, distance from water bodies, relief, nature of
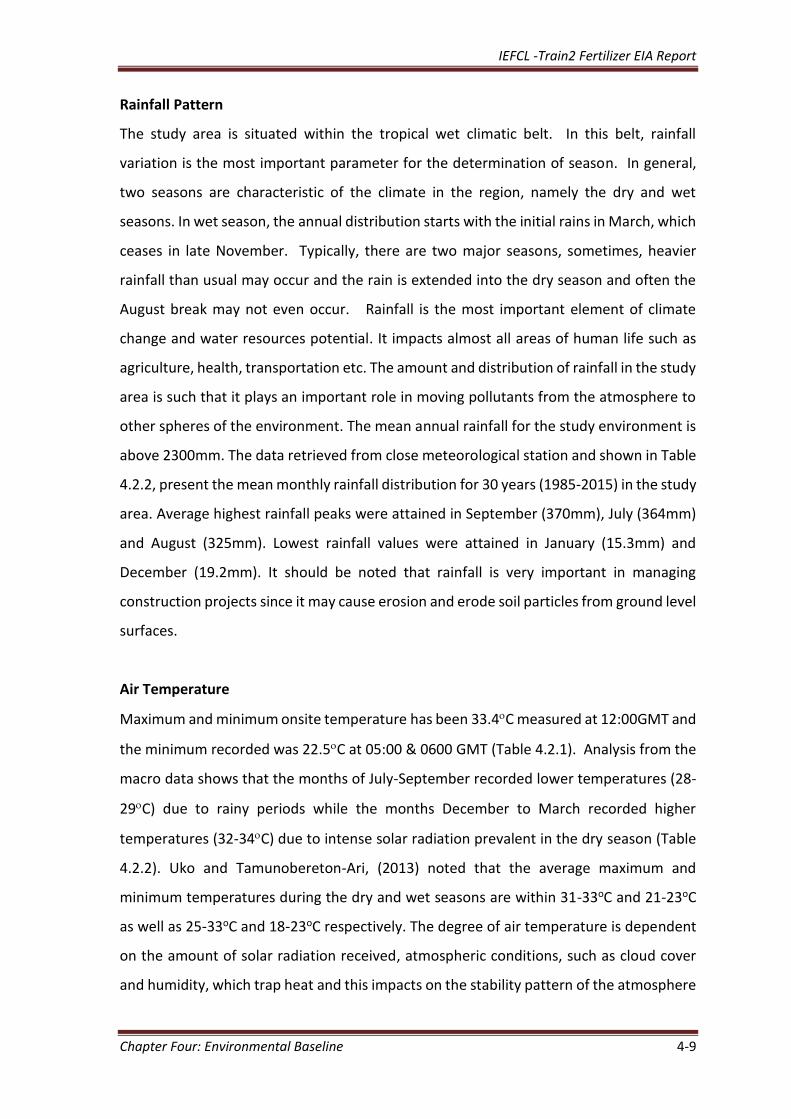
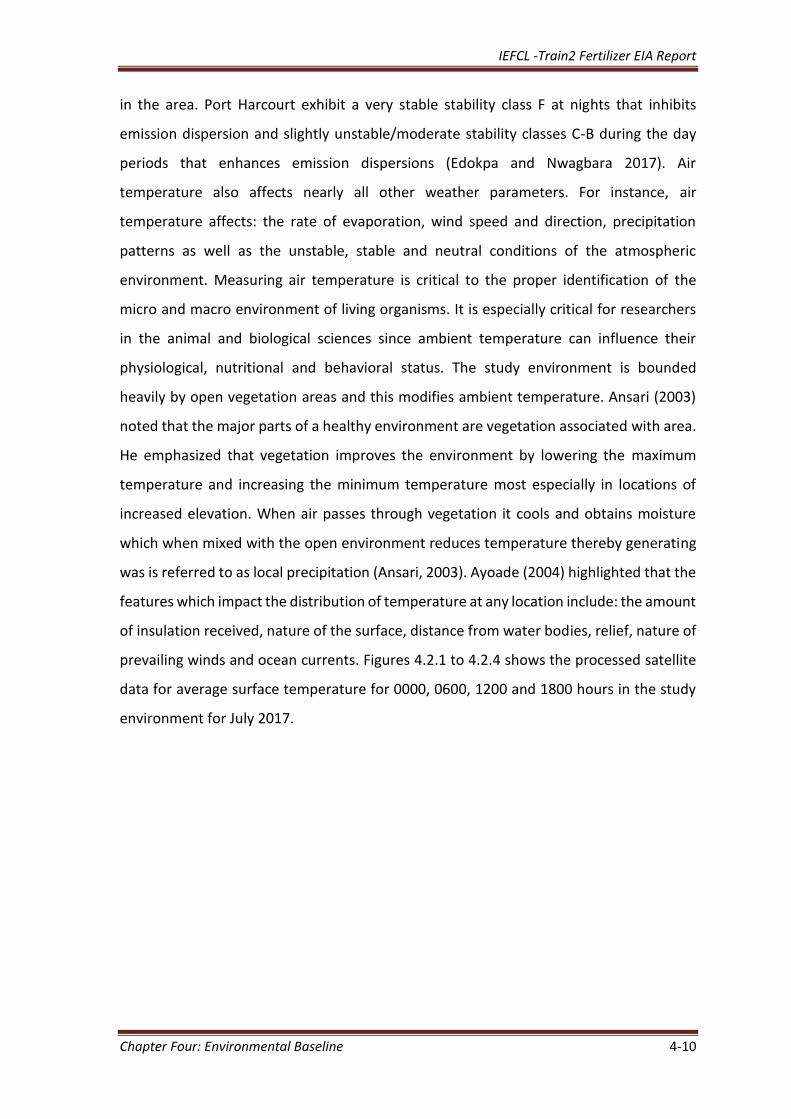
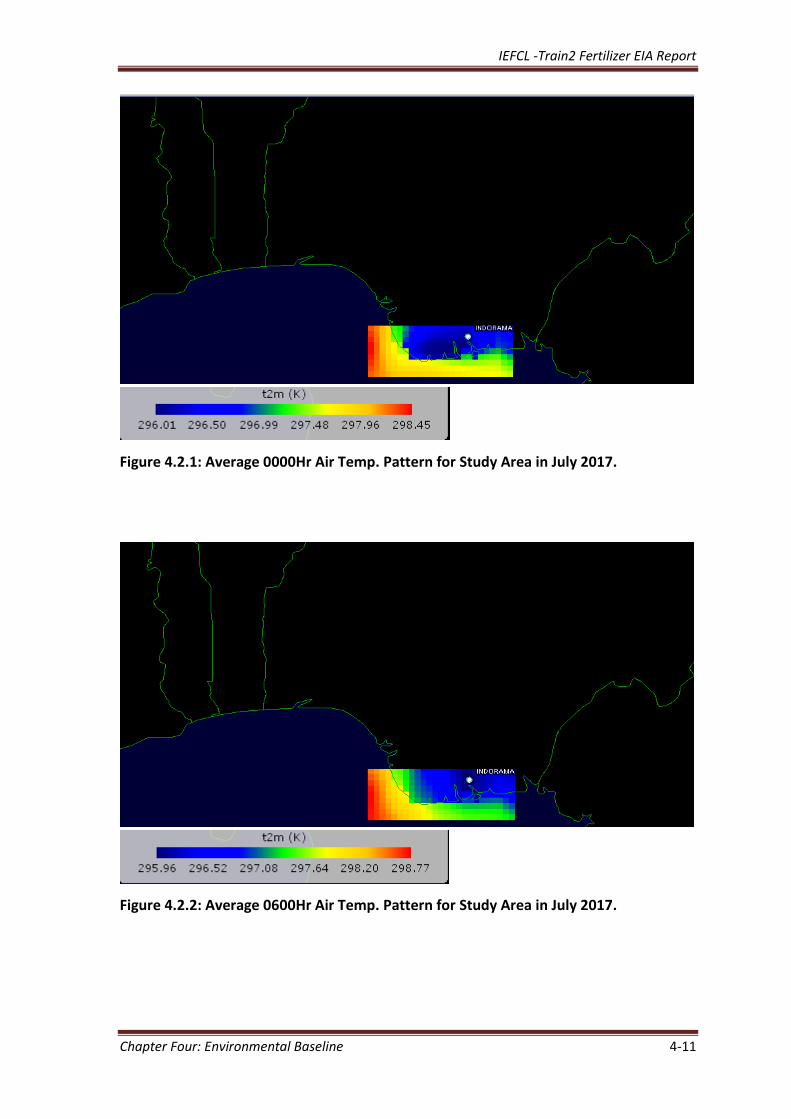
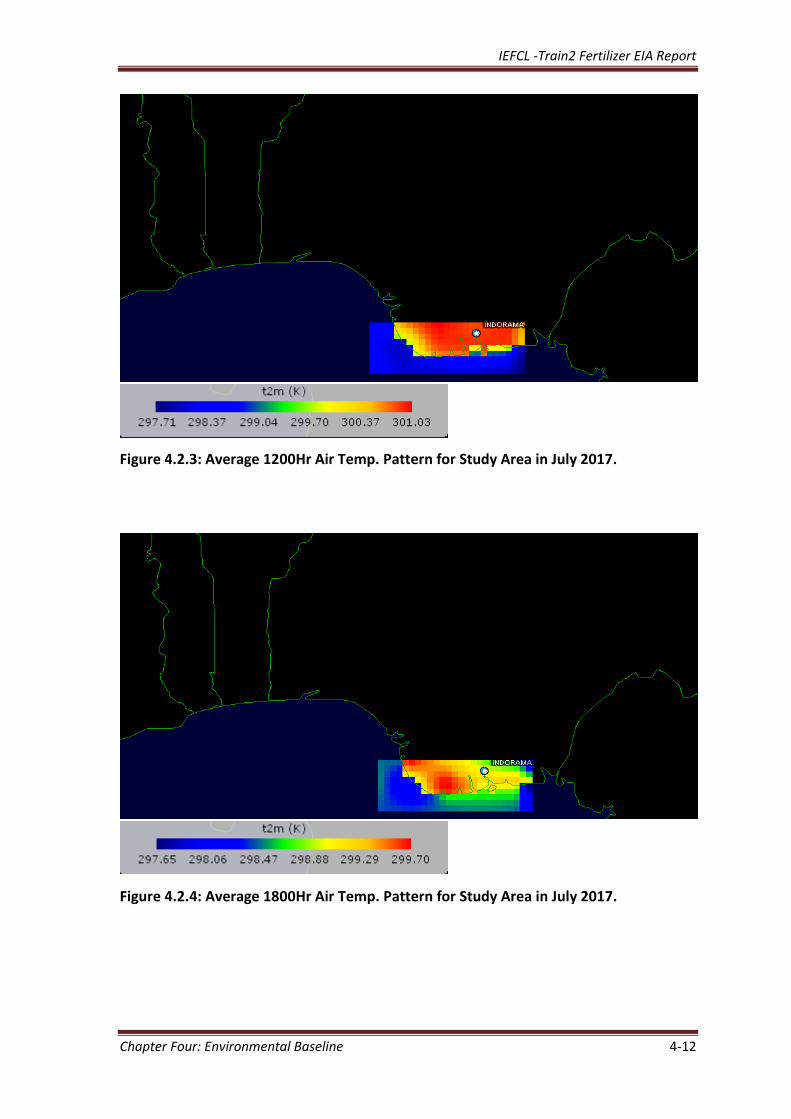
prevailing winds and ocean currents. Figures 4.2.1 to 4.2.4 shows the processed satellite
data for average surface temperature for 0000, 0600, 1200 and 1800 hours in the study
environment for July 2017.
IEFCL -Train2 Fertilizer EIA Report
Chapter Four: Environmental Baseline 4-11
Figure 4.2.1: Average 0000Hr Air Temp. Pattern for Study Area in July 2017.
Figure 4.2.2: Average 0600Hr Air Temp. Pattern for Study Area in July 2017.
IEFCL -Train2 Fertilizer EIA Report
Chapter Four: Environmental Baseline 4-12
Figure 4.2.3: Average 1200Hr Air Temp. Pattern for Study Area in July 2017.
Figure 4.2.4: Average 1800Hr Air Temp. Pattern for Study Area in July 2017.
IEFCL -Train2 Fertilizer EIA Report
Chapter Four: Environmental Baseline 4-13
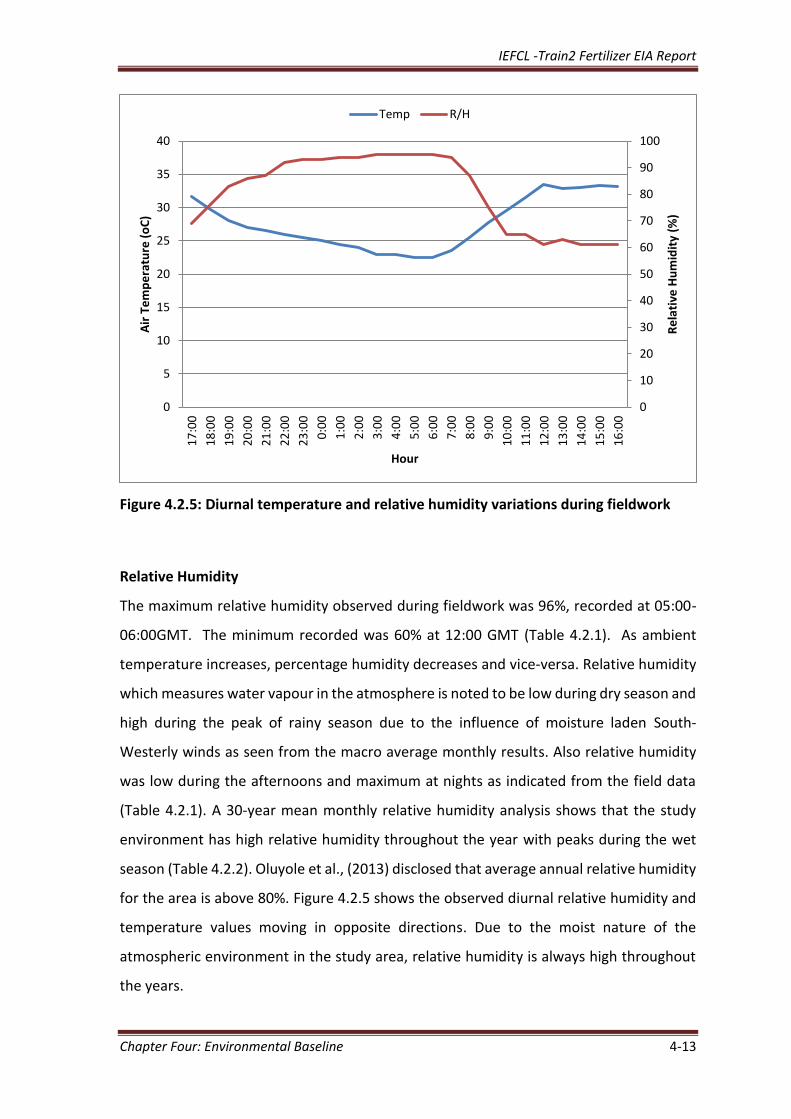
Figure 4.2.5: Diurnal temperature and relative humidity variations during fieldwork
Relative Humidity
The maximum relative humidity observed during fieldwork was 96%, recorded at 05:00-
06:00GMT. The minimum recorded was 60% at 12:00 GMT (Table 4.2.1). As ambient
temperature increases, percentage humidity decreases and vice-versa. Relative humidity
which measures water vapour in the atmosphere is noted to be low during dry season and
high during the peak of rainy season due to the influence of moisture laden South-
Westerly winds as seen from the macro average monthly results. Also relative humidity
was low during the afternoons and maximum at nights as indicated from the field data
(Table 4.2.1). A 30-year mean monthly relative humidity analysis shows that the study
environment has high relative humidity throughout the year with peaks during the wet
season (Table 4.2.2). Oluyole et al., (2013) disclosed that average annual relative humidity
for the area is above 80%. Figure 4.2.5 shows the observed diurnal relative humidity and
temperature values moving in opposite directions. Due to the moist nature of the
atmospheric environment in the study area, relative humidity is always high throughout
the years.
0
10
20
30
40
50
60
70
80
90
100
0
5
10
15
20
25
30
35
40
17
:00
18
:00
19
:00
20
:00
21
:00
22
:00
23
:00
0:0
0
1:0
0
2:0
0
3:0
0
4:0
0
5:0
0
6:0
0
7:0
0
8:0
0
9:0
0
10
:00
11
:00
12
:00
13
:00
14
:00
15
:00
16
:00
Re
lati
ve H
um
idit
y (%
)
Air
Te
mp
era
ture
(o
C)
Hour
Temp R/H
IEFCL -Train2 Fertilizer EIA Report
Chapter Four: Environmental Baseline 4-14
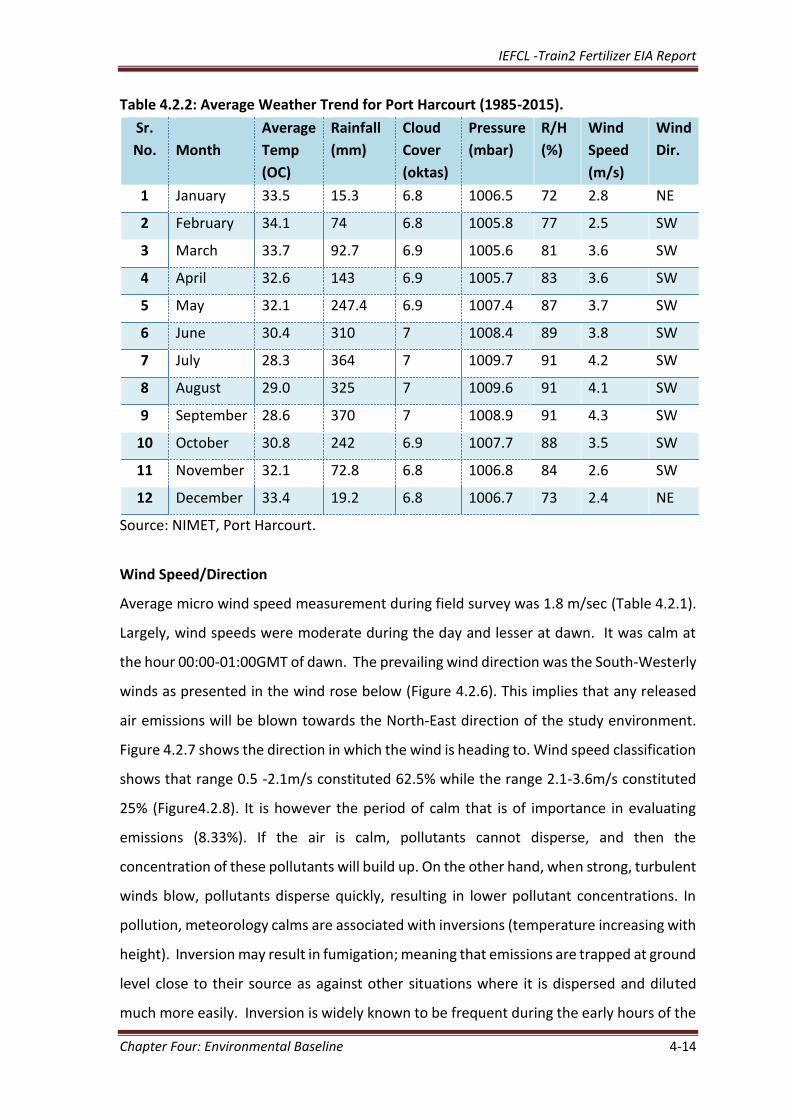
Table 4.2.2: Average Weather Trend for Port Harcourt (1985-2015).
Sr.
No.
Month
Average
Temp
(OC)
Rainfall
(mm)
Cloud
Cover
(oktas)
Pressure
(mbar)
R/H
(%)
Wind
Speed
(m/s)
Wind
Dir.
1 January 33.5 15.3 6.8 1006.5 72 2.8 NE
2 February 34.1 74 6.8 1005.8 77 2.5 SW
3 March 33.7 92.7 6.9 1005.6 81 3.6 SW
4 April 32.6 143 6.9 1005.7 83 3.6 SW
5 May 32.1 247.4 6.9 1007.4 87 3.7 SW
6 June 30.4 310 7 1008.4 89 3.8 SW
7 July 28.3 364 7 1009.7 91 4.2 SW
8 August 29.0 325 7 1009.6 91 4.1 SW
9 September 28.6 370 7 1008.9 91 4.3 SW
10 October 30.8 242 6.9 1007.7 88 3.5 SW
11 November 32.1 72.8 6.8 1006.8 84 2.6 SW
12 December 33.4 19.2 6.8 1006.7 73 2.4 NE
Source: NIMET, Port Harcourt.
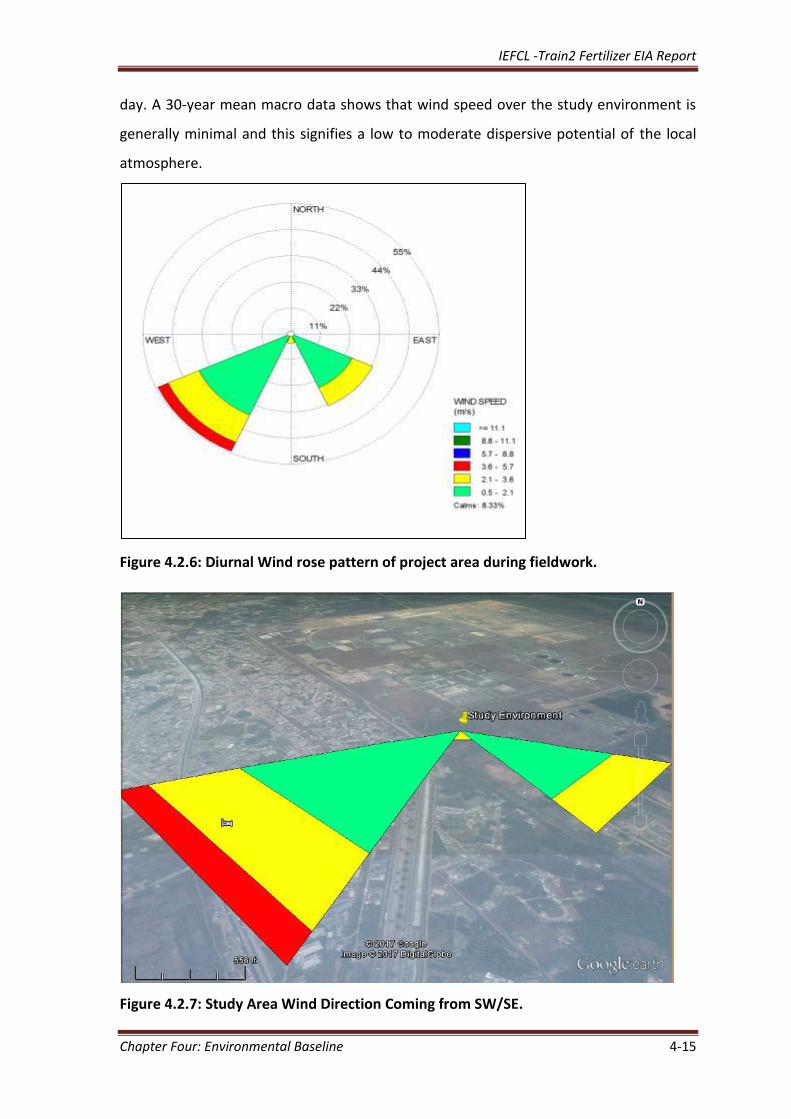
Wind Speed/Direction
Average micro wind speed measurement during field survey was 1.8 m/sec (Table 4.2.1).
Largely, wind speeds were moderate during the day and lesser at dawn. It was calm at
the hour 00:00-01:00GMT of dawn. The prevailing wind direction was the South-Westerly
winds as presented in the wind rose below (Figure 4.2.6). This implies that any released
air emissions will be blown towards the North-East direction of the study environment.
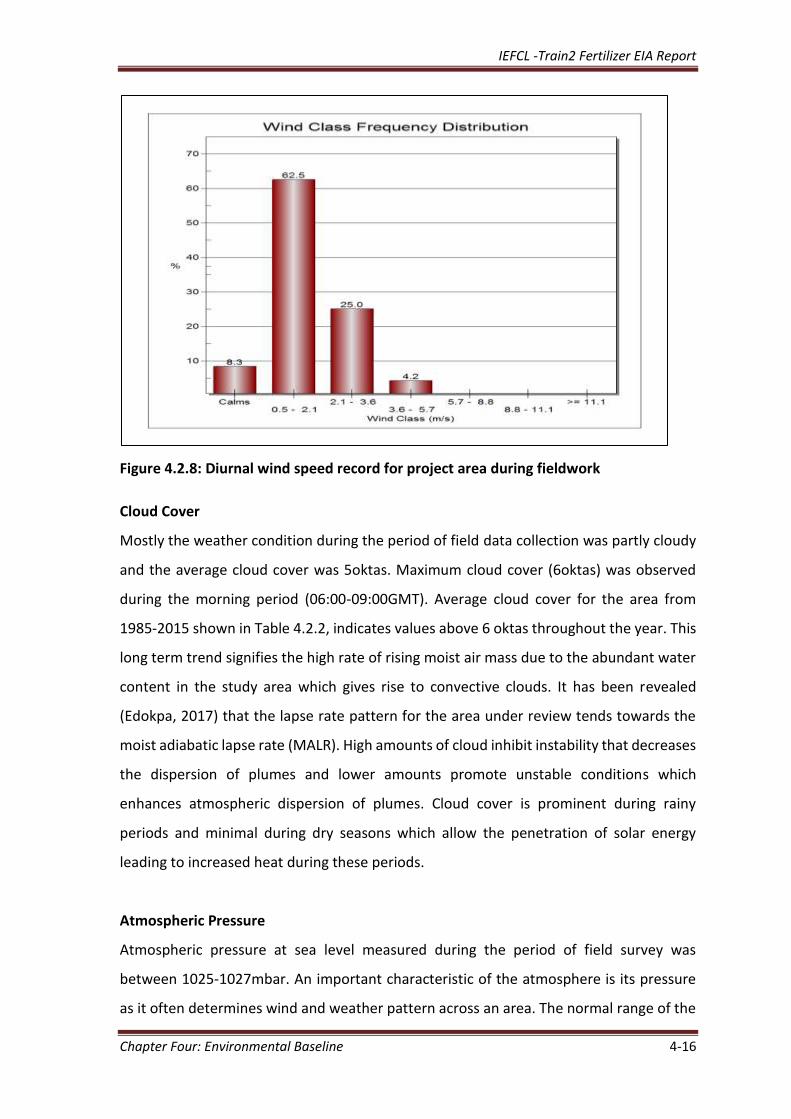
Figure 4.2.7 shows the direction in which the wind is heading to. Wind speed classification
shows that range 0.5 -2.1m/s constituted 62.5% while the range 2.1-3.6m/s constituted
25% (Figure4.2.8). It is however the period of calm that is of importance in evaluating
emissions (8.33%). If the air is calm, pollutants cannot disperse, and then the
concentration of these pollutants will build up. On the other hand, when strong, turbulent
winds blow, pollutants disperse quickly, resulting in lower pollutant concentrations. In
pollution, meteorology calms are associated with inversions (temperature increasing with
height). Inversion may result in fumigation; meaning that emissions are trapped at ground
level close to their source as against other situations where it is dispersed and diluted
much more easily. Inversion is widely known to be frequent during the early hours of the
IEFCL -Train2 Fertilizer EIA Report
Chapter Four: Environmental Baseline 4-15
day. A 30-year mean macro data shows that wind speed over the study environment is
generally minimal and this signifies a low to moderate dispersive potential of the local
atmosphere.
Figure 4.2.6: Diurnal Wind rose pattern of project area during fieldwork.
Figure 4.2.7: Study Area Wind Direction Coming from SW/SE.
IEFCL -Train2 Fertilizer EIA Report
Chapter Four: Environmental Baseline 4-16
Figure 4.2.8: Diurnal wind speed record for project area during fieldwork
Cloud Cover
Mostly the weather condition during the period of field data collection was partly cloudy
and the average cloud cover was 5oktas. Maximum cloud cover (6oktas) was observed
during the morning period (06:00-09:00GMT). Average cloud cover for the area from
1985-2015 shown in Table 4.2.2, indicates values above 6 oktas throughout the year. This
long term trend signifies the high rate of rising moist air mass due to the abundant water
content in the study area which gives rise to convective clouds. It has been revealed
(Edokpa, 2017) that the lapse rate pattern for the area under review tends towards the
moist adiabatic lapse rate (MALR). High amounts of cloud inhibit instability that decreases
the dispersion of plumes and lower amounts promote unstable conditions which
enhances atmospheric dispersion of plumes. Cloud cover is prominent during rainy
periods and minimal during dry seasons which allow the penetration of solar energy
leading to increased heat during these periods.
Atmospheric Pressure
Atmospheric pressure at sea level measured during the period of field survey was
between 1025-1027mbar. An important characteristic of the atmosphere is its pressure
as it often determines wind and weather pattern across an area. The normal range of the
IEFCL -Train2 Fertilizer EIA Report
Chapter Four: Environmental Baseline 4-17
earth’s air pressure is from 970mbar to 1050mbar. Air pressure differences across various
locations are the results of unequal heating across surfaces. This leads to wind blowing
from high pressure areas towards low pressure areas. High pressure areas are usually
associated with clear weather while low pressure areas are associated with unstable
weather conditions which generate precipitation.
IEFCL -Train2 Fertilizer EIA Report
Chapter Four: Environmental Baseline 4-18
4.3 AIR QUALITY AND NOISE
4.3.1 Air Quality
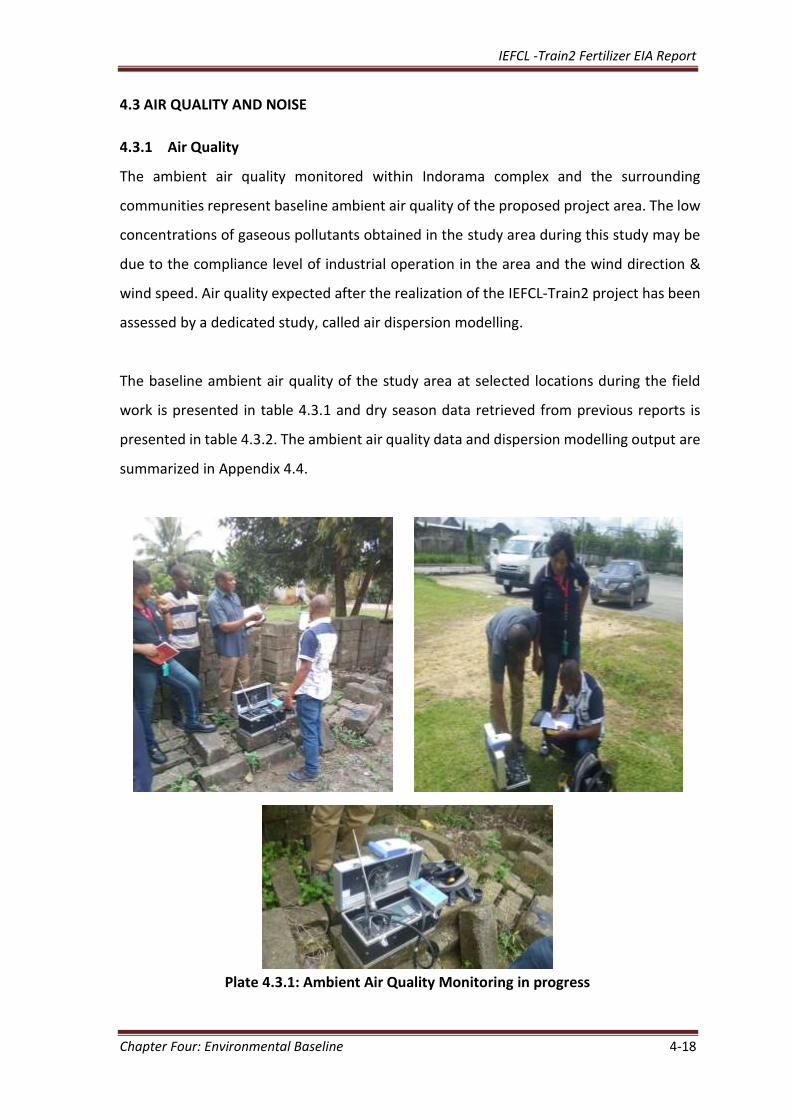
The ambient air quality monitored within Indorama complex and the surrounding
communities represent baseline ambient air quality of the proposed project area. The low
concentrations of gaseous pollutants obtained in the study area during this study may be
due to the compliance level of industrial operation in the area and the wind direction &
wind speed. Air quality expected after the realization of the IEFCL-Train2 project has been
assessed by a dedicated study, called air dispersion modelling.
The baseline ambient air quality of the study area at selected locations during the field
work is presented in table 4.3.1 and dry season data retrieved from previous reports is
presented in table 4.3.2. The ambient air quality data and dispersion modelling output are
summarized in Appendix 4.4.
Plate 4.3.1: Ambient Air Quality Monitoring in progress
IEFCL -Train2 Fertilizer EIA Report
Chapter Four: Environmental Baseline 4-19
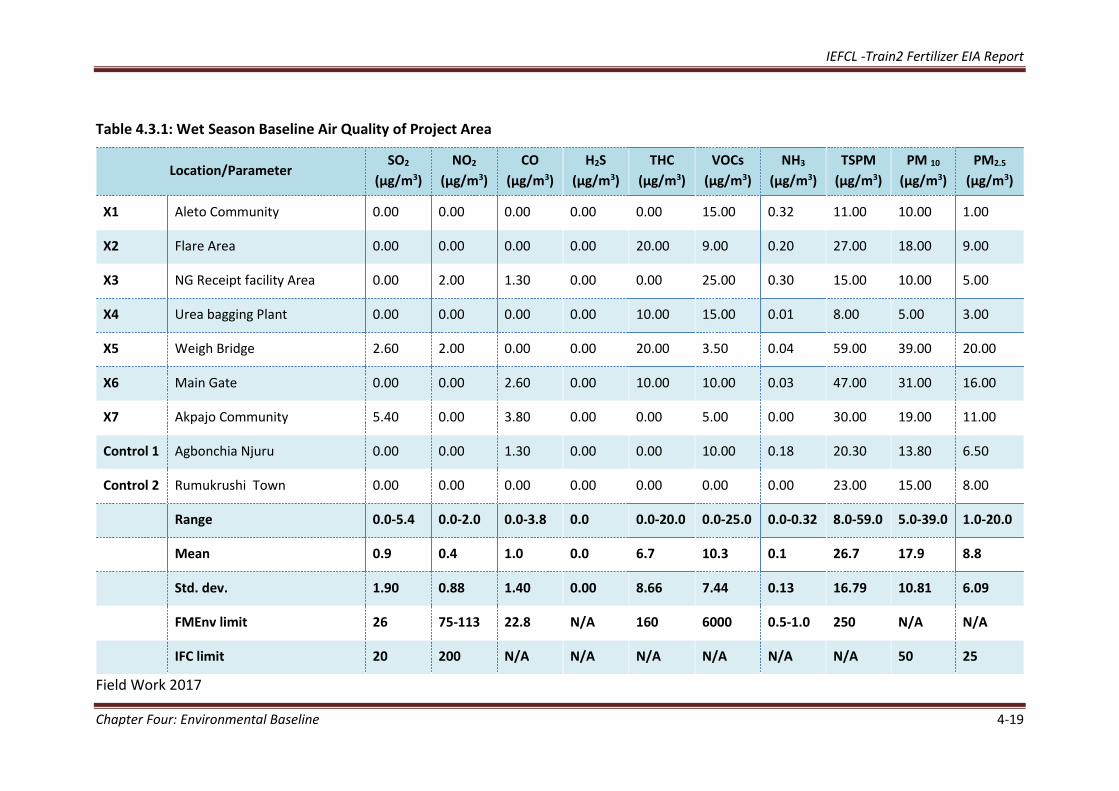
Table 4.3.1: Wet Season Baseline Air Quality of Project Area
Field Work 2017
Location/Parameter SO2
(µg/m3)
NO2
(µg/m3)
CO
(µg/m3)
H2S
(µg/m3)
THC
(µg/m3)
VOCs
(µg/m3)
NH3
(µg/m3)
TSPM
(µg/m3)
PM 10
(µg/m3)
PM2.5
(µg/m3)
X1 Aleto Community 0.00 0.00 0.00 0.00 0.00 15.00 0.32 11.00 10.00 1.00
X2 Flare Area 0.00 0.00 0.00 0.00 20.00 9.00 0.20 27.00 18.00 9.00
X3 NG Receipt facility Area 0.00 2.00 1.30 0.00 0.00 25.00 0.30 15.00 10.00 5.00
X4 Urea bagging Plant 0.00 0.00 0.00 0.00 10.00 15.00 0.01 8.00 5.00 3.00
X5 Weigh Bridge 2.60 2.00 0.00 0.00 20.00 3.50 0.04 59.00 39.00 20.00
X6 Main Gate 0.00 0.00 2.60 0.00 10.00 10.00 0.03 47.00 31.00 16.00
X7 Akpajo Community 5.40 0.00 3.80 0.00 0.00 5.00 0.00 30.00 19.00 11.00
Control 1 Agbonchia Njuru 0.00 0.00 1.30 0.00 0.00 10.00 0.18 20.30 13.80 6.50
Control 2 Rumukrushi Town 0.00 0.00 0.00 0.00 0.00 0.00 0.00 23.00 15.00 8.00
Range 0.0-5.4 0.0-2.0 0.0-3.8 0.0 0.0-20.0 0.0-25.0 0.0-0.32 8.0-59.0 5.0-39.0 1.0-20.0
Mean 0.9 0.4 1.0 0.0 6.7 10.3 0.1 26.7 17.9 8.8
Std. dev. 1.90 0.88 1.40 0.00 8.66 7.44 0.13 16.79 10.81 6.09
FMEnv limit 26 75-113 22.8 N/A 160 6000 0.5-1.0 250 N/A N/A
IFC limit 20 200 N/A N/A N/A N/A N/A N/A 50 25
IEFCL -Train2 Fertilizer EIA Report
Chapter Four: Environmental Baseline 4-20
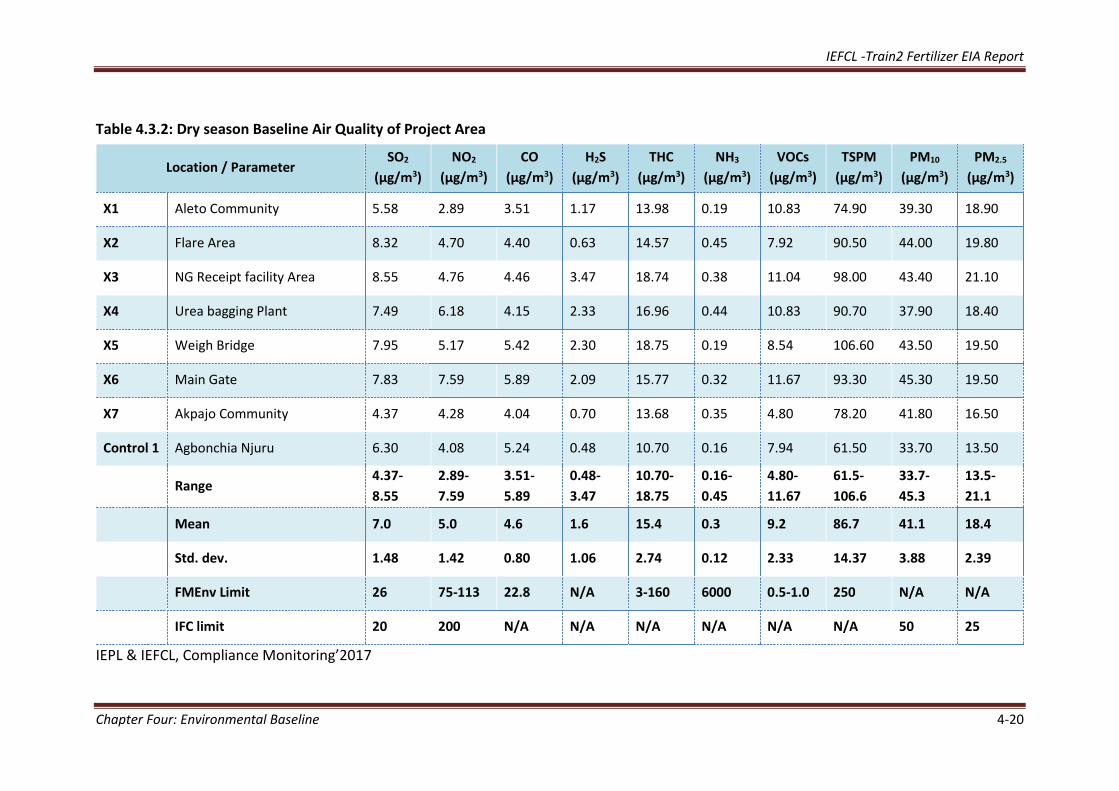
Table 4.3.2: Dry season Baseline Air Quality of Project Area
IEPL & IEFCL, Compliance Monitoring’2017
Location / Parameter SO2
(µg/m3)
NO2
(µg/m3)
CO
(µg/m3)
H2S
(µg/m3)
THC
(µg/m3)
NH3
(µg/m3)
VOCs
(µg/m3)
TSPM
(µg/m3)
PM10
(µg/m3)
PM2.5
(µg/m3)
X1 Aleto Community 5.58 2.89 3.51 1.17 13.98 0.19 10.83 74.90 39.30 18.90
X2 Flare Area 8.32 4.70 4.40 0.63 14.57 0.45 7.92 90.50 44.00 19.80
X3 NG Receipt facility Area 8.55 4.76 4.46 3.47 18.74 0.38 11.04 98.00 43.40 21.10
X4 Urea bagging Plant 7.49 6.18 4.15 2.33 16.96 0.44 10.83 90.70 37.90 18.40
X5 Weigh Bridge 7.95 5.17 5.42 2.30 18.75 0.19 8.54 106.60 43.50 19.50
X6 Main Gate 7.83 7.59 5.89 2.09 15.77 0.32 11.67 93.30 45.30 19.50
X7 Akpajo Community 4.37 4.28 4.04 0.70 13.68 0.35 4.80 78.20 41.80 16.50
Control 1 Agbonchia Njuru 6.30 4.08 5.24 0.48 10.70 0.16 7.94 61.50 33.70 13.50
Range 4.37-
8.55
2.89-
7.59
3.51-
5.89
0.48-
3.47
10.70-
18.75
0.16-
0.45
4.80-
11.67
61.5-
106.6
33.7-
45.3
13.5-
21.1
Mean 7.0 5.0 4.6 1.6 15.4 0.3 9.2 86.7 41.1 18.4
Std. dev. 1.48 1.42 0.80 1.06 2.74 0.12 2.33 14.37 3.88 2.39
FMEnv Limit 26 75-113 22.8 N/A 3-160 6000 0.5-1.0 250 N/A N/A
IFC limit 20 200 N/A N/A N/A N/A N/A N/A 50 25
IEFCL -Train2 Fertilizer EIA Report
Chapter Four: Environmental Baseline 4-21
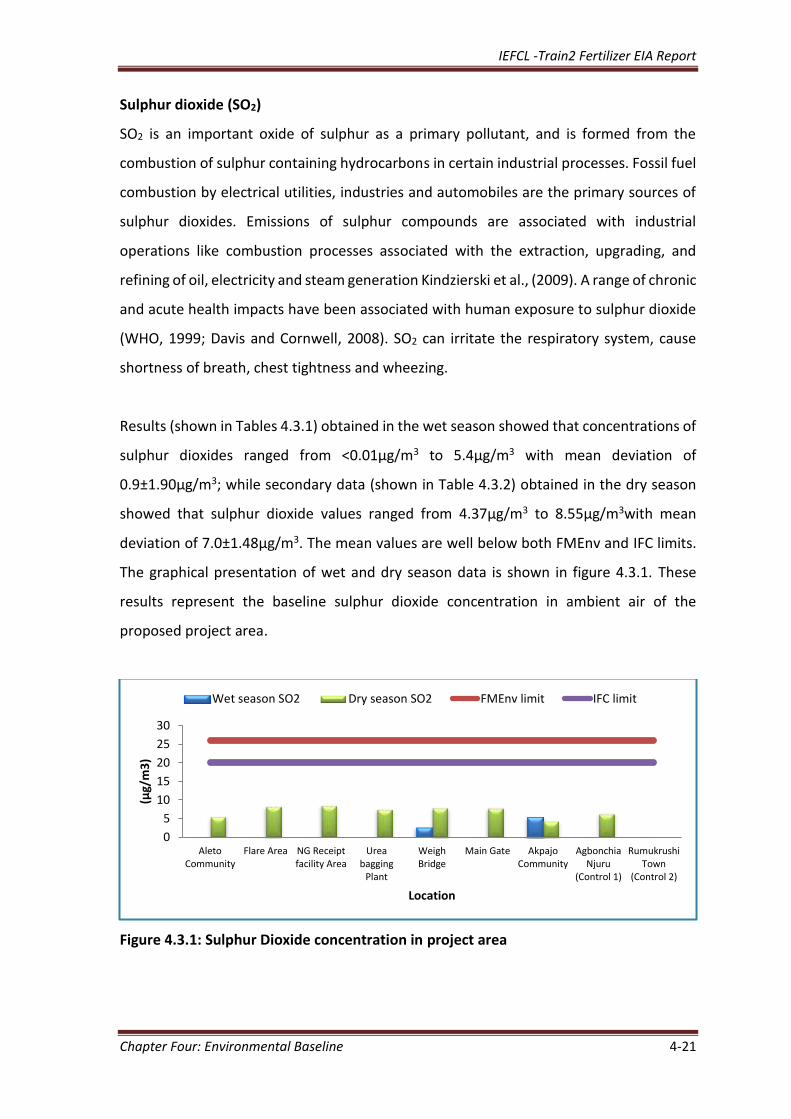
Sulphur dioxide (SO2)
SO2 is an important oxide of sulphur as a primary pollutant, and is formed from the
combustion of sulphur containing hydrocarbons in certain industrial processes. Fossil fuel
combustion by electrical utilities, industries and automobiles are the primary sources of
sulphur dioxides. Emissions of sulphur compounds are associated with industrial
operations like combustion processes associated with the extraction, upgrading, and
refining of oil, electricity and steam generation Kindzierski et al., (2009). A range of chronic
and acute health impacts have been associated with human exposure to sulphur dioxide
(WHO, 1999; Davis and Cornwell, 2008). SO2 can irritate the respiratory system, cause
shortness of breath, chest tightness and wheezing.
Results (shown in Tables 4.3.1) obtained in the wet season showed that concentrations of
sulphur dioxides ranged from <0.01µg/m3 to 5.4µg/m3 with mean deviation of
0.9±1.90µg/m3; while secondary data (shown in Table 4.3.2) obtained in the dry season
showed that sulphur dioxide values ranged from 4.37µg/m3 to 8.55µg/m3with mean
deviation of 7.0±1.48µg/m3. The mean values are well below both FMEnv and IFC limits.
The graphical presentation of wet and dry season data is shown in figure 4.3.1. These
results represent the baseline sulphur dioxide concentration in ambient air of the
proposed project area.
Figure 4.3.1: Sulphur Dioxide concentration in project area
0
5
10
15
20
25
30
AletoCommunity
Flare Area NG Receiptfacility Area
Ureabagging
Plant
WeighBridge
Main Gate AkpajoCommunity
AgbonchiaNjuru
(Control 1)
RumukrushiTown
(Control 2)
(µg/
m3
)
Location
Wet season SO2 Dry season SO2 FMEnv limit IFC limit
IEFCL -Train2 Fertilizer EIA Report
Chapter Four: Environmental Baseline 4-22
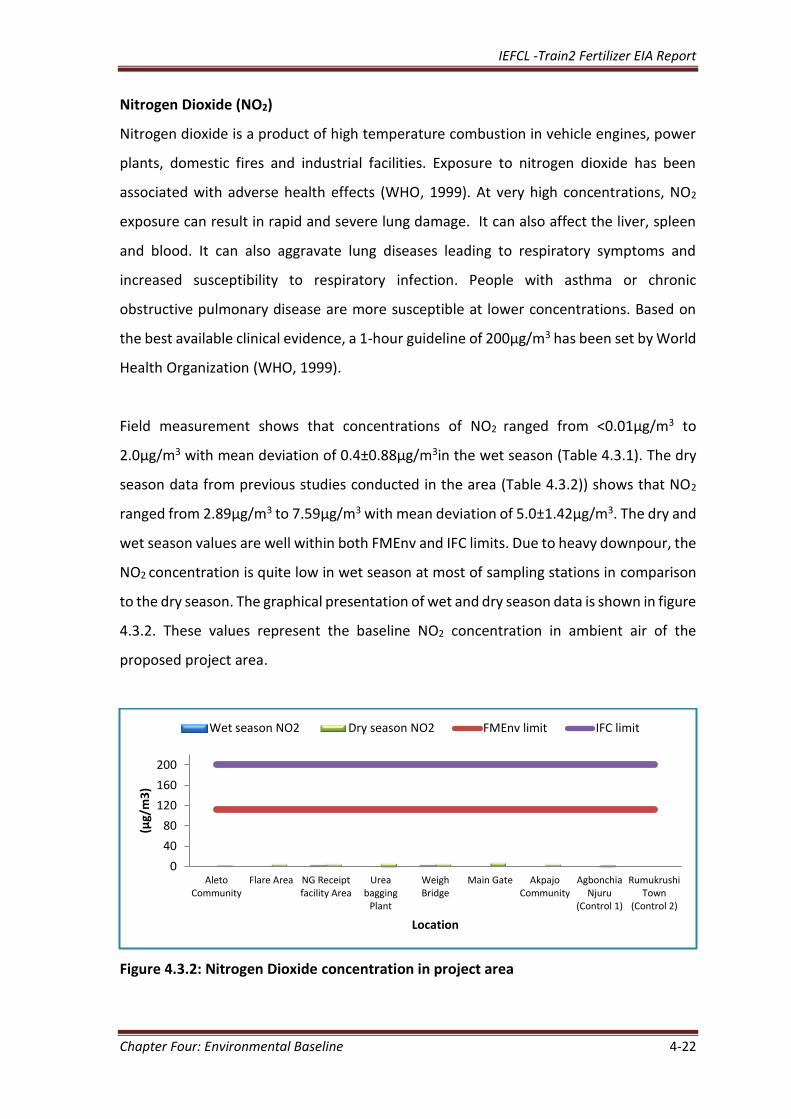
Nitrogen Dioxide (NO2)
Nitrogen dioxide is a product of high temperature combustion in vehicle engines, power
plants, domestic fires and industrial facilities. Exposure to nitrogen dioxide has been
associated with adverse health effects (WHO, 1999). At very high concentrations, NO2
exposure can result in rapid and severe lung damage. It can also affect the liver, spleen
and blood. It can also aggravate lung diseases leading to respiratory symptoms and
increased susceptibility to respiratory infection. People with asthma or chronic
obstructive pulmonary disease are more susceptible at lower concentrations. Based on
the best available clinical evidence, a 1-hour guideline of 200μg/m3 has been set by World
Health Organization (WHO, 1999).
Field measurement shows that concentrations of NO2 ranged from <0.01µg/m3 to
2.0µg/m3 with mean deviation of 0.4±0.88µg/m3in the wet season (Table 4.3.1). The dry
season data from previous studies conducted in the area (Table 4.3.2)) shows that NO2
ranged from 2.89µg/m3 to 7.59µg/m3 with mean deviation of 5.0±1.42µg/m3. The dry and
wet season values are well within both FMEnv and IFC limits. Due to heavy downpour, the
NO2 concentration is quite low in wet season at most of sampling stations in comparison
to the dry season. The graphical presentation of wet and dry season data is shown in figure
4.3.2. These values represent the baseline NO2 concentration in ambient air of the
proposed project area.
Figure 4.3.2: Nitrogen Dioxide concentration in project area
0
40
80
120
160
200
AletoCommunity
Flare Area NG Receiptfacility Area
Ureabagging
Plant
WeighBridge
Main Gate AkpajoCommunity
AgbonchiaNjuru
(Control 1)
RumukrushiTown
(Control 2)
(µg/
m3
)
Location
Wet season NO2 Dry season NO2 FMEnv limit IFC limit
IEFCL -Train2 Fertilizer EIA Report
Chapter Four: Environmental Baseline 4-23
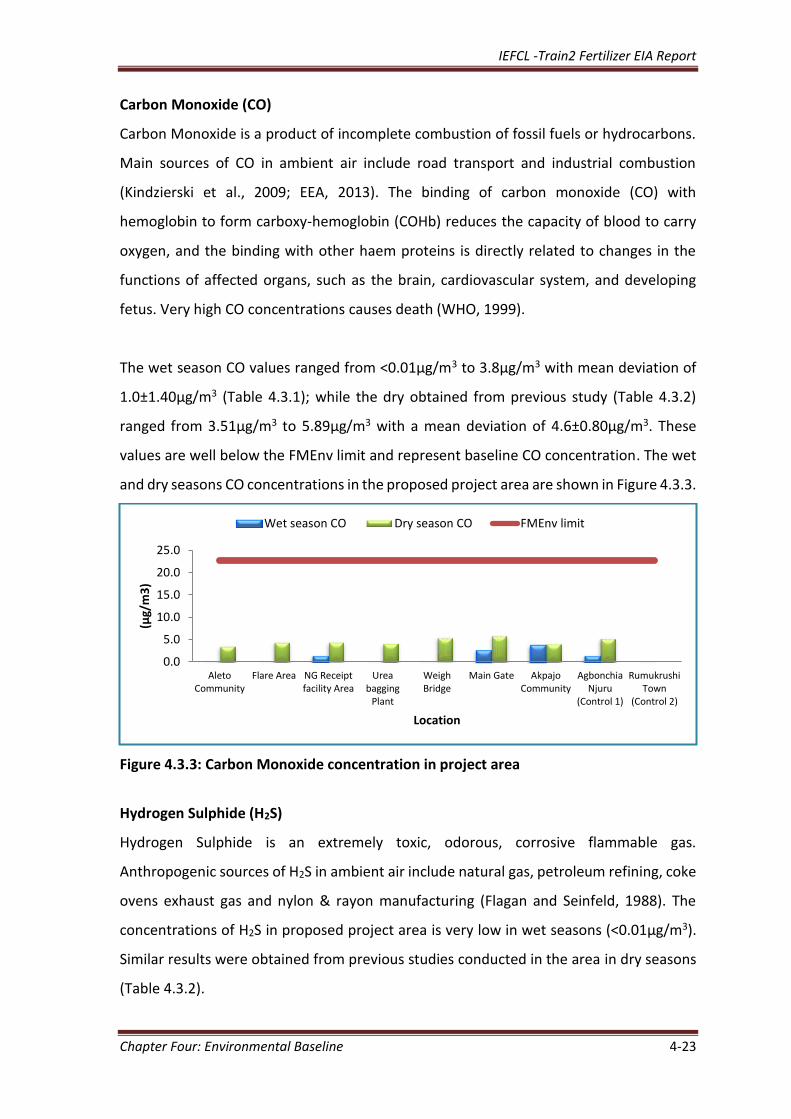
Carbon Monoxide (CO)
Carbon Monoxide is a product of incomplete combustion of fossil fuels or hydrocarbons.
Main sources of CO in ambient air include road transport and industrial combustion
(Kindzierski et al., 2009; EEA, 2013). The binding of carbon monoxide (CO) with
hemoglobin to form carboxy-hemoglobin (COHb) reduces the capacity of blood to carry
oxygen, and the binding with other haem proteins is directly related to changes in the
functions of affected organs, such as the brain, cardiovascular system, and developing
fetus. Very high CO concentrations causes death (WHO, 1999).
The wet season CO values ranged from <0.01µg/m3 to 3.8µg/m3 with mean deviation of
1.0±1.40µg/m3 (Table 4.3.1); while the dry obtained from previous study (Table 4.3.2)
ranged from 3.51µg/m3 to 5.89µg/m3 with a mean deviation of 4.6±0.80µg/m3. These
values are well below the FMEnv limit and represent baseline CO concentration. The wet
and dry seasons CO concentrations in the proposed project area are shown in Figure 4.3.3.
Figure 4.3.3: Carbon Monoxide concentration in project area
Hydrogen Sulphide (H2S)
Hydrogen Sulphide is an extremely toxic, odorous, corrosive flammable gas.
Anthropogenic sources of H2S in ambient air include natural gas, petroleum refining, coke
ovens exhaust gas and nylon & rayon manufacturing (Flagan and Seinfeld, 1988). The
concentrations of H2S in proposed project area is very low in wet seasons (<0.01µg/m3).
Similar results were obtained from previous studies conducted in the area in dry seasons
(Table 4.3.2).
0.0
5.0
10.0
15.0
20.0
25.0
AletoCommunity
Flare Area NG Receiptfacility Area
Ureabagging
Plant
WeighBridge
Main Gate AkpajoCommunity
AgbonchiaNjuru
(Control 1)
RumukrushiTown
(Control 2)
(µg/
m3
)
Location
Wet season CO Dry season CO FMEnv limit
IEFCL -Train2 Fertilizer EIA Report
Chapter Four: Environmental Baseline 4-24
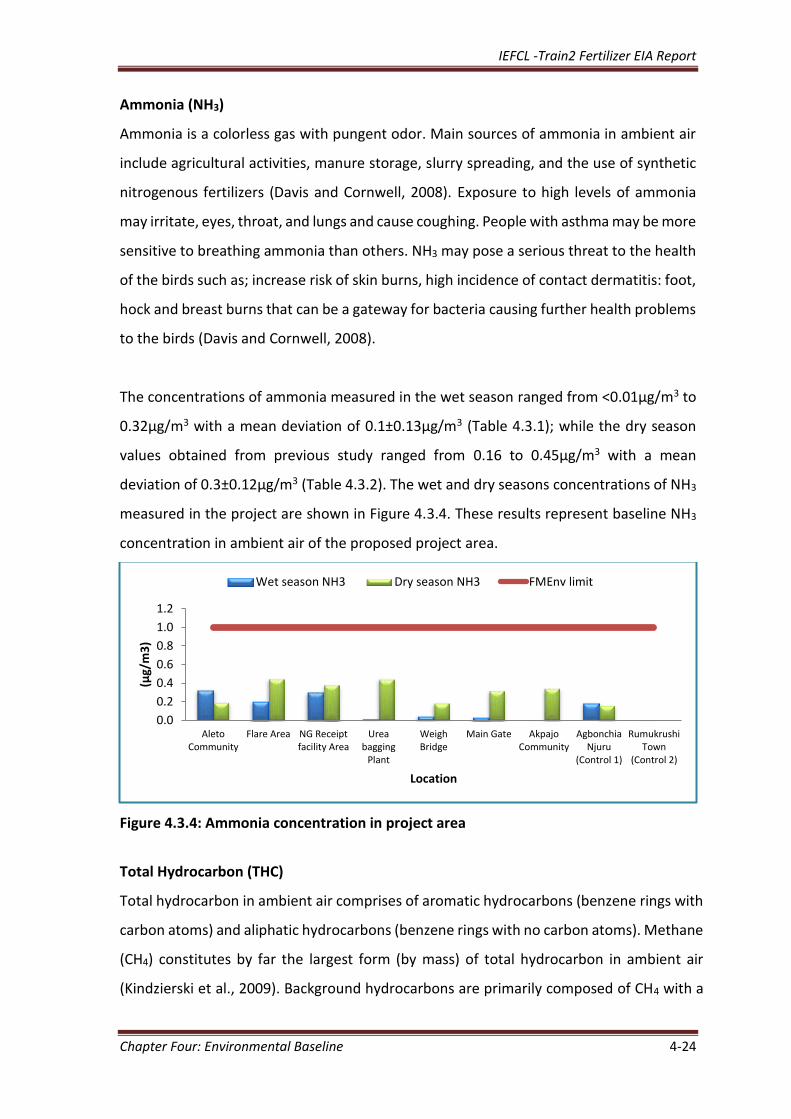
Ammonia (NH3)
Ammonia is a colorless gas with pungent odor. Main sources of ammonia in ambient air
include agricultural activities, manure storage, slurry spreading, and the use of synthetic
nitrogenous fertilizers (Davis and Cornwell, 2008). Exposure to high levels of ammonia
may irritate, eyes, throat, and lungs and cause coughing. People with asthma may be more
sensitive to breathing ammonia than others. NH3 may pose a serious threat to the health
of the birds such as; increase risk of skin burns, high incidence of contact dermatitis: foot,
hock and breast burns that can be a gateway for bacteria causing further health problems
to the birds (Davis and Cornwell, 2008).
The concentrations of ammonia measured in the wet season ranged from <0.01µg/m3 to
0.32µg/m3 with a mean deviation of 0.1±0.13µg/m3 (Table 4.3.1); while the dry season
values obtained from previous study ranged from 0.16 to 0.45µg/m3 with a mean
deviation of 0.3±0.12µg/m3 (Table 4.3.2). The wet and dry seasons concentrations of NH3
measured in the project are shown in Figure 4.3.4. These results represent baseline NH3
concentration in ambient air of the proposed project area.
Figure 4.3.4: Ammonia concentration in project area
Total Hydrocarbon (THC)
Total hydrocarbon in ambient air comprises of aromatic hydrocarbons (benzene rings with
carbon atoms) and aliphatic hydrocarbons (benzene rings with no carbon atoms). Methane
(CH4) constitutes by far the largest form (by mass) of total hydrocarbon in ambient air
(Kindzierski et al., 2009). Background hydrocarbons are primarily composed of CH4 with a
0.0
0.2
0.4
0.6
0.8
1.0
1.2
AletoCommunity
Flare Area NG Receiptfacility Area
Ureabagging
Plant
WeighBridge
Main Gate AkpajoCommunity
AgbonchiaNjuru
(Control 1)
RumukrushiTown
(Control 2)
(µg/
m3
)
Location
Wet season NH3 Dry season NH3 FMEnv limit
IEFCL -Train2 Fertilizer EIA Report
Chapter Four: Environmental Baseline 4-25
small contribution from non-methane hydrocarbons (NMHCs). THC is produced by both
anthropogenic and biogenic (natural) sources. Major-anthropogenic sources include
agricultural activities, road transportation and industrial processes. Methane is an
important greenhouse gas, and also contributes to the formation of ground level ozone
(Kindzierski et al., 2009).
Health effects associated with a single exposure to hydrocarbons are asphyxiation,
narcosis (i.e. depression of the central nervous system; anesthesia), cardiac arrest and
aspiration (WHO, 1999). The acute health effects of hydrocarbon mixtures are generally
associated with exposure concentrations at thousands of ppm.
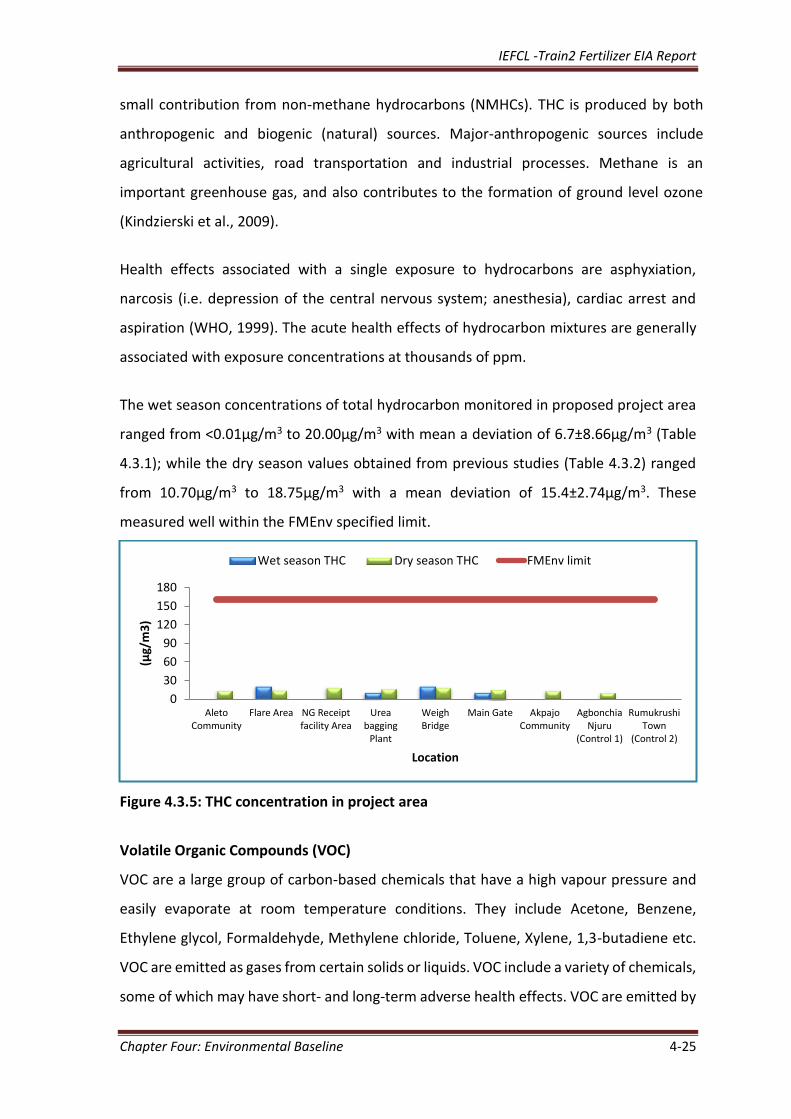
The wet season concentrations of total hydrocarbon monitored in proposed project area
ranged from <0.01µg/m3 to 20.00µg/m3 with mean a deviation of 6.7±8.66µg/m3 (Table
4.3.1); while the dry season values obtained from previous studies (Table 4.3.2) ranged
from 10.70µg/m3 to 18.75µg/m3 with a mean deviation of 15.4±2.74µg/m3. These
measured well within the FMEnv specified limit.
Figure 4.3.5: THC concentration in project area
Volatile Organic Compounds (VOC)
VOC are a large group of carbon-based chemicals that have a high vapour pressure and
easily evaporate at room temperature conditions. They include Acetone, Benzene,
Ethylene glycol, Formaldehyde, Methylene chloride, Toluene, Xylene, 1,3-butadiene etc.
VOC are emitted as gases from certain solids or liquids. VOC include a variety of chemicals,
some of which may have short- and long-term adverse health effects. VOC are emitted by
0
30
60
90
120
150
180
AletoCommunity
Flare Area NG Receiptfacility Area
Ureabagging
Plant
WeighBridge
Main Gate AkpajoCommunity
AgbonchiaNjuru
(Control 1)
RumukrushiTown
(Control 2)
(µg/
m3
)
Location
Wet season THC Dry season THC FMEnv limit
IEFCL -Train2 Fertilizer EIA Report
Chapter Four: Environmental Baseline 4-26
thousands of products including: paints and lacquers, paint strippers, cleaning agents,
pesticides, furniture and furnishing items, office equipment such as copiers and printers,
correction fluids and carbonless copy paper, graphics and craft materials including glues
and adhesives, permanent markers, and photographic solutions.
VOC are known to cause Eye, nose, and throat irritation; headaches, loss of coordination,
nausea; damage to liver, kidney, and central nervous system. Some organics can cause
cancer in animals; some are suspected or known to cause cancer in humans (WHO, 1999).
The principal harmful effects of VOC are toxicity, possible contribution to smog via
photochemical reactions in the atmosphere, and possible contribution to the
“greenhouse effect” and consequent global warming (Davis and Cornwell, 2008),
VOC concentrations measured in the project area in the wet season ranged from
<0.01µg/m3to 25.0µg/m3 with a mean deviation of 10.3±7.44µg/m3 (Table 4.3.1), while
the dry season values obtained from previous studies (Table 4.3.2) ranged from
4.80µg/m3to 11.67µg/m3 with a mean deviation of 9.2±2.33µg/m3. Concentration levels
of VOC shown are well below limit and represent baseline VOC concentration of the
proposed project area.
Total Suspended Particulate Matters (TSPM)
The term particulate matter (PM) describes materials that are suspended in the air. PM is
a mixture of aerosol particles (solid and liquid) covering a wide range of sizes and chemical
composition. These are light particles (Usually dust, fly ash) or other materials found
suspended in the atmosphere and carried around by the wind. TSP is either directly
emitted as primary particles or it is formed in the atmosphere from emissions of SO2, NOx,
NH3 and Non methane volatile organic compounds (NMVOCs).
TSPM is emitted from many anthropogenic sources, including both combustion and non-
combustion sources. Major sources of TSPM include transportation (diesel vehicles),
combustion processes, refining of bitumen and coal-burning power plants (Kindzierski et
al., 2009). Adverse health effects include aggravation of respiratory problems,
IEFCL -Train2 Fertilizer EIA Report
Chapter Four: Environmental Baseline 4-27
cardiovascular and lung diseases, heart attacks and arrhythmias. Prolong exposure to TSP
can lead to premature death (WHO, 1999; Kindzierski et al., 2009).
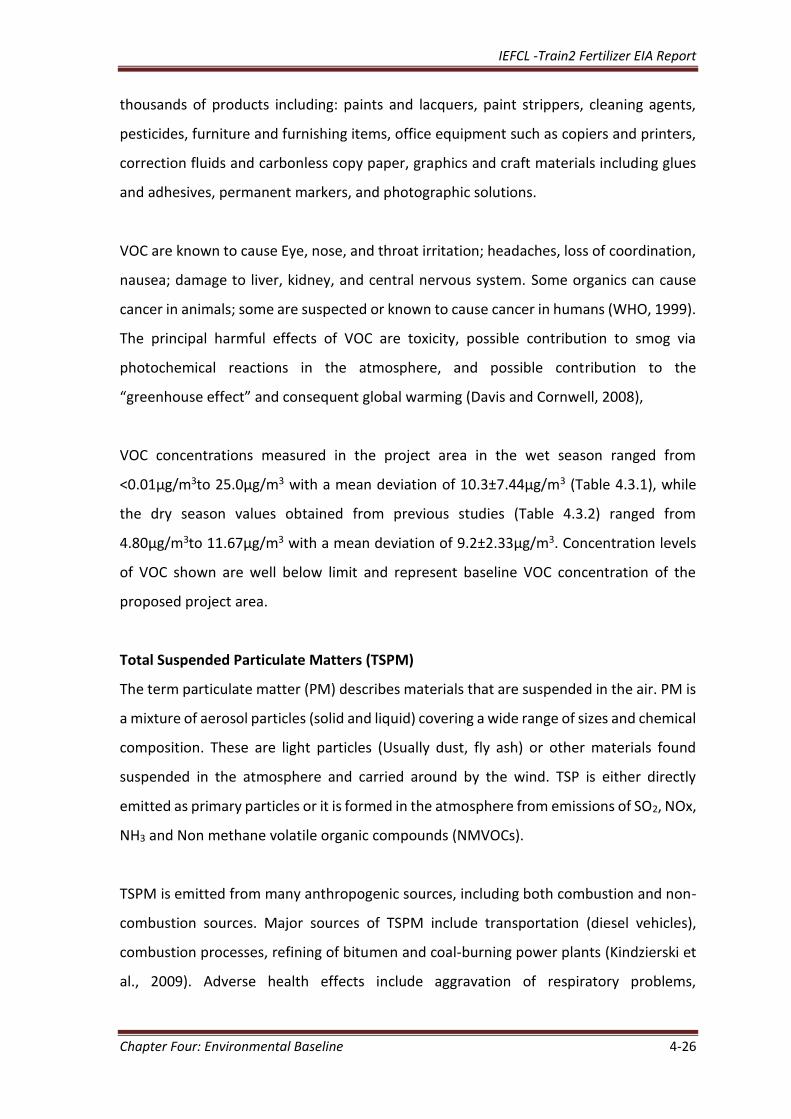
Concentrations of TSPM obtained in the wet season ranged from 8.0µg/m3 to 59.0µg/m3
with a mean deviation of 26.7±16.79 µg/m3 (Table 4.3.1), while the dry season values
obtained from previous studies (Table 4.3.2) ranged from 61.50µg/m3 to 106.60µg/m3
with a mean deviation of 46.7±14.37µg/m3. Concentrations of TSPM measured in project
area are well below FMEnv limit and represent baseline TSPM concentration of the project
area. The wet and dry seasons TSPM concentrations in the proposed project area are
shown in Figure 4.3.6.
Figure 4.3.6: TSPM concentration in project area
PM10Particulate Matter (Respirable Suspended Particulate matter, RSPM)
PM10 refers to particulate of size less than 10 microns (≤10 µm) in aerodynamic diameter.
PM10 particulate matter is also known as respirable suspended particulate matter because
it is breathe out by human beings. It has the same sources and effects as TSPM.
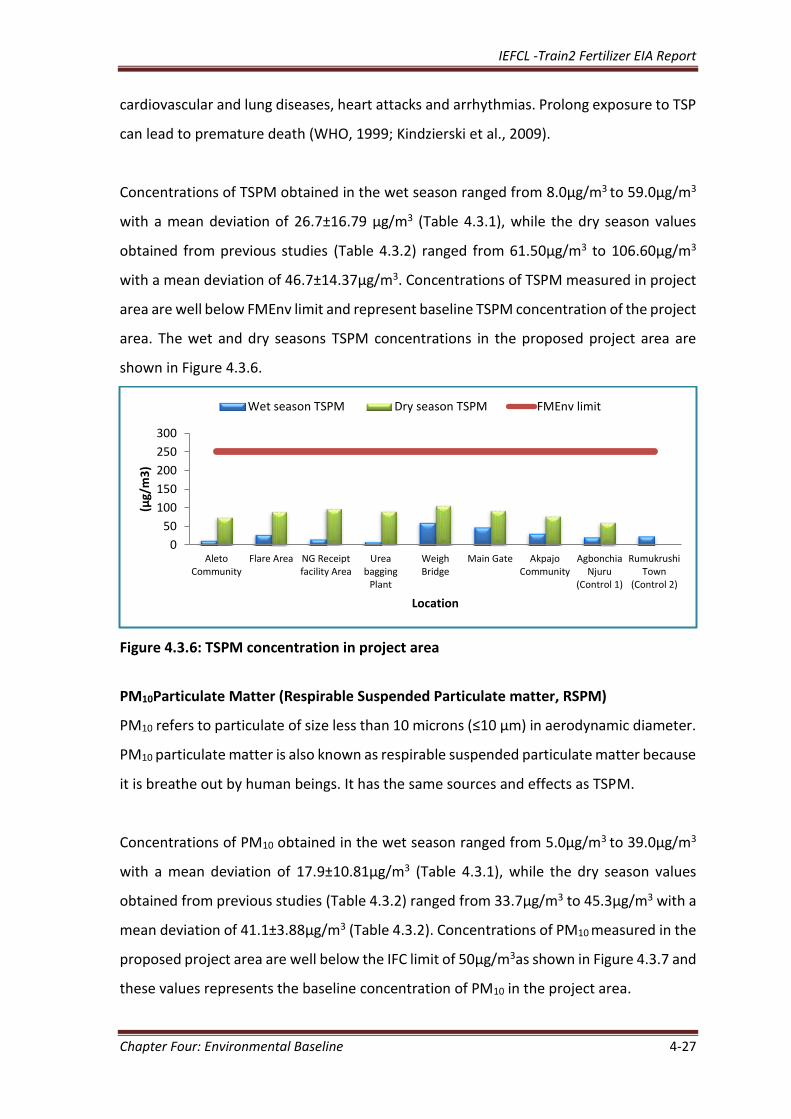
Concentrations of PM10 obtained in the wet season ranged from 5.0µg/m3 to 39.0µg/m3
with a mean deviation of 17.9±10.81µg/m3 (Table 4.3.1), while the dry season values
obtained from previous studies (Table 4.3.2) ranged from 33.7µg/m3 to 45.3µg/m3 with a
mean deviation of 41.1±3.88µg/m3 (Table 4.3.2). Concentrations of PM10 measured in the
proposed project area are well below the IFC limit of 50µg/m3as shown in Figure 4.3.7 and
these values represents the baseline concentration of PM10 in the project area.
0
50
100
150
200
250
300
AletoCommunity
Flare Area NG Receiptfacility Area
Ureabagging
Plant
WeighBridge
Main Gate AkpajoCommunity
AgbonchiaNjuru
(Control 1)
RumukrushiTown
(Control 2)
(µg/
m3
)
Location
Wet season TSPM Dry season TSPM FMEnv limit
IEFCL -Train2 Fertilizer EIA Report
Chapter Four: Environmental Baseline 4-28
Figure 4.3.7: PM10 concentration in project area
PM2.5 Particulate Matter (Inhalable Suspended Particulate matter, ISPM)
PM2.5 refers to particulate matter with size less than 2.5 microns (≤2.5 µm) in aerodynamic
diameter. It also called inhalable suspended particulate matter because it can penetrate
through the upper respiratory track into the lungs. It has the same sources and effects as
TSPM.
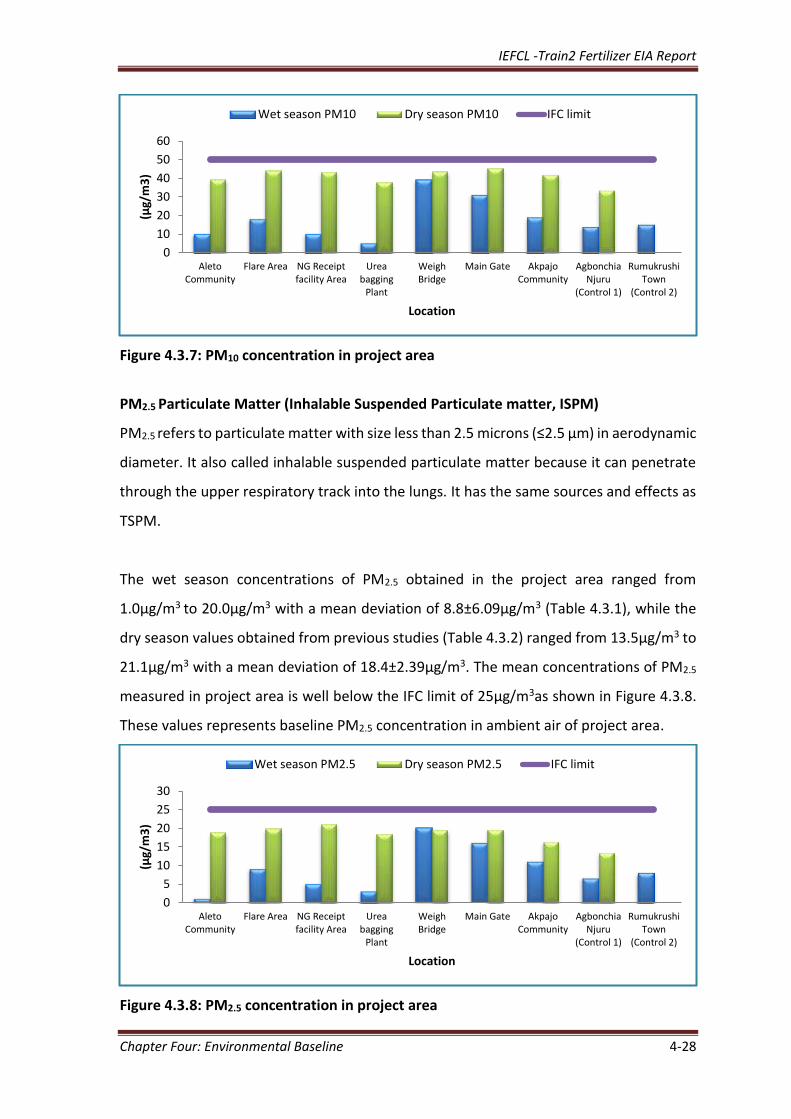
The wet season concentrations of PM2.5 obtained in the project area ranged from
1.0µg/m3 to 20.0µg/m3 with a mean deviation of 8.8±6.09µg/m3 (Table 4.3.1), while the
dry season values obtained from previous studies (Table 4.3.2) ranged from 13.5µg/m3 to
21.1µg/m3 with a mean deviation of 18.4±2.39µg/m3. The mean concentrations of PM2.5
measured in project area is well below the IFC limit of 25µg/m3as shown in Figure 4.3.8.
These values represents baseline PM2.5 concentration in ambient air of project area.
Figure 4.3.8: PM2.5 concentration in project area
0
10
20
30
40
50
60
AletoCommunity
Flare Area NG Receiptfacility Area
Ureabagging
Plant
WeighBridge
Main Gate AkpajoCommunity
AgbonchiaNjuru
(Control 1)
RumukrushiTown
(Control 2)
(µg/
m3
)
Location
Wet season PM10 Dry season PM10 IFC limit
0
5
10
15
20
25
30
AletoCommunity
Flare Area NG Receiptfacility Area
Ureabagging
Plant
WeighBridge
Main Gate AkpajoCommunity
AgbonchiaNjuru
(Control 1)
RumukrushiTown
(Control 2)
(µg/
m3
)
Location
Wet season PM2.5 Dry season PM2.5 IFC limit
IEFCL -Train2 Fertilizer EIA Report
Chapter Four: Environmental Baseline 4-29
Odour in Relation to Air Quality
An odour is caused by one or more volatile chemical compounds, generally at a very
low concentration, that is perceive by the sense of olfaction. It is the smell that we are
able to detect from substances, usually carried by air into our nostrils. The ability of
odours to be carried long distances in the air means that odour have the ability to affect
a large number of people. The degree to which people are affected will however
depend on the sensitivity of their sense of smell and their tolerance of the odour in
question. The any sense of odour was not observed during filed work.
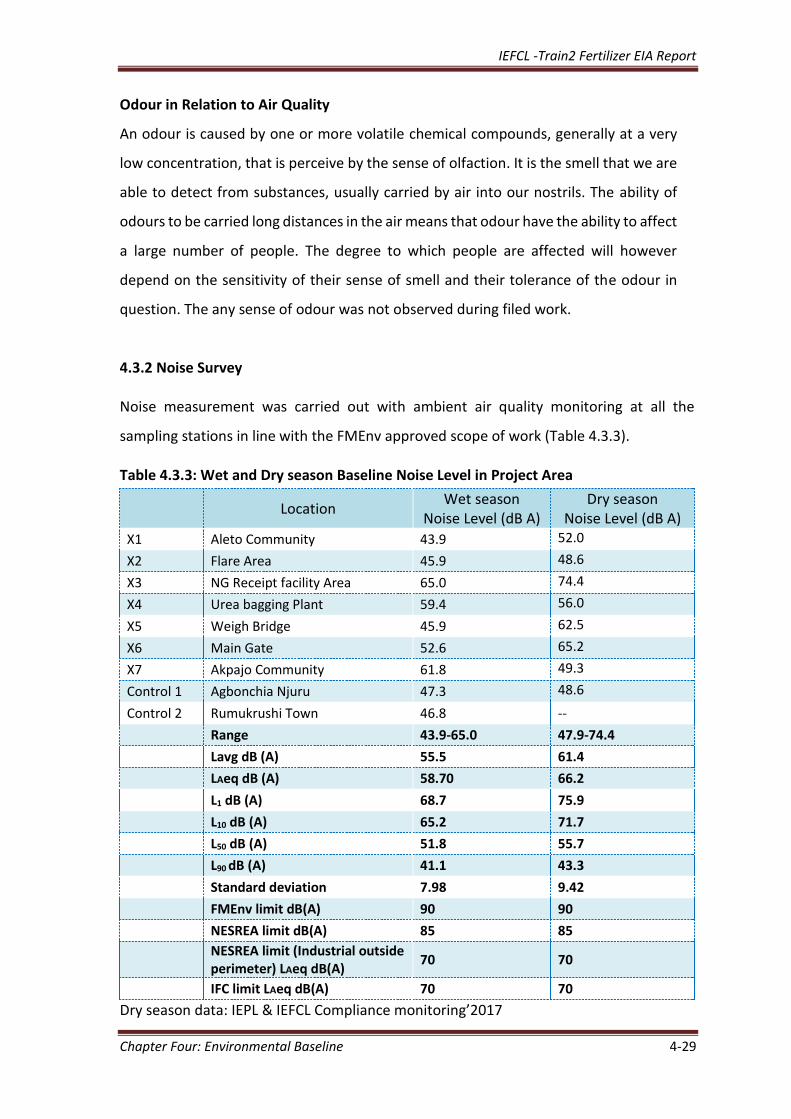
4.3.2 Noise Survey
Noise measurement was carried out with ambient air quality monitoring at all the
sampling stations in line with the FMEnv approved scope of work (Table 4.3.3).
Table 4.3.3: Wet and Dry season Baseline Noise Level in Project Area
Location
Wet season Noise Level (dB A)
Dry season Noise Level (dB A)
X1 Aleto Community 43.9 52.0
X2 Flare Area 45.9 48.6
X3 NG Receipt facility Area 65.0 74.4
X4 Urea bagging Plant 59.4 56.0
X5 Weigh Bridge 45.9 62.5
X6 Main Gate 52.6 65.2
X7 Akpajo Community 61.8 49.3
Control 1 Agbonchia Njuru 47.3 48.6
Control 2 Rumukrushi Town 46.8 --
Range 43.9-65.0 47.9-74.4
Lavg dB (A) 55.5 61.4
LAeq dB (A) 58.70 66.2
L1 dB (A) 68.7 75.9
L10 dB (A) 65.2 71.7
L50 dB (A) 51.8 55.7
L90 dB (A) 41.1 43.3
Standard deviation 7.98 9.42
FMEnv limit dB(A) 90 90
NESREA limit dB(A) 85 85
NESREA limit (Industrial outside perimeter) LAeq dB(A)
70 70
IFC limit LAeq dB(A) 70 70
Dry season data: IEPL & IEFCL Compliance monitoring’2017
IEFCL -Train2 Fertilizer EIA Report
Chapter Four: Environmental Baseline 4-30
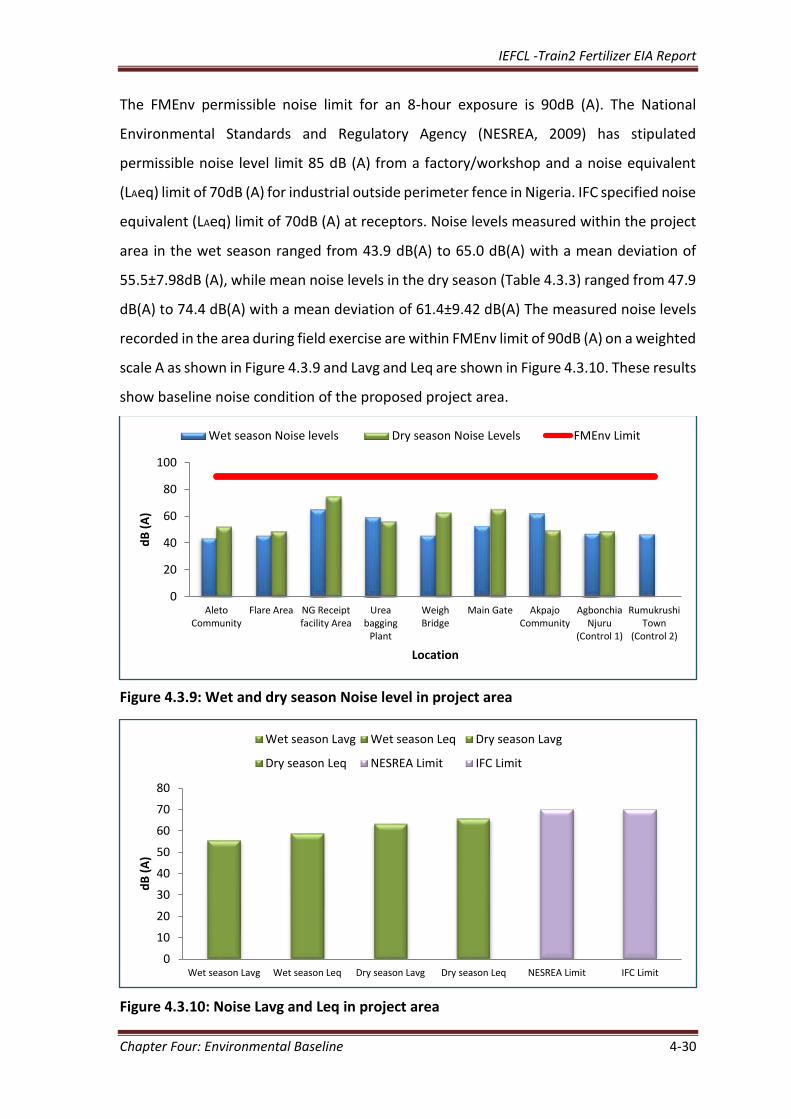
The FMEnv permissible noise limit for an 8-hour exposure is 90dB (A). The National
Environmental Standards and Regulatory Agency (NESREA, 2009) has stipulated
permissible noise level limit 85 dB (A) from a factory/workshop and a noise equivalent
(LAeq) limit of 70dB (A) for industrial outside perimeter fence in Nigeria. IFC specified noise
equivalent (LAeq) limit of 70dB (A) at receptors. Noise levels measured within the project
area in the wet season ranged from 43.9 dB(A) to 65.0 dB(A) with a mean deviation of
55.5±7.98dB (A), while mean noise levels in the dry season (Table 4.3.3) ranged from 47.9
dB(A) to 74.4 dB(A) with a mean deviation of 61.4±9.42 dB(A) The measured noise levels
recorded in the area during field exercise are within FMEnv limit of 90dB (A) on a weighted
scale A as shown in Figure 4.3.9 and Lavg and Leq are shown in Figure 4.3.10. These results
show baseline noise condition of the proposed project area.
Figure 4.3.9: Wet and dry season Noise level in project area
Figure 4.3.10: Noise Lavg and Leq in project area
0
20
40
60
80
100
AletoCommunity
Flare Area NG Receiptfacility Area
Ureabagging
Plant
WeighBridge
Main Gate AkpajoCommunity
AgbonchiaNjuru
(Control 1)
RumukrushiTown
(Control 2)
dB
(A
)
Location
Wet season Noise levels Dry season Noise Levels FMEnv Limit
0
10
20
30
40
50
60
70
80
Wet season Lavg Wet season Leq Dry season Lavg Dry season Leq NESREA Limit IFC Limit
dB
(A
)
Wet season Lavg Wet season Leq Dry season Lavg
Dry season Leq NESREA Limit IFC Limit
IEFCL -Train2 Fertilizer EIA Report
Chapter Four: Environmental Baseline 4-31
More recently, research has focused on noise as an auditory stressor that can produce
both direct and indirect health effects (Sheela, 2000). The direct health effect known to
be attributable to noise is hearing loss (resulting from damage to the inner hair cells of
the organ of corti) with noise exposure higher than 90 decibels. There are several non-
auditory physiological effects of noise exposure including a possible increase in
cardiovascular disease from elevated blood pressure and physiological reactions
involving the cardiovascular endocrine system (Talbott, 1995). In addition, community
noise has been shown to adversely affect sleep, communication, performance and
behavior, reading and memory acquisition, and mental health (Talbott, 1995).
4.3.2.1 Day and Night measurement
For a proper understanding of possible cumulative effect, a comprehensive noise survey
for day (07:00 – 22:00) and night (22:00 – 07:00) period covering both internal and
external receptors was carried out and presented as Appendix 4.5. The result indicated
that noise levels within the complex for day and night were 75.3 and 72.2dB (A)
respectively. While noise levels recorded at the closest external receptor were 68.1 and
65.7dB (A) for day and night respectively.
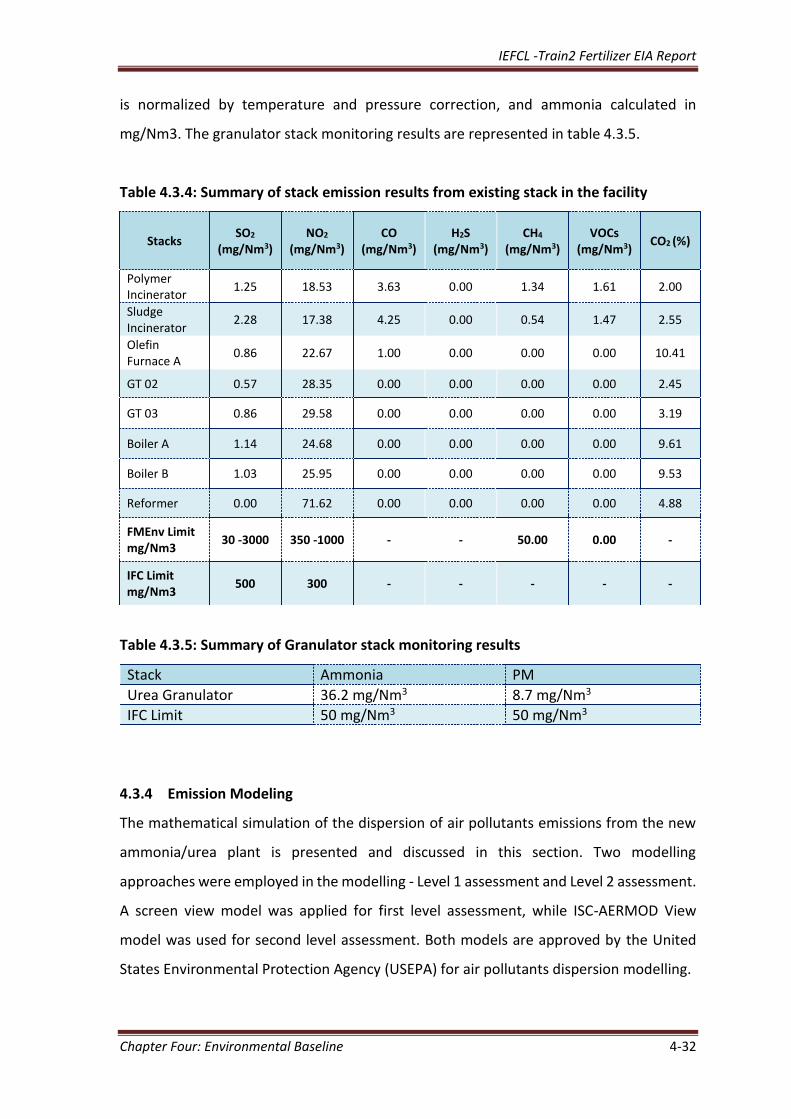
4.3.3 Stack Emission
Flue/ Stack Gas monitoring was carried out in accordance with the FMEnv approved term
of reference (ToR) and scope of work for the proposed IEFCL-Train2 project in the existing
Indorama complex. The flue gas monitoring was carried using Testo 350 XL flue gas
analyzer. A total of nine readings were taken for each stack at 10 minutes intervals. The
mean values were calculated and then converted from ppm to mg/Nm3 as presented in
the table 4.3.4 below. The result revealed low concentration of priority parameters
measured when compared to the FMEnv limit.
For monitoring of PM and ammonia in granulator stack flue gas, isokinetic sampling
method was adopted, where the gas was sucked isokinetically and particulate matter
collected in thimble. This collected mass is divided by normalized volume to get PM
emissions in mg/Nm3. To analyze ammonia, standard acid is used as absorbent and then
concentration was determined through a back titration with 0.2N-NaOH. The gas volume
IEFCL -Train2 Fertilizer EIA Report
Chapter Four: Environmental Baseline 4-32
is normalized by temperature and pressure correction, and ammonia calculated in
mg/Nm3. The granulator stack monitoring results are represented in table 4.3.5.
Table 4.3.4: Summary of stack emission results from existing stack in the facility
Stacks SO2
(mg/Nm3) NO2
(mg/Nm3) CO
(mg/Nm3) H2S
(mg/Nm3) CH4
(mg/Nm3) VOCs
(mg/Nm3) CO2 (%)
Polymer Incinerator
1.25 18.53 3.63 0.00 1.34 1.61 2.00
Sludge Incinerator
2.28 17.38 4.25 0.00 0.54 1.47 2.55
Olefin Furnace A
0.86 22.67 1.00 0.00 0.00 0.00 10.41
GT 02 0.57 28.35 0.00 0.00 0.00 0.00 2.45
GT 03 0.86 29.58 0.00 0.00 0.00 0.00 3.19
Boiler A 1.14 24.68 0.00 0.00 0.00 0.00 9.61
Boiler B 1.03 25.95 0.00 0.00 0.00 0.00 9.53
Reformer 0.00 71.62 0.00 0.00 0.00 0.00 4.88
FMEnv Limit mg/Nm3
30 -3000 350 -1000 - - 50.00 0.00 -
IFC Limit mg/Nm3
500 300 - - - - -
Table 4.3.5: Summary of Granulator stack monitoring results
Stack Ammonia PM
Urea Granulator 36.2 mg/Nm3 8.7 mg/Nm3
IFC Limit 50 mg/Nm3 50 mg/Nm3
4.3.4 Emission Modeling
The mathematical simulation of the dispersion of air pollutants emissions from the new
ammonia/urea plant is presented and discussed in this section. Two modelling
approaches were employed in the modelling - Level 1 assessment and Level 2 assessment.
A screen view model was applied for first level assessment, while ISC-AERMOD View
model was used for second level assessment. Both models are approved by the United
States Environmental Protection Agency (USEPA) for air pollutants dispersion modelling.
IEFCL -Train2 Fertilizer EIA Report
Chapter Four: Environmental Baseline 4-33
A screening model was applied for first level assessment to provide the worst-case
pollutant concentrations, while ISC- AERMOD was used for second assessment to provide
an in-depth modeling approach to determine long-range (24-hour) scenarios.
Screen view version 4.0 is a screening-level air quality model approved by the United
States Environmental Protection Agency (USEPA ) for the estimates of worst-case ground
level concentrations for a single source as well as concentrations in the cavity zone, and
concentrations due to inversion break-up and shoreline fumigation (Lake Environmental,
2011). The screen view model has a built-in, meteorological data matrix that represents a
spectrum of different combinations of meteorological conditions that could possibly occur
in the area. It calculates concentrations under these different combinations of
meteorological conditions. From this output, the highest (worst-case) concentration is
selected. Screening models are generally limited to providing the worst-case one-hour
concentrations at a receptor. Screening models are considered to provide conservative
concentration estimates, and as such are used as a flagging device that indicates the
potential for unacceptable air quality (British Columbia Ministry of Environment, 2008).
Although Level 1 assessments are useful in many situations, often the complete
distribution of concentrations in time and space are of interest. This distribution provides
the spatial pattern of maximum concentrations at different time averages surrounding
the source area, and/or the identification of areas where certain specified concentration
thresholds are exceeded as well as their exceedance frequencies (British Columbia
Ministry of Environment, 2008).
The ISC-AERMOD View model was used at the second level modelling assessment to
determine long range air pollutants transport and their impacts on surrounding receptors.
Mathematical simulations of emissions air dispersion from new stationary sources on long
term basis was achieved by the modelling code AERMOD using the graphical user interface
(GUI) AERMOD View. AERMOD View is a steady-state Gaussian Plume Air Dispersion
Model developed by the Atmospheric Studies Group (ASG) scientists. The model
incorporates Industrial Source Complex Model (ISCST3), AERMOD model and Plume Rise
Enhancements (ISC-PRIME).
IEFCL -Train2 Fertilizer EIA Report
Chapter Four: Environmental Baseline 4-34
ISC-AERMOD View is a USEPA Regulatory, refined, steady-state, multiple source, Gaussian
plume air Dispersion Model. ISC- AERMOD View is widely accepted as the preferred model
to use for industrial sources in air quality analysis. The model was used to simulate
pollutant concentrations emitted from the proposed ammonia/urea plant. Therefore,
using ISC- AERMOD View for cumulative impacts modelling gives conservatively high
impacts from a distance point source. Results are compared with Federal Ministry of
Environment (FMEnv) and International Finance Corporation (IFC) standards and
guidelines.
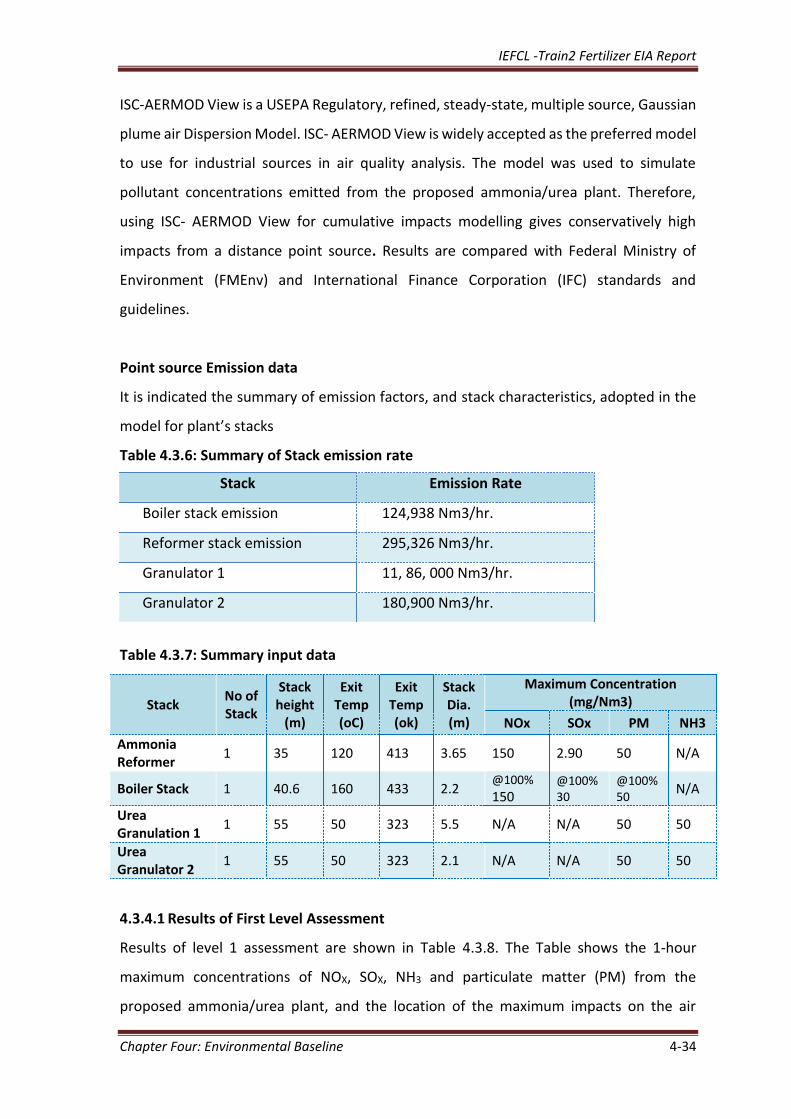
Point source Emission data
It is indicated the summary of emission factors, and stack characteristics, adopted in the
model for plant’s stacks
Table 4.3.6: Summary of Stack emission rate
Table 4.3.7: Summary input data
Stack No of Stack
Stack height
(m)
Exit Temp (oC)
Exit Temp (ok)
Stack Dia. (m)
Maximum Concentration (mg/Nm3)
NOx SOx PM NH3
Ammonia Reformer
1 35 120 413 3.65 150 2.90 50 N/A
Boiler Stack 1 40.6 160 433 2.2 @100%
150 @100% 30
@100% 50
N/A
Urea Granulation 1
1 55 50 323 5.5 N/A N/A 50 50
Urea Granulator 2
1 55 50 323 2.1 N/A N/A 50 50
4.3.4.1 Results of First Level Assessment
Results of level 1 assessment are shown in Table 4.3.8. The Table shows the 1-hour
maximum concentrations of NOX, SOX, NH3 and particulate matter (PM) from the
proposed ammonia/urea plant, and the location of the maximum impacts on the air
Stack Emission Rate
Boiler stack emission 124,938 Nm3/hr.
Reformer stack emission 295,326 Nm3/hr.
Granulator 1 11, 86, 000 Nm3/hr.
Granulator 2 180,900 Nm3/hr.
IEFCL -Train2 Fertilizer EIA Report
Chapter Four: Environmental Baseline 4-35
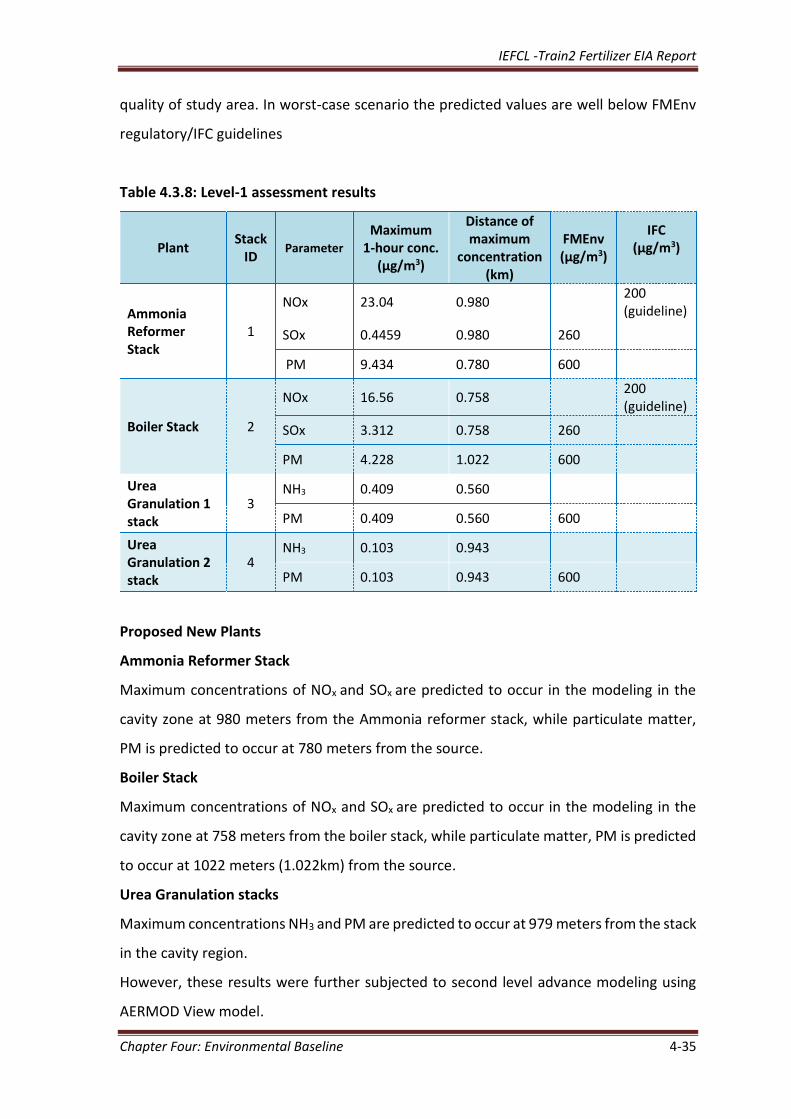
quality of study area. In worst-case scenario the predicted values are well below FMEnv
regulatory/IFC guidelines
Table 4.3.8: Level-1 assessment results
Plant Stack
ID Parameter
Maximum 1-hour conc.
(µg/m3)
Distance of maximum
concentration (km)
FMEnv (µg/m3)
IFC (µg/m3)
Ammonia Reformer Stack
1
NOx 23.04 0.980 200 (guideline)
SOx 0.4459 0.980 260
PM 9.434 0.780 600
Boiler Stack 2
NOx 16.56 0.758 200 (guideline)
SOx 3.312 0.758 260
PM 4.228 1.022 600
Urea Granulation 1 stack
3 NH3 0.409 0.560
PM 0.409 0.560 600
Urea Granulation 2 stack
4 NH3 0.103 0.943
PM 0.103 0.943 600
Proposed New Plants
Ammonia Reformer Stack
Maximum concentrations of NOx and SOx are predicted to occur in the modeling in the
cavity zone at 980 meters from the Ammonia reformer stack, while particulate matter,
PM is predicted to occur at 780 meters from the source.
Boiler Stack
Maximum concentrations of NOx and SOx are predicted to occur in the modeling in the
cavity zone at 758 meters from the boiler stack, while particulate matter, PM is predicted
to occur at 1022 meters (1.022km) from the source.
Urea Granulation stacks
Maximum concentrations NH3 and PM are predicted to occur at 979 meters from the stack
in the cavity region.
However, these results were further subjected to second level advance modeling using
AERMOD View model.
IEFCL -Train2 Fertilizer EIA Report
Chapter Four: Environmental Baseline 4-36
4.3.4.2 Results of Second Level Assessment
Prediction of Pollutants Emissions
Air quality impact of the proposed ammonia/urea plant has been predicted based on the
physical details of stacks and emission rates of SOX, NOX, NH3 and PM. The simulation
isopleths for the 24-hour modeling period are shown in Figures 4.3.11 to 4.3.14. All the
figures reported the maximum expected values comparable with the Air Quality Standards
as point of the model domain which refers to areas outside the Indorama complex.
The maximum 24 hourly average concentration of SO2 is predicted to be 0.23µg/m3 (Table
4.3.9 and Figure 4.3.11). This maximum ground level concentration of SO2 occurred
adjacent to the Indorama complex as shown in Figure 4.3.11. The effective cumulative
prediction is made by superimposing the maximum predicted concentration on the
measured background average SO2 concentration level. This is computed to be 1.13µg/m3
in the wet season and 7.23µg/m3 in the dry season. These values are well below the
FMEnv limit.
The maximum 24 hourly average concentration of NO2 is predicted to be 15.95µg/m3
(Table 4.3.9 and Figure 4.3.12). This maximum ground level concentration of NO2 also
occurred adjacent to the Indorama complex as shown in Figure 4.3.12. The effective
cumulative concentration of NO2 is forecasted by superimposing the predicted
concentration on the observed background average concentration of NO2. This is
computed to be 15.99 µg/m3 in the wet season and 20.95 µg/m3 in the dry season. These
values are well below FMEnv limit.
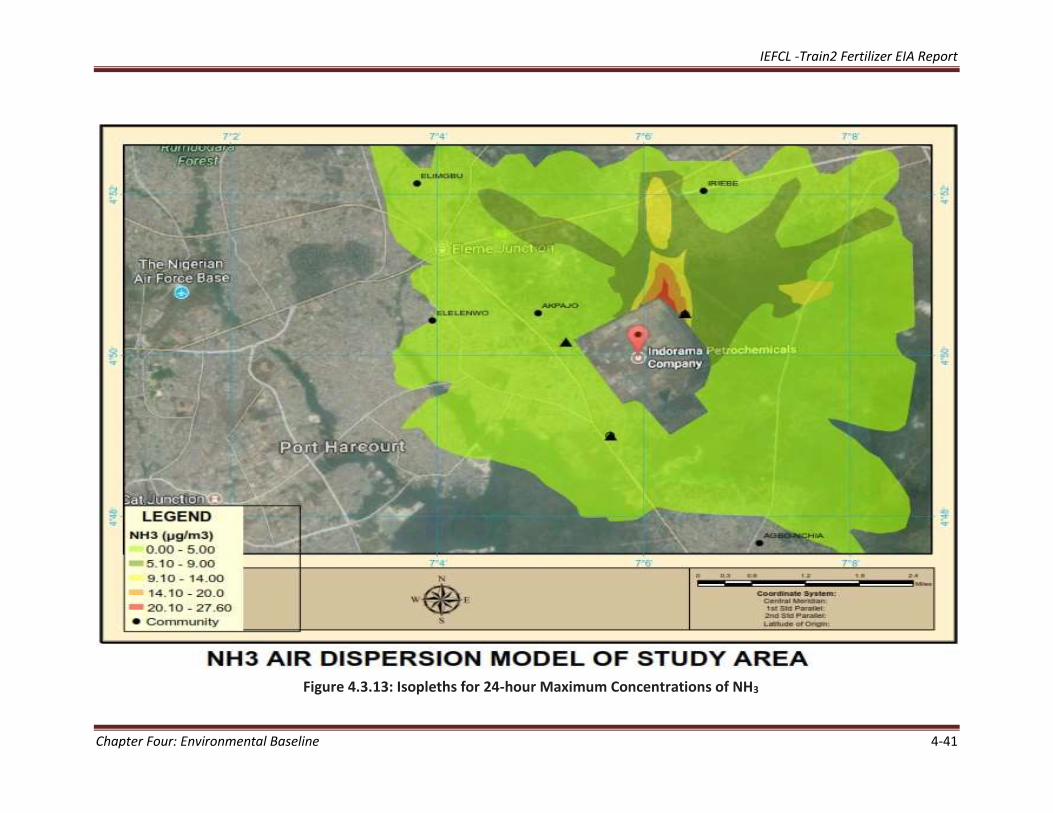
The maximum 24 hourly average concentration of NH3 is predicted to be 0.27µg/m3 (Table
4.3.9). This maximum ground level concentration of NH3 also occurred adjacent to the
Indorama complex as shown in Figure 4.3.13. The effective cumulative concentration of
NH3 is forecasted by superimposing the predicted concentration on the observed
background average concentration of NH3. This is computed to be 0.37 µg/m3 in the wet
season and 0.57 µg/m3 in the dry season.
IEFCL -Train2 Fertilizer EIA Report
Chapter Four: Environmental Baseline 4-37
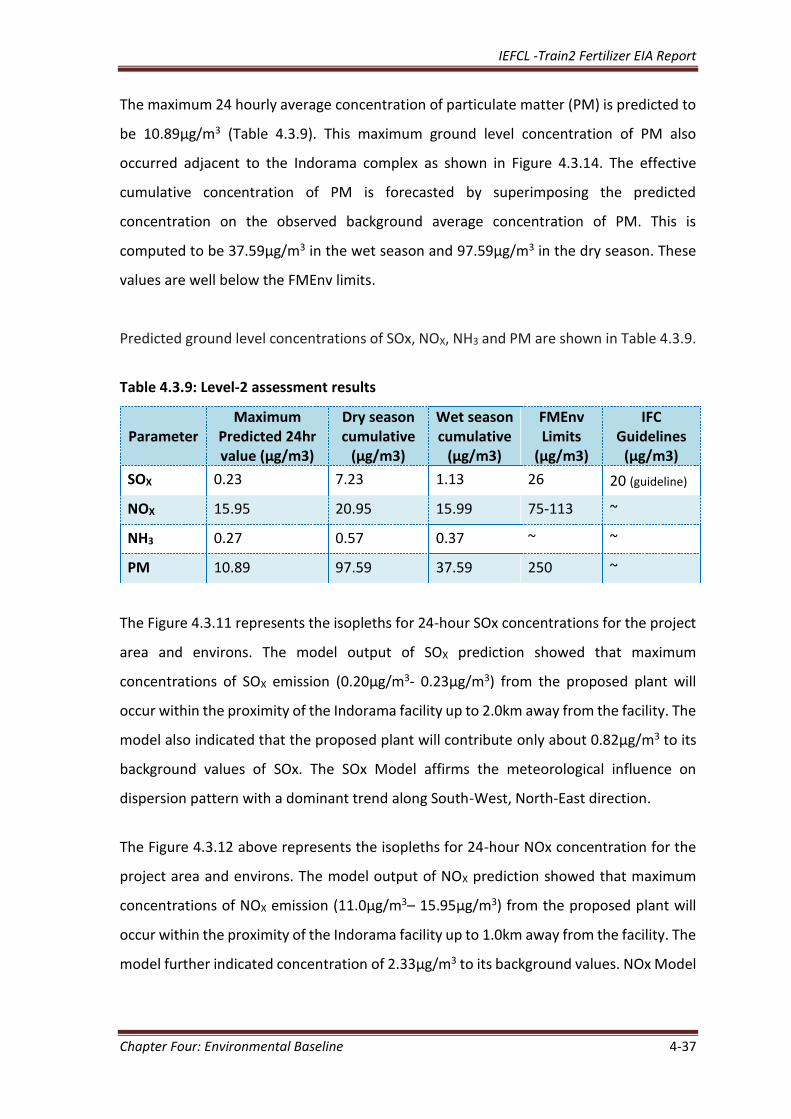
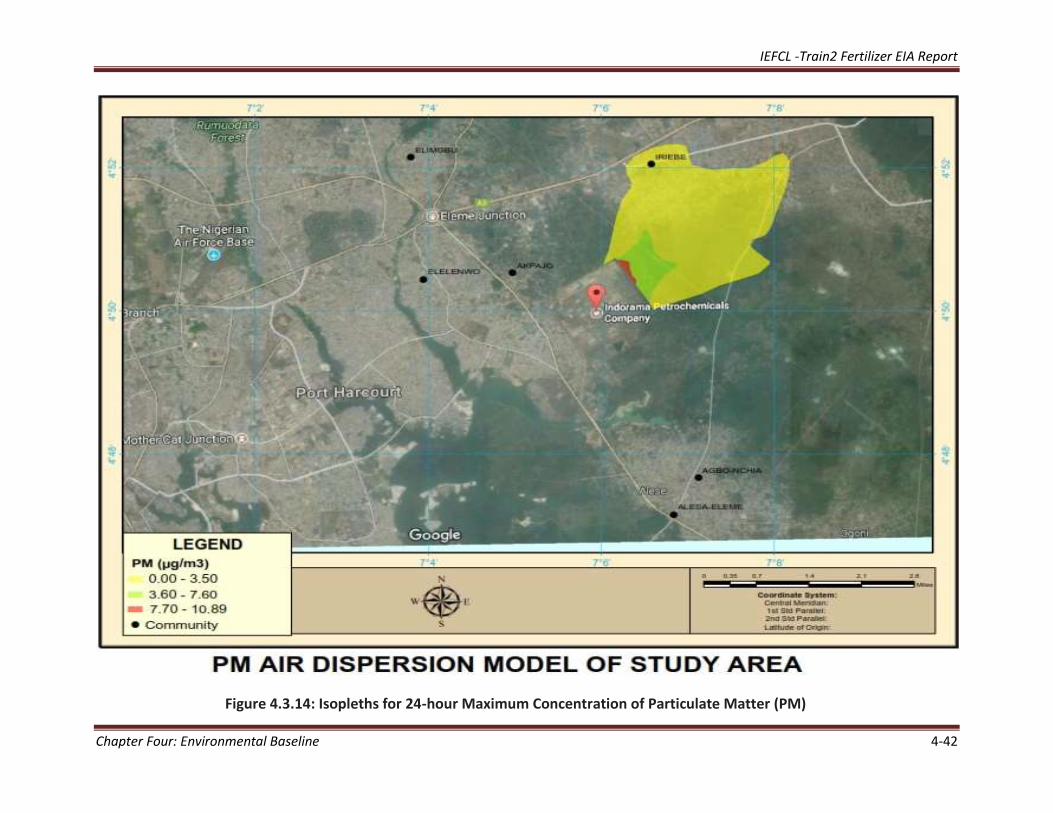
The maximum 24 hourly average concentration of particulate matter (PM) is predicted to
be 10.89µg/m3 (Table 4.3.9). This maximum ground level concentration of PM also
occurred adjacent to the Indorama complex as shown in Figure 4.3.14. The effective
cumulative concentration of PM is forecasted by superimposing the predicted
concentration on the observed background average concentration of PM. This is
computed to be 37.59µg/m3 in the wet season and 97.59µg/m3 in the dry season. These
values are well below the FMEnv limits.
Predicted ground level concentrations of SOx, NOX, NH3 and PM are shown in Table 4.3.9.
Table 4.3.9: Level-2 assessment results
Parameter Maximum
Predicted 24hr value (µg/m3)
Dry season cumulative
(µg/m3)
Wet season cumulative
(µg/m3)
FMEnv Limits
(µg/m3)
IFC Guidelines
(µg/m3)
SOX 0.23 7.23 1.13 26 20 (guideline)
NOX 15.95 20.95 15.99 75-113 ~
NH3 0.27 0.57 0.37 ~ ~
PM 10.89 97.59 37.59 250 ~
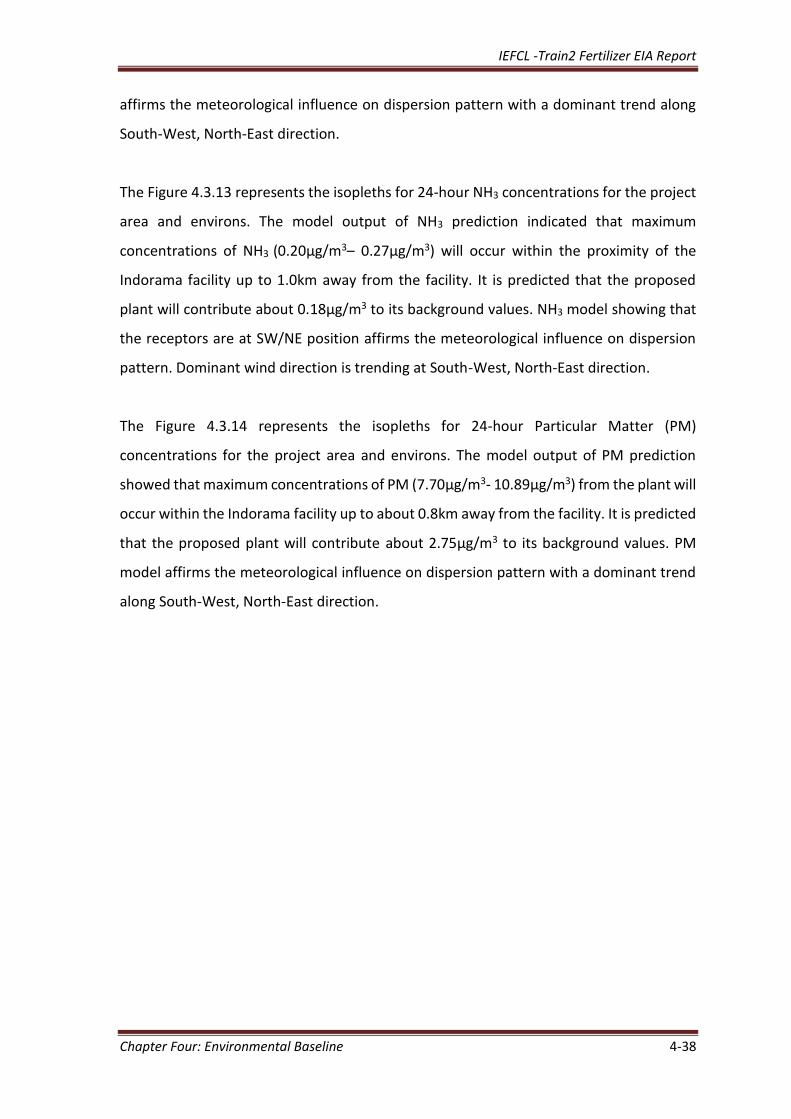
The Figure 4.3.11 represents the isopleths for 24-hour SOx concentrations for the project
area and environs. The model output of SOX prediction showed that maximum
concentrations of SOX emission (0.20µg/m3- 0.23µg/m3) from the proposed plant will
occur within the proximity of the Indorama facility up to 2.0km away from the facility. The
model also indicated that the proposed plant will contribute only about 0.82µg/m3 to its
background values of SOx. The SOx Model affirms the meteorological influence on
dispersion pattern with a dominant trend along South-West, North-East direction.
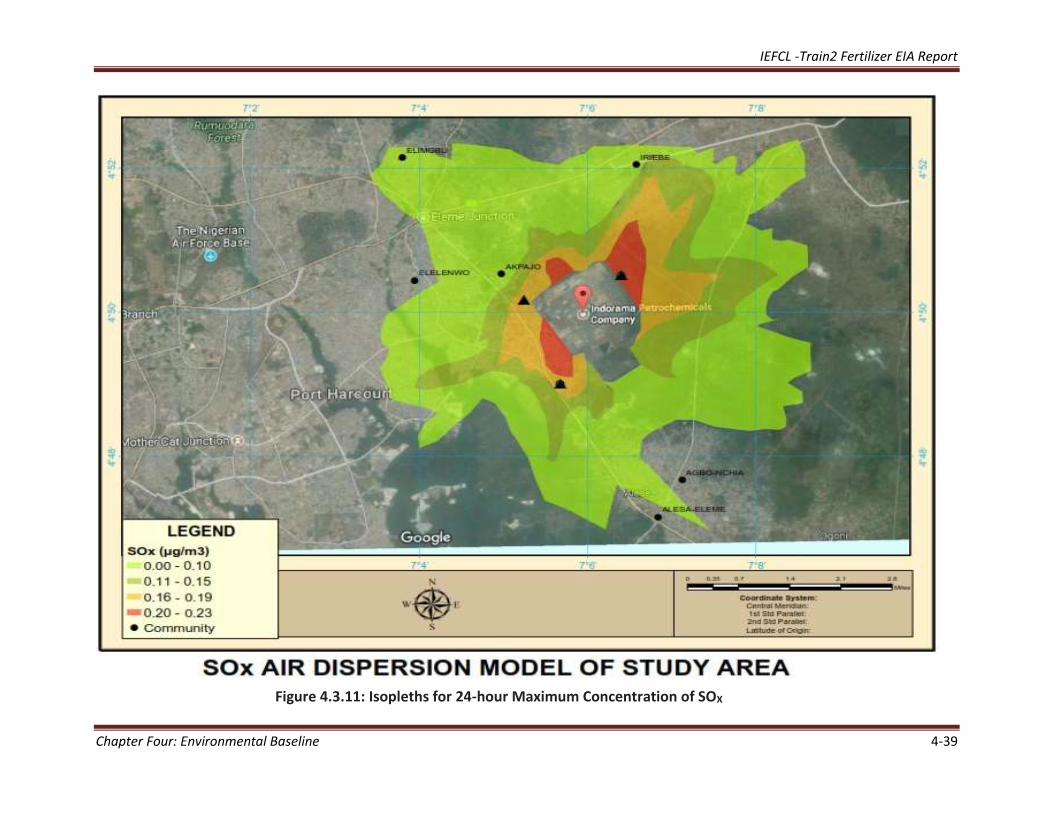
The Figure 4.3.12 above represents the isopleths for 24-hour NOx concentration for the
project area and environs. The model output of NOX prediction showed that maximum
concentrations of NOX emission (11.0µg/m3– 15.95µg/m3) from the proposed plant will
occur within the proximity of the Indorama facility up to 1.0km away from the facility. The
model further indicated concentration of 2.33µg/m3 to its background values. NOx Model
IEFCL -Train2 Fertilizer EIA Report
Chapter Four: Environmental Baseline 4-38
affirms the meteorological influence on dispersion pattern with a dominant trend along
South-West, North-East direction.
The Figure 4.3.13 represents the isopleths for 24-hour NH3 concentrations for the project
area and environs. The model output of NH3 prediction indicated that maximum
concentrations of NH3 (0.20µg/m3– 0.27µg/m3) will occur within the proximity of the
Indorama facility up to 1.0km away from the facility. It is predicted that the proposed
plant will contribute about 0.18µg/m3 to its background values. NH3 model showing that
the receptors are at SW/NE position affirms the meteorological influence on dispersion
pattern. Dominant wind direction is trending at South-West, North-East direction.
The Figure 4.3.14 represents the isopleths for 24-hour Particular Matter (PM)
concentrations for the project area and environs. The model output of PM prediction
showed that maximum concentrations of PM (7.70µg/m3- 10.89µg/m3) from the plant will
occur within the Indorama facility up to about 0.8km away from the facility. It is predicted
that the proposed plant will contribute about 2.75µg/m3 to its background values. PM
model affirms the meteorological influence on dispersion pattern with a dominant trend
along South-West, North-East direction.
IEFCL -Train2 Fertilizer EIA Report
Chapter Four: Environmental Baseline 4-39
Figure 4.3.11: Isopleths for 24-hour Maximum Concentration of SOX
IEFCL -Train2 Fertilizer EIA Report
Chapter Four: Environmental Baseline 4-40
Figure 4.3.12: Isopleths for 24-hour Maximum Concentration of NOx
IEFCL -Train2 Fertilizer EIA Report
Chapter Four: Environmental Baseline 4-41
Figure 4.3.13: Isopleths for 24-hour Maximum Concentrations of NH3
IEFCL -Train2 Fertilizer EIA Report
Chapter Four: Environmental Baseline 4-42
Figure 4.3.14: Isopleths for 24-hour Maximum Concentration of Particulate Matter (PM)
IEFCL -Train2 Fertilizer EIA Report
Chapter Four: Environmental Baseline 4-43
METEOROLOGY
The meteorology of the proposed project area will play a significant role in the dispersion
of air pollutants in the area. Historical meteorological data (PSU/NCAR Mesoscale Model
MM5), secondary data meteorological data and field observed data were used to
investigate and simulate pollutants dispersion pattern in the dry season and wet season
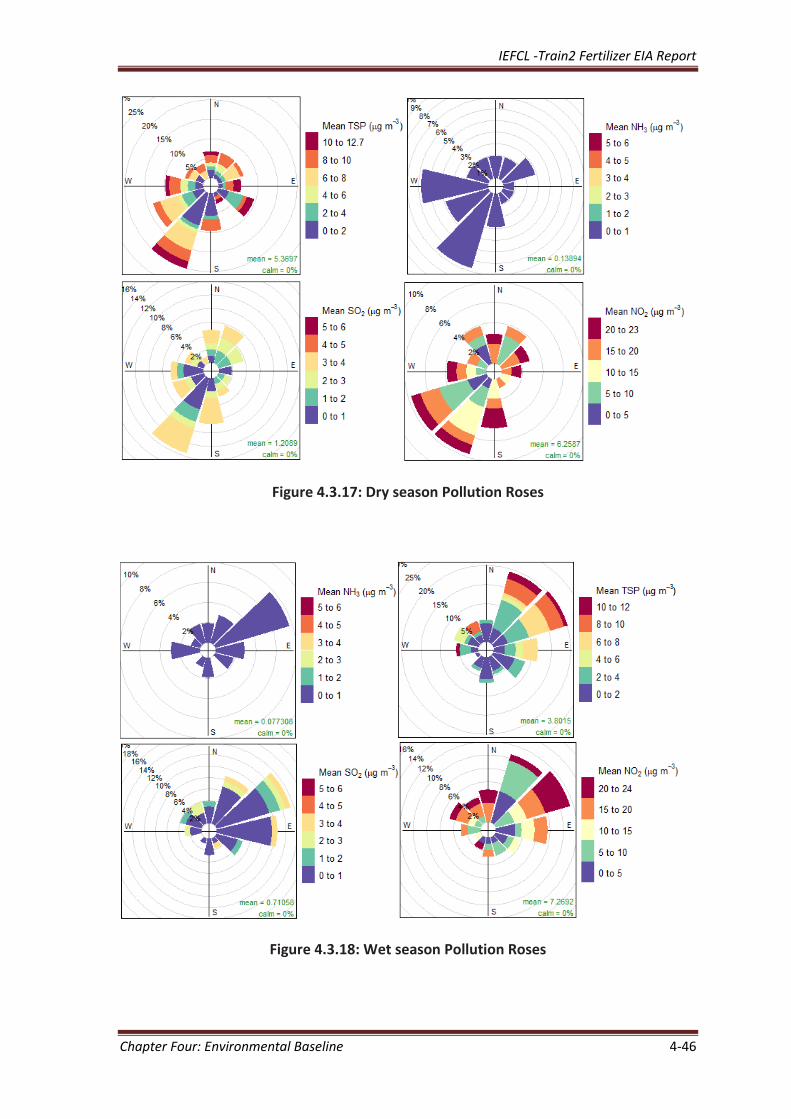
period. The measured data and MM5 data have been used to build pollution roses
centered on site (see Figures 4.3.17 and 4.3.18).
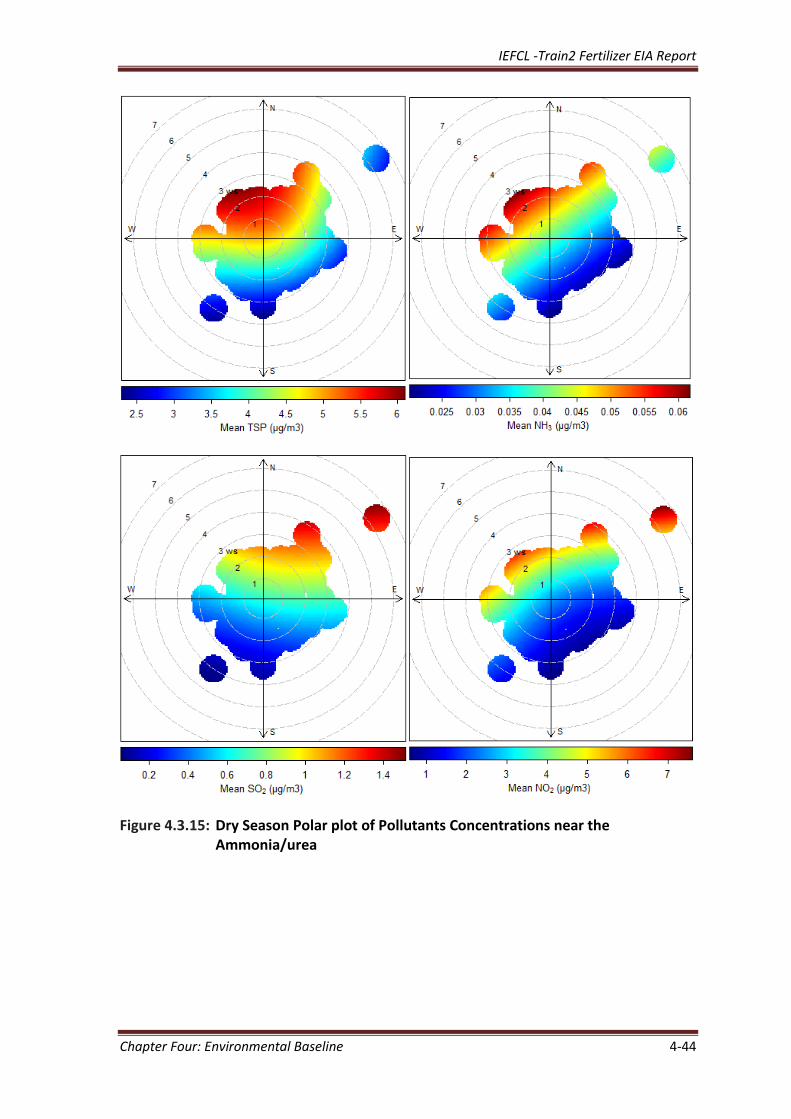
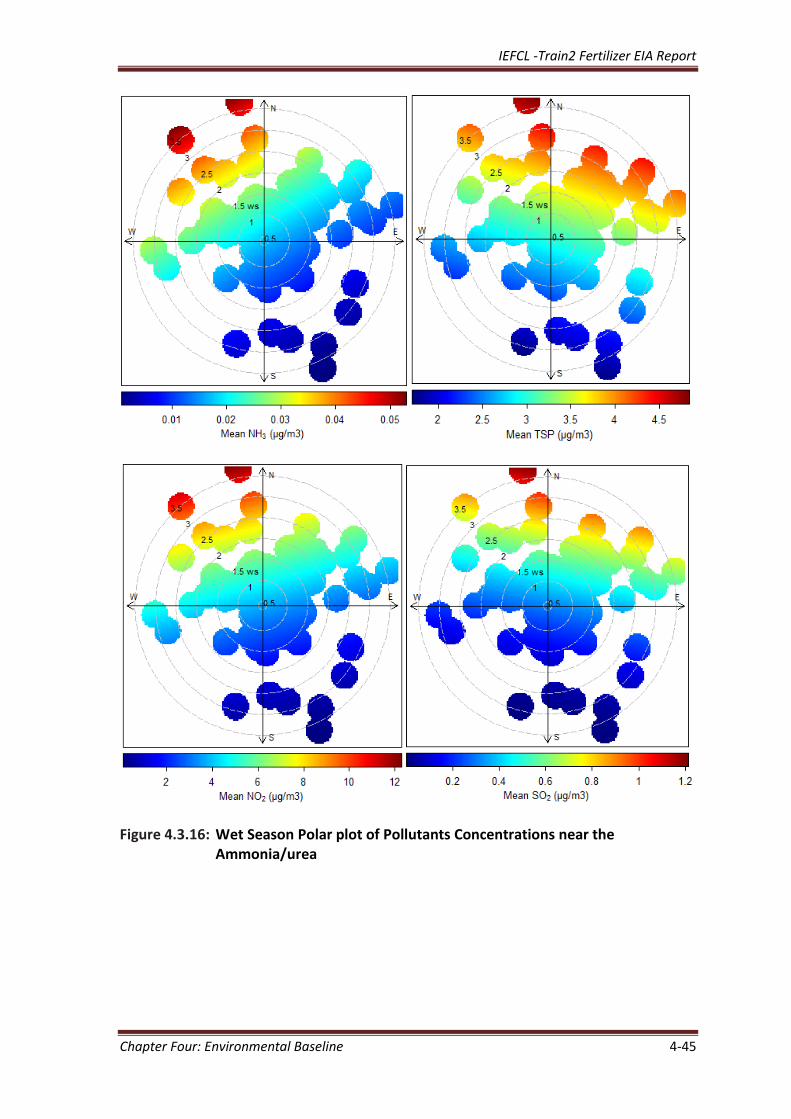
The dry season and the wet season polar plots of pollutants dispersion from the new
plants are shown in Figures 4.3.15 and 4.3.16 respectively. The simulated polar plots
showed that highest pollutant concentrations are related with high wind speed from the
North-East and North-West directions. In addition, at a wind speed of about 4.0m/s
pollutant concentrations will spread to the South-East and South-West. The pollution
roses showed that North-East wind blowing towards the South in the dry season will
contribute most to the overall mean concentrations of pollutants (Figure 4.3.17).
Similarly, the South-West wind blowing towards the North in the wet season will
contribute most to the overall mean concentrations of pollutants (Figure 4.3.18). This
clearly showed the dominance of South-Westerly winds controlling the overall mean
pollutants concentrations at the proposed facility site in the wet season and the
dominance of North-Easterly winds controlling the overall mean pollutants
concentrations at the proposed facility site in the dry season. Pollution roses conditioned
by wind speed and direction are presented in Figures 4.3.17 and 4.3.18.
IEFCL -Train2 Fertilizer EIA Report
Chapter Four: Environmental Baseline 4-44
Figure 4.3.15: Dry Season Polar plot of Pollutants Concentrations near the
Ammonia/urea
IEFCL -Train2 Fertilizer EIA Report
Chapter Four: Environmental Baseline 4-45
Figure 4.3.16: Wet Season Polar plot of Pollutants Concentrations near the
Ammonia/urea
IEFCL -Train2 Fertilizer EIA Report
Chapter Four: Environmental Baseline 4-46
Figure 4.3.17: Dry season Pollution Roses
Figure 4.3.18: Wet season Pollution Roses
IEFCL -Train2 Fertilizer EIA Report
Chapter Four: Environmental Baseline 4-47
The analysis carried out highlighted the compliance of air quality in the Ante Operam
scenario according to the values monitored. The modeling of emissions carried out in this
report was able to provide an insight to what emissions are expected and how they would
be dispersed from the proposed facility. All the Ante/post operam scenarios showed that
pollutants concentrations from the new plants are well below the FMEnv regulatory/IFC
guidelines standards. Hence, the impacts of the proposed ammonia/urea facility are well
below the allowable prevention of significant deterioration (PSD) increment.
Second level modeling results (Table 4.3.9) indicated that pollutants concentrations from
the proposed ammonia/urea plant are well below FMEnv and IFC permissible limits.
Results also revealed that maximum ground-level concentrations are expected to occur
up to 2.0km away from the proposed plants. The dispersion of air pollutants from the
proposed plant have a minor influence on the background concentration levels of NOx,
SOx, PM and NH3.
Modeling simulations indicated that all concentrations outside the plant are expected to
be within the concentration limits/regulation standards. Base on this, it is possible to
assume that:
Minor increments are expected in pollutant concentrations at ground level after
the operation of the new Fertilizer Plant;
Ground level concentrations of all pollutant emissions during the operation of the
proposed plant project are well below air quality regulatory standards.
All the values will be in compliance with the applicable occupational exposure
standards.
IEFCL -Train2 Fertilizer EIA Report
Chapter Four: Environmental Baseline 4-48
4.4 SOIL QUALITY
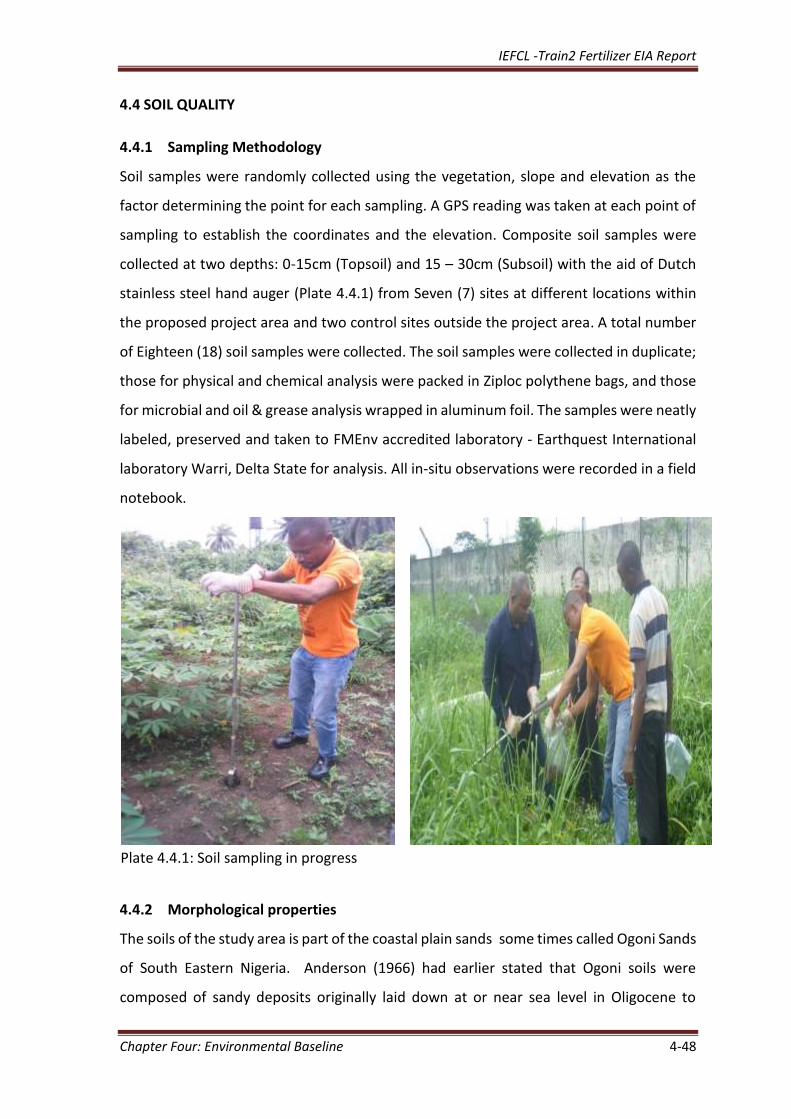
4.4.1 Sampling Methodology
Soil samples were randomly collected using the vegetation, slope and elevation as the
factor determining the point for each sampling. A GPS reading was taken at each point of
sampling to establish the coordinates and the elevation. Composite soil samples were
collected at two depths: 0-15cm (Topsoil) and 15 – 30cm (Subsoil) with the aid of Dutch
stainless steel hand auger (Plate 4.4.1) from Seven (7) sites at different locations within
the proposed project area and two control sites outside the project area. A total number
of Eighteen (18) soil samples were collected. The soil samples were collected in duplicate;
those for physical and chemical analysis were packed in Ziploc polythene bags, and those
for microbial and oil & grease analysis wrapped in aluminum foil. The samples were neatly
labeled, preserved and taken to FMEnv accredited laboratory - Earthquest International
laboratory Warri, Delta State for analysis. All in-situ observations were recorded in a field
notebook.
Plate 4.4.1: Soil sampling in progress
4.4.2 Morphological properties
The soils of the study area is part of the coastal plain sands some times called Ogoni Sands
of South Eastern Nigeria. Anderson (1966) had earlier stated that Ogoni soils were
composed of sandy deposits originally laid down at or near sea level in Oligocene to
IEFCL -Train2 Fertilizer EIA Report
Chapter Four: Environmental Baseline 4-49
Pleistocene times. The soils of the study area are coarse grained, gravelly, locally fine-
grained, poorly sorted, subangular to well rounded (Assez,1975). Ojanuga et al (1981)
stated that the genesis of these soils have resulted from cycles of soil formation which
alternated with cycles of erosion in the mid tertiary to Holocene era in Nigeria. Soil
consistency as observed during the field exercise were between wet (slightly sticky and
non sticky) and moist (friable), while soil colour were between black (10YR2/1), Dark red
(2.5/YR3/6), Brown (10YR5/3) and Strong brown (7.5YR4/6). The topography of the study
area were relatively flat with some gentle slope as observsed around station one (SS1-
Okulu Aleto).
Soils of the area with the exception of some localized variations are characterized as very
good physical features, poor inherent fertility status, low degree of acidity, low cation
exchange capacity (FAO, 1990) and predominant sandy texture.
4.4.3 Soil Physico-chemical Characteristics
The summary of results of the soil physico-chemical analysis is presented in Tables 4.4.1
and 4.4.2 for the topsoil (0 – 15 cm) and subsoil (15 – 30 cm) respectively, while detailed
results for all the sample locations are presented in Appendix 4.6. The textural
classification of the two soil depths within the study area and control site was
predominantly fine-grained fairly consolidated Loamy Sand, Sandy Loam and Sandy Clay
Loam soil (using the soil particle size matrix), with considerably low clay content. The sand,
silt and clay contents of the topsoil ranged between 64.50 – 77.00%, 5.80 – 1.10% and
13.80 – 27.00% respectively, while the subsoil recorded 58.80 – 72.20% sand, 6.10-7.90%
silt and 20.80 – 34.40% clay. The mean values obtained from the control sample locations
were not significantly different from that of the project influence zone. Similar textural
characteristics have been reported for the study area from previous studies of IEFCL-
Train1 EIA 2010. The texture of a soil determines the water absorption/infiltration rate,
the water holding capacity and migration of pollutant down the soil strata (Agede 2009).
It also determines the amount of soil aeration, ease of tilling, and soil fertility (Udoh 1986).
High sand percentage observed on the soil result is indicative of porous nature of the soil,
which may encourage easy percolation of nutrients and pollutants to the groundwater
table in the event of chemical spillage, while the moderate clay content of the soil is
IEFCL -Train2 Fertilizer EIA Report
Chapter Four: Environmental Baseline 4-50
suggestive of greater cohesion, plasticity and aggregation of the soil particles for a better
soil structure and possible soil stability especially under high engineering activity.
Other parameters that determine the dynamics of pollutants in soil include bulk density
and porosity. The bulk density in particular gives a rough estimation of the aeration and
permeability of a soil. The lower the bulk density, the higher the soil permeability to
encourage free movement of liquid substance across the soil horizon (Nwachukwu 2016).
Bulk density varies with structural conditions of the soil. Therefore, it is related to packing
and often used as a measure for soil structure. The results obtained in this study revealed
porosity range of 43.80 – 53.20% and bulk density 0.15 – 0.28 for topsoil, while the
respective values for subsoil ranged from 44.00 – 56.08 % and 0.18 – 0.33 g/cm3, with no
significantly different (p>0.05) when compared to the control values. The low soil bulk
density result revealed that no form of soil compaction is in progress within and outside
the project influence zone (Nwachukwu 2016).
The strength of soil changes with respect to soil water content. Thus, the soil moisture
content ranged from 0.24 – 1.15% and 0.26 – 0.51% for topsoil and subsoil respectively.
Both the moisture content and bulk density recorded in the cause of this study depict
strong soil with respect to compressibility. Brady and Weil, (1999) remarked that soil
moisture, plasticity and particle size of soils determine stability of soils in response to
loading forces from traffic, tillage and building foundations. Clay content, nature of clay,
nature of exchangeable cations and organic matter content of soils vary, and these
influence the plasticity and general activity levels of soils.
The soil reaction falls within acidic pH range of 4.70 – 5.60 (5.22 ± 0.39) for topsoil and
4.30 – 6.80 (5.37 ± 1.03) for subsoil indicating that the soil is slightly acidic, which is typical
of a Niger Delta soil (Isirimah 1987). pH is often considered in terms of the soil capability
and suitability to support plants growth. This is because the value of the free H+
concentration in a soil influences the availability of nutrient elements and biochemical
reactions in the soil (Bohn et al., 1984). Agriculturally, soil pH has so far been proven to
influence nutrient absorption and plant growth through the availability of plant nutrient
and presence of toxic element harmful to plants. Therefore soil pH is like an index
IEFCL -Train2 Fertilizer EIA Report
Chapter Four: Environmental Baseline 4-51
parameter to estimate concentration of other parameters in the soil, just like low pH
increases heavy metal concentration in the soil (Itanna 1998); pH <6.5 affect the
availability of Phosphorus (Brady, 1974). Consequently, the present pH condition of the
soil may enhance the solubility and mobility of heavy metals and their subsequent
percolation to the groundwater table but may slow down microbial degradation. The
optimum pH values for pollutant-degrading microorganisms range from 6.5 to 7.5
(Margesin and Schinner, 2005).
The Organic matter content of the soil ranged from 0.09 – 0.21% at the topsoil, while the
subsoil ranged from 0.08 – 0.16% indicating low organic matter content of both topsoil
and subsoil according to FAO (1990) classification, which also reflected in the Total
Organic Carbon results recorded during this studied. Spatial variation in the measured
TOM values across the sampling stations was not too high with coefficient of variation less
than 25%. Soil organic matter contributes to soil aggregation and reduces susceptibility to
erosion (Brady and Weil, 1996). As such many important soil properties are dependent
on the quality of organic matter present in soil. These properties include the absorption
and retention of water, reserves of exchanged bases, the capacity to supply nitrogen,
phosphorus and other elements to growing crops, stability of soil structure, adequacy of
aeration and pollutants bioavailability (Margesin and Schinner, 2005). In fact pollutant
concentrations in soil are normalized with the organic matter in conjunction with clay
content (DPR, 2002).
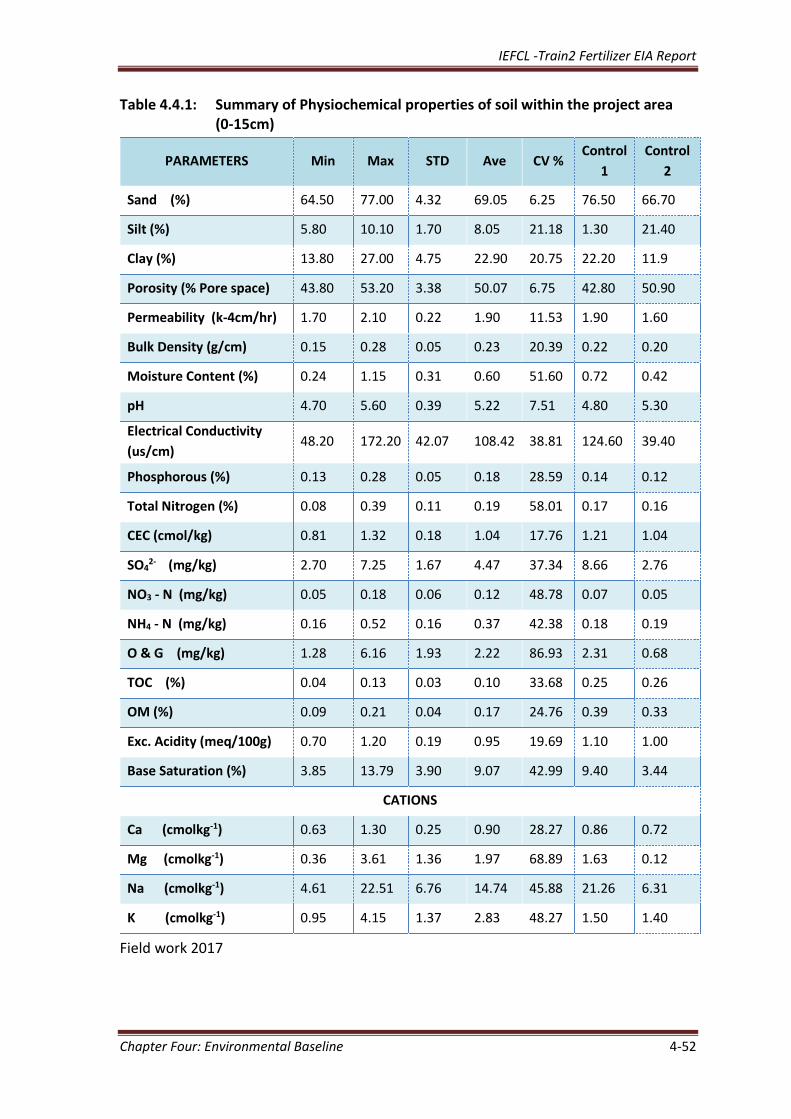
IEFCL -Train2 Fertilizer EIA Report
Chapter Four: Environmental Baseline 4-52
Table 4.4.1: Summary of Physiochemical properties of soil within the project area (0-15cm)
PARAMETERS Min Max STD Ave CV % Control
1
Control
2
Sand (%) 64.50 77.00 4.32 69.05 6.25 76.50 66.70
Silt (%) 5.80 10.10 1.70 8.05 21.18 1.30 21.40
Clay (%) 13.80 27.00 4.75 22.90 20.75 22.20 11.9
Porosity (% Pore space) 43.80 53.20 3.38 50.07 6.75 42.80 50.90
Permeability (k-4cm/hr) 1.70 2.10 0.22 1.90 11.53 1.90 1.60
Bulk Density (g/cm) 0.15 0.28 0.05 0.23 20.39 0.22 0.20
Moisture Content (%) 0.24 1.15 0.31 0.60 51.60 0.72 0.42
pH 4.70 5.60 0.39 5.22 7.51 4.80 5.30
Electrical Conductivity
(us/cm) 48.20 172.20 42.07 108.42 38.81 124.60 39.40
Phosphorous (%) 0.13 0.28 0.05 0.18 28.59 0.14 0.12
Total Nitrogen (%) 0.08 0.39 0.11 0.19 58.01 0.17 0.16
CEC (cmol/kg) 0.81 1.32 0.18 1.04 17.76 1.21 1.04
SO42- (mg/kg) 2.70 7.25 1.67 4.47 37.34 8.66 2.76
NO3 - N (mg/kg) 0.05 0.18 0.06 0.12 48.78 0.07 0.05
NH4 - N (mg/kg) 0.16 0.52 0.16 0.37 42.38 0.18 0.19
O & G (mg/kg) 1.28 6.16 1.93 2.22 86.93 2.31 0.68
TOC (%) 0.04 0.13 0.03 0.10 33.68 0.25 0.26
OM (%) 0.09 0.21 0.04 0.17 24.76 0.39 0.33
Exc. Acidity (meq/100g) 0.70 1.20 0.19 0.95 19.69 1.10 1.00
Base Saturation (%) 3.85 13.79 3.90 9.07 42.99 9.40 3.44
CATIONS
Ca (cmolkg-1) 0.63 1.30 0.25 0.90 28.27 0.86 0.72
Mg (cmolkg-1) 0.36 3.61 1.36 1.97 68.89 1.63 0.12
Na (cmolkg-1) 4.61 22.51 6.76 14.74 45.88 21.26 6.31
K (cmolkg-1) 0.95 4.15 1.37 2.83 48.27 1.50 1.40
Field work 2017
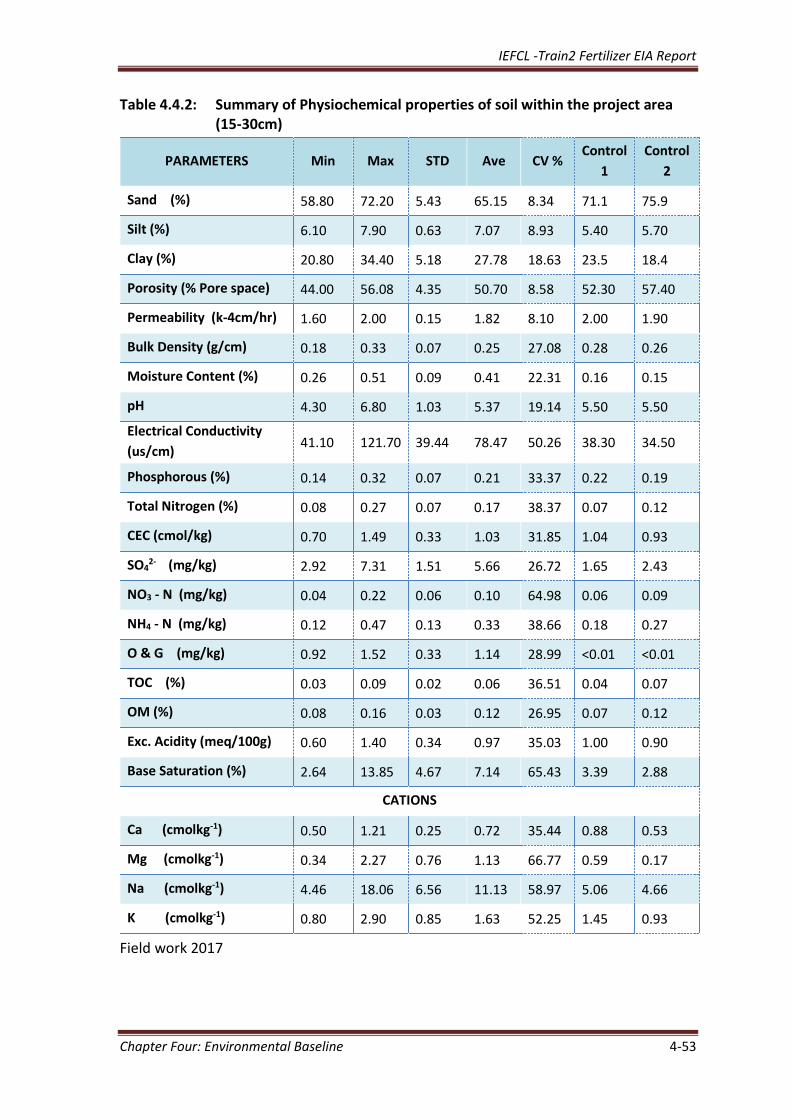
IEFCL -Train2 Fertilizer EIA Report
Chapter Four: Environmental Baseline 4-53
Table 4.4.2: Summary of Physiochemical properties of soil within the project area (15-30cm)
PARAMETERS Min Max STD Ave CV % Control
1
Control
2
Sand (%) 58.80 72.20 5.43 65.15 8.34 71.1 75.9
Silt (%) 6.10 7.90 0.63 7.07 8.93 5.40 5.70
Clay (%) 20.80 34.40 5.18 27.78 18.63 23.5 18.4
Porosity (% Pore space) 44.00 56.08 4.35 50.70 8.58 52.30 57.40
Permeability (k-4cm/hr) 1.60 2.00 0.15 1.82 8.10 2.00 1.90
Bulk Density (g/cm) 0.18 0.33 0.07 0.25 27.08 0.28 0.26
Moisture Content (%) 0.26 0.51 0.09 0.41 22.31 0.16 0.15
pH 4.30 6.80 1.03 5.37 19.14 5.50 5.50
Electrical Conductivity
(us/cm) 41.10 121.70 39.44 78.47 50.26 38.30 34.50
Phosphorous (%) 0.14 0.32 0.07 0.21 33.37 0.22 0.19
Total Nitrogen (%) 0.08 0.27 0.07 0.17 38.37 0.07 0.12
CEC (cmol/kg) 0.70 1.49 0.33 1.03 31.85 1.04 0.93
SO42- (mg/kg) 2.92 7.31 1.51 5.66 26.72 1.65 2.43
NO3 - N (mg/kg) 0.04 0.22 0.06 0.10 64.98 0.06 0.09
NH4 - N (mg/kg) 0.12 0.47 0.13 0.33 38.66 0.18 0.27
O & G (mg/kg) 0.92 1.52 0.33 1.14 28.99 <0.01 <0.01
TOC (%) 0.03 0.09 0.02 0.06 36.51 0.04 0.07
OM (%) 0.08 0.16 0.03 0.12 26.95 0.07 0.12
Exc. Acidity (meq/100g) 0.60 1.40 0.34 0.97 35.03 1.00 0.90
Base Saturation (%) 2.64 13.85 4.67 7.14 65.43 3.39 2.88
CATIONS
Ca (cmolkg-1) 0.50 1.21 0.25 0.72 35.44 0.88 0.53
Mg (cmolkg-1) 0.34 2.27 0.76 1.13 66.77 0.59 0.17
Na (cmolkg-1) 4.46 18.06 6.56 11.13 58.97 5.06 4.66
K (cmolkg-1) 0.80 2.90 0.85 1.63 52.25 1.45 0.93
Field work 2017
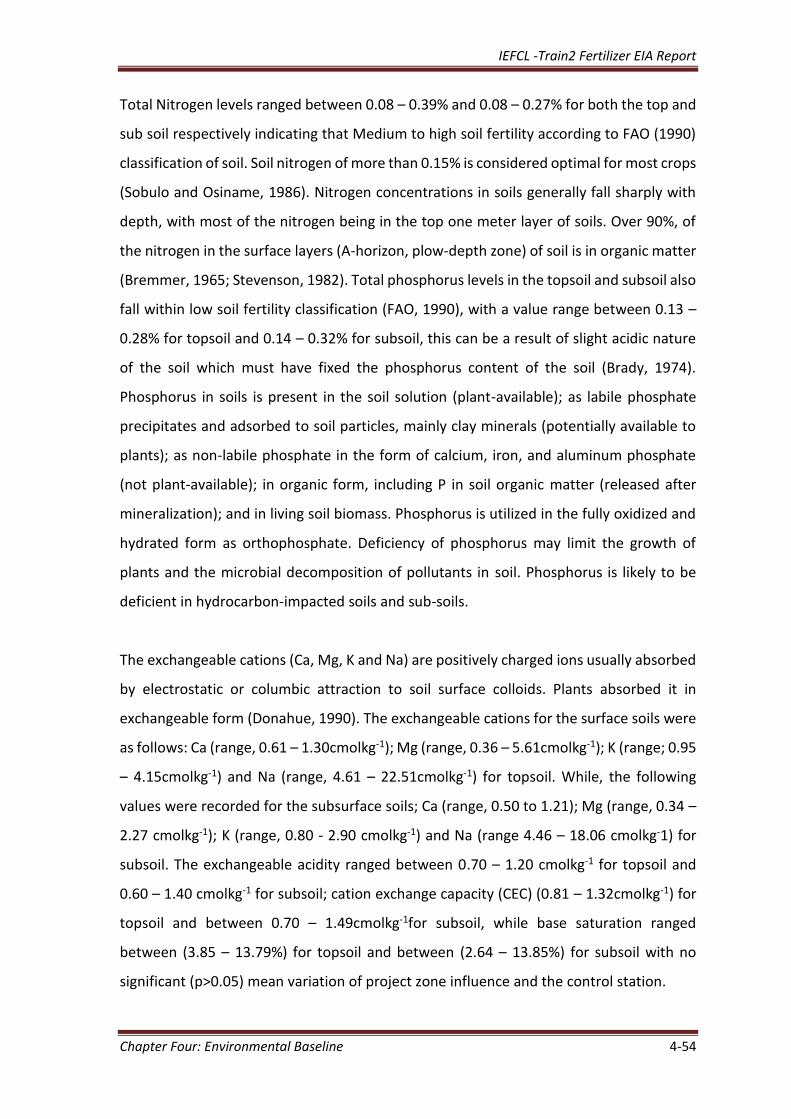
IEFCL -Train2 Fertilizer EIA Report
Chapter Four: Environmental Baseline 4-54
Total Nitrogen levels ranged between 0.08 – 0.39% and 0.08 – 0.27% for both the top and
sub soil respectively indicating that Medium to high soil fertility according to FAO (1990)
classification of soil. Soil nitrogen of more than 0.15% is considered optimal for most crops
(Sobulo and Osiname, 1986). Nitrogen concentrations in soils generally fall sharply with
depth, with most of the nitrogen being in the top one meter layer of soils. Over 90%, of
the nitrogen in the surface layers (A-horizon, plow-depth zone) of soil is in organic matter
(Bremmer, 1965; Stevenson, 1982). Total phosphorus levels in the topsoil and subsoil also
fall within low soil fertility classification (FAO, 1990), with a value range between 0.13 –
0.28% for topsoil and 0.14 – 0.32% for subsoil, this can be a result of slight acidic nature
of the soil which must have fixed the phosphorus content of the soil (Brady, 1974).
Phosphorus in soils is present in the soil solution (plant-available); as labile phosphate
precipitates and adsorbed to soil particles, mainly clay minerals (potentially available to
plants); as non-labile phosphate in the form of calcium, iron, and aluminum phosphate
(not plant-available); in organic form, including P in soil organic matter (released after
mineralization); and in living soil biomass. Phosphorus is utilized in the fully oxidized and
hydrated form as orthophosphate. Deficiency of phosphorus may limit the growth of
plants and the microbial decomposition of pollutants in soil. Phosphorus is likely to be
deficient in hydrocarbon-impacted soils and sub-soils.
The exchangeable cations (Ca, Mg, K and Na) are positively charged ions usually absorbed
by electrostatic or columbic attraction to soil surface colloids. Plants absorbed it in
exchangeable form (Donahue, 1990). The exchangeable cations for the surface soils were
as follows: Ca (range, 0.61 – 1.30cmolkg-1); Mg (range, 0.36 – 5.61cmolkg-1); K (range; 0.95
– 4.15cmolkg-1) and Na (range, 4.61 – 22.51cmolkg-1) for topsoil. While, the following
values were recorded for the subsurface soils; Ca (range, 0.50 to 1.21); Mg (range, 0.34 –
2.27 cmolkg-1); K (range, 0.80 - 2.90 cmolkg-1) and Na (range 4.46 – 18.06 cmolkg-1) for
subsoil. The exchangeable acidity ranged between 0.70 – 1.20 cmolkg-1 for topsoil and
0.60 – 1.40 cmolkg-1 for subsoil; cation exchange capacity (CEC) (0.81 – 1.32cmolkg-1) for
topsoil and between 0.70 – 1.49cmolkg-1for subsoil, while base saturation ranged
between (3.85 – 13.79%) for topsoil and between (2.64 – 13.85%) for subsoil with no
significant (p>0.05) mean variation of project zone influence and the control station.
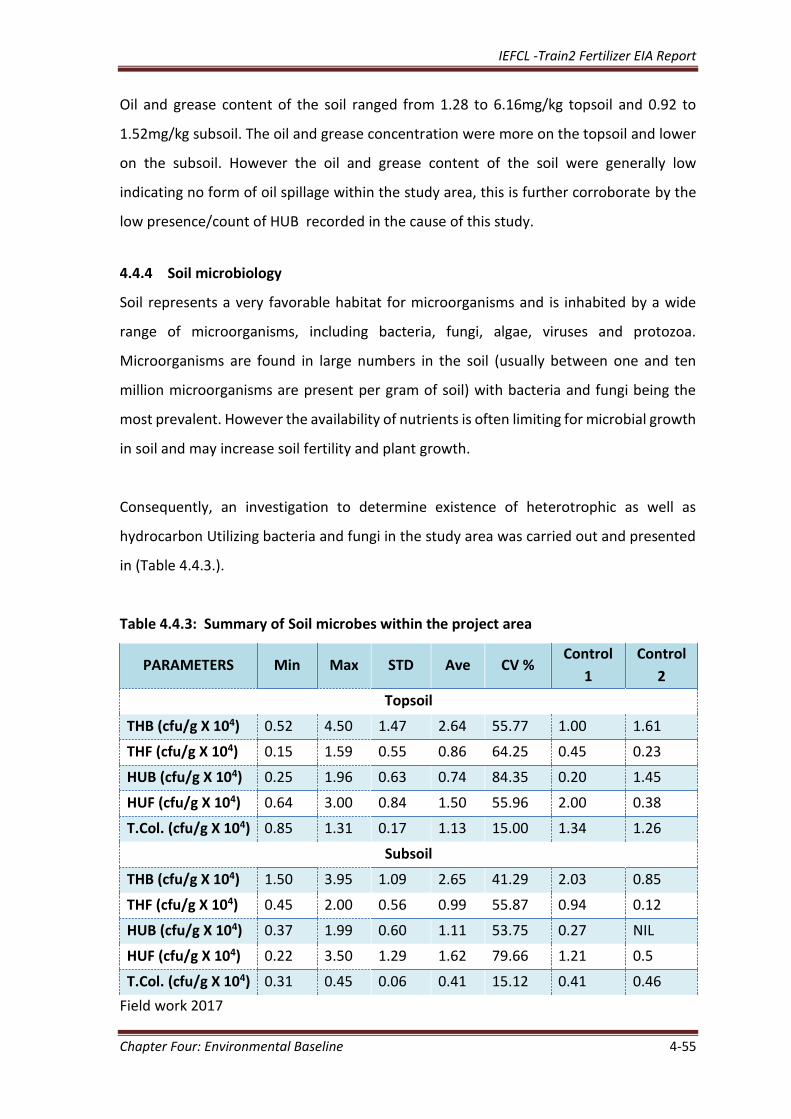
IEFCL -Train2 Fertilizer EIA Report
Chapter Four: Environmental Baseline 4-55
Oil and grease content of the soil ranged from 1.28 to 6.16mg/kg topsoil and 0.92 to
1.52mg/kg subsoil. The oil and grease concentration were more on the topsoil and lower
on the subsoil. However the oil and grease content of the soil were generally low
indicating no form of oil spillage within the study area, this is further corroborate by the
low presence/count of HUB recorded in the cause of this study.
4.4.4 Soil microbiology
Soil represents a very favorable habitat for microorganisms and is inhabited by a wide
range of microorganisms, including bacteria, fungi, algae, viruses and protozoa.
Microorganisms are found in large numbers in the soil (usually between one and ten
million microorganisms are present per gram of soil) with bacteria and fungi being the
most prevalent. However the availability of nutrients is often limiting for microbial growth
in soil and may increase soil fertility and plant growth.
Consequently, an investigation to determine existence of heterotrophic as well as
hydrocarbon Utilizing bacteria and fungi in the study area was carried out and presented
in (Table 4.4.3.).
Table 4.4.3: Summary of Soil microbes within the project area
PARAMETERS Min Max STD Ave CV % Control
1
Control
2
Topsoil
THB (cfu/g X 104) 0.52 4.50 1.47 2.64 55.77 1.00 1.61
THF (cfu/g X 104) 0.15 1.59 0.55 0.86 64.25 0.45 0.23
HUB (cfu/g X 104) 0.25 1.96 0.63 0.74 84.35 0.20 1.45
HUF (cfu/g X 104) 0.64 3.00 0.84 1.50 55.96 2.00 0.38
T.Col. (cfu/g X 104) 0.85 1.31 0.17 1.13 15.00 1.34 1.26
Subsoil
THB (cfu/g X 104) 1.50 3.95 1.09 2.65 41.29 2.03 0.85
THF (cfu/g X 104) 0.45 2.00 0.56 0.99 55.87 0.94 0.12
HUB (cfu/g X 104) 0.37 1.99 0.60 1.11 53.75 0.27 NIL
HUF (cfu/g X 104) 0.22 3.50 1.29 1.62 79.66 1.21 0.5
T.Col. (cfu/g X 104) 0.31 0.45 0.06 0.41 15.12 0.41 0.46
Field work 2017
IEFCL -Train2 Fertilizer EIA Report
Chapter Four: Environmental Baseline 4-56
The total population of total heterotrophic bacteria (THB) ranged from 0.52x10⁴ to
4.50x10⁴(cfu/g) for topsoil and 1.50x10⁴– 3.95x10⁴(cfu/g) for subsoil; total heterotrophic
fungi (THF) ranged from 0.15x10⁴ – 1.59x10⁴(cfu/g) for topsoil and 0.45x10⁴–
2.00x10⁴(cfu/g) for subsoil. The population of total hydrocarbon utilizing bacteria (THUB)
ranged from 0.25x10⁴– 1.96x10⁴(cfu/g) for topsoil and 0.37x10⁴– 1.99x10⁴(cfu/g) for
subsoil, and the total hydrocarbon utilizing fungi (THUF) ranged from 0.64x10⁴ –
3.00x10⁴(cfu/g) for topsoil and 0.22x10⁴– 3.50x10⁴(cfu/g) for subsoil. Comparatively, the
hydrocarbon utilizers were the least in population. Therefore, it can be said that there is
no significant hydrocarbon pollution around the study area to encourage the significant
presence of this bacteria, this is further justified by low concentration of oil and grease
content in the soil samples.
4.4.5 Soil Fauna
The soil macro-fauna identified through visual observation in the study area include
various arthropods (Myricarid striata, Dorylus fimbriatus, Glomens marginata), Annelids
(Earthworms) and Nematodes (Acanthamoeba polyphaga, Acrobeloides sp, Porcellia
scraber). These organisms are primary consumers; decomposers, mixers and utilizers of
energy stored in plants and plant residues, and contribute to the recycling of nutrients.
They also help in soil particle aggregation to encourage soil stability. Others are secondary
consumers such as centipedes and spiders. These animals consume smaller sized animals
and they, also may serve as food for organisms occupying higher levels of the food chain.
Soil fauna are notable and are critical in the biological turnover and nutrients release of
plant residues by fragmenting the plant residues, resulting in enhanced microorganism
activities and grazing of micro flora by fauna. Anderson and Fletcher (1988) noted a
symbiotic interaction between earthworm and microorganism in the breakdown and
fragmentation of organic matter.
4.4.6 Heavy metals
Heavy metals analysis in the soil samples revealed Iron (Fe) having the highest
concentration (Mean 6847.25mg/kg topsoil and 6685.20mg/kg subsoil), while mercury
(Hg) and Vanadium (v) recorded the lowest concentration <0.05mg/kg, Lead
concentration ranged from 38.14 to 51.16 topsoil and 31.03 to 48.74mg/kg in subsoil.
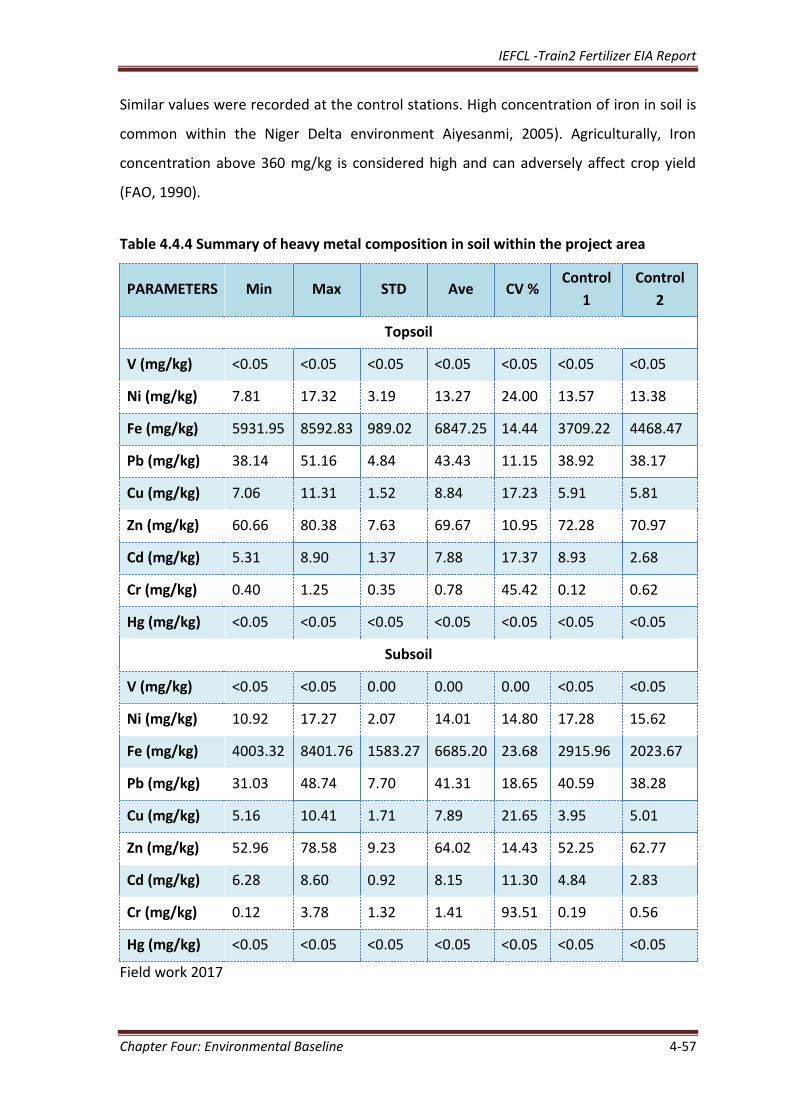
IEFCL -Train2 Fertilizer EIA Report
Chapter Four: Environmental Baseline 4-57
Similar values were recorded at the control stations. High concentration of iron in soil is
common within the Niger Delta environment Aiyesanmi, 2005). Agriculturally, Iron
concentration above 360 mg/kg is considered high and can adversely affect crop yield
(FAO, 1990).
Table 4.4.4 Summary of heavy metal composition in soil within the project area
PARAMETERS Min Max STD Ave CV % Control
1
Control
2
Topsoil
V (mg/kg) <0.05 <0.05 <0.05 <0.05 <0.05 <0.05 <0.05
Ni (mg/kg) 7.81 17.32 3.19 13.27 24.00 13.57 13.38
Fe (mg/kg) 5931.95 8592.83 989.02 6847.25 14.44 3709.22 4468.47
Pb (mg/kg) 38.14 51.16 4.84 43.43 11.15 38.92 38.17
Cu (mg/kg) 7.06 11.31 1.52 8.84 17.23 5.91 5.81
Zn (mg/kg) 60.66 80.38 7.63 69.67 10.95 72.28 70.97
Cd (mg/kg) 5.31 8.90 1.37 7.88 17.37 8.93 2.68
Cr (mg/kg) 0.40 1.25 0.35 0.78 45.42 0.12 0.62
Hg (mg/kg) <0.05 <0.05 <0.05 <0.05 <0.05 <0.05 <0.05
Subsoil
V (mg/kg) <0.05 <0.05 0.00 0.00 0.00 <0.05 <0.05
Ni (mg/kg) 10.92 17.27 2.07 14.01 14.80 17.28 15.62
Fe (mg/kg) 4003.32 8401.76 1583.27 6685.20 23.68 2915.96 2023.67
Pb (mg/kg) 31.03 48.74 7.70 41.31 18.65 40.59 38.28
Cu (mg/kg) 5.16 10.41 1.71 7.89 21.65 3.95 5.01
Zn (mg/kg) 52.96 78.58 9.23 64.02 14.43 52.25 62.77
Cd (mg/kg) 6.28 8.60 0.92 8.15 11.30 4.84 2.83
Cr (mg/kg) 0.12 3.78 1.32 1.41 93.51 0.19 0.56
Hg (mg/kg) <0.05 <0.05 <0.05 <0.05 <0.05 <0.05 <0.05
Field work 2017
IEFCL -Train2 Fertilizer EIA Report
Chapter Four: Environmental Baseline 4-58
4.4.7 Land use
Land use within the study area is largely affected by large extent of human activities such
as industrilisation, municipal and agricultural activities. High industrialization, which is at
its peak within the area has resulted to visible reduction in agricutural activity of the study
area. The notable landuse within the study area included Indorama complex (which is
playing host to the proposed IEFCL-Train2 fertilizer project), NNPC estate adjcent to
Indorama complex, Onura shrine, Port Harcourt Refinery, fuel stations and road
infrastucture network. Comparatively, Port Harcourt Refinery, Indorama complex and
NNPC Estate occupies prominent space in the land use of the study area.
IEFCL -Train2 Fertilizer EIA Report
Chapter Four: Environmental Baseline 4-59
4.5 VEGETATION AND WILDLIFE
The ecological study covered flora and fauna species compositions, in terms of species
that are abundant, common, occasional and rare. The tables and figures below are used
to explain prevailing situations in the study area. In addition the study area lies within the
riparian lowland forest with a two-layer canopy characteristic and a low lying flat terrain
that experiences seasonal flooding. The soils of the IEFCL Train2 which is sandy-loam,
clayey-loam, clayey and poorly drained. The soil of the study area is wet and moist in the
wet season but dry and friable during the dry season. However, the proposed IEFCL Train2
site had little vegetation components which are mainly herbaceous in nature as compared
to the surroundings of the Train1 facility. No endangered and endemic species were
encountered in the study area. Hence, the project will not affect any form of wildlife or
plant in the IEFCL Train2 project environs as well as in the study area.
4.5.1 Vegetation
4.5.1.1 Tree/Shrub species composition
Within the study area, a total of thirteen tree/ shrub species occurred and out of which
no specie (tree/shrub) was abundant but rather, one specie was found to be common and
that specie was Elaeis guinensis. In the same vein, four species were occasional and they
include; Anthonota macrophylla, Alchornea cordifolia, Alstonia boonei and Harungana
madascariensis. However, eight species were found to be rare and they are; Ficus
exasperate, Psidium guajava, Anthocleista vogelii, Musanga cecropioides, Anacardium
occidentalis, Bambusa vulgaris, Baphia nitida and Persea Americana.
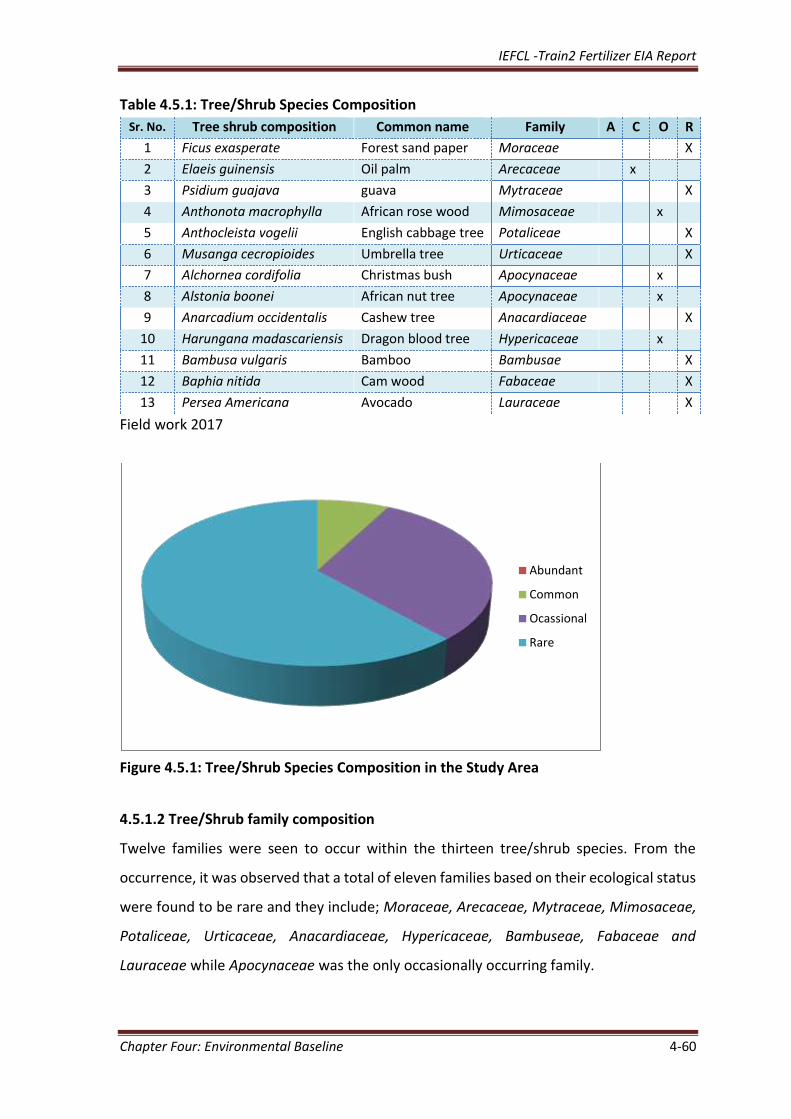
IEFCL -Train2 Fertilizer EIA Report
Chapter Four: Environmental Baseline 4-60
Table 4.5.1: Tree/Shrub Species Composition
Sr. No. Tree shrub composition Common name Family A C O R
1 Ficus exasperate Forest sand paper Moraceae X
2 Elaeis guinensis Oil palm Arecaceae x
3 Psidium guajava guava Mytraceae X
4 Anthonota macrophylla African rose wood Mimosaceae x
5 Anthocleista vogelii English cabbage tree Potaliceae X
6 Musanga cecropioides Umbrella tree Urticaceae X
7 Alchornea cordifolia Christmas bush Apocynaceae x
8 Alstonia boonei African nut tree Apocynaceae x
9 Anarcadium occidentalis Cashew tree Anacardiaceae X
10 Harungana madascariensis Dragon blood tree Hypericaceae x
11 Bambusa vulgaris Bamboo Bambusae X
12 Baphia nitida Cam wood Fabaceae X
13 Persea Americana Avocado Lauraceae X
Field work 2017
Figure 4.5.1: Tree/Shrub Species Composition in the Study Area
4.5.1.2 Tree/Shrub family composition
Twelve families were seen to occur within the thirteen tree/shrub species. From the
occurrence, it was observed that a total of eleven families based on their ecological status
were found to be rare and they include; Moraceae, Arecaceae, Mytraceae, Mimosaceae,
Potaliceae, Urticaceae, Anacardiaceae, Hypericaceae, Bambuseae, Fabaceae and
Lauraceae while Apocynaceae was the only occasionally occurring family.
Abundant
Common
Ocassional
Rare
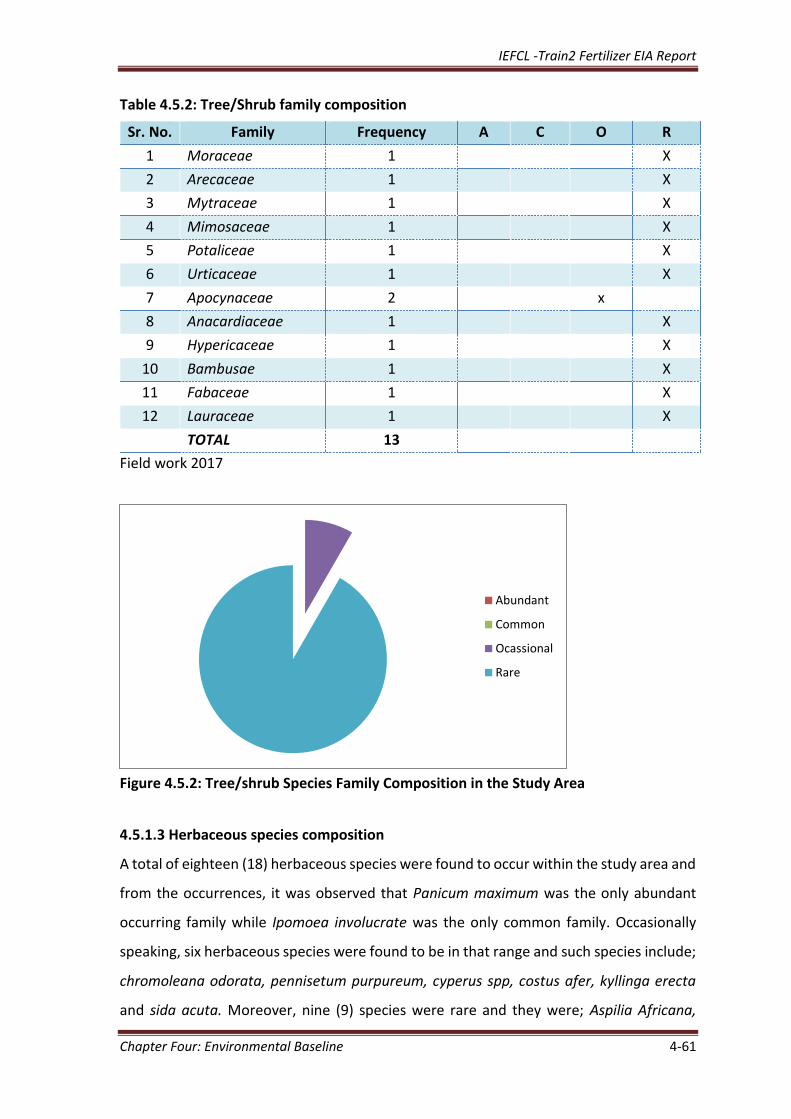
IEFCL -Train2 Fertilizer EIA Report
Chapter Four: Environmental Baseline 4-61
Table 4.5.2: Tree/Shrub family composition
Sr. No. Family Frequency A C O R
1 Moraceae 1 X
2 Arecaceae 1 X
3 Mytraceae 1 X
4 Mimosaceae 1 X
5 Potaliceae 1 X
6 Urticaceae 1 X
7 Apocynaceae 2 x
8 Anacardiaceae 1 X
9 Hypericaceae 1 X
10 Bambusae 1 X
11 Fabaceae 1 X
12 Lauraceae 1 X
TOTAL 13
Field work 2017
Figure 4.5.2: Tree/shrub Species Family Composition in the Study Area
4.5.1.3 Herbaceous species composition
A total of eighteen (18) herbaceous species were found to occur within the study area and
from the occurrences, it was observed that Panicum maximum was the only abundant
occurring family while Ipomoea involucrate was the only common family. Occasionally
speaking, six herbaceous species were found to be in that range and such species include;
chromoleana odorata, pennisetum purpureum, cyperus spp, costus afer, kyllinga erecta
and sida acuta. Moreover, nine (9) species were rare and they were; Aspilia Africana,
Abundant
Common
Ocassional
Rare
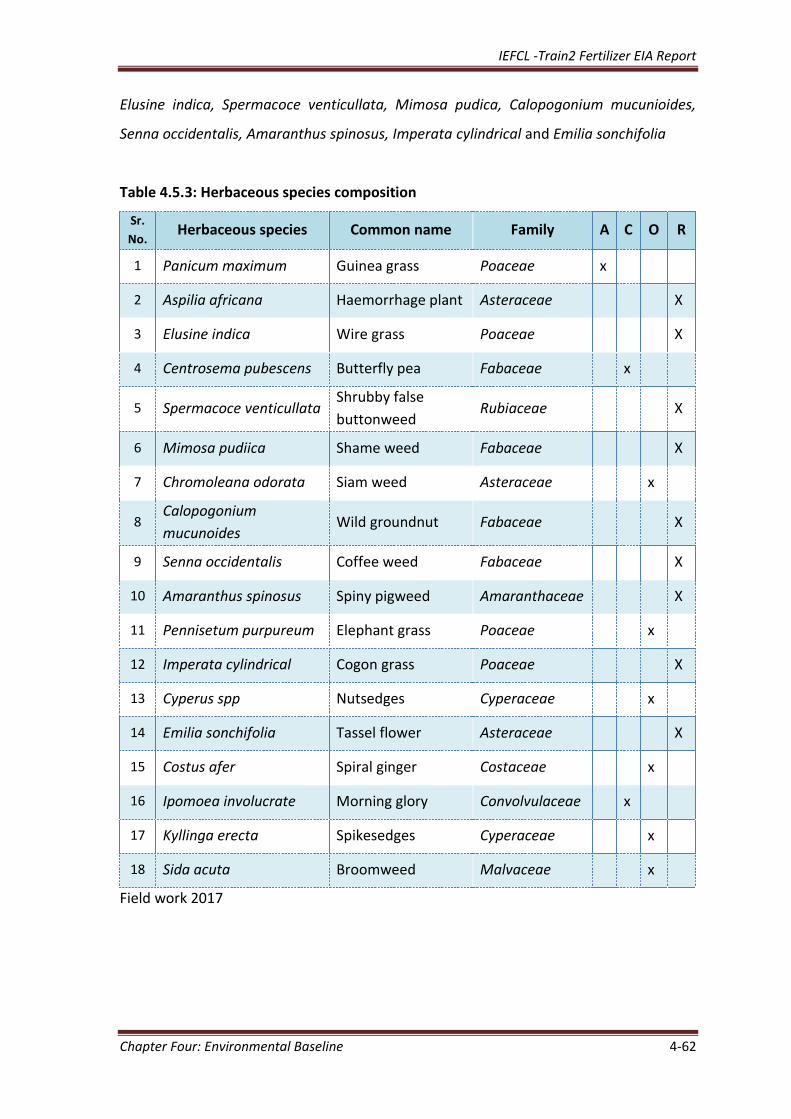
IEFCL -Train2 Fertilizer EIA Report
Chapter Four: Environmental Baseline 4-62
Elusine indica, Spermacoce venticullata, Mimosa pudica, Calopogonium mucunioides,
Senna occidentalis, Amaranthus spinosus, Imperata cylindrical and Emilia sonchifolia
Table 4.5.3: Herbaceous species composition
Sr.
No. Herbaceous species Common name Family A C O R
1 Panicum maximum Guinea grass Poaceae x
2 Aspilia africana Haemorrhage plant Asteraceae X
3 Elusine indica Wire grass Poaceae X
4 Centrosema pubescens Butterfly pea Fabaceae x
5 Spermacoce venticullata Shrubby false
buttonweed Rubiaceae X
6 Mimosa pudiica Shame weed Fabaceae X
7 Chromoleana odorata Siam weed Asteraceae x
8 Calopogonium
mucunoides Wild groundnut Fabaceae X
9 Senna occidentalis Coffee weed Fabaceae X
10 Amaranthus spinosus Spiny pigweed Amaranthaceae X
11 Pennisetum purpureum Elephant grass Poaceae x
12 Imperata cylindrical Cogon grass Poaceae X
13 Cyperus spp Nutsedges Cyperaceae x
14 Emilia sonchifolia Tassel flower Asteraceae X
15 Costus afer Spiral ginger Costaceae x
16 Ipomoea involucrate Morning glory Convolvulaceae x
17 Kyllinga erecta Spikesedges Cyperaceae x
18 Sida acuta Broomweed Malvaceae x
Field work 2017
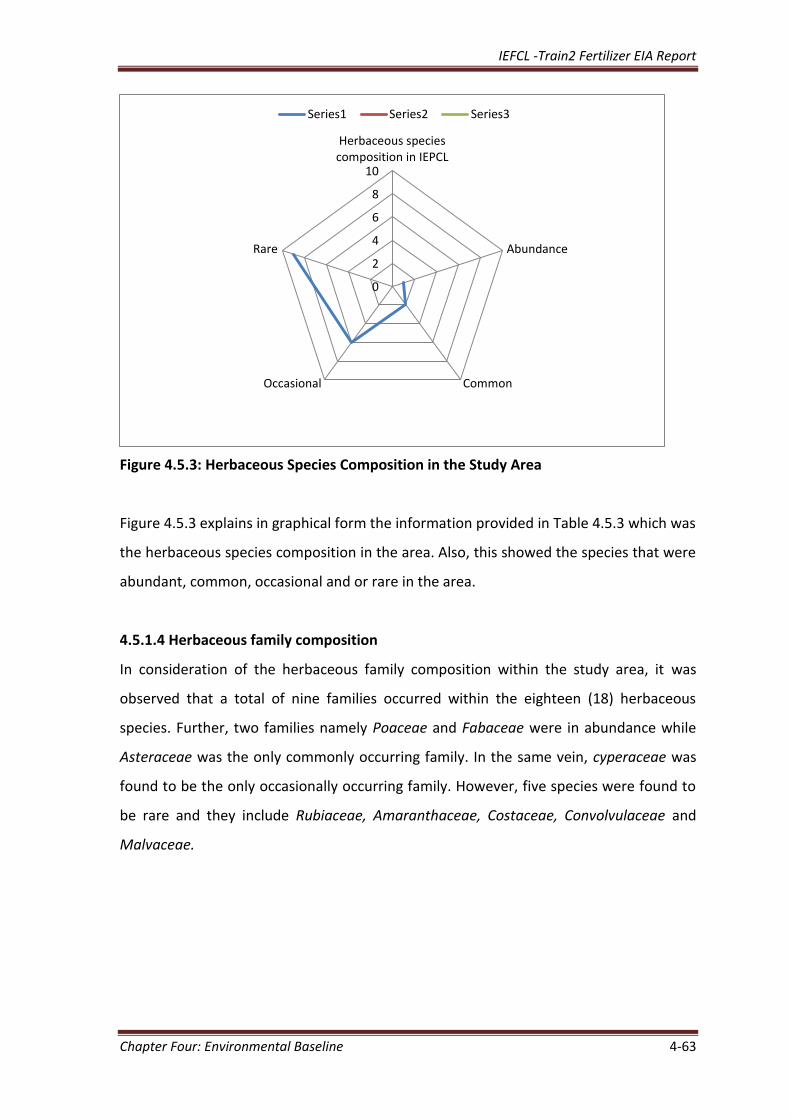
IEFCL -Train2 Fertilizer EIA Report
Chapter Four: Environmental Baseline 4-63
Figure 4.5.3: Herbaceous Species Composition in the Study Area
Figure 4.5.3 explains in graphical form the information provided in Table 4.5.3 which was
the herbaceous species composition in the area. Also, this showed the species that were
abundant, common, occasional and or rare in the area.
4.5.1.4 Herbaceous family composition
In consideration of the herbaceous family composition within the study area, it was
observed that a total of nine families occurred within the eighteen (18) herbaceous
species. Further, two families namely Poaceae and Fabaceae were in abundance while
Asteraceae was the only commonly occurring family. In the same vein, cyperaceae was
found to be the only occasionally occurring family. However, five species were found to
be rare and they include Rubiaceae, Amaranthaceae, Costaceae, Convolvulaceae and
Malvaceae.
0
2
4
6
8
10
Herbaceous speciescomposition in IEPCL
Abundance
CommonOccasional
Rare
Series1 Series2 Series3
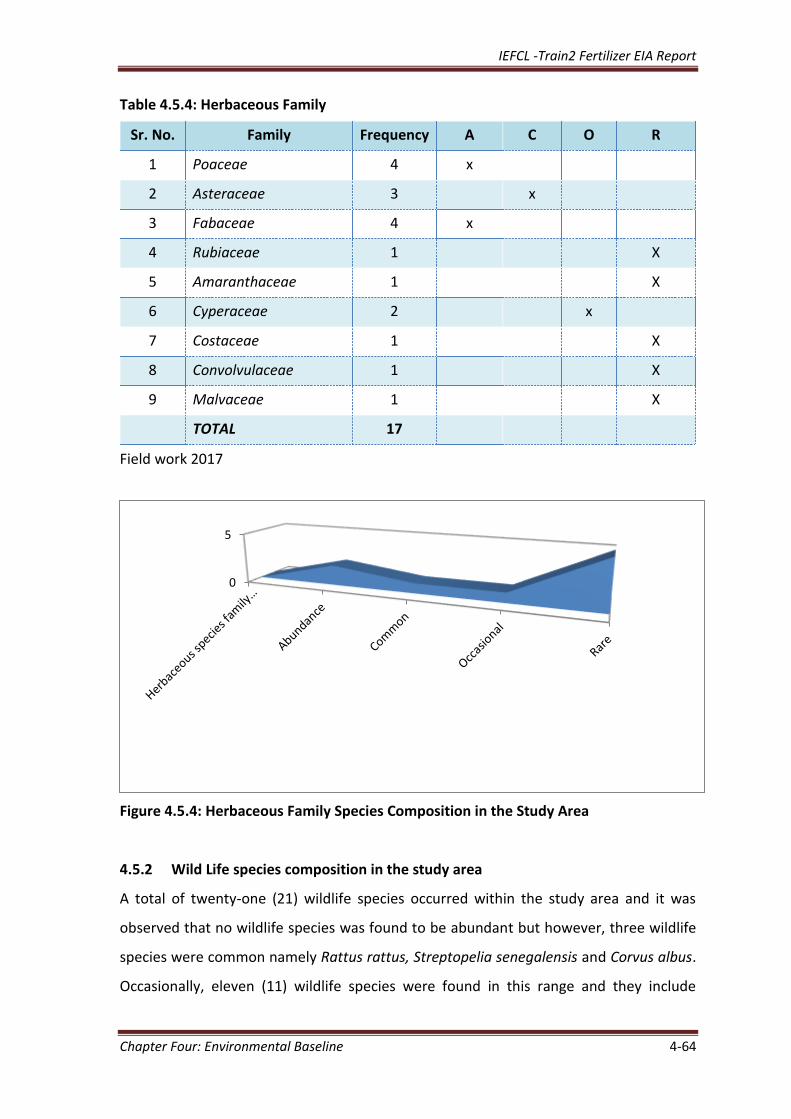
IEFCL -Train2 Fertilizer EIA Report
Chapter Four: Environmental Baseline 4-64
Table 4.5.4: Herbaceous Family
Sr. No. Family Frequency A C O R
1 Poaceae 4 x
2 Asteraceae 3 x
3 Fabaceae 4 x
4 Rubiaceae 1 X
5 Amaranthaceae 1 X
6 Cyperaceae 2 x
7 Costaceae 1 X
8 Convolvulaceae 1 X
9 Malvaceae 1 X
TOTAL 17
Field work 2017
Figure 4.5.4: Herbaceous Family Species Composition in the Study Area
4.5.2 Wild Life species composition in the study area
A total of twenty-one (21) wildlife species occurred within the study area and it was
observed that no wildlife species was found to be abundant but however, three wildlife
species were common namely Rattus rattus, Streptopelia senegalensis and Corvus albus.
Occasionally, eleven (11) wildlife species were found in this range and they include
0
5
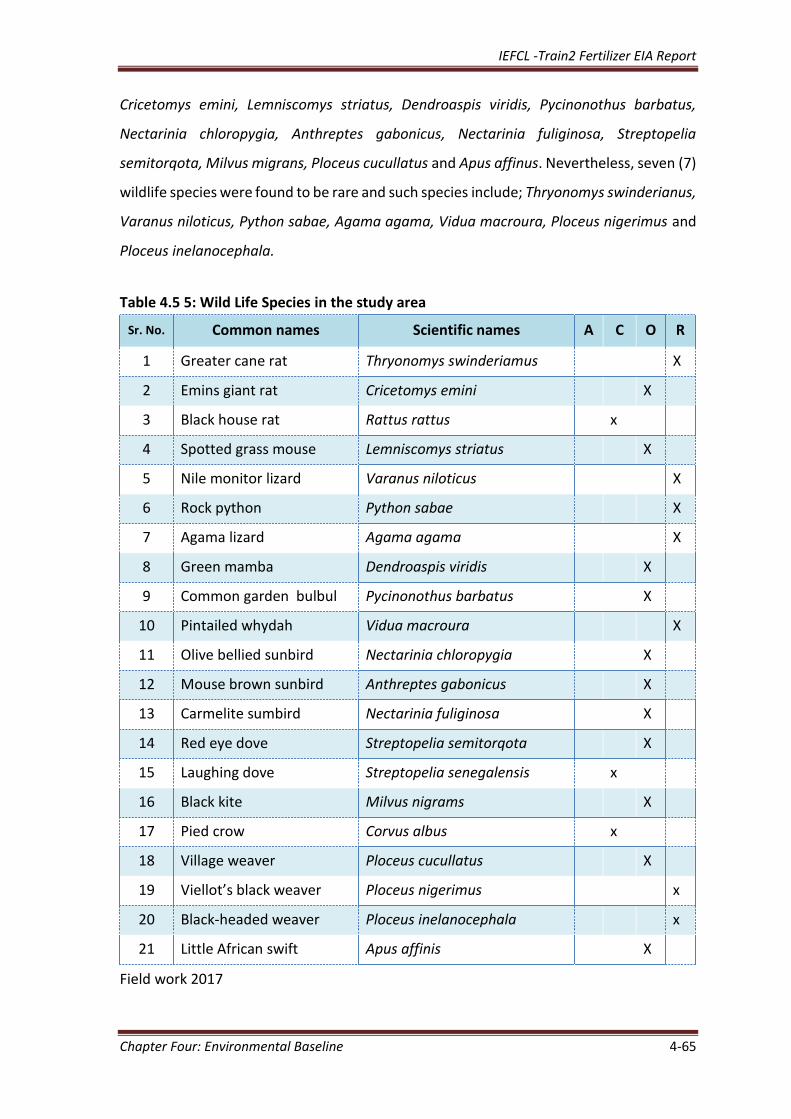
IEFCL -Train2 Fertilizer EIA Report
Chapter Four: Environmental Baseline 4-65
Cricetomys emini, Lemniscomys striatus, Dendroaspis viridis, Pycinonothus barbatus,
Nectarinia chloropygia, Anthreptes gabonicus, Nectarinia fuliginosa, Streptopelia
semitorqota, Milvus migrans, Ploceus cucullatus and Apus affinus. Nevertheless, seven (7)
wildlife species were found to be rare and such species include; Thryonomys swinderianus,
Varanus niloticus, Python sabae, Agama agama, Vidua macroura, Ploceus nigerimus and
Ploceus inelanocephala.
Table 4.5 5: Wild Life Species in the study area
Sr. No. Common names Scientific names A C O R
1 Greater cane rat Thryonomys swinderiamus X
2 Emins giant rat Cricetomys emini X
3 Black house rat Rattus rattus x
4 Spotted grass mouse Lemniscomys striatus X
5 Nile monitor lizard Varanus niloticus X
6 Rock python Python sabae X
7 Agama lizard Agama agama X
8 Green mamba Dendroaspis viridis X
9 Common garden bulbul Pycinonothus barbatus X
10 Pintailed whydah Vidua macroura X
11 Olive bellied sunbird Nectarinia chloropygia X
12 Mouse brown sunbird Anthreptes gabonicus X
13 Carmelite sumbird Nectarinia fuliginosa X
14 Red eye dove Streptopelia semitorqota X
15 Laughing dove Streptopelia senegalensis x
16 Black kite Milvus nigrams X
17 Pied crow Corvus albus x
18 Village weaver Ploceus cucullatus X
19 Viellot’s black weaver Ploceus nigerimus x
20 Black-headed weaver Ploceus inelanocephala x
21 Little African swift Apus affinis X
Field work 2017
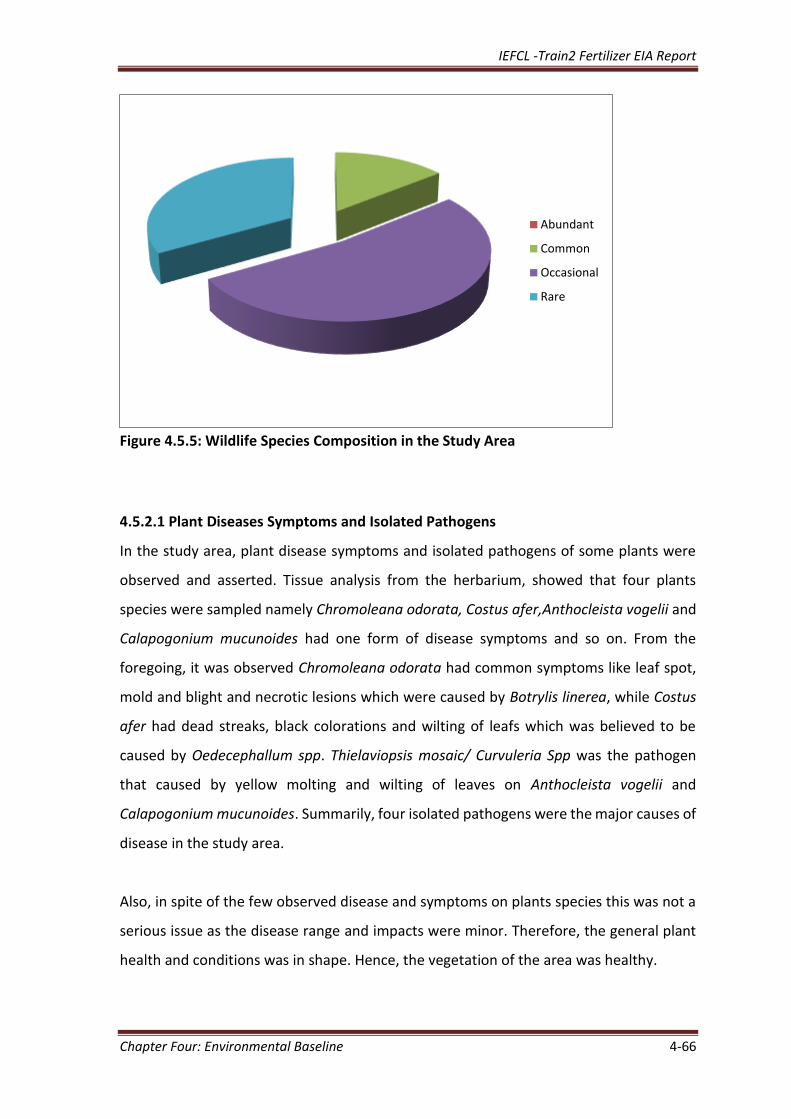
IEFCL -Train2 Fertilizer EIA Report
Chapter Four: Environmental Baseline 4-66
Figure 4.5.5: Wildlife Species Composition in the Study Area
4.5.2.1 Plant Diseases Symptoms and Isolated Pathogens
In the study area, plant disease symptoms and isolated pathogens of some plants were
observed and asserted. Tissue analysis from the herbarium, showed that four plants
species were sampled namely Chromoleana odorata, Costus afer,Anthocleista vogelii and
Calapogonium mucunoides had one form of disease symptoms and so on. From the
foregoing, it was observed Chromoleana odorata had common symptoms like leaf spot,
mold and blight and necrotic lesions which were caused by Botrylis linerea, while Costus
afer had dead streaks, black colorations and wilting of leafs which was believed to be
caused by Oedecephallum spp. Thielaviopsis mosaic/ Curvuleria Spp was the pathogen
that caused by yellow molting and wilting of leaves on Anthocleista vogelii and
Calapogonium mucunoides. Summarily, four isolated pathogens were the major causes of
disease in the study area.
Also, in spite of the few observed disease and symptoms on plants species this was not a
serious issue as the disease range and impacts were minor. Therefore, the general plant
health and conditions was in shape. Hence, the vegetation of the area was healthy.
Abundant
Common
Occasional
Rare
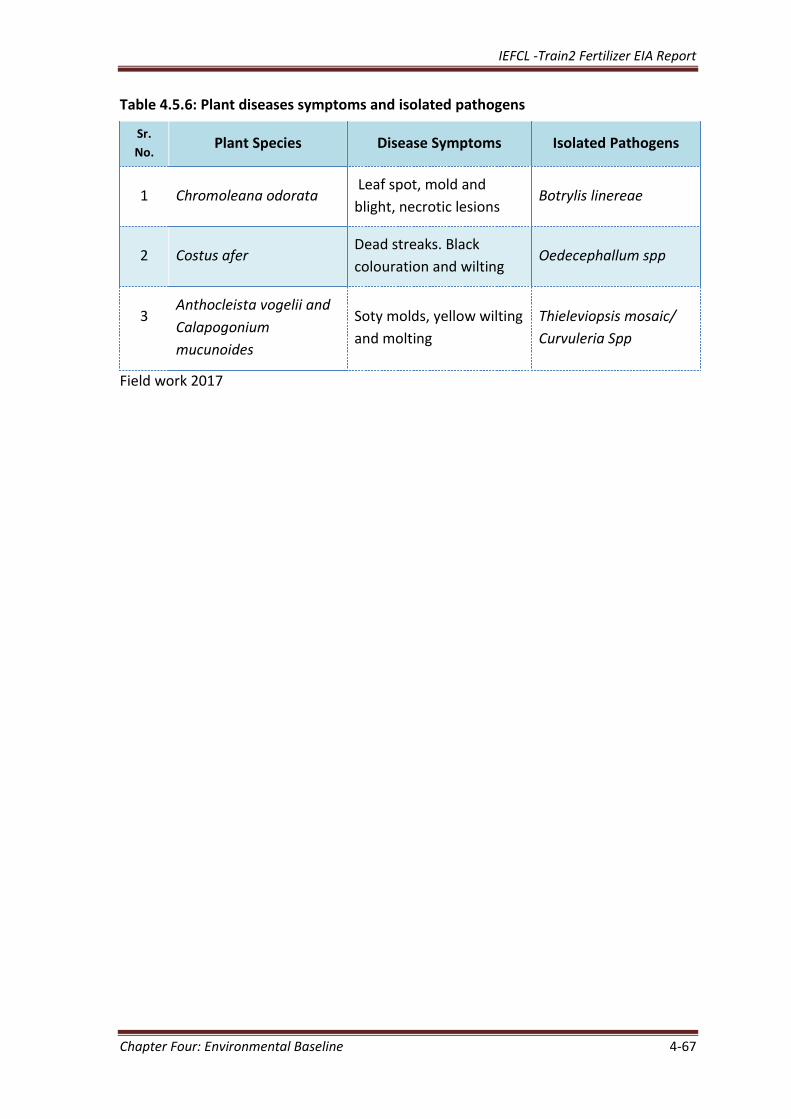
IEFCL -Train2 Fertilizer EIA Report
Chapter Four: Environmental Baseline 4-67
Table 4.5.6: Plant diseases symptoms and isolated pathogens
Sr.
No. Plant Species Disease Symptoms Isolated Pathogens
1 Chromoleana odorata Leaf spot, mold and
blight, necrotic lesions Botrylis linereae
2 Costus afer Dead streaks. Black
colouration and wilting Oedecephallum spp
3
Anthocleista vogelii and
Calapogonium
mucunoides
Soty molds, yellow wilting
and molting
Thieleviopsis mosaic/
Curvuleria Spp
Field work 2017
IEFCL -Train2 Fertilizer EIA Report
Chapter Four: Environmental Baseline 4-68
4.6. HYDROGEOLOGY
Geologically, the site is underlain by the coastal plain sands, which in this area is overlain
by firm – stiff clay/sandy clay sediments belonging to the pleistocenic formation.
The general geology of the area essentially reflects the influence of movements of rivers
in the Niger Delta and their search for lines of flow to the sea with consequent deposition
of transported sediments. In broad terms, the area may be considered flat. The site is
accessible from East-West Road – Onne – (from Eleme Junction to Alsea-Eleme
Community) via Eleme refinery axis.
Environmental/Geophysical and Geotechnical/Groundwater data of the underlying soils
are needed for the study of the subsurface conditions. Consequently, Environmental,
Geophysical survey (VES), were performed at the existing environmental Geotechnical
boreholes/monitoring boreholes perimeter to conduct a limited subsoil investigation at
the site.
4.6.1 Geomorphology
The geomorphology of the study area Indorama Complex and Alesa Eleme corresponds
with that of Niger Delta. The area forms part of Niger Delta, which extends from the
Forcados in the West to Calabar River in the East and covers a distance of about 350km.
The Delta has a narrow coastal strip varying in width from a few meters to about 16m, it
makes up more than half of the Southern Nigeria basin, which includes all the sedimentary
sequences, bounded by Benin hinge line in the West and the Calabar hinge line on the
East. The Delta is tropical one, being composed mainly of fine grained deltaic sediments.
The area is tectonically stable and is situated in the equatorial rain forest belt. The Niger
Delta is characterized into five (5) major inter gradational geomorphologic units (Allen,
1965; short and stumble, 1975, and Wigwe, 1975). These units occur from land to sea as.
Dry flatland and plain
Dry deltaic plain with rare fresh water swamps
Extensive fresh water swamps and meander belts
Saltwater mangrove swamps, estuaries, creeks and lagoons
Abandoned and active coastal Islands and beaches
The study area falls under dry flat land plain. There is dense rain forest vegetation in area.
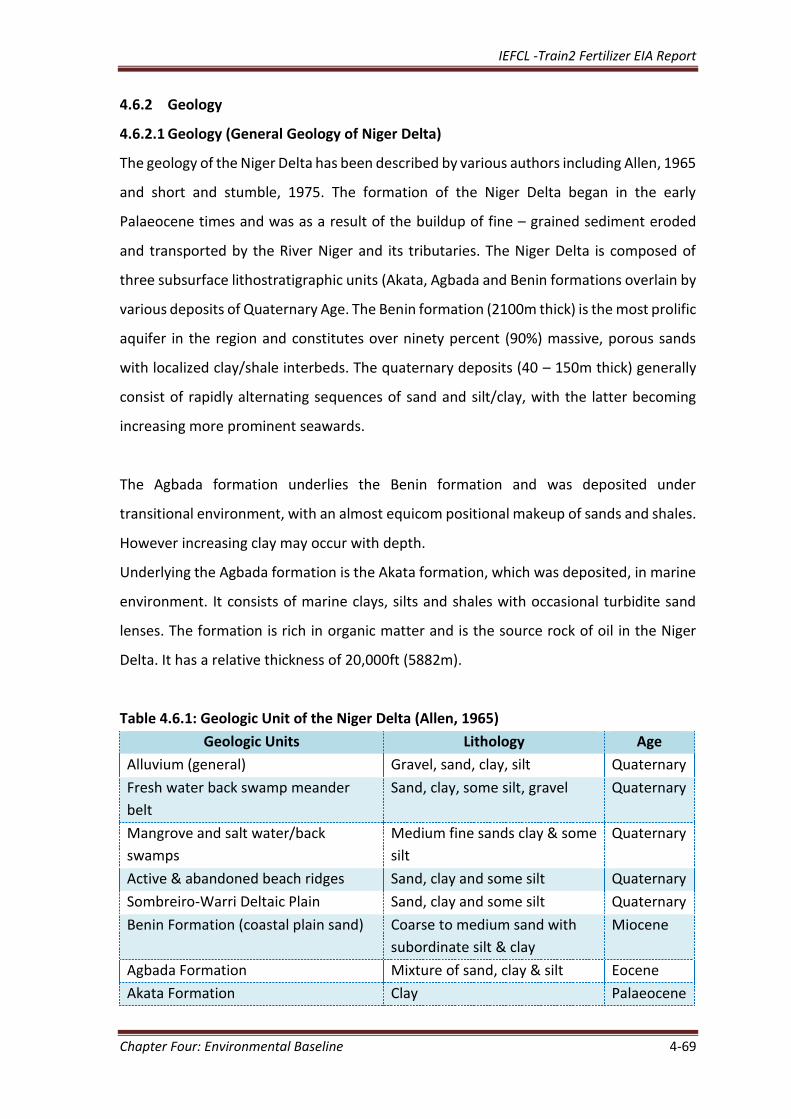
IEFCL -Train2 Fertilizer EIA Report
Chapter Four: Environmental Baseline 4-69
4.6.2 Geology
4.6.2.1 Geology (General Geology of Niger Delta)
The geology of the Niger Delta has been described by various authors including Allen, 1965
and short and stumble, 1975. The formation of the Niger Delta began in the early
Palaeocene times and was as a result of the buildup of fine – grained sediment eroded
and transported by the River Niger and its tributaries. The Niger Delta is composed of
three subsurface lithostratigraphic units (Akata, Agbada and Benin formations overlain by
various deposits of Quaternary Age. The Benin formation (2100m thick) is the most prolific
aquifer in the region and constitutes over ninety percent (90%) massive, porous sands
with localized clay/shale interbeds. The quaternary deposits (40 – 150m thick) generally
consist of rapidly alternating sequences of sand and silt/clay, with the latter becoming
increasing more prominent seawards.
The Agbada formation underlies the Benin formation and was deposited under
transitional environment, with an almost equicom positional makeup of sands and shales.
However increasing clay may occur with depth.
Underlying the Agbada formation is the Akata formation, which was deposited, in marine
environment. It consists of marine clays, silts and shales with occasional turbidite sand
lenses. The formation is rich in organic matter and is the source rock of oil in the Niger
Delta. It has a relative thickness of 20,000ft (5882m).
Table 4.6.1: Geologic Unit of the Niger Delta (Allen, 1965)
Geologic Units Lithology Age
Alluvium (general) Gravel, sand, clay, silt Quaternary
Fresh water back swamp meander
belt
Sand, clay, some silt, gravel Quaternary
Mangrove and salt water/back
swamps
Medium fine sands clay & some
silt
Quaternary
Active & abandoned beach ridges Sand, clay and some silt Quaternary
Sombreiro-Warri Deltaic Plain Sand, clay and some silt Quaternary
Benin Formation (coastal plain sand) Coarse to medium sand with
subordinate silt & clay
Miocene
Agbada Formation Mixture of sand, clay & silt Eocene
Akata Formation Clay Palaeocene
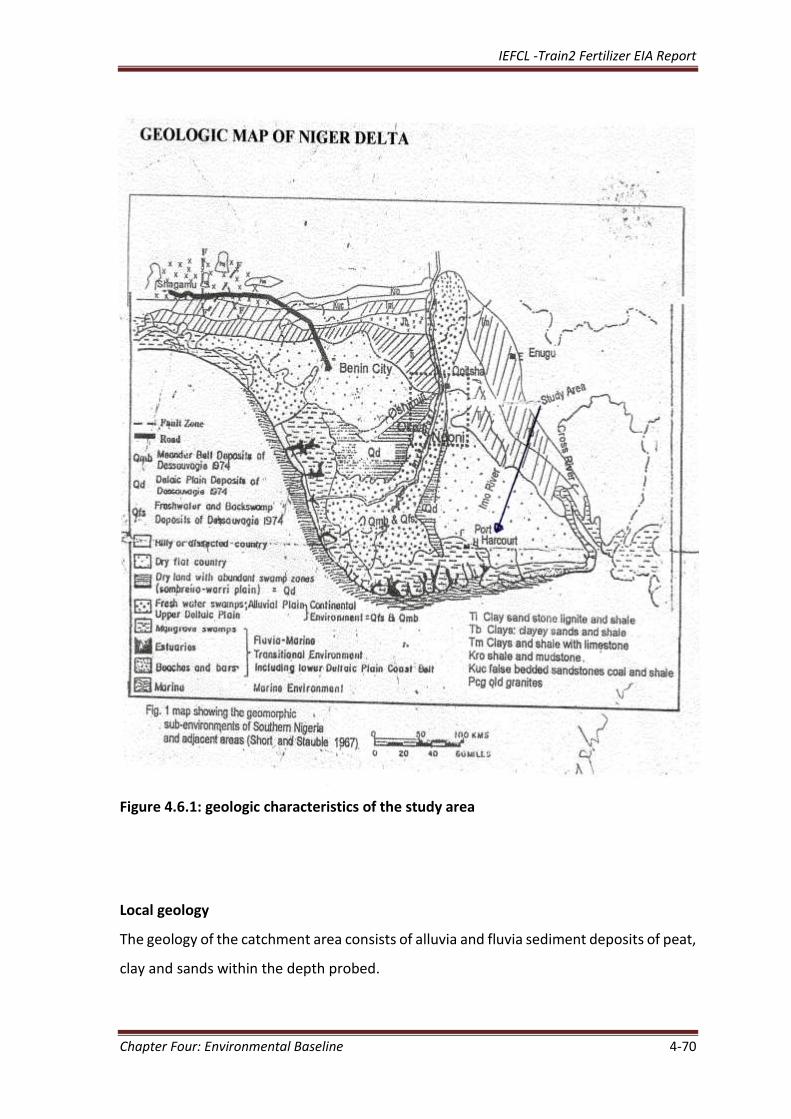
IEFCL -Train2 Fertilizer EIA Report
Chapter Four: Environmental Baseline 4-70
Figure 4.6.1: geologic characteristics of the study area
Local geology
The geology of the catchment area consists of alluvia and fluvia sediment deposits of peat,
clay and sands within the depth probed.
IEFCL -Train2 Fertilizer EIA Report
Chapter Four: Environmental Baseline 4-71
Terrain
The terrain within the local study area originally consists of mud flats with slight slope and
swamps with dry sand ridges (sand fill) on which the facilities and settlements are found.
A number of creeks and streams that empty into Okulu Stream that empties into Okirika
Channel which empties into Bonny River also exist.
4.6.3 Hydrology
The hydrologic system in the catchment area can be conceptualized by series of flat and
dipping topography towards Okulu Stream flow direction and other valleys (wetland).
To assess the hydrology of ground water in area three (3) existing boreholes were
considered borehole 1-3 in triangular array. This is to capture ground water flow direction
and the heterogeneity of the subsurface across the area. The position and the slope of the
water table (potentiometric surface in confined aquifer) is determined by measuring the
position of the water level in wells from a fixed measuring point. The direction of slope of
the water table is also important because it indicates the direction of ground water flow.
However, if the depth to water in a non-flowing well (hw) is subtracted from the altitude
of the measuring point (z) the result is the total head (ht)
Z – hw = ht
Using the above relation to determine the slope of water table i.e. direction of ground
water movement. The respective total head (ht) of the borehole wells are determined
relative to a common datum plane. In summary, the direction of ground water movement
and the hydraulic gradient can be determined if the following data are available for at
least 3 wells located in any triangular arrangement.
Relative geographical position of the wells
Distance between the wells
Total head at each well
The ground water flow direction was determined following the graphical constructional
approach of R.C Health (U.S Geological Survey Water supply Paper 2220). The triangular
plot indicating the direction(s) of ground water flow is presented below while the
respective parameters of boreholes are stated below.
IEFCL -Train2 Fertilizer EIA Report
Chapter Four: Environmental Baseline 4-72
Borehole 1
Altitude, (z2=20.5m (asl)
Depth water level, (hw) 6.5m
Total head, (ht)=14m (asl)
Borehole 2
Altitude, Z=18m (asl)
Depth to water level, hw= 6.1m
Total head (ht) =11.9 (asl)
Borehole 3
Altitude z=24.6m (asl)
Depth to water level, hw=7.6m
Total head (ht)=17m (asl)
As indicated in figure 4.6.2 below (flow direction chart) the general flow direction in the
vicinity of the catchment area is to the South-East.
This is supported by the regional factors such as SSE trending pattern of Affluent River,
topographic conditions as well as buried stream channels (surface outflow) in the study
area.
Precipitation infiltrates the over burden vadose zone (clay and sand), surface
impoundments before recharging the sand and gravel shallow aquifer and very slowly
discharges naturally into the stream/rivers. Also within the study area water leaves the
shallow aquifer through ground water withdrawal by pumping from the existing water
boreholes supplies and evapo-transpiration by capillarity rise, surface run-off from the
built-up areas and plant areas into the drainage. There are good network open drainage
system all over with man-hol in places where the run-off entered and empties into the
stream water body in the area. Following Darcy’s law (velocity is proportional to both the
hydraulic conductivity of the formation and the hydraulic gradient) more of in the
horizontal flow. Also vertical flow of ground water and contaminants by gravity causes the
leakage from the aquifer into adjacent strata.
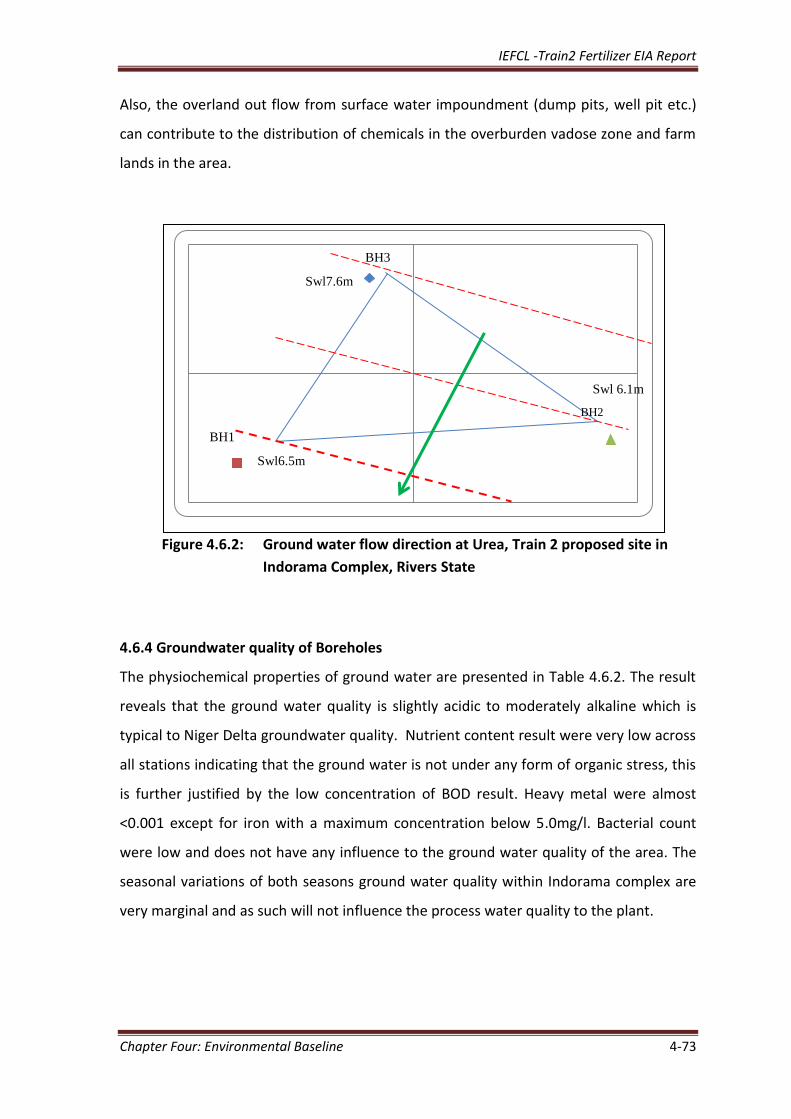
IEFCL -Train2 Fertilizer EIA Report
Chapter Four: Environmental Baseline 4-73
Also, the overland out flow from surface water impoundment (dump pits, well pit etc.)
can contribute to the distribution of chemicals in the overburden vadose zone and farm
lands in the area.
Figure 4.6.2: Ground water flow direction at Urea, Train 2 proposed site in
Indorama Complex, Rivers State
4.6.4 Groundwater quality of Boreholes
The physiochemical properties of ground water are presented in Table 4.6.2. The result
reveals that the ground water quality is slightly acidic to moderately alkaline which is
typical to Niger Delta groundwater quality. Nutrient content result were very low across
all stations indicating that the ground water is not under any form of organic stress, this
is further justified by the low concentration of BOD result. Heavy metal were almost
<0.001 except for iron with a maximum concentration below 5.0mg/l. Bacterial count
were low and does not have any influence to the ground water quality of the area. The
seasonal variations of both seasons ground water quality within Indorama complex are
very marginal and as such will not influence the process water quality to the plant.
Swl 6.1m
BH2
Swl7.6m
BH3
BH1
Swl6.5m
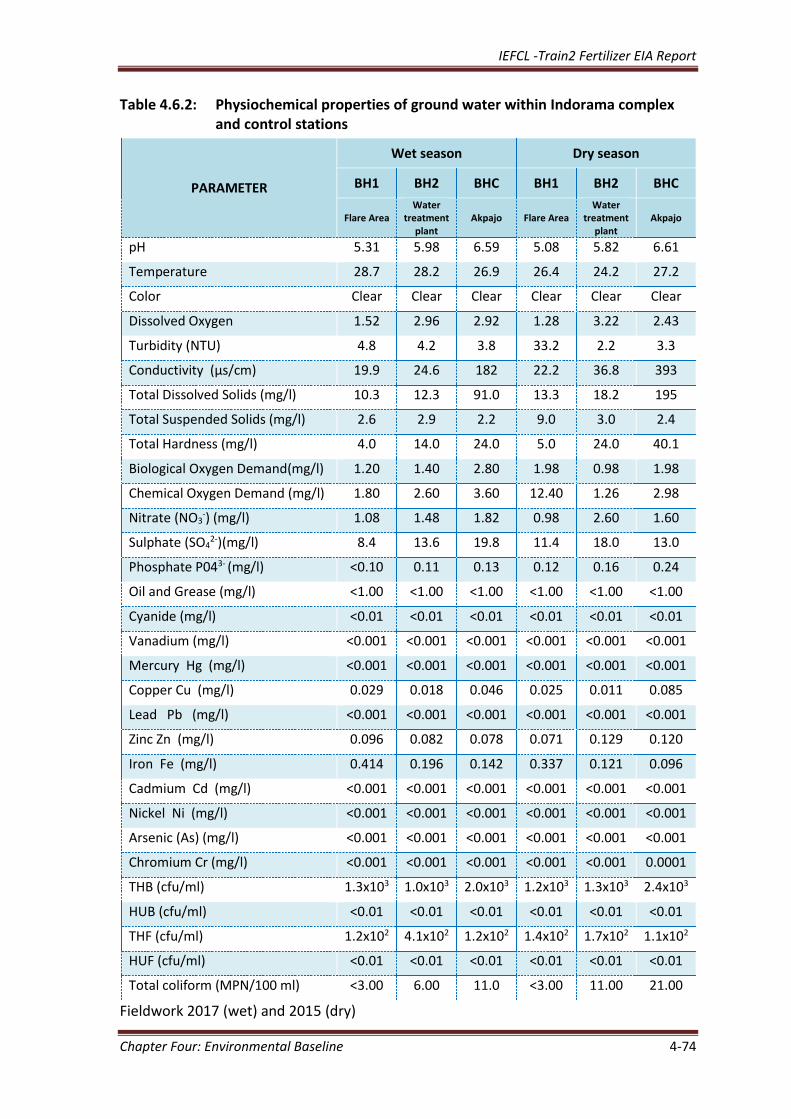
IEFCL -Train2 Fertilizer EIA Report
Chapter Four: Environmental Baseline 4-74
Table 4.6.2: Physiochemical properties of ground water within Indorama complex and control stations
Fieldwork 2017 (wet) and 2015 (dry)
PARAMETER
Wet season Dry season
BH1 BH2 BHC BH1 BH2 BHC
Flare Area Water
treatment plant
Akpajo Flare Area Water
treatment plant
Akpajo
pH 5.31 5.98 6.59 5.08 5.82 6.61
Temperature 28.7 28.2 26.9 26.4 24.2 27.2
Color Clear Clear Clear Clear Clear Clear
Dissolved Oxygen 1.52 2.96 2.92 1.28 3.22 2.43
Turbidity (NTU) 4.8 4.2 3.8 33.2 2.2 3.3
Conductivity (µs/cm) 19.9 24.6 182 22.2 36.8 393
Total Dissolved Solids (mg/l) 10.3 12.3 91.0 13.3 18.2 195
Total Suspended Solids (mg/l) 2.6 2.9 2.2 9.0 3.0 2.4
Total Hardness (mg/l) 4.0 14.0 24.0 5.0 24.0 40.1
Biological Oxygen Demand(mg/l) 1.20 1.40 2.80 1.98 0.98 1.98
Chemical Oxygen Demand (mg/l) 1.80 2.60 3.60 12.40 1.26 2.98
Nitrate (NO3-) (mg/l) 1.08 1.48 1.82 0.98 2.60 1.60
Sulphate (SO42-)(mg/l) 8.4 13.6 19.8 11.4 18.0 13.0
Phosphate P043- (mg/l) <0.10 0.11 0.13 0.12 0.16 0.24
Oil and Grease (mg/l) <1.00 <1.00 <1.00 <1.00 <1.00 <1.00
Cyanide (mg/l) <0.01 <0.01 <0.01 <0.01 <0.01 <0.01
Vanadium (mg/l) <0.001 <0.001 <0.001 <0.001 <0.001 <0.001
Mercury Hg (mg/l) <0.001 <0.001 <0.001 <0.001 <0.001 <0.001
Copper Cu (mg/l) 0.029 0.018 0.046 0.025 0.011 0.085
Lead Pb (mg/l) <0.001 <0.001 <0.001 <0.001 <0.001 <0.001
Zinc Zn (mg/l) 0.096 0.082 0.078 0.071 0.129 0.120
Iron Fe (mg/l) 0.414 0.196 0.142 0.337 0.121 0.096
Cadmium Cd (mg/l) <0.001 <0.001 <0.001 <0.001 <0.001 <0.001
Nickel Ni (mg/l) <0.001 <0.001 <0.001 <0.001 <0.001 <0.001
Arsenic (As) (mg/l) <0.001 <0.001 <0.001 <0.001 <0.001 <0.001
Chromium Cr (mg/l) <0.001 <0.001 <0.001 <0.001 <0.001 0.0001
THB (cfu/ml) 1.3x10³ 1.0x10³ 2.0x10³ 1.2x10³ 1.3x10³ 2.4x10³
HUB (cfu/ml) <0.01 <0.01 <0.01 <0.01 <0.01 <0.01
THF (cfu/ml) 1.2x10² 4.1x10² 1.2x10² 1.4x10² 1.7x10² 1.1x10²
HUF (cfu/ml) <0.01 <0.01 <0.01 <0.01 <0.01 <0.01
Total coliform (MPN/100 ml) <3.00 6.00 11.0 <3.00 11.00 21.00
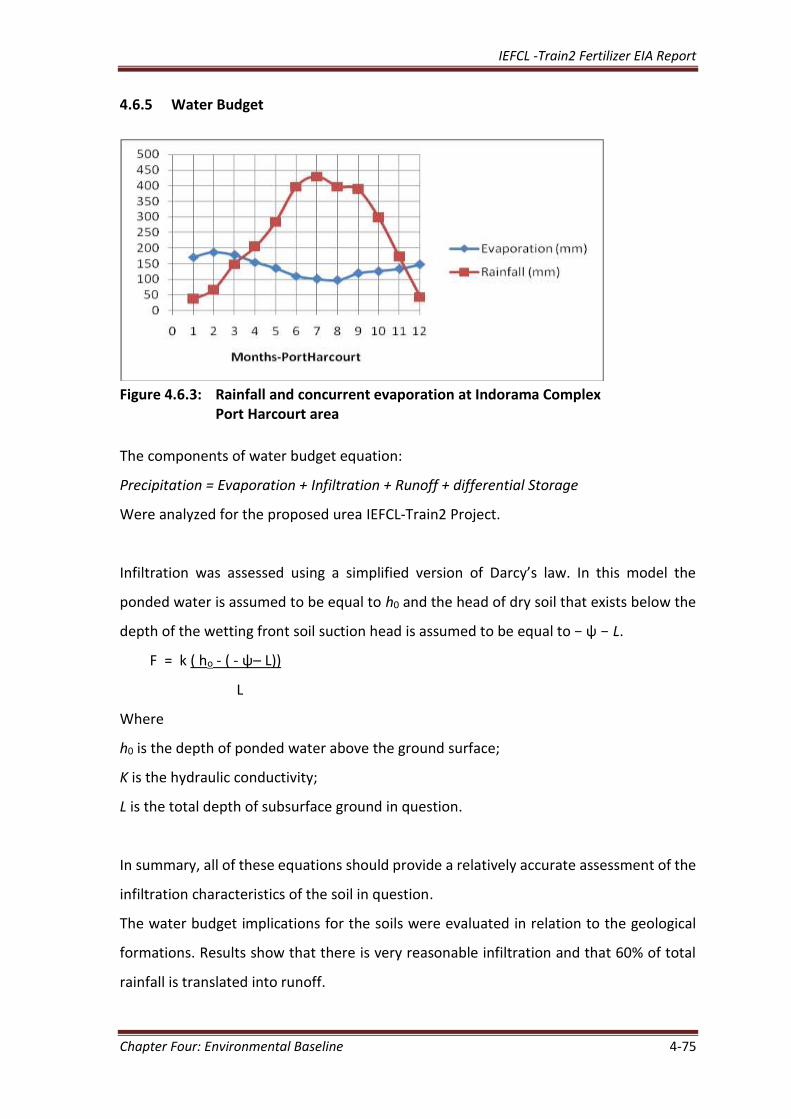
IEFCL -Train2 Fertilizer EIA Report
Chapter Four: Environmental Baseline 4-75
4.6.5 Water Budget
Figure 4.6.3: Rainfall and concurrent evaporation at Indorama Complex
Port Harcourt area
The components of water budget equation:
Precipitation = Evaporation + Infiltration + Runoff + differential Storage
Were analyzed for the proposed urea IEFCL-Train2 Project.
Infiltration was assessed using a simplified version of Darcy’s law. In this model the
ponded water is assumed to be equal to h0 and the head of dry soil that exists below the
depth of the wetting front soil suction head is assumed to be equal to − ψ − L.
F = k ( ho - ( - ψ– L))
L
Where
h0 is the depth of ponded water above the ground surface;
K is the hydraulic conductivity;
L is the total depth of subsurface ground in question.
In summary, all of these equations should provide a relatively accurate assessment of the
infiltration characteristics of the soil in question.
The water budget implications for the soils were evaluated in relation to the geological
formations. Results show that there is very reasonable infiltration and that 60% of total
rainfall is translated into runoff.
IEFCL -Train2 Fertilizer EIA Report
Chapter Four: Environmental Baseline 4-76
The project area is in a geological formation of high potential of groundwater recharge
because of
Favourable sub surface geology falling within the Benin formation
Abundant recharge potential from
i. Rainfall of above 2,280mm/year average
ii. Natural groundwater flow from North Southwards
Evapo-transpiration does not adversely affect infiltration of water from ground
into the aquifer.
Based on above, total recharge potential of the area was found as 1 mega cubic meter
(mcm) per square kilometer. (Rivers State Ministry of Water Resources, 2000). This
recharge potential has effectively ensured that users of groundwater in Eleme Local
Government Area and the study area are not starved of water.
4.6.6 Geophysical investigation
Resistivity was measured by passing a current of known value into the ground by means
of two electrodes (C1, C2) and measuring potential difference between two intermediate
points in the ground using another two electrodes (P1, P2). The ground whose mean
resistivity is measured is that comprised between the voltage electrodes (P1, P2 ) up to a
depth (ID) equal to about 1/3 of the distance between C1 and C2 (total electrode spread)
and a width equal to about 2/3 of the distance C1 and C2.. As the electrode spread (C1, C2)
increases, depth of the probe increases, thereby, giving a vertical electrical sounding. VES
also referred to as electrical drilling. The potential – drop – ratio method is a variation on
this procedure used for determining resistivity. All resistivity techniques in general use
require the measurement of apparent resistivity ρa, which is obtained from the electrode
configuration.
ρa = π.R.a (b/a + b2 / a2 )
Where R = resistance value read on the resistivity meter (Ω)
a = distance between both inner electrodes (m)
b = distance between inner and outer electrodes (m)
ρa = avearage resistivity (Ωm) of an equivalent soil layer which is equal to 75% of the
distance between the inner and outer electrodes (0.756)
IEFCL -Train2 Fertilizer EIA Report
Chapter Four: Environmental Baseline 4-77
4.6.6.1 Instrumentation
The measuring field equipment used include: SR-2 Soil Resistivity Meter with a liquid
crystal digital readout containing three main units; all housed in a single casing; the
transmitter, the receiver and the micro-processor. The electrically isolated transmitter
sends out well-defined and regulated signal currents. The receiver discriminates wise and
measure voltage correlated with transmitted signal current (resistivity surveying mode),
the microprocessor monitors and controls operations and calculates ground resistance.
A pair of current electrodes and pair of potential electrodes all made of stainless steel.
Rolls of copper cables with connecting cables, plugs and clips.
4.6.6.2 Data Processing
Raw field data was transferred to computer on completion of each day and the data was
checked to verify accuracy and that the equipments was fully functional and to identify
and measurement which may require immediate resurvey. Data was finally analyzed by
mathematical methods using appropriate constants and are presented in a tabular form
by an appropriate computer programme.
The VES data are then presented as sounding curves, which are obtained by plotting graph
of apparent resistivity versus depth on the logarithmic graph sheets.
4.6.6.3 Results
The results are displayed in the table and graphics is presented in Appendix 4.7. The
computer-modeled curve (Apparent resistivity graphics and sections) is generated from
the field data displayed on the table. The geo-electric model summarizes the probable
subsurface geology and information on subsurface condition in the survey site.
As resistivity is a fundamental electrical property of rock material closely related to their
lithology, thus the determination of the subsurface distribution of resistivity from
measurements on the surface can yield useful information on the structure or
composition of buried formation.
From the result of the 3 geo-electric resistivity measurement certain deductions could be
made:
IEFCL -Train2 Fertilizer EIA Report
Chapter Four: Environmental Baseline 4-78
VES 1.
The area could be characterized with 3 major geo-electric resistivity zones within a
shallow subsurface sounded depth of 30m. The upper subsurface geo-electric zone; 211-
2760m, thickness about 5.0m, with Lateritic, Silty clay material. Middle geo-electric zone
500-10000m, thickness about 20.0m, silty clay material. Lower geo-electric zone; 1000-
5000m, with sand – gravel sand material.
VES 2.
The area could be characterized with 3 major geo-electric resistivity zones within a
shallow subsurface sounded depth of 30m. The upper subsurface geo-electric zone;
10000m, thickness about 5.0m, with lateritic silty sand material. Middle geo-electric zone;
6000 – 8000m, thickness about 21.0m, with lateritic sand material. Lower geo-electric
zone; 900 – 10000m, with sand – silty sand material.
VES 3.
The area could be characterized with 3 major geo-electric resistivity zones within a
shallow subsurface sounded depth of 30m. The upper subsurface geo-electric zone;
10000m, thickness about 3.0m, with lateritic silty clay material. Middle geo-electric zone;
300 – 8000m, thickness about 23.0m, with lateritic sand material. Lower geo-electric zone;
900 – 12000m, with sand – gravel/sand material.
VES 1 &3. First and second layers are made up of impervious unit with low porosity and
poor permeability while the third layers are made of aquifer layers of high porosity and
permeability. The ground water movement is most viable in third layer.
In VES 2. First – third layers ranged from sand to silty sand layers with appreciable porosity
and permeability thus must of the infiltration that reaches the ground water discharge to
the surface streams/ creek thus enhancing soil flush. Any pollutant can percolate down
through the silty soil, then moves rapidly as interflow to the estuarine system. This is a
peculiar case with the coastal drainage of unconsolidated top sediment (U.S EPA, 1995).
Also VES 1-3 resistivity values, there is one indication of any anomaly as values above
90000Ωm that depicts faults, crack, loose sand or sink holes and fractures etc. are not
witnessed.
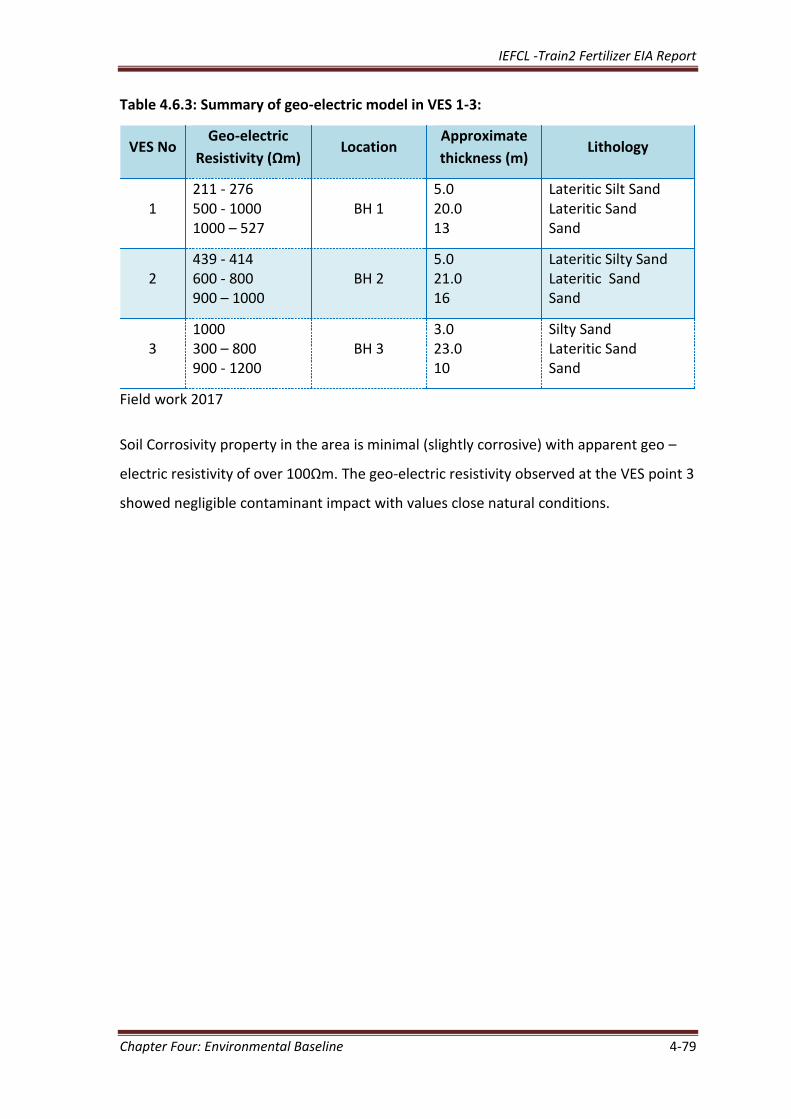
IEFCL -Train2 Fertilizer EIA Report
Chapter Four: Environmental Baseline 4-79
Table 4.6.3: Summary of geo-electric model in VES 1-3:
VES No Geo-electric
Resistivity (Ωm) Location
Approximate
thickness (m) Lithology
1 211 - 276 500 - 1000 1000 – 527
BH 1 5.0 20.0 13
Lateritic Silt Sand Lateritic Sand Sand
2 439 - 414 600 - 800 900 – 1000
BH 2 5.0 21.0 16
Lateritic Silty Sand Lateritic Sand Sand
3 1000 300 – 800 900 - 1200
BH 3 3.0 23.0 10
Silty Sand Lateritic Sand Sand
Field work 2017
Soil Corrosivity property in the area is minimal (slightly corrosive) with apparent geo –
electric resistivity of over 100Ωm. The geo-electric resistivity observed at the VES point 3
showed negligible contaminant impact with values close natural conditions.
IEFCL -Train2 Fertilizer EIA Report
Chapter Four: Environmental Baseline 4-80
4.7. SURFACE WATER SYSTEM
The impact of industrial toxics and hazardous wastes on aquatic life including
microorganisms cannot be over-stressed. Consequently, upon the industrial revolution,
many production and manufacturing companies have due to improper waste
management techniques, added toxic and hazardous wastes including synthetic
compounds into the aquatic environment. These wastes are also discharged into water
without any treatment as a result of improper or deliberate channeling of the wastes into
aquatic environment. The presence of these wastes in the environment causes extensive
damage to the water quality characteristics and the ecology of the environment,
especially when microbial degradation activities fail to remove these pollutants fast
enough to prevent environmental degradation. The environmental consequences of
marine pollution include creating a harsh marine environment which adversely affects
activities of marine micro-flora as well as fish and other marine lives. Okulu stream takes
its course form Ogale meandering through Agbonchia and serves as the Indorama
complex treated effluent and rain water surface run-off discharge receiving water body.
It flows from the East towards the West and changes direction South West towards the
downstream. The Indorama complex treated effluent and rain water surface run-off is
held in a retention pond and flows through a 1.10 km earth channel before emptying into
the Okulu Aleto wetland.
4.7.1 Physico-chemical properties of Surface water (Okulu Stream)
The summary of the Physico-chemical characteristics of surface water collected during
field work (wet season) are presented in Table 4.7.1 and the secondary data for dry season
retrieved from IEFCL and IEFCL-compliance monitoring reports are presented in table
4.7.2.
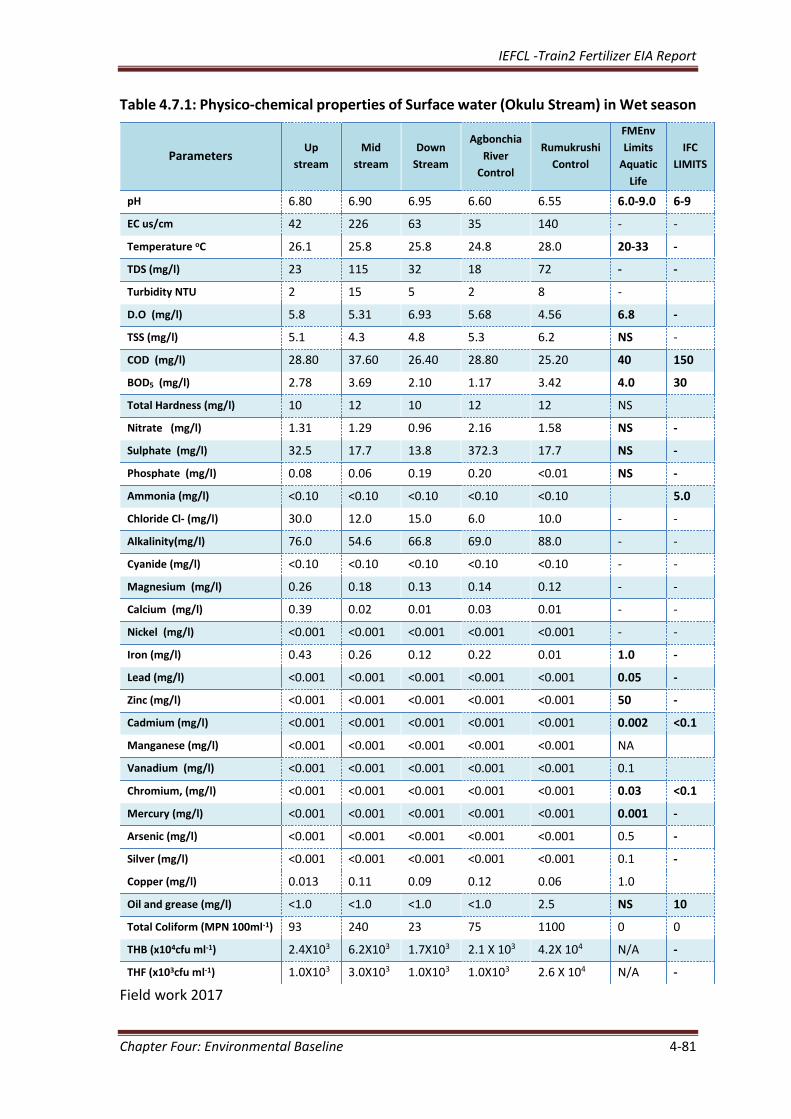
IEFCL -Train2 Fertilizer EIA Report
Chapter Four: Environmental Baseline 4-81
Table 4.7.1: Physico-chemical properties of Surface water (Okulu Stream) in Wet season
Field work 2017
Parameters Up
stream
Mid
stream
Down
Stream
Agbonchia
River
Control
Rumukrushi
Control
FMEnv
Limits
Aquatic
Life
IFC
LIMITS
pH 6.80 6.90 6.95 6.60 6.55 6.0-9.0 6-9
EC us/cm 42 226 63 35 140 - -
Temperature oC 26.1 25.8 25.8 24.8 28.0 20-33 -
TDS (mg/l) 23 115 32 18 72 - -
Turbidity NTU 2 15 5 2 8 -
D.O (mg/l) 5.8 5.31 6.93 5.68 4.56 6.8 -
TSS (mg/l) 5.1 4.3 4.8 5.3 6.2 NS -
COD (mg/l) 28.80 37.60 26.40 28.80 25.20 40 150
BOD5 (mg/l) 2.78 3.69 2.10 1.17 3.42 4.0 30
Total Hardness (mg/l) 10 12 10 12 12 NS
Nitrate (mg/l) 1.31 1.29 0.96 2.16 1.58 NS -
Sulphate (mg/l) 32.5 17.7 13.8 372.3 17.7 NS -
Phosphate (mg/l) 0.08 0.06 0.19 0.20 <0.01 NS -
Ammonia (mg/l) <0.10 <0.10 <0.10 <0.10 <0.10 5.0
Chloride Cl- (mg/l) 30.0 12.0 15.0 6.0 10.0 - -
Alkalinity(mg/l) 76.0 54.6 66.8 69.0 88.0 - -
Cyanide (mg/l) <0.10 <0.10 <0.10 <0.10 <0.10 - -
Magnesium (mg/l) 0.26 0.18 0.13 0.14 0.12 - -
Calcium (mg/l) 0.39 0.02 0.01 0.03 0.01 - -
Nickel (mg/l) <0.001 <0.001 <0.001 <0.001 <0.001 - -
Iron (mg/l) 0.43 0.26 0.12 0.22 0.01 1.0 -
Lead (mg/l) <0.001 <0.001 <0.001 <0.001 <0.001 0.05 -
Zinc (mg/l) <0.001 <0.001 <0.001 <0.001 <0.001 50 -
Cadmium (mg/l) <0.001 <0.001 <0.001 <0.001 <0.001 0.002 <0.1
Manganese (mg/l) <0.001 <0.001 <0.001 <0.001 <0.001 NA
Vanadium (mg/l) <0.001 <0.001 <0.001 <0.001 <0.001 0.1
Chromium, (mg/l) <0.001 <0.001 <0.001 <0.001 <0.001 0.03 <0.1
Mercury (mg/l) <0.001 <0.001 <0.001 <0.001 <0.001 0.001 -
Arsenic (mg/l) <0.001 <0.001 <0.001 <0.001 <0.001 0.5 -
Silver (mg/l) <0.001 <0.001 <0.001 <0.001 <0.001 0.1 -
Copper (mg/l) 0.013 0.11 0.09 0.12 0.06 1.0
Oil and grease (mg/l) <1.0 <1.0 <1.0 <1.0 2.5 NS 10
Total Coliform (MPN 100ml-1) 93 240 23 75 1100 0 0
THB (x104cfu ml-1) 2.4X10³ 6.2X10³ 1.7X10³ 2.1 X 10³ 4.2X 10⁴ N/A -
THF (x103cfu ml-1) 1.0X10³ 3.0X10³ 1.0X10³ 1.0X10³ 2.6 X 10⁴ N/A -
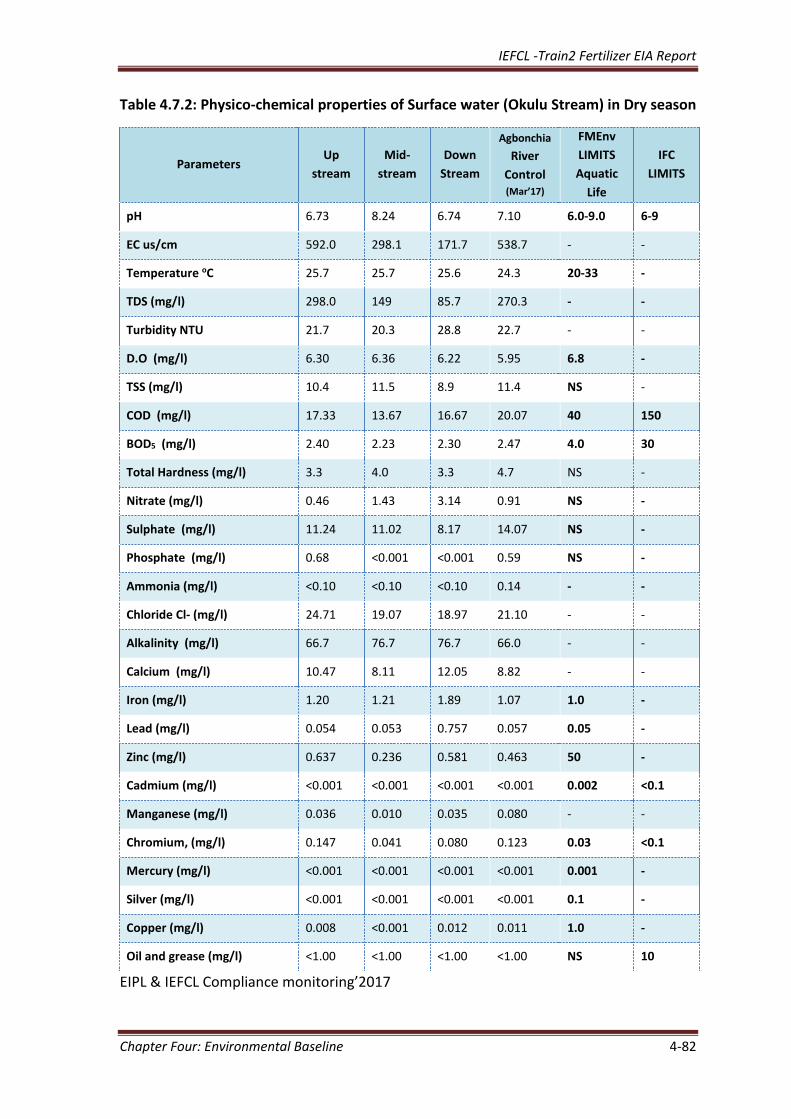
IEFCL -Train2 Fertilizer EIA Report
Chapter Four: Environmental Baseline 4-82
Table 4.7.2: Physico-chemical properties of Surface water (Okulu Stream) in Dry season
EIPL & IEFCL Compliance monitoring’2017
Parameters Up
stream
Mid-
stream
Down
Stream
Agbonchia
River
Control (Mar’17)
FMEnv
LIMITS
Aquatic
Life
IFC
LIMITS
pH 6.73 8.24 6.74 7.10 6.0-9.0 6-9
EC us/cm 592.0 298.1 171.7 538.7 - -
Temperature oC 25.7 25.7 25.6 24.3 20-33 -
TDS (mg/l) 298.0 149 85.7 270.3 - -
Turbidity NTU 21.7 20.3 28.8 22.7 - -
D.O (mg/l) 6.30 6.36 6.22 5.95 6.8 -
TSS (mg/l) 10.4 11.5 8.9 11.4 NS -
COD (mg/l) 17.33 13.67 16.67 20.07 40 150
BOD5 (mg/l) 2.40 2.23 2.30 2.47 4.0 30
Total Hardness (mg/l) 3.3 4.0 3.3 4.7 NS -
Nitrate (mg/l) 0.46 1.43 3.14 0.91 NS -
Sulphate (mg/l) 11.24 11.02 8.17 14.07 NS -
Phosphate (mg/l) 0.68 <0.001 <0.001 0.59 NS -
Ammonia (mg/l) <0.10 <0.10 <0.10 0.14 - -
Chloride Cl- (mg/l) 24.71 19.07 18.97 21.10 - -
Alkalinity (mg/l) 66.7 76.7 76.7 66.0 - -
Calcium (mg/l) 10.47 8.11 12.05 8.82 - -
Iron (mg/l) 1.20 1.21 1.89 1.07 1.0 -
Lead (mg/l) 0.054 0.053 0.757 0.057 0.05 -
Zinc (mg/l) 0.637 0.236 0.581 0.463 50 -
Cadmium (mg/l) <0.001 <0.001 <0.001 <0.001 0.002 <0.1
Manganese (mg/l) 0.036 0.010 0.035 0.080 - -
Chromium, (mg/l) 0.147 0.041 0.080 0.123 0.03 <0.1
Mercury (mg/l) <0.001 <0.001 <0.001 <0.001 0.001 -
Silver (mg/l) <0.001 <0.001 <0.001 <0.001 0.1 -
Copper (mg/l) 0.008 <0.001 0.012 0.011 1.0 -
Oil and grease (mg/l) <1.00 <1.00 <1.00 <1.00 NS 10
IEFCL -Train2 Fertilizer EIA Report
Chapter Four: Environmental Baseline 4-83
pH
The water body is a fresh water body with pH slightly acidic at the upstream which is
typical of the Niger delta surface water bodies. The pH during the rainy season fieldwork
(2017) ranged from 6.80 to 6.95 and 6.55 – 6.60 at the Okulu River and control stations
compared to 6.73 to 8.24 and 7.10 for control station for dry season sampling. The values
recorded complied to regulatory limit of 6.50 to 8.50. The trend analysis showed the
recipient water pH values were more alkaline in the wet season than values obtained in
the dry season. This could be as a result of run off of agricultural fertilizers applied to farms
into the surface water and sand mining activities on the water body. However the
observed pH values are normal for the Niger Delta (Ideriah et al. 2010) and within the
recommended range of pH for natural surface waters. The change in pH was not
significant and the various industrial activities around the study area (industrial treated
wastewater discharge, mechanical and manual sand mining) have not significantly altered
the pH of the water body.
Temperature
Temperature of a water body is influenced by the condition of the weather, ambient
atmosphere and temperature of runoff or effluent discharged into it. The temperature of
the sampling stations during the dry season ranged from 25.6 to 25.7oC and 24.30C at
control station against 25.8 to 26.1 0C and 24.8 to 28.00C at the control stations in wet
season. The fluctuation in temperature could also be attributed to the time of sampling,
velocity and turbulence mixture of the sample.
Turbidity
Turbidity is a measure of the degree to which the water loses its transparency due to the
presence of suspended particulates. Turbidity is considered as a good measure of the
quality of water. The suspended particles scatter the light, thus decreasing the
photosynthetic activity of plants and algae, which contributes to lowering of dissolved
oxygen concentration The turbidity values ranged from 20.3 to 28.8NTU and 22.7 for
Okulu Stream and control station respectively during the dry season against 2.0 to 15.0
NTU and Control stations of 2.0 to 8.0 NTU in rainy season (September 2017). Sand mining
activity is carried out on all sides and directions of the stream which serves as a major
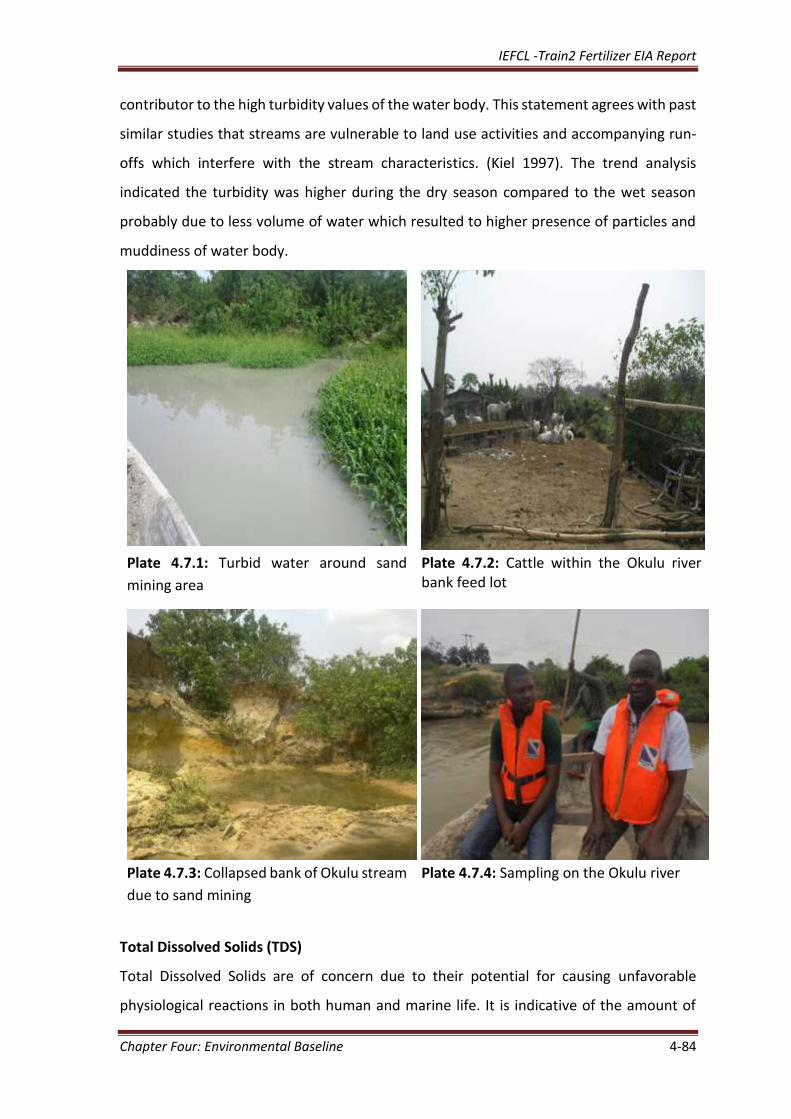
IEFCL -Train2 Fertilizer EIA Report
Chapter Four: Environmental Baseline 4-84
contributor to the high turbidity values of the water body. This statement agrees with past
similar studies that streams are vulnerable to land use activities and accompanying run-
offs which interfere with the stream characteristics. (Kiel 1997). The trend analysis
indicated the turbidity was higher during the dry season compared to the wet season
probably due to less volume of water which resulted to higher presence of particles and
muddiness of water body.
Plate 4.7.1: Turbid water around sand
mining area
Plate 4.7.2: Cattle within the Okulu river bank feed lot
Plate 4.7.3: Collapsed bank of Okulu stream
due to sand mining
Plate 4.7.4: Sampling on the Okulu river
Total Dissolved Solids (TDS)
Total Dissolved Solids are of concern due to their potential for causing unfavorable
physiological reactions in both human and marine life. It is indicative of the amount of
IEFCL -Train2 Fertilizer EIA Report
Chapter Four: Environmental Baseline 4-85
loads on a water body the higher the concentrations the more the loads. The TDS
concentrations range from 85.7 to 298.0mg/l and 270.3 mg/l at the control in dry season
as against the wet season of 23.0 to 115.0 mg/l and 18.0 to 72.0 mg/l at the control
stations.
Total Suspended Solids (TSS)
Suspended solids consist of an inorganic fraction (silts, clays, calcium, potassium,
bicarbonates, chlorides, etc.) and an organic fraction (algae, zooplankton, bacteria and
detritus) that are within the water column (GEMS, 1992). The TSS concentrations in dry
season ranged from 8.9 to 11.5mg/l and 11.4 mg/l at control station as against the wet
season (September 2017) concentration of 4.3 to 5.1 mg/l at sampling stations and 5.3 to
6.2 at control stations. The trend analysis indicated the TSS was higher during the dry
season compared to the wet season probably due to less volume of water which resulted
to higher presence of particles and muddiness of water body.
Oxygen Demand
The dissolved oxygen level during the dry season was ranged from 6.22 to 6.36mg/l and
5.95 mg/l at the control station. The concentration recorded during fieldwork September
2017 was 5.31 to 6.93 mg/l, while at the control station it ranged from 4.56 to 5.68mg/l.
This result clearly shows the intense anthropogenic activities at the control stations (car
washings, storm run-off and waste disposal) which may have influence on the result
recorded within these stations. This implies that the Okulu stream has more carrying
capacity than the control stations located in Eleme and Obi-Akpor LGAs. The Chemical
Oxygen Demand level for the study area in rainy season (September 2017) ranged from
26.40 to 37.60 mg/l and 25.20 to 28.80 mg/l at control stations against dry season results
of 13.67 to 17.33 mg/l and 20.07 mg/l at the control station. BOD concentration recorded
indicate that the water body is not in any form of organic stress, as such have sufficient
oxygen to handle organic load intrusion into the water body.
Heavy Metals
The values of heavy metals determined were generally low and within their respective
regulatory acceptable limits. The results showed concentration of the heavy metal such
IEFCL -Train2 Fertilizer EIA Report
Chapter Four: Environmental Baseline 4-86
as Pb and Zn were moderately low, while vanadium, Chromium, Arsenic, Cadmium, Lead
and Zinc were less than detectable limit of the instrument used. Some metal levels
exhibited significant seasonal variation. The concentration levels might be attributed to
anthropogenic enrichment arising from sand mining, abattoir, excavation activities as well
as surface runoff from dumpsite in the area.
On the whole water quality data obtained in the area showed that the water bodies have
low level alkaline earth metals and some heavy metals. The concentration levels of
hydrocarbons was within the acceptable limits. The values of heavy metals determined
were generally low and within their respective regulatory acceptable limits. Surface water
in the Niger Delta has been recorded to contain high iron concentrations attributed to the
metals being bound to the soil and sediment matrix. The intense manual sand mining
observed during study is a confirmed contributing factor to high iron concentration. The
physicochemical characteristics of the surface water indicate slight contamination of the
recipient environment due to the ongoing sand mining activity on the water body.
However the carrying capacity of the water body evaluated, is good.
4.7.2 Surface water microbiology
Coliforms commonly referred to as indicators of recent contamination (bio monitors) of
water were present in the surface water samples. The total coliforms ranged from 23 to
240 MPN/100ml for rainy season. The low prevalence of total coliforms, especially those
of vegetative origins maybe attributed to the absence of several autochthonous species
and supported by the prevailing environmental conditions and physicochemical
characteristics of the surface water. Similarly, the total coliform counts in the control
stations did not show any significant difference.
4.7.3 Sediment
In aquatic ecosystem, the sediments act as sink and therefore preserve or retain the
quality of the environment. The heavy particles or the insoluble fractions settle down on
the bed as sediments. The nature and quality of sediment could also be determined from
information on the status of the physico-chemical properties. Such information is also
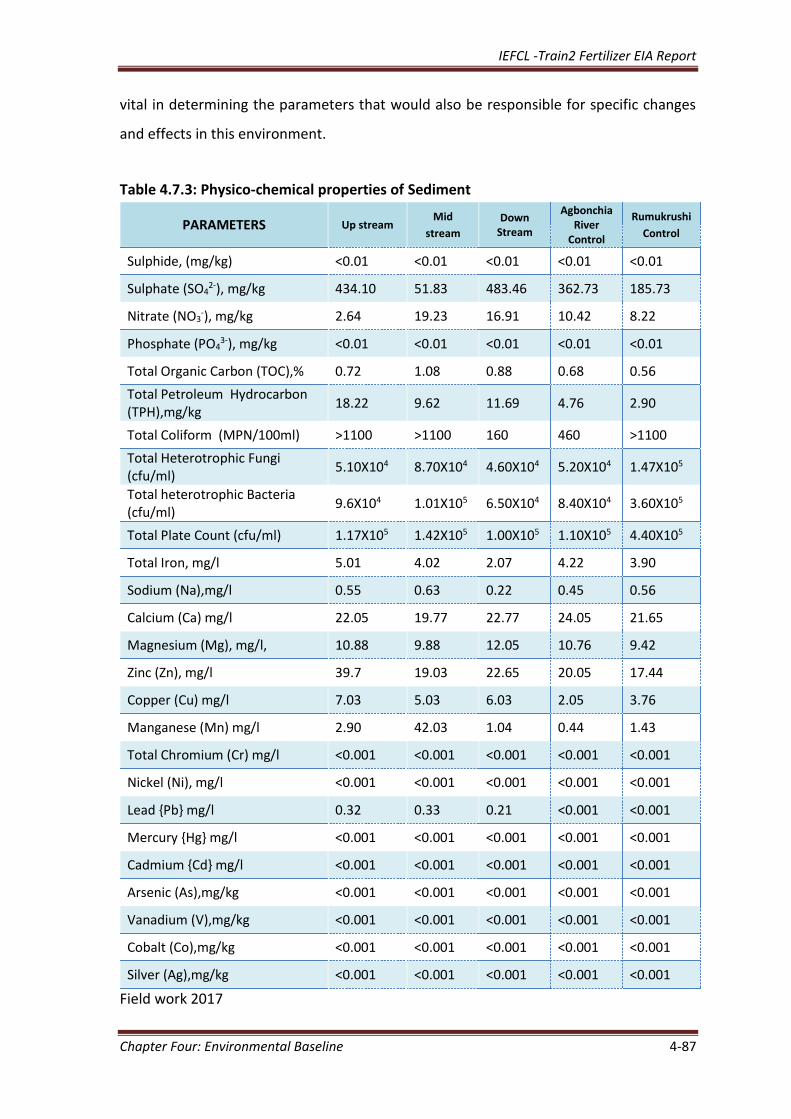
IEFCL -Train2 Fertilizer EIA Report
Chapter Four: Environmental Baseline 4-87
vital in determining the parameters that would also be responsible for specific changes
and effects in this environment.
Table 4.7.3: Physico-chemical properties of Sediment
PARAMETERS Up stream Mid
stream Down
Stream
Agbonchia River
Control
Rumukrushi
Control
Sulphide, (mg/kg) <0.01 <0.01 <0.01 <0.01 <0.01
Sulphate (SO42-), mg/kg 434.10 51.83 483.46 362.73 185.73
Nitrate (NO3-), mg/kg 2.64 19.23 16.91 10.42 8.22
Phosphate (PO43-), mg/kg <0.01 <0.01 <0.01 <0.01 <0.01
Total Organic Carbon (TOC),% 0.72 1.08 0.88 0.68 0.56
Total Petroleum Hydrocarbon (TPH),mg/kg
18.22 9.62 11.69 4.76 2.90
Total Coliform (MPN/100ml) >1100 >1100 160 460 >1100
Total Heterotrophic Fungi (cfu/ml)
5.10X10⁴ 8.70X10⁴ 4.60X10⁴ 5.20X10⁴ 1.47X10⁵
Total heterotrophic Bacteria (cfu/ml)
9.6X10⁴ 1.01X10⁵ 6.50X10⁴ 8.40X10⁴ 3.60X10⁵
Total Plate Count (cfu/ml) 1.17X10⁵ 1.42X10⁵ 1.00X10⁵ 1.10X10⁵ 4.40X10⁵
Total Iron, mg/l 5.01 4.02 2.07 4.22 3.90
Sodium (Na),mg/l 0.55 0.63 0.22 0.45 0.56
Calcium (Ca) mg/l 22.05 19.77 22.77 24.05 21.65
Magnesium (Mg), mg/l, 10.88 9.88 12.05 10.76 9.42
Zinc (Zn), mg/l 39.7 19.03 22.65 20.05 17.44
Copper (Cu) mg/l 7.03 5.03 6.03 2.05 3.76
Manganese (Mn) mg/l 2.90 42.03 1.04 0.44 1.43
Total Chromium (Cr) mg/l <0.001 <0.001 <0.001 <0.001 <0.001
Nickel (Ni), mg/l <0.001 <0.001 <0.001 <0.001 <0.001
Lead Pb mg/l 0.32 0.33 0.21 <0.001 <0.001
Mercury Hg mg/l <0.001 <0.001 <0.001 <0.001 <0.001
Cadmium Cd mg/l <0.001 <0.001 <0.001 <0.001 <0.001
Arsenic (As),mg/kg <0.001 <0.001 <0.001 <0.001 <0.001
Vanadium (V),mg/kg <0.001 <0.001 <0.001 <0.001 <0.001
Cobalt (Co),mg/kg <0.001 <0.001 <0.001 <0.001 <0.001
Silver (Ag),mg/kg <0.001 <0.001 <0.001 <0.001 <0.001
Field work 2017
IEFCL -Train2 Fertilizer EIA Report
Chapter Four: Environmental Baseline 4-88
4.7.3.1 Sediment Physico-chemistry
The color of the sediment samples ranged from black to dark grey coloration. The silt
fraction was higher than the sand and clay content making the sediment Silty in texture.
Nutrients are adequate to support the healthy growth of benthic population. The
concentrations of nutrients in sediment around the study area are indicated below;
Sulphate concentrations varied from 51.8 to 483.5 mg/kg and 185.7 to 362.7 mg/kg for
rainy season (September 2017) nitrate content ranged from 2.64 to 19.23 mg/kg and 8.22
to 10.42 mg/l at control stations for rainy season. Total Petroleum Hydrocarbon was low
for all samples taken 9.62 to 18.22 mg/kg and at control stations with 2.90 to 4.76 mg/l
for rainy season. This implies that the sediment along the study area is slightly
contaminated with petroleum hydrocarbons resulting from the mechanical dragger on the
water body. The heavy metal concentrations are low in the sediment samples and there
is no indication of their accumulation in the samples. Mercury and Arsenic were very low
and below detection limit in the sediment samples.
4.7.3.2 Sediment Microbiology
The microbiological data obtained from the analysis of the sediment samples. The
hydrocarbonoclastis (Hydrocarbon Utilizing Bacteria and Fungi) were not detected in the
sediment, showing the low hydrocarbon burden and thus corroborating with the absence
of hydrocarbon contamination in the sediment sample. The low hydrocarbonoclastic
counts in the study area and control station further lends credence to the sediment
physicochemical results as also described by Atlas (1981). Furthermore, the bacterial
genera isolated in the sediment include Pseudomonas, Klebsiella, Proteus, Bacillus,
Staphylococcus, Serratia, Micrococcus, Flavobacterium, Enterobacter, Achromobacter and
Arthrobacter. The fungal isolate mainly belonged to the genera Fusarium, Aspergillus,
Candida, Mucor and Penicllium.
4.7.4 Treated Effluent Water Quality
The monthly treated effluent water sample collected from Indorama complex discharged
point by third party and analysed by FMEnv approved laboratory, is presented in table
4.7.4 (wet season) and table 4.7.5 (dry season). The data revels that the treated effluent
quality is in compliance with regulatory limits/IFC guidelines.
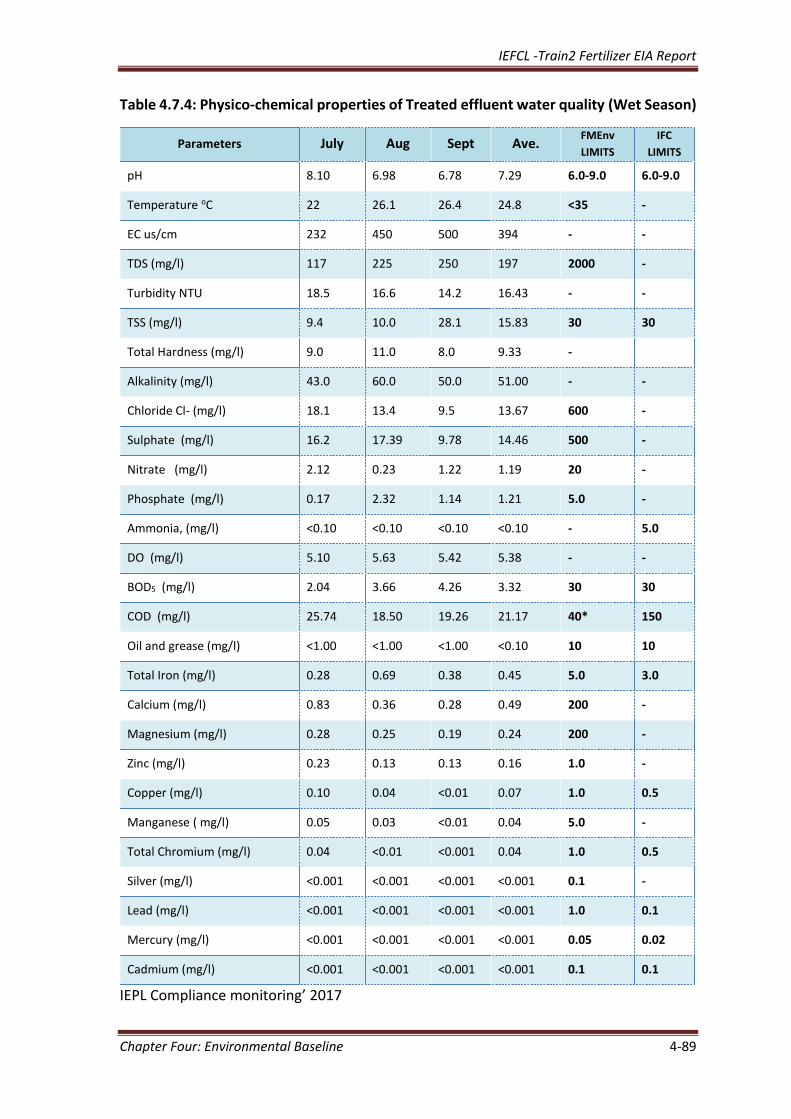
IEFCL -Train2 Fertilizer EIA Report
Chapter Four: Environmental Baseline 4-89
Table 4.7.4: Physico-chemical properties of Treated effluent water quality (Wet Season)
IEPL Compliance monitoring’ 2017
Parameters July Aug Sept Ave. FMEnv
LIMITS
IFC
LIMITS
pH 8.10 6.98 6.78 7.29 6.0-9.0 6.0-9.0
Temperature oC 22 26.1 26.4 24.8 <35 -
EC us/cm 232 450 500 394 - -
TDS (mg/l) 117 225 250 197 2000 -
Turbidity NTU 18.5 16.6 14.2 16.43 - -
TSS (mg/l) 9.4 10.0 28.1 15.83 30 30
Total Hardness (mg/l) 9.0 11.0 8.0 9.33 -
Alkalinity (mg/l) 43.0 60.0 50.0 51.00 - -
Chloride Cl- (mg/l) 18.1 13.4 9.5 13.67 600 -
Sulphate (mg/l) 16.2 17.39 9.78 14.46 500 -
Nitrate (mg/l) 2.12 0.23 1.22 1.19 20 -
Phosphate (mg/l) 0.17 2.32 1.14 1.21 5.0 -
Ammonia, (mg/l) <0.10 <0.10 <0.10 <0.10 - 5.0
DO (mg/l) 5.10 5.63 5.42 5.38 - -
BOD5 (mg/l) 2.04 3.66 4.26 3.32 30 30
COD (mg/l) 25.74 18.50 19.26 21.17 40* 150
Oil and grease (mg/l) <1.00 <1.00 <1.00 <0.10 10 10
Total Iron (mg/l) 0.28 0.69 0.38 0.45 5.0 3.0
Calcium (mg/l) 0.83 0.36 0.28 0.49 200 -
Magnesium (mg/l) 0.28 0.25 0.19 0.24 200 -
Zinc (mg/l) 0.23 0.13 0.13 0.16 1.0 -
Copper (mg/l) 0.10 0.04 <0.01 0.07 1.0 0.5
Manganese ( mg/l) 0.05 0.03 <0.01 0.04 5.0 -
Total Chromium (mg/l) 0.04 <0.01 <0.001 0.04 1.0 0.5
Silver (mg/l) <0.001 <0.001 <0.001 <0.001 0.1 -
Lead (mg/l) <0.001 <0.001 <0.001 <0.001 1.0 0.1
Mercury (mg/l) <0.001 <0.001 <0.001 <0.001 0.05 0.02
Cadmium (mg/l) <0.001 <0.001 <0.001 <0.001 0.1 0.1
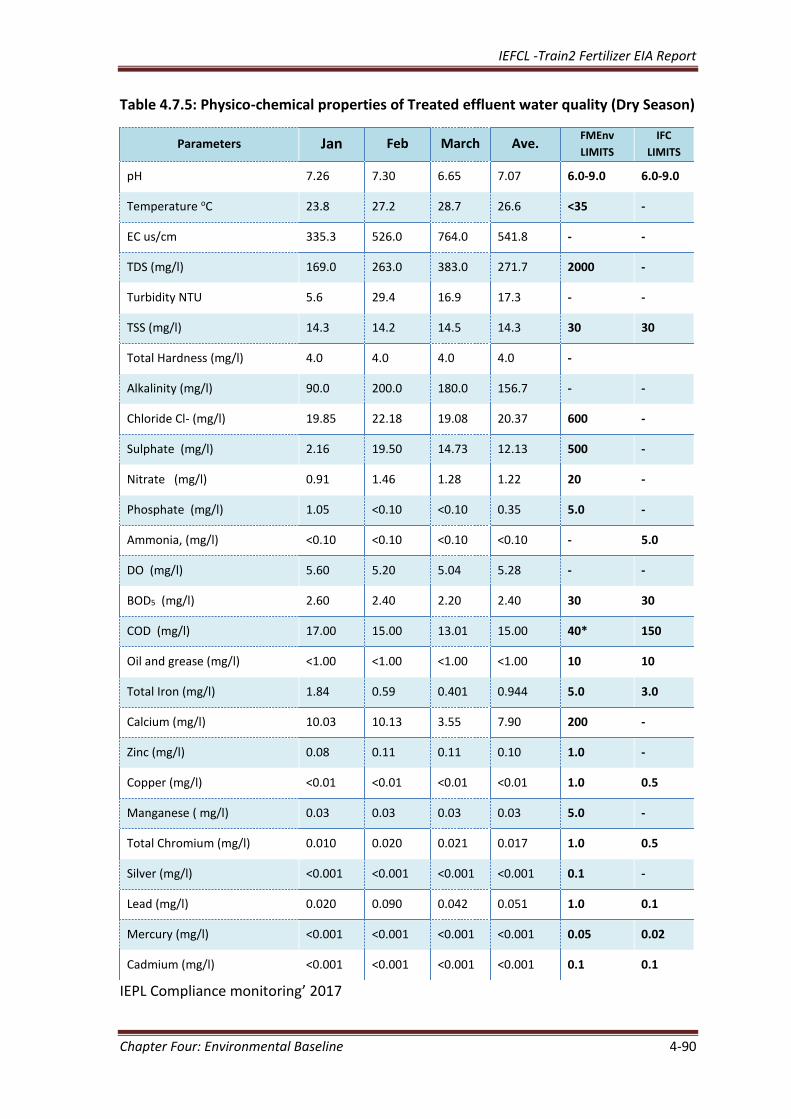
IEFCL -Train2 Fertilizer EIA Report
Chapter Four: Environmental Baseline 4-90
Table 4.7.5: Physico-chemical properties of Treated effluent water quality (Dry Season)
IEPL Compliance monitoring’ 2017
Parameters Jan Feb March Ave. FMEnv
LIMITS
IFC
LIMITS
pH 7.26 7.30 6.65 7.07 6.0-9.0 6.0-9.0
Temperature oC 23.8 27.2 28.7 26.6 <35 -
EC us/cm 335.3 526.0 764.0 541.8 - -
TDS (mg/l) 169.0 263.0 383.0 271.7 2000 -
Turbidity NTU 5.6 29.4 16.9 17.3 - -
TSS (mg/l) 14.3 14.2 14.5 14.3 30 30
Total Hardness (mg/l) 4.0 4.0 4.0 4.0 -
Alkalinity (mg/l) 90.0 200.0 180.0 156.7 - -
Chloride Cl- (mg/l) 19.85 22.18 19.08 20.37 600 -
Sulphate (mg/l) 2.16 19.50 14.73 12.13 500 -
Nitrate (mg/l) 0.91 1.46 1.28 1.22 20 -
Phosphate (mg/l) 1.05 <0.10 <0.10 0.35 5.0 -
Ammonia, (mg/l) <0.10 <0.10 <0.10 <0.10 - 5.0
DO (mg/l) 5.60 5.20 5.04 5.28 - -
BOD5 (mg/l) 2.60 2.40 2.20 2.40 30 30
COD (mg/l) 17.00 15.00 13.01 15.00 40* 150
Oil and grease (mg/l) <1.00 <1.00 <1.00 <1.00 10 10
Total Iron (mg/l) 1.84 0.59 0.401 0.944 5.0 3.0
Calcium (mg/l) 10.03 10.13 3.55 7.90 200 -
Zinc (mg/l) 0.08 0.11 0.11 0.10 1.0 -
Copper (mg/l) <0.01 <0.01 <0.01 <0.01 1.0 0.5
Manganese ( mg/l) 0.03 0.03 0.03 0.03 5.0 -
Total Chromium (mg/l) 0.010 0.020 0.021 0.017 1.0 0.5
Silver (mg/l) <0.001 <0.001 <0.001 <0.001 0.1 -
Lead (mg/l) 0.020 0.090 0.042 0.051 1.0 0.1
Mercury (mg/l) <0.001 <0.001 <0.001 <0.001 0.05 0.02
Cadmium (mg/l) <0.001 <0.001 <0.001 <0.001 0.1 0.1
IEFCL -Train2 Fertilizer EIA Report
Chapter Four: Environmental Baseline 4-91
4.8 HYDROBILOGY
4.8.1 Phytoplankton
A total of forty-eight (48) phytoplankton species representing four (4) major classes were
identified in the study area in both climatic regimes (dry and wet seasons). The four
classes include: Bacillariophyceae (diatoms), Chlorophyceae (green algae), Cyanophyceae
(blue green algae) and Euglenophyceae. Bacillariophyceae formed the most dominant
group of phytoplankton in the wet season with a percentage composition of 42.27%.
Similarly, in the dry season the percentage composition was 29.83% which is about 1 fold
decrease. The seasonal changes in the species composition and population density may
be attributed to the changing environmental conditions, increase in nutrients from
surface runoff during the dry season and deposition of organic matter. However, the surge
in the population of Bacillariophyceae may be attributed to their ability to grow under
relatively low temperatures which are less suitable for other algae (Wanganeo and
Wanganeo, 1991). The findings compare favourably with Davies et al, 2009; Allison and
Otene, 2012; Lund, 1965 and Munawar, 1974 for similar ecosystems. The population
density ranged from 2 to 43 cells/1000L in the dry season and 12 to 24 cells/1000L in the
wet season. Well represented taxa in the wet and dry season include: Cyclotellaspp,
Naviculaspp, Melosiraspp (Dry season); Navicula cuspidate, Nitzschiaclosterium, Amphora
ovalis, Nitzschia frigida, tabellaria fenestrate (wet season). The Bacillariophyceae
depicted bimodal growth in the wet season especially in the upstream of the Okulu
stream. This may be attributed to the deposition of nutrients during these peak periods
(Kaul, et al, 1978).
The Chlorophyceae formed the second most dominant group of phytoplankton in the wet
season (34.02%) with a population density of 6 to 20 cells/1000L and 0 to 12 cells/1000L
in the dry season (12.41%). Peak values in the wet season may be attributed to change in
environmental conditions. Bimodal wet season peaks were also observed in the upstream
and downstream of the Okulu stream which may be attributed to influx of nutrients into
the Okulu stream. Generally due to runoffs slight sessional variations were observed
across the sampling stations. Well represented taxa include: Closterium lineatum,
Micrasterias radiata (wet season) and Rhizocloniumspp, Chlorella spp (dry season).
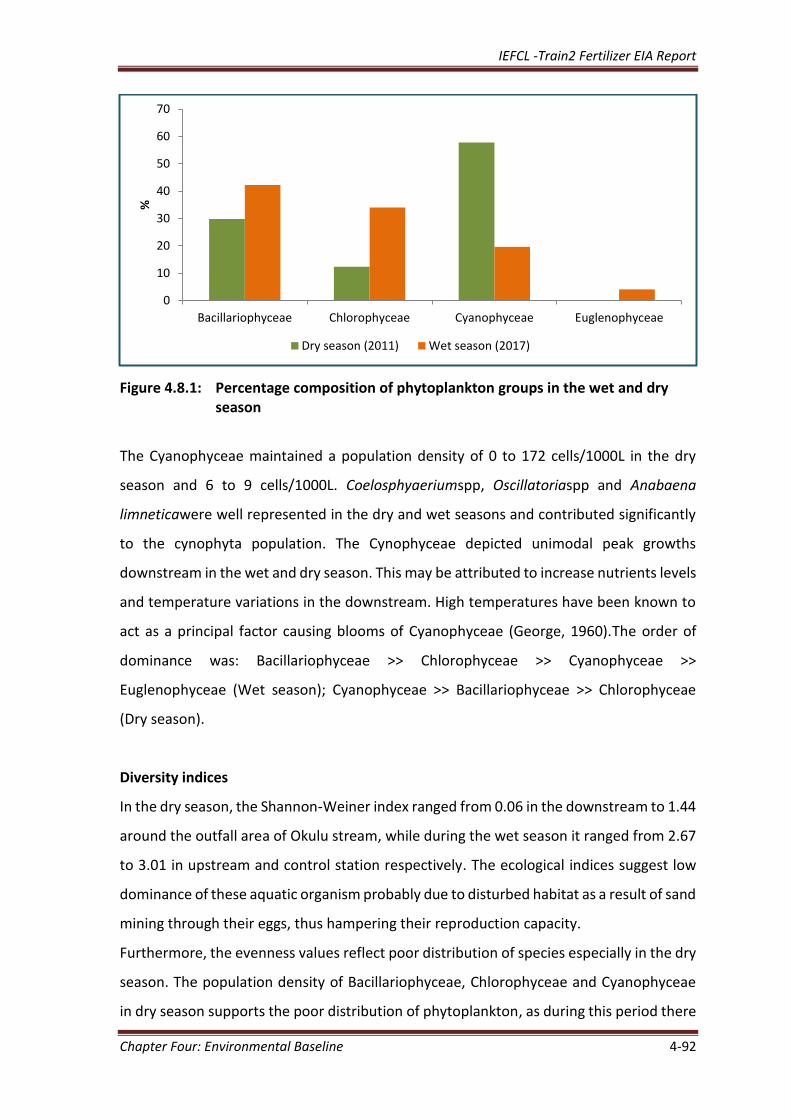
IEFCL -Train2 Fertilizer EIA Report
Chapter Four: Environmental Baseline 4-92
Figure 4.8.1: Percentage composition of phytoplankton groups in the wet and dry season
The Cyanophyceae maintained a population density of 0 to 172 cells/1000L in the dry
season and 6 to 9 cells/1000L. Coelosphyaeriumspp, Oscillatoriaspp and Anabaena
limneticawere well represented in the dry and wet seasons and contributed significantly
to the cynophyta population. The Cynophyceae depicted unimodal peak growths
downstream in the wet and dry season. This may be attributed to increase nutrients levels
and temperature variations in the downstream. High temperatures have been known to
act as a principal factor causing blooms of Cyanophyceae (George, 1960).The order of
dominance was: Bacillariophyceae >> Chlorophyceae >> Cyanophyceae >>
Euglenophyceae (Wet season); Cyanophyceae >> Bacillariophyceae >> Chlorophyceae
(Dry season).
Diversity indices
In the dry season, the Shannon-Weiner index ranged from 0.06 in the downstream to 1.44
around the outfall area of Okulu stream, while during the wet season it ranged from 2.67
to 3.01 in upstream and control station respectively. The ecological indices suggest low
dominance of these aquatic organism probably due to disturbed habitat as a result of sand
mining through their eggs, thus hampering their reproduction capacity.
Furthermore, the evenness values reflect poor distribution of species especially in the dry
season. The population density of Bacillariophyceae, Chlorophyceae and Cyanophyceae
in dry season supports the poor distribution of phytoplankton, as during this period there
0
10
20
30
40
50
60
70
Bacillariophyceae Chlorophyceae Cyanophyceae Euglenophyceae
%
Dry season (2011) Wet season (2017)
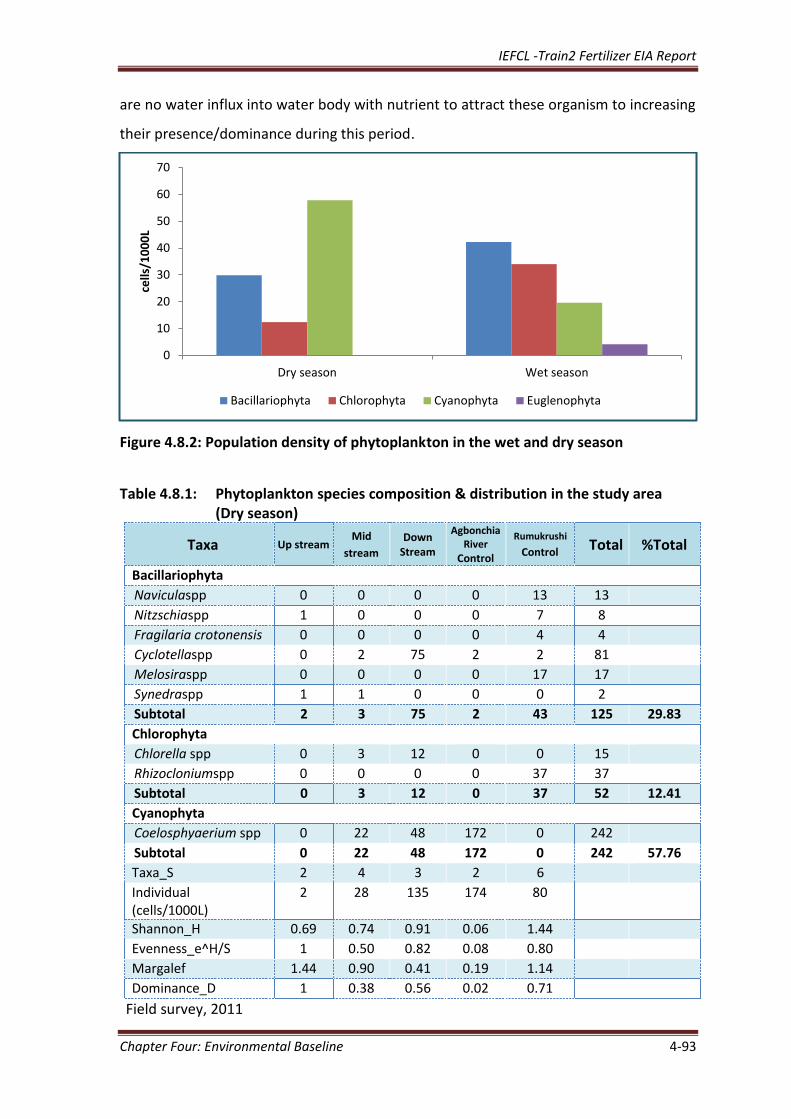
IEFCL -Train2 Fertilizer EIA Report
Chapter Four: Environmental Baseline 4-93
are no water influx into water body with nutrient to attract these organism to increasing
their presence/dominance during this period.
Figure 4.8.2: Population density of phytoplankton in the wet and dry season
Table 4.8.1: Phytoplankton species composition & distribution in the study area (Dry season)
Taxa Up stream Mid
stream Down
Stream
Agbonchia River
Control
Rumukrushi
Control Total %Total
Bacillariophyta
Naviculaspp 0 0 0 0 13 13
Nitzschiaspp 1 0 0 0 7 8
Fragilaria crotonensis 0 0 0 0 4 4
Cyclotellaspp 0 2 75 2 2 81
Melosiraspp 0 0 0 0 17 17
Synedraspp 1 1 0 0 0 2
Subtotal 2 3 75 2 43 125 29.83
Chlorophyta
Chlorella spp 0 3 12 0 0 15
Rhizocloniumspp 0 0 0 0 37 37
Subtotal 0 3 12 0 37 52 12.41
Cyanophyta
Coelosphyaerium spp 0 22 48 172 0 242
Subtotal 0 22 48 172 0 242 57.76
Taxa_S 2 4 3 2 6
Individual (cells/1000L)
2 28 135 174 80
Shannon_H 0.69 0.74 0.91 0.06 1.44
Evenness_e^H/S 1 0.50 0.82 0.08 0.80
Margalef 1.44 0.90 0.41 0.19 1.14
Dominance_D 1 0.38 0.56 0.02 0.71
Field survey, 2011
0
10
20
30
40
50
60
70
Dry season Wet season
cells
/10
00
L
Bacillariophyta Chlorophyta Cyanophyta Euglenophyta
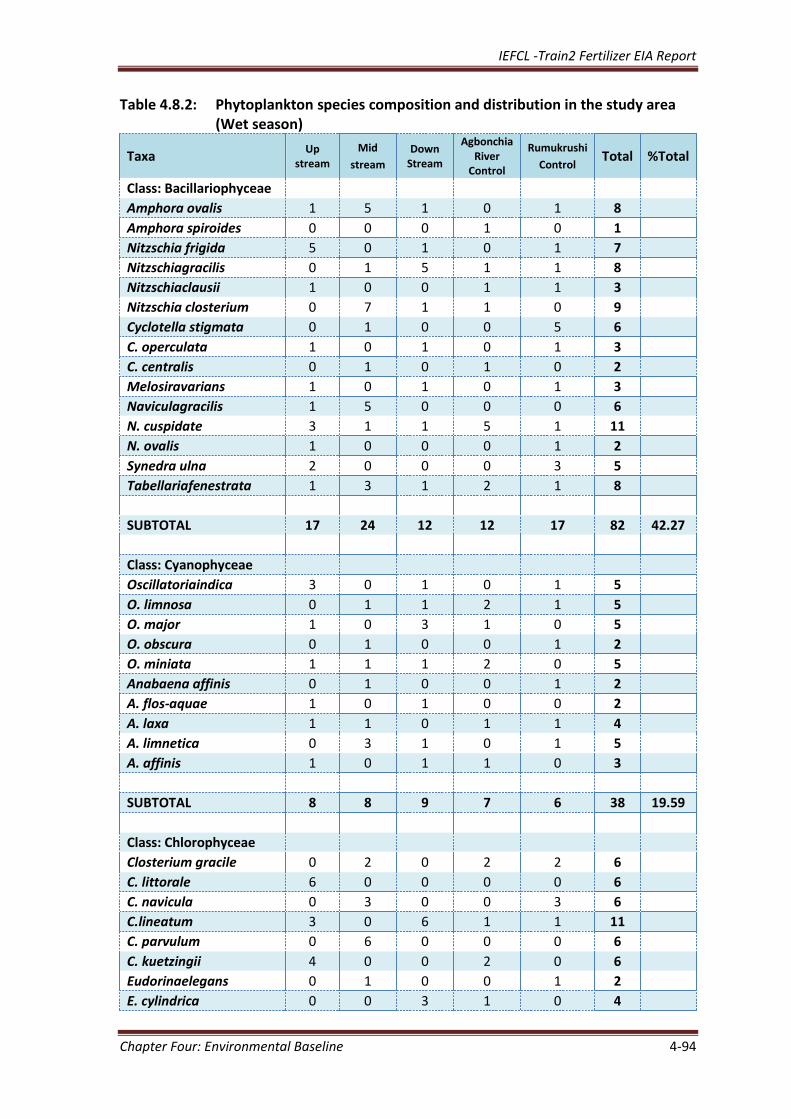
IEFCL -Train2 Fertilizer EIA Report
Chapter Four: Environmental Baseline 4-94
Table 4.8.2: Phytoplankton species composition and distribution in the study area (Wet season)
Taxa Up
stream Mid
stream Down
Stream
Agbonchia River
Control
Rumukrushi
Control Total %Total
Class: Bacillariophyceae
Amphora ovalis 1 5 1 0 1 8
Amphora spiroides 0 0 0 1 0 1
Nitzschia frigida 5 0 1 0 1 7
Nitzschiagracilis 0 1 5 1 1 8
Nitzschiaclausii 1 0 0 1 1 3
Nitzschia closterium 0 7 1 1 0 9
Cyclotella stigmata 0 1 0 0 5 6
C. operculata 1 0 1 0 1 3
C. centralis 0 1 0 1 0 2
Melosiravarians 1 0 1 0 1 3
Naviculagracilis 1 5 0 0 0 6
N. cuspidate 3 1 1 5 1 11
N. ovalis 1 0 0 0 1 2
Synedra ulna 2 0 0 0 3 5
Tabellariafenestrata 1 3 1 2 1 8
SUBTOTAL 17 24 12 12 17 82 42.27
Class: Cyanophyceae
Oscillatoriaindica 3 0 1 0 1 5
O. limnosa 0 1 1 2 1 5
O. major 1 0 3 1 0 5
O. obscura 0 1 0 0 1 2
O. miniata 1 1 1 2 0 5
Anabaena affinis 0 1 0 0 1 2
A. flos-aquae 1 0 1 0 0 2
A. laxa 1 1 0 1 1 4
A. limnetica 0 3 1 0 1 5
A. affinis 1 0 1 1 0 3
SUBTOTAL 8 8 9 7 6 38 19.59
Class: Chlorophyceae
Closterium gracile 0 2 0 2 2 6
C. littorale 6 0 0 0 0 6
C. navicula 0 3 0 0 3 6
C.lineatum 3 0 6 1 1 11
C. parvulum 0 6 0 0 0 6
C. kuetzingii 4 0 0 2 0 6
Eudorinaelegans 0 1 0 0 1 2
E. cylindrica 0 0 3 1 0 4
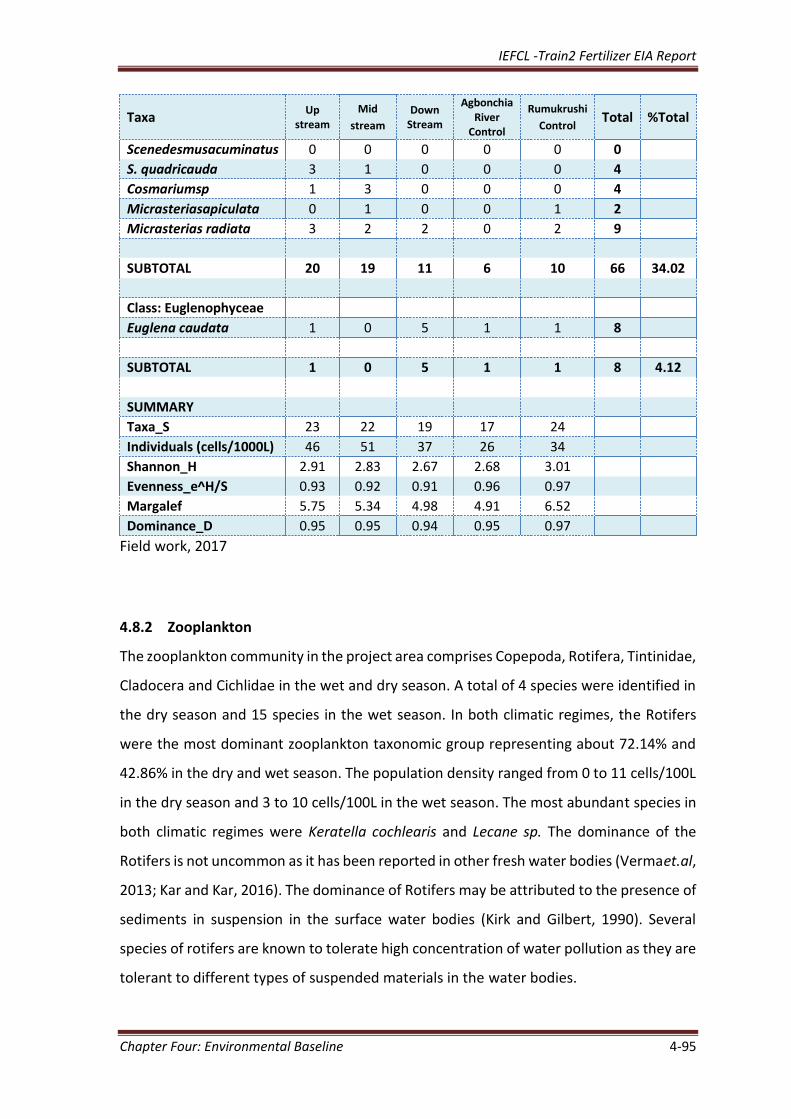
IEFCL -Train2 Fertilizer EIA Report
Chapter Four: Environmental Baseline 4-95
Taxa Up
stream Mid
stream Down
Stream
Agbonchia River
Control
Rumukrushi
Control Total %Total
Scenedesmusacuminatus 0 0 0 0 0 0
S. quadricauda 3 1 0 0 0 4
Cosmariumsp 1 3 0 0 0 4
Micrasteriasapiculata 0 1 0 0 1 2
Micrasterias radiata 3 2 2 0 2 9
SUBTOTAL 20 19 11 6 10 66 34.02
Class: Euglenophyceae
Euglena caudata 1 0 5 1 1 8
SUBTOTAL 1 0 5 1 1 8 4.12
SUMMARY
Taxa_S 23 22 19 17 24
Individuals (cells/1000L) 46 51 37 26 34
Shannon_H 2.91 2.83 2.67 2.68 3.01
Evenness_e^H/S 0.93 0.92 0.91 0.96 0.97
Margalef 5.75 5.34 4.98 4.91 6.52
Dominance_D 0.95 0.95 0.94 0.95 0.97
Field work, 2017
4.8.2 Zooplankton
The zooplankton community in the project area comprises Copepoda, Rotifera, Tintinidae,
Cladocera and Cichlidae in the wet and dry season. A total of 4 species were identified in
the dry season and 15 species in the wet season. In both climatic regimes, the Rotifers
were the most dominant zooplankton taxonomic group representing about 72.14% and
42.86% in the dry and wet season. The population density ranged from 0 to 11 cells/100L
in the dry season and 3 to 10 cells/100L in the wet season. The most abundant species in
both climatic regimes were Keratella cochlearis and Lecane sp. The dominance of the
Rotifers is not uncommon as it has been reported in other fresh water bodies (Vermaet.al,
2013; Kar and Kar, 2016). The dominance of Rotifers may be attributed to the presence of
sediments in suspension in the surface water bodies (Kirk and Gilbert, 1990). Several
species of rotifers are known to tolerate high concentration of water pollution as they are
tolerant to different types of suspended materials in the water bodies.
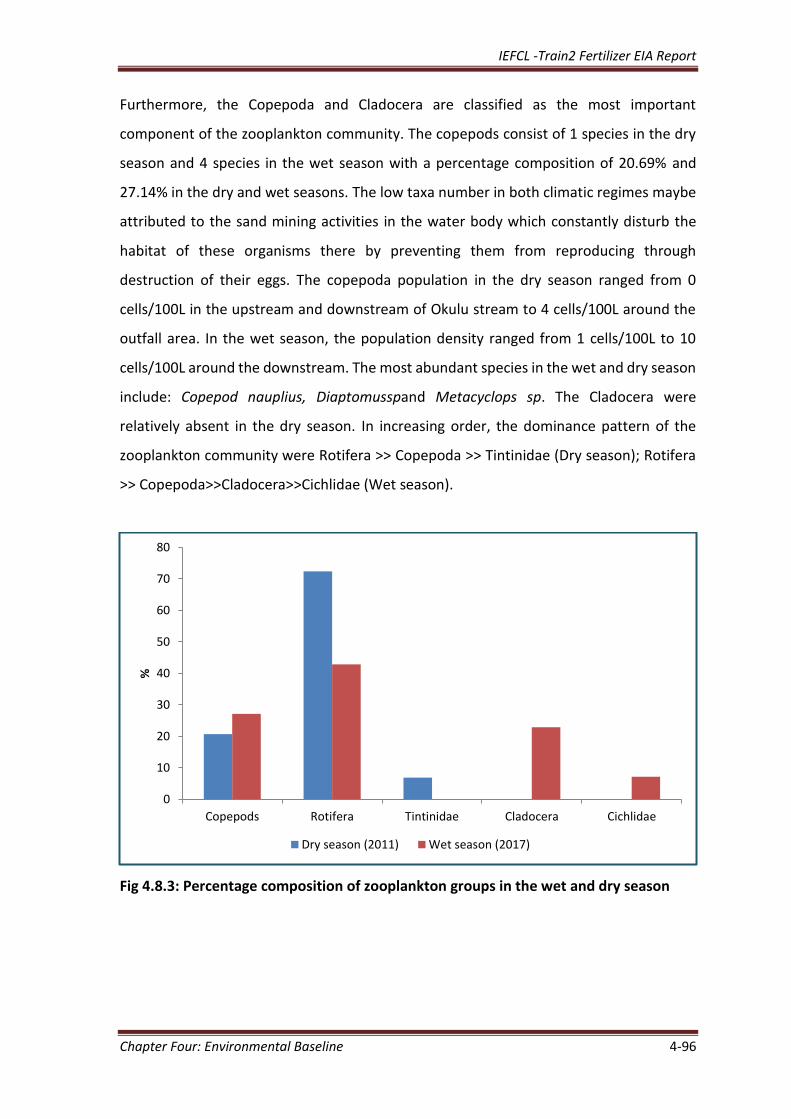
IEFCL -Train2 Fertilizer EIA Report
Chapter Four: Environmental Baseline 4-96
Furthermore, the Copepoda and Cladocera are classified as the most important
component of the zooplankton community. The copepods consist of 1 species in the dry
season and 4 species in the wet season with a percentage composition of 20.69% and
27.14% in the dry and wet seasons. The low taxa number in both climatic regimes maybe
attributed to the sand mining activities in the water body which constantly disturb the
habitat of these organisms there by preventing them from reproducing through
destruction of their eggs. The copepoda population in the dry season ranged from 0
cells/100L in the upstream and downstream of Okulu stream to 4 cells/100L around the
outfall area. In the wet season, the population density ranged from 1 cells/100L to 10
cells/100L around the downstream. The most abundant species in the wet and dry season
include: Copepod nauplius, Diaptomusspand Metacyclops sp. The Cladocera were
relatively absent in the dry season. In increasing order, the dominance pattern of the
zooplankton community were Rotifera >> Copepoda >> Tintinidae (Dry season); Rotifera
>> Copepoda>>Cladocera>>Cichlidae (Wet season).
Fig 4.8.3: Percentage composition of zooplankton groups in the wet and dry season
0
10
20
30
40
50
60
70
80
Copepods Rotifera Tintinidae Cladocera Cichlidae
%
Dry season (2011) Wet season (2017)
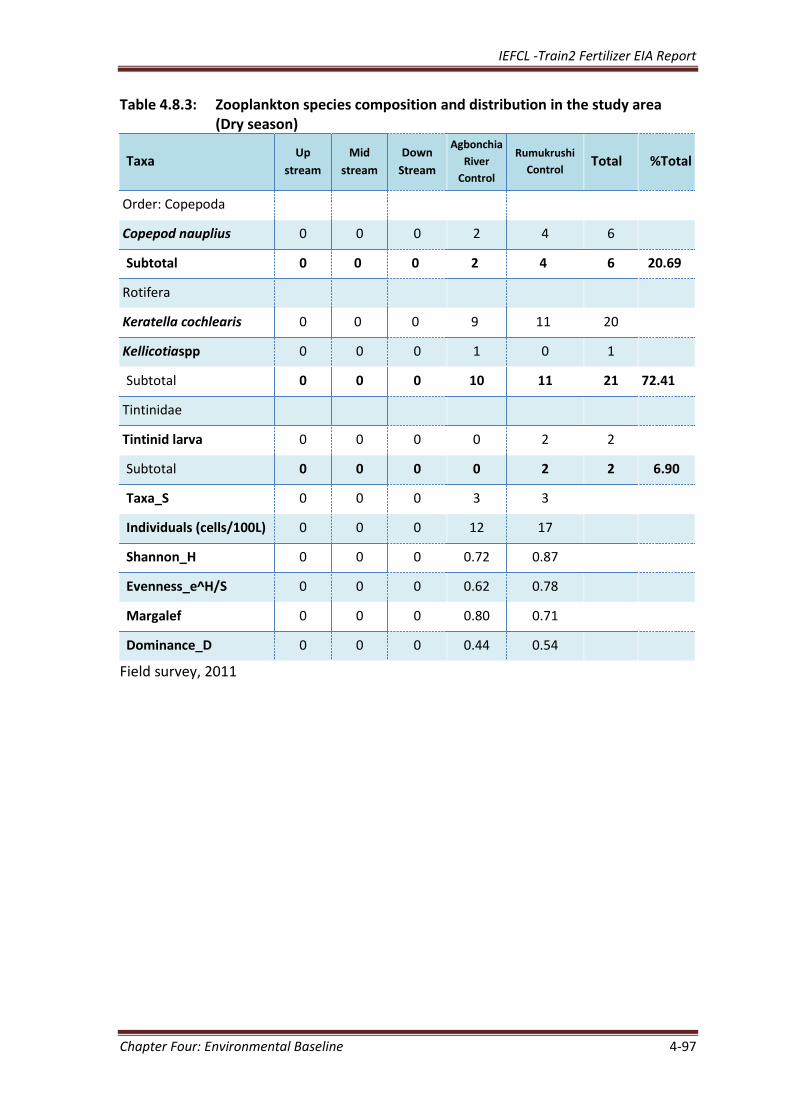
IEFCL -Train2 Fertilizer EIA Report
Chapter Four: Environmental Baseline 4-97
Table 4.8.3: Zooplankton species composition and distribution in the study area (Dry season)
Taxa Up
stream
Mid
stream
Down
Stream
Agbonchia
River
Control
Rumukrushi
Control Total %Total
Order: Copepoda
Copepod nauplius 0 0 0 2 4 6
Subtotal 0 0 0 2 4 6 20.69
Rotifera
Keratella cochlearis 0 0 0 9 11 20
Kellicotiaspp 0 0 0 1 0 1
Subtotal 0 0 0 10 11 21 72.41
Tintinidae
Tintinid larva 0 0 0 0 2 2
Subtotal 0 0 0 0 2 2 6.90
Taxa_S 0 0 0 3 3
Individuals (cells/100L) 0 0 0 12 17
Shannon_H 0 0 0 0.72 0.87
Evenness_e^H/S 0 0 0 0.62 0.78
Margalef 0 0 0 0.80 0.71
Dominance_D 0 0 0 0.44 0.54
Field survey, 2011
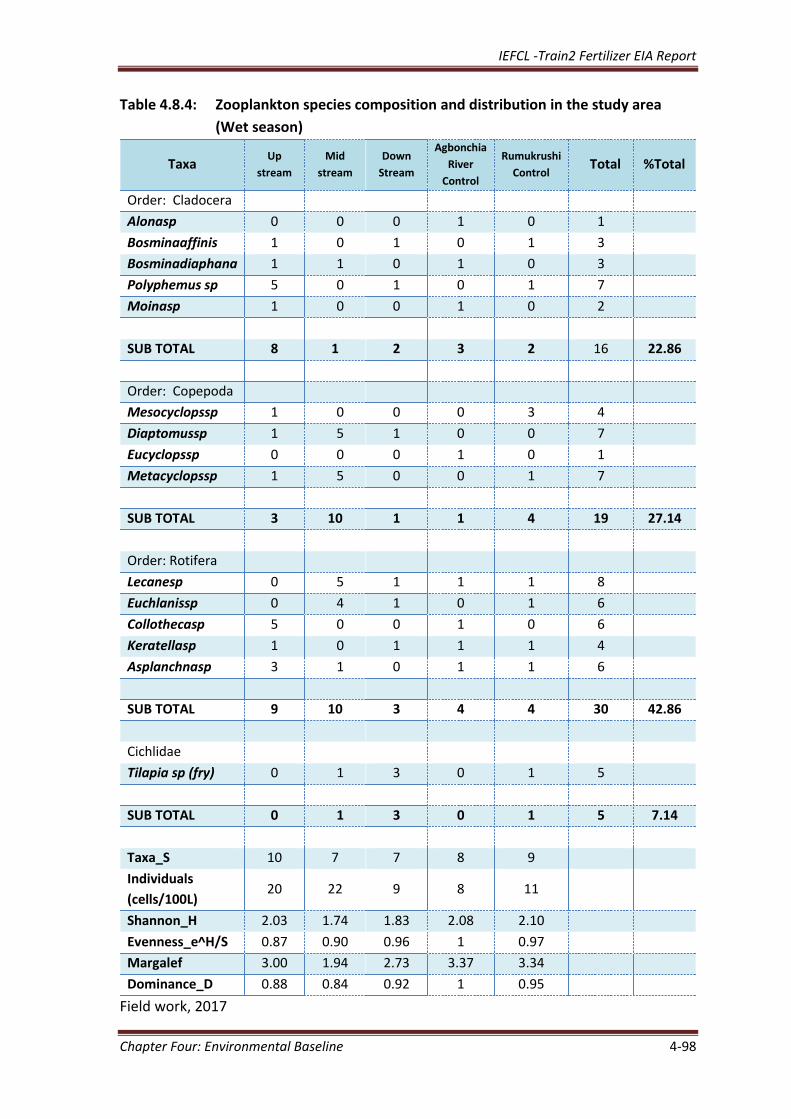
IEFCL -Train2 Fertilizer EIA Report
Chapter Four: Environmental Baseline 4-98
Table 4.8.4: Zooplankton species composition and distribution in the study area
(Wet season)
Taxa Up
stream Mid
stream Down
Stream
Agbonchia
River
Control
Rumukrushi
Control Total %Total
Order: Cladocera
Alonasp 0 0 0 1 0 1
Bosminaaffinis 1 0 1 0 1 3
Bosminadiaphana 1 1 0 1 0 3
Polyphemus sp 5 0 1 0 1 7
Moinasp 1 0 0 1 0 2
SUB TOTAL 8 1 2 3 2 16 22.86
Order: Copepoda
Mesocyclopssp 1 0 0 0 3 4
Diaptomussp 1 5 1 0 0 7
Eucyclopssp 0 0 0 1 0 1
Metacyclopssp 1 5 0 0 1 7
SUB TOTAL 3 10 1 1 4 19 27.14
Order: Rotifera
Lecanesp 0 5 1 1 1 8
Euchlanissp 0 4 1 0 1 6
Collothecasp 5 0 0 1 0 6
Keratellasp 1 0 1 1 1 4
Asplanchnasp 3 1 0 1 1 6
SUB TOTAL 9 10 3 4 4 30 42.86
Cichlidae
Tilapia sp (fry) 0 1 3 0 1 5
SUB TOTAL 0 1 3 0 1 5 7.14
Taxa_S 10 7 7 8 9
Individuals
(cells/100L) 20 22 9 8 11
Shannon_H 2.03 1.74 1.83 2.08 2.10
Evenness_e^H/S 0.87 0.90 0.96 1 0.97
Margalef 3.00 1.94 2.73 3.37 3.34
Dominance_D 0.88 0.84 0.92 1 0.95
Field work, 2017
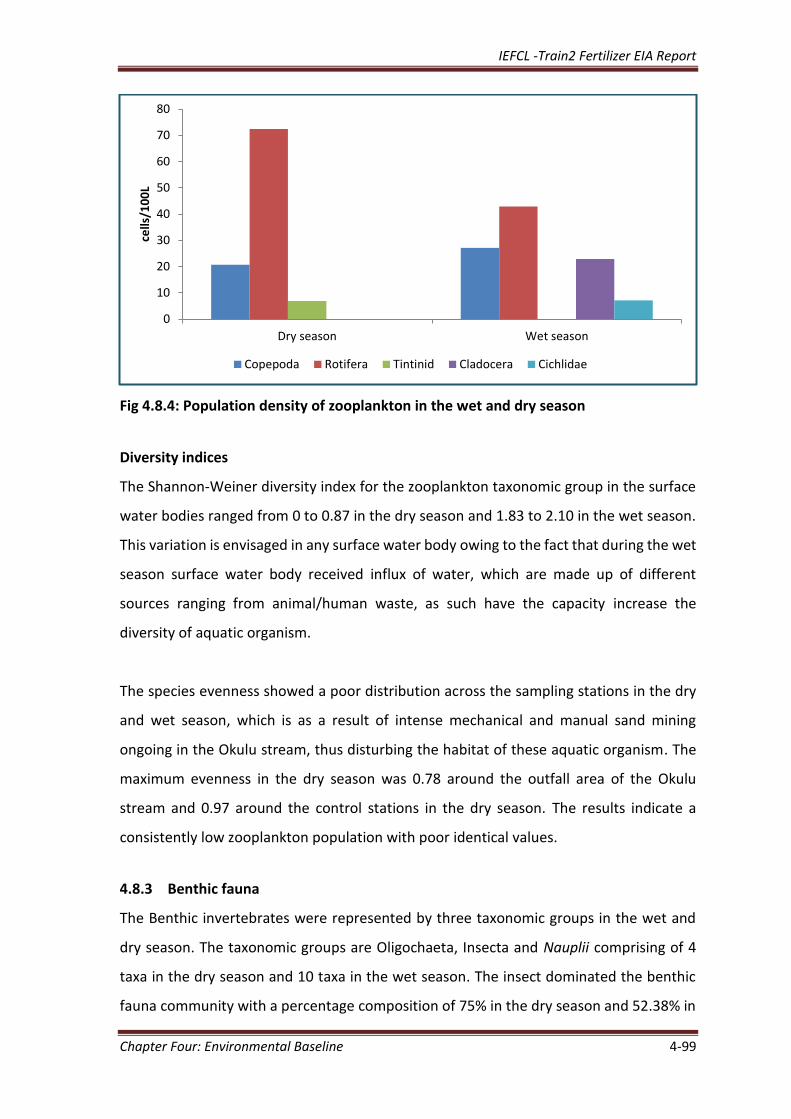
IEFCL -Train2 Fertilizer EIA Report
Chapter Four: Environmental Baseline 4-99
Fig 4.8.4: Population density of zooplankton in the wet and dry season
Diversity indices
The Shannon-Weiner diversity index for the zooplankton taxonomic group in the surface
water bodies ranged from 0 to 0.87 in the dry season and 1.83 to 2.10 in the wet season.
This variation is envisaged in any surface water body owing to the fact that during the wet
season surface water body received influx of water, which are made up of different
sources ranging from animal/human waste, as such have the capacity increase the
diversity of aquatic organism.
The species evenness showed a poor distribution across the sampling stations in the dry
and wet season, which is as a result of intense mechanical and manual sand mining
ongoing in the Okulu stream, thus disturbing the habitat of these aquatic organism. The
maximum evenness in the dry season was 0.78 around the outfall area of the Okulu
stream and 0.97 around the control stations in the dry season. The results indicate a
consistently low zooplankton population with poor identical values.
4.8.3 Benthic fauna
The Benthic invertebrates were represented by three taxonomic groups in the wet and
dry season. The taxonomic groups are Oligochaeta, Insecta and Nauplii comprising of 4
taxa in the dry season and 10 taxa in the wet season. The insect dominated the benthic
fauna community with a percentage composition of 75% in the dry season and 52.38% in
0
10
20
30
40
50
60
70
80
Dry season Wet season
cells
/10
0L
Copepoda Rotifera Tintinid Cladocera Cichlidae
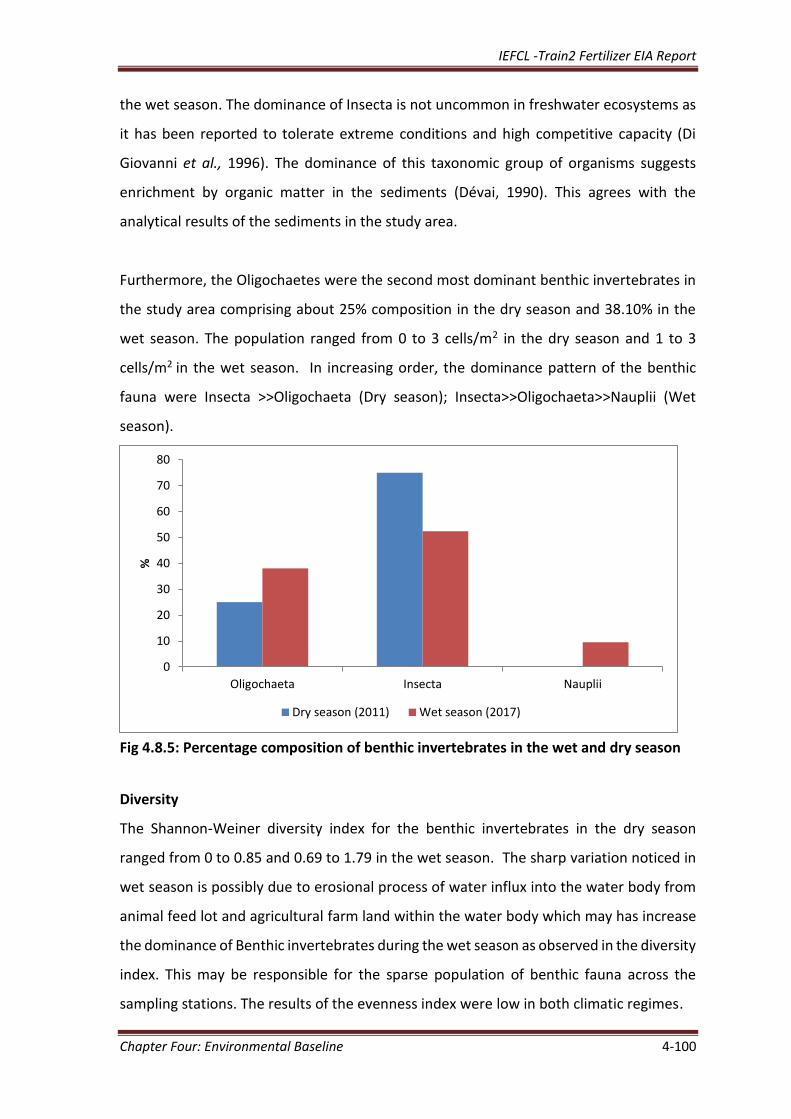
IEFCL -Train2 Fertilizer EIA Report
Chapter Four: Environmental Baseline 4-100
the wet season. The dominance of Insecta is not uncommon in freshwater ecosystems as
it has been reported to tolerate extreme conditions and high competitive capacity (Di
Giovanni et al., 1996). The dominance of this taxonomic group of organisms suggests
enrichment by organic matter in the sediments (Dévai, 1990). This agrees with the
analytical results of the sediments in the study area.
Furthermore, the Oligochaetes were the second most dominant benthic invertebrates in
the study area comprising about 25% composition in the dry season and 38.10% in the
wet season. The population ranged from 0 to 3 cells/m2 in the dry season and 1 to 3
cells/m2 in the wet season. In increasing order, the dominance pattern of the benthic
fauna were Insecta >>Oligochaeta (Dry season); Insecta>>Oligochaeta>>Nauplii (Wet
season).
Fig 4.8.5: Percentage composition of benthic invertebrates in the wet and dry season
Diversity
The Shannon-Weiner diversity index for the benthic invertebrates in the dry season
ranged from 0 to 0.85 and 0.69 to 1.79 in the wet season. The sharp variation noticed in
wet season is possibly due to erosional process of water influx into the water body from
animal feed lot and agricultural farm land within the water body which may has increase
the dominance of Benthic invertebrates during the wet season as observed in the diversity
index. This may be responsible for the sparse population of benthic fauna across the
sampling stations. The results of the evenness index were low in both climatic regimes.
0
10
20
30
40
50
60
70
80
Oligochaeta Insecta Nauplii
%
Dry season (2011) Wet season (2017)
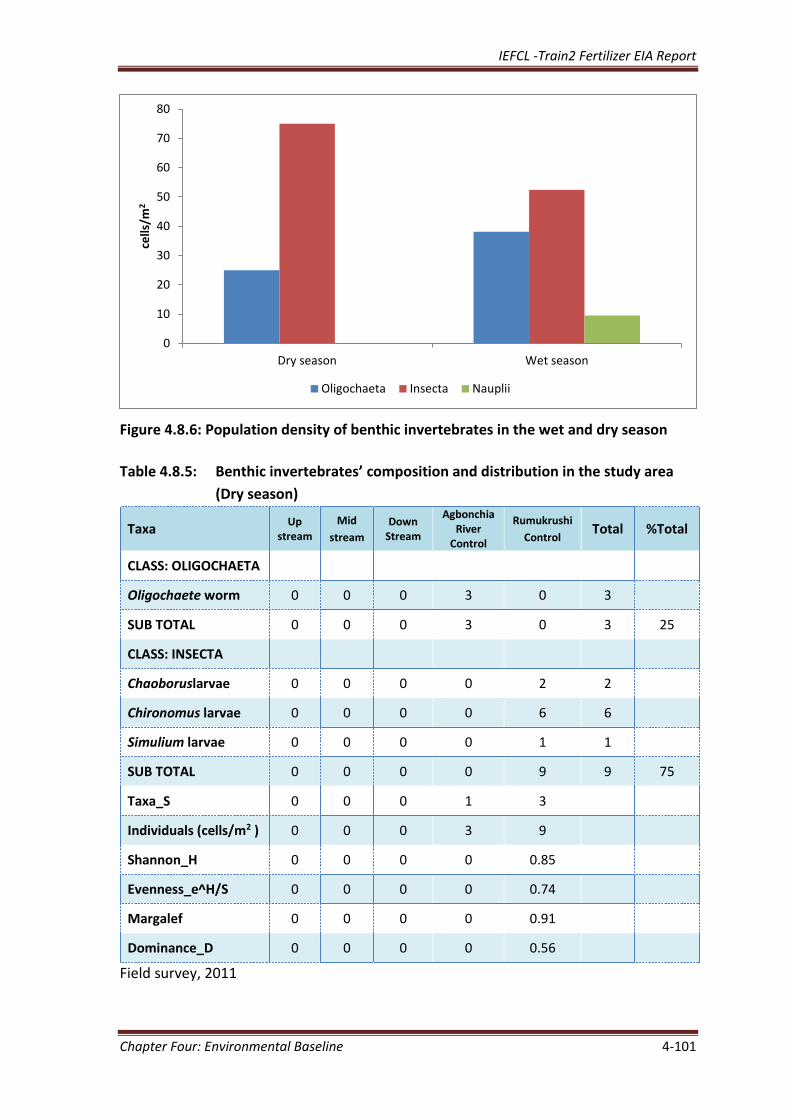
IEFCL -Train2 Fertilizer EIA Report
Chapter Four: Environmental Baseline 4-101
Figure 4.8.6: Population density of benthic invertebrates in the wet and dry season
Table 4.8.5: Benthic invertebrates’ composition and distribution in the study area
(Dry season)
Taxa Up
stream Mid
stream Down
Stream
Agbonchia River
Control
Rumukrushi
Control Total %Total
CLASS: OLIGOCHAETA
Oligochaete worm 0 0 0 3 0 3
SUB TOTAL 0 0 0 3 0 3 25
CLASS: INSECTA
Chaoboruslarvae 0 0 0 0 2 2
Chironomus larvae 0 0 0 0 6 6
Simulium larvae 0 0 0 0 1 1
SUB TOTAL 0 0 0 0 9 9 75
Taxa_S 0 0 0 1 3
Individuals (cells/m2 ) 0 0 0 3 9
Shannon_H 0 0 0 0 0.85
Evenness_e^H/S 0 0 0 0 0.74
Margalef 0 0 0 0 0.91
Dominance_D 0 0 0 0 0.56
Field survey, 2011
0
10
20
30
40
50
60
70
80
Dry season Wet season
cells
/m2
Oligochaeta Insecta Nauplii
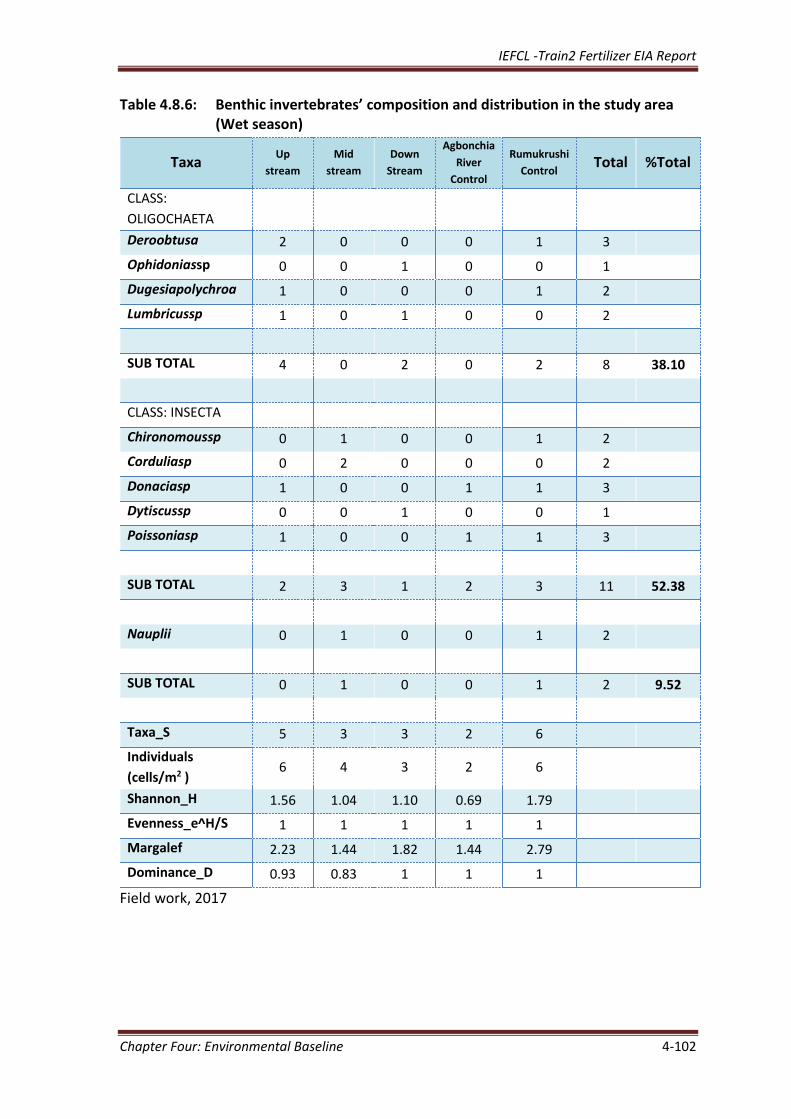
IEFCL -Train2 Fertilizer EIA Report
Chapter Four: Environmental Baseline 4-102
Table 4.8.6: Benthic invertebrates’ composition and distribution in the study area (Wet season)
Taxa Up
stream Mid
stream Down
Stream
Agbonchia
River
Control
Rumukrushi
Control Total %Total
CLASS:
OLIGOCHAETA
Deroobtusa 2 0 0 0 1 3
Ophidoniassp 0 0 1 0 0 1
Dugesiapolychroa 1 0 0 0 1 2
Lumbricussp 1 0 1 0 0 2
SUB TOTAL 4 0 2 0 2 8 38.10
CLASS: INSECTA
Chironomoussp 0 1 0 0 1 2
Corduliasp 0 2 0 0 0 2
Donaciasp 1 0 0 1 1 3
Dytiscussp 0 0 1 0 0 1
Poissoniasp 1 0 0 1 1 3
SUB TOTAL 2 3 1 2 3 11 52.38
Nauplii 0 1 0 0 1 2
SUB TOTAL 0 1 0 0 1 2 9.52
Taxa_S 5 3 3 2 6
Individuals
(cells/m2 ) 6 4 3 2 6
Shannon_H 1.56 1.04 1.10 0.69 1.79
Evenness_e^H/S 1 1 1 1 1
Margalef 2.23 1.44 1.82 1.44 2.79
Dominance_D 0.93 0.83 1 1 1
Field work, 2017
IEFCL -Train2 Fertilizer EIA Report
Chapter Four: Environmental Baseline 4-103
4.8.4 Fisheries
4.8.4.1 Fishery Composition of the Study Area
Fishing activities in the surface water bodies around the project area are generally
subsistent and nearly absent in the last few years. The fishery resources in these lentic
systems have been severely threatened with increasing manual and mechanical sand-
mining activities. During the field data gathering exercise, there was no presence of
artisanal fishing activities in the Okulu stream.
The analytical result of the aquatic ecosystem in both climatic regimes (Surface water
quality, Sediment quality and Hydrobiology) which are far below threshold limits set
by regulatory agency indicate sufficient carrying capacity of the Okulu stream.
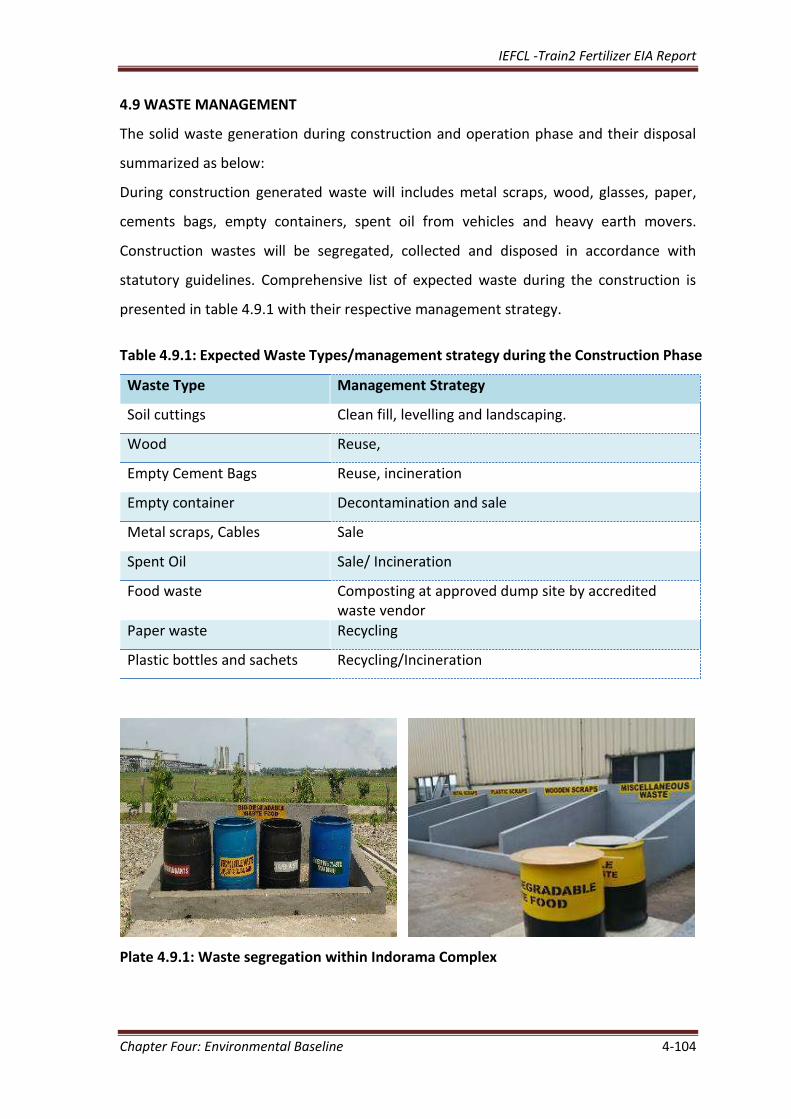
IEFCL -Train2 Fertilizer EIA Report
Chapter Four: Environmental Baseline 4-104
4.9 WASTE MANAGEMENT
The solid waste generation during construction and operation phase and their disposal
summarized as below:
During construction generated waste will includes metal scraps, wood, glasses, paper,
cements bags, empty containers, spent oil from vehicles and heavy earth movers.
Construction wastes will be segregated, collected and disposed in accordance with
statutory guidelines. Comprehensive list of expected waste during the construction is
presented in table 4.9.1 with their respective management strategy.
Table 4.9.1: Expected Waste Types/management strategy during the Construction Phase
Waste Type Management Strategy
Soil cuttings Clean fill, levelling and landscaping.
Wood Reuse,
Empty Cement Bags Reuse, incineration
Empty container Decontamination and sale
Metal scraps, Cables Sale
Spent Oil Sale/ Incineration
Food waste Composting at approved dump site by accredited waste vendor
Paper waste Recycling
Plastic bottles and sachets Recycling/Incineration
Plate 4.9.1: Waste segregation within Indorama Complex
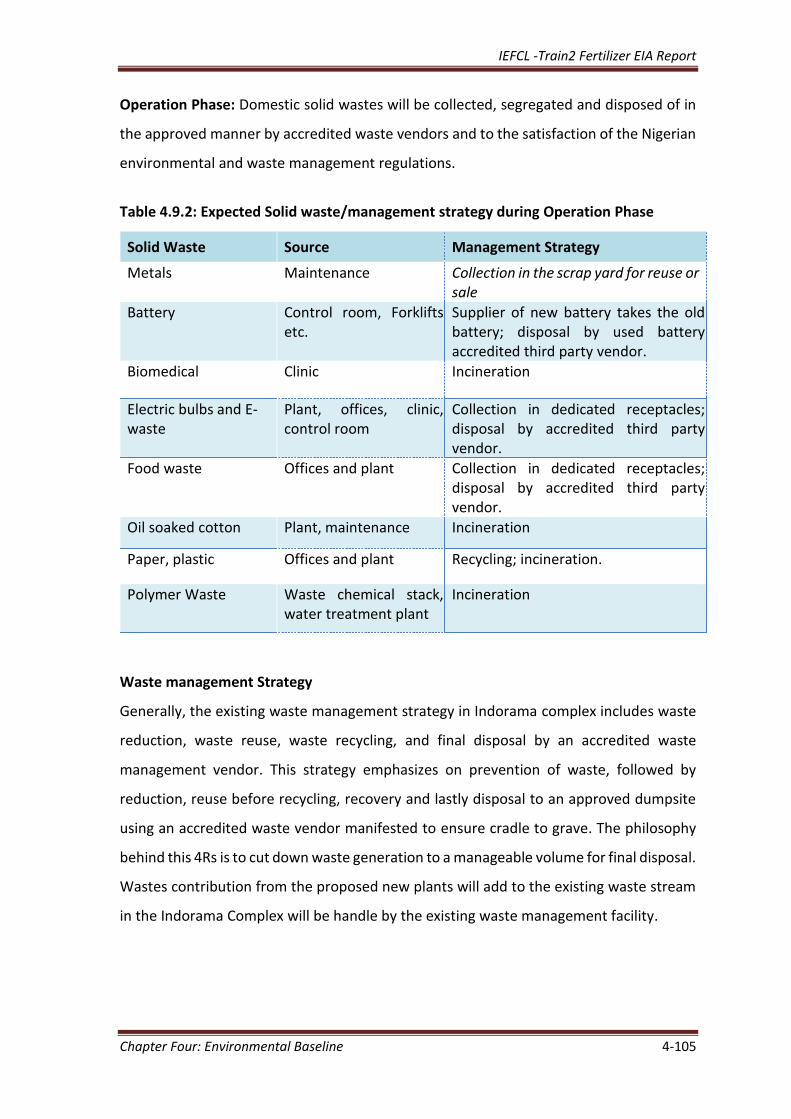
IEFCL -Train2 Fertilizer EIA Report
Chapter Four: Environmental Baseline 4-105
Operation Phase: Domestic solid wastes will be collected, segregated and disposed of in
the approved manner by accredited waste vendors and to the satisfaction of the Nigerian
environmental and waste management regulations.
Table 4.9.2: Expected Solid waste/management strategy during Operation Phase
Solid Waste Source Management Strategy
Metals Maintenance Collection in the scrap yard for reuse or sale
Battery Control room, Forklifts etc.
Supplier of new battery takes the old battery; disposal by used battery accredited third party vendor.
Biomedical Clinic Incineration
Electric bulbs and E-waste
Plant, offices, clinic, control room
Collection in dedicated receptacles; disposal by accredited third party vendor.
Food waste Offices and plant Collection in dedicated receptacles; disposal by accredited third party vendor.
Oil soaked cotton Plant, maintenance Incineration
Paper, plastic Offices and plant Recycling; incineration.
Polymer Waste Waste chemical stack, water treatment plant
Incineration
Waste management Strategy
Generally, the existing waste management strategy in Indorama complex includes waste
reduction, waste reuse, waste recycling, and final disposal by an accredited waste
management vendor. This strategy emphasizes on prevention of waste, followed by
reduction, reuse before recycling, recovery and lastly disposal to an approved dumpsite
using an accredited waste vendor manifested to ensure cradle to grave. The philosophy
behind this 4Rs is to cut down waste generation to a manageable volume for final disposal.
Wastes contribution from the proposed new plants will add to the existing waste stream
in the Indorama Complex will be handle by the existing waste management facility.
IEFCL -Train2 Fertilizer EIA Report
Chapter Four: Environmental Baseline 4-106
4.10 SOCIO – ECONOMIC ASSESSMENT
4.10.1 Study Settlements
The area considered for the Socio Economic Impact Assessment (SEIA) covers a radius of
5km from the Indorama Complex (area of study for the project EIA report). In the area
under consideration, there are four (4) main settlements namely Agbonchia, Aleto,
Akpajo, in the Eleme Local Government Area and Elelenwo in Obio/Akpor. Elelenwo is of
Ikwerre origin. Among Aleto and Agbonchia settlements, there are three family units,
respectively Okerewa, Njuru and Akpankpan, whose creations were to ensure adequate
community welfare packages to the host communities by the Indorama management.
Okerewa is studied under Aleto, while Njuru and Akpakpan are covered under Agbonchia.
These settlements have been considered for the study because of their proximity to the
Project site, in which the major social impacts related to the project are expected. The
people of Eleme claim a common ancestry, language and ethnicity while the Elelenwo
community is of the Ikwerre ethnic group.
4.10.2 The Eleme Communities
Eleme is a kingdom and the current traditional head king Oluka Ejire, the Onne-eh Eleme
is a government recognized 1st class chief. Although Ogale is the traditional headquarters
of Eleme kingdom, the present ruler hails from Agbonchia. Eleme shares boundary with
other ethnic groups in Rivers State like Ikwerre, Okrika, Oyigbo and Ogonis. The language
of Eleme also borrows from these neighbours and shares strong similarities with Ogoni.
There are two clans in Eleme: Odido and Nchia; the study communities belong to the
Nchia clan.
There is a hierarchical order of leadership whereby the paramount ruler is at the apex and
the ordinary citizen is at the bottom. In-between the hierarchy are family heads or chiefs
who usually sit with Emere Eleme in Council. Within the leadership structure are
influential groups such as the Community Development Committee (CDC) and the youths.
The CDC comprises representatives from the various units that make up the community.
Notable individuals are co-opted as members if they feel that they could be resourceful
in contributing to the progress of the community even if they are not initially proposed
from their units.
IEFCL -Train2 Fertilizer EIA Report
Chapter Four: Environmental Baseline 4-107
Rise in the proportion of young people who become exposed to modern lifestyle,
education and attitudes has brought youthful exuberance to the fore. The Youths Council
in Eleme are active in conversing issues such as employment, scholarship, industrial
relations and culture. Accordingly, sub committees of the Youth’s Council are formed to
address the various challenges they face. Another group with influence in Eleme is the
women head chiefs in the various sub-clans. Other groups in the community are peer
groups, age grade, trade groups and social clubs.
4.10.3 Elelenwo Community
The people of Elelenwo are descended from Obio after whom Obio/Akpor local
government area of Rivers state is named. Obio had two sons namely Evo and Apara.
Under Evo, there are three clans EvoKpotoma and Esara. Kpotoma has six communities
namely Rumuluku, Rumuenyeron, Rumueziolu, Rumuoduwere, Rumueheleze and
Rumuodani. Elelenwo comprises sections of the last three communities. Rumuodani is
the community whose land is part of the territory that was acquired by the Federal
government to build the then Eleme Petrochemical complex. Elelenwo traditional
leadership has a committee of the three clans whose chairman is the paramount ruler of
Elelenwo. The headship is rotated so that every clan at some time have the chance of
leading the community. For Elelenwo as a whole, there is a community development
committee, youth council, women group and Owhor holders (Ikwerre traditional
priesthood). These various groups are like arms that govern Elelenwo community.
4.10.4 Socio-economic Survey
In this survey, respondents weighed the relative degree of influence among the categories
described above. In community governance; chiefs were rated highest, followed by the
youths, elders, women and age grade.
Settlement Pattern
Settlement pattern in the study area is nucleated. All the settlement layouts are densely
built and occupied with streets and lengthy roads. It is likely that they all began as linear
settlements along the old Bori road, but the evidence now is of settlements with internal
structures that spread deep from the main thoroughfare. The internal structures of the
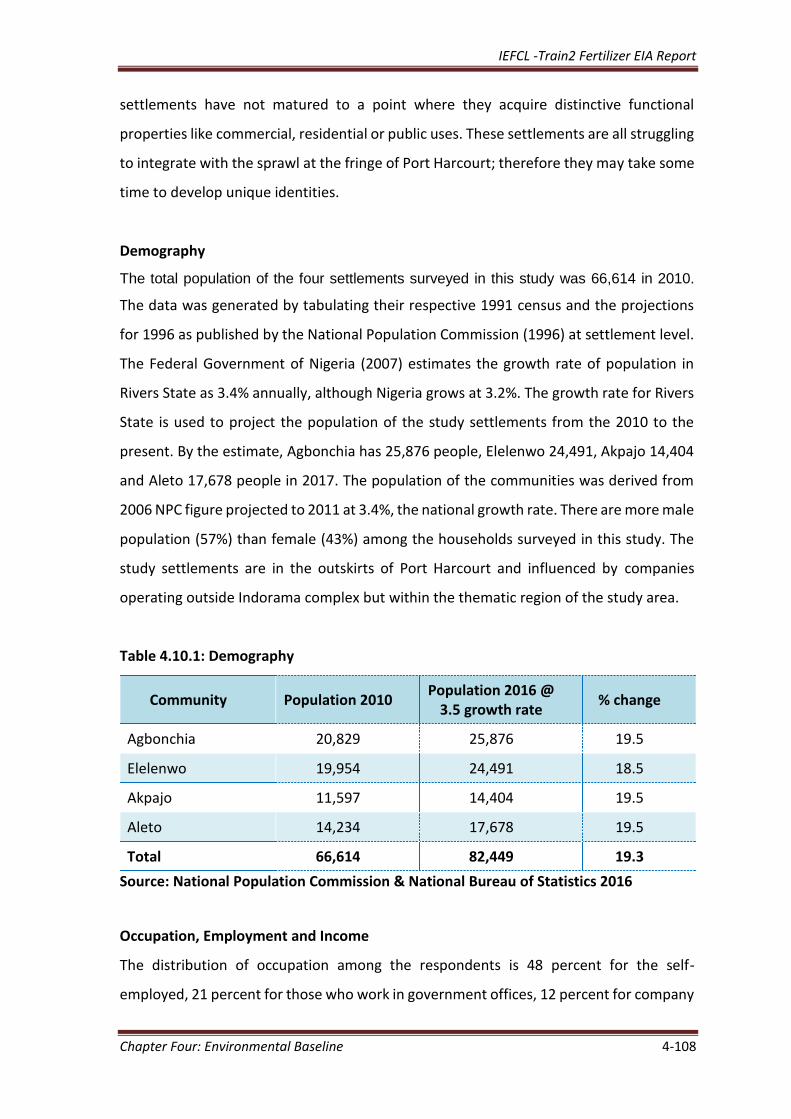
IEFCL -Train2 Fertilizer EIA Report
Chapter Four: Environmental Baseline 4-108
settlements have not matured to a point where they acquire distinctive functional
properties like commercial, residential or public uses. These settlements are all struggling
to integrate with the sprawl at the fringe of Port Harcourt; therefore they may take some
time to develop unique identities.
Demography
The total population of the four settlements surveyed in this study was 66,614 in 2010.
The data was generated by tabulating their respective 1991 census and the projections
for 1996 as published by the National Population Commission (1996) at settlement level.
The Federal Government of Nigeria (2007) estimates the growth rate of population in
Rivers State as 3.4% annually, although Nigeria grows at 3.2%. The growth rate for Rivers
State is used to project the population of the study settlements from the 2010 to the
present. By the estimate, Agbonchia has 25,876 people, Elelenwo 24,491, Akpajo 14,404
and Aleto 17,678 people in 2017. The population of the communities was derived from
2006 NPC figure projected to 2011 at 3.4%, the national growth rate. There are more male
population (57%) than female (43%) among the households surveyed in this study. The
study settlements are in the outskirts of Port Harcourt and influenced by companies
operating outside Indorama complex but within the thematic region of the study area.
Table 4.10.1: Demography
Community Population 2010 Population 2016 @
3.5 growth rate % change
Agbonchia 20,829 25,876 19.5
Elelenwo 19,954 24,491 18.5
Akpajo 11,597 14,404 19.5
Aleto 14,234 17,678 19.5
Total 66,614 82,449 19.3
Source: National Population Commission & National Bureau of Statistics 2016
Occupation, Employment and Income
The distribution of occupation among the respondents is 48 percent for the self-
employed, 21 percent for those who work in government offices, 12 percent for company
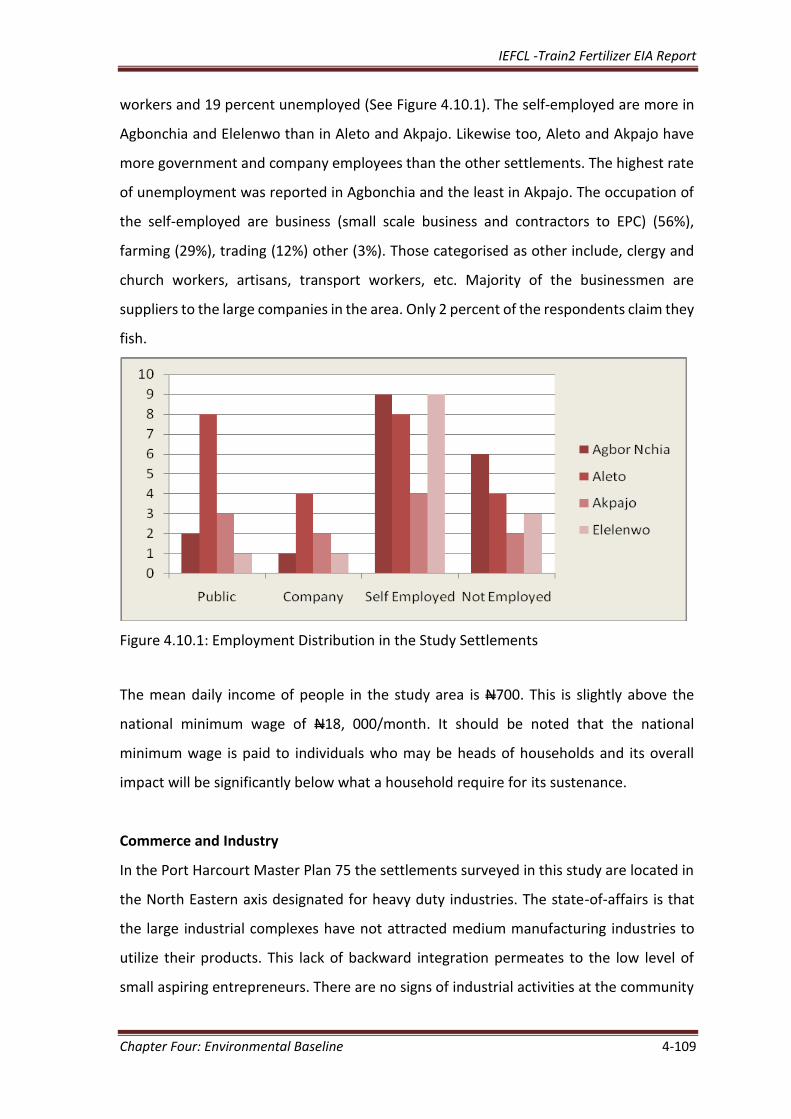
IEFCL -Train2 Fertilizer EIA Report
Chapter Four: Environmental Baseline 4-109
workers and 19 percent unemployed (See Figure 4.10.1). The self-employed are more in
Agbonchia and Elelenwo than in Aleto and Akpajo. Likewise too, Aleto and Akpajo have
more government and company employees than the other settlements. The highest rate
of unemployment was reported in Agbonchia and the least in Akpajo. The occupation of
the self-employed are business (small scale business and contractors to EPC) (56%),
farming (29%), trading (12%) other (3%). Those categorised as other include, clergy and
church workers, artisans, transport workers, etc. Majority of the businessmen are
suppliers to the large companies in the area. Only 2 percent of the respondents claim they
fish.
Figure 4.10.1: Employment Distribution in the Study Settlements
The mean daily income of people in the study area is N700. This is slightly above the
national minimum wage of N18, 000/month. It should be noted that the national
minimum wage is paid to individuals who may be heads of households and its overall
impact will be significantly below what a household require for its sustenance.
Commerce and Industry
In the Port Harcourt Master Plan 75 the settlements surveyed in this study are located in
the North Eastern axis designated for heavy duty industries. The state-of-affairs is that
the large industrial complexes have not attracted medium manufacturing industries to
utilize their products. This lack of backward integration permeates to the low level of
small aspiring entrepreneurs. There are no signs of industrial activities at the community
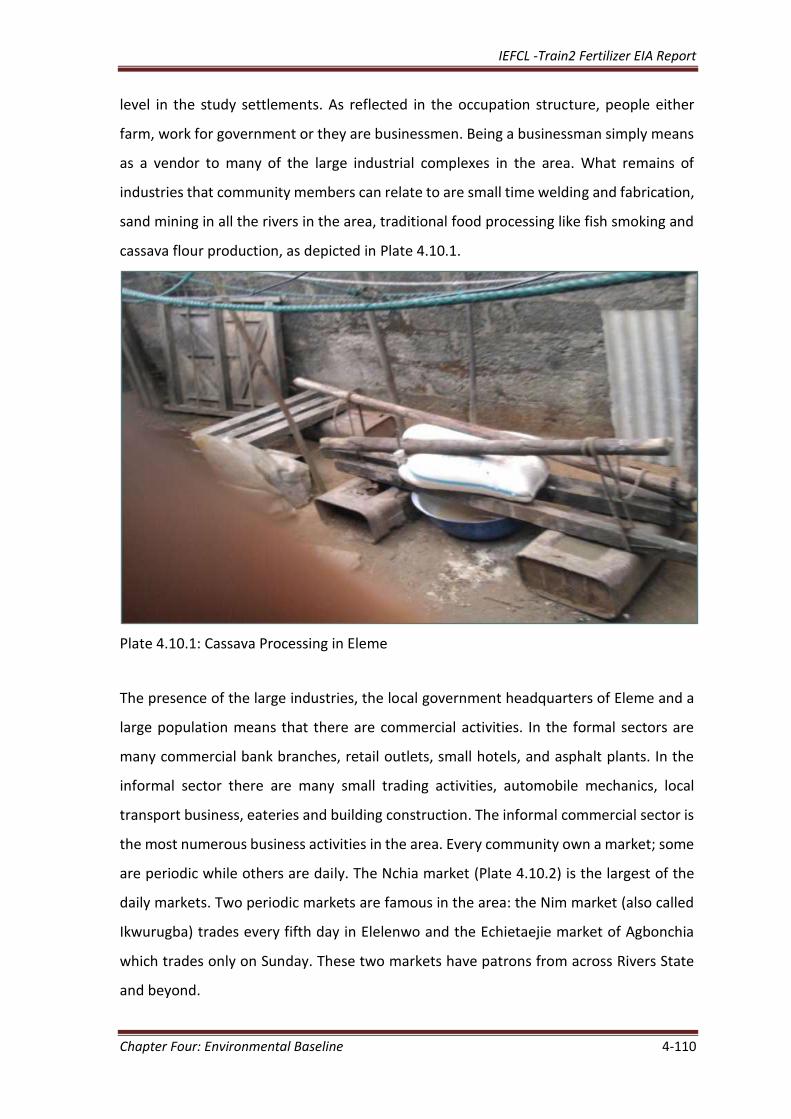
IEFCL -Train2 Fertilizer EIA Report
Chapter Four: Environmental Baseline 4-110
level in the study settlements. As reflected in the occupation structure, people either
farm, work for government or they are businessmen. Being a businessman simply means
as a vendor to many of the large industrial complexes in the area. What remains of
industries that community members can relate to are small time welding and fabrication,
sand mining in all the rivers in the area, traditional food processing like fish smoking and
cassava flour production, as depicted in Plate 4.10.1.
Plate 4.10.1: Cassava Processing in Eleme
The presence of the large industries, the local government headquarters of Eleme and a
large population means that there are commercial activities. In the formal sectors are
many commercial bank branches, retail outlets, small hotels, and asphalt plants. In the
informal sector there are many small trading activities, automobile mechanics, local
transport business, eateries and building construction. The informal commercial sector is
the most numerous business activities in the area. Every community own a market; some
are periodic while others are daily. The Nchia market (Plate 4.10.2) is the largest of the
daily markets. Two periodic markets are famous in the area: the Nim market (also called
Ikwurugba) trades every fifth day in Elelenwo and the Echietaejie market of Agbonchia
which trades only on Sunday. These two markets have patrons from across Rivers State
and beyond.
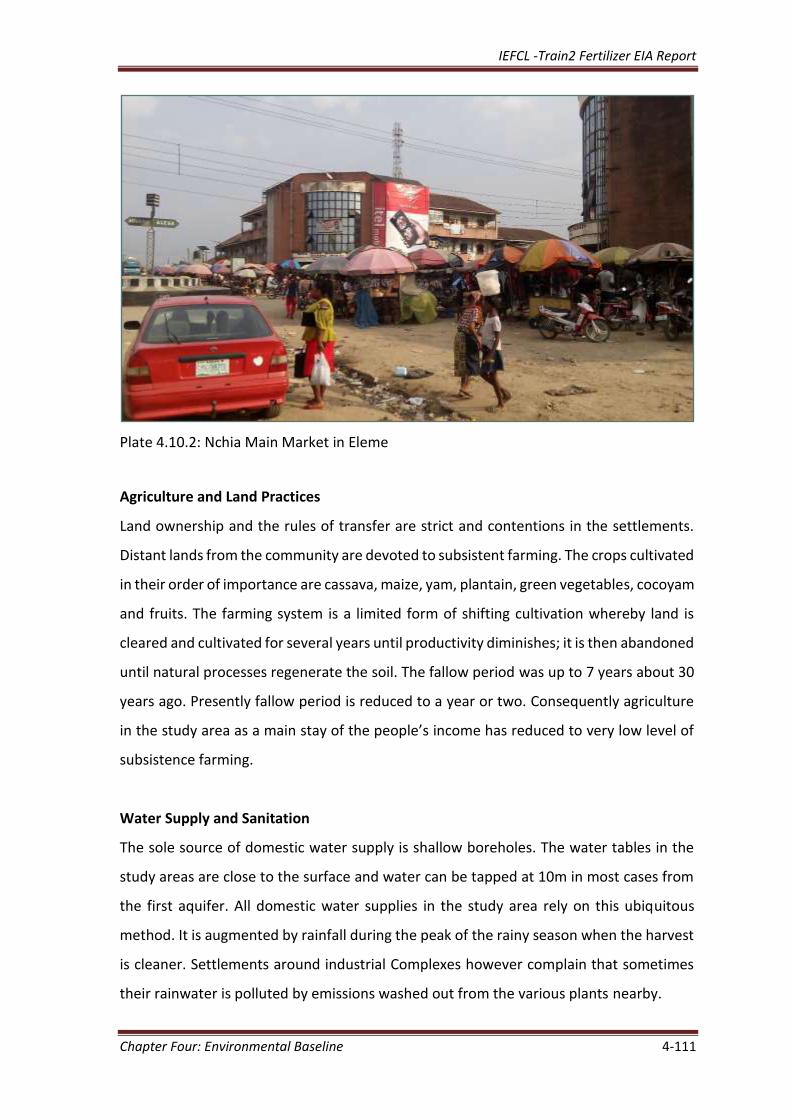
IEFCL -Train2 Fertilizer EIA Report
Chapter Four: Environmental Baseline 4-111
Plate 4.10.2: Nchia Main Market in Eleme
Agriculture and Land Practices
Land ownership and the rules of transfer are strict and contentions in the settlements.
Distant lands from the community are devoted to subsistent farming. The crops cultivated
in their order of importance are cassava, maize, yam, plantain, green vegetables, cocoyam
and fruits. The farming system is a limited form of shifting cultivation whereby land is
cleared and cultivated for several years until productivity diminishes; it is then abandoned
until natural processes regenerate the soil. The fallow period was up to 7 years about 30
years ago. Presently fallow period is reduced to a year or two. Consequently agriculture
in the study area as a main stay of the people’s income has reduced to very low level of
subsistence farming.
Water Supply and Sanitation
The sole source of domestic water supply is shallow boreholes. The water tables in the
study areas are close to the surface and water can be tapped at 10m in most cases from
the first aquifer. All domestic water supplies in the study area rely on this ubiquitous
method. It is augmented by rainfall during the peak of the rainy season when the harvest
is cleaner. Settlements around industrial Complexes however complain that sometimes
their rainwater is polluted by emissions washed out from the various plants nearby.
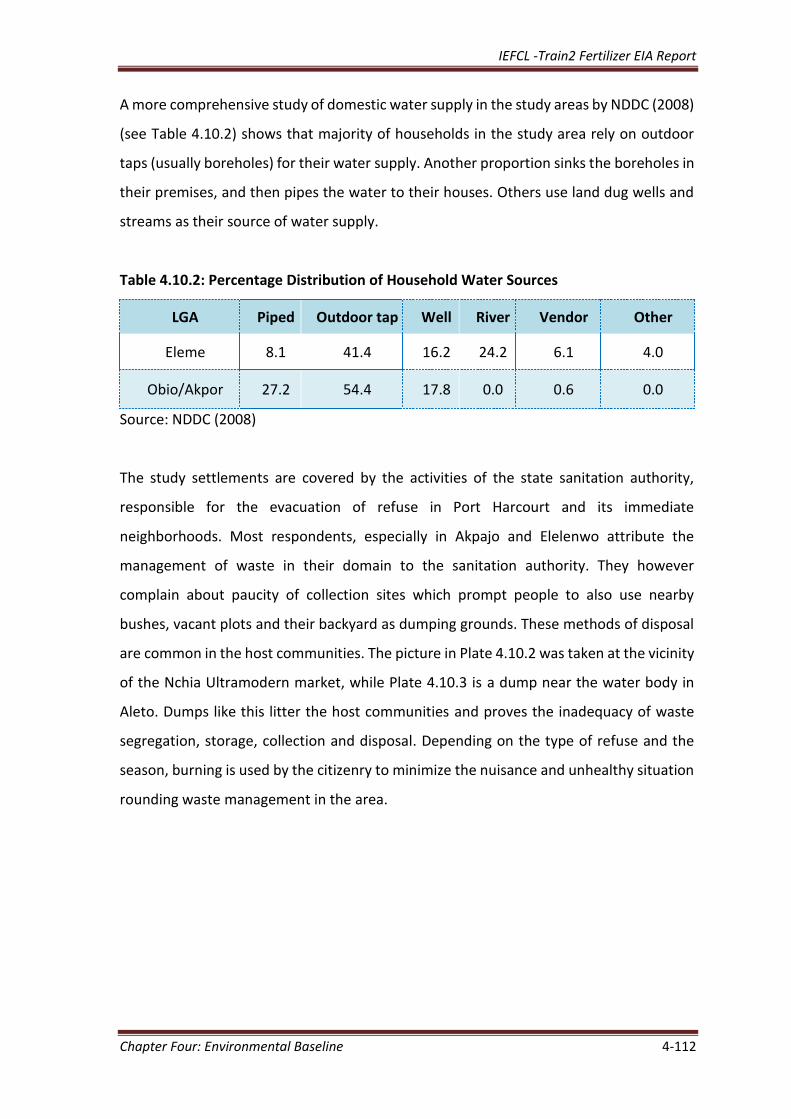
IEFCL -Train2 Fertilizer EIA Report
Chapter Four: Environmental Baseline 4-112
A more comprehensive study of domestic water supply in the study areas by NDDC (2008)
(see Table 4.10.2) shows that majority of households in the study area rely on outdoor
taps (usually boreholes) for their water supply. Another proportion sinks the boreholes in
their premises, and then pipes the water to their houses. Others use land dug wells and
streams as their source of water supply.
Table 4.10.2: Percentage Distribution of Household Water Sources
LGA Piped Outdoor tap Well River Vendor Other
Eleme 8.1 41.4 16.2 24.2 6.1 4.0
Obio/Akpor 27.2 54.4 17.8 0.0 0.6 0.0
Source: NDDC (2008)
The study settlements are covered by the activities of the state sanitation authority,
responsible for the evacuation of refuse in Port Harcourt and its immediate
neighborhoods. Most respondents, especially in Akpajo and Elelenwo attribute the
management of waste in their domain to the sanitation authority. They however
complain about paucity of collection sites which prompt people to also use nearby
bushes, vacant plots and their backyard as dumping grounds. These methods of disposal
are common in the host communities. The picture in Plate 4.10.2 was taken at the vicinity
of the Nchia Ultramodern market, while Plate 4.10.3 is a dump near the water body in
Aleto. Dumps like this litter the host communities and proves the inadequacy of waste
segregation, storage, collection and disposal. Depending on the type of refuse and the
season, burning is used by the citizenry to minimize the nuisance and unhealthy situation
rounding waste management in the area.
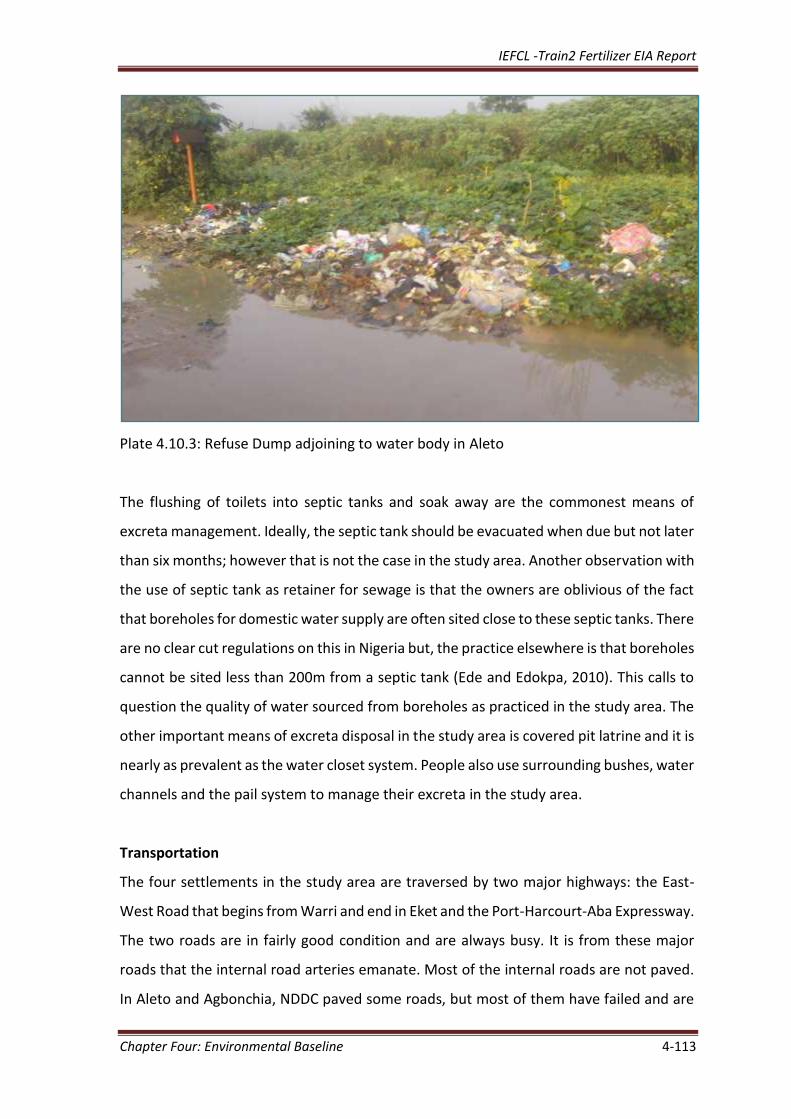
IEFCL -Train2 Fertilizer EIA Report
Chapter Four: Environmental Baseline 4-113
Plate 4.10.3: Refuse Dump adjoining to water body in Aleto
The flushing of toilets into septic tanks and soak away are the commonest means of
excreta management. Ideally, the septic tank should be evacuated when due but not later
than six months; however that is not the case in the study area. Another observation with
the use of septic tank as retainer for sewage is that the owners are oblivious of the fact
that boreholes for domestic water supply are often sited close to these septic tanks. There
are no clear cut regulations on this in Nigeria but, the practice elsewhere is that boreholes
cannot be sited less than 200m from a septic tank (Ede and Edokpa, 2010). This calls to
question the quality of water sourced from boreholes as practiced in the study area. The
other important means of excreta disposal in the study area is covered pit latrine and it is
nearly as prevalent as the water closet system. People also use surrounding bushes, water
channels and the pail system to manage their excreta in the study area.
Transportation
The four settlements in the study area are traversed by two major highways: the East-
West Road that begins from Warri and end in Eket and the Port-Harcourt-Aba Expressway.
The two roads are in fairly good condition and are always busy. It is from these major
roads that the internal road arteries emanate. Most of the internal roads are not paved.
In Aleto and Agbonchia, NDDC paved some roads, but most of them have failed and are
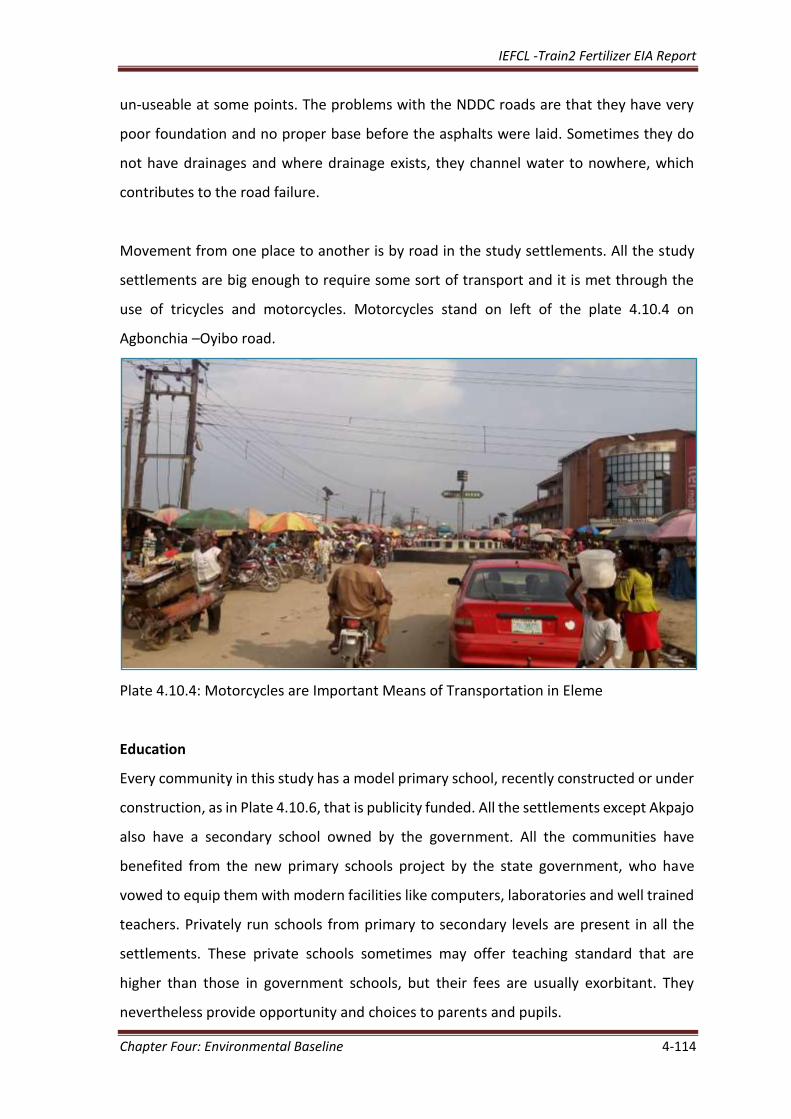
IEFCL -Train2 Fertilizer EIA Report
Chapter Four: Environmental Baseline 4-114
un-useable at some points. The problems with the NDDC roads are that they have very
poor foundation and no proper base before the asphalts were laid. Sometimes they do
not have drainages and where drainage exists, they channel water to nowhere, which
contributes to the road failure.
Movement from one place to another is by road in the study settlements. All the study
settlements are big enough to require some sort of transport and it is met through the
use of tricycles and motorcycles. Motorcycles stand on left of the plate 4.10.4 on
Agbonchia –Oyibo road.
Plate 4.10.4: Motorcycles are Important Means of Transportation in Eleme
Education
Every community in this study has a model primary school, recently constructed or under
construction, as in Plate 4.10.6, that is publicity funded. All the settlements except Akpajo
also have a secondary school owned by the government. All the communities have
benefited from the new primary schools project by the state government, who have
vowed to equip them with modern facilities like computers, laboratories and well trained
teachers. Privately run schools from primary to secondary levels are present in all the
settlements. These private schools sometimes may offer teaching standard that are
higher than those in government schools, but their fees are usually exorbitant. They
nevertheless provide opportunity and choices to parents and pupils.
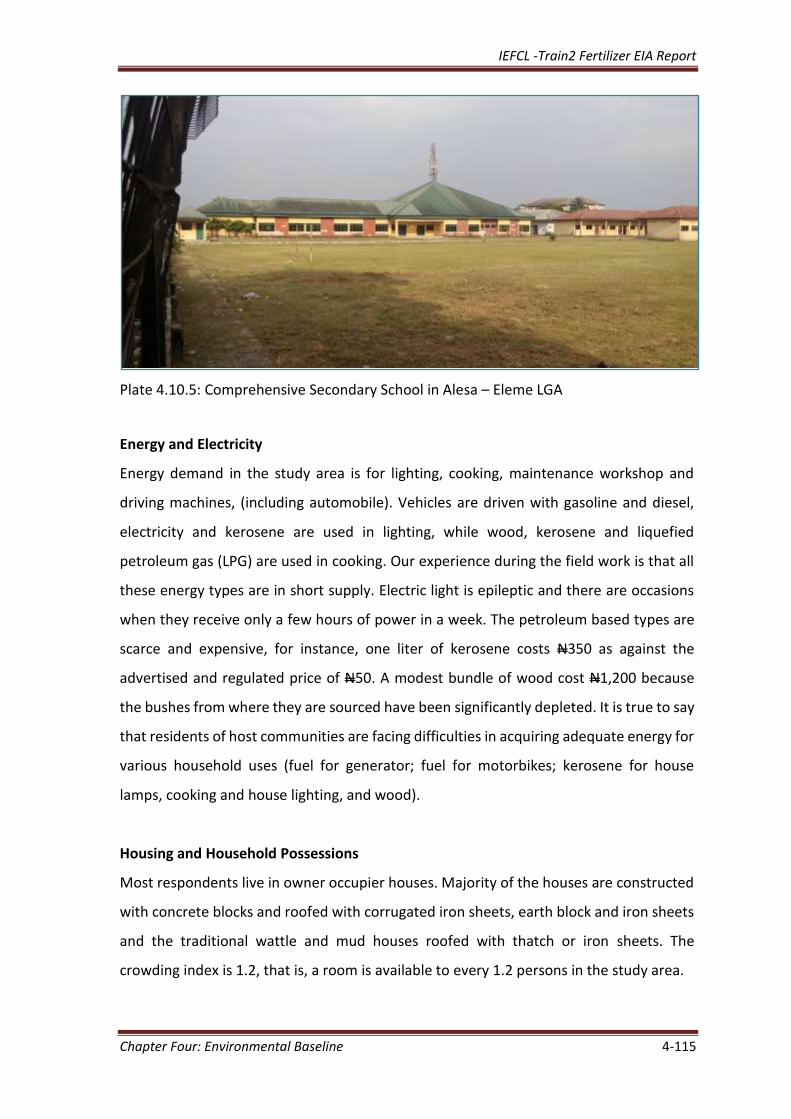
IEFCL -Train2 Fertilizer EIA Report
Chapter Four: Environmental Baseline 4-115
Plate 4.10.5: Comprehensive Secondary School in Alesa – Eleme LGA
Energy and Electricity
Energy demand in the study area is for lighting, cooking, maintenance workshop and
driving machines, (including automobile). Vehicles are driven with gasoline and diesel,
electricity and kerosene are used in lighting, while wood, kerosene and liquefied
petroleum gas (LPG) are used in cooking. Our experience during the field work is that all
these energy types are in short supply. Electric light is epileptic and there are occasions
when they receive only a few hours of power in a week. The petroleum based types are
scarce and expensive, for instance, one liter of kerosene costs N350 as against the
advertised and regulated price of N50. A modest bundle of wood cost N1,200 because
the bushes from where they are sourced have been significantly depleted. It is true to say
that residents of host communities are facing difficulties in acquiring adequate energy for
various household uses (fuel for generator; fuel for motorbikes; kerosene for house
lamps, cooking and house lighting, and wood).
Housing and Household Possessions
Most respondents live in owner occupier houses. Majority of the houses are constructed
with concrete blocks and roofed with corrugated iron sheets, earth block and iron sheets
and the traditional wattle and mud houses roofed with thatch or iron sheets. The
crowding index is 1.2, that is, a room is available to every 1.2 persons in the study area.
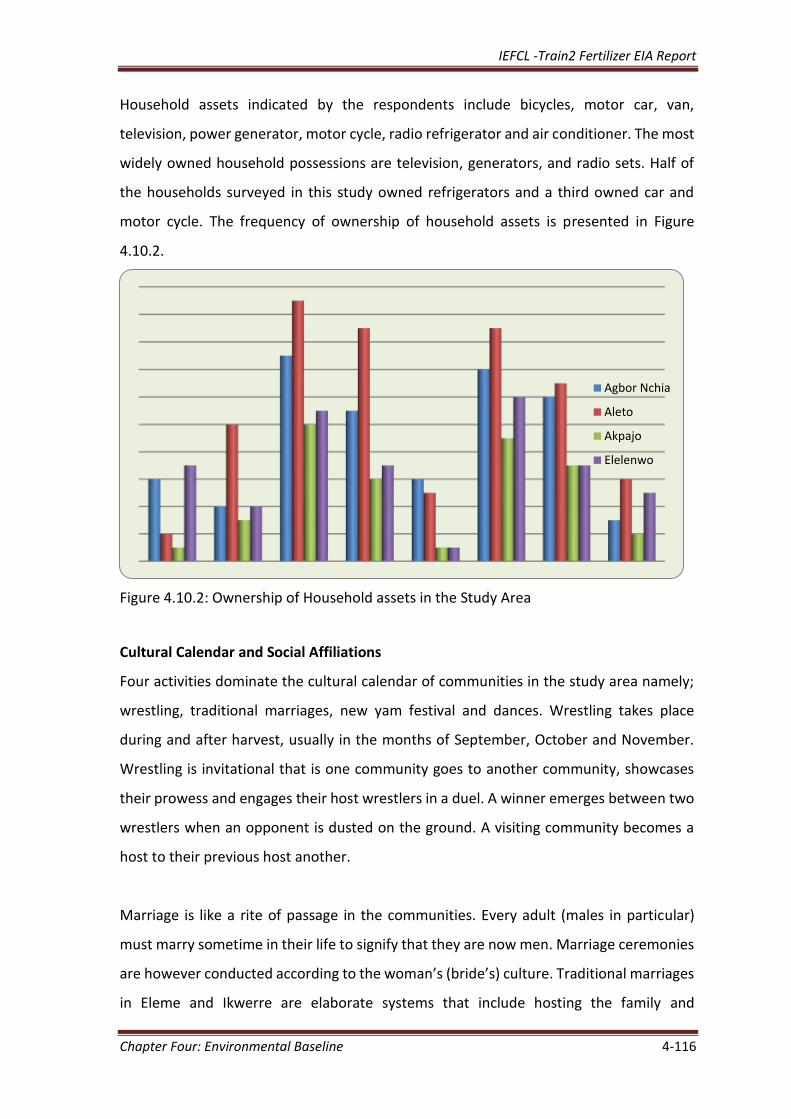
IEFCL -Train2 Fertilizer EIA Report
Chapter Four: Environmental Baseline 4-116
Household assets indicated by the respondents include bicycles, motor car, van,
television, power generator, motor cycle, radio refrigerator and air conditioner. The most
widely owned household possessions are television, generators, and radio sets. Half of
the households surveyed in this study owned refrigerators and a third owned car and
motor cycle. The frequency of ownership of household assets is presented in Figure
4.10.2.
Figure 4.10.2: Ownership of Household assets in the Study Area
Cultural Calendar and Social Affiliations
Four activities dominate the cultural calendar of communities in the study area namely;
wrestling, traditional marriages, new yam festival and dances. Wrestling takes place
during and after harvest, usually in the months of September, October and November.
Wrestling is invitational that is one community goes to another community, showcases
their prowess and engages their host wrestlers in a duel. A winner emerges between two
wrestlers when an opponent is dusted on the ground. A visiting community becomes a
host to their previous host another.
Marriage is like a rite of passage in the communities. Every adult (males in particular)
must marry sometime in their life to signify that they are now men. Marriage ceremonies
are however conducted according to the woman’s (bride’s) culture. Traditional marriages
in Eleme and Ikwerre are elaborate systems that include hosting the family and
Agbor Nchia
Aleto
Akpajo
Elelenwo

IEFCL -Train2 Fertilizer EIA Report
Chapter Four: Environmental Baseline 4-117
community in feasts. As a result, the drinks and foods are the key expenditures the groom
has to prepare for. Marriage in these cultures is also not a onetime event among the
Ikwerres, this may include a minimum of four occasions and each of those occasions is
embellished with food and drinks. In Eleme a woman may be sponsored in what is called
Mgbete that takes a year of preparation before her outing to the public and suitors.
The decline in yam production in the area has affected new yam festivals also. New yam
festival used to hold in August and it is practiced in all the study settlements. The principle
is that nobody in a community eats of their yam harvest unless it is first offered to the
gods and ancestors, whom it is believed made the harvest possible. Some respondents
who do not grow yam of their own even purchase newly harvested yam in order to
partake in the ceremony. Again the new yam festival which was highly regarded as
Christmas today is fading into obscurity due to urbanization and modernity.
Traditional dances are found in every African culture. The dances may be for members’
only, free and open participation with or without masquerades. The dances may be mixed
or gender restrictive sometimes too; Esomba dance in Aleto is for women only. Similarly,
Ndudu is a form of dance for women in Ikwerre culture.
Social Affiliation in the societies involves being a member of groups where people share
things in common. The categories posed to the respondents include politics, co-
operatives, social clubs, education, religion and cultural associations. Across the study
communities, affiliation to a religious body was the greatest indicated by the
respondents. The implication is that almost all the respondents are religious, usually of
the Christian faiths. Affiliation to one or more (mainly foreign) football clubs came second.
There is no doubt that most adolescents and young adults in the community have their
favourite football clubs, and that watching their club play on television is perhaps their
preferred pastime. Other social affiliations include membership of political parties, social
clubs, educational associations, co-operatives and cultural clubs. We observed a tendency
among respondents to see specialized training in trades like fitting, iron bending, welding
and mechanics which are required in striving petroleum industries around the area. Some
even enroll for higher education as reasons for citing education as a social affiliation.

IEFCL -Train2 Fertilizer EIA Report
Chapter Four: Environmental Baseline 4-118
Taboos and Sacred Places
All human activities in traditional Eleme or Ikwerre setting has a spiritual side to it that is
effected through rituals and sacrifices and the places designated to perform these rituals
are sacred places. The basic structure of traditional religion in the study areas begins with
the family alters. In Agbonchia the study team were shown spots where the family alters
are. The Elelenwo people also have their rukannis that approximates the same thing in
Ikwerre land.
At the community level there are shrines dedicated to so many causes. Adooka and Onura
shrine in Aleto protects the community and in Elelenwo Mini Achara will be the
equivalent. Seseiokulu in Agbonchia is a shrine to which sacrifices are made before
planting, soil fertility and harvest. When things considered abomination (e.g., the death
of a woman under pregnancy, drowning) occur, the chief priest Onnenkike in Eleme is
invited to cleanse the land through sacrifice, so that such bad event do not happen again.
In Elelenwo, an infant who is afflicted may be taken to the shrine of Mini Achara vows
made to the deity. If reprieve is granted the parents are expected to redeem their pledge
through sacrifice. In Ikwerre calendar as used in Elelenwo there are five days in a week
namely Riabo, Sarabo, Namake, Okwa and Nim. Riabo is the sacred day in which most
traditional religious rites are performed and Nim is the market day. In Eleme there are
five (5) days a week namely Obo (big market day), Nma, Ojua, Ochun (small market day),
Okor. Obon is the traditional market day that no farming is allowed.
Religion
In spite of the traditional observances in the study communities most respondents
profess themselves to be Christians. The religious learning of the people include all
possible denomination, whether Orthodox or unorthodox. Among the orthodox churches
cited are Anglican, Catholic, Lutheran, Baptist, Jehovah’s Witness, and Cherubim. The
Anglican Church was however described as the community church. It is usually the oldest
Christian denomination in the communities, built through community effort and it will
have a mission school attached which is to the congregations’ commitment. Every
community surveyed in this study had several Anglican churches for instance Agbonchia
had 4, Aleto 3 and Elelenwo 4. The new (Pentecostals) churches are also gaining
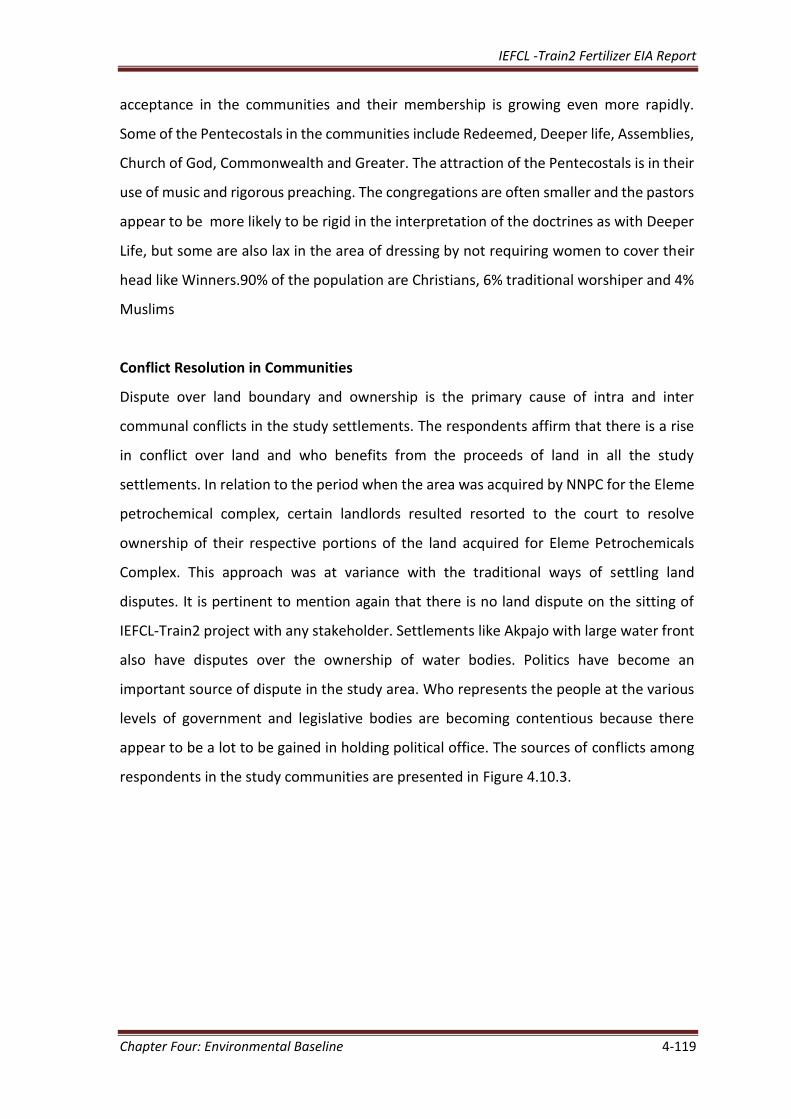
IEFCL -Train2 Fertilizer EIA Report
Chapter Four: Environmental Baseline 4-119
acceptance in the communities and their membership is growing even more rapidly.
Some of the Pentecostals in the communities include Redeemed, Deeper life, Assemblies,
Church of God, Commonwealth and Greater. The attraction of the Pentecostals is in their
use of music and rigorous preaching. The congregations are often smaller and the pastors
appear to be more likely to be rigid in the interpretation of the doctrines as with Deeper
Life, but some are also lax in the area of dressing by not requiring women to cover their
head like Winners.90% of the population are Christians, 6% traditional worshiper and 4%
Muslims
Conflict Resolution in Communities
Dispute over land boundary and ownership is the primary cause of intra and inter
communal conflicts in the study settlements. The respondents affirm that there is a rise
in conflict over land and who benefits from the proceeds of land in all the study
settlements. In relation to the period when the area was acquired by NNPC for the Eleme
petrochemical complex, certain landlords resulted resorted to the court to resolve
ownership of their respective portions of the land acquired for Eleme Petrochemicals
Complex. This approach was at variance with the traditional ways of settling land
disputes. It is pertinent to mention again that there is no land dispute on the sitting of
IEFCL-Train2 project with any stakeholder. Settlements like Akpajo with large water front
also have disputes over the ownership of water bodies. Politics have become an
important source of dispute in the study area. Who represents the people at the various
levels of government and legislative bodies are becoming contentious because there
appear to be a lot to be gained in holding political office. The sources of conflicts among
respondents in the study communities are presented in Figure 4.10.3.
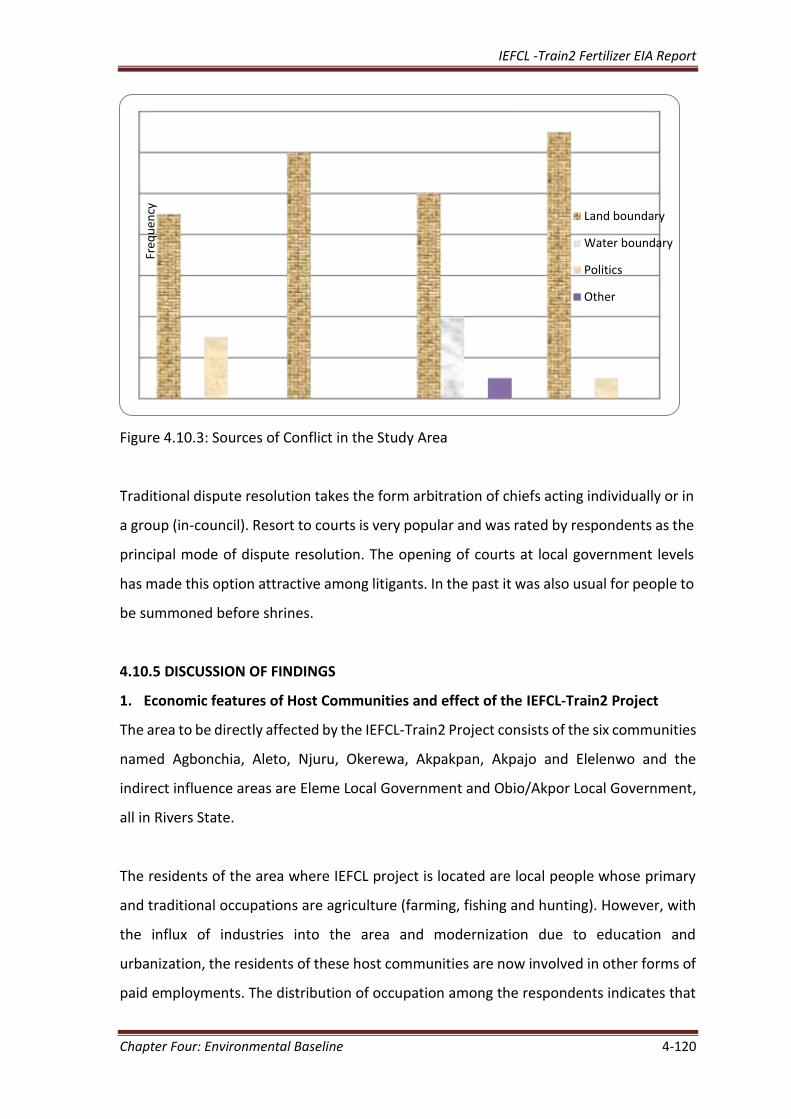
IEFCL -Train2 Fertilizer EIA Report
Chapter Four: Environmental Baseline 4-120
Figure 4.10.3: Sources of Conflict in the Study Area
Traditional dispute resolution takes the form arbitration of chiefs acting individually or in
a group (in-council). Resort to courts is very popular and was rated by respondents as the
principal mode of dispute resolution. The opening of courts at local government levels
has made this option attractive among litigants. In the past it was also usual for people to
be summoned before shrines.
4.10.5 DISCUSSION OF FINDINGS
1. Economic features of Host Communities and effect of the IEFCL-Train2 Project
The area to be directly affected by the IEFCL-Train2 Project consists of the six communities
named Agbonchia, Aleto, Njuru, Okerewa, Akpakpan, Akpajo and Elelenwo and the
indirect influence areas are Eleme Local Government and Obio/Akpor Local Government,
all in Rivers State.
The residents of the area where IEFCL project is located are local people whose primary
and traditional occupations are agriculture (farming, fishing and hunting). However, with
the influx of industries into the area and modernization due to education and
urbanization, the residents of these host communities are now involved in other forms of
paid employments. The distribution of occupation among the respondents indicates that
Freq
uen
cy Land boundary
Water boundary
Politics
Other
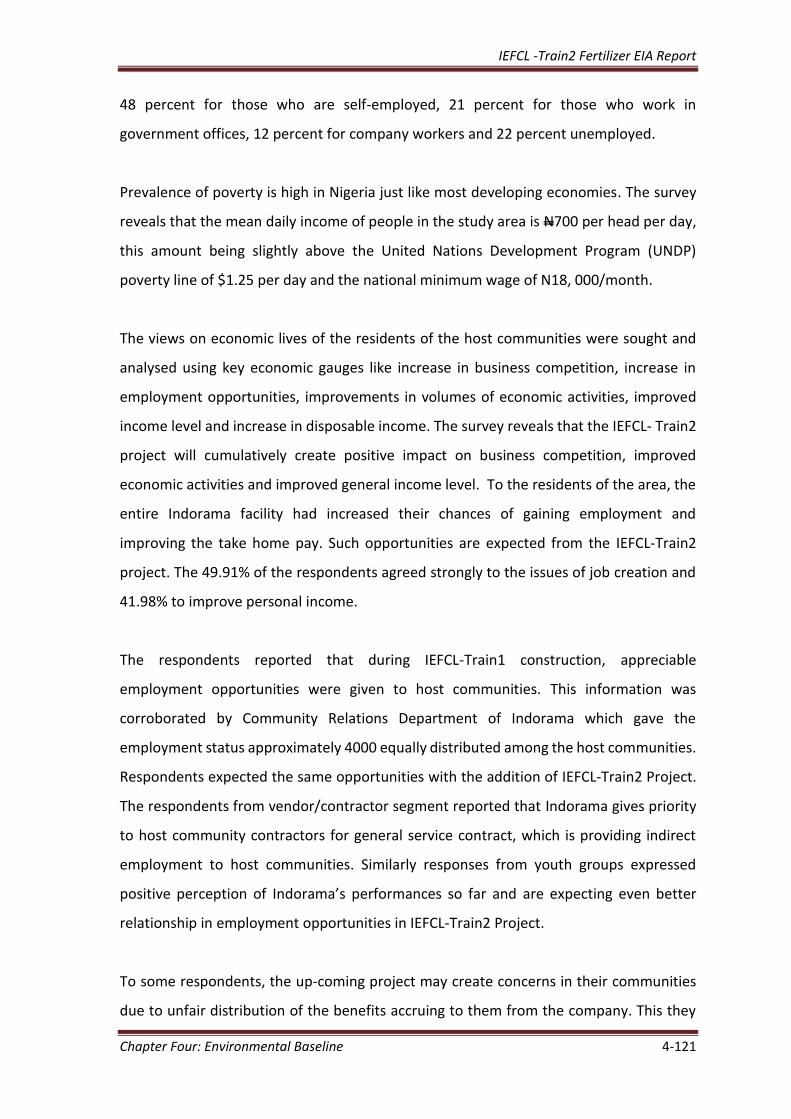
IEFCL -Train2 Fertilizer EIA Report
Chapter Four: Environmental Baseline 4-121
48 percent for those who are self-employed, 21 percent for those who work in
government offices, 12 percent for company workers and 22 percent unemployed.
Prevalence of poverty is high in Nigeria just like most developing economies. The survey
reveals that the mean daily income of people in the study area is N700 per head per day,
this amount being slightly above the United Nations Development Program (UNDP)
poverty line of $1.25 per day and the national minimum wage of N18, 000/month.
The views on economic lives of the residents of the host communities were sought and
analysed using key economic gauges like increase in business competition, increase in
employment opportunities, improvements in volumes of economic activities, improved
income level and increase in disposable income. The survey reveals that the IEFCL- Train2
project will cumulatively create positive impact on business competition, improved
economic activities and improved general income level. To the residents of the area, the
entire Indorama facility had increased their chances of gaining employment and
improving the take home pay. Such opportunities are expected from the IEFCL-Train2
project. The 49.91% of the respondents agreed strongly to the issues of job creation and
41.98% to improve personal income.
The respondents reported that during IEFCL-Train1 construction, appreciable
employment opportunities were given to host communities. This information was
corroborated by Community Relations Department of Indorama which gave the
employment status approximately 4000 equally distributed among the host communities.
Respondents expected the same opportunities with the addition of IEFCL-Train2 Project.
The respondents from vendor/contractor segment reported that Indorama gives priority
to host community contractors for general service contract, which is providing indirect
employment to host communities. Similarly responses from youth groups expressed
positive perception of Indorama’s performances so far and are expecting even better
relationship in employment opportunities in IEFCL-Train2 Project.
To some respondents, the up-coming project may create concerns in their communities
due to unfair distribution of the benefits accruing to them from the company. This they
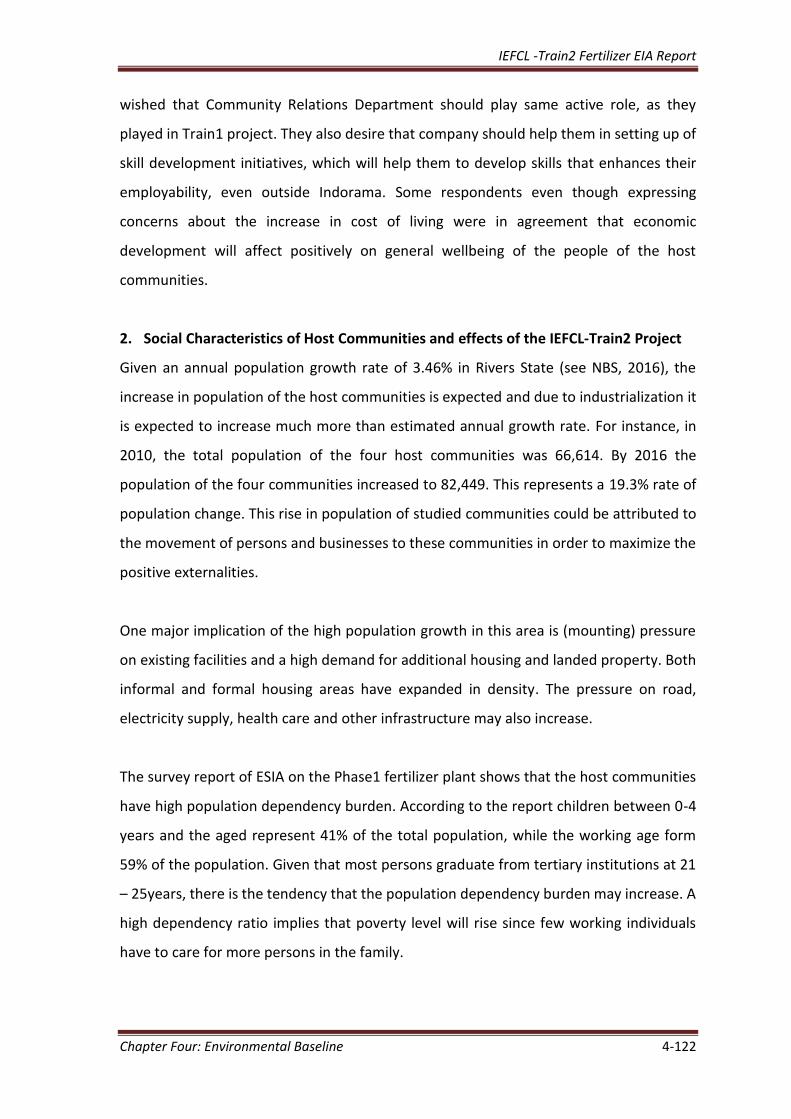
IEFCL -Train2 Fertilizer EIA Report
Chapter Four: Environmental Baseline 4-122
wished that Community Relations Department should play same active role, as they
played in Train1 project. They also desire that company should help them in setting up of
skill development initiatives, which will help them to develop skills that enhances their
employability, even outside Indorama. Some respondents even though expressing
concerns about the increase in cost of living were in agreement that economic
development will affect positively on general wellbeing of the people of the host
communities.
2. Social Characteristics of Host Communities and effects of the IEFCL-Train2 Project
Given an annual population growth rate of 3.46% in Rivers State (see NBS, 2016), the
increase in population of the host communities is expected and due to industrialization it
is expected to increase much more than estimated annual growth rate. For instance, in
2010, the total population of the four host communities was 66,614. By 2016 the
population of the four communities increased to 82,449. This represents a 19.3% rate of
population change. This rise in population of studied communities could be attributed to
the movement of persons and businesses to these communities in order to maximize the
positive externalities.
One major implication of the high population growth in this area is (mounting) pressure
on existing facilities and a high demand for additional housing and landed property. Both
informal and formal housing areas have expanded in density. The pressure on road,
electricity supply, health care and other infrastructure may also increase.
The survey report of ESIA on the Phase1 fertilizer plant shows that the host communities
have high population dependency burden. According to the report children between 0-4
years and the aged represent 41% of the total population, while the working age form
59% of the population. Given that most persons graduate from tertiary institutions at 21
– 25years, there is the tendency that the population dependency burden may increase. A
high dependency ratio implies that poverty level will rise since few working individuals
have to care for more persons in the family.
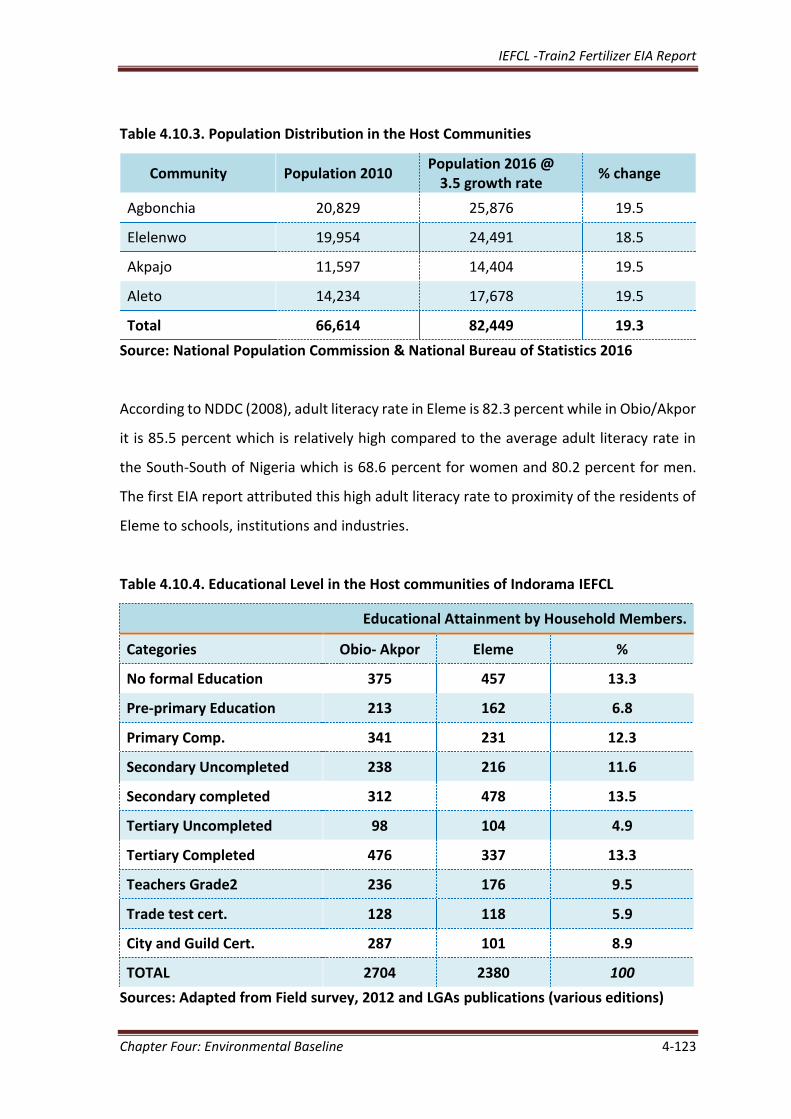
IEFCL -Train2 Fertilizer EIA Report
Chapter Four: Environmental Baseline 4-123
Table 4.10.3. Population Distribution in the Host Communities
Community Population 2010 Population 2016 @
3.5 growth rate % change
Agbonchia 20,829 25,876 19.5
Elelenwo 19,954 24,491 18.5
Akpajo 11,597 14,404 19.5
Aleto 14,234 17,678 19.5
Total 66,614 82,449 19.3
Source: National Population Commission & National Bureau of Statistics 2016
According to NDDC (2008), adult literacy rate in Eleme is 82.3 percent while in Obio/Akpor
it is 85.5 percent which is relatively high compared to the average adult literacy rate in
the South-South of Nigeria which is 68.6 percent for women and 80.2 percent for men.
The first EIA report attributed this high adult literacy rate to proximity of the residents of
Eleme to schools, institutions and industries.
Table 4.10.4. Educational Level in the Host communities of Indorama IEFCL
Educational Attainment by Household Members.
Categories Obio- Akpor Eleme %
No formal Education 375 457 13.3
Pre-primary Education 213 162 6.8
Primary Comp. 341 231 12.3
Secondary Uncompleted 238 216 11.6
Secondary completed 312 478 13.5
Tertiary Uncompleted 98 104 4.9
Tertiary Completed 476 337 13.3
Teachers Grade2 236 176 9.5
Trade test cert. 128 118 5.9
City and Guild Cert. 287 101 8.9
TOTAL 2704 2380 100
Sources: Adapted from Field survey, 2012 and LGAs publications (various editions)
IEFCL -Train2 Fertilizer EIA Report
Chapter Four: Environmental Baseline 4-124
The sitting and activities of the Indorama may have positive and adverse effects on the
social lives of the host communities. On the positive contributions of the activities to their
social lives, the people agreed strongly that the presence of the company will lead to
improvement in quality of housing and bring affordable houses to the host communities.
This is a product of the general increase in income level in the area. The respondents also
expressed less worries about the company’s activities on pressure in schools, hospitals
and family unity. The increase in social investments like private schools and health care
facilities as a result of the presence and activities of the company may have improved
these social variables. Improved income level also contributes to family unity and stability
since most families’ needs could be met due to additional income earned from the
company’s activities.
According to respondents, through the holding of six host communities in IEPL, the
communities have proportionate holding commensurate to IEPL’s equity shares in the
Fertilizer operations as well. This gives them feeling of ownership. Almost all respondents
wish that the company should grow and bring more projects to utilize available resources
within the region. The other respondents said that Indorama’s sharing philosophy has
make company a successful example of private - public partnership.
According the IEFCL SEIA Phase 1 report, most respondents in the host communities live
in owner occupier houses. The majority of the houses are constructed with concrete
blocks and roofed with corrugated iron sheets, earth block and iron sheets, and the
traditional wattle and mud houses roofed with thatch or iron sheets. Though the study
reported a crowding index of 1.2, that is, a room is available to every 1.2 persons in the
study area, the structure/pattern of shelter and availability have improved due to the
activities of Indorama in the area.
According to respondents, that traffic and road safety in and around the host communities
have created some concerns to road management due to the presence and activities of
numerous trucks in area, in general in state. This they believe may deteriorate further
with the proposed fertilizer Phase II plant. These traffic and road safety deterioration are
consequences of additional workforce which will use the road to the company on a daily

IEFCL -Train2 Fertilizer EIA Report
Chapter Four: Environmental Baseline 4-125
basis, increased subsidiary investments like restaurants and hotels, upsurge of people
residing in the host communities and additional vendors and heavy duty vehicles that are
involved in the movement of the products of the company to either the wharf or to other
parts of the country. There is also a concern about social friction among the various ethnic
groups living around the host communities. It should be noted that people from other
parts of the country also would migrate into Eleme LG area as a result of booming
industrial activities in the area and consequently also contribute to security of the area.
The people of the host communities also have concern that their social identities, value
and traditional recreational activities may affect due to the influx of persons into their
communities. The people further expressed the desire that the coming of new projects in
the area will afford the youths some vocational skills and empowerment.
3. Cultural Characteristics of Host communities and the effect of IEFCL-Train2 Project
The following activities dominate the cultural calendar of communities in the study area,
namely: wrestling, traditional marriages, new yam festival and dances. Marriage is like a
rite of passage in the communities. Every adult (males in particular) must marry sometime
in their life to signify that they are now men. Marriage ceremonies are, however,
conducted according to the woman’s (bride’s) culture. Traditional marriages in the host
communities are elaborate and are done by hosting the families of the bride and groom,
and the community in feasts.
The host communities are mostly Christians and affiliations to religious and political
bodies are stronger among the people than other social clubs like age grade and other
cultural clubs.
The host communities have very strong traditional institutions headed by a Chief or family
head. According to the Phase I EIA report, all human activities in traditional Eleme or
Ikwerre setting have a spiritual side to it that is effected through rituals and sacrifices and
the places designated to perform these rituals are sacred places. The designated places
for rituals are usually decorated with the artefacts and instruments which depict the
ancestry or origin of the community. The communities also have high moral values which
tend to promote hard work, discipline and respect. Certain activities or events like; the

IEFCL -Train2 Fertilizer EIA Report
Chapter Four: Environmental Baseline 4-126
death of a woman under pregnancy, drowning in a river/stream are considered taboos in
Eleme and Ikwerre kingdoms.
The opinion of the people in the host communities was sought and analysed based on the
cultural parameters such as marriage ceremonies, dressing, language and religion. The
reactions of the respondents showed that the effect of the location of the project and the
fact that expatriate staff live within Indorama facility reduces the contact with the
residence of host communities. Secondly, the response gathered from questionnaires also
showed that greater number of the peoples that will be employed, directly or indirectly
will come from host communities and as such the respondents agreed that effect on the
above stated cultural parameters will be minimally affected.
IEFCL -Train2 Fertilizer EIA Report
Chapter Four: Environmental Baseline 4-127
4.11 HEALTH IMPACT ASSESSMENT
This section presents the baseline health data based on information generated from
sampled groups in the study communities. The data relies on self-reporting, presumptions
by respondents in the survey and data from the health centers in the area. Data obtained
from these facilities were subsequently compared with state and National data and
averages that are available.
4.11.1 Health services
From the result of the analysis of questionnaire responses, focus group discussion,
interviews and personal observations, it is apparent that the primary health care delivery
service in these communities was inadequate. Healthcare delivery services lack
infrastructural facilities, adequate funding for drug procurement, adequate health
personnel and financial resources to sustain and upgrade the entire health system.
Health-care facilities
The communities of Agbonchia, Aleto, Akpajo and Elelenwo are blessed with primary
Healthcare Service Centers, newly built by the Rivers state Government. It is believed that
when they are fully equipped, people in the host communities would have a better
opportunity to assess primary health care services. There are however a lot of private
clinics, maternities, medical laboratories and pharmaceutical/chemist shops. Some of
these health facilities include:
Primary Health Care Centers
Private medical clinics and Maternities.
In the communities the medical team identified many traditional medicine practitioners,
few Traditional Birth attendants who in their limited capacity still assist and compliment
orthodox Healthcare delivery. These people lack adequate training in Hygienic
procedures. There is urgent need to train them in the area of hygiene to make their
contributions more meaningful. There were many patent medicine stores that stock both
fake and adulterated drugs, surprisingly at prices beyond the reach of the people. Facilities
for prompt/emergency responses were absent, only available in few of the hospitals such
as the General hospital Eleme etc. Poor economic and financial resources, problem of
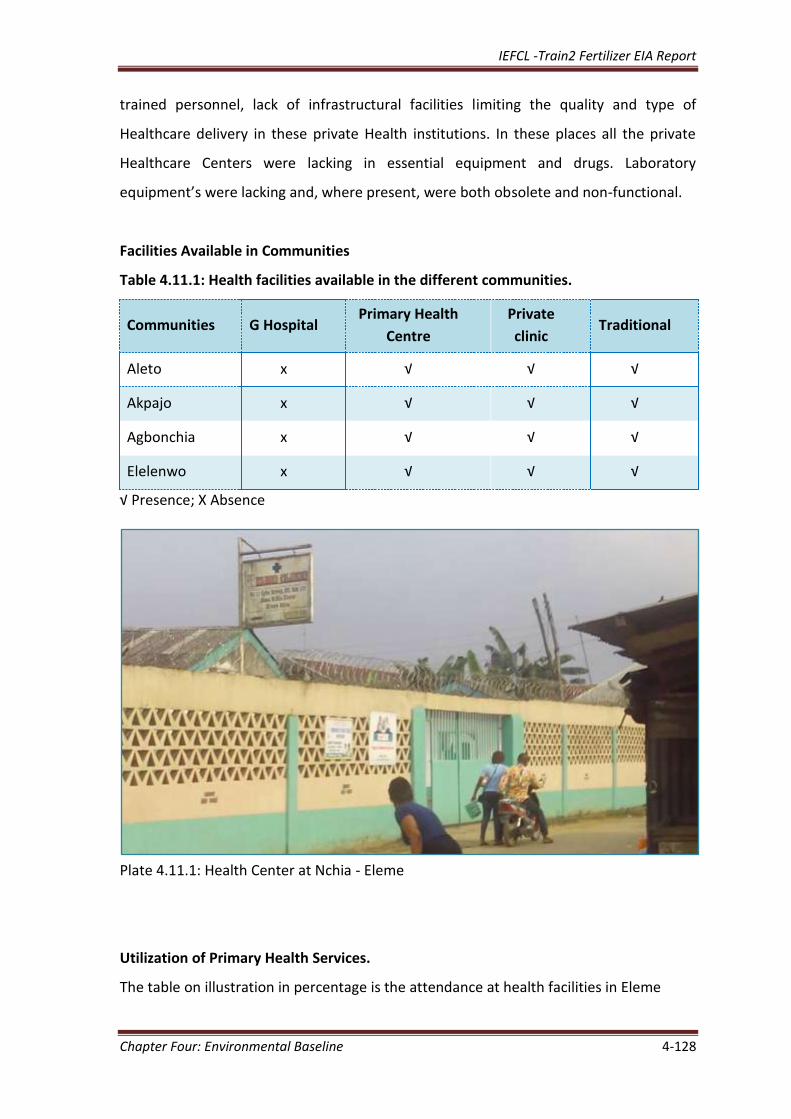
IEFCL -Train2 Fertilizer EIA Report
Chapter Four: Environmental Baseline 4-128
trained personnel, lack of infrastructural facilities limiting the quality and type of
Healthcare delivery in these private Health institutions. In these places all the private
Healthcare Centers were lacking in essential equipment and drugs. Laboratory
equipment’s were lacking and, where present, were both obsolete and non-functional.
Facilities Available in Communities
Table 4.11.1: Health facilities available in the different communities.
Communities G Hospital Primary Health
Centre
Private
clinic Traditional
Aleto x √ √ √
Akpajo x √ √ √
Agbonchia x √ √ √
Elelenwo x √ √ √
√ Presence; X Absence
Plate 4.11.1: Health Center at Nchia - Eleme
Utilization of Primary Health Services.
The table on illustration in percentage is the attendance at health facilities in Eleme
IEFCL -Train2 Fertilizer EIA Report
Chapter Four: Environmental Baseline 4-129
Table 4.11.2: Treatment Facility Utilization in Eleme (Agbonchia)
Sr. No. Facility Utilization (%)
1. Hospital/Health center 55%
2. Chemists/Pharmacy 20%
3. Traditional/Herbal home 10%
4 Healing Home/church 15%
Field work 2017
Surprisingly the use of clinics for birth delivery is relatively low. Patients prefer to go to
traditional medical practitioners, churches and untrained traditional birth attendants. The
reasons are many and varied according to our informants. Some of the reasons include
but not limited to
High cost of hospital treatment
Some hospitals are not user-friendly
Massive, aggressive and vigorous campaigns by the Pentecostal sect that their
members will deliver like Hebrew women of the Old Testament without recourse
to caesarean section/assisted delivery.
The patients come back to the hospital when there are problems/complications such as
prolonged/traumatic labour, due to pelvic insufficiency, or cases of breach. There could
also be obstetrics pelvic infections due to actions/inactions of birth attendants and
pregnant mothers during pregnancy and labour/vaginal examinations, use of unsterile
gloves or taking deliveries in an unhygienic conditions/environment can lead to infections
and even infertility and death. Obstetric pelvic infection is almost always a result of
intervention during labour or delivery. Poor hygienic conditions and non-observance of
aseptic procedures at places of delivery in maternity homes, traditional and alternative
settings outside orthodox facilities are important factors.
4.11.2 Nutritional Status
The nutritional status was good because of the availability of fish, fish products, and other
sea foods which supplied proteins, vitamins and other mineral salts. The people engage
in farming and rich calorie foods like yams, garri, rice, corn are produced from their farms.
IEFCL -Train2 Fertilizer EIA Report
Chapter Four: Environmental Baseline 4-130
To determine the nutritional status of the people we had to look at background histories
and nutritional parameters which are determined by.
Anthropometry measures, or assessment – height, weight, skin fold thickness, arm
muscle circumference and other parameters.
Biochemical (laboratory) assessment of blood and urine, enzyme activities, levels
of nutrient or the bye-products.
Clinical assessment (physical examination): general appearance of skin, eyes and
tongue, rapid hair loss, sense of touch, ability to walk.
Diet History: usual intake or record of previous day’s meal.
For the purpose of this study anthropometric assessment was done on children from the
different communities i.e. Height, Weight and Mid arm circumference measurements
were taken in addition to physical examination, appearance of skin, eyes and tongue were
done. The result of these assessments indicates that the nutritional status was good.
There were a few of the children in some of the communities and pregnant women that
showed slight evidence of malnutrition, the rest were nutritionally healthy.
Food hygiene
The level of food hygiene in the community was low right from collection/marketing of
the food items through handling, preparation and service. The Abattoir/slaughter along
the East-West highway at Aleto Bridge (Plate 4.11.2) and the one in Elelenwo are both
dirty. Environmental health problems arising from poor standard of food hygiene can be
alleviated through education and effective health education. Food is often contaminated
by exposure during marketing, preparation and serving. The channels of contaminations
can be removed by good rural marketing practice and improved personal hygiene.
Sanitation of the Living Environment
The general sanitary status of the living environments in the communities were rated as
good based on a set of WHO criteria. Majority of the communities had good sanitary
status of the living environments.
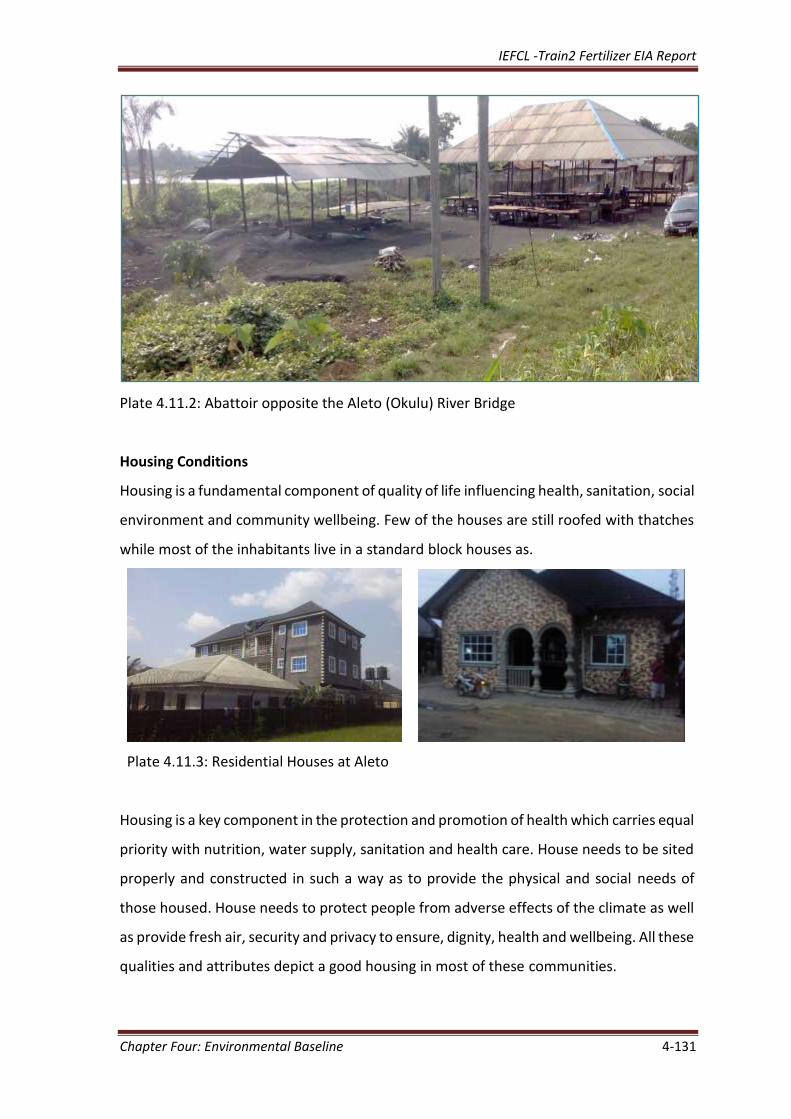
IEFCL -Train2 Fertilizer EIA Report
Chapter Four: Environmental Baseline 4-131
Plate 4.11.2: Abattoir opposite the Aleto (Okulu) River Bridge
Housing Conditions
Housing is a fundamental component of quality of life influencing health, sanitation, social
environment and community wellbeing. Few of the houses are still roofed with thatches
while most of the inhabitants live in a standard block houses as.
Plate 4.11.3: Residential Houses at Aleto
Housing is a key component in the protection and promotion of health which carries equal
priority with nutrition, water supply, sanitation and health care. House needs to be sited
properly and constructed in such a way as to provide the physical and social needs of
those housed. House needs to protect people from adverse effects of the climate as well
as provide fresh air, security and privacy to ensure, dignity, health and wellbeing. All these
qualities and attributes depict a good housing in most of these communities.
IEFCL -Train2 Fertilizer EIA Report
Chapter Four: Environmental Baseline 4-132
4.11.3 Reproductive Health
Reproductive sexual health services: Reproduction and sexual health as a concept
encompasses a set of health problems or diseases associated with the physical and social
risks of human sexuality and reproduction.
Common Reproductive and Sexual Health problems in the Communities includes:
Lack of access to good quality contraceptive family planning
Hazardous birthing environment
Infertility
Maternal and child malnutrition and infection
Human immune deficiency syndrome (HIV) & sexually transmitted diseases (STIs)
During the sampling, it was found that these health problems exert an enormously heavy
illness burden on adults, young people and children, often with long term physical and
social consequences. About 50-100 pregnancy related deaths cases occurs each year and
each of these perhaps one-quarter to one-third are due to lack of access to safe abortion
services. This information cannot be authenticated, because the source could not back it
with records. It is estimated that for every pregnancy related death, some may have
suffered significant complications. In other words many women suffer serious morbidity
each year. Of the prenatal deaths among children in the community, about half are
associated with low birth weight (under 2500gm) due predominantly to maternal protein-
calorie malnutrition and anemia and in some cases STIs.
HIV and STIs constitute another major cluster of reproductive health problem, which
cannot be statistically reported because of lack of records in the area. Again the State
Governments policy/programme in health care may bring succor to this important global
issue when the health centers become functional and operational.
4.11.4 Disease Prevalence
The information provided in these sections is based on hospital records and responses
from questionnaires, focus group discussion, on the spot observation and key informants
IEFCL -Train2 Fertilizer EIA Report
Chapter Four: Environmental Baseline 4-133
on the nature and pattern of diseases in the communities in the study area in the last 12
months. There were a few fragmented data from hospital records in the area.
The prevalence rate (i.e. the number of cases of the condition at a particular time or
period divided by the size of the population exposed) has been used in the assessment of
disease prevalence. It has enabled a fair interpretation of data about the disease
prevalence in the community and it’s comparison with the ill health in other areas in
subsequent studies. A reliable prevalence rate could not be determined because of
insufficient data In addition a lot of people carried out self-medication while some are
treated by traditional medical practitioners and traditional birth attendants without
records.
Summary of prevalence of communicable diseases in the community in the project area
Malaria
Malaria was the most prevalent and occurring disease in the communities hosting the
project. It was characterized by periodic chills and fever, its presence is confirmed by
examination of blood smear for the parasite. Its prevalent rate was high in the
communities in the project area. The high prevalence rate of malaria is sustained by a
number of factors:
The abundance of mosquitoes (the insect vector of the causative agent which
consists of plasmodium falciparum and less of plasmodium vivax and plasmodium
malariae),
Presence of stagnant water,
Absence of pest control,
Inadequate prophylactic drugs supply and inadequate diagnostic facility and
personal indifference to health care.
It affected both male and female of all ages but least in children under one year old. The
prevalence rate was high between April and June when the presence of numerous water
holding ponds favoured the breeding of mosquito vector. Severity of malaria varies from
weakening effect or fever to death particularly in children.
IEFCL -Train2 Fertilizer EIA Report
Chapter Four: Environmental Baseline 4-134
Diarrhoea
Diarrhoea was the second most prevalent disease. Its symptom includes unusually
frequent passage of loose watery stool and occasional presence of blood pus and mucus
in the stool.
Protozoa, entamoebe histolytic organisms or parasitic bacteria Escherichia coli cause it. It
resulted in severe dehydration and weakness and was prevalent in all the communities of
the project area. Its prevalent rate could not be determined due to absence of record. Its
high prevalence was attributed to poor sanitation, consumption of facially contaminated
water in the community.
It affected male and female of all ages but least in children under one year of age;
probably as a result of improved maternal care of babies through breast feeding and
sterilization of baby food and materials (proper hygiene).
Upper Respiratory Tract Infections
This includes any of the several diseases of the respiratory tracts characterized by
inflammation of the lungs and caused by bacteria, viruses or chemical irritant. It was
prevalent in the communities of the project area. Its severity varies from mild respiratory
discomfort to death. It affected both male and females.
Skin Rashes
The condition includes measles, chicken pox, ring worm, eczema, different agents caused
these. They were generally of medium to high prevalence.
Sexually Transmitted Infections (STIs)
They include gonorrhoea, acquired immune deficiency syndrome (AIDS). Syphilis and
tuberculosis.
STIs are important because of the high morbidity and complication, for example infertility,
congenital infection and pelvic inflammatory disease (PID), AIDS is now a pandemic health
outcome especially in developing countries. Its incidence was high and recorded in the
hospitals and health centers but are referred to UPTH, BMH and other specialized
hospitals probably because of absence and low health facilities and usage. The presence
of many seamen and sailors that arrive Onne port regularly and many workers working in
IEFCL -Train2 Fertilizer EIA Report
Chapter Four: Environmental Baseline 4-135
the over 100 companies in and around Eleme and Elelenwo contribute to the problem of
sexually transmitted diseases.
HIV/AIDS and STIs Control:
Forcing prostitutes to get regular examination and treatment
Better treatment to prevent the spread of resistant organism
Good prophylactic drugs.
Immunization against gonorrhoea, it is still at the trial stage.
Examination and treatment of bar girls and other high risk groups.
Utilization of special of STI health visitors or assistants based on wards in towns.
Use of posters.
Telling people to get contacts treated or giving contact slip
Radio announcement about high prevalence
Advising people on early symptoms and having more clinics which are more
private and confidential in their management of the diseases.
NGO’s may be required to enhance Health education for secondary schools,
youth groups, the communities, and other risk groups.
Schistosomiasis
The incidence of Schistosomiasis was very low being lower than 10/10,000 in the area.
However whenever it occurred it is usually mistaken for signs of puberty and in some
cases witchcraft.
Filariasis
The condition was of high prevalence. Many cases were sighted and this was in agreement
with official hospital records.
Tuberculosis
The incidence of Tuberculosis was noted in two communities (Agbonchia and Elelenwo).
The people involved were physically and clinically examined and there were overt signs
of Tuberculosis. In one particular case the sputum of the patient contained blood in it,
and the patient looking weak and wasted. Co-infection with HIV/AIDS was suspected
IEFCL -Train2 Fertilizer EIA Report
Chapter Four: Environmental Baseline 4-136
because the symptoms of both diseases are similar. During the FGD, the people also
complained that TB which was hitherto unknown in their communities is now rampant. It
was also noted that in some place, people lived in over-crowed houses which certainly
predispose people to Tuberculosis as the diseases is airborne.
Tetanus
This is caused by mycobacterium tetani. This results from untreated wounds caused by
fishing gears and stumps from the farm.
Non-Communicable Diseases
Food Poisoning
This was recorded only sporadically in the area as resulting from consumption of
contaminated food. It caused vomiting, dehydration and body weakness.
Malnutrition
It is due to inadequate food intake or micro nutrient deficiency. Only in some parts of the
community where the cases were recorded recently and where some children and few
pregnant mothers presented with malnutrition. The pregnant mothers equally presented
with oedema.
Injury
Occupational injuries occurred at the farms and while fishing and from fishing gears.
Injuries are also sustained during fetching of fire wood, cutting of wood in the forest,
building of boats, boat mishap and fire incident caused by fuel stored in the boats. Some
other people get injuries from working in the numerous companies in Eleme e.g. during
Tank cleaning and loading and offloading of scrap metals and demolition wastes.
Mental Disorder
There were few cases of mental disorder probably caused by substance abuse. Substance
abuse is gradually becoming so much of problem in the communities that laws banning
the use of substance in the public should be enacted. Substance abuse involves the use
of marijuana, heroin and inhalation of poisonous chemicals.
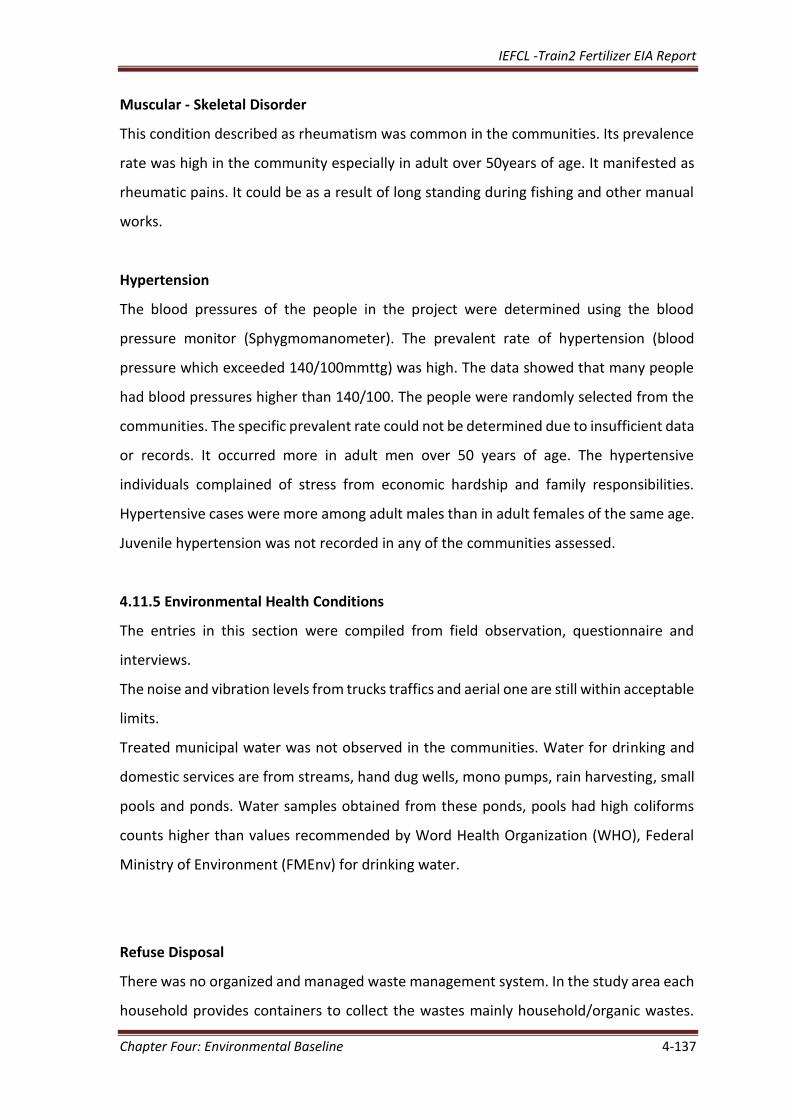
IEFCL -Train2 Fertilizer EIA Report
Chapter Four: Environmental Baseline 4-137
Muscular - Skeletal Disorder
This condition described as rheumatism was common in the communities. Its prevalence
rate was high in the community especially in adult over 50years of age. It manifested as
rheumatic pains. It could be as a result of long standing during fishing and other manual
works.
Hypertension
The blood pressures of the people in the project were determined using the blood
pressure monitor (Sphygmomanometer). The prevalent rate of hypertension (blood
pressure which exceeded 140/100mmttg) was high. The data showed that many people
had blood pressures higher than 140/100. The people were randomly selected from the
communities. The specific prevalent rate could not be determined due to insufficient data
or records. It occurred more in adult men over 50 years of age. The hypertensive
individuals complained of stress from economic hardship and family responsibilities.
Hypertensive cases were more among adult males than in adult females of the same age.
Juvenile hypertension was not recorded in any of the communities assessed.
4.11.5 Environmental Health Conditions
The entries in this section were compiled from field observation, questionnaire and
interviews.
The noise and vibration levels from trucks traffics and aerial one are still within acceptable
limits.
Treated municipal water was not observed in the communities. Water for drinking and
domestic services are from streams, hand dug wells, mono pumps, rain harvesting, small
pools and ponds. Water samples obtained from these ponds, pools had high coliforms
counts higher than values recommended by Word Health Organization (WHO), Federal
Ministry of Environment (FMEnv) for drinking water.
Refuse Disposal
There was no organized and managed waste management system. In the study area each
household provides containers to collect the wastes mainly household/organic wastes.
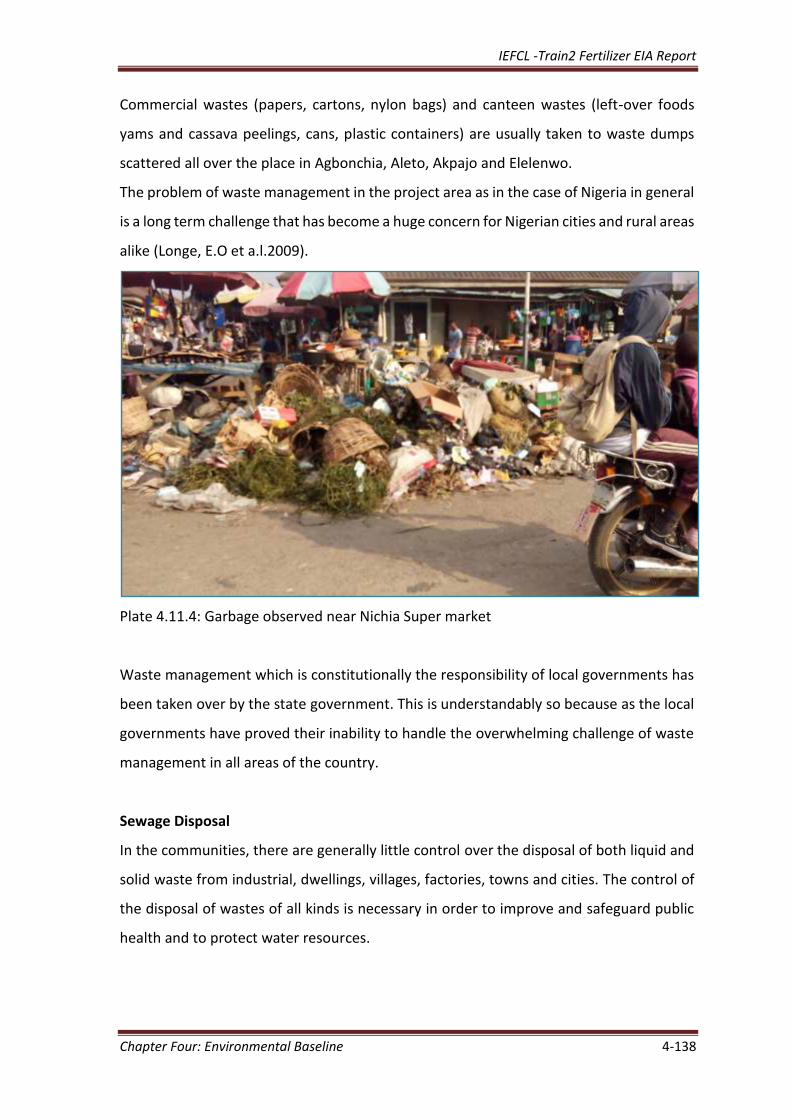
IEFCL -Train2 Fertilizer EIA Report
Chapter Four: Environmental Baseline 4-138
Commercial wastes (papers, cartons, nylon bags) and canteen wastes (left-over foods
yams and cassava peelings, cans, plastic containers) are usually taken to waste dumps
scattered all over the place in Agbonchia, Aleto, Akpajo and Elelenwo.
The problem of waste management in the project area as in the case of Nigeria in general
is a long term challenge that has become a huge concern for Nigerian cities and rural areas
alike (Longe, E.O et a.l.2009).
Plate 4.11.4: Garbage observed near Nichia Super market
Waste management which is constitutionally the responsibility of local governments has
been taken over by the state government. This is understandably so because as the local
governments have proved their inability to handle the overwhelming challenge of waste
management in all areas of the country.
Sewage Disposal
In the communities, there are generally little control over the disposal of both liquid and
solid waste from industrial, dwellings, villages, factories, towns and cities. The control of
the disposal of wastes of all kinds is necessary in order to improve and safeguard public
health and to protect water resources.
IEFCL -Train2 Fertilizer EIA Report
Chapter Four: Environmental Baseline 4-139
Disease vectors
The vectors identified in the area include:
Mosquito (particularly anopheles species and culex species) were abundant in the
area especially in stagnant waters, drains, and in swamps where they breed. They
transmit plasmodium which causes malaria.
Tsetse fly (glossino species) transmits trypanosome which causes sleeping
sickness in humans.
House Fly (Muscadomestica) and latrine fly (fanniacanicularis) were common in
refuse dump. They transmitted a wild array of disease agents including those of
diarrhoea and dysentery.
Snails occurred in the swamps and are host of shistosoma (s.haematobium and
s.mansoni), that causes shistosomiasis characterised by frequent painful and
bloody urination and blood in the stool respectively.
Water Supply
There is no functional Municipal treatment scheme sighted anywhere in the study area.
Source of water supply included shallow hand-dug well, rivers, streams, ponds, rain
harvesting, and a few sometimes non-functional bore holes. Some of these non-
functional boreholes were provided by SPDC and Indorama and others by
families/personal efforts. They are used for all domestic purposes including drinking and
bathing, the water is not usually treated before use. Samples of water taken from such
sources analysed in the laboratory showed high coliform count higher than the values
recommended by WHO and Federal Ministry of Environment. The WHO has estimated
that 80% of all sicknesses and diseases in the world are attributed to unhygienic water.
Water–borne diseases are among the leading causes of death in many developing
countries today, Nigeria being a typical example. In addition to the alarming mortality
rates, it is estimated that people in Nigeria and other developing nations lose 10% of their
productive time because of diseases related to poor and contaminated water.
Improvements in health are generally considered to be one of the most important
benefits of water programmes.
IEFCL -Train2 Fertilizer EIA Report
Chapter Four: Environmental Baseline 4-140
Water Pollution; The pollution of natural waters in the project area by waste matter
resulting from the industrial and human activities such as slaughter slabs by rivers,
dredging and illegal sand mining are fingered as sources of river water pollution in the
area
Domestic sewage with high concentration of microorganisms, BOD, organic and
inorganic and floatable matter.
Pesticides and fungicides
Oil & grease and oil dispersants from thousands of tanker trucks in the area.
Water Supply Needs of the Project Areas; Agbonchia, Aleto, Elelenwo, Akpajo need
adequate safe, potable water supply, easy access is a major factor in raising the health
standard of the people and its beneficial effect in the reduction of morbidity especially
among children and infants have been established.
Provision of potable water supply represents in the final analysis a challenging worthwhile
and lasting investment which benefits all by improving hygiene and reducing the
incidence of water borne and water associated diseases. Majority of households in the
study area rely on outdoor taps (usually from boreholes) for their water supply. Another
proportion sinks the boreholes in their premises, and then pipes the water to their
houses. Others use hand dug wells and rain harvesting as their source of water supply.
Plate 4.11.5: Water taps at Agbonchia
Cooking Practices
The most commonly used fuels for cooking in the area are firewood and kerosene. Wood
is the most common fuel used for cooking, reported by 66 % of households. Indoor
IEFCL -Train2 Fertilizer EIA Report
Chapter Four: Environmental Baseline 4-141
cooking is also commonly practiced. Indoor cooking is prevalent in most of the locations.
About, 45% and 43% in Eleme and Akpajo respectively all cook indoors.
Smoke generated from this practice may serve the additional purpose of preserving the
wood and other ephemeral materials from which some make-shift houses are
constructed, against insects and termites.
Cooking with firewood indoors exposes individuals to toxic air pollutants and can
contribute to or aggravate respiratory infections, asthma, chronic bronchitis, and other
health problems. The indoor cooking practice is common across Nigeria. According to the
National Demographic and Health Survey (2008) about 40% of household cook inside
their houses, while about one-quarter (25%) cook outdoors.
These mosquito species are major disease vectors. Anopheles transmits malaria parasites
(Plasmodium sp.) and also known to transmit the filarial parasite: Wuchereriabancrofti.
Culex species also transmit Wuchereriabancrofti while Aedes are the main vector of
yellow fever. PCR analysis revealed Anopheles gambiaesensustricto: the most efficient
African malaria vector as the only Anopheles species in the three clusters.
Mosquito Breeding Sites
Standing water are typical breeding sites for mosquitoes. Over 50% of the mosquito
breeding sites identified in the surveyed area were anthropogenic due to the daily
activities engaged in by members of the community. More of the breeding sites were also
as a result of heavy rainfall and flooding coupled with poor drainages that lead to stagnant
waters that support larval growth days after the rains, most of these sites were identified
at Akpajo and Elelenwo.
Mosquito Control in Households
Almost every household surveyed uses at least one type of mosquito control method. The
most common method is the use of bed nets, followed by mosquito coils and insecticide
sprays. Other less common methods found in the surveyed area are insecticide treated
nets, window netting, and nocturnal leaf burning.
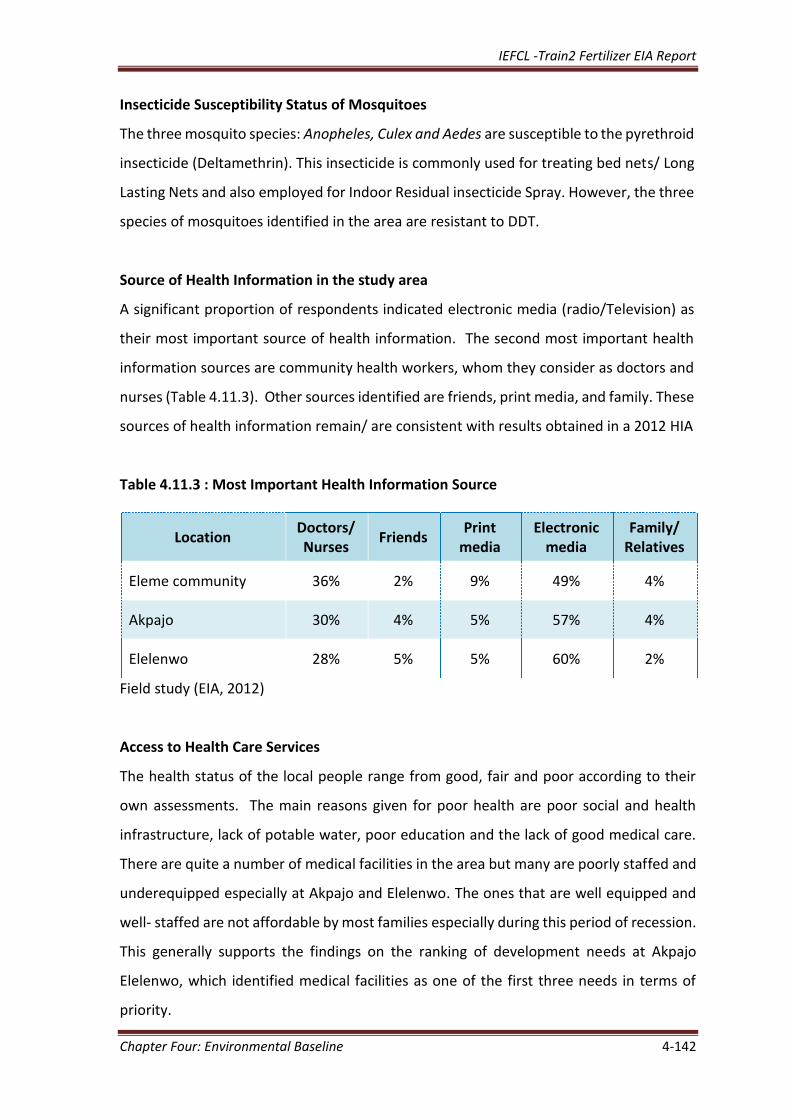
IEFCL -Train2 Fertilizer EIA Report
Chapter Four: Environmental Baseline 4-142
Insecticide Susceptibility Status of Mosquitoes
The three mosquito species: Anopheles, Culex and Aedes are susceptible to the pyrethroid
insecticide (Deltamethrin). This insecticide is commonly used for treating bed nets/ Long
Lasting Nets and also employed for Indoor Residual insecticide Spray. However, the three
species of mosquitoes identified in the area are resistant to DDT.
Source of Health Information in the study area
A significant proportion of respondents indicated electronic media (radio/Television) as
their most important source of health information. The second most important health
information sources are community health workers, whom they consider as doctors and
nurses (Table 4.11.3). Other sources identified are friends, print media, and family. These
sources of health information remain/ are consistent with results obtained in a 2012 HIA
Table 4.11.3 : Most Important Health Information Source
Field study (EIA, 2012)
Access to Health Care Services
The health status of the local people range from good, fair and poor according to their
own assessments. The main reasons given for poor health are poor social and health
infrastructure, lack of potable water, poor education and the lack of good medical care.
There are quite a number of medical facilities in the area but many are poorly staffed and
underequipped especially at Akpajo and Elelenwo. The ones that are well equipped and
well- staffed are not affordable by most families especially during this period of recession.
This generally supports the findings on the ranking of development needs at Akpajo
Elelenwo, which identified medical facilities as one of the first three needs in terms of
priority.
Location Doctors/ Nurses
Friends Print
media Electronic
media Family/
Relatives
Eleme community 36% 2% 9% 49% 4%
Akpajo 30% 4% 5% 57% 4%
Elelenwo 28% 5% 5% 60% 2%
IEFCL -Train2 Fertilizer EIA Report
Chapter Four: Environmental Baseline 4-143
Previous health survey indicates that about 10-15% of the respondents in the surveyed
communities manage their health problems through herbal remedy and/or self-
medication. The others visit/patronize one type of health facility or the other and still
others patronize prayer houses or churches.
4.11.6 Indorama Medical center
Indorama operates a comprehensive medical center with the state of the art
equipments, drugs supply, aesthetic and clean environment, adequate number of medical
professionals, like Medical doctors, Pharmacist, Nurses and Laboratory scientists. It also
has good occupational and health and safety professionals. Health conditions ranging
from minor injuries like cuts, laceration and bruises to malaria, diarrhea, body pains, skin
rashes, hypertension, respiratory distress and a number of other cases are handled at the
medical center, complex and more difficult cases are referred to bigger hospitals such as
BMH and UPTH etc.
Occupational health and safety department complements the effort of the medical center
by emphasizing occupational health and safety issues reducing hazards, injuries and
accidents. Management is completely committed to occupational health and safety
issues. There is a general duty on employers to protect the health of the employee under
the health and safety at work 1974 (HSWA) section 2 (1). There is emphasis on the
prevention of risk to health of workers arising and where prevention is not possible
however employers must control this risk/exposure to this risk.
This duty ensures the implementation of the number of strategies which must be related
to the degree of risk. Other strategies are available as support strategies. Support
strategies such as PPE (Personal Protective Equipment), health surveillance and provision
of appropriate welfare amenities, provide extra protections if there are used correctly and
on a regular basis. This occupational health and safety approach is strongly adopted and
adhered to by the management of Indorama. This approach has drastically reduced
accident and injuries, lost man hours and absenteeism due to ill health and incapacitation
arising from injuries and accidents
IEFCL -Train2 Fertilizer EIA Report
Chapter Four: Environmental Baseline 4-144
4.11.7 Discussion of Findings
Many of the residents in the project area are quick to point out that there are health
facilities without adequate personnel, equipment, adequate prophylactic drugs and drug
revolving scheme in their communities. According to them, “People in the community
have no option than to resort to unorthodox treatment/herbal healers for their health
care needs”. The nearest general hospital is located at Ogale in Eleme. For those at the
communities of Akpajo and Elelenwo they have no other general hospital, they go to the
one at Ogale when the need arises.
They further assert that the lack of finance, doctor/patient contact time and the attitude
of health workers discourage the use of the only hospital in the study area by community
members. Although largely improved due to improved facilities and good paved road
network, as compared to earlier studies (Anyanwu 2012), but the regular traffic jam/chaos
along the East/West road remain a major challenge in situations of emergency that would
require an immediate evacuation.
In-depth interviews with the Traditional Birth Attendants (TBAs) suggest that the
government should provide a functional health facility for the communities which could
serve as a referral point and collaboration for orthodox and traditional medicine as these
would go a long way in improving the health status of people within the environment. In
most cases people who need medical attention in the community resort to patent medical
store owners for advice or to alternative medicine which is diverse in the study area. In
Elelenwo for instance, there is specialization in this form of healing. There are
practitioners specializing in orthopaedic (Nbadiwe Amadi and Mgbualu Ehoro), ear and
eye (Chief Ihianyi), paediatrics (Ebuchi Mgbamosu) remedies against snake bites (Ejekwu
James) and epilepsy (ChikweleNjo). Similar specialization was cited by the panel on focus
group in Agbonchia, for instance Chinwi Okparaji and Ada Wachi are bone healers in that
community.
Africans attribute most illness to the supernatural and the prayers of their detractors.
Some churches believe they can tackle such problems, so it is not unusual for churches to
serve as spiritual healing homes, with the promise of cure as sure as orthodox medicine.
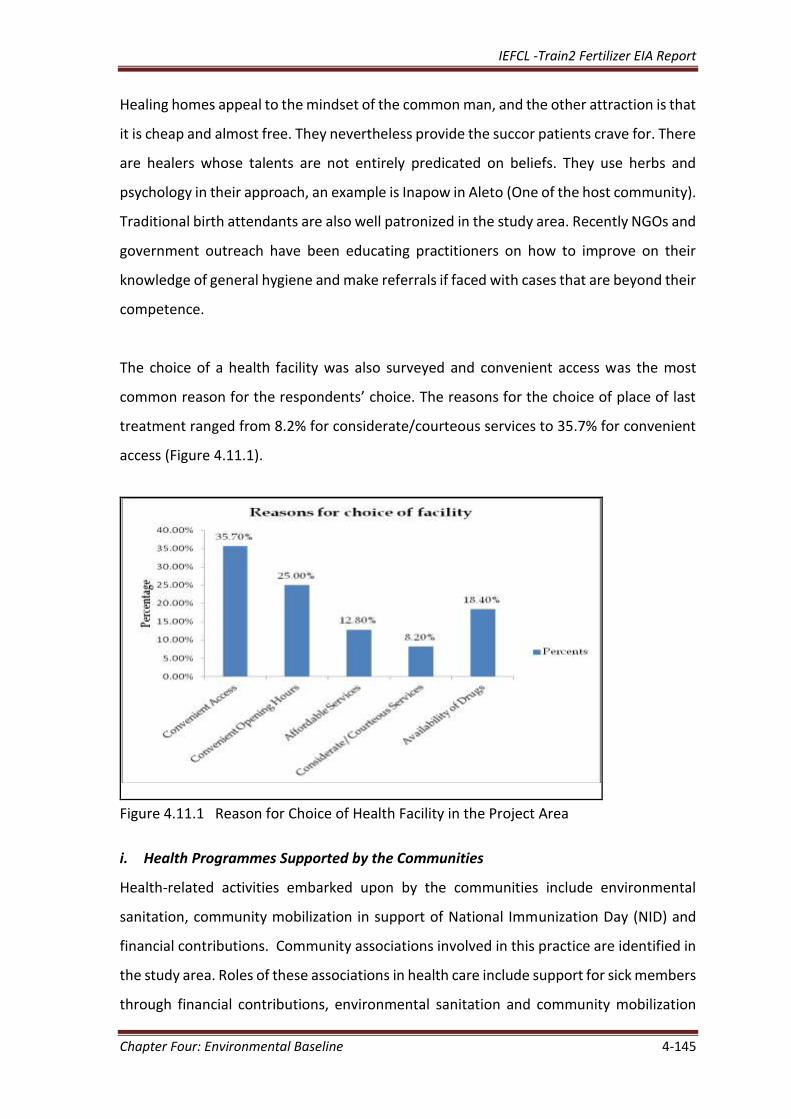
IEFCL -Train2 Fertilizer EIA Report
Chapter Four: Environmental Baseline 4-145
Healing homes appeal to the mindset of the common man, and the other attraction is that
it is cheap and almost free. They nevertheless provide the succor patients crave for. There
are healers whose talents are not entirely predicated on beliefs. They use herbs and
psychology in their approach, an example is Inapow in Aleto (One of the host community).
Traditional birth attendants are also well patronized in the study area. Recently NGOs and
government outreach have been educating practitioners on how to improve on their
knowledge of general hygiene and make referrals if faced with cases that are beyond their
competence.
The choice of a health facility was also surveyed and convenient access was the most
common reason for the respondents’ choice. The reasons for the choice of place of last
treatment ranged from 8.2% for considerate/courteous services to 35.7% for convenient
access (Figure 4.11.1).
Figure 4.11.1 Reason for Choice of Health Facility in the Project Area
i. Health Programmes Supported by the Communities
Health-related activities embarked upon by the communities include environmental
sanitation, community mobilization in support of National Immunization Day (NID) and
financial contributions. Community associations involved in this practice are identified in
the study area. Roles of these associations in health care include support for sick members
through financial contributions, environmental sanitation and community mobilization
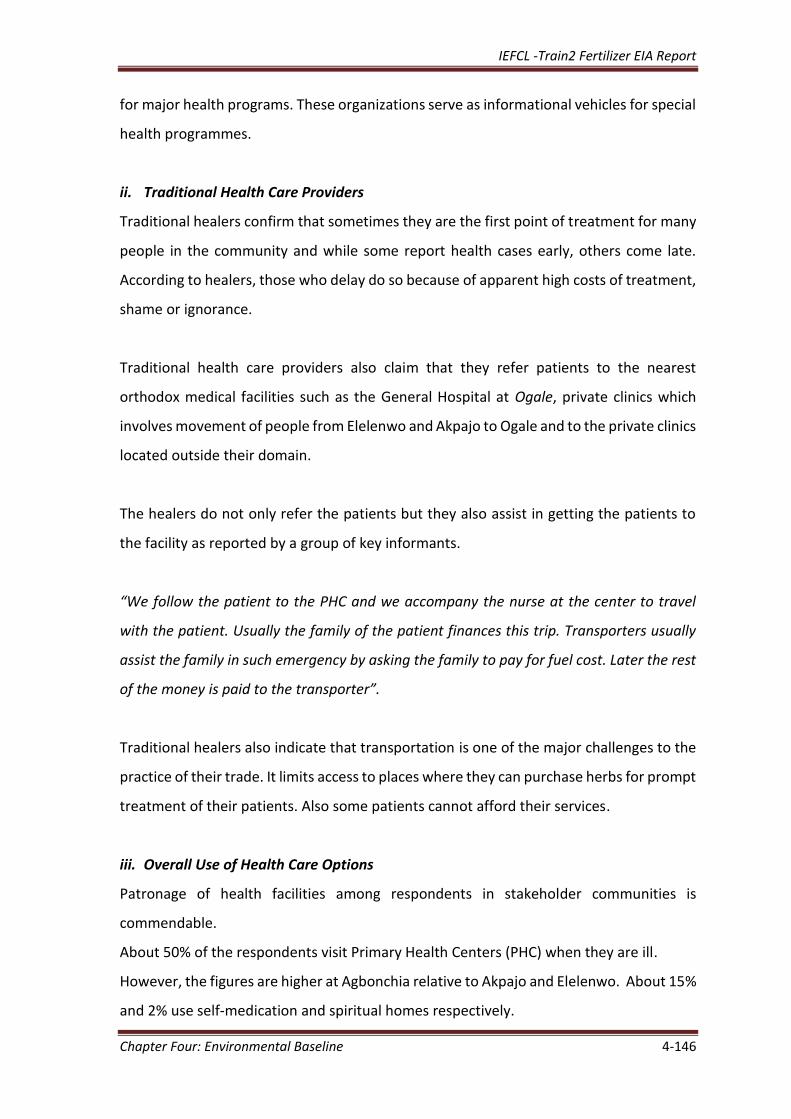
IEFCL -Train2 Fertilizer EIA Report
Chapter Four: Environmental Baseline 4-146
for major health programs. These organizations serve as informational vehicles for special
health programmes.
ii. Traditional Health Care Providers
Traditional healers confirm that sometimes they are the first point of treatment for many
people in the community and while some report health cases early, others come late.
According to healers, those who delay do so because of apparent high costs of treatment,
shame or ignorance.
Traditional health care providers also claim that they refer patients to the nearest
orthodox medical facilities such as the General Hospital at Ogale, private clinics which
involves movement of people from Elelenwo and Akpajo to Ogale and to the private clinics
located outside their domain.
The healers do not only refer the patients but they also assist in getting the patients to
the facility as reported by a group of key informants.
“We follow the patient to the PHC and we accompany the nurse at the center to travel
with the patient. Usually the family of the patient finances this trip. Transporters usually
assist the family in such emergency by asking the family to pay for fuel cost. Later the rest
of the money is paid to the transporter”.
Traditional healers also indicate that transportation is one of the major challenges to the
practice of their trade. It limits access to places where they can purchase herbs for prompt
treatment of their patients. Also some patients cannot afford their services.
iii. Overall Use of Health Care Options
Patronage of health facilities among respondents in stakeholder communities is
commendable.
About 50% of the respondents visit Primary Health Centers (PHC) when they are ill.
However, the figures are higher at Agbonchia relative to Akpajo and Elelenwo. About 15%
and 2% use self-medication and spiritual homes respectively.
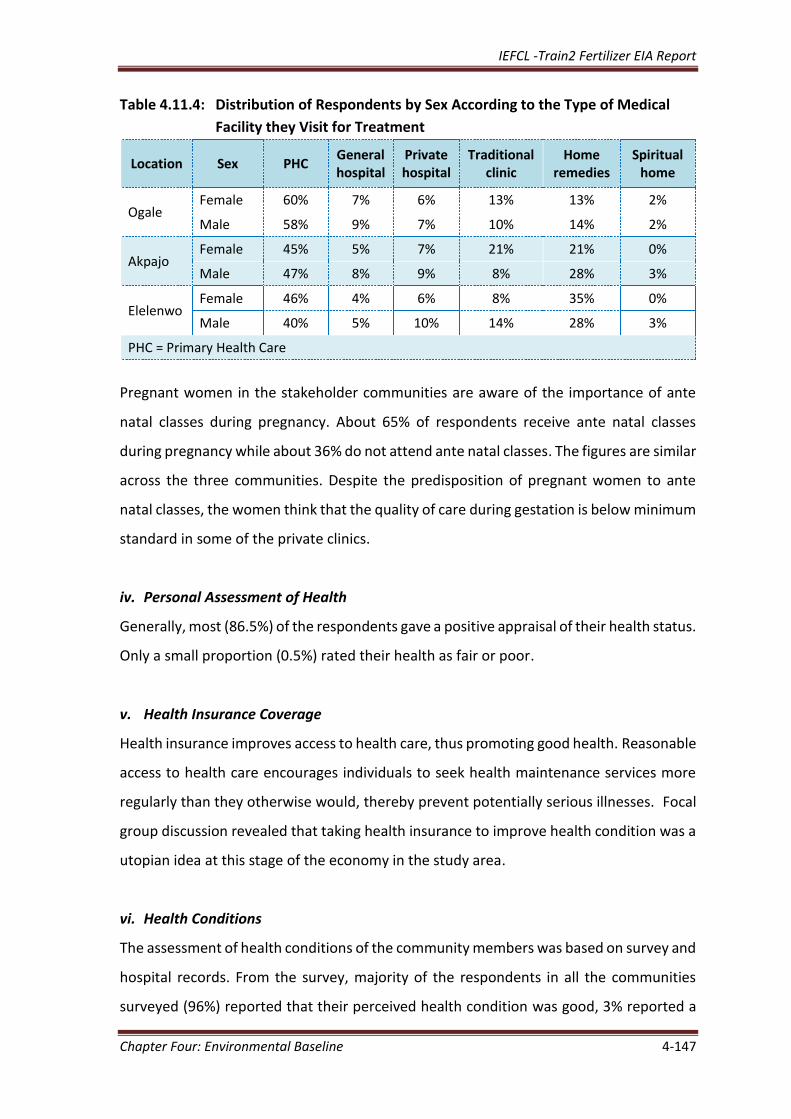
IEFCL -Train2 Fertilizer EIA Report
Chapter Four: Environmental Baseline 4-147
Table 4.11.4: Distribution of Respondents by Sex According to the Type of Medical
Facility they Visit for Treatment
Location Sex PHC General hospital
Private hospital
Traditional clinic
Home remedies
Spiritual home
Ogale Female 60% 7% 6% 13% 13% 2%
Male 58% 9% 7% 10% 14% 2%
Akpajo Female 45% 5% 7% 21% 21% 0%
Male 47% 8% 9% 8% 28% 3%
Elelenwo Female 46% 4% 6% 8% 35% 0%
Male 40% 5% 10% 14% 28% 3%
PHC = Primary Health Care
Pregnant women in the stakeholder communities are aware of the importance of ante
natal classes during pregnancy. About 65% of respondents receive ante natal classes
during pregnancy while about 36% do not attend ante natal classes. The figures are similar
across the three communities. Despite the predisposition of pregnant women to ante
natal classes, the women think that the quality of care during gestation is below minimum
standard in some of the private clinics.
iv. Personal Assessment of Health
Generally, most (86.5%) of the respondents gave a positive appraisal of their health status.
Only a small proportion (0.5%) rated their health as fair or poor.
v. Health Insurance Coverage
Health insurance improves access to health care, thus promoting good health. Reasonable
access to health care encourages individuals to seek health maintenance services more
regularly than they otherwise would, thereby prevent potentially serious illnesses. Focal
group discussion revealed that taking health insurance to improve health condition was a
utopian idea at this stage of the economy in the study area.
vi. Health Conditions
The assessment of health conditions of the community members was based on survey and
hospital records. From the survey, majority of the respondents in all the communities
surveyed (96%) reported that their perceived health condition was good, 3% reported a
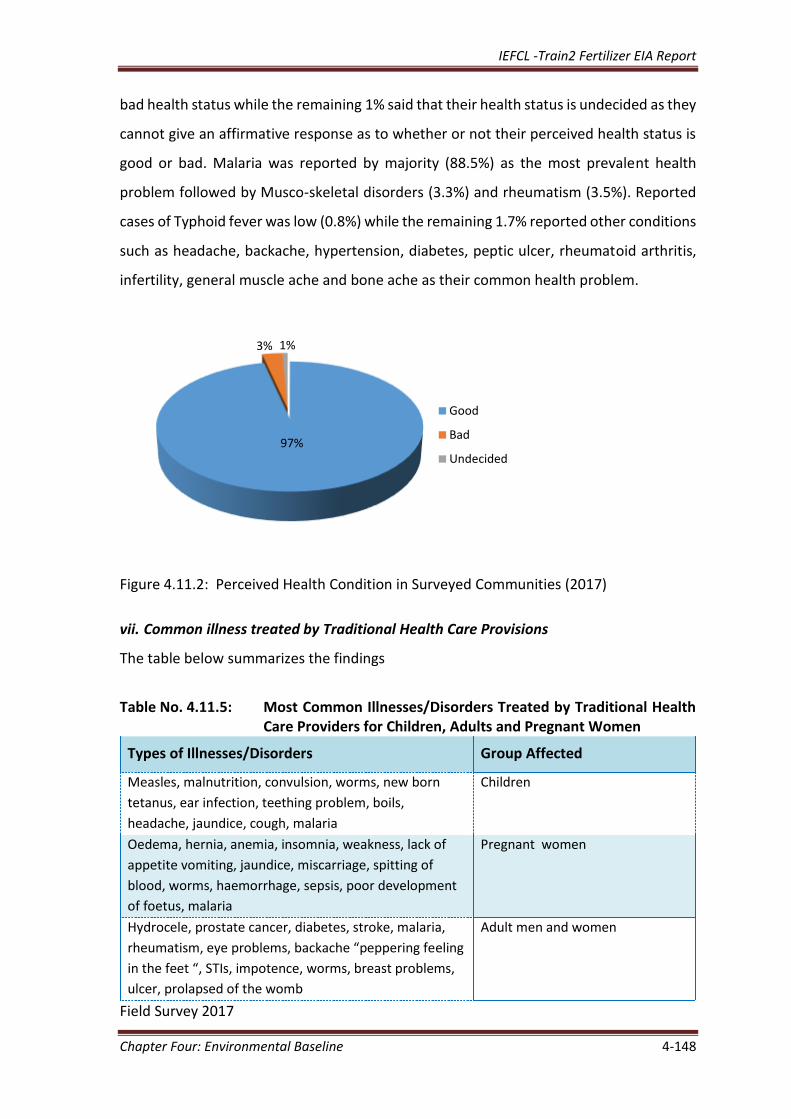
IEFCL -Train2 Fertilizer EIA Report
Chapter Four: Environmental Baseline 4-148
bad health status while the remaining 1% said that their health status is undecided as they
cannot give an affirmative response as to whether or not their perceived health status is
good or bad. Malaria was reported by majority (88.5%) as the most prevalent health
problem followed by Musco-skeletal disorders (3.3%) and rheumatism (3.5%). Reported
cases of Typhoid fever was low (0.8%) while the remaining 1.7% reported other conditions
such as headache, backache, hypertension, diabetes, peptic ulcer, rheumatoid arthritis,
infertility, general muscle ache and bone ache as their common health problem.
Figure 4.11.2: Perceived Health Condition in Surveyed Communities (2017)
vii. Common illness treated by Traditional Health Care Provisions
The table below summarizes the findings
Table No. 4.11.5: Most Common Illnesses/Disorders Treated by Traditional Health
Care Providers for Children, Adults and Pregnant Women
Types of Illnesses/Disorders Group Affected
Measles, malnutrition, convulsion, worms, new born
tetanus, ear infection, teething problem, boils,
headache, jaundice, cough, malaria
Children
Oedema, hernia, anemia, insomnia, weakness, lack of
appetite vomiting, jaundice, miscarriage, spitting of
blood, worms, haemorrhage, sepsis, poor development
of foetus, malaria
Pregnant women
Hydrocele, prostate cancer, diabetes, stroke, malaria,
rheumatism, eye problems, backache “peppering feeling
in the feet “, STIs, impotence, worms, breast problems,
ulcer, prolapsed of the womb
Adult men and women
Field Survey 2017
97%
3% 1%
Good
Bad
Undecided
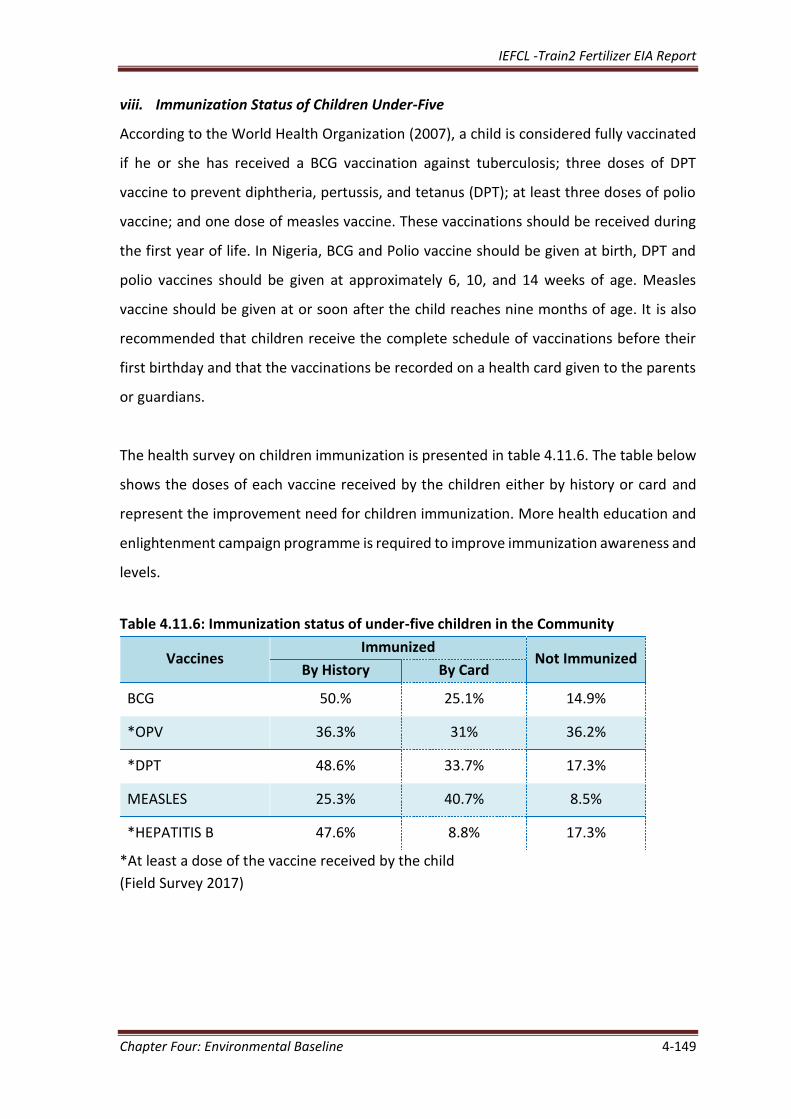
IEFCL -Train2 Fertilizer EIA Report
Chapter Four: Environmental Baseline 4-149
viii. Immunization Status of Children Under-Five
According to the World Health Organization (2007), a child is considered fully vaccinated
if he or she has received a BCG vaccination against tuberculosis; three doses of DPT
vaccine to prevent diphtheria, pertussis, and tetanus (DPT); at least three doses of polio
vaccine; and one dose of measles vaccine. These vaccinations should be received during
the first year of life. In Nigeria, BCG and Polio vaccine should be given at birth, DPT and
polio vaccines should be given at approximately 6, 10, and 14 weeks of age. Measles
vaccine should be given at or soon after the child reaches nine months of age. It is also
recommended that children receive the complete schedule of vaccinations before their
first birthday and that the vaccinations be recorded on a health card given to the parents
or guardians.
The health survey on children immunization is presented in table 4.11.6. The table below
shows the doses of each vaccine received by the children either by history or card and
represent the improvement need for children immunization. More health education and
enlightenment campaign programme is required to improve immunization awareness and
levels.
Table 4.11.6: Immunization status of under-five children in the Community
Vaccines Immunized
Not Immunized By History By Card
BCG 50.% 25.1% 14.9%
*OPV 36.3% 31% 36.2%
*DPT 48.6% 33.7% 17.3%
MEASLES 25.3% 40.7% 8.5%
*HEPATITIS B 47.6% 8.8% 17.3%
*At least a dose of the vaccine received by the child
(Field Survey 2017)
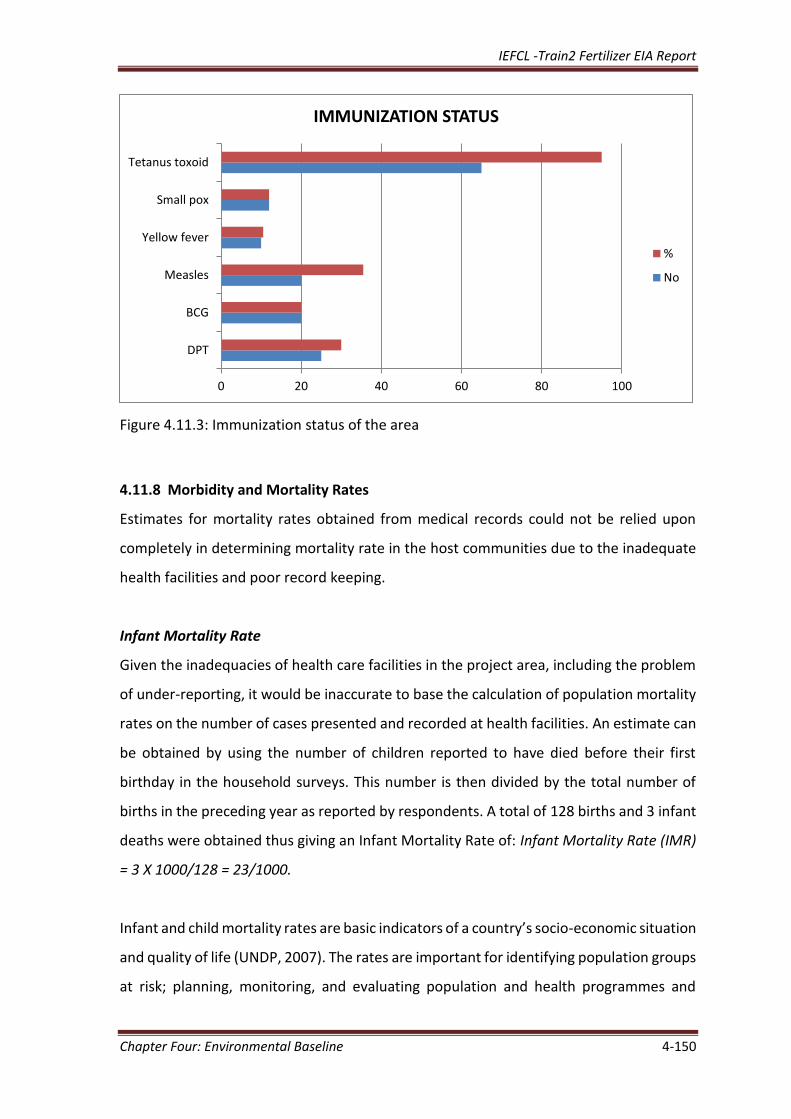
IEFCL -Train2 Fertilizer EIA Report
Chapter Four: Environmental Baseline 4-150
Figure 4.11.3: Immunization status of the area
4.11.8 Morbidity and Mortality Rates
Estimates for mortality rates obtained from medical records could not be relied upon
completely in determining mortality rate in the host communities due to the inadequate
health facilities and poor record keeping.
Infant Mortality Rate
Given the inadequacies of health care facilities in the project area, including the problem
of under-reporting, it would be inaccurate to base the calculation of population mortality
rates on the number of cases presented and recorded at health facilities. An estimate can
be obtained by using the number of children reported to have died before their first
birthday in the household surveys. This number is then divided by the total number of
births in the preceding year as reported by respondents. A total of 128 births and 3 infant
deaths were obtained thus giving an Infant Mortality Rate of: Infant Mortality Rate (IMR)
= 3 X 1000/128 = 23/1000.
Infant and child mortality rates are basic indicators of a country’s socio-economic situation
and quality of life (UNDP, 2007). The rates are important for identifying population groups
at risk; planning, monitoring, and evaluating population and health programmes and
0 20 40 60 80 100
DPT
BCG
Measles
Yellow fever
Small pox
Tetanus toxoid
IMMUNIZATION STATUS
%
No
IEFCL -Train2 Fertilizer EIA Report
Chapter Four: Environmental Baseline 4-151
policies; and monitoring progress towards the Millennium Development Goal to reduce
child mortality by two-thirds by the year 2015.
Data from the 2008 NDHS indicate that the national infant mortality rate is 75 deaths per
1,000 live births, while the under-five mortality rate is 157 per 1,000 live births.
The national neonatal mortality rate is 40 per 1,000 births. Thus, almost half of childhood
deaths occurred during infancy, with one-quarter taking place during the first month of
life. Child mortality is consistently lower in urban areas than in rural areas (CDC, 2005).
There is also variation in the mortality level across zones. The infant mortality and under-
five mortality rates are highest in the North East, and lowest in the South West (CDC,
2005).
Maternal Mortality Ratio
A total of 2 maternal deaths are reported in relation to 128 births during the preceding
year (Akpajo community). This would give the maternal mortality ratio as follows:
Maternal Mortality Ratio = 2 X 1000/128 = 16/1000
Crude Mortality Rate
Crude mortality rate was estimated in a similar manner as the infant mortality rate by
using the estimated total population of the sampled households and the total number of
deaths reported by the respondents during the survey. Out of a sampled population of
2729, in an early study, a total of 22 deaths were reported in the preceding year giving a
Crude Mortality Rate of: Crude Mortality Rate (CMR) = 22 X 1000/2729 = 8/1000.
It should be noted that this estimate is based on deaths reported by respondents, and
could not be verified due to the lack of mortality records. Respondents may have reported
fewer deaths than actually occurred. This would explain why the crude mortality rate
estimated is much lower than the national crude mortality rate of 14/1000 (NPC, 1991).
In 2016, the prevalence of reported deaths among households in the last one year from
available records indicate that mortality ratio was highest at Elelenwo and least at Akpajo.
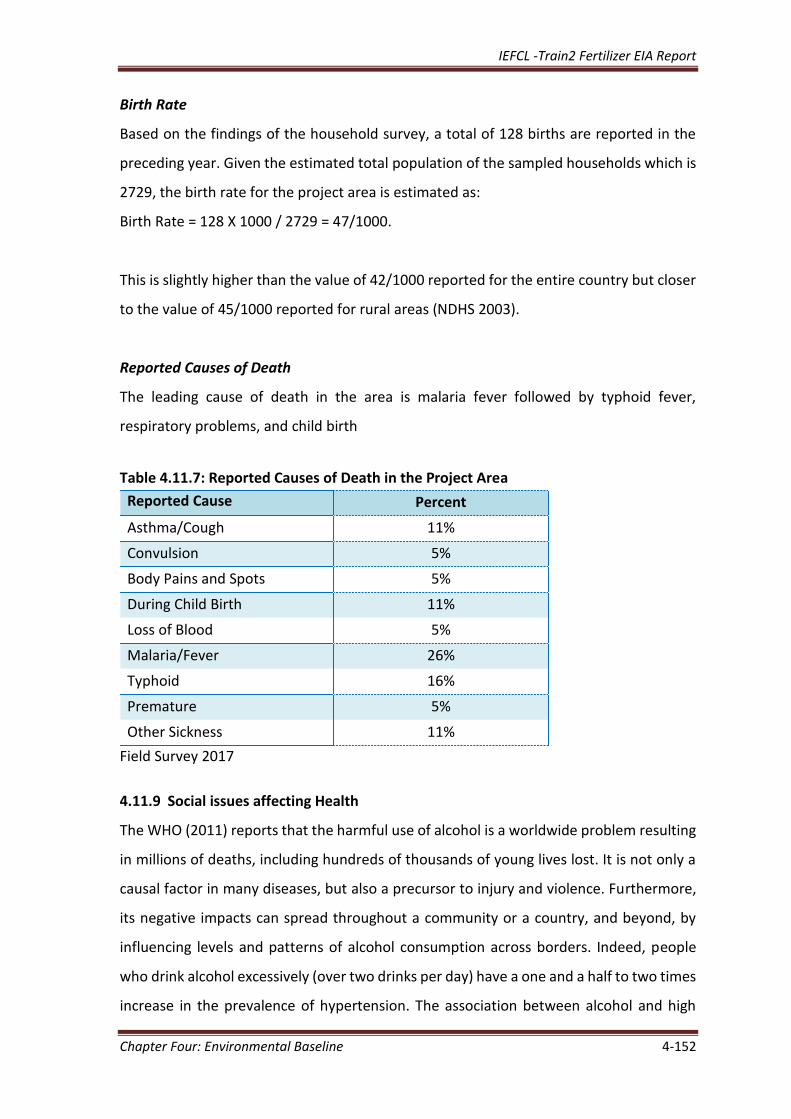
IEFCL -Train2 Fertilizer EIA Report
Chapter Four: Environmental Baseline 4-152
Birth Rate
Based on the findings of the household survey, a total of 128 births are reported in the
preceding year. Given the estimated total population of the sampled households which is
2729, the birth rate for the project area is estimated as:
Birth Rate = 128 X 1000 / 2729 = 47/1000.
This is slightly higher than the value of 42/1000 reported for the entire country but closer
to the value of 45/1000 reported for rural areas (NDHS 2003).
Reported Causes of Death
The leading cause of death in the area is malaria fever followed by typhoid fever,
respiratory problems, and child birth
Table 4.11.7: Reported Causes of Death in the Project Area
Reported Cause Percent
Asthma/Cough 11%
Convulsion 5%
Body Pains and Spots 5%
During Child Birth 11%
Loss of Blood 5%
Malaria/Fever 26%
Typhoid 16%
Premature 5%
Other Sickness 11%
Field Survey 2017
4.11.9 Social issues affecting Health
The WHO (2011) reports that the harmful use of alcohol is a worldwide problem resulting
in millions of deaths, including hundreds of thousands of young lives lost. It is not only a
causal factor in many diseases, but also a precursor to injury and violence. Furthermore,
its negative impacts can spread throughout a community or a country, and beyond, by
influencing levels and patterns of alcohol consumption across borders. Indeed, people
who drink alcohol excessively (over two drinks per day) have a one and a half to two times
increase in the prevalence of hypertension. The association between alcohol and high
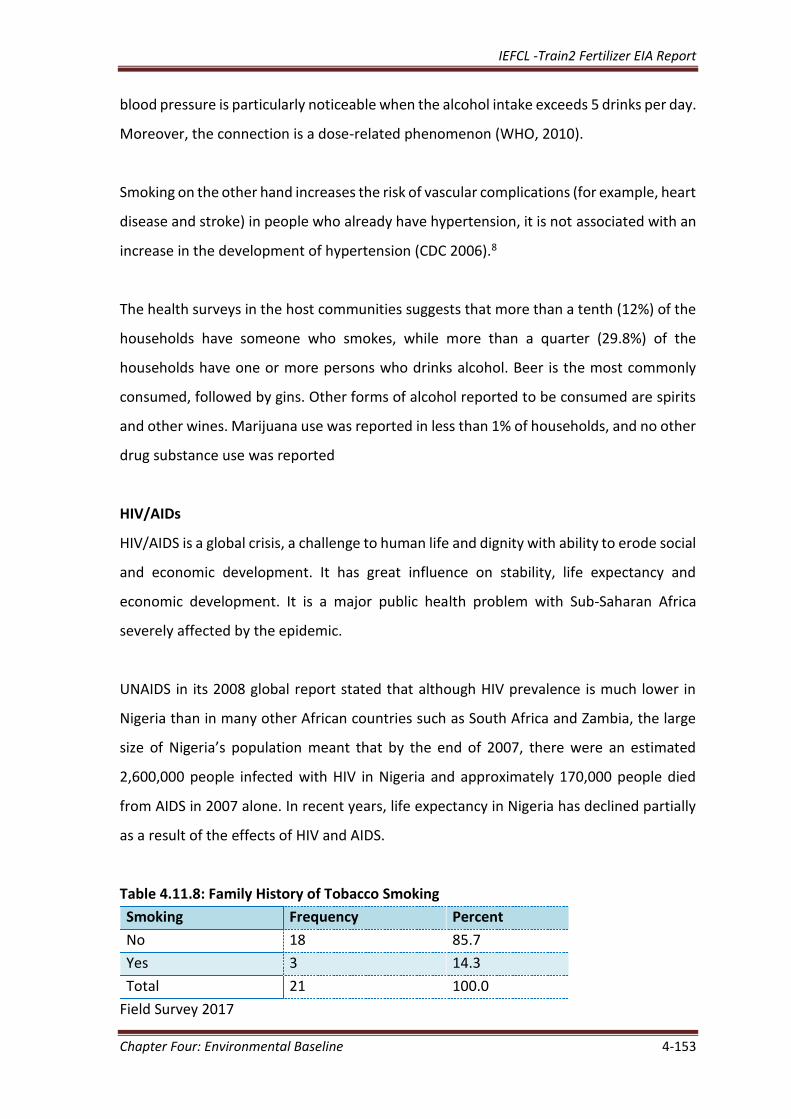
IEFCL -Train2 Fertilizer EIA Report
Chapter Four: Environmental Baseline 4-153
blood pressure is particularly noticeable when the alcohol intake exceeds 5 drinks per day.
Moreover, the connection is a dose-related phenomenon (WHO, 2010).
Smoking on the other hand increases the risk of vascular complications (for example, heart
disease and stroke) in people who already have hypertension, it is not associated with an
increase in the development of hypertension (CDC 2006).8
The health surveys in the host communities suggests that more than a tenth (12%) of the
households have someone who smokes, while more than a quarter (29.8%) of the
households have one or more persons who drinks alcohol. Beer is the most commonly
consumed, followed by gins. Other forms of alcohol reported to be consumed are spirits
and other wines. Marijuana use was reported in less than 1% of households, and no other
drug substance use was reported
HIV/AIDs
HIV/AIDS is a global crisis, a challenge to human life and dignity with ability to erode social
and economic development. It has great influence on stability, life expectancy and
economic development. It is a major public health problem with Sub-Saharan Africa
severely affected by the epidemic.
UNAIDS in its 2008 global report stated that although HIV prevalence is much lower in
Nigeria than in many other African countries such as South Africa and Zambia, the large
size of Nigeria’s population meant that by the end of 2007, there were an estimated
2,600,000 people infected with HIV in Nigeria and approximately 170,000 people died
from AIDS in 2007 alone. In recent years, life expectancy in Nigeria has declined partially
as a result of the effects of HIV and AIDS.
Table 4.11.8: Family History of Tobacco Smoking
Smoking Frequency Percent
No 18 85.7
Yes 3 14.3
Total 21 100.0
Field Survey 2017
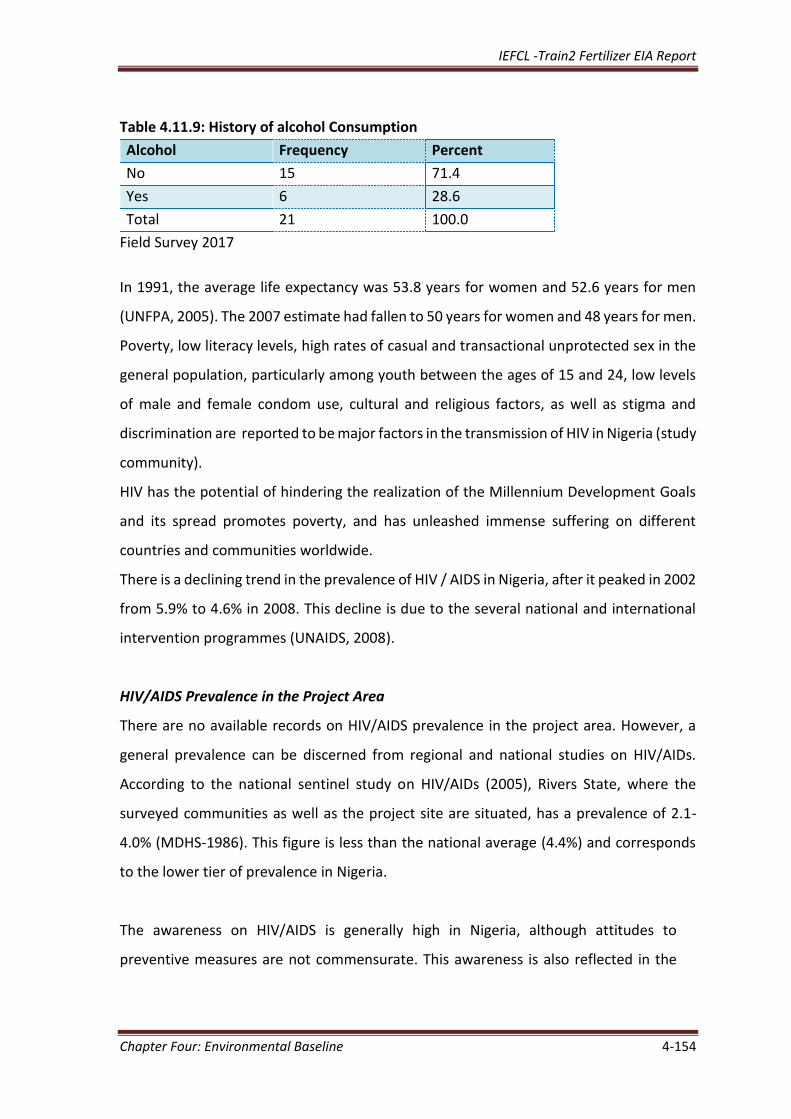
IEFCL -Train2 Fertilizer EIA Report
Chapter Four: Environmental Baseline 4-154
Table 4.11.9: History of alcohol Consumption
Alcohol Frequency Percent
No 15 71.4
Yes 6 28.6
Total 21 100.0
Field Survey 2017
In 1991, the average life expectancy was 53.8 years for women and 52.6 years for men
(UNFPA, 2005). The 2007 estimate had fallen to 50 years for women and 48 years for men.
Poverty, low literacy levels, high rates of casual and transactional unprotected sex in the
general population, particularly among youth between the ages of 15 and 24, low levels
of male and female condom use, cultural and religious factors, as well as stigma and
discrimination are reported to be major factors in the transmission of HIV in Nigeria (study
community).
HIV has the potential of hindering the realization of the Millennium Development Goals
and its spread promotes poverty, and has unleashed immense suffering on different
countries and communities worldwide.
There is a declining trend in the prevalence of HIV / AIDS in Nigeria, after it peaked in 2002
from 5.9% to 4.6% in 2008. This decline is due to the several national and international
intervention programmes (UNAIDS, 2008).
HIV/AIDS Prevalence in the Project Area
There are no available records on HIV/AIDS prevalence in the project area. However, a
general prevalence can be discerned from regional and national studies on HIV/AIDs.
According to the national sentinel study on HIV/AIDs (2005), Rivers State, where the
surveyed communities as well as the project site are situated, has a prevalence of 2.1-
4.0% (MDHS-1986). This figure is less than the national average (4.4%) and corresponds
to the lower tier of prevalence in Nigeria.
The awareness on HIV/AIDS is generally high in Nigeria, although attitudes to
preventive measures are not commensurate. This awareness is also reflected in the
IEFCL -Train2 Fertilizer EIA Report
Chapter Four: Environmental Baseline 4-155
study area. However, cases of HIV /AIDS among residents in the surveyed households
are only skeletally reported.
4.11.10 Health Needs of the Community
The needs of the community as gathered from the questionnaire, focal group
discussions and informal discussions include:
Uninterrupted sources of potable water as well as improved and accessible
health care facilities;
Training of health manpower (i.e. community health workers (CHEW),nurses,
doctors, medical lab scientist, occupational health therapies radiographer and
radiologist);
Training of traditional birth attendants and traditional medical practitioner on
hygienic procedures;
Regular Immunization Programs, provision of facility for prompt/emergency
response such as ambulance, mobile clinics;
Monitoring and surveillance for early detection of epidemics;
Health insurance schemes to make health care accessible and affordable to
the people.
Regular Town Hall talks on Environmental Health.

IEFCL -Train2 Fertilizer EIA Report
Chapter Four: Environmental Baseline 4-156
4.12 STAKEHOLDER ENGAGEMENT / CONSULTATION
Meaningful public and stakeholder participation and engagement is the cornerstone of
any successful environmental assessment of a project. Not only the public and
stakeholder consultation required as part of Nigerian environmental impact assessment
(EIA) legislation and IFC Environmental Guideline, an open and meaningful public
engagement program undertaken as part of the EIA of a project contributes to building
positive community relations, and generally assists in the acceptance of, or co-existence
with, a development proposal.
In Nigeria all EIA legislations require that the proponent of a project demonstrate that the
potentially affected public and other stakeholders have been given a meaningful
opportunity to provide comment and raise any concerns they may have about the project,
as part of the EIA process. In addition, the proponent must incorporate the relevant
feedback received from such stakeholders into the EIA report, and must demonstrate how
it has considered or addressed (or how it intends to consider or address), as appropriate,
the issues raised by the public into the EIA and subsequent development of the project.
The primary objectives of the consultation were to:
Identify stakeholders for the proposed IEFCL-Train2 project;
Explain to host communities and other stakeholders about the proposed project
activities/operations and ensure exchange of information that will facilitate good
working relations; see public engagement briefing document Appendix 4.12
Identify and address issues and concerns of stakeholders early;
Incorporate the relevant feedback obtained from the public, stakeholders, and
regulatory agencies into the EIA Report for the Project, as well as in the business
decision-making process for the Project;
Meet statutory requirement.
The project team held series of stakeholder consultation sessions. Initial discussions and
consultation were initiated with the stakeholders, including the business community,
government, community groups and neighbours, to obtain information on any initial

IEFCL -Train2 Fertilizer EIA Report
Chapter Four: Environmental Baseline 4-157
concerns that these and other stakeholders may have about the Project. The consultation
sessions culminated in a scoping workshop. The stakeholders identified for the project
and who participated in the various consultation sessions included communities within
the project area and the regulators, and where adequately engaged through:
scoping workshop,
baseline data gathering,
focal group discussion,
questionnaire administration
Public forum etc.
Communities concerns that were apparent in the community stakeholder engagement
are summarized below:
Can two fertilizer plants be sited in a particular place?
Traffic congestion and pollution as a result of heavy traffic.
Environmental impact of proposed project to human health
The capacity of Okulu stream to handle effluent from the proposed Train2 project
How will the project consider women.
Will the project give employment to Eleme people
The benefit of the project to host community
Migrants from other regions may take most jobs and dominate most of the
business as it is already visible in the area.
The other major concern of the host communities is the lack of good potable
water, basic social amenities like road infrastructure, and steady electricity in the
area.
Another important concern of the communities was the dilapidated nature of
some schools in the area and prayed that Indorama through corporate social
responsibility should continue to give support in this area.
Most people mention the possibility that migrant workers might bring diseases
that are not common in the area.
Safety problems from the increasing numbers of big trucks to be used during
construction work and operation in form of product lifting.

IEFCL -Train2 Fertilizer EIA Report
Chapter Four: Environmental Baseline 4-158
Transportation of finished products from the factory will cause congestion on the
already stretched public road.
Community expectations
Views on expectation of what the proposed project should bring to the people were
unanimous and the people ranked them in the following order of priority.
Employment/scholarship and contract opportunity to host communities
Improved basic social amenities such as good boreholes in each community
Improved health care facility.
Build a training center to enable new skill development
Consider host community first in terms of employment opportunities
The complete proceedings of stakeholder’s engagement carried on the 17th November
2017 is attached as Appendix 4.12

IEFCL -Train2 Fertilizer EIA Report
Chapter Four: Environmental Baseline 4-159
4.13 CORPORATE HEALTH AND SOCIAL RESPONSIVENESS
The present report also reviewed how the proponent had responded to the social and
health needs of the host communities.
The Company’s Philosophy of Corporate Social Responsibility (CSR)
Indorama-Nigeria Group strongly believes in being socially responsible and
responsive, especially as it related to health, safety and environment, as well as
community development and empowerment.
The Company firmly believes in the concept of Corporate Social Responsibility
(CSR) or Corporate Social Investment (CSI) as a major integral part of business
operations.
In this regard, the company makes conscious or deliberate effort to include public
interest and sustainability in corporate decisions involving people, plant and
profit.
Consequently, the Company considers the welfare, wellbeing, healthcare and
socio-cultural issues of the host communities, surrounding or neighboring
communities and the larger society.
The Company firmly believes in giving back to society part of its fortunes in
appreciation of good neighborliness and good corporate citizenship.
Areas of community interventions include providing employment opportunities,
youth empowerment programs, micro-credit for vulnerable groups such as
widows, construction of roads, and providing social amenities such as building of
schools, rural electrification, water supply, healthcare; etc.
The Company strongly believes in the sustainability of its CSR programmes
through needs analysis and community participation in all corporate interventions
and executions.
Sustainable CSR Programmes for Host Communities
In the past ten years, the companies have executed many community development
programmes such as building of schools, construction of roads and drainages,
rehabilitation of hospitals and supply of medical equipment and electrification projects.
IEFCL -Train2 Fertilizer EIA Report
Chapter Four: Environmental Baseline 4-160
Others includes award of scholarships to indigent undergraduates from Eleme and
Elelenwo, employment opportunities for indigenes, sponsorship of worthy events,
donation of drugs and food items to some charity organizations in the area and youth
empowerment programmes.
In specific terms, the companies have achieved the following CSR millstones in the
following areas:
Socio-economic Financial Empowerment
The biggest of Indorama’s CSR programmes is the allotment of 7.5% shares of the
company to six host communities of Akpajo, Aleto, Agbonchia, Elelenwo, Njuru
and Okerewa as a successful example of private - public partnership.
This has created tremendous value and engendered significant economic activities
in the communities. More than N20 Billion has accrued to the host communities
through this intervention since 2012.
The company has created over 3,500 direct and indirect employment
opportunities to indigenes of the six host communities, the pipeline communities
and neighboring communities. This has significantly increased their socio-
economic wellbeing of the workers and their families and other dependents.
The company’s micro-credit scheme has been able to empower many widows and
other vulnerable groups in the six host communities who are into micro
businesses.
Indorama has created a pool of entrepreneurs from the host communities.
Capacity of a people to earn income and generate employment has been
developed.
Lots of contract jobs have been given to host community contractors ranging from
civil, electrical, logistics, labour supplies, car hire, equipment leasing, asphalting of
roads in the complex, security on the company pipelines, etc.
IEFCL -Train2 Fertilizer EIA Report
Chapter Four: Environmental Baseline 4-161
Education:
Building of a massive secondary school complex (boys and girls) for Aleto
community (one of the host communities). The school comprising 12 classrooms,
Principal’s office, staff offices, science laboratories, sick bay, etc. was
commissioned and handed over to the community leaders on 11th January 2017.
Donation of 79 sets of solid high quality seat-fitted tables to the Nigerian Navy
Basic Training School, Onne, Rivers State;
Has awarded scholarships to 30 indigent students of Eleme/Elelenwo extraction
doing engineering and other science related courses in universities and
polytechnics. For Engineering Courses are for five years while others are for four
4 years.
In 2008, the company organized a graduate training program for host community
engineering students with zero experience and later absorbed them as staff. The
company shall consider it again as personnel requirement improves.
Purchased a plot of land in Aleto community and constructed ICT and Skill
Acquisition Center, which is operational and functional now.
Indorama donated N10 million to the University of Port Harcourt Centre of Gas,
Refining & Petrochemicals to sponsor an international conference to add value to
the education and knowledge sharing for national development.
Healthcare:
Indorama carried out a full renovation of the Nchia General Hospital Eleme and
donated drugs and medical equipment worth Eighty Million Naira (N80,000,000)
to the hospital.
To make the hospital fully functional, Indorama embarked on building of doctors’
and nurses’ quarters, and building of a major emergency entrance/exit road in the
hospital. All these have been commissioned.
As a follow up to the hospital renovation, Indorama organized a two-day Free Eye
Camp in which about 500 persons with eye diseases were diagnosed and treated
free of charge.
IEFCL -Train2 Fertilizer EIA Report
Chapter Four: Environmental Baseline 4-162
At various times, Indorama has donated drugs and food items to Daughters of
Charity, a Catholic charity organization, which takes care of the poor and needy in
the Eleme and environs.
Indorama healthcare interventions also are extended to the larger society. In
March 2013, the company donated various sets of medical equipment to the
University of Port Harcourt Teaching Hospital.
Another donation of medical equipment worth millions of naira was also made to
the Braithwaite Specialists Memorial Hospital (BSMH), Port Harcourt (owned by
the Rivers state Government) in August 2017.
Infrastructure
In July 2015, Indorama donated N530 million in an initiative of the Rivers state
Government to rehabilitate the Eleme – Onne axis of the Federal highway which
had become impassable and causing terrible hardship for motorists and workers.
The company has done quite enormous number of developmental projects in the
host communities including
(a) Building of roads in Elelenwo and Agbonchia communities,
(b) Electrification project in Njuru and Akpajo communities,
(c) Building of modern secondary school in Aleto community.
(d) In each Community the company has expended N26M (N52M for 2
Communities).
(e) Each community has 600 MTR road and Electrification project consisting of
erection of 36 High Tension Poles, 22 Low Tension Poles to cover 1KM,
Installation of 1KM long HT and LT Cables and procurement & installation of
500KVA Transformer to power the HT/LT Cables.
Indorama Eleme Petrochemicals Ltd and its sister companies have made lives
better to its host and transit community as well as the larger society through its
numerous corporate social responsibility (CRS) initiatives.
Conclusively, Appendix 4.13 has been attached to show full details and status of CSR
projects to the host community.


