Embed Size (px)
Citation preview

Identifying roots of northern hardwood species:patterns with diameter and depth
Ruth D. Yanai, Melany C. Fisk, Timothy J. Fahey, Natalie L. Cleavitt, andByung B. Park
Abstract: Forest canopies are often stratified by species; little is known about the depth distribution of tree roots in mixedstands because they are not readily identified by species. We used diagnostic characteristics of wood anatomy and grossmorphology to distinguish roots by species and applied these methods to test for differences in the rooting depth of sugarmaple (Acer saccharum Marsh.), American beech (Fagus grandifolia Ehrh.), and yellow birch (Betula alleghaniensisBritt.) in two northern hardwood forests. We also distinguished hobblebush (Viburnum lantanoides Michx.) and white ash(Fraxinus americana L.) roots. Analysis of plastid DNA fragment lengths confirmed that 90% of the roots were correctlyidentified. The vertical distribution of fine roots of these species differed by 2–4 cm in the median root depth (P = 0.03).There was a significant difference in the distribution of roots by size class, with fine roots (0–2 mm) being more concen-trated near the soil surface than coarser roots (2–5 mm; P = 0.004). The two sites differed by <2 cm in median rootingdepths (P = 0.02). The visual identification of roots for the main tree species in the northern hardwood forest allows spe-cies-specific questions to be posed for belowground processes.
Resume : La stratification des essences est frequente dans le couvert forestier. La distribution verticale des racines desarbres est peu connue dans les peuplements melanges parce que l’identification des racines n’est pas facile. Nous avonsutilises les caracteristiques diagnostiques de l’anatomie et de la morphologie grossiere du bois pour differencier les racinesselon l’espece et nous avons appliques ces methodes pour tester les differences de profondeur d’enracinement de l’erable asucre (Acer saccharum Marsh.), du hetre d’Amerique (Fagus grandifolia Ehrh.) et du bouleau jaune (Betula alleghaniensisBritt.) dans deux forets feuillues nordiques. Nous avons aussi distingue les racines de la viorne bois-d’orignal (Viburnumlantanoides Michx.) et du frene blanc (Fraxinus americana L.). L’analyse de la longueur des fragments d’ADN des plastesa confirme que 90 % des racines ont ete correctement identifiees. La distribution verticale des racines fines etaientsignificativement differente selon l’espece (P = 0,03) et la difference variait de deux a quatre cm en comparant la profon-deur mediane des racines. Il y avait une difference significative dans la distribution des racines selon la classe dedimension : les racines fines (0–2 mm) etaient plus concentrees pres de la surface du sol que les plus grosses racines (2–5 mm) (P = 0,004). La profondeur mediane d’enracinement differait de moins de deux cm entre les deux stations (P =0,02). L’identification visuelle des racines des principales especes d’arbres dans la foret feuillue nordique permet deformuler des questions propres a chaque espece au sujet des processus souterrains.
[Traduit par la Redaction]
Introduction
Vertical stratification of foliage in the canopy of mixedforests has been associated with interspecific differences intree growth rates, successional status, and physiologicaltraits, such as shade tolerance (Oliver and Larson 1996). Bycomparison, we know relatively little about how tree speciesdistribute biomass belowground, although spatial differencesin root distributions might be expected to promote speciescoexistence (Veresoglou and Fitter 1984). Differences inrooting depth have been well studied in conifer plantations,where, for example, shallow-rooted species are more proneto windthrow (Nicoll et al. 2006). However, because of dif-
ficulties in distinguishing fine roots of different tree species,few studies have compared depth distributions in mixedstands (Schenk et al. 1999).
Some degree of root depth stratification might be ex-pected in mixed stands because of interspecific differencesin age or size structure. In a Scots pine (Pinus sylvestris L.)forest in France, understory Norway spruce (Picea abies (L.)Karst.) were more superficially rooted (Mikola et al. 1966).Vertical segregation of roots by species might also resultfrom differences in root system architecture or physiologicaltraits in relation to the soil environment. Loblolly pine(Pinus taeda L.) was more deeply rooted than red maple(Acer rubrum L.) or black locust (Robinia pseudoacacia L.)
Received 28 March 2008. Accepted 14 August 2008. Published on the NRC Research Press Web site at cjfr.nrc.ca on 25 October 2008.
R.D. Yanai and B.B. Park.1,2 Department of Forest and Natural Resources Management, SUNY College of Environmental Science andForestry, Syracuse, NY 13210, USA.M.C. Fisk. Department of Zoology, Miami University, Oxford, OH 45056, USA.T.J. Fahey and N.L. Cleavitt. Department of Natural Resources, Cornell University, Ithaca, NY 14853, USA.
1Corresponding author (e-mail: [email protected]).2Present address: Department of Forest Conservation, Korea Forest Research Institute, Seoul 130-712, South Korea.
2862
Can. J. For. Res. 38: 2862–2869 (2008) doi:10.1139/X08-125 # 2008 NRC Canada

in mixed-species stands in the Virginia Piedmont (Freder-ickson and Zedaker 1995). Western red cedar (Thuja plicataDonn ex D. Don), which is flood tolerant, was more deeplyrooted than western hemlock (Tsuga heterophylla (Raf.)Sarg.) in the very wet climate of British Columbia (Bennettet al. 2002). In northern hardwoods, where species are moresimilar in their habitat requirements and sugar maple(Acer saccharum Marsh.), American beech (Fagus grandifo-lia Ehrh.; hereinafter referred to as beech), and yellow birch(Betula alleghaniensis Britt.) are commonly codominant, itis not clear what degree of vertical stratification of fine rootsshould be expected. Notably, sugar maple is an arbuscularmycorrhizal species and the ectomycorrhizae of yellow birchand beech are quite distinct taxonomically (Newton andHaigh 1998).
The paucity of observations of spatial segregation of fineroots by species reflects the difficulty of distinguishing theseplant tissues, whose morphological characteristics are oftenvery similar (Pregitzer et al. 2000). However, in forestswith only a few dominant tree species, subtle but significantdifferences in root anatomy, branching patterns, or grossmorphology can be used to sort fine roots by species. An al-ternative approach is to use genetic techniques (Jackson etal. 1999), but costs would be prohibitive for large samplesizes.
We used a combination of wood anatomy and gross mor-phology to separate roots of five woody species common inthe northern hardwood forest of the northeastern USA. Weapplied these methods to test for differences in the rootingdepth of sugar maple, beech, and yellow birch in two north-ern hardwood sites in New Hampshire. We also validatedthe visual identification of roots by species using moleculargenetic techniques.
Methods
Study sitesWe collected roots by depth in two mature northern hard-
wood ecosystems in the White Mountains of New Hamp-shire in June 2005. Overstory vegetation in both forests wasdominated by sugar maple, beech, and yellow birch, as char-acterized by measuring diameters of all trees ‡10 cm indiameter at breast height (Table 1).
At the Bartlett Experimental Forest, we used a 115-year-old stand (C9) at 440 m a.s.l. in which root biomass withdepth had been measured 1 year earlier (Yanai et al. 2006;Park et al. 2007). Soils were coarse-loamy, mixed, frigid,Typic Haplorthods. The stand had three 2500 m2 measure-ment plots, each of which had one soil pit from which rootswere previously measured. In June 2005, we collected rootsfrom two small pits (15 cm � 15 cm) in the same 100 m2
subplots that had contained the soil pits, for a total of sixpits.
At the Hubbard Brook Experimental Forest we sampled inthree permanent plots (500 m2) located in the lower hard-wood zone (520–580 m a.s.l.) near the reference watershed,which were approximately 105 years old (Fahey et al. 2005).Soils are Typic Haplorthods developed from unsorted basaltills with a 4–8 cm thick organic horizon. Three 15 cm �15 cm pits were excavated in each plot. T
able
1.M
orph
olog
ical
char
acte
rist
ics
used
toid
entif
yro
ots
toth
esp
ecie
sor
genu
sle
vel.
Spec
ies
Xyl
emst
ruct
ure
(in
cros
s-se
ctio
n)Fr
agra
nce
Roo
tha
bit
Roo
tep
ider
mis
Am
eric
anbe
ech
Com
poun
dra
ysin
xyle
mfo
rma
whi
test
ar;
sim
ple
rays
and
smal
lve
ssel
sal
sopr
esen
tN
one
Side
bran
ches
spar
sely
bran
ched
;m
ayha
vesw
olle
nro
ottip
sB
rittl
e;sc
rape
sof
fin
chun
ksex
posi
ngst
ark
whi
tein
ner
laye
rSu
gar
map
le,
red
map
le,
and
stri
ped
map
leD
iffu
sepo
rous
,w
ithun
ifor
mly
dist
ribu
ted
vess
els
and
inco
nspi
cuou
ssi
mpl
era
ysN
one
Roo
ttip
sha
vea
club
-sha
ped
appe
aran
ce;
pinn
atel
ybr
anch
edw
itha
grad
ual
decr
ease
insi
zew
ithro
otor
der
Scra
pes
sim
ilar
tobe
ech,
expo
sing
star
kw
hite
inne
rla
yer
Yel
low
birc
hD
iffu
sepo
rous
,w
ithun
ifor
mal
ydi
stri
bute
dve
ssel
san
din
cons
picu
ous
sim
ple
rays
,si
mila
rto
map
le
Win
terg
reen
Roo
tsar
eos
cilla
te;
root
orde
rdo
esn’
tco
rres
pond
tobr
anch
diam
eter
;al
lsk
inny
Not
britt
leor
easi
lysc
rapi
ng;
elas
tic
Hob
bleb
ush
Lar
geve
ssel
sin
xyle
m;
rem
nant
sof
cort
exan
dep
ider
mis
Mal
odor
ous
Sim
ilar
tom
aple
;fe
wif
any
club
bed
root
tips
Mor
efl
eshy
and
yello
wis
h;ep
ider
mis
scra
pes
off
inlo
ngso
ftse
ctio
nsW
hite
ash
Rin
gpo
rous
with
alte
rnat
ing
larg
ean
dsm
all
vess
els;
rays
are
sim
ple
Non
eIr
regu
larl
ypi
nnat
ebr
anch
ing;
little
diff
eren
cein
size
of1s
t,2n
d,an
d3r
dor
der
root
s
Stri
king
lyye
llow
whe
nfr
esh
Yanai et al. 2863
# 2008 NRC Canada

Root collection and processingAfter removing the Oi litter, we collected the soil and
roots from each 15 cm � 15 cm pit to a maximum depth ofapproximately 25 cm. Samples were collected in five depthincrements in each pit. It was not practical to sample equaldepth increments in all the pits because of variation in thedepths of coarse fragments and large woody roots that im-peded soil collection. Instead, we measured the actual thick-ness of each depth increment for each pit. Generally, this
was 2–4 cm for shallow depths and 5–7 cm for deeper sam-ples.
Samples from each pit and depth layer were refrigerateduntil they could be processed. Roots were separated fromsoil by hand and washed thoroughly against a 4 mm meshscreen. We then sorted the roots by species according towood anatomy and gross morphology (Table 1; Fig. 1).Some root material was not classified by species, either be-cause the root fragments were too small to have the diagnos-
Fig. 1. Gross morphological differences as depicted by xylem structure (right) and root habit (left) of Fraxinus americana, Fagus grand-ifolia, Acer saccharum, Viburnum lantanoides, and Betula alleghaniensis.
2864 Can. J. For. Res. Vol. 38, 2008
# 2008 NRC Canada

tic xylem characteristics or exterior morphological traits, orbecause the sorters were not confident of the classification.Each species group was subdivided into two size classes, 0–2 mm and 2–5 mm; unidentified roots were not separated bysize class. Dead roots and roots >5 mm in diameter were notretained. All other roots were oven-dried and weighed.
Molecular confirmation of root identificationThe species of root branches <2 mm in diameter were
identified with molecular genetic methods using the proce-dure described by Brunner et al. (2001). We analyzed 2–5 root branches from the surface layer of each of the six pitsamples at Bartlett. In some pits we were unable to amplifyDNA from all surface layer root branches, so we usedadditional root branches from deeper layers for a total of23–25 root branches per species. We used only the more in-tact root networks, to ensure adequate sample sizes. Rootsamples were ground in an amalgamator (Darby Dental,Akron, Ohio). DNA was extracted from approximately30 mg of each sample using a standard alkaline lysis orchloroform extraction procedure modified with addition ofpolyvinylpolypyrrolidone, polyvinylpyrrolidone, betamer-captoethanol, and spermidine, to improve extraction effi-ciency and inhibitor removal (Brunner et al. 2001). Theplastid trnL intron was amplified using primers c and d(Taberlet et al. 1991) and PCR products were digested withtaqI. The trnL intron of some samples was also sequencedto verify digest patterns. We extracted DNA from sugar ma-ple, yellow birch, and beech leaf tissues following the sameprocedures. Roots were identified by comparing fragmentsizes with those from leaves of the same species.
We experienced difficulty PCR-amplifying the trnL intronof root and leaf tissues despite optimizing salt concentra-tions and annealing temperatures. We attribute this primarilyto the effects of using oven-dried roots and leaves; no suchproblems were encountered when we PCR-amplified freshleaf tissue for comparison.
Data analysisWe analyzed differences in rooting depth by species using
the soil depth above which 50% of the root mass was found.Because our measurements were not continuous with depth,we first characterized the depth distribution of roots withineach site, species, and size class by distributing the observedroot mass evenly within each depth increment. We thenidentified the depth of the median root to the nearest centi-metre. The experimental unit was the pit (n = 15, with 6 atBartlett and 9 at Hubbard Brook). Differences in the medianroot depth were evaluated with analysis of variance(ANOVA), using site, species, and diameter as main effectsand including their interactions. We also analyzed the effectof species and diameter within site.
In a second approach to distinguishing rooting depth byspecies, we fitted an exponential curve to our observationsof cumulative root mass as a function of depth. Again, be-cause our measurements were not continuous, we used themass of roots in 3 cm depth increments derived by evenlydistributing the observed root mass over the sampled depths.The cumulative fraction of roots below each 3 cm depth in-crement (Y) was described as a function of depth (d), usingthe function Y = 1 – bd for each pit. This approach results in
biased estimates of the coefficient b because we describe thedepth of our samples assuming linear, not exponential, distri-butions (Cook and Kelliher 2006), but this bias applies con-sistently across all pits and species. The same problem wouldapply to any nonlinear model; we selected this model be-cause it has only one parameter. We averaged b across pits(two pits per plot at Bartlett and three pits per plot at Hub-bard Brook) within plots (three per stand) and used ANOVAto analyze b as a function of species, size class, and site.Duncan’s multiple range test was used to compare values ofb as a function of species, size class, and site (a = 0.05).
Results
Identification of roots by speciesMost of the roots were sorted into one of the five taxa
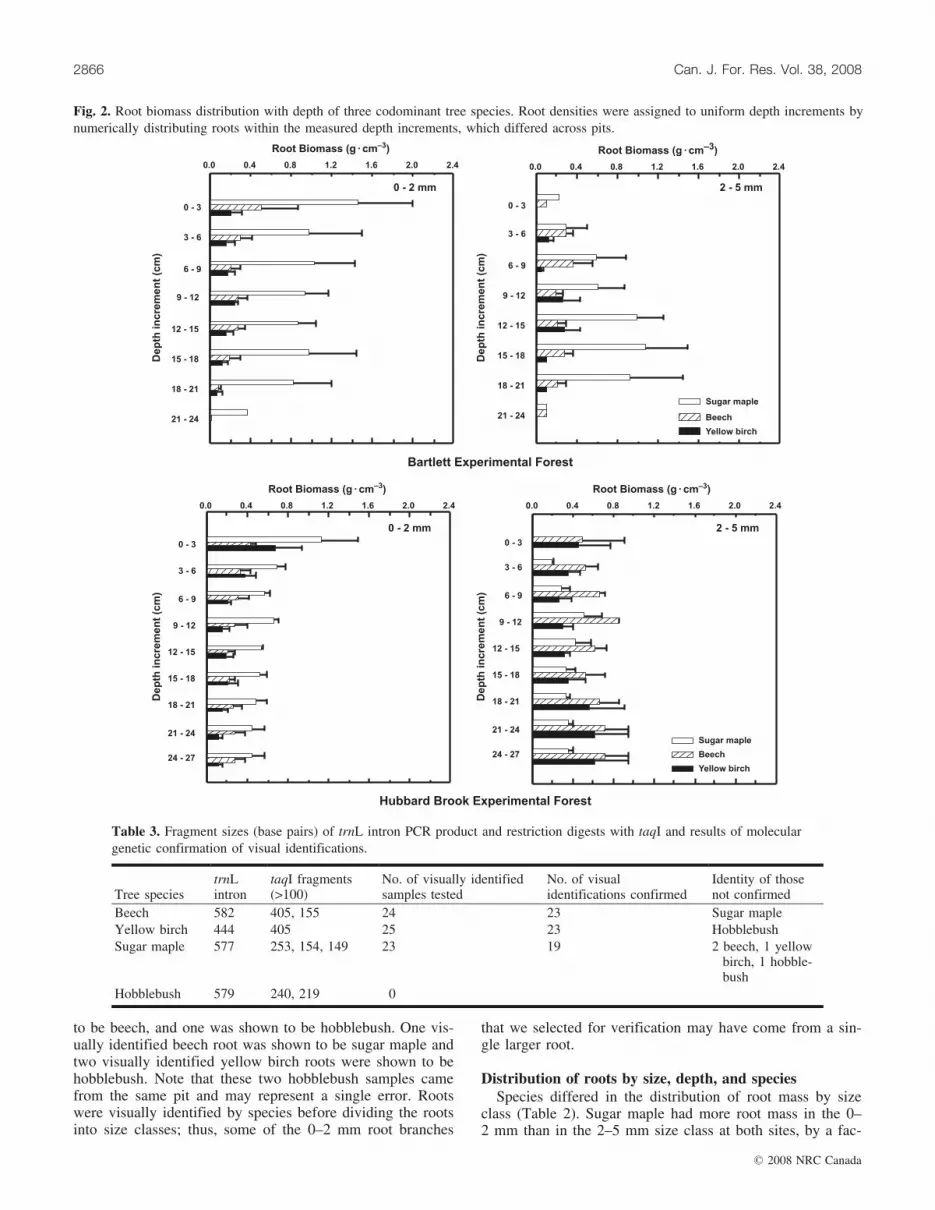
using the characteristics described in Table 1 and illustratedin Fig. 1. At Bartlett, 86% of the total root biomass in thetop 25 cm of soil was identified by species. At HubbardBrook, 78% was identified. Sugar maple was the dominantroot species at both sites, with beech second, and yellowbirch third in total root mass < 5 mm, as expected based onthe aboveground inventories (Table 2). The two sites dif-fered somewhat in species composition of the roots, withsugar maple being more dominant at Bartlett than at Hub-bard Brook (Table 2; Fig. 2). Hobblebush (Viburnum lanta-noides Michx.) was an accessory species at the Bartlett site,comprising 4% of the total root biomass of 2180 ± 298 g�m–2.At the Hubbard Brook site, hobblebush was 2.2% andwhite ash (Fraxinus americana L.) was 1.8% of the rootbiomass of 2675 ± 265 g�m–2. Roots of other species werenot identified by our methods (Table 1).
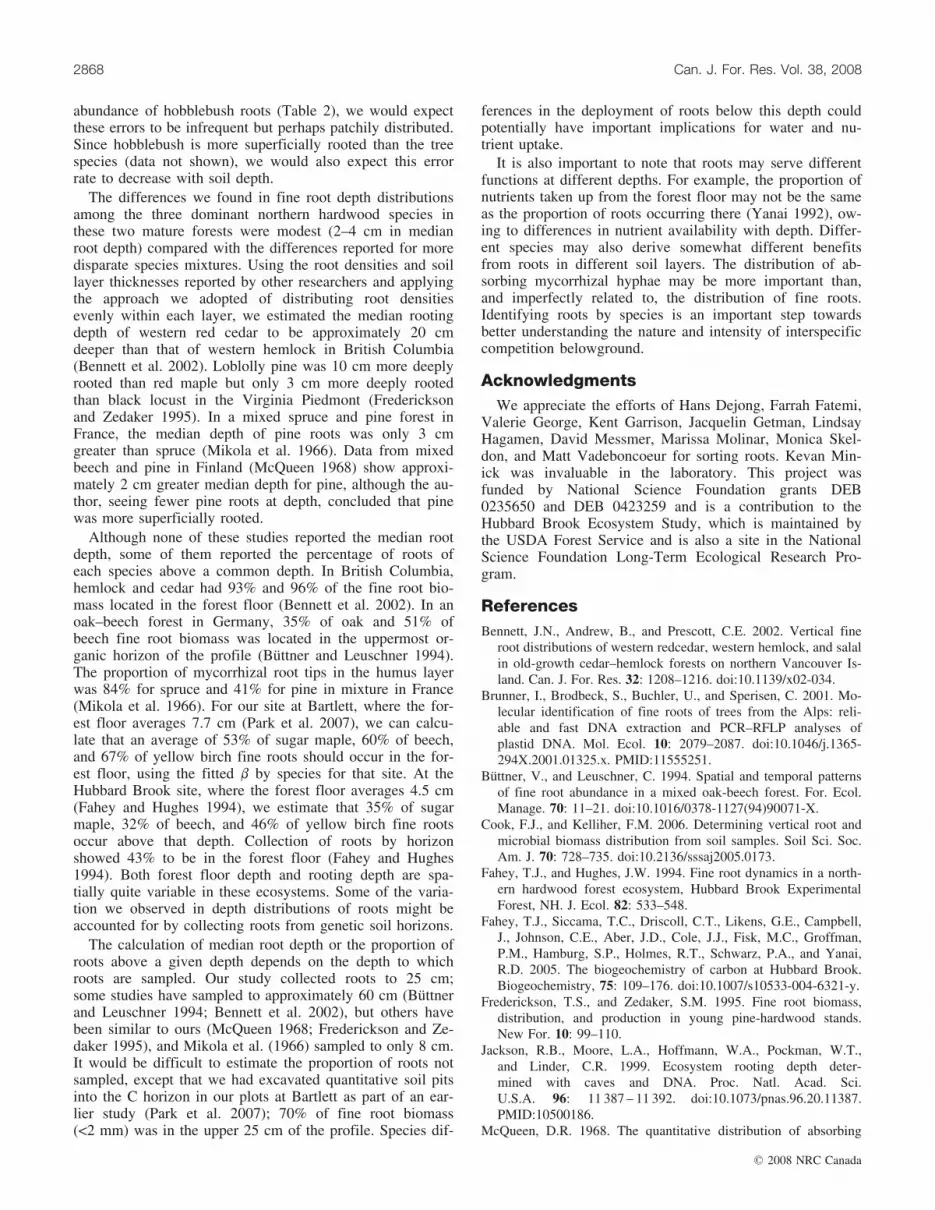
Visual identification of roots was verified by moleculargenetic identification for 96% of beech, 92% of yellowbirch, and 83% of sugar maple roots (Table 3). Of the rootsthat were visually identified as sugar maple, one was identi-fied as yellow birch by molecular methods, two were shown
Table 2. Overstory basal area and mass of roots by species in twonorthern hardwood stands at Bartlett and Hubbard Brook.
Root biomass (g�m–2)
SpeciesTree basal area(m2�ha–1) 0–2 mm 2–5 mm
BartlettSugar maple 17.0 (3.1) 880.(200) 485.(146)Beech 10.2 (1.5) 216.(82) 168.(46)Yellow birch 7.8 (1.5) 114.(37) 57.(21)Hobblebush .na 12.(7) 13.(na)Other 0.2 (0.1) 313.(80)
Hubbard BrookSugar maple 16.0 (0.6) 681.(140) 214.(65)Beech 9.9 (2.0) 235.(59) 386.(71)Yellow birch 9.0 (1.3) 269.(62) 291.(70)Hobblebush .na 68.(29) 0.White ash 2.3 (2.3) 67.(31) 30.(na)Other 0. 598.(77)
Note: Values are means with standard errors in parentheses (n = 3plots). Standard errors were not available (na) for means based on onlyone observation. Hobblebush is not measured by basal area of trees. Uni-dentified roots were not divided by size classes, so the mass of ‘‘Other’’includes 0–2 mm and 2–5 mm size classes.
Yanai et al. 2865
# 2008 NRC Canada
to be beech, and one was shown to be hobblebush. One vis-ually identified beech root was shown to be sugar maple andtwo visually identified yellow birch roots were shown to behobblebush. Note that these two hobblebush samples camefrom the same pit and may represent a single error. Rootswere visually identified by species before dividing the rootsinto size classes; thus, some of the 0–2 mm root branches
that we selected for verification may have come from a sin-gle larger root.
Distribution of roots by size, depth, and speciesSpecies differed in the distribution of root mass by size
class (Table 2). Sugar maple had more root mass in the 0–2 mm than in the 2–5 mm size class at both sites, by a fac-
Fig. 2. Root biomass distribution with depth of three codominant tree species. Root densities were assigned to uniform depth increments bynumerically distributing roots within the measured depth increments, which differed across pits.
Table 3. Fragment sizes (base pairs) of trnL intron PCR product and restriction digests with taqI and results of moleculargenetic confirmation of visual identifications.
Tree speciestrnLintron
taqI fragments(>100)
No. of visually identifiedsamples tested
No. of visualidentifications confirmed
Identity of thosenot confirmed
Beech 582 405, 155 24 23 Sugar mapleYellow birch 444 405 25 23 HobblebushSugar maple 577 253, 154, 149 23 19 2 beech, 1 yellow
birch, 1 hobble-bush
Hobblebush 579 240, 219 0
2866 Can. J. For. Res. Vol. 38, 2008
# 2008 NRC Canada

tor of two or three. Beech and yellow birch tended to havecoarser roots; both had slightly more biomass in the largersize class at Hubbard Brook, but less in this size class atBartlett.
The ANOVA of the median rooting depths did not revealsignificant differences among the three dominant tree spe-cies in the depth distribution of fine roots (<2 mm) in thetop 25 cm of the profile (P = 0.59). Across all stands andsites, the median root of yellow birch was at 9.7 cm depth,beech was at 10.0 cm, and sugar maple was at 12.0 cm.Within sites, median fine root depths ranged from 6.3 ±1.5 cm for beech to 9.2 ± 0.7 cm for yellow birch at Bartlett(P = 0.15), and at Hubbard Brook values ranged from 8.5 ±2.1 cm for yellow birch to 9.8 ± 0.9 cm for sugar maple(P = 0.86).
We also analyzed the distribution of roots with depth byfitting curves describing cumulative root fraction (Y) as afunction of depth (d). Yellow birch roots declined moresteeply with depth than sugar maple (P = 0.03); beech wasintermediate in depth distribution and not statistically distin-guishable from either yellow birch or sugar maple (Fig. 3a).The b function (Fig. 3) imperfectly described our observedroot distributions with depth (Fig. 2), which is not surpris-ing, considering it has only one parameter. The median rootdepths corresponding to the fitted values of b were shal-lower than those estimated directly. Specifically, ln (0.5) / ln(b) was 5.9 cm for yellow birch, 8.3 cm for beech, and10.0 cm for sugar maple.
Differences in rooting depth with diameter were morepronounced than differences with species. The median depthof roots in the 0–2 mm size class was 8.7 ± 1.4 cm, whereasthe median depth of roots 2–5 cm in diameter was 13.0 ±1.9 cm. The exponential model also showed that fine rootswere more concentrated near the soil surface (Figs. 2 and3b) (P = 0.004), as previously reported in this forest type(Yanai et al. 2006; Park et al. 2007). This pattern was com-
mon across species; there was not a significant interaction ofsize class and species on b or on the median root depth.
Finally, the two sites differed significantly in rootingdepth based on comparisons of b (P = 0.01), with roots atHubbard Brook distributed more deeply (Fig. 3c). The depthof the median root averaged 11.0 ± 1.9 cm at HubbardBrook and 9.7 ± 1.4 cm at Bartlett.
DiscussionMorphological traits were sufficient to identify most of
the roots we collected in these two northern hardwood sites.At Bartlett, we were unable to identify 14% of the root masscollected. This plot was heavily dominated by sugar maple,beech, and yellow birch (99% of basal area, Table 2), butwhite birch (Betula papyrifera Marsh.) and striped maple(Acer pensylvanicum L.) were also present. At HubbardBrook, 100% of the basal area was in species whose rootswe could recognize (including 6% white ash) (Table 2), butwe were unable to identify 22% of the root mass. Some ofthe ‘‘unknown’’ roots were fragments too small to be identi-fied; others simply stumped our root sorters. Both trainingof the sorters and the method of root collection will influ-ence the success of root separation using our morphologicalcriteria; we collected roots from sizable (15 cm � 15 cm)pits, so as to produce fewer small root fragments than wouldbe the case for core samples.
Molecular genetic analysis confirmed the visual identifi-cation of beech and yellow birch roots in most cases; visualidentification of sugar maple was most problematic. We ex-pected high success in beech identification because of thedistinctive xylem anatomy relative to the other species(Table 1). We were also successful in distinguishing be-tween sugar maple and yellow birch (in 49 of 50 roots), de-spite the similarity of gross morphological traits betweenthese two species. Confusion with hobblebush occurred forboth yellow birch and sugar maple. Given the relatively low
Fig. 3. Curves fitted to describe variation with depth in root mass by species (a), size class (b), and site (c). Curves are of the form Y = 1 –bd, describing cumulative root fraction (Y) by depth (d). Bartlett, Bartlett Experimental Forest site; HB, Hubbard Brook Experimental Forestsite.
Yanai et al. 2867
# 2008 NRC Canada
abundance of hobblebush roots (Table 2), we would expectthese errors to be infrequent but perhaps patchily distributed.Since hobblebush is more superficially rooted than the treespecies (data not shown), we would also expect this errorrate to decrease with soil depth.
The differences we found in fine root depth distributionsamong the three dominant northern hardwood species inthese two mature forests were modest (2–4 cm in medianroot depth) compared with the differences reported for moredisparate species mixtures. Using the root densities and soillayer thicknesses reported by other researchers and applyingthe approach we adopted of distributing root densitiesevenly within each layer, we estimated the median rootingdepth of western red cedar to be approximately 20 cmdeeper than that of western hemlock in British Columbia(Bennett et al. 2002). Loblolly pine was 10 cm more deeplyrooted than red maple but only 3 cm more deeply rootedthan black locust in the Virginia Piedmont (Fredericksonand Zedaker 1995). In a mixed spruce and pine forest inFrance, the median depth of pine roots was only 3 cmgreater than spruce (Mikola et al. 1966). Data from mixedbeech and pine in Finland (McQueen 1968) show approxi-mately 2 cm greater median depth for pine, although the au-thor, seeing fewer pine roots at depth, concluded that pinewas more superficially rooted.
Although none of these studies reported the median rootdepth, some of them reported the percentage of roots ofeach species above a common depth. In British Columbia,hemlock and cedar had 93% and 96% of the fine root bio-mass located in the forest floor (Bennett et al. 2002). In anoak–beech forest in Germany, 35% of oak and 51% ofbeech fine root biomass was located in the uppermost or-ganic horizon of the profile (Buttner and Leuschner 1994).The proportion of mycorrhizal root tips in the humus layerwas 84% for spruce and 41% for pine in mixture in France(Mikola et al. 1966). For our site at Bartlett, where the for-est floor averages 7.7 cm (Park et al. 2007), we can calcu-late that an average of 53% of sugar maple, 60% of beech,and 67% of yellow birch fine roots should occur in the for-est floor, using the fitted b by species for that site. At theHubbard Brook site, where the forest floor averages 4.5 cm(Fahey and Hughes 1994), we estimate that 35% of sugarmaple, 32% of beech, and 46% of yellow birch fine rootsoccur above that depth. Collection of roots by horizonshowed 43% to be in the forest floor (Fahey and Hughes1994). Both forest floor depth and rooting depth are spa-tially quite variable in these ecosystems. Some of the varia-tion we observed in depth distributions of roots might beaccounted for by collecting roots from genetic soil horizons.
The calculation of median root depth or the proportion ofroots above a given depth depends on the depth to whichroots are sampled. Our study collected roots to 25 cm;some studies have sampled to approximately 60 cm (Buttnerand Leuschner 1994; Bennett et al. 2002), but others havebeen similar to ours (McQueen 1968; Frederickson and Ze-daker 1995), and Mikola et al. (1966) sampled to only 8 cm.It would be difficult to estimate the proportion of roots notsampled, except that we had excavated quantitative soil pitsinto the C horizon in our plots at Bartlett as part of an ear-lier study (Park et al. 2007); 70% of fine root biomass(<2 mm) was in the upper 25 cm of the profile. Species dif-
ferences in the deployment of roots below this depth couldpotentially have important implications for water and nu-trient uptake.
It is also important to note that roots may serve differentfunctions at different depths. For example, the proportion ofnutrients taken up from the forest floor may not be the sameas the proportion of roots occurring there (Yanai 1992), ow-ing to differences in nutrient availability with depth. Differ-ent species may also derive somewhat different benefitsfrom roots in different soil layers. The distribution of ab-sorbing mycorrhizal hyphae may be more important than,and imperfectly related to, the distribution of fine roots.Identifying roots by species is an important step towardsbetter understanding the nature and intensity of interspecificcompetition belowground.
AcknowledgmentsWe appreciate the efforts of Hans Dejong, Farrah Fatemi,
Valerie George, Kent Garrison, Jacquelin Getman, LindsayHagamen, David Messmer, Marissa Molinar, Monica Skel-don, and Matt Vadeboncoeur for sorting roots. Kevan Min-ick was invaluable in the laboratory. This project wasfunded by National Science Foundation grants DEB0235650 and DEB 0423259 and is a contribution to theHubbard Brook Ecosystem Study, which is maintained bythe USDA Forest Service and is also a site in the NationalScience Foundation Long-Term Ecological Research Pro-gram.
ReferencesBennett, J.N., Andrew, B., and Prescott, C.E. 2002. Vertical fine
root distributions of western redcedar, western hemlock, and salalin old-growth cedar–hemlock forests on northern Vancouver Is-land. Can. J. For. Res. 32: 1208–1216. doi:10.1139/x02-034.
Brunner, I., Brodbeck, S., Buchler, U., and Sperisen, C. 2001. Mo-lecular identification of fine roots of trees from the Alps: reli-able and fast DNA extraction and PCR–RFLP analyses ofplastid DNA. Mol. Ecol. 10: 2079–2087. doi:10.1046/j.1365-294X.2001.01325.x. PMID:11555251.
Buttner, V., and Leuschner, C. 1994. Spatial and temporal patternsof fine root abundance in a mixed oak-beech forest. For. Ecol.Manage. 70: 11–21. doi:10.1016/0378-1127(94)90071-X.
Cook, F.J., and Kelliher, F.M. 2006. Determining vertical root andmicrobial biomass distribution from soil samples. Soil Sci. Soc.Am. J. 70: 728–735. doi:10.2136/sssaj2005.0173.
Fahey, T.J., and Hughes, J.W. 1994. Fine root dynamics in a north-ern hardwood forest ecosystem, Hubbard Brook ExperimentalForest, NH. J. Ecol. 82: 533–548.
Fahey, T.J., Siccama, T.C., Driscoll, C.T., Likens, G.E., Campbell,J., Johnson, C.E., Aber, J.D., Cole, J.J., Fisk, M.C., Groffman,P.M., Hamburg, S.P., Holmes, R.T., Schwarz, P.A., and Yanai,R.D. 2005. The biogeochemistry of carbon at Hubbard Brook.Biogeochemistry, 75: 109–176. doi:10.1007/s10533-004-6321-y.
Frederickson, T.S., and Zedaker, S.M. 1995. Fine root biomass,distribution, and production in young pine-hardwood stands.New For. 10: 99–110.
Jackson, R.B., Moore, L.A., Hoffmann, W.A., Pockman, W.T.,and Linder, C.R. 1999. Ecosystem rooting depth deter-mined with caves and DNA. Proc. Natl. Acad. Sci.U.S.A. 96: 11 387 – 11 392. doi:10.1073/pnas.96.20.11387.PMID:10500186.
McQueen, D.R. 1968. The quantitative distribution of absorbing
2868 Can. J. For. Res. Vol. 38, 2008
# 2008 NRC Canada
roots of Pinus sylvestris and Fagus sylvatica in a forest succes-sion. Oecol. Plant. 3: 83–89.
Mikola, P., Hall, J., and Torniainen, E. 1966. Vertical distributionof mycorrhizae in pine forests with spruce undergrowth. Ann.Bot. Fenn. 3: 406–409.
Newton, A.C., and Haigh, J.M. 1998. Diversity of ectomycorrhizalfungi in Britain: a test of the species–area relationship, and therole of host specificity. New Phytol. 138: 619–627. doi:10.1046/j.1469-8137.1998.00143.x.
Nicoll, B.C., Gardiner, B.A., Rayner, B., and Peace, A.J. 2006. An-chorage of coniferous trees in relation to species, soil type, androoting depth. Can. J. For. Res. 36: 1871–1883. doi:10.1139/X06-072.
Oliver, C.D., and Larson, B.C. 1996. Forest stand dynamics. Up-date edition. Wiley & Sons, New York.
Park, B.B., Yanai, R.D., Vadeboncoeur, M.A., and Hamburg, S.P.2007. Estimating root biomass in rocky soils using pits, cores,and allometric equations. Soil Sci. Soc. Am. J. 71: 206–213.
Pregitzer, K.S., King, J.S., Burton, A.J., and Brown, S.E. 2000. Re-
sponses of tree fine roots to temperature. New Phytol. 147: 105–115. doi:10.1046/j.1469-8137.2000.00689.x.
Schenk, H.J., Callaway, R.M., and Mahall, B.E. 1999. Spatial rootsegregation: are plants territorial? Adv. Ecol. Res, 28: 145–180.doi:10.1016/S0065-2504(08)60032-X.
Taberlet, P., Gielly, L., Pautou, G., and Bouvet, J. 1991. Universalprimers for amplification of three non-coding regions of chloro-plast DNA. Plant Mol. Biol. 17: 1105–1109. doi:10.1007/BF00037152. PMID:1932684.
Veresoglou, D.S., and Fitter, A.H. 1984. Spatial and temporal pat-terns of growth and nutrient uptake of five coexisting grasses. J.Ecol. 72: 259–272. doi:10.2307/2260018.
Yanai, R.D. 1992. Phosphorus budget of a 70-year old northernhardwood forest. Biogeochemistry, 17: 1–22. doi:10.1007/BF00002757.
Yanai, R.D., Park, B.B., and Hamburg, S.P. 2006. The vertical andhorizontal distribution of roots in northern hardwood stands ofvarying age. Can. J. For. Res. 36: 450–459. doi:10.1139/x05-254.
Yanai et al. 2869
# 2008 NRC Canada


