Embed Size (px)
Citation preview

DOI: 10.1126/science.1175202 , 612 (2009); 325Science
et al.Filip K. Swirski,Their Deployment to Inflammatory SitesIdentification of Splenic Reservoir Monocytes and
www.sciencemag.org (this information is current as of July 31, 2009 ):The following resources related to this article are available online at
http://www.sciencemag.org/cgi/content/full/325/5940/612version of this article at:
including high-resolution figures, can be found in the onlineUpdated information and services,
http://www.sciencemag.org/cgi/content/full/325/5940/612/DC1 can be found at: Supporting Online Material
http://www.sciencemag.org/cgi/content/full/325/5940/612#otherarticles, 9 of which can be accessed for free: cites 27 articlesThis article
http://www.sciencemag.org/cgi/content/full/325/5940/612#otherarticles 1 articles hosted by HighWire Press; see: cited byThis article has been
http://www.sciencemag.org/cgi/collection/immunologyImmunology
: subject collectionsThis article appears in the following
http://www.sciencemag.org/about/permissions.dtl in whole or in part can be found at: this article
permission to reproduce of this article or about obtaining reprintsInformation about obtaining
registered trademark of AAAS. is aScience2009 by the American Association for the Advancement of Science; all rights reserved. The title
CopyrightAmerican Association for the Advancement of Science, 1200 New York Avenue NW, Washington, DC 20005. (print ISSN 0036-8075; online ISSN 1095-9203) is published weekly, except the last week in December, by theScience
on
July
31, 2
009
www.
scie
ncem
ag.o
rgDo
wnlo
aded
from

(number of correct looks + number of incorrectlooks)] were calculated for each structure andtested against a chance level of 0, as well ascompared across groups and conditions. Second,we measured the infants’ overall accuracy (6).That is, trials were scored as correct if the infantlooked longer to the correct side within the 2 safter hearing a new item and before the start ofthe next trial. Difference scores were calculatedfor each structure as described above.
Bilinguals looked more often to the correctside for both structures during the test trials asshown by the first look analysis [AAB: t(21) =2.24, P = 0.03; ABA: t(21) = 3.76, P = 0.001;Fig. 1C, left] and by the overall accuracy analysis[AAB: t(21) = 2.14, P= 0.04; ABA: t(21) = 2.75,P = 0.01; Fig. 1C, right]. Monolinguals, by con-trast, looked more often to the correct side whenthe speech items had the structure AAB, but notwhen they had the structure ABA, as shown bythe first look analysis [AAB: t(21) = 2.37, P =0.03; ABA: t(21) = !1.48, P = 0.15] and by theoverall accuracy analysis [AAB: t(21) = 2.15,P=0.04; ABA: t(21) = !1.43, P = 0.16].
The overall analysis of variance with thefactors Group (monolingual/bilingual) and Con-dition (AAB/ABA) on difference scores for firstlooks yielded a main effect of Group [F(1,42) =4.61, P = 0.03] and, crucially, a Group ! Condi-tion interaction [F(1,42) = 5.44, P = 0.02]. Posthoc tests show that monolinguals’ performancefor the ABA structure was worse than for theAAB structure (Bonferroni P = 0.03) and worsethan the bilinguals’ performance for the ABAstructure (Bonferroni P = 0.02).
To exclude the possibility that bilinguals’advantage reflects just a better learning of con-
tingencies between sounds and locations, ratherthan their ability to learn multiple structural regu-larities, we ran an additional experiment involv-ing only monolingual infants. In experiment 2, anew group of 12-month-old monolinguals heardspeech items that differed not only in their struc-ture but also in their pitch (e.g., female voice forABA and male voice for AAB). Infants success-fully learned to predict the toy locations basedon the voices as shown by the first look analysis[female voice: t(19) = 2.60, P= 0.01; male voice:t(19) = 2.94, P = 0.008; Fig. 1C] and the overallaccuracy analysis [female voice: t(19) = 2.24,P = 0.03; male voice: t(19) = 2.59, P = 0.01,Fig. 1C]. Together, the results of these experi-ments show that, in contrast to bilinguals, mono-lingual infants cannot learn two structures, althoughthey can associate two speakers with differentlocations.
Twelve-month-old preverbal bilingual infantsthus seem to be more flexible learners of multiplestructural regularities than monolinguals. Thisflexibility might be related to different (mutuallycompatible) processes. Bilinguals might be betterat learning two structures simultaneously. Alter-natively, they might be better at avoiding inter-ference between the two structures and quicklylearn one of the structures and the correspondingtoy location. This might even help them to learnthe other structure and location. Although there isno evidence that such “reasoning by exclusion” isavailable to infants at this age, such ability mighthelp infants to bootstrap new regularities fromregularities they have already learned.
The advantage of bilinguals may be related tothe precocious development of control and selec-tion abilities, which has been documented in bi-
lingual children (7) and infants (8). These abilitiesmay allow bilinguals to take advantage of sourcesof information unavailable inmonolingual settingsand to become better at simultaneouslymonitoringdifferent structural regularities. This in turn mayhelp them to learn more efficiently each of theirlanguages. Such powerful learning abilities allowbilinguals to pass the linguistic milestones at thesame rate as monolinguals.
References and Notes1. J. F. Werker, K. Byers-Heinlein, Trends Cogn. Sci. 12, 144
(2008).2. B. Z. Pearson, S. C. Fernandez, D. K. Oller, Lang. Learn.
43, 93 (1993).3. J. Gervain, F. Macagno, S. Cogoi, M. Peña, J. Mehler,
Proc. Natl. Acad. Sci. U.S.A. 105, 14222 (2008).4. G. F. Marcus, S. Vijayan, S. Bandi Rao, P. M. Vishton,
Science 283, 77 (1999).5. Materials and methods are available as supporting
material on Science Online.6. B. McMurray, R. N. Aslin, Infancy 6, 203 (2004).7. E. Bialystok, Child Dev. 70, 636 (1999).8. A. M. Kovács, J. Mehler, Proc. Natl. Acad. Sci. U.S.A. 106,
6556 (2009).9. We thank the parents and infants who participated in the
study as well as A. D. Endress, G. Csibra, E. Téglás, andL. Bonatti for comments. We also thank the anonymousreviewers for helpful suggestions. This work was supportedby the NEST PATHFINDER initiative “What it means to behuman” (CALACEI), J. S. McDonnell Foundation, and MarieCurie 035975 DISCOS grants. Á.M.K. is currently at theHungarian Academy of Sciences and at the CentralEuropean University, Budapest, Hungary.
Supporting Online Materialwww.sciencemag.org/cgi/content/full/1173947/DC1Materials and Methods
23 March 2009; accepted 19 June 2009Published online 9 July 2009;10.1126/science.1173947Include this information when citing this paper.
Identification of Splenic ReservoirMonocytes and Their Deployment toInflammatory SitesFilip K. Swirski,1*† Matthias Nahrendorf,1* Martin Etzrodt,1,2 Moritz Wildgruber,1Virna Cortez-Retamozo,1 Peter Panizzi,1 Jose-Luiz Figueiredo,1 Rainer H. Kohler,1Aleksey Chudnovskiy,1 Peter Waterman,1 Elena Aikawa,1 Thorsten R. Mempel,1,3 Peter Libby,4,5Ralph Weissleder,1,6† Mikael J. Pittet1†A current paradigm states that monocytes circulate freely and patrol blood vessels but differentiateirreversibly into dendritic cells (DCs) or macrophages upon tissue entry. Here we show that bonafide undifferentiated monocytes reside in the spleen and outnumber their equivalents incirculation. The reservoir monocytes assemble in clusters in the cords of the subcapsular red pulpand are distinct from macrophages and DCs. In response to ischemic myocardial injury, splenicmonocytes increase their motility, exit the spleen en masse, accumulate in injured tissue, andparticipate in wound healing. These observations uncover a role for the spleen as a site for storageand rapid deployment of monocytes and identify splenic monocytes as a resource that the bodyexploits to regulate inflammation.
Protection of injured or infected tissue in-volves migratory leukocytes (1–3). Amongthem are blood monocytes, which consist
of at least two functionally distinct subsets (4, 5).
Ly-6Chigh (Gr-1+) monocytes are inflammatoryand migrate to injured (6, 7) or infected (8–10)sites but also propagate chronic diseases (11–13).Ly-6Clow (Gr-1–) monocytes patrol the resting
vasculature (14), populate normal (15) or inflam-matory sites (14), and participate in resolution ofinflammation (7).
Tissue repair after myocardial infarction(MI) requires coordinated mobilization of bothsubsets: first, Ly-6Chigh monocytes digest dam-aged tissue; second, Ly-6Clow monocytes pro-mote wound healing (7). We observed that theischemic myocardium accumulates Ly-6Chigh
monocytes in numbers that exceed their avail-ability in circulation (Fig. 1A), which intrigued
1Center for Systems Biology, Massachusetts General Hospitaland Harvard Medical School, Boston, MA 02114, USA. 2Facultyof Biology and Medicine, University of Lausanne, CH-1015Lausanne, Switzerland. 3Center for Immunology and Inflam-matory Diseases, Massachusetts General Hospital and HarvardMedical School, Charlestown, MA 02129, USA. 4CardiovascularDivision, Department of Medicine, Brigham and Women’sHospital, Boston, MA 02115, USA. 5Center for Excellence inVascular Biology, Brigham and Women’s Hospital, Boston,MA 02115, USA. 6Department of Systems Biology, HarvardMedical School, Boston, MA 02115.
*These authors contributed equally to this work.†To whom correspondence should be addressed. E-mail:[email protected] (F.K.S.); [email protected] (R.W.); [email protected] (M.J.P.)
31 JULY 2009 VOL 325 SCIENCE www.sciencemag.org612
REPORTS
on
July
31, 2
009
www.
scie
ncem
ag.o
rgDo
wnlo
aded
from

us. Although the bone marrow producesand contains numerous (pro)monocytes (16),we sought to identify compartmental reser-
voirs of extramedullary monocytes, as thesecould accommodate the demands of rapid-onset inflammation.
First, we screened candidate tissues for thepresence of monocyte-like cells (17). Monocytesexpress CD11b and CD115 and are negative or
Fig. 1. The resting spleen contains a largereservoir of bona fide monocytes. (A) Totalnumber of Ly-6Chigh and Ly-6Clowmonocytesin the infarcted myocardium and (2 ml)peripheral blood (means T SEM, n = 9 to15). Monocytes were identified as CD11bhigh,Linlow, and (F4/80, I–Ab, CD11c)low. Lin refersto the combination of CD90, B220, CD49b,NK1.1, and Ly-6G monoclonal antibodies.(B) Total monocyte number retrieved fromdifferent tissues (means T SEM, n = 3 to 5).(C) Flow cytometric analysis of blood andsplenic Ly-6Chigh and Ly-6Clow monocytes,as well as CD11b+ macrophages and DCs(Mø/DCs) (n = 5). (D) Cytospin preparationsof Ly-6Chigh and Ly-6Clow monocytes from blood and spleen. Insets indicate forward (FSC) and side (SSC) scatters identified by flowcytometry (means T SEM, n= 3). (E) Microarray analysis of Ly-6Chighmonocytes from blood and spleen. Data depict the average log2–based intensity of the same probe across four replicates. Also refer to tables S1 and S2. (F) Expression of 45 genes (by quantitativereverse transcription polymerase chain reaction) and 11 proteins (by flow cytometry) for Ly-6Chigh and Ly-6Clow monocytes in bloodand spleen (n = 4). Also refer to table S3. (G) Ex vivo phagocytosis of beads by Ly-6Chigh and Ly-6Clow monocytes and T cells (control)from blood and spleen [mean fluorescent intensity (MFI) T SEM, n = 3]. (H) In vitro differentiation of blood and splenic Ly-6Chigh andLy-6Clow monocytes to macrophages (F4/80high) and DCs (CD11chigh) in response to macrophage colony-stimulating factor (M-CSF)and granulocyte-macrophage CSF (GM-CSF) + interleukin-4 (IL-4), respectively (MFI T SEM, n = 3 to 9). Data pool at least threeindependent experiments [(A) and (H)], or are from one experiment representative of at least three independent experiments [(C)and (D)].
Fig. 2. Splenicmonocytes cluster in thesubcapsular red pulp. (A) Histogramsdepict flow cytometric analysis of GFPfluorescence of splenic leukocytes inCx3cr1gfp/+ mice (n = 3). The pie chartshows the relative proportions of variousGFP+ populations. Also refer to figs. S2and S3. (B and C) Multiphoton micros-copy micrographs of Cx3cr1gfp/+ miceshow GFP+ Mø/DCs (green) in themarginal zones (B) and GFP+monocytes(green) in the subcapsular red pulp (C).Collagen fibers appear in blue. (D) Asingle optical section shows GFP+mono-cytes (green) in the subcapsular redpulp. The dense collagen network (blue)of the splenic capsule indicates theboundary of the organ. (E) An intravitalmicrograph of the spleen subcapsularred pulp shows GFP+ monocytes (green)organized in clusters and topographi-cally distinct from blood vessels (red). Alldata are from one experiment represent-ative of at least two independent experiments.
www.sciencemag.org SCIENCE VOL 325 31 JULY 2009 613
REPORTS
on
July
31, 2
009
www.
scie
ncem
ag.o
rgDo
wnlo
aded
from

low for CD90, B220, CD49b, NK1.1, and Ly-6Gsurface proteins. They are distinct from macro-phages and dendritic cells (DCs) on the basis ofthe F4/80 glycoprotein, CD11c, and major histo-compatibility complex molecule I–Ab. Of all or-gans profiled, only the spleen contained cells thatmet these criteria and that were present in largequantities. The population included Ly-6Chigh andLy-6Clow subtypes in ratios similar to those in theblood (Fig. 1, B and C, and fig. S1).
The spleen's major known functions areremoval of aging erythrocytes and recycling ofiron, elicitation of immunity, and supply oferythrocytes after hemorrhagic shock (18). Thepresence of numerous monocytes in the spleenseems paradoxical, because monocytes are dis-tinguished from lineage descendants on the basisof residency: Monocytes are considered circulat-ing, whereas macrophages and DCs are tissue-resident and predominantly sessile (5, 14, 19).
We therefore conducted additional experimentsto characterize the monocyte-like cells in thespleen.
We found that splenic monocytes resem-bled their blood counterparts morphologically:Ly-6Chigh monocytes were larger than Ly-6Clow
monocytes, and both subsets had kidney- orhorseshoe-shaped nuclei (Fig. 1D). Ly-6Chigh
monocytes in blood and spleen had essentiallyindistinguishable transcriptomes (Fig. 1E andtables S1 and S2). Refined mRNA and proteinanalysis validated this similarity (Fig. 1F), al-though, as expected, Ly-6Chigh monocytes dif-fered from their Ly-6Clow counterparts (5) (Fig. 1Fand table S3). Splenic Ly-6Chigh and Ly-6Clow
monocytes had phagocytic functions similar tothose of their blood counterparts (Fig. 1G) anddifferentiated comparably into macrophages orDCs in vitro (Fig. 1H). We therefore concludedthat the spleen contains a population of bona fide
monocytes that coexists with, but is differentfrom, macrophages and DCs and that outnum-bers blood monocytes.
To determine where monocytes reside inthe spleen, we used Cx3cr1
gfp/+ mice in whichnearly all fluorescent splenocytes are monocytesor their lineage descendents (Fig. 2A and figs.S2 and S3). We detected dense populations ofgreen fluorescent protein–positive (GFP+) cellsin two regions, the marginal zone and the sub-capsular red pulp. As expected, cells in the mar-ginal zone were mostly macrophages and DCs(18): They were large and morphologicallyirregular; F4/80high or CD11chigh, respectively;and localized around the white pulp (Fig. 2B,fig S3, and movie S1). The fluorescent cells inthe subcapsular red pulp were mostly mono-cytes: They were devoid of dendrites; hadkidney- or horseshoe-shaped nuclei; wereCD11b+ and F4/80–/low but CD11c–; and were
Fig. 3. Splenic reservoir monocytesemigrate from the subcapsular redpulp and populate inflammatorysites. (A) Splenic sections from micewithout MI and 1 day after MIstained with hematoxylin and eosin.(B) Splenic sections stained withCD11b-specific antibodies (red) and4!,6!-diamidino-2-phenylindole (DAPI)(blue) depict the subcapsular redpulp and the marginal zone frommice without MI and 1 day afterMI. (C) Enumeration of CD11b+ cellsin the subcapsular red pulp andmarginal zone (means T SEM, n =10 high-power fields). (D) Totalnumber of monocytes in the spleen,blood, or bone marrow (tibia) incontrol mice (no MI) or 1 day afterMI (means T SEM, n = 6 to 15). (E)Total number of monocytes in thespleen or blood in wild-type (WT)and Ccr2–/– mice in response to MI(n = 3 to 6). (F) Total number ofblood monocytes in splenecto-mized animals (–Spleen) and sham-operated controls (+Spleen) withoutMI or 1 day after MI (n = 3 to 6). (Gand H) Accumulation of cells inheart in the same groups of miceas measured by flow cytometry [(G),n = 3] or by counts per mg tissue[(H), means T SEM, n = 9]. (I) Accu-mulation of monocyte subsets orig-inating exclusively from spleen asmeasured by flow cytometry. Dotplots (CD45.1 versus CD45.2) ofgated monocytes and histograms(Gr-1) of each positive population.(J) CD45.1 versus CD45.2 profile ofgated monocytes in a mouse receiv-ing a control transplant (pancreas)and in a mouse not subjected to MI. Also refer to fig. S7. (K) FMT-MRI of in vivophagocytic and proteolytic activities in infarcts. Fluorochrome concentration isshown in the infarcted area, on the basis of MRI-derived anatomy (n = 6). FI,
fluorescence intensity. *P < 0.05; **P < 0.005. Data pool at least three indepen-dent experiments (D to F, and H), or are from one experiment representative oftwo [(I) and (J)] or at least three independent experiments [(A) to (C), and (G)].
31 JULY 2009 VOL 325 SCIENCE www.sciencemag.org614
REPORTS
on
July
31, 2
009
www.
scie
ncem
ag.o
rgDo
wnlo
aded
from

arranged in clusters of ~20 to 50 cells along theperimeter of the organ (Fig. 2, C to E, fig. S3,and movies S2 and S3). They clustered mostlyin the reticular fiber–rich pulp cords, just as iron-recycling CD163+ macrophages do (20) (fig.S3). Also, intravital microscopy and parabiosisexperiments revealed that splenic monocytesresided in the spleen, rather than simply passedthrough the spleen within blood (fig. S4 and S5).
A hallmark of a reservoir population is itsability to deploy to distant sites. Thus, we testedwhether splenic Ly-6Chigh monocytes are mobi-lized in response to surgically induced ischemiaof the myocardium. One day after coronary liga-tion, we observed reduced numbers of monocytes
in the subcapsular red pulp of the spleen (Fig. 3, Ato C) that could not be attributed to local celldifferentiation or death (fig. S6) and, therefore,indicated exit. Entire organ enumeration after MIrevealed monocyte loss in spleen, gain in blood,but no change in the bonemarrow (Fig. 3D and fig.S6), which suggested mobilization of splenic, butnot bone marrow, monocytes after tissue injury.
We next compared the relative contributionsof the spleen and the bone marrow in response toMI by using mice in which only one of the twotissues can contribute monocytes. First, we eval-uated Ccr2–/– mice, because the chemokine re-ceptor mediates monocyte mobilization from thebone marrow (9, 21), but not from the spleen
(table S4). The number of blood monocytes com-parably increased—and the number of splenicmonocytes comparably decreased—after MI inboth wild-type and Ccr2–/– mice (Fig. 3E). Thereleased monocytes in Ccr2–/–mice did not accu-mulate in the ischemic myocardium, becauseinfiltration depends on the chemokine CCR2[table S4 and (7)]. Second, we evaluated animalssplenectomized by a procedure that preserves thebonemarrow and bloodmonocyte pools (fig. S7).After MI, blood monocyte numbers increased incontrol, but not splenectomized, animals (Fig.3F). Analysis of the ischemic myocardium re-vealed a massive influx of Ly-6Chigh monocytesin mice containing the spleen. However, this
Fig. 4. Ang II–AT-1 receptor signaling promotes splenic monocyte motilityand tissue emigration. (A) Percentage of monocytes lost from the spleen 1 dayafter MI or Ang II infusion in WT and Atgr1a–/–mice (means T SEM, n = 4 to 9).(B) Serum Ang II concentrations in the steady-state (control), and 1 day afterMI or infusion of Ang II (n = 6 to 9). (C) Total number of splenic monocytes(Ly-6Chigh and Ly-6Clow) in the groups of mice mentioned above. (D) Western blotanalysis of monomeric and dimeric forms of the AT-1 receptor on controlsplenic monocytes in the steady state (control), and 1 day after MI or infusionof Ang II, n = 3. (E) In vitro migration of splenic monocytes in response to AngII (1 mM) (means T SEM, n = 6). (F) Intravital microscopy of GFP+ cells (green)in the spleen subcapsular red pulp of an Ang II–treated Cx3cr1gfp/+ mouse.Images show a splenic monocyte, an Mø or DC, and a patrolling monocyte.Blood is shown in red. Tracks indicate the position of cell centroids at 15-s
intervals (time in min:s). (G) (Top) Intravital micrographs of GFP+ cells incontrol mice and 1 day after MI or infusion of Ang II at the initial recordingtime point. (Bottom) Tracks for all GFP+ cells in the field of view and over1 hour. Some cells entered or exited our imaging area during the recordingand thus were followed for a shorter duration. V, vessel; P, parenchyma. (H)Average displacement over time of all GFP+ splenic monocytes [means T SEM,n = 143 (control), 163 (MI), and 125 (Ang II) cells]. (I) Displacement over timeof single splenic monocytes (left), splenic macrophages of DCs (middle), andpatrolling monocytes (right). (J ) Recording of a departing splenic monocyte.Tracks indicate the position of the cell centroid. *P < 0.05, **P < 0.01, ***P <0.001. Data pool two [(A) to (C), and (E)] or at least three independentexperiments [(H) and (I)], or are from one experiment representative of at leastthree independent experiments [(D), (F), and (G)].
www.sciencemag.org SCIENCE VOL 325 31 JULY 2009 615
REPORTS
on
July
31, 2
009
www.
scie
ncem
ag.o
rgDo
wnlo
aded
from

number was decreased by 75% in splenecto-mized mice (Fig. 3, G and H). These findingsindicate that the spleen mobilizes monocytes enmasse afterMI. Similar observations in rats arguefor a generalizable existence of a splenic mono-cyte reservoir (fig. S8).
To track unambigously the fate of monocytesfrom the spleen to the heart, we studied CD45.1mice that were splenectomized, given CD45.2spleens by transplantation, and subjected to MI(fig. S9). We observed increased numbers ofdonor monocytes in the blood of animals afterMI, which indicated that the injury triggered therelease of splenic monocytes (fig. S10). Theinfarct accumulated donor (i.e., spleen-derived)and host monocytes, all of which were Gr-1+
(Ly-6Chigh) (Fig. 3I). The transplantationprocedure itself reduced the number of reservoirdonor monocytes by a factor of 6.1, likely be-cause of ischemia-related cell differentiation.Correcting for this, we calculated that the spleencontributed 41% of monocytes to the ischemicmyocardium. Control experiments (transplantedpancreas or transplanted spleen but no MI)showed no accumulation of donor monocytes inthe recipient heart (Fig. 3J). Noninvasive fluo-rescence molecular tomography–magnetic reso-nance imaging (FMT-MRI) three-dimensionalfusion imaging (22) with phagocytosis andcathepsin-activatable sensors (23) revealed atten-uated activities in infarcts of splenectomized mice(Fig. 3K), which indicates that splenic monocytesare biologically activewhen recruited to inflamedtissue. Thus, the spleen stores Ly-6Chigh mono-cytes readily recruitable to augment inflammationat distant sites. The spleen does not likely producemonocytes, because donor spleens contained onlyhost-derived cells as early as 3 weeks after trans-plantation (fig. S11).
The spleen did not contribute neutrophilssignificantly, which suggested selective mo-bilization of monocytes (fig. S12). Of these, bothsubsets (Ly-6Chigh and Ly-6Clow) exited the spleenin response to MI, yet after 1 day, the ischemicmyocardium recruited Ly-6Chigh monocytes selec-tively (fig. S13). The excluded Ly-6Clowmonocytesmay have dispersed to other tissues, patrolled thevasculature, or accumulated in the infarct at a latertime (7).
Monocytes express a wide variety of recep-tors (24), some of which may trigger splenicrelease. We focused on angiotensin II (Ang II),because (i) it induces cytoskeletal rearrangementand migration of monocytes in vitro (25), (ii) itaugments monocyte-mediated inflammation(26), and (iii) its serum levels increase after MI(27). Ang II exerts its effects by binding to theangiotensin type 1 (AT-1) and AT-2 receptors.
Atgr1a–/– animals subjected to MI did notexpel splenic monocytes efficiently (Fig. 4A) andaccumulated only a few monocytes in theischemicmyocardium (fig. S14), which indicatedthat Ang II–AT-1 signaling contributes to expul-sion in this model. Sustained exogenous admin-istration of Ang II in wild-type mice reproduced
monocyte egress; mice with Ang II concentra-tions comparable to those after MI (Fig. 4B)released splenic monocytes (Fig. 4C and fig.S15). Moreover, Ang II infusion or MI elicitedAT-1 receptor dimerization in splenic monocytesin vivo (Fig. 4D), an event that stimulates a widespectrum of intracellular responses (26). We alsofound that Ang II induced directional migrationof splenic monocytes in vitro (Fig. 4E). Thesedata support a direct link between Ang II, the AT-1receptor, and splenic monocytes and prompted usto explore the effects of Ang II on cell behaviorin vivo.
We developed a real-time intravital microsco-py technique that allows observation of endoge-nous monocytes and vessels in the subcapsularred pulp of the spleen in live animals, at depths upto 100 mm below the fibrous capsule, while pre-serving organ temperature and blood flow.Spleens of Cx3cr1
gfp/+ mice contained threedistinct GFP+ populations, based on their locationand size (Fig. 4F, fig. S16, and movies S4 to 6).Real-time tracking of GFP+ cells in cluster-richregions of the subcapsular red pulp revealedbehavioral changes shortly after MI or after ad-ministration of Ang II (Fig. 4G). Splenic mono-cytes increased their displacement over time bymore than threefold within 2 hours after eitherintervention (Fig. 4, G to I, movies S7 to 9 andfig. S17), which indicated that Ang II inducedtheir migration in vivo. Conversely, splenic mac-rophages or DCs showed very low displacementthat did not increase in response to intervention,whereas patrolling monocytes showed typicallyhigh displacement (Fig. 4I), as reported in dermaland mesenteric vessels (14). The motile splenicmonocytes that responded to Ang II were morelikely to encounter neighboring venous sinuses orcollecting veins and to enter the blood stream toexit the spleen. Figure 4J andmovie S10 show oneexample of a prototypical departing monocyte.The increased motility of splenic monocytes andsubsequent egress led to a considerable loss offluorescent cells in tissue (fig. S15).
Splenic contraction after hemorrhagic shockis associated with erythrocyte expulsion (28).Our intravital microscopy data show, however,that the subcapsular red pulp did not measurablycontract when monocytes were already activated1.5 hours after treatment withAng II (fig. S18). Acontraction-induced mechanism would also af-fect other leukocytes, but our neutrophil dataindicate otherwise.
Our findings illuminate the body's ability tomobilize a reservoir of undifferentiated splenicmonocytes in response to injury. Triggering ofthis reservoir likely provides a stochastic advan-tage for rapid monocyte accumulation, but suchtriggering is not necessarily desirable. Futurestudies should investigate the contribution of thesplenic monocyte population in response to otherinflammatory events and whether additional fac-tors control monocyte migration, organization,and differentiation in the splenic environment.Understanding how an organism controls the
quality and quantity of its immune players isessential to understanding homeostasis, and itsperturbation and restoration following infectionand tissue injury.
References and Notes1. A. D. Luster, R. Alon, U. H. von Andrian, Nat. Immunol.
6, 1182 (2005).2. K. Ley, C. Laudanna, M. I. Cybulsky, S. Nourshargh,
Nat. Rev. Immunol. 7, 678 (2007).3. A. J. Singer, R. A. Clark, N. Engl. J. Med. 341, 738
(1999).4. C. Auffray, M. H. Sieweke, F. Geissmann, Annu. Rev.
Immunol. 27, 669 (2009).5. S. Gordon, P. R. Taylor, Nat. Rev. Immunol. 5, 953
(2005).6. L. Arnold et al., J. Exp. Med. 204, 1057 (2007).7. M. Nahrendorf et al., J. Exp. Med. 204, 3037
(2007).8. I. R. Dunay et al., Immunity 29, 306 (2008).9. N. V. Serbina, E. G. Pamer, Nat. Immunol. 7, 311
(2006).10. C. Sunderkotter et al., J. Immunol. 172, 4410
(2004).11. F. K. Swirski et al., J. Clin. Invest. 117, 195 (2007).12. F. Tacke et al., J. Clin. Invest. 117, 185 (2007).13. A. Mantovani, P. Allavena, A. Sica, F. Balkwill,
Nature 454, 436 (2008).14. C. Auffray et al., Science 317, 666 (2007).15. F. Geissmann, S. Jung, D. R. Littman, Immunity 19, 71
(2003).16. R. van Furth, Z. A. Cohn, J. Exp. Med. 128, 415
(1968).17. Materials and methods are available as supporting
material on Science Online.18. R. E. Mebius, G. Kraal, Nat. Rev. Immunol. 5, 606
(2005).19. D. M. Mosser, J. P. Edwards, Nat. Rev. Immunol. 8, 958
(2008).20. M. Kristiansen et al., Nature 409, 198 (2001).21. C. L. Tsou et al., J. Clin. Invest. 117, 902 (2007).22. R. Weissleder, M. J. Pittet, Nature 452, 580
(2008).23. M. Nahrendorf et al., Circ. Res. 100, 1218 (2007).24. R. Medzhitov, Nature 454, 428 (2008).25. U. Kintscher et al., Hypertension 37, 587 (2001).26. S. AbdAlla, H. Lother, A. Langer, Y. el Faramawy,
U. Quitterer, Cell 119, 343 (2004).27. H. M. McAlpine, S. M. Cobbe, Am. J. Med. 84, 61
(1988).28. B. N. Davies, P. G. Withrington, Pharmacol. Rev. 25, 373
(1973).29. This work was supported in part by NIH grants U01
HL080731, P50 CA86355, R24 CA69246, U54CA126515, and P01 A154904 (to R.W.), MGH-Center forSystems Biology (to M.J.P.), AHA SDG 0835623D (toM.N.), and NIH grant 1R01HL095612 (to F.K.S). Theauthors thank U. von Andrian for critical assessment ofthe manuscript; A. Luster for providing Ccr2–/– mice; D.Erle, A. Barcak, and C. Eisley for microarray hybridizationand data analysis; M. Waring for sorting cells; A.Moseman for helpful discussion and feedback withparabiosis experiments; and A. Newton, C. Siegel,N. Sergeyev, and Y. Iwamoto for technical assistance.MIAME (minimum information about a microarrayexperiment)–compliant expression data have beendeposited under accession no. GSE14850. This work isdedicated to the memory of Marc-Henri Pittet.
Supporting Online Materialwww.sciencemag.org/cgi/content/full/325/5940/612/DC1Materials and MethodsFigs. S1 to S18Tables S1 to S4ReferencesMovies S1 to S10
20 April 2009; accepted 10 June 200910.1126/science.1175202
31 JULY 2009 VOL 325 SCIENCE www.sciencemag.org616
REPORTS
on
July
31, 2
009
www.
scie
ncem
ag.o
rgDo
wnlo
aded
from

www.sciencemag.org/cgi/content/full/325/5940/612/DC1
Supporting Online Material for
Identification of Splenic Reservoir Monocytes and Their Deployment to Inflammatory Sites
Filip K. Swirski,* Matthias Nahrendorf, Martin Etzrodt, Moritz Wildgruber, Virna Cortez-Retamozo, Peter Panizzi, Jose-Luiz Figueiredo, Rainer Kohler, Aleksey Chudnovskiy, Peter Waterman, Elena Aikawa, Thorsten R. Mempel,
Peter Libby, Ralph Weissleder,* Mikael J. Pittet*
*To whom correspondence should be addressed. E-mail: [email protected] (F.K.S.), [email protected] (R.W.), or [email protected] (M.J.P.)
Published 31 July 2009, Science 325, 612 (2009)
DOI: 10.1126/science.1175202
This PDF file includes
Materials and Methods Figs. S1 to S18 Tables S1 to S4 References
Other Supporting Online Material for this manuscript includes the following: (available at www.sciencemag.org/cgi/content/full/325/5940/612/DC1)
Movies S1 to S10

SUPPORTING ONLINE MATERIAL
Materials and MethodsAnimals. C57BL/6J, B6.129P-Cx3cr1tm1Litt/J (Cx3cr1gfp/gfp), B6.129S4-Ccr2tm1Ifc/J (Ccr2–/–), B6.SJL-PtprcaPep3b/BoyJ (CD45.1+) and B6.129P2-Agtr1atm1Unc (At-1–/–) female mice (all from Jackson Laboratories) were used in this study. Cx3cr1gfp/+ mice were obtained by breeding Cx3cr1gfp/gfp mice with C57BL/6J mice. Cx3cr1gfp/+ mice have one Cx3cr1 allele replaced with cDNA encoding Egfp, and can be used to track monocytes (1). Mice were 8-12 weeks old, except Ccr2–/– which were 1 year old (spleens of young Ccr2–/– mice are very small). Female Wistar rats were ~230 g (from Jackson Laboratories).
Cells. Peripheral blood was drawn via cardiac puncture with citrate solution (100 mM Na-citrate, 130 mM glucose, pH 6.5) as anti-coagulant and mononuclear cells were purified by density centrifugation. Total blood leukocyte numbers were determined using acetic acid lysis solution (3% HEMA 3 Solution II, 94% ddH2O, 3% glacial acetic acid). After organ harvest, single cell suspensions were obtained from brain, gut, heart, kidney, liver, lung, muscle and pancreas by digestion with a cocktail of 450 U/ml collagenase I, 125 U/ml collagenase XI, 60 U/ml DNase I and 60 U/ml hyaluronidase (Sigma-Aldrich, St. Louis, MO) for 1 h at 37°C while shaking. Some spleens were also prepared with the digestion cocktail. Total viable cell numbers were determined using Trypan Blue (Cellgro, Mediatech, Inc, VA).
Flow Cytometry. Anti-CD90-PE, anti-CD90-FITC, 53-2.1 (BD Biosciences); anti-B220-PE, anti B220-FITC, RA3-6B2 (BD Biosciences); anti-CD49b-PE, anti CD49b-FITC, DX5 (BD Biosciences); anti-NK1.1-PE, anti-NK1.1-FITC, PK136 (BD Biosciences); anti-Ly-6G-PE, anti-Ly-6G-FITC, 1A8 (BD Biosciences); anti-CD11b-APC, M1/70 (BD Biosciences); anti-CD11b-PE (ED8) (Abcam); anti-CD11b-APC-Cy7 M1/70 (BD Biosciences); anti-F4/80-biotin, anti-F4/80-FITC, C1:A3-1 (BioLegend); anti-CD11c-biotin, anti-CD11c-FITC, anti-CD11c-APC, HL3 (BD Biosciences); anti-I-Ab-biotin, anti-I-Ab-FITC, AF6-120.1 (BD Biosciences); anti-Ly-6C-FITC, anti-Ly-6C-biotin, AL-21 (BD Biosciences); anti-CD43-FITC, S7 (BD Biosciences); anti-CD62L-FITC, MEL-14 (BD Biosciences); anti-CD68-FITC, FA-11 (AbD Serotec); anti-CD86-biotin, GL1 (BD Biosciences); anti-CD115-PE, 604B5-2E11 (AbD Serotec); anti-Mac-3-FITC, M3/84 (BD Biosciences); anti-Gr-1-PeCy7, RB6-8C5 (BD Biosciences); anti-CD45.2-FITC 104 (BD Biosciences); anti-CD45.1-biotin A20 (BD Biosciences); anti-CD45.1-APC A20 (BD Biosciences) were used for flow cytometric analyses in this study. Strep-PerCP (BD Biosciences) was used to label biotinylated antibodies. Monocytes were identified as CD11bhigh (CD90/B220/CD49b/NK1.1/Ly-6G)low (F4/80/I-Ab/CD11c)low
Ly-6Chigh/low. Macrophages/DCs were identified as CD11bhigh (CD90/B220/CD49b/NK1.1/Ly-6G)low (F4/80/I-Ab/CD11c)high Ly-6Clow or on the basis of F4/80 or CD11c expression only. Neutrophils were identified as CD11bhigh (CD90/B220/CD49b/NK1.1/Ly-6G)high (F4/80/I-Ab/CD11c)low Ly-6Cint. Monocyte and macrophage/DC numbers were calculated as total cells multiplied by percent cells within the monocyte/macrophage gate. Within this population, monocyte subsets were identified as (F4/80/I-Ab/CD11c)low and either Ly-6Chigh or Ly-6Clow. For calculation of total cell numbers in tissue, normalization to weight of tissue was performed. Data were acquired on an LSRII (BD Biosciences) and analyzed with FlowJo v.8.5.2 (Tree Star, Inc.). Cells were sorted on a BD FACSAria (BD Biosciences). For morphologic characterizations, sorted cells were prepared on slides by cytocentrifugation (Shandon, Inc.) at 10 g for 2 min, and stained with HEMA-3 (Fischer Scientific). For gene profiling studies, blood and spleens of 5 to 10 mice were pooled for each replicate. Splenic monocytes were enriched by lineage depletion using MACS LD columns (Miltenyi) and PE–conjugated antibodies against B220, CD49b, NK1.1, Ly-6G, CD90 and Ter-119 followed by anti-PE magnetic beads (Miltenyi). Lineage-depleted cells were further stained with specific antibodies to allow for phenotypic identification of monocyte subsets. Monocytes from blood were stained and sorted
without prior enrichment.
Microarray gene expression profiling. Monocyte subsets from blood and spleen of a group of four mice were isolated by fluorescence activated cell sorting (FACS) as CD11bhigh (CD90/B220/CD49b/NK1.1/Ly-6G)low (F4/80/I-Ab/CD11c)low Ly-6Chigh cells. To avoid e!ects of lengthy staining protocols on the transcriptome of the cells of interest we developed a protocol that allowed sorting of cell subsets into RNA lysis bu!er within ~30 min after the animals were sacrificed. Briefly, heparin-blood was drawn from anesthetized mice by cardiac puncture and spleens were immediately homogenized through a nylon mesh into 3 ml of PBS. "e volume of the heparinized blood was adjusted with PBS to 1 ml of blood and the antibody mix was added. Similarly the antibodies were added to 1 ml of the splenocyte suspension. Staining was performed for 10 min, samples were diluted by addition of 1 ml PBS, immediately loaded onto 2 ml histopaque, and spun for 10 min at 18 g, 22°C. "e interphase was collected and diluted into one volume of sorting bu!er containing PBS, 2% FCS and 2 mM EDTA. Cells were FACS-sorted without delay. "e protocol neither imposed cell pelleting, extend dwelling on ice, nor induced major osmotic stress. Both preparations of blood and splenic monocytes were performed for each animal simultaneously and under the same conditions. Samples of 1,000 Ly-6Chigh blood and Ly-6Chigh splenic monocytes were collected directly into 20 µl lysis bu!er of the PicoPure RNA isolation kit (Arcturus). Sorting times varied between 2 and 10 min. RNA extraction was subsequently performed according to the manufacturer’s instructions (Arcturus). RNA quality was assessed using RNA pico lab chips on the Agilent Bioanalyzer. For all samples a RIN above 8 could be achieved. On average 1,000 cells yielded 200 pg total RNA. All further steps were performed at the UCSF Shared Microarray Core Facilities according to standard protocols (http://www.arrays.ucsf.edu and http://www.agilent.com). RNA was amplified using the NuGen WT-Ovation Pico System, and the amplified cDNA was labeled using the FL-Ovation cDNA Fluorescent Module (NuGen Technologies, San Carlos, Ca). Briefly, input total RNA was reverse–transcribed into cDNA and then amplified using a linear isothermal amplification process (SPIA). "e amplified products were CY-3 labeled and fragmented according to manufacturer’s guidelines. Labeled cDNA was assessed using the Nanodrop ND-100 (Nanodrop Technologies, Inc., Wilmington DE) and the Agilent 2100 Bioanalyzer; equal amounts of Cy3-labeled target were hybridized to Agilent whole mouse genome 4x44K Ink-jet arrays. Hybridizations were performed for 14 h according to the manufacturers protocol. Arrays were scanned using the Agilent microarray scanner and raw signal intensities were extracted with their Feature Extraction v9.1 software. "e data set was normalized using the quantile normalization method (2). No background subtraction was performed, and the median feature pixel intensity was used as the raw signal before normalization. "e moderated t-statistic and false discovery rate for each gene of comparison between blood and spleen were calculated. Adjusted p-values were produced according to the Holm-Bonferoni method (3). All procedures were carried out using functions in the LIMMA software package of the Bioconductor Project (www.bioconductor.org). MIAME compliant expression data have been deposited under the accession GSE14850.
Real-time PCR reactions of preselected genes. For phenotypic di!erentiation of monocyte subsets by expression analysis we designed a TaqMan custom low–density array (Applied Biosystems) comprising 45 genes of interest and three endogenous control genes for quality controls purposes (Table S3). "e technical details of the procedure can be found here: http://www3.appliedbiosystems.com/cms/groups/mcb_marketing/documents/generaldocuments/cms_040595.pdf. RNA was extracted from FACS-sorted monocyte subsets using the RNAeasy mini Kit (Qiagen). Typically, 250,000 monocytes of each subset were obtained from pooled blood and spleen samples of 10-15 mice. 250,000 cells yielded 100-250
1

ng RNA in a volume of 35 µl. RNA yield and integrity were assessed with a NanoDrop spectralphotometer (!ermo-Scientific) and an Agilent Bioanalyzer (Agilent) using the eukaryotic RNApico lab chip. Only samples with a RNA integrity number of above 7 were used for further processing. For low density array profiling, real time PCR cDNA was generated from 50 ng or 100 ng of RNA per sample by reverse transcription (RT) using multiplex RT pools (Applied Biosystems) according to the manufacturer’s protocol. !e cDNA was then applied to the micro-fluidic card and real time PCR was performed on a 7900HT real time PCR machine (Applied Biosystems). Cycle threshold (Ct) values (auto thresholding) of the real time PCR readouts were compared among subsets derived from blood and spleen. Four independent replicates of each subset and from each organ were used for analysis. We used the Global Pattern Recognition (GPR) and geNorm algorithms to compare gene expression between groups. GPR detects significant changes in gene expression by multiple gene normalization, which does not require or assume constant level of expression of a single normalizer gene (i.e., ‘housekeeping gene’). By comparing the expression of each gene to every other gene in the array, a global pattern is established, and significant changes are identified and ranked (4). !e geNorm algorithm implemented in the GPR program was used to calculate fold changes of gene expression based on the geometrical mean of a group of 10 best normalizers identified by GPR. Taken together, gene expression could be compared by two means: (i) ranking scores determining the significance of a di"erence in gene expression among the groups compared and (ii) by a reliable determination method of fold-changes in gene expression. Based on these readouts a gene was considered to be di"erentially expressed when it had been scored by GPR and showed a fold change >2.
In vitro phagocytosis. FACS-sorted monocytes from blood and spleen were incubated for 4 h with latex beads at a 1/10 cell/bead ratio (yellow-green latex beads, 2.5 µm, Sigma) in 200µl RPMI 1640 (Mediatech, Inc, VA) in a 96-well plate (100K/well) (Costar, Corning Inc, NY).
In vitro di!erentiation. FACS-sorted Ly-6Chigh and Ly-6Clow monocytes from blood and spleen were treated either with M-CSF (0.02 µg/ml) or GM-CSF (0.5 µg/ml) and IL-4 (0.2 µg/ml) in RPMI 1640 medium (Cellgro, Mediatech, Inc, VA) supplemented with 10% FCS (Valley Biomedical, Inc.), 50 µM 2-Mercaptoethanol (Cellgro, Mediatech, Inc, VA) and 100 U/ml Penicillin-Streptomycin (Cellgro, Mediatech, Inc, VA). Cells (105) were plated in triplicate in 96-well round-bottom plates (Costar, Corning Inc, NY) and cultured in a humidified incubator at 37°C, 5% CO2. !e medium was replaced every second day to keep the growth factors fresh. Cells were harvested at day 7, and expression of the cell surface markers F4/80 and CD11c was determined by staining for 30 min with anti-F4/80-biotin, C1:A3-1 (AbD Serotec) and anti-CD11c-APC, HL3 (BD Biosciences); Strep-PerCP (BD Biosciences) labeled the biotinylated antibody.
Histology. Histology of spleens was assessed for the following groups: wild type C57BL/6 mice, wild type mice 1 day after MI, wild type mice 1 day after Ang II, Cx3cr1gfp/+ mice, Cx3cr1gfp/+ mice 1 day after MI, and Cx3cr1gfp/+ mice 1 day after Ang II. Spleens were excised, rinsed in PBS and embedded in OCT (Sakura Finetek). Fresh-frozen serial 6 µm thick sections were used for overall histological analysis and immunofluorescence staining. Hematoxylin and eosin staining was used to identify red and white pulps. Sections were incubated with anti-CD11b, M1/70 (BD Pharmingen); anti-F4/80, A3-1 (Abcam); anti-CD11c, 3.9 (Abcam); anti-neutrophil, NIMP-R14 (Santa Cruz Biotechnology, Inc); anti-CD163, G-17 (Santa Cruz Biotechnology, Inc); or anti-CD49b, Hal/29 (BD Pharmingen) antibodies followed by an appropriate biotinylated secondary antibody, and texas red-conjugated streptavidin (GE Healthcare). DAPI (Vector Laboratories) was used to identify cell nuclei. Negative controls were obtained by incubating tissue sections with the corresponding secondary antibodies only. Cell numbers were quantified using IPLab (version 3.9.3; Scanalytics, Inc., Fairfax, VA) and signal intensities were calculated using ImageJ (version 1.38x).
Parabiosis. Surgical gloves and autoclaved sterilized instruments were used. Animals were kept warm with a heating pad. Mice were weight-matched. We administered analgesia (buprenorphine 0.05-0.2 mg/kg) 30 minutes before surgery. Mice were anesthetized with isoflurane (2%/2L) and joined by a technique adapted from Bunster and Meyer (5). After shaving the corresponding lateral aspects of each mouse, matching skin incisions were made from behind the ear to the tail of each mouse, and the subcutaneous fascia was bluntly dissected to create about # cm of free skin. !e olecranon and knee joints were attached by a mono-nylon 5.0 (Ethicon, Albuquerque, NM), and the dorsal and ventral skins were approximated by continuous suture. In some experiments, after an interval of several weeks, parabiosed mice were surgically separated by a reversal of the procedure. Percent chimerism was defined for gated monocytes as %CD45.1 / (%CD45.1 + %CD45.2) in CD45.2 mice, and as %CD45.2 / (%CD45.2 + %CD45.1) in CD45.1 mice.
Myocardial infarction. Mice or rats were anesthetized with gas anesthesia (isoflurane 2% / 2L O2), and intubated and ventilated with an Inspira Advanced Safety Single Animal Pressure/Volume Controlled Ventilator (Harvard Apparatus, Holliston, MA). !e chest wall was shaved and left thoracotomy was performed in the 4th left intercostal space. !e left ventricle was visualized and the left coronary artery was permanently ligated with monofilament nylon 8-0 sutures (Ethicon, Somerville, NJ) at the site of its emergence from under the left atrium. !e chest wall was closed with 7-0 nylon sutures and the skin was sealed with superglue. Notably, for mice used in this study, the infarcts were of small to moderate size (~15% in delayed enhancement MRI) and therefore did not alter blood pressure or cardiac output. We measured cardiac index in infarcted and non-infarcted mice using gated high field cardiac MRI volumetry as described previously (6). Cardiac index was not changed on day 1 after coronary ligation: MI 780 ± 53 ml/min*kg, no MI 792 ± 94 ml/min*kg, n=6 per group.
Splenectomy. During isoflurane anesthesia, the abdominal cavity of mice was opened and the spleen vessels were cauterized. !e spleen was carefully removed and placed in cold PBS solution. For control experiments, the abdomen was opened, but the spleen was not removed. In rats, splenic vessels were ligated with 7-0 sutures.
Spleen transplant. A pictorial representation of the procedure is shown in Figure S7. Spleen donor mice (CD45.2) were anesthetized with a subcutaneous injection of ketamine (90 mg/kg) and xylazine (10 mg/kg), followed by an intravenous injection of 200 units of heparin (American Pharmaceutical, Schaumburg, Il). !e complete inhibition of clotting ensures that no vascular or intrasplenic thrombosis occurs. In deep anesthesia, the thorax was then opened and the right atrium incised to allow blood to exit during perfusion. Over a period of 5 minutes, the entire mouse was then perfused with a total of 20 ml of normal saline through a cannula inserted into the apex of the left ventricle. At the end of this procedure, fluid exiting the right atrium was clear which indicated thorough removal of the donor blood. !e abdomen of the donor was then opened with a longitudinal incision. !e pancreas, the spleen and the abdominal vasculature in the epigastric region were visualized. Small vessels between the pancreas and the intestine were ligated with 6.0 cotton (Ethicon). !e celiac artery was then isolated, and the hepatic and gastric artery ligated with 10.0 suture (Ethicon). !e abdominal aorta was ligated and cut just below the celiac artery with micro-dissection scissors (ROBOZ, Rockville, MD), and dissected above the celiac artery. !is approach resulted in an aortic cu" connected to the splenic artery, which allowed vascular anastomosis of the spleen to the recipient. Following ligation of the bile duct, the portal vein was isolated, and the superior and inferior mesenteric and gastric veins were ligated. !e portal vein was intersected closely to the liver. !e entire organ package containing the vascular connections, spleen and the pancreas was then removed and stored in ice cold saline for 15 minutes while the recipient was prepared. !e recipient (CD45.1) was anesthetized with isoflurane supplemented with oxygen (2-3 Vol%). An abdominal midline incision was made and the inferior vena cava and the descending aorta were isolated below the
2

renal arteries. !e recipient vessels were clamped with an atraumatic bulldog clamp (ASSI, Westbury, NY) and opened with micro-scissors. !e portal vein was anastomosed to the inferior vena cava and the donor aortic cu" was connected with an end-to side anastomosis to the recipient aorta using 10.0 suture. !e clamp was then removed to restore blood flow. !e time of ischemia of the donor spleen, which ended after completion of both vascular anastomoses by unclamping the recipient aorta and vein, was ~60 min. Flow cytometric analysis of transplanted spleens (in mice without MI) indicated that the procedure reduced on average the reservoir of donor splenic monocytes by ~6-fold (donor monocytes in donor spleens 12 h after operation: 0.23 ± 0.01 X 10⁶ cells, n=2; control monocytes in control spleens: 1.4 ± 0.2 X 10⁶ cells, n=8). !e ‘missing’ monocytes in transplanted spleens likely matured into Mø/DC because the number of these cells increased locally (donor CD45.2+ CD11b+ Mø/DC in donor spleens: 0.99 ± 0.6 X 10⁶ cells; control CD11b+ Mø/DC in control spleens: 0.36 ± 0.5 X 10⁶ cells). Some monocytes may also have died locally, however they virtually did not enter circulation (donor monocytes in blood: 0.0012 ± 0.0004 X 10⁶
cells). !e reduced availability of donor monocytes in transplantation experiments was taken into account when quantifying their relative contribution in infarcts (see below). In an additional cohort of mice, 1 h after this procedure, the mouse was re-anesthetized and myocardial infarction was induced as described above (n=2). 24 h later, flow cytometry analysis of cells from MI revealed 10.1 ± 2% monocytes of splenic origin. Taking into account the reduced reservoir of splenic monocytes in transplanted animals, we calculated that a normal spleen should contribute ~40% of the recruited monocytes (6 X 10.1% splenic monocytes versus 89.9% other monocytes #40% splenic monocytes versus 60% other monocytes). We also performed the two following control experiments: !e first experiment involved mice (n=2) transplanted with a spleen as mentioned above, but the spleens were excised just before unclamping the host vasculature, leaving only the donor vasculature, connective tissue and parts of the pancreas in the recipient mouse. !e mice were then subjected to MI and the infarcts investigated 24 h later by flow cytometry. We detected no CD45.2+ cells in these mice. !e second experiment involved mice (n=2) that received a spleen graft but were not subjected to MI. In some experiments (fig. S11), donor spleens were transplanted into the great omentum of recipients. Specifically, awhile submerged in ice-cold PBS solution, donor spleens were sectioned into 5 pieces of approximately 3 mm thickness, transplanted, and fixed in place with 8-0 nylon sutures. To facilitate microvascular connections, the hilar aspect of the splenic segments was brought in proximity to the great omental vessels. !e institutional Subcommittee on Research Animal Care at Massachusetts General Hospital (MGH) approved all animal studies.
Fluorescence Molecular Tomography (FMT) - Magnetic Resonance Imaging (MRI). Animal preparation: Mice were shaved and depilated to remove all hair that otherwise absorb light and interfere with optical imaging. Mice were anesthetized (Isoflurane 1.5%, O2 2 L/min) and rendered immobile in a multimodal imaging cartridge, which lightly compresses the anesthetized mouse between optically translucent windows. !e latter do not interfere with fluorescence imaging. !e cartridge provides fiducial landmarks on the frame that enable exact, robust and observer-independent fusion of images. !e cartridge also prevents motion of the mouse during transfer between modalities. CLIO-680 and ProSense-750 (VisEn Medical) were injected intravenously on day 1 after coronary ligation at a dose of 15 mg iron oxide/kg body weight and 5 nmol respectively, and FMT-MRI was carried out 24 hours later. Twelve mice with MI were imaged; 6 received splenectomy at the time of coronary ligation. A commercially available FMT system was used for in vivo imaging studies (FMT2500, VisEn Medical). !e system allows for dual-channel imaging without the need for an index matching fluid, i.e., is a noninvasive free-space imaging system. It is equipped with MRI-safe mouse holders, allowing for imaging in the FMT and MRI systems without the need to reposition the mouse. Typical FMT scan times were less than 5 min per mouse. Data were post-processed using a normalized Born forward equation to
calculate a 3D map of fluorochrome concentration (7). To reliably identify the region of interest within the heart, FMT was hybridized with MRI for anatomic reference. After completion of FMT, the imaging cartridge holding the anesthetized mouse was inserted into a custom-made plexiglass holder that supplies isoflurane anesthesia and optimal positioning inside a transmit-receive MR body coil. We used a 7 Tesla horizontal bore scanner (Pharmascan, Bruker, Billerica) and a RARE sequence (TE 26.9 ms, TR 2500 ms, slice thickness 1 mm, 24 slices, matrix 256x256, FOV 6x6 cm) to image the entire mouse and the fiducial markers on the imaging cartridge. !e fiducial wells were filled with fluorochrome solution, and therefore were readily identified by FMT (fluorescence) and MRI (proton signal). FMT and MRI DICOM images were fused with OsiriX (!e Osirix Foundation, Geneva, Switzerland). Within both data sets, fiducial points were tagged to define their X-Y-Z-coordinates. Using these coordinates, FMT data were then resampled, rotated and translated to match the MR image matrix, and finally fused. After identification of infarcts on MRI, regions of interest were defined in both FMT channels. FMT-derived fluorescence is given in pmol and represents the absolute quantity of the excited fluorochrome within the infarct.
Fluorescence reflectance imaging (FRI). Myocardial short-axis sections were produced after harvest of rat hearts and then exposed on a custom-built fluorescence reflectance system 24 h after i.v. injection of 5 mg/kg CLIO-VT680.
Delivery of Angiotensin (Ang) II. C57BL/6 mice were implanted subcutaneously in the dorsum of the neck with osmotic mini-pumps (Alzet) for 2 to 24 hours. Mini-pumps were pre-incubated in PBS for 4 h to assure immediate delivery of the agent after implantation. Ang II (Bachem) was delivered at a rate of 1 µl/h at 1.5 mg/kg/day. Control mice were implanted with mini-pumps delivering saline (0.9% NaCl) (n=3-6).
ELISA for determination of serum Ang II levels. Blood was obtained from mice under anesthesia by cardiac puncture with a syringe pre-loaded with 80 µl of 100 mM EDTA anticoagulant. !e blood was supplemented with 50mM p-hydroxymercuribenzoid acid (Sigma), centrifuged, and supernatant loaded onto Amprep Phenyl PH mini-columns (GE Biosciences) to isolate peptides from the sera. Methanol-eluted peptides were dried by vacuum centrifugation. Ang II concentration was determined by using an Ang II ELISA (Cayman Chemical), and normalized to the volume of blood isolated.
Western for Ang II Type 1 (AT-1) receptor on splenic monocytes. Monocytes were isolated by FACS as described above. Sample pellets of ~175,000 monocytes were resuspended in Laemmli bu"er (BioRad), and sonicated to lyse cells and shear genomic DNA. Samples were developed by electrophoresis on a 4-15% polyacrilamide gel (BioRad). !e proteins were transferred to a polyvinylidene difluoride membrane (Fischer) by semidry transfer. Membranes were blocked with carnation milk and PBS supplemented with 0.05% Tween 20 overnight. Membranes were washed, stained initially with anti-AT-1 receptor antibody (Abcam), stripped with Restore bu"er (Pierce), and stained with anti-glyceraldehyde-3-phosphate (GAPDH) (Rockland Immunochemicals for Research). Blots were developed with Western Lightning Chemiluminescence reagent (PerkinElmer Instruments) and molecular weights were compared to bands for Precision Plus Protein Western C standards (BioRad).
In vitro migration. Migration experiments using Ang II as a chemoattractant were performed in BD BioCoat invasion chambers (BD Biosciences). Sorted monocytes from spleen were suspended in RPMI 1640 media (Cellgro) supplemented with 0.2% FCS (Valley Biomedical, Inc.). 2x10⁵ cells were placed on the matrigel-coated 8 µm pore size PET membrane and incubated in a humidified incubator at 37°C, 5% CO2 for 1 h, allowing the cells to attach to the matrigel. Migration was induced by addition of Angiotensin II (1 µM) (Bachem) to the lower compartment. After 2 h, non-migrating cells were removed with a cotton
3

tip and the membranes were fixed and stained with HEMA 3 staining set (Fisher Scientific) to identify cells that had migrated to the lower surface of the membrane. !e number of migrated cells was determined per 200 " high-power field. Cells that had migrated to the lower chamber were counted using Trypan Blue (Cellgro).
Intravital imaging. Animal preparation: During isoflurane anesthesia, the peritoneal cavity was opened with a transverse incision in the disinfected abdominal wall. !e gastric-splenic ligament was dissected and the spleen carefully exteriorized. Robust blood flow was observed in the splenic artery during the duration of each experiment and splenic perfusion was confirmed by inspection through fluorescence microscopy upon tail vein injection of an intravascular imaging agent. !e exteriorized spleen was completely submerged in temperature-controlled saline solution. Temperature near the spleen was carefully monitored using an Omega HH12A thermometer with fine wire thermocouples (Omega Engineering Inc., Stamford, CT) and kept at 37ºC. Confocal Microscopy: Images were collected with a prototypical intravital laser scanning microscope (IV100, Olympus Corporation, Tokyo, Japan) (8) using an Olympus 20x UplanFL (NA. 0.5) objective and the Olympus FluoView FV300 version 4.3 program. Samples were excited at 488 nm with an air-cooled argon laser (Melles Griot, Carlsbad, CA) for visualization of the GFP+ cells, and at 748 nm with a red diode laser (Model FV10-LD748, Olympus Corporation, Tokyo, Japan) for visualization of the blood pool agent (AngioSense-680, VisEn Medical, MA). Light was collected using custom-built dichroic mirrors SDM-570 and SDM-750, and emission filters BA 505-550 and BA 770 nm IF (Olympus Corporation, Tokyo, Japan). Both channels were collected simultaneously. A prototypical tissue stabilizer (Olympus Corporation, Tokyo, Japan) was used to reduce motion and stabilize the focal plane. !e stabilizer was attached to the objective and its z-position was fine adjusted using a micrometer screw to apply soft pressure on the tissue. Time-lapse recordings were made by collecting images of 256x256 pixels at 15 s intervals over 1 h in a single plane (2D) of focus. Mice were analyzed in the steady-state or 2 h or 24 h
after either MI or infusion of Ang II. Multiphoton Microscopy: Mice were anesthetized with ketamine (150 mg/kg BW) and xylazine (10 mg/kg BW) i.m., and the spleen was immobilized by placing a coverslip on its ventral surface. Images were collected with Praireview software on an Ultima IV upright multiphoton microscope (Prairie Technologies, Middleton, WI) equipped with an Olympus 20x/0.95 NA water immersion objective. For multiphoton excitation and second harmonic generation, a Ti:sapphire laser with 10-W MilleniaXs pump (Mai Tai HP, Spectra-Physics, Mountain View, CA) was tuned to 920 nm. Emitted light and second harmonic signals were detected through 525/50 and 460/50 nm bandpass filters using non-descanned detectors to generate two-color images and stacks, which were volume-rendered using the brightest-spot rendering mode within Volocity software (Improvision, Coventry, UK). Optical slides were acquired at 1 or 2 µm intervals. !e number of stacks varied between 16 and 60 (please refer to Movies S1-3 for more information). Data Analysis: All GFP+ cells were identified manually in each recording. To determine the displacement over time of individual cells, the centroid position (x-y dimension) of these cells was recorded at the first and last time-point when they could be identified during a recording; then the distance between these two points was calculated, and divided by the elapsed time. Single cell tracks for GFP+ cells were generated based on the position of cell centroids from a series of images recorded at 15 s intervals, and ImageJ and the Manual Tracking plugin (http://rsbweb.nih.gov/ij/plugins/track/track.html) were used for display and quantification. Motion-artifacts in recordings were corrected using the auto-alignment plugin (stackreg) of ImageJ (http://rsb.info.nih.gov/ij/).
Statistics. Results were expressed as mean±SEM. Statistical tests included unpaired, 2-tailed Student's t test using Welch's correction for unequal variances and 1-way ANOVA followed by Bonferroni’s multiple comparison test. P values of 0.05 or less were considered to denote significance.
4

Supplementary Figures
Figure S1: Co-existence of macrophages/DCs and undi!erentiated monocytes in the spleen. Leukocytes were retrieved from the spleen and labeled with antibodies as described in Methods. (A) Gating on leukocytes based on CD11b, Lin (i.e. CD90/B220/CD49b/NK1./Ly-6Glow), F4/80 and CD11c expression identifies at least eight di!erent populations, two of which (CD11b+ Linlow F4/80low CD11c– Ly-6Chigh/
low) are monocytes. (B) Enumeration of the eight populations reveals di!erent numbers of monocytes, macrophages (Mø; defined by F4/80 expression), DCs (DC; defined by CD11c expression) or other cells (many of which are lymphocytes) (n=3). (C) Enumeration of all monocytes vs all macrophages or DCs in the spleen (n=3). (D) CD11bhigh Linlow monocytes correspond to CD11bhigh CD115+ monocytes. "e dot plot overlay shows that 97.5% of gated CD11bhigh CD115+ cells (blue dots) overlay with CD11bhigh Linlow monocytes. All data are from one experiment representative of at least three independent experiments.
Figure S2: Flow cytometry identification of various immune cell types obtained from the spleen of Cx3cr1gfp/+ mice. Monocytes were defined as CD11bhigh Linlow (F4/80/CD11c/I-Ab)low and were further divided into Ly-6Chigh/low subsets. DC were defined as CD11c+ cells; Mø as F4/80+; NK cells as (NK1.1/CD49b)high; T cells as CD3+; B cells as B220high; and neutrophils as SSChigh Ly-6Ghigh. EGFP expression was analyzed for each cell type; mean fluorescence intensities (MFI) are shown on the right (n=3). Of note, 6±3% NK cells were EGFP+, whereas virtually all monocytes were EGFP+. When taking into account the abundance of each cell population and the fractions that are EGFP+, our flow cytometry data indicate that EGFP+ monocytes outnumber EGFP+ NK cells by >12 to 1 in the spleen (i.e., 92% EGFP+ monocytes for 8% EGFP+ NK cells). All data are from one experiment representative of at least two independent experiments.
5

Figure S3: Monocytes reside in the subcapsular red pulp. (A) Immunofluorescence panels of spleens from Cx3cr1gfp/+ mice flash-frozen and stained with anti-CD11b, F4/80, CD11c, CD163 or CD49b (red) antibodies and DAPI (blue), and co-localized with GFP (green). !e subcapsular red pulp (left three panels) and marginal zones (right three panels) are shown; srp = subcapsular red pulp, mz = marginal zone, wp = white pulp. We used the same exposure times to capture fluorescence of a given Ab in SRP and MZ. Monocytes were GFPhigh, CD11b+, F4/80low, CD11c– and CD163– and were found predominantly in the subcapsular red pulp. GFP– CD11bhigh population represents neutrophils. Very few CD49b+ GFP+ NK cells were observed in the subcaspular red pulp. CD163 identifies iron-recycling macrophages that reside predominantly in the SRP. (B) Negative controls were generated by staining with the appropriate secondary antibodies only. (C) Signal intensity of GFP, CD11b, F4/80 and CD11c in various regions of the spleen. !e numbers were generated by drawing same-area regions of interest with ImageJ on
regions either in the subcapsular red pulp or the marginal zone that were positive for each signal, so as to calculate intensity of a given signal as a measure of expression for that particular marker (note that exposure times were kept the same for any given marker in all regions). !e data show that GFP+ cells are most bright in the subcapsular red pulp, in keeping with flow cytometry data in Fig 2A that show that monocytes are brightest compared to macrophages. Also note that F4/80 and CD11c expression is brightest in the marginal zone, in keeping with flow cytometry data of Fig S2, which show that mature macrophages express F4/80 higher than monocytes (notably, monocytes are F4/80–/low) and mature DCs express CD11c higher than monocytes (monocytes are predominantly CD11c–; see Figure 1H). CD11b and CD163 expression are similarly bright in both regions. *P<0.05; **P<0.001 (n=10 high power fields). All data are from one experiment representative of at least two independent experiments.
6
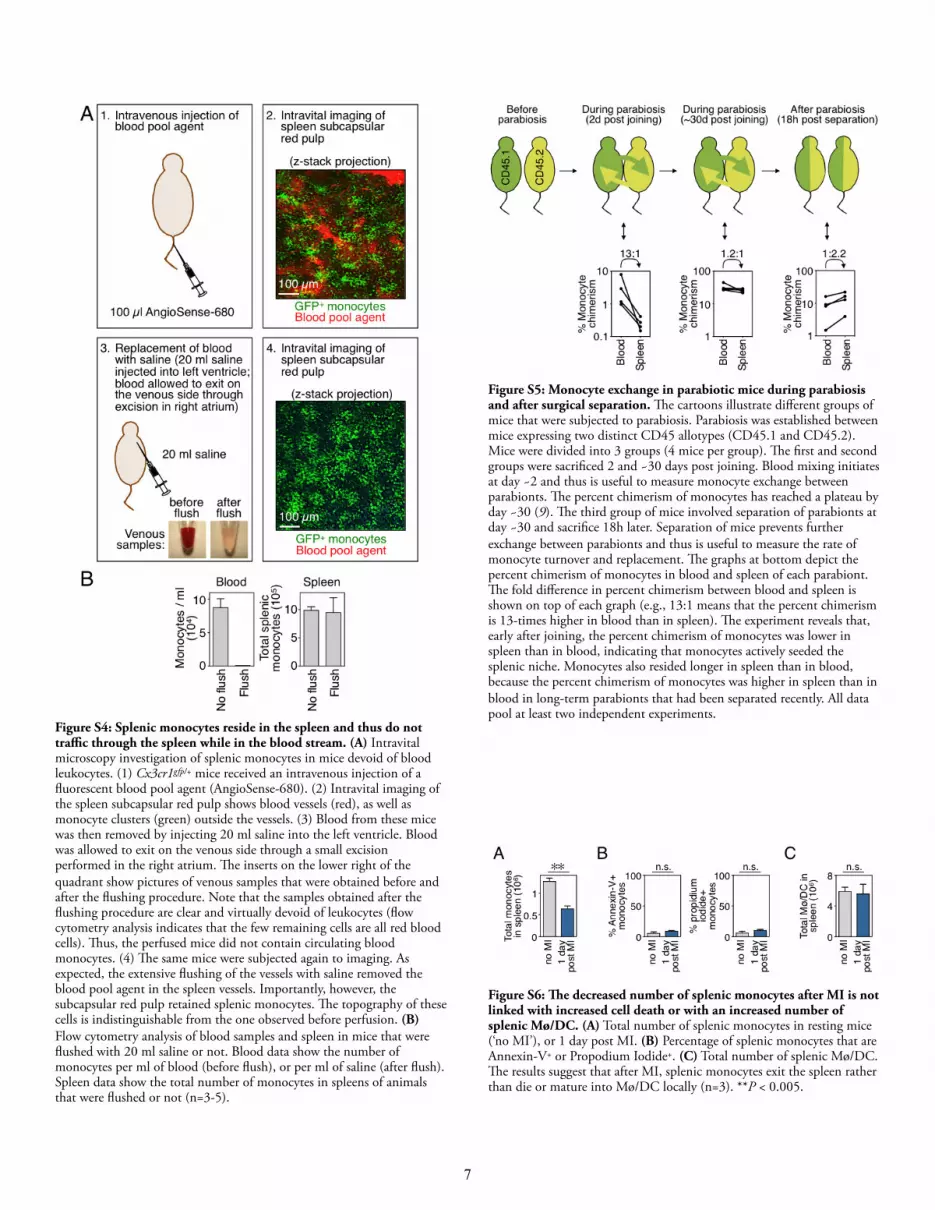
Figure S4: Splenic monocytes reside in the spleen and thus do not tra!c through the spleen while in the blood stream. (A) Intravital microscopy investigation of splenic monocytes in mice devoid of blood leukocytes. (1) Cx3cr1gfp/+ mice received an intravenous injection of a fluorescent blood pool agent (AngioSense-680). (2) Intravital imaging of the spleen subcapsular red pulp shows blood vessels (red), as well as monocyte clusters (green) outside the vessels. (3) Blood from these mice was then removed by injecting 20 ml saline into the left ventricle. Blood was allowed to exit on the venous side through a small excision performed in the right atrium. !e inserts on the lower right of the quadrant show pictures of venous samples that were obtained before and after the flushing procedure. Note that the samples obtained after the flushing procedure are clear and virtually devoid of leukocytes (flow cytometry analysis indicates that the few remaining cells are all red blood cells). !us, the perfused mice did not contain circulating blood monocytes. (4) !e same mice were subjected again to imaging. As expected, the extensive flushing of the vessels with saline removed the blood pool agent in the spleen vessels. Importantly, however, the subcapsular red pulp retained splenic monocytes. !e topography of these cells is indistinguishable from the one observed before perfusion. (B) Flow cytometry analysis of blood samples and spleen in mice that were flushed with 20 ml saline or not. Blood data show the number of monocytes per ml of blood (before flush), or per ml of saline (after flush). Spleen data show the total number of monocytes in spleens of animals that were flushed or not (n=3-5).
Figure S5: Monocyte exchange in parabiotic mice during parabiosis and after surgical separation. !e cartoons illustrate di"erent groups of mice that were subjected to parabiosis. Parabiosis was established between mice expressing two distinct CD45 allotypes (CD45.1 and CD45.2). Mice were divided into 3 groups (4 mice per group). !e first and second groups were sacrificed 2 and ~30 days post joining. Blood mixing initiates at day ~2 and thus is useful to measure monocyte exchange between parabionts. !e percent chimerism of monocytes has reached a plateau by day ~30 (9). !e third group of mice involved separation of parabionts at day ~30 and sacrifice 18h later. Separation of mice prevents further exchange between parabionts and thus is useful to measure the rate of monocyte turnover and replacement. !e graphs at bottom depict the percent chimerism of monocytes in blood and spleen of each parabiont. !e fold di"erence in percent chimerism between blood and spleen is shown on top of each graph (e.g., 13:1 means that the percent chimerism is 13-times higher in blood than in spleen). !e experiment reveals that, early after joining, the percent chimerism of monocytes was lower in spleen than in blood, indicating that monocytes actively seeded the splenic niche. Monocytes also resided longer in spleen than in blood, because the percent chimerism of monocytes was higher in spleen than in blood in long-term parabionts that had been separated recently. All data pool at least two independent experiments.
Figure S6: "e decreased number of splenic monocytes after MI is not linked with increased cell death or with an increased number of splenic Mø/DC. (A) Total number of splenic monocytes in resting mice (‘no MI’), or 1 day post MI. (B) Percentage of splenic monocytes that are Annexin-V+ or Propodium Iodide+. (C) Total number of splenic Mø/DC. !e results suggest that after MI, splenic monocytes exit the spleen rather than die or mature into Mø/DC locally (n=3). **P < 0.005.
7

Figure S7: Splenectomized animals show normal monocyte and lymphocyte counts in blood and bone marrow. (A) Number of blood monocytes per ml of blood (left) or of bone marrow monocytes per tibia (right) in control mice (‘+Spleen’) or in splenectomized animals (‘–Spleen’). (B) Number of blood and bone marrow lymphocytes in the same groups of mice. Mice were analyzed by flow cytometry. Splenectomized mice were sacrificed 1 day after surgery (n=3).
Figure S8: Analysis of monocytes in rats subjected to MI. (A) Flow cytometry analysis of spleens from control rats and from rats subjected to MI. (B) Total count of CD11b+ cells in spleen as identified in panel A. (C) Flow cytometry analysis of enzymatically-digested hearts 1 day after MI in rats with or without spleen. (D) Total count of CD11b+ cells in hearts as in panel C. n=3–4. (E) Fluorescence reflectance imaging (FRI) of explanted hearts 1 day after MI obtained from rats with or without spleen. Rats received an intravenous injection of CLIO-VT680 at the time of MI (e.g., 1 day before sacrifice). FRI at 680 nm wavelength measures fluorescent nanopartice uptake; FRI at 488 nm wavelength measures autofluorescence. (F) Target to background ratio in the infarcted hearts shown in panel E (n=3–4). *P < 0.05; ***P < 0.0005.
Figure S9: Spleen transplantation with vascular anastomosis. A spleen transplant model was developed to quantitatively track splenic monocytes after induction of myocardial infarction. (1) !e spleen was harvested from a CD45.2+ mouse after inhibition of clotting with heparin. Before explantation, the donor animal was perfused with saline until no blood remained in circulation. (2) !e donor spleen was then carefully exposed using micro-dissection tools and a surgical microscope. To facilitate vascular anastomosis to the recipients’ circulation, the splenic artery and vein were prepared while they remained connected to the abdominal aorta and the portal vein. !e use of this vasculature with a much higher caliber as a conduit facilitated vascular anastomosis of the splenic artery and vein to the recipient. Side branches and other major vessels were carefully ligated to avoid bleeding. (3) !e organ was then transplanted into the intraperitoneal cavity of the CD45.1+ recipient, and arterial and venous anastomoses were produced using microsurgical techniques. End-to-side anastomoses of the aortic cu" to the recipient descending aorta, and of the portal vein to the recipient inferior vena cava were established while these vessels were clamped. After unclamping, flow through the transplanted organ was verified visually, followed by splenectomy of the orthotopic CD45.1 recipient spleen. Vascular anastomosis of splenic vessels is shown on the digital image of the surgical field on the right. To better visualize the anatomy, the spleen was flipped over to the right side of the animal. (4) !e abdomen was then closed and myocardial infarction was induced in the recipient by coronary ligation through a left lateral intercostal thoracotomy. (5) 12 hours later, the infarct was harvested and prepared by enzymatic digestion. (6) !e resulting cell suspension was stained with an antibody cocktail including antibodies for CD45.1 and 2, which reported the source of recruited monocytes by flow cytometry. CD45.2+ cells originated from the donor spleen, whereas CD45.1+ cells were from the recipient animal.
8

Figure S10: Number of monocytes originating from a transplanted donor spleen and released into blood of the recipient. !e data show the number of total monocytes in 2 ml blood. Mice were analyzed in transplanted animals that were subjected to MI or not (n=2).
Figure S11: !e spleen is not a site of monocyte production. CD45.2+ donor spleens were implanted in the omentum of CD45.1+ mice and removed for analysis 1 day or 21 days after transplantation. Data show representative contour plots depicting the relative distribution of donor CD45.2+ and host CD45.1+ cells (n=3). *P < 0.05.
Figure S12: Splenic monocytes and neutrophils have distinct reservoir capacities. (A) Flow cytometric enumeration of neutrophils in single cell suspensions obtained from the entire spleen, and either in the absence of MI or 0.5 and 1 d after MI. !e number of neutrophils is statistically unchanged after MI, which indicates that the spleen does not lose a significant population of neutrophils (n=3-6). (B, C) Immunofluorescence analysis of neutrophils (NIMP-R14+ cells) in the subcapsular red pulp in the absence of MI or 1 d after MI. Panel B shows a similar pattern of neutrophil residency, and Panel C shows similar neutrophil counts 1 day after MI when compared to controls. (D) Flow cytometric analysis of neutrophil counts in the blood in the absence of MI or 0.5 and 1 day after MI in mice with or without spleen. !e results show no significant contribution of the spleen to the number of circulating neutrophils (n=6). (E) Flow cytometric analysis of neutrophils in the heart either in the absence of MI or 1 day after MI in mice with or without spleen. (F) Enumeration of neutrophils in the same mice shows a
slight, but insignificant decrease of neutrophils in mice without spleen. n=3-6. (G) CD45.2+ spleens were transplanted immediately after MI to CD45.1+ splenectomized mice. Data show that 1 day after MI spleen-derived neutrophils do not contribute to the neutrophil population in the heart. Data pool two experiments (A, D, F), or are from one experiment representative of two independent experiments (B, C, E, G).
Figure S13: Redistribution of monocyte subsets after MI. Total number of Ly-6Chigh and Ly-6Clow monocytes lost from the spleen (left) and gained in the heart (right) 1 day after MI. Mean±SEM (n=6–15). Data pool at least three independent experiments.
Figure S14: Accumulation of monocytes in heart of Atgr1a–/– mice. Control (WT) and Atgr1a–/– mice were subjected to MI. !e number of monocytes per mg tissue was determined 1 day later (n=3). *P<0.05.
Figure S15: CD11b+ cells emigrate the subcapsular red pulp in response to Ang II. (A) Representative immunofluorescence sections of the spleen stained with anti-CD11b (red) and DAPI (blue) depict the subcapsular red pulp from control mice (left) and mice 1 day after Ang II osmotic pump infusion (right). (B) Enumeration of CD11b+ cells per high power field in the subcapsular red pulp of the mice mentioned above. Mean and SEM are shown, n=10 high power fields. (C) Intravital microscopy of GFP+ cells (green) in the spleen subcapsular red pulp of live Cx3cr1gfp/+ mice. Images show clusters of monocytes in control mice (left) and their disappearance 1 day after Ang II osmotic pump infusion (right). *P<0.05. All data are representative of at least two independent experiments.
9

Figure S16: Identification of GFP+ Mø/DC, patrolling monocytes, and splenic monocytes by intravital microscopy in Cx3cr1gfp/+ mice. (A) Representative immunohistology of a large F4/80high GFP+ Mø/DC (top) and a smaller F4/80lo/– GFP+ monocyte (bottom). (B) GFP+ cells recorded in the subcasular red pulp were divided based on their size (Mø/DC: Area !150 µm2, ~5% of recorded GFP+ cells; monocytes: Area <150 µm2, ~5% of GFP+ cells). (C) After using size to separate GFP+ cells into Mø/DC and monocytes, monocytes were further divided into patrolling monocytes (cells physically interacting with blood vessels, ~5% of GFP+ cells), and splenic monocytes (not physically interacting with vessels, ~90% of GFP+ cells). It is worth noting that splenic monocytes represent the vast majority of recorded GFP+ cells. Mø/DC were in minority because our recordings were performed in the subcapsular red pulp (marginal zones are typically located at depths greater than 100 µm). (D) Mø/DC show on average slower mean track velocities than splenic monocytes (Mø/DC: 0.20 ± 0.10 µm/min; splenic monocytes: 2.28 ± 2.95 µm/min; t test: P<0.028). (E) Mø/DC show on average a lower circularity (or ‘roundness’) index than splenic monocytes (Mø/DC: 0.48 ± 0.12; splenic monocytes: 0.78 ± 0.09; t test: P<0.0001). Circularity Index = 4"A/P2, where A is the cell cross-sectional area and P the cell perimeter). Data pool (B, D, E) or are from one experiment representative of three independent experiments (A, C).
Figure S17: Displacement over time for all parenchymal GFP+ cells in Cx3cr1gfp/+ mice. Data show displacement over time for all splenic GFP+ cells, i.e., both splenic monocytes and splenic Mø/DC, in resting mice (control) and 1 day after MI or infusion of Ang II. n=155 (control), 171 (MI), and 134 (Ang II) cells. #is figure illustrates that the combination of so-called ‘splenic monocytes’ and ‘splenic macrophages/DCs’ (analyzed separately in Fig 4I) preserves statistically di$erent displacements over time between control and MI-treated or Ang II-treated groups. *P<0.01, **P<0.001. Data pool three independent experiments.
Figure S18: Activation of splenic monocytes in vivo occurs without physical contraction of the subcasular red pulp. (A) Anesthetized Cx3cr1gfp/+ mice received a blood pool agent to visualize vessels (Angiosense-680, red) and were imaged by intravital micrcoscopy at relatively low magnification in monocyte-rich regions of the subcapsular red pulp. (B) Mice then received Ang II as described previously and the same region was imaged at di$erent time points. Images on top show intravital recordings, whereas images on the bottom include the outline of vessels identified at time=0. #e outline serves as a fiducial marker and is reproduced on the subsequent images. Physical contraction of the subcapsular red pulp should associate with decreased distances between the fiducial marker, a phenomenon that we did not observe during the duration of the experiment. Note leakage of the blood pool agent in the red pulp parenchyma over time, which is in line with previous findings that Ang II increases microvascular permeability.
10

Supplementary Tables
11

12

Legends to Supplementary Movies Movie S1: Ring of GFP+ macrophages/DCs in the marginal zone of the spleen. !e animation shows GFP+ macrophages/DCs (green) at di"erent depths throughout the spleen from Cx3cr1gfp/+ mice, starting at 50 µm and ending at 110 µm below the capsule. !e cells are arranged in a ring in the marginal zone surrounding the white pulp. Scale bar=50 µm.
Movie S2: GFP+ monocytes in the subcapsular red pulp of the spleen. !e animation shows GFP+ monocytes (green) in the subcapsular red pulp of the spleen from Cx3cr1gfp/+ mice. !e dense collagen network (blue) of the splenic capsule indicates the boundary of the organ. !e recording covers 120 µm at 2 µm increments. Scale bar=100 µm.
Movie S3: GFP+ monocytes in the subcapsular red pulp of the spleen. !e animation shows GFP+ monocytes (green) in the subcapsular red pulp of the spleen from Cx3cr1gfp/+ mice, starting at 20 and ending at 50 µm below the capsule, respectively. Collagen fibers are shown in blue. Scale bar=25 µm.
Movie S4: A splenic monocyte in the subcapsular red pulp. !e moviemovie shows a GFP+ splenic monocyte (green) in the subcapsular red pulp of a live Cx3cr1gfp/+ mouse. A fluorescent blood pool agent was injected immediately before imaging and is shown in red. Tracks indicate the position of the cell centroid at 15 second intervals. Time is shown in minutes and seconds. Scale bar=20 µm.
Movie S5: A splenic DC or macrophage in the subcapsular red pulp. !e movie shows a GFP+ DC or macrophage (green) in the subcapsular red pulp of a live Cx3cr1gfp/+ mouse. A fluorescent blood pool agent was injected immediately before imaging and is shown in red. Tracks indicate the position of the cell centroid at 15 second intervals. Time is shown in minutes and seconds. Scale bar=20 µm.
Movie S6: A patrolling monocyte in the red pulp of the spleen. !e movie shows a GFP+ monocyte (green) patrolling a blood vessel (red) in the subcapsular red pulp of a live Cx3cr1gfp/+ mouse. Blood vessels were visualized by injecting a fluorescent blood pool agent immediately before imaging. Tracks indicate the position of the cell centroid at 15 second intervals. Time is shown in minutes and seconds. Scale ba =20 µm.
Movie S7: Migratory activity of GFP+ cells in the subcapsular red pulp of the resting spleen. !e movie on the left shows GFP+ cells (green) in the subcapsular red pulp of a live Cx3cr1gfp/+ mouse. A fluorescent blood pool agent was injected immediately before imaging and is shown in red. Tracks indicate the position of the centroid of all GFP+ cells at 15 second intervals. Movies on the right separately show tracks (top) and cells (bottom). !ree types of GFP+ cells can be visualized: i) motile monocytes patrolling the blood vessel are located in the upper left region of the recording; ii) a sessile cell (labeled with a purple dot at the center of the recording), that is larger in size and has several cytoplasmic protrusions/dendrites, and thus likely represents a macrophage or DC; iii) monocytes located in the spleen parenchyma and not associated with blood vessels. Time is shown in minutes and seconds. Scale bar=20 µm.
Movie S8: Migratory activity of GFP+ cells in the subcapsular spleen red pulp 2 h after MI. !e movie on the left shows GFP+ cells (green) in the subcapsular red pulp of a live Cx3cr1gfp/+ mouse. A fluorescent blood pool agent was injected immediately before imaging and is shown in red. Tracks indicate the position of the centroid of each GFP+ cell at 15 second intervals. Movies on the right separately show tracks (top) and cells (bottom). Time is shown in minutes and seconds. Scale bar=20 µm.
Movie S9: Migratory activity of GFP+ cells in the subcapsular spleen red pulp 2 h after infusion of Ang II. !e movie on the left shows GFP+ cells (green) in the subcapsular red pulp of a live Cx3cr1gfp/+ mouse. A fluorescent blood pool agent was injected immediately before imaging and is shown in red. Tracks indicate the position of the centroid of each GFP+ cell at 15 second intervals. Movies on the right separately show tracks (top) and cells (bottom). Time is shown in minutes and seconds. Scale bar=20 µm.
Movie S10: Departing splenic monocyte. !e movie shows a splenic GFP+ monocyte migrating from the spleen parenchyma to the lumen of a vessel. !e cell likely had entered the vessel at time point 52:30 min:sec, and then migrated ~220 µm during the next 6 min. !is represents an average instantaneous velocity of ~16 µm/min. !is is in range with the average instantaneous velocities observed for patrolling monocytes. However, starting at time point 58:45 and during the next 30 sec, the cell migrated over >125 µm and disappeared from the field of view. !is represents an average instantaneous velocity of >250 µm/min, which is one order of magnitude higher than the one reported for patrolling monocytes. Conversely, the cell did not enter free flow immediately after intravasation since it could be detected relatively close to the site of entry as late as 6 min after intravasation. !us, departing monocytes may adhere for some time to the endothelium before they enter free flow. Tracks indicate the position of the cell centroid. Time is shown in minutes and seconds. Scale bar=20 µm.
Supplementary references1. S. Jung et al. Mol Cell Bio 20, 4106 (2000).2. B. M. Bolstad et al. Bioinformatics 19, 185 (2003).3. S. Holm, Scand J Stat 6, 65 (1979).4. S. Akilesh, et al. Genome Res 13, 1719 (2003).5. E. Bunster, R.K. Meyer, Anat Rec 57, 339 (1933).6. M. Nahrendorf et al. Circulation, 113:1196 (2006).7. M. Nahrendorf et al., Circ Res 100, 1218 (2007).8. H. Alencar, et al. Neoplasia 7, 977 (2005).9. K. Liu, et al. Nat Immunol 8, 578 (2007)
13

www.sciencemag.org SCIENCE VOL 325 31 JULY 2009 549
PERSPECTIVES
In the left upper quadrant of the abdomen lies the spleen, functioning in two major capacities—fi ltering and storing blood
cells, and acting as an immune tissue, where antibody synthesis occurs and certain patho-gens are eliminated. Yet the spleen lacks the gravitas of neighboring organs because we can survive without it, albeit with some inconveniences. Its surgical removal causes modest increases in circulating white blood cells and platelets, diminished responsive-ness to certain vaccines, and increased susceptibility to infection with certain bacteria and protozoa. But on page 612 in this issue, the organ gains some new respect, as Swirski et al. ( 1) show that in the mouse, the spleen serves as a reservoir for immune cells (mono-cytes) that function in repairing the heart after myocardial infarction.
Circulating monocytes were pos-tulated by Florence Sabin and Charles Doan, over 80 years ago, to play an important role in defense against infec-tion ( 2), and recent work has confi rmed this ( 3). Indeed, monocytes are essential for immune defense against potentially lethal microbial pathogens ( 4). Clear-ance of microbial infection requires dispatching monocytes from their res-ervoir, thought to be the bone marrow, in adequate numbers toward the site of infection. Monocytes are guided to their proper destination by chemokines, infl ammatory cytokines, and adhesion molecules ( 3). But how adequate num-bers of monocytes are mustered for their mission is less well understood. Swirski et al. demonstrate that after induction of infl ammation—in their case, by myocardial infarction in mouse—monocytes rapidly exit the spleen, enter the bloodstream, and infi l-trate the infl amed myocardium to remodel damaged tissue.
Circulating monocytes are a heteroge-neous population ( 5), and in humans, can be divided into at least two subsets: one that expresses a high amount of the sur-face protein CD14 and no CD16, and a more mature subset that expresses a lower
amount of CD14 and higher amount of CD16. The latter subset shares similarities with tissue macrophages, which are derived from monocytes. In mice, circulating mono-cytes also can be divided into subsets on the basis of chemokine receptor expression and the presence of the Ly-6C surface protein ( 3). One subset of murine monocytes (Ly-6Chigh) expresses high amounts of the CCR2 chemokine receptor and the surface protein Ly-6C, and has been implicated in infl am-
matory responses. The second murine monocyte subset expresses a high amount of the chemokine receptor CX3CR1 and a low amount of Ly-6C (Ly-6Clow) and is sim-ilar to macrophages.
Although Ly-6Chigh monocytes contrib-ute to antimicrobial defense, they have also been implicated in the pathogenesis of ath-erosclerosis (hardening of the arteries). High blood cholesterol increases the fre-quency both of circulating monocytes and those that infi ltrate lesions (plaques) in arte-rial walls ( 6). Furthermore, mice in which the CCR2 chemokine receptor or its major ligand, monocyte chemotactic protein-1 [(MCP-1); also called CCL2] are geneti-
cally deleted have markedly reduced athero-sclerosis ( 7, 8). Recruitment of monocytes to plaques depends on CCR2-mediated signaling, perhaps in response to MCP-1 produced by cells within the arterial wall. Ly-6Chigh monocytes lacking CCR2 that are “adoptively transferred” into recipi-ent mice do not traffic as efficiently into plaques of hypercholesterolemic mice as do CCR2-expressing Ly-6Chigh monocytes ( 6, 9). Although the most obvious explana-
tion for this is that monocytes use CCR2-mediated signals to enter the arterial wall, it is also possible that CCR2-defi cient mono-cytes return to the bone marrow and become trapped there, because CCR2 is required for monocytes to emigrate from the bone marrow ( 10, 11). Adopt ive transfer stud-ies with Ly-6Chigh monocytes have shown that they rapidly return to bone marrow in the absence of active recruitment to sites of infl ammation ( 12).
Monocytes have also been implicated in the repair of damaged myocardium after myocardial infarction ( 13). In this scenario, Ly-6Chigh monocytes are first to infiltrate damaged heart tissue and contribute to the
Dispensable But Not IrrelevantIMMUNOLOGY
Ting Jia 1 and Eric G. Pamer 1 ,2
Heart injury triggers the release of monocytes
from an unexpected reservoir, the spleen.
Spleen
Injured heart(myocardial infarction)
Monocyte
MCP-1
Bone marrow
Releasesmonocytes
ReleasesmonocytesPromotes removal
of damagedheart tissue
Inflammatoryresponse
Angiotensin II
Released into blood
CCR2
Ly-6C
CCR2
Ly-6C
MonocyteAngiotensin IIreceptor
Calling up the reserves. In response to heart injury (myocardial infarction), specifi c subsets of monocytes are
recruited from the bone marrow and spleen to remove and repair damaged tissue.
CR
ED
IT: C
. B
ICK
EL/S
CIE
NC
E
1Immunology Program, Sloan-Kettering Institute, New York,
NY 10065, USA. 2Infectious Diseases Service, Memorial
Hospital, Memorial Sloan-Kettering Cancer Center, 1275
York Avenue, New York, NY 10065, USA. E-mail: pamere@
mskcc.org
Published by AAAS
on
July
31,
200
9 w
ww
.sci
ence
mag
.org
Dow
nloa
ded
from

31 JULY 2009 VOL 325 SCIENCE www.sciencemag.org 550
PERSPECTIVES
Cybersecurity is a pressing global issue today and increasingly affects all of us. According to a recent esti-
mate, each U.S. adult had a 66% chance of experiencing at least one data expo-sure in 2008 and a 30% chance of experi-encing multiple such exposures ( 1). A key motivator for cyber attackers is fi nancial gain; a study of the underground economy observed advertisements for over $276 mil-lion in total “goods” (such as stolen credit card information) during a recent 1-year period ( 2). The annual cost to companies due to intellectual property theft and repair after data breaches has been estimated at over $1 trillion globally ( 3). Yet, in a study of consumer’s personal computers, only 37% had up-to-date anti-malicious soft-ware (malware) protection; of those, 23% had active malware infections ( 4). What are the key cybersecurity dangers today, and how can they be addressed?
Computers can be infected merely by surfi ng the Web. By attacking a single Web site, attackers can potentially infect the computers of all visitors to that site. Using a technique known as SQL (Structured Query Language) injection, an attacker can insert malicious code into the database associated with the Web site. If the victim’s browser is vulnerable, that malicious content is trans-
mitted to the victim’s computer. Using another technique, cross-site scripting, the software toolkit known as “Mpack” recently caused considerable damage ( 5). Users visit-ing legitimate Web sites were invisibly redi-rected to a server that downloaded malicious software onto the user’s machine. Various types of malware can be downloaded to the victim’s machine in this way, including key-loggers (which steal account and password information), rootkits (which hide the pres-ence and activity of malicious software), and software enlisting the computer in a botnet.
Botnets are responsible for attacks including spam, phishing, distributed denial of service, data harvesting, click fraud, and password cracking. A bot is a computer that has been infected such that it can be remotely controlled; a botnet is a large network of bots. Up to 25% of the world’s network-connected computers may be part of a botnet ( 6). In 2008, the bot-net Srizbi sent out an estimated 60 billion spam messages per day—about 50% of the world’s total ( 7). At the end of 2008, Srizbi’s impact was much reduced when a suspect Web hosting company was cut off from the Internet. The botnet made a comeback, but in early 2009 a software patch was released that could remove the Srizbi software from client computers.
Another recent botnet, Storm, was esti-mated to have infected 1 million to 5 million computers; each infected computer sent out an average of 1200 spam messages an hour
( 8), generating healthy revenue for the botnet owners ( 9). Storm successfully evaded anti-virus protection, had a decentralized control structure that made it diffi cult to shut down, and had a built-in self-defense mechanism (it launched denial of service attacks against researchers trying to access and study it). Storm also made sophisticated use of social engineering techniques: It was highly effec-tive at inducing people to take action (such as to download and execute fi les), thereby infecting their computers with malware.
Social engineering here refers to manipu-lating a computer user to take an action with undesired consequences, such as download-ing a fi le containing malware, clicking on a link that takes them to a fraudulent Web site, or divulging confi dential information. Many users are easily manipulated in this way. In a study ( 10), university computer science stu-dents were sent an e-mail explaining that the system password database had been compro-mised and that they should reply with their password so that they could be validated in the database. No such database compro-mise had in fact occurred. The students were advised that they should never reveal their passwords to anybody, yet 41% of the stu-dents sent their passwords. Most were sus-picious, changing their passwords in the 2 weeks after the study, but very few reported the incident ( 10).
In another study, a credit union hired a security fi rm to perform a social engi-neering “penetration test” on itself. When
Is Your Computer Secure?COMPUTER SCIENCE
Frederick R. Chang
Security must be built in to software from the
outset rather than added on later.
Department of Computer Sciences, The University of Texas
at Austin, Austin, TX 78712, USA. E-mail: [email protected].
edu
fragmentation and recycling of necrotic and apoptotic tissues, whereas Ly-6Clow mono-cytes arrive at the scene later to promote revascularization and collagen deposition. Recruitment of Ly-6Chigh monocytes to dam-aged myocardium is dramatically dimin-ished in CCR2-defi cient mice. Swirski et al. used the mouse myocardial infarction model to further characterize Ly-6Chigh monocyte recruitment and identifi ed the subcapsular red pulp of the spleen as a major source of recruited monocytes. Interestingly, angio-tensin II, a circulating peptide that regulates vascular tone and blood pressure, promotes CCR2-independent emigration of splenic Ly-6Chigh monocytes into the circulation.
Corticosteroid administration and vigor-ous physical exertion both result in abrupt
increases in the number of circulating white blood cells, including monocytes. It has been assumed in these circumstances that white blood cells are released from endothelial surfaces. The fi nding by Swirski et al. that an increase in the circulating concentration of angiotensin II after myocardial infarction induces the dimerization of the angiotensin receptor on Ly-6Chigh monocytes reveals a novel mechanism to boost circulating white blood cells in times of stress.
The fi ndings by Swirski et al. raise ques-tions about whether other types of stress or injury draw upon the spleen’s reserve of monocytes as well. In the meantime, although the study does not make the spleen any less dispensable for mammalian sur-vival, it does make this easily dismissed
immune system organ seem a bit more pur-poseful and deserving of recognition.
References
1. F. K. Swirski et al., Science 325, 612 (2009).
2. F. R. Sabin, C. A. Doan, J. Exp. Med. 46, 627 (1927).
3. C. Auffray, M. H. Sieweke, F. Geissmann, Annu. Rev.
Immunol. 27, 669 (2009).
4. N. V. Serbina, T. Jia, T. M. Hohl, E. G. Pamer, Annu. Rev.
Immunol. 26, 421 (2008).
5. H. W. Ziegler-Heitbrock, B. Passlick, D. Flieger,
Hybridoma 7, 521 (1988).
6. F. K. Swirski et al., J. Clin. Invest. 117, 195 (2007).
7. L. Boring, J. Gosling, M. Cleary, I. F. Charo, Nature 394,
894 (1998).
8. L. Gu et al., Mol. Cell 2, 275 (1998).
9. F. Tacke et al., J. Clin. Invest. 117, 185 (2007).
10. N. V. Serbina, E. G. Pamer, Nat. Immunol. 7, 311 (2006).
11. C. L. Tsou et al., J. Clin. Invest. 117, 902 (2007).
12. C. Varol et al., J. Exp. Med. 204, 171 (2007).
13. M. Nahrendorf et al., J. Exp. Med. 204, 3037 (2007).
10.1126/science.1178329
Published by AAAS
on
July
31,
200
9 w
ww
.sci
ence
mag
.org
Dow
nloa
ded
from


