Embed Size (px)
Citation preview
Identification of fragmented object outlines 1
Panis, S., De Winter, J., Vandekerckhove, J., & Wagemans, J. (in press). Identification of
everyday objects on the basis of fragmented versions of outlines. Perception.
Identification of everyday objects on the basis of fragmented outline
versions
Sven Panis
Joeri De Winter
Joachim Vandekerckhove
Johan Wagemans
Laboratory of Experimental Psychology
University of Leuven, Belgium
Running head: IDENTIFICATION OF FRAGMENTED OBJECT OUTLINES
Address correspondence to:
Johan Wagemans
University of Leuven
Laboratory of Experimental Psychology
Tiensestraat 102
B-3000 Leuven
Belgium
tel: +32-16-32.59.69
fax: +32-16-32.60.99
Email: [email protected]
Identification of fragmented object outlines 2
Abstract. Although Attneave (1954, Psychological Review 61 183 – 193)
and Biederman (1987, Psychological Review 94 115 – 147) have argued
that curved contour segments are most important in shape perception,
Kennedy and Domander (1985, Perception 14 367 – 370) showed that
fragmented object contours are more identifiable when straight segments are
shown. Based on the set of line drawings published by Snodgrass and
Vanderwart (1980, Journal of Experimental Psychology: Human Learning
and Memory 6 174 – 215), we have made outline versions that can be used
to investigate this issue with a larger and more heterogeneous stimulus set.
Fragments were placed either around the “salient” points or around the
midpoints (points midway between two salient points), creating curved
versus relatively straight fragments when the original outline was
fragmented (experiment 1), or angular and straight fragments when straight-
line versions were fragmented (experiment 2). We manipulated fragment
length in every experiment except the last one, in which we presented only
selected points (experiment 3). While fragmented versions were on average
more identifiable when straight fragments are shown, certain objects were
more identifiable when the curved segments or the angles were shown. A
tentative explanation of these results is presented in terms of an advantage
for straight segments during grouping processes for outlines with high part
salience, and an advantage for curved segments during matching processes
for outlines with low part salience.
Identification of fragmented object outlines 3
1 Introduction
Researchers studying which segments of the contours of an object
carry the most information for correct identification, have drawn
contradictory conclusions using different methods. Attneave (1954)
suggested that high curvature regions of an object’s contour are more
perceptually informative than others. He demonstrated (1) that connecting
the high curvature points of a line drawing of a cat with straight lines does
not eliminate recognition, and (2) that people mark the points with high
absolute curvature when asked to mark the ‘salient’ or important points on a
smoothly curved closed contour. Recently, Norman et al (2001) replicated
the results of Attneave’s second demonstration by having 12 persons copy
silhouettes of potatoes – shapes with smoothly varying convex and concave
curvatures – using only 10 points, and observing that they consistently
marked regions of locally high absolute curvature. With Koenderink and
van Doorn (1978), they concluded that sensitivity to curvature maxima is
useful for qualitative three-dimensional (3-D) shape perception because
curvature maxima are projections of positive or negative Gaussian curvature
on the surface of 3-D objects (see also Todd 2004). Similarly, Feldman and
Singh (2005) used information theory to show that information along visual
contours is concentrated in regions of high magnitude of curvature.
In an unpublished study, Biederman and Blickle (1985; referenced
and discussed by Biederman 1987) deleted varying amounts of the (internal
Identification of fragmented object outlines 4
and external) contours of line drawings of 18 objects (25%, 45% and 65%)
either at the vertices or at midsegments. With an exposure duration of 100
ms and 65% contour deletion (or 35% contour shown), they found that
removal of vertices resulted in higher error rates than the midsegment
removal, consistent with the studies mentioned above using or assuming
closed contours. Biederman’s (1987) Recognition-by-Components (RBC)
theory, a member of structural decomposition models of shape
representation, states that an image is first segmented at deep concavities
into an arrangement of volumetric primitives or components (geons) based
on nonaccidental properties of edges in a 2-D image (curvature, collinearity,
symmetry, parallelism, and cotermination). After identification of the
primitives, the spatial arrangement between them is matched against stored
3-D structural descriptions. Because vertices are important diagnostic
features for the identity of the components, removal of vertices is expected
to yield more errors than midsegment deletion.
However, some theoretical assumptions of Biederman’s (1987)
theory can be questioned based on other findings. First, Kennedy and
Domander (1985) used a small number of line-drawings of objects and
found that identification of fragmented object contours was worse when
fragments were placed around ‘MAX’ points (points at which the contour
changes direction maximally) than around ‘MIN’ points (points midway
between two MAX points), and the best when fragments were occupying
the positions between MIN and MAX points. Kennedy and Domander
Identification of fragmented object outlines 5
(1985; p. 369) concluded that “the shapes of objects are best represented by
samples of the contour that are selected to be evenly distributed, even if this
means eliminating all of the points where contour changes direction
maximally”, because extrapolation across the gaps between the fragments of
the contour is in general more accurate when the gaps are small. According
to this extrapolation hypothesis, making fragments longer should never
result in a decrease of identification performance. They explain the better
performance with MIN fragments compared to MAX fragments of the same
physical length by the fact that “in MIN point pictures the distribution of
line segments may be superior for showing direction” (Kennedy and
Domander 1985; p. 369). Second, the results of Cave and Kosslyn (1993)
suggest that objects are not necessarily parsed at concavities into their
constituent parts prior to recognition, while proper spatial relations between
parts are indeed critical for recognition. Third, while Biederman and Cooper
(1991) interpreted their priming results using fragmented pictures as
evidence for an intermediate representation in terms of component parts (see
also Hayworth and Biederman 2006), Cave and Kosslyn (1993) argued
convincingly that these results can be explained on overall global shape
alone (based on completion; see also Edelman 1999). Fourth, competitive
grouping of contour segments occurs at all levels of the visual system and
the figure-ground assignments are influenced by bottom-up geometrical
saliency as well as top-down object knowledge (Hess and Field 1999;
Murray et al 2004; Palmer et al 2003; Spillman 1999). Fifth, performance in

Identification of fragmented object outlines 6
visual discrimination, classification, and completion tasks seems to be
dominated by the configural properties (symmetry, parallelism, etc.)
between the components (contour segments) regardless of the
discriminability of the component properties (length, curvature), suggesting
that the configural properties have processing priority and may be available
earlier than the component properties (Kimchi 1994; Kimchi and Bloch
1998; Sekuler 1994; Sekuler et al 1994). Finally, Keane et al (2003) showed
that configural changes made to object parts were detected more easily and
quickly than changes made to the shape of object parts.
These studies all suggest that the global shape, based on the spatial
relations between an object’s visible elements, is represented first, while
identifying the parts of an object based on concavities (De Winter and
Wagemans 2006; Hoffman and Richards 1984; Hoffman and Singh 1997;
Singh and Hoffman 2001) occurs later. This is consistent with the reverse
hierarchy theory of vision (Hochstein and Ahissar 2002), with view-based
theories which state that configural relations between viewpoint-dependent
object features (not specifically related to parts) are matched directly with
stored representations (Lowe 1987; Tarr and Pinker 1989; Ullman 1989),
and with recent computational models and theories about visual processing
(Rolls and Deco 2002).
Also, there are a number of reasons to believe that inflections are
perceptually important too. Mathematically, a change in curvature sign is
easier to compute, more robust, and more stable under transformations than
Identification of fragmented object outlines 7
maxima or minima of curvature (Van Gool et al 1994) and inflections on the
contour correspond to parabolic lines on the 3-D object surface, separating
convex and concave surface regions (Koenderink and van Doorn 1982).
Finally, Beintema and Lappe (2002) found that a biological motion stimulus
is still interpretable when the lights are attached somewhere on the limbs,
instead of on the joints. Thus, comparing identification of curved fragments
around salient points (positive and negative curvature extrema) with straight
fragments around midpoints (often but not always close to inflections) is not
just interesting for the sake of comparison but also theoretically meaningful
because it can generate testable hypotheses (see General Discussion).
In this paper we present a large-scale study, consisting of three
experiments, in which we test Biederman and Blickle’s (1985) and Kennedy
and Domander’s (1985) ideas about which segments of object contours are
most informative for object identification, using a large number of objects
and a large sample of subjects. This study is part of a larger research
program on the role of curvature singularities in shape and object perception
(see De Winter and Wagemans 2004 for an overview), for which we created
outlines of objects derived from the published set of everyday objects of
Snodgrass and Vanderwart (1980; see Wagemans et al 2007). These
outlines were used by De Winter and Wagemans (2007a) to test Attneave’s
(1954) hypothesis more thoroughly. They asked a large number of
participants to mark the salient points (SPs) on this large and heterogeneous
set of object outlines. Their data confirmed Attneave’s hypothesis in that

Identification of fragmented object outlines 8
salient points marked by subjects are closest to extrema (points with locally
a negative or positive extremum of curvature) and even closer to negative
minima or concavities than to positive maxima or convexities because in
natural shapes concavities are in general deeper than convexities and can
thus be located better perceptually.
We use a large number of object outlines (N = 186) because
previous picture fragmentation studies (Biederman and Blickle 1985;
Kennedy and Domander 1985) typically used a low number of quite
homogeneous object shapes to test their hypotheses. We will show that
conclusions based on a small number of object stimuli can often not be
generalised to all possible object shapes because the global shape is an
important factor in determining whether straight or curved fragments will be
important. We use salient points and midpoints instead of extrema and
inflections because De Winter and Wagemans (2007b) found that straight-
line stimuli based on (subjectively defined) salient points were better
identifiable than when based on (mathematically defined) extrema, although
on average, the contours contained more extrema than salient points. In
practice, this difference is not so important anyway because De Winter and
Wagemans (2007a) have shown that salient points are often very close to
strong extrema. The outlines of objects (no internal contours) are used
because this (1) avoids differences in occlusion cues (eg vertices) between
fragmented versions, (2) allows us to avoid the presence of internal features
that could differ in their diagnosticity for identification between both types
Identification of fragmented object outlines 9
of fragmentation used in this study (eg the pedal of a bicycle), and to control
(3) the position and extent of deletions and (4) the similarity of the
distribution of both sets of resulting fragments more systematically as was
done by Biederman and Blickle (1985) and Kennedy and Domander (1985).
For each of our objects, we created different types of fragmented
versions in which the fragments are evenly distributed. First, when
fragmenting the original outlines containing smoothly changing curvature
values, we placed the fragments around the salient points (SPs) identified by
De Winter and Wagemans (2007a) or around the midpoints (MPs, points on
the contour in the middle between two SPs), creating curved and more or
less straight fragments, respectively. Four different fragment lengths were
tested in experiment 1. Second, in experiment 2, the influence of changing
local properties of the image elements (the visible contour segments) was
studied by deleting local curvature information from the contour segments
by fragmenting the straight-line versions (in which the SPs are connected
with straight-lines), used by De Winter and Wagemans (2007b). This results
in fragments that were either corner-shaped or completely straight. In terms
of RBC (Biederman 1987) this deletion of local curvature implies a change
in the identity of the components (changing curved into straight edges).
Three fragment lengths were tested in experiment 2.
Finally, the necessity of the presence of local direction information
around these points for identification was studied by presenting the smallest
possible fragments: the SPs and/or the MPs themselves (experiment 3). The
Identification of fragmented object outlines 10
main motivation for experiment 3 was that Deregowski (1986) noted that
the results of Kennedy and Domander (1985) do not invalidate Attneave’s
(1954) hypothesis because he only talks of points at which information is
concentrated, while Kennedy and Domander (1985) used short dashes that
contain information about direction. However, although Attneave’s
hypothesis is concerned only with highly informative points, Attneave
himself did connect the high curvature points with straight lines so he added
direction information that was valid in the sense that no spurious angles
were introduced. Similarly, when people have to mark salient points, the
complete contour is shown. This is the first study in which Deregowski’s
(1986) strict interpretation of Attneave’s hypothesis is tested by presenting
high informative points alone.
2 General Methods
Because all three of the experiments reported here belong to the
same large-scale study, they share several aspects of the methods for data
acquisition (ie subjects, stimuli, procedure) and data analysis (ie scoring,
dependent variables, a posteriori analyses). To avoid repetition in the
description of the individual experiments, we include these general aspects
of the methods here and focus on the specific details in which the methods
differ between experiments below (eg the method of fragmentation).

Identification of fragmented object outlines 11
2.1 Subjects
First-year psychology students at the University of Leuven
participated in all of the experiments in this study as a mandatory
component of their curriculum. They were always naïve regarding the
purpose of the experiment and unfamiliar with the stimuli (we used different
samples with new freshmen in each of three consecutive academic years),
and all had normal or corrected-to-normal vision. Depending on the number
of conditions in each experiment, we used a different number of subjects, to
have data from 18 to 26 subjects per stimulus per condition within a
reasonable time per subject (usually less than 20 minutes).
2.2 Stimuli
The stimulus set consisted of 17 fragmented versions of object
outlines that were derived from the 260 line drawings of everyday objects
by Snodgrass and Vanderwart (1980). In a previous study (Wagemans et al
2007), silhouette and outline versions were created of the complete
Snodgrass and Vanderwart set (see also De Winter and Wagemans 2004;
Wagemans et al 1998). Silhouettes were made by filling-in the interior
surfaces of the line drawings in black. Outlines were subsequently extracted
automatically and spline-fitted to obtain smooth curvature values at all
points along the contour.
Some outlines were excluded for the following reasons. (1) Outlines
that were too simple (eg squares or circles) were excluded because of

Identification of fragmented object outlines 12
numerous possible valid namings. (2) Some outlines had some small
anomalies in the outline shape (due to the spline-fitting procedure) and they
were excluded because these anomalies might affect the fragmented
versions differentially and hence our major results of interest. These
selection criteria led to a set of 186 object outlines (out of 260), with an
average identification rate of 82.8% (SD = 23.1%).
In each of the three experiments belonging to the current study, the
186 objects were divided in two groups and subsequently each group was
divided in a number of subgroups. We made sure that groups and subgroups
were always matched to have approximately the same average
identifiability, the same number of living versus nonliving objects, and the
same average number of inflections (one of our operationalisations of
outline complexity).
2.3 Procedure
The experiments were performed in a computer class room with 33
PCs separated by about 1 m. Each experiment consisted of multiple sessions
with a maximum number of 30 subjects per session. We presented all the
stimuli centred on a 17 inch CRT display at a viewing distance of
approximately 0.7 m but viewing distance was not strictly controlled. The
display resolution was set to 1024 by 768 pixels. The refresh rate was 60
Hz. Stimuli were all contained within a box of 640 by 480 pixels (not drawn
as such), resulting in a viewing angle of about 16 by 12 degrees.

Identification of fragmented object outlines 13
Trials were self-paced. Each fragmented version was presented for a
maximum of 5 s and then replaced by a fixation cross. Subjects were asked
to identify each stimulus and subsequently input its name via the computer
keyboard and click on an OK button with the mouse when finished.
Subjects could begin typing the object name as soon as they had identified
the stimulus and they could type and correct as long as they wanted. If the
subject clicked on OK in a time period shorter than 5 s, the stimulus was
removed from the screen and the next stimulus appeared. The presentation
order was randomized for each subject separately and the experimenter
secured silence throughout the session until the last subject was finished.
2.4 Scoring
A response was counted as correct when either the same name was
given as the one listed by Snodgrass and Vanderwart (1980), or when it was
a synonym or dialect name that clearly indicated the same concept. This was
done because we used Flemish subjects in all experiments and Flemish has
many more synonyms and dialect names than English or Dutch (eg
Severens et al 2005).
We also approved names referring to related objects if these were
not visually distinguishable in our outlines. For example, we approved
“aircraft” for “airplane”, “cradle” for “baby carriage”, “mouth” for “lips”,
“rat” for “mouse”, “nutcracker” for “pliers”, etc. but also “dromedary” for
“camel” because many people do not know the difference. However,
Identification of fragmented object outlines 14
slightly related names that were referring to different basic-level categories
were not allowed when they were visually distinguishable in our contour
stimuli (e.g., “seat” for “bed”, “bee” for “beetle”, “chicken” for “bird”,
“shoe” for “boot”, etc.). Scoring was done automatically for all the names
that were already contained in our data base from previous studies. New
names were being scored manually by applying the same criteria (in case of
doubt, the authors decided together). The data base was updated with the
new names (and their scoring) each time a new experiment was performed.
In any event, every experiment in this study used the same scoring criteria
and the results will therefore be comparable across the different
experiments.
2.5 Data analysis
We determined the average percent of correct identification in each
of the conditions across subjects and compared them with an Analysis-of-
Variance. Specifically, general linear mixed model theory (GLMM; Littell
et al 1996) was used to model a repeated measures block design with type of
fragment and/or fragment length as within-subjects factors and subject as a
random block factor. In a GLMM the random subject effects model the
correlations between observations of the same subject. We also performed
similar analyses across stimuli, but we will not report those results because
they are similar to the analyses across subjects.

Identification of fragmented object outlines 15
We also computed a number of stimulus measures on the closed
contour to support our tentative interpretations on the basis of stimulus
inspection more quantitatively. Correlations between these measures and
performance differences (averaged across subjects) between SP and MP
versions were overall low (all r < .25) but some interesting patterns will be
reported. T-tests for independent samples revealed that the two sets of
stimuli showing opposite performance patterns across fragment lengths (SP
> MP or SP < MP; N = 47 in each set) differed significantly in (1) area, (2)
number of inflections, (3) the number of peaks which was based on the
adaptive smoothing algorithm by Horng (2003), which iteratively
smoothens out low curvature values and strengthens high curvature values,
resulting in a certain number of peaks in the curvature graph, (4) a measure
of compactness (contour length divided by area2), (5) contour length, (6) a
measure of homogeneity (the number of peaks divided by contour length2),
(7) number of parts (based on the empirical segmentation data of De Winter
and Wagemans 2006), (8) the number of fragments or the number of salient
points, (9) the average of the absolute curvature values of every point of a
contour.

Identification of fragmented object outlines 16
3 Experiment 1: Identification of fragmented outlines
3.1 Introduction
In experiment 1 we fragmented the original, smoothly curved
outlines in two ways: Fragments were placed around salient points (SPs) or
around midpoints (MPs) and four fragment lengths were tested. RBC
predicts overall lower identification for MP fragments compared to SP
fragments.
3.2 Methods
3.2.1 Subjects. 202 first-year, naïve psychology students participated.
3.2.2 Stimuli. De Winter and Wagemans (2007a) asked an independent
sample of observers (N = 161) to mark the salient points on each contour of
the 260 objects of Snodgrass and Vanderwart (1980). The selection of the
most salient points proceeded as follows. First, the raw frequency data were
smoothed by a Gaussian function (with an SD of 5 pixels) and then the local
maxima from this saliency distribution were selected if their value was
higher than a particular threshold. Because the contours differed widely in
how distributed the saliency values were, the threshold was set adaptively: It
was determined as the integer value of the average smoothed saliency (eg 7
for an average smoothed saliency of 7.93). It was clear that subjects usually
marked points with high curvature.

Identification of fragmented object outlines 17
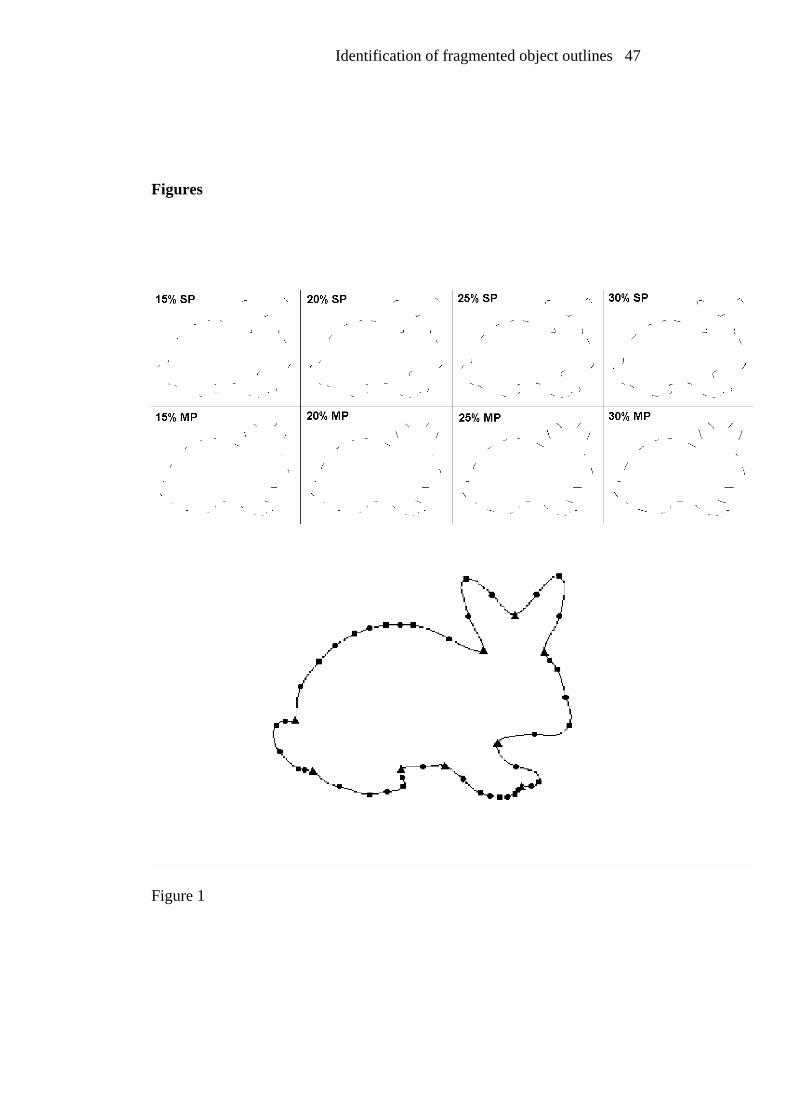
For the 186 selected object outlines, fragments were placed either
around these salient points (SPs) or around midpoints (MPs, the points
halfway in-between two SPs with distance measured on the original outline
as the Euclidean distance in pixels from point to point). Four fragmentation
levels were used: 15, 20, 25 or 30% of the total contour was shown (figure
1). We approximated the requested total percentage contour in both
conditions by starting from the relevant set of ‘target’ points (ie SPs or
MPs) and letting the fragments grow until each of both parts of a fragment
occupied the requested percentage of the distance on the contour between
the target point and the neighbouring MPs (in case of SP target points) or
SPs (in case of MP target points). Thus, each fragment contained an SP or
an MP but was not necessarily divided exactly in half by the target point
because the distance between the target point and both neighbouring MPs or
SPs was not necessarily the same. This procedure results in variable gap and
fragment lengths for each object contour. This will contribute to grouping at
different levels of the visual system, from simple local filling-in to the
global integration of parts in a structural description (Lamote and
Wagemans 1999; see also Kourtzi et al 2003 for related neurophysiological
evidence). Each fragmented version has the same number of fragments and
we will refer to the fragmentation levels by the variable ‘fragment length’
with values 15, 20, 25, and 30. These four fragmentation levels were chosen
on the basis of a pilot study where the difference in identification between
similar types of mathematically defined fragments (fragments placed around

Identification of fragmented object outlines 18
extrema or inflections) was largest in the range 15% to 28% (see Wagemans
et al 2001).
-------------------------------
insert figure 1 about here
-------------------------------
3.2.3 Procedure. The 186 objects were divided in 2 groups and each group
subsequently in 4 subgroups containing 23 or 24 objects. Every subject saw
each subgroup in one of eight within-subject conditions (2 levels of
fragment type x 4 levels of fragment length). Assignment of subgroups to
conditions was counterbalanced across subjects. Every participant received
186 trials. Each object was shown in each condition to 25 or 26 subjects.
3.3 Results and discussion
First, we calculated the percentage correct responses for each
combination of subject (N = 202), type of fragment (SP and MP) and
fragment length (15, 20, 25 and 30). These scores were analysed using a
GLMM as a repeated-measures block design with type of fragment and
fragment length as within-subjects factors and subject as a random block
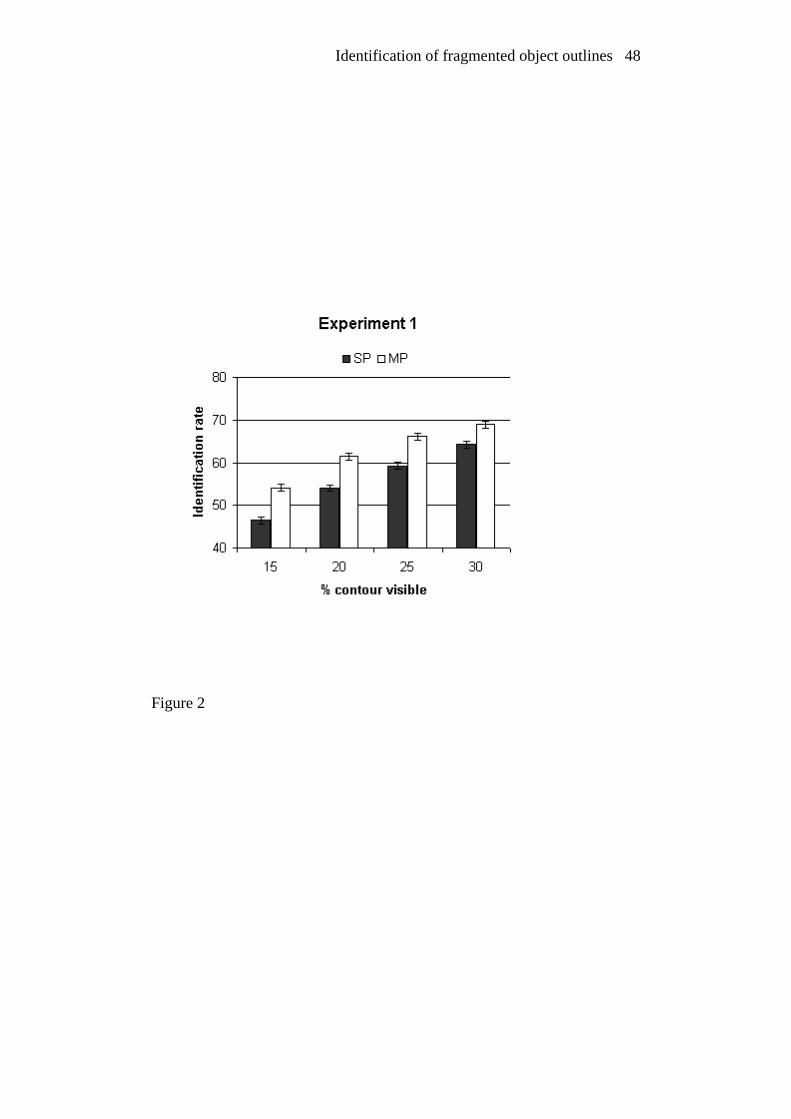
factor (figure 2 and table 1). Both main effects of fragment type and
fragment length were highly significant (F1, 201 = 120.42, p < 0.001; F3, 603 =
214.65, p < 0.001): MP fragments were identified correctly more frequently
than SP fragments (62.66% versus 56.01%) and correct identification
improved with larger fragment lengths (50.30%, 57.73%, 62.68% and
Identification of fragmented object outlines 19
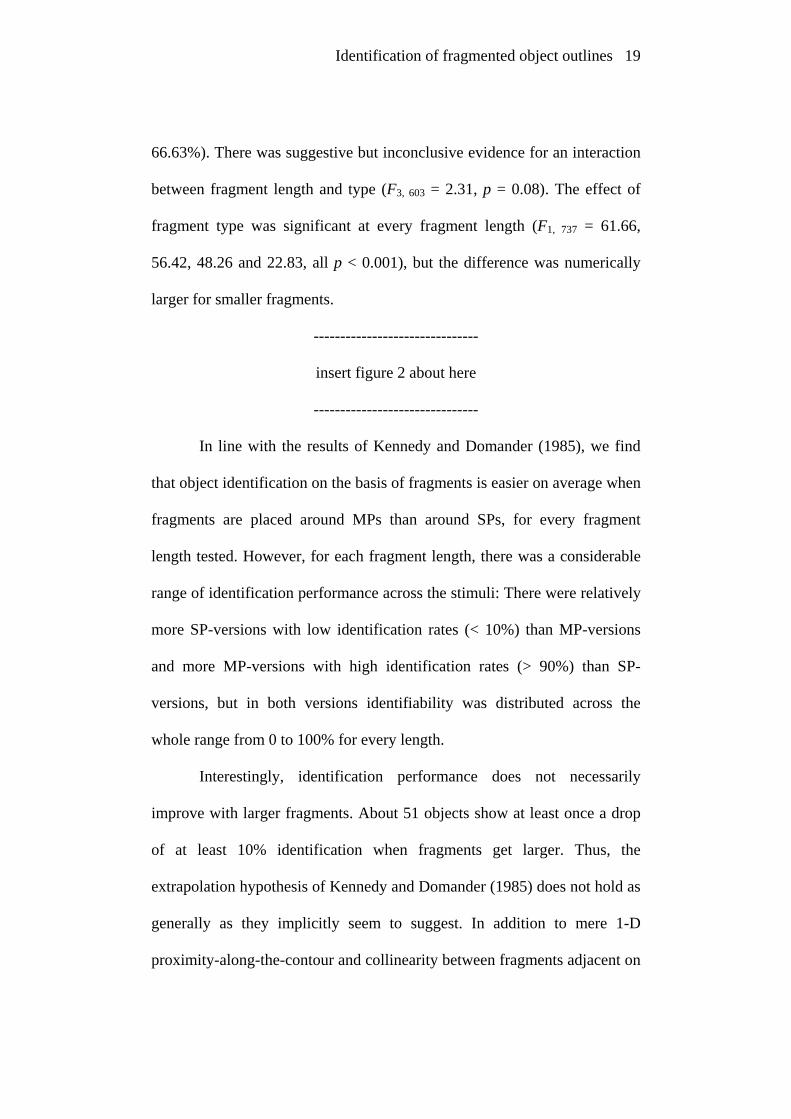
66.63%). There was suggestive but inconclusive evidence for an interaction
between fragment length and type (F3, 603 = 2.31, p = 0.08). The effect of
fragment type was significant at every fragment length (F1, 737 = 61.66,
56.42, 48.26 and 22.83, all p < 0.001), but the difference was numerically
larger for smaller fragments.
-------------------------------
insert figure 2 about here
-------------------------------
In line with the results of Kennedy and Domander (1985), we find
that object identification on the basis of fragments is easier on average when
fragments are placed around MPs than around SPs, for every fragment
length tested. However, for each fragment length, there was a considerable
range of identification performance across the stimuli: There were relatively
more SP-versions with low identification rates (< 10%) than MP-versions
and more MP-versions with high identification rates (> 90%) than SP-
versions, but in both versions identifiability was distributed across the
whole range from 0 to 100% for every length.
Interestingly, identification performance does not necessarily
improve with larger fragments. About 51 objects show at least once a drop
of at least 10% identification when fragments get larger. Thus, the
extrapolation hypothesis of Kennedy and Domander (1985) does not hold as
generally as they implicitly seem to suggest. In addition to mere 1-D
proximity-along-the-contour and collinearity between fragments adjacent on

Identification of fragmented object outlines 20
the contour, other configural relations (eg parallelism, symmetry, and
convexity relations between segments that are adjacent in the 2-D plane but
not along the contour), appear to play a role as well and provide a context
which may hamper or facilitate the task at hand (see also Liu et al 1999;
Pomerantz et al 1977).
When identification rate is averaged across fragment lengths for
each object, there are about two third of the objects that show better
identification in MP than in SP, while one third shows the opposite pattern
(see table 1). To study on which variables both groups of object contours
differ, we selected the 25% (N = 47) objects with the strongest difference
scores in both groups. T-tests for independent samples (see table 2)
indicated significant differences between both groups for area, number of
inflections and peaks, compactness and homogeneity, contour length,
number of fragments and parts, and the average absolute curvature across all
points. Our measures of homogeneity and compactness both have a positive
correlation with difference scores for every length (SP% minus MP%)
meaning that less homogeneous and/or less compact objects tend to be more
identifiable with MP fragments than with SP fragments. Area, contour
length, and the number of peaks all correlate negatively meaning that larger
objects and/or outlines showing more curvature variation and/or objects
with longer contours also benefit from MP fragments. These analyses
indicate that more complex outlines with high part saliency (less compact,
less homogeneous, larger area, longer contour, more parts, etc.) benefit from

Identification of fragmented object outlines 21
the relatively straight MP fragments, while simpler outlines with low part
saliency benefit from the curved SP fragments. We will return to these
findings in the General Discussion.
-------------------------------------
insert tables 1 and 2 about here
-------------------------------------
4 Experiment 2: Identification of fragmented straight-line versions of
outlines
4.1 Introduction
We fragmented the straight-line versions connecting SPs used by De
Winter and Wagemans (2007b) in two ways to study the effect of deleting
smooth changes in local curvature. Three fragment lengths were tested.
RBC predicts an overall lower performance compared to experiment 1 since
the shape of the inferred components (geons) will have changed completely.
4.2 Methods
4.2.1 Subjects. 231 first-year, naïve psychology students participated.
4.2.2 Stimuli. The same 186 objects as in experiment 1 were used. First, a
"straight-line" (SL) version was created by connecting the neighbouring SPs
of every object contour with straight lines (from now on we call these SPs

Identification of fragmented object outlines 22
connected by straight-line segments SPSLs). Second, points on this straight-
line contour lying in the middle between two SPSLs (the points halfway in-
between two SPSLs with distance measured on the straight-line contour as
the Euclidean distance in pixels from point to point) were defined as
midpoints in the straight-line versions (MPSLs). Lastly, these straight-line
contours were fragmented such that the fragments were lying around the
SPSLs (forming corner-shaped fragments with variable angles) or the
MPSLs (forming short straight lines). Using the same procedure as in
experiment 1, we constructed three fragmentation levels: 15, 20 or 25% of
the total contour was shown (see figure 3). Notice that the SPSLs have the
same position as the original SPs, while in most cases, the MPSLs have a
different position than the original MPs. (Note also that the MPSL
fragments could have been constructed differently by placing a straight
fragment on the tangent at the MPs, so that the MPSLs would also always
have the same position as the original MPs.) Furthermore, SPSL fragments
adjacent on the contour are by definition perfectly collinear because they
derive from straight-line figures while MPSL fragments are not necessarily
collinear along the contour. Thus, if we still find an advantage for MPSL
fragments compared to SPSL fragments this means that (1) the absolute
position of the straight MPSL fragment is not so important, and (2) that
collinearity is not the only, and possibly not the most important configural
property that is used to identify fragmented object outlines.

Identification of fragmented object outlines 23
-------------------------------
insert figure 3 about here
-------------------------------
4.2.3 Procedure. The 186 stimuli were divided in 2 groups and each group
subsequently in 6 subgroups, each containing 15 or 16 objects. Each subject
was randomly allocated to a group and saw each of the 6 corresponding
subgroups in one of 6 within-subject conditions (2 levels of SL fragment
type x 3 levels of fragment length). Assignment of groups to subjects and
subgroups to conditions was counterbalanced across subjects. Every
participant received 93 trials. Each object was shown in each condition to
18 – 20 subjects.
4.3 Results and discussion
First, we calculated percentage correct responses for each
combination of subject (N = 231), fragment type (SPSL and MPSL), and
fragment length (15, 20 and 25). These scores were analysed as a repeated-
measures block design with fragment type and fragment length as within-
block factors and subject as a random block factor (figure 4 and table 1).
Both main effects were significant (F1, 230 = 9.76, p < 0.005; F2, 460 = 131.57,
p < 0.001): MPSL fragments were recognised correctly more frequently
than SPSL fragments (56.80% versus 54.84%) and correct identification
improved with larger fragment lengths (50.08%, 56.36% and 61.02%). The
interaction was not significant (F2, 460 = .50, p = .61). However, the effect of
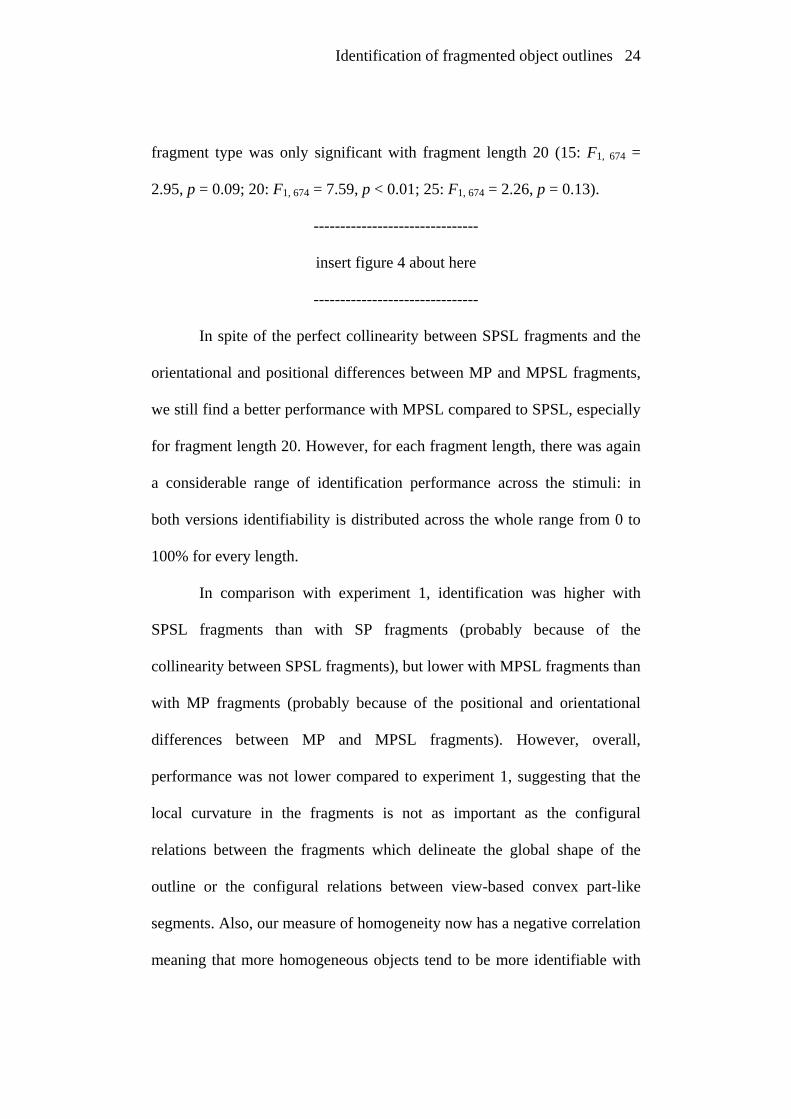
Identification of fragmented object outlines 24
fragment type was only significant with fragment length 20 (15: F1, 674 =
2.95, p = 0.09; 20: F1, 674 = 7.59, p < 0.01; 25: F1, 674 = 2.26, p = 0.13).
-------------------------------
insert figure 4 about here
-------------------------------
In spite of the perfect collinearity between SPSL fragments and the
orientational and positional differences between MP and MPSL fragments,
we still find a better performance with MPSL compared to SPSL, especially
for fragment length 20. However, for each fragment length, there was again
a considerable range of identification performance across the stimuli: in
both versions identifiability is distributed across the whole range from 0 to
100% for every length.
In comparison with experiment 1, identification was higher with
SPSL fragments than with SP fragments (probably because of the
collinearity between SPSL fragments), but lower with MPSL fragments than
with MP fragments (probably because of the positional and orientational
differences between MP and MPSL fragments). However, overall,
performance was not lower compared to experiment 1, suggesting that the
local curvature in the fragments is not as important as the configural
relations between the fragments which delineate the global shape of the
outline or the configural relations between view-based convex part-like
segments. Also, our measure of homogeneity now has a negative correlation
meaning that more homogeneous objects tend to be more identifiable with

Identification of fragmented object outlines 25
MPSL fragments than with SPSL fragments. This is understandable since
SPSL fragments will introduce spurious angles for the more homogeneous
(ie more circle-like) outlines. When identification rate is averaged across
lengths, there are 90 objects that show better identification in MPSL than in
SPSL, while 88 objects show the opposite pattern. T-tests for independent
samples indicated significant differences between both sets (SPSL > MPSL
and SPSL < MPSL; N = 47) only for our measure of homogeneity (average
homogeneity for objects showing MPSL > SPSL: 36.6, and for SPSL >
MPSL: 16.5, p < 0.02). We will return to these findings in the General
Discussion.
5 Experiment 3: Identification based on salient points
5.1 Introduction
We test Deregowski’s (1986) strict interpretation of Attneave’s
hypothesis, i.e. that the high curvature points themselves contain most
information, by presenting only the SPs, only the MPs, or both. We realise
that identification could drop substantially, but even with low identification
scores it is interesting to study whether identifiability differs between SPs
and MPs. Conceptually, we consider a point to be – in the limit – the
smallest possible fragment.

Identification of fragmented object outlines 26
5.2 Methods
5.2.1 Subjects. 124 first-year, naïve psychology students participated.
5.2.2 Stimuli. The same 186 objects as in experiment 1 were used. We
presented the SPs alone (SPpt), the MPs alone (MPpt), or all points together
(SPMPpt).
5.2.3 Procedure. The 186 stimuli were divided in 2 groups and each group
subsequently in three subgroups, each containing 30 to 32 objects. Each
subject was randomly allocated to a group and saw each of the 3
corresponding subgroups in one of 3 within-subject conditions (3 levels of
point type). Assignment of groups to subjects and subgroups to conditions
was counterbalanced across subjects. Every participant received 93 trials.
Each object was shown in each condition to 20 – 22 subjects.
5.3 Results and discussion
First, we calculated percentage correct responses for each
combination of subject (N = 124) and fragment type (SPpt, MPpt and
SPMPpt). These scores were analysed as a repeated-measures block design
with fragment type as a within-block factor and subject as a random block
factor (see also table 1). The main effect of fragment type was significant
(F2, 246 = 501.48, p < 0.001). Tukey-Kramer corrected a posteriori
comparisons showed that all three differences are significant. Mean percent
correct identification in SPpt (17.41) was higher than that in MPpt (12.80),
but lower than in SPMPpt (38.85).
Identification of fragmented object outlines 27
We find partial evidence for Deregowski’s (1986) strict
interpretation of Attneave’s hypothesis since on average, SPs are better
identifiable than MPs, but for many objects much information is lost, even
when SPs and MPs are presented together. This result shows that a
substantial amount of crucial information for identification is present in the
orientational information provided by fragments compared to points. Again,
there was a considerable range of identification performance across the
stimuli: Most of the stimuli were hard to identify (102 objects or 55% have
identification rates < 11% in both the SPpt and MPpt conditions) but in
every condition identifiability is distributed across the whole range from 0
to 100%.
It is not surprising that, on average, SPs allow better identification
than MPs because De Winter and Wagemans (2007b) found that straight-
line versions connecting SPs were on average better identifiable than
straight-lines connecting MPs. Probably people mentally connected the
points with virtual lines and this works fine for those objects in which the
points that neighbour each other on the contour are closest to each other, or
in other words, in which the density of the points is low enough so that it is
clear which points have to be connected. This interpretation is supported by
our observation that all objects showing SPpt > MPpt also show SPSL >
MPSL. The relative position of the salient points of these objects thus shows
the global shape better than for other objects.

Identification of fragmented object outlines 28
6 General Discussion
It is not surprising that cartoonists only need to draw a few lines to
evoke object recognition when our visual system is highly sensitive to view-
based configural relations between contour segments in fragmented object
contours. In this paper we tested the identifiability of different fragmented
object outlines. In experiment 1 we observed that the relatively straight MP
fragments from the original bounding contour are on average more
identifiable than SP fragments for every fragment length tested, consistent
with the findings of Kennedy and Domander (1985). In experiment 2 we
fragmented straight-line versions connecting SPs and we found that the
straight MPSL fragments are more easily identified than the angular SPSL
fragments (especially for 20% contour), in spite of the perfect collinearity
between SPSL fragments and the possible changes in position and
orientation of MPSL fragments compared to the MP fragments from the
original outline. In contrast, when points were presented in experiment 3,
SPs lead on average to higher identification rates than MPs. Since
identifiability was lowest in experiment 3, we find only partial evidence for
Deregowski’s (1986) strict interpretation of Attneave’s (1954) hypothesis
that most information is concentrated in the salient points themselves.
However, the generality of these findings has to be questioned
because (1) in every experiment and for every fragment length tested, our
manipulations affect different objects to different extents, (2) in every

Identification of fragmented object outlines 29
experiment and for every fragment length tested, a considerable number of
objects show a pattern opposite to the average pattern (see table 1), (3)
objects showing SP > MP are not necessarily showing SLSP > SLMP or
vice versa, and finally (4) taking the first two experiments together, some
objects are identified > 85% correct in every experimental manipulation (N
= 16), while others are almost never identified correctly (< 15%, N = 6).
The latter finding suggests that diagnostic identity information can be
present at different structural levels, eg from the global shape (the
configural relations between convex part-like segments) to more local and
detailed levels (eg the exact position and shape of a curved fragment, or the
exact configural relation between two fragments). So, on top of the average
differences between conditions, there is a large variability as well.
One interpretation of this variability is that the visual system is very
sensitive to the configural properties between the fragments, and that the
configural relations change with changing fragment properties. For
example, when local curvature information is deleted by presenting SPSL
and MPSL fragments, performance patterns can change dramatically
compared to SP and MP fragments (as shown by the fact that SPSL – MPSL
difference scores do not correlate with compactness, area, length and
number of peaks as do the SP – MP difference scores, and by the fact that
homogeneity correlates positively with SP – MP scores, but negatively with
SPSL – MPSL scores). Also, when fragments get larger, there can be a large

Identification of fragmented object outlines 30
change in whether or not some configural properties still exist or emerge
between two fragments.
This observed sensitivity to configural properties is consistent with
the observed dominance of global, configural properties between fragments
during completion (Kimchi 1994; Kimchi and Bloch 1998; Sekuler 1994;
Sekuler et al 1994) and suggests that the global shape of objects is an
important factor for determining which fragments of the contour are useful
for identification. Indeed, psychophysical, anatomical and
neurophysiological research on contour integration has shown that the local
orientation-specific interactions between neurons in early visual cortex are
context dependent and are involved in perceiving closure and figure-ground
assignment (see Kovács 1996 for a review). Again, such context
dependency is consistent with our findings that MP fragments tend to
convey more identification information compared to SP fragments for
complex object outlines (less homogeneous, less compact, more peaks,
more inflections, higher average absolute curvature, a longer contour, a
larger area, more fragments or salient points, and more parts), while curved
SP fragments convey more information for outlines with the opposite
characteristics (see table 2). Since we defined outline homogeneity as the
number of strong extrema divided by contour length squared, this measure
will increase when there are more “strong” extrema and/or when the contour
gets shorter. Because the contours are closed, higher outline homogeneity
values (eg when the contour gets shorter for a constant number of strong

Identification of fragmented object outlines 31
extrema) will indicate lower part saliency and vice versa. Because part
saliency (see De Winter and Wagemans 2007a; Hoffman and Singh 1997) is
defined by the combination of these measures (compactness, outline
complexity, contour length, area, number of strong extrema), our results
suggest that complex outlines with high part saliency show an MP
advantage, while simple outlines with low part saliency show an SP
advantage.
An influence of global factors has also been observed in other
studies using the same stimulus set, for example, De Winter and Wagemans
(2007b) and De Winter and Wagemans (2006) who found global influences
on identifiability of straight-line versions and on segmentation, respectively.
To study the influence of global outline characteristics on identifiability of
fragmented versions a posteriori, we grouped the objects depending on their
performance patterns (SP > MP or SP < MP, and/or SPSL > MPSL or SPSL
< MPSL). This revealed some interesting observations. For example,
objects showing SP < MP but SPSL > MPSL are mostly man-made and
have a global shape with many straight segments and angles, so that the
perfect alignment between SLSPs is resembling the true shape much better
compared to the SPs. In contrast, objects that show SP > MP, but SLSP <
SLMP, have in general contours that are curved and consist of few parts.
These objects require local curvature information to be well identifiable and
suffer from the presence of sharp corners in SPSL. Also, highly identifiable
objects (74% – 100% in each of 14 fragment conditions) showing SP = MP

Identification of fragmented object outlines 32
and SPSL = MPSL have relatively complex contours and a characteristic
global shape without much diagnostic information at the level of small
details (many animals and symmetrical objects). In contrast, objects which
have an MP advantage (SP < MP and SPSL < MPSL) have many parts and
long complex contours. Some of these objects suffer from cluttering or
grouping ambiguity in the SP and SPSL conditions, while for other objects,
some MP and MPSL fragments contain diagnostic configural information
that is not explicitly present in the SP and SPSL fragments. Objects which
have an SP advantage (SP > MP and SLSP > SLMP) are very compact and
homogeneous and contain a critical curved feature that is not explicitly
present in the MP and SLMP conditions. Also, objects showing SP = MP
and SPSL < MPSL have mainly curved segments in their contour, and most
of these objects have few parts and are symmetrical. Some even show better
identification with SL fragments than with the complete SL figure (reported
by De Winter and Wagemans 2007b), because their global shape is
smoothly curved and therefore the SL figure resembles the original shape
less than the SL fragments for which the completion process can fill in
curved segments. These observations thus reveal the same general trend as
was found in De Winter and Wagemans (2007b), ie all fragment versions of
sufficiently complex object contours without distinctive features at the level
of small details can generally be identified well based on the global shape,
regardless of the type of fragment (salient point versus midpoint).
Conversely, shapes that are hard to identify from the complete contour (<

Identification of fragmented object outlines 33
20%) can never be identified from fragments. When other object contours
are fragmented, it is the specific selection of fragments that will determine
whether identification is still possible: when the grouping process preserves
the global shape characteristics or more local distinctive configural features,
identification is good and otherwise it is poor.
To understand why the global shape determines whether straight or
curved fragments enjoy an identification advantage, we need to understand
the effect of shape complexity on grouping and matching processes.
Because complex shapes are structurally dissimilar, while more simple
shapes are structurally similar (Donderi 2006), and because Gerlach et al
(2004, 2006) suggested that high structural similarity is an advantage during
grouping, but not during matching, we propose the following tentative
explanation for our results. First, because fragmenting object outlines that
are complex and have high part saliency will lead to difficult grouping of
the fragments and, once grouped, to easy matching because of their
structural variability or outline diagnosticity, we hypothesize that complex
outlines will enjoy an MP advantage during grouping processes because the
configural relations (symmetry, collinearity, proximity, etc.) are stronger
between straight fragments, compared to curved fragments of the same
length. This explanation is consistent with the results of Singh and Fulvio
(2005), who studied extrapolation of contour geometry and found (1) that
extrapolation of curvature increases linearly with the curvature of the
inducing contour, and (2) that the overall precision of the extrapolated

Identification of fragmented object outlines 34
contour decreases systematically with curvature. Second, because
fragmenting simple outlines with low part saliency will lead to easy
grouping but difficult matching, we hypothesize that simple outlines will
enjoy an SP advantage during matching, because many object
representations will be activated that are structurally similar to the input
object. Testing these alternatives by comparing stored information with the
input can be done better with curved SP fragments because only they
contain exact information about the location and shape of part boundaries
(concavities) and part end-points (convexities).
Dissociating between competitive grouping between configural
properties and matching processes can also explain why information theory
and perceptual saliency studies indicate extrema as important points in
closed shapes, while some identification studies (Kennedy and Domander
1985, but see Biederman and Blickle 1985) found that fragments around
midpoints are more identifiable than fragments around extrema. In
particular, when points are presented alone, the only information conveyed
is relative (and absolute) position. We have shown in experiment 3 that
much information is lost when only certain points of the outline are shown
(only 27 objects show at least 50% identification in SPpt or MPpt)
indicating a grouping problem. In other words, it seems invalid to reason in
terms of information concentration in points, since shape depends on the
configural relations between points and fragments. The fact that none of our
stimulus measures correlated significantly with the SPpt – MPpt difference

Identification of fragmented object outlines 35
suggest that other factors related to ‘clutter’ determine whether
identification based on points is possible, for example, the difference
between the distance between points along the contour and the distance
between points in the 2-D plane.
However, when small fragments are added, orientation and curvature
information is available and configural properties such as collinearity
(Claessens and Wagemans 2005), symmetry (Wagemans 1995, 1997),
parallelism, etc. can come into play. The results of experiment 1 showed
that these configural properties are very powerful: many objects (N = 46 or
25% for SP fragments and N = 65 or 35% for MP fragments) are
identifiable (by at least 80% of our subjects) when only 15% of the contour
is shown. Furthermore, we found that MP fragments add more information
to MPs (from 12.8% for MPpt to 54.3% for MP15) than SP fragments to
SPs (from 17.4% for SPpt to 46.5% for SP15), consistent with an MP
advantage during difficult grouping conditions (small fragments and/or
complex shapes). It could therefore be interesting to study whether
configural properties other than collinearity are detected more easily
between straight than between curved segments. Although Kimchi (1994)
did not test this hypothesis explicitly, there is a trend in her data which is
consistent with this idea. However, we hypothesize that when the configural
grouping of the fragments will extract a global shape that is simple and
which will activate many candidate objects, then matching processes will
Identification of fragmented object outlines 36
benefit from the SP fragments because they contain exact information about
location and shape of part boundaries and part end-points.
Finally, when large fragments are added so that closure is possible,
or when the complete contour is shown, the grouping process always
generates a valid solution and there is no competition between configural
relations. Because subjects will be matching the closed contours to memory,
the areas that are perceptually salient parts will be the extreme curvature
areas. We hypothesize that the presentation of closed contours is the simple
reason why saliency studies find that extrema are more important for shape
representation. Similarly, Feldman and Singh (2005) started from a non-
fragmented line when they applied information theory to show that curved
segments contain more information compared to straight segments, thereby
“bypassing” any effect of competitive grouping processes.
Theories such as RBC (Biederman 1987) that require that the parts
are identified based on detecting concavities, before the object can be
identified, would not predict the following observations. First, the deletion
of local curvature in experiment 2 did not result in an overall lowering of
the performance and affected only a subset of all objects to different
(positive and negative) extents. Second, we noticed that some stimuli were
identified differently depending on the perceived facing (left or right). For
example, a right facing snail was sometimes identified as a left facing
whale. Pavlova et al (2002) noticed a similar top-down influence of
apparent direction of locomotion on the perceptual interpretations of
Identification of fragmented object outlines 37
biological motion stimuli presented normally or backwards. It seems that
the initial global interpretation of the facing of the fragmented stimulus
influences the perceptual interpretation and the perceived local groupings of
the fragments, and inhibits the intended groupings (see also Bruner and
Potter 1964). Third, Feldman and Singh (2005) used information theory to
show that concavities contain more information than convexities, but only
under the assumption of closure, i.e., only when grouping processes have
extracted the global shape. Logically, this implies that discriminating
between convexities and concavities is only possible when the global shape
is represented. Indeed, Barenholtz and Feldman (2003) showed that the
single-part superiority effect – faster perceptual comparisons when crossing
curvature maxima (convexities) than minima (concavities) – disappears
when the global configuration was not consistent with a part-boundary
interpretation (see also Vandekerckhove et al 2007). Finally, initial evidence
consistent with the hypotheses of an early MP grouping advantage for
complex outlines, and a later SP matching advantage for simple outlines, is
provided by Panis and Wagemans (2007). Their results suggest that the
initial contact with memory is based on the global shape that is extracted
early by configural grouping processes operating in parallel, and not on the
detection of concavities and discriminating them from convexities in
parallel. We thus conclude that the contradictory results of Biederman and
Blickle (1985) and Kennedy and Domander (1985) are mainly due to (1)
their unrepresentative choice of shapes with too little variation in outline

Identification of fragmented object outlines 38
complexity, and partly to (2) their unsystematic control of the distribution of
fragments and extent of deletions.
To summarize, we have shown that the salient segments in closed
outlines are not necessarily the most informative or perceptually relevant
when fragmented outlines have to be identified. Which fragments contain
the most information is influenced by the configural properties between the
fragments and therefore also by the fragment properties (curvature, length,
absolute position), and by the complexity of the inferred global shape. Our
tentative explanation for the interaction between part saliency or outline
complexity and fragment curvature, is that straight fragments enjoy an
identification advantage for complex shapes when grouping is difficult but
matching easy, while curved fragments enjoy an identification advantage for
simple shapes when grouping is easy but matching difficult. Compared to
the introspection in saliency studies where the complete shape is represented
before points are selected, we think that systematically controlled
fragmentation is a good operationalisation to find the most informative
regions for object identification because only minimal information is shown.

Identification of fragmented object outlines 39
References
Attneave F, 1954 “Some informational aspects of visual perception” Psychological Review
61 183 – 193
Barenholtz E, Feldman J, 2003 “Visual comparisons within and between object parts:
Evidence for a single-part superiority effect” Vision Research 43 1655 – 1666
Beintema J A, Lappe M, 2002 “Perception of biological motion without local image
motion” Proceedings of the National Academy of Sciences 99 5661 – 5663
Biederman I, 1987 “Recognition-by-components: A theory of human image understanding”
Psychological Review 94 115 – 147
Biederman I, Cooper E E, 1991 “Priming contour-deleted images: Evidence for
intermediate representations in visual object recognition” Cognitive Psychology 23
393 – 419
Bruner J S, Potter M C, 1964 “Interference in visual recognition” Science 144 424 – 425
Cave C B, Kosslyn S M, 1993 “The role of parts and spatial relations in object
identification” Perception 22 229 – 248
Claessens P M, Wagemans J, 2005 “Perceptual grouping in Gabor lattices: proximity and
alignment” Perception & Psychophysics 67 1446 – 1459
Deregowski J B, 1986 “Shape and contour: Dots and dashes” Perception 15 217
De Winter J, Wagemans J, 2004 “Contour-based object identification and segmentation:
Stimuli, norms and data, and software tools” Behavior Research Methods,
Instruments, and Computers 36 604 – 624
De Winter J, Wagemans J, 2006 “Segmentation of object outlines into parts: A large-scale
integrative study” Cognition 99 275 – 325
De Winter J, Wagemans J, 2007a “Perceptual saliency of points along the contour of
everyday objects: A large-scale study” Revision submitted
De Winter J, Wagemans J, 2007b “The awakening of Attneave’s sleeping cat:
Identification of everyday objects on the basis of straight-line versions of outlines”
Revision submitted
Donderi D C, 2006 “Visual complexity: A review” Psychological Bulletin 132 73 – 97
Edelman S, 1999 Representation and recognition in vision (Cambridge, MA: MIT Press)
Feldman J, Singh M, 2005 “Information along contours and object boundaries”
Psychological Review 112 243 – 252
Gerlach C, Law I, Paulson O B, 2004 “Structural similarity and category-specificity: A
refined account” Neuropsychologia 42 1543 – 1553
Gerlach C, Law I, Paulson O B, 2006 “Shape configuration and category-specificity”
Neuropsychologia 44 1247 – 1260

Identification of fragmented object outlines 40
Hayworth K J, Biederman I, 2006 “Neural evidence for intermediate representations in
object recognition” Vision Research 46 4024 – 4031
Hess R, Field D, 1999 “Integration of contours: New insights” Trends in Cognitive
Sciences 3 480 – 486 Hochstein S, Ahissar M, 2002 “View from the top: Hierarchies and reverse hierarchies in
the visual system” Neuron 36 791 – 804
Hoffman D D, Richards W A, 1984 “Parts of recognition” Cognition 18 65 – 96
Hoffman D D, Singh M, 1997 “Salience of visual parts” Cognition 63 29 – 78
Horng J-H, 2003 “An adaptive smoothing approach for fitting digital planar curves with
line segments and circular arcs” Pattern Recognition Letters 24 565 – 577
Keane S K, Hayward W G, Burke D, 2003 “Detection of three types of change to novel
objects” Visual Cognition 10 101 – 127
Kennedy J M, Domander R, 1985 “Shape and contour: The points of maximum change are
least useful for recognition” Perception 14 367 – 370
Kimchi R, 1994 “The role of wholistic/configural properties versus global properties in
visual form perception” Perception 23 489 – 504
Kimchi R, Bloch B, 1998 “Dominance of configural properties in visual form perception”
Psychonomic Bulletin and Review 5 135 – 139
Koenderink J J, van Doorn A J, 1978 “How an ambulant observer can construct a model of
the environment from the geometrical structure of the visual inflow”, in
Kybernetic, 1997 Eds. G Hauske, E Butenandt (Munchen, Oldenbourg) pp 224 –
247
Koenderink J J, van Doorn A J, 1982 “The shape of smooth objects and the way contours
end” Perception 11 129 – 137
Kourtzi Z, Tolias A S, Altmann C F, Augath M, Logothetis N K, 2003 “Integration of local
features into global shapes: Monkey and human fMRI studies” Neuron 37 333 –
346
Kovács I, 1996 “Gestalten of today: early processing of visual contours and surfaces”
Behavioural Brain Research 82 1 – 11
Lamote C, Wagemans J, 1999 “Rapid integration of contour fragments: From simple
filling-in to parts-based shape description” Visual Cognition 6 345 – 361
Littell R C, Milliken G A, Stroup W W, 1996 SAS system for mixed models. SAS Institute
Leuven. ISBN/ISSN : 1-55544-779-1.
Liu Z, Jacobs D W, Basri R, 1999 “The role of convexity in perceptual completion: beyond
good continuation” Vision Research 39 4244 – 4257

Identification of fragmented object outlines 41
Lowe D G, 1987 “Three-dimensional object recognition from single two-dimensional
images” Artificial Intelligence 31 355 – 395
Murray S O, Schrater P, Kersten D, 2004 “Perceptual grouping and the interactions
between visual cortical areas” Neural Networks 17 695 – 705
Norman J F, Phillips F, Ross H E, 2001 “Information concentration along the boundary
contours of naturally shaped solid objects” Perception 30 1285 – 1294
Palmer S E, Brooks J L, Nelson R, 2003 “When does grouping happen?” Acta
Psychologica 114 311 – 330
Panis S, Wagemans J, 2007 “Time-course contingencies in perceptual organization and
identification of fragmented object outlines” Manuscript submitted
Pavlova M, Krägeloh-Mann I, Birbaumer N, Sokolov A, 2002 “Biological motion shown
backwards: the apparent-facing effect” Perception 31 435 – 443
Pomerantz J R, Sager L C, Stoever R J, 1977 “Perception of wholes and of their
component parts: Some configural superiority effects” Journal of Experimental
Psychology: Human Perception and Performance 3 422 – 435
Rolls E T, Deco G, 2002 Computational neuroscience of vision (Oxford: Oxford University
Press)
Sekuler A B, 1994 “Local and global minima in visual completion: effects of symmetry
and orientation” Perception 23 529 –545
Sekuler A B, Palmer S E, Flynn C, 1994 “Local and global processes in visual completion”
Psychological Science 5 260 – 267
Severens E, Van Lommel S, Ratinckx E, Hartsuiker R J, 2005 “Timed picture naming
norms for 590 pictures in Dutch” Acta Psychologica 119 159 – 187
Singh M, Fulvio J M, 2005 “Visual extrapolation of contour geometry” Proceedings of the
National Academy of Sciences of the U.S.A. 102 939 – 944
Singh M, Hoffman D D, 2001 “Part-based representations of visual shape and implications
for visual cognition”, in From fragments to objects: Grouping and segmentation
in vision Eds. T F Shipley, P J Kellman (Amsterdam: Elsevier) pp 401 – 459
Snodgrass J G, Vanderwart M, 1980 “A standardized set of 260 pictures: Norms for name
agreement, image agreement, familiarity, and visual complexity” Journal of
Experimental Psychology: Human Learning and Memory 6 174 – 215
Spillman L, 1999 “From elements to perception: Local and global processing in visual
neurons” Perception 28 1461 – 1492
Tarr M J, Pinker S, 1989 “Mental rotation and orientation-dependence in shape
recognition” Cognitive Psychology 21 233 – 282

Identification of fragmented object outlines 42
Todd J T, 2004 “The visual perception of 3D shape” Trends in Cognitive Sciences 8 115 –
121
Ullman S, 1989 “Aligning pictorial descriptions: An approach to object recognition”
Cognition 32 193 – 254
Vandekerckhove J, Panis S, Wagemans J, 2007 “The concavity effect is a compound of
local and global effects” Perception & Psychophysics (in press)
Van Gool L, Moons T, Pauwels E, Wagemans J, 1994 “Invariance from the Euclidean
geometer’s perspective” Perception 23 547 – 561
Wagemans J, 1995 “Detection of visual symmetries” Spatial Vision 9 9 – 32
Wagemans J, 1997 “Characteristics and models of human symmetry detection” Trends in
Cognitive Sciences 1 346 – 352
Wagemans J, De Winter J, Op de Beeck H, Ploeger A, Beckers T, Vanroose P, 2007
“Identification of everyday objects on the basis of silhouette and outline versions”
Manuscript submitted
Wagemans J, Notebaert W, Boucart M, 1998 “Lorazepam but not diazepam impairs
identification of pictures on the basis of specific contour fragments”
Psychopharmacology 138 326 – 333
Wagemans J, Panis S, De Winter J, Op de Beeck H, 2001 “Perceptual and conceptual
priming in picture identification on the basis of contour fragments with specific
curvature properties” Journal of Vision 1(3), 97a (VSS, Sarasota, USA)

Identification of fragmented object outlines 43
Acknowledgements. This research was supported by a research grant from
the University of Leuven Research Council (OT/00/007) and from the Fund
for Scientific Research (FWO Flanders, G.0189.02N). This study is part of a
larger research program with financial support from the University Research
Council (GOA/2005/03-TBA) to the Laboratory of Experimental
Psychology. We want to thank two anonymous reviewers for their helpful
comments on an earlier version of this article.

Identification of fragmented object outlines 44
Tables.
Table 1. Descriptive information of the objects in each of three groups (SP > MP, SP = MP, SP < MP), tabulated separately for each experiment and for each fragment length. Each cell contains the number of stimuli, the average percent identification difference, and the median identification difference. The last column (AV) shows these values when identification performance for each fragment type is first averaged across fragment lengths for each object. Experiment 1 15% 20% 25% 30% AV
SP < MP 101 106 99 91 117 -23.3 -20.3 -20.2 -18.2 -15.9 -19.2 -15.4 -15.4 -16 -12.9
SP = MP 23 23 37 41 6 0 0 0 0 0 0 0 0 0 0
SP > MP 62 57 50 54 63 14.7 13.4 14.3 14.6 9.7 12 8 8 8 6
Experiment 2 15% 20% 25% AV SPSL < MPSL 82 92 70 90
-17.7 -15.8 -19.2 -13.6 -12.1 -12.6 -15.4 -10.5
SPSL = MPSL 21 32 37 8 0 0 0 0 0 0 0 0
SPSL > MPSL 83 62 79 88 13.9 15.6 13.9 10
10.5 14.3 10.5 6.9 Experiment 3
SPpt > MPpt 81 17.4 11.8
SPpt = MPpt 60 0 0
SPpt < MPpt 45 -12.5
-10

Identification of fragmented object outlines 45
Table 2. Results of t-tests for independent samples on the N = 47 most
extreme objects at both ends of the average ‘SP - MP’ identification
distribution in experiment 1. The average of the outline measures (column
1) of the objects in both groups are shown in column 2 and 3. The t- and p-
values are shown in columns 4 and 5.
Experiment 1 SP<MP SP>MP t N=47 Area 40179.02 29420.77 3.37 p < .01 Number of inflections 27.49 18.81 2.84 p < .01 Peaks 15 9.83 2.69 p < .01 Compactness 13.53 30.21 2.56 p < .02 Length 1414.51 1153.58 2.52 p < .02 Homogeneity 16.24 34.69 2.28 p < .03 AvAbsCurv 0.29 0.2 2.2 p < .04 Number of fragments 30.19 23.4 2.17 p < .04 AvDeltaAbsCurv 0.04 0.02 2.13 p < .04 Number of parts 5.3 4.06 2.05 p < .05

Identification of fragmented object outlines 46
Figure Captions
Figure 1. Examples of SP and MP fragments for stimulus No. 182 (rabbit)
for each fragment length. On the closed contour, triangles indicate salient
points with negative curvature, squares salient points with positive curvature
and circles indicate midpoints.
Figure 2. Percent correct identification in experiment 1 as a function of
fragment length (15, 20, 25, 30%) and fragment type (SP and MP). Error
bars indicate standard error of the mean (S.E.M. = .8038).
Figure 3. Examples of SPSL and MPSL fragments for stimulus No. 146
(moon) for each fragment length. Below, the original and SL contour are
shown, with triangles indicating salient points with negative curvature,
squares salient points with positive curvature and circles midpoints. Notice
the change in position between the encircled MPSLs and the MPs.
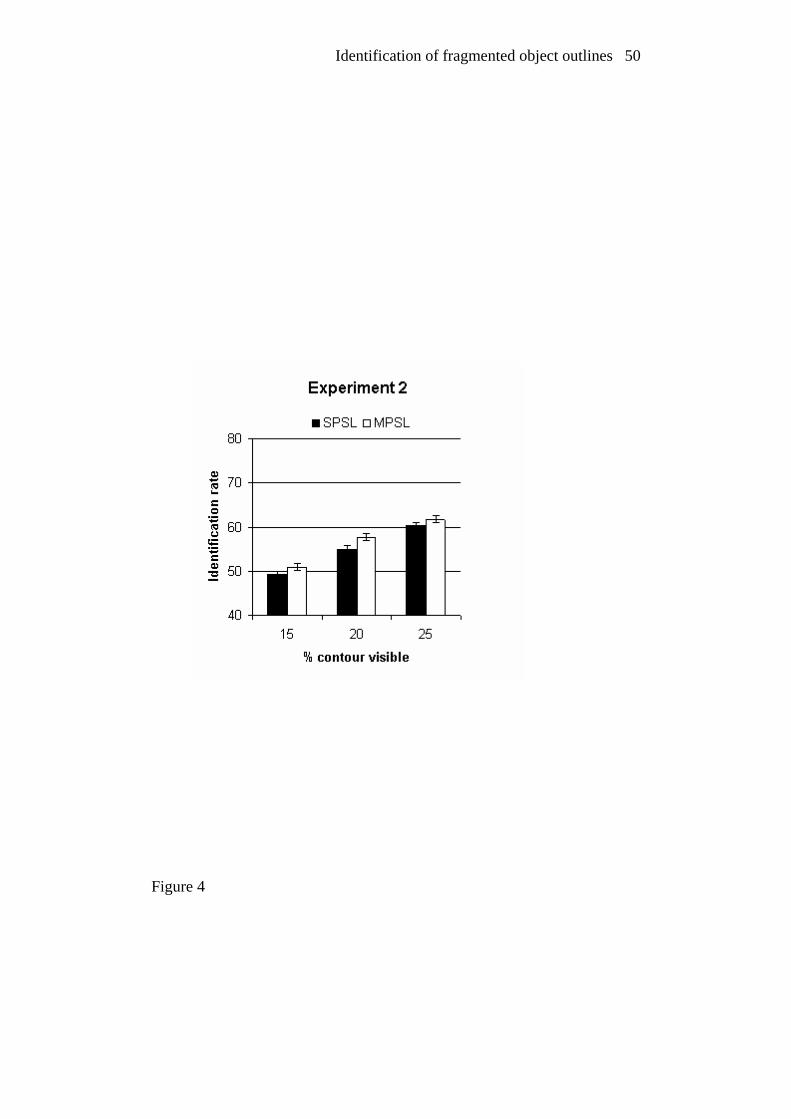
Figure 4. Percent correct identification in experiment 2 as a function of
fragment length (15, 20, 25%) and fragment type (SPSL and MPSL). Error
bars indicate standard error of the mean (S.E.M. = .7662).
Identification of fragmented object outlines 47
Figures
Figure 1
Identification of fragmented object outlines 48
Figure 2

Identification of fragmented object outlines 49
Figure 3
Identification of fragmented object outlines 50
Figure 4


