Embed Size (px)
Citation preview

Teku et al. BMC Systems Biology 2014, 8:17http://www.biomedcentral.com/1752-0509/8/17
RESEARCH ARTICLE Open Access
Identification of core T cell network based onimmunome interactomeGabriel N Teku1†, Csaba Ortutay2,3† and Mauno Vihinen1,2,3*
Abstract
Background: Data-driven studies on the dynamics of reconstructed protein-protein interaction (PPI) networksfacilitate investigation and identification of proteins important for particular processes or diseases and reducestime and costs of experimental verification. Modeling the dynamics of very large PPI networks is computationallycostly.
Results: To circumvent this problem, we created a link-weighted human immunome interactome and performed filtering.We reconstructed the immunome interactome and weighed the links using jackknife gene expression correlation of inte-grated, time course gene expression data. Statistical significance of the links was computed using the Global Statistical Sig-nificance (GloSS) filtering algorithm. P-values from GloSS were computed for the integrated, time course geneexpression data. We filtered the immunome interactome to identify core components of the T cell PPI network(TPPIN). The interconnectedness of the major pathways for T cell survival and response, including the T cell re-ceptor, MAPK and JAK-STAT pathways, are maintained in the TPPIN network. The obtained TPPIN network issupported both by Gene Ontology term enrichment analysis along with study of essential genes enrichment.
Conclusions: By integrating gene expression data to the immunome interactome and using a weightednetwork filtering method, we identified the T cell PPI immune response network. This network reveals the mostcentral and crucial network in T cells. The approach is general and applicable to any dataset that containssufficient information.
Keywords: Protein-protein interaction, Network, Filtering, T cell, TPPIN, Signaling, PPI
BackgroundCellular interactomes often consist of large numbers ofproteins with even larger numbers of connections betweenthem. Typically in protein-protein interaction (PPI) net-work nodes represent proteins and the links represent re-lationships between them. This network representationenables the study and visualization of the reconstructedcellular systems.Data-driven studies on the dynamics of reconstructed
PPI networks facilitate investigation and identification ofproteins important for a particular process and reducestime and costs of experimental verification [1,2]. Modelingthe dynamics of very large PPI networks is computationally
* Correspondence: [email protected]†Equal contributors1Department of Experimental Medical Science, Lund University, Lund,Sweden2Institute of Biomedical Technology, University of Tampere, Tampere, FinlandFull list of author information is available at the end of the article
© 2014 Teku et al.; licensee BioMed Central LtCommons Attribution License (http://creativecreproduction in any medium, provided the or
very costly. To circumvent this problem, one needs toidentify relevant core components of networks without los-ing vital information. A PPI network constituting most ofthe relevant core of a cellular system is sufficient to studyits dynamic properties [3].Many methods have been developed to reduce com-
plex directed and undirected networks to their corecomponents. Some of the methods include topologicalcentrality techniques [4], synthetic biology approaches ofthe minimal gene set of a cell [5,6], complex systemscoarse-graining [7,8], and filtering approaches [9-11]. Inthe centrality methods, topological centrality of nodes isused to identify the non-redundant links and to deletethe redundant ones [11]. Minimal gene set approachesaim to identify genes that are crucial for life sustenanceand cannot be inactivated under specific optimal growthconditions. These approaches do not take into accountinteractions between essential gene products [5]. Thecoarse-graining approaches identify specific motifs in a
d. This is an Open Access article distributed under the terms of the Creativeommons.org/licenses/by/2.0), which permits unrestricted use, distribution, andiginal work is properly credited.

Table 1 KEGG pathways used to supplement IKB dataset
KEGG identifier Name of KEGG pathway
path:hsa04010 MAPK signaling pathway
path:hsa04062 Chemokine signaling pathway
path:hsa04514 Cell adhesion molecules
path:hsa04612 Antigen processing and presentation
path:hsa04620 Toll-like receptor signaling pathway
path:hsa04621 NOD-like receptor signaling pathway
path:hsa04622 RIG-1-like receptor signaling pathway
path:hsa04630 Jak-STAT signaling pathway
path:hsa04640 Hematopoietic cell lineage
path:hsa04650 Natural killer cell mediated cytotoxicity
path:hsa04660 T cell receptor signaling pathway
path:hsa04662 B cell receptor signaling pathway
path:hsa04664 FcεRI signaling pathway
path:hsa04666 FcγR-mediated phagocytosis
path:hsa04670 Leukocyte trans-endothelial migration
path:hsa04672 Intestinal immune network for IgA production
path:hsa04610 Complement and coagulation cascades
path:hsa04623 Cytosolic DNA-sensing pathway
The protein products of the genes that take part in these pathways were usedto supplement the protein data from the IKB database. The combined proteindata represent the immune response protein dataset.
Teku et al. BMC Systems Biology 2014, 8:17 Page 2 of 14http://www.biomedcentral.com/1752-0509/8/17
network, and collapse and replace them by a single node[8]. This process is repeated until there are no more mo-tifs. The final network is less complex but does not con-sider the structural heterogeneity and broad weightdistribution, i.e. the multi-scale nature, of cellular networks.Network filtering approaches have also been used to
reduce network complexity [10-13]. Those that preservethe inherent multiscale structure of natural complex net-works have been shown to be better in revealing most ofthe important components of networks [11,13]. Theseapproaches score the nodes or links, and enable the de-letion of those that do not deviate significantly from anull model.In this study, we identified the network of proteins
relevant in T cells by filtering the immunome interac-tome using the result from Global Statistical Significance(GloSS) [13] algorithm and a constraint of connectivityof the T cell receptor (TCR) signaling pathway. We com-piled genes for the major immune processes and usedthem to reconstruct the immunome interactome, i.e., allthe PPIs of the immunome. We then integrated gene ex-pression profiles for the corresponding genes across sev-eral experiments. Jackknife correlation for gene expressionwas then used to weigh links between the proteinsencoded by the genes. To maintain the multiscale struc-ture of the network during filtering, we used the GloSS al-gorithm. This algorithm utilizes a global null model of thelink weight and the degree distribution of the network. Itcomputes the statistical significance for each link. For thenull model, GloSS assigns weights from the weight distri-bution of the network, independently and randomly, with-out changing its topology. We filtered the network bydeleting links based on their p-values (computed byGloSS) in descending order. To determine the endpoint ofthe filtering, we imposed as a constraint, the existence of asingle path between the components of the NF-κB andTCR complexes.Because we investigated the global and aggregate char-
acteristics of the system and integrated T cell gene ex-pressions, we can assume that the filtered networkcontains most of the components central for T cell sig-naling [14]. This was supported by Gene Ontology (GO)and essential genes enrichment analysis.
ResultsProtein-protein interaction networkWe used altogether 1579 proteins for the network filtering(Additional file 1). Eight hundred and eighty five humanimmunome genes were obtained from the ImmunomeKnowledge Base (IKB) [15]. As IKB contains only themost essential immunome genes and does not necessarilycontain full pathways, it was supplemented with proteinsfor key immune system pathways derived from the KEGGPathway database [16] (Table 1).
The PPI network was reconstructed for the immu-nome proteins (see workflow in Figure 1). PPI data wereretrieved from iRefIndex database (version 9.0) whichcompiles PPIs from the major repositories [17]. ppiTrim(version 1.2.1) was used for general filtering according toStojmirovic et al. [18]. Only experimentally verified andbinary PPIs were retained. Moreover, multiple binaryPPIs encoded by the same gene pair were collapsed intoa single PPI. Finally, binary interactions to proteins out-side the immunome were eliminated. A total of 5603PPIs between 1259 immunome proteins were availableafter these pre-processing steps (Additional files 2 and 3).
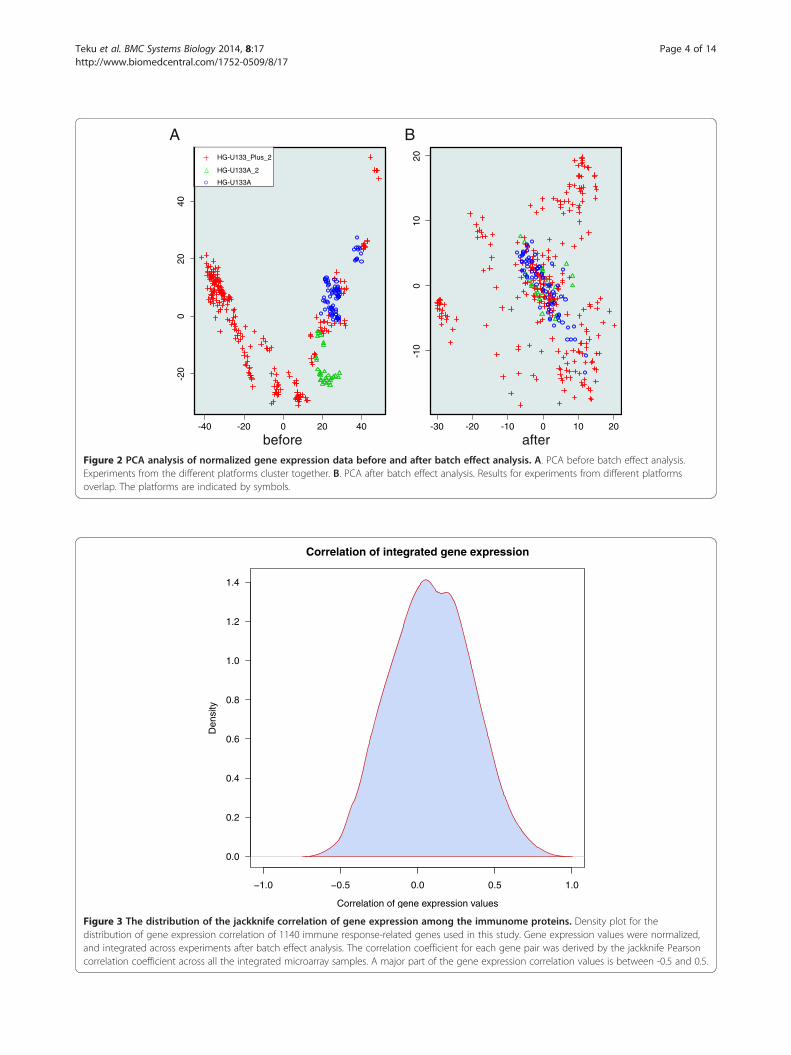
Gene expression correlationT cell gene expression datasets were obtained fromNCBI GEO [19] and EBI ArrayExpress [20] databases.Altogether 16 time series datasets (Additional file 4)containing 384 samples derived from 5 platforms ful-filled the set criteria. After pre-processing, batch effectanalysis was performed. Further, exploratory PrincipalComponent Analysis (PCA) was done to examine theeffect and performance of the batch effect analysis(Figure 2). The samples cluster according to experi-ment and platform before batch effect analysis. How-ever, after batch effect correction, samples performedon all three platforms overlap with each other. Thebatch effect-corrected expression data were integrated

IKB database KEGG Pathways
Immunome protein dataset
iRefIndex database
Quality control of PPIs
GEO microarray data
ArrayExpress raw microarray data
Human T cell, time series raw data
Normalization of Affymetrix whole transcript arrays
Batch effects analysis and integration of gene
expression across arrays
Jackknife correlation of gene expression
Link-weighted immunome interactome
Immunome interactome
Extract immunome
PPIs
Figure 1 Workflow for the reconstruction of the immunome interactome. The general steps taken to reconstruct the immunomeinteractome are shown. The cylinders represent data repositories from which data was retrieved. Parallelograms represent data, either retrievedfrom databases or obtained by analyses. Rectangles represent performed analyses. T cell microarray experiments available in ArrayExpress andthe GEO databases were retrieved. These experiments included at least 3 samples. The selected experiments were normalized using theR/Bioconductor libraries. Batch effect analysis was done and all experiments were merged or integrated. Jackknife Pearson correlation coefficientwas calculated for the integrated dataset. Immunome proteins were retrieved from the Immunome knowledge Base (IKB) and the KEGGpathways databases. Major immune response pathways from the KEGG were used to supplement the IKB immunome proteins. Immunomeinteractome was obtained by retrieving PPIs for the immunome protein dataset from the iRefIndex database. To reduce noisy PPIs we used theppiTrim method and further filtered its output of redundant and non-immune response PPIs. The Jackknife correlation coefficients were used aslink weights.
Teku et al. BMC Systems Biology 2014, 8:17 Page 3 of 14http://www.biomedcentral.com/1752-0509/8/17
or merged together. Of the genes encoding the 1259immunome proteins, 1149 were expressed in at least80% of the samples in the merged dataset and werethus included in the analysis.Next, the mean of the jackknife Pearson product-
moment correlation coefficient was calculated for thepre-processed and merged expression values for all genepair combinations. In total, 1140 genes representing5164 gene pairs encoding interacting proteins in theimmunome interactome were used for further analysis.The distribution of the integrated jackknife correlation
values is shown in Figure 3. The maximum gene expres-sion correlation is 0.88, between ITGA2B (integrin α-IIbor CD41) and ITGB3 (integrin β-3 or CD61). The encodedproteins form an integrin receptor complex [21] and arethus co-expressed. Their functions include cell adhesion,cell-cell interaction, receptor for several molecules andplatelet activation [21]. The minimum correlation of -0.62was observed between LCK, coding for lymphocyte-specific protein tyrosine kinase, and PAK2, p21 protein(Cdc42/Rac)-activated kinase 2. LCK is an important
signaling protein in many cellular processes, especially inT cell receptor (TCR) activation and T cell development[22]. PAK2 is a member of the PAK proteins (a family ofserine/threonine kinases) targeted by small GTP proteins,CDC42 and RAC1 [23,24]. They take part in several sig-naling pathways, including the TCR signaling network. Al-beit association of increased PAK2 activity in cells thatoverexpress Src kinases, PAK2 and LCK have not beenshown to directly interact with each other [25]. The meanof the correlation values for all gene pairs is 0.09 and mostof the correlation coefficients lie between -0.5 and 0.5.
T cell-specific PPI networkWe reconstructed the immunome PPI network as aweighted and undirected graph. The nodes, links, and linkweights of the graph represent, respectively, the immu-nome protein coding genes, the PPIs and the absolutevalue of the mean jackknife expression correlation be-tween the connected immunome protein coding genes.The topology and weight distribution of naturally oc-
curring complex weighted networks are heterogeneous
-40 -20 0 20 40
-20
020
40
HG-U133_Plus_2
HG-U133A_2
HG-U133A
-30 -20 -10 0 10 20-1
00
1020
A B
before afterFigure 2 PCA analysis of normalized gene expression data before and after batch effect analysis. A. PCA before batch effect analysis.Experiments from the different platforms cluster together. B. PCA after batch effect analysis. Results for experiments from different platformsoverlap. The platforms are indicated by symbols.
−1.0 −0.5 0.0 0.5 1.0
0.0
0.2
0.4
0.6
0.8
1.0
1.2
1.4
Correlation of integrated gene expression
Correlation of gene expression values
Den
sity
Figure 3 The distribution of the jackknife correlation of gene expression among the immunome proteins. Density plot for thedistribution of gene expression correlation of 1140 immune response-related genes used in this study. Gene expression values were normalized,and integrated across experiments after batch effect analysis. The correlation coefficient for each gene pair was derived by the jackknife Pearsoncorrelation coefficient across all the integrated microarray samples. A major part of the gene expression correlation values is between -0.5 and 0.5.
Teku et al. BMC Systems Biology 2014, 8:17 Page 4 of 14http://www.biomedcentral.com/1752-0509/8/17

Teku et al. BMC Systems Biology 2014, 8:17 Page 5 of 14http://www.biomedcentral.com/1752-0509/8/17
and tightly connected. This makes the identification ofthe relevant structure that maintains the multiscale na-ture of the network nontrivial. Thus, we used the GloSSalgorithm [13] to compute a p-value, for each link.GloSS identifies the relevant backbone of a weightedgraph while retaining the multiscale coupling of itsweight distribution and topological characteristics. Ituses a global null model that describes both the struc-ture of the network and its weight distribution. Thep-values computed by GloSS were used to filter thenetwork by deleting links based on their p-values, indescending order. We monitored the filtering process tomake sure that the central networks between TCR, andNF-κB and NFAT signaling pathways remained intact.These pathways have been shown to be crucial for T cellsignaling [26,27] and therefore cannot be disconnectedwithout destroying essential cellular processes.We followed changes of structural and biological fea-
tures in the PPI network during the filtering processwith network parameters. The diameter of the networkrepresents the longest minimum distance between thenodes. We used as measures the changes in diameter,the relative size of the largest connected component andthe average size of the isolated components [28]. Thesenetwork topology scores show how connectivity, integ-rity and robustness of the network are changed whenlinks are removed during the filtering process (Figure 4).All the panels in Figure 4 indicate that at the cutoffpoint most of the remaining network’s connectivity andintegrity is still maintained. We call the remaining net-work the T cell PPI Network, TPPIN (Figure 5). TPPINconsists of 288 nodes, 227 links in 73 connected compo-nents (Table 2).
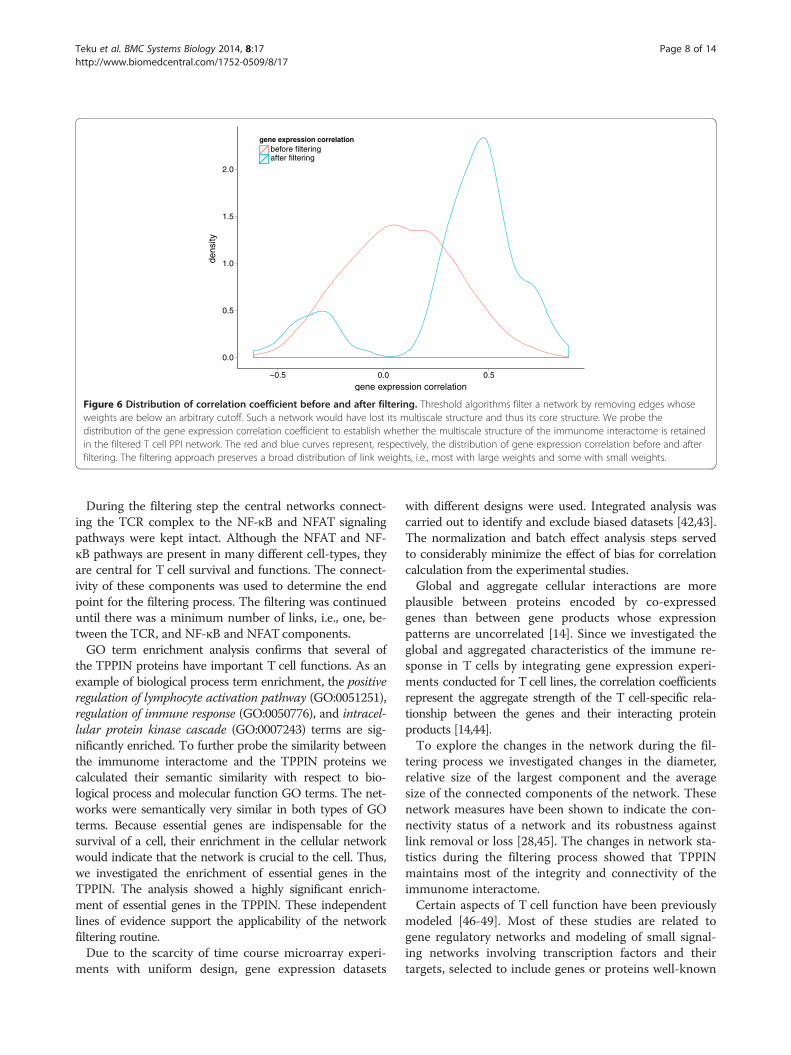
Correlation distribution before and after filteringThreshold algorithms filter a network by removing edgeswhose weights are below an arbitrary cutoff. Such a net-work loses its multiscale and, thus, its core structure.We probed the distribution of the gene expression cor-relation coefficient to establish whether the multiscalestructure of the immunome interactome is retained inthe filtered T cell PPI network (Figure 6). The filteringprocess succeeds in maintaining not just the links withlarge weights but also links with lower weights. Thus,the filtering process maintains the multi-scale structureof the network and retains edges that are crucial for theT cell PPI network.
Effect of noise on the filtering procedureTo test the sensitivity of our filtering procedure to noisewe introduced randomness to the immunome interac-tome, before performing filtering, by randomizing frac-tions of the link weights while preserving the topologyof the network. We refer to these networks as the Link
Weight-Randomized Networks (LWRNs). Nine suchnetworks were created based on the fraction of weightsrandomized. Thirty iterations were conducted for eachLWRN. Each iteration consists of choosing randomly afraction of links, reassigning their weights randomly,conducting the filtering procedure, and calculating net-work topology statistics. The topology features calcu-lated for each iteration include node degree, averagepath length, betweenness centrality of both the nodesand the links, clustering coefficient of the network, andthe intersection between the TPPIN and the LWRN.These measures indicate the local and global connectiv-ity of a network. We retained the average of the abovequantities.Figure 7 shows the similarity or dissimilarity between
TPPIN and LWRNs. Figure 7 A-E, shows that as moreof the link weights are randomized, the topology of theLWRNs diverges significantly from TPPIN. Moreover, asFigure 7 F shows, there is very little overlap of links be-tween the LWRNs and TPPIN.
Gene Ontology over-representation and semanticsimilarity analysisGO term over-representation analysis was performed forthe TPPIN proteins and shows that, at level two details,most of the biological process terms are relevant forT cell function (Table 3 and Additional file 5). For example,the term positive regulation of lymphocyte activationpathway (GO:0051251, p-value = 9.74 × 10⁻⁷), regulationof immune response (GO:0050776, p-value = 1.11 × 10⁻⁶),and intracellular protein kinase cascade (GO:0007243,p-value = 3.40 × 10⁻⁶) terms are among the most sig-nificantly enriched after adjusting for multiple compari-sons. In addition to significant immune response-relatedterms, there are also those for general cellular processes.To better investigate the similarity or difference be-
tween the immunome interactome and the TPPIN net-work, we explored semantic similarity of the networksusing the GOSemSim package available from R/Biocon-ductor. The semantic similarity ranges between 0 and 1.The similarity between the immunome interactome andTPPIN proteins in the biological process and molecularfunction terms were very high, i.e., 0.91 and 0.92, re-spectively, indicating that the TPPIN is very representa-tive of the immunome interactome.
Essential genes over-representation analysisEssential genes are indispensable to the survival of a cellor organism. To account for how essential the genes are,we performed an over-representation analysis to identifythe proportion of the essential TPPIN genes. We con-ducted a hypergeometric test on the human orthologs ofthe mouse lethality genes from the Mouse Genome In-formatics resource [29]. The results show a highly

0.0 0.2 0.4 0.6 0.8 1.0
200
400
600
800
diam
eter
0.0 0.2 0.4 0.6 0.8 1.0
2.0
2.4
2.8
3.2
<s>
0.0 0.2 0.4 0.6 0.8 1.0
0.0
0.2
0.4
0.6
0.8
1.0
S
Network topology changes during filtering
fraction of links removedFigure 4 Network topology changes during GloSS-, NFAT- and NF-κB-assisted filtering. The immune response PPI network topologicalchanges during the filtering process. Network measures were used to investigate the immunome interactome during filtering. The x-axis in eachpanel is the fraction of nodes removed during filtering. On the y-axis, the top panel shows changes in the network diameter, the middle panelchanges in the average size of the isolated components excluding the largest or giant component (<s>). The bottom panel shows changes inthe relative size of the largest or giant component (S). The relative size of the largest component is the number of nodes in the largest compo-nent divided by the number of nodes in the whole network. That is, nrel = n/N, where nrel is the relative size of the largest component, n is thenumber of nodes in the largest component and N is the number of nodes in the whole network). Each of the network measures were plottedagainst the fraction of links removed during filtering. The vertical line shows the point at which the paths between the TCR complex and theNF-κB and NFAT downstream components are broken. This also represents the point at which the filtering process stops. This indicates thatthe connectivity and robustness of the filtered network at this endpoint is maintained. Thus the connectivity and robustness inherent in theimmunome interactome is maintained in the TPPIN.
Teku et al. BMC Systems Biology 2014, 8:17 Page 6 of 14http://www.biomedcentral.com/1752-0509/8/17
significant enrichment of essential genes in the TPPIN(p-value = 1.37 × 10⁻¹⁰, Table 4 and Figure 5).
Interconnection of T cell-specific pathwaysThe TPPIN proteins were mapped onto the TCR, JAK-STAT and MAPK signaling pathways that are central forT cell functions [30] (Figure 8). Albeit containing just athird of the proteins in the initial network, the TPPINincludes almost all the main components for theremaining pathways. Except for CD3γ and CD3δ, all theCD3 proteins of the TCR complex are present in theTPPIN. Further, most proteins important for early T cell
activation, NFAT, AP1, NF-κB, T cell co-inhibitory andco-stimulatory signal transduction are present. Overall,most of the proteins in the important pathways for T cellsignaling are present in the TPPIN. This indicates thatthe filtering procedure was able to, first of all, identifycentral pathways and, secondly, to keep their connectiv-ity. As a novel feature the TPPIN indicates the intercon-nection of the central pathways.
Discussion and conclusionsIn this study, we identified the network of proteins rele-vant for T cells by filtering the multiscale immunome

ATG12
ATG5
ACTB
ACTG1
MYL12A
PSTPIP1
PSME2
IKBKEPSME1
PRNP
IL6
PTPRC
CASP2IRAK4
MAPKAPK2
PIK3CADHX58
WAS
CD1D
TGFB1
KRASDDX58LILRB2
IL1R1
TGFBR1
CASP7
CSF3R
MSN
SELL
CCR3 HCK
NOD1
CRADDIL6R
CSF2RB TRAF3ACKR2
CCL11LYN
CD80
CTLA4
CCL4
ASAP2
CCR5
PLCG1
NFAT5
GRB2
CCR2MAP4K1
STAT2
STAT1 JAK2
ASAP1
IRF2
CRK
JAK1
PIK3R1 IL7R
FYNIL6ST
RIPK1
WASL
CDC42
CASP8
PRKCZ
PTK2 TRAF6
ECSIT
CYLD
RPS6KB1
ITGB7
PXNIL8
CTSL
FLNA
SDC2
CSF2RA
DUSP6
TNFRSF1B
RPS6KA1 PLAUR
CXCL2
ADA DPP4
MAPK1
NOD2
GSK3A
PRKCG
CARD9
CCL2
MYD88
C1QA
C1QB
F2R
PROCR
CXCR2
CCL8
CXCR1
HSPA5
CD72
PIAS2
JUN
POLR2H
POLR2K
BLNK
F2
PROC
IL12RB2
PIP5K1C
STAT4
SRFIRAK3
IL15IL15RA
AIMP1
HSP90B1
IL13
VCAM1
IL12RB1
JAK3
IL2RG
IRF7
TICAM1
PTK2B
HLA-E
CD9
B2M
PRKACA
VASP
IL16
HSP90AA1
GZMB
PRF1
CASP3
PIK3CG
MS4A1ROCK1
YWHAZ
MAPK14
EZR
ZAK
CD4
MAP2K6
DDX3X
MKNK2
F8
TNFRSF8
CANX
ITGB8
LTBR
CALR
PDIA3
CFL1
PRKCQ
LCK
CD2
CD3E
ZAP70
CD247
CD8A
SH2D1A
CXCL10
TNFRSF11A
GNA12
KIT
CCL5CXCR3
TNFRSF9
TNFSF11
TNFRSF4
TRAF1
HLA-B
HLA-C
HLA-A
RHOA
HLA-G
XCL1
VCAN
IGF1R
ITGA4
PTPN11
ITGB1
SPP1
CD46
CRKL SOS2
IL2RB
CISHSOCS2
HRAS CD27
BLM
TRAF5
ARAF
IRAK1
MAPKAPK3
CASP1
IGF2R
CD36 CD63
PYCARD
CARD8
LTA
TNF
MAP3K3
CD5
CFHR4
PIK3CD
IFIH1
CRP
CASP10
AZI2
CD6
AKT1
AKT2
DAXX
RAF1XRCC5
PARP1
TP53
CSF1FADD IRF3
PAK1
STAT3
MAVSTNFRSF1A
AKT3
SOCS1
FLT3LCP2
SHC1
CD22
CD19
STAT5A
ATM IKBKBCTNNA1 PIN1PRKCDCTNND1
RELA
RELB
MAP3K14
NFKBIASTAT5B
NFKB2
CBL
BTKPTPRJ
LEPR
STAM2
PAFAH1B3
SIGIRRPF4
DARCMAP3K5
MAP2K3ITGB3
HLA-DPA1
DUSP1TAOK1
TNFSF13
DUSP10
AP3B1
ARF6
MAPK8
ITGA2B
IL2RA
IL2
HSPA4
ITGAV
MMP2
A2M
RASA1
HSPA1A
HLA-DPB1
POLR3F
POLR3C
CREBBP
IL4R
CD40PIAS3
EP300
CD40LG
TNFRSF17
TGFB2BIRC3
Figure 5 T cell PPI Network and essential genes enrichment. After removing non-immunome genes and immunome genes without thelethality annotations, we calculated the hypergeometric distribution and Fisher’s exact test for significance. The figure demonstrates the enrichmentof essential genes across almost every component of the TPPIN and for the whole network (p-value = 1.37 × 10⁻¹⁰). The node labels are geneidentifiers for the genes coding the proteins. The nodes colored red represent essential genes. The essential genes data is based on thehuman orthologs of the mouse lethality genes from the Mouse Genome Informatics database.
Teku et al. BMC Systems Biology 2014, 8:17 Page 7 of 14http://www.biomedcentral.com/1752-0509/8/17
interactome using the GloSS filtering algorithm [13]. Wecompiled the genes for the major immune processes andreconstructed the immunome interactome. Then we in-tegrated gene expression profiles across several gene ex-pression experiments. The jackknife correlation for geneexpression was used to weigh links between the proteinsencoded by the genes. Next, we used the output fromGloSS to filter the network. The filtered network con-tains most of the relevant T cell functional componentsand was designated TPPIN. This was confirmed by theoverrepresentation analysis conducted with GO termsand essential genes.Many important components of the TCR-dependent
signaling pathways are present in the TPPIN. Except for
Table 2 General structure of the T cell PPI network
Number of nodes inconnected component
Numberof links
Number of componentsin the network
91 100 1
14 14 1
6 5 2
5 4 3
4 3 5
3 2 13
3 3 1
A component represents a set of nodes that are all connected to each other,either directly or indirectly. Components with two nodes are not included inthe table.
CD3γ and CD3δ, other components of the TCR complexwhich are included in the microarrays used in this study,are present (TCR-α and -β are not present in the micro-arrays). The co-receptors CD4 and CD8 are bothpresent, as well as, all the proteins that make up the im-munological synapse. With the exception of LAT, GADSand ITK, most proteins that are central in the immediateTCR receptor-associated intracellular signaling after theformation of the immunological synapse and TCR acti-vation are present in the TPPIN, including LCK, FYN,CD45, ZAP70, SLP-76 and PLC-γ.After its activation, PLC-γ cleaves PIP2 into the sec-
ond messenger IP3 and DAG [31,32]. This event sets offthe activation of three important signaling pathways inT cells that end up with transcriptional activation ofNFAT, NF-κB and AP-1 [30]. DAG activates PKC-θ,which in turn activates NF-κB [33]. IP3 activates CaNthrough the calcium signaling, and CaN subsequentlyactivates NFAT [34]. DAG activates RasGRP [35,36],which in turn initiates the activation of the MAP kinasecascade [37], culminating in the activation of FOS [38].Key proteins in the NF-κB pathway including PKC-θ,IKK-β and IκB [39] are present in the TPPIN. With theexception of RasGRP, MEK1/2 and ELK co-complexes,the other vital proteins in the MAP kinase signaling cas-cade [40] and the JAK-STAT pathway [41] are capturedby the TPPIN. These results show how the TPPIN repre-sents relevant T cell-related parts of the immunomeinteractome.
0.0
0.5
1.0
1.5
2.0
−0.5 0.0 0.5
gene expression correlation
dens
ity
gene expression correlationbefore filteringafter filtering
Figure 6 Distribution of correlation coefficient before and after filtering. Threshold algorithms filter a network by removing edges whoseweights are below an arbitrary cutoff. Such a network would have lost its multiscale structure and thus its core structure. We probe thedistribution of the gene expression correlation coefficient to establish whether the multiscale structure of the immunome interactome is retainedin the filtered T cell PPI network. The red and blue curves represent, respectively, the distribution of gene expression correlation before and afterfiltering. The filtering approach preserves a broad distribution of link weights, i.e., most with large weights and some with small weights.
Teku et al. BMC Systems Biology 2014, 8:17 Page 8 of 14http://www.biomedcentral.com/1752-0509/8/17
During the filtering step the central networks connect-ing the TCR complex to the NF-κB and NFAT signalingpathways were kept intact. Although the NFAT and NF-κB pathways are present in many different cell-types, theyare central for T cell survival and functions. The connect-ivity of these components was used to determine the endpoint for the filtering process. The filtering was continueduntil there was a minimum number of links, i.e., one, be-tween the TCR, and NF-κB and NFAT components.GO term enrichment analysis confirms that several of
the TPPIN proteins have important T cell functions. As anexample of biological process term enrichment, the positiveregulation of lymphocyte activation pathway (GO:0051251),regulation of immune response (GO:0050776), and intracel-lular protein kinase cascade (GO:0007243) terms are sig-nificantly enriched. To further probe the similarity betweenthe immunome interactome and the TPPIN proteins wecalculated their semantic similarity with respect to bio-logical process and molecular function GO terms. The net-works were semantically very similar in both types of GOterms. Because essential genes are indispensable for thesurvival of a cell, their enrichment in the cellular networkwould indicate that the network is crucial to the cell. Thus,we investigated the enrichment of essential genes in theTPPIN. The analysis showed a highly significant enrich-ment of essential genes in the TPPIN. These independentlines of evidence support the applicability of the networkfiltering routine.Due to the scarcity of time course microarray experi-
ments with uniform design, gene expression datasets
with different designs were used. Integrated analysis wascarried out to identify and exclude biased datasets [42,43].The normalization and batch effect analysis steps servedto considerably minimize the effect of bias for correlationcalculation from the experimental studies.Global and aggregate cellular interactions are more
plausible between proteins encoded by co-expressedgenes than between gene products whose expressionpatterns are uncorrelated [14]. Since we investigated theglobal and aggregated characteristics of the immune re-sponse in T cells by integrating gene expression experi-ments conducted for T cell lines, the correlation coefficientsrepresent the aggregate strength of the T cell-specific rela-tionship between the genes and their interacting proteinproducts [14,44].To explore the changes in the network during the fil-
tering process we investigated changes in the diameter,relative size of the largest component and the averagesize of the connected components of the network. Thesenetwork measures have been shown to indicate the con-nectivity status of a network and its robustness againstlink removal or loss [28,45]. The changes in network sta-tistics during the filtering process showed that TPPINmaintains most of the integrity and connectivity of theimmunome interactome.Certain aspects of T cell function have been previously
modeled [46-49]. Most of these studies are related togene regulatory networks and modeling of small signal-ing networks involving transcription factors and theirtargets, selected to include genes or proteins well-known

1.5
1.6
1.7
1.8
1.9
2.0
0.1 0.2 0.3 0.4 0.5 0.6 0.7 0.8 0.9 1.0
Fraction of Randomized Link Weights
Ave
rage
Deg
ree
networks
TPPIN
LWRN
Average Degree for TPPIN and LWRN
7.0
7.5
8.0
8.5
9.0
0.1 0.2 0.3 0.4 0.5 0.6 0.7 0.8 0.9 1.0
Fraction of Randomized Link Weights
Mea
n P
ath
Leng
th
Mean Path Length for TPPIN and LWRN
200
400
600
0.1 0.2 0.3 0.4 0.5 0.6 0.7 0.8 0.9 1.0
Fraction of Randomized Link Weights
Mea
n B
etw
eenn
ess
of N
odes
Mean Betweenness of Nodes for TPPIN and LWRN
200
400
600
0.1 0.2 0.3 0.4 0.5 0.6 0.7 0.8 0.9 1.0
Fraction of Randomized Link Weights
Mea
n B
etw
eenn
ess
of L
inks
Mean Betweenness of Links for TPPIN and LWRN
0.02
0.04
0.06
0.1 0.2 0.3 0.4 0.5 0.6 0.7 0.8 0.9 1.0
Fraction of Randomized Link Weights
Mea
n C
lust
erin
g C
oeffi
cien
t
Mean Clustering Coefficient for TPPIN and LWRN
0.6
0.8
1.0
1.2
0.1 0.2 0.3 0.4 0.5 0.6 0.7 0.8 0.9 1.0
Fraction of Randomized Link Weights
Link
Inte
rsec
tion
Link Intersection Between TPPIN and LWRN
A
C D
E F
B
Figure 7 Comparison of T cell PPI network and link weight-randomized networks. Robustness analysis on the filtering procedure wasperformed by randomizing the immunome interactome link weights to introduce noise. Thirty iterations were conducted so that a fraction oflinks are selected randomly and their weights randomly reassigned for each iteration. The Link Weight-Randomized Network (LWRN) was filteredand node degree, average path length, betweenness centrality of both the nodes and the links, clustering coefficient of the network, and theintersection between TPPIN and the LWRNs, were calculated. The blue line curves are for the LWRNs and red lines for the TPPIN. A. Change inaverage degree, B. change in mean path length, C. change in mean betweenness of nodes, D. change in mean betweenness of links, E. changein mean clustering coefficient, F. Link intersection between TPPIN and LWRNs.
Teku et al. BMC Systems Biology 2014, 8:17 Page 9 of 14http://www.biomedcentral.com/1752-0509/8/17
in the modeled system. In these studies, the typical num-ber of genes or proteins is in a few tens, whereas westarted with the entire immunome interactome of 1149proteins and 5164 links, and ended up with a core net-work that contains 288 proteins and 227 links. Thenumber of nodes and links in the TPPIN makes it amen-able to tailored cellular systems modeling and experi-mental studies. Our approach is unsupervised and does
not utilize any preconceptions, yet, it reveals the centralproteins and their networks.The filtering process carried out in this study has some
potential limitations. It needs several time course expres-sion datasets for the cell-type or tissue of interest and eachexperiment should consist of at least 3 samples. A set ofproteins is needed to track the connectivity of the vitalpathways and a stop criterion when key pathways are
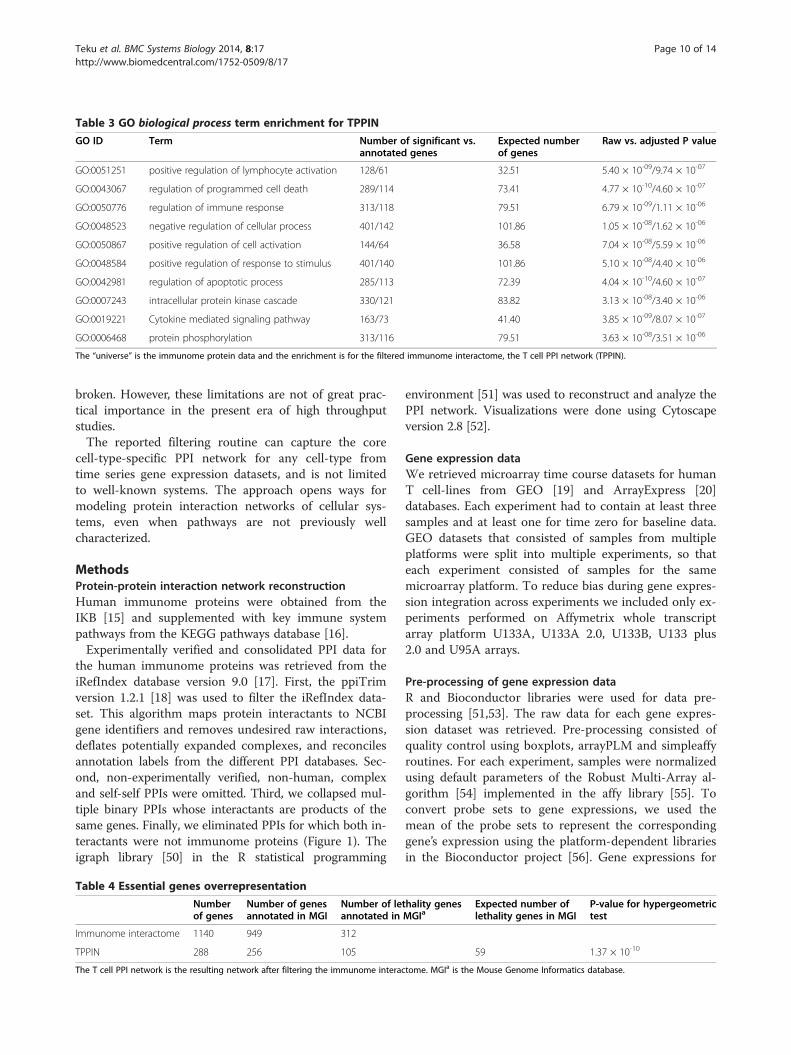
Table 3 GO biological process term enrichment for TPPIN
GO ID Term Number of significant vs.annotated genes
Expected numberof genes
Raw vs. adjusted P value
GO:0051251 positive regulation of lymphocyte activation 128/61 32.51 5.40 × 10-09/9.74 × 10-07
GO:0043067 regulation of programmed cell death 289/114 73.41 4.77 × 10⁻¹⁰/4.60 × 10-07
GO:0050776 regulation of immune response 313/118 79.51 6.79 × 10-09/1.11 × 10-06
GO:0048523 negative regulation of cellular process 401/142 101.86 1.05 × 10-08/1.62 × 10-06
GO:0050867 positive regulation of cell activation 144/64 36.58 7.04 × 10-08/5.59 × 10-06
GO:0048584 positive regulation of response to stimulus 401/140 101.86 5.10 × 10-08/4.40 × 10-06
GO:0042981 regulation of apoptotic process 285/113 72.39 4.04 × 10⁻¹⁰/4.60 × 10-07
GO:0007243 intracellular protein kinase cascade 330/121 83.82 3.13 × 10-08/3.40 × 10-06
GO:0019221 Cytokine mediated signaling pathway 163/73 41.40 3.85 × 10-09/8.07 × 10-07
GO:0006468 protein phosphorylation 313/116 79.51 3.63 × 10-08/3.51 × 10-06
The “universe” is the immunome protein data and the enrichment is for the filtered immunome interactome, the T cell PPI network (TPPIN).
Teku et al. BMC Systems Biology 2014, 8:17 Page 10 of 14http://www.biomedcentral.com/1752-0509/8/17
broken. However, these limitations are not of great prac-tical importance in the present era of high throughputstudies.The reported filtering routine can capture the core
cell-type-specific PPI network for any cell-type fromtime series gene expression datasets, and is not limitedto well-known systems. The approach opens ways formodeling protein interaction networks of cellular sys-tems, even when pathways are not previously wellcharacterized.
MethodsProtein-protein interaction network reconstructionHuman immunome proteins were obtained from theIKB [15] and supplemented with key immune systempathways from the KEGG pathways database [16].Experimentally verified and consolidated PPI data for
the human immunome proteins was retrieved from theiRefIndex database version 9.0 [17]. First, the ppiTrimversion 1.2.1 [18] was used to filter the iRefIndex data-set. This algorithm maps protein interactants to NCBIgene identifiers and removes undesired raw interactions,deflates potentially expanded complexes, and reconcilesannotation labels from the different PPI databases. Sec-ond, non-experimentally verified, non-human, complexand self-self PPIs were omitted. Third, we collapsed mul-tiple binary PPIs whose interactants are products of thesame genes. Finally, we eliminated PPIs for which both in-teractants were not immunome proteins (Figure 1). Theigraph library [50] in the R statistical programming
Table 4 Essential genes overrepresentation
Numberof genes
Number of genesannotated in MGI
Number of leannotated in
Immunome interactome 1140 949 312
TPPIN 288 256 105
The T cell PPI network is the resulting network after filtering the immunome interac
environment [51] was used to reconstruct and analyze thePPI network. Visualizations were done using Cytoscapeversion 2.8 [52].
Gene expression dataWe retrieved microarray time course datasets for humanT cell-lines from GEO [19] and ArrayExpress [20]databases. Each experiment had to contain at least threesamples and at least one for time zero for baseline data.GEO datasets that consisted of samples from multipleplatforms were split into multiple experiments, so thateach experiment consisted of samples for the samemicroarray platform. To reduce bias during gene expres-sion integration across experiments we included only ex-periments performed on Affymetrix whole transcriptarray platform U133A, U133A 2.0, U133B, U133 plus2.0 and U95A arrays.
Pre-processing of gene expression dataR and Bioconductor libraries were used for data pre-processing [51,53]. The raw data for each gene expres-sion dataset was retrieved. Pre-processing consisted ofquality control using boxplots, arrayPLM and simpleaffyroutines. For each experiment, samples were normalizedusing default parameters of the Robust Multi-Array al-gorithm [54] implemented in the affy library [55]. Toconvert probe sets to gene expressions, we used themean of the probe sets to represent the correspondinggene’s expression using the platform-dependent librariesin the Bioconductor project [56]. Gene expressions for
thality genesMGIa
Expected number oflethality genes in MGI
P-value for hypergeometrictest
59 1.37 × 10⁻¹⁰
tome. MGIa is the Mouse Genome Informatics database.

Figure 8 T cell PPI Network mapped to TCR, with main JAK-STAT and MAPK signaling pathways. The figure shows the TCR and the mainJAK-STAT and MAPK signaling networks that are connected to the TCR-dependent T cell response. The pathway information is adapted from theKEGG Pathways resource. The TPPIN proteins are represented by red-colored boxes with protein names in white text. The signaling networkdemonstrates the effectiveness of the filtering approach as many of the central proteins in T cell response are left intact after filtering.
Teku et al. BMC Systems Biology 2014, 8:17 Page 11 of 14http://www.biomedcentral.com/1752-0509/8/17
non-protein coding genes in the immunome proteindataset were removed.The gene expression datasets were merged and batch
effects were analyzed. We also performed PCA analysisbefore and after batch effect analysis to examine its ef-fect and performance on the normalized datasets. Thebatch effects and PCA analysis were performed usingthe ComBat [43] and plotMDS algorithms implementedin the inSilicoMerging library [42] in Bioconductor.
Gene expression correlationThe mean of the jackknife Pearson correlation coeffi-cient of the merged and pre-processed expression valuesfor all gene pair combinations was calculated using thebootstrap library implemented in R. These correlationvalues were converted to absolute values and used aslink weights for the immunome interactome.
Protein network filteringWe reconstructed the immunome PPI network as aweighted and undirected graph using the igraph packagein R. The nodes, links, and link weights of the graphrepresent, respectively, the immunome protein coding
genes, the PPIs and the average jackknife gene expres-sion correlation between the immunome protein codinggenes.Network filtering was achieved with the GloSS algo-
rithm [13], which identifies the relevant backbone of aweighted graph while retaining its weight distributionand structure. It uses a global null model to calculatethe significance of the links by maintaining the topologyof the network while assigning link weights randomly,from the observed weight distribution. The link weights(jackknife correlation coefficients) were multiplied by100 to allow the p-values to be computed by GloSS. Thecomputed link p-values by GloSS were used to filter thenetwork by removing links in decreasing order of p-value.We monitored the filtering process to make sure that atleast a path or connectivity remained between the TCRcomplex and NF-κB signaling pathways. The steps belowrepresent the filtering procedure:
Step 1: Using GloSS, determine p-value for each edgeof the networkStep 2: Select the link with the largest p-valueStep 3: Remove the link from the network
Teku et al. BMC Systems Biology 2014, 8:17 Page 12 of 14http://www.biomedcentral.com/1752-0509/8/17
Step 4: Check for presence of connectivity between theNF-κB components and the TCR complexStep 4.1: If connectivity exists discard the link and goto step 2.Step 4.2: If connectivity does not exist, return the linkto the network and stop.
This procedure was performed for both the NF-κBand the NFAT signaling pathways. Network diameter isthe maximum of the shortest paths between the nodesof the network. A connected component is the region ofa network in which there is a path connecting all nodepairs. We followed changes in the network diameter, therelative size of the largest connected component and theaverage size of the isolated components [28]. The rela-tive size of the largest component is the number ofnodes in the largest component divided by the numberof nodes in the whole network. That is, nrel = n/N,where, nrel is the relative size of the largest component,n is the number of nodes in the largest component andN is the number of nodes in the whole network. Thesemeasures were plotted against the fraction of filterednodes. The ratio,
number of deleted nodesnumber of nodes in the network
;
represents the fraction of the filtered nodes. The igraphpackage was used to calculate the network scores [50].
Robustness of the T cell PPI networkLink weight-randomized networks were created by ran-domizing the weights of a fraction of links, keeping thetopology unchanged. The following fractions of linkswere used to create each of the link weight-randomizednetworks: 0.1, 0.2, 0.3, 0.4, 0.5, 0.6, 0.7, 0.8 and 0.9.Thirty iterations were performed on each link weight-randomized network. For each iteration, a fraction oflinks were randomly selected, their weights randomlyreassigned, the filtering procedure performed and net-work topology statistics calculated. Node degree, averagepath length, betweenness centrality of both the nodesand the links, clustering coefficient of the network, andthe intersection between the TPPIN network and thelink weight-randomized networks, were calculated. Afterthe iterations for each link weight-randomized network,the average of each of the network topology statisticswas retained.
Gene Ontology term enrichment, over-representation andsemantic similarity analysisThe interconnected proteins in the TPPIN were sub-jected to GO [57] term enrichment analysis. The GOterms for the proteins in the immunome interactome
were used as the background. Fisher's exact test of thehypergeometric distribution was calculated and correc-tion for multiple comparisons was performed using theBenjamini-Hochberg procedure [58]. The enrichmentanalysis was performed with Webgestalt [59]. Semanticsimilarity between the immunome interactome and theTPPIN was calculated using the clusterSim routine ofthe GOSemSim library [60] (version 1.18.0) available inR/Bioconductor.
Analysis of essential genesWe retrieved the human orthologs of the mouse lethalitygenes from the Mouse Genome Informatics database[29]. A gene was included in the set of lethality geneswith the following criteria: phenotype contains the word“lethality”, the type of lethality annotation contains nei-ther “partial” nor “wean”. After removing non-immunomegenes and those without the above-mentioned lethalityannotations, we calculated the hypergeometric distribu-tion and Fisher’s exact test for significance. Essential geneswere retrieved using the biomaRt package in R [61] andvisualization of the TPPIN with essential genes was doneusing Cytoscape 2.8.3.
Pathway gene mappingThe TPPIN genes were mapped to the KEGG pathwaysusing the KEGG pathway mapper tool [16].
Additional files
Additional file 1: Protein data from the Immunome KnowledgeBase and the immune response pathways from KEGG. This filecontains the Entrez-gene identifiers of the genes encoding the immuneresponse proteins from the IKB database and the KEGG immune responsepathways listed in Table 1 of the main document. This dataset representsthe immunome protein dataset and was used to generate the immunomeinteractome from PPIs in the iRefIndex database.
Additional file 2: Immunome interactome network figure. The figurerepresents the immunome interactome constructed from the immunomeprotein list of Additional file 1. The figure shows the complex nature of thenetwork and thus cannot be studied by intuition alone. To reduce thecomplexity of the network the filtering procedure, reported in this study, wasperformed.
Additional file 3: Immunome interactome table. This is a table of thePPIs of the immune response proteins of Additional file 1. They werereconstructed from the iRefIndex which is a compendiumof PPI data from major PPI databases. Additional filtering was carried outsuch that only experimentally verified, human, binary PPIs were obtained(see methods). The identifiers are entrez gene identifiers of the genes thatcode for the immune response genes.
Additional file 4: A summary of the gene expression datasets. Thisconsists of a summary of all microarray datasets that were used in thisstudy. The datasets were retrieved from NCBI’s GEO and EBI’sArrayExpress databases. The dataset with asterisk (*) contains 3experiments conducted on 3 different platforms. The 3 experiments wereseparated into separate data sets throughout the pre-processing. Afterpre-processing only samples from the experiment conducted onAffymetrix Human Genome U133A Array were merged with data setsfrom other experiments.
Teku et al. BMC Systems Biology 2014, 8:17 Page 13 of 14http://www.biomedcentral.com/1752-0509/8/17
Additional file 5: Full Gene Ontology analysis results table. Thiscontains details of the GO term enrichment analysis performed by theWebgestalt web resource. The background of the GO analysis is theimmune response proteins. The null hypothesis significance test is thehypergeometric test and the p-values were corrected using theBenjamini–Hochberg procedure.
Competing interestsThe authors declare that they have no competing interests.
Authors’ contributionsGNT contributed towards data acquisition, analysis and interpretation;drafting and writing the manuscript. CO and MV contributed towardsconception and design of this work; analysis and interpretation; drafting andwriting the manuscript. All authors read and approved the final manuscript.
AcknowledgementsWe thank Marko Pesu for valuable discussions.
Author details1Department of Experimental Medical Science, Lund University, Lund,Sweden. 2Institute of Biomedical Technology, University of Tampere,Tampere, Finland. 3BioMediTech, University of Tampere, Tampere, Finland.
Received: 5 July 2013 Accepted: 5 February 2014Published: 15 February 2014
References1. Csermely P, Korcsmaros T, Kiss HJ, London G, Nussinov R: Structure and
dynamics of molecular networks: A novel paradigm of drug discovery:a comprehensive review. Pharmacol Ther 2013, 138(3):333–408.
2. Karlebach G, Shamir R: Modelling and analysis of gene regulatorynetworks. Nat Rev Mol Cell Biol 2008, 9(10):770–780.
3. Kim JR, Kim J, Kwon YK, Lee HY, Heslop-Harrison P, Cho KH: Reduction ofcomplex signaling networks to a representative kernel. Sci Signal 2011,4:175. ra35.
4. Newman ME: Finding community structure in networks using theeigenvectors of matrices. Phys Rev E Stat Nonlin Soft Matter Phys 2006,74(3 Pt 2):036104.
5. Kobayashi K, Ehrlich SD, Albertini A, Amati G, Andersen KK, Arnaud M, Asai K,Ashikaga S, Aymerich S, Bessieres P, Boland F, Brignell SC, Bron S, Bunai K,Chapuis J, Christiansen LC, Danchin A, Debarbouille M, Dervyn E, Deuerling E,Devine K, Devine SK, Dreesen O, Errington J, Fillinger S, Foster SJ, Fujita Y,Galizzi A, Gardan R, Eschevins C, Fukushima T, Haga K, Harwood CR, Hecker M,Hosoya D, Hullo MF, Kakeshita H, Karamata D, Kasahara Y, Kawamura F, Koga K,Koski P, Kuwana R, Imamura D, Ishimaru M, Ishikawa S, Ishio I, Le Coq D,Masson A, Mauel C, Meima R, Mellado RP, Moir A, Moriya S, Nagakawa E,Nanamiya H, Nakai S, Nygaard P, Ogura M, Ohanan T, O'Reilly M, O'Rourke M,Pragai Z, Pooley HM, Rapoport G, Rawlins JP, Rivas LA, Rivolta C, Sadaie A,Sadaie Y, Sarvas M, Sato T, Saxild HH, Scanlan E, Schumann W, Seegers JF,Sekiguchi J, Sekowska A, Seror SJ, Simon M, Stragier P, Studer R, Takamatsu H,Tanaka T, Takeuchi M, Thomaides HB, Vagner V, van Dijl JM, Watabe K, Wipat A,Yamamoto H, Yamamoto M, Yamamoto Y, Yamane K, Yata K, Yoshida K,Yoshikawa H, Zuber U, Ogasawara N: Essential Bacillus subtilis genes. Proc NatlAcad Sci U S A 2003, 100(8):4678–4683.
6. Commichau FM, Pietack N, Stulke J: Essential genes in Bacillus subtilis: are-evaluation after ten years. Mol Biosyst 2013, 9(6):1068–1075.
7. Song C, Havlin S, Makse HA: Self-similarity of complex networks. Nature2005, 433(7024):392–395.
8. Itzkovitz S, Levitt R, Kashtan N, Milo R, Itzkovitz M, Alon U: Coarse-grainingand self-dissimilarity of complex networks. Phys Rev E Stat Nonlin SoftMatter Phys 2005, 71(1 Pt 2):016127.
9. Santoni D, Pedicini M, Castiglione F: Implementation of a regulatory genenetwork to simulate the TH1/2 differentiation in an agent-based modelof hypersensitivity reactions. Bioinformatics 2008, 24(11):1374–1380.
10. Serrano MA, Boguna M, Vespignani A: Extracting the multiscale backboneof complex weighted networks. Proc Natl Acad Sci U S A 2009,106(16):6483–6488.
11. Grady D, Thiemann C, Brockmann D: Robust classification of salient linksin complex networks. Nat Commun 2012, 3:864.
12. Tumminello M, Aste T, Di Matteo T, Mantegna RN: A tool for filteringinformation in complex systems. Proc Natl Acad Sci U S A 2005,102(30):10421–10426.
13. Radicchi F, Ramasco JJ, Fortunato S: Information filtering in complexweighted networks. Phys Rev E Stat Nonlin Soft Matter Phys 2011,83(4 Pt 2):046101.
14. Klebanov LB, Yakovlev AY: A nitty-gritty aspect of correlation and networkinference from gene expression data. Biol Direct 2008, 3:35.
15. Ortutay C, Vihinen M: Immunome knowledge base (IKB): an integratedservice for immunome research. BMC Immunol 2009, 10:3.
16. Kanehisa M, Goto S, Sato Y, Furumichi M, Tanabe M: KEGG for integrationand interpretation of large-scale molecular data sets. Nucleic Acids Res2012, 40(1):D109–D114.
17. Razick S, Magklaras G, Donaldson IM: iRefIndex: a consolidated proteininteraction database with provenance. BMC Bioinforma 2008, 9:405.
18. Stojmirovic A, Yu YK: ppiTrim: constructing non-redundant and up-to-date interactomes. In Database (Oxford) 2011. ; 2011. bar036.
19. Sayers EW, Barrett T, Benson DA, Bolton E, Bryant SH, Canese K, Chetvernin V,Church DM, Dicuccio M, Federhen S, Feolo M, Fingerman IM, Geer LY,Helmberg W, Kapustin Y, Krasnov S, Landsman D, Lipman DJ, Lu Z, Madden TL,Madej T, Maglott DR, Marchler-Bauer A, Miller V, Karsch-Mizrachi I, Ostell J,Panchenko A, Phan L, Pruitt KD, Schuler GD, Sequeira E, Sherry ST,Shumway M, Sirotkin K, Slotta D, Souvorov A, Starchenko G, Tatusova TA,Wagner L, Wang Y, Wilbur WJ, Yaschenko E, Ye J: Database resources of theNational Center for Biotechnology Information. Nucleic Acids Res 2012,40(1):D13–D25.
20. Parkinson H, Sarkans U, Kolesnikov N, Abeygunawardena N, Burdett T, DylagM, Emam I, Farne A, Hastings E, Holloway E, Kurbatova N, Lukk M, Malone J,Mani R, Pilicheva E, Rustici G, Sharma A, Williams E, Adamusiak T, Brandizi M,Sklyar N, Brazma A: ArrayExpress update-an archive of microarray andhigh-throughput sequencing-based functional genomics experiments.Nucleic Acids Res 2011, 39(Database issue):D1002–D1004.
21. Wippler J, Kouns WC, Schlaeger EJ, Kuhn H, Hadvary P, Steiner B: Theintegrin αIIb-β3, platelet glycoprotein IIb-IIIa, can form a functionallyactive heterodimer complex without the cysteine-rich repeats of theβ3 subunit. J Biol Chem 1994, 269(12):8754–8761.
22. Nakayama T, Yamashita M: The TCR-mediated signaling pathways thatcontrol the direction of helper T cell differentiation. Semin Immunol 2010,22(5):303–309.
23. Takino J, Yamagishi S, Takeuchi M: Cancer malignancy is enhanced byglyceraldehyde-derived advanced glycation end-products. J Oncol 2010,2010:739852.
24. Olivieri KC, Mukerji J, Gabuzda D: Nef-mediated enhancement of cellularactivation and human immunodeficiency virus type 1 replication inprimary T cells is dependent on association with p21-activated kinase 2.Retrovirology 2011, 8:64–4690. 8-64.
25. Karkkainen S, Hiipakka M, Wang JH, Kleino I, Vaha-Jaakkola M, Renkema GH,Liss M, Wagner R, Saksela K: Identification of preferred protein interactionsby phage-display of the human Src homology-3 proteome. EMBO Rep2006, 7(2):186–191.
26. Voll RE, Jimi E, Phillips RJ, Barber DF, Rincon M, Hayday AC, Flavell RA,Ghosh S: NF-κB activation by the pre-T cell receptor serves as a selectivesurvival signal in T lymphocyte development. Immunity 2000, 13(5):677–689.
27. Macian F: NFAT proteins: key regulators of T-cell development andfunction. Nat Rev Immunol 2005, 5(6):472–484.
28. Albert R, Jeong H, Barabasi AL: Error and attack tolerance of complexnetworks. Nature 2000, 406(6794):378–382.
29. Cox A, Ackert-Bicknell C, Dumont BL, Ding Y, Bell JT, Brockmann GA,Wergedal JE, Bult C, Paigen B, Flint J, Tsaih SW, Churchill GA, Broman KW:A new standard genetic map for the laboratory mouse. Genetics 2009,182(4):1335–1344.
30. Smith-Garvin JE, Koretzky GA, Jordan MS: T cell activation. Annu RevImmunol 2009, 27:591–619.
31. Berg LJ, Finkelstein LD, Lucas JA, Schwartzberg PL: Tec family kinases in Tlymphocyte development and function. Annu Rev Immunol 2005, 23:549–600.
32. Carpenter G, Ji Q: Phospholipase C-γ as a signal-transducing element. ExpCell Res 1999, 253(1):15–24.
33. Schmitz ML, Bacher S, Dienz O: NF-κB activation pathways induced byT cell costimulation. FASEB J 2003, 17(15):2187–2193.
34. Hogan PG, Chen L, Nardone J, Rao A: Transcriptional regulation bycalcium, calcineurin, and NFAT. Genes Dev 2003, 17(18):2205–2232.

Teku et al. BMC Systems Biology 2014, 8:17 Page 14 of 14http://www.biomedcentral.com/1752-0509/8/17
35. Ebinu JO, Bottorff DA, Chan EY, Stang SL, Dunn RJ, Stone JC: RasGRP, a Rasguanyl nucleotide- releasing protein with calcium- and diacylglycerol-bindingmotifs. Science 1998, 280(5366):1082–1086.
36. Tognon CE, Kirk HE, Passmore LA, Whitehead IP, Der CJ, Kay RJ: Regulationof RasGRP via a phorbol ester-responsive C1 domain. Mol Cell Biol 1998,18(12):6995–7008.
37. Thomas G: MAP kinase by any other name smells just as sweet. Cell 1992,68(1):3–6.
38. Karin M, Liu Z, Zandi E: AP-1 function and regulation. Curr Opin Cell Biol1997, 9(2):240–246.
39. Weil R, Israel A: Deciphering the pathway from the TCR to NF-κB. CellDeath Differ 2006, 13(5):826–833.
40. Rincon M: MAP-kinase signaling pathways in T cells. Curr Opin Immunol2001, 13(3):339–345.
41. Shuai K, Liu B: Regulation of JAK-STAT signaling in the immune system.Nat Rev Immunol 2003, 3(11):900–911.
42. Taminau J, Meganck S, Lazar C, Steenhoff D, Coletta A, Molter C, Duque R,de Schaetzen V, Weiss Solis DY, Bersini H, Nowe A: Unlocking the potentialof publicly available microarray data using inSilicoDb andinSilicoMerging R/Bioconductor packages. BMC Bioinforma 2012,13:335–2105. 13-335.
43. Johnson WE, Li C, Rabinovic A: Adjusting batch effects in microarrayexpression data using empirical Bayes methods. Biostatistics 2007,8(1):118–127.
44. Guo Y, Xiao P, Lei S, Deng F, Xiao GG, Liu Y, Chen X, Li L, Wu S, Chen Y,Jiang H, Tan L, Xie J, Zhu X, Liang S, Deng H: How is mRNA expressionpredictive for protein expression? A correlation study on humancirculating monocytes. Acta Biochim Biophys Sin (Shanghai) 2008,40(5):426–436.
45. Cohen R, Erez K, ben Avraham D, Havlin S: Resilience of the internet torandom breakdowns. Phys Rev Lett 2000, 85(21):4626–4628.
46. Rui-Sheng W, Reka A: Elementary signaling modes predict the essentialityof signal transduction network components. BMC Syst Biol 2011, 5:44.
47. Mendoza L, Pardo F: A robust model to describe the differentiation ofT-helper cells. Theory Biosci 2010, 129(4):283–293.
48. Mendoza L: A network model for the control of the differentiationprocess in Th cells. BioSystems 2006, 84(2):101–114.
49. Mendoza L, Xenarios I: A method for the generation of standardizedqualitative dynamical systems of regulatory networks. Theor Biol MedModel 2006, 3:13.
50. Csardi G, Nepusz T: The igraph software package for complex networkresearch. Inter J, Complex Systems 2006, 1(1):1695.
51. R: A Language and Environment for Statistical Computing. http://www.r-project.org/.
52. Smoot ME, Ono K, Ruscheinski J, Wang PL, Ideker T: Cytoscape 2.8: newfeatures for data integration and network visualization. Bioinformatics2011, 27(3):431–432.
53. Gentleman RC, Carey VJ, Bates DM, Bolstad B, Dettling M, Dudoit S, Ellis B,Gautier L, Ge Y, Gentry J, Hornik K, Hothorn T, Huber W, Iacus S, Irizarry R,Leisch F, Li C, Maechler M, Rossini AJ, Sawitzki G, Smith C, Smyth G, TierneyL, Yang JY, Zhang J: Bioconductor: open software development forcomputational biology and bioinformatics. Genome Biol 2004, 5(10):R80.
54. Irizarry RA, Hobbs B, Collin F, Beazer-Barclay YD, Antonellis KJ, Scherf U,Speed TP: Exploration, normalization, and summaries of highdensity oligonucleotide array probe level data. Biostatistics 2003,4(2):249–264.
55. Gautier L, Cope L, Bolstad BM, Irizarry RA: Affy-analysis of affymetrixGeneChip data at the probe level. Bioinformatics 2004, 20(3):307–315.
56. Bioconductor task view: annotation data. http://www.bioconductor.org/packages/release/BiocViews.html#___AffymetrixChip.
57. The Gene Ontology Consortium: The Gene Ontology: enhancements for2011. Nucleic Acids Res 2012, 40(D1):D559–D564.
58. Benjamini Y, Hochberg Y: Controlling the false discovery rate: a practicaland powerful approach to multiple testing. J R Stat Soc Ser B StatMethodol 1995, 57(1):289–300.
59. Zhang B, Kirov S, Snoddy J: WebGestalt: an integrated system forexploring gene sets in various biological contexts. Nucleic Acids Res 2005,33(Web Server issue):W741–W748.
60. Yu G, Li F, Qin Y, Bo X, Wu Y, Wang S: GOSemSim: an R package formeasuring semantic similarity among GO terms and gene products.Bioinformatics 2010, 26(7):976–978.
61. Durinck S, Spellman PT, Birney E, Huber W: Mapping identifiers for theintegration of genomic datasets with the R/Bioconductor packagebiomaRt. Nature Protocols 2009, 4(8):1184–1191.
doi:10.1186/1752-0509-8-17Cite this article as: Teku et al.: Identification of core T cell networkbased on immunome interactome. BMC Systems Biology 2014 8:17.
Submit your next manuscript to BioMed Centraland take full advantage of:
• Convenient online submission
• Thorough peer review
• No space constraints or color figure charges
• Immediate publication on acceptance
• Inclusion in PubMed, CAS, Scopus and Google Scholar
• Research which is freely available for redistribution
Submit your manuscript at www.biomedcentral.com/submit


