Embed Size (px)
Citation preview

IBM z/OS Debugger
User's GuideVersion 14.1.9
SC27-4642-06
IBM

IBM z/OS Debugger
User's GuideVersion 14.1.9
SC27-4642-06
IBM

Note!Before using this information and the product it supports, be sure to read the general information under “Notices” on page581.
Seventh Edition (December 2019)
This edition applies to IBM z/OS Debugger, Version 14.1.9 (Program Number 5724-T07 with the PTF for APARPH13364), which supports the following compilers:v AD/Cycle C/370 Version 1 Release 2 (Program Number 5688-216)
v C/C++ for MVS/ESA Version 3 (Program Number 5655-121)
v C/C++ feature of OS/390 (Program Number 5647-A01)
v C/C++ feature of z/OS Version 1 (Program Number 5694-A01)
v C/C++ feature of z/OS Version 2 (Program Number 5650-ZOS)
v OS/VS COBOL, Version 1 Release 2.4 (5740-CB1) - with limitations
v VS COBOL II Version 1 Release 3 and Version 1 Release 4 (Program Numbers 5668-958, 5688-023) - withlimitations
v COBOL/370 Version 1 Release 1 (Program Number 5688-197)
v COBOL for MVS & VM Version 1 Release 2 (Program Number 5688-197)
v COBOL for OS/390 & VM Version 2 (Program Number 5648-A25)
v Enterprise COBOL for z/OS and OS/390 Version 3 (Program Number 5655-G53)
v Enterprise COBOL for z/OS Version 4 (Program Number 5655-S71)
v Enterprise COBOL for z/OS Version 5 (Program Number 5655-W32)
v Enterprise COBOL for z/OS Version 6 Release 1 and 2 (Program Number 5655-EC6)
v High Level Assembler for MVS & VM & VSE Version 1 Release 4, Version 1 Release 5, Version 1 Release 6(Program Number 5696-234)
v OS PL/I Version 2 Release 1, Version 2 Release 2, Version 2 Release 3 (Program Numbers 5668-909, 5668-910) -with limitations
v PL/I for MVS & VM Version 1 Release 1 (Program Number 5688-235)
v VisualAge PL/I for OS/390 Version 2 Release 2 (Program Number 5655-B22)
v Enterprise PL/I for z/OS and OS/390 Version 3 (Program Number 5655-H31)
v Enterprise PL/I for z/OS Version 4 (Program Number 5655-W67)
v Enterprise PL/I for z/OS Version 5 Release 1 and 2 (Program Number 5655-PL5)
This edition also applies to all subsequent releases and modifications until otherwise indicated in new editions ortechnical newsletters.
You can access publications online at www.ibm.com/e-business/linkweb/publications/servlet/pbi.wss
You can find out more about IBM z/OS Debugger by visiting the following IBM Web sites:v IBM Debug for z Systems: https://www.ibm.com/us-en/marketplace/debug-for-z-systems
v IBM Developer for z Systems: https://www.ibm.com/us-en/marketplace/developer-for-z-systems
v IBM Z Open Development: https://www.ibm.com/us-en/marketplace/z-open-development
v IBM Z Open Unit Test: https://www.ibm.com/us-en/marketplace/z-open-unit-test
© Copyright IBM Corporation 1992, 2019.US Government Users Restricted Rights – Use, duplication or disclosure restricted by GSA ADP Schedule Contractwith IBM Corp.
|

Contents
About this document . . . . . . . . xiiiWho might use this document . . . . . . . . xiiiAccessing z/OS licensed documents on the Internet xiiiHow this document is organized . . . . . . . xivTerms used in this document . . . . . . . . xviiHow to read syntax diagrams . . . . . . . xviii
Symbols . . . . . . . . . . . . . . xviiiSyntax items . . . . . . . . . . . . . xixSyntax examples . . . . . . . . . . . xix
How to send your comments . . . . . . . . xx
Summary of changes. . . . . . . . xxiii
IBM z/OS Debugger as a component xxix
Part 1. Getting started with z/OSDebugger . . . . . . . . . . . . . 1
Chapter 1. z/OS Debugger: overview . . 3z/OS Debugger interfaces . . . . . . . . . . 4
Batch mode. . . . . . . . . . . . . . 5Full-screen mode . . . . . . . . . . . . 5Full-screen mode using the Terminal InterfaceManager . . . . . . . . . . . . . . . 5Remote debug mode. . . . . . . . . . . 6
IBM z/OS Debugger Utilities . . . . . . . . . 7IBM z/OS Debugger Utilities: Job Card . . . . 7IBM z/OS Debugger Utilities: ProgramPreparation . . . . . . . . . . . . . . 7IBM z/OS Debugger Utilities: z/OS DebuggerSetup File . . . . . . . . . . . . . . 8IBM z/OS Debugger Utilities: IMS TM Debugging 8IBM z/OS Debugger Utilities: Load ModuleAnalyzer. . . . . . . . . . . . . . . 8IBM z/OS Debugger Utilities: z/OS DebuggerUser Exit Data Set . . . . . . . . . . . 8IBM z/OS Debugger Utilities: Other IBMApplication Delivery Foundation for z Systemstools . . . . . . . . . . . . . . . . 8IBM z/OS Debugger Utilities: JCL for BatchDebugging . . . . . . . . . . . . . . 8IBM z/OS Debugger Utilities: IMS BTS Debugging 9IBM z/OS Debugger Utilities: JCL to Setup FileConversion . . . . . . . . . . . . . . 9IBM z/OS Debugger Utilities: Delay Debug Profile 9IBM z/OS Debugger Utilities: IMS Transactionand User ID Cross Reference Table . . . . . . 9IBM z/OS Debugger Utilities: Non-CICS DebugSession Start and Stop Message Viewer . . . . 9IBM z/OS Debugger Utilities: z/OS DebuggerCode Coverage . . . . . . . . . . . . 9IBM z/OS Debugger Utilities: z/OS DebuggerDeferred Breakpoints . . . . . . . . . . 9
IBM z/OS Debugger Utilities: z/OS DebuggerJCL Wizard . . . . . . . . . . . . . 10Starting IBM z/OS Debugger Utilities . . . . 10
Chapter 2. Debugging a program infull-screen mode: introduction . . . . 11Compiling or assembling your program with theproper compiler options . . . . . . . . . . 11Starting z/OS Debugger . . . . . . . . . . 12The z/OS Debugger full screen interface . . . . 13Stepping through a program. . . . . . . . . 14Running your program to a specific line . . . . . 14Setting a breakpoint . . . . . . . . . . . 15Displaying the value of a variable . . . . . . . 15Displaying memory through the Memory window 17Changing the value of a variable . . . . . . . 17Skipping a breakpoint . . . . . . . . . . . 18Clearing a breakpoint . . . . . . . . . . . 18Recording and replaying statements . . . . . . 18Stopping z/OS Debugger. . . . . . . . . . 19
Part 2. Preparing your program fordebugging . . . . . . . . . . . . 21
Chapter 3. Preparing to remote debugin standard mode . . . . . . . . . . 23
Chapter 4. Planning your debugsession . . . . . . . . . . . . . . 25Choosing compiler options for debugging . . . . 26
Choosing TEST or NOTEST compiler suboptionsfor COBOL programs . . . . . . . . . . 27Choosing TEST or NOTEST compiler suboptionsfor PL/I programs . . . . . . . . . . . 35Choosing TEST or DEBUG compiler suboptionsfor C programs . . . . . . . . . . . . 41Choosing TEST or DEBUG compiler suboptionsfor C++ programs . . . . . . . . . . . 46Understanding how hooks work and why youneed them . . . . . . . . . . . . . . 50Understanding what symbol tables do and whysaving them elsewhere can make yourapplication smaller . . . . . . . . . . . 51
Choosing a debugging mode . . . . . . . . 52Debugging in browse mode . . . . . . . . 54
Choosing a method or methods for starting z/OSDebugger . . . . . . . . . . . . . . . 57Choosing how to debug old COBOL programs . . 60Creating deferred breakpoints for COBOL and PL/Iprograms . . . . . . . . . . . . . . . 61
© Copyright IBM Corp. 1992, 2019 iii

Chapter 5. Updating your processes soyou can debug programs with z/OSDebugger . . . . . . . . . . . . . 63Update your compilation, assembly, and linkingprocess . . . . . . . . . . . . . . . . 63
Compiling your program without using IBMz/OS Debugger Utilities . . . . . . . . . 63Compiling your program by using IBM z/OSDebugger Utilities . . . . . . . . . . . 65Compiling a Enterprise PL/I program on an HFSor zFS file system . . . . . . . . . . . 66Compiling your C program with c89 or c++ . . 67Compiling a C program on an HFS or zFS filesystem . . . . . . . . . . . . . . . 67Compiling a C++ program on an HFS or zFS filesystem . . . . . . . . . . . . . . . 68
Update your library and promotion process . . . 68Make the modifications necessary to implementyour preferred method of starting z/OS Debugger . 69
Chapter 6. Preparing a LangX COBOLprogram . . . . . . . . . . . . . . 73Compiling your OS/VS COBOL program . . . . 73Compiling your VS COBOL II program . . . . . 74Compiling your Enterprise COBOL program . . . 74Creating the EQALANGX file for LangX COBOLprograms . . . . . . . . . . . . . . . 74Link-editing your program . . . . . . . . . 76
Chapter 7. Preparing an assemblerprogram . . . . . . . . . . . . . . 77Before you assemble your program . . . . . . 77Assembling your program . . . . . . . . . 77Creating the EQALANGX file for an assemblerprogram . . . . . . . . . . . . . . . 78Assembling your program and creatingEQALANGX . . . . . . . . . . . . . . 79Link-editing your program . . . . . . . . . 80
Restrictions for link-editing your assemblerprogram . . . . . . . . . . . . . . 80
Chapter 8. Preparing a DB2 program 81Processing SQL statements . . . . . . . . . 81Linking DB2 programs for debugging . . . . . 83Binding DB2 programs for debugging . . . . . 84
Chapter 9. Preparing a DB2 storedprocedures program . . . . . . . . . 85
Chapter 10. Preparing a CICS program 89Link-editing EQADCCXT into your program . . . 89Creating and storing a DTCN profile . . . . . . 90
Displaying a list of active DTCN profiles andmanaging DTCN profiles . . . . . . . . . 93Description of fields on the DTCN Primary Menuscreen . . . . . . . . . . . . . . . 94Description of fields on the DTCN Menu 2 screen 99Description of fields on the DTCN AdvancedOptions screen . . . . . . . . . . . . 101
Creating and storing debugging profiles withCADP . . . . . . . . . . . . . . . . 101Starting z/OS Debugger for non-LanguageEnvironment programs under CICS . . . . . . 102
Passing runtime parameters to z/OS Debuggerfor non-Language Environment programs underCICS . . . . . . . . . . . . . . . 102
Chapter 11. Preparing an IMS program 105Starting z/OS Debugger under IMS by usingCEEUOPT or CEEROPT . . . . . . . . . . 105Managing runtime options for IMSplex users byusing IBM z/OS Debugger Utilities . . . . . . 106Setting up the DFSBXITA user exit routine . . . 106
Chapter 12. Specifying the TESTruntime options through theLanguage Environment user exit . . . 109Editing the source code of CEEBXITA . . . . . 110
Modifying the naming pattern. . . . . . . 110Modifying the message display level . . . . 111Modifying the call back routine registration . . 112Activate the cross reference function andmodifying the cross reference table data setname . . . . . . . . . . . . . . . 112
Comparing the two methods of linking CEEBXITA 112Linking the CEEBXITA user exit into yourapplication program . . . . . . . . . . . 113Linking the CEEBXITA user exit into a private copyof a Language Environment runtime module . . . 113Creating and managing the TEST runtime optionsdata set . . . . . . . . . . . . . . . 114
Creating and managing the TEST runtimeoptions data set by using Terminal InterfaceManager (TIM) . . . . . . . . . . . . 115Creating and managing the TEST runtimeoptions data set by using IBM z/OS DebuggerUtilities . . . . . . . . . . . . . . 117
Part 3. Starting z/OS Debugger 119
Chapter 13. Writing the TEST run-timeoption string. . . . . . . . . . . . 121Special considerations while using the TESTrun-time option . . . . . . . . . . . . 121
Defining TEST suboptions in your program . . 121Suboptions and NOTEST . . . . . . . . 121Implicit breakpoints . . . . . . . . . . 122Primary commands file and USE file . . . . 122Running in batch mode . . . . . . . . . 122Starting z/OS Debugger at different points . . 122Session log . . . . . . . . . . . . . 123
Precedence of Language Environment runtimeoptions . . . . . . . . . . . . . . . 123Example: TEST run-time options . . . . . . . 124Specifying additional run-time options with VSCOBOL II and PL/I programs . . . . . . . . 125
Specifying the STORAGE run-time option . . . 125Specifying the TRAP(ON) run-time option . . 126
iv IBM z/OS Debugger V14.1.9 User's Guide
Specifying TEST run-time option with #pragmarunopts in C and C++ . . . . . . . . . . 126
Chapter 14. Starting z/OS Debuggerfrom the IBM z/OS Debugger Utilities . 127Creating the setup file . . . . . . . . . . 127Editing an existing setup file . . . . . . . . 128Copying information into a setup file from anexisting JCL . . . . . . . . . . . . . . 128Entering file allocation statements, runtime options,and program parameters . . . . . . . . . 128Saving your setup file . . . . . . . . . . 130Starting your program . . . . . . . . . . 130
Chapter 15. Starting z/OS Debuggerfrom a program . . . . . . . . . . 131Starting z/OS Debugger with CEETEST . . . . 131
Additional notes about starting z/OS Debuggerwith CEETEST . . . . . . . . . . . . 134
Example: using CEETEST to start z/OS Debuggerfrom C/C++. . . . . . . . . . . . . . 134Example: using CEETEST to start z/OS Debuggerfrom COBOL . . . . . . . . . . . . . 136Example: using CEETEST to start z/OS Debuggerfrom PL/I . . . . . . . . . . . . . . 137Starting z/OS Debugger with PLITEST . . . . . 138Starting z/OS Debugger with the __ctest() function 139
Chapter 16. Starting z/OS Debugger inbatch mode . . . . . . . . . . . . 141Example: JCL that runs z/OS Debugger in batchmode . . . . . . . . . . . . . . . . 141
Modifying the example to debug in full-screenmode . . . . . . . . . . . . . . . 142
Chapter 17. Starting z/OS Debuggerfor batch or TSO programs . . . . . 143Starting a debugging session in full-screen modeusing the Terminal Interface Manager or adedicated terminal . . . . . . . . . . . 143Starting z/OS Debugger for programs that start inLanguage Environment . . . . . . . . . . 145
Example: Allocating z/OS Debugger loadlibrary data set . . . . . . . . . . . . 146Example: Allocating z/OS Debugger files . . . 146
Starting z/OS Debugger for programs that startoutside of Language Environment . . . . . . 147
Passing parameters to EQANMDBG. . . . . 148Example: Modifying JCL that invokes anassembler DB2 program running in a batch TSOenvironment. . . . . . . . . . . . . 150
Chapter 18. Starting z/OS Debuggerunder CICS . . . . . . . . . . . . 151Comparison of methods for starting z/OSDebugger under CICS . . . . . . . . . . 151Starting z/OS Debugger under CICS by usingDTCN . . . . . . . . . . . . . . . . 152
Ending a CICS debugging session that wasstarted by DTCN . . . . . . . . . . . 153Example: How z/OS Debugger chooses a CICSprogram for debugging . . . . . . . . . 153
Starting z/OS Debugger for CICS programs byusing CADP. . . . . . . . . . . . . . 153Starting z/OS Debugger under CICS by usingCEEUOPT . . . . . . . . . . . . . . 154Starting z/OS Debugger under CICS by usingcompiler directives . . . . . . . . . . . 154
Chapter 19. Starting a debug session 155
Chapter 20. Starting z/OS Debugger inother environments. . . . . . . . . 157Starting z/OS Debugger from DB2 storedprocedures . . . . . . . . . . . . . . 157
Part 4. Debugging your programsin full-screen mode . . . . . . . . 159
Chapter 21. Using full-screen mode:overview . . . . . . . . . . . . . 161z/OS Debugger session panel . . . . . . . . 161
Session panel header . . . . . . . . . . 163Source window. . . . . . . . . . . . 164Monitor window . . . . . . . . . . . 165Log window. . . . . . . . . . . . . 166Memory window . . . . . . . . . . . 167Command pop-up window. . . . . . . . 168List pop-up window . . . . . . . . . . 169
Creating a preferences file . . . . . . . . . 169Displaying the source . . . . . . . . . . 170
Changing which file appears in the Sourcewindow . . . . . . . . . . . . . . 170
Entering commands on the session panel . . . . 171Order in which z/OS Debugger acceptscommands from the session panel . . . . . 174Using the session panel command line . . . . 174Issuing system commands . . . . . . . . 175Entering prefix commands on specific lines orstatements . . . . . . . . . . . . . 175Entering multiple commands in the Memorywindow . . . . . . . . . . . . . . 176Using commands that are sensitive to the cursorposition . . . . . . . . . . . . . . 177Using Program Function (PF) keys to entercommands . . . . . . . . . . . . . 177Initial PF key settings . . . . . . . . . 177Retrieving previous commands . . . . . . 178Composing commands from lines in the Logand Source windows . . . . . . . . . . 178Opening the Command pop-up window toenter long z/OS Debugger commands . . . . 179
Navigating through z/OS Debugger windows . . 179Moving the cursor between windows . . . . 180Switching between the Memory window andLog window. . . . . . . . . . . . . 180Scrolling through the physical windows . . . 180
Contents v
Enlarging a physical window . . . . . . . 181Scrolling to a particular line number. . . . . 182Finding a string in a window . . . . . . . 182Displaying the line at which execution halted 185Navigating through the Memory window . . . 185
Creating a commands file . . . . . . . . . 186Recording your debug session in a log file . . . 188
Creating the log file . . . . . . . . . . 188Recording how many times each source lineruns . . . . . . . . . . . . . . . 189Recording the breakpoints encountered. . . . 190
Setting breakpoints to halt your program at a line 190Setting breakpoints in a load module that is notloaded or in a program that is not active . . . . 190Controlling how z/OS Debugger handles warningsabout invalid data in comparisons . . . . . . 191Stepping through or running your program . . . 192
Recording and replaying statements . . . . . 193Saving and restoring settings, breakpoints, andmonitor specifications . . . . . . . . . . 196
Saving and restoring automatically . . . . . 197Disabling the automatic saving and restoring ofbreakpoints, monitors, and settings . . . . . 198Restoring manually . . . . . . . . . . 199
Performance considerations in multi-enclaveenvironments . . . . . . . . . . . . . 199Displaying and monitoring the value of a variable 200
One-time display of the value of variables. . . 200Adding variables to the Monitor window . . . 201Displaying the Working-Storage Section of aCOBOL program in the Monitor window . . . 202Displaying the data type of a variable in theMonitor window . . . . . . . . . . . 203Replacing a variable in the Monitor windowwith another variable. . . . . . . . . . 203Adding variables to the Monitor windowautomatically . . . . . . . . . . . . 204How z/OS Debugger handles characters thatcannot be displayed in their declared data type . 207Modifying characters that cannot be displayedin their declared data type . . . . . . . . 207Formatting values in the Monitor window. . . 208Displaying values in hexadecimal format . . . 208Monitoring the value of variables inhexadecimal format . . . . . . . . . . 209Modifying variables or storage by using acommand . . . . . . . . . . . . . 209Modifying variables or storage by typing overan existing value . . . . . . . . . . . 210Opening and closing the Monitor window. . . 210
Displaying and modifying memory through theMemory window . . . . . . . . . . . . 211
Modifying memory through the hexadecimaldata area . . . . . . . . . . . . . . 211
Managing file allocations . . . . . . . . . 211Displaying error numbers for messages in the Logwindow . . . . . . . . . . . . . . . 213Displaying a list of compile units known to z/OSDebugger. . . . . . . . . . . . . . . 213Requesting an attention interrupt duringinteractive sessions . . . . . . . . . . . 214
Ending a full-screen debug session . . . . . . 214
Chapter 22. Debugging a COBOLprogram in full-screen mode . . . . . 217Example: sample COBOL program for debugging 217Halting when certain routines are called in COBOL 220Identifying the statement where your COBOLprogram has stopped . . . . . . . . . . . 221Modifying the value of a COBOL variable . . . . 221Halting on a COBOL line only if a condition is true 222Debugging COBOL when only a few parts arecompiled with TEST . . . . . . . . . . . 222Capturing COBOL I/O to the system console. . . 223Displaying raw storage in COBOL . . . . . . 224Getting a COBOL routine traceback . . . . . . 224Tracing the run-time path for COBOL codecompiled with TEST . . . . . . . . . . . 224Generating a COBOL run-time paragraph trace . . 225Finding unexpected storage overwrite errors inCOBOL . . . . . . . . . . . . . . . 226Halting before calling an invalid program inCOBOL . . . . . . . . . . . . . . . 227
Chapter 23. Debugging a LangXCOBOL program in full-screen mode . 229Example: sample LangX COBOL program fordebugging . . . . . . . . . . . . . . 229Defining a compilation unit as LangX COBOL andloading debug information . . . . . . . . . 231Defining a compilation unit in a different loadmodule as LangX COBOL . . . . . . . . . 232Halting when certain LangX COBOL programs arecalled . . . . . . . . . . . . . . . . 232Identifying the statement where your LangXCOBOL program has stopped . . . . . . . . 233Displaying and modifying the value of LangXCOBOL variables or storage . . . . . . . . 233Halting on a line in LangX COBOL only if acondition is true . . . . . . . . . . . . 233Debugging LangX COBOL when debuginformation is only available for a few parts . . . 234Getting a LangX COBOL program traceback . . . 234Finding unexpected storage overwrite errors inLangX COBOL . . . . . . . . . . . . . 234
Chapter 24. Debugging a PL/I programin full-screen mode . . . . . . . . . 235Example: sample PL/I program for debugging . . 235Halting when certain PL/I functions are called . . 238Identifying the statement where your PL/Iprogram has stopped . . . . . . . . . . . 238Modifying the value of a PL/I variable . . . . . 239Halting on a PL/I line only if a condition is true 239Debugging PL/I when only a few parts arecompiled with TEST . . . . . . . . . . . 240Displaying raw storage in PL/I . . . . . . . 240Getting a PL/I function traceback . . . . . . 240Tracing the run-time path for PL/I code compiledwith TEST . . . . . . . . . . . . . . 241
vi IBM z/OS Debugger V14.1.9 User's Guide

Finding unexpected storage overwrite errors inPL/I . . . . . . . . . . . . . . . . 242Halting before calling an undefined program inPL/I . . . . . . . . . . . . . . . . 243
Chapter 25. Debugging a C programin full-screen mode . . . . . . . . . 245Example: sample C program for debugging . . . 245Halting when certain functions are called in C . . 248Modifying the value of a C variable . . . . . . 249Halting on a line in C only if a condition is true 249Debugging C when only a few parts are compiledwith TEST . . . . . . . . . . . . . . 250Capturing C output to stdout . . . . . . . . 250Capturing C input to stdin . . . . . . . . . 251Calling a C function from z/OS Debugger. . . . 251Displaying raw storage in C . . . . . . . . 251Debugging a C DLL . . . . . . . . . . . 252Getting a function traceback in C. . . . . . . 252Tracing the run-time path for C code compiledwith TEST . . . . . . . . . . . . . . 252Finding unexpected storage overwrite errors in C 253Finding uninitialized storage errors in C . . . . 254Halting before calling a NULL C function . . . . 254
Chapter 26. Debugging a C++ programin full-screen mode . . . . . . . . . 255Example: sample C++ program for debugging . . 255Halting when certain functions are called in C++ 259Modifying the value of a C++ variable . . . . . 260Halting on a line in C++ only if a condition is true 261Viewing and modifying data members of the thispointer in C++ . . . . . . . . . . . . . 261Debugging C++ when only a few parts arecompiled with TEST . . . . . . . . . . . 261Capturing C++ output to stdout . . . . . . . 262Capturing C++ input to stdin . . . . . . . . 262Calling a C++ function from z/OS Debugger . . . 263Displaying raw storage in C++ . . . . . . . 263Debugging a C++ DLL . . . . . . . . . . 263Getting a function traceback in C++ . . . . . . 264Tracing the run-time path for C++ code compiledwith TEST . . . . . . . . . . . . . . 264Finding unexpected storage overwrite errors inC++ . . . . . . . . . . . . . . . . 265Finding uninitialized storage errors in C++ . . . 265Halting before calling a NULL C++ function . . . 266
Chapter 27. Debugging an assemblerprogram in full-screen mode . . . . . 267Example: sample assembler program for debugging 267Defining a compilation unit as assembler andloading debug data . . . . . . . . . . . 270Deferred LDDs . . . . . . . . . . . . . 271Re-appearance of an assembler CU . . . . . . 271Multiple compilation units in a single assembly 271
Loading debug data from multiple CSECTs in asingle assembly using one LDD command. . . 272Loading debug data from multiple CSECTs in asingle assembly using separate LDD commands . 272
Debugging multiple CSECTs in a singleassembly after the debug data is loaded . . . 272
Halting when certain assembler routines are called 273Identifying the statement where your assemblerprogram has stopped . . . . . . . . . . . 273Displaying and modifying the value of assemblervariables or storage . . . . . . . . . . . 273Converting a hexadecimal address to a symbolicaddress . . . . . . . . . . . . . . . 274Halting on a line in assembler only if a condition istrue . . . . . . . . . . . . . . . . 274Getting an assembler routine traceback . . . . . 274Finding unexpected storage overwrite errors inassembler . . . . . . . . . . . . . . 275
Chapter 28. Customizing yourfull-screen session . . . . . . . . . 277Defining PF keys . . . . . . . . . . . . 277Defining a symbol for commands or other strings 278Customizing the layout of physical windows onthe session panel . . . . . . . . . . . . 278
Opening and closing physical windows . . . 279Resizing physical windows . . . . . . . . 279Zooming a window to occupy the whole screen 280
Customizing session panel colors . . . . . . . 280Customizing profile settings . . . . . . . . 282Saving customized settings in a preferences file 284Saving and restoring customizations between z/OSDebugger sessions. . . . . . . . . . . . 284
Part 5. Debugging your programsby using z/OS Debuggercommands . . . . . . . . . . . . 285
Chapter 29. Entering z/OS Debuggercommands . . . . . . . . . . . . 287Using uppercase, lowercase, and DBCS in z/OSDebugger commands . . . . . . . . . . . 287
DBCS . . . . . . . . . . . . . . . 287Character case and DBCS in C and C++ . . . 288Character case in COBOL and PL/I . . . . . 288
Abbreviating z/OS Debugger keywords . . . . 288Entering multiline commands in full-screen . . . 289Entering multiline commands in a commands file 289Entering multiline commands without continuation 290Using blanks in z/OS Debugger commands . . . 290Entering comments in z/OS Debugger commands 291Using constants in z/OS Debugger commands . . 291Getting online help for z/OS Debugger commandsyntax . . . . . . . . . . . . . . . . 292
Chapter 30. Debugging COBOLprograms . . . . . . . . . . . . . 293z/OS Debugger commands that resemble COBOLstatements . . . . . . . . . . . . . . 293
COBOL command format . . . . . . . . 293COBOL compiler options in effect for z/OSDebugger commands . . . . . . . . . . 294COBOL reserved keywords. . . . . . . . 294
Contents vii

Using COBOL variables with z/OS Debugger . . 295Accessing COBOL variables . . . . . . . 295Assigning values to COBOL variables . . . . 295Example: assigning values to COBOL variables 295Displaying values of COBOL variables . . . . 296
Using DBCS characters in COBOL . . . . . . 297%PATHCODE values for COBOL. . . . . . . 297Declaring session variables in COBOL . . . . . 299z/OS Debugger evaluation of COBOL expressions 299
Displaying the results of COBOL expressionevaluation . . . . . . . . . . . . . 300Using constants in COBOL expressions . . . . 300
Using z/OS Debugger functions with COBOL . . 301Using %HEX with COBOL . . . . . . . . 301Using the %STORAGE function with COBOL 301
Qualifying variables and changing the point ofview in COBOL . . . . . . . . . . . . 301
Qualifying variables in COBOL . . . . . . 302Changing the point of view in COBOL . . . . 303Considerations when debugging a COBOL class 303
Debugging VS COBOL II programs . . . . . . 304Finding the listing of a VS COBOL II program 305
Chapter 31. Debugging a LangXCOBOL program . . . . . . . . . . 307Loading a LangX COBOL program's debuginformation . . . . . . . . . . . . . . 307z/OS Debugger session panel while debugging aLangX COBOL program . . . . . . . . . . 308Restrictions for debugging a LangX COBOLprogram . . . . . . . . . . . . . . . 308%PATHCODE values for LangX COBOL programs 310Restrictions for debugging non-LanguageEnvironment programs . . . . . . . . . . 310
Chapter 32. Debugging PL/I programs 311z/OS Debugger subset of PL/I commands . . . 311PL/I language statements . . . . . . . . . 311%PATHCODE values for PL/I. . . . . . . . 312PL/I conditions and condition handling . . . . 313Entering commands in PL/I DBCS freeform format 314Initializing z/OS Debugger for PL/I programswhen TEST(ERROR, ...) run-time option is in effect . 314z/OS Debugger enhancements to LIST STORAGEPL/I command . . . . . . . . . . . . . 314PL/I support for z/OS Debugger session variables 314Accessing PL/I program variables . . . . . . 315Accessing PL/I structures . . . . . . . . . 315z/OS Debugger evaluation of PL/I expressions . . 317Supported PL/I built-in functions . . . . . . 318
Using SET WARNING PL/I command withbuilt-in functions . . . . . . . . . . . 320
Unsupported PL/I language elements . . . . . 320Debugging OS PL/I programs. . . . . . . . 320Restrictions while debugging Enterprise PL/Iprograms . . . . . . . . . . . . . . . 321
Chapter 33. Debugging C and C++programs . . . . . . . . . . . . . 323z/OS Debugger commands that resemble C andC++ commands . . . . . . . . . . . . 323Using C and C++ variables with z/OS Debugger 324
Accessing C and C++ program variables . . . 324Displaying values of C and C++ variables orexpressions . . . . . . . . . . . . . 325Assigning values to C and C++ variables . . . 325
%PATHCODE values for C and C++ . . . . . 326Declaring session variables with C and C++ . . . 326C and C++ expressions . . . . . . . . . . 327Calling C and C++ functions from z/OS Debugger 328C reserved keywords . . . . . . . . . . . 329C operators and operands . . . . . . . . . 330Language Environment conditions and their C andC++ equivalents . . . . . . . . . . . . 330z/OS Debugger evaluation of C and C++expressions . . . . . . . . . . . . . . 331Intercepting files when debugging C and C++programs . . . . . . . . . . . . . . . 332Scope of objects in C and C++. . . . . . . . 334
Storage classes in C and C++ . . . . . . . 335Blocks and block identifiers for C . . . . . . 336Blocks and block identifiers for C++. . . . . . 336Example: referencing variables and settingbreakpoints in C and C++ blocks . . . . . . . 337
Scope and visibility of objects in C and C++programs . . . . . . . . . . . . . . 337Blocks and block identifiers in C and C++programs . . . . . . . . . . . . . . 338
Displaying environmental information for C andC++ programs . . . . . . . . . . . . . 338Qualifying variables and changing the point ofview in C and C++ . . . . . . . . . . . 339
Qualifying variables in C and C++ . . . . . 339Changing the point of view in C and C++. . . 340Example: using qualification in C. . . . . . 340
Stepping through C++ programs . . . . . . . 342Setting breakpoints in C++ . . . . . . . . . 342
Setting breakpoints in C++ using ATENTRY/EXIT . . . . . . . . . . . . 342Setting breakpoints in C++ using AT CALL . . 343
Examining C++ objects . . . . . . . . . . 343Example: displaying attributes of C++ objects 343
Monitoring storage in C++ . . . . . . . . . 344Example: monitoring and modifying registersand storage in C . . . . . . . . . . . 345
Chapter 34. Debugging an assemblerprogram . . . . . . . . . . . . . 347The SET ASSEMBLER and SET DISASSEMBLYcommands . . . . . . . . . . . . . . 347Loading an assembler program's debuginformation . . . . . . . . . . . . . . 347z/OS Debugger session panel while debugging anassembler program . . . . . . . . . . . 348%PATHCODE values for assembler programs . . 349Using the STANDARD and NOMACGEN view 351Debugging non-reentrant assembler . . . . . . 351
viii IBM z/OS Debugger V14.1.9 User's Guide

Manipulating breakpoints in non-reentrantassembler load modules . . . . . . . . . 352Manipulating local variables in non-reentrantassembler load modules . . . . . . . . . 352
Restrictions for debugging an assembler program 352Restrictions for debugging a LanguageEnvironment assembler MAIN program . . . 354Restrictions on setting breakpoints in theprologue of Language Environment assemblerprograms . . . . . . . . . . . . . . 354Restrictions for debugging non-LanguageEnvironment programs . . . . . . . . . 354Restrictions for debugging assembler code thatuses instructions as data. . . . . . . . . 355Restrictions for debugging self-modifyingassembler code . . . . . . . . . . . . 355Restrictions for debugging assembler programsthat consist of multiple sections . . . . . . 357
Chapter 35. Debugging adisassembled program . . . . . . . 359The SET ASSEMBLER and SET DISASSEMBLYcommands . . . . . . . . . . . . . . 359Capabilities of the disassembly view . . . . . 359Starting the disassembly view . . . . . . . . 360The disassembly view . . . . . . . . . . 360Performing single-step operations in thedisassembly view . . . . . . . . . . . . 361Setting breakpoints in the disassembly view . . . 361Restrictions for debugging self-modifying code . . 361Displaying and modifying registers in thedisassembly view . . . . . . . . . . . . 362Displaying and modifying storage in thedisassembly view . . . . . . . . . . . . 362Changing the program displayed in thedisassembly view . . . . . . . . . . . . 362Restrictions for the disassembly view . . . . . 363
Part 6. Debugging in differentenvironments . . . . . . . . . . 365
Chapter 36. Debugging DB2 programs 367Debugging DB2 programs in batch mode . . . . 367Debugging DB2 programs in full-screen mode . . 368
Chapter 37. Debugging DB2 storedprocedures . . . . . . . . . . . . 371Resolving some common problems whiledebugging DB2 stored procedures . . . . . . 371
Chapter 38. Debugging IMS programs 373Using IMS Transaction Isolation to create a privatemessage-processing region and select transactionsto debug . . . . . . . . . . . . . . . 373Using IMS pseudo wait-for-input (PWFI) with IMSTransaction Isolation . . . . . . . . . . . 376Debugging IMS batch programs interactively byrunning BTS in TSO foreground . . . . . . . 377Debugging IMS batch programs in batch mode . . 377
Debugging non-Language Environment IMS MPPs 377Verifying configuration and starting a region fornon-Language Environment IMS MPPs . . . . 378Choosing an interface and gatheringinformation for non-Language Environment IMSMPPs . . . . . . . . . . . . . . . 378Running the EQASET transaction fornon-Language Environment IMS MPPs . . . . 378
Debugging Language Environment IMS MPPswithout issuing /SIGN ON. . . . . . . . . 380
Syntax of the EQASET transaction for LanguageEnvironment MPPs . . . . . . . . . . 380
Creating setup file for your IMS program by usingIBM z/OS Debugger Utilities . . . . . . . . 381Using IMS message region templates todynamically swap transaction class and debug in aprivate message region . . . . . . . . . . 382Placing breakpoints in IMS applications to avoidthe appearance of z/OS Debugger becomingunresponsive . . . . . . . . . . . . . 384
Chapter 39. Debugging CICSprograms . . . . . . . . . . . . . 385Displaying the contents of channels and containers 385Controlling pattern-match breakpoints with theDISABLE and ENABLE commands . . . . . . 387Preventing z/OS Debugger from stopping at EXECCICS RETURN . . . . . . . . . . . . . 389Early detection of CICS storage violations . . . . 389Saving settings while debugging apseudo-conversational CICS program . . . . . 390Saving and restoring breakpoints and monitorspecifications for CICS programs . . . . . . . 390Restrictions when debugging under CICS . . . . 390Accessing CICS resources during a debuggingsession . . . . . . . . . . . . . . . 391Accessing CICS storage before or after a debuggingsession . . . . . . . . . . . . . . . 392
Chapter 40. Debugging ISPFapplications . . . . . . . . . . . . 393
Chapter 41. Debugging programs in aproduction environment . . . . . . . 397Fine-tuning your programs for z/OS Debugger . . 397
Removing hooks . . . . . . . . . . . 397Removing statement and symbol tables. . . . 398
Debugging without hooks, statement tables, andsymbol tables . . . . . . . . . . . . . 399Debugging optimized COBOL programs . . . . 400
Chapter 42. Debugging UNIX SystemServices programs . . . . . . . . . 403Debugging MVS POSIX programs . . . . . . 403
Chapter 43. Debugging non-LanguageEnvironment programs . . . . . . . 405Debugging exclusively non-Language Environmentprograms . . . . . . . . . . . . . . . 405
Contents ix
|||

Debugging MVS batch or TSO non-LanguageEnvironment initial programs . . . . . . . . 405Debugging CICS non-Language Environmentassembler or non-Language Environment COBOLinitial programs . . . . . . . . . . . . 406
Part 7. Debugging complexapplications . . . . . . . . . . . 407
Chapter 44. Debugging multilanguageapplications . . . . . . . . . . . . 409z/OS Debugger evaluation of HLL expressions . . 409z/OS Debugger interpretation of HLL variablesand constants . . . . . . . . . . . . . 410
HLL variables . . . . . . . . . . . . 410HLL constants . . . . . . . . . . . . 410
z/OS Debugger commands that resemble HLLcommands . . . . . . . . . . . . . . 410Qualifying variables and changing the point ofview . . . . . . . . . . . . . . . . 411
Qualifying variables . . . . . . . . . . 411Changing the point of view . . . . . . . 413
Handling conditions and exceptions in z/OSDebugger. . . . . . . . . . . . . . . 413
Handling conditions in z/OS Debugger . . . 414Handling exceptions within expressions (C andC++ and PL/I only) . . . . . . . . . . 415
Debugging multilanguage applications . . . . . 415Debugging an application fully supported byLanguage Environment . . . . . . . . . 416Using session variables across differentprogramming languages. . . . . . . . . 416Creating a commands file that can be usedacross different programming languages . . . 418
Coexistence with other debuggers . . . . . . 418Coexistence with unsupported HLL modules . . . 418
Chapter 45. Debugging multithreadingprograms . . . . . . . . . . . . . 419Restrictions when debugging multithreadingapplications . . . . . . . . . . . . . . 419
Chapter 46. Debugging acrossmultiple processes and enclaves . . . 421Starting z/OS Debugger within an enclave . . . 421Viewing z/OS Debugger windows across multipleenclaves . . . . . . . . . . . . . . . 422Ending a z/OS Debugger session within multipleenclaves . . . . . . . . . . . . . . . 422Using z/OS Debugger commands within multipleenclaves . . . . . . . . . . . . . . . 422
Chapter 47. Debugging amultiple-enclave interlanguagecommunication (ILC) application . . . 427
Chapter 48. Debugging programscalled by Java native methods . . . . 429
Chapter 49. Solving problems incomplex applications . . . . . . . . 431Debugging programs loaded from library lookaside(LLA) . . . . . . . . . . . . . . . . 431Debugging user programs that use system prefixednames . . . . . . . . . . . . . . . . 431
Displaying system prefixes . . . . . . . . 432Debugging programs with names similar tosystem components . . . . . . . . . . 432
Debugging programs containing data-onlymodules . . . . . . . . . . . . . . . 432Optimizing the debugging of large applications 433
Using explicit debug mode to load debug datafor only specific modules . . . . . . . . 433Excluding specific load modules and compileunits . . . . . . . . . . . . . . . 434
Displaying current NAMES settings . . . . . . 435Using the EQAOPTS NAMES command to includeor exclude the initial load module . . . . . . 435Using delay debug mode to delay starting of adebug session . . . . . . . . . . . . . 435
Usage notes . . . . . . . . . . . . . 436Debugging subtasks created by the ATTACHassembler macro . . . . . . . . . . . . 437Debugging tasks running under a generic user IDby using Terminal Interface Manager . . . . . 438
Part 8. Appendixes . . . . . . . . 441
Appendix A. Data sets used by z/OSDebugger . . . . . . . . . . . . . 443
Appendix B. How does z/OS Debuggerlocate source, listing, or separatedebug files? . . . . . . . . . . . . 451Remote debugging in standard mode . . . . . 451Non-remote debugging and remote debugging inDebug Tool compatibility mode . . . . . . . 452
How does z/OS Debugger locate source andlisting files? . . . . . . . . . . . . . 454How does z/OS Debugger locate COBOL andPL/I separate debug files? . . . . . . . . 455How does z/OS Debugger locate EQALANGXfiles . . . . . . . . . . . . . . . 456How does z/OS Debugger locate the C/C++source file and the .dbg file? . . . . . . . 456How does z/OS Debugger locate the C/C++.mdbg file? . . . . . . . . . . . . . 457
x IBM z/OS Debugger V14.1.9 User's Guide

Appendix C. Examples: Preparingprograms and modifying setup fileswith IBM z/OS Debugger Utilities . . . 459Creating personal data sets . . . . . . . . . 459Starting IBM z/OS Debugger Utilities . . . . . 460Compiling or assembling your program by usingIBM z/OS Debugger Utilities . . . . . . . . 460Modifying and using a setup file . . . . . . . 463
Run the program in foreground . . . . . . 463Run the program in batch . . . . . . . . 464
Appendix D. z/OS Debugger JCLWizard . . . . . . . . . . . . . . 465z/OS Debugger JCL Wizard introduction . . . . 465z/OS Debugger JCL Wizard use cases . . . . . 466
Help information . . . . . . . . . . . 466Debug a Language Environment program byusing the Terminal Interface Manager . . . . 468Debug a Language Environment program withthe Remote GUI by using the A line commandwith a Procedure Step Override with the TESTparameter TCPIP . . . . . . . . . . . 473Debug a Language Environment program withthe Remote GUI by using Debug Manager . . 476Debug a non-Language Environment programby using the Terminal Interface Manager . . . 478Debug a Language Environment DB2 programwith Remote GUI using the TCPIP parameter ofthe TEST command . . . . . . . . . . 482Debug a non-Language Environment DB2program by using the Remote GUI . . . . . 484Start Code Coverage without an interactivez/OS Debugger session . . . . . . . . . 487Start Code Coverage with an interactive z/OSDebugger session using the Terminal InterfaceManager . . . . . . . . . . . . . . 489Debug a Language Environment VS COBOL IIprogram compiled with the NOTEST option byusing the Terminal Interface Manager . . . . 491Debug a non-Language Environment programwhen the debug member does not match theprogram name . . . . . . . . . . . . 494
Appendix E. z/OS Debugger CodeCoverage . . . . . . . . . . . . . 501Overview of z/OS Debugger Code Coverage. . . 501
Introduction to z/OS Debugger Code Coverage 501Collecting code coverage observations withz/OS Debugger . . . . . . . . . . . 502Code coverage selection and extraction process 503Code coverage reporting process . . . . . . 504Code coverage Viewer . . . . . . . . . 505
Code coverage by using z/OS Debugger . . . . 506Setup . . . . . . . . . . . . . . . 506Generating code coverage extractedobservations . . . . . . . . . . . . . 509IBM z/OS Debugger Utilities Option E . . . . 512Annotated listing format . . . . . . . . 520Batch facilities . . . . . . . . . . . . 525Batch examples . . . . . . . . . . . . 526
Generating code coverage for CICS transactions 526Generating code coverage in IMS TransactionIsolation . . . . . . . . . . . . . . 527
XML tags for code coverage . . . . . . . . 528XML tags definition for the Observation file . . 528XML tag hierarchy for the Observation file . . 531XML Tags used in the Options file . . . . . 531XML tags used in the Selection file . . . . . 532
Appendix F. Notes on debugging inbatch mode . . . . . . . . . . . . 535
Appendix G. Using IMS messageregion templates to dynamically swaptransaction class and debug in aprivate message region . . . . . . . 537
Appendix H. Displaying and modifyingCICS storage with DTST. . . . . . . 539Starting DTST . . . . . . . . . . . . . 539
Examples of starting DTST . . . . . . . . 539Modifying storage through the DTST storagewindow . . . . . . . . . . . . . . . 541Navigating through the DTST storage window . . 541DTST storage window . . . . . . . . . . 542Navigation keys for help screens . . . . . . . 543Syntax of the DTST transaction . . . . . . . 544
Examples . . . . . . . . . . . . . . 545
Appendix I. z/OS Debugger LoadModule Analyzer . . . . . . . . . . 547Choosing a method to start Load Module Analyzer 547Starting the Load Module Analyzer by using JCL 547Starting the Load Module Analyzer by using IBMz/OS Debugger Utilities . . . . . . . . . . 547Description of the JCL statements to use with LoadModule Analyzer . . . . . . . . . . . . 547
Description of DD names used by Load ModuleAnalyzer . . . . . . . . . . . . . . 548Description of parameters used by Load ModuleAnalyzer . . . . . . . . . . . . . . 549Description of EQASYSPF file format . . . . 551Description of EQAPGMNM file format . . . 552Description of program output created by LoadModule Analyzer . . . . . . . . . . . 552Description of output contents created by LoadModule Analyzer . . . . . . . . . . . 553
Example: Output created by Load ModuleAnalyzer for an OS/VS COBOL load module . . 553Example: Compiler options output created by LoadModule Analyzer . . . . . . . . . . . . 553
Appendix J. Running NEWCOPY onprograms by using DTNP transaction . 555
Appendix K. Using the IBM DebugTool plugins . . . . . . . . . . . . 557Instrument JCL for Debugging Plug-in . . . . . 560
Contents xi

z/OS Debugger Code Coverage Plug-in . . . . 563Load Module Analyzer Plug-in . . . . . . . 565Locating the trace file of the DTCN Profile, theDTSP Profile, Instrument JCL for Debugging, CodeCoverage, and Load Module Analyzer view . . . 567
Example: .debugtool.dtcn.trace file . . . . . 567Examples: .debugtool.dtsp.trace files. . . . . 568Examples: .debugtool.bjfd.trace files . . . . . 568
Appendix L. Debugging a programprocessed by the Automatic BinaryOptimizer for z/OS . . . . . . . . . 571
Appendix M. Support resources andproblem solving information . . . . . 573Searching knowledge bases . . . . . . . . . 573
Searching IBM Knowledge Center . . . . . 573Searching product support documents . . . . 573
Getting fixes. . . . . . . . . . . . . . 574Subscribing to support updates . . . . . . . 574
RSS feeds and social media subscriptions . . . 574My Notifications . . . . . . . . . . . 575
Contacting IBM Support. . . . . . . . . . 575Define the problem and determine the severityof the problem . . . . . . . . . . . . 576
Gather diagnostic information . . . . . . . 577Submit the problem to IBM Support. . . . . 577
Appendix N. Accessibility . . . . . . 579Using assistive technologies . . . . . . . . 579Keyboard navigation of the user interface . . . . 579Accessibility of this document . . . . . . . . 579
Notices . . . . . . . . . . . . . . 581Copyright license . . . . . . . . . . . . 582Programming interface information . . . . . . 582Trademarks and service marks . . . . . . . 582
Glossary . . . . . . . . . . . . . 583
Bibliography. . . . . . . . . . . . 591IBM z/OS Debugger publications . . . . . . 591High level language publications . . . . . . . 591Related publications . . . . . . . . . . . 593
Index . . . . . . . . . . . . . . . 595
xii IBM z/OS Debugger V14.1.9 User's Guide

About this document
z/OS® Debugger combines the richness of the z/OS environment with the powerof Language Environment® to provide a debugger for programmers to isolate andfix their program bugs and test their applications. z/OS Debugger gives you thecapability of testing programs in batch, using a nonprogrammable terminal infull-screen mode, or using a workstation interface to remotely debug yourprograms.
Who might use this documentThis document is intended for programmers using z/OS Debugger to debughigh-level languages (HLLs) with Language Environment and assembler programseither with or without Language Environment. Throughout this document, theHLLs are referred to as C, C++, COBOL, and PL/I.
z/OS Debugger runs on the z/OS operating system and supports the followingsubsystems:v CICS®
v DB2®
v IMSv JES batchv TSOv UNIX System Services in remote debug mode or full-screen mode using the
Terminal Interface Manager only
To use this document and debug a program written in one of the supportedlanguages, you need to know how to write, compile, and run such a program.
Accessing z/OS licensed documents on the Internetz/OS licensed documentation is available on the Internet in PDF format at theIBM® Resource Link® Web site at:http://www.ibm.com/servers/resourcelink
Licensed documents are available only to customers with a z/OS license. Access tothese documents requires an IBM Resource Link user ID and password, and a keycode. With your z/OS order you received a Memo to Licensees, (GI10-8928), thatincludes this key code.
To obtain your IBM Resource Link user ID and password, log on to:http://www.ibm.com/servers/resourcelink
To register for access to the z/OS licensed documents:1. Sign in to Resource Link using your Resource Link user ID and password.2. Select User Profiles located on the left-hand navigation bar.
Note: You cannot access the z/OS licensed documents unless you have registeredfor access to them and received an e-mail confirmation informing you that yourrequest has been processed.
Printed licensed documents are not available from IBM.
© Copyright IBM Corp. 1992, 2019 xiii
You can use the PDF format on either z/OS Licensed Product Library CD-ROM orIBM Resource Link to print licensed documents.
How this document is organized
Note: Chapters 2, 14, 21 to 28, and Appendices C, E to J are not applicable to IBMDeveloper for z Systems® (non-Enterprise Edition), IBM Z Open Development, orIBM Z Open Unit Test. In addition, Chapters 3, 6, 31 and Appendix L are notapplicable to IBM Z Open Development or IBM Z Open Unit Test.
This document is divided into areas of similar information for easy retrieval ofappropriate information. The following list describes how the information isgrouped:v Part 1 groups together introductory information about z/OS Debugger. The
following list describes each chapter:– Chapter 1 introduces z/OS Debugger and describes some of its features.– Chapter 2 describes a simple scenario of how to use z/OS Debugger in
full-screen mode, introducing you to some basic commands that you mightuse frequently.
v Part 2 groups together information about how to prepare programs fordebugging. The following list describes each chapter:– Chapter 3 describes how to compile your program to prepare to remote
debug in standard mode.– Chapter 4 describes how to choose compiler options, debugging mode, and
runtime options so that you can prepare programs for debugging. It alsodescribes your options for debugging COBOL programs compiled withcompilers that are now out-of-service.
– Chapter 5 describes how to implement the choices you made in chapter 4.– Chapter 6 describes how to prepare a LangX COBOL program.– Chapter 7 describes how to prepare an assembler program.– Chapter 8 describes how to prepare a DB2 program.– Chapter 9 describes how to prepare a DB2 stored procedures program.– Chapter 10 describes how to prepare a CICS program.– Chapter 11 describes how to prepare an IMS program.– Chapter 12 describes how to include a call to the TEST runtime option into a
program.v Part 3 groups together information that describes the different methods you can
use to start z/OS Debugger. The following list describes each chapter:– Chapter 13 describes how to write the TEST runtime option to indicate how
and when you want to start z/OS Debugger.– Chapter 14 describes how to start z/OS Debugger from IBM z/OS Debugger
Utilities.– Chapter 15 describes how to start z/OS Debugger from a program.– Chapter 16 describes how to start z/OS Debugger in batch mode.– Chapter 17 describes how to start z/OS Debugger for your batch or TSO
programs.– Chapter 18 describes how to start z/OS Debugger from CICS programs.– Chapter 19 describes how to start z/OS Debugger in full-screen mode.
xiv IBM z/OS Debugger V14.1.9 User's Guide
– Chapter 20 describes how to start z/OS Debugger in full-screen mode usingthe Terminal Interface Manager. This chapter also describes some tips tostarting z/OS Debugger from a stored procedure.
v Part 4 groups together information about how to debug a program in full-screenmode and provides an example of how to debug a C, COBOL, and PL/Iprogram in full-screen mode. The following list describes each chapter:– Chapter 21 provides overview information about full-screen mode.– Chapter 22 provides a sample COBOL program to describe how to debug it
in full-screen mode.– Chapter 23 provides a sample OS/VS COBOL program as representative of
non-Language Environment COBOL programs to describe how to debug it infull-screen mode.
– Chapter 24 provides a sample PL/I program to describe how to debug it infull-screen mode.
– Chapter 25 provides a sample C program to describe how to debug it infull-screen mode.
– Chapter 26 provides a sample C++ program to describe how to debug it infull-screen mode.
– Chapter 27 provides a sample assembler program to describe how to debug itin full-screen mode.
– Chapter 28 describes how to modify the appearance of a full-screen modedebugging session and save those changes, as well as other settings, into files.
v Part 5 groups together information about how to enter and use z/OS Debuggercommands.– Chapter 29 provides information about entering mixed case commands, using
DBCS characters, abbreviating commands, entering multiline commands, andentering comments.
– Chapter 30 describes how to use z/OS Debugger commands to debugCOBOL programs.
– Chapter 31 describes how to use z/OS Debugger commands to debug LangXCOBOL programs.
– Chapter 32 describes how to use z/OS Debugger commands to debug PL/Iprograms.
– Chapter 33 describes how to use z/OS Debugger commands to debug C orC++ programs.
– Chapter 34 describes how to use z/OS Debugger commands to debugassembler programs.
– Chapter 35 describes how to use z/OS Debugger commands to debugdisassembly programs.
v Part 6 groups together information about debugging DB2, DB2 storedprocedures, IMS, CICS, ISPF, UNIX System Services, and production-levelprograms.– Chapter 36 describes how to debug a DB2 program.– Chapter 37 describes how to debug a DB2 stored procedure.– Chapter 38 describes how to debug an IMS program.– Chapter 39 describes how to debug a CICS program.– Chapter 40 describes how to debug an ISPF program.– Chapter 41 describes how to debug a production-level program.– Chapter 42 describes how to debug a program running in the UNIX System
Services shell.
About this document xv

– Chapter 43 describes how to debug programs that do not start or run inLanguage Environment.
v Part 7 groups together information about how to debug programs written inmultiple language or running in multiple processes.– Chapter 44 describes how to debug a program written in multiple languages.– Chapter 45 describes the restrictions when you debug a multithreaded
program.– Chapter 46 describes how to debug a program that runs across multiple
processes and enclaves.– Chapter 47 describes how to debug a multiple-enclave interlanguage
communication (ILC) application.– Chapter 48 describes how to debug programs that are called by Java™ native
methods.– Chapter 49 describes how to solve various problems when debugging
complex applications.v Part 8 groups together appendixes. The following list describes each appendix:
– Appendix A describes the data sets that z/OS Debugger uses to retrieve andstore information.
– Appendix B describes the process z/OS Debugger uses to locate source,listing, or side files.
– Appendix C provides an example that guides you through the process ofpreparing a sample program and modifying existing setup files by using IBMz/OS Debugger Utilities.
– Appendix D describes the z/OS Debugger JCL Wizard.– Appendix E describes how to use z/OS Debugger Code Coverage.– Appendix F describes notes on debugging in batch mode.– Appendix G describes using IMS message region templates to dynamically
swap transaction class and debug in a private message region.– Appendix H describes how to use the DTST transaction to display and
modify CICS storage.– Appendix I describes how to use Load Module Analyzer, a stand-alone
program that is shipped with z/OS Debugger.– Appendix J describes how you can use the DTNP transaction, supplied by
z/OS Debugger, to load a new copy of a program into an active CICS region.– Appendix K describes how to install the IBM Debug Tool DTCN Profile
Manager, DTSP Profile Manager, Instrument JCL for Debugging, z/OSDebugger Code Coverage, and Load Module Analyzer plug-ins.
– Appendix L describes how to debug a load module or program objectprocessed by the Automatic Binary Optimizer for z/OS.
– Appendix M describes the resources that are available to help you solve anyproblems you might encounter with z/OS Debugger.
– Appendix N describes the features and tools available to people with physicaldisabilities that help them use z/OS Debugger and z/OS Debuggerdocuments.
The last several topics list notices, bibliography, and glossary of terms.
xvi IBM z/OS Debugger V14.1.9 User's Guide

Terms used in this documentBecause of differing terminology among the various programming languagessupported by z/OS Debugger, as well as differing terminology between platforms,a group of common terms is established. The following table lists these terms andtheir equivalency in each language.
z/OS Debuggerterm
C and C++equivalent
COBOL orLangX COBOLequivalent
PL/I equivalent assembler
Compile unit C and C++source file
Program v Program
v PL/I sourcefile forEnterprisePL/I
v A packagestatement orthe name ofthe mainprocedure forEnterprisePL/I1
CSECT
Block Function orcompoundstatement
Program, nestedprogram,method, orPERFORM groupof statements
Block CSECT
Label Label Paragraph nameor section name
Label Label
Note:
1. The PL/I program must be compiled with and run in one of the followingenvironments:v Compiled with Enterprise PL/I for z/OS, Version 3.6 or later, and run with
the following versions of Language Environment:– Language Environment Version 1.9, or later– Language Environment Version 1.6, Version 1.7, or Version 1.8, with the
PTF for APAR PK33738 appliedv Compiled with Enterprise PL/I for z/OS, Version 3.5, with the PTFs for
APARs PK35230 and PK35489 applied and run with the following versions ofLanguage Environment:– Language Environment Version 1.9, or later– Language Environment Version 1.6, Version 1.7, or Version 1.8, with the
PTF for APAR PK33738 applied
z/OS Debugger provides facilities that apply only to programs compiled withspecific levels of compilers. Because of this, IBM z/OS Debugger User's Guide usesthe following terms:
assemblerRefers to assembler programs with debug information assembled by usingthe High Level Assembler (HLASM).
About this document xvii

COBOLRefers to the all COBOL compilers supported by z/OS Debugger exceptthe COBOL compilers described in the term LangX COBOL.
Disassembly or disassembledRefers to high-level language programs compiled without debuginformation or assembler programs without debug information. Thedebugging support z/OS Debugger provides for these programs is throughthe disassembly view.
Enterprise PL/IRefers to the Enterprise PL/I for z/OS and OS/390® and the VisualAge®
PL/I for OS/390 compilers.
LangX COBOLRefers to any of the following COBOL programs that are supportedthrough use of the EQALANGX debug file:v Programs compiled using the IBM OS/VS COBOL compiler.v Programs compiled using the VS COBOL II compiler with the NOTEST
compiler option.v Programs compiled using the Enterprise COBOL for z/OS V3 and V4
compiler with the NOTEST compiler option.
When you read through the information in this document, remember thatOS/VS COBOL programs are non-Language Environment programs, eventhough you might have used Language Environment libraries to link andrun your program.
VS COBOL II programs are non-Language Environment programs whenyou link them with the non-Language Environment library. VS COBOL IIprograms are Language Environment programs when you link them withthe Language Environment library.
Enterprise COBOL programs are always Language Environment programs.Note that COBOL DLL's cannot be debugged as LangX COBOL programs.
Read the information regarding non-Language Environment programs forinstructions on how to start z/OS Debugger and debug non-LanguageEnvironment COBOL programs, unless information specific to LangXCOBOL is provided.
PL/I Refers to all levels of PL/I compilers. Exceptions will be noted in the textthat describe which specific PL/I compiler is being referenced.
How to read syntax diagramsThis section describes how to read syntax diagrams. It defines syntax diagramsymbols, items that may be contained within the diagrams (keywords, variables,delimiters, operators, fragment references, operands) and provides syntax examplesthat contain these items.
Syntax diagrams pictorially display the order and parts (options and arguments)that comprise a command statement. They are read from left to right and from topto bottom, following the main path of the horizontal line.
SymbolsThe following symbols may be displayed in syntax diagrams:
xviii IBM z/OS Debugger V14.1.9 User's Guide

SymbolDefinition
►►─── Indicates the beginning of the syntax diagram.
───► Indicates that the syntax diagram is continued to the next line.
►─── Indicates that the syntax is continued from the previous line.
───►◄ Indicates the end of the syntax diagram.
Syntax itemsSyntax diagrams contain many different items. Syntax items include:v Keywords - a command name or any other literal information.v Variables - variables are italicized, appear in lowercase and represent the name
of values you can supply.v Delimiters - delimiters indicate the start or end of keywords, variables, or
operators. For example, a left parenthesis is a delimiter.v Operators - operators include add (+), subtract (-), multiply (*), divide (/), equal
(=), and other mathematical operations that may need to be performed.v Fragment references - a part of a syntax diagram, separated from the diagram to
show greater detail.v Separators - a separator separates keywords, variables or operators. For example,
a comma (,) is a separator.
Keywords, variables, and operators may be displayed as required, optional, ordefault. Fragments, separators, and delimiters may be displayed as required oroptional.
Item typeDefinition
RequiredRequired items are displayed on the main path of the horizontal line.
OptionalOptional items are displayed below the main path of the horizontal line.
DefaultDefault items are displayed above the main path of the horizontal line.
Syntax examplesThe following table provides syntax examples.
Table 1. Syntax examples
Item Syntax example
Required item.
Required items appear on the main path of the horizontalline. You must specify these items.
►► KEYWORD required_item ►◄
Required choice.
A required choice (two or more items) appears in avertical stack on the main path of the horizontal line. Youmust choose one of the items in the stack.
►► KEYWORD required_choice1required_choice2
►◄
About this document xix

Table 1. Syntax examples (continued)
Item Syntax example
Optional item.
Optional items appear below the main path of thehorizontal line.
►► KEYWORDoptional_item
►◄
Optional choice.
An optional choice (two or more items) appears in avertical stack below the main path of the horizontal line.You may choose one of the items in the stack.
►► KEYWORDoptional_choice1optional_choice2
►◄
Default.
Default items appear above the main path of thehorizontal line. The remaining items (required oroptional) appear on (required) or below (optional) themain path of the horizontal line. The following exampledisplays a default with optional items.
►►default_choice1
KEYWORDoptional_choice2optional_choice3
►◄
Variable.
Variables appear in lowercase italics. They representnames or values.
►► KEYWORD variable ►◄
Repeatable item.
An arrow returning to the left above the main path of thehorizontal line indicates an item that can be repeated.
A character within the arrow means you must separaterepeated items with that character.
An arrow returning to the left above a group ofrepeatable items indicates that one of the items can beselected, or a single item can be repeated.
►► ▼KEYWORD repeatable_item ►◄
►► ▼
,
KEYWORD repeatable_item ►◄
Fragment.
The ─┤ fragment ├─ symbol indicates that a labelled groupis described below the main syntax diagram. Syntax isoccasionally broken into fragments if the inclusion of thefragment would overly complicate the main syntaxdiagram.
►► KEYWORD fragment ►◄
fragment:
, required_choice1, default_choice
, required_choice2, optional_choice
How to send your commentsYour feedback is important in helping us to provide accurate, high-qualityinformation. If you have comments about this document or any other z/OSDebugger documentation, contact us in one of these ways:v Use the Online Readers' Comment Form at www.ibm.com/software/awdtools/
rcf/. Be sure to include the name of the document, the publication number ofthe document, the version of z/OS Debugger, and, if applicable, the specificlocation (for example, page number) of the text that you are commenting on.
v Send your comments by email to [email protected]. Be sure to include thename of the book, the part number of the book, the version of z/OS Debugger,
xx IBM z/OS Debugger V14.1.9 User's Guide
and, if applicable, the specific location of the text you are commenting on (forexample, a page number or table number).
When you send information to IBM, you grant IBM a nonexclusive right to use ordistribute the information in any way it believes appropriate without incurring anyobligation to you.
About this document xxi

xxii IBM z/OS Debugger V14.1.9 User's Guide

Summary of changes
Version 14.1.9
The following changes were added for IBM z/OS Debugger Version 14.1.9.v New support
– Support is added for z/OS Version 2 Release 4.v IMS Transaction Isolation facility
– Instructions for using the IMS PSTOP command are added to end the waitstate of the IMS region when PWFI is used, so that you can continue with theprogram. For more information, see “Using IMS pseudo wait-for-input (PWFI)with IMS Transaction Isolation” on page 376.
v Terminal Interface Manager
– Terminal Interface Manager now supports MFA-generated tokens andpassword phrases.
Version 14.1.7
The following changes were added for IBM z/OS Debugger Version 14.1.7.v Source entry breakpoints
– When you create source entry breakpoints, you need to specify module andcompile unit information. You are prompted to enter a module name andcompile unit name when you add the breakpoint during an edit session forthe first time. With the module name and compile unit name specified, thedebug session can suspend at the desired location. For more information, seethe "Source entry breakpoints" topic in IBM Knowledge Center.
v Visual debug
– Stack pattern breakpoints that are set in one debug session are restored insubsequent debug sessions.
– When visual debug is enabled, a new toolbar action Link with Visual DebugView appears in the Breakpoints view. When the action is enabled, selecting astack pattern breakpoint in the Breakpoints view shows the stack pattern pathin the Visual Debug view.
v z/OS Debugger Utilities
– A new field Data set name for the IMS RESLIB is added on the ISPF panelEQAPMPDF. You can now use z/OS Debugger Utilities option 4.6 to set adifferent RESLIB for a specific IMS subsystem. If this field is not specified,then the RESLIB specified for us5imrsl in EQAZDFLT is used as the default.For more information, see the "Scenario F: Enabling the Transaction IsolationFacility" topic in IBM z/OS Debugger Customization Guide.
v Remote playback
– The remote Playback function can now record and playback variable values.For more information, see the "Using the Playback toolbar" topic in IBMKnowledge Center.
Version 14.1.6
The following changes were added for IBM z/OS Debugger Version 14.1.6.v IBM Z Open Unit Test
© Copyright IBM Corp. 1992, 2019 xxiii
|
|
|
|
|
||||
|
||

– IBM Z Open Unit Test extends IBM Z Open Development to provide unittesting. With this extension, z/OS Debugger provides support for CompiledCode Coverage and Headless Code Coverage, in addition to the featuresprovided in IBM Z Open Development.For a list of debug features in this combination, see “IBM z/OS Debugger asa component” on page xxix.For installation information, see the chapter about product registration in IBMz/OS Debugger Customization Guide .
Version 14.1.5
The following changes were added for IBM z/OS Debugger Version 14.1.5.v IBM Z® Open Development
– z/OS Debugger is included as part of the new IBM Z Open DevelopmentVersion 1.0 product. For a list of debug features in this product, see “IBMz/OS Debugger as a component” on page xxix. For installation information,see the chapter about product registration in IBM z/OS Debugger CustomizationGuide .
v Currency support
– Support is added for CICS Transaction Server for z/OS Version 5 Release 5.v Visual debug
– Visual debug is now supported on macOS.– A new Visual Debug perspective is added to improve the visual debugging
experience.v Debug Tool compatibility mode
– Support is added for visual debug.– Support is added for COBOL paragraph breakpoints.– Support is added for source entry breakpoints.
v z/OS Debugger Utilities
– Support is added to the remote debug mode selection to use the DebugManager and a user ID (DBMDT) to identify the workstation.
v Global engine search path
A new preference is added so that you can set or clear the global engine searchpath on the Compiled Debug preference page. This preference applies to allincoming debug sessions that cannot be matched to a launch.
Version 14.1.3
The following changes were added for IBM z/OS Debugger Version 14.1.3.v IMS Transaction Isolation
An option is added to IMS Transaction Isolation to preserve the original PSB.For more information, see the new EQAOPTS command IMSISOORIGPSB inIBMz/OS Debugger Reference and Messages.
v Support for Swift
The Load Module Analyzer is enhanced to support Toolkit for Swift on z/OS.v z/OS Debugger Code Coverage
– A new EQACCOPT sample is created in hlq.SEQASAMP for a z/OS DebuggerCode Coverage batch JCL EQAOPTS DD. For more information, see“EQAOPTS commands” on page 507.
xxiv IBM z/OS Debugger V14.1.9 User's Guide

– A list of the existing Code Coverage JCL samples is added to the IBM z/OSDebugger User's Guide. You can use the JCL samples to build a test case, andspecify, gather, process, and document code coverage for the test case. Formore information, see “Batch examples” on page 526.
v MVS Batch Application launches
The Step option list is added on the Remote Profile tab for you to control thestep in the remote debug profile. You can now override the computed step witha custom step, or choose not to include the step in the remote profile. For moreinformation on the step option, see Remote Profile Tab in the IBM Developer forz Systems in IBM Knowledge Center.
v Message updates
– The whole section of CRRDG messages for remote debugging is reworked onto be up-to-date and include more valuable information. For moreinformation, see Remote debugging messages for z/OS Debugger in the IBMDeveloper for z Systems in IBM Knowledge Center.
– Messages EQA9886E and EQA9887E are added to IBMz/OS Debugger Referenceand Messages to ensure that accurate messages are issued when certainproblems are encountered.
v Playback toolbar
A topic is added to introduce how to use the Playback toolbar. For moreinformation, see Using the Playback toolbar in the IBM Developer for z Systemsin IBM Knowledge Center.
Version 14.1.2
The following changes were added for IBM z/OS Debugger Version 14.1.2.v Debug Tool compatibility mode
IBM z/OS Debugger is progressing towards one remote debug mode based onDebug Tool compatibility mode. In support of this direction, Debug Toolcompatibility mode, when available in the user interface, is selected by defaultfor V14.1.2 or later. Any existing launches, property groups, or updatedpreferences remain unchanged. For more information on Debug Toolcompatibility mode, see “Remote debug mode” on page 6.
v Code Coverage
– The headless Compiled Code Coverage collector now produces theSonarQube format and the raw format, in addition to the currently supportedformat. For more information on how to set the exporter types, see Runningcode coverage in headless mode in the IBM Developer for z Systemsdocumentation in IBM Knowledge Center.
– For programs written in COBOL, Compiled Code Coverage now presentsstructural results for programs, sections, and paragraphs. Both the file reportview and the workbench report view support structural results.
– In the Code Coverage Results view, the entry JUnit Code CoverageWorkspace Results was removed. JUnit code coverage results now appearunder Java Code Coverage Workspace Results. Expand the individual Javacode coverage result to see the JUnit results.
v Debug Hovers
Structures and arrays are no longer limited to 100 entries when you inspectvariables in the debug hover help during a debug session.
v COBOL V6.2
When you use line mode, batch mode, full screen mode, and remote mode withDebug Tool compatibility mode, and compile with the TEST(SEPARATE,SOURCE)
Summary of changes xxv

option of the Enterprise COBOL for z/OS Version 6 Release 2 compiler, if thename of the side file does not match the PROGRAM-ID, the debugger can nowlocate the side file, as long as it is in the specified data sets or directories.When you specify the side file location, you can now specify a z/OS UNIXSystem Services directory through a SET SOURCE command, EQAUEDAT userexit, SET DEFAULT LISTINGS command, EQADEBUG DD name, orEQA_DBG_SYSDEBUG environment variable.For more information, see “Choosing TEST or NOTEST compiler suboptions forCOBOL programs” on page 27.
v CEETEST
You can now use CEETEST to restart z/OS Debugger after you use QUIT DEBUG. Tostart z/OS Debugger when a CEETEST call is encountered, set the EQAOPTSCEEREACTAFTERQDBG command to YES. For more information, see “Additionalnotes about starting z/OS Debugger with CEETEST” on page 134.
v IMS Transaction Isolation
An Other run-time options field is added to the Manage Additional Librariesand Delay Debug panel (EQAPMPRG). With this new field, you can specifyLanguage Environment options for the private message region. For moreinformation, see “Using IMS Transaction Isolation to create a privatemessage-processing region and select transactions to debug” on page 373.
Version 14.1.1
The following changes were added for IBM z/OS Debugger Version 14.1.1.v Support for macOS
Remote debugging can now be used on macOS. For limitations, see "macOSlimitations and differences" in the IBM Developer for z Systems in IBMKnowledge Center.
v Code Coverage API Javadoc
Code Coverage API (CCAPI) Javadoc is now included. Use CCAPI to parse andmerge code coverage results programmatically and integrate the results withyour custom tools. For more information, see "Code Coverage API" in the IBMDeveloper for z Systems documentation in IBM Knowledge Center.
Version 14.1.0
The following changes were added for IBM z/OS Debugger Version 14.1.v Currency support
– Support is added for Enterprise COBOL for z/OS Version 6 Release 2.– Support is added for Enterprise PL/I for z/OS Version 5 Release 2.– Support is added for z/OS Version 2 Release 3.– Support is added for z/OS Version 2 Release 3 XL C/C++.– Support is added for CICS Transaction Server for z/OS Version 5 Release 4.– Support is added for DB2 for z/OS Version 12 Release 1.– Support is added for Automatic Binary Optimizer for z/OS Version 1 Release
3.v New features for COBOL V6.2
– Support is added for TEST(SEPARATE) in Enterprise COBOL for z/OS Version6 Release 2. This option puts the debug data in a side file rather than theprogram object. For more information, see "Remote debugging in standardmode" and "Non-remote debugging and remote debugging in Debug Tool
xxvi IBM z/OS Debugger V14.1.9 User's Guide
compatibility mode" in the "How does z/OS Debugger locate source, listing,or separate debug files" appendix in the IBM z/OS Debugger User's Guide.
– With the new Enterprise COBOL for z/OS Version 6 Release 2 compiler,standard mode users can now use the actual source input to the compiler intheir debug session (Source view) in addition to the Expanded Source view.For more information, see "Switching between different debug views" in theIBM Developer for z Systems in IBM Knowledge Center.
v Code Coverage
– Compiled Code Coverage now supports setting the view to use when yousave source. For more information, see "Specifying code coverage options inthe startup key" and "Code Coverage Tab" in the IBM Developer for zSystems documentation in IBM Knowledge Center.
– Support is added for enhanced remote Compiled Code Coverage for DebugTool compatibility mode that now includes non-Language Environmentassembler language and performance improvements. For more information,see "Supported compiler and options for code coverage" in the IBMDeveloper for z Systems documentation in IBM Knowledge Center.
– Debug Tool Coverage Utility (DTCU) is deprecated. To determine codecoverage with z/OS Debugger, use IBM Compiled Code Coverage or z/OSDebugger Code Coverage.
v New installation verification programs
New installation verification programs are available for standard mode. Formore information, see "Running the installation verification programs for SVCs","Running the installation verification programs in a CICS region", and "Runningthe installation verification programs for Debug Manager" in the IBM z/OSDebugger Customization Guide.
v Change variable values
Variable values can be changed in the hovering Debug editor window. For moreinformation, see "Inspecting variables" in the IBM Developer for z Systems inIBM Knowledge Center.
Summary of changes xxvii

xxviii IBM z/OS Debugger V14.1.9 User's Guide

IBM z/OS Debugger as a component
IBM z/OS Debugger is the next iteration of IBM debug technology on z Systemsand consolidates the IBM Integrated Debugger and IBM Debug Tool engines intoone unified technology. IBM z/OS Debugger is progressing towards one remotedebug mode based on Debug Tool compatibility mode. In support of this direction,Debug Tool compatibility mode, when available in the user interface, is selected bydefault for V14.1.2 or later.
IBM z/OS Debugger is a component of the following products:
IBM Developer for z Systems Enterprise EditionThis product is included in IBM Application Delivery Foundation for zSystems. IBM Developer for z Systems Enterprise Edition provides all thedebug features.
IBM Developer for z SystemsIBM Developer for z Systems is a subset of IBM Developer for z SystemsEnterprise Edition. IBM Developer for z Systems, previously known asIBM Rational® Developer for z Systems, is an Eclipse-based integrateddevelopment environment for creating and maintaining z/OS applicationsefficiently.
IBM Developer for z Systems includes all enhancements in IBM Developerfor z Systems Enterprise Edition except for the debug features noted inTable 2 on page xxx.
IBM Debug for z SystemsIBM Debug for z Systems is a subset of IBM Developer for z SystemsEnterprise Edition. IBM Debug for z Systems focuses on debuggingsolutions for z/OS application developers. See Table 2 on page xxx for thedebug features supported.
IBM Debug for z Systems does not provide advanced developer featuresthat are available in IBM Developer for z Systems Enterprise Edition.
For information about how to install the IBM Debug for z Systems client,see Installation of IBM Developer for z Systems and IBM Debug for zSystem (https://developer.ibm.com/mainframe/2016/12/02/installation-of-ibm-developer-for-z-systems-and-ibm-debug-for-z-systems/).
IBM Z Open DevelopmentIBM Z Open Development offers an entry level toolset with the corecapabilities needed to link z/OS development seamlessly with anestablished, open DevOps toolchain. IBM Z Open Development providesremote debug support for high level compiled languages. See Table 2 onpage xxx for the debug features supported.
IBM Z Open Unit Test, extending IBM Z Open DevelopmentIBM Z Open Unit Test is an automated unit testing tool for batch and CICSprograms. It helps minimize the time taken to unit test traditional z/OSapplications, and helps businesses respond and deliver with speed.
IBM Z Open Unit Test provides code coverage support for high levelcompiled languages via IBM z/OS Debugger. It can only be used with theIBM Z Open Development offering and extends IBM Z Open Development
© Copyright IBM Corp. 1992, 2019 xxix

to help ensure that no untested code is delivered. See Table 2 for the debugfeatures supported for the combination.
Table 2 maps out the debug features in the products. In this table, the letter Xindicates the features that each product supports.
Table 2. Debug feature comparison
IBM Z OpenDevelopment
IBM Z OpenUnit Test,extendingIBM Z OpenDevelopment
IBM Debugfor z Systems
IBMDeveloper forz Systems
IBMDeveloperfor z SystemsEnterpriseEdition
Main features
z/OSDebugger3270interface,includingz/OSDebuggerUtilities
X X
z/OSDebuggerremote debug
X X X 1 X 2 X
Debug Toolcompatibilitymode
X X X X X
Standardmode 3
X X X
Debug ToolPlugins
X X 4 X
Code Coverage features
CompiledCodeCoverage
X X 1 X 2 X
HeadlessCodeCoverage
X X X
Java CodeCoverage
X X
z/OSDebuggerCodeCoverage(3270 andremoteinterfaces) 5
X X
3270 features
z/OSDebugger fullscreen, batchor line mode
X X
IMS Isolationsupport
X X
xxx IBM z/OS Debugger V14.1.9 User's Guide

Table 2. Debug feature comparison (continued)
IBM Z OpenDevelopment
IBM Z OpenUnit Test,extendingIBM Z OpenDevelopment
IBM Debugfor z Systems
IBMDeveloper forz Systems
IBMDeveloperfor z SystemsEnterpriseEdition
Remote debug features
IntegrationwithLanguageEditors:
v COBOLEditor
v PLI Editor
X X X X
IntegrationwithLanguageEditors:
v System z®
LPEXEditor
v RemoteC/C++Editor
X X
Visual Debug X X X X
IMS IsolationGUI interface
X
Integrationwith CICSExplorer®
views
X X
Integrationwith Propertygroups
X X X X
Source EntryBreakpoints
X X X X
Team Debugsupport
X X
Compiler support features
Assemblersupport:CreateEQALANGXfiles
X X X
Assemblersupport:Debugging 6
X X X X X
LANGXCOBOLsupport 7
X X X
IBM z/OS Debugger as a component xxxi

Table 2. Debug feature comparison (continued)
IBM Z OpenDevelopment
IBM Z OpenUnit Test,extendingIBM Z OpenDevelopment
IBM Debugfor z Systems
IBMDeveloper forz Systems
IBMDeveloperfor z SystemsEnterpriseEdition
Support forAutomaticBinaryOptimizer(ABO)
X X X
IBM COBOLand CICSCommandLevelConversionAid forOS/390 &MVS & VM
X X X
Load ModuleAnalyzer
X X
Notes:
1. IBM Debug for z Systems includes z/OS Debugger remote debug and compiledcode coverage GUI interface, but does not include Headless Code Coverageand Java Code Coverage.
2. IBM Developer for z Systems includes z/OS Debugger remote debug andcompiled code coverage GUI interface, but does not include z/OS DebuggerCode Coverage.
3. The following features are only supported in standard mode:v Support for 64 bit Enterprise PL/I for z/OS Version 5v Support for 64 bit C/C++ feature of z/OSv COBOL V6.2 Source View
4. IBM Developer for z Systems includes Debug Tool plugins, but does notinclude Load Module Analyzer and z/OS Debugger Code Coverage.
5. z/OS Debugger Code Coverage can only be enabled in the 3270 interface.6. Debugging assembler requires that you have EQALANGX files that have been
created via ADFz Common Components or a product that ships the ADFzCommon Components.
7. LANGX COBOL refers to any of the following programs:v A program compiled with the IBM OS/VS COBOL compiler.v A program compiled with the IBM VS COBOL II compiler with the NOTEST
compiler option.v A program compiled with the IBM Enterprise COBOL for z/OS Version 3 or
Version 4 compiler with the NOTEST compiler option.
xxxii IBM z/OS Debugger V14.1.9 User's Guide

Part 1. Getting started with z/OS Debugger
© Copyright IBM Corp. 1992, 2019 1

2 IBM z/OS Debugger V14.1.9 User's Guide

Chapter 1. z/OS Debugger: overview
z/OS Debugger helps you test programs and examine, monitor, and control theexecution of programs that are written in assembler, C, C++, COBOL, or PL/I on az/OS system. Your applications can include other languages; z/OS Debuggerprovides a disassembly view where you can debug, at the machine code level,those portions of your application. However, in the disassembly view, yourdebugging capabilities are limited. Table 3 and Table 4 on page 4 map out thecombinations of compilers and subsystems that z/OS Debugger supports.
You can use z/OS Debugger to debug your programs in batch mode, interactivelyin full-screen mode, or in remote debug mode.
Table 3 maps out the z/OS Debugger interfaces and compilers or assemblers eachinterface supports.
Table 3. z/OS Debugger interface type by compiler or assembler
Compiler or assemblerBatchmode
Full-screenmode
Remotedebugmode 1
OS/VS COBOL, Version 1 Release 2.4 (with limitations) 2 X X
VS COBOL II Version 1 Release 3 and Version 1 Release 4 (with limitations; forprograms compiled with the TEST compiler option and linked with the LanguageEnvironment library.)
X X X
VS COBOL II Version 1 Release 3 and Version 1 Release 4 (with limitations; forprograms compiled with the NOTEST compiler option and linked with anon-Language Environment library.) 2
X X
VS COBOL II Version 1 Release 3 and Version 1 Release 4 (with limitations; forprograms compiled with the NOTEST compiler option and linked with the LanguageEnvironment library.) 2
X X
AD/Cycle COBOL/370 Version 1 Release 1 X X
COBOL for MVS & VM X X X
COBOL for OS/390 & VM X X X
Enterprise COBOL for z/OS and OS/390 compiled with the TEST compiler option X X X
Enterprise COBOL for z/OS and OS/390 compiled with the NOTEST compiler option 2 X X
Enterprise COBOL for z/OS compiled with the TEST compiler option X X X
Enterprise COBOL for z/OS V3 and V4 compiled with the NOTEST compiler option 2 X X X
OS PL/I Version 2 Release 1, Version 2 Release 2, and Version 2 Release 3 (withlimitations)
X X
PL/I for MVS & VM X X
Enterprise PL/I for z/OS and OS/390 compiled with the TEST compiler option X X X
Enterprise PL/I for z/OS compiled with the TEST compiler option X X X
AD/Cycle C/370™ Version 1 Release 2 X X
C/C++ for MVS/ESA Version 3 Release 2 X X
C/C++ feature of OS/390 Version 1 Release 3 and earlier X X
C/C++ feature of OS/390 Version 2 Release 10 and later X X X
C/C++ feature of z/OS X X X
© Copyright IBM Corp. 1992, 2019 3

Table 3. z/OS Debugger interface type by compiler or assembler (continued)
Compiler or assemblerBatchmode
Full-screenmode
Remotedebugmode 1
IBM High Level Assembler (HLASM), Version 1 Release 4, Version 1 Release 5, andVersion 1 Release 6
X X X
Notes:
1. This column of the table is only applicable for Debug Tool compatibility mode. For standard mode, see Chapter 3,“Preparing to remote debug in standard mode,” on page 23.
2. See Chapter 6, “Preparing a LangX COBOL program,” on page 73 for information about how to prepare aprogram of this type.
Table 4 maps out the z/OS Debugger interfaces and subsystems each interfacesupports.
Table 4. z/OS Debugger interface type by subsystem
SubsystemBatchmode
Full-screenmode
Full-screenmode usingthe TerminalInterfaceManager
Remotedebugmode
TSO X X X X
JES batch X X X
UNIX System Services X X
CICS X1 X
DB2 X X X X
DB2 stored procedures X X
IMS TM X X
IMS batch X X X
IMS BTS X X X
Airline Control System (ALCS) X2
1 You can use 3 different ways to debug CICS programs in full-screen mode:single terminal mode, screen control mode, and separate terminal mode.2 Only for C and C++ programs.
Refer to the following topics for more information related to the material discussedin this topic.
Related concepts“z/OS Debugger interfaces”Related tasksChapter 4, “Planning your debug session,” on page 25Chapter 21, “Using full-screen mode: overview,” on page 161Related referencesIBM z/OS Debugger Reference and Messages
z/OS Debugger interfacesThe terms full-screen mode, batch mode, and remote debug mode identify the types ofdebugging interfaces that z/OS Debugger provides.
4 IBM z/OS Debugger V14.1.9 User's Guide

Batch mode
Note: This section is not applicable to IBM Developer for z Systems(non-Enterprise Edition), IBM Z Open Development, or IBM Z Open Unit Test.
You can use a z/OS Debugger commands file to predefine a series of z/OSDebugger commands to be performed on a running application. Neither terminalinput, nor user interaction is available during batch mode debugging. Whencommands in the commands file are processed by the debugger, they can producemessages that are written to the z/OS Debugger log. Log messages are written to alog file for your review at a later time.
The term "batch mode" debugging refers to this debugging method, which iscontrolled by a predefined script. Note that batch mode debugging is not limitedto debugging batch programs. Batch mode can be used with any type ofapplication supported by z/OS Debugger, including online applications runningunder CICS, IMS/TM, or TSO.
Full-screen mode
Note: This section is not applicable to IBM Developer for z Systems(non-Enterprise Edition), IBM Z Open Development, or IBM Z Open Unit Test.
z/OS Debugger provides an interactive full-screen interface on a 3270 device, withdebugging information displayed in three windows:v A Source window in which to view your program source or listingv A Log window, which records commands and other interactions between z/OS
Debugger and your programv A Monitor window in which to monitor changes in your program
You can debug all languages supported by z/OS Debugger in full-screen mode.
Refer to the following topics for more information related to the material discussedin this topic.
Related tasksIBM z/OS Debugger Customization Guide
Full-screen mode using the Terminal Interface Manager
Note: This section is not applicable to IBM Developer for z Systems(non-Enterprise Edition), IBM Z Open Development, or IBM Z Open Unit Test.
Full-screen mode using the Terminal Interface Manager provides the sameinteractive full-screen interface that full-screen mode provides and enables you todebug types of programs that you could not debug with full-screen mode. Forexample, you can debug a COBOL batch job running in MVS/JES, a DB2 StoredProcedure, an IMS transaction running on a IMS MPP region, or an applicationrunning in UNIX System Services.
The Terminal Interface Manager (TIM) is a component of z/OS Debugger thatprovides communication between the debugger, which controls an applicationprogram as it runs, and a terminal session where you interact with the debugger.To use the TIM you connect a 3270 terminal session to the TIM.
Chapter 1. z/OS Debugger: overview 5

The debugger displays on that terminal session in full-screen mode and acceptsyour commands. You can connect to the TIM from a dedicated 3270 terminalsession, for example, a terminal emulator session configured to connect to it.Optionally, you can access the TIM from VTAM® session manager software.
Contact your system administrator to determine how to access a terminal sessionusing the TIM on your system.
Remote debug modeIn remote debug mode, the host application starts z/OS Debugger, whichcommunicates through a TCP/IP connection to a remote debugger on yourWindows, Linux or macOS workstation.
z/OS Debugger can work with the remote GUI in IBM Developer for z Systems,IBM Z Open Development, or IBM Z Open Unit Test to provide you with theability to debug host programs, including batch programs, through a graphicaluser interface (GUI) on the workstation.
IBM z/OS Debugger supports two modes of remote debugging:
Standard modeUses the Program Information and Control Library (PICL) engine technology. With the PICL technology, part of the processing is performed in the client machine, which can reduce the overhead in the z/OS system. The following features are provided in the standard mode only:v Integration with IBM Fault Analyzer for setting deferred breakpointsv Support for 64 bit Enterprise PL/I for z/OS Version 5v Support for 64 bit C/C++ feature of z/OS
Note: Standard mode is not available in IBM Z Open Development or IBM Z Open Unit Test.
Debug Tool compatibility modeUses the remote debug engine from the former Debug Tool for z/OS toperform all host debugging tasks. This mode supports all features that areavailable in Debug Tool for z/OS.
IBM z/OS Debugger is progressing towards one remote debug mode basedon Debug Tool compatibility mode. In support of this direction, DebugTool compatibility mode, when available in the user interface, is selectedby default for V14.1.2 or later. Any existing launches, property groups, orupdated preferences remain unchanged.
You can enter some z/OS Debugger commands through the remotedebugger's Debug Console. For a list of z/OS Debugger commands thatyou can enter, see “z/OS Debugger commands supported in remote debugmode” in the IBM z/OS Debugger Reference and Messages.
Unless otherwise specified, the information about remote debug mode in IBM z/OSDebugger User's Guide applies only to Debug Tool compatibility mode.
6 IBM z/OS Debugger V14.1.9 User's Guide

For more information about remote debugging with IBM z/OS Debugger, see theIBM Developer for z Systems, IBM Z Open Development, or IBM Z Open Unit Testdocumentation in IBM Knowledge Center.
IBM z/OS Debugger Utilities
Note: This section is not applicable to IBM Developer for z Systems(non-Enterprise Edition), IBM Z Open Development, or IBM Z Open Unit Test.
IBM z/OS Debugger Utilities is a set of ISPF panels that give you access to toolsthat can help you manage your debugging sessions. This topic describes thesetools.
IBM z/OS Debugger Utilities: Job CardThe tool (under option 0, called Job Card) helps you create a JOB card that is usedby the tools in Program Preparation (option 1), z/OS Debugger Setup File (option2), and JCL for Batch Debugging (option 8).
IBM z/OS Debugger Utilities: Program PreparationThe set of tools under the Program Preparation (option 1) can help you manage allthe tasks required to compile or assemble, and link your programs. They can alsohelp you convert older COBOL source code and copybooks to newer versions ofCOBOL by using COBOL and CICS Command Level Conversion Aid (CCCA). TheProgram Preparation option can be very useful if you do not have an establishedbuild process at your site. The following list describes the specific tasks thatProgram Preparation can help you do:v Run the DB2 precompiler or the CICS translator.v Set compiler options.v Specify naming patterns for your data sets.v Specify input data sets for copy processing.v Convert, compile, and link-edit your programs in either TSO foreground or
MVS™ batch.v Convert, compile, and link-edit your high level language programs in either TSO
foreground or MVS batch.v Convert, assemble, and link-edit your assembler programs in either TSO
foreground or MVS batch.v Generate EQALANGX side files.v Generate a listing from an EQALANGX or COBOL SYSDEBUG side file.v Prepare the following COBOL programs for debugging:
– Programs written for non-Language Environment COBOL.– Programs previously compiled with the CMPR2 compiler option.
To prepare these programs, you convert the source to the newer COBOLstandard and compile it with the newer compilers. After you debug yourprogram, you can do one of the following:– Make changes to your non-Language Environment COBOL source and repeat
the conversion and compilation every time you want to debug your program.– Make changes in the converted source and stop maintaining your
non-Language Environment COBOL source.
Chapter 1. z/OS Debugger: overview 7

IBM z/OS Debugger Utilities: z/OS Debugger Setup FileSetup files can save you time when you are debugging a program that needs to berestarted multiple times. Setup files store information needed to allocate thenecessary files and run a single job-step with z/OS Debugger either in MVS batchor TSO foreground. You can create several setup files for each program; each setupfile can store information about starting and running your program in differentcircumstances. To create and manage setup files, select z/OS Debugger Setup File(option 2).
IBM z/OS Debugger Utilities: IMS TM DebuggingYou can create private IMS message regions to debug test applications withoutinterfering with other regions by using one of two features:v You can use predefined IMS message region templates to start a private IMS
message region, assign a specific transaction to the region, and run thattransaction in the region
v You can use the IMS Transaction Isolation function to view a list of IMStransactions for Message Processing Regions in an IMS system, and select theones that you want to debug. You can also use this function to clone atransaction's operating environment into a private message-processing regionthat is reserved for your use. Any transactions that you register to debug arerouted to this private environment to isolate you from other users of that sametransaction and environment.
For IMSplex users, you can modify the Language Environment runtime parameterstable without relinking the applications. The tools that can help you complete thesetasks are found under option 4, called IMS TM Debugging.
IBM z/OS Debugger Utilities: Load Module AnalyzerLoad Module Analyzer analyzes MVS load modules or program objects todetermine the language translator (compiler or assembler) used to generate theobject for each CSECT. The tool that can help you complete this task can be foundunder option 5, called Load Module Analyzer.
IBM z/OS Debugger Utilities: z/OS Debugger User Exit DataSet
This function assists you in preparing a TEST runtime option data set that is usedby the z/OS Debugger Language Environment user exit. The z/OS DebuggerLanguage Environment user exits use this TEST runtime option string to start adebug session. The tool that can help you complete this task is found under option6, called z/OS Debugger User Exit Data Set, in IBM z/OS Debugger Utilities.
IBM z/OS Debugger Utilities: Other IBM Application DeliveryFoundation for z Systems tools
This function provides an interface to the IBM File Manager ISPF functions. Youcan find these tools under option 7, called Other IBM Application DeliveryFoundation for z Systems tools, in IBM z/OS Debugger Utilities.
IBM z/OS Debugger Utilities: JCL for Batch DebuggingModify the JCL for a batch job so that z/OS Debugger is started when the job isrun. The tool that can help you complete this task is found under option 8, calledJCL for Batch Debugging, in IBM z/OS Debugger Utilities.
8 IBM z/OS Debugger V14.1.9 User's Guide

IBM z/OS Debugger Utilities: IMS BTS DebuggingThe IMS BTS Debugging option helps you run and debug IMS BTS programs bysaving, into a set up file, the information needed to create the runtimeenvironment for the program. IBM z/OS Debugger Utilities uses the information inthe set up file to create the appropriate JCL statements, which you can then run inthe foreground or submit as a batch job.
IBM z/OS Debugger Utilities: JCL to Setup File ConversionThe JCL to Setup File Conversion option is an alternative to the z/OS DebuggerSetup File option above. With this option, you can select from a list of JCL stepsrather than from a list of JCL cards to specify what to convert to a set up fileformat.
IBM z/OS Debugger Utilities: Delay Debug ProfileThe Delay Debug Profile function assists you in preparing a data set that containsTEST runtime options, and pattern match arguments. The data set is used by thez/OS Debugger delay debug mode to find a match of a program name or Cfunction name (compile unit) (along with an optional load module name). When amatch is found, z/OS Debugger uses the TEST runtime option string to start adebug session. The tool that helps you complete this task is found under Option B,called Delay Debug Profile, in IBM z/OS Debugger Utilities.
IBM z/OS Debugger Utilities: IMS Transaction and User IDCross Reference Table
The IMS Transaction and User ID Cross Reference Table contains the crossreference information between an IMS Transaction and a User ID. z/OS Debuggeruses the information to find the ID of the user who wants to debug the transactionand to construct the name of the user's debug profile data set. This function isused when an IMS transaction runs using a generic ID as is in the case withtransactions started using the MQ or web gateway.
IBM z/OS Debugger Utilities: Non-CICS Debug Session Startand Stop Message Viewer
The Non-CICS Debug Session Start and Stop Message Viewer allows users tobrowse the start and stop messages of debug sessions. You can use it to trackdebug sessions and identify abnormal sessions that are started but not terminated.
IBM z/OS Debugger Utilities: z/OS Debugger Code CoverageThe z/OS Debugger Code Coverage allows users to view the code coverageobservations generated from the z/OS Debugger session. It also provides functionsto extract and merge the code observations and generate reports.
IBM z/OS Debugger Utilities: z/OS Debugger DeferredBreakpoints
The z/OS Debugger Deferred Breakpoints allows users to create and view a list ofbreakpoints prior to starting the debug session. It reduces the time spent in thedebugging session and also the system resource usages.
Chapter 1. z/OS Debugger: overview 9

IBM z/OS Debugger Utilities: z/OS Debugger JCL WizardThe z/OS Debugger JCL Wizard, an ISPF edit macro named EQAJCL, can be usedto modify a JCL or procedure member and create statements to invoke z/OSDebugger in various environments.
Starting IBM z/OS Debugger UtilitiesIBM z/OS Debugger Utilities can be started in one of the following ways:v If an option was installed to access the IBM z/OS Debugger Utilities primary
options ISPF panel from an existing panel, then select that option by usinginstructions from the installer.
v If the z/OS Debugger data sets were installed into your normal logonprocedure, enter the following command from the ISPF Command Shell panel(by default set as option 6):EQASTART NATLANG(language_id)
v If z/OS Debugger was not installed in your ISPF environment, enter thiscommand from the ISPF Command Shell panel (by default set as option 6):EX ’hlq.SEQAEXEC(EQASTART)’ ’NATLANG(language_id)’
To determine which method to use on your system, contact your systemadministrator.
NATLANG(language_id) is optional. If you specify NATLANG(language_id), yoursettings are remembered by EQASTART and become the default on subsequentstarts of EQASTART when you do not specify parameters.
NATLANGThe NATLANG parameter specifies that national language to be used to displayprogram messages. The syntax of this parameter is:
►► NATLANG (ENUlanguage_idUENJPNKOR
) ►◄
language_idOne of the following IDs:
ENU English
UEN Uppercase English
JPN Japanese
Feature needed: JPN is not a valid choice unless the JPN feature ofz/OS Debugger has been installed.
KOR Korean
Feature needed: KOR is not a valid choice unless the KOR feature ofz/OS Debugger has been installed.
10 IBM z/OS Debugger V14.1.9 User's Guide

Chapter 2. Debugging a program in full-screen mode:introduction
Note: This chapter is not applicable to IBM Developer for z Systems(non-Enterprise Edition), IBM Z Open Development, or IBM Z Open Unit Test.
Full-screen mode is the interface that z/OS Debugger provides to help you debugprograms on a 3270 terminal. This topic describes the following tasks which makeup a basic debugging session:1. “Compiling or assembling your program with the proper compiler options”2. “Starting z/OS Debugger” on page 123. After you start z/OS Debugger, you will see the full-screen mode interface.
“The z/OS Debugger full screen interface” on page 13 describes the parts of theinterface. Then you can do any of the following tasks:v “Stepping through a program” on page 14v “Running your program to a specific line” on page 14v “Setting a breakpoint” on page 15v “Skipping a breakpoint” on page 18v “Clearing a breakpoint” on page 18v “Displaying the value of a variable” on page 15v “Displaying memory through the Memory window” on page 17v “Changing the value of a variable” on page 17v “Recording and replaying statements” on page 18
4. “Stopping z/OS Debugger” on page 19
Each topic directs you to other topics that provide more information.
Compiling or assembling your program with the proper compileroptions
Each programming language has a comprehensive set of compiler options. It isimportant to use the correct compiler options to prepare your program fordebugging. The following list describes the simplest set of compiler options to usefor each programming language:
Compiler options that you can use with C programsThe TEST and DEBUG compiler options provide suboptions to refinedebugging capabilities. Which compiler option and suboptions to choosedepends on the version of the C compiler that you are using.
Compiler options that you can use with C++ programsThe TEST and DEBUG compiler options provide suboptions to refinedebugging capabilities. Which compiler option and suboptions to choosedepends on the version of the C++ compiler that you are using.
Compiler options that you can use with COBOL programsThe TEST compiler option provides suboptions to refine debuggingcapabilities. Some suboptions are used only with a specific version ofCOBOL. This chapter assumes the use of suboptions available to allversions of COBOL.
© Copyright IBM Corp. 1992, 2019 11

Compiler options that you can use with LangX COBOL programsWhen you compile your OS/VS COBOL program, the following optionsare required: NOTEST, SOURCE, DMAP, PMAP, VERB, XREF, NOLST,NOBATCH, NOSYMDMP, NOCOUNT.
When you compile your VS COBOL II program, the following options arerequired: NOOPTIMIZE, NOTEST, SOURCE, MAP, XREF, and LIST (orOFFSET).
When you compile your Enterprise COBOL for z/OS V3 and V4 program,the following options are required: NOOPTIMIZE, NOTEST, SOURCE,MAP, XREF, and LIST.
Compiler options that you can use with PL/I programsThe TEST compiler option provides suboptions to refine debuggingcapabilities. Some suboptions are used only with a specific version of PL/I.This chapter assumes the use of suboptions available to all versions ofPL/I, except for PL/I for MVS or OS PL/I compilers, which must alsospecify the SOURCE suboption.
Assembler options that you can use with assembler programsWhen you assemble your program, you must specify the ADATA option.Specifying this option generates a SYSADATA file, which the EQALANGXpostprocessor needs to create a debug file.
See Chapter 4, “Planning your debug session,” on page 25 for instructions on howto choose the correct combination of compiler options and suboptions to use foryour situation.
Starting z/OS DebuggerThere are several methods to start z/OS Debugger in full-screen mode. Eachmethod is designed to help you start z/OS Debugger for programs that arecompiled with an assortment of compiler options and that run in a variety ofruntime environments. Part 3, “Starting z/OS Debugger,” on page 119 describeseach of these methods.
In this topic, we describe the simplest and most direct method to start z/OSDebugger for a program that runs in Language Environment in TSO. At a TSOREADY prompt, enter the following command:CALL ’USERID1.MYLIB(MYPROGRAM)’ ’/TEST’
Place the slash (/) before or after the TEST runtime option, depending on theprogramming language you are debugging.
The following topics can give you more information about other methods ofstarting z/OS Debugger:v Chapter 14, “Starting z/OS Debugger from the IBM z/OS Debugger Utilities,”
on page 127v Chapter 13, “Writing the TEST run-time option string,” on page 121v “Starting z/OS Debugger with CEETEST” on page 131v “Starting z/OS Debugger with PLITEST” on page 138v “Starting z/OS Debugger with the __ctest() function” on page 139v “Starting z/OS Debugger for programs that start in Language Environment” on
page 145v Chapter 16, “Starting z/OS Debugger in batch mode,” on page 141v “Starting z/OS Debugger for programs that start outside of Language
Environment” on page 147
12 IBM z/OS Debugger V14.1.9 User's Guide
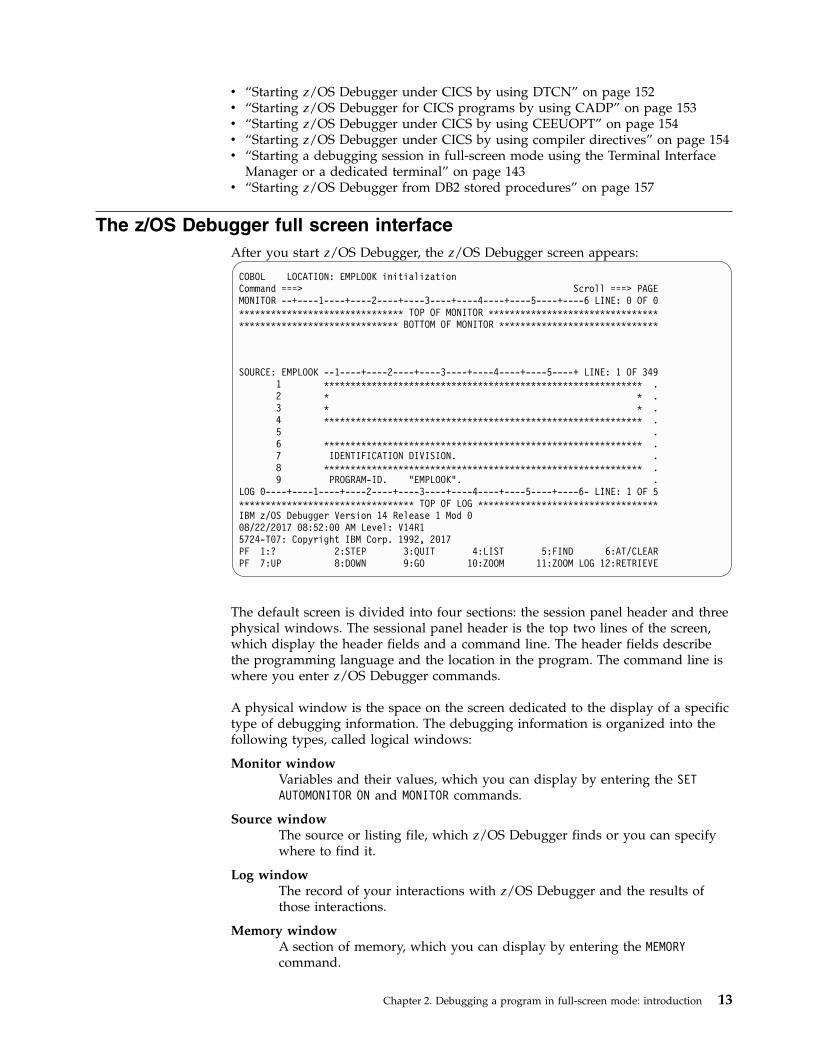
v “Starting z/OS Debugger under CICS by using DTCN” on page 152v “Starting z/OS Debugger for CICS programs by using CADP” on page 153v “Starting z/OS Debugger under CICS by using CEEUOPT” on page 154v “Starting z/OS Debugger under CICS by using compiler directives” on page 154v “Starting a debugging session in full-screen mode using the Terminal Interface
Manager or a dedicated terminal” on page 143v “Starting z/OS Debugger from DB2 stored procedures” on page 157
The z/OS Debugger full screen interfaceAfter you start z/OS Debugger, the z/OS Debugger screen appears:
COBOL LOCATION: EMPLOOK initializationCommand ===> Scroll ===> PAGEMONITOR --+----1----+----2----+----3----+----4----+----5----+----6 LINE: 0 OF 0******************************* TOP OF MONITOR ************************************************************** BOTTOM OF MONITOR ******************************
SOURCE: EMPLOOK --1----+----2----+----3----+----4----+----5----+ LINE: 1 OF 3491 ************************************************************ .2 * * .3 * * .4 ************************************************************ .5 .6 ************************************************************ .7 IDENTIFICATION DIVISION. .8 ************************************************************ .9 PROGRAM-ID. "EMPLOOK". .
LOG 0----+----1----+----2----+----3----+----4----+----5----+----6- LINE: 1 OF 5********************************* TOP OF LOG **********************************IBM z/OS Debugger Version 14 Release 1 Mod 008/22/2017 08:52:00 AM Level: V14R15724-T07: Copyright IBM Corp. 1992, 2017PF 1:? 2:STEP 3:QUIT 4:LIST 5:FIND 6:AT/CLEARPF 7:UP 8:DOWN 9:GO 10:ZOOM 11:ZOOM LOG 12:RETRIEVE
The default screen is divided into four sections: the session panel header and threephysical windows. The sessional panel header is the top two lines of the screen,which display the header fields and a command line. The header fields describethe programming language and the location in the program. The command line iswhere you enter z/OS Debugger commands.
A physical window is the space on the screen dedicated to the display of a specifictype of debugging information. The debugging information is organized into thefollowing types, called logical windows:
Monitor windowVariables and their values, which you can display by entering the SETAUTOMONITOR ON and MONITOR commands.
Source windowThe source or listing file, which z/OS Debugger finds or you can specifywhere to find it.
Log windowThe record of your interactions with z/OS Debugger and the results ofthose interactions.
Memory windowA section of memory, which you can display by entering the MEMORYcommand.
Chapter 2. Debugging a program in full-screen mode: introduction 13

The default screen displays three physical windows, with one assigned the Monitorwindow, the second assigned the Source window, and the third assigned the Logwindow. You can swap the Memory window with the Log window.
Refer to the following topics for more information related to the material discussedin this topic.
Related tasks“Entering commands on the session panel” on page 171“Navigating through z/OS Debugger windows” on page 179“Customizing the layout of physical windows on the session panel” on page278Related references“z/OS Debugger session panel” on page 161MEMORY command in IBM z/OS Debugger Reference and MessagesMONITOR command in IBM z/OS Debugger Reference and MessagesSET AUTOMONITOR command in IBM z/OS Debugger Reference and MessagesWINDOW SWAP command in IBM z/OS Debugger Reference and Messages
Stepping through a programStepping through a program means that you run a program one line at a time.After each line is run, you can observe changes in program flow and storage.These changes are displayed in the Monitor window, Source window, and Logwindow. Use the STEP command to step through a program.
Refer to the following topics for more information related to the material discussedin this topic.
Related tasks“Stepping through or running your program” on page 192
Running your program to a specific lineYou can run from one point in a program to another point by using one of thefollowing methods:v Set a breakpoint and use the GO command. This command runs your program
from the point where it stopped to the breakpoint that you set. Any breakpointsthat are encountered cause your program to stop. The RUN command issynonymous with the GO command.
v Use the GOTO command. This command resumes your program at the point thatyou specify in the command. The code in between is skipped.
v Use the JUMPTO command. This command moves the point at which yourprogram resumes running to the statement you specify in the command;however, the program does not resume. The code in between is skipped.
v Use the RUNTO command. This command runs your program to the point thatyou specify in the RUNTO command. The RUNTO command is helpful when youhaven't set a breakpoint at the point you specify in the RUNTO command.
Refer to the following topics for more information related to the material discussedin this topic.
Related referencesIBM z/OS Debugger Reference and Messages
14 IBM z/OS Debugger V14.1.9 User's Guide
Setting a breakpointIn z/OS Debugger, breakpoints can indicate a stopping point in your program anda stopping point in time. Breakpoints can also contain activities, such asinstructions to run, calculations to perform, and changes to make.
A basic breakpoint indicates a stopping point in your program. For example, tostop on line 100 of your program, enter the following command on the commandline:AT 100
In the Log window, the message AT 100 ; appears. If line 100 is not a valid placeto set a breakpoint, the Log window displays a message similar to Statement 100is not valid. The breakpoint is also indicated in the Source window by areversing of the colors in the prefix area.
Breakpoints do more than just indicate a place to stop. Breakpoints can alsocontain instructions. For example, the following breakpoint instructs z/OSDebugger to display the contents of the variable myvar when z/OS Debuggerreaches line 100:AT 100 LIST myvar;
A breakpoint can contain instructions that alter the flow of the program. Forexample, the following breakpoint instructs z/OS Debugger to go to label newPlacewhen it reaches line 100:AT 100 GOTO newPlace ;
A breakpoint can contain a condition, which means that z/OS Debugger stops atthe breakpoint only if the condition is met. For example, to stop at line 100 onlywhen the value of myvar is greater than 10, enter the following command:AT 100 WHEN myvar > 10;
A breakpoint can contain complex instructions. In the following example, whenz/OS Debugger reaches line 100, it alters the contents of the variable myvar if thevalue of the variable mybool is true:AT 100 if (mybool == TRUE) myvar = 10 ;
The syntax of the complex instruction depends on the program language that youare debugging. The previous example assumes that you are debugging a Cprogram. If you are debugging a COBOL program, the same example is written asfollows:AT 100 if mybool = TRUE THEN myvar = 10 ; END-IF ;
Refer to the following topics for more information related to the material discussedin this topic.
Related referencesIBM z/OS Debugger Reference and Messages
Displaying the value of a variableAfter you are familiar with setting breakpoints and running through yourprogram, you can begin displaying the value of a variable. The value of a variablecan be displayed in one of the following ways:v One-time display (in the Log window) is useful for quickly checking the value
of a variable.
Chapter 2. Debugging a program in full-screen mode: introduction 15

For one-time display, enter the following command on the command line, wherex is the name of the variable:LIST (x)
The Log window shows a message in the following format:LIST ( x ) ;x = 10
Alternatively, you can enter the L prefix command in the prefix area of theSource window. In the following line from the Source window, type in L2 in theprefix area, then press Enter to display the value of var2:200 var1 = var2 + var3;
z/OS Debugger creates the command LIST (var2), runs it, then displays thefollowing message in the Log window:LIST ( VAR2 ) ;VAR2 = 50
You can use the L prefix command only with programs assembled or compiledwith the following assemblers or compilers:– Enterprise PL/I for z/OS, Version 3.6 or 3.7 with the PTF for APAR PK70606,
or later– Enterprise COBOL (compiled with the TEST compiler option)– Assembler– Disassembly
v Continuous display (in the Monitor window) is useful for observing the value ofa variable over time.For continuous display, enter the following command on the command line,where x is the name of the variable:MONITOR LIST ( x )
In the Monitor window, a line appears with the name of the variable and thecurrent value of the variable next to it. If the value of the variable is undefined,the variable is not initialized, or the variable does not exist, a message appearsunderneath the variable name declaring the variable unusable.Alternatively, you can enter the M prefix command in the prefix area of theSource window. In the following line from the Source window, type in M3 in theprefix area, then press Enter to add var3 to the Monitor window:200 var1 = var2 + var3;
z/OS Debugger creates the command MONITOR LIST (var3), runs it, then addsvar3 to the Monitor window.You can use the M prefix command only with programs assembled or compiledwith the following assemblers or compilers:– Enterprise PL/I for z/OS, Version 3.6 or 3.7 with the PTF for APAR PK70606,
or later– Enterprise COBOL (compiled with the TEST compiler option)– Assembler– Disassembly
v A combination of one-time and continuous display, where the value of variablescoded in the current line are displayed, is useful for observing the value ofvariables when the variables are used.For a combination of one-time and continuous display, enter the followingcommand on the command line:SET AUTOMONITOR ON ;
16 IBM z/OS Debugger V14.1.9 User's Guide

After a line of code is run, the Monitor window displays the name and value ofeach variable on the line of code. The SET AUTOMONITOR command can be usedonly with specific programming languages, as described in IBM z/OS DebuggerReference and Messages.
Refer to the following topics for more information related to the material discussedin this topic.
Related tasks“Displaying values of C and C++ variables or expressions” on page 325“Displaying values of COBOL variables” on page 296“Displaying and monitoring the value of a variable” on page 200Related references“Monitor window” on page 165Description of the MONITOR COMMAND in IBM z/OS Debugger Reference andMessagesDescription of the SET AUTOMONITOR COMMAND in IBM z/OS DebuggerReference and Messages
Displaying memory through the Memory windowSometimes it is helpful to look at memory directly in a format similar to a dump.You can use the Memory window to view memory in this format.
The Memory window is not displayed in the default screen. To display theMemory window, use the WINDOW SWAP MEMORY LOG command. z/OS Debuggerdisplays the Memory window in the location of the Log window.
After you display the Memory window, you can navigate through it using theSCROLL DOWN and SCROLL UP commands. You can modify the contents of memory bytyping the new values in the hexadecimal data area.
Refer to the following topics for more information related to the material discussedin this topic.
Related tasksChapter 28, “Customizing your full-screen session,” on page 277“Displaying the Memory window” on page 185“Displaying and modifying memory through the Memory window” on page211“Scrolling through the physical windows” on page 180Related references“z/OS Debugger session panel” on page 161WINDOW SWAP command in IBM z/OS Debugger Reference and Messages
Changing the value of a variableAfter you see the value of a variable, you might want to change the value. If, forexample, the assigned value isn't what you expect, you can change it to the desiredvalue. You can then continue to study the flow of your program, postponing theanalysis of why the variable wasn't set correctly.
Changing the value of a variable depends on the programming language that youare debugging. In z/OS Debugger, the rules and methods for the assignment ofvalues to variables are the same as programming language rules and methods. Forexample, to assign a value to a C variable, use the C assignment rules andmethods:var = 1 ;
Chapter 2. Debugging a program in full-screen mode: introduction 17

Refer to the following topics for more information related to the material discussedin this topic.
Related tasks“Assigning values to C and C++ variables” on page 325“Assigning values to COBOL variables” on page 295
Skipping a breakpointUse the DISABLE command to temporarily disable a breakpoint. Use the ENABLEcommand to re-enable the breakpoint.
Refer to the following topics for more information related to the material discussedin this topic.
Related referencesDescription of the DISABLE command in IBM z/OS Debugger Reference andMessagesDescription of the ENABLE command in IBM z/OS Debugger Reference andMessages
Clearing a breakpointWhen you no longer require a breakpoint, you can clear it. Clearing it removes anyof the instructions associated with that breakpoint. For example, to clear abreakpoint on line 100 of your program, enter the following command on thecommand line:CLEAR AT 100
The Log window displays a line that says CLEAR AT 100 ; and the prefix areareverts to its original colors. These changes indicate that the breakpoint at line 100is gone.
Refer to the following topics for more information related to the material discussedin this topic.
Related referencesDescription of the CLEAR command in IBM z/OS Debugger Reference and Messages
Recording and replaying statementsYou can record and subsequently replay statements that you run. When you replaystatements, you can replay them in a forward direction or a backward direction.Table 5 describes the sequence in which statements are replayed when you replaythem in a forward direction or a backward direction.
Table 5. The sequence in which statements are replayed.
PLAYBACKFORWARD
sequence
PLAYBACKBACKWARDsequence COBOL Statements
1 9 DISPLAY "CALC Begins."
2 8 MOVE 1 TO BUFFER-PTR.
3 7 PERFORM ACCEPT-INPUT 2 TIMES.
8 2 DISPLAY "CALC Ends."
9 1 GOBACK.
ACCEPT-INPUT.
18 IBM z/OS Debugger V14.1.9 User's Guide

Table 5. The sequence in which statements are replayed. (continued)
PLAYBACKFORWARD
sequence
PLAYBACKBACKWARDsequence COBOL Statements
4, 6 4, 6 ACCEPT INPUT-RECORD FROM A-INPUT-FILE
5, 7 3, 5 MOVE RECORD-HEADER TO REPROR-HEADER.
To begin recording, enter the following command:PLAYBACK ENABLE
Statements that you run after you enter the PLAYBACK ENABLE command arerecorded.
To replay the statements that you record:1. Enter the PLAYBACK START command.2. To move backward one statement, enter the STEP command.3. Repeat step 2 as many times as you can to replay another statement.4. To move forward (from the current statement to the next statement), enter the
PLAYBACK FORWARD command.5. Enter the STEP command to replay another statement.6. Repeat step 5 as many times as you want to replay another statement.7. To move backward, enter the PLAYBACK BACKWARD command.
PLAYBACK BACKWARD and PLAYBACK FORWARD change the direction commands likeSTEP move in.
When you have finished replaying statements, enter the PLAYBACK STOP command.z/OS Debugger returns you to the point at which you entered the PLAYBACK STARTcommand. You can resume normal debugging. z/OS Debugger continues to recordyour statements. To replay a new set of statements, begin at step 1.
When you finish recording and replaying statements, enter the followingcommand:PLAYBACK DISABLE
z/OS Debugger no longer records any statements and discards information thatyou recorded. The PLAYBACK START, PLAYBACK FORWARD, PLAYBACK BACKWARD, andPLAYBACK STOP commands are no longer available.
Refer to the following topics for more information related to the material discussedin this topic.
Related referencesDescription of the PLAYBACK commands in IBM z/OS Debugger Reference andMessages
Stopping z/OS DebuggerTo stop your debug session, do the following steps:1. Enter the QUIT command.2. In response to the message to confirm your request to stop your debug session,
press "Y" and then press Enter.
Chapter 2. Debugging a program in full-screen mode: introduction 19
Your z/OS Debugger screen closes.
Refer to IBM z/OS Debugger Reference and Messages for more information about theQQUIT, QUIT ABEND and QUIT DEBUG commands which can stop your debug session.
Refer to the following topics for more information related to the material discussedin this topic.
Related referencesDescription of the QUIT command in IBM z/OS Debugger Reference and MessagesDescription of the QQUIT command in IBM z/OS Debugger Reference and Messages
20 IBM z/OS Debugger V14.1.9 User's Guide

Part 2. Preparing your program for debugging
© Copyright IBM Corp. 1992, 2019 21

22 IBM z/OS Debugger V14.1.9 User's Guide

Chapter 3. Preparing to remote debug in standard mode
About this task
Note: This chapter is not applicable to IBM Z Open Development or IBM Z OpenUnit Test .
To prepare to remote debug in standard mode, you must compile your programwith certain compiler options.
You can specify compiler options in the following ways:v Creating and managing property groups in the Property Group Manager (See
“Resource management with property groups.”)v Specifying the options in the COBOL and PL/I Compile Step Options window,
which generates JCL (See “COBOL and PL/I step options.”)v Editing the JCL directly.
Procedure
To add compiler options to the JCL directly, complete the following steps:1. Open the JCL file in the Remote Systems view of the z/OS Projects perspective.2. Specify the following options:
Table 6. Compiler options for debugging
Compiler Required options Recommended options
z/OS C andC++
DEBUG orDEBUG(FORMAT(DWARF))
DEBUG(NOHOOK) for better generated code
EnterpriseCOBOL forz/OS V3.4 andV4
SOURCE,LIST,XREF,MAP,NONUM NOTEST for better performance
EnterpriseCOBOL forz/OS V5 andV6.1
TEST
EnterpriseCOBOL forz/OS V6.2
TEST or TEST(SEPARATE)1
Enterprise PL/Ifor z/OS V4and V5 (31-bit)
TEST(NOHOOK) TEST(NOHOOK,SEPARATE) for betterperformance
Enterprise PL/Ifor z/OS V5(64-bit)
TEST
High LevelAssembler V1.6
ADATA
© Copyright IBM Corp. 1992, 2019 23

Related information:“Remote debugging in standard mode” on page 451
1. With TEST the debug data is placed in a NOLOAD segment in the program object. With TEST(SEPARATE) the debug data is placedin a separate debug file.
24 IBM z/OS Debugger V14.1.9 User's Guide

Chapter 4. Planning your debug session
Before you begin debugging, create a plan that can help you make the followingchoices:v The compiler or assembler options and suboptions you need to use when you
compile or assemble programs.v The debugging mode (batch, full-screen, full-screen mode using the Terminal
Interface Manager, or remote debug mode) that you will use to interact withz/OS Debugger.
v The method or methods you can use to start z/OS Debugger.v If you have older COBOL programs, as listed in the COBOL and CICS Command
Level Conversion Aid for OS/390 & MVS & VM: User's Guide, how you want todebug them.
To help you create your plan, do the following tasks:1. Use Table 7 on page 26 to record the compiler options and suboptions that you
will use for your programs. The table contains compiler options that canprovide the most debugging capability with the smallest program size for ageneral set of compilers. See “Choosing compiler options for debugging” onpage 26 for the following information:v The prerequisites required for a compiler option and suboption.v Additional tasks that you might need to do to make a compiler option and
suboption work at your site.v Information about how a compiler option and suboption might affect
program size and z/OS Debugger functionality.v If you are using other IBM Application Delivery Foundation for z Systems
tools, information on how to choose compiler options so that you createoutput that can be used by the other IBM Application Delivery Foundationfor z Systems tools.
2. Use Table 4 on page 4 to record the debugging mode you will use. See“Choosing a debugging mode” on page 52 to learn about prerequisites andtasks you must do to make the debugging mode work.
3. Use Table 13 on page 57 to record the methods you will use to specify TESTruntime options. See “Choosing a method or methods for starting z/OSDebugger” on page 57 to help you determine which method will work best foryour programs.
4. If you have older COBOL programs (as listed in the COBOL and CICS CommandLevel Conversion Aid for OS/390 & MVS & VM: User's Guide) that you want todebug, you must decide between the following options:v Leave them in their old source and possibly have to debug them as LangX
COBOL programs.v Convert them to the 1985 COBOL Standard level.
See “Choosing how to debug old COBOL programs” on page 60 for moreinformation.
After you have completed these tasks, use the information you collected to followthe instructions in Chapter 5, “Updating your processes so you can debugprograms with z/OS Debugger,” on page 63.
© Copyright IBM Corp. 1992, 2019 25
Choosing compiler options for debuggingCompiler options affects the size of your load module and the amount of z/OSDebugger functionality available to you. z/OS Debugger uses information such ashooks and symbol tables to gain control of a program, run the programstatement-by-statement or line-by-line, and display information about yourprogram.
To learn more about how hooks and symbol tables help z/OS Debugger debugyour program, read the following topics:v “Understanding how hooks work and why you need them” on page 50v “Understanding what symbol tables do and why saving them elsewhere can
make your application smaller” on page 51
To learn more about how the compiler options affect z/OS Debugger functionality,read the following topics:v “Choosing TEST or NOTEST compiler suboptions for COBOL programs” on
page 27v “Choosing TEST or NOTEST compiler suboptions for PL/I programs” on page
35v “Choosing TEST or DEBUG compiler suboptions for C programs” on page 41v “Choosing DEBUG compiler suboptions for C programs” on page 41v “Choosing TEST or NOTEST compiler suboptions for C programs” on page 43v “Choosing DEBUG compiler suboptions for C++ programs” on page 47v “Choosing TEST or DEBUG compiler suboptions for C++ programs” on page 46v “Choosing TEST or NOTEST compiler options for C++ programs” on page 48
Table 7. Record the compiler options you need to use in this table.Compiler or assembler Compiler options you will use
OS/VS COBOL, Version 1 Release 2.4 1 NOTEST,SOURCE,DMAP,PMAP,VERB,XREF,NOLST,NOBATCH,NOSYMDMP,NOCOUNTor
______________________________________________________________
VS COBOL II Version 1 Release 3 and Version 1 Release 4 (forprograms compiled with the TEST compiler option and linked with theLanguage Environment library.)
TEST or
______________________________________________________________
VS COBOL II Version 1 Release 3 and Version 1 Release 4 (forprograms compiled with the NOTEST compiler option and linked witha non-Language Environment library.) 1
NOTEST,NOOPTIMIZE,SOURCE,MAP,XREF,LIST(or OFFSET) or
______________________________________________________________
VS COBOL II Version 1 Release 3 and Version 1 Release 4 (forprograms compiled with the NOTEST compiler option and linked withthe Language Environment library.) 1
NOTEST,NOOPTIMIZE,SOURCE,MAP,XREF,LIST(or OFFSET) or
______________________________________________________________
AD/Cycle COBOL/370 Version 1 Release 1 TEST(ALL,SYM) or
______________________________________________________________
COBOL for MVS & VM TEST(ALL,SYM) or
______________________________________________________________
COBOL for OS/390 & VM TEST(NONE,SYM,SEPARATE) or
______________________________________________________________
Enterprise COBOL for z/OS and OS/390, Version 3 TEST(NONE,SYM,SEPARATE) or
__________________________
Enterprise COBOL for z/OS Version 3 or Version 4 compiled with theNOTEST compiler option 1
NOTEST,NOOPTIMIZE,SOURCE,MAP,XREF,LIST(or OFFSET) or
______________________________________________________________
26 IBM z/OS Debugger V14.1.9 User's Guide

Table 7. Record the compiler options you need to use in this table. (continued)Compiler or assembler Compiler options you will use
Enterprise COBOL for z/OS Version 4 compiled with the TESTcompiler option
TEST(NOHOOK,SEPARATE,EJPD) or
______________________________________________________________
Enterprise COBOL for z/OS Version 5 and Version 62 compiled withthe TEST compiler option
TEST(EJPD,SOURCE) or______________________________________________________________
OS PL/I Version 2 Release 1, Version 2 Release 2, and Version 2Release 3
TEST(ALL,SYM) or
______________________________________________________________
PL/I for MVS & VM TEST(ALL,SYM) or
______________________________________________________________
Enterprise PL/I, Version 3.1 through Version 3.3 TEST(ALL,SYM) or
______________________________________________________________
Enterprise PL/I, Version 3.4 TEST(ALL,NOHOOK,SYM) or
______________________________________________________________
Enterprise PL/I, Version 3.5 or later TEST(ALL,NOHOOK,SYM,SEPARATE) or
______________________________________________________________
Enterprise PL/I, Version 3.7 TEST(ALL,NOHOOK,SYM,SEPARATE,SOURCE) or
______________________________________________________________
Enterprise PL/I, Version 3.8 or later TEST(ALL,NOHOOK,SYM,SEPARATE) and LISTVIEW or
______________________________________________________________
Enterprise PL/I, Version 4 or Version 53 (31-bit) TEST(ALL,NOHOOK,SYM,SEPARATE) and LISTVIEW andGONUMBER(SEPARATE) or
______________________________________________________________
v AD/Cycle C/370 Version 1 Release 1
v C/C++ for MVS/ESA Version 3 Release 1 or later
v C++ feature of OS/390 Version 2 Release 6 or later
v C++ feature of z/OS, Version 1.5 or earlier
TEST or
______________________________________________________________
v C feature of OS/390 Version 2 Release 6 or later
v C feature of z/OS, Version 1.5 or earlier
TEST(HOOK) or
______________________________________________________________
C/C++ feature of z/OS, Version 1.6 or later (31-bit) DEBUG(FORMAT(DWARF)) or
______________________________________________________________
IBM High Level Assembler (HLASM), Version 1 Release 4, Version 1Release 5, Version 1 Release 6
ADATA
1. See Chapter 6, “Preparing a LangX COBOL program,” on page 73 for information on how to prepare a program of this type.
2. Support for Enterprise COBOL for z/OS Version 6 is a superset of that for Version 5 in z/OS Debugger.
3. Support for Enterprise PL/I for z/OS Version 5 (31-bit) is the same as that for Version 4 in z/OS Debugger.
Choosing TEST or NOTEST compiler suboptions for COBOLprograms
This topic describes the combination of TEST compiler option and suboptions youneed to specify to obtain the wanted debugging scenario. This topic assumes youare compiling your COBOL program with Enterprise COBOL for z/OS, Version 3.4,or later; however, the topics provide information about alternatives to use for olderversions of the COBOL compiler.
The COBOL compiler provides the TEST compiler option and its suboptions tocontrol the following actions:v The generation and placement of hooks and symbol tables.v The placement of debug information into the object file or a separate debug file.
Chapter 4. Planning your debug session 27
The following instructions help you choose the combination of TEST compilersuboptions that provide the functionality you need to debug your program:1. Choose a debugging scenario, keeping in mind your site's resources, from the
following list:v Scenario A: If you are compiling with Enterprise COBOL for z/OS, Version 4,
you can get the most z/OS Debugger functionality and a small program sizeby using TEST(NOHOOK,SEPARATE). If you need to debug programs that areloaded into protected storage, verify that your site installed the AuthorizedDebug Facility.If you want to compile your program with the OPT(STD) or OPT(FULL)compiler option, you must also specify the EJPD suboption of the TESTcompiler option to be able to do the following tasks:– Use the GOTO or JUMPTO commands.– Modify variables with predictable results.
When you use the EJPD suboption, you might lose some optimization.If you are using other other IBM Application Delivery Foundation for zSystems tools, review the information in IBM Application Delivery Foundationfor z Systems Common Components Customization Guide and User Guide to makesure you specify all the compiler options you need to create the files neededby all the IBM Application Delivery Foundation for z Systems tools.
v Scenario B: If you are compiling with any of the following compilers, youcan get the most z/OS Debugger functionality and a small program size byusing TEST(NONE,SYM,SEPARATE):– Enterprise COBOL for z/OS and OS/390, Version 3 Release 2 or later– Enterprise COBOL for z/OS and OS/390, Version 3 Release 1 with APAR
PQ63235– COBOL for OS/390 & VM, Version 2 Release 2– COBOL for OS/390 & VM, Version 2 Release 1 with APAR PQ63234.
If you need to debug programs that are loaded into protected storage, verifythat your site installed the Authorized Debug Facility.If you want to compile your program with optimization and be able to getthe most z/OS Debugger functionality, you must compile it with one of thefollowing combination of compiler options:– OPT(STD) TEST(NONE,SYM)
– OPT(STD) TEST(NONE,SYM,SEPARATE)
– OPT(FULL) TEST(NONE,SYM)
– OPT(FULL) TEST(NONE,SYM,SEPARATE)
For these types of programs, you can modify variables, but the results mightbe unpredictable.If you are using other IBM Application Delivery Foundation for z Systemstools, review the information in IBM Application Delivery Foundation for zSystems Common Components Customization Guide and User Guide to make sureyou specify all the compiler options you need to create the files needed byall the IBM Application Delivery Foundation for z Systems tools.
v Scenario C: To get all z/OS Debugger functionality but have a largerprogram size and do not want debug information in a separate debug file,compile with one of the following compiler options for the compilersspecified:– TEST(HOOK,NOSEPARATE) with Enterprise COBOL for z/OS, Version 4.
28 IBM z/OS Debugger V14.1.9 User's Guide

– TEST(ALL,SYM,NOSEPARATE) with any of the following compilers:- Enterprise COBOL for z/OS and OS/390, Version 3 Release 2 or later- Enterprise COBOL for z/OS and OS/390, Version 3 Release 1 with
APAR PQ63235- COBOL for OS/390 & VM, Version 2 Release 2- COBOL for OS/390 & VM, Version 2 Release 1 with APAR PQ40298
If you are using other IBM Application Delivery Foundation for z Systemstools, review the information in IBM Application Delivery Foundation for zSystems Common Components Customization Guide and User Guide to make surethat you specify all the compiler options that you need to create the filesneeded by all the IBM Application Delivery Foundation for z Systems tools.
v Scenario D: If you are using COBOL for OS/390 & VM, Version 2 Release 1,or earlier, and you want to get all z/OS Debugger functionality, useTEST(ALL,SYM).If you are using other IBM Application Delivery Foundation for z Systemstools, review the topic in IBM Application Delivery Foundation for z SystemsCommon Components Customization Guide and User Guide that corresponds tothe compiler that you are using from the following list to make sure that youspecify all the compiler options that you need to create the files needed byall the IBM Application Delivery Foundation for z Systems tools:– Enterprise COBOL for z/OS Version 3 and COBOL for OS/390 and VM
programs– COBOL for MVS(tm) and VM programs– VS COBOL II programs– OS/VS COBOL programs
v Scenario E: You can get most of z/OS Debugger's functionality by compilingwith the NOTEST compiler option and generating an EQALANGX file. Thisrequires that you debug your program in LangX COBOL mode.
v Scenario F: You can get some z/OS Debugger's functionality by compilingwith the NOTEST compiler option. This requires that you debug your programin disassembly mode.If you are using other IBM Application Delivery Foundation for z Systemstools, review the topic in IBM Application Delivery Foundation for z SystemsCommon Components Customization Guide and User Guide that corresponds tothe compiler that you are using from the following list to make sure youspecify all the compiler options that you need to create the files needed byall the IBM Application Delivery Foundation for z Systems tools:– Enterprise COBOL for z/OS Version 4 programs– Enterprise COBOL for z/OS Version 3 and COBOL for OS/390 and VM
programs– COBOL for MVS(tm) and VM programs– VS COBOL II programs– OS/VS COBOL programs
v Scenario G: If you are compiling with Enterprise COBOL for z/OS Version 5or Version 6 Release 1, you can get the most z/OS Debugger functionality byusing TEST(SOURCE). If you need to debug programs that are loaded intoprotected storage, you must verify that your site installed the AuthorizedDebug Facility. With the TEST(SOURCE) compiler option, the debug data issaved in the program object in a NOLOAD debug segment. The debug datadoes not increase the size of the loaded program. The debug data alwaysmatches the executable and is always available, so there is no need to search
Chapter 4. Planning your debug session 29

the lists of data sets. The size of the program object increases but not thefootprint in memory, unless it is required to load the debug data while youare debugging a program.
v Scenario H: If you are compiling with Enterprise COBOL for z/OS Version 6Release 2, you can get the most z/OS Debugger functionality by usingTEST(SOURCE) or TEST(SEPARATE,SOURCE). If you need to debug programs thatare loaded into protected storage, you must verify that your site installed theAuthorized Debug Facility.– With the TEST(SOURCE) compiler option, the debug data is saved in the
program object in a NOLOAD debug segment. The debug data does notincrease the size of the loaded program. The debug data always matchesthe executable and is always available, so there is no need to search thelists of data sets. The size of the program object increases but not thefootprint in memory, unless it is required to load the debug data whenyou are debugging a program.
– With the TEST(SEPARATE,SOURCE) compiler option, the debug data is savedin a separate debug file. The compiler uses the SYSDEBUG DD statementto name the separate debug file. Enterprise COBOL for z/OS, Version 6Release 2 does not store the name of the separate debug file in theprogram object. You must specify the side file location through a SETSOURCE command, EQAUEDAT user exit, SET DEFAULT LISTINGS command,EQADEBUG DD name, or EQA_DBG_SYSDEBUG environment variable. Witha SET SOURCE command, you can specify the exact location of the side file.If you use a SET DEFAULT LISTINGS command, EQADEBUG DD name orEQA_DBG_SYSDEBUG environment variable, and if the side file is notfound because the side file name does not match the CU name, z/OSDebugger will do an exhaustive search of the data sets specified by thesame method to locate the matching side file. The exhaustive search mightbe slow.
– With the TEST(SEPARATE,SOURCE) compiler option, when you specify theside file location, you can specify a PDS data set or z/OS UNIX SystemServices directory through a SET DEFAULT LISTING command, EQAUEDATuser exit, EQADEBUG DD card, or EQA_DBG_SYSDEBUG environmentvariable.
2. For COBOL programs using IMS, include the IMS interface module DFSLI000from the IMS RESLIB library.
3. For scenarios A, B and E, do the following steps:a. If you use the Dynamic Debug facility to place hooks into programs that
reside in read-only storage, verify with your system administrator that theAuthorized Debug facility has been installed and that you are authorized touse it.
b. After you start z/OS Debugger, verify that you have not deactivated theDynamic Debug facility by entering the QUERY DYNDEBUG command.
c. Verify that the separate debug file is a non-temporary file and is availableduring the debug session. The listing does not need to be saved.
4. Verify whether you need to do any of the following tasks:v If you specify NUMBER with TEST, make sure the sequence fields in your source
code all contain numeric characters.v You need to specify the SYM suboption of the TEST compiler option to do the
following actions:– To specify labels (paragraph or section names) as targets of the GOTO
command.
30 IBM z/OS Debugger V14.1.9 User's Guide

– To reference program variables by name.– To access a variable or expression through commands like LIST or
DESCRIBE.– To use the DATA suboption of the PLAYBACK ENABLE command.
You need to specify the SYM suboption to do these actions only if you arecompiling with any of the following compilers:– Any release of Enterprise COBOL for z/OS and OS/390, Version 3– Any release of COBOL for OS/390 & VM, Version 2
v The TEST compiler option and the DEBUG runtime option are mutuallyexclusive, with DEBUG taking precedence. If you specify both the WITHDEBUGGING MODE clause in your SOURCE-COMPUTER paragraph and the USE FORDEBUGGING statement in your code, TEST is deactivated. The TEST compileroption appears in the list of options, but a diagnostic message is issuedtelling you that because of the conflict, TEST is not in effect.
v For VS COBOL II programs, if you use the TEST compiler option, you mustspecify:– the SOURCE compiler option. This option is required to generate a listing
file and save it at location userid.pgmname.list.– the RESIDENT compiler option. This option is required by Language
Environment to ensure that the necessary z/OS Debugger routines areloaded dynamically at run time.
In addition, you must link your program with the Language EnvironmentSCEELKED library and not the VS COBOL II COB2LIB library.
After you have chosen the compiler options and suboptions, see Chapter 4,“Planning your debug session,” on page 25 to determine the next task you mustcomplete.
Refer to the following topics for more information related to the material discussedin this topic.
Related referencesDescription of the TEST compiler option in Enterprise COBOL for z/OSProgramming Guide
The following table explains the effects of the NOTEST compiler option, the TESTcompiler option, and some of the suboptions of the TEST compiler option on z/OSDebugger behavior or the availability of features, which are not described inEnterprise COBOL for z/OS Programming Guide:
Chapter 4. Planning your debug session 31
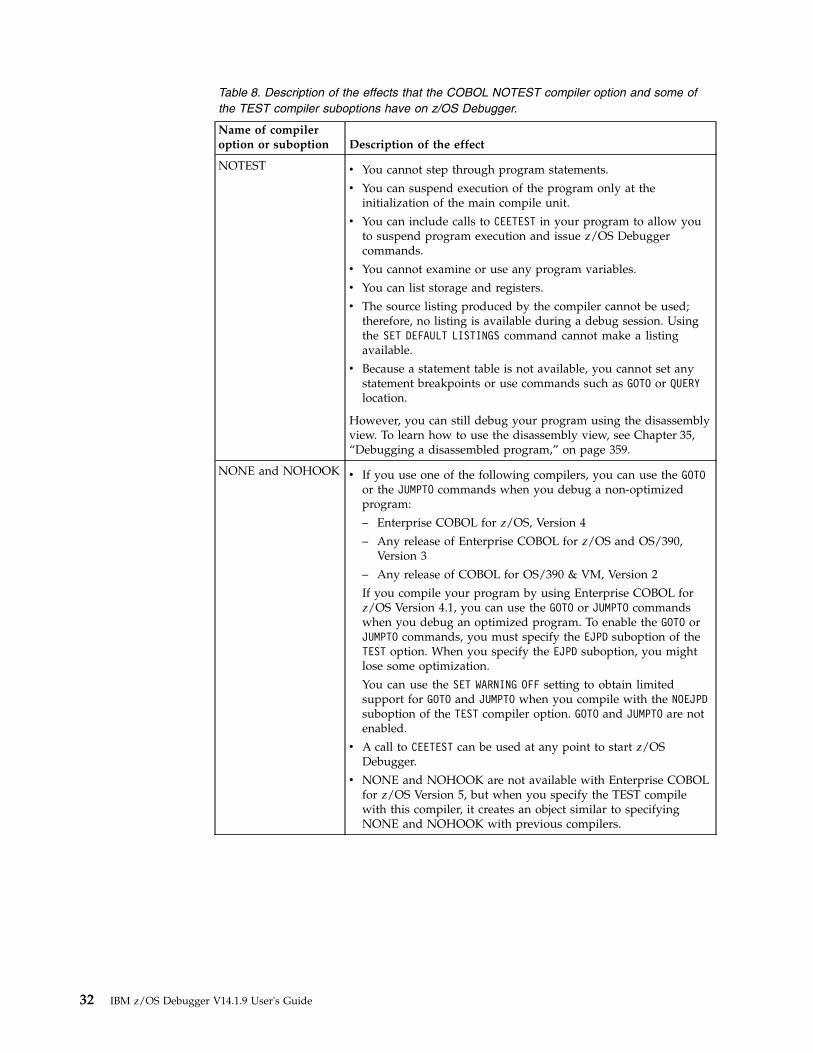
Table 8. Description of the effects that the COBOL NOTEST compiler option and some ofthe TEST compiler suboptions have on z/OS Debugger.
Name of compileroption or suboption Description of the effect
NOTEST v You cannot step through program statements.
v You can suspend execution of the program only at theinitialization of the main compile unit.
v You can include calls to CEETEST in your program to allow youto suspend program execution and issue z/OS Debuggercommands.
v You cannot examine or use any program variables.
v You can list storage and registers.
v The source listing produced by the compiler cannot be used;therefore, no listing is available during a debug session. Usingthe SET DEFAULT LISTINGS command cannot make a listingavailable.
v Because a statement table is not available, you cannot set anystatement breakpoints or use commands such as GOTO or QUERYlocation.
However, you can still debug your program using the disassemblyview. To learn how to use the disassembly view, see Chapter 35,“Debugging a disassembled program,” on page 359.
NONE and NOHOOK v If you use one of the following compilers, you can use the GOTOor the JUMPTO commands when you debug a non-optimizedprogram:
– Enterprise COBOL for z/OS, Version 4
– Any release of Enterprise COBOL for z/OS and OS/390,Version 3
– Any release of COBOL for OS/390 & VM, Version 2
If you compile your program by using Enterprise COBOL forz/OS Version 4.1, you can use the GOTO or JUMPTO commandswhen you debug an optimized program. To enable the GOTO orJUMPTO commands, you must specify the EJPD suboption of theTEST option. When you specify the EJPD suboption, you mightlose some optimization.
You can use the SET WARNING OFF setting to obtain limitedsupport for GOTO and JUMPTO when you compile with the NOEJPDsuboption of the TEST compiler option. GOTO and JUMPTO are notenabled.
v A call to CEETEST can be used at any point to start z/OSDebugger.
v NONE and NOHOOK are not available with Enterprise COBOLfor z/OS Version 5, but when you specify the TEST compilewith this compiler, it creates an object similar to specifyingNONE and NOHOOK with previous compilers.
32 IBM z/OS Debugger V14.1.9 User's Guide

Table 8. Description of the effects that the COBOL NOTEST compiler option and some ofthe TEST compiler suboptions have on z/OS Debugger. (continued)
Name of compileroption or suboption Description of the effect
EJPDYou can modify variables in an optimized program that wascompiled with one the following compilers:
v Enterprise COBOL for z/OS, Version 5
v Enterprise COBOL for z/OS, Version 4
v Enterprise COBOL for z/OS and OS/390, Version 3 Release 2 orlater
v Enterprise COBOL for z/OS and OS/390, Version 3 Release 1with APAR PQ63235 installed
v COBOL for OS/390 & VM, Version 2 Release 2
v COBOL for OS/390 & VM, Version 2 Release 1 with APARPQ63234 installed
However, results might be unpredictable. To obtain morepredictable results, compile your program with Enterprise COBOLfor z/OS, Version 4 and 5, and specify the EJPD suboption of theTEST compiler option. However, variables that are declared withthe VALUE clause to initialize them cannot be modified.
LOUDThe LOUD parameter is suggested, but optional. If youspecify it, additional informational and statistical messages aredisplayed.
NOSYM v You cannot reference program variables by name.
v You cannot use commands such as LIST or DESCRIBE to access avariable or expression.
v You cannot use commands such as CALL variable to branch toanother program, or GOTO to branch to another label (paragraphor section name).
If you are compiling with Enterprise COBOL for z/OS, Version 4,the compiler ignores SYM or NOSYM and always creates a symboltable.
This option is not available with Enterprise COBOL for z/OSVersion 5.
Chapter 4. Planning your debug session 33

Table 8. Description of the effects that the COBOL NOTEST compiler option and some ofthe TEST compiler suboptions have on z/OS Debugger. (continued)
Name of compileroption or suboption Description of the effect
STMT v The COBOL compiler generates compiled-in hooks for dateprocessing statements only when the DATEPROC compiler optionis specified. A date processing statement is any statement thatreferences a date field, or any EVALUATE or SEARCH statement WHENphrase that references a date field.
v You can set breakpoints at all statements and step through yourprogram.
v z/OS Debugger cannot gain control at path points unless theyare also at statement boundaries.
v Branching to all statements and labels using the z/OS Debuggercommand GOTO is allowed.
If you are compiling with Enterprise COBOL for z/OS, Version 4,the compiler treats the STMT suboption as if it were the HOOKsuboption, which is equivalent to the ALL suboption for any releaseof Enterprise COBOL for z/OS and OS/390, Version 3, or COBOLfor OS/390 & VM, Version 2.
This option is not available with Enterprise COBOL for z/OSVersion 5.
PATH v z/OS Debugger can gain control only at path points and blockentry and exit points. If you attempt to step through yourprogram, z/OS Debugger gains control only at statements thatcoincide with path points, giving the appearance that not allstatements are executed.
v A call to CEETEST can be used at any point to start z/OSDebugger.
v The z/OS Debugger command GOTO is valid for all statementsand labels coinciding with path points.
If you are compiling with Enterprise COBOL for z/OS, Version 4,the compiler treats the PATH suboption as if it were the HOOKsuboption, which is equivalent to the ALL suboption for any releaseof Enterprise COBOL for z/OS and OS/390, Version 3, or COBOLfor OS/390 & VM, Version 2.
This option is not available with Enterprise COBOL for z/OSVersion 5.
34 IBM z/OS Debugger V14.1.9 User's Guide

Table 8. Description of the effects that the COBOL NOTEST compiler option and some ofthe TEST compiler suboptions have on z/OS Debugger. (continued)
Name of compileroption or suboption Description of the effect
BLOCK v z/OS Debugger gains control at entry and exit of your program,methods, and nested programs.
v z/OS Debugger can be explicitly started at any point with a callto CEETEST.
v Issuing a command such as STEP causes your program to rununtil it reaches the next entry or exit point.
v GOTO can be used to branch to statements that coincide withblock entry and exit points.
If you are compiling with Enterprise COBOL for z/OS, Version 4,the compiler treats the BLOCK suboption as if it were the HOOKsuboption, which is equivalent to the ALL suboption for any releaseof Enterprise COBOL for z/OS and OS/390, Version 3, or COBOLfor OS/390 & VM, Version 2.
This option is not available with Enterprise COBOL for z/OSVersion 5.
ALL v You can set breakpoints at all statements and path points, andstep through your program.
v z/OS Debugger can gain control of the program at allstatements, path points, date processing statements, labels, andblock entry and exit points, allowing you to enter z/OSDebugger commands.
v Branching to statements and labels using the z/OS Debuggercommand GOTO is allowed.
If you are compiling with Enterprise COBOL for z/OS, Version 4,the compiler treats the ALL suboption as if it were the HOOKsuboption, which is equivalent to the ALL suboption for any releaseof Enterprise COBOL for z/OS and OS/390, Version 3, or COBOLfor OS/390 & VM, Version 2.
This option is not available with Enterprise COBOL for z/OSVersion 5, but when you specify the TEST compile with thiscompiler, it creates an object similar to specifying ALL with theexception that compiled-in hooks are not available.
Choosing TEST or NOTEST compiler suboptions for PL/Iprograms
This topic describes the combination of TEST compiler option and suboptions youneed to specify to obtain the desired debugging scenario. This topic assumes youare compiling your PL/I program with Enterprise PL/I for z/OS, Version 3.5, orlater; however, the topics provide information about alternatives to use for olderversions of the PL/I compiler.
The PL/I compiler provides the TEST compiler option and its suboptions to controlthe following actions:v The generation and placement of hooks and symbol tables.v The placement of debug information into the object file or separate debug file.
Chapter 4. Planning your debug session 35

z/OS Debugger does not support debugging optimized PL/I programs. Do not usecompiler options other than NOOPTIMIZE,
The following instructions help you choose the combination of TEST compilersuboptions that provide the functionality you need to debug your program:1. Choose a debugging scenario, keeping in mind your site's resources, from the
following list:v Scenario A: If you are using Enterprise PL/I for z/OS, Version 3.8 or later,
and you want to get the most z/OS Debugger functionality and a smallprogram size, use TEST(ALL,NOHOOK,SYM,SEPARATE) and the LISTVIEW(SOURCE)compiler option. If you need to debug programs that are loaded intoprotected storage, verify that your site installed the Authorized DebugFacility.Consider the following options:– If you are using Enterprise PL/I for z/OS, Version 4 or later, you can
specify the GONUMBER(SEPARATE) compiler option, which can help make theprogram size smaller. You must install the PTF for APAR PM19445 onLanguage Environment, Version 1.10 to Version 1.12.
– You can specify any of the LISTVIEW sub-options (SOURCE, AFTERALL,AFTERCICS, AFTERMACRO, or AFTERSQL), as described in Enterprise PL/I forz/OS Programming Guide, to display either the original source or the sourceafter the specified preprocessor.
– If you are debugging in full-screen mode and you want to debugprograms with INCLUDE files that have executable code, specify theLISTVIEW(AFTERMACRO) compiler option and, if you do not specify theMACRO compiler option, specify the PP(MACRO(INCONLY)) compiler option.
– If you are debugging in remote debug mode and you want to automonitorvariables in INCLUDE files, specify the LISTVIEW(AFTERMACRO) compileroption and, if you do not specify the MACRO compiler option, specify thePP(MACRO(INCONLY)) compiler option.
If you are using other IBM Application Delivery Foundation for z Systemstools, see topic Enterprise PL/I Version 3.5 and Version 3.6 programs in IBMApplication Delivery Foundation for z Systems Common Components CustomizationGuide and User Guide to make sure you specify all the compiler options youneed to create the files needed by all the IBM Application DeliveryFoundation for z Systems tools.
v Scenario B: If you are using Enterprise PL/I for z/OS, Version 3.7, and youwant to get the most z/OS Debugger functionality and a small program size,use TEST(ALL,NOHOOK,SYM,SEPARATE,SOURCE). If you need to debug programsthat are loaded into protected storage, verify that your site installed theAuthorized Debug Facility.Consider the following options:– You can substitute SOURCE with AFTERALL, AFTERCICS, AFTERMACRO, or
AFTERSQL, as described in Enterprise PL/I for z/OS Programming Guide.– If you are debugging in full-screen mode and you want to debug
programs with INCLUDE files that have executable code, specify theTEST(ALL,NOHOOK,SYM,SEPARATE,AFTERMACRO) compiler options and, if youdo not specify the MACRO compiler option, specify the PP(MACRO(INCONLY))compiler option.
– If you are debugging in remote debug mode and you want to automonitorvariables in INCLUDE files, specify the
36 IBM z/OS Debugger V14.1.9 User's Guide

TEST(ALL,NOHOOK,SYM,SEPARATE,AFTERMACRO) compiler options and, if youdo not specify the MACRO compiler option, specify the PP(MACRO(INCONLY))compiler option.
If you are using other IBM Application Delivery Foundation for z Systemstools, see topic Enterprise PL/I Version 3.5 and Version 3.6 programs in IBMApplication Delivery Foundation for z Systems Common Components CustomizationGuide and User Guide to make sure you specify all the compiler options youneed to create the files needed by all the IBM Application DeliveryFoundation for z Systems tools.
v Scenario C: If you are using Enterprise PL/I for z/OS, Version 3.5 or 3.6, andyou want to get most z/OS Debugger functionality and a small programsize, use TEST(ALL,NOHOOK,SYM,SEPARATE). If you need to debug programsthat are loaded into protected storage, verify that your site installed theAuthorized Debug Facility.If you are using other IBM Application Delivery Foundation for z Systemstools, see topic Enterprise PL/I Version 3.5 and Version 3.6 programs in IBMApplication Delivery Foundation for z Systems Common Components CustomizationGuide and User Guide to make sure you specify all the compiler options youneed to create the files needed by all the IBM Application DeliveryFoundation for z Systems tools.
v Scenario D: If you are using Enterprise PL/I for z/OS, Version 3.4, and youwant to debug your program without compiled-in hooks, useTEST(ALL,NOHOOK,SYM). If you need to debug programs that are loaded intoprotected storage, verify that your site installed the Authorized DebugFacility.If you are using other IBM Application Delivery Foundation for z Systemstools, see topic Enterprise PL/I Version 3.4 and earlier programs in IBMApplication Delivery Foundation for z Systems Common Components CustomizationGuide and User Guide to make sure you specify all the compiler options youneed to create the files needed by all the IBM Application DeliveryFoundation for z Systems tools.
v Scenario E: If you are using Enterprise PL/I for z/OS, Version 3.3 or earlier,and you want to get all z/OS Debugger functionality, use TEST(ALL,SYM).If you are using other IBM Application Delivery Foundation for z Systemstools, see topic Enterprise PL/I Version 3.4 and earlier programs or PL/I forMVS(tm) and VM and OS PL/I programs in IBM Application Delivery Foundationfor z Systems Common Components Customization Guide and User Guide to makesure you specify all the compiler options you need to create the files neededby all the IBM Application Delivery Foundation for z Systems tools.
v Scenario F: You can get some z/OS Debugger functionality by compilingwith the NOTEST compiler option. This requires that you debug your programin disassembly mode.If you are using other IBM Application Delivery Foundation for z Systemstools, review the topic in IBM Application Delivery Foundation for z SystemsCommon Components Customization Guide and User Guide that corresponds tothe compiler that you are using from the following list to make sure youspecify all the compiler options you need to create the files needed by all theIBM Application Delivery Foundation for z Systems tools:– Enterprise PL/I Version 3.5 and Version 3.6 programs– Enterprise PL/I Version 3.4 and earlier programs– PL/I for MVS(tm) and VM and OS PL/I programs
2. For scenarios A, B, C, E, and F, do the following steps:
Chapter 4. Planning your debug session 37

a. If you use the Dynamic Debug facility to place hooks into programs thatreside in read-only storage, verify with your system administrator that theAuthorized Debug facility has been installed and that you are authorized touse it.
b. After you start z/OS Debugger, verify that you have not deactivated theDynamic Debug facility by entering the QUERY DYNDEBUG command.
c. Verify that the separate debug file is a non-temporary file and is availableduring the debug session.
3. Verify whether you need to do any of the following tasks:v
When you compile a program, do not associate SYSIN with an in-streamdata set (for example //SYSIN DD *) because z/OS Debugger requiresaccess to a permanent data set for the source of the program you aredebugging.
v If you are compiling a PL/I for MVS & VM or OS PL/I program and to beable to view your listing while debugging in full-screen mode, you mustcompile the program with the SOURCE compiler option. The SOURCE compileroption is required to generate a listing file. You must direct the listing to anon-temporary file that is available during the debug session. During adebug session, z/OS Debugger displays the first file it finds nameduserid.pgmname.list in the Source window. In addition, you must link yourprogram with the Language Environment SCEELKED library; do not use theOS PL/I PLIBASE or SIBMBASE library.If z/OS Debugger cannot find the listing at this location, see “Changingwhich file appears in the Source window” on page 170.
After you have chosen the compiler options and suboptions, see Chapter 4,“Planning your debug session,” on page 25 to determine the next task you mustcomplete.
38 IBM z/OS Debugger V14.1.9 User's Guide

Table 9. Description of the effects that the PL/I NOTEST compiler option and the TESTcompiler suboptions have on z/OS Debugger.
Name of compileroption or suboption Description of the effect
NOTESTSome behaviors or features change when you debug a PL/Iprogram compiled with the NOTEST compiler option. The followinglist describes these changes:
v You can list storage and registers.
v You can include calls to PLITEST or CEETEST in your programso you can suspend running your program and issue z/OSDebugger commands.
v You cannot step through program statements. You can suspendrunning your program only at the initialization of the maincompile unit.
v You cannot examine or use any program variables.
v Because hooks at the statement level are not inserted, youcannot set any statement breakpoints or use commands such asGOTO or QUERY LOCATION.
v The source listing produced by the compiler cannot be used;therefore, no listing is available during a debug session.
However, you can still debug your program using the disassemblyview. To learn how to use the disassembly view, see Chapter 35,“Debugging a disassembled program,” on page 359.
NOHOOKSome behaviors or features change when you debug a PL/Iprogram compiled with the NOHOOK suboption of the TEST compileroption. The following list describes these changes:
v For z/OS Debugger to generate overlay hooks, one of thesuboptions ALL, PATH, STMT or BLOCK must be in effect, butHOOK need not be specified, and NOHOOK would berecommended.
v If NOHOOK is specified, ENTRY and EXIT breakpoints are theonly PATH breakpoints at which z/OS Debugger stops.
NONEWhen you compile a PL/I program with the NONE suboption of theTEST compiler option, you can start z/OS Debugger at any point inyour program by writing a call to PLITEST or CEETEST in yourprogram.
SYMSome behaviors or features change when you debug a PL/Iprogram compiled with the SYM suboption of the TEST compileroption. The following list describes these changes:
v You can reference all program variables by name, which allowsyou to examine them or use them in expressions and use theDATA parameter of the PLAYBACK ENABLE command.
v Enables support for the SET AUTOMONITOR ON command.
v Enables the support for labels as GOTO targets.
Chapter 4. Planning your debug session 39

Table 9. Description of the effects that the PL/I NOTEST compiler option and the TESTcompiler suboptions have on z/OS Debugger. (continued)
Name of compileroption or suboption Description of the effect
NOSYMSome behaviors or features change when you debug a PL/Iprogram compiled with the NOSYM suboption of the TEST compileroption. The following list describes these changes:
v You cannot reference program variables by name.
v You cannot use commands such as LIST or DESCRIBE to accessa variable or expression.
v You cannot use commands such as CALL variable to branch toanother program, or GOTO to branch to another label(procedure or block name).
BLOCKSome behaviors or features change when you debug a PL/Iprogram compiled with the BLOCK suboption of the TEST compileroption. The following list describes these changes:
v Enables z/OS Debugger to gain control at block boundaries:block entry and block exit.
v When Dynamic Debug is not active and you use the HOOKcompiler option, you can gain control only at the entry and exitpoints of your program and all entry and exit points of internalprogram blocks. When you enter the STEP command, forexample, your program runs until it reaches the next block entryor exit point.
v When Dynamic Debug is active, you can set breakpoints at allstatements and step through your program.
v You cannot gain control at path points unless you also specifyPATH.
v A call to PLITEST or CEETEST can be used to start z/OSDebugger at any point in your program.
v Hooks are not inserted into an empty ON-unit or an ON-unitconsisting of a single GOTO statement.
STMTSome behaviors or features change when you debug a PL/Iprogram compiled with the STMT suboption of the TEST compileroption. The following list describes these changes:
v You can set breakpoints at all statements and step through yourprogram.
v z/OS Debugger cannot gain control at path points unless theyare also at statement boundaries, unless you also specify PATH.
v Branching to all statements and labels using the z/OS Debuggercommand GOTO is allowed.
ALLSome behaviors or features change when you debug a PL/Iprogram compiled with the ALL suboption of the TEST compileroption. The following list describes these changes:
v You can set breakpoints at all statements and path points, andSTEP through your program.
v z/OS Debugger can gain control of the program at allstatements, path points, labels, and block entry and exit points,allowing you to enter z/OS Debugger commands.
v Enables branching to statements and labels using the z/OSDebugger command GOTO.
40 IBM z/OS Debugger V14.1.9 User's Guide

Refer to the following topics for more information related to the material discussedin this topic.
Related referencesDescription of the TEST compiler option in Enterprise PL/I for z/OS ProgrammingGuide.
Choosing TEST or DEBUG compiler suboptions for Cprograms
This topic describes the combination of TEST or DEBUG compiler options andsuboptions you need to specify to obtain the desired debugging scenario. Thistopic assumes you are compiling your C program with z/OS C/C++, Version 1.6,or later; however, the topics provide information about alternatives to use for olderversions of the C compiler.
Choosing between TEST and DEBUG compiler optionsIf you are compiling with z/OS C/C++, Version 1.5 or earlier, you must choose theTEST compiler option.
The C/C++ compiler option DEBUG was introduced with z/OS C/C++ Version 1.5.z/OS Debugger supports the DEBUG compiler option in z/OS C/C++ Version 1.6 orlater. The DEBUG compiler option replaces the TEST compiler option that wasavailable with previous versions of the compiler.
If you are compiling with z/OS C/C++, Version 1.6 or later, choose the DEBUGcompiler option and take advantage of the following benefits:v For C++ programs, you can specify the HOOK(NOBLOCK) compiler option, which
can improve debug performance.v For C and C++ programs, if you specify the FORMAT(DWARF) suboption of the
DEBUG compiler option, the load modules are smaller; however, you must savethe .dbg file in addition to the source file. z/OS Debugger needs both of thesefiles to debug your program.
v For C and C++ programs compiled with z/OS XL C/C++, Version 1.10 or later,if you specify the FORMAT(DWARF) suboption of the DEBUG compiler option, theload modules are smaller and you can create .mdbg files with captured source.z/OS Debugger needs only the .mdbg file to debug your program.
Choosing DEBUG compiler suboptions for C programsThis topic describes the debugging scenarios available, and how to create aparticular debugging scenario by choosing the correct DEBUG compiler suboptions.
The C compiler provides the DEBUG compiler option and its suboptions to controlthe following actions:v The generation and placement of hooks and symbol tables.v The placement of debug information into the object file or separate debug file.
z/OS Debugger does not support debugging optimized C programs. Do not useany OPTIMIZE compiler options other than NOOPTIMIZE or OPTIMIZE(0).
The following instructions help you choose the combination of DEBUG compilersuboptions that provide the functionality you need to debug your program:1. Choose a debugging scenario, keeping in mind your site's resources, from the
following list:
Chapter 4. Planning your debug session 41
v Scenario A: To get the most z/OS Debugger functionality, a smaller programsize, and better performance, use one of the following combinations:DEBUG(FORMAT(DWARF),HOOK(LINE,NOBLOCK,PATH),SYMBOL,FILE(file_location))
The compiler options are the same whether you use only .dbg files or alsouse .mdbg files.
v Scenario B: To get all z/OS Debugger functionality but have a largerprogram size and do not want the debug information in a separate file, usethe following combination:DEBUG(FORMAT(ISD),HOOK(LINE,NOBLOCK,PATH),SYMBOL)
v Scenario C: You can get some z/OS Debugger functionality by compilingwith the NODEBUG compiler option. This requires that you debug yourprogram in disassembly mode.
For all scenarios, if you are using other IBM Application Delivery Foundationfor z Systems tools, see topic z/OS XL C and C++ programs in IBM ApplicationDelivery Foundation for z Systems Common Components Customization Guide andUser Guide to make sure you specify all the compiler options you need to createthe files needed by all the IBM Application Delivery Foundation for z Systemstools.
2. For the scenario you selected, verify that you have the following resources:v For scenario A, do the following tasks:
– If you create an .mdbg file, do the following tasks:a. Specify YES for the EQAOPTS MDBG command (which requires z/OS
Debugger to search for a .dbg file in a .mdbg file)2.b. Verify that the .dbg files are non-temporary files.c. Create the .mdbg file with captured source by using the -c option for
the dbgld command or the CAPSRC option on the CDADBGLD utility.d. Verify that the .mdbg file is a non-temporary file.
– If you use only .dbg files, verify that the .dbg files are non-temporary filesand specify NO for the EQAOPTS MDBG command3.
v For scenario C, do the following steps:a. If you are running on z/OS Version 1.6 or Version 1.7, verify that
Language Environment PTF for APAR PK12833 is installed.b. If you use the Dynamic Debug facility to place hooks into programs that
reside in read-only storage, verify with your system administrator thatthe Authorized Debug facility has been installed and that you areauthorized to use it.
c. After you start z/OS Debugger, verify that you have not deactivated theDynamic Debug facility by entering the QUERY DYNDEBUG command.
3. Verify whether you need to do any of the following tasks:v You can specify any combination of the C DEBUG suboptions in any order. The
default suboptions are BLOCK, LINE, PATH, and SYMBOL.v When you compile a program, do not associate SYSIN with an in-stream
data set (for example //SYSIN DD *) because z/OS Debugger requiresaccess to a permanent data set for the source of the program you aredebugging.
2. In situations where you can specify environment variables, you can set the environment variable EQA_USE_MDBG to YES orNO, which overrides any setting (including the default setting) of the EQAOPTS MDBG command.
3. In situations where you can specify environment variables, you can set the environment variable EQA_USE_MDBG to YES orNO, which overrides any setting (including the default setting) of the EQAOPTS MDBG command.
42 IBM z/OS Debugger V14.1.9 User's Guide

v z/OS Debugger does not support the LP64 compiler option. You mustspecify or have in effect the ILP32 compiler option.
v If you specify the OPTIMIZE compiler option with a level higher than 0, thenno hooks are generated for line, block or path points, and no symbol table isgenerated. Only hooks for function entry and exit points are generated foroptimized programs. The TEST compiler option has the same restriction.
v You cannot call user-defined functions from the command line.
Refer to the following topics for more information related to the material discussedin this topic.
Related referencesDescription of the DEBUG compiler option in z/OS XL C/C++ User's Guide
Choosing TEST or NOTEST compiler suboptions for C programsThis topic describes the debugging scenarios available, and how to create aparticular debugging scenario by choosing the correct TEST compiler suboptions.
The C compiler provides the TEST compiler option and its suboptions to control thegeneration and placement of hooks and symbol tables.
z/OS Debugger does not support debugging optimized C programs. Do not usecompiler options other than NOOPTIMIZE,
The following instructions help you choose the combination of TEST compilersuboptions that provide the functionality you need to debug your program:1. Choose a debugging scenario, keeping in mind your site's resources, from the
following list:v Scenario A: To get all z/OS Debugger functionality but have a larger
program size (compared to using DEBUG(FORMAT(DWARF))), useTEST(ALL,HOOK,SYMBOL).
v Scenario B: You can get some z/OS Debugger functionality by compilingwith the NOTEST compiler option. This requires that you debug your programin disassembly mode.
v Scenario C: If you are debugging programs running in ALCS, you mustcompile with the HOOK suboption of the TEST compiler option.
For all scenarios, if you are using other IBM Application Delivery Foundationfor z Systems tools, see topic z/OS XL C and C++ programs in IBM ApplicationDelivery Foundation for z Systems Common Components Customization Guide andUser Guide to make sure you specify all the compiler options you need to createthe files needed by all the IBM Application Delivery Foundation for z Systemstools.
2. For scenario B, do the following steps:a. If you are running on z/OS Version 1.6 or Version 1.7, verify that Language
Environment PTF for APAR PK12833 is installed.b. If you use the Dynamic Debug facility to place hooks into programs that
reside in read-only storage, verify with your system administrator that theAuthorized Debug facility has been installed and that you are authorized touse it.
c. After you start z/OS Debugger, verify that you have not deactivated theDynamic Debug facility by entering the SET DYNDEBUG OFF command.
3. Verify whether you need to do any of the following tasks:
Chapter 4. Planning your debug session 43

v When you compile a program, do not associate SYSIN with an in-streamdata set (for example //SYSIN DD *) because z/OS Debugger requiresaccess to a permanent data set for the source of the program you aredebugging.
v If you are using #pragma statements to specify your TEST or NOTEST compileroptions, see “Compiling your C program with the #pragma statement” onpage 45.
v The C TEST compiler option implicitly specifies the GONUMBER compiler option,which causes the compiler to generate line number tables that correspond tothe input source file. You can explicitly remove this option by specifyingNOGONUMBER. When the TEST and NOGONUMBER options are specified together,z/OS Debugger does not display the current execution line as you stepthrough your code.
v Programs that are compiled with both the TEST compiler option and eitherthe OPT(1) or OPT(2) compiler option do not have hooks at line, block, andpath points, or generate a symbol table, regardless of the TEST suboptionsspecified. Only hooks for function entry and exit points are generated foroptimized programs.
v You can specify any number of TEST suboptions, including conflictingsuboptions (for example, both PATH and NOPATH). The last suboptions that arespecified take effect. For example, if you specify TEST(BLOCK, NOBLOCK,BLOCK, NOLINE, LINE), what takes effect is TEST(BLOCK, LINE) because BLOCKand LINE are specified last.
v No duplicate hooks are generated even if two similar TEST suboptions arespecified. For example, if you specify TEST(BLOCK, PATH), the BLOCKsuboption causes the generation of hooks at entry and exit points. The PATHsuboption also causes the generation of hooks at entry and exit points.However, only one hook is generated at each entry and exit point.
Table 10. Description of the effects that the C NOTEST compiler option and the TESTcompiler suboptions have on z/OS Debugger.
Name of compileroption or suboption Description of the effect
NOTESTThe following list explains the effect the NOTEST compiler optionwill have on how z/OS Debugger behaves or the availability offeatures, which are not described in z/OS XL C/C++ User's Guide:v You cannot step through program statements. You can suspend
execution of the program only at the initialization of the maincompile unit.
v You cannot examine or use any program variables.v You can list storage and registers.v You cannot use the z/OS Debugger command GOTO.
However, you can still debug your program using the disassemblyview. To learn how to use the disassembly view, see Chapter 35,“Debugging a disassembled program,” on page 359.
TESTThe following list explains the effect some of the suboptions of theTEST compiler option will have on how z/OS Debugger behavesor the availability of features, which are not described in z/OS XLC/C++ User's Guide:
v The maximum number of lines in a single source file cannotexceed 131,072.
v The maximum number of include files that have executablestatements cannot exceed 1024.
44 IBM z/OS Debugger V14.1.9 User's Guide

Table 10. Description of the effects that the C NOTEST compiler option and the TESTcompiler suboptions have on z/OS Debugger. (continued)
Name of compileroption or suboption Description of the effect
NOSYMThe following list explains the effect the NOSYM suboption of theTEST compiler option will have on how z/OS Debugger behaves orthe availability of features, which are not described in z/OS XLC/C++ User's Guide.
v You cannot reference program variables by name.
v You cannot use commands such as LIST or DESCRIBE to access avariable or expression.
v You cannot use commands such as CALL or GOTO to branch toanother label (paragraph or section name).
Refer to the following topics for more information related to the material discussedin this topic.
Related referencesDescription of the TEST compiler option in z/OS XL C/C++ User's Guide
Compiling your C program with the #pragma statementThe TEST/NOTEST compiler option can be specified either when you compile yourprogram or directly in your program, using a #pragma.
This #pragma must appear before any executable code in your program.
The following example generates symbol table information, symbol information fornested blocks, and hooks at line numbers:#pragma options (test(SYM,BLOCK,LINE))
This is equivalent to TEST(SYM,BLOCK,LINE,PATH).
You can also use a #pragma to specify runtime options.
Delay debug mode for C requires the FUNCEVENT(ENTRYCALL)compiler suboption
You must specify the FUNCEVENT(ENTRYCALL) compiler option when you compileyour programs for delay debug usage.
Usage notes:
v The FUNCEVENT(ENTRYCALL) compiler option is available in the z/OS 2.1 XLC/C++ compiler with the PTF for APAR PI19326 applied.
v The z/OS 2.1 Language Environment with the PTF for APAR PI12415 appliedmust be available on the target system where the C programs are executed.
v If your C application runs on UNIX System Services with imported functionsfrom a DLL module and you want to delay the starting of a debug session untilone of those functions is called, the DLL module name must be the same as theload library name.
Rules for the placement of hooks in functions and nested blocksThe following rules apply to the placement of hooks for getting in and out offunctions and nested blocks:
Chapter 4. Planning your debug session 45

v The hook for function entry is placed before any initialization or statements forthe function.
v The hook for function exit is placed just before actual function return.v The hook for nested block entry is placed before any statements or initialization
for the block.v The hook for nested block exit is placed after all statements for the block.
Refer to the following topics for more information related to the material discussedin this topic.
Related referencesz/OS XL C/C++ User's Guide
Rules for placement of hooks in statements and path pointsThe following rules apply to the placement of hooks for statements and pathpoints:v Label hooks are placed before the code and all other statement or path point
hooks for the statement.v The statement hook is placed before the code and path point hook for the
statement.v A path point hook for a statement is placed before the code for the statement.
Refer to the following topics for more information related to the material discussedin this topic.
Related referencesz/OS XL C/C++ User's Guide
Choosing TEST or DEBUG compiler suboptions for C++programs
This topic describes the combination of TEST or DEBUG compiler options andsuboptions you need to specify to obtain the desired debugging scenario. Thistopic assumes you are compiling your C++ program with z/OS C/C++, Version1.6, or later; however, the topics provide information about alternatives to use forolder versions of the C++ compiler.
Choosing between TEST and DEBUG compiler optionsIf you are compiling with z/OS C/C++, Version 1.5 or earlier, you must choose theTEST compiler option.
The C/C++ compiler option DEBUG was introduced with z/OS C/C++ Version 1.5.z/OS Debugger supports the DEBUG compiler option in z/OS C/C++ Version 1.6 orlater. The DEBUG compiler option replaces the TEST compiler option that wasavailable with previous versions of the compiler.
If you are compiling with z/OS C/C++, Version 1.6 or later, choose the DEBUGcompiler option and take advantage of the following benefits:v For C++ programs, you can specify the HOOK(NOBLOCK) compiler option, which
can improve debug performance.v For C and C++ programs, if you specify the FORMAT(DWARF) suboption of the
DEBUG compiler option, the load modules are smaller; however, you must savethe .dbg file in addition to the source file. z/OS Debugger needs both of thesefiles to debug your program.
v For C and C++ programs compiled with z/OS XL C/C++, Version 1.10 or later,if you specify the FORMAT(DWARF) suboption of the DEBUG compiler option, the
46 IBM z/OS Debugger V14.1.9 User's Guide

load modules are smaller and you can create .mdbg files with captured source.z/OS Debugger needs only the .mdbg file to debug your program.
Choosing DEBUG compiler suboptions for C++ programsThis topic describes the debugging scenarios available, and how to create aparticular debugging scenario by choosing the correct DEBUG compiler suboptions.
The C++ compiler provides the DEBUG compiler option and its suboptions to controlthe following actions:v The generation and placement of hooks and symbol tables.v The placement of debug information into the object file or separate debug file.
z/OS Debugger does not support debugging optimized C programs. Do not useany OPTIMIZE compiler options other than NOOPTIMIZE or OPTIMIZE(0).
The following instructions help you choose the combination of DEBUG compilersuboptions that provide the functionality you need to debug your program:1. Choose a debugging scenario, keeping in mind your site's resources, from the
following list:v Scenario A: To get the most z/OS Debugger functionality, a smaller program
size, and better performance, use one of the following combinations:DEBUG(FORMAT(DWARF),HOOK(LINE,NOBLOCK,PATH),SYMBOL,FILE(file_location))
The compiler options are the same whether you use only .dbg files or alsouse .mdbg files.
v Scenario B: To get all z/OS Debugger functionality but have a largerprogram size and do not want the debug information in a separate file, usethe following combination:DEBUG(FORMAT(ISD),HOOK(LINE,NOBLOCK,PATH),SYMBOL)
v Scenario C: You can get some z/OS Debugger functionality by compilingwith the NODEBUG compiler option. This requires that you debug yourprogram in disassembly mode.
For all scenarios, if you are using other IBM Application Delivery Foundationfor z Systems tools, see IBM Application Delivery Foundation for z SystemsCommon Components Customization Guide and User Guide to make sure youspecify all the compiler options you need to create the files needed by all theIBM Application Delivery Foundation for z Systems tools.
2. For the scenario you selected, verify that you have the following resources:v For scenario A, do the following tasks:
– If you create an .mdbg file, do the following tasks:a. Specify YES for the EQAOPTS MDBG command (which requires z/OS
Debugger to search for a .dbg file in a .mdbg file)4.b. Verify that the .dbg files are non-temporary files.c. Create the .mdbg file with captured source by using the -c option for
the dbgld command or the CAPSRC option on the CDADBGLD utility.d. Verify that the .mdbg file is a non-temporary file.
4. In situations where you can specify environment variables, you can set the environment variable EQA_USE_MDBG to YES orNO, which overrides any setting (including the default setting) of the EQAOPTS MDBG command.
Chapter 4. Planning your debug session 47

– If you use only .dbg files, verify that the .dbg files are non-temporary filesand specify NO for the EQAOPTS MDBG command5.
v For scenario C, do the following steps:a. If you are running on z/OS Version 1.6 or Version 1.7, verify that
Language Environment PTF for APAR PK12833 is installed.b. If you use the Dynamic Debug facility to place hooks into programs that
reside in read-only storage, verify with your system administrator thatyou are authorized to do so
c. After you start z/OS Debugger, verify that you have not deactivated theDynamic Debug facility by entering the QUERY DYNDEBUG command.
3. Verify whether you need to do any of the following tasks:v You can specify any combination of the C++ DEBUG suboptions in any order.
The default suboptions are BLOCK, LINE, PATH, and SYM.v
When you compile a program, do not associate SYSIN with an in-streamdata set (for example //SYSIN DD *) because z/OS Debugger requiresaccess to a permanent data set for the source of the program you aredebugging.
v z/OS Debugger does not support the LP64 compiler option. You mustspecify or have in effect the ILP32 compiler option.
v If you specify the OPTIMIZE compiler option with a level higher than 0, thenno hooks are generated for line, block or path points, and no symbol table isgenerated. Only hooks for function entry and exit points are generated foroptimized programs. The TEST compiler option has the same restriction.
v You can not call user defined functions from the command line.
After you have chosen the compiler options and suboptions, see Chapter 4,“Planning your debug session,” on page 25 to determine the next task you mustcomplete.
Refer to the following topics for more information related to the material discussedin this topic.
Related referencesDescription of the DEBUG compiler option in z/OS XL C/C++ User's Guide
Choosing TEST or NOTEST compiler options for C++ programsThis topic describes the debugging scenarios available, and how to create aparticular debugging scenario by choosing the correct TEST compiler suboptions.
The C++ compiler provides the TEST compiler option and its suboptions to controlthe generation and placement of hooks and symbol tables.
z/OS Debugger does not support debugging optimized C++ programs. Do not usecompiler options other than NOOPTIMIZE,
The following instructions help you choose the combination of TEST compilersuboptions that provide the functionality you need to debug your program:1. Choose a debugging scenario, keeping in mind your site's resources, from the
following list:
5. In situations where you can specify environment variables, you can set the environment variable EQA_USE_MDBG to YES orNO, which overrides any setting (including the default setting) of the EQAOPTS MDBG command.
48 IBM z/OS Debugger V14.1.9 User's Guide

v Scenario A: To get all z/OS Debugger functionality but have a largerprogram size (compared to using DEBUG(FORMAT(DWARF))), use TEST.
v Scenario B: You can get some z/OS Debugger functionality by compilingwith the NOTEST compiler option. This requires that you debug your programin disassembly mode.
v Scenario C: If you are debugging programs running in ALCS, you mustcompile with the HOOK suboption of the TEST compiler option.
For all scenarios, if you are using other IBM Application Delivery Foundationfor z Systems tools, see IBM Application Delivery Foundation for z SystemsCommon Components Customization Guide and User Guide to make sure youspecify all the compiler options you need to create the files needed by all theIBM Application Delivery Foundation for z Systems tools.
2. Verify whether you need to do any of the following tasks:v
When you compile a program, do not associate SYSIN with an in-streamdata set (for example //SYSIN DD *) because z/OS Debugger requiresaccess to a permanent data set for the source of the program you aredebugging.
v The C++ TEST compiler option implicitly specifies the GONUMBER compileroption, which causes the compiler to generate line number tables thatcorrespond to the input source file. You can explicitly remove this option byspecifying NOGONUMBER. When the TEST and NOGONUMBER options are specifiedtogether, z/OS Debugger does not display the current execution line as youstep through your code.
v Programs that are compiled with both the TEST compiler option and eitherthe OPT(1) or OPT(2) compiler option do not have hooks at line, block, andpath points, or generate a symbol table. Only hooks for function entry andexit points are generated for optimized programs.
After you have chosen the compiler options and suboptions, see Chapter 4,“Planning your debug session,” on page 25 to determine the next task you mustcomplete.
Table 11. Description of the effects that the C++ NOTEST and TEST compiler option haveon z/OS Debugger.
Name of compileroption or suboption Description of the effect
NOTESTThe following list explains the effect of the NOTEST compiler has onz/OS Debugger behavior, which are not described in z/OS XLC/C++ User's Guide:v You cannot step through program statements. You can suspend
execution of the program only at the initialization of the maincompile unit.
v You cannot examine or use any program variables.v You can list storage and registers.v You cannot use the z/OS Debugger command GOTO.
However, you can still debug your program using the disassemblyview. To learn how to use the disassembly view, see Chapter 35,“Debugging a disassembled program,” on page 359.
Chapter 4. Planning your debug session 49

Table 11. Description of the effects that the C++ NOTEST and TEST compiler option haveon z/OS Debugger. (continued)
Name of compileroption or suboption Description of the effect
TESTThe following list explains the effect the TEST compiler has onz/OS Debugger behavior, which are not described in z/OS XLC/C++ User's Guide:
v The maximum number of lines in a single source file cannotexceed 131,072.
v The maximum number of include files that have executablestatements cannot exceed 1024.
Refer to the following topics for more information related to the material discussedin this topic.
Related referencesDescription of the TEST compiler option in z/OS XL C/C++ User's Guide
Rules for the placement of hooks in functions and nested blocksThe following rules apply to the placement of hooks for functions and nestedblocks:v The hook for function entry is placed before any initialization or statements for
the function.v The hook for function exit is placed just before actual function return.v The hook for nested block entry is placed before any statements or initialization
for the block.v The hook for nested block exit is placed after all statements for the block.
Refer to the following topics for more information related to the material discussedin this topic.
Related referencesz/OS XL C/C++ User's Guide
Rules for the placement of hooks in statements and path pointsThe following rules apply to the placement of hooks for statements and pathpoints:v Label hooks are placed before the code and all other statement or path point
hooks for the statement.v The statement hook is placed before the code and path point hook for the
statement.v A path point hook for a statement is placed before the code for the statement.
Refer to the following topics for more information related to the material discussedin this topic.
Related referencesz/OS XL C/C++ User's Guide
Understanding how hooks work and why you need themHooks enable you to set breakpoints. Hooks are instructions that can be insertedinto a program by a compiler at compile time. Hooks can be placed at theentrances and exits of blocks, at statement boundaries, and at points in theprogram where program flow might change between statement boundaries (calledpath points). If you compile a program with the TEST compiler option and specify
50 IBM z/OS Debugger V14.1.9 User's Guide

any suboption except NONE or NOHOOK, the compiler inserts hooks into your program(except for Enterprise COBOL for z/OS Version 5, which never generates compiledin hooks).
How the Dynamic Debug facility can help you get maximumperformance without hooksIn the following situations, you can compile or create a program without hooks.Then, you can use the Dynamic Debug facility to insert hooks at runtime wheneveryou set a breakpoint or enter the STEP command:v Assembler, disassembly, and LangX COBOL programs do not contain hooks.v Enterprise COBOL for z/OS Version 5 always generates programs without
hooks.v If you use Enterprise COBOL for z/OS, Version 4, you can compile your
programs without hooks by using the TEST(NOHOOK) compiler option.v If you use one of the following compilers, you can compile your programs
without hooks by using the TEST(NONE) compiler option:– Enterprise COBOL for z/OS and OS/390, Version 3– COBOL for OS/390 & VM, Version 2 Release 2– COBOL for OS/390 & VM, Version 2 Release 1, with APAR PQ40298
v If you use the Enterprise PL/I for z/OS, Version 3.4 or later, compiler, you cancompile your programs without hooks by using the TEST(NOHOOK) compileroption.
The Dynamic Debug facility can also help improve the performance of z/OSDebugger while debugging programs compiled with any of the followingcompilers:v any COBOL compiler supported by z/OS Debuggerv any PL/I compiler supported by z/OS Debuggerv any C/C++ compiler supported by z/OS Debugger
When you compile with one the following compilers and have the compiler inserthooks, you can enhance the program's performance while you debug it by usingthe Dynamic Debug facility:v any COBOL compiler supported by z/OS Debuggerv any PL/I compiler supported by z/OS Debuggerv any C/C++ compiler supported by z/OS Debugger
When you start z/OS Debugger, the Dynamic Debug facility is activated unlessyou change the default by using the DYNDEBUG EQAOPTS command. If the DYNDEBUGEQAOPTS command was used to change the default to DYNDEBUG OFF, you canactivate it by using the SET DYNDEBUG ON z/OS Debugger command. Note that theSET DYNDEBUG ON z/OS Debugger command must be issued before you enter theSTEP or GO command. If the Dynamic Debug facility is not active, z/OS Debuggeruses the hooks inserted by the compiler, instead of the hooks inserted by theDynamic Debug facility.
Understanding what symbol tables do and why saving themelsewhere can make your application smaller
The symbol table contains descriptions of variables, their attributes, and theirlocation in storage. z/OS Debugger uses these descriptions when it referencesvariables. The symbol tables can be stored in the object file of the program or in a
Chapter 4. Planning your debug session 51

separate debug file. You can save symbol tables in a separate debug file if youcompile or assemble your programs with one of the following compilers orassembler:v Enterprise COBOL for z/OS, Version 4v Enterprise COBOL for z/OS and OS/390, Version 3v COBOL for OS/390 & VM, Version 2 Release 2v COBOL for OS/390 & VM, Version 2 Release 1 with APAR PQ40298v OS/VS COBOL Version 1, Release 2.4v Enterprise PL/I for z/OS, Version 3 Release 5 or laterv High Level Assembler for MVS & VM & VSE, Release 4 or later
Saving symbol tables in a separate debug file can reduce the size of the loadmodule for your program.
For C and C++ programs, debug tables can be saved in a separate debug file (.dbgfile) by specifying the FORMAT(DWARF) suboption of the DEBUG compiler option. z/OSDebugger supports the DEBUG compiler option shipped with z/OS C/C++ Version1.6 or later.
Programs compiled with the Enterprise COBOL for z/OS Version 5 compiler,Version 6 Release 1 compiler or Version 6 Release 2 compiler with theTEST(NOSEPARATE) compiler option have all of their debug information (includingthe symbol table) stored in a NOLOAD segment of the program object. This segmentis only loaded into memory when you are debugging the program object.
Choosing a debugging modeUse the following list to determine which debugging mode to use for yourprograms:
For TSO programsChoose full-screen mode. If you want to use a supported remote debugger,choose remote debug mode.
For JES batch programsIf you want to interact with your batch program, choose full-screen modeusing the Terminal Interface Manager. If you want to interact with yourbatch program using a supported remote debugger, choose remote debugmode. If you don't want to interact with your batch program, use batchmode and specify commands through a commands file and review resultsin a log file.
For UNIX System Services programsChoose full-screen mode using the Terminal Interface Manager. If you wantto use a supported remote debugger, choose remote debug mode.
For CICS programsIf you want to interact with z/OS Debugger on a 3270 device, choosefull-screen mode and one of the following terminal modes:v Single terminal mode: The application program and z/OS Debugger
share the same terminal. Use this terminal mode to debug a transactionthat interacts with a 3270 terminal. When you create your CADP orDTCN profile, set the Display Device to the terminal ID that theapplication program uses.
v Screen control mode: z/OS Debugger displays its screens on a terminalrunning the DTSC transaction.
52 IBM z/OS Debugger V14.1.9 User's Guide

If you use screen control mode, the DTSC transaction runs in the sameregion as your application program on a terminal of your choice, anddisplays z/OS Debugger screens on behalf of the task you aredebugging, which might not have its own terminal.Use screen control mode to debug application programs which are nottypically associated with a terminal, and which are running in an MROenvironment.Screen control mode works in the following manner:1. Enter DTSC on the terminal that you want to use to display z/OS
Debugger. This terminal can be connected directly to the regionwhere the application program runs, or connected to the region withCRTE or Transaction Routing. If you use Transaction Routing, youmust ensure that DTSC runs in the same region as the applicationprogram using it.
2. Set the Display Device in your DTCN or CADP profile to theterminal running the DTSC transaction.
3. Start the application program.4. Press Enter on the terminal running the DTSC transaction to connect
to z/OS Debugger.v Separate terminal mode (formerly called Dual Terminal Mode): z/OS
Debugger dynamically starts the CDT# transaction on a terminal.Use separate terminal mode to debug application programs which arenot typically associated with a terminal, and your terminal is connecteddirectly to the region running your application program.Separate terminal mode works in the following manner:1. Set the Display Device in your DTCN or CADP profile to an
available terminal and that terminal can be located by the CICSregion running z/OS Debugger.
2. Start the application program.
If you want to debug your program with a remote debugger, select remotedebug mode. Make note of the TCP/IP address of your remote debuggerbecause you will need it when you update your CADP or DTCN profile.
If you do not use single terminal mode and your program sends a screento the terminal without the WAIT option, CICS Terminal Control holds thatscreen until the program runs an EXEC CICS SEND or EXEC CICS RECEIVEstatement.
If you want to debug programs that use Distributed Program Link (DPL),you can select one of the following debugging modes:v Select remote debug mode and use the remote debugger to debug both
the DPL client and DPL server.v Select full screen mode and use two 3270 terminals, one for the DPL
client and one for the DPL server.You can connect the 3270 terminal to the DPL server in one of thefollowing ways:– Directly to the server region.– To the client region. If you choose this option, use one of the
following terminal modes:- Screen Control Mode with DTSC running on a terminal that is
connected to the server with CRTE
Chapter 4. Planning your debug session 53
- Separate Terminal Mode with the terminal connected to the clientregion and configure the server region so that it looks for theterminal in the client region. To configure the server region, see“Separate terminal mode terminal connects to a TOR andapplication runs in an AOR” in the IBM z/OS DebuggerCustomization Guide.
For DB2 programsChoose full-screen mode using the Terminal Interface Manager. If you wantto use a supported remote debugger, choose remote debug mode.
For DB2 Stored ProceduresChoose full-screen mode using the Terminal Interface Manager. If you wantto use a supported remote debugger, choose remote debug mode.
For IMS TM programsChoose full-screen mode using the Terminal Interface Manager. If you wantto use a supported remote debugger, choose remote debug mode.
For IMS batch programsIf you want to interact with your IMS batch programs, choose full-screenmode using the Terminal Interface Manager. If you want to interact withyour IMS batch programs with a supported remote debugger, chooseremote debug mode. If you do not want to interact with your IMS batchprogram, choose batch mode and specify commands through a commandsfile and review results in a log file.
For IMS BTS programsIf you want your program and your debugging session to run on a singlescreen, choose full-screen mode. If you want your BTS data to display onyour TSO terminal and your debugging session to display on anotherterminal, choose full-screen mode using the Terminal Interface Manager. Ifyou want your BTS data to display on your TSO terminal and yourdebugging session to display on a supported remote debugger, chooseremote debug mode.
For ALCS programsYou must choose remote debug mode.
Refer to the following topics for more information related to the material discussedin this topic.
Related referencesIMS/VS Batch Terminal Simulator Program Reference and Operations Manual
Debugging in browse modeWhen you debug in some production environments, it might be necessary torestrict your ability to change storage contents and execution flow. Debugging inbrowse mode enables you to debug your programs while restricting your ability tochange storage contents and execution flow. z/OS Debugger uses the RACF®
authority of the current user, an EQAOPTS command, or both to determinewhether to operate in browse mode.
When you debug in browse mode, you can not do the following actions:v Modify the contents of memory or registersv Alter the sequence of program execution
You can use the QUERY BROWSE MODE command to determine if browse mode isactive.
54 IBM z/OS Debugger V14.1.9 User's Guide
For information on how to install and control browse mode, see IBM z/OSDebugger Customization Guide.
Browse mode debugging in full screen, line, and batch modeIf you are debugging in full screen, line, or batch mode; browse mode is active;and you enter any of the following commands, z/OS Debugger displays a messagethat the command is not permitted in browse mode:v ALLOCATE commandv Assignment command (assembler and disassembly)v Assignment command (LangX COBOL)v Assignment command (PL/I)v CALL %CECI commandv CALL entry_name (COBOL)v CALL %FM commandv CALL %HOGAN commandv CLEAR LOG commandv COMPUTE commandv FREE commandv GO BYPASS commandv GOTO commandv GOTO LABEL commandv INPUT commandv JUMPTO commandv JUMPTO LABEL commandv MEMORY command (z/OS Debugger displays the Memory window, but you
cannot modify anything)v MOVE commandv QUIT commandv QUIT expression commandv QQUIT commandv SET INTERCEPT commandv SET command (COBOL)v STORAGE commandv SYSTEM commandv TRIGGER commandv TSO command
If you enter a command with an expression or condition that might alter any storage,register, or similar data, or the command invokes any user-written function oralters the sequence of execution, z/OS Debugger displays a message that thecommand is not permitted in browse mode:v do/whilev DO command (PL/I)v EVALUATE command (COBOL)v expression command (C and C++)v for command (C and C++)v %IF command
Chapter 4. Planning your debug session 55

v IF commandv LIST expression commandv switch commandv while command
Browse mode debugging in remote debug modeWhen you use the remote debugger and browse mode is active, the remotedebugger does not allow you to do the following actions:v JumpTo Location – Source window RMB actionv Change Value – Expression, Variable, and Registers RMB actionv Typing over memory in the Memory window
In addition, the remote debugger enforces following restrictions:v Change Value – the remote debugger does not allow Registers RMB action and
displays an error messagev Terminate Button – the program terminates with an abend (instead, click on
Disconnect to continue running the program without the debugger)
Also, the remote debugger does not allow you to enter the following DebugConsole commands:v JUMPTO (and JUMPTO in the Action field of the Add a Breakpoint window)v SET INTERCEPT
v QUIT
If an abend occurs while debugging in remote debug mode and browse mode isactive, the remote debugger does not give you any continuation options. You cannot continue program execution after the abend occurs.
Controlling browse modeBrowse mode can be controlled (activated or deactivated) by changing RACFaccess, specifying the EQAOPTS BROWSE command, both of these, or neither ofthese. To control browse mode through RACF access, change your RACF access tothe following RACF Facilities:v For CICS: EQADTOOL.BROWSE.CICSv For non-CICS: EQADTOOL.BROWSE.MVS
To control browse mode through an EQAOPTS command, specify either ON orOFF for the EQAOPTS BROWSE command.
The following table shows how combinations of these control methods (by RACFaccess or by the EQAOPTS BROWSE command) can activate or deactivate browsemode. For instructions using these controls see IBM z/OS Debugger CustomizationGuide.
Table 12. How different combinations of RACF access and the EQAOPTS BROWSEcommand activate or deactivate browse mode.
Status of RACFaccess
Setting of the EQAOPTS BROWSE command
Not set (use RACFstatus) ON OFF
facility (access) notdefined
normal mode(browse mode is notactive)
browse mode isactive
normal mode
56 IBM z/OS Debugger V14.1.9 User's Guide

Table 12. How different combinations of RACF access and the EQAOPTS BROWSEcommand activate or deactivate browse mode. (continued)
Status of RACFaccess
Setting of the EQAOPTS BROWSE command
Not set (use RACFstatus) ON OFF
ACCESS=NONE Cannot use z/OSDebugger
Cannot use z/OSDebugger
Cannot use z/OSDebugger
ACCESS=READ browse mode isactive
browse mode isactive
browse mode isactive
ACCESS=UPDATE(or higher)
normal mode browse mode isactive
normal mode
Choosing a method or methods for starting z/OS DebuggerTable 13 indicates that there are several different methods to start z/OS Debuggerfor each type of program. In this topic, you will read about the circumstances inwhich each applicable method works for each type of program. Then you canselect which method would work best for your site. After you complete this topic,you will have selected the methods that work best for your programs.
Table 13. Methods for specifying the TEST runtime options and the subsystems that supportthese methods.
TSOJESbatch
UNIXSystemServices CICS DB2
DB2 storedprocedures(PROGRAMTYPE=MAIN)
DB2 storedprocedures(PROGRAMTYPE=SUB)
IMSTM
IMSbatch
IMSBTS
Use the DFSBXITA user exit X X X
Use the CADP transaction X
Use the DTCN transaction X
Use the DB2 catalog X2 X
From within a program bycoding a call to CEETEST,__ctest(), or PLITEST
X X X X X X X X X X
Through CEEUOPT or CEEROPT X X X X1 X1 X1,2 X X X
Use the CEEOPTS DD statementin JCL or CEEOPTS allocation inTSO
X X X X X X
Use the parameters on the EXECstatement when you start yourprogram
X
Use the parameters on the RUNstatement when you start yourprogram
X
Use the parameters on the CALLstatement when you start yourprogram
X
Through the EQASETtransaction3
X3
Through the EQANMDBGprogram4
X4 X4 X4 X4
Use the EQAD3CXT user exitroutine
X X X X X X
Note:
1. You cannot use CEEROPT to specify TEST runtime options.
2. The DB2 catalog method always takes precedence over CEEUOPT.
3. This method is only for non-Language Environment assembler programs.
4. This method is only for non-Language Environment programs.
5. This method is only for DB2 stored procedures invoked with the call_sub function.
6. EQAD3CXT also supports DB2 stored procedures (PROGRAM TYPE=SUB) if you set the RRTN_SW flag as x'01'.
Chapter 4. Planning your debug session 57

For each subsystem, Table 13 on page 57 shows that you can choose from severaldifferent methods of specifying the TEST runtime options. The following list canhelp you select the method that best applies to your situation, ordered byflexibility and convenience:
For TSO programs
1. For programs that start in Language Environment, specify the TESTruntime options using the CEEOPTS allocation in TSO for the mostflexible method of specifying the runtime options.
2. Specify the TEST runtime options using the parameters on the CALLstatement if you have a small number of runtime options or need toinvoke EQANMDBG for a non-Language Environment program.
3. If you specify the TEST runtime options by coding a call to CEETEST,__ctest(), or PLITEST, you will have to recompile your program everytime you want to change the options.
For JES batch programs
1. For programs that start in Language Environment, specify the TESTruntime options using the CEEOPTS DD statement in your JCL for themost flexible method of specifying runtime options.
2. Specify the TEST runtime options using the parameters on the EXECstatement option if you have a small number of runtime options orneed to invoke EQANMDBG for a non-Language Environmentprogram.
3. If you specify the TEST runtime options by coding a call to CEETEST,__ctest(), or PLITEST, you will have to recompile your program everytime you want to change the options.
For UNIX System Services programs
1. Specify the TEST runtime options by setting the _CEE_RUNOPTSenvironment variable.
2. If you specify the TEST runtime options by coding a call to CEETEST,__ctest(), or PLITEST, you will have to recompile your program everytime you want to change the options.
For CICS programs
1. Specify the TEST runtime options using either the DTCN or CADPtransaction to create and store a profile that contains the TEST runtimeoptions.
2. If you specify the TEST runtime options by coding a call to CEETEST,__ctest(), or PLITEST, you will have to recompile your program everytime you want to change the options.
For DB2 programs
1. Specify the TEST runtime options using the CEEOPTS DD statement inJCL or CEEOPTS allocation in TSO for the most flexible method ofspecifying runtime options.
2. Specify the TEST runtime options using the parameters on the RUNstatement option if you have a small number of runtime options.
3. If you specify the TEST runtime options by coding a call to CEETEST,__ctest(), or PLITEST, you will have to recompile your program everytime you want to change the options.
For DB2 stored procedures that have the PROGRAM TYPE of MAIN
58 IBM z/OS Debugger V14.1.9 User's Guide

1. Specify the TEST runtime options using the Language EnvironmentEQAD3CXT user exit routine. You can run the stored procedure withyour own set of suboptions. Another user can run or debug the storedprocedure with a separate set of suboptions. Therefore, multiple userscan run or debug the stored procedure at the same time.
2. If the exit routine is not available at your site, specify the TEST runtimeoptions using the DB2 catalog. However, you are limited to specifyingone specific set of suboptions, which means that every user that runs ordebugs that stored procedure uses the same set of suboptions.
If you implement both methods, the Language Environment exit routinetakes precedence over the DB2 catalog.
For DB2 stored procedures that have the PROGRAM TYPE of SUB
v For programs invoked with the call_sub function, specify the TESTruntime options using the Language Environment EQAD3CXT exitroutine. You can run or debug the DB2 stored procedure with your ownset of suboptions, while another user can run or debug the DB2 storedprocedure with a separate set of suboptions.If the exit routine is not available at your site, specify the TEST runtimeoptions using the DB2 catalog. You are limited to specifying one set ofsuboptions, which means that every user that runs or debugs that storedprocedure uses the same set of suboptions.If you implement methods, the Language Environment exit routine takesprecedence over the DB2 catalog.
v For programs invoked by any other method, specify the TEST runtimeoptions using the DB2 catalog. You are limited to specifying one set ofsuboptions, which means that every user that runs or debugs that storedprocedure uses the same set of suboptions.
For IMS TM programs
1. Specify the TEST runtime options using the Language EnvironmentEQAD3CXT user exit routine.
2. If your program is a non-Language Environment program, issue theEQASET transaction to setup your debugging preference.
3. If the EQAD3CXT user exit routine is not available at your site, specifythe TEST runtime options using the DFSBXITA user exit routine.
4. If the EQAD3CXT or DFSBXITA user exit routines are not available atyour site, specify the TEST runtime options using CEEUOPT orCEEROPT.
5. If none of the previous options are available at your site, specify theTEST runtime options by coding a call to CEETEST, __ctest(), orPLITEST. However, you will have to recompile your program everytime you want to change the options.
For IMS batch programs
1. For programs that start in Language Environment, specify the TESTruntime options using the CEEOPTS allocation in JCL because thismethod can be the most flexible method.
2. Specify the TEST runtime options using the EQAD3CXT user exitroutine.
3. If your program is a non-Language Environment program, use theEQANMDBG program to start your debugging session.
Chapter 4. Planning your debug session 59
4. If the EQAD3CXT user exit routine is not available at your site, specifythe TEST runtime options using the DFSBXITA user exit routine;however, you must specify PROGRAM rather than TRANSACTION.
5. If the EQAD3CXT or DFSBXITA user exit routines are not available atyour site, specify the TEST runtime options using CEEUOPT orCEEROPT.
6. If none of the previous options are available at your site, specify theTEST runtime options by coding a call to CEETEST, __ctest(), orPLITEST. However, you will have to recompile your program everytime you want to change the options.
For IMS BTS programs
1. For programs that start in Language Environment, specify the TESTruntime options using the CEEOPTS allocation in JCL because thismethod can be the most flexible method.
2. Specify the TEST runtime options using the EQAD3CXT user exitroutine.
3. If your program is a non-Language Environment program, use theEQANMDBG program to start your debugging session.
4. If the EQAD3CXT user exit routine is not available at your site, specifythe TEST runtime options using the DFSBXITA user exit routine.
5. If the EQAD3CXT or DFSBXITA user exit routines are not available atyour site, specify the TEST runtime options using CEEUOPT orCEEROPT.
6. If none of the previous options are available at your site, specify theTEST runtime options by coding a call to CEETEST, __ctest(), orPLITEST. However, you will have to recompile your program everytime you want to change the options.
After you have identified the method or methods you will use to start z/OSDebugger, see Chapter 4, “Planning your debug session,” on page 25 to determinethe next task you must complete.
Choosing how to debug old COBOL programsPrograms compiled with the OS/VS COBOL compiler can be debugged by doingone of the following:v Debug them as LangX COBOL programs.v Convert them to the 1985 COBOL Standard level and compile them with the
Enterprise COBOL for z/OS and OS/390 or COBOL for OS/390 & VM compiler.You can use the Load Module Analyzer to identify OS/VS COBOL programs ina load module, then use COBOL and CICS Command Level Conversion Aid(CCCA) to convert the programs.
To convert an OS/VS COBOL program to 1985 COBOL Standard, do the followingsteps:1. Identify the OS/VS COBOL programs in your load module by using the Load
Module Analyzer. For instructions on using Load Module Analyzer, seeAppendix I, “z/OS Debugger Load Module Analyzer,” on page 547.
2. Convert your OS/VS COBOL source by using COBOL and CICS CommandLevel Conversion Aid (CCCA). For instructions on using CCCA, see COBOLand CICS Command Level Conversion Aid for OS/390 & MVS & VM User's Guide.
60 IBM z/OS Debugger V14.1.9 User's Guide

3. Compile the new source with either the Enterprise COBOL for z/OS andOS/390 or COBOL for OS/390 & VM.You can combine steps 2 and 3 by using the Convert and Compile option ofIBM z/OS Debugger Utilities.
4. Debug the object module by using z/OS Debugger.
After you convert and debug your program, you can do one of the followingoptions:v Continue to use the OS/VS COBOL compiler. Every time you want to debug
your program, you need to do the steps described in this section.v Use the new source that was produced by the steps described in this section.
You can compile the source and debug it without repeating the steps describedin this section.
CCCA can use any level of COBOL source program as input, including VS COBOLII, COBOL for MVS & VM, and COBOL for OS/390 & VM programs that werepreviously compiled with the CMPR2 compiler option.
Creating deferred breakpoints for COBOL and PL/I programsCreating a list of breakpoints before starting the z/OS Debugger session reducessystem resource usage and the time spent in the debugging session.
To create and use the deferred breakpoints, complete the following steps:v Create breakpoints and save the definitions in a file-based repository using the
Create breakpoints option in the z/OS Debugger Deferred Breakpoints selectionin DTU. You can also use IBM Fault Analyzer to create breakpoints. See IBMFault Analyzer User's Guide and Reference for details.
v View the breakpoints in the repository and save the definitions in a commandsfile in the z/OS Debugger command format using the View breakpoints optionin the z/OS Debugger Deferred Breakpoints selection in DTU.
v Set the breakpoints that are defined in the commands file during the debugsession by using one of the methods where the commands file is accepted like acommands file, a preference file, or a USE command.
The breakpoint types supported are AT STATEMENT and AT LABEL.
The following programming languages and side file configurations are supported:
Table 14. The supported programming languages and side file configurations
Programming language Side file Compiled with
Enterprise COBOL V4 orearlier
LANGX NOTEST
Enterprise COBOL V4 orearlier
SYSDEBUG TEST (SEPARATE)
Enterprise COBOL V5 Program Object TEST (SOURCE)
Enterprise PL/I SYSDEBUG TEST (SYM,SEPARATE)
Chapter 4. Planning your debug session 61

62 IBM z/OS Debugger V14.1.9 User's Guide

Chapter 5. Updating your processes so you can debugprograms with z/OS Debugger
After you have completed the tasks in Chapter 4, “Planning your debug session,”on page 25, you can use the information you have collected to update thefollowing processes:v Your compilation and linking processes so that programs are compiled with the
correct compiler options and suboptions and that the required files are saved(for example, the separate debug file).
v Your library or promotion processes so that files containing information thatz/OS Debugger needs to debug your programs are available.
v Your libraries or security systems so that you have access to the files that z/OSDebugger needs to debug your programs. For example, if you have RACFsecurity measures, you might need to update them so that z/OS Debugger canaccess the files it needs.
For more information about how to update these processes, see the followingtopics:v “Update your compilation, assembly, and linking process”v “Update your library and promotion process” on page 68v “Make the modifications necessary to implement your preferred method of
starting z/OS Debugger” on page 69
Update your compilation, assembly, and linking processThis topic describes the changes you must make to your compilation, assembly,and linking process to implement the choices you made in Chapter 4, “Planningyour debug session,” on page 25. If you are familiar with managing JCL and withyour site's compilation or assembly process, see “Compiling your program withoutusing IBM z/OS Debugger Utilities” for instructions on the specific changes youneed to make. If your site uses IBM z/OS Debugger Utilities to manage theseprocesses, see “Compiling your program by using IBM z/OS Debugger Utilities”on page 65 for instructions on how to use the Program Preparation option toupdate these processes.
Compiling your program without using IBM z/OS DebuggerUtilities
Create or modify JCL so that it includes all the statements you need to compile orassemble your programs, then properly link any libraries. The following listdescribes the changes you need to make:v Specify the correct compiler options and suboptions that you chose from Table 7
on page 26.For each compiler, there might be additional updates you might need to make sothat z/OS Debugger starts. The following list describes these updates:– If you are compiling an Enterprise PL/I program on an HFS or zFS file
system, see “Compiling a Enterprise PL/I program on an HFS or zFS filesystem” on page 66.
– If you are compiling a C program on an HFS or zFS file system, see“Compiling a C program on an HFS or zFS file system” on page 67.
© Copyright IBM Corp. 1992, 2019 63

– If you are compiling a C program with c89 or c++, see “Compiling your Cprogram with c89 or c++” on page 67.
– If you are compiling a C++ program on an HFS or zFS file system, see“Compiling a C++ program on an HFS or zFS file system” on page 68.
v Specify the statements to save the files that z/OS Debugger needs. Table 15 canhelp you identify which file you need to save for a particular compiler option.For example, if you are compiling a COBOL program with the SEPARATEsuboption of the TEST compiler option, make sure you specify the DD statementwith the name of the separate debug file.
v If you are using other IBM Application Delivery Foundation for z Systems tools,see IBM Application Delivery Foundation for z Systems Common ComponentsCustomization Guide and User Guide that correspond to the compilers or assemblerthat you are using. Those topics contain instructions on other updates you mustmake to your compilation, assembler, and linking processes.
v If YES is specified for the EQAOPT MDBG command (which requires z/OSDebugger to search for a .dbg file in a .mdbg file)6, verify that the .mdbg file is anon-temporary file and is available during the debug session. Ensure that the.mdbg file was created with captured source by using the -c option for the dbgldcommand or the CAPSRC option on the CDADBGLD utility.
v For LangX COBOL programs, write JCL that generates the EQALANGX file, asdescribed in “Creating the EQALANGX file for LangX COBOL programs” onpage 74.
v For assembler programs, write a SYSADATA DD statement that generates theEQALANGX files, as described in “Creating the EQALANGX file for anassembler program” on page 78.
v For DB2 programs, specify the correct DB2 preprocessor and coprocessor, asdescribed in “Processing SQL statements” on page 81.
Table 15. Files that you need to save when compiling with a particular compiler option or suboption
Programminglanguage
Compiler suboption orassembler option File you need to save
COBOL
SEPARATE separate debug file
any other listing7
NOTEST listing7
LangX COBOL
“Compiling your OS/VS COBOLprogram” on page 73
“Compiling your VS COBOL IIprogram” on page 74
“Compiling your EnterpriseCOBOL program” on page 74
EQALANGX
any other listing file containing pseudo-assembler code
PL/I
SEPARATE separate debug file
6. In situations where you can specify environment variables, you can set the environment variable EQA_USE_MDBG to YES orNO, which overrides any setting (including the default setting) of the EQAOPTS MDBG command.
7. It is except for Enterprise COBOL for z/OS Version 5.
64 IBM z/OS Debugger V14.1.9 User's Guide

Table 15. Files that you need to save when compiling with a particular compiler option or suboption (continued)
Programminglanguage
Compiler suboption orassembler option File you need to save
any other (pre-Enterprise PL/I) listing file
any other (Enterprise PL/I) source file that was used as input to the compiler
NOTEST listing file containing pseudo-assembler code
C/C++
DEBUG(DWARF) the .dbg file and source file
If you are using an .mdbg file that stores the source file, thensave that .mdbg file.
TEST source file that was used as input to the compiler
NOTEST listing file containing pseudo-assembler code
assembler
ADATA EQALANGX
no debug information saved listing file containing pseudo-assembler code
After you complete this task, see “Update your library and promotion process” onpage 68.
Compiling your program by using IBM z/OS Debugger Utilities
Note: This section is not applicable to IBM Developer for z Systems(non-Enterprise Edition), IBM Z Open Development, or IBM Z Open Unit Test.
z/OS Debugger Utilities provides several utilities than can help you compile yourprograms and start z/OS Debugger. The steps described in this topic apply to thefollowing category of compilers and assemblers:v Enterprise PL/Iv Enterprise COBOLv C/C++v Assembler
If you are using IBM z/OS Debugger Utilities to prepare your program and startz/OS Debugger, read Appendix C, “Examples: Preparing programs and modifyingsetup files with IBM z/OS Debugger Utilities,” on page 459, which describes howto prepare a sample program and start z/OS Debugger by using IBM z/OSDebugger Utilities. After you read the sample and understand how to use IBMz/OS Debugger Utilities, do the following steps:1. Start IBM z/OS Debugger Utilities.2. Type in "1" to select Program Preparation, then press Enter.3. Type in the number that corresponds to the compiler you want to use, then
press Enter.4. Type in the information about the program you are compiling and select the
appropriate options for the CICS and DB2/SQL fields.If the program source is a sequential data set and the DB2 precompiler isselected, make sure the DBRMLIB data set field in panel EQAPPC1B, EQAPPC2B,EQAPPC3B, EQAPPC4B, or EQAPPC5B is a partitioned data set with a membername. For example, DEBUG.TEST.DBRMLIB(PROG1).
Chapter 5. Updating your processes so you can debug programs with z/OS Debugger 65
Type in the backslash character ("/") in the Enter / to edit options and dataset name patterns field, then press Enter.
5. Using the information you collected in Table 7 on page 26, fill out the fieldswith the appropriate values. After you have made all the changes you want tomake, press PF3 to save this information and return to the previous panel.
6. Review the choices you made. Press Enter.7. Verify your selections, then press Enter.8. After the compilation is done, a panel is displayed. If there were errors in the
compilation, review the messages and make any changes. Return to step 1 torepeat the compilation.
9. Press PF3 until you return to the Program Preparation panel.10. In the Program Preparation panel, type in "L", then press Enter.11. In the Link Edit panel, specify whether you want the link edit to run in the
foreground or background. Specify the name of other libraries you need tolink to your program. After you are done making all your changes, pressEnter.
12. Verify any selections, then press Enter.13. After the link edit is done, if there were errors in the link edit, review the
messages and make any changes. Return to step 1 to repeat the process.14. Press PF3 until you return to the main IBM z/OS Debugger Utilities panel.
After you complete this task, see “Update your library and promotion process” onpage 68.
Compiling a Enterprise PL/I program on an HFS or zFS filesystem
If you are compiling and launching Enterprise PL/I programs on an HFS or zFSfile system, you must do one of the following:v Compile and launch the programs from the same location, orv specify the full path name when you compile the programs.
By default, the Enterprise PL/I compiler stores the relative path and file names inthe object file. When you start a debug session, if the source is not in the samelocation as where the program is launched, z/OS Debugger does not locate thesource. To avoid this problem, specify the full path name for the source when youcompile the program. For example, if you execute the following series ofcommands, z/OS Debugger does not find the source because it is located inanother directory (/u/myid/mypgm):1. Change to the directory where your program resides and compile the program.
cd /u/myid/mypgmpli -g "//TEST.LOAD(HELLO)" hello.pli
2. Exit UNIX System Services and return to the TSO READY prompt.3. Launch the program with the TEST run-time option.
call TEST.LOAD(HELLO) ’test/’
z/OS Debugger does find the source if you change the compile command to:pli -g "//TEST.LOAD(HELLO)" /u/myid/mypgm/hello.pli
The same restriction applies to programs that you compile to run in a CICSenvironment.
66 IBM z/OS Debugger V14.1.9 User's Guide

Compiling your C program with c89 or c++If you build your application using the c89 or c++, do the following steps:1. Compile your source code as usual, but specify the –g option to generate
debugging information. The –g option is equivalent to the TEST compiler optionunder TSO or MVS batch. For example, to compile the C source file fred.cfrom the u/mike/app directory, specify:cd /u/mike/appc89 –g –o "//PROJ.LOAD(FRED)" fred.c
Note: The quotation marks (") in the command line above are required.2. Set up your TSO environment, as described in “Compiling your program
without using IBM z/OS Debugger Utilities” on page 63 or “Compiling yourprogram by using IBM z/OS Debugger Utilities” on page 65.
3. Debug the program under TSO by entering the following:FRED TEST ENVAR(’PWD=/u/mike/app’) / asis
Note: The apostrophes (') in the command line above are required.ENVAR(’PWD=/u/mike/app’) sets the environment variable PWD to the path fromwhere the source files were compiled. z/OS Debugger uses this information todetermine from where it should read the source files.
If you are creating .mdbg files, capture the source files into the .mdbg file byspecify the -c option with the dbgld command, or the CAPSRC option with theCDADBGLD utility. To learn how to use the dbgld command and the CDADBGLDutility, see z/OS XL C/C++ User's Guide. z/OS Debugger needs access to the .mdbgfile to debug your program.
Compiling a C program on an HFS or zFS file systemIf you are compiling and launching programs on an HFS or zFS file system, youmust do one of the following:v Compile and launch the programs from the same location.v Specify the full path name when you compile the programs.
By default, the C compiler stores the relative path and file names of the source filesin the object file. When you start a debug session, if the source is not in the samelocation as where the program is launched, z/OS Debugger does not find thesource. To avoid this problem, specify the full path name of the source when youcompile the program. For example, if you execute the following series ofcommands, z/OS Debugger does not find the source because it is located inanother directory (/u/myid/mypgm):1. Change to the directory where your program resides and compile the program.
cd /u/myid/mypgmc89 -g -o "//TEST.LOAD(HELLO)" hello.c
2. Exit UNIX System Services and return to the TSO READY prompt.3. Launch the program with the TEST run-time option.
call TEST.LOAD(HELLO) ’test/’
z/OS Debugger finds the source if you change the compile command to:c89 -g -o "//TEST.LOAD(HELLO)" /u/myid/mypgm/hello.c
The same restriction applies to programs that you compile to run in a CICSenvironment.
Chapter 5. Updating your processes so you can debug programs with z/OS Debugger 67

If you are creating .mdbg files, capture the source files into the .mdbg file byspecify the -c option with the dbgld command, or the CAPSRC option with theCDADBGLD utility. To learn how to use the dbgld command and the CDADBGLDutility, see z/OS XL C/C++ User's Guide. z/OS Debugger needs access to the .mdbgfile to debug your program.
Compiling a C++ program on an HFS or zFS file systemIf you are compiling and launching programs on an HFS or zFS file system, youmust do one of the following:v Compile and launch the programs from the same location, orv specify the full path name when you compile the programs.
By default, the C++ compiler stores the relative path and file names of the sourcefiles in the object file. When you start a debug session, if the source is not in thesame location as where the program is launched, z/OS Debugger does not locatethe source. To avoid this problem, specify the full path name of the source whenyou compile the program. For example, if you execute the following series ofcommands, z/OS Debugger does not find the source because it is located inanother directory (/u/myid/mypgm):1. Change to the directory where your program resides and compile the program.
cd /u/myid/mypgmc++ -g -o "//TEST.LOAD(HELLO)" hello.cpp
2. Exit UNIX System Services and return to the TSO READY prompt.3. Launch the program with the TEST run-time option.
call TEST.LOAD(HELLO) ’test/’
z/OS Debugger finds the source if you change the compile command to:c++ -g -o "//TEST.LOAD(HELLO)" /u/myid/mypgm/hello.cpp
The same restriction applies to programs that you compile to run in a CICSenvironment.
If you are creating .mdbg files, capture the source files into the .mdbg file byspecify the -c option with the dbgld command, or the CAPSRC option with theCDADBGLD utility. To learn how to use the dbgld command and the CDADBGLDutility, see z/OS XL C/C++ User's Guide. z/OS Debugger needs access to the .mdbgfile to debug your program.
Update your library and promotion processIf you use a library to maintain your program and a promotion process to moveprograms through levels of quality and testing, you might have to update theseprocesses to ensure that z/OS Debugger can find the files it needs to obtaininformation about your programs. For example, if your final production level doesnot have access to the same libraries as your development level, and you want tobe able to debug programs that are in the final product level, you might need toupdate the environment in your final production level so that it can access to thefollowing resources:v All the data sets required to debug your program, for example, the source file,
listing file, separate debug file, or EQALANGX file.v Access to all the libraries required by your program or z/OS Debugger.
68 IBM z/OS Debugger V14.1.9 User's Guide

If you are using other IBM Application Delivery Foundation for z Systems tools,see IBM Application Delivery Foundation for z Systems Common ComponentsCustomization Guide and User Guide that correspond to the compilers or assemblerthat you are using. Those topics give instructions on which files to move throughyour levels so that the IBM Application Delivery Foundation for z Systems toolscan find the files they need.
If you manage your source code with a library system that requires you specify theSUBSYS=ssss parameter when you allocate a data set, you or your site need tospecify the EQAOPTS SUBSYS command, which provides the value for ssss. Youmust do this for the following types of programs:v Enterprise PL/I program that was compiled without the SEPARATE suboption of
TEST compiler optionv C/C++ programs
This support is not available for CICS programs. To learn how to specifyEQAOPTS commands, see the IBM z/OS Debugger Reference and Messages or theIBM z/OS Debugger Customization Guide.
Make the modifications necessary to implement your preferred methodof starting z/OS Debugger
In this topic, you will use the information you gathered after completing 2 inChapter 4, “Planning your debug session,” on page 25and “Choosing a method ormethods for starting z/OS Debugger” on page 57 to write the TEST runtimeoptions string, then save that string in the appropriate location.
You might have to write several different TEST runtime options strings. Forexample, the TEST runtime options string that you write for your CICS programsmight not be the same TEST runtime options string you can use for your IMSprograms. For this situation, you might want to use Table 16 to record the stringyou want to use for each type of program you are debugging.
Table 16. Record the TEST runtime options strings you need for your site
Test runtime options string (for example, TEST(ALL,,,MFI%SYSTEM01.TRMLU001:))
TSO
JES batch
UNIX SystemServices
CICS
DB2
DB2 storedprocedures(PROGRAMTYPE=MAIN)
Chapter 5. Updating your processes so you can debug programs with z/OS Debugger 69

Table 16. Record the TEST runtime options strings you need for your site (continued)
Test runtime options string (for example, TEST(ALL,,,MFI%SYSTEM01.TRMLU001:))
DB2 storedprocedures(PROGRAMTYPE=SUB)
IMS TM
IMS batch
IMS BTS
If you are not familiar with the format of the TEST runtime option string, see thefollowing topics:v Description of the TEST runtime option in IBM z/OS Debugger Reference and
Messages
v Chapter 13, “Writing the TEST run-time option string,” on page 121
After you have written the TEST runtime option strings, you need to save them inthe appropriate location. Using the information you recorded in Table 13 on page57, review the following list, which directs you to the instructions on where andhow to save the TEST runtime options strings:
Through the EQAD3CXT user exit routineSee Chapter 12, “Specifying the TEST runtime options through the LanguageEnvironment user exit,” on page 109.
Through the DFSBXITA user exit routineSee “Setting up the DFSBXITA user exit routine” on page 106.
Using the CADP transactionSee “Creating and storing debugging profiles with CADP” on page 101.
Using the DTCN transactionSee “Creating and storing a DTCN profile” on page 90.
Using the DB2 catalogSee Chapter 9, “Preparing a DB2 stored procedures program,” on page 85.
By coding a call to CEETEST, __ctest(), or PLITESTSee one of the following topics:v “Starting z/OS Debugger with CEETEST” on page 131v “Starting z/OS Debugger with the __ctest() function” on page 139v “Starting z/OS Debugger with PLITEST” on page 138
Through CEEUOPT or CEEROPTSee one of the following topics:v “Starting z/OS Debugger under CICS by using CEEUOPT” on page 154v “Linking DB2 programs for debugging” on page 83v “Starting z/OS Debugger under IMS by using CEEUOPT or CEEROPT” on
page 105
Using the CEEOPTS DD statement in JCL or CEEOPTS allocation in TSOUse the JCL for Batch Debugging option in IBM z/OS Debugger Utilities.
70 IBM z/OS Debugger V14.1.9 User's Guide

Using the parms on the EXEC statement when you start your programWhen you specify the EXEC statement, include the TEST runtime option as aparameter.
Use the parms on the RUN statement when you start your programWhen you specify the RUN statement, include the TEST runtime option as aparameter.
Using the parms on the CALL statement when you start your programSee the example in “Starting z/OS Debugger” on page 12.
Through the EQASET transactionSee “Running the EQASET transaction for non-Language Environment IMSMPPs” on page 378.
Through the EQANMDBG programSee “Starting z/OS Debugger for programs that start outside of LanguageEnvironment” on page 147.
Chapter 5. Updating your processes so you can debug programs with z/OS Debugger 71

72 IBM z/OS Debugger V14.1.9 User's Guide
Chapter 6. Preparing a LangX COBOL program
Note: This chapter is not applicable to IBM Z Open Development or IBM Z OpenUnit Test .
This chapter describes how to prepare a LangX COBOL program that you candebug with z/OS Debugger.
The term LangX COBOL refers to any of the following programs:v A program compiled with the IBM OS/VS COBOL compiler.v A program compiled with the IBM VS COBOL II compiler with the NOTEST
compiler option.v A program compiled with the IBM Enterprise COBOL for z/OS Version 3 or
Version 4 compiler with the NOTEST compiler option.
To prepare a LangX COBOL program, you must do the following steps:1. Compile your program with the IBM OS/VS COBOL, the IBM VS COBOL II, or
the IBM Enterprise COBOL compiler using the proper options.2. Create the EQALANGX file.3. Link-edit your program.
As you read through the information in this document, remember that OS/VSCOBOL programs are non-Language Environment programs, even though youmight have used Language Environment libraries to link and run your program.
VS COBOL II programs are non-Language Environment programs when you linkthem with the non-Language Environment library. VS COBOL II programs areLanguage Environment programs when you link them with the LanguageEnvironment library.
Enterprise COBOL programs are always Language Environment programs. Notethat COBOL DLL's cannot be debugged as LangX COBOL programs.
Read the information regarding non-Language Environment programs forinstructions on how to start z/OS Debugger and debug non-LanguageEnvironment COBOL programs, unless information specific to LangX COBOL isprovided.
Compiling your OS/VS COBOL programYou must compile your OS/VS COBOL program with the IBM OS/VS COBOLcompiler and use the following options:v NOTESTv SOURCEv DMAPv PMAPv VERBv XREFv NOLSTv NOBATCH
© Copyright IBM Corp. 1992, 2019 73

v NOSYMDMPv NOCOUNT
If you are using other IBM Application Delivery Foundation for z Systems tools(for example, Application Performance Analyzer), you might need to specifyadditional compiler options. To understand how the IBM Application DeliveryFoundation for z Systems tools work together, see IBM Application DeliveryFoundation for z Systems Common Components Customization Guide and User Guide. Tolearn which additional compiler options you might need to specify, see IBMApplication Delivery Foundation for z Systems Common Components CustomizationGuide and User Guide.
Compiling your VS COBOL II programYou must compile your VS COBOL II program with the IBM VS COBOL IIcompiler and use the following options:v NOTESTv NOOPTIMIZEv SOURCEv MAPv XREFv LIST or OFFSET
If you are using other IBM Application Delivery Foundation for z Systems tools(for example, Application Performance Analyzer), you might need to specifyadditional compiler options. To understand how the IBM Application DeliveryFoundation for z Systems tools work together, see IBM Application DeliveryFoundation for z Systems Common Components Customization Guide and User Guide. Tolearn which additional compiler options you might need to specify, see IBMApplication Delivery Foundation for z Systems Common Components CustomizationGuide and User Guide.
Compiling your Enterprise COBOL programYou must compile your Enterprise COBOL program with the IBM EnterpriseCOBOL compiler and use the following options:v NOTESTv NOOPTIMIZEv SOURCEv MAPv XREFv LIST
Creating the EQALANGX file for LangX COBOL programs
Note: The EQALANGX program is part of IBM Application Delivery Foundationfor z Systems Common Components, which is not shipped with IBM Z OpenDevelopment or IBM Z Open Unit Test.
Use the EQALANGX program to create the EQALANGX file. The EQALANGXprogram is an alias of IPVLANGX, which is shipped as part of the ADFz CommonComponents. It is in IPV.SIPVMODA. It is the same as the IDILANGX alias that
74 IBM z/OS Debugger V14.1.9 User's Guide

Fault Analyzer uses and the CAZLANGX alias that Application PerformanceAnalyzer uses. The module names can be used interchangeably.
For further information about the xxxLANGX program, look for IDILANGX in theFault Analyzer User's Guide and Reference. For return codes and messages, look forIPVLANGX in the IBM Application Delivery Foundation for z Systems CommonComponents Customization Guide and User Guide.
To create the EQALANGX file, do the following steps:1. Create JCL similar to the following:
//XTRACT EXEC PGM=EQALANGX,REGION=32M,// PARM=’(COBOL ERROR LOUD’//STEPLIB DD DISP=SHR,DSN=IPV.SIPVMODA//LISTING DD DISP=SHR,DSN=yourid.langxcompiler.listing//IDILANGX DD DISP=OLD,DSN=yourid.EQALANGX
The following list describes the variables used in this example and theparameters you can use with the EQALANGX program:
PARM=
COBOLThe COBOL parameter indicates that a LangX COBOL module is beingprocessed.
ERRORThe ERROR parameter is suggested, but optional. If you specify it,additional information is displayed when an error is detected.
LOUDThe LOUD parameter is suggested, but optional. If you specify it,additional informational and statistical messages are displayed.
64K CREFThe 64K and CREF parameters are optional. Previously, these optionswere required.
The messages displayed by specifying the ERROR and LOUD parametersare Write To Operator or Write To Programmer (WTO or WTP) messages.See the IBM Application Delivery Foundation for z Systems CommonComponents Customization Guide and User Guide for detailed informationabout the messages and return codes displayed by the IPVLANGXprogram.
IPV.SIPVMODAThe name of the data set that contains the ADFz Common Componentsload modules. If the ADFz Common Components load modules are in asystem linklib data set, you can omit the following line://STEPLIB DD DISP=SHR,DSN=IPV.SIPVMODA
yourid.langxcompiler.listingThe name of the listing data set generated by the IBM OS/VS COBOL, IBMVS COBOL II, or IBM Enterprise COBOL compiler. If this is a partitioneddata set, the member name must be specified. For information about thecharacteristics of this data set, see IBM OS/VS COBOL Compiler and LibraryProgrammer's Guide, VS COBOL II Application Programming Guide for MVSand CMS, or Enterprise COBOL for z/OS Programming Guide.
yourid.EQALANGXThe name of the data set where the EQALANGX debug file is to be placed.
Chapter 6. Preparing a LangX COBOL program 75

This data set must have variable block record format (RECFM=VB) and alogical record length of 1562 (LRECL=1562).
z/OS Debugger searches for the EQALANGX debug file in a partitioneddata set with the name yourid.EQALANGX and a member name thatmatches the name of the program. If you want the member name of theEQALANGX debug file to match the name of the program, you do notneed to specify a member name on the DD statement.
2. Submit the JCL and verify that the EQALANGX file is created in the locationyou specified on the IDILANGX DD statement.
Link-editing your programYou can link-edit your program by using your normal link-edit procedures.
After you link-edit your program, you can run your program and start z/OSDebugger.
76 IBM z/OS Debugger V14.1.9 User's Guide

Chapter 7. Preparing an assembler program
This chapter describes how to prepare an assembler program that you can debugwith the full capabilities of z/OS Debugger. To prepare an assembler program, youmust do the following steps:1. Assemble your program with the proper options.2. Create the EQALANGX file.3. Link-edit your program.
If you use IBM z/OS Debugger Utilities to prepare your assembler program, youcan do steps 1 and 2 in one step.
Before you assemble your programWhen you debug an assembler program, you can use most of the z/OS Debuggercommands. There are three differences between debugging an assembler programand debugging programs written in other programming languages supported byz/OS Debugger:v After you assemble your program, you must create a debug information file,
also called the EQALANGX file. z/OS Debugger uses this file to obtain informationabout your assembler program.
v z/OS Debugger assumes all compile units are written in some high-levellanguage (HLL). You must inform z/OS Debugger that a compile unit is anassembler compile unit and instruct z/OS Debugger to load the assemblercompile unit's debug information. Do this by entering the LOADDEBUGDATA (or LDD)command.
v Assembler does not have language elements you can use to write expressions.z/OS Debugger provides assembler-like language elements you can use to writeexpressions for z/OS Debugger commands that require an expression. See IBMz/OS Debugger Reference and Messages for a description of the syntax of theassembler-like language.
After you verify that your assembler program meets these requirements, prepareyour assembler program by doing the following tasks:1. “Assembling your program.”2. “Creating the EQALANGX file for an assembler program” on page 78.
“Assembling your program and creating EQALANGX” on page 79 describes howto prepare an assembler program by using IBM z/OS Debugger Utilities.
Assembling your programIf you assemble your program without using IBM z/OS Debugger Utilities, youmust use the High Level Assembler (HLASM) and specify a SYSADATA DDstatement and the ADATA option. This causes the assembler to create aSYSADATA file. The SYSADATA file is required to generate the debug information(the EQALANGX file) used by z/OS Debugger.
If you are using other IBM Application Delivery Foundation for z Systems tools,see IBM Application Delivery Foundation for z Systems Common Components
© Copyright IBM Corp. 1992, 2019 77

Customization Guide and User Guide to make sure you specify all the assembleroptions you need to create the files needed by all the IBM Application DeliveryFoundation for z Systems tools.
Creating the EQALANGX file for an assembler program
Note: The EQALANGX program is part of IBM Application Delivery Foundationfor z Systems Common Components, which is not shipped with IBM Z OpenDevelopment or IBM Z Open Unit Test.
Use the EQALANGX program to create the EQALANGX file. The EQALANGXprogram is an alias of IPVLANGX, which is shipped as part of the ADFz CommonComponents. It is in IPV.SIPVMODA. It is the same as the IDILANGX alias thatFault Analyzer uses and the CAZLANGX alias that Application PerformanceAnalyzer uses. The module names can be used interchangeably.
For further information about the xxxLANGX program, look for IDILANGX in theFault Analyzer User's Guide and Reference. For return codes and messages, look forIPVLANGX in the IBM Application Delivery Foundation for z Systems CommonComponents Customization Guide and User Guide.
To create the EQALANGX files without using IBM z/OS Debugger Utilities, useJCL similar to the following://XTRACT EXEC PGM=EQALANGX,REGION=32M,// PARM=’(ASM ERROR LOUD’//STEPLIB DD DISP=SHR,DSN=IPV.SIPVMODA//SYSADATA DD DISP=SHR,DSN=yourid.sysadata//IDILANGX DD DISP=OLD,DSN=yourid.EQALANGX
The following list describes the variables used in this example the parameters youcan use with the EQALANGX program:
PARM=
(ASMIndicates that an assembler module is being processed.
ERRORThis parameter is suggested but optional. If you specify it, additionalinformation is displayed when an error is detected.
LOUDThe LOUD parameter is suggested, but optional. If you specify it,additional informational and statistical messages are displayed.
The messages displayed by specifying the ERROR and LOUD parameters areWrite To Operator or Write To Programmer (WTO or WTP) messages. See theIBM Application Delivery Foundation for z Systems Common ComponentsCustomization Guide and User Guide for detailed information about the messagesand return codes displayed by the IPVLANGX program.
IPV.SIPVMODAThe name of the data set that contains the ADFz Common Components loadmodules. If the ADFz Common Components load modules are in a systemlinklib data set, you can omit the following line://STEPLIB DD DISP=SHR,DSN=IPV.SIPVMODA
yourid.sysadataThe name of the data set containing the SYSADATA output from the assembler.
78 IBM z/OS Debugger V14.1.9 User's Guide

If this is a partitioned data set, the member name must be specified. Forinformation about the characteristics of this data set, see HLASM Programmer'sGuide.
yourid.EQALANGXThe name of the data set where the EQALANGX debug file is to be placed.This data set must have variable block record format (RECFM=VB) and a logicalrecord length of 1562 (LRECL=1562).
z/OS Debugger searches for the EQALANGX debug file in a partitioned dataset with the name yourid.EQALANGX and a member name that matches thename of the first CSECT in the assembly. If you want the member name of theEQALANGX debug file to match the first CSECT in the assembly, you do notneed to specify a member name on the DD statement. Otherwise, you mustspecify a member name on the DD statement. In this case, you must use theSET SOURCE command to direct z/OS Debugger to the member containing theEQALANGX data.
z/OS Debugger does not support debugging of Private Code (unnamedCSECT).
Assembling your program and creating EQALANGX
Note: This section is not applicable to IBM Developer for z Systems(non-Enterprise Edition), IBM Z Open Development, or IBM Z Open Unit Test.
You can assemble your program and create the EQALANGX file at the same time byusing IBM z/OS Debugger Utilities. Do the following:1. Start IBM z/OS Debugger Utilities. The IBM z/OS Debugger Utilities panel is
displayed.2. Select option 1, "Program Preparation" . The z/OS Debugger Program
Preparation panel is displayed.3. Select option 5, "Assemble". The z/OS Debugger Program Preparation - High
Level Assembler panel is displayed. In this panel, specify the name of thesource file and the assemble options that are used by High Level Assembler(HLASM) to assemble the program.If option 5 is not available, contact your system administrator.
4. Press Enter. The High Level Assembler - Verify Selections panel isdisplayed. Verify that the information on the panel is correct and then pressEnter.
5. If any of the output data sets you specified do not existed, you are asked toverify the options used to create them.
6. If you specified that the processing be completed by batch, the JCL created torun the batch job is displayed. Verify that the JCL is correct, type Submit in thecommand line, press Enter and then press PF3.
7. After the processing is completed, the High Level Assembler - View Outputspanel is displayed. This panel displays the return code of each processcompleted and enables you to view, edit, or browse the input and output datasets.
To read more information about a field in any panel, place the cursor in the inputfield and press PF1. To read more information about a panel, place the cursoranywhere on the panel that is not an input field and press PF1.
Chapter 7. Preparing an assembler program 79

After you assemble your program and create the EQALANGX file, you can link-edityour program.
Link-editing your programYou can link-edit your program by using your normal link-edit procedures or youcan use IBM z/OS Debugger Utilities by doing the following:
Note: z/OS Debugger Utilities is not available in IBM Developer for z Systems(non-Enterprise Edition), IBM Z Open Development or IBM Z Open Unit Test.1. From the z/OS Debugger Program Preparation panel, select option L, "Link
Edit". The z/OS Debugger Program Preparation - Link Edit panel is displayed.In this panel, specify the input data sets and link edit options that you need thelinker to use.
2. Press Enter. The Link Edit - Verify Selections panel is displayed. Verify thatthe information on the panel is correct and then press Enter.
3. If any of the output data sets you specified do not exist, you are asked to verifythe options used to create them. Press Enter after you verify the options.
4. If you specified that the processing be completed by batch, the JCL created torun the batch job is displayed. Verify that the JCL is correct and press PF3.
5. After the processing is completed, the Link Edit - View Outputs panel isdisplayed. This panel displays the return code of each process completed andenables you to view, edit, or browse the input and output data sets.
To read more information about a field in any panel, place the cursor in the inputfield and press PF1. To read more information about a panel, place the cursoranywhere on the panel that is not an input field and press PF1.
After you link-edit your program, you can run your program and start z/OSDebugger.
Restrictions for link-editing your assembler programz/OS Debugger cannot find the EQALANGX member when you change the namewith a CHANGE link statement. For example, the message “EQALANGX debugfile cannot be found for PGM1TEST” is displayed when you use the following linkstatements:CHANGE PGMTEST1(PGM1TEST)INCLUDE LINKLIB(PGMTEST1)
80 IBM z/OS Debugger V14.1.9 User's Guide

Chapter 8. Preparing a DB2 program
You do not need to use any special coding techniques to debug DB2 programswith z/OS Debugger.
The following sections describe the tasks you need to do to prepare a DB2program for debugging:1. “Processing SQL statements.”2. “Linking DB2 programs for debugging” on page 83.3. “Binding DB2 programs for debugging” on page 84.
Refer to the following topics for more information related to the material discussedin this topic.
Related referencesDB2 UDB for z/OS Application Programming and SQL Guide
Processing SQL statementsYou must run your program through the DB2 preprocessor or coprocessor, whichprocesses SQL statements, either before or as part of the compilation. In thissection, we describe how and when each compiler uses the DB2 preprocessor orcoprocessor. Then you can choose the right method so that you can debug theprogram with z/OS Debugger.v If you are preparing a COBOL program using a compiler earlier than Enterprise
COBOL for z/OS and OS/390 Version 2 Release 2 , use the DB2 precompiler.Then compile your program as described in the appropriate section for yourprogramming language.
v If you are preparing a COBOL program using Enterprise COBOL for z/OS andOS/390 Version 2 Release 2 or later, do one of the following tasks:– Use the DB2 precompiler. Then compile your program as described in the
appropriate section for your programming language.– Use the SQL compiler option so that the SQL statements are processed by the
DB2 coprocessor during compilation. Save the program listing if youcompiled with the NOSEPARATE suboption of the TEST compiler option or theseparate debug file if you compiled with the SEPARATE suboption of the TESTcompiler option.
v If you are preparing a PL/I program using a compiler earlier than EnterprisePL/I for z/OS and OS/390 Version 3 Release 1, use the DB2 precompiler. Thencompile your program as described in the appropriate section for yourprogramming language.
v The following table describes your options for specific PL/I compilers.
© Copyright IBM Corp. 1992, 2019 81

If you are using any of the following PL/Icompilers: Choose one of the following tasks:
v Enterprise PL/I for z/OS and OS/390Version 3 Release 1 through Version 3Release 4
v Enterprise PL/I for z/OS, Version 3.5 orlater, and you do not specify the SEPARATEsuboption of the TEST compiler option
v Use the DB2 precompiler. Save theprogram source files generated by theDB2 precompiler, which z/OS Debuggeruses to debug your program. Thencompile your program as described in theappropriate section for your programminglanguage.
v Use the PP(SQL:('option,...')) compileroption so that the SQL statements areprocessed by the DB2 coprocessor duringcompilation. Save the program source filethat you used as input to the compiler.
v If you are preparing a program using Enterprise PL/I for z/OS, Version 3.5 orlater, and you specify the SEPARATE suboption of the TEST compiler option, doone of the following tasks:– Use the DB2 precompiler. Compile the program source files generated by the
DB2 precompiler with the appropriate compiler options, as described in“Choosing TEST or NOTEST compiler suboptions for PL/I programs” onpage 35, select scenario B. Save the separate debug file created by thecompiler.
– Use the PP(SQL:('option,...')) compiler option so that the SQL statements areprocessed by the DB2 coprocessor during compilation. Save the separatedebug file created by the compiler.
v If you are preparing a C or C++ program using a compiler earlier than C/C++for z/OS Version 1 Release 5, use the DB2 precompiler. Save the program sourcefiles generated by the DB2 precompiler, which z/OS Debugger uses to debugyour program. Then compile your program as described in the appropriatesection for your programming language.
v If you are preparing a C or C++ program using C/C++ for z/OS Version 1Release 5 or later, do one of the following tasks:– Use the DB2 precompiler. Save the program source files generated by the DB2
precompiler, which z/OS Debugger uses to debug your program. Thencompile your program as described in the appropriate section for yourprogramming language.
– Specify the SQL compiler option so that the SQL statements are processed bythe DB2 coprocessor during compilation. Save the program source file thatyou used as input to the compiler.
v If you are using an assembler program, first run your program through the DB2precompiler, then assemble your program using the output of the DB2precompiler. Generate a EQALANGX file from the assembler output and savethe EQALANGX file.
Important: Ensure that your program source, separate debug file, or programlisting is stored in a permanent data set that is available to z/OS Debugger.
To enhance the performance of z/OS Debugger, use a large block size when yousave these files. If you are using COBOL or Enterprise PL/I separate debug files, itis important that you allocate these files with the correct attributes to optimize theperformance of z/OS Debugger. Use the following attributes for the PDS thatcontains the COBOL or PL/I separate debug file:v RECFM=FB
82 IBM z/OS Debugger V14.1.9 User's Guide

v LRECL=1024v BLKSIZE set so the system determines the optimal size
Refer to the following topics for more information related to the material discussedin this topic.
Related referencesDB2 UDB for OS/390 Application Programming and SQL Guide
Linking DB2 programs for debuggingTo debug DB2 programs, you must link the output from the compiler into yourprogram load library. You can include the user runtime options module,CEEUOPT, by doing the following:1. Find the user runtime options program CEEUOPT in the Language
Environment SCEESAMP library.2. Change the NOTEST parameter into the desired TEST parameter. For example:
old: NOTEST=(ALL,*,PROMPT,INSPPREF),new: TEST=(,*,;,*),
If you are using remote debug mode, specify the TCPIP suboption, as in thefollowing example:TEST=(,,,TCPIP&&9.2404.79%8001:*)
Note: Double ampersand is required.If you are using full-screen mode using a dedicated terminal without TerminalInterface Manager, specify the MFI suboption with a VTAM LU name, as in thefollowing example:Test=(,,,MFI%TRMLU001)
If you are using full-screen mode using the Terminal Interface Manager, specifythe VTAM suboption with your user ID, as in the following example:Test=(,,,VTAM%USERABCD)
3. Assemble the CEEUOPT program and keep the object code.4. Link-edit the CEEUOPT object code with any program to start z/OS Debugger.
The modified assembler program, CEEUOPT, is shown below.*/****************************************************************/*/* LICENSED MATERIALS - PROPERTY OF IBM */*/* */*/* 5694-A01 */*/* */*/* (C) COPYRIGHT IBM CORP. 1991, 2001 */*/* */*/* US GOVERNMENT USERS RESTRICTED RIGHTS - USE, */*/* DUPLICATION OR DISCLOSURE RESTRICTED BY GSA ADP */*/* SCHEDULE CONTRACT WITH IBM CORP. */*/* */*/* STATUS = HLE7705 */*/****************************************************************/CEEUOPT CSECTCEEUOPT AMODE ANYCEEUOPT RMODE ANY
CEEXOPT TEST=(,*,;,*)END
Chapter 8. Preparing a DB2 program 83

The user runtime options program can be assembled with predefined TEST runtimeoptions to establish defaults for one or more applications. Link-editing anapplication with this program results in the default options when that applicationis started.
If your system programmer has not already done so, include all the properlibraries in the SYSLIB concatenation. For example, the ISPLOAD library forISPLINK calls, and the DB2 DSNLOAD library for the DB2 interface modules(DSNxxxx).
Refer to the following topics for more information related to the material discussedin this topic.
Related tasksChapter 15, “Starting z/OS Debugger from a program,” on page 131
Binding DB2 programs for debuggingBefore you can run your DB2 program, you must run a DB2 bind in order to bindyour program with the relevant DBRM output from the precompiler step. Nospecial requirements are needed for z/OS Debugger.
84 IBM z/OS Debugger V14.1.9 User's Guide

Chapter 9. Preparing a DB2 stored procedures program
This topic describes the information you need to collect and the steps you musttake to prepare a DB2 stored procedure for debugging with z/OS Debugger. z/OSDebugger can debug stored procedures where PROGRAM TYPE is MAIN or SUB;the preparation steps are the same.
Before you begin, verify that you can use the supported debugging modes. z/OSDebugger can debug stored procedures written in assembler, C, C++, COBOL andEnterprise PL/I in any of the following debugging modes:v remote debugv full-screen mode using the Terminal Interface Managerv batch
Review the topic “Creating a stored procedure” in the DB2 Application Programmingand SQL Guide to verify that your stored procedure complies with the format andrestrictions for external stored procedures. z/OS Debugger supports debuggingonly external stored procedures.
To prepare a DB2 stored procedure, do the following steps:1. Verify that your DB2 system administrator has completed the tasks described in
section Preparing your environment to debug a DB2 stored procedures" of IBMz/OS Debugger Customization Guide. The DB2 system administrator must definethe address space where the stored procedure runs, give DB2 programs theappropriate RACF read authorizations, and recycle the address space so thatthe updates take effect.
2. If you are not familiar with the parameters used to create the DB2 storedprocedure you want to debug, you can enter the SELECT statement, asillustrated in the following example, to obtain this information:SELECT PROGRAM_TYPE,STAYRESIDENT,RUNOPTS,LANGUAGE
FROM SYSIBM.SYSROUTINESWHERE NAME=’name_of_DB2_stored_procedure’;
3. For stored procedures of program type SUB that are not invoked by thecall_sub function, verify that when your system programmer or DB2 systemadministrator defines the WLM address space, the value for NUMTCB is set to1. NUMTCB specifies the maximum number of Task Control Blocks (TCBs) thatcan run concurrently in a WLM address space. If the stored procedure mightrun in a TCB other than the one it was started in, you will not able to debugthat stored procedure. Setting the value of NUMTCB to 1 ensures that thestored procedure is not run in a different TCB.
4. When you define your stored procedure, verify the following items:v Specify the correct value for the LANGUAGE parameter and the PROGRAM
TYPE parameter. For C, C++, COBOL or Enterprise PL/I, the PROGRAMTYPE can be either MAIN or SUB. For assembler, the PROGRAM TYPE mustbe MAIN.
v For stored procedures of program type SUB that are not invoked by thecall_sub function, determine if other users might run the stored procedurewhile you are debugging it. If other users might run the stored procedure,you can not debug it.
© Copyright IBM Corp. 1992, 2019 85
v For stored procedures of program type SUB that are invoked by the call_subfunction, review the following options:– If you plan to specify the TEST runtime options through the Language
Environment EQAD3CXT exit routine, specify STAY RESIDENT NO.– If you plan to specify the TEST runtime options through the DB2 catalog,
you can specify either YES or NO for STAY RESIDENT.5. Compile or assemble your program, as described in Part 2, “Preparing your
program for debugging,” on page 21. For Enterprise PL/I programs, alsospecify the RENT compiler option.
6. Review the following list to determine how to specify the TEST runtime options:v For stored procedures of program type MAIN, you can specify the TEST
runtime option either through the Language Environment EQAD3CXT exitroutine, or through the DB2 catalog. If you use both methods, the LanguageEnvironment EQAD3CXT exit routine take precedence over the DB2 catalog.
v For stored procedures of program type SUB that are invoked by the call_subfunction, you can specify the TEST runtime option either through theLanguage Environment EQAD3CXT exit routine or through the DB2 catalog.If you choose to use the Language Environment EQAD3CXT exit routine,you must specify the NOTEST runtime option for the RUN OPTIONS parameterwhen you define the stored procedure.
v For stored procedures of program type SUB that are not invoked by thecall_sub function, you can specify the TEST runtime option through the DB2catalog or from within a program by coding a call to CEETEST, __ctest(), orPLITEST.
7. To specify the TEST runtime options through the Language EnvironmentEQAD3CXT exit routine, prepare a copy of the EQAD3CXT user exit asdescribed in Chapter 12, “Specifying the TEST runtime options through theLanguage Environment user exit,” on page 109.Remember that if you want to debug an existing stored procedure of programtype SUB that is invoked by the call_sub function, you must modify the storedprocedure so that it uses the NOTEST runtime option for the RUN OPTIONSparameter. The following example shows how to use the ALTER PROCEDUREstatement to make this modification:ALTER PROCEDURE name_of_DB2_stored_procedure RUN OPTIONS ’NOTEST’;
8. To specify the TEST runtime options through the DB2 catalog, do the followingsteps:a. If you have not created the stored procedure, write the stored procedure
using the CREATE PROCEDURE statement. You can use the followingexample as a guide:CREATE PROCEDURE SPROC1
LANGUAGE COBOLEXTERNAL NAME SPROC1PARAMETER STYLE GENERALWLM ENVIRONMENT WLMENV1RUN OPTIONS ’TEST(,,,TCPIP&9.112.27.99%8001:*)’PROGRAM TYPE SUB;
This example creates a stored procedure for a COBOL program calledSPROC1, the program type is SUB, it runs in a WLM address space calledWLMENV1, and it is debugged in remote debug mode.
b. If you need to modify an existing stored procedure, use the ALTERPROCEDURE statement. You can use the following example as a guide:
86 IBM z/OS Debugger V14.1.9 User's Guide

The IP address for the remote debugger changed from 9.112.27.99 to9.112.27.21. To modify the stored procedure, enter the following statement:ALTER PROCEDURE name_of_DB2_stored_procedure
RUN OPTIONS ’TEST(,,,TCPIP&9.112.27.21%8001:*)’;
c. Verify that the stored procedure is defined correctly by entering the SELECTstatement. For example, you can enter the following SELECT statement:SELECT * FROM SYSIBM.SYSROUTINES;
Chapter 9. Preparing a DB2 stored procedures program 87

88 IBM z/OS Debugger V14.1.9 User's Guide

Chapter 10. Preparing a CICS program
To prepare a CICS program for debugging, you must do the following tasks:1. Complete the program preparation tasks for COBOL, PL/I, C, C++, assembler,
or LangX COBOL, as described in the following sections:“Choosing TEST or NOTEST compiler suboptions for COBOL programs” onpage 27“Choosing TEST or NOTEST compiler suboptions for PL/I programs” onpage 35“Choosing TEST or DEBUG compiler suboptions for C programs” on page41“Choosing TEST or DEBUG compiler suboptions for C++ programs” onpage 46Chapter 7, “Preparing an assembler program,” on page 77Chapter 6, “Preparing a LangX COBOL program,” on page 73
2. Determine if your site uses CADP or DTCN debugging profiles and verify thatyour system has been configured to use the chosen debugging profile.
3. Determine if you need to link edit EQADCCXT into your program byreviewing the instructions in “Link-editing EQADCCXT into your program.”
4. Do one of the following tasks:v If your site is using DTCN debugging profiles, create and store a DTCN
debugging profile. Instructions for creating a DTCN debugging profile are in“Creating and storing a DTCN profile” on page 90.
v If you are using CICS Transaction Server for z/OS Version 2 Release 3 orlater and your site uses CADP to manage debugging profiles, create andstore a CADP debugging profile. See “Creating and storing debuggingprofiles with CADP” on page 101 for more information about using CADP.
Link-editing EQADCCXT into your programz/OS Debugger provides an Language Environment CEEBXITA assembler exitcalled EQADCCXT to help you activate, by using the DTCN transaction, adebugging session under CICS. You do not need to use this exit if you are runningany of the following options:v You are running under CICS Transaction Server for z/OS Version 2 Release 3 or
later and you use the CADP transaction to define debug profiles.v You are using the DTCN transaction and you are debugging non-Language
Environment Assembler programs.v You are using the DTCN transaction and you are debugging COBOL programs,
or PL/I programs in the following situation:– Compiled with Enterprise PL/I for z/OS, Version 3 Release 4 with the PTF
for APAR PK03264 applied, or later– Running with Language Environment Version 1 Release 6 with the PTF for
APAR PK03093 applied, or later
When you use EQADCCXT, be aware of the following conditions:v If your site does not use an Language Environment assembler exit (CEEBXITA),
then link-edit member EQADCCXT, which contains the CSECT CEEBXITA andis in library hlq.SEQAMOD, into your main program.
© Copyright IBM Corp. 1992, 2019 89

v If your site uses an existing CEEBXITA, the EQADCCXT exit provided by z/OSDebugger must be merged with it. The source for EQADCCXT is inhlq.SEQASAMP(EQADCCXT). Link the merged exit into your main program.
After you link-edit your program, use the DTCN transaction to create a profile thatspecifies the combination of resources that you want to debug. See “Creating andstoring a DTCN profile.”
Creating and storing a DTCN profileYou can create and store DTCN profiles in the following manner:v By using the DTCN transaction. The rest of the information in these topics
describe how to do this.v By using Remote CICS Application launch configurations. For more information
about creating a debug configuration for a CICS application, see the IBMDeveloper for z Systems, IBM Z Open Development, or IBM Z Open Unit Testdocumentation in IBM Knowledge Center.
The DTCN transaction stores debugging profiles in a repository. The repository canbe either a CICS temporary storage queue or a VSAM file. The following listdescribes the differences between using a CICS temporary storage queue or aVSAM file:v If you don't log on to CICS or you log on as the default user, you cannot use a
VSAM file. You must use a CICS temporary storage queue.v If you use a CICS temporary storage queue, the profile will be deleted if the
terminal that created the profile has been disconnected or the CICS region isterminated. If you use a VSAM file, the profile will persist throughdisconnections or CICS region restarts.
v If you use a CICS temporary storage queue, there can be only one profile on asingle terminal. If you use a VSAM file, there can be multiple profiles, eachcreated by a different user, on a single terminal.
z/OS Debugger determines which storage method is used based on the presence ofa debugging profile VSAM file. If z/OS Debugger finds a debugging profile VSAMfile allocated to the CICS region, it assumes you are using a VSAM file as therepository. If it doesn't find a debugging profile VSAM file, it assumes you areusing a CICS temporary storage queue as the repository. See the IBM z/OSDebugger Customization Guide or contact your system programmer for moreinformation about how the VSAM files are created and managed.
If the repository is a temporary storage queue, each profile is retained in therepository until one of the following events occurs:v The profile is explicitly deleted by the terminal that entered it.v DTCN detects that the terminal which created the profile has been disconnected.v The CICS region is terminated.
If the repository is a VSAM file, each profile is retained until it is explicitly deleted.The DTCN transaction uses the user ID to identify a profile. Therefore, each userID can have only one profile stored in the VSAM file.
Profiles are either active or inactive. If a profile is active, DTCN tries to match itwith a transaction that uses the resources specified in the profile. DTCN does nottry to match a transaction with an inactive profile. To make a profile active orinactive, use the z/OS Debugger CICS Control - Primary Menu panel (the main
90 IBM z/OS Debugger V14.1.9 User's Guide

DTCN panel) to make the profile active or inactive, then save it. If the repository isa VSAM file, when DTCN detects that the terminal is disconnected, it makes theprofile inactive.
To create and store a DTCN profile:1. Log on to a CICS terminal and enter the transaction ID DTCN. The DTCN
transaction displays the main DTCN screen, z/OS Debugger CICS Control -Primary Menu, shown below.
DTCN z/OS Debugger CICS Control - Primary Menu S07CICPD* VSAM storage method * ▌1▐
Select the combination of resources to debug (see Help for more information)Terminal Id ==> 0090Transaction Id ==>LoadMod::>CU(s) ==> ::> ==> ::>
==> ::> ==> ::>==> ::> ==> ::>==> ::> ==> ::>
User Id ==> CICSUSERNetName ==>IP Name/Address ==>Select type and ID of debug display deviceSession Type ==> MFI MFI, TCP, DIR, DTC, DBMPort Number ==> TCP PortDisplay Id ==> 0090
Generated String: TEST(ERROR,’*’,PROMPT,’MFI%0090:*’)
Repository String: No string currently saved in repository
Profile Status: No Profile Saved. Press PF4 to save current settings.
PF1=HELP 2=GHELP 3=EXIT 4=SAVE 5=ACT/INACT 6=DEL 7=SHOW 8=ADV 9=OPT 10=CUR TRM
Line ▌1▐ displays a message to indicate that DTCN will store the profile in atemporary storage queue or in a VSAM file. Some of the entry fields are filledin with values from one of the following sources:v If the temporary storage queue is the type of repository, the fields are filled
in with default values that start z/OS Debugger, in full-screen mode, fortasks running on this terminal.
v If a VSAM file is the type of repository and a profile exists for the currentuser, the fields are filled in with data found in that profile. If a VSAM file isthe type of repository and a profile does not exist for the current user, thefields are filled in with default values that start z/OS Debugger, infull-screen mode, for tasks running on this terminal.
If you do not want to change these fields, you can skip the next two steps andproceed to step 4 on page 92. If you want to change the settings on this panel,continue to the next step.
2. Specify the combination of resources that identify the transaction or programthat you want to debug. For more information about these fields, do one ofthe following tasks:v Read “Description of fields on the DTCN Primary Menu screen” on page
94.v Place the cursor next to the field and press PF1 to display the online help.
3. Specify the type of debugging session you want to run and the ID of thedevice that displays the debugging session. For more information about thesefields, do one of the following tasks:v Read “Description of fields on the DTCN Primary Menu screen” on page
94.
Chapter 10. Preparing a CICS program 91
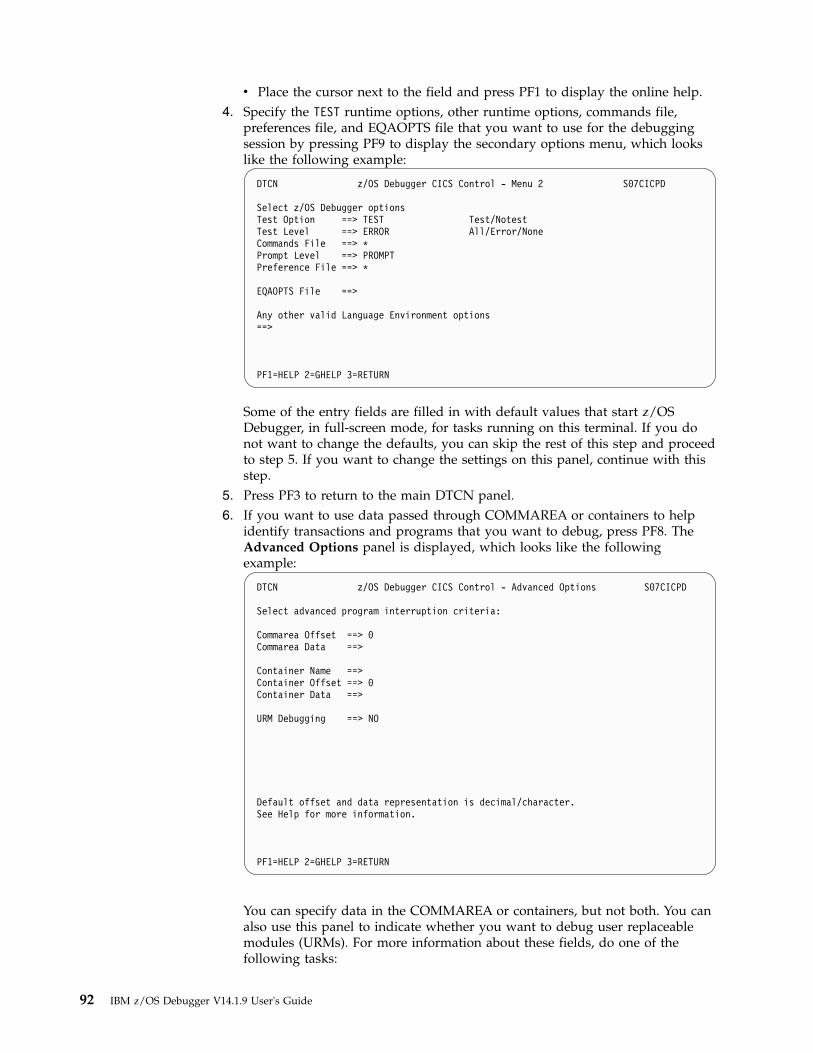
v Place the cursor next to the field and press PF1 to display the online help.4. Specify the TEST runtime options, other runtime options, commands file,
preferences file, and EQAOPTS file that you want to use for the debuggingsession by pressing PF9 to display the secondary options menu, which lookslike the following example:
DTCN z/OS Debugger CICS Control - Menu 2 S07CICPD
Select z/OS Debugger optionsTest Option ==> TEST Test/NotestTest Level ==> ERROR All/Error/NoneCommands File ==> *Prompt Level ==> PROMPTPreference File ==> *
EQAOPTS File ==>
Any other valid Language Environment options==>
PF1=HELP 2=GHELP 3=RETURN
Some of the entry fields are filled in with default values that start z/OSDebugger, in full-screen mode, for tasks running on this terminal. If you donot want to change the defaults, you can skip the rest of this step and proceedto step 5. If you want to change the settings on this panel, continue with thisstep.
5. Press PF3 to return to the main DTCN panel.6. If you want to use data passed through COMMAREA or containers to help
identify transactions and programs that you want to debug, press PF8. TheAdvanced Options panel is displayed, which looks like the followingexample:
DTCN z/OS Debugger CICS Control - Advanced Options S07CICPD
Select advanced program interruption criteria:
Commarea Offset ==> 0Commarea Data ==>
Container Name ==>Container Offset ==> 0Container Data ==>
URM Debugging ==> NO
Default offset and data representation is decimal/character.See Help for more information.
PF1=HELP 2=GHELP 3=RETURN
You can specify data in the COMMAREA or containers, but not both. You canalso use this panel to indicate whether you want to debug user replaceablemodules (URMs). For more information about these fields, do one of thefollowing tasks:
92 IBM z/OS Debugger V14.1.9 User's Guide

v Read “Description of fields on the DTCN Primary Menu screen” on page94.
v Place the cursor next to the field and press PF1 to display the online help.7. Press PF3 to return to the main DTCN panel.8. Press PF4 to save the profile. DTCN performs data verification on the data
that you entered in the DTCN panel. When DTCN discovers an error, it placesthe cursor in the erroneous field and displays a message. You can usecontext-sensitive help (PF1) to find what is wrong with the input.
9. Press PF5 to change the status from active to inactive, or from inactive toactive. A profile has three possible states:
No profile savedA profile has not yet been created for this terminal.
Active The profile is active for pattern matching.
InactivePattern matching is skipped for this profile.
10. After you save the profile in the repository, DTCN shows the saved TESTstring in the display field Repository String. If you are satisfied with the savedprofile, press PF3 to exit DTCN.
Now, any tasks that run in the CICS system and match the resources that youspecified in the previous steps will start z/OS Debugger.
Refer to the following topics for more information related to the material discussedin this topic.
Related tasks“Displaying a list of active DTCN profiles and managing DTCN profiles”
Related references“Description of fields on the DTCN Primary Menu screen” on page 94Description of the DTCD transaction in IBM z/OS Debugger Customization Guide
Displaying a list of active DTCN profiles and managing DTCNprofiles
To display all of the active DTCN profiles in the CICS region, do the followingsteps:1. If you have not started the DTCN transaction, Log on to a CICS terminal and
enter the transaction ID DTCN. The DTCN transaction displays the mainDTCN screen, z/OS Debugger CICS Control - Primary Menu.
2. Press PF7. The z/OS Debugger CICS Control - All Sessions screen displays,shown below.
DTCN z/OS Debugger CICS Control - All Sessions S07CICPD
Overtype "_" with "D" to delete, "A" to activate, "I" to inactivate a profile.
Owner Sta Term Tran User Id NetName Applid Display Id
_ 0090 ACT 0090 TRN1 USER1 0072 S07CICPD 0090
LoadMod::>CU(s) CIC9060 ::> CS9060 CBLAC?3 ::> *9361________ ::> ________ ________ ::> ________________ ::> ________ ________ ::> ________________ ::> ________ ________ ::> ________
IP Name/Addr ____________________________________________________
Chapter 10. Preparing a CICS program 93
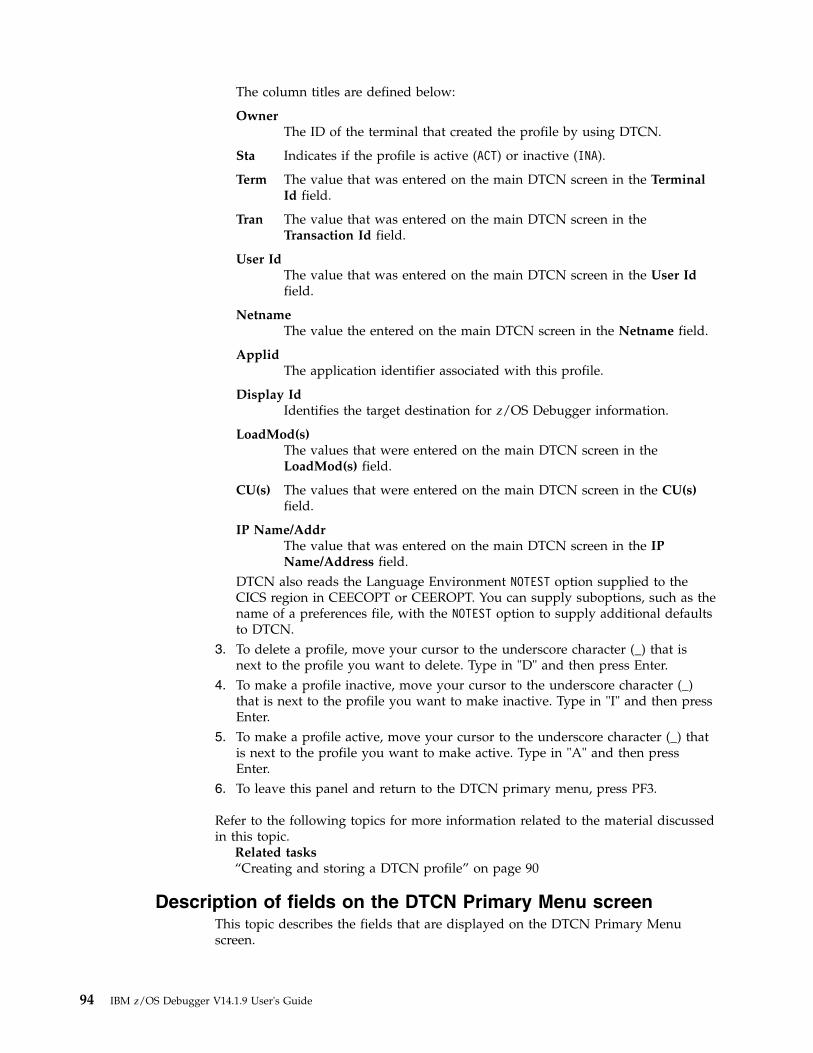
The column titles are defined below:
OwnerThe ID of the terminal that created the profile by using DTCN.
Sta Indicates if the profile is active (ACT) or inactive (INA).
Term The value that was entered on the main DTCN screen in the TerminalId field.
Tran The value that was entered on the main DTCN screen in theTransaction Id field.
User IdThe value that was entered on the main DTCN screen in the User Idfield.
NetnameThe value the entered on the main DTCN screen in the Netname field.
ApplidThe application identifier associated with this profile.
Display IdIdentifies the target destination for z/OS Debugger information.
LoadMod(s)The values that were entered on the main DTCN screen in theLoadMod(s) field.
CU(s) The values that were entered on the main DTCN screen in the CU(s)field.
IP Name/AddrThe value that was entered on the main DTCN screen in the IPName/Address field.
DTCN also reads the Language Environment NOTEST option supplied to theCICS region in CEECOPT or CEEROPT. You can supply suboptions, such as thename of a preferences file, with the NOTEST option to supply additional defaultsto DTCN.
3. To delete a profile, move your cursor to the underscore character (_) that isnext to the profile you want to delete. Type in "D" and then press Enter.
4. To make a profile inactive, move your cursor to the underscore character (_)that is next to the profile you want to make inactive. Type in "I" and then pressEnter.
5. To make a profile active, move your cursor to the underscore character (_) thatis next to the profile you want to make active. Type in "A" and then pressEnter.
6. To leave this panel and return to the DTCN primary menu, press PF3.
Refer to the following topics for more information related to the material discussedin this topic.
Related tasks“Creating and storing a DTCN profile” on page 90
Description of fields on the DTCN Primary Menu screenThis topic describes the fields that are displayed on the DTCN Primary Menuscreen.
94 IBM z/OS Debugger V14.1.9 User's Guide

The following list describes the resources you can specify to help identify theprogram or transaction that you want to debug:
Terminal IdSpecify the CICS terminal identifier associated with the transaction youwant to debug. By default, DTCN sets the ID by one of the following rules:v If the type of repository is a VSAM file and the current user ID has a
saved profile, DTCN fills in the field with the terminal ID that is in therepository. You can change the terminal ID to the ID of the terminal youare currently running on, by placing your cursor on the terminal ID fieldand then pressing PF10. Press PF4 to save the profile with this newvalue.
v If the type of repository is a VSAM file and the current user ID does nothave a saved profile, the terminal ID field is filled in with the ID of theterminal you are currently running on.
v If the type of repository is a temporary storage queue, the terminal IDfield is filled in with the ID of the terminal you are currently runningon.
v If the CICS transaction or program that you want to debug is notassociated with a specific terminal (for example, the request to start adebug session comes from a browser), make this field blank.
If YES is specified for the EQAOPTS DTCNFORCETERMID command, you mustspecify a terminal identifier. To learn about the EQAOPTS DTCNFORCETERMIDcommand, see the topic “EQAOPTS commands” in the IBM z/OS DebuggerCustomization Guide or IBM z/OS Debugger Reference and Messages.
Transaction IdSpecify the CICS transaction to debug. If you specify a transaction IDwithout any other resource, z/OS Debugger is started every time any ofthe following situations occurs:v You run the transaction.v The first program run by the transaction is started.v Any other user runs the transaction.v Any enabled DFH* module is the first program run by the transaction.
To start z/OS Debugger at the desired program that the transaction runs,specify the program name in the Program Id(s) field.
If YES is specified for the EQAOPTS DTCNFORCETRANID command, you mustspecify a transaction ID. To learn about the EQAOPTS DTCNFORCETRANIDcommand, see the topic “EQAOPTS commands” in the IBM z/OS DebuggerCustomization Guide or IBM z/OS Debugger Reference and Messages.
LoadMod::>CU(s)Specify the resource pair or pairs, consisting of a load module name and acompile unit (CU) name that you want to debug. Type in the load modulename after the ==> and the corresponding CU name after the ::>. You canspecify any of the following names:
LoadModThe name of a load module that you want to debug. The loadmodule must comply with the following requirements:v For z/OS Debugger initialization, the load module can be any
CICS load module if it is invoked as an Language Environmentenclave or over a CICS Link Level. This includes the followingtypes of load modules:
Chapter 10. Preparing a CICS program 95

– The initial load module in a transaction.– A load module invoked by CICS LINK or XCTL.
v Any non-Language Environment assembler load module whichis loaded through an EXEC CICS LOAD command.
CU The name of the compile unit (CU) that you want to debug. TheCU must comply with the following requirements:v Any CICS CU if it is invoked as an Language Environment
enclave or over a CICS Link Level. This includes the followingtypes of CUs:– The initial CU in a transaction– A CU invoked by CICS LINK or XCTL
v Any COBOL CU, even if it is a nested CU or a subprogramwithin a composite load module, invoked by a static or dynamicCALL.
v Any Enterprise PL/I for z/OS Version 3 Release 4 CU (with thePTF for APAR PK03264 applied), or later, running withLanguage Environment Version 1 Release 6 (with the PTF forAPAR PK03093 applied), or later, even if it is a nested CU or asubprogram within a composite load module, invoked as a staticor dynamic CALL.
v Any non-Language Environment assembler CU which is loadedthrough an EXEC CICS LOAD command.
Usage Notes®:
v If you specify a LoadMod and leave the corresponding CU field blank,the CU field defaults to an asterisk (*).
v If you specify a CU and leave the corresponding LoadMod field blank,the LoadMod field defaults to an asterisk (*).
v If you leave all LoadMod and CU fields blank and you set the PromptLevel on the “z/OS Debugger CICS Control - Menu 2” to PROMPT,z/OS Debugger initializes for the first program invoked.
v If you migrate from a version of z/OS Debugger prior to Version 10.1,you can obtain the same behavior produced by the DTCN Program Idresource by using the LoadMod::>CU resource pair and specifying onlythe CU resource. The LoadMod resource defaults to an asterisk (*).
v You can specify wildcard characters (*) and (?).v If z/OS Debugger was started by another program before the EXEC CICS
LOAD command that starts this non-Language Environment assemblerprogram, you need to enter one of the following commands so thatz/OS Debugger gains control of this program:– LDD
– SET ASSEMBLER ON
– SET DISASSEMBLY ON
v When you specify a CU for C/C++ and Enterprise PL/I programs(languages that use a fully qualified data set name as the compile unitname), you must specify the correct part of the compile unit name in theCU field. Use the following rules to determine which part of the compileunit name you need to specify:– If you are using a PDS or PDSE, you must specify the member name.
For example, if the compile unit names are
96 IBM z/OS Debugger V14.1.9 User's Guide
DEV1.TEST.ENTPLI.SOURCE(ABC) and DEV1.TEST.C.SOURCE(XYZ),you must specify ABC and XYZ in the program ID field.
– If you are using a sequential data set, specify one of the following:- The last qualifier of the sequential data set. For example, if the
compile unit names are DEV1.TEST.ENTPLI.SOURCE.ABC andDEV1.TEST.C.SOURCE.XYZ, you must specify ABC and XYZ in theprogram ID field.
- Wildcards. For example, if the compile unit names areDEV1.TEST.ENTPLI.ABC.SOURCE andDEV1.TEST.C.XYZ.SOURCE, you must specify *ABC* and *XYZ* inthe program ID field.
– If you compiled your PL/I program with the following compiler andit is running in the following environment, you need to use thepackage name or the main procedure name:- Enterprise PL/I for z/OS, Version 3.5, with the PTFs for APARs
PK35230 and PK35489 applied, or Enterprise PL/I for z/OS,Version 3.6 or later
- Language Environment, Version 1.6 through 1.8 with the PTF forAPAR PK33738 applied, or later
v Specifying a CICS program in the LoadMod::>CU field is similar tosetting a breakpoint by using the AT ENTRY command and z/OSDebugger stops each time you enter LoadMod::>CU.
v If z/OS Debugger is already running and it cannot find the separatedebug file, then z/OS Debugger does not stop at the CICS programspecified in the LoadMod::>CU field. Use the AT APPEARANCE or AT ENTRYcommand to stop at this CICS program.
v If YES is specified for the EQAOPTS DTCNFORCELOADMODID command, youmust specify a value for the LoadMod field. To learn about theEQAOPTS DTCNFORCELOADMODID command, see the topic “EQAOPTScommands” in the IBM z/OS Debugger Customization Guide or IBM z/OSDebugger Reference and Messages.
v If YES is specified for the EQAOPTS DTCNFORCEPROGID or DTCNFORCECUIDcommands, you must specify a value for the CU field. To learn about theEQAOPTS DTCNFORCEPROGID or DTCNFORCECUID commands, see the topic“EQAOPTS commands” in the IBM z/OS Debugger Customization Guide orIBM z/OS Debugger Reference and Messages.
User IdSpecify the user identifier associated with the transaction you want todebug. The following list can help you decide what to enter in this field:v If the user identifier is the same one that is currently running DTCN,
use the default user identifier.v If the user identifier is different than the one currently running DTCN
and you know the user identifier, enter that user identifier.v If you do not know the user identifier or the transaction is not
associated with a user identifier, specify the wild character or blanks.
If YES is specified for the EQAOPTS DTCNFORCEUSERID command, you mustspecify a user identifier. To learn about the EQAOPTS DTCNFORCEUSERIDcommand, see the topic “EQAOPTS commands” in the IBM z/OS DebuggerCustomization Guide or IBM z/OS Debugger Reference and Messages.
NetNameSpecify the four character name of a CICS terminal or a CICS system that
Chapter 10. Preparing a CICS program 97
you want to use to run your debugging session. This name is used byVTAM to identify the CICS terminal or system.
If YES is specified for the EQAOPTS DTCNFORCENETNAME command, youmust specify a value for the NetName field. To learn about the EQAOPTSDTCNFORCENETNAME command, see the topic “EQAOPTS commands” in theIBM z/OS Debugger Customization Guide or IBM z/OS Debugger Reference andMessages.
IP Name/AddressThe client IP name or IP address that is associated with a CICS application.All IP names are treated as upper case. Wildcards (* and ?) are permitted.z/OS Debugger is invoked for every task that is started for that client.
If YES is specified for the EQAOPTS DTCNFORCEIP command, you mustspecify an IP address. To learn about the EQAOPTS DTCNFORCEIPcommand, see the topic “EQAOPTS commands” in the IBM z/OS DebuggerCustomization Guide or IBM z/OS Debugger Reference and Messages.
The following list describes the fields that you can use to indicate which type ofdebugging session you want to run.
Session TypeSelect one of the following options:
MFI Indicates that z/OS Debugger initializes on a 3270 type of terminal.
TCP Indicates that you want to interact with z/OS Debugger using aremote debugger in Debug Tool compatibility mode connectedwith a TCP/IP host name or address.
DIR Indicates that you want to interact with z/OS Debugger using aremote debugger in standard mode connected with a TCP/IP hostname or address.
Note: Standard mode is not available in IBM Z OpenDevelopment or IBM Z Open Unit Test.
DTC Indicates that you want to interact with z/OS Debugger using aremote debugger in Debug Tool compatibility mode connectedwith a z/OS Debugger Debug Manager userid.
DBM Indicates that you want to interact with z/OS Debugger using aremote debugger in standard mode connected with a z/OSDebugger Debug Manager userid.
Note: Standard mode is not available in IBM Z OpenDevelopment or IBM Z Open Unit Test.
Port NumberSpecifies the TCP/IP port number that is listening for debug sessions onyour workstation. By default, IBM Developer for z Systems, IBM Z OpenDevelopment, or IBM Z Open Unit Test uses port 8001. If you entered DTCor DBM in the Session Type field, this field must be left blank.
Display IdIdentifies the target destination for z/OS Debugger.
If you entered DTC or DBM in the Session Type field, enter the useridthat your workstation is using to connect to the z/OS remote system.
98 IBM z/OS Debugger V14.1.9 User's Guide

If you entered TCP or DIR in the Session Type field, determine the IPaddress or host name of the workstation that is running the remotedebugger. Change the value in the Display Id field by doing the followingsteps:1. Place your cursor on the Display Id field.2. Type in the IP address or host name of the workstation that is running
the remote debugger.3. To save the profile with this new value, press PF4.
If you entered MFI in the Session Type field, DTCN fills in the Display Idfield according to the following rules:v If the type of repository is a VSAM file and the current user ID has a
saved profile, DTCN fills in the field with the display ID that is in therepository.
v If the type of repository is a VSAM file and the current user ID does nothave a saved profile, DTCN fills in the field with the ID of the terminalyou are currently running on.
v If the type of repository is a temporary storage queue, DTCN fills in thefield with the ID of the terminal you are currently running on.
You can use one of the following terminal modes to display z/OSDebugger on a 3270 terminal:v Single terminal mode: z/OS Debugger and the application program
share the same terminal. To use this mode, enter the ID of the terminalbeing used by your application program or move the cursor to theDisplay ID field and press PF10.
v Screen control mode: z/OS Debugger displays its screens on a terminalwhich is running the DTSC transaction. To use this mode, start theDTSC transaction on a terminal and specify that terminal’s ID in theDisplay ID field.
v Separate terminal mode: z/OS Debugger displays its screens on aterminal which is available for use (not associated with any transaction)and can be located by CICS. To use this mode, specify the terminal’s IDin the Display ID field.
Description of fields on the DTCN Menu 2 screenThe following list describes the fields that you can use to specify the TEST runtimeoptions, other runtime options, commands file, and preferences file that you wantto use for the debugging session:
Test OptionTEST/NOTEST specifies the conditions under which z/OS Debugger assumescontrol during the initialization of your application.
Test LevelALL/ERROR/NONE specifies what conditions need to be met for z/OSDebugger to gain control.
Commands FileA valid fully qualified data set name that specifies the commands file forthis run. Do not enclose the name of the data set in quotation marks (") orapostrophes ('). The CICS region must have read authorization to thecommands file.
Chapter 10. Preparing a CICS program 99

If you leave this field blank and have a value for a default user commandsfile set through the EQAOPTS COMMANDSDSN command, z/OS Debuggerdoes the following tasks to find a commands file:1. z/OS Debugger constructs the name of a data set from the naming
pattern specified in the command.2. z/OS Debugger locates the data set.3. If the data set contains a member with a name that matches the name
of the initial load module in the first enclave, it processes that memberas a commands file.
If you do not want specify a commands file, and want to prevent z/OSDebugger from using the file specified by the EQAOPTS COMMANDSDSNcommand, specify NULLFILE for the commands file.
To learn how to specify the EQAOPTS COMMANDSDSN command, see the topic“EQAOPTS commands” in either the IBM z/OS Debugger CustomizationGuide or IBM z/OS Debugger Reference and Messages.
Prompt LevelSpecifies whether z/OS Debugger is started at Language Environmentinitialization.
Preferences FileA valid fully qualified data set name that specifies the preferences file forthis run. Do not enclose the name of the data set in quotation marks (") orapostrophes ('). The CICS region must have read authorization to thepreferences file.
If you leave this field blank and have a value for a default user preferencesfile set through the EQAOPTS PREFERENCESDSN command, z/OS Debuggerdoes the following tasks to find a preferences file:1. z/OS Debugger constructs the name of a data set from the naming
pattern specified in the command.2. z/OS Debugger locates the data set and processes it as a preferences
file.
If you do not want to specify a preferences file, and want to prevent z/OSDebugger from using the file specified by the EQAOPTS PREFERENCESDSNcommand, specify NULLFILE for the preferences file.
To learn how to specify the EQAOPTS PREFERENCESDSN command, see thetopic “EQAOPTS commands” in either the IBM z/OS DebuggerCustomization Guide or IBM z/OS Debugger Reference and Messages.
EQAOPTS FileA valid fully qualified data set name that specifies the EQAOPTS file forthis run. Do not enclose the name of the data set in quotation marks (") orapostrophes ('). The CICS region must have read authorization to theEQAOPTS file.
Any other valid Language Environment Options You can change any Language Environment option that your site hasdefined as overrideable except the STACK option. For additional informationabout Language Environment options, see z/OS Language EnvironmentProgramming Reference or contact your CICS system programmer.
100 IBM z/OS Debugger V14.1.9 User's Guide

Description of fields on the DTCN Advanced Options screenThe following list describes the fields that you can use to specify the data passedthrough COMMAREA or containers that can help identify transactions andprograms that you want to debug:
Commarea offsetSpecifies the offset of data within a commarea passed to a program oninvocation. You can specify the offset in decimal format (for example, 13) or inhexadecimal format (for example, X'D'). If you specify data in hexadecimalformat, you must specify an even number of hexadecimal digits.
Commarea dataSpecifies the data within a commarea that is passed to a program oninvocation. You can specify the data in character format (for example, "ABC")or in hexadecimal format (for example, X'C1C2C3').
Container nameSpecifies the name of a container within the current channel passed to aprogram on invocation. Container names are case sensitive.
Container offsetSpecifies the offset of data in the named container passed to a program in thecurrent channel on invocation. You can specify the offset in decimal format (forexample, 13) or in hexadecimal format (for example, X'D').
Container dataSpecified the data in the named container passed to a program in the currentchannel on invocation. You can specify the data in character format (forexample, "ABC") or in hexadecimal format (for example, X'C1C2C3'). If youspecify data in hexadecimal format, you must specify an even number ofhexadecimal digits.
URM debuggingSpecifies whether you want z/OS Debugger to include the debugging of URMsas part of the debug session. Choose from the following options:
YES z/OS Debugger debugs URMs which match normal z/OS Debuggerdebugging criteria.
NO z/OS Debugger excludes URMs form debugging sessions.
Creating and storing debugging profiles with CADPCADP is an interactive transaction supplied by CICS Transaction Server for z/OSVersion 2 Release 3, or later. CADP helps you maintain persistent debuggingprofiles. These profiles contain a pattern of CICS resource names that identify atask that you want to debug. When CICS programs are started, CICS tries to matchthe executing resources to find a profile whose resources match those that arespecified in a CADP profile. During this pattern matching, CICS selects the bestmatching profile, which is the one with greatest number of resources that matchthe active task.
Before using CADP, verify that you have done the following tasks:v Compiled and linked your program as described in Chapter 10, “Preparing a
CICS program,” on page 89.v Verified that your site uses CADP and that all the tasks required to customize
z/OS Debugger so that it can debug CICS programs described in IBM z/OSDebugger Customization Guide are completed. In particular, verify that the
Chapter 10. Preparing a CICS program 101

DEBUGTOOL system initialization parameter is set to YES so that z/OS Debuggeruses the CADP profile repository instead of the DTCN profile repository to finda matching debugging profile.
See CICS Supplied Transactions for instructions on how to use the CADP utilitytransaction. If you are going to debug user-replaceable modules (URMs), specifyENVAR("INCLUDEURM=YES") in the Other Language Environment Options field.
Refer to the following topics for more information related to the material discussedin this topic.
Related referencesCICS Application Programming Guide for a description of debugging profiles.
Starting z/OS Debugger for non-Language Environment programsunder CICS
You can start z/OS Debugger to debug a program that does not run in theLanguage Environment run time by using the existing debug profile maintenancetransactions DTCN and CADP. You must use DTCN with versions of CICS prior to CICSTransaction Server for z/OS Version 2 Release 3.
To debug CICS non-Language Environment programs, the z/OS Debuggernon-Language Environment Exits must have been previously started.
To debug non-Language Environment assembler programs or non-LanguageEnvironment COBOL programs that run under CICS, you must start the requiredz/OS Debugger global user exits before you start the programs. z/OS Debuggerprovides the following global user exits to help you debug non-LanguageEnvironment applications: XPCFTCH, XEIIN, XEIOUT, XPCTA, and XPCHAIR.The exits can be started by using either the DTCX transaction (provided by z/OSDebugger), or using a PLTPI program that runs during CICS region startup.DTCXXO activates the non-Language Environment Exits for z/OS Debugger inCICS. DTCXXF inactivates the non-Language Environment Exits for z/OSDebugger in CICS.
Refer to the following topics for more information related to the material discussedin this topic.
Related tasksIBM z/OS Debugger Customization Guide
Passing runtime parameters to z/OS Debugger fornon-Language Environment programs under CICS
When you define your debugging profile using the DTCN Options Panel (PF9) or theCADP Create/Modify Debugging Profile Panel, you can pass a limited set ofruntime options that will take effect during your debugging session when youdebug programs that do not run in Language Environment. You can pass thefollowing runtime options:v TEST/NOTEST: must be TESTv TEST LEVEL: must be ALLv Commands filev Prompt Level: must be PROMPTv Preferences filev You can also specify the following runtime options in a TEST string:
102 IBM z/OS Debugger V14.1.9 User's Guide

– NATLANG: to specify the National Language used to communicate with z/OSDebugger
– COUNTRY: to specify a Country Code for z/OS Debugger– TRAP: to specify whether z/OS Debugger is to intercept Abends
Refer to the following topics for more information related to the material discussedin this topic.
Related referencesIBM z/OS Debugger Reference and Messages
Chapter 10. Preparing a CICS program 103

104 IBM z/OS Debugger V14.1.9 User's Guide

Chapter 11. Preparing an IMS program
To prepare an IMS program, do the following tasks:1. Verify that Chapter 4, “Planning your debug session,” on page 25 and
Chapter 5, “Updating your processes so you can debug programs with z/OSDebugger,” on page 63 have been completed.
2. Contact your system programmer to find out the preferred method for startingz/OS Debugger and which of the following methods you need to use to specifyTEST runtime options:v Specifying the TEST runtime options in a data set, which is then extracted by
a customized version of the Language Environment user exit routineCEEBXITA. See Chapter 12, “Specifying the TEST runtime options throughthe Language Environment user exit,” on page 109 for instructions.
v Specifying the TEST runtime options in a CEEUOPT (application level, whichyou link-edit to your application program) or CEEROPT module, (regionlevel). See “Starting z/OS Debugger under IMS by using CEEUOPT orCEEROPT” for instructions.
v Specifying the TEST runtime options through the EQASET transaction fornon-Language Environment assembler programs running in IMS TM. See“Running the EQASET transaction for non-Language Environment IMSMPPs” on page 378 for instructions.
v “Managing runtime options for IMSplex users by using IBM z/OS DebuggerUtilities” on page 106.
Starting z/OS Debugger under IMS by using CEEUOPT or CEEROPTYou can specify your TEST runtime options by using CEEUOPT (which is anassembler module that uses the CEEXOPT macro to set application level defaults,and is link-edited into an application program) or CEEROPT (which is anassembler module that uses the CEEXOPT macro to set region level defaults).Every time your application program runs, z/OS Debugger is started.
To use CEEUOPT to specify your TEST runtime options, do the following steps:1. Code an assembler program that includes a CEEXOPT macro invocation that
specifies your application program's runtime options.2. Assemble the program.3. Link-edit the program into your application program by specifying an
INCLUDE LibraryDDname(CEEUOPT-member name)4. Place your application program in the load library used by IMS.
To use CEEROPT to specify your TEST runtime options, do the following steps:1. Code an assembler program that includes a CEEXOPT macro invocation that
specifies your region's runtime options.2. Assemble the program.3. Link-edit the program into a load module named CEEROPT by specifying an
INCLUDE LibraryDDname(CEEROPT-member name)4. Place the CEEROPT load module into the load library used by IMS.
© Copyright IBM Corp. 1992, 2019 105

Managing runtime options for IMSplex users by using IBM z/OSDebugger Utilities
Note: This section is not applicable to IBM Developer for z Systems(non-Enterprise Edition), IBM Z Open Development, or IBM Z Open Unit Test.
This topic describes how to add, delete, or modify TEST runtime options that arestored in the IMS Language Environment runtime parameter repository. To managethe items in this repository, do the following steps:1. From the main IBM z/OS Debugger Utilities panel (EQA@PRIM), type 4 in the
Option line and press Enter.2. In the Manage IMS Programs panel (EQAPRIS), type 1 in the Option line and
press Enter.3. In the Manage LE Runtime Options in IMS panel (EQAPRI), type in the
IMSplex ID and optional qualifiers. IBM z/OS Debugger Utilities uses thisinformation to search through the IMS Language Environment runtimeparameter repository and find the entries that most closely match theinformation you typed in. You can use wild cards (* and %) to increase thechances of a match. After you type in your search criteria, press Enter.
4. In the Edit LE Runtime Options Entries in IMS panel (EQAPRIM), a tabledisplays all the entries found in the IMS Language Environment runtimeparameter repository that most closely match your search criteria. You can dothe following tasks in this panel:v Delete an entry.v Add a new entry.v Edit an existing entry.v Copy an existing entry.
For more information about a command or field, press PF1 to display a helppanel.
5. After you finish making your changes, press PF3 to save your changes andclose the panel that is displayed. If necessary, press the PF3 repeatedly to closeother panels until you reach the Manage IMS Programs panel (EQAPRIS).
Setting up the DFSBXITA user exit routineTo make the debug session use the options you specified in the Manage LERuntime Options in IMS function, you must use the DFSBXITA user exit suppliedby IMS. This exit contains a copy of the Language Environment CEEBXITA userexit that is customized for IMS. The DFSBXITA user exit either replaces the exitsupplied by Language Environment in CEEBINIT, or is placed in your loadmodule.v To make the user exit available installation-wide, do a replace link edit of the
IMS CEEBXITA into the CEEBINIT load module in your system hlq.SCEERUNLanguage Environment runtime library.
v To make the user exit available region-wide, copy the CEEBINIT in yourhlq.SCEERUN library into a private library, and then do a replace link edit of theIMS CEEBXITA into the CEEBINIT load module in your private library. Thenplace your private library in the STEPLIB DD concatenation sequence before thesystem hlq.SCEERUN data set in the MPR region startup job.
v To make the user exit available to a specific application, link the IMS CEEBXITAinto your load module. The user exit runs only when the application is run.
106 IBM z/OS Debugger V14.1.9 User's Guide
The following sample JCL describes how to do a replace link edit of the IMSCEEBXITA into a CEEBINIT load module:INCLUDE MYOBJ(CEEBXITA) ▌1▐REPLACE CEEBXITAINCLUDE SYSLIB(CEEBINIT)ORDER CEEBINIT MODE AMODE(24),RMODE(24)ENTRY CEEBINITALIAS CEEBLIBMNAME CEEBINIT(R)
When you assembled the IMS user exit DFSBXITA, if you named the resultingobject member DFSBXITA, replace CEEBXITA on line ▌1▐ with DFSBXITA.
Chapter 11. Preparing an IMS program 107

108 IBM z/OS Debugger V14.1.9 User's Guide

Chapter 12. Specifying the TEST runtime options through theLanguage Environment user exit
z/OS Debugger provides a customized version of the Language Environment userexit (CEEBXITA). The user exit returns a TEST runtime option when called by theLanguage Environment initialization logic. z/OS Debugger provides a user exitthat supports three different environments. This topic is also described in IBM z/OSDebugger Customization Guide with information specific to system programmers.
The user exit extracts the TEST runtime option from a user controlled data set witha name that is constructed from a naming pattern. The naming pattern can includethe following tokens:
&USERIDz/OS Debugger replaces the &USERID token with the user ID of the currentuser. Each user can specify an individual TEST runtime option when debuggingan application. This token is optional.
&PGMNAMEz/OS Debugger replaces the &PGMNAME token with the name of the mainprogram (load module). Each program can have its own TEST runtime options.This token is optional.
z/OS Debugger provides the user exit in two forms:v A load module. The load modules for the three environments are in the
hlq.SEQAMOD data set. Use this load module if you want the default namingpatterns and message display level. The default naming pattern is&USERID.DBGTOOL.EQAUOPTS and the default message display level is X'00'.
v Sample assembler user exit that you can edit. The assembler user exits for thethree environments are in the hlq.SEQASAMP data set. You can also merge thissource with an existing version of CEEBXITA. Use this source code if you wantnaming patterns or message display levels that are different than the defaultvalues.
z/OS Debugger provides a customized version of the Language Environment userexit named EQAD3CXT. The following table shows the environments in which thisuser exit can be used. The EQAD3CXT user exit determines the runtimeenvironment internally and can be used in multiple environments.
Table 17. Language Environment user exits for various environments
Environment User exit name
The following types of DB2 stored procedures that run inWLM-established address spaces:
v type MAIN1
v type SUB4
EQAD3CXT
IMS TM2 and BTS3 EQAD3CXT
Batch EQAD3CXT
Note:
1. EQAD3CXT is supported for DB2 version 7 or later. If DB2 RUNOPTS isspecified, EQAD3CXT takes precedence over DB2 RUNOPTS.
© Copyright IBM Corp. 1992, 2019 109

2. For IMS TM, if you do not sign on to the IMS terminal, you might need to runthe EQASET transaction with the TSOID option. For instructions on how to runthe EQASET transaction, see “Debugging Language Environment IMS MPPswithout issuing /SIGN ON” in the IBM z/OS Debugger User's Guide.
3. For BTS, you need to specify Environment command (./E) with the user ID ofthe IO PCB. For example, if the user ID is ECSVT2, then the Environmentcommand is ./E USERID=ECSVT2.
4. If you have installed the PTF for APAR PM15192 for Language EnvironmentVersion 1.10 to Version 1.12, or have Language Environment Version 1.13 orhigher, the type SUB stored procedure is invoked by the call_sub function andEQAD3CXT is not needed.
Each user exit can be used in one of the following ways:v You can link the user exit into your application program.v You can link the user exit into a private copy of a Language Environment
module (CEEBINIT, CEEPIPI, or both), and then, only for the modules youmight debug, place the SCEERUN data set containing this module in front of thesystem Language Environment modules in CEE.SCEERUN in the load modulesearch path.
To learn about the advantages and disadvantages of each method, see Comparingthe two methods of linking CEEBXITA.
To prepare a program to use the Language Environment user exit, do the followingtasks:1. Editing the source code of CEEBXITA.2. Linking the CEEBXITA user exit into your application program or Linking the
CEEBXITA user exit into a private copy of a Language Environment runtimemodule.
3. Creating and managing the TEST runtime options data set.
Editing the source code of CEEBXITAYou can edit the sample assembler user exit that is provided in hlq.SEQASAMP tocustomize the naming patterns or message display level by doing one of thefollowing tasks:v Use SMP/E USERMOD EQAUMODK to update the copy of the exit in the
hlq.SEQAMOD data set. The system programmer usually implements theUSERMOD. The USERMOD is in hlq.SEQASAMP.
v Create a private load module for the customized exit. Copy the assembler userexit that has the same name as the user exit from hlq.SEQASAMP to a local dataset. Edit the patterns or message display level. Customize and run the JCL togenerate a load module.
Modifying the naming patternThe naming pattern of the data set that has the TEST runtime option is in the formof a sequential data set name. You can optionally specify a &USERID token, whichz/OS Debugger substitutes with the user ID of the current user. You can also add a&PGMNAME token, which z/OS Debugger substitutes with the name of the mainprogram (load module). However, if users create and manage the TEST runtimeoption data set with the DTSP Profile view in the remote debugger, do not specifythe &PGMNAME token because the view does not support that token.
110 IBM z/OS Debugger V14.1.9 User's Guide

In some cases, the first character of a user ID is not valid for a name qualifier. Acharacter can be concatenated before the &USERID token to serve as the prefixcharacter for the user ID. For example, you can prefix the token with the character"P" to form P&USERID, which is a valid name qualifier after the current user ID issubstituted for &USERID. For IMS, &USERID token might be substituted with one ofthe following values:v IMS user ID, if users sign on to IMS.v TSO user ID, if users do not sign on to IMS.
The default naming pattern is &USERID.DBGTOOL.EQAUOPTS. This is the pattern that isin the load module provided in hlq.SEQAMOD.
The following table shows examples of naming patterns and the correspondingdata set names after z/OS Debugger substitutes the token with a value.
Table 18. Data set naming patterns, values for tokens, and resulting data set names
Naming pattern User ID Program name Name after user ID substitution
&USERID.DBGTOOL.EQAUOPTS JOHNDOE JOHNDOE.DBGTOOL.EQAUOPTS
P&USERID.EQAUOPTS 123456 P123456.EQAUOPTS
DT.&USERID.TSTOPT TESTID DT.TESTID.TSTOPT
DT.&USERID.&PGMNAME.TSTOPT TESTID IVP1 DT.TESTID.IVP1.TSTOPT
To customize the naming pattern of the data set that has TEST runtime option,change the value of the DSNT DC statement in the sample user exit. For example:* Modify the value in DSNT DC field below.** Note: &USERID below has one additional ’&’, which is an escape* character.*DSNT_LN DC A(DSNT_SIZE) Length field of naming patternDSNT DC C’&&USERID.DBGTOOL.EQAUOPTS’DSNT_SIZE EQU *-DSNT Size of data set naming pattern*
Modifying the message display levelYou can modify the message display level for CEEBXITA. The following values setWTO message display level:
X'00'Do not display any messages.
X'01'Display error and warning messages.
X'02'Display error, warning, and diagnostic messages.
The default value, which is in the load module in hlq.SEQAMOD, is X'00'.
To customize the message display level, change the value of the MSGS_SW DCstatement in the sample user exit. For example:* The following switch is to control WTO message display level.** x’00’ - no messages* x’01’ - error and warning messages
Chapter 12. Specifying the TEST runtime options through the Language Environment user exit 111

* x’02’ - error, warning, and diagnostic messages*MSGS_SW DC X’00’ message level*
Modifying the call back routine registrationYou can register a call back routine to the Language Environment. The LanguageEnvironment invokes the call back routine prior to calling a type SUB programusing CALL_SUB API in the CEEPIPI environment. The call back routine performsa pattern match to determine if the type SUB program is to be debugged.
To customize the registration, change the value of the RRTN_SW DC statement.
x'00'No registration of the call back routine.
x'01'Registration of the call back routine.
Activate the cross reference function and modifying the crossreference table data set name
You can activate the cross reference function of the IMS Transaction and User IDCross Reference Table and provide a cross reference table data set name. When anIMS transaction is initiated from the web or MQ gateway, it runs with a genericID. If a user wants to debug the transaction, the cross reference function provides away to associate the transaction with his or her user ID.
To customize the activation, change the value of the XRDSN_SW DC statement.
x'00'Cross reference function is not activated.
x'01'Cross reference function is activated.
To customize the cross reference table data set name, change the value of theXRDSN DC statement. You must provide a fully qualified MVS sequential data setname.
Comparing the two methods of linking CEEBXITAYou can link in the user exit CEEBXITA in the following ways:v Link it into the application program.
AdvantageThe user exit affects only the application program being debugged. Thismeans you can control when z/OS Debugger is started for theapplication program. You might also not need to make any changes toyour JCL to start z/OS Debugger.
DisadvantageYou must remember to remove the user exit for production or, if it isn'tpart of your normal build process, you must remember to relink it to theapplication program.
v Link it into a private copy of a Language Environment runtime load module(CEEBINIT, CEEPIPI, or both)
112 IBM z/OS Debugger V14.1.9 User's Guide

AdvantageYou do not have to change your application program to use the userexit. In addition, you do not have to link edit extra modules into yourapplication program.
DisadvantageYou need to take extra steps in preparing and maintaining your runtimeenvironment:– Make a private copy of one or more Language Environment runtime
routines– Only for the modules you might debug, customize your runtime
environment to place the private copies in front of the systemLanguage Environment modules in CEE.SCEERUN in the loadmodule search path
– When you apply maintenance to Language Environment, you mightneed to relink the routines.
– When you upgrade to a new version of Language Environment, youmust relink the routines.
If you link the user exit into the application program and into a private copy of aLanguage Environment runtime load module, which is in the load module searchpath of your application execution, the copy of the user exit in the application loadmodule is used.
Linking the CEEBXITA user exit into your application programIf you choose to link the CEEBXITA user exit into your application program, usethe following sample JCL, which links the user exit with the program TESTPGM. Ifyou have customized the user exit and placed it in a private library, replace thedata name, (hlq.SEQAMOD) of the first SYSLIB DD statement with the data setname that contains the modified user exit load module.//SAMPLELK JOB ,// MSGCLASS=H,TIME=(,30),MSGLEVEL=(2,0),NOTIFY=&SYSUID,REGION=0M//*//LKED EXEC PGM=HEWL,REGION=4M,// PARM=’CALL,XREF,LIST,LET,MAP,RENT’//SYSLMOD DD DISP=SHR,DSN=USERID.OUTPUT.LOAD//SYSPRINT DD DISP=OLD,DSN=USERID.OUTPUT.LINKLIST(TESTPGM)//SYSUT1 DD UNIT=SYSDA,SPACE=(1024,(200,20))//*//SYSLIB DD DISP=SHR,DSN=hlq.SEQAMOD// DD DISP=SHR,DSN=CEE.SCEELKED//*//OBJECT DD DISP=SHR,DSN=USERID.INPUT.OBJECT//SYSLIN DD *
INCLUDE OBJECT(TESTPGM)INCLUDE SYSLIB(EQAD3CXT)NAME TESTPGM(R)
/*
Linking the CEEBXITA user exit into a private copy of a LanguageEnvironment runtime module
If you choose to customize a private copy of a Language Environment runtimeload module, you need to ensure that your private copy of these load modules isplaced ahead of your system copy of CEE.SCEERUN in your runtime environment.
Chapter 12. Specifying the TEST runtime options through the Language Environment user exit 113

The following table shows the Language Environment runtime load module andthe user exit needed for each environment.
Table 19. Language Environment runtime module and user exit required for variousenvironments
Environment User exit nameCEE loadmodule
The following types of DB2 stored procedures thatrun in WLM-established address spaces:
v type MAIN
v type SUB1
EQAD3CXT CEEPIPI
IMS TM and BTS EQAD3CXT CEEBINIT
Batch EQAD3CXT CEEBINIT
Note:
1. If you have installed the PTF for APAR PM15192 for Language EnvironmentVersion 1.10 to Version 1.12, or have Language Environment Version 1.13 orhigher, the type SUB stored procedure is invoked by the call_sub function andEQAD3CXT is not needed.
Edit and run sample hlq.SEQASAMP(EQAWLCE3) to create these updatedLanguage Environment runtime modules. This is typically done by the systemprogrammer installing z/OS Debugger. The sample creates the following loadmodule data sets:v hlq.DB2SP.SCEERUN(CEEPIPI)v hlq.IMSTM.SCEERUN(CEEBINIT)v hlq.BATCH.SCEERUN(CEEBINIT)
When you apply service to Language Environment that affects either of thesemodules (CEEPIPI or CEEBINIT) or you move to a new level of LanguageEnvironment, you need to rebuild your private copy of these modules by runningthe sample again.
Option 8 of the Debug Tool Utilities ISPF panel, "JCL for Batch Debugging", useshlq.BATCH.SCEERUN if you use Invocation Method E.
Creating and managing the TEST runtime options data setThe TEST runtime options data set is an MVS data set that contains the LanguageEnvironment runtime options. The z/OS Debugger Language Environment userexit EQAD3CXT constructs the name of this data set based on a naming patterndescribed in “Modifying the naming pattern” in the IBM z/OS DebuggerCustomization Guide.
You can create this data set in one of the following ways:v By using Terminal Interface Manager (TIM), as described in “Creating and
managing the TEST runtime options data set by using Terminal InterfaceManager (TIM)” on page 115.
v By using IBM z/OS Debugger Utilities option 6, "z/OS Debugger User Exit DataSet", as described in “Creating and managing the TEST runtime options data setby using IBM z/OS Debugger Utilities” on page 117.
v By using the DTSP Profile view. To learn more about this view, see "AppendixK: Using the IBM Debug Tool plug-ins (deprecated)" on page 545.
114 IBM z/OS Debugger V14.1.9 User's Guide

v By configuring the Remote Profile tab from one of the following debugconfigurations:– Remote DB2 Application– Remote IMS Application– Remote IMS Application with Isolation– MVS Batch Application
Creating and managing the TEST runtime options data set byusing Terminal Interface Manager (TIM)
Note: This section is not applicable to IBM Developer for z Systems(non-Enterprise Edition), IBM Z Open Development, or IBM Z Open Unit Test.
Before you begin, verify that the user ID that you use to log on to TerminalInterface Manager (TIM) has permission to read and write the TEST runtimeoptions data set.
To create the TEST runtime options data set by using Terminal Interface Manager,do the following steps:1. Log on to Terminal Interface Manager.2. In the z/OS Debugger TERMINAL INTERFACE MANAGER panel, press
PF10.3. In the * Specify TEST Run-time Option Data Set * panel, type in the name of
a data set which follows the naming pattern specified by your systemadministrator, in the Data Set Name field. If the data set is not cataloged, typein a volume serial.
4. Press Enter. If Terminal Interface Manager cannot find the data set, it displaysthe * Allocate TEST Run-time Option Data Set * panel. Specify allocationparameters for the data set, then press Enter. Terminal Interface Managercreates the data set.
5. In the * Edit TEST Run-time Option Data Set * panel, make the followingchanges:
Program name(s)Specify the names of up to eight programs you want to debug. You canspecify specific names (for example, EMPLAPP), names appended with awildcard character (*), or just the wildcard character (which means youwant to debug all Language Environment programs).
Test OptionSpecify whether to use TEST or NOTEST runtime option.
Test LevelSpecify which TEST level to use: ALL, ERROR, or NONE.
Commands FileIf you want to use a commands file, specify the name of a commands filein the format described in the commands_file_designator section of the topic“Syntax of the TEST run-time option” in the IBM z/OS Debugger Referenceand Messages manual.
Prompt LevelSpecify whether to use PROMPT or NOPROMPT.
Preferences FileIf you want to use a preferences file, specify the name of a preferences file
Chapter 12. Specifying the TEST runtime options through the Language Environment user exit 115
in the format described in the preferences_file_designator section of the topic“Syntax of the TEST run-time option” in the IBM z/OS Debugger Referenceand Messages manual.
EQAOPTS FileIf you want z/OS Debugger to run any EQAOPTS commands at run time,specify the name of the EQAOPTS file as a fully-qualified data set name.
Other run-time optionsType in any other Language Environment runtime options.
6. Terminal Interface Manager displays the part of the TEST runtime option thatspecifies which session type (debugging mode and display information) youwant to use under the Current debug display information field. To change thesession type, do the following steps:a. Press PF9.b. In the Change session type panel, select one of the following options:
Full-screen mode using the z/OS Debugger Terminal Interface ManagerType in the user ID you will use to log on to Terminal InterfaceManager and debug your program in the User ID field.
Remote debug modeType in the IP address in the Address field and port number in the Portfield of the remote debugger's daemon.
c. (Optional) Press Enter. Terminal Interface Manager accepts the changes andrefreshes the panel.
d. Press PF4. Terminal Interface Manager displays the * Edit TEST Run-timeOption Data Set * panel and under the Current debug session type string:displays one of the following strings:v VTAM%userid, if you selected Full-screen mode using the z/OS Debugger
Terminal Interface Manager.v TCPIP&IP_address%port, if you selected Remote debug mode.
7. Press PF4 to save your changes to the TEST runtime options data set and toreturn to the main Terminal Interface Manager screen.
Refer to the following topics for more information related to the material discussedin this topic.v For more information about the values to specify for the Test Option, Test Level,
and Prompt Level fields, see the topic “Syntax of the TEST run-time option” inthe IBM z/OS Debugger Reference and Messages manual.
v For instructions on creating a commands file or preferences file, see the topics“Creating a commands file” on page 186 or “Creating a preferences file” on page169.
v For instructions on creating an EQAOPTS file, see the topic “ProvidingEQAOPTS commands at run time” in the IBM z/OS Debugger Reference andMessages manual or IBM z/OS Debugger Customization Guide.
v For more information about other Language Environment runtime options, seeLanguage Environment Programming Reference, SA22-7562.
v For more information about the values to specify for the Full-screen mode usingthe z/OS Debugger Terminal Interface Manager field, see “Starting a debuggingsession in full-screen mode using the Terminal Interface Manager or a dedicatedterminal” on page 143.
v For more information about the values to specify for the Remote debug modefield, see the online help for the remote GUI.
116 IBM z/OS Debugger V14.1.9 User's Guide

Creating and managing the TEST runtime options data set byusing IBM z/OS Debugger Utilities
Note: This section is not applicable to IBM Developer for z Systems(non-Enterprise Edition), IBM Z Open Development, or IBM Z Open Unit Test.
To create the TEST runtime options data set by using IBM z/OS Debugger Utilities,do the following steps:1. Start IBM z/OS Debugger Utilities and select option 6, "z/OS Debugger User
Exit Data Set".2. Provide the name of a new or existing data set. Make sure the name matches
the naming pattern. If you do not know the naming pattern, ask your systemadministrator. Remember the following rules:v Substitute the &PGMNAME token with the name of the program you want to
debug. The program must be the main CSECT of the load module in aLanguage Environment enclave.
v For IMS, &USERID token might be substituted with one of the followingvalues:– IMS user ID, if users sign on to IMS.– TSO user ID, if users do not sign on to IMS.
3. Fill out the rest of the fields with the TEST runtime options you want to useand the names of up to eight additional programs to debug.
4. For IMS, you can also fill out the IMS Subsystem ID, or IMS Transaction IDfield, or both. If provided, the IDs are used as additional filtering criteria.
5. For batch, you can also specify the Job name or Step name fields, or both. Ifprovided, the names are used as additional filtering criteria.You can use a wildcard (*) at the end of a job name or step name. For example,a job name of JOB1* means that a job name that starts with JOB1 passes thematching test, like JOB1, JOB1A, or JOB1ABC; a job name of * means that anyjob name passes the matching test.
Chapter 12. Specifying the TEST runtime options through the Language Environment user exit 117

118 IBM z/OS Debugger V14.1.9 User's Guide
Part 3. Starting z/OS Debugger
© Copyright IBM Corp. 1992, 2019 119

120 IBM z/OS Debugger V14.1.9 User's Guide

Chapter 13. Writing the TEST run-time option string
The instructions in this section apply to programs that run in LanguageEnvironment. For programs that do not run in Language Environment, refer to theinstructions in “Starting z/OS Debugger for programs that start outside ofLanguage Environment” on page 147.
This topic describes some of the factors you should consider when you use theTEST runtime option, provides examples, and describes other runtime options youmight need to specify. The syntax of the TEST runtime option is described in thetopic “TEST run-time option” in IBM z/OS Debugger Reference and Messages.
To specify how z/OS Debugger gains control of your application and begins adebug session, you use the TEST run-time option. The simplest form of the TESToption is TEST with no suboptions specified; however, suboptions provide you withmore flexibility. There are four types of suboptions available, summarized below.
test_levelDetermines what high-level language conditions raised by your programcause z/OS Debugger to gain control of your program
commands_fileDetermines which primary commands file is used as the initial source ofcommands
prompt_levelDetermines whether an initial commands list is unconditionally run duringprogram initialization
preferences_file Specifies the session parameter and a file that you can use to specifydefault settings for your debugging environment, such as customizing thesettings on the z/OS Debugger Profile panel
Special considerations while using the TEST run-time optionWhen you use the TEST run-time option, there are several implications to consider,which are described in this section.
Defining TEST suboptions in your programIn C, C++ or PL/I, you can define TEST with suboptions using a #pragma runoptsor PLIXOPT string, then specify TEST with no suboptions at run time. This causesthe suboptions specified in the #pragma runopts or PLIXOPT string to take effect.
You can change the TEST/NOTEST run-time options at any time with the SET TESTcommand.
Suboptions and NOTESTSome suboptions are disabled with NOTEST, but are still allowed. This means youcan start your program using the NOTEST option and specify suboptions you mightwant to take effect later in your debug session. The program begins to run withoutz/OS Debugger taking control.
© Copyright IBM Corp. 1992, 2019 121

To enable the suboptions you specified with NOTEST, start z/OS Debugger duringyour program's run time by using a library service call such as CEETEST, PLITEST,or the __ctest() function.
Implicit breakpointsIf the test level in effect causes z/OS Debugger to gain control at a condition or ata particular program location, an implicit breakpoint with no associated action isassumed. This occurs even though you have not previously defined a breakpointfor that condition or location using an initial command string or a primarycommands file. Control is given to your terminal or to your primary commandsfile.
Primary commands file and USE fileThe primary commands file acts as a surrogate terminal. After it is accessed as asource of commands, it continues to act in this capacity until all commands havebeen run or the application has ended. This differs from the USE file in that, if aUSE file contains a command that returns control to the program (such as STEP orGO), all subsequent commands are discarded. However, USE files started fromwithin a primary commands file take on the characteristics of the primarycommands file and can be run until complete.
The initial command list, whether it consists of a command string included in therun-time options or a primary commands file, can contain a USE command to getcommands from a secondary file. If started from the primary commands file, aUSE file takes on the characteristics of the primary commands file.
Running in batch modeIn batch mode, when the end of your commands file is reached, a GO command isrun at each request for a command until the program terminates. If anothercommand is requested after program termination, a QUIT command is forced.
Starting z/OS Debugger at different pointsIf z/OS Debugger is started during program initialization, it is started before allthe instructions in the main prolog are run. At that time, no program blocks areactive and references to variables in the main procedure cannot be made, compileunits cannot be called, and the GOTO command cannot be used. However, referencesto static variables can be made.
If you enter the STEP command at this point, before entering any other commands,both program and Language Environment initialization are completed and you aregiven access to all variables. You can also enter all valid commands.
If z/OS Debugger is started while your program is running (for example, by usinga CEETEST call), it might not be able to find all compile units associated with yourapplication. Compile units located in load modules that are not currently active arenot known to z/OS Debugger, even if they were run prior to z/OS Debugger'sinitialization.
For example, suppose load module mod1 contains compile units cu1 and cu2, bothcompiled with the TEST option. The compile unit cu1 calls cux, contained in loadmodule mod2, which returns after it completes processing. The compile unit cu2contains a call to the CEETEST library service. When the call to CEETEST initializesz/OS Debugger, only cu1 and cu2 are known to z/OS Debugger. z/OS Debuggerdoes not recognize cux.
122 IBM z/OS Debugger V14.1.9 User's Guide
The initial command string is run only once, when z/OS Debugger is firstinitialized in the process.
Commands in the preferences file are run only once, when z/OS Debugger is firstinitialized in the process.
Session logThe session log stores the commands entered and the results of the execution ofthose commands. The session log saves the results of the execution of thecommands as comments. This allows you to use the session log as a commandsfile.
Refer to the following topics for more information related to the material discussedin this topic.
Related tasks“Link-editing EQADCCXT into your program” on page 89Related referencesIBM z/OS Debugger Reference and Messages
Precedence of Language Environment runtime optionsThe Language Environment runtime options have the following order ofprecedence (from highest to lowest):1. Installation options in the CEEDOPT file that were specified as nonoverrideable
with the NONOVR attribute.2. Options specified by the Language Environment assembler user exit. In the
CICS environment, z/OS Debugger uses the DTCN transaction and thecustomized Language Environment user exit EQADCCXT, which is link-editedwith the application. In the IMS Version 8 environment, IMS retrieves theoptions that most closely match the options in its Language Environmentruntime options table. You can edit this table by using IBM z/OS DebuggerUtilities.
3. Options specified at the invocation of your application, using the TEST runtimeoption, unless accepting runtime options is disabled by Language Environment(EXECOPS/NOEXECOPS).
4. Options specified within the source program (with #pragma or PLIXOPT) orapplication options specified with CEEUOPT and link-edited with yourapplication.If the object module for the source program is input to the linkage editor beforethe CEEUOPT object module, then these options override CEEUOPT defaults.You can force the order in which objects modules are input by using linkageeditor control statements.
5. Region-wide CICS or IMS options defined within CEEROPT.6. Option defaults specified at installation in CEEDOPT.7. IBM-supplied defaults.
Suboptions are processed in the following order:1. Commands entered at the command line override any defaults or suboptions
specified at run time.2. Commands run from a preferences file override the command string and any
defaults or suboptions specified at run time.
Chapter 13. Writing the TEST run-time option string 123
3. Commands from a commands file override default suboptions, suboptionsspecified at run time, commands in a command string, and commands in apreferences file.
Refer to the following topics for more information related to the material discussedin this topic.
Related referencesz/OS Language Environment Programming Guide
Example: TEST run-time optionsThe following examples of using the TEST run-time option are provided toillustrate run-time options available for your programs. They do not illustratecomplete commands. The complete syntax of the TEST run-time option can befound in the IBM z/OS Debugger Reference and Messages.
NOTEST z/OS Debugger is not started at program initialization. Note that a call toCEETEST, PLITEST, or __ctest() causes z/OS Debugger to be started duringthe program's execution.
NOTEST(ALL,MYCMDS,*,*)z/OS Debugger is not started at program initialization. Note that a call toCEETEST, PLITEST, or __ctest() causes z/OS Debugger to be started duringthe program's execution. After z/OS Debugger is started, the suboptionsspecified become effective and the commands in the file allocated to DDname of MYCMDS are processed.
If you specify NOTEST and control has returned from the program in whichz/OS Debugger first became active, you can no longer debugnon-Language Environment programs or detect non-LanguageEnvironment events.
TEST Specifying TEST with no suboptions causes a check for other possibledefinitions of the suboption. For example, C and C++ allow defaultsuboptions to be selected at compile time using #pragma runopts. Similarly,PL/I offers the PLIXOPT string. Language Environment provides the macroCEEXOPT. Using this macro, you can specify installation andprogram-specific defaults.
If no other definitions for the suboptions exist, the IBM-supplied defaultsuboptions are (ALL, *, PROMPT, INSPPREF).
TEST(ALL,*,*,*)z/OS Debugger is not started initially; however, any condition or anattention in your program causes z/OS Debugger to be started, as does acall to CEETEST, PLITEST, or __ctest(). Neither a primary commands filenor preferences file is used.
TEST(NONE,,*,*)z/OS Debugger is not started initially and begins by running in a"production mode", that is, with minimal effect on the processing of theprogram. However, z/OS Debugger can be started using CEETEST, PLITEST,or __ctest().
TEST(ALL,test.scenario,PROMPT,prefer)z/OS Debugger is started at the end of environment initialization, butbefore the main program prolog has completed. The ddname prefer isprocessed as the preferences file, and subsequent commands are found indata set test.scenario. If all commands in the commands file areprocessed and you issue a STEP command when prompted, or a STEP
124 IBM z/OS Debugger V14.1.9 User's Guide

command is run in the commands file, the main block completesinitialization (that is, its AUTOMATIC storage is obtained and initial valuesare set). If z/OS Debugger is reentered later for any reason, it continues toobtain commands from test.scenario repeating this process untilend-of-file is reached. At this point, commands are obtained from yourterminal.
TEST(ALL,,,MFI%F000:)When running under CICS, z/OS Debugger displays its screens onterminal ID F000.
TEST(ALL,,,MFI%TRMLU001:)For use with full-screen mode using a dedicated terminal without TerminalInterface Manager. The VTAM LU TRMLU001 is used for display. Thisterminal must be known to VTAM and not in session when z/OSDebugger is started.
TEST(ALL,,,MFI%SYSTEM01.TRMLU001:)For use in the following situation:v You are using full-screen mode using a dedicated terminal without
Terminal Interface Manager.v You must specify a network identifier.
The VTAM LU TRMLU001 on network node SYSTEM01 is used fordisplay. This terminal must be known to VTAM and not in session whenz/OS Debugger is started.
TEST(ALL,,,VTAM%USERABCD:)For use with full-screen mode using the Terminal Interface Manager. Theuser accessed the z/OS Debugger Terminal Interface Manager with user idUSERABCD.
Remote debug modeIf you are working in remote debug mode, that is, you are debugging yourhost application from your workstation, the following examples apply:TEST(,,,TCPIP&machine.somewhere.something.com%8001:*)TEST(,,,TCPIP&9.2404.79%8001:*)TEST(,,,DBMDT%USERABCD:*)NOTEST(,,,TCPIP&9.2411.55%8001:*)
Refer to the following topics for more information related to the material discussedin this topic.
Related referencesz/OS Language Environment Programming Guide
Specifying additional run-time options with VS COBOL II and PL/Iprograms
There are two additional run-time options that you might need to specify to debugCOBOL and PL/I programs: STORAGE and TRAP(ON).
Specifying the STORAGE run-time optionThe STORAGE run-time option controls the initial content of storage when allocatedand freed, and the amount of storage that is reserved for the "out-of-storage"condition. When you specify one of the parameters in the STORAGE run-time option,all allocated storage processed by the parameter is initialized to that value. If yourprogram does not have self-initialized variables, you must specify the STORAGErun-time option.
Chapter 13. Writing the TEST run-time option string 125

Specifying the TRAP(ON) run-time optionThe TRAP(ON) run-time option is used to fully enable the Language Environmentcondition handler that passes exceptions to the z/OS Debugger. Along with theTEST option, it must be used if you want the z/OS Debugger to take controlautomatically when an exception occurs. You must also use the TRAP(ON) run-timeoption if you want to use the GO BYPASS command and to debug handlers youhave written. Using TRAP(OFF) with the z/OS Debugger causes unpredictableresults to occur, including the operating system cancelling your application andz/OS Debugger when a condition, abend, or interrupt is encountered.
Note: This option replaces the OS PL/I and VS COBOL II STAE/NOSTAE options.
Specifying TEST run-time option with #pragma runopts in C and C++The TEST run-time option can be specified either when you start your program, ordirectly in your source by using this #pragma:#pragma runopts (test(suboption,suboption...))
This #pragma must appear before the first statement in your source file. Forexample, if you specified the following in the source:#pragma runopts (notest(all,*,prompt))
then entered TEST on the command line, the result would beTEST(ALL,*,PROMPT).
TEST overrides the NOTEST option specified in the #pragma and, because TEST doesnot contain any suboptions of its own, the suboptions ALL, *, and PROMPT remain ineffect.
If you link together two or more compile units with differing #pragmas, the optionsspecified with the first compile are honored. With multiple enclaves, the optionsspecified with the first enclave (or compile unit) started in each new process arehonored.
If you specify options on the command line and in a #pragma, any options enteredon the command line override those specified in the #pragma unless you specifyNOEXECOPS. Specifying NOEXECOPS, either in a #pragma or with the EXECOPS compileroption, prevents any command line options from taking effect.
Refer to the following topics for more information related to the material discussedin this topic.
Related tasksz/OS XL C/C++ User's Guide
126 IBM z/OS Debugger V14.1.9 User's Guide

Chapter 14. Starting z/OS Debugger from the IBM z/OSDebugger Utilities
Note: This chapter is not applicable to IBM Developer for z Systems(non-Enterprise Edition), IBM Z Open Development, or IBM Z Open Unit Test.
The z/OS Debugger Setup File option (also called z/OS Debugger Setup Utilitiesor DTSU) in IBM z/OS Debugger Utilities helps you manage setup files whichstore the following information:v file allocation statementsv run-time optionsv program parametersv the name of your program
Then you use the setup files to run your program in foreground or batch. Thez/OS Debugger Setup Utility (DTSU) RUN command performs the file allocationsand then starts the program with the specified options and parameters in theforeground. The DTSU SUBMIT command submits a batch job to start the program.
Refer to the following topics for more information related to the material discussedin this topic.
Related tasks“Creating the setup file”“Editing an existing setup file” on page 128“Saving your setup file” on page 130“Starting your program” on page 130
Creating the setup fileYou can have several setup files, but you must create them one at a time. To createa setup file, do the following steps:1. From the IBM z/OS Debugger Utilities panel, select the z/OS Debugger Setup
File option.2. In the z/OS Debugger Foreground – Edit Setup File panel, type the name of
the new setup file in the Setup File Library or Other Data Set Name field. Donot specify a member name if you are creating a sequential data set. If you arecreating a setup file for a DB2 program, select the Initialize New setup file forDB2 field. Press Enter.
3. A panel similar to the ISPF 3.2 "Allocate New Data Set" panel appears whenyou enter the name of the new set up file in the Other Data Set Name field.You can modify the default allocation parameters. Enter the END command orpress PF3 to continue.
4. The Edit – Edit Setup File panel appears. You can enter file allocationstatements, run-time options, and program parameters.
Refer to the following topics for more information related to the material discussedin this topic.
Related tasks“Entering file allocation statements, runtime options, and program parameters”on page 128
© Copyright IBM Corp. 1992, 2019 127

Editing an existing setup fileYou can have several setup files, but you can edit only one file at a time. To editan existing setup file, do the following steps:1. From the IBM z/OS Debugger Utilities panel, select the z/OS Debugger Setup
File option.2. In the z/OS Debugger Foreground – Edit Setup File panel, type the name of
the existing setup file in the Setup File Library or Other Data Set Name field.Press Enter to continue.
3. The Edit – Edit Setup File panel appears. You can modify file allocationstatements, run-time options, and program parameters.
Refer to the following topics for more information related to the material discussedin this topic.
Related tasks“Entering file allocation statements, runtime options, and program parameters”
Copying information into a setup file from an existing JCLYou can enter the COPY command to copy an EXEC statement and its associatedDD statements from another data set containing JCL.
You can use option A to select a step of a job, and convert it to the setup fileformat.
Entering file allocation statements, runtime options, and programparameters
The top part of the Edit–Setup File panel contains the name of the program (loadmodule) that you want to run and the runtime parameter string. If the setup file isfor a DB2 program, the panel also contains fields for the DB2 System identifier andthe DB2 plan. The bottom part of the Edit–Setup File panel contains the fileallocation statements. This part of the panel is similar to an ISPF edit panel. Youcan insert new lines, copy (repeat) a line, delete a line, and type over informationon a line.
To modify the name of the load module, type the new name in the Load ModuleName field.
To modify the parameter string:1. Select the format of the parameter string and whether the program is to start in
the Language Environment. Non-Language Environment COBOL programs donot run in Language Environment. If you are debugging a non-LanguageEnvironment COBOL program, select the non-Language Environment option.
2. Enter the parameter string in one of the following ways:v Type the parameter string in the Enter / to modify parameters field.v Type a slash ("/") before the Enter / to modify parameters field and press
Enter. The z/OS Debugger Foreground - Modify Parameter String panelappears. Define your runtime options and suboptions by doing the followingsteps:a. Define the TEST run-time option and its suboptions.
128 IBM z/OS Debugger V14.1.9 User's Guide
b. Enter any Language Environment or z/OS Debugger runtime options andother program parameters.
c. Press PF3. DTSU creates the parameter string from the options that youspecified and puts it in the Enter / to modify parameters field.
In the file allocation section of the panel, each line represents an element of a DDname allocation or concatenation. The statements can be modified, copied, deleted,and reordered.
To modify a statement, do one of the following steps:v Modify the statement directly on the Edit – Edit Setup File panel:
1. Move your cursor to the statement you want to modify.2. Type the new information over the existing information.3. Press Enter.
v Modify the statement by using a select command:1. Move your cursor to the statement you want to modify.2. Type one of the following select commands:
– SA - Specify allocation information– SD - Specify DCB information– SS - Specify SMS information– SP - Specify protection information– SO - Specify sysout information– SX - Specify all DD information by column display– SZ - Specify all DD information by section display
3. Press Enter.
To copy a statement, do the following steps:1. Move your cursor to the Cmd field of the statement you want to copy.2. Type R and press Enter. The statement is copied into a new line immediately
following the current line.
To delete a statement, do the following steps:1. Move your cursor to the Cmd field of the statement you want to delete.2. Type D and press Enter. The statement is deleted.
IBM z/OS Debugger Utilities does not support reordering the DD names, only thedata sets within each concatenation. The DD names are automatically sorted inalphabetical order. To reorder statements in a concatenation, do the following steps:1. Move your cursor to the sequence number field of a statement you want to
move and enter the new sequence number.
To insert a new line, do the following steps:1. Move your cursor to the Cmd field of the line right above the line you want a
new statement inserted.2. Type I and press Enter.3. Move your cursor to the new line and type in the new information or use one
of the Select commands.
The Edit and Browse line commands allow you to modify or view the contents ofthe data set name specified for DD and SYSIN DD types.
Chapter 14. Starting z/OS Debugger from the IBM z/OS Debugger Utilities 129

You can use the DDNAME STEPLIB to specify the load module search order.
For additional help, move the cursor to any field and enter the HELP command orpress PF1.
Refer to the following topics for more information related to the material discussedin this topic.
Related tasks“Saving your setup file”
Saving your setup fileTo save your information, enter the SAVE command. To save your information in asecond data set and continue editing in the second data set, enter the SAVE AScommand.
To save your setup file and exit the Edit–Edit Setup File panel, enter the ENDcommand or press PF3.
To exit the Edit–Edit Setup File panel without saving any changes to your setupfile, enter the CANCEL command or press PF12.
Refer to the following topics for more information related to the material discussedin this topic.
Related tasks“Starting your program”
Starting your programTo perform the allocations and run the program with the specified parameterstring, enter the RUN command or press PF4.
To generate JCL from the information in the setup file and then submit to the batchjob, enter the SUBMIT command or press PF10.
130 IBM z/OS Debugger V14.1.9 User's Guide
Chapter 15. Starting z/OS Debugger from a program
The instructions in this section apply to programs that run in LanguageEnvironment. For programs that do not run in Language Environment, refer to theinstructions in “Starting z/OS Debugger for programs that start outside ofLanguage Environment” on page 147.
z/OS Debugger can also be started directly from within your program using oneof the following methods:v Language Environment provides the callable service CEETEST that is started from
Language Environment-enabled languages.v For C or C++ programs, you can use a __ctest() function call or include a
#pragma runopts specification in your program.
Note: The __ctest() function is not supported in CICS.v For PL/I programs, you can use a call to PLITEST or by including a PLIXOPT
string that specifies the correct TEST run-time suboptions to start z/OSDebugger.
However, you cannot use these methods in DB2 stored procedures with thePROGRAM TYPE of SUB.
If you use these methods to start z/OS Debugger, you can debug non-LanguageEnvironment programs and detect non-Language Environment events only in theenclave in which z/OS Debugger first appeared and in subsequent enclaves. Youcannot debug non-Language Environment programs or detect non-LanguageEnvironment events in higher-level enclaves.
To start z/OS Debugger using these alternatives, you still need to be aware of theTEST suboptions specified using NOTEST, CEEUOPT, or other "indirect" settings.
“Example: using CEETEST to start z/OS Debugger from C/C++” on page 134“Example: using CEETEST to start z/OS Debugger from COBOL” on page 136“Example: using CEETEST to start z/OS Debugger from PL/I” on page 137Related tasks“Starting z/OS Debugger with CEETEST”“Starting z/OS Debugger with PLITEST” on page 138“Starting z/OS Debugger with the __ctest() function” on page 139“Starting z/OS Debugger under CICS by using CEEUOPT” on page 154
Refer to the following topics for more information related to the material discussedin this topic.
Related references“Special considerations while using the TEST run-time option” on page 121
Starting z/OS Debugger with CEETESTUsing CEETEST, you can start z/OS Debugger from within your program and sendit a string of commands. If no command string is specified, or the command stringis insufficient, z/OS Debugger prompts you for commands from your terminal orreads them from the commands file. In addition, you have the option of receivinga feedback code that tells you whether the invocation procedure was successful.
© Copyright IBM Corp. 1992, 2019 131

If you don't want to compile your program with hooks, you can use CEETEST callsto start z/OS Debugger at strategic points in your program. If you decide to usethis method, you still need to compile your application so that symbolicinformation is created.
Using CEETEST when z/OS Debugger is already initialized results in a reentry thatis similar to a breakpoint.
The following diagrams describe the syntax for CEETEST:
For C and C++
►► void CEETEST ( , ) ;string_of_commands fc
►◄
For COBOL
►► CALL "CEETEST" USING string_of_commands , fc ; ►◄
For PL/I
►► CALL CEETEST ( * , * ) ;string_of_commands fc
►◄
string_of_commands (input)Halfword-length prefixed string containing a z/OS Debugger command list.The command string string_of_commands is optional.
If z/OS Debugger is available, the commands in the list are passed to thedebugger and carried out.
If string_of_commands is omitted, z/OS Debugger prompts for commands ininteractive mode.
For z/OS Debugger, remember to use the continuation character if yourcommand exceeds 72 characters.
The first command in the command string can indicate that you want to startz/OS Debugger in one of the following debug modes:v full-screen mode using the Terminal Interface Managerv remote debug mode
To indicate that you want to start z/OS Debugger in full-screen mode using adedicated terminal without Terminal Interface Manager, specify the MFIsuboption of the TEST runtime option with the LU name of the dedicatedterminal. For example, you can code the following call in your PL/I program:Call CEETEST(’MFI%TRMLU001:*;Query Location;Describe CUS;’,*);
For a COBOL program, you can code the following call:01 PARMS.05 LEN PIC S9(4) BINARY Value 43.05 PARM PIC X(43) Value ’MFI%TRMLU001:*;Query Location;Describe CUS;’.
CALL "CEETEST" USING PARMS FC.
132 IBM z/OS Debugger V14.1.9 User's Guide
To indicate that you want to start z/OS Debugger in full-screen mode usingthe Terminal Interface Manager, specify the VTAM suboption of the TESTruntime option with the User ID that you supplied to the Terminal InterfaceManager. For example, you can code the following call in your PL/I program:Call CEETEST(VTAM%USERABCD:*;Query Location;Describe CUS;,*);
In these examples, the suboption :* can be replaced with the name of apreferences file. If you started z/OS Debugger the TEST runtime option andspecified a preferences file and you specify another preferences file in theCEETEST call, the preferences file in the CEETEST call replaces the preferences filespecified with the TEST runtime option.
To indicate that you want to start z/OS Debugger in remote debug mode,specify the DBMDT or TCPIP suboptions of the TEST runtime option with theuserid you logged on RSE with (DBMDT) or the IP address and port numberthat the remote debugger is listening to (TCPIP).
Note: You cannot use CEETEST to start z/OS Debugger in standard mode.
To start z/OS Debugger in Debug Tool compatibility mode during remotedebug by using Debug Manager and specify the user ID you logged on RSEwith, code the following call:Call CEETEST('DBMDT%userid:*;',*);
To start z/OS Debugger in Debug Tool compatibility mode and specify theTCP/IP address of your workstation, code the following call:Call CEETEST(’TCPIP&your.company.com%8001:*;’,*);
These calls must include the trailing semicolon (;).
fc (output)A 12-byte feedback code, optional in some languages, that indicates the result ofthis service.
CEE000
Severity = 0Msg_No = Not ApplicableMessage = Service completed successfully
CEE2F2
Severity = 3Msg_No = 2530Message = A debugger was not available
Note: The CEE2F2 feedback code can also be obtained by MVS/JES batchapplications. For example, either the z/OS Debugger environment wascorrupted or the debug event handler could not be loaded.
Language Environment provides a callable service called CEEDCOD to help youdecode the fields in the feedback code. Requesting the return of the feedback codeis recommended.
For C and C++ and COBOL, if z/OS Debugger was started through CALL CEETEST,the GOTO command is only allowed after z/OS Debugger has returned control toyour program via STEP or GO.
Chapter 15. Starting z/OS Debugger from a program 133

Additional notes about starting z/OS Debugger with CEETESTC and C++
Include leawi.h header file.
COBOLInclude CEEIGZCT. CEEIGZCT is in the Language Environment SCEESAMPdata set.
PL/I Include CEEIBMAW and CEEIBMCT. CEEIBMAW is in the Language EnvironmentSCEESAMP data set.
Batch and CICS nonterminal processesWe strongly recommend that you use feedback codes (fc) when usingCEETEST to initiate z/OS Debugger from a batch process or a CICSnonterminal task; otherwise, results are unpredictable.
QUIT DEBUGAfter you use QUIT DEBUG to stop your debug session, you can restart z/OSDebugger with CEETEST. To start z/OS Debugger when a CEETEST call isencountered, set the EQAOPTS CEEREACTAFTERQDBG command to YES.
Note: You cannot use CEETEST to start z/OS Debugger in standard modefor remote debugging.
“Example: using CEETEST to start z/OS Debugger from C/C++”“Example: using CEETEST to start z/OS Debugger from COBOL” on page 136“Example: using CEETEST to start z/OS Debugger from PL/I” on page 137Related tasks“Entering multiline commands in full-screen” on page 289Related referencesz/OS Language Environment Programming GuideIBM z/OS Debugger Reference and Messages
Example: using CEETEST to start z/OS Debugger from C/C++The following examples show how to use the Language Environment callableservice CEETEST to start z/OS Debugger from C or C++ programs.
Example 1 In this example, an empty command string is passed to z/OS Debuggerand a pointer to the Language Environment feedback code is returned. Ifno other TEST run-time options have been compiled into the program, thecall to CEETEST starts z/OS Debugger with all defaults in effect. After itgains control, z/OS Debugger prompts you for commands.#include <leawi.h>#include <string.h>#include <stdio.h>
int main(void) {_VSTRING commands;_FEEDBACK fc;
strcpy(commands.string, "");commands.length = strlen(commands.string);
CEETEST(&commands, &fc);
}
Example 2In this example, a string of valid z/OS Debugger commands is passed to
134 IBM z/OS Debugger V14.1.9 User's Guide

z/OS Debugger and a pointer to Language Environment feedback code isreturned. The call to CEETEST starts z/OS Debugger and the commandstring is processed. At statement 23, the values of x and y are displayed inthe Log, and execution of the program resumes. Barring further interrupts,the behavior at program termination depends on whether you have set ATTERMINATION:v If you have set AT TERMINATION, z/OS Debugger regains control and
prompts you for commands.v If you have not set AT TERMINATION, the program terminates.
The command LIST(z) is discarded when the command GO is executed.
Note: If you include a STEP or GO in your command string, all commandsafter that are not processed. The command string operates like acommands file.#include <leawi.h>#include <string.h>#include <stdio.h>
int main(void) {_VSTRING commands;_FEEDBACK fc;
strcpy(commands.string, "AT LINE 23; {LIST(x); LIST(y);} GO; LIST(z)");commands.length = strlen(commands.string);...CEETEST(&commands, &fc);...
}
Example 3In this example, a string of valid z/OS Debugger commands is passed toz/OS Debugger and a pointer to the feedback code is returned. If the callto CEETEST fails, an informational message is printed.
If the call to CEETEST succeeds, z/OS Debugger is started and thecommand string is processed. At statement 30, the values of x and y aredisplayed in the Log, and execution of the program resumes. Barringfurther interrupts, the behavior at program termination depends onwhether you have set AT TERMINATION:v If you have set AT TERMINATION, z/OS Debugger regains control and
prompts you for commands.v If you have not set AT TERMINATION, the program terminates.#include <leawi.h>#include <string.h>#include <stdio.h>
#define SUCCESS "\0\0\0\0"
int main (void) {
int x,y,z;_VSTRING commands;_FEEDBACK fc;
strcpy(commands.string,"AT LINE 30 { LIST(x); LIST(y); } GO;");commands.length = strlen(commands.string);...CEETEST(&commands,&fc);
Chapter 15. Starting z/OS Debugger from a program 135

...if (memcmp(&fc,SUCCESS,4) != 0) {
printf("CEETEST failed with message number %d\n",fc.tok_msgno);return(2999);
}}
Example: using CEETEST to start z/OS Debugger from COBOLThe following examples show how to use the Language Environment callableservice CEETEST to start z/OS Debugger from COBOL programs.
Example 1 A command string is passed to z/OS Debugger at its invocation and thefeedback code is returned. After it gains control, z/OS Debugger becomesactive and prompts you for commands or reads them from a commandsfile.01 FC.
02 CONDITION-TOKEN-VALUE.COPY CEEIGZCT.
03 CASE-1-CONDITION-ID.04 SEVERITY PIC S9(4) BINARY.04 MSG-NO PIC S9(4) BINARY.
03 CASE-2-CONDITION-IDREDEFINES CASE-1-CONDITION-ID.
04 CLASS-CODE PIC S9(4) BINARY.04 CAUSE-CODE PIC S9(4) BINARY.
03 CASE-SEV-CTL PIC X.03 FACILITY-ID PIC XXX.
02 I-S-INFO PIC S9(9) BINARY.77 Debugger PIC x(7) Value ’CEETEST’.
01 Parms.05 AA PIC S9(4) BINARY Value 14.05 BB PIC x(14) Value ’SET SCREEN ON;’.
CALL Debugger USING Parms FC.
Example 2A string of commands is passed to z/OS Debugger when it is started.After it gains control, z/OS Debugger sets a breakpoint at statement 23,runs the LIST commands and returns control to the program by runningthe GO command. The command string is already defined and assigned tothe variable COMMAND-STRING by the following declaration in the DATADIVISION of your program:01 COMMAND-STRING.
05 AA PIC 99 Value 60 USAGE IS COMPUTATIONAL.05 BB PIC x(60) Value ’AT STATEMENT 23; LIST (x); LIST (y); GO;’.
The result of the call is returned in the feedback code, using a variabledefined as:01 FC.
02 CONDITION-TOKEN-VALUE.COPY CEEIGZCT.
03 CASE-1-CONDITION-ID.04 SEVERITY PIC S9(4) BINARY.04 MSG-NO PIC S9(4) BINARY.
03 CASE-2-CONDITION-IDREDEFINES CASE-1-CONDITION-ID.
04 CLASS-CODE PIC S9(4) BINARY.04 CAUSE-CODE PIC S9(4) BINARY.
136 IBM z/OS Debugger V14.1.9 User's Guide

03 CASE-SEV-CTL PIC X.03 FACILITY-ID PIC XXX.
02 I-S-INFO PIC S9(9) BINARY.
in the DATA DIVISION of your program. You are not prompted forcommands.CALL "CEETEST" USING COMMAND-STRING FC.
Example: using CEETEST to start z/OS Debugger from PL/IThe following examples show how to use the Language Environment callableservice CEETEST to start z/OS Debugger from PL/I programs.
Example 1 No command string is passed to z/OS Debugger at its invocation and nofeedback code is returned. After it gains control, z/OS Debugger becomesactive and prompts you for commands or reads them from a commandsfile.CALL CEETEST(*,*); /* omit arguments */
Example 2A command string is passed to z/OS Debugger at its invocation and thefeedback code is returned. After it gains control, z/OS Debugger becomesactive and executes the command string. Barring any further interruptions,the program runs to completion, where z/OS Debugger prompts forfurther commands.DCL ch char(50)
init(’AT STATEMENT 10 DO; LIST(x); LIST(y); END; GO;’);
DCL 1 fb,5 Severity Fixed bin(15),5 MsgNo Fixed bin(15),5 flags,
8 Case bit(2),8 Sev bit(3),8 Ctrl bit(3),
5 FacID Char(3),5 I_S_info Fixed bin(31);
DCL CEETEST ENTRY ( CHAR(*) VAR OPTIONAL,1 optional ,
254 real fixed bin(15), /* MsgSev */254 real fixed bin(15), /* MSGNUM */254 /* Flags */,255 bit(2), /* Flags_Case */255 bit(3), /* Flags_Severity */255 bit(3), /* Flags_Control */
254 char(3), /* Facility_ID */254 fixed bin(31) ) /* I_S_Info */
options(assembler) ;
CALL CEETEST(ch, fb);
Example 3This example assumes that you use predefined function prototypes andmacros by including CEEIBMAW, and predefined feedback code constants andmacros by including CEEIBMCT.
A command string is passed to z/OS Debugger that sets a breakpoint onevery tenth executed statement. Once a breakpoint is reached, z/OS
Chapter 15. Starting z/OS Debugger from a program 137

Debugger displays the current location information and continues theexecution. After the CEETEST call, the feedback code is checked for properexecution.
Note: The feedback code returned is either CEE000 or CEE2F2. There is noway to check the result of the execution of the command passed.%INCLUDE CEEIBMAW;%INCLUDE CEEIBMCT;DCL 01 FC FEEDBACK;
/* if CEEIBMCT is NOT included, the following DECLARES need to beprovided: ---------- comment start -------------
Declare CEEIBMCT Character(8) Based;Declare ADDR Builtin;%DCL FBCHECK ENTRY;%FBCHECK: PROC( fbtoken, condition ) RETURNS( CHAR );
DECLAREfbtoken CHAR;condition CHAR;
RETURN(’(ADDR(’||fbtoken||’)–>CEEIBMCT = ’||condition||’)’);%END FBCHECK;%ACT FBCHECK;
---------- comment end --------------- */
Call CEETEST(’AT Every 10 STATEMENT * Do; Q Loc; Go; End;’||’List AT;’, FC);
If ¬FBCHECK(FC, CEE000)Then Put Skip List(’––––> ERROR! in CEETEST call’, FC.MsgNo);
Starting z/OS Debugger with PLITESTFor PL/I programs, the preferred method of Starting z/OS Debugger is to use thebuilt-in subroutine PLITEST. It can be used in exactly the same way as CEETEST,except that you do not need to include CEEIBMAW or CEEIBMCT, or performdeclarations.
The syntax is:
►► CALL PLITEST( character_string_expression )
; ►◄
character_string_expressionSpecifies a list of z/OS Debugger commands. If necessary, this is converted toa fixed-length string.
Note:
1. If z/OS Debugger executes a command in a CALL PLITEST command string thatcauses control to return to the program (GO for example), any commandsremaining to be executed in the command string are discarded.
2. If you don't want to compile your program with hooks, you can use CALLPLITEST statements as hooks and insert them at strategic points in yourprogram. If you decide to use this method, you still need to compile yourapplication so that symbolic information is created.
The following examples show how to use PLITEST to start z/OS Debugger forPL/I.
138 IBM z/OS Debugger V14.1.9 User's Guide

Example 1 No argument is passed to z/OS Debugger when it is started. After gainingcontrol, z/OS Debugger prompts you for commands.CALL PLITEST;
Example 2A string of commands is passed to z/OS Debugger when it is started.After gaining control, z/OS Debugger sets a breakpoint at statement 23,and returns control to the program. You are not prompted for commands.In addition, the List Y; command is discarded because of the execution ofthe GO command.CALL PLITEST(’At statement 23 Do; List X; End; Go; List Y;’);
Example 3Variable ch is declared as a character string and initialized as a string ofcommands. The string of commands is passed to z/OS Debugger when itis started. After it runs the commands, z/OS Debugger prompts you formore commands.DCL ch Char(45) Init(’At Statement 23 Do; List x; End;’);
CALL PLITEST(ch);
Starting z/OS Debugger with the __ctest() functionYou can also use the C and C++ library routine __ctest() or ctest() to start z/OSDebugger. Add:#include <ctest.h>
to your program to use the ctest() function.
Note: If you do not include ctest.h in your source or if you compile using theoption LANGLVL(ANSI), you must use __ctest() function. The __ctest() function isnot supported in CICS.
When a list of commands is specified with __ctest(), z/OS Debugger runs thecommands in that list. If you specify a null argument, z/OS Debugger getscommands by reading from the supplied commands file or by prompting you. Ifcontrol returns to your application before all commands in the command list arerun, the remainder of the command list is ignored. z/OS Debugger will continuereading from the specified commands file or prompt for more input.
If you do not want to compile your program with hooks, you can use __ctest()function calls to start z/OS Debugger at strategic points in your program. If youdecide to use this method, you still need to compile your application so thatsymbolic information is created.
Using __ctest() when z/OS Debugger is already initialized results in a reentrythat is similar to a breakpoint.
The syntax for this option is:
►► int(1)
__ctest ( char *char_str_exp ) ; ►◄
Notes:
1 The syntax for ctest() and __ctest() is the same.
Chapter 15. Starting z/OS Debugger from a program 139

char_str_expSpecifies a list of z/OS Debugger commands.
The following examples show how to use the __ctest() function for C and C++.
Example 1A null argument is passed to z/OS Debugger when it is started. After itgains control, z/OS Debugger prompts you for commands (or readscommands from the primary commands file, if specified).__ctest(NULL);
Example 2A string of commands is passed to z/OS Debugger when it is started. Atstatement 23, z/OS Debugger lists x and y, then returns control to theprogram. You are not prompted for commands. In this case, the commandlist z; is never executed because of the execution of the command GO.__ctest("at line 23 {"
" list x;"" list y;""}""go;""list z;");
Example 3Variable ch is declared as a pointer to character string and initialized as astring of commands. The string of commands is passed to z/OS Debuggerwhen it is started. After it runs the string of commands, z/OS Debuggerprompts you for more commands.char *ch = "at line 23 list x;";...__ctest(ch);
Example 4A string of commands is passed to z/OS Debugger when it is started.After z/OS Debugger gains control, you are not prompted for commands.z/OS Debugger runs the commands in the command string and returnscontrol to the program by way of the GO command.#include <stdio.h>#include <string.h>
char *ch = "at line 23 printf(\"x.y is %d\n\", x.y); go;";char buffer[35.132];
strcpy(buffer, "at change x.y;");
__ctest(strcat(buffer, ch));
140 IBM z/OS Debugger V14.1.9 User's Guide

Chapter 16. Starting z/OS Debugger in batch mode
Choose one of the following options to start z/OS Debugger in batch mode:v Follow the instructions outlined in this section. This includes modifying your
JCL to include the appropriate z/OS Debugger data sets and TEST runtimeoptions.
v Use the z/OS Debugger Setup Utility (DTSU). DTSU can generate JCL thatincludes the appropriate z/OS Debugger data sets and TEST runtime options,and can submit your batch job. For instructions on how to use DTSU, refer toChapter 14, “Starting z/OS Debugger from the IBM z/OS Debugger Utilities,”on page 127.
To start z/OS Debugger in batch mode without using DTSU, do the followingsteps:1. Ensure that you have compiled your program with the TEST compiler option.2. Modify the JCL that runs your batch program to include the appropriate z/OS
Debugger data sets and to specify the TEST run-time option.3. Run the modified JCL.
You can interactively debug an MVS batch job by choosing one of the followingoptions:v In full-screen mode using the Terminal Interface Manager. Follow the
instructions in “Starting a debugging session in full-screen mode using theTerminal Interface Manager or a dedicated terminal” on page 143.
v In remote debug mode. Follow the instructions in the topic “Preparing todebug” of the online help for the remote GUI.
Refer to the following topics for more information related to the material discussedin this topic.
Related tasksAppendix F, “Notes on debugging in batch mode,” on page 535Chapter 29, “Entering z/OS Debugger commands,” on page 287
Example: JCL that runs z/OS Debugger in batch modeSample JCL for a batch debug session for the COBOL program, EMPLRUN, isprovided below. The job card and data set names need to be modified to suit yourinstallation.//DEBUGJCL JOB <appropriate JOB card information>//* ****************************************************************//* JCL to run a batch z/OS Debugger session//* Program EMPLRUN was previously compiled with the COBOL//* compiler TEST option//* ****************************************************************//STEP1 EXEC PGM=EMPLRUN,// PARM=’/TEST(,INSPIN,,)’ ▌1▐//*//* Include the z/OS Debugger SEQAMOD data set//*//STEPLIB DD DISP=SHR,DSN=userid.TEST.LOAD// DD DISP=SHR,DSN=hlq.SEQAMOD//*//* Specify a commands file with DDNAME matching the one
© Copyright IBM Corp. 1992, 2019 141
//* specified in the /TEST runtime option above//* This example shows inline data but a data set could be//* specified like: //INSPIN DD DISP=SHR,DSN=userid.TEST.INSPIN//*//INSPIN DD *
STEP;AT *PERFORM
QUERY LOCATION;GO;
END-PERFORM;GO;QUIT;
/*//*//* Specify a log file for the debug session//* Log file can be a data set with LRECL >= 42 and <= 256//* For COBOL only, use LRECL <= 72 if you are planning to//* use the log file as a commands file in subsequent Debug//* Tool sessions. You can specify the log file like://* //INSPLOG DD DISP=SHR,DSN=userid.TEST.INSPLOG//*//INSPLOG DD SYSOUT=*,DCB=(LRECL=72,RECFM=FB,BLKSIZE=0)//SYSPRINT DD SYSOUT=*//SYSUDUMP DD DUMMY//SYSOUT DD SYSOUT=*/*//
Modifying the example to debug in full-screen modeThe example in “Example: JCL that runs z/OS Debugger in batch mode” on page141 can be modified so that the batch program can be debugged in full-screenmode. Change line ▌1▐ to one of the following examples:v To use full-screen mode using a dedicated terminal without Terminal Interface
Manager, use the following statement:// PARM=’/TEST(,INSPIN,,MFI%TRMLU001:)’
v To use full-screen mode using the Terminal Interface Manager, use the followingstatement:// PARM=’/TEST(,INSPIN,,VTAM%USERABCD:)’
142 IBM z/OS Debugger V14.1.9 User's Guide

Chapter 17. Starting z/OS Debugger for batch or TSOprograms
This section describes how to start z/OS Debugger to debug programs that run inthe following situations:v Programs that start in Language Environmentv Programs that start outside of Language Environment
Starting a debugging session in full-screen mode using the TerminalInterface Manager or a dedicated terminal
Note: This section is not applicable to IBM Developer for z Systems(non-Enterprise Edition), IBM Z Open Development, or IBM Z Open Unit Test.
You can debug batch programs interactively by using full-screen mode using theTerminal Interface Manager or full-screen mode using a dedicated terminal withoutTerminal Interface Manager. Before you start this debugging session, contact yoursystem administrator to verify that your system was customized to support thistype of debugging session, and for instructions on how to access a terminal thatsupports this mode.
You need to decide whether you will use the z/OS Debugger Terminal InterfaceManager. The z/OS Debugger Terminal Interface Manager enables you to associatea user ID with a specific dedicated terminal, which removes the need to updateyour runtime parameter string whenever the dedicated terminal LU name changes.This is the recommended method for most users.
To start a debugging session in full-screen mode using the Terminal InterfaceManager, do the following steps:1. Start two terminal emulator sessions in either of the following ways:v Two separate emulator windows.v If you use IBM Session Manager, you can select two sessions from the IBM
Session Manager menu.
In either case, connect the second emulator session to a terminal that canhandle a full-screen mode using the Terminal Interface Manager and that alsostarts the Terminal Interface Manager.
2. On the first terminal emulator session, log on to TSO.3. On the second terminal emulator session, provide your login credentials to the
Terminal Interface Manager and press Enter. The login credentials can be yourTSO user ID and password, password phrase, or MFA token.
Notes:
a. You are not logging on TSO. You are indicating that you want your user IDassociated with this terminal LU.
b. When the number of characters entered into the password field, includingblanks, exceeds 8, the input is passed to the security system as a passwordphrase.
© Copyright IBM Corp. 1992, 2019 143
|||
|||

A panel similar to the following panel is then displayed on the second terminalemulator session:
z/OS DEBUGGER TERMINAL INTERFACE MANAGER
EQAY001I Terminal TRMLU001 connected for user USER1EQAY001I Ready for z/OS Debugger
PF3=EXIT PF10=Edit LE options data set PF12=LOGOFF
The terminal is now ready to receive a z/OS Debugger full-screen mode usingthe Terminal Interface Manager session.
4. Edit the PARM string of your batch job so that you specify the TEST runtimeparameter as follows:TEST(,,,VTAM%userid:*)
Place a slash (/) before or after the parameter, depending on our programminglanguage. userid is the TSO user ID that you provided to the Terminal InterfaceManager.
5. Submit the batch job.6. On the second terminal emulator session, a full-screen mode debugging session
is displayed. Interact with it the same way you would with any otherfull-screen mode debugging session.
7. After you exit z/OS Debugger, the second terminal emulator session displaysthe panel and messages you saw in step 3. This indicates that z/OS Debuggercan use this session again. (this will happen each time you exit from z/OSDebugger).
8. If you want to start another debugging session, return to step 5. If you arefinished debugging, you can do one of the following tasks:v Close the second terminal emulator session.v Exit the Terminal Interface Manager by choosing one of the following
options:– Press PF12 to display the Terminal Interface Manager logon panel. You
can log in with the same ID or a different user ID.– Press PF3 to exit the Terminal Interface Manager.
To start a debugging session using a dedicated terminal without the z/OSDebugger Terminal Interface Manager, do the following steps:1. Ask your system programmer if you need to specify a VTAM network
identifier to communicate with the terminal LU you will use for display. If so,make a note of the network identifier.
144 IBM z/OS Debugger V14.1.9 User's Guide
2. Start two terminal emulator sessions. Connect the second emulator session to aterminal that can handle a full-screen mode debugging session through adedicated terminal.
3. On the first terminal emulator session, log on to TSO.4. On the second terminal emulator session, note the LU name of the terminal. If
a session manager is displayed, exit from it.5. Edit the PARM string of your batch job so that you specify the TEST runtime
parameter in one of the following ways:v
TEST(,,,MFI%luname:*)
vTEST(,,,MFI%network_identifier.luname:*)
Place a slash (/) before or after the parameter, depending on yourprogramming language. luname is the VTAM LU name of the second terminalemulator. network_identifier is the name of the VTAM network node thatcontains luname.
6. Submit the batch job.7. On the second terminal emulator session, a full-screen mode debugging session
is displayed. Interact with it the same way you would with any otherfull-screen mode debugging session.
8. After you exit z/OS Debugger, a USSMSG10 or Telnet Solicitor Logon panel isdisplayed on the second terminal emulator session.
9. Go back to step 6 if you need to restart the debugging session.
Starting z/OS Debugger for programs that start in LanguageEnvironment
Choose one of the following options to start z/OS Debugger under MVS in TSO:v You can follow the instructions outlined in this section. The instructions describe
how to allocate all the files you need to start your debug session and how tostart your program with the proper parameters.
v Use the z/OS Debugger Setup Utility (DTSU). DTSU helps you allocate all thefiles you need to start your debug session, and can start your program or submityour batch job. For instructions on using DTSU, refer to Chapter 14, “Startingz/OS Debugger from the IBM z/OS Debugger Utilities,” on page 127.
To start z/OS Debugger under MVS in TSO without using DTSU, do the followingsteps:1. Ensure your program has been compiled with the TEST compiler option.2. Ensure that the z/OS Debugger SEQAMOD library is in the load module
search path.
Note: High-level qualifiers and load library names are specific to yourinstallation. Ask the person who installed z/OS Debugger the name of the dataset. By default, the name of the data set ends in SEQAMOD. This data setmight already be in the linklist or included in your TSO logon procedure, inwhich case you don't need to do anything to access it.
3. Allocate all other data sets containing files your program needs.
Chapter 17. Starting z/OS Debugger for batch or TSO programs 145

4. Allocate any z/OS Debugger files that you want to use. For example, if youwant a session log file, allocate a data set for the session log file. Do notallocate the session log file to a terminal. For example, do not use ALLOCFI(INSPLOG) DA(*).
5. Start your program with the TEST run-time option, specifying the appropriatesuboptions, or include a call to CEETEST, PLITEST, or __ctest() in the program'ssource.
Refer to the following topics for more information related to the material discussedin this topic.
Related tasksChapter 13, “Writing the TEST run-time option string,” on page 121“Starting a debugging session in full-screen mode using the Terminal InterfaceManager or a dedicated terminal” on page 143“Recording your debug session in a log file” on page 188Chapter 15, “Starting z/OS Debugger from a program,” on page 131Related referencesIBM z/OS Debugger Reference and Messagesz/OS Language Environment Programming Guide
Example: Allocating z/OS Debugger load library data setThe following example CLIST fragments show how you might allocate the z/OSDebugger load library data set (SEQAMOD) if it is not in the linklist or TSO logonprocedure:
Example 1:PROC 0 TESTTSOLIB ACTIVATE DA(’hlq.SEQAMOD’)END
Example 2:PROC 0 TESTTSOLIB DEACTIVATEFREE FILE(SEQAMOD)ALLOCATE DA(’hlq.SEQAMOD’) FILE(SEQAMOD) SHR REUSETSOLIB ACTIVATE FILE(SEQAMOD)END
If you store either example CLIST in MYID.CLIST(DTSETUP), you can run the CLISTby entering the following command at the TSO READY prompt:EXEC ’MYID.CLIST(DTSETUP)’
The CLIST runs and the appropriate z/OS Debugger data set is allocated.
Example: Allocating z/OS Debugger filesThe following example illustrate how you can use the command line to allocate thepreferences and log files, then start the COBOL program tstscrpt with the TESTrun-time option:ALLOCATE FILE(insppref) data set(setup.pref) REUSEALLOCATE FILE(insplog) data set(session.log) REUSECALL ’USERID1.MYLIB(TSTSCRPT)’ ’/TEST’
The example illustrates that the default z/OS Debugger run-time suboptions andthe default Language Environment run-time options were assumed.
146 IBM z/OS Debugger V14.1.9 User's Guide
The following example illustrates how you can use a CLIST to define thepreferences file (debug.preferen) and the log file (debug.log), then start the Cprogram prog1 with the TEST run-time option:ALLOC FI(insplog) DA(debug.log) REUSEALLOC FI(insppref) DA(debug.preferen) REUSE
CALL ’MYID.MYQUAL.LOAD(PROG1)’ +’ TRAP(ON) TEST(,*,;,insppref)/’
All the data sets must exist before starting this CLIST.
Starting z/OS Debugger for programs that start outside of LanguageEnvironment
To debug an MVS batch or TSO program that has an initial program that does notrun under the control of Language Environment, including non-LanguageEnvironment COBOL programs, use the z/OS Debugger program EQANMDBG tostart z/OS Debugger.
If you need to debug a non-Language Environment program where EQANMDBGis used to start z/OS Debugger, and your program frees SUBPOOL 1 (which z/OSDebugger uses itself by default), you need to specify a new parm to EQANMDBG.
The parameter is NONLESP(nnn) where nnn is a SUBPOOL number from 2 - 127,that specifies the SUBPOOL for z/OS Debugger to use for its storage.
If the initial program does run under the control of Language Environment andsubsequent programs run outside the control of Language Environment, you canuse the methods described in “Starting z/OS Debugger for programs that start inLanguage Environment” on page 145 to debug all the programs.
To start z/OS Debugger by using EQANMDBG, do one of the following options:v By using the z/OS Debugger Setup Utility (DTSU) option 3 to run the programs
either under TSO or in MVS batch.v By modifying the MVS JCL, TSO CLIST or REXX EXEC that you use to start
your program, making the following changes:– Change the name of the program to be started to EQANMDBG.– Make one of the following updates:
- Change the parameters by adding the name of the program to be debuggedand any required z/OS Debugger run-time parameters. See “Passingparameters to EQANMDBG by using only the PARM string” on page 148for instructions.
- Add a EQANMDBG DD statement that provides the name of the programto be debugged and any required z/OS Debugger run-time parameters. See“Passing parameters to EQANMDBG using only the EQANMDBG DDstatement” on page 149 for instructions.
- Change the parameters by adding the name of the program to bedebugged, and add an EQANMDBG DD statement that provides anyrequired z/OS Debugger run-time parameters. See “Passing parameters toEQANMDBG using the PARM string and EQANMDBG DD statement” onpage 149 for instructions.
- Verify that the z/OS Debugger SEQAMOD and SEQABMOD libraries arein the load module search path.
Chapter 17. Starting z/OS Debugger for batch or TSO programs 147

Refer to the following topics for more information related to the material discussedin this topic.
Related tasksChapter 14, “Starting z/OS Debugger from the IBM z/OS Debugger Utilities,”on page 127
Passing parameters to EQANMDBGWhen you modify your JCL, CLIST, or REXX EXEC to start EQANMDBG, youpass the following parameters to EQANMDBG:v The name of the user program to be debugged (required)v Any of the following run-time options (optional):
– COUNTRY to specify a country code for z/OS Debugger– NATLANG to specify the national language used to communicate with z/OS
Debugger– NQNLESP to specify the SUBPOOL for z/OS Debugger to use for its storage– TEST to specify z/OS Debugger options. For example, you can use suboptions
of the TEST run-time option to specify the data sets that contain z/OSDebugger commands and preferences. You can use suboptions to specifywhether to use a remote debug mode session or a full-screen mode using theTerminal Interface Manager session.
– TRAP to specify whether z/OS Debugger is to intercept abends.
You can specify these parameters in one of following ways:v “Passing parameters to EQANMDBG by using only the PARM string”v “Passing parameters to EQANMDBG using only the EQANMDBG DD
statement” on page 149v “Passing parameters to EQANMDBG using the PARM string and EQANMDBG
DD statement” on page 149
Refer to the following topics for more information related to the material discussedin this topic.
Related referencesz/OS Debugger run-time options (IBM z/OS Debugger Reference and Messages)
Passing parameters to EQANMDBG by using only the PARMstringThe easiest way to pass parameters to EQANMDBG is to modify the PARM stringto contain the name of the program to be debugged, optionally followed by any ofthe z/OS Debugger run-time options and the parameters required by yourprogram.
The syntax for this string is:
►► user_program_name
▼
,
, run-time_parm
/ user_parms►◄
The following table compares how a sample JCL statement might look like afteryou modify the PARM string:
148 IBM z/OS Debugger V14.1.9 User's Guide

Original sample JCL Modified sample JCL
//STEP1 EXEC PGM=MYPROG,PARM=’ABC,X(12)’...//
//STEP1 EXEC PGM=EQANMDBG,// PARM=’MYPROG,NATLANG(UEN)/ABC,X(12)’...//
Passing parameters to EQANMDBG using only the EQANMDBGDD statementIf the user parameter string that you are passing to your program is too long toadd the necessary z/OS Debugger parameters to the PARM string, you can leavethe PARM string unchanged and pass all required parameters to z/OS Debuggerby using the EQANMDBG DD statement.
When you add an EQANMDBG DD statement to your JCL or allocate theEQANMDBG file in your TSO session, it can point to a data set with any RECFM(F, V, or U) and any LRECL. The data set must contain one or more lines. If itcontains more than one line, all trailing blanks are removed from each line.However, each line is assumed to start in column 1 with any leading blanksconsidered to be part of the parameter data. Sequence numbers are not supportedin this file.
The following table compares original JCL and modified JCL:
Original JCL Modified JCL
//STEP1 EXEC PGM=MYPROG,PARM=’ABC,X(12)’...//
//STEP1 EXEC PGM=EQANMDBG,// PARM=’ABC,X(12)’//EQANMDBG DD *MYPROG,TEST(ALL,INSPIN,,MFI:*),NATLANG(ENU)/*...//
Passing parameters to EQANMDBG using the PARM string andEQANMDBG DD statementWith this method you can put the name of the user program to be debugged aspart of the PARM string, and then specify all other z/OS Debugger run-timeoptions by using the EQANMDBG DD statement.
This can be desirable if you need to pass the same run-time parameters to severalprograms, you have room in the PARM string to add the name of the program tobe debugged, but you do not have room to add all of the run-time parameters tothe PARM string.
When you use this method, you must do the following:v Include an EQANMDBG DD statement that includes, at a minimum, an asterisk
as the first positional parameter to indicate that the user-program name is to betaken from the PARM string.
v Modify the PARM string to include the user-program name followed by a slashat the beginning of the PARM string.
The following table compares original JCL and modified JCL:
Chapter 17. Starting z/OS Debugger for batch or TSO programs 149

Original JCL Modified JCL
//STEP1 EXEC PGM=MYPROG,PARM=’ABC,X(12)’...//
//STEP1 EXEC PGM=EQANMDBG,// PARM=’MYPROG/ABC,X(12)’//EQANMDBG DD **,TEST(ALL,INSPIN,,MFI:*),NATLANG(ENU)/*...//
Example: Modifying JCL that invokes an assembler DB2program running in a batch TSO environment
The following example shows a portion of JCL that invokes an assembler DB2program and the modifications you make to this portion of the JCL to start z/OSDebugger.
Original sample JCL Modified sample JCL
//RUN EXEC PGM=IKJEFT01,DYNAMNBR=20//SYSTSIN DD *DSN SYSTEM(DB2_subsystem_id)RUN PROGRAM(MYPGM) PLAN(MYPGM) -
PARM(’program-parameters’)END/*// ... other DD statements as needed ...// ... for TSO and the application ...
//RUN EXEC PGM=IKJEFT01,DYNAMNBR=20//SYSTSIN DD *DSN SYSTEM(DB2_subsystem_id)RUN PROGRAM(EQANMDBG) PLAN(MYPGM) -
PARM(’program-parameters’)END/*//EQANMDBG DD *MYPGM,TEST(,,,VTAM%user-id:)/*// ... other DD statements as needed ...// ... for TSO and the application ...
150 IBM z/OS Debugger V14.1.9 User's Guide

Chapter 18. Starting z/OS Debugger under CICS
This topic compares the different methods you can use to start z/OS Debuggerand gives instructions on each method. This topic assumes you have completed thefollowing tasks:v Ensured that all of the required installation and configuration steps for CICS
Transaction Server, Language Environment, and z/OS Debugger have beencompleted. For more information, refer to the installation and customizationguides for each product.
v Completed all the tasks in the following topics:– Chapter 4, “Planning your debug session,” on page 25– Chapter 5, “Updating your processes so you can debug programs with z/OS
Debugger,” on page 63– Chapter 10, “Preparing a CICS program,” on page 89
Comparison of methods for starting z/OS Debugger under CICSThere are several different mechanisms available to start z/OS Debugger underCICS. Each mechanism has a different advantage and are listed below:v DTCN is a full-screen CICS transaction that z/OS Debugger provides. By using
DTCN, you can create a profile that contains a pattern of CICS resource namesthat identify a task that you want to debug. You can dynamically change anyLanguage Environment TEST or NOTEST runtime option that your application wasoriginally link-edited with. You can also use DTCN to dynamically change anyother Language Environment runtime options that are not specific to z/OSDebugger which are defined in your CICS installation except the STACK option.DTCN has the following advantages and differences compared to CADP:– Provides a plug-in for remote users. For more information, see "Appendix K:
Using the IBM Debug Tool plug-ins (deprecated)" on page 545.– Provides two mechanisms for managing debug profiles:
1. In a Temporary Storage Queue (TSQ) - debug profiles are owned by theterminal that created them. The debug profiles are deleted if the terminalthat created the profile is disconnected or the CICS region is terminated.Also, a single terminal can have only one debug profile.
2. In a VSAM file - debug profiles are owned by the user ID that createdthem. The debug profiles persist through disconnections or CICS regionrestarts. Also, a single terminal can have multiple debug profiles that arecreated by using different users.
– Provides general and field sensitive help.– Provides a service that deletes ownerless profiles from the DTCN repository.
See "Deleting DTCN profiles with the DTCN LINK service" in the IBM z/OSDebugger Customization Guide.
– Displays both the generated and saved repository runtime strings.– Provides the following additional CICS resources for identifying a task that
you want to debug:- Eight pairs of Load Module and CU Names (including wildcards)- IP Name/Address- Commarea Offset
© Copyright IBM Corp. 1992, 2019 151
- Commarea Data- Container Name- Container Offset- Container Data- URM Debugging
– Provides a EQAOPTS File field. You can use this field to specify a file thatcontains a set of z/OS Debugger EQAOPTS commands for the debug session.
To learn how to set up profiles by using DTCN, see Chapter 10, “Preparing aCICS program,” on page 89.
v CADP is a CICS transaction for you to manage debugging profiles. Thistransaction is available with CICS Transaction Server for z/OS Version 2 Release3.CADP has the following advantages and differences compared to DTCN:– With CADP, you can add multiple profiles from the same display device by
using a single program name. There is no limit to the number of supportedprofiles. You can specify the program names by using a wildcard.
– CADP provides the same abilities as DTCN for managing debug profiles forLanguage Environment applications. CADP can also manage debug profilesfor Java applications, Enterprise Java Beans (EJBs), and CORBA statelessobjects.
– CADP profiles are persistent, and are kept in VSAM files. Persistence meansthat if a CADP profile is present before a CICS region is restarted, the CADPprofile is present after the CICS region is restarted.
– CADP profiles can be shared across a CICSPLEX.v Language Environment CEEUOPT module link-edited into your application,
containing an appropriate TEST option, which tells Language Environment tostart z/OS Debugger every time the application is run.This mechanism can be useful during initial testing of new code when you willwant to run z/OS Debugger frequently.
v A compiler directive within the application, such as #pragma runopts(test) (forC and C++) or CALL CEETEST.These directives can be useful when you need to run multiple debug sessions fora piece of code that is deep inside a multiple enclave or multiple CUapplication. The application runs without z/OS Debugger until it encounters thedirective, at which time z/OS Debugger is started at the precise point that youspecify. With CALL CEETEST, you can even make the invocation of z/OSDebugger conditional, depending on variables that the application can test.
If your program uses several of these methods, the order of precedence isdetermined by Language Environment. For more information about the order ofprecedence for Language Environment run-time options, see z/OS LanguageEnvironment Programming Guide.
Starting z/OS Debugger under CICS by using DTCNIf a DTCN profile exists, when a CICS program starts, z/OS Debugger analyzesthe program's resources to see if they match a profile. If z/OS Debugger finds amatch, z/OS Debugger starts a debugging session for that program. If multipleprofiles exist, z/OS Debugger selects the profile with the greatest number ofresources that match the program. If two programs have an equal number ofmatching resources, z/OS Debugger selects the older profile.
152 IBM z/OS Debugger V14.1.9 User's Guide
Before you begin, verify that you prepared your CICS program as instructed inChapter 10, “Preparing a CICS program,” on page 89.
To start z/OS Debugger under CICS by using DTCN, do the following steps:1. If you chose screen control mode, start the DTSC transaction on the terminal
you specified in the Display Id field.2. Run your CICS programs. If z/OS Debugger identifies a task that matches a
DTCN profile, z/OS Debugger starts. If you chose screen control mode, pressEnter on the terminal running the DTSC transaction to connect to z/OSDebugger.
Refer to the following topics for more information related to the material discussedin this topic.
Related tasks“Choosing TEST or NOTEST compiler suboptions for COBOL programs” onpage 27
Ending a CICS debugging session that was started by DTCNAfter you have finished debugging your program, use DTCN again to turn offyour debug profile by pressing PF6 to delete your debug profile and then pressingPF3 to exit. You do not need to remove EQADCCXT from the load module; in fact, it'sa good idea to leave it there for the next time you want to start z/OS Debugger.
Example: How z/OS Debugger chooses a CICS program fordebugging
For example, consider the following two profiles:v First, profile A is saved, specifying resource CU PROG1v Later, profile B is saved, specifying resource User Id USER1
When PROG1 is run by USER1, profile A is used.
If this situation occurs, an error message is displayed on the system console,suggesting that you should specify additional resources. In the above example,each profile should specify both a User Id and a CU resource.
Starting z/OS Debugger for CICS programs by using CADPBefore you begin, verify that you prepared your CICS program as instructed inChapter 10, “Preparing a CICS program,” on page 89.
To start z/OS Debugger under CICS by using CADP, do the following steps:1. If you chose screen control mode, start the DTSC transaction on the terminal
you specified in the Display Id field.2. Run your CICS programs. If z/OS Debugger identifies a task that matches a
CADP profile, z/OS Debugger starts. If you chose screen control mode, pressEnter on the terminal running the DTSC transaction to connect to z/OSDebugger.
Refer to the following topics for more information related to the material discussedin this topic.
Related tasks“Creating and storing debugging profiles with CADP” on page 101Related references
Chapter 18. Starting z/OS Debugger under CICS 153

CICS Supplied Transactions
Starting z/OS Debugger under CICS by using CEEUOPTTo request that Language Environment start z/OS Debugger every time theapplication is run, assemble a CEEUOPT module with an appropriate TESTrun-time option. It is a good idea to link-edit the CEEUOPT module into a libraryand just add an INCLUDE LibraryDDname(CEEUOPT-MemberName) statement to thelink-edit options when you link your application. Once the application programhas been placed in the load library (and NEWCOPY'd if required), whenever it isrun z/OS Debugger will be started.
z/OS Debugger runs in the mode defined in the TEST run-time option yousupplied, normally Single Terminal mode, although you could provide a primarycommands file and a log file and not use a terminal at all.
To start z/OS Debugger, simply run the application. Don't forget to remove theCEEUOPT containing your TEST run-time option when you have finisheddebugging your program.
Refer to the following topics for more information related to the material discussedin this topic.
Related tasksChapter 13, “Writing the TEST run-time option string,” on page 121
Starting z/OS Debugger under CICS by using compiler directivesWhen compile-directives are processed by your program, z/OS Debugger will bestarted in single terminal mode (this method supports only single terminal mode).
Refer to the following topics for more information related to the material discussedin this topic.
Related tasks“Starting z/OS Debugger with CEETEST” on page 131
154 IBM z/OS Debugger V14.1.9 User's Guide

Chapter 19. Starting a debug session
You can start z/OS Debugger by using the Language Environment TEST run-timeoption in one of the following ways:v Using the z/OS Debugger Setup Utility (DTSU). DTSU helps you allocate files
and can start your program. The methods listed below describe how youmanually perform the same tasks.
Note: DTSU is not available in IBM Developer for z Systems (non-EnterpriseEdition), IBM Z Open Development, or IBM Z Open Unit Test.
v For TSO programs that start in Language Environment, start your program withthe TEST run-time option as described in “Starting z/OS Debugger for programsthat start in Language Environment” on page 145.
v For MVS batch programs that start in Language Environment, start yourLanguage Environment program with the TEST runtime option and specify theappropriate suboptions, as described in Chapter 16, “Starting z/OS Debugger inbatch mode,” on page 141.
v For MVS batch programs that do not start in Language Environment, start thenon-Language Environment z/OS Debugger (EQANMDBG), and pass yourprogram name and the TEST runtime option. Specify the appropriate suboptions,as described in “Starting z/OS Debugger for programs that start outside ofLanguage Environment” on page 147.
v For CICS, make sure z/OS Debugger is installed in your CICS region. EnterDTCN or CADP (in CICS Transaction Server for z/OS Version 2 Release 3 andlater) to start the z/OS Debugger control transaction. Enter the name of thetransaction and program that you want to debug and any other criteria, such asterminal id or user id. If you are using DTCN, press PF4 to save the defaultdebugging profile, then press PF3 to exit the DTCN transaction. You are nowsetup to start your transaction and begin a debugging session.If you are using CADP to manage your debugging profiles, make sure that theDEBUGTOOL system initialization parameter is set to YES.
v For CICS transactions that run non-Language Environment assembler programsor non-Language Environment COBOL programs, verify with your systemadministrator that the z/OS Debugger CICS global user exits are installed andactive. If exits are active and the non-Language Environment assembler ornon-Language Environment COBOL programs are defined in a DTCN or CADPdebugging profile, z/OS Debugger will debug the non-Language Environmentassembler or non-Language Environment COBOL programs. These programsmust be the first program to run at a CICS Link Level (for example, at the startof a task or through a CICS LINK or XCTL request).
Refer to the following topics for more information related to the material discussedin this topic.
Related tasksChapter 14, “Starting z/OS Debugger from the IBM z/OS Debugger Utilities,”on page 127“Choosing TEST or DEBUG compiler suboptions for C programs” on page 41“Choosing TEST or DEBUG compiler suboptions for C++ programs” on page 46“Choosing TEST or NOTEST compiler suboptions for COBOL programs” onpage 27
© Copyright IBM Corp. 1992, 2019 155

“Choosing TEST or NOTEST compiler suboptions for PL/I programs” on page35“Ending a full-screen debug session” on page 214“Entering commands on the session panel” on page 171“Passing parameters to EQANMDBG” on page 148Related references“z/OS Debugger session panel” on page 161
156 IBM z/OS Debugger V14.1.9 User's Guide

Chapter 20. Starting z/OS Debugger in other environments
You can start z/OS Debugger to debug batch programs from DB2 storedprocedures.
Starting z/OS Debugger from DB2 stored proceduresBefore you run the stored procedure, verify that you have completed all theinstructions in Chapter 9, “Preparing a DB2 stored procedures program,” on page85.
To verify that the stored procedure has started, enter the following DB2 Displaycommand, where xxxx is the name of the stored procedure:Display Procedure(xxxx)
If the stored procedure is not started, enter the following DB2 command:Start procedure(xxxx)
If z/OS Debugger or the remote debugger do not start when the stored procedurecalls them, verify that you have correctly specified connection information (forexample, the TCP/IP address and port number) in the Language EnvironmentEQAD3CXT exit routine or the DB2 catalog.
Refer to the following topics for more information related to the material discussedin this topic.
Related tasksChapter 4, “Planning your debug session,” on page 25
© Copyright IBM Corp. 1992, 2019 157

158 IBM z/OS Debugger V14.1.9 User's Guide

Part 4. Debugging your programs in full-screen mode
Note: This part is not applicable to IBM Developer for z Systems (non-EnterpriseEdition), IBM Z Open Development, or IBM Z Open Unit Test.
© Copyright IBM Corp. 1992, 2019 159

160 IBM z/OS Debugger V14.1.9 User's Guide

Chapter 21. Using full-screen mode: overview
Note: This chapter is not applicable to IBM Developer for z Systems(non-Enterprise Edition), IBM Z Open Development, or IBM Z Open Unit Test.
The topics below describe the z/OS Debugger full-screen interface, and how to usethis interface to perform common debugging tasks.
Debugging your programs in full-screen mode is the easiest way to learn how touse z/OS Debugger, even if you plan to use batch or line modes later.
The following list describes the maximum screen size supported by z/OSDebugger for a particular type of terminal:v In full screen mode, you can use any screen size supported by ISPF.v In full-screen mode using the Terminal Interface Manager or a CICS terminal,
you can use a maximum screen size (number of rows times number of columns)of 10922. If the number of rows times the number of columns is not less than10923, z/OS Debugger displays a WTO error message and abends.
Note: The PF key definitions used in these topics are the default settings.
Refer to the following topics for more information related to the material discussedin this topic.
Related tasksChapter 19, “Starting a debug session,” on page 155“Ending a full-screen debug session” on page 214“Entering commands on the session panel” on page 171“Navigating through z/OS Debugger windows” on page 179“Recording your debug session in a log file” on page 188“Setting breakpoints to halt your program at a line” on page 190“Setting breakpoints in a load module that is not loaded or in a program that isnot active” on page 190“Stepping through or running your program” on page 192“Displaying and monitoring the value of a variable” on page 200“Displaying error numbers for messages in the Log window” on page 213“Displaying a list of compile units known to z/OS Debugger” on page 213“Requesting an attention interrupt during interactive sessions” on page 214Chapter 25, “Debugging a C program in full-screen mode,” on page 245Chapter 26, “Debugging a C++ program in full-screen mode,” on page 255Chapter 22, “Debugging a COBOL program in full-screen mode,” on page 217Chapter 24, “Debugging a PL/I program in full-screen mode,” on page 235
z/OS Debugger session panelThe z/OS Debugger session panel contains a header with information about theprogram you are debugging, a command line, and up to three physical windows.A physical window is the space on the screen dedicated to the display of a specifictype of debugging information. The debugging information is organized into thefollowing types, called logical windows:
Monitor windowVariables and their values, which you can display by entering the SETAUTOMONITOR ON and MONITOR commands.
© Copyright IBM Corp. 1992, 2019 161
Source windowThe source or listing file, which z/OS Debugger finds or you can specifywhere to find it.
Log windowThe record of your interactions with z/OS Debugger and the results ofthose interactions.
Memory windowSection of memory, which you can select by entering the MEMORY command.
Each physical window can be assigned only one logical window. The physicalwindow assumes the name of the logical window, so when you enter commandsthat affect the physical window (for example, the WINDOW SIZE command), youidentify the physical window by providing the name of its assigned logicalwindow. Physical windows can be closed (not displayed), but at least one physicalwindow must remain open at any time.
The z/OS Debugger session panel below shows the default layout which containsthree physical windows: one for the Monitor window ▌1▐, a second for the Sourcewindow ▌2▐, and the third for the Log window ▌3▐.
COBOL LOCATION: DTAM01 :> 109.1Command ===> Scroll ===> PAGEMONITOR -+----1----+----2----+----3----+----4----+----5----+----6- LINE: 1 OF 7**************************** TOP OF MONITOR **********************************
----+----1----+----2----+----3----+----4----0001 1 NUM1 00000000050002 2 NUM4 ’1111’ ▌1▐0003 3 WK-LONG-FIELD-2 ’123456790 223456790 323456790 423456790 52340004 56790 623456790 723456790 8234567890 92345670005 90 023456790 123456790 223456790 323456790 40006 23456790 5234567890 623456790 723456790 8234SOURCE: DTAM01 ---1----+----2----+----3----+----4----+----5--- LINE: 107 OF 196
107 * SINGLE DATAITEM IN A STRUCTURE .108 *------------------------------------------------------------- .109 ADD 1 TO AA-NUM1 ▌2▐ .110 .111 *------------------------------------------------------------- .112 * SINGLE DATAITEM IN A STRUCTURE - QUALIFIED .
LOG 0----+----1----+----2----+----3----+----4----+----5----+---- LINE: 40 OF 430040 MONITOR0041 LIST NUM4 ;0042 MONITOR ▌3▐0043 LIST WK-LONG-FIELD-2 ;
Refer to the following topics for more information related to the material discussedin this topic.
Related tasks“Customizing the layout of physical windows on the session panel” on page278Related references“Session panel header” on page 163“Monitor window” on page 165“Source window” on page 164“Log window” on page 166“Memory window” on page 167
162 IBM z/OS Debugger V14.1.9 User's Guide

Session panel headerThe first few lines of the z/OS Debugger session panel contain a command lineand header fields that display information about the program that you aredebugging.
Below is an example header for a C program.
C ▌1▐ LOCATION: MYID.SOURCE(TSTPGM1):>248 ▌2▐Command ===> ▌3▐ SCROLL ===> PAGE ▌4▐
▌5▐
Below is an example header for a COBOL program.
COBOL ▌1▐ LOCATION: XYZPROG::>SUBR:>118 ▌2▐Command ===> ▌3▐ SCROLL ===> PAGE ▌4▐
▌5▐...
The header fields are described below.
▌1▐ Assemble, C, COBOL, LX COBOL, Disassem, or PL/IThe name of the current programming language. This language is notnecessarily the programming language of the code in the Source window.The language that is displayed in this field determines the syntax rulesthat you must follow for entering commands.
Note:
1. z/OS Debugger does not differentiate between C and C++ programs. Ifthere is a C++ program in the Source window, only C is displayed inthis field.
2. LX COBOL is used to indicate LangX COBOL.
▌2▐ LOCATIONThe program unit name and statement where execution is suspended,usually in the form compile unit:>nnnnnn.
In the C example above, execution in MYID.SOURCE(TSTPGM1) is suspendedat line 248.
In the COBOL example above, execution in XYZPROG is suspended atXYZPROG::>SUBR:>118, or line 118 of subroutine SUBR.
If you are replaying recorded statements, the word "LOCATION" isreplaced by PBK<LOC or PBK>LOC. The < and > symbols indicate whether therecorded statements are being replayed in the backward (<) or forward (>)direction.
If you are using the Enterprise PL/I compiler or the C/C++ compiler, thecompile unit name is the entire data set name of the source. If the settingfor LONGCUNAME is ON (the default) to display the CU name in long form, thename might be truncated. If your PL/I program was compiled with thefollowing compiler and running in the following environment, the packagestatement or the name of the main procedure is displayed.v Enterprise PL/I for z/OS, Version 3.5, compiler with the PTFs for APARs
PK35230 and PK35489 applied, or Enterprise PL/I for z/OS, Version 3.6or later
Chapter 21. Using full-screen mode: overview 163

v Language Environment, Version 1.6 through 1.8 with the PTF for APARPK33738 applied, or later
▌3▐ COMMANDThe input area for the next z/OS Debugger command. You can enter anyvalid z/OS Debugger command here.
▌4▐ SCROLLThe number of lines or columns that you want to scroll when you enter aSCROLL command without an amount specified. To hide this field, enter theSET SCROLL DISPLAY OFF command. To modify the scroll amount, use theSET DEFAULT SCROLL command.
The value in this field is the operand applied to the SCROLL UP, SCROLLDOWN, SCROLL LEFT, and SCROLL RIGHT scrolling commands. Table 20 lists allthe scrolling commands.
Table 20. Scrolling commands
Command Description
n Scroll by n number of lines.
HALF Scroll by half a page.
PAGE Scroll by a full page.
TOP Scroll to the top of the data.
BOTTOM Scroll to the bottom of the data.
MAX Scroll to the limit of the data.
LEFT x Scroll to the left by x number of characters.
RIGHT x Scroll to the right by x number of characters.
CURSOR Position of the cursor.
TO x Scroll to line x, where x is an integer.
▌5▐ Message areasInformation and error messages are displayed in the space immediatelybelow the command line.
Source window▌1▐SOURCE: MULTCU ---1----+----2----+----3----+----4----+----5----+ LINE: 70 OF 85
70 PROCEDURE DIVISION. .71 ************************************************************** .72 * THIS IS THE MAIN PROGRAM AREA. This program only displays .73 * text.▌3▐ .74 ************************************************************** .
▌2▐ 75 DISPLAY "MULTCU COBOL SOURCE STARTED." UPON CONSOLE. .76 MOVE 25 TO PROGRAM-USHORT-BIN. .77 MOVE -25 TO PROGRAM-SSHORT-BIN. .▌4▐78 PERFORM TEST-900. .79 PERFORM TEST-1000. .80 DISPLAY "MULTCU COBOL SOURCE ENDED." UPON CONSOLE. .
The Source window displays the source file or listing. The Source window has fourparts, described below.
▌1▐ Header areaIdentifies the window, shows the compile unit name, and shows thecurrent position in the source or listing.
164 IBM z/OS Debugger V14.1.9 User's Guide

▌2▐ Prefix areaOccupies the left-most eight columns of the Source window. Containsstatement numbers or line numbers you can use when referring to thestatements in your program. You can use the prefix area to set, display, andremove breakpoints with the prefix commands AT, CLEAR, ENABLE, DISABLE,QUERY, and SHOW.
▌3▐ Source display areaShows the source code (for a C and C++ program), the source listing (for aCOBOL, LangX COBOL, or PL/I program), a pseudo assembler listing (foran assembler program), or the disassembly view (for programs withoutdebug information) for the currently qualified program unit. If the currentexecutable statement is in the source display area, it is highlighted.
▌4▐ Suffix areaA narrow, variable-width column at the right of the screen that z/OSDebugger uses to display frequency counts. It is only as wide as the largestcount it must display.
The suffix area is optional. To show the suffix area, enter SET SUFFIX ON. Tohide the suffix area, enter SET SUFFIX OFF. You can also set it on or offwith the Source Listing Suffix field in the Profile Settings panel.
The labeled header line for each window contains a scale and a line counter. If youscroll a window horizontally, the scale also scrolls to indicate the columnsdisplayed in the window. The line counter indicates the line number at the top of awindow and the total number of lines in that window. If you scroll a windowvertically, the line counter reflects the top line number currently displayed in thatwindow.
Refer to the following topics for more information related to the material discussedin this topic.
Related tasks“Entering prefix commands on specific lines or statements” on page 175“Customizing profile settings” on page 282
Monitor windowThe Monitor window displays the names and values of variables selected by theSET AUTOMONITOR or MONITOR commands.
The following diagram shows the default Monitor window and highlights theparts of the Monitor window:
COBOL LOCATION: DTAM01 :> 109.1Command ===> Scroll ===> PAGEMONITOR -+----1----+----2----+----3----+----4----+----5----+----6- LINE: 1 OF 7******************************** TOP OF MONITOR *******************************
-----+----1----+----2----+-▌1▐--3----+----4--0001 1 NUM1 00000000050002 2 NUM4 ’1111’ ▌2▐0003 3 WK-LONG-FIELD-2 ’123456790 223456790 323456790 423456790 52340004 ▌3▐ 56790 623456790 723456790 8234567890 92345670005 90 023456790 123456790 223456790 323456790 40006 ▌4▐ 23456790 5234567890 623456790 723456790 82340007 4 HEX-NUM1 X’ABCD 1234’
▌1▐ Monitor value scale, which provides a reference to help you measure thecolumn position in the Monitor value area.
▌2▐ Monitor value area, where z/OS Debugger displays the values of the
Chapter 21. Using full-screen mode: overview 165

variables. z/OS Debugger extends the display to the right up to the fullwidth of the displayable area of the Monitor window.
▌3▐ Monitor name area, where z/OS Debugger displays the names of thevariables.
▌4▐ Monitor reference number area, where z/OS Debugger displays thereference number it assigned to a variable.
When you enter the MONITOR LIST, MONITOR QUERY, MONITOR DESCRIBE, and SETAUTOMONITOR commands, z/OS Debugger displays the output in the Monitorwindow. If this window is not open, z/OS Debugger opens it when you enter aMONITOR or SET AUTOMONITOR command.
By default, the Monitor window displays a maximum of 1000 lines. You canchange this maximum by using the SET MONITOR LIMIT command. However,monitoring large amounts of data can use large amounts of storage, which mightcreate problems. Verify that there is enough storage available to monitor large dataitems or data items that contain a large number of elements. To find out thecurrent maximum, enter the QUERY MONITOR LIMIT command.
Refer to the following topics for more information related to the material discussedin this topic.
Related tasks“Adding variables to the Monitor window” on page 201“Replacing a variable in the Monitor window with another variable” on page203“Adding variables to the Monitor window automatically” on page 204“Scrolling through the physical windows” on page 180
Related references“SET MONITOR command” in IBM z/OS Debugger Reference and Messages“QUERY command” in IBM z/OS Debugger Reference and Messages
Log windowLOG 0----+----1----+----2----+----3----+----4----+----5----+----6 LINE: 6 OF 140007 MONITOR0008 LIST PROGRAM-USHORT-BIN ;0009 MONITOR0010 LIST PROGRAM-SSHORT-BIN ;0011 AT 75 ;0012 AT 77 ;0013 AT 79 ;0014 GO ;
The Log window records and displays your interactions with z/OS Debugger.
At the beginning of a debug session, if you have specified any of the followingfiles, the Log window displays messages indicating the beginning and end of anycommands issued from these files:v global preferences filev preferences filev commands file
If a global preferences file exists, the data set name of the global preferences file isdisplayed.
166 IBM z/OS Debugger V14.1.9 User's Guide

The following commands are not recorded in the Log window.PANEL
FIND
CURSOR
RETRIEVE
SCROLL
WINDOW
IMMEDIATE
QUERY prefix commandSHOW prefix command
If SET INTERCEPT ON is in effect for a file, that file's output also appears in the Logwindow.
You can optionally exclude STEP and GO commands from the log by specifying SETECHO OFF.
Commands that can be used with IMMEDIATE, such as the SCROLL and WINDOWcommands, are excluded from the Log window.
By default, the Log window keeps 1000 lines for display. The default value can bechanged by one of the following methods:v The system administrator changes it through a global preferences file.v You can change it through a preferences file.v You can change it by entering SET LOG KEEP n, where n is the number of lines
you want kept for display
The maximum number of lines is determined by the amount of storage available.
The labeled header line for each window contains a scale and a line counter. If youscroll a window horizontally, the scale also scrolls to indicate the columnsdisplayed in the window. The line counter indicates the line number at the top of awindow and the total number of lines in that window. If you scroll a windowvertically, the line counter reflects the top line number currently displayed in thatwindow.
Memory windowThe Memory window displays the contents of memory. The following figurehighlights the parts of the Memory window.
MEMORY---1----+----2----+----3----+----4----+----5----+----6----+----7----+- ▌1▐History: 24702630 2505A000▌2▐Base address: 265B1018 Amode: 31+00000 265B1018 11C3D6C2 D6D34040 4011D3D6 C3C1E3C9 | .COBOL .LOCATI |+00010 265B1028 D6D57A12 D7D9D6C7 F1407A6E 40F4F44B | ON:.PROG1 :> 44. |+00020 265B1038 F1404040 40404040 40404040 40404040 | 1 |+00030 265B1048 40404040 40404040 40404040 40404040 | ▌6▐ |+00040 265B1058 40404040 40404040 40404040 40404040 | |+00050 265B1068 11C39694 94819584 117E7E7E 6E009389 | .Command.===>.li |+00060 265B1078 A2A340A2 A3969981 87854DA2 A399F16B | st storage(str1, |+00070 265B1088 F3F25D40 40404040 40404040 40404040 | 32) |▌3▐ ▌4▐ ▌5▐
Chapter 21. Using full-screen mode: overview 167

▌1▐ Header areaThe header area identifies the window and contains a scale.
▌2▐Information areaThe information area displays a memory history of up to 8 base addresses.The information area also displays the address mode and up to 8 uniquebase addresses.
The following sections are collectively known as the memory dump area.
▌3▐ Offset column The offset column displays the offset from the base address of the line ofdata in memory.
▌4▐ Address columnThe address column displays the low-order 32 bits of the starting addressof the line of data in memory.
▌5▐ Hexadecimal data columnThe hexadecimal data area displays data in hexadecimal format. Each linedisplays 16 bytes of memory in four 4 byte groups.
▌6▐ Character data columnThe character data area displays data in character format. Each linedisplays 16 bytes of memory.
The maximum number of lines that the Memory window can display is limited tothe size of the window. You can use the SCROLL DOWN and SCROLL UP commands todisplay additional memory.
Refer to the following topics for more information related to the material discussedin this topic.
Related tasks“Navigating through the Memory window using the history area” on page 185
Command pop-up windowz/OS Debugger displays the Command pop-up window as a pop-up window overthe Source, Log, and Monitor windows so that you to can more easily enter longor multiline commands. z/OS Debugger displays the Command pop-up windowwhen any of the following situations occur:v You enter the POPUP commandv You enter an incomplete command on the command linev You enter a continuation character on the command linev You type over long text in the Source or Log window
You can control the size of the window by doing any of the following actions:v When you enter the POPUP command, specify the number of lines you want for
that particular instance of a Command pop-up windowv If you want the Command pop-up window to display the same number of lines
every time you enter the POPUP command, specify the number of lines you wantwith the SET POPUP command
v Resize the window by moving the cursor below the last line in the Commandpop-up window and then press Enter
After you finish entering commands, press Enter to run the commands and closethe window.
168 IBM z/OS Debugger V14.1.9 User's Guide
List pop-up windowWhen the Log window is not visible, z/OS Debugger displays the results of a LISTexpression command in the List pop-up window and writes the results to the log.If the expression evaluation fails, z/OS Debugger displays the List pop-up windowwith the error message. While the List pop-up window is open, you can not alterthe value of a variable. You can scroll up and down in the List pop-up window byentering the SCROLL UP and SCROLL DOWN commands in the Command line or usingthe appropriate PF key. The maximum lines of data for the List pop-up windowcan not exceed 1000 lines. If the result of the expression evaluation exceeds 1000lines, z/OS Debugger displays a warning message below the Command line. Toclose the List pop-up window, do either of the following:v Press Enter.v Enter any command except SCROLL UP or SCROLL DOWN in the Command line.
z/OS Debugger closes the window and runs the command.
Creating a preferences fileIf you have a preference as to the appearance or behavior of z/OS Debugger, youcan set these options in a preferences file. You can modify the layout of thewindows of the session panel, set PF keys to specific actions, or change the colorsuse in the session panel. “Saving customized settings in a preferences file” on page284 describes what you can specify in a preferences file and how to make z/OSDebugger use your preferences file.
If your site has preferences for all users to use, the system administrator can setthese preferences in a global preferences file. When z/OS Debugger starts, it doesthe following steps:1. Checks for a global preferences file specified through the EQAOPTS GPFDSN
command and runs any commands specified in that file.2. If you specify a preferences file, z/OS Debugger looks for that preferences file
and runs any commands in that preferences file. A preferences file can bespecified through one of the following methods:v directly; for example, through the TEST runtime optionv through the EQAOPTS PREFERENCESDSN command
3. If you specify a commands file, z/OS Debugger looks for that commands fileand runs any commands in that commands file. A commands file can bespecified through one of the following methods:v Directly, for example, through the TEST runtime option.v Through the EQAOPTS COMMANDSDSN command. If that file has a member in it
that matches the name of the initial load module in the first enclave, z/OSDebugger reads that member as a commands file.
Because of the order in which z/OS Debugger processes these files, any settingsthat you specify in your preferences and commands files can override settings inthe global preferences file. To learn how to specify EQAOPTS commands, see thetopic “EQAOPTS commands” in the IBM z/OS Debugger Reference and Messages orIBM z/OS Debugger Customization Guide. To learn about what format to use for theglobal preferences file, preferences file, and commands file, see Appendix A, “Datasets used by z/OS Debugger,” on page 443.
Chapter 21. Using full-screen mode: overview 169

Displaying the sourcez/OS Debugger displays your source in the Source Window using a source, listing,or separate debug file, depending on how you prepared your program.
When you start z/OS Debugger, if your source is not displayed, see “Changingwhich file appears in the Source window” for instructions on how find and displaythe source.
If there is no debug data, you can display the disassembled code by entering theSET DISASSEMBLY command.
If your programs contain DB2 or CICS code, you might need to use a different file.See Chapter 8, “Preparing a DB2 program,” on page 81 or Chapter 10, “Preparing aCICS program,” on page 89 for more information.
Refer to the following topics for more information related to the material discussedin this topic.
Related tasks“Choosing TEST or NOTEST compiler suboptions for COBOL programs” onpage 27Chapter 6, “Preparing a LangX COBOL program,” on page 73“Choosing TEST or NOTEST compiler suboptions for PL/I programs” on page35“Choosing TEST or DEBUG compiler suboptions for C programs” on page 41“Choosing TEST or DEBUG compiler suboptions for C++ programs” on page 46Chapter 7, “Preparing an assembler program,” on page 77Chapter 8, “Preparing a DB2 program,” on page 81Chapter 9, “Preparing a DB2 stored procedures program,” on page 85Chapter 10, “Preparing a CICS program,” on page 89Chapter 11, “Preparing an IMS program,” on page 105Related referencesAppendix B, “How does z/OS Debugger locate source, listing, or separatedebug files?,” on page 451IBM z/OS Debugger Reference and Messages
Changing which file appears in the Source windowThis topic describes several different ways of changing which file appears in theSource window. This topic assumes you already know the name of the source,listing, or separate debug file that you want to display. If you don't know thename of the file, see “Displaying a list of compile units known to z/OS Debugger”on page 213 for suggestions on how to find the name of a file.
Before you change the file that appears in the Source window, make sure youunderstand how z/OS Debugger locates source, listing, and separate debug filesby reading Appendix B, “How does z/OS Debugger locate source, listing, orseparate debug files?,” on page 451.
To change which file appears in the Source window, choose one of the followingoptions:v Type over the name after SOURCE:, which is in the Header area of the Source
window, with the desired name. The new name must be the name of a compileunit that is known to z/OS Debugger.
v Use the Source Identification panel to direct z/OS Debugger to the new files:1. With the cursor on the command line, press PF4 (LIST).
170 IBM z/OS Debugger V14.1.9 User's Guide

In the Source Identification panel, you can associate the source, listing, orseparate debug file that show in the Source window with their compile unit.
2. Type over the Listing/Source File field with the new name.v Use the SET SOURCE command. With the cursor on the command line, type SET
SOURCE ON (cuname) new_file_name, where new_file_name is the new source file.Press Enter.If you need to do this repeatedly, you can use the SET SOURCE ON commandsgenerated in the Log window. You can save these commands in a file andreissue them with the USE command for future invocations of z/OS Debugger.
v Enter the PANEL PROFILE command, which displays the Profile Settings panel.Enter the new file name in the Default Listing PDS name field.
v Use the SET DEFAULT LISTINGS command. With the cursor on the command line,type SET DEFAULT LISTINGS new_file_name, where new_file_name is the renamedlisting or separate debug file. Press Enter.To point z/OS Debugger to several renamed files, you can use the SET DEFAULTLISTINGS command and specify the renamed files, separated by commas andenclosed in parenthesis. For example, to point z/OS Debugger to the filesSVTRSAMP.TS99992.MYPROG, PGRSAMP.LLTEST.PROGA, and RRSAMP.CRTEST.PROGR,enter the following command:SET DEFAULT LISTINGS (SVTRSAMP.TS99992.MYPROG, PGRSAMP.LLTEST.PROGA,RRSAMP.CRTEST.PROGR) ;
v Use the EQADEBUG DD statement to define the location of the files.v Code the EQAUEDAT user exit with the location of the files.
For C and C++ programs compiled with the FORMAT(DWARF) and FILE suboptions ofthe DEBUG compiler option, the information in this topic describes how to specifythe location of the source file. If you or your site specified YES for the EQAOPTSMDBG command (which requires z/OS Debugger to search for the .dbg and thesource file in a .mdbg file)8, you cannot specify another location for the source file.
Entering commands on the session panelYou can enter a command or modify what is on the session panel in several areas,as shown in Figure 1 on page 172 and Figure 2 on page 173.
8. In situations where you can specify environment variables, you can set the environment variable EQA_USE_MDBG to YES orNO, which overrides any setting (including the default setting) of the EQAOPTS MDBG command.
Chapter 21. Using full-screen mode: overview 171
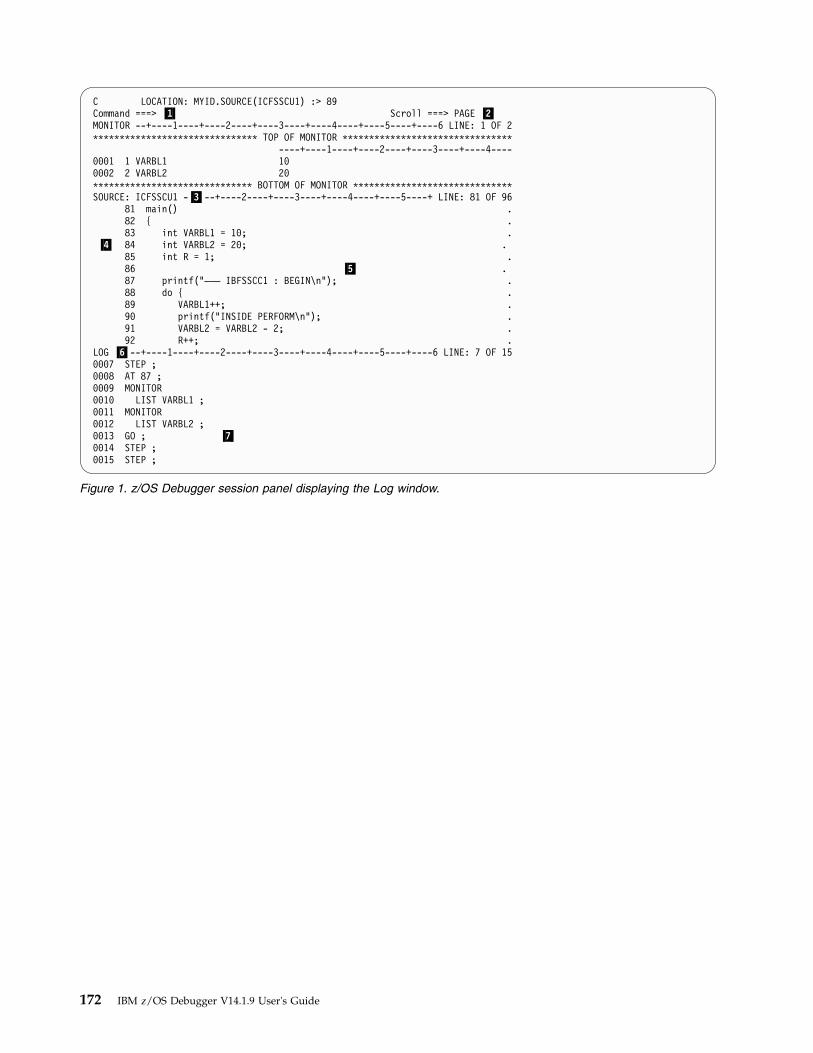
C LOCATION: MYID.SOURCE(ICFSSCU1) :> 89Command ===> ▌1▐ Scroll ===> PAGE ▌2▐MONITOR --+----1----+----2----+----3----+----4----+----5----+----6 LINE: 1 OF 2******************************* TOP OF MONITOR ********************************
----+----1----+----2----+----3----+----4----0001 1 VARBL1 100002 2 VARBL2 20****************************** BOTTOM OF MONITOR ******************************SOURCE: ICFSSCU1 -▌3▐--+----2----+----3----+----4----+----5----+ LINE: 81 OF 96
81 main() .82 { .83 int VARBL1 = 10; .
▌4▐ 84 int VARBL2 = 20; .85 int R = 1; .86 ▌5▐ .87 printf("––– IBFSSCC1 : BEGIN\n"); .88 do { .89 VARBL1++; .90 printf("INSIDE PERFORM\n"); .91 VARBL2 = VARBL2 - 2; .92 R++; .
LOG ▌6▐--+----1----+----2----+----3----+----4----+----5----+----6 LINE: 7 OF 150007 STEP ;0008 AT 87 ;0009 MONITOR0010 LIST VARBL1 ;0011 MONITOR0012 LIST VARBL2 ;0013 GO ; ▌7▐0014 STEP ;0015 STEP ;
Figure 1. z/OS Debugger session panel displaying the Log window.
172 IBM z/OS Debugger V14.1.9 User's Guide

Note: Figure 2 shows PF keys that were redefined. If you want to redefine your PFkeys, see “Defining PF keys” on page 277.
▌1▐ Command lineYou can enter any valid z/OS Debugger command on the command line.
▌2▐ Scroll areaYou can redefine the default amount you want to scroll by typing thedesired value over the value currently displayed.
▌3▐ Compile unit name areaYou can change the qualification by typing the desired qualification overthe value currently displayed. For example, to change the currentqualification from ICFSSCU1, as shown in the Source window header, toICFSSCU2, type ICFSSCU2 over ICFSSCU1 and press Enter.
▌4▐ Prefix areaYou can enter only z/OS Debugger prefix commands in the prefix area,located in the left margin of the Source window.
▌5▐ Source windowYou can modify any lines in the Source window and place them on thecommand line.
▌6▐ Window id areaYou can change your window configuration by typing the name of thewindow you want to display over the name of the window that iscurrently being displayed.
COBOL LOCATION: PROG1 :> 44Command ===> ▌1▐ Scroll ===> CSR ▌2▐MONITOR -+----1----+----2----+----3----+----4----+----5----+----6- LINE: 1 OF 2******************************* TOP OF MONITOR ********************************
----+----1----+----2----+----3----+----4----0001 1 STR1 ’ONE ’0002 2 STR3 ’THREE’****************************** BOTTOM OF MONITOR ******************************SOURCE: PROG1 -▌3▐-1----+----2----+----3----+----4----+----5----+ LINE: 43 OF 53
43 MOVE "ONE" TO STR1. MOVE "TWO" TO STR2. MOVE "THREE" TO S .44 MOVE "FOUR" TO STR4. MOVE "FIVE" TO STR5. .45 PERFORM UNTIL R = 9 .
▌4▐ 46 MOVE "TOP" TO STR1 MOVE "BEG" TO STR2 MOVE "UP" TO STR3 .47 ADD 1 TO VARBL1 .48 SUBTRACT 2 FROM VARBL2 ▌5▐ .49 ADD 1 TO R .50 MOVE "BOT" TO STR1 MOVE "END" TO STR2 MOVE "DOW" TO STR .51 END-PERFORM. .52 MOVE "DONE" TO STR1. MOVE "END" TO STR2. MOVE "FIN" TO ST .53 STOP RUN. .
****************************** BOTTOM OF SOURCE *******************************MEMOR▌6▐-+----2----+----3----+----4----+----5----+----6----+----7----+----8----+History: 329D47DA 329D65CC 329D88AB 329D8000
329D90E8 ▌8▐Base address: 329D90E8 Amode: 31+00000 329D90E8 D6D5C540 40000000 E3E6D640 40000000 | ONE ...TWO ... |+00010 329D90F8 E3C8D9C5 C5000000 00000000 00000000 | THREE........... |+00020 329D9108 00000000 00000000 00000000 00000000 | ................ |+00030 329D9118 00000000 00000000 00000000 00000000 | ................ |+00040 329D9128 00000000 00000000 00000000 00000000 | ................ |+00050 329D9138 00000000 00000000 00000000 00000000 | ................ |+00060 329D9148 00000000 00000000 00000000 00000000 | ................ |+00070 329D9158 00000000 00000000 00000000 00000000 | ................ |PF 1:ZOOM MEM 2:STEP 3:QUIT 4:SWAP 5:MEMORY 6:BREAKPF 7:UP 8:DOWN 9:GO 10:ZOOM SRC 11:ZOOM LOG 12:RETRIEVE
Figure 2. z/OS Debugger session panel displaying the Memory window.
Chapter 21. Using full-screen mode: overview 173
▌7▐ Log windowYou can modify any lines in the log and have z/OS Debugger place themon the command line.
▌8▐ Memory windowYou can modify memory or specify a new memory base address. Thiswindow is not displayed by default. You must enter the WINDOW SWAPMEMORY LOG command, WINDOW OPEN MEMORY command, or WINDOW ZOOMMEMORY command to display this window.
Refer to the following topics for more information related to the material discussedin this topic.
Related tasks“Using the session panel command line”“Issuing system commands” on page 175“Entering prefix commands on specific lines or statements” on page 175“Entering multiple commands in the Memory window” on page 176“Using commands that are sensitive to the cursor position” on page 177“Using Program Function (PF) keys to enter commands” on page 177“Retrieving previous commands” on page 178“Composing commands from lines in the Log and Source windows” on page178Related references“Order in which z/OS Debugger accepts commands from the session panel”“Initial PF key settings” on page 177
Order in which z/OS Debugger accepts commands from thesession panel
If you enter commands in more than one valid input area on the session panel andpress Enter, the input areas are processed in the following order of precedence.1. Prefix area2. Command line3. Compile unit name area4. Scroll area5. Window id area6. Source/Log window7. Memory window
Using the session panel command lineYou can enter any z/OS Debugger command in the command field. You can alsoenter any TSO command by prefixing them with SYSTEM or TSO. Commands can beup to 48 SBCS characters or 23 DBCS characters in length.
If you need to enter a lengthy command, z/OS Debugger provides a commandcontinuation character, the SBCS hyphen (-). When the current programminglanguage is C and C++, you can also use the backslash (\) as a continuationcharacter. You can continue requesting additional command lines by entering thecontinuation characters until you complete your command.
z/OS Debugger also provides automatic continuation if your command is notcomplete; for example, if you enter a left brace ({) without the matching right brace(}). If you need to continue your command, z/OS Debugger displays the
174 IBM z/OS Debugger V14.1.9 User's Guide

Command pop-up window. You type in the rest of your command and any othercommands. Press Enter to run the commands and close the Command pop-upwindow.
Refer to the following topics for more information related to the material discussedin this topic.
Related tasksChapter 29, “Entering z/OS Debugger commands,” on page 287
Issuing system commandsDuring your z/OS Debugger session, you can still access your base operatingsystem using the SYSTEM command. The string following the SYSTEM command ispassed on to your operating system. You can communicate with TSO in a TSOenvironment. For example, if you want to see a TSO catalog listing while in adebugging session, enter SYSTEM LISTC;.
When you are entering system commands, you must comply with the following:v A command is required after the SYSTEM keyword. Do not enter any required
parameters. z/OS Debugger prompts you.v If you are debugging in batch and need system services, you can include
commands and their requisite parameters in a CLIST and substitute the CLISTname in place of the command.
v If you want to enter several TSO commands, you can include them in a USE file,a procedure, or other commands list. Or you can enter:SYSTEM ISPF;
This starts ISPF and displays an ISPF panel on your host emulator screen thatyou can use to issue commands.
For CICS only: The SYSTEM command is not supported.
TSO is a synonym for the SYSTEM command. Truncation of the TSO command is notallowed.
Entering prefix commands on specific lines or statementsYou can type certain commands, known as prefix commands, in the prefix area ofspecific lines in the Source or Monitor window so that those commands affect onlythose lines. For example, you can type the AT command in the prefix area of line 8in the Source window, press Enter, then z/OS Debugger sets a statementbreakpoint only on line 8.
The following prefix commands can be entered in the prefix area of the Sourcewindow:v ATv CLEARv DISABLEv ENABLEv Lv Mv QUERYv RUNTOv SHOW
Chapter 21. Using full-screen mode: overview 175

The following prefix commands can be entered in the prefix area of the Monitorwindow, including the automonitor section:v HEXv DEFv CLv LISTv CC...code coverage(to clear a range of lines)
To enter a prefix command into the Source window, do the following steps:1. Scroll through the Source window until you see the line or lines of code you
want to change.2. Move your cursor to the prefix area of the line you want to change.3. Type in the appropriate prefix command.4. If there are multiple statements or verbs on the line, you can indicate which
statement or verb you want to change by typing in a number indicating therelative position of the statement or verb. For example, if there are threestatements on the line and you want to set a breakpoint on the third statement,type in a 3 following the AT prefix command. The resulting prefix command isAT 3.
5. If there are more lines you want to change, return to step 3.6. Press Enter. z/OS Debugger runs the commands you typed on the lines you
typed them on.
To enter a prefix command into the Monitor window, do the following steps:1. Scroll through the Monitor window until you see the line or lines you want to
change.2. Move your cursor to the prefix area of the line you want to change.3. Type in the appropriate prefix command.4. If there are more lines you want to change, return to step 3.5. Press Enter. z/OS Debugger runs the commands you typed on the lines you
typed them on.
Refer to the following topics for more information related to the material discussedin this topic.
Related referencesSET MONITOR command in IBM z/OS Debugger Reference and MessagesPrefix commands in IBM z/OS Debugger Reference and Messages
Entering multiple commands in the Memory windowYou can enter multiple commands and changes into the Memory window. z/OSDebugger processes the user input line by line, starting at the top of the Memorywindow, as described in the following list:1. History entry area. Processing stops at an invalid input, which displays an
error message, or after the first "G" or "R" command. The Memory window isrefreshed and the remaining commands and changes you typed into theMemory window are ignored.
2. Base address. Processing stops at an invalid input, which displays an errormessage; after valid input; or after the first "G" command. The Memorywindow is refreshed and the remaining commands and changes you typed intothe Memory window are ignored.
176 IBM z/OS Debugger V14.1.9 User's Guide

3. Address column. Processing stops at an invalid input, which displays an errormessage; after valid input; or after the first "G" command. The Memorywindow is refreshed and the remaining commands and changes you typed intothe Memory window are ignored.
4. Hexadecimal data area. Processing stops at an invalid input, which displays anerror message; after valid input; or after the first "G" command. Valid changesthat z/OS Debugger encounters before invalid changes or the "G" command areprocessed. The Memory window is refreshed and the remaining commands orchanges you typed into the Memory window are ignored.
Using commands that are sensitive to the cursor positionCertain commands are sensitive to the position of the cursor. These commands,called cursor-sensitive commands, include all those that contain the keyword CURSOR(AT CURSOR, DESCRIBE CURSOR, FIND CURSOR, LIST CURSOR, SCROLL...CURSOR, TRIGGERAT CURSOR, WINDOW...CURSOR).
To enter a cursor-sensitive command, type it on the command line, position thecursor at the location in your Source window where you want the command totake effect (for example, at the beginning of a statement or at a verb), and pressEnter.
You can also issue cursor-sensitive commands by assigning them to PF keys.
Note: Do not confuse cursor-sensitive commands with the CURSOR command,which returns the cursor to its last saved position.
Refer to the following topics for more information related to the material discussedin this topic.
Related tasks“Defining PF keys” on page 277
Using Program Function (PF) keys to enter commandsThe cursor-sensitive commands, as well as other full-screen tasks, can be issuedmore quickly by assigning the commands to PF keys. You can issue the WINDOWCLOSE, LIST, CURSOR, SCROLL TO, DESCRIBE ATTRIBUTES, RETRIEVE, FIND, WINDOW SIZE,and the scrolling commands (SCROLL UP, DOWN, LEFT, and RIGHT) this way. Using PFkeys makes tasks convenient and easy.
Refer to the following topics for more information related to the material discussedin this topic.
Related tasks“Defining PF keys” on page 277“Using commands that are sensitive to the cursor position”Related references“Initial PF key settings”
Initial PF key settingsThe table below shows the initial PF key settings.
PF key Label Definition Use
PF1 ? ? “Getting online help for z/OSDebugger command syntax” on page292
Chapter 21. Using full-screen mode: overview 177

PF key Label Definition Use
PF2 STEP STEP “Stepping through or running yourprogram” on page 192
PF3 QUIT QUIT “Ending a full-screen debug session”on page 214
PF4 LIST LIST “Displaying a list of compile unitsknown to z/OS Debugger” on page213
PF4 LIST LIST variable_name “Displaying and monitoring the valueof a variable” on page 200
PF5 FIND IMMEDIATE FIND “Finding a string in a window” onpage 182
PF6 AT/CLEAR AT TOGGLE CURSOR “Setting breakpoints to halt yourprogram at a line” on page 190
PF7 UP IMMEDIATE UP “Scrolling through the physicalwindows” on page 180
PF8 DOWN IMMEDIATE DOWN “Scrolling through the physicalwindows” on page 180
PF9 GO GO “Stepping through or running yourprogram” on page 192
PF10 ZOOM IMMEDIATE ZOOM “Zooming a window to occupy thewhole screen” on page 280
PF11 ZOOM LOG IMMEDIATE ZOOM LOG “Zooming a window to occupy thewhole screen” on page 280
PF12 RETRIEVE IMMEDIATE RETRIEVE “Retrieving previous commands”
Refer to the following topics for more information related to the material discussedin this topic.
Related tasks“Defining PF keys” on page 277
Retrieving previous commandsTo retrieve the last command you entered, press PF12 (RETRIEVE). The retrievedcommand is displayed on the command line. You can make changes to thecommand, then press Enter to issue it.
To step backwards through previous commands, press PF12 to retrieve eachcommand in sequence. If a retrieved command is too long to fit in the commandline, only its last line is displayed.
Refer to the following topics for more information related to the material discussedin this topic.
Related tasks“Composing commands from lines in the Log and Source windows”
Composing commands from lines in the Log and Sourcewindows
You can use lines in the Log and Source windows to compose new commands.
178 IBM z/OS Debugger V14.1.9 User's Guide

To compose a command from lines in the Log or Source window, do the followingsteps:1. Move the cursor to the desired line.2. Modify one or more lines that you want to include in the command. For
example, delete any comment characters.3. Press Enter. z/OS Debugger displays the input line or lines on the command
line. If the line or lines do not fit on the command line, z/OS Debuggerdisplays the Command pop-up window with the command as typed in so far.Any trailing blanks on the last line are removed. If you want to expand theCommand pop-up window, place the cursor below it and press Enter.
4. If the command is incomplete, modify the command.5. Press Enter to run the command.
Refer to the following topics for more information related to the material discussedin this topic.
Related tasks“Retrieving previous commands” on page 178Chapter 29, “Entering z/OS Debugger commands,” on page 287Related references“COBOL command format” on page 293“z/OS Debugger subset of PL/I commands” on page 311“PL/I language statements” on page 311“z/OS Debugger commands that resemble C and C++ commands” on page 323
Opening the Command pop-up window to enter long z/OSDebugger commands
If you need to enter a command that is longer than the length of the commandline, enter the POPUP command to open the Command pop-up window and thenenter your z/OS Debugger command.
z/OS Debugger automatically displays the Command pop-up window in thefollowing situations:v You enter an incomplete command on the command line.v You enter a continuation character on the command line.
You can enter the rest of your command in the Command pop-up window.
Navigating through z/OS Debugger windowsYou can navigate in any of the windows using the CURSOR command and thescrolling commands: SCROLL UP, DOWN, LEFT, RIGHT, TO, NEXT, TOP, and BOTTOM. Youcan also search for character strings using the FIND command, which scrolls youautomatically to the specified string.
The window acted upon by any of these commands is determined by one ofseveral factors. If you specify a window name (LOG, MEMORY, MONITOR, or SOURCE)when entering the command, that window is acted upon. If the command iscursor-oriented, the window containing the cursor is acted upon. If you do notspecify a window name and the cursor is not in any of the windows, the windowacted upon is determined by the settings of Default window and Default scrollamount under the Profile Settings panel.
Refer to the following topics for more information related to the material discussedin this topic.
Chapter 21. Using full-screen mode: overview 179
Related tasks“Moving the cursor between windows”“Scrolling through the physical windows”“Scrolling to a particular line number” on page 182“Finding a string in a window” on page 182“Changing which file appears in the Source window” on page 170“Displaying the line at which execution halted” on page 185“Customizing profile settings” on page 282
Moving the cursor between windowsTo move the cursor back and forth quickly from the Monitor, Source, or Logwindow to the command line, use the CURSOR command. This command, andseveral other cursor-oriented commands, are highly effective when assigned to PFkeys. After assigning the CURSOR command to a PF key, move the cursor bypressing that PF key. If the cursor is not on the command line when you issue theCURSOR command, it goes there. To return it to its previous position, press theCURSOR PF key again.
Refer to the following topics for more information related to the material discussedin this topic.
Related tasks“Defining PF keys” on page 277
Switching between the Memory window and Log windowz/OS Debugger has four logical windows, but can only display up to threephysical windows at a time. You can alternate between the Memory window andthe Log window by entering the WINDOW SWAP MEMORY LOG command on thecommand line. You can navigate through the physical windows by entering scrollcommands.
Refer to the following topics for more information related to the material discussedin this topic.
Related tasks“Scrolling to a particular line number” on page 182“Scrolling through the physical windows”
Scrolling through the physical windowsYou can scroll through the physical windows by using commands or PF keys.Either way, the placement of the cursor plays a key role in determining whichphysical window is affected by the command.
To scroll through a physical window by using commands, do the following steps:1. If you are going to scroll left or right through the Monitor value area of the
Monitor window, enter the SET MONITOR WRAP OFF command.2. Type in the scroll command in the command line, but do not press the Enter
key. You can enter any of the following scroll commands: SCROLL LEFT, SCROLLRIGHT, SCROLL UP, SCROLL DOWN . You cannot scroll left or right in the Memorywindow.
3. Move the cursor to the physical window or area of the physical window youwant to scroll through. In the Memory window, move the cursor to any sectionof the memory dump area. In the Monitor window, move the cursor to theMonitor value area to scroll left or right through that area. If you did not enterthe SET MONITOR WRAP OFF command, then the scroll command will scroll theentire window.
180 IBM z/OS Debugger V14.1.9 User's Guide

4. Press Enter.
If you scroll a window or area to the right or left, z/OS Debugger adjusts the scalein the window or area to indicate the columns displayed in the window. If youscroll a window up or down, the line counter reflects the top line numbercurrently displayed in that window. In the Memory window, if you scroll up ordown, all the sections of the memory dump area adjust to display the newinformation.
You can combine steps 2 and 3 above by using the command to indicate whichphysical window you want to scroll through. For example, if you want to scroll up5 lines in the physical window that is displaying the Monitor window, you enterthe command SCROLL UP 5 MONITOR.
To scroll through a physical window using PF keys, do the following steps:1. Move the cursor to the physical window or scrollable area you want to scroll
through. A scrollable area includes the memory dump area of the Memorywindow.
2. Press the PF7 (UP) key to scroll up or the PF8 (DOWN) key to scroll down. Thenumber of lines that you scroll through is determined by the value of theDefault scroll amount setting.
If you do not move the cursor to a specific physical window, the default logicalwindow is scrolled. To find out which logical window is the default logicalwindow, enter the QUERY DEFAULT WINDOW command.
Refer to the following topics for more information related to the material discussedin this topic.
Related tasks“Customizing the layout of physical windows on the session panel” on page278“Scrolling to a particular line number” on page 182“Customizing profile settings” on page 282“Enlarging a physical window”“Navigating through the Memory window using the history area” on page 185Related referencesQUERY command in IBM z/OS Debugger Reference and MessagesSCROLL command in IBM z/OS Debugger Reference and MessagesSET DEFAULT WINDOW command in IBM z/OS Debugger Reference andMessages
Enlarging a physical windowYou can enlarge a physical window to full screen by using the WINDOW ZOOMcommand or a PF key. To enlarge a physical window by using the WINDOW ZOOMcommand, type in WINDOW ZOOM, followed by the name of the physical window youwant to enlarge, then press Enter. To reduce the physical window back to itsoriginal size, enter the WINDOW ZOOM command again. For example, if you want toenlarge the physical window that is displaying the Monitor window, enter thecommand WINDOW ZOOM. To reduce the size of that physical window back to itsoriginal size, enter the command WINDOW ZOOM.
To enlarge a physical window by using a PF key, move the cursor into the physicalwindow that you want to enlarge, then press the PF10 (ZOOM) key. For example,if you want to enlarge the physical window that is displaying the Source window,
Chapter 21. Using full-screen mode: overview 181

move your cursor somewhere into the Source window, then press the PF10(ZOOM) key. To reduce the size of that physical window back to its original size,press the PF10 (ZOOM) key.
Refer to the following topics for more information related to the material discussedin this topic.
Related tasks“Customizing the layout of physical windows on the session panel” on page278Related referencesWINDOW command in IBM z/OS Debugger Reference and Messages
Scrolling to a particular line numberTo display a particular line at the top of a window, use the POSITION or SCROLL TOcommand with the line or statement numbers shown in the window prefix areas.Enter POSITION n or SCROLL TO n (where n is a line number) on the command lineand press Enter.
For example, to bring line 345 to the top of the window, enter POSITION 345 ORSCROLL TO 345 on the command line. z/OS Debugger scrolls the selected windowvertically so that it displays line 345 at the top of that window.
If you used the LIST AT LINE or LIST AT STATEMENT command to get a list of lineor statement breakpoints, then use the POSITION or SCROLL TO command to displayone of those breakpoints at the top of the Source window. As an alternate to usingthe combination of the LIST AT LINE or LIST AT STATEMENT command with thePOSITION or SCROLL TO command, you can use the FINDBP command. The FINDBPcommand works in a manner similar to the FIND command for strings, except thatit searches for line, statement, and offset breakpoints.
Finding a string in a windowYou can search for strings in the Source, Monitor, or Log window. You can specifywhere to start the search, to search either forward or backward, and, for the Sourcewindow, the columns that are searched. The default window that is searched is thewindow specified by the SET DEFAULT WINDOW command or the Default windowentry in your Profile Settings panel. The default direction for searches is forward.For the Source window, the default boundaries for columns are 1 to *, unless youspecify a different set of boundaries with the SET FIND BOUNDS command.
To find a string within the default window using the default search direction, dothe following steps:1. Type in the FIND command, specifying the string you want to find. Ensure that
the string complies with the rules described “Syntax of a search string” on page183.
2. Press Enter.
If you want to repeat the previous search, hit the PF5 key.
Refer to the following topics for more information related to the material discussedin this topic.
Related concepts“How does z/OS Debugger search for strings?” on page 183Related references“Syntax of a search string” on page 183
182 IBM z/OS Debugger V14.1.9 User's Guide

How does z/OS Debugger search for strings?The z/OS Debugger FIND command uses many of the same rules for beginning asearch that the ISPF FIND command uses to begin its searches. z/OS Debuggerbegins a search in the first position after the cursor location.
If you reach the end, z/OS Debugger displays a message indicating you havereached the end. Repeat the FIND command by pressing the PF5 key and then thesearch starts from the top.
If you were searching backwards and you reach the beginning, z/OS Debuggerdisplays a message indicating you have reached the beginning. Repeat the FINDcommand by pressing the PF5 key and the search begins from the end.
Syntax of a search stringThe string can contains any combination of characters, numbers, and symbols.However, if the string contains any of the following characters, it must be enclosedin quotation marks (") or apostrophes ('):v spacesv an asterisk ("*")v a question mark ("?")v a semicolon (";")
Use the following rules to determine whether to use quotation marks (") orapostrophes ('):v If you are debugging a C or C++ program, the string must be enclosed in
quotation marks (").v If you are debugging an assembler, COBOL, LangX COBOL, disassembly, or
PL/I program, the string can be enclosed in quotation marks (") or apostrophes(').
Finding the same string in a different windowTo find the same string in a different window, type in the command: FIND *window_name.
Finding a string in the Monitor value area when SET MONITORWRAP OFF is in effectType the FIND command with the string, then place the cursor in the Monitorwindow. z/OS Debugger searches the entire Monitor window, including thescrolled data in the Monitor value area, until the string is found or until the end ofdata is reached.
Finding the same string in a different directionTo find the same string in a different direction, enter the FIND * command withthe string and the PREV or NEXT keyword. For example, the following commandsearches for the string "RecordDate" in the backwards direction:FIND RecordDate PREV ;
Specifying the boundaries of a search in the Source windowYou can specify that z/OS Debugger search through a limited number of columnsin the Source window, which can be useful when you are searching through a verylarge source file and some text is organized in specific columns. You can specifythe boundaries to use for the current search or for all searches. The columnalignment of the source might not match the original source code. The columnspecifications for the FIND command are related to the scale shown in the Sourcewindow, not the original source code.
Chapter 21. Using full-screen mode: overview 183

To specify the boundaries for the current search, enter the FIND command andspecify the search string and the boundaries. For example, to search for "ABC" incolumns 7 through 12, enter the following command:FIND "ABC" 7 12;
To search for "VAR1" that begins in column 8 or any column after that, enter thefollowing command:FIND "VAR1" 8 *;
To search for "VAR1" beginning in column 1, enter the following command:FIND "VAR1" 1;
To specify the default boundaries to use for all searches, enter the SET FIND BOUNDScommand, specifying the left and right boundaries. After you enter the SET FINDBOUNDS command, every time you enter the FIND command without specifyingboundaries, z/OS Debugger searches for the string you specified only within thoseboundaries. For example, to specify that you want z/OS Debugger to alwayssearch for text within columns 7 through 52, enter the following command:SET FIND BOUNDS 7 52;
Afterward, every time you enter the FIND command without specifying boundaries,z/OS Debugger searches only within columns 7 through 52. To reset theboundaries to the default setting, which is 1 through *, enter the followingcommand:SET FIND BOUNDS;
Refer to the following topics for more information related to the material discussedin this topic.
Related references“Example: Searching for COBOL paragraph names”FIND command in IBM z/OS Debugger Reference and MessagesSET FIND BOUNDS command in IBM z/OS Debugger Reference and MessagesQUERY command in IBM z/OS Debugger Reference and Messages
Example: Complex searchesTo find a string in the backwards direction in a different window, enter the FINDcommand with the string, the PREV keyword, and the name of the window. Forexample, the following command searches for the string "EmployeeName" in theLog window:FIND EmployeeName PREV LOG;
Example: Searching for COBOL paragraph namesTo find a COBOL paragraph name that begins in column 8, enter the followingcommand:FIND paraa 8;
z/OS Debugger will find only the string that starts in column 8.
To find a reference to a COBOL paragraph name in COBOL’s Area B withincolumns 12 through 72, enter the following command:FIND paraa 12 72;
z/OS Debugger will find only the string that starts and ends within columns 12 to72.
184 IBM z/OS Debugger V14.1.9 User's Guide
Displaying the line at which execution haltedAfter displaying different source files and scrolling, you can go back to the haltedexecution point by entering the SET QUALIFY RESET command.
Navigating through the Memory windowThis topic describes the navigational aids available through the Memory windowthat are not available through other windows.
Displaying the Memory windowYou can display the Memory window by doing one of the following options:v Entering the WINDOW SWAP MEMORY LOG command. z/OS Debugger replaces the
contents of the physical window that is displaying the Log window with theMemory window. The Memory window is empty if you did not specify a baseaddress (by using the MEMORY command) or the history area is empty.
v After assigning the Memory window to a physical window, entering the WINDOWOPEN MEMORY command. z/OS Debugger opens the physical window anddisplays the contents of the Memory window.
v Customizing the session panel so that the Memory window is displayed in adefault physical window instead of the Log window. Use this option if you wantthe Memory window to display continuously and in place of the Log window.
Refer to the following topics for more information related to the material discussedin this topic.
Related tasks“Scrolling through the physical windows” on page 180“Switching between the Memory window and Log window” on page 180“Displaying memory through the Memory window” on page 17“Customizing the layout of physical windows on the session panel” on page278Related references“Memory window” on page 167“Order in which z/OS Debugger accepts commands from the session panel” onpage 174MEMORY command in IBM z/OS Debugger Reference and Messages
Navigating through the Memory window using the history areaEvery time you enter a new MEMORY command or use the G command, the currentbase address is moved to the right and down in the history area. The history areacan hold up to eight base addresses. When the history area is full and you enter anew base address, z/OS Debugger removes the oldest base address (located at thebottom and right-most part of the history area) from the history area and puts thenew base address on the top left. The history area is persistent in a debug session.
To use the history area to navigate through the Memory window, enter the G or gcommand over an address in the history area, then press Enter. z/OS Debuggerdisplays the memory dump data starting with the new address. You can clear thehistory area by entering the CLEAR MEMORY command. You can remove an entry inthe history area by typing over the entry with the R or r command.
Refer to the following topics for more information related to the material discussedin this topic.
Related tasks“Scrolling through the physical windows” on page 180“Specifying a new base address” on page 186
Chapter 21. Using full-screen mode: overview 185
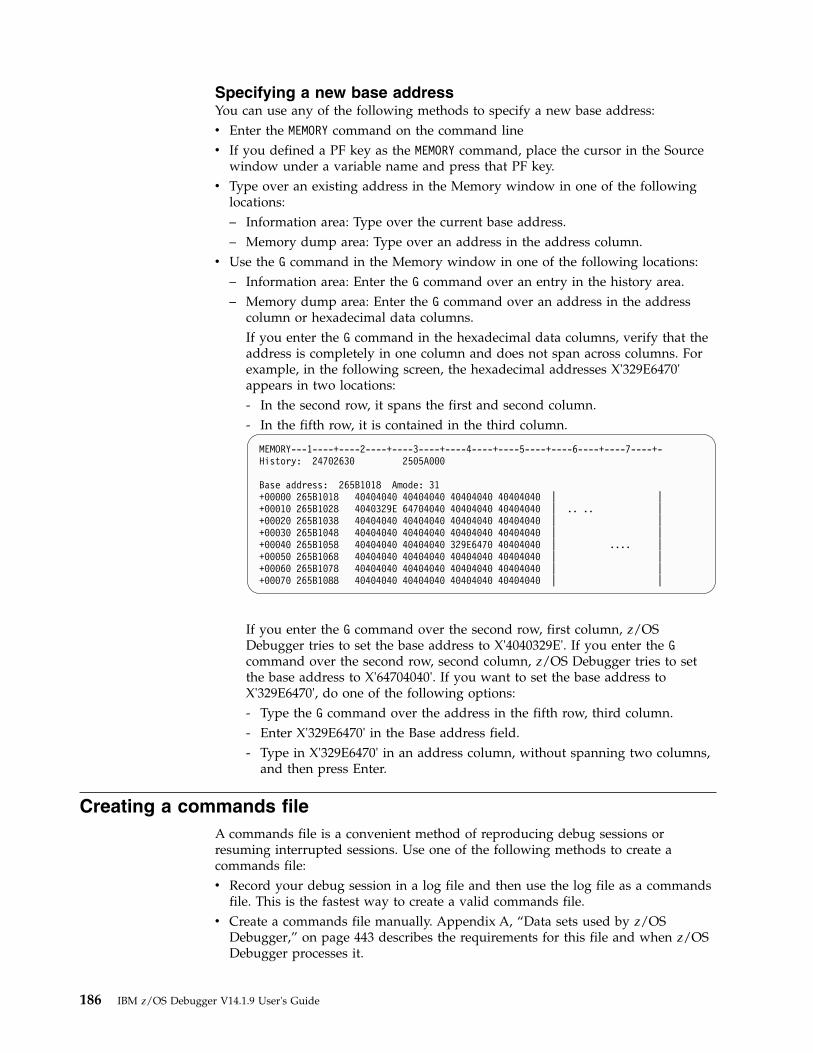
Specifying a new base addressYou can use any of the following methods to specify a new base address:v Enter the MEMORY command on the command linev If you defined a PF key as the MEMORY command, place the cursor in the Source
window under a variable name and press that PF key.v Type over an existing address in the Memory window in one of the following
locations:– Information area: Type over the current base address.– Memory dump area: Type over an address in the address column.
v Use the G command in the Memory window in one of the following locations:– Information area: Enter the G command over an entry in the history area.– Memory dump area: Enter the G command over an address in the address
column or hexadecimal data columns.If you enter the G command in the hexadecimal data columns, verify that theaddress is completely in one column and does not span across columns. Forexample, in the following screen, the hexadecimal addresses X'329E6470'appears in two locations:- In the second row, it spans the first and second column.- In the fifth row, it is contained in the third column.
MEMORY---1----+----2----+----3----+----4----+----5----+----6----+----7----+-History: 24702630 2505A000
Base address: 265B1018 Amode: 31+00000 265B1018 40404040 40404040 40404040 40404040 | |+00010 265B1028 4040329E 64704040 40404040 40404040 | .. .. |+00020 265B1038 40404040 40404040 40404040 40404040 | |+00030 265B1048 40404040 40404040 40404040 40404040 | |+00040 265B1058 40404040 40404040 329E6470 40404040 | .... |+00050 265B1068 40404040 40404040 40404040 40404040 | |+00060 265B1078 40404040 40404040 40404040 40404040 | |+00070 265B1088 40404040 40404040 40404040 40404040 | |
If you enter the G command over the second row, first column, z/OSDebugger tries to set the base address to X'4040329E'. If you enter the Gcommand over the second row, second column, z/OS Debugger tries to setthe base address to X'64704040'. If you want to set the base address toX'329E6470', do one of the following options:- Type the G command over the address in the fifth row, third column.- Enter X'329E6470' in the Base address field.- Type in X'329E6470' in an address column, without spanning two columns,
and then press Enter.
Creating a commands fileA commands file is a convenient method of reproducing debug sessions orresuming interrupted sessions. Use one of the following methods to create acommands file:v Record your debug session in a log file and then use the log file as a commands
file. This is the fastest way to create a valid commands file.v Create a commands file manually. Appendix A, “Data sets used by z/OS
Debugger,” on page 443 describes the requirements for this file and when z/OSDebugger processes it.
186 IBM z/OS Debugger V14.1.9 User's Guide

When you create a commands file that might be used in an application programthat was created with several different programming languages, you might want touse z/OS Debugger commands that are programming language neutral. Thefollowing guidelines can help you write commands that are programminglanguage neutral:v Write conditions with the %IF command.v Delimit strings and long compile unit names with quotation marks (").v Prefix a hexadecimal constant with an X or x, followed by an apostrophe ('),
then suffix the constant with an apostrophe ('). For example, you can write thehexadecimal constant C1C2C3C4 as x’C1C2C3C4’.
v Group commands together with the BEGIN and END commands.v Check the IBM z/OS Debugger Reference and Messages to determine if a command
works with only specific programming languages.v Type in comments beginning at column 2 and not extending beyond column 72.
Begin comments with "/*" and end them with "*/".
For PL/I programs, if your commands file has sequence numbers in columns 73through 80, you must enter the SET SEQUENCE ON command as the first command inthe commands file or before you use the commands file. After you enter thiscommand, z/OS Debugger does not interpret the data in columns 73 through 80 asa command. Later, if you want z/OS Debugger to interpret the data in columns 73through 80 as a command, enter the command SET SEQUENCE OFF.
For C and C++ programs, if you use commands that reference blocks, the blocknames can differ if the same program is compiled with either the ISD or DWARFcompiler option. If your program is compiled with the ISD compiler option, z/OSDebugger assigns block names in a sequential manner. If your program iscompiled with the DWARF compiler option, z/OS Debugger assigns block namesin a non-sequential manner. Therefore, the names might differ. If you switchcompiler options, check the block names in commands you use in your commandsfile.
At runtime, a commands file can be specified through one of the followingmethods:v Directly, for example, through the TEST runtime option.v Through the EQAOPTS COMMANDSDSN command. If that file has a member in it
that matches the name of the initial load module in the first enclave, z/OSDebugger reads that member as a commands file.
To learn how to specify EQAOPTS commands, see the topic “EQAOPTScommands” in the IBM z/OS Debugger Reference and Messages or IBM z/OS DebuggerCustomization Guide. To learn about what format to use for the commands file, seeAppendix A, “Data sets used by z/OS Debugger,” on page 443.
Refer to the following topics for more information related to the material discussedin this topic.
Related tasks“Entering comments in z/OS Debugger commands” on page 291Related referencesBEGIN command in IBM z/OS Debugger Reference and Messages%IF command in IBM z/OS Debugger Reference and Messages
Chapter 21. Using full-screen mode: overview 187

Recording your debug session in a log filez/OS Debugger can record your commands and their generated output in asession log file. This allows you to record your session and use the file as areference to help you analyze your session strategy. You can also use the log file asa command input file in a later session by specifying it as your primary commandsfile. This is a convenient method of reproducing debug sessions or resuminginterrupted sessions.
The following appear as comments (preceded by an asterisk {*} in column 7 forCOBOL programs, and enclosed in /* */ for C, C++, PL/I and assemblerprograms):v All command outputv Commands from USE filesv Commands specified on a __ctest() function callv Commands specified on a CALL CEETEST statementv Commands specified on a CALL PLITEST statementv Commands specified in the run-time TEST command string suboptionv QUIT commandsv z/OS Debugger messages about the program execution (for example, intercepted
console messages and exceptions)
Refer to the following topics for more information related to the material discussedin this topic.
Related tasks“Creating the log file”“Saving and restoring settings, breakpoints, and monitor specifications” onpage 196
Creating the log fileFor debugging sessions in full-screen mode, you can create a log file in one of thefollowing ways:v Automatically by using the EQAOPTS LOGDSN and LOGDSNALLOC commands. This
method helps new z/OS Debugger users automatically create a log file. To learnhow to specify EQAOPTS commands, see the topic “EQAOPTS commands” inthe IBM z/OS Debugger Reference and Messages or IBM z/OS DebuggerCustomization Guide.If you are an existing user that saves settings in a SAVESETS data set, z/OSDebugger does not create a new log file for you because the SAVESETS data setcontains a SET LOG command. z/OS Debugger uses the log file specified in thatSET LOG command.
v Manually as described in this topic.
For debugging sessions in batch mode, manually create the log file as described inthis topic.
To create a permanent log of your debug session, first create a file with thefollowing specifications:v RECFM(F) or RECFM(FB) and 32<=LRECL<=256v RECFM(V) or RECFM(VB) and 40<=LRECL<=264
Then, allocate the file to the DD name INSPLOG in the CLIST, JCL, or EXEC youuse to run your program.
188 IBM z/OS Debugger V14.1.9 User's Guide

For COBOL and LangX COBOL only, if you want to subsequently use the sessionlog file as a commands file, make the RECFM FB and the LRECL equal to 72. z/OSDebugger ignores everything after column 72 for file input during a COBOL debugsession.
For CICS only, SET LOG OFF is the default. To start the log, you must use the SETLOG ON file command. For example, to have the log written to a data set namedTSTPINE.DT.LOG , issue: SET LOG ON FILE TSTPINE.DT.LOG;.
Make sure the default of SET LOG ON is still in effect. If you have issued SET LOGOFF, output to the log file is suppressed. If z/OS Debugger is never given control,the log file is not used.
When the default log file (INSPLOG) is accessed during initialization, any existingfile with the same name is overwritten. On MVS, if the log file is allocated withdisposition of MOD, the log output is appended to the existing file. Entering theSET LOG ON FILE xxx command also appends the log output to the existing file.
If a log file was not allocated for your session, you can allocate one with the SETLOG command by entering:SET LOG ON FILE logddn;
This causes z/OS Debugger to write the log to the file which is allocated to the DDname LOGDDN.
Note: A sequential file is recommended for a session log since z/OS Debuggerwrites to the log file.
At any time during your session, you can stop information from being sent to alog file by entering:SET LOG OFF;
To resume use of the log file, enter:SET LOG ON;
The log file is active for the entire z/OS Debugger session.
z/OS Debugger keeps a log file in the following modes of operation: line mode,full-screen mode, and batch mode.
Recording how many times each source line runsTo record of how many times each line of your code was executed:1. Use a log file if you want to keep a permanent record of the results. To learn
how to create a log file, see “Creating the log file” on page 188.2. Issue the command:
SET FREQUENCY ON;
After you have entered the SET FREQUENCY ON command, your Source windowis updated to show the current frequency count. Remember that this commandstarts the statistic gathering to display the actual count, so if your applicationhas already executed a section of code, the data for these executed statementswill not be available.If you want statement counts for the entire program, issue:
Chapter 21. Using full-screen mode: overview 189

GO ;LIST FREQUENCY * ;
which lists the number of times each statement is run. When you quit, theresults are written to the Log file. You can issue the LIST FREQUENCY * at anytime, but it will only display the frequency count for the currently activecompile unit.
Refer to the following topics for more information related to the material discussedin this topic.
Related tasks“Creating the log file” on page 188
Recording the breakpoints encounteredIf you are debugging a compile unit that does not support automonitoring, youcan use the SET AUTOMONITOR command to record the breakpoints encountered inthat compile unit. After you enter the SET AUTOMONITOR ON command, z/OSDebugger records the location of each breakpoint that is encountered, as if youentered the QUERY LOCATION command.
Setting breakpoints to halt your program at a lineTo set or clear a line breakpoint, move the cursor over an executable line in theSource window and press PF6 (AT/CLEAR). You can temporarily turn off thebreakpoint with DISABLE and turn it back on with ENABLE.
Refer to the following topics for more information related to the material discussedin this topic.
Related tasks“Halting on a line in C only if a condition is true” on page 249“Halting on a line in C++ only if a condition is true” on page 261“Halting on a COBOL line only if a condition is true” on page 222“Halting on a PL/I line only if a condition is true” on page 239
Setting breakpoints in a load module that is not loaded or in aprogram that is not active
You can browse the source or set breakpoints in a load module that has not yetbeen loaded or in a program that is not yet active by using the followingcommand:SET QUALIFY CU load_spec ::> cu_spec ;
In this command, specify the name of the load module and CU in which you wishto set breakpoints. The load module is then implicitly loaded, if necessary, and aCU is created for the specified CU. The source for the specified CU is thendisplayed in the SOURCE window. You can then set statement breakpoints asdesired.
When program execution is resumed because of a command such as GO or STEP,any implicitly loaded modules are deleted, all breakpoints in implicitly createdCUs are suspended, and any implicitly created CUs are destroyed. If the CU islater created during normal program execution, the suspended breakpoints arereactivated.
190 IBM z/OS Debugger V14.1.9 User's Guide

If you use the SET SAVE BPS function to save and restore breakpoints, thebreakpoints are saved and restored under the name of the first load module in theactive enclave. Therefore, if you use the command SET QUALIFY CU to setbreakpoints in programs that execute as part of different enclaves, the breakpointsthat you set by using this command are not restored when run in a differentenclave.
Controlling how z/OS Debugger handles warnings about invalid data incomparisons
When z/OS Debugger processes (evaluates) a conditional expression and the datain one of the operands is invalid, the conditional expression becomes invalid. Inthis situation, z/OS Debugger stops and prompts you for a command. You have toenter the GO command to continue running your program. If you want to preventz/OS Debugger from prompting you in this situation, enter the SET WARNING OFFcommand.
A conditional expression can become invalid for several reasons, including thefollowing situations:v A variable is not initialized and the data in the variable is not valid for the
variable's attributes.v A field has multiple definitions, with each definition having different attributes.
While the program is running, the type of data in the field changes. When z/OSDebugger evaluates the conditional expression, the data in the variable used inthe comparison is not valid for the variable's attributes.
If an exception is raised during the evaluation of a conditional expression and SETWARNING is OFF, z/OS Debugger still stops, displays a message about the exception,and prompts you to enter a command.
The following example describes what happens when you use a field that hasmultiple definitions, with each definition having different attributes, as part of aconditional expression:1. You enter the following command to check the value of WK-TEST-NUM, which
is a field with two definitions, one is numeric, the other is string:AT CHANGE WK-TEST-NUM
BEGIN;IF WK-TEST-NUM = 10;
LIST ’WK-TEST-NUM IS 10’;ELSE;
GO;END-IF;End;
2. When z/OS Debugger evaluates the conditional expression WK-TEST-NUM = 10,the type of data in the field WK-TEST-NUM is string. Because the data in the fieldWK-TEST-NUM is a string and it cannot be compared to 10, the comparisonbecomes invalid. z/OS Debugger stops and prompts you to enter a command.
3. You decide you want z/OS Debugger to continue running the program andstop only when the type of data in the field is numeric and matches the 10.
4. You enter the following command, which adds calls to the SET WARNING OFFand SET WARNING ON commands:AT CHANGE WK-TEST-NUM
BEGIN;SET WARNING OFF;IF WK-TEST-NUM = 10;
Chapter 21. Using full-screen mode: overview 191

LIST ’WK-TEST-NUM IS 10’;ELSE;
BEGIN;SET WARNING ON;GO;END;
END-IF;SET WARNING ON;END;
Now, when the value of the field WK-TEST-NUM is not 10 or it is not a numerictype, z/OS Debugger evaluates the conditional expression WK-TEST-NUM = 10 asfalse and runs the GO command. z/OS Debugger does not stop and prompt youfor a command.
In this example, the display of warning messages about the conditional expression(WK-TEST-NUM = 10) was suppressed by entering the SET WARNING OFF commandbefore the conditional expression was evaluated. After the conditional expressionwas evaluated, the display of warning messages was allowed by entering the SETWARNING ON command.
Carefully consider when you enter the SET WARNING OFF command because youmight suppress the display of warning messages that might help you detect otherproblems in your program.
Stepping through or running your programBy default, when z/OS Debugger starts, none of your program has run yet(including C++ constructors and static object initialization).
z/OS Debugger defines a line as one line on the screen, commonly identified by aline number. A statement is a language construct that represents a step in asequence of actions or a set of declarations. A statement can equal one line, it canspan several lines, or there can be several statements on one line. The number ofstatements that z/OS Debugger runs when you step through your programdepends on where hooks are placed.
To run your program up to the next hook, press PF2 (STEP). If you compiled yourprogram with a combination of any of the following TEST or DEBUG compilersuboptions, STEP performs one statement:v For C, compile with TEST(ALL) or DEBUG(HOOK(LINE,NOBLOCK,PATH)).v For C++, compile with TEST or DEBUG(HOOK(LINE,NOBLOCK,PATH)).v For any release of Enterprise COBOL for z/OS, Version 3, or Enterprise COBOL
for z/OS and OS/390, Version 2, compile with one of the following suboptions:– TEST(ALL)
– TEST(NONE) and use the Dynamic Debug facilityv For Enterprise COBOL for z/OS, Version 4, compile with one of the following
suboptions:– TEST(HOOK)
– TEST(NOHOOK) and use the Dynamic Debug facilityv For any release of Enterprise PL/I for z/OS, compile with TEST(ALL).v For Enterprise PL/I for z/OS, Version 3.4 or later, compile with
TEST(ALL,NOHOOK) and use the Dynamic Debug facility.
To run your program until a breakpoint is reached, the program ends, or acondition is raised, press PF9 (GO).
192 IBM z/OS Debugger V14.1.9 User's Guide

Note: A condition being raised is determined by the setting of the TEST run-timesuboption test_level.
The command STEP OVER runs the called function without stepping into it. If youaccidentally step into a function when you meant to step over it, issue the STEPRETURN command that steps to the return point (just after the call point).
Refer to the following topics for more information related to the material discussedin this topic.
Related tasksChapter 4, “Planning your debug session,” on page 25Chapter 13, “Writing the TEST run-time option string,” on page 121
Recording and replaying statementsz/OS Debugger provides a set of commands (the PLAYBACK commands) that helpsyou record and replay the statements that you run while you debug your program.To record and replay statements, you need to do the following:1. Record the statements that you run (PLAYBACK ENABLE command). If you specify
the DATA parameter or the DATA parameter is defaulted, additional informationabout your program is recorded.
2. Prepare to replay statements (PLAYBACK START command).3. Replay the statements that you recorded (STEP or RUNTO command).4. Change the direction that the statements are replayed (PLAYBACK FORWARD
command).5. Stop replaying statements (PLAYBACK STOP command).6. Stop recording the statements that you run (PLAYBACK DISABLE command). All
data for the compile units specified or implied on the PLAYBACK DISABLEcommand is discarded.
Each of these steps are described in more detail in the sections that follow.
Refer to the following topics for more information related to the material discussedin this topic.
Related referencesIBM z/OS Debugger Reference and Messages
Recording the statements that you runThe PLAYBACK ENABLE command includes a set of parameters to specify:v Which compile units to recordv The maximum amount of storage to use to record the statements that you runv Whether to record the following additional information about your program:
– The value of variables.– The value of registers.– Information about the files you use: open, close, last operation performed on
the files, how the files were opened.
The PLAYBACK ENABLE command can be used to record the statements that you runfor all compile units or for specific compile units. For example, you can record thestatements that you run for compile units A, B, and C, where A, B, and C areexisting compile units. Later, you can enter the PLAYBACK ENABLE command andspecify that you want to record the statements that you run for all compile units.You can use an asterisk (*) to specify all current and future compile units.
Chapter 21. Using full-screen mode: overview 193

The number of statements that z/OS Debugger can record depends on thefollowing:v The amount of storage specified or defaulted.v The number of changes made to the variables.v The number of changes made to files.
You cannot change the storage value after you have started recording. The morestorage that you specify, the more statements that z/OS Debugger can record. Afterz/OS Debugger has filled all the available storage, z/OS Debugger putsinformation about the most recent statements over the oldest information. Whenthe DATA parameter is in effect, the available storage fills more quickly.
You can use the DATA parameter with programs compiled with the SYM suboption ofthe TEST compiler option only if they are compiled with the following compilers:v Enterprise COBOL for z/OS, Version 6v Enterprise COBOL for z/OS, Version 5v Enterprise COBOL for z/OS, Version 49
v Enterprise COBOL for z/OS and OS/390, Version 3 Release 2 or laterv Enterprise COBOL for z/OS and OS/390, Version 3 Release 1 with APAR
PQ63235v COBOL for OS/390 & VM, Version 2 with APAR PQ63234
Refer to the following topics for more information related to the material discussedin this topic.
Related tasks“Stop the recording” on page 195
Preparing to replay the statements that you recordedThe PLAYBACK START command notifies z/OS Debugger that you want to replay thestatements that you recorded. This command suspends normal debugging; allbreakpoints are suspended and you cannot use many z/OS Debugger commands.IBM z/OS Debugger Reference and Messages provides a complete list of whichcommands you cannot use while you replay statements.
The initial direction is backward.
Replaying the statements that you recordedTo replay the statements that you recorded, enter the STEP or RUNTO command. Youcan replay the statements you recorded until one of the following conditions isreached:v If you are replaying in the backward direction, you reach the point where you
entered the PLAYBACK ENABLEcommand. If you are replaying in the forwarddirection, you reach the point where you entered the PLAYBACK START command.command.
v You reach the point where there are no more statements to replay, because youhave run out of storage.
You can replay as far forward as the point where you entered the PLAYBACK STARTcommand. As you replay statements, you see only the statements that yourecorded for those compile units you indicated you wanted to record. While you
9. With Enterprise COBOL for z/OS, Version 4, and the TEST compiler option the symbol tables are always generated.
194 IBM z/OS Debugger V14.1.9 User's Guide

are replaying steps, you cannot modify variables. If the DATA parameter is in effect,you can access the contents of variables and expressions.
Changing the direction that statements are replayedTo change the direction that statements are replayed, enter the PLAYBACK FOWARD orPLAYBACK BACKWARD command. The initial direction is backward.
Stop the replayingTo stop replaying the statements that you recorded and resume normal debugging,enter the PLAYBACK STOP command. This command resumes normal debugging atthe point where you entered the PLAYBACK START command. z/OS Debuggercontinues to record the statements that you run.
Stop the recordingTo stop recording the statements that you run and collecting additional informationabout your program, enter the PLAYBACK DISABLE command. This command can beused to stop recording the statements that you run in all or specific compile units.If you stop recording for one or more compile units, the data collected for thosecompile units is discarded. If you stop recording for all compile units, the PLAYBACKSTART command is no longer available.
Restrictions on recording and replaying statementsYou cannot modify the value of variables or storage while you are replayingstatements.
When you replay statements, many z/OS Debugger commands are unavailable.IBM z/OS Debugger Reference and Messages contains a complete list of all thecommands that are not available.
Restrictions on accessing COBOL dataIf the DATA parameter is specified or defaulted for a COBOL compile unit thatsupports this parameter, you can access data defined in the following section of theDATA DIVISION:v FILE SECTION
v WORKING-STORAGE SECTION
v LOCAL-STORAGE SECTION
v LINKAGE SECTION
You can also access special registers, except for the ADDRESS OF, LENGTH OF, andWHEN-COMPILED special registers. You can also access all the special registerssupported by z/OS Debugger commands.
When you are replaying statements, many z/OS Debugger commands are availableonly if the following conditions are met:v The DATA parameter must be specified or defaulted for the compile unit.v The compile unit must be compiled with a compiler that supports the DATA
parameter.
You can use the QUERY PLAYBACK command to determine the compile units forwhich the DATA option is in effect.
IBM z/OS Debugger Reference and Messages contains a complete list of all thecommands that can be used when you specify the DATA parameter.
Chapter 21. Using full-screen mode: overview 195

Saving and restoring settings, breakpoints, and monitor specificationsYou can save settings, breakpoints, and monitor specifications from one debuggingsession and then restore them in a subsequent debugging session. You can save thefollowing information:
SettingsThe settings for the WINDOW SIZE, WINDOW CLOSE, and SET command, exceptfor the following settings for the SET command:v DBCSv FREQUENCYv NATIONAL LANGUAGEv PROGRAMMING LANGUAGEv FILE operand of the RESTORE SETTINGS switchv QUALIFYv SOURCEv TEST
BreakpointsAll of the breakpoints currently set or suspended in the current debuggingsession as well as all LOADDEBUGDATA (LDD) specifications. Thefollowing breakpoints are saved:v APPEARANCE breakpointsv CALL breakpointsv DELETE breakpointsv ENTRY breakpointsv EXIT breakpointsv GLOBAL APPEARANCE breakpointsv GLOBAL CALL breakpointsv GLOBAL DELETE breakpointsv GLOBAL ENTRY breakpointsv GLOBAL EXIT breakpointsv GLOBAL LABEL breakpointsv GLOBAL LOAD breakpointsv GLOBAL STATEMENT breakpointsv GLOBAL LINE breakpointsv LABEL breakpointsv LOAD breakpointsv OCCURRENCE breakpointsv STATEMENT breakpointsv LINE breakpointsv TERMINATION breakpoints
If a deferred AT ENTRY breakpoint has not been encountered, it is notsaved nor restored.
Monitor specificationsAll of the monitor and LOADDEBUGDATA (LDD) specifications that are currentlyin effect.
196 IBM z/OS Debugger V14.1.9 User's Guide

In most environments, z/OS Debugger uses specific default data set names to savethese items so that it can automatically save and restore these items for you. Inthese environments, you must automatically restore the settings so that the SETRESTORE BPS AUTO and SET RESTORE MONITORS AUTO commands are in effect duringz/OS Debugger initialization. There are some environments where you have to usethe RESTORE command to restore these items manually.
In TSO, CICS (when you log on with your own ID), and UNIX System Services,the following default data set names are used:v userid.DBGTOOL.SAVESETS (a sequential data set) is used to save the settings.v userid.DBGTOOL.SAVEBPS (a PDS or PDSE data set) is used to save the
breakpoints, monitor specifications, and LDD specifications.
In non-interactive mode (MVS batch mode without using full-screen mode usingthe Terminal Interface Manager), you must include an INSPSAFE DD statement toindicate the data set that you want z/OS Debugger to use to save and restore thesettings and an INSPBPM DD statement to indicate the data set that you wantz/OS Debugger to use to save and restore the breakpoints and monitor and LDDspecifications.
Use a sequential data set to save and restore the settings. Use a PDS or PDSE tosave and restore the breakpoints and monitor and LDD specifications. Werecommend that you use a PDSE to avoid having to compress the data set. z/OSDebugger uses a separate member to store the breakpoints, LDD data, and monitorspecifications for each enclave. z/OS Debugger names the member the name of theinitial load module in the enclave. If you want to discard all of the savedbreakpoints, LDD data, and monitor specifications for an enclave, you can deletethe corresponding member. However, do not alter the contents of the member.
Saving and restoring automaticallySaving and restoring automatically means that every time you finish a debuggingsession, z/OS Debugger saves information about your debugging session. The nexttime you start a debugging session, z/OS Debugger restores that information.Setting up automatic saving and restoring requires that you allocate files and enterthe appropriate commands that enable this feature. You can do this in one of thefollowing ways:v You or your site can specify the EQAOPTS SAVESETDSNALLOC and SAVEBPDSNALLOC
commands. These commands can create the files and enter the appropriatecommands for you, your group, or your entire site. If you choose this method,you can skip the rest of this topic and follow the instructions in the topic“EQAOPTS commands” in the IBM z/OS Debugger Reference and Messages or IBMz/OS Debugger Customization Guide.
v Run the EQAWSVST job in hlq.SEQASAMP to create the data set and run theappropriate commands. The disadvantage to this method is that you have todetermine if the values for the EQAOPTS SAVESETDSN and SAVEBPDSN commandshave been altered, and then make a similar change to the job.
v You can do the steps described in this topic.
To enable automatic saving and restoring, you must do the following steps:1. Pre-allocate a sequential data set with the default name where settings will be
saved. If you are running in non-interactive mode (MVS batch mode withoutusing full-screen mode using the Terminal Interface Manager), you mustinclude an INSPSAFE DD statement that references this data set.
Chapter 21. Using full-screen mode: overview 197
2. Pre-allocate a PDSE or PDS with the default name where breakpoints, monitor,and LDD specifications will be saved. If you are running in non-interactivemode (MVS batch mode without using full-screen mode using the TerminalInterface Manager), you must include an INSPBPM DD statement thatreferences this data set.
3. Start z/OS Debugger.v If you are running in CICS, you must log on as a user other than the default
user and the CICS region must have update authorization to the SAVESETTINGS and SAVE BPS data sets.
v If you are running in non-interactive mode (MVS batch mode without usingfull-screen mode using the Terminal Interface Manager), you must addINSPSAFE and INSPBPM DD statements that reference the data sets youallocated in step 1 and 2.
4. Enable automatic saving and restoring of settings by using the followingcommands:SET SAVE SETTINGS AUTO;SET RESTORE SETTINGS AUTO;
5. If you want to enable automatic saving and restoring of breakpoints and LDDspecifications or monitor and LDD specifications, use the following commands:SET SAVE BPS AUTO;SET RESTORE BPS AUTO;SET SAVE MONITORS AUTO;SET RESTORE MONITORS AUTO;
You must do step 4 (enabling automatic saving and restoring of settings) if youwant to enable automatic restoring of breakpoints or monitor specifications.
6. Shutdown z/OS Debugger. Your settings are saved in the corresponding dataset.
The next time you start z/OS Debugger, the settings are automatically restored. Ifyou are debugging the same program, the breakpoints and monitor specificationsare also automatically restored.
Disabling the automatic saving and restoring of breakpoints,monitors, and settings
To disable automatic saving of breakpoints and monitors, you must ensure that thefollowing settings are in effect:v SET SAVE BPS NOAUTO;
v SET SAVE MONITORS NOAUTO;
To disable automatic saving of settings, you must ensure that the SET SAVESETTINGS NOAUTO; setting is in effect.
To disable automatic restoring of breakpoints and monitors, you must ensure thatthe following settings are in effect:v SET RESTORE BPS NOAUTO;
v SET RESTORE MONITORS NOAUTO;
To disable automatic restoring of settings, you must ensure that the SET RESTORESETTINGS NOAUTO; setting is in effect.
If you disable the automatic saving of any of these values, the last saved data isstill present in the appropriate data sets. Therefore, you can restore from these data
198 IBM z/OS Debugger V14.1.9 User's Guide
sets. Be aware that this means you will restore values from the last time the datawas saved which might not be from the last time you ran z/OS Debugger.
Restoring manuallyAutomatic restoring is not supported in the following environments:v Debugging in CICS without logging-onv Debugging DB2 stored procedures
You can save and restore breakpoints, monitor, and LDD specifications by doingthe following steps:1. Pre-allocate a sequential data set for saving and restoring of settings.2. Pre-allocate a PDSE or PDS for saving and restoring breakpoints and monitor
specifications.3. Start z/OS Debugger.4. To enable automatic saving of settings, use the following command where
mysetdsn is the name of the data set that you allocated in step 1:SET SAVE SETTINGS AUTO FILE mysetdsn;
5. To enable automatic saving of breakpoints and LDD specifications or monitorand LDD specifications, use the following commands, where mybpdsn is thename of the data set that you allocated in step 2:SET SAVE BPS AUTO FILE mybpdsn;SET SAVE MONITORS AUTO;
6. Shutdown z/OS Debugger.
The next time you start z/OS Debugger in one of these environments, you mustuse the following commands, in the sequence shown, at the beginning of yourz/OS Debugger session.SET SAVE SETTINGS AUTO FILE mysetdsn;RESTORE SETTINGS;SET SAVE BPS AUTO FILE mybpdsn;RESTORE BPS MONITORS;
You can put these commands into a user preferences file.
Performance considerations in multi-enclave environmentsEach time information is saved or restored, the following actions must take place:1. The data set is allocated.2. The data set is opened.3. The data set is written or read.4. The data set is closed.5. The data set is deallocated.
Because each of these steps requires operating system services, the overall processcan require a significant amount of elapsed time.
For saving and restoring settings, this process is done once when z/OS Debuggeris activated and once when z/OS Debugger terminates. Therefore, unless z/OSDebugger is repeatedly activated and terminated, the process is not excessivelytime-consuming. However, for saving and restoring of breakpoints, monitors, orboth, this process occurs once on entry to each enclave and once on termination ofeach enclave.
Chapter 21. Using full-screen mode: overview 199
If your program consists of multiple enclaves or an enclave that is run repeatedly,this process might occur many times. In this case, if performance is a concern, youmight want to consider disabling saving and restoring of breakpoints andmonitors. If your program runs under CICS with DTCN and saving and restoringof breakpoints and monitors is not enabled (SET SAVE BPS NOAUTO;, SET SAVEMONITORS NOAUTO;, SET RESTORE BPS NOAUTO;, and SET RESTORE MONITORS NOAUTO;are in effect), breakpoints are saved and restored from a CICS Temporary StorageQueue which is less time-consuming than the standard method but does notpreserve breakpoints across CICS restarts nor does it provide for saving andrestoring of monitors.
Displaying and monitoring the value of a variablez/OS Debugger can display the value of variables in the following ways:v One-time display, by using the LIST command, the PF4 key, or the L prefix
command. One-time display displays the value of the variable at the momentyou enter the LIST command, press the PF4 key, or enter the L prefix command.If you step or run through your program, any changes to the value of thevariable are not displayed. The L and M prefix commands are available onlywhen you use the following languages or compilers:– Enterprise PL/I for z/OS, Version 3.6 or 3.7 with the PTF for APAR PK70606,
or later– Enterprise COBOL compiled with the TEST compile option– Assembler– Disassembly
v Continuous display, called monitoring, by using the MONITOR LIST command, theSET AUTOMONITOR command, or the M prefix command. If you step or run throughyour program, any changes to the value of the variable are displayed.
Note: Use the command SET LIST TABULAR to format the LIST output for arraysand structures in tabular format. See the IBM z/OS Debugger Reference and Messagesfor more information about this command.
If z/OS Debugger cannot display the value of a variable in its declared data type,see “How z/OS Debugger handles characters that cannot be displayed in theirdeclared data type” on page 207.
One-time display of the value of variablesBefore you begin, determine if you want to change the format in whichinformation is displayed. Variables that are areas and structures might be easier toread if they are arranged in a tabular format on the screen. To make changes to theformat, do one of the following options:v If you want to change the format of the output for arrays and structures to
tabular format when displaying a variable, do the following steps:1. Move the cursor to the command line.2. Enter the following command: SET LIST TABULAR ON
v If you want to change the format of the output for arrays and structures tolinear format when displaying a variable, do the following steps:1. Move the cursor to the command line.2. Enter the following command: SET LIST TABULAR OFF
v If you want to format the logged output of arrays and structures when SETAUTOMONITOR ON LOG is in effect, do the following steps:
200 IBM z/OS Debugger V14.1.9 User's Guide

1. Move the cursor to the command line.2. Enter the following command: SET LIST TABULAR ON3. Enter the following command: SET AUTOMONITOR ON LOG
To display the contents of a variable once, do one of the following options:v By using the PF4 key, do the following steps:
1. Scroll through the Source window until you find the variable you want todisplay.
2. Move your cursor to the variable name.3. Press the PF4 (LIST) key. The value of the variable is displayed in the Log
window.v By using the LIST command:
1. Move the cursor to the command line.2. Type the following command, substituting your variable name for
variable-name:LIST variable-name;
3. Press Enter. The value of the variable is displayed in the Log window.v By using the L prefix command, do the following steps:
1. Scroll through the Source window until you find the operand you want todisplay.
2. Move your cursor to the prefix area of the line that contains the operand youwant to display.
3. Type in an "L" in the prefix area, then press Enter to display the value of allof the operands on that line. If you want to display the value of a specificoperand on that line, do the following steps:a. If you are debugging a high-level language program, beginning from the
left and with the number 1, assign a number to the first occurrence ofeach variable. For example, in the following line, rightSide is 1, leftSide is2, and bottomSide is 3:rightSide = (leftSide * leftSide) + (bottomSide * bottomSide);
If you are debugging an assembler or disassembly program, beginningfrom the left and beginning with number 1 assign the each operand ofthe machine instruction a number.
b. Type in an "L" in the prefix area, followed by the number assigned to theoperand that you want to display. If you wanted to display the value ofleftSide in the previous example, you would enter "L2" in the prefix area.
c. Press Enter. z/OS Debugger displays the value of leftSide in the Logwindow.
Adding variables to the Monitor windowWhen you add a variable to the Monitor window, you are monitoring the value ofthat variable. To add a variable to the Monitor window, do one of the followingoptions:v To use the MONITOR LIST command, do the following steps:
1. Move the cursor to the command line.2. Type the following command, substituting your variable name for
variable-name:MONITOR LIST variable-name;
Chapter 21. Using full-screen mode: overview 201

3. Press Enter. z/OS Debugger assigns the variable a reference number between1 and 99, adds the variable to the Monitor window (above the automonitorsection, if it is displayed), and displays the current value of the variable.
Every time z/OS Debugger receives control or every time you enter a z/OSDebugger command that can affect the display, z/OS Debugger updates thevalue of variable-name in the Monitor window so that the Monitor windowalways displays the current value.
v To use the M prefix command, do the following steps:1. Scroll through the Source window until you find the operand you want to
monitor.2. Move your cursor to the prefix area of the line that contains the operand you
want to monitor.3. Type in an "M" in the prefix area, then press Enter to monitor the value of all
of the operands on that line. If you want to monitor the value of a specificoperand on that line, do the following steps:a. If you are debugging a high-level language program, beginning from the
left and with number 1, assign a number to the first occurrence of eachvariable. For example, in the following line, rightSide is 1, leftSide is 2, andbottomSide is 3:rightSide = (leftSide * leftSide) + (bottomSide * bottomSide);
If you are debugging an assembler or disassembly program, beginningfrom the left and beginning with number 1 assign the each operand ofthe machine instruction a number.
b. Type in an "M" in the prefix area, followed by the number assigned to theoperand that you want to monitor. If you wanted to monitor the value ofleftSide in the previous example, you would enter "M2" in the prefix area.
c. Press Enter.Every time z/OS Debugger receives control or every time you enter a z/OSDebugger command that can affect the display, z/OS Debugger updates thevalue of leftSide in the Monitor window so that the Monitor window alwaysdisplays the current value.
Refer to the following topics for more information related to the material discussedin this topic.
Related tasks“Adding variables to the Monitor window automatically” on page 204
Displaying the Working-Storage Section of a COBOL programin the Monitor window
You can add all of the variables in the Working-Storage Section of a COBOLprogram to the Monitor window by doing the following steps:1. Move the cursor to the command line.2. Type in the following command: MONITOR LIST TITLED WSS;3. Press Enter. z/OS Debugger assigns the WSS entry a reference number between
1 and 99, adds the WSS entry to the Monitor window, and displays the currentvalues of all of the variables in the Working-Storage Section.
Every time z/OS Debugger receives control or you enter a z/OS Debuggercommand that can effect the display, z/OS Debugger updates the value of eachvariable in the Monitor window so that z/OS Debugger always displays thecurrent value.
202 IBM z/OS Debugger V14.1.9 User's Guide

Because the Working-Storage Section can contain many variables, monitoring theWorking-Storage Section can add a substantial amount of overhead and use morestorage.
Refer to the following topics for more information related to the material discussedin this topic.
Related tasks“Modifying variables or storage by typing over an existing value” on page 210
Displaying the data type of a variable in the Monitor windowThe command SET MONITOR DATATYPE ON displays the data type of the variablesdisplayed in the Monitor window, including those in the automonitor section. Thedata type is ordinarily the type which was used in the declaration of the variable.The command SET MONITOR DATATYPE OFF disables the display of this information.
To display the value and data type of a variable in the Monitor window:1. Move the cursor to the command line.2. Enter the following command:
SET MONITOR DATATYPE ON;
3. Enter one of the following commands:v
MONITOR LIST variable-name;
Substitute the name of your variable name for variable-name. z/OS Debuggeradds the variable to the Monitor window and displays the current value anddata type of the variable.
vSET AUTOMONITOR ON;
z/OS Debugger adds the variable or variables in the current statement to theautomonitor section of the Monitor window and displays the current valueand data type of the variable or variables.
vSET AUTOMONITOR ON LOG;
z/OS Debugger adds the variable or variables to the automonitor section ofthe Monitor window, displays the current value and data type of the variableor variables, and saves that information in the log.
Replacing a variable in the Monitor window with anothervariable
When you add a variable to the Monitor window, z/OS Debugger assigns thevariable a reference number between 1 and 99. You can use the reference numbersto help you replace a variable in the Monitor window with another variable.
To replace a variable in the Monitor window with another variable, do thefollowing steps:1. Verify that you know the reference number of the variable in the Monitor
window that you want to replace.2. Move the cursor to the command line.3. Type the following command, substituting reference_number with the reference
number of the variable you want to replace and variable-name with the name ofa new variable:MONITOR reference_number LIST variable-name;
Chapter 21. Using full-screen mode: overview 203
You can specify only an existing reference number or a reference number that isone greater than the highest existing reference number.
4. Press Enter. z/OS Debugger adds the new variable to the Monitor window onthe line that displayed the old variable, and displays the current value of thatvariable.
If you added an element of an array to the Monitor window, you can replace thatelement with another element of the same array by doing the following steps:1. Move your cursor to the Monitor window and place it under the subscript you
want to change.2. Type in the new subscript.3. Press Enter. z/OS Debugger replaces the old element with the new element,
then displays a message confirming the change.
Adding variables to the Monitor window automaticallyAs you step through a program, you might want to monitor variables that are oneach statement as you run each statement. Manually adding variables to theMonitor window (as described in “Adding variables to the Monitor window” onpage 201) before you run each statement can be time consuming. z/OS Debuggercan automatically add the variables at each statement, before or after it is run;display the values of those variables, before or after the statement is run; thenremove the variables from the Monitor window after you run the statement. To dothis, use the SET AUTOMONITOR ON command.
Before you begin, make sure you understand how the SET AUTOMONITOR commandworks by reading “How z/OS Debugger automatically adds variables to theMonitor window” on page 205.
To add variables to the Monitor window automatically, do the following steps:1. Move the cursor to the command line.2. Enter one of the following commands:v SET AUTOMONITOR ON; if you want to display variables at the current
statement, before the statement is run.v SET AUTOMONITOR ON PREVIOUS; if you want to display variables at the
statement z/OS Debugger just ran, after the statement was run.v SET AUTOMONITOR ON BOTH; if you want to display variables at the statement
z/OS Debugger just ran, after the statement was run, and the currentstatement, before the statement is run.
As you step through your program, z/OS Debugger displays the names andvalues of the variables in the automonitor section of the window.
3. To stop adding variables to the Monitor window automatically, enter the SETAUTOMONITOR OFF command. z/OS Debugger removes the line **********AUTOMONITOR ********** and any variables underneath that line.
Refer to the following topics for more information related to the material discussedin this topic.
Related concepts“How z/OS Debugger automatically adds variables to the Monitor window” onpage 205
Related tasks“Saving the information in the automonitor section to the log file” on page 205
204 IBM z/OS Debugger V14.1.9 User's Guide

Related referencesDescription of the SET AUTOMONITOR command in IBM z/OS Debugger Referenceand Messages.“Example: How z/OS Debugger adds variables to the Monitor windowautomatically” on page 206
Saving the information in the automonitor section to the log fileTo save the following information in the log file, enter the SET AUTOMONITOR ON LOGcommand:v Breakpoint locationsv The names and values of the variables at the breakpoints
The default option is NOLOG, which would not save the above information.
Each entry in the log file contains the breakpoint location within the program andthe names and values of the variables in the statement. To stop saving thisinformation in the log file and continue updating the automonitor section of theMonitor window, enter the SET AUTOMONITOR ON NOLOG command.
Refer to the following topics for more information related to the material discussedin this topic.
Related concepts“How z/OS Debugger automatically adds variables to the Monitor window”
Related tasks“Adding variables to the Monitor window automatically” on page 204
Related referencesDescription of the SET AUTOMONITOR command in IBM z/OS Debugger Referenceand Messages.“Example: How z/OS Debugger adds variables to the Monitor windowautomatically” on page 206
How z/OS Debugger automatically adds variables to the MonitorwindowWhen you enter the SET AUTOMONITOR ON command, z/OS Debugger displays theline ********** AUTOMONITOR ********** at the bottom of the list of any monitoredvariables in the Monitor window, as shown in the following example:
COBOL LOCATION: DTAM01 :> 109.1Command ===> Scroll ===> PAGEMONITOR -+----1----+----2----+----3----+----4----+----5----+----6- LINE: 1 OF 7******************************** TOP OF MONITOR *******************************
----+----1----+----2----+----3----+----4----+
0001 1 NUM1 00000000050002 2 NUM4 ’1111’0003 3 WK-LONG-FIELD-2 ’123456790 223456790 323456790 423456790 5230004 456790 623456790 723456790 823456790 92345670005 90 023456790 123456790 223456790 323456790 40006 23456790 523456790 623456790 723456790 823450007 ********** AUTOMONITOR **********
The area below this line is called the automonitor section. Each time you enter theSTEP command or a breakpoint is encountered, z/OS Debugger does the followingtasks:1. Removes any variable names and values displayed in the automonitor section.
Chapter 21. Using full-screen mode: overview 205

2. Displays the names and values of the variables of the statement that z/OSDebugger runs next. The values displayed are values before the statement isrun.
This behavior displays the value of the variables before z/OS Debugger runs thestatement. If you want to see the value of the variables after z/OS Debugger runsthe statement, you can enter the SET AUTOMONITOR ON PREVIOUS command. z/OSDebugger displays the line ********** AUTOMONITOR – PREVIOUS load-name ::>cu-name :> statement-id ********** at the bottom of the list of any monitoredvariables in the Monitor window. Each time you enter the STEP command or abreakpoint is encountered, z/OS Debugger does the following tasks:1. Removes any variable names and values displayed in the automonitor section.2. Displays the names and the values of the variables of the most recent statement
that z/OS Debugger ran. The values displayed are values after that statementwas run.
If you want to see the value of the variables before and after z/OS Debugger runsthe statement, you can enter the SET AUTOMONITOR ON BOTH command. z/OSDebugger displays the line ********** AUTOMONITOR load-name ::> cu-name :>statement-id ********** at the bottom of the list of any monitored variables inthe Monitor window. Below this line, z/OS Debugger displays the names andvalues of the variables on the statement that z/OS Debugger runs next. Then,z/OS Debugger displays the line ***** Previous Statement load-name ::>cu-name :> statement-id ***** . Below this line, z/OS Debugger displays thenames and values of the variables of the statement that z/OS Debugger just ran.Each time you enter the STEP command or a breakpoint is encountered, z/OSDebugger does the following tasks:1. Removes any variable names and values displayed in the automonitor section.2. Displays the names and values of the variables of the statement that z/OS
Debugger runs next. The values displayed are values before the statement isrun.
3. Displays the names and the values of the variables of the statement that z/OSDebugger just ran. The values displayed are values after the statement was run.
Refer to the following topics for more information related to the material discussedin this topic.
Related tasks“Adding variables to the Monitor window automatically” on page 204
Related referencesDescription of the SET AUTOMONITOR command in IBM z/OS Debugger Referenceand Messages.“Example: How z/OS Debugger adds variables to the Monitor windowautomatically”
Example: How z/OS Debugger adds variables to the Monitorwindow automaticallyThe example in this section assumes that the following two lines of COBOL codeare to be run:COMPUTE LOAN-AMOUNT = FUNCTION NUMVAL(LOAN-AMOUNT-IN). ▌1▐COMPUTE INTEREST-RATE = FUNCTION NUMVAL(INTEREST-RATE-IN).
Before you run the statement in Line ▌1▐, enter the following command:SET AUTOMONITOR ON ;
206 IBM z/OS Debugger V14.1.9 User's Guide

The name and value of the variables LOAN-AMOUNT and LOAN-AMOUNT-IN aredisplayed in the automonitor section of the Monitor window. These values are thevalues of the variables before you run the statement.
Enter the STEP command. z/OS Debugger removes LOAN-AMOUNT andLOAN-AMOUNT-IN from the automonitor section of the Monitor window and thendisplays the name and value of the variables INTEREST-RATE and INTEREST-RATE-IN.These values are the values of the variables before you run the statement.
Refer to the following topics for more information related to the material discussedin this topic.
Related concepts“How z/OS Debugger automatically adds variables to the Monitor window” onpage 205
Related tasks“Adding variables to the Monitor window automatically” on page 204
Related referencesDescription of the SET AUTOMONITOR command in IBM z/OS Debugger Referenceand Messages.
How z/OS Debugger handles characters that cannot bedisplayed in their declared data type
In the Monitor window, z/OS Debugger uses one of the following characters toindicate that a character cannot be displayed in its declared data type:v For COBOL and PL/I programs, z/OS Debugger displays a dot (X'4B').v For assembler and LangX COBOL programs, z/OS Debugger displays a
quotation mark (").v For C and C++ programs, z/OS Debugger displays the character as an escape
sequence.
Characters that cannot be displayed in their declared data type can vary from codepage to code page, but, in general, these are characters that have no correspondingsymbol that can be displayed on a screen.
To be able to modify these characters, you can use the HEX and DEF prefixcommands to help you verify which character you are modifying.
Refer to the following topics for more information related to the material discussedin this topic.
Related tasks“Modifying characters that cannot be displayed in their declared data type”
Modifying characters that cannot be displayed in theirdeclared data type
As described in “How z/OS Debugger handles characters that cannot be displayedin their declared data type,” if you want to modify characters that can't bedisplayed in their declared data type and ensure that the results are what youexpected, do the following steps:1. Move the cursor to the prefix area of the Monitor window, along the line that
contains the character you want to modify.
Chapter 21. Using full-screen mode: overview 207

2. Enter the HEX prefix command. z/OS Debugger changes the character to displayin hexadecimal format.
3. Move the cursor to the character.4. Type in the new hexadecimal value and then press Enter. z/OS Debugger
modifies the character and displays the new value in hexadecimal format.5. If you want to view the character in its declared data type, move the cursor to
the prefix area and enter the DEF command.
Refer to the following topics for more information related to the material discussedin this topic.
“Displaying and monitoring the value of a variable” on page 200“Modifying the value of a COBOL variable” on page 221“Displaying and modifying the value of LangX COBOL variables or storage” onpage 233“Modifying the value of a PL/I variable” on page 239“Modifying the value of a C variable” on page 249“Modifying the value of a C++ variable” on page 260“Displaying and modifying the value of assembler variables or storage” onpage 273Related referencesPrefix commands in IBM z/OS Debugger Reference and Messages
Formatting values in the Monitor windowTo monitor the value of the variable in columnar format, enter the SET MONITORCOLUMN ON command. The variable names that are displayed in the Monitorwindow are aligned to the same column and values are aligned to the samecolumn. z/OS Debugger displays the Monitor value area scale under the headerline for the Monitor window.
To display the value of the monitored variables wrapped in the Monitor window,enter the SET MONITOR WRAP ON command. To display the value of the monitoredvariables in a scrollable line, enter the SET MONITOR WRAP OFF command after youenter the SET MONITOR COLUMN ON command.
Displaying values in hexadecimal formatYou can display the value of a variable in hexadecimal format by entering the LIST%HEX command or defining a PF key with the LIST %HEX command. For PL/Iprograms, to display the value of a variable in hexadecimal format, use the PL/Ibuilt-in function HEX. For more information about the PL/I HEX built-in function,see Enterprise PL/I for z/OS: Programming Guide. If you display a PL/I variable inhexadecimal format, you cannot edit the value of the variable by typing over theexisting value in the Monitor window.
To display the value of a variable in hexadecimal format, enter one of thefollowing commands, substituting variable-name with the name of your variable:v For PL/I programs: LIST HEX(variable-name) ;v For all other programs: LIST %HEX(variable-name) ;
z/OS Debugger displays the value of the variable variable-name in hexadecimalformat.
If you defined a PF key with the LIST %HEX command, do the following steps:
208 IBM z/OS Debugger V14.1.9 User's Guide

1. If the variable is not displayed in the Source window, scroll through yourprogram until the variable you want is displayed in the Source window.
2. Move your cursor to the variable name.3. Press the PF key to which you defined LIST %HEX command. z/OS Debugger
displays the value of the variable variable-name in hexadecimal format.
You cannot define a PF key with the PL/I HEX built-in function.
Monitoring the value of variables in hexadecimal formatYou can monitor the value of a variable in either the variable's declared data typeor in hexadecimal format. To monitor the value of a variable in its declared datatype, follow the instructions described in “Adding variables to the Monitorwindow” on page 201. If you monitor a PL/I variable in hexadecimal format byusing the PL/I HEX built-in function, you cannot edit the value of the variable bytyping over the existing value in the Monitor window. Instead of using the PL/IHEX built-in function, us the commands described in this topic.
To monitor the value of a variable or expression in hexadecimal format, do one ofthe following instructions:v If the variable is already being monitored, enter the following command:
MONITOR n HEX ;
Substitute n with the number in the monitor list that corresponds to themonitored expression that you would like to display in hexadecimal format.
v If the variable is not being monitored, enter the following command:MONITOR LIST (expression) HEX ;
Substitute expression with the name of the variable or a complex expression thatyou want to monitor.
Refer to the following topics for more information related to the material discussedin this topic.
Related tasks“Entering prefix commands on specific lines or statements” on page 175
Modifying variables or storage by using a commandYou can modify the value of a variable or storage by using one of the followingcommands:v assignment command for assembler or disassemblyv assignment command for LangX COBOLv assignment command for PL/Iv COMPUTE command for COBOLv Expression command for C and C++v MOVE command for COBOLv SET command for COBOLv STORAGE
Each command is described in IBM z/OS Debugger Reference and Messages.
Refer to the following topics for more information related to the material discussedin this topic.
Related tasks“Displaying values of COBOL variables” on page 296
Chapter 21. Using full-screen mode: overview 209

“Displaying values of C and C++ variables or expressions” on page 325“Accessing PL/I program variables” on page 315“Displaying and modifying the value of assembler variables or storage” onpage 273
Modifying variables or storage by typing over an existingvalue
To modify the value of a variable by typing over the existing value in the Monitorwindow, do the following steps:1. Move the cursor to the existing value. If the part of value you that want to
modify is out of screen, use the SCROLL Monitor value area function (availablewith the SET MONITOR WRAP OFF command) and move the cursor to the positionof existing value.
2. Type in the new value. Black vertical bars mark the area where you can type inyour new value; you cannot type anything before and including the left verticalbar nor can you type anything including and after the right vertical bar.
3. Press Enter.z/OS Debugger modifies the variable or storage. The command that z/OSDebugger generated to modify the variable or storage is stored in the log file.
Restrictions for modifying variables in the Monitor windowYou can modify the value of a variable by typing over the existing value in theMonitor window, with the following exceptions:v You cannot type in a value that is larger than the declared type of the variable.
For example, if you declare a variable as a string of four character and you tryto type in five characters, z/OS Debugger prevents you from typing in the fifthcharacter.
v If z/OS Debugger cannot display the entire value in the Monitor window andthe setting of MONITOR WRAP is ON, you cannot modify the value of that variable.
v If you modify a long value and the setting of MONITOR WRAP is OFF, z/OSDebugger creates a STORAGE command to modify the value. If you are debugginga program that is optimized, the STORAGE command might not modify the value.
v You cannot modify the value of z/OS Debugger variables, except value ofregisters %GPRn, %FPRn, %EPRn, %LPRn.
v You cannot modify the value of a z/OS Debugger built-in function.v You cannot modify the value of a PL/I built-in function.v You cannot modify a complex expression.
If you type quotation marks (") or apostrophes (') in the Monitor value area,carefully verify that they comply with any applicable quotation rules.
Opening and closing the Monitor windowIf the Monitor window is closed before you enter the SET AUTOMONITOR ONcommand, z/OS Debugger opens the Monitor window and displays the name andvalue of the variables of statement you run in the automonitor section of thewindow.
If the Monitor window is open before you enter the SET AUTOMONITOR OFFcommand and you are watching the value of variables not monitored by SETAUTOMONITOR ON, the Monitor window remains open.
210 IBM z/OS Debugger V14.1.9 User's Guide

Displaying and modifying memory through the Memory windowz/OS Debugger can display sections of memory through the Memory window. Youcan open the Memory window and have it display a specific section of memory bydoing one of the following options:v Entering the MEMORY command and specifying a base address. If the Memory
window is already displayed through a physical window, the memory dumparea displays memory starting at the base address.If the Memory window is not displayed through a physical window, the baseaddress is saved for usage later when the Memory window is displayed througha physical window.To display the Memory window through a physical window, use the WINDOWSWAP MEMORY LOG command or PANEL LAYOUT command.
v Assigning the MEMORY command to a PF key. After you assign the MEMORYcommand to a PF key, you can move the cursor to a variable, then press the PFkey. If the Memory window is already displayed through a physical window, thememory dump area displays memory starting at the base address. If theMemory window is not displayed through a physical window, the base addressis saved for usage later when the Memory window is displayed through aphysical window.To display the Memory window through a physical window, use the WINDOWSWAP MEMORY LOG command or PANEL LAYOUT command.
Refer to the following topics for more information related to the material discussedin this topic.
Related tasks“Scrolling through the physical windows” on page 180“Switching between the Memory window and Log window” on page 180“Displaying memory through the Memory window” on page 17“Customizing the layout of physical windows on the session panel” on page278Related references“Memory window” on page 167“Order in which z/OS Debugger accepts commands from the session panel” onpage 174MEMORY command in IBM z/OS Debugger Reference and Messages
Modifying memory through the hexadecimal data areaYou can type over the hexadecimal data area with hexadecimal characters (0-9, A-F,a-f). z/OS Debugger updates the memory with the value you typed in. If youmodify the program instruction area of memory, z/OS Debugger does not do anySTEP commands or stop at any AT breakpoints near the area where you modifiedmemory. In addition, if you try to run the program, the results are unpredictable.
The character data column is the character representation of the data and is onlyfor viewing purposes.
Managing file allocationsYou can manage files while you are debugging by using the DESCRIBE ALLOCATIONS,ALLOCATE, and FREE commands. You cannot manage files while debugging CICSprograms.
Chapter 21. Using full-screen mode: overview 211

To view a current list of allocated files, enter the DESCRIBE ALLOCATIONS command.The following screen displays the command and sample output:
DESCRIBE ALLOCATIONS ;* Current allocations:* VOLUME CAT DISP OPEN DDNAME DSNAME* ▌1▐--- ▌2▐- ▌3▐------ ▌4▐- ▌5▐----- ▌6▐------------------------------------------* COD008 * SHR KEEP * EQAZSTEP BCARTER.TEST.LOAD* SMS004 * SHR KEEP SHARE.CEE210.SCEERUN* COD00B * OLD KEEP * INSPLOG BCARTER.DTOOL.LOGV* VIO NEW DELETE ISPCTL0 SYS02190.T085429.RA000.BCARTER.R0100269* COD016 * SHR KEEP ISPEXEC BCARTER.MVS.EXEC* IPLB13 * SHR KEEP ISPF.SISPEXEC.VB* VIO NEW DELETE ISPLST1 SYS02190.T085429.RA000.BCARTER.R0100274* IPLB13 * SHR KEEP * ISPMLIB ISPF.SISPMENU* SMS278 * SHR KEEP SHARE.ANALYZ21.SIDIMLIB* SHR89A * SHR KEEP SHARE.ISPMLIB* SMS25F * SHR KEEP * ISPPLIB SHARE.PROD.ISPPLIB* SMS891 * SHR KEEP SHARE.ISPPLIB* SMS25F * SHR KEEP SHARE.ANALYZ21.SIDIPLIB* IPLB13 * SHR KEEP ISPF.SISPPENU* IPLB13 * SHR KEEP SDSF.SISFPLIB* IPLB13 * SHR KEEP SYS1.SBPXPENU* COD002 * OLD KEEP * ISPPROF BCARTER.ISPPROF* NEW DELETE SYSIN TERMINAL* NEW DELETE SYSOUT TERMINAL* NEW DELETE SYSPRINT TERMINAL
The following list describes each column:
▌1▐ VOLUMEThe volume serial of the DASD volume that contains the data set.
▌2▐ CATAn asterisk in this column indicates that the data set was located by usingthe system catalog.
▌3▐ DISPThe disposition that is assigned to the data set.
▌4▐ OPENAn asterisk in this column indicates that the file is currently open.
▌5▐ DDNAMEDD name for the file.
▌6▐ DSNAMEData set name for a DASD data set:v DUMMY for a DD DUMMYv SYSOUT(x) for a SYSOUT data setv TERMINAL for a file allocated to the terminalv * for a DD * file
You can allocate files to an existing, cataloged data set by using the ALLOCATEcommand.
You can free an allocated file by using the FREE command.
By default, the DESCRIBE ALLOCATIONS command lists the files allocated by thecurrent user. You can specify other parameters to list other system allocations, suchas the data sets currently allocated to LINK list, LPA list, APF list, system catalogs,Parmlib, and Proclib. The IBM z/OS Debugger Reference and Messages describes theparameters you must specify to list this information.
212 IBM z/OS Debugger V14.1.9 User's Guide

Displaying error numbers for messages in the Log windowWhen an error message shows up in the Log window without a message ID, youcan have the message ID show up as in:EQA1807E The command element d is ambiguous.
Either modify your profile or use the SET MSGID ON command. To modify yourprofile, use the PANEL PROFILE command and set Show message ID numbers toYES by typing over the NO.
Refer to the following topics for more information related to the material discussedin this topic.
Related tasks“Customizing profile settings” on page 282
Displaying a list of compile units known to z/OS DebuggerThis topics describes what to do if you want to know which compile units areknown to z/OS Debugger. This is helpful if you have forgotten the name of acompile unit or the load module that a compile unit belongs to.
To determine which compile units are known to z/OS Debugger, do one of thefollowing options:v Enter the LIST NAMES CUS command.v If you are debugging an assembler or disassembly program, enter the SET
DISASSEMBLY ON or SET ASSEMBLER ON command, then enter the LIST NAMES CUScommand.
After you run the LIST NAMES CUS command, z/OS Debugger displays a list ofcompile units in the Log window. You can use this list to compose a SET QUALIFYCU command by typing in the words "SET QUALIFY CU" over the name of acompile unit. Then press Enter. z/OS Debugger displays the command constructedfrom the words that you typed in and the name of the compile unit. Press Enteragain to run the command.
For example, after you enter the LIST NAMES CUS command, z/OS Debuggerdisplays the following lines in the Log window:USERID.MFISTART.C(CALC)USERID.MFISTART.C(PUSHPOP)USERID.MFISTART.C(READTOKN)
If you type "SET QUALIFY CU" over the last line, then press Enter, z/OSDebugger composes the following command into the command line: SET QUALIFYCU "USERID.MFISTART.C(READTOKN)". Press Enter and z/OS Debugger runs thecommand.
This method saves keystrokes and reduces errors in long commands.
Refer to the following topics for more information related to the material discussedin this topic.
Related tasks“Changing which file appears in the Source window” on page 170
Chapter 21. Using full-screen mode: overview 213
Requesting an attention interrupt during interactive sessionsDuring an interactive z/OS Debugger session, you can request an attentioninterrupt, if necessary. For example, you can stop what appears to be an unendingloop, stop the display of voluminous output at your terminal, or stop the executionof the STEP command.
An attention interrupt should not be confused with the ATTENTION condition. If youset an AT OCCURRENCE or ON ATTENTION, the commands associated with thatbreakpoint are not run at an attention interrupt.
Language Environment TRAP and INTERRUPT run-time options should both be set toON in order for attention interrupts that are recognized by the host operatingsystem to be also recognized by Language Environment. The test_level suboption ofthe TEST run-time option should not be set to NONE.
An attention interrupt key is not supported in the following environment anddebugging modes:v CICSv full-screen mode using the Terminal Interface Manager
For MVS only: For C, when using an attention interrupt, use SET INTERCEPT ONFILE stdout to intercept messages to the terminal. This is required becausemessages do not go to the terminal after an attention interrupt.
For the Dynamic Debug facility only: The Dynamic Debug facility supportsattention interrupts only for programs that have compiled-in hooks.
The correct key might not be marked ATTN on every keyboard. Often thefollowing keys are used:v Under TSO: PA1 keyv Under IMS: PA1 key
When you request an attention interrupt, control is given to z/OS Debugger:v At the next hook if z/OS Debugger has previously gained control or if you
specified either TEST(ERROR) or TEST(ALL) or have specifically set breakpointsv At a __ctest() or CEETEST callv When an HLL condition is raised in the program, such as SIGINT in C
Refer to the following topics for more information related to the material discussedin this topic.
Related tasks“Starting a debugging session in full-screen mode using the Terminal InterfaceManager or a dedicated terminal” on page 143Related referencesz/OS Language Environment Programming Guide
Ending a full-screen debug sessionWhen you have finished debugging your program, you can end your full-screendebug session by using one of the following methods:
Method A
1. Press PF3 (QUIT) or enter QUIT on the command line.
214 IBM z/OS Debugger V14.1.9 User's Guide

2. Type Y to confirm your request and press Enter. Your program stopsrunning.
If you are debugging a CICS non-Language Environment assembler ornon-Language Environment COBOL program, QUIT ends z/OS Debuggerand the task ends with an ABEND 4038.
Method B
1. Enter the QQUIT command. You are not prompted to confirm yourrequest to end your debug session. Your program stops running.
If you are debugging a CICS non-Language Environment assembler ornon-Language Environment COBOL program, QUIT ends z/OS Debuggerand the task ends with an ABEND 4038.
Method C
1. Enter the QUIT DEBUG or the QUIT DEBUG TASK (CICS only) command.2. Type Y to confirm your request and press Enter. z/OS Debugger ends
and your program continues running.
Refer to the following topics for more information related to the material discussedin this topic.
Related referencesIBM z/OS Debugger Reference and Messages
Chapter 21. Using full-screen mode: overview 215

216 IBM z/OS Debugger V14.1.9 User's Guide

Chapter 22. Debugging a COBOL program in full-screen mode
Note: This chapter is not applicable to IBM Developer for z Systems(non-Enterprise Edition), IBM Z Open Development, or IBM Z Open Unit Test.
The descriptions of basic debugging tasks for COBOL refer to the followingCOBOL program.
“Example: sample COBOL program for debugging”
Refer to the following topics for more information related to the material discussedin this topic.
Related tasksChapter 30, “Debugging COBOL programs,” on page 293“Halting when certain routines are called in COBOL” on page 220“Modifying the value of a COBOL variable” on page 221“Halting on a COBOL line only if a condition is true” on page 222“Debugging COBOL when only a few parts are compiled with TEST” on page222“Capturing COBOL I/O to the system console” on page 223“Displaying raw storage in COBOL” on page 224“Getting a COBOL routine traceback” on page 224“Tracing the run-time path for COBOL code compiled with TEST” on page 224“Generating a COBOL run-time paragraph trace” on page 225“Finding unexpected storage overwrite errors in COBOL” on page 226“Halting before calling an invalid program in COBOL” on page 227
Example: sample COBOL program for debuggingThe program below is used in various topics to demonstrate debugging tasks.
This program calls two subprograms to calculate a loan payment amount and thefuture value of a series of cash flows. It uses several COBOL intrinsic functions.
Main program COBCALC*********************************************************** COBCALC ** ** A simple program that allows financial functions to ** be performed using intrinsic functions. ** ***********************************************************IDENTIFICATION DIVISION.PROGRAM-ID. COBCALC.ENVIRONMENT DIVISION.DATA DIVISION.WORKING-STORAGE SECTION.01 PARM-1.
05 CALL-FEEDBACK PIC XX.01 FIELDS.
05 INPUT-1 PIC X(10).01 INPUT-BUFFER-FIELDS.
05 BUFFER-PTR PIC 9.05 BUFFER-DATA.
10 FILLER PIC X(10) VALUE "LOAN".10 FILLER PIC X(10) VALUE "PVALUE".
© Copyright IBM Corp. 1992, 2019 217

10 FILLER PIC X(10) VALUE "pvalue".10 FILLER PIC X(10) VALUE "END".
05 BUFFER-ARRAY REDEFINES BUFFER-DATAOCCURS 4 TIMES
PIC X(10).
PROCEDURE DIVISION.DISPLAY "CALC Begins." UPON CONSOLE.MOVE 1 TO BUFFER-PTR.MOVE SPACES TO INPUT-1.
* Keep processing data until END requestedPERFORM ACCEPT-INPUT UNTIL INPUT-1 EQUAL TO "END".
* END requestedDISPLAY "CALC Ends." UPON CONSOLE.GOBACK.
* End of program.
** Accept input data from buffer*ACCEPT-INPUT.
MOVE BUFFER-ARRAY (BUFFER-PTR) TO INPUT-1.ADD 1 BUFFER-PTR GIVING BUFFER-PTR.
* Allow input data to be in UPPER or lower caseEVALUATE FUNCTION UPPER-CASE(INPUT-1) ▌CALC1▐WHEN "END"
MOVE "END" TO INPUT-1WHEN "LOAN"
PERFORM CALCULATE-LOANWHEN "PVALUE"
PERFORM CALCULATE-VALUEWHEN OTHER
DISPLAY "Invalid input: " INPUT-1END-EVALUATE.
** Calculate Loan via CALL to subprogram*CALCULATE-LOAN.
CALL "COBLOAN" USING CALL-FEEDBACK.IF CALL-FEEDBACK IS NOT EQUAL "OK" THENDISPLAY "Call to COBLOAN Unsuccessful.".
** Calculate Present Value via CALL to subprogram*CALCULATE-VALUE.
CALL "COBVALU" USING CALL-FEEDBACK.IF CALL-FEEDBACK IS NOT EQUAL "OK" THENDISPLAY "Call to COBVALU Unsuccessful.".
Subroutine COBLOAN*********************************************************** COBLOAN ** ** A simple subprogram that calculates payment amount ** for a loan. ** ***********************************************************IDENTIFICATION DIVISION.PROGRAM-ID. COBLOAN.ENVIRONMENT DIVISION.DATA DIVISION.WORKING-STORAGE SECTION.01 FIELDS.
05 INPUT-1 PIC X(26).05 PAYMENT PIC S9(9)V99 USAGE COMP.05 PAYMENT-OUT PIC $$$$,$$$,$$9.99 USAGE DISPLAY.
218 IBM z/OS Debugger V14.1.9 User's Guide

05 LOAN-AMOUNT PIC S9(7)V99 USAGE COMP.05 LOAN-AMOUNT-IN PIC X(16).05 INTEREST-IN PIC X(5).05 INTEREST PIC S9(3)V99 USAGE COMP.05 NO-OF-PERIODS-IN PIC X(3).05 NO-OF-PERIODS PIC 99 USAGE COMP.05 OUTPUT-LINE PIC X(79).
LINKAGE SECTION.01 PARM-1.
05 CALL-FEEDBACK PIC XX.PROCEDURE DIVISION USING PARM-1.
MOVE "NO" TO CALL-FEEDBACK.MOVE "30000 .09 24 " TO INPUT-1.UNSTRING INPUT-1 DELIMITED BY ALL " "
INTO LOAN-AMOUNT-IN INTEREST-IN NO-OF-PERIODS-IN.* Convert to numeric values
COMPUTE LOAN-AMOUNT = FUNCTION NUMVAL(LOAN-AMOUNT-IN).COMPUTE INTEREST = FUNCTION NUMVAL(INTEREST-IN).COMPUTE NO-OF-PERIODS = FUNCTION NUMVAL(NO-OF-PERIODS-IN).
* Calculate annuity amount requiredCOMPUTE PAYMENT = LOAN-AMOUNT *
FUNCTION ANNUITY((INTEREST / 12 ) NO-OF-PERIODS).* Make it presentable
MOVE SPACES TO OUTPUT-LINEMOVE PAYMENT TO PAYMENT-OUT.STRING "COBLOAN:_Repayment_amount_for_a_" NO-OF-PERIODS-IN
"_month_loan_of_" LOAN-AMOUNT-IN"_at_" INTEREST-IN "_interest_is:_"
DELIMITED BY SPACESINTO OUTPUT-LINE.
INSPECT OUTPUT-LINE REPLACING ALL "_" BY SPACES.DISPLAY OUTPUT-LINE PAYMENT-OUT.MOVE "OK" TO CALL-FEEDBACK.GOBACK.
Subroutine COBVALU*********************************************************** COBVALU ** ** A simple subprogram that calculates present value ** for a series of cash flows. ** ***********************************************************IDENTIFICATION DIVISION.PROGRAM-ID. COBVALU.ENVIRONMENT DIVISION.DATA DIVISION.WORKING-STORAGE SECTION.01 CHAR-DATA.
05 INPUT-1 PIC X(10).05 PAYMENT-OUT PIC $$$$,$$$,$$9.99 USAGE DISPLAY.05 INTEREST-IN PIC X(5).05 NO-OF-PERIODS-IN PIC X(3).05 INPUT-BUFFER PIC X(10) VALUE "5069837544".05 BUFFER-ARRAY REDEFINES INPUT-BUFFER
OCCURS 5 TIMESPIC XX.
05 OUTPUT-LINE PIC X(79).01 NUM-DATA.
05 PAYMENT PIC S9(9)V99 USAGE COMP.05 INTEREST PIC S9(3)V99 USAGE COMP.05 COUNTER PIC 99 USAGE COMP.05 NO-OF-PERIODS PIC 99 USAGE COMP.05 VALUE-AMOUNT OCCURS 99 PIC S9(7)V99 COMP.
LINKAGE SECTION.01 PARM-1.
Chapter 22. Debugging a COBOL program in full-screen mode 219

05 CALL-FEEDBACK PIC XX.PROCEDURE DIVISION USING PARM-1.
MOVE "NO" TO CALL-FEEDBACK.MOVE ".12 5 " TO INPUT-1.UNSTRING INPUT-1 DELIMITED BY "," OR ALL " " ▌VALU1▐INTO INTEREST-IN NO-OF-PERIODS-IN.
* Convert to numeric valuesCOMPUTE INTEREST = FUNCTION NUMVAL(INTEREST-IN). ▌VALU2▐COMPUTE NO-OF-PERIODS = FUNCTION NUMVAL(NO-OF-PERIODS-IN).
* Get cash flowsPERFORM GET-AMOUNTS VARYING COUNTER FROM 1 BY 1 UNTILCOUNTER IS GREATER THAN NO-OF-PERIODS.
* Calculate present valueCOMPUTE PAYMENT =
FUNCTION PRESENT-VALUE(INTEREST VALUE-AMOUNT(ALL) ). ▌VALU3▐* Make it presentable
MOVE PAYMENT TO PAYMENT-OUT.STRING "COBVALU:_Present_value_for_rate_of_"
INTEREST-IN "_given_amounts_"BUFFER-ARRAY (1) ",_"BUFFER-ARRAY (2) ",_"BUFFER-ARRAY (3) ",_"BUFFER-ARRAY (4) ",_"BUFFER-ARRAY (5) "_is:_"
DELIMITED BY SPACESINTO OUTPUT-LINE.
INSPECT OUTPUT-LINE REPLACING ALL "_" BY SPACES.DISPLAY OUTPUT-LINE PAYMENT-OUT.MOVE "OK" TO CALL-FEEDBACK.GOBACK.
** Get cash flows for each period*GET-AMOUNTS.
MOVE BUFFER-ARRAY (COUNTER) TO INPUT-1.COMPUTE VALUE-AMOUNT (COUNTER) = FUNCTION NUMVAL(INPUT-1).
Refer to the following topics for more information related to the material discussedin this topic.
Related tasksChapter 22, “Debugging a COBOL program in full-screen mode,” on page 217
Halting when certain routines are called in COBOLThis topic describes how to halt just before or just after a routine is called by usingthe AT CALL or AT ENTRY commands. The “Example: sample COBOL program fordebugging” on page 217 is used to describe these commands.
To use the AT CALL command, you must compile the calling program with the TESTcompiler option.
To halt just before COBLOAN is called, enter the following command:AT CALL COBLOAN ;
To use the AT ENTRY command, you must compile the called program with the TESTcompiler option.
To halt just after COBVALU is called, enter the following command:AT ENTRY COBVALU ;
220 IBM z/OS Debugger V14.1.9 User's Guide

To halt just after COBVALU is called and only when CALL-FEEDBACK equals OK,enter the following command:AT ENTRY COBVALU WHEN CALL-FEEDBACK = "OK" ;
Identifying the statement where your COBOL program has stoppedIf you have many breakpoints set in your program, enter the following commandto have z/OS Debugger identify your program has been stopped:QUERY LOCATION
The z/OS Debugger Log window displays something similar to the followingexample:QUERY LOCATION ;You were prompted because STEP ended.The program is currently entering block COBVALU.
Modifying the value of a COBOL variable“Example: sample COBOL program for debugging” on page 217
To list the contents of a single variable, move the cursor to an occurrence of thevariable name in the Source window and press PF4 (LIST). Remember that z/OSDebugger starts after program initialization but before symbolic COBOL variablesare initialized, so you cannot view or modify the contents of variables until youhave performed a step or run. The value is displayed in the Log window. This isequivalent to entering LIST TITLED variable on the command line. Run theCOBCALC program to the statement labeled ▌CALC1▐, and enter AT 46 ; GO ; onthe z/OS Debugger command line. Move the cursor over INPUT-1 and press LIST(PF4). The following appears in the Log window:LIST ( INPUT-1 ) ;INPUT-1 = ’LOAN ’
To modify the value of INPUT-1, enter on the command line:MOVE ’pvalue’ to INPUT-1 ;
You can enter most COBOL expressions on the command line.
Now step into the call to COBVALU by pressing PF2 (STEP) and step until thestatement labeled ▌VALU2▐ is reached. To view the attributes of the variableINTEREST, issue the z/OS Debugger command:DESCRIBE ATTRIBUTES INTEREST ;
The result in the Log window is:ATTRIBUTES FOR INTEREST
ITS LENGTH IS 4ITS ADDRESS IS 00011DC802 COBVALU:>INTEREST S999V99 COMP
You can use this action as a simple browser for group items and data hierarchies.For example, you can list all the values of the elementary items for theCHAR-DATA group with the command:LIST CHAR-DATA ;
with results in the Log window appearing something like this:
Chapter 22. Debugging a COBOL program in full-screen mode 221

LIST CHAR-DATA ;02 COBVALU:>INPUT-1 of 01 COBVALU:>CHAR-DATA = ’.12 5 ’Invalid data for 02 COBVALU:>PAYMENT-OUT of 01 COBVALU:>CHAR-DATA is found.02 COBVALU:>INTEREST-IN of 01 COBVALU:>CHAR-DATA = ’.12 ’02 COBVALU:>NO-OF-PERIODS-IN of 01 COBVALU:>CHAR-DATA = ’5 ’02 COBVALU:>INPUT-BUFFER of 01 COBVALU:>CHAR-DATA = ’5069837544’SUB(1) of 02 COBVALU:>BUFFER-ARRAY of 01 COBVALU:>CHAR-DATA = ’50’SUB(2) of 02 COBVALU:>BUFFER-ARRAY of 01 COBVALU:>CHAR-DATA = ’69’SUB(3) of 02 COBVALU:>BUFFER-ARRAY of 01 COBVALU:>CHAR-DATA = ’83’SUB(4) of 02 COBVALU:>BUFFER-ARRAY of 01 COBVALU:>CHAR-DATA = ’75’SUB(5) of 02 COBVALU:>BUFFER-ARRAY of 01 COBVALU:>CHAR-DATA = ’44’
Note: If you use the LIST command to list the contents of an uninitialized variable,or a variable that contains invalid data, z/OS Debugger displays INVALID DATA.
Refer to the following topics for more information related to the material discussedin this topic.
Related tasks“Using COBOL variables with z/OS Debugger” on page 295
Halting on a COBOL line only if a condition is trueOften a particular part of your program works fine for the first few thousandtimes, but it fails under certain conditions. You don't want to just set a linebreakpoint because you will have to keep entering GO.
“Example: sample COBOL program for debugging” on page 217
For example, in COBVALU you want to stop at the calculation of present valueonly if the discount rate is less than or equal to -1 (before the exception occurs).First run COBCALC, step into COBVALU, and stop at the statement labeled▌VALU1▐. To accomplish this, issue these z/OS Debugger commands at the start ofCOBCALC:AT 67 ; GO ;CLEAR AT 67 ; STEP 4 ;
Now set the breakpoint like this:AT 44 IF INTEREST > -1 THEN GO ; END-IF ;
Line 44 is the statement labeled ▌VALU3▐. The command causes z/OS Debugger tostop at line 44. If the value of INTEREST is greater than -1, the program continues.The command causes z/OS Debugger to remain on line 44 only if the value ofINTEREST is less than or equal to -1.
To force the discount rate to be negative, enter the z/OS Debugger command:MOVE ’-2 5’ TO INPUT-1 ;
Run the program by issuing the GO command. z/OS Debugger halts the program atline 44. Display the contents of INTEREST by issuing the LIST INTEREST command.To view the effect of this breakpoint when the discount rate is positive, begin anew debug session and repeat the z/OS Debugger commands shown in thissection. However, do not issue the MOVE ’-2 5’ TO INPUT-1 command. Theprogram execution does not stop at line 44 and the program runs to completion.
Debugging COBOL when only a few parts are compiled with TEST“Example: sample COBOL program for debugging” on page 217
222 IBM z/OS Debugger V14.1.9 User's Guide

Suppose you want to set a breakpoint at entry to COBVALU. COBVALU has beencompiled with TEST but the other programs have not. z/OS Debugger comes upwith an empty Source window. You can use the LIST NAMES CUS command todetermine if the COBVALU compile unit is known to z/OS Debugger and then setthe appropriate breakpoint using either the AT APPEARANCE or the AT ENTRYcommand.
Instead of setting a breakpoint at entry to COBVALU in this example, issue a STEPcommand when z/OS Debugger initially displays the empty Source window. z/OSDebugger runs the program until it reaches the entry for the first routine compiledwith TEST, COBVALU in this case.
Refer to the following topics for more information related to the material discussedin this topic.
Related tasks“Halting when certain routines are called in COBOL” on page 220
Capturing COBOL I/O to the system consoleTo redirect output normally appearing on the system console to your z/OSDebugger terminal, enter the following command:SET INTERCEPT ON CONSOLE ;
“Example: sample COBOL program for debugging” on page 217
For example, if you run COBCALC and issue the z/OS Debugger SET INTERCEPTON CONSOLE command, followed by the STEP 3 command, you will see thefollowing output displayed in the z/OS Debugger Log window:SET INTERCEPT ON CONSOLE ;STEP 3 ;CONSOLE : CALC Begins.
The phrase CALC Begins. is displayed by the statement DISPLAY "CALC Begins."UPON CONSOLE in COBCALC.
The SET INTERCEPT ON CONSOLE command not only captures output to the systemconsole, but also allows you to input data from your z/OS Debugger terminalinstead of the system console by using the z/OS Debugger INPUT command. Forexample, if the next COBOL statement executed is ACCEPT INPUT-DATA FROMCONSOLE, the following message appears in the z/OS Debugger Log window:CONSOLE : IGZ0000I AWAITING REPLY.The program is waiting for input from CONSOLE.Use the INPUT command to enter 114 characters for the interceptedfixed-format file.
Continue execution by replying to the input request by entering the followingz/OS Debugger command:INPUT some data ;
Note: Whenever z/OS Debugger intercepts system console I/O, and for theduration of the intercept, the display in the Source window is empty and theLocation field in the session panel header at the top of the screen shows Unknown.
Chapter 22. Debugging a COBOL program in full-screen mode 223

Displaying raw storage in COBOLYou can display the storage for a variable by using the LIST STORAGE command.For example, to display the storage for the first 12 characters of BUFFER-DATAenter:LIST STORAGE(BUFFER-DATA,12)
You can also display only a section of the data. For example, to display the storagethat starts at offset 4 for a length of 6 characters, enter:LIST STORAGE(BUFFER-DATA,4,6)
Refer to the following topics for more information related to the material discussedin this topic.
Related tasks“Displaying and modifying memory through the Memory window” on page211
Getting a COBOL routine tracebackOften when you get close to a programming error, you want to know how you gotinto that situation, and especially what the traceback of calling routines is. To getthis information, issue the command:LIST CALLS ;
“Example: sample COBOL program for debugging” on page 217
For example, if you run the COBCALC example with the commands:AT APPEARANCE COBVALU AT ENTRY COBVALU;GO;GO;LIST CALLS;
the Log window contains something like:AT APPEARANCE COBVALUAT ENTRY COBVALU ;
GO ;GO ;LIST CALLS ;At ENTRY in COBOL program COBVALU.From LINE 67.1 in COBOL program COBCALC.
which shows the traceback of callers.
Tracing the run-time path for COBOL code compiled with TESTTo trace a program showing the entry and exit points without requiring anychanges to the program, place the following z/OS Debugger commands in a file ordata set and USE them when z/OS Debugger initially displays your program.Assuming you have a PDS member, USERID.DT.COMMANDS(COBCALC), thatcontains the following z/OS Debugger commands:* Commands in a COBOL USE file must be coded in columns 8-72.* If necessary, commands can be continued by coding a ’-’ in* column 7 of the continuation line.01 LEVEL PIC 99 USAGE COMP;MOVE 1 TO LEVEL;AT ENTRY * PERFORM;COMPUTE LEVEL = LEVEL + 1;
224 IBM z/OS Debugger V14.1.9 User's Guide
LIST ( "Entry:", LEVEL, %CU);GO;END-PERFORM;
AT EXIT * PERFORM;LIST ( "Exit:", LEVEL);COMPUTE LEVEL = LEVEL - 1;GO;END-PERFORM;
You can use this file as the source of commands to z/OS Debugger by entering thefollowing command:USE USERID.DT.COMMANDS(COBCALC)
If, after executing the USE file, you run COBCALC, the following trace (or similar)is displayed in the Log window:ENTRY:LEVEL = 00002%CU = COBCALCENTRY:LEVEL = 00003%CU = COBLOANEXIT:LEVEL = 00003ENTRY:LEVEL = 00003%CU = COBVALUEXIT:LEVEL = 00003ENTRY:LEVEL = 00003%CU = COBVALUEXIT:LEVEL = 00003EXIT:LEVEL = 00002
If you do not want to create the USE file, you can enter the commands through thecommand line, and the same effect is achieved.
Generating a COBOL run-time paragraph traceTo generate a trace showing the names of paragraphs through which execution haspassed, the z/OS Debugger commands shown in the following example can beused. You can either enter the commands from the z/OS Debugger command lineor place the commands in a file or data set.
“Example: sample COBOL program for debugging” on page 217
Assume you have a PDS member, USERID.DT.COMMANDS(COBCALC2), thatcontains the following z/OS Debugger commands.* COMMANDS IN A COBOL USE FILE MUST BE CODED IN COLUMNS 8-72.* IF NECESSARY, COMMANDS CAN BE CONTINUED BY CODING A ’-’ IN* COLUMN 7 OF THE CONTINUATION LINE.AT GLOBAL LABEL PERFORM;LIST LINES %LINE;GO;
END-PERFORM;
When z/OS Debugger initially displays your program, enter the followingcommand:USE USERID.DT.COMMANDS(COBCALC2)
Chapter 22. Debugging a COBOL program in full-screen mode 225
After executing the USE file, you can run COBCALC and the following trace (orsimilar) is displayed in the Log window:
42 ACCEPT-INPUT.
59 CALCULATE-LOAN.
42 ACCEPT-INPUT.
66 CALCULATE-VALUE.
64 GET-AMOUNTS.
64 GET-AMOUNTS.
64 GET-AMOUNTS.
64 GET-AMOUNTS.
64 GET-AMOUNTS.
42 ACCEPT-INPUT.
66 CALCULATE-VALUE.
64 GET-AMOUNTS.
64 GET-AMOUNTS.
64 GET-AMOUNTS.
64 GET-AMOUNTS.
64 GET-AMOUNTS.
42 ACCEPT-INPUT.
Finding unexpected storage overwrite errors in COBOLDuring program run time, some storage might unexpectedly change its value andyou want to find out when and where this happened. Consider this examplewhere the program changes more than the caller expects it to change.
05 FIELD-1 OCCURS 2 TIMESPIC X(8).
05 FIELD-2 PIC X(8).PROCEDURE DIVISION.* ( An invalid index value is set )
MOVE 3 TO PTR.MOVE "TOO MUCH" TO FIELD-1( PTR ).
Find the address of FIELD-2 with the command:DESCRIBE ATTRIBUTES FIELD-2
Suppose the result is X'0000F559'. To set a breakpoint that watches for a change instorage values starting at that address for the next 8 bytes, issue the command:AT CHANGE %STORAGE(H’0000F559’,8)
When the program runs, z/OS Debugger halts if the value in this storage changes.
226 IBM z/OS Debugger V14.1.9 User's Guide

Halting before calling an invalid program in COBOLCalling an undefined program is a severe error. If you have developed a mainprogram that calls a subprogram that doesn't exist, you can cause z/OS Debuggerto halt just before such a call. For example, if the subprogram NOTYET doesn'texist, you can set the breakpoint:AT CALL (NOTYET)
When z/OS Debugger stops at this breakpoint, you can bypass the CALL byentering the GO BYPASS command. This allows you to continue your debug sessionwithout raising a condition.
Chapter 22. Debugging a COBOL program in full-screen mode 227

228 IBM z/OS Debugger V14.1.9 User's Guide

Chapter 23. Debugging a LangX COBOL program infull-screen mode
Note: This chapter is not applicable to IBM Z Open Development or IBM Z OpenUnit Test .
The descriptions of basic debugging tasks for LangX COBOL refer to the followingprogram.
“Example: sample LangX COBOL program for debugging”
As you read through the information in this document, remember that OS/VSCOBOL programs are non-Language Environment programs, even though youmight have used Language Environment libraries to link and run your program.
VS COBOL II programs are non-Language Environment programs when you linkthem with the non-Language Environment library. VS COBOL II programs areLanguage Environment programs when you link them with the LanguageEnvironment library.
Enterprise COBOL programs are always Language Environment programs. Notethat COBOL DLL's cannot be debugged as LangX COBOL programs.
Read the information regarding non-Language Environment programs forinstructions on how to start z/OS Debugger and debug non-LanguageEnvironment COBOL programs, unless information specific to LangX COBOL isprovided.
Example: sample LangX COBOL program for debuggingThe program below is used in various topics to demonstrate debugging tasks. It isan OS/VS COBOL program which is being used as a representative of LangXCOBOL programs.
To run this sample program, do the following steps:1. Prepare the sample program as described in Chapter 6, “Preparing a LangX
COBOL program,” on page 73.2. Verify that the debug information for this program is located in the COB03O
and COB03AO members of the yourid.EQALANGX data set.3. Start z/OS Debugger as described in “Starting z/OS Debugger for programs
that start outside of Language Environment” on page 147.4. To load the debug information for this program, enter the following command:
LDD (COB03O,COB03AO) ;
This program is a small example of an OS/VS COBOL program (COB03O) thatcalls another OS/VS COBOL program (COB03A0).
Load module: COB03O
COB03O
© Copyright IBM Corp. 1992, 2019 229

******************************************************* PROGRAM NAME: COB03O ** ** COMPILED WITH IBM OS/VS COBOL COMPILER *******************************************************
IDENTIFICATION DIVISION.PROGRAM-ID. COB03O.******************************************************************* ** LICENSED MATERIALS - PROPERTY OF IBM ** ** 5655-P14: Debug Tool ** (C) Copyright IBM Corp. 2005 All Rights Reserved ** ** US GOVERNMENT USERS RESTRICTED RIGHTS - USE, DUPLICATION OR ** DISCLOSURE RESTRICTED BY GSA ADP SCHEDULE CONTRACT WITH IBM ** CORP. ** ** *******************************************************************ENVIRONMENT DIVISION.DATA DIVISION.WORKING-STORAGE SECTION.
01 LOAN PIC 999999.01 INTEREST-RATE PIC 99V99.01 INTEREST-DUE PIC 999999.01 INTEREST-SAVE PIC 999999.01 INTEREST-AFTER-MULTIPLY PIC 999999.01 INTEREST-AFTER-DIVIDE PIC 999999.
* DATE THAT WILL RECEIVE INCREMENTED JULIAN-DATE01 INC-DATE PIC 9(7).* LOOP COUNT TO INCREMENT DATE 1000 TIMES *01 LOOPCOUNT PIC 9999.
* JULIAN DATE01 JULIAN-DATE PIC 9(7).01 J-DATE REDEFINES JULIAN-DATE.
05 J-YEAR PIC 9(4).05 J-DAY PIC 9(3).
* SAVE DATE01 SAVE-DATE PIC 9(7).
PROCEDURE DIVISION.
PROG.ACCEPT JULIAN-DATE FROM DAYDISPLAY ’JULIAN DATE: ’ JULIAN-DATEMOVE JULIAN-DATE TO SAVE-DATE
MOVE 10000 TO LOAN
CALL ’COB03AO’ USING LOAN INTEREST-DUE.
DISPLAY ’LOAN: ’ LOANDISPLAY ’INTEREST-DUE: ’ INTEREST-DUE
STOP RUN.
COB03AO******************************************************* PROGRAM NAME: COB03AO ** ** COMPILED WITH IBM OS/VS COBOL COMPILER *
230 IBM z/OS Debugger V14.1.9 User's Guide

******************************************************
IDENTIFICATION DIVISION.PROGRAM-ID. COB03AO.******************************************************************* ** LICENSED MATERIALS - PROPERTY OF IBM ** ** 5655-P14: Debug Tool ** (C) Copyright IBM Corp. 2005 All Rights Reserved ** ** US GOVERNMENT USERS RESTRICTED RIGHTS - USE, DUPLICATION OR ** DISCLOSURE RESTRICTED BY GSA ADP SCHEDULE CONTRACT WITH IBM ** CORP. ** ** *******************************************************************ENVIRONMENT DIVISION.DATA DIVISION.WORKING-STORAGE SECTION.77 INTEREST-RATE PIC 99V99 VALUE 0.22.LINKAGE SECTION.01 USING-LIST.
02 LOANAMT PIC 999999.02 INTEREST PIC 999999.
PROCEDURE DIVISION USING USING-LIST.
PROG.COMPUTE INTEREST = LOANAMT * INTEREST-RATE.DISPLAY ’INTEREST-RATE: ’ INTEREST-RATE.
GOBACK.
Defining a compilation unit as LangX COBOL and loading debuginformation
Before you can debug a LangX COBOL program, you must define the compilationunit (CU) as a LangX COBOL CU and load the debug data for the CU. This canonly be done for a CU that is currently known to z/OS Debugger as a disassemblyCU or for a CU that is not currently known to z/OS Debugger.
You use the LOADDEBUGDATA command (abbreviated as LDD) to define a disassemblyCU as a LangX COBOL CU and to cause the debug data for this CU to be loaded.When you invoke the LDD command, you can specify either a single CU name or alist of CU names enclosed in parenthesis. Each of the names specified must beeither:v the name of a disassembly CU that is currently known to z/OS Debuggerv a name that does not match the name of a CU currently known to z/OS
Debugger
When the CU name is currently known to z/OS Debugger, the CU is immediatelymarked as a LangX COBOL CU and an attempt is made to load the debug asfollows:v If your debug data is in a partitioned data set where the high-level qualifier is
the current user ID, the low-level qualifier is EQALANGX, and the membername is the same as the name of the CU that you want to debug no other actionis necessary
Chapter 23. Debugging a LangX COBOL program in full-screen mode 231
v If your debug data is in a different partitioned data set than userid.EQALANGXbut the member name is the same as the name of the CU that you want todebug, enter the following command before or after you enter the LDD command:SET DEFAULT LISTINGS
v If your debug data is in a sequential data set or is a member of a partitioneddata set but the member name is different from the CU name, enter thefollowing command before or after the LDD command: SET SOURCE
When the CU name specified on the LDD command is not currently known to z/OSDebugger, a message is issued and the LDD command is deferred until a CU by thatname becomes known (appears). At that time, the CU is automatically created as aLangX COBOL CU and an attempt is made to load the debug data using thedefault data set name or the current SET DEFAULT LISTINGS specification.
After you have entered an LDD command for a CU, you cannot view the CU as adisassembly CU.
If z/OS Debugger cannot find the associated debug data after you have entered anLDD command, the CU is a LangX COBOL CU rather than a disassembly CU. Youcannot enter another LDD command for this CU. However, you can enter a SETDEFAULT LISTING command or a SET SOURCE command to cause the associateddebug data to be loaded from a different data set.
Defining a compilation unit in a different load module as LangXCOBOL
You must use the LDD command to identify a CU as a LangX COBOL CU. If theCU is part of a load module that has not yet been loaded when you enter the LDDcommand, z/OS Debugger displays a message indicating that the CU was notfound and that the running of the LDD command has been deferred. If the CU laterappears as a disassembly CU, the LDD command is run at that time.
Refer to the following topics for more information related to the material discussedin this topic.
Related tasks“Defining a compilation unit as LangX COBOL and loading debug information”on page 231
Halting when certain LangX COBOL programs are called“Example: sample LangX COBOL program for debugging” on page 229
To halt after the COB03AO routine is called, enter the following command:AT ENTRY COB03AO ;
The AT CALL command is not supported for LangX COBOL routines. Do not usethe AT CALL command to halt z/OS Debugger when a LangX COBOL routine iscalled.
232 IBM z/OS Debugger V14.1.9 User's Guide

Identifying the statement where your LangX COBOL program hasstopped
If you have many breakpoints set in your program and you want to know whereyour program was halted, you can enter the following command:QUERY LOCATION
The z/OS Debugger Log window displays a message similar to the followingmessage:QUERY LOCATIONYou are executing commands in the ENTRY COB03O ::> COB03AO breakpoint.The program is currently entering block COB03O ::> COB03AO.
Displaying and modifying the value of LangX COBOL variables orstorage
To display the contents of a single variable, move the cursor to an occurrence ofthe variable name in the Source window and press PF4 (LIST). The value isdisplayed in the Log window. This is equivalent to entering the LIST variablecommand on the command line.
For example, run the COB03O program to the CALL statement by entering AT 56 ;GO ; on the z/OS Debugger command line. Move the cursor over LOAN and pressPF4 (LIST). z/OS Debugger displays the following message in the Log window:LIST ( ’LOAN ’)LOAN = 10000
To change the value of LOAN to 100, type ’LOAN’ = ’100’ in the command lineand press Enter.
To view the attributes of variable LOAN, enter the following command:DESCRIBE ATTRIBUTES ’LOAN’
z/OS Debugger displays the following messages in the Log window:ATTRIBUTES for LOAN
Its address is 0002E500 and its length is 6LOAN PIC 999999
To step into the call to COB03AO, press PF2 (STEP).
Halting on a line in LangX COBOL only if a condition is trueOften a particular part of your program works fine for the first few thousandtimes, but it fails under certain conditions. Setting a line breakpoint is inefficientbecause you will have to repeatedly enter the GO command.
“Example: sample LangX COBOL program for debugging” on page 229
In the COB03AO program, to halt z/OS Debugger when the LOANAMT variableis set to 100, enter the following command:AT 36 DO; IF ’LOANAMT ¬= 100’ THEN GO; END;
Line 36 is the line COMPUTE INTEREST = LOANAMT * INTEREST-RATE. Thecommand causes z/OS Debugger to stop at line 36. If the value of LOANAMT is
Chapter 23. Debugging a LangX COBOL program in full-screen mode 233

not 100, the program continues. The command causes z/OS Debugger to stop online 36 only if the value of LOANAMT is 100.
Debugging LangX COBOL when debug information is only availablefor a few parts
“Example: sample LangX COBOL program for debugging” on page 229
Suppose you want to set a breakpoint at the entry point to COB03AO program andthat debug information is available for COB03AO but not for COB03O. In thiscircumstance, z/OS Debugger would display an empty Source window. To displaya list of compile units known to z/OS Debugger, enter the following commands:SET ASSEMBLER ONLIST NAMES CUS
The LIST NAMES CUS command displays a list of all the compile units that areknown to z/OS Debugger. If COB03AO is fetched later on by the application, itmight not be known to z/OS Debugger. Enter the following commands:LDD COB03AOAT ENTRY COB03AOGO
Getting a LangX COBOL program tracebackOften when you get close to a programming error, you want to know whatsequence of calls lead you to the programming error. This sequence is called atraceback or a traceback of callers. To get the traceback information, enter thefollowing command:LIST CALLS
“Example: sample LangX COBOL program for debugging” on page 229
For example, if you run the example with the following commands, the Logwindow displays the traceback of callers:LDD (COB03O,COB03AO) ;AT ENTRY COB03AO ;GO ;LIST CALLS ;
The Log window displays information similar to the following:At ENTRY in LangX COBOL program COB03O ::> COB03AO.From LINE 74 in LangX COBOL program COB03O ::> COB03O.
Finding unexpected storage overwrite errors in LangX COBOLWhile your program is running, some storage might unexpectedly change its valueand you want to find out when and where this happened. Suppose in the exampledescribed in “Getting a LangX COBOL program traceback,” the program finds thevalue of LOAN unexpectedly modified. To set a breakpoint that watches for achange in the value of LOAN, enter the following command:AT CHANGE ’LOAN’;
When the program runs, z/OS Debugger stops if the value of LOAN changes.
234 IBM z/OS Debugger V14.1.9 User's Guide

Chapter 24. Debugging a PL/I program in full-screen mode
Note: This chapter is not applicable to IBM Developer for z Systems(non-Enterprise Edition), IBM Z Open Development, or IBM Z Open Unit Test.
The descriptions of basic debugging tasks for PL/I refer to the following PL/Iprogram.
“Example: sample PL/I program for debugging”
Refer to the following topics for more information related to the material discussedin this topic.
Related tasksChapter 32, “Debugging PL/I programs,” on page 311“Halting when certain PL/I functions are called” on page 238“Modifying the value of a PL/I variable” on page 239“Halting on a PL/I line only if a condition is true” on page 239“Debugging PL/I when only a few parts are compiled with TEST” on page 240“Displaying raw storage in PL/I” on page 240“Getting a PL/I function traceback” on page 240“Tracing the run-time path for PL/I code compiled with TEST” on page 241“Finding unexpected storage overwrite errors in PL/I” on page 242“Halting before calling an undefined program in PL/I” on page 243
Example: sample PL/I program for debuggingThe program below is used in various topics to demonstrate debugging tasks.
This program is a simple calculator that reads its input from a character buffer. Ifintegers are read, they are pushed on a stack. If one of the operators (+ - * /) isread, the top two elements are popped off the stack, the operation is performed onthem and the result is pushed on the stack. The = operator writes out the value ofthe top element of the stack to a buffer.
Before running PLICALC, you need to allocate SYSPRINT to the terminal byentering the following command:ALLOC FI(SYSPRINT) DA(*) REUSE
Main program PLICALCplicalc: proc options(main);/*------------------------------------------------------------------*//* *//* A simple calculator that does operations on integers that *//* are pushed and popped on a stack *//* *//*------------------------------------------------------------------*/dcl index builtin;dcl length builtin;dcl substr builtin;/* */dcl 1 stack,
2 stkptr fixed bin(15,0) init(0),2 stknum(50) fixed bin(31,0);
dcl 1 bufin,2 bufptr fixed bin(15,0) init(0),
© Copyright IBM Corp. 1992, 2019 235

2 bufchr char (100) varying;dcl 1 tok char (100) varying;dcl 1 tstop char(1) init (’s’);dcl 1 ndx fixed bin(15,0);dcl num fixed bin(31,0);dcl i fixed bin(31,0);dcl push entry external;dcl pop entry returns (fixed bin(31,0)) external;dcl readtok entry returns (char (100) varying) external;/*------------------------------------------------------------------*//* input action: *//* 2 push 2 on stack *//* 18 push 18 *//* + pop 2, pop 18, add, push result (20) *//* = output value on the top of the stack (20) *//* 5 push 5 *//* / pop 5, pop 20, divide, push result (4) *//* = output value on the top of the stack (4) *//*------------------------------------------------------------------*/bufchr = ’2 18 + = 5 / =’;do while (tok ^= tstop);tok = readtok(bufin); /* get next ’token’ */select (tok);
when (tstop)leave;
when (’+’) do;num = pop(stack);call push(stack,num); /* ▌CALC1▐ statement */
end;when (’-’) do;
num = pop(stack);call push(stack,pop(stack)-num);
end;when (’*’)
call push(stack,pop(stack)*pop(stack));when (’/’) do;
num = pop(stack);call push(stack,pop(stack)/num); /* ▌CALC2▐ statement */
end;when (’=’) do;
num = pop(stack);put list (’PLICALC: ’, num) skip;call push(stack,num);
end;otherwise do;/* must be an integer */
num = atoi(tok);call push(stack,num);
end;end;
end;return;
TOK functionatoi: procedure(tok) returns (fixed bin(31,0));/*------------------------------------------------------------------*//* *//* convert character string to number *//* (note: string validated by readtok) *//* *//*------------------------------------------------------------------*/dcl 1 tok char (100) varying;dcl 1 num fixed bin (31,0);dcl 1 j fixed bin(15,0);num = 0;do j = 1 to length(tok);
num = (10 * num) + (index(’0123456789’,substr(tok,j,1))-1);
236 IBM z/OS Debugger V14.1.9 User's Guide

end;return (num);
end atoi;end plicalc;
PUSH functionpush: procedure(stack,num);/*------------------------------------------------------------------*//* *//* a simple push function for a stack of integers *//* *//*------------------------------------------------------------------*/dcl 1 stack connected,
2 stkptr fixed bin(15,0),2 stknum(50) fixed bin(31,0);
dcl num fixed bin(31,0);stkptr = stkptr + 1;stknum(stkptr) = num; /* ▌PUSH1▐ statement */return;end push;
POP functionpop: procedure(stack) returns (fixed bin(31,0));/*------------------------------------------------------------------*//* *//* a simple pop function for a stack of integers *//* *//*------------------------------------------------------------------*/dcl 1 stack connected,
2 stkptr fixed bin(15,0),2 stknum(50) fixed bin(31,0);
stkptr = stkptr - 1;return (stknum(stkptr+1));end pop;
READTOK functionreadtok: procedure(bufin) returns (char (100) varying);/*------------------------------------------------------------------*//* *//* a function to read input and tokenize it for a simple calculator *//* *//* action: get next input char, update index for next call *//* return: next input char(s) *//*------------------------------------------------------------------*/dcl length builtin;dcl substr builtin;dcl verify builtin;dcl 1 bufin connected,
2 bufptr fixed bin(15,0),2 bufchr char (100) varying;
dcl 1 tok char (100) varying;dcl 1 tstop char(1) init (’s’);dcl 1 j fixed bin(15,0);
/* start of processing */if bufptr > length(bufchr) then do;tok = tstop;return ( tok );
end;bufptr = bufptr + 1;do while (substr(bufchr,bufptr,1) = ’ ’);bufptr = bufptr + 1;if bufptr > length(bufchr) then do;
tok = tstop;return ( tok );
end;
Chapter 24. Debugging a PL/I program in full-screen mode 237

end;tok = substr(bufchr,bufptr,1); /* get ready to return single char */select (tok);when (’+’,’-’,’/’,’*’,’=’)
bufptr = bufptr;otherwise do; /* possibly an integer */
tok = ’’;do j = bufptr to length(bufchr);
if verify(substr(bufchr,j,1),’0123456789’) ^= 0 thenleave;
end;if j > bufptr then do;
j = j - 1;tok = substr(bufchr,bufptr,(j-bufptr+1));bufptr = j;
end;else
tok = tstop;end;
end;return (tok);end readtok;
Refer to the following topics for more information related to the material discussedin this topic.
Related tasksChapter 24, “Debugging a PL/I program in full-screen mode,” on page 235
Halting when certain PL/I functions are calledThis topic describes how to halt just before or just after a routine is called by usingthe AT CALL and AT ENTRY commands. The “Example: sample PL/I program fordebugging” on page 235 is used to describe these commands.
To use the AT CALL command, you must compile the calling program with the TESTcompiler option.
To halt just before READTOK is called, enter the following command:AT CALL READTOK ;
To use the AT ENTRY command, you must compile the called program with the TESTcompiler option.
To halt just after READTOK is called, enter the following command:AT ENTRY READTOK ;
To halt just after TOK is called and only when the parameter tok equals 2, enterthe following command:AT ENTRY TOK WHEN tok=’2’;
Identifying the statement where your PL/I program has stoppedIf you have many breakpoints set in your program, enter the following commandto have z/OS Debugger identify where your program has stopped:QUERY LOCATION
The z/OS Debugger Log window displays something similar to the followingexample:
238 IBM z/OS Debugger V14.1.9 User's Guide

QUERY LOCATION ;You are executing commands in the ENTRY READTOK breakpoint.The program is currently entering block READTOK.
Modifying the value of a PL/I variableTo list the contents of a single variable, move the cursor to an occurrence of thevariable name in the Source window and press PF4 (LIST). The value is displayedin the Log window. This is equivalent to entering LIST TITLED variable on thecommand line. For example, run the PLICALC program to the statement labeled▌CALC1▐ by entering AT 22 ; GO ; on the z/OS Debugger command line. Move thecursor over NUM and press PF4 (LIST). The following appears in the Log window:LIST NUM ;NUM = 18
To modify the value of NUM to 22, type over the NUM = 18 line with NUM = 22,press Enter to put it on the command line, and press Enter again to issue thecommand.
You can enter most PL/I expressions on the command line.
Now step into the call to PUSH by pressing PF2 (STEP) and step until the statementlabeled ▌PUSH1▐ is reached. To view the attributes of variable STKNUM, enter thez/OS Debugger command:DESCRIBE ATTRIBUTES STKNUM;
The result in the Log window is:ATTRIBUTES FOR STKNUMITS ADDRESS IS 0003944C AND ITS LENGTH IS 200
PUSH : STACK.STKNUM(50) FIXED BINARY(31,0) REAL PARAMETERITS ADDRESS IS 0003944C AND ITS LENGTH IS 4
You can list all the values of the members of the structure pointed to by STACK withthe command:LIST STACK;
with results in the Log window appearing something like this:LIST STACK ;STACK.STKPTR = 2STACK.STKNUM(1) = 2STACK.STKNUM(2) = 18STACK.STKNUM(3) = 233864...STACK.STKNUM(50) = 121604
You can change the value of a structure member by issuing the assignment as acommand as in the following example:STKNUM(STKPTR) = 33;
Halting on a PL/I line only if a condition is trueOften a particular part of your program works fine for the first few thousandtimes, but it fails under certain conditions. You don't want to just set a linebreakpoint because you will have to keep entering GO.
“Example: sample PL/I program for debugging” on page 235
Chapter 24. Debugging a PL/I program in full-screen mode 239

For example, in PLICALC you want to stop at the division selection only if thedivisor is 0 (before the exception occurs). Set the breakpoint like this:AT 31 DO; IF NUM ^= 0 THEN GO; END;
Line 31 is the statement labeled ▌CALC2▐. The command causes z/OS Debugger tostop at line 31. If the value of NUM is not 0, the program continues. The commandcauses z/OS Debugger to stop on line 31 only if the value of NUM is 0.
Debugging PL/I when only a few parts are compiled with TEST“Example: sample PL/I program for debugging” on page 235
Suppose you want to set a breakpoint at entry to subroutine PUSH. PUSH hasbeen compiled with TEST, but the other files have not. z/OS Debugger comes upwith an empty Source window. To display the compile units, enter the command:LIST NAMES CUS
The LIST NAMES CUS command displays a list of all the compile units that areknown to z/OS Debugger. If PUSH is fetched later on by the application, thiscompile unit might not be known to z/OS Debugger. If it is displayed, enter:SET QUALIFY CU PUSHAT ENTRY PUSH;GO ;
If it is not displayed, set an appearance breakpoint as follows:AT APPEARANCE PUSH ;GO ;
You can also combine the breakpoints as follows:AT APPEARANCE PUSH AT ENTRY PUSH; GO;
The only purpose for this appearance breakpoint is to gain control the first time afunction in the PUSH compile unit is run. When that happens, you can set abreakpoint at entry to PUSH like this:AT ENTRY PUSH;
Displaying raw storage in PL/IYou can display the storage for a variable by using the LIST STORAGE command.For example, to display the storage for the first 30 characters of STACK enter:LIST STORAGE(STACK,30)
Refer to the following topics for more information related to the material discussedin this topic.
Related tasks“Displaying and modifying memory through the Memory window” on page211
Getting a PL/I function tracebackOften when you get close to a programming error, you want to know how you gotinto that situation, and especially what the traceback of calling functions is. To getthis information, issue the command:LIST CALLS ;
240 IBM z/OS Debugger V14.1.9 User's Guide
“Example: sample PL/I program for debugging” on page 235
For example, if you run the PLICALC example with the commands:AT ENTRY READTOK ;GO ;LIST CALLS ;
the Log window will contain something like:At ENTRY IN PL/I subroutine READTOK.From LINE 17.1 IN PL/I subroutine PLICALC.
which shows the traceback of callers.
Tracing the run-time path for PL/I code compiled with TESTTo trace a program showing the entry and exit points without changing theprogram, you can enter the commands described in step 1 by using a commandsfile or by entering the commands individually. To use a commands file, do thefollowing steps:1. Create a PDS member with a name similar to the following name:
userid.DT.COMMANDS(PLICALL)
2. Edit the file or data set and add the following z/OS Debugger commands:SET PROGRAMMING LANGUAGE PLI ;DCL LVLSTR CHARACTER (50);DCL LVL FIXED BINARY (15);LVL = 0;AT ENTRY *DO;LVLSTR = ’ ’ ;LVL = LVL + 1 ;LVLSTR = ’ENTERING >’ || %BLOCK;LIST UNTITLED ( LVLSTR ) ;GO ;END;AT EXIT *DO;LVLSTR = ’EXITING < ’ || %BLOCK;LIST UNTITLED ( LVLSTR ) ;LVL = LVL - 1 ;GO ;END;
3. Start z/OS Debugger.4. Enter the following command:
USE DT.COMMANDS(PLICALL)
5. Run your program sequence. z/OS Debugger displays the trace in the Logwindow.
For example, after you enter the USE command, you run the following programsequence:*PROCESS MACRO,OPT(TIME);*PROCESS S STMT TEST(ALL);
PLICALL: PROC OPTIONS (MAIN);
DCL PLIXOPT CHAR(60) VAR STATIC EXTERNAL
INIT(’STACK(20K,20K),TEST’);
CALL PLISUB;
Chapter 24. Debugging a PL/I program in full-screen mode 241

PUT SKIP LIST(’DONE WITH PLICALL’);
PLISUB: PROC;
DCL PLISUB1 ENTRY ;
CALL PLISUB1;
PUT SKIP LIST(’DONE WITH PLISUB ’);
END PLISUB;
PLISUB1: PROC;
DCL PLISUB2 ENTRY ;
CALL PLISUB2;
PUT SKIP LIST(’DONE WITH PLISUB1’);
END PLISUB1;
PLISUB2: PROC;
PUT SKIP LIST(’DONE WITH PLISUB2’);END PLISUB2;END PLICALL;
In the Log window, z/OS Debugger displays a trace similar to the following trace:’ENTERING >PLICALL ’’ENTERING >PLISUB ’’ENTERING >PLISUB1 ’’ENTERING >PLISUB2 ’’EXITING < PLISUB2 ’’EXITING < PLISUB1 ’’EXITING < PLISUB ’’EXITING < PLICALL ’
Finding unexpected storage overwrite errors in PL/IDuring program run time, some storage might unexpectedly change its value andyou want to find out when and where this happened. Consider the followingexample where the program changes more than the caller expects it to change.2 FIELD1(2) CHAR(8);2 FIELD2 CHAR(8);CTR = 3; /* an invalid index value is set */FIELD1(CTR) = ’TOO MUCH’;
Find the address of FIELD2 with the command:DESCRIBE ATTRIBUTES FIELD2
Suppose the result is X'00521D42'. To set a breakpoint that watches for a change instorage values starting at that address for the next 8 bytes, issue the command:AT CHANGE %STORAGE(’00521D42’px,8)
When the program is run, z/OS Debugger halts if the value in this storagechanges.
242 IBM z/OS Debugger V14.1.9 User's Guide

Halting before calling an undefined program in PL/ICalling an undefined program or function is a severe error. To halt just before sucha call is run, set this breakpoint:AT CALL 0
When z/OS Debugger stops at this breakpoint, you can bypass the CALL byentering the GO BYPASS command. This allows you to continue your debug sessionwithout raising a condition.
Chapter 24. Debugging a PL/I program in full-screen mode 243

244 IBM z/OS Debugger V14.1.9 User's Guide
Chapter 25. Debugging a C program in full-screen mode
Note: This chapter is not applicable to IBM Developer for z Systems(non-Enterprise Edition), IBM Z Open Development, or IBM Z Open Unit Test.
The descriptions of basic debugging tasks for C refer to the following C program.
“Example: sample C program for debugging”
Refer to the following topics for more information related to the material discussedin this topic.
Related tasksChapter 33, “Debugging C and C++ programs,” on page 323“Halting when certain functions are called in C” on page 248“Modifying the value of a C variable” on page 249“Halting on a line in C only if a condition is true” on page 249“Debugging C when only a few parts are compiled with TEST” on page 250“Capturing C output to stdout” on page 250“Calling a C function from z/OS Debugger” on page 251“Displaying raw storage in C” on page 251“Debugging a C DLL” on page 252“Getting a function traceback in C” on page 252“Tracing the run-time path for C code compiled with TEST” on page 252“Finding unexpected storage overwrite errors in C” on page 253“Finding uninitialized storage errors in C” on page 254“Halting before calling a NULL C function” on page 254
Example: sample C program for debuggingThe program below is used in various topics to demonstrate debugging tasks.
This program is a simple calculator that reads its input from a character buffer. Ifintegers are read, they are pushed on a stack. If one of the operators (+ - * /) isread, the top two elements are popped off the stack, the operation is performed onthem, and the result is pushed on the stack. The = operator writes out the value ofthe top element of the stack to a buffer.
CALC.H/*----- FILE CALC.H --------------------------------------------------*//* *//* Header file for CALC.C PUSHPOP.C READTOKN.C *//* a simple calculator *//*--------------------------------------------------------------------*/typedef enum toks {
T_INTEGER,T_PLUS,T_TIMES,T_MINUS,T_DIVIDE,T_EQUALS,T_STOP
} Token;Token read_token(char buf[]);typedef struct int_link {
struct int_link * next;int i;
© Copyright IBM Corp. 1992, 2019 245

} IntLink;typedef struct int_stack {
IntLink * top;} IntStack;extern void push(IntStack *, int);extern int pop(IntStack *);
CALC.C/*----- FILE CALC.C --------------------------------------------------*//* *//* A simple calculator that does operations on integers that *//* are pushed and popped on a stack *//*--------------------------------------------------------------------*/#include <stdio.h>#include <stdlib.h>#include "calc.h"IntStack stack = { 0 };main(){
Token tok;char word[100];char buf_out[100];int num, num2;for(;;){tok=read_token(word);switch(tok){
case T_STOP:break;
case T_INTEGER:num = atoi(word);push(&stack,num); /* ▌CALC1▐ statement */break;
case T_PLUS:push(&stack, pop(&stack)+pop(&stack) );break;
case T_MINUS:num = pop(&stack);push(&stack, num-pop(&stack));break;
case T_TIMES:push(&stack, pop(&stack)*pop(&stack));break;
case T_DIVIDE:num2 = pop(&stack);num = pop(&stack);push(&stack, num/num2); /*▌CALC2▐ statement */break;
case T_EQUALS:num = pop(&stack);sprintf(buf_out,"= %d ",num);push(&stack,num);break;
}if (tok==T_STOP)
break;}return 0;
}
PUSHPOP.C/*----- FILE PUSHPOP.C -----------------------------------------------*//* *//* A push and pop function for a stack of integers *//*--------------------------------------------------------------------*/
246 IBM z/OS Debugger V14.1.9 User's Guide

#include <stdlib.h>#include "calc.h"/*--------------------------------------------------------------------*//* input: stk - stack of integers *//* num - value to push on the stack *//* action: get a link to hold the pushed value, push link on stack *//* */extern void push(IntStack * stk, int num){
IntLink * ptr;ptr = (IntLink *) malloc( sizeof(IntLink)); /* ▌PUSHPOP1▐ */ptr–>i = num; /* ▌PUSHPOP2▐ statement */ptr–>next = stk–>top;stk–>top = ptr;
}/*--------------------------------------------------------------------*//* return: int value popped from stack *//* action: pops top element from stack and gets return value from it *//*--------------------------------------------------------------------*/extern int pop(IntStack * stk){
IntLink * ptr;int num;ptr = stk–>top;num = ptr–>i;stk–>top = ptr–>next;free(ptr);return num;
}
READTOKN.C/*----- FILE READTOKN.C ----------------------------------------------*//* *//* A function to read input and tokenize it for a simple calculator *//*--------------------------------------------------------------------*/#include <ctype.h>#include <stdio.h>#include "calc.h"/*--------------------------------------------------------------------*//* action: get next input char, update index for next call *//* return: next input char *//*--------------------------------------------------------------------*/static char nextchar(void){/*--------------------------------------------------------------------*//* input action: *//* 2 push 2 on stack *//* 18 push 18 *//* + pop 2, pop 18, add, push result (20) *//* = output value on the top of the stack (20) *//* 5 push 5 *//* / pop 5, pop 20, divide, push result (4) *//* = output value on the top of the stack (4) *//*--------------------------------------------------------------------*/
char * buf_in = "2 18 + = 5 / = ";static int index; /* starts at 0 */char ret;ret = buf_in[index];++index;return ret;
}/*--------------------------------------------------------------------*//* output: buf - null terminated token *//* return: token type *//* action: reads chars through nextchar() and tokenizes them */
Chapter 25. Debugging a C program in full-screen mode 247

/*--------------------------------------------------------------------*/Token read_token(char buf[]){
int i;char c;/* skip leading white space */for( c=nextchar();
isspace(c);c=nextchar())
;buf[0] = c; /* get ready to return single char e.g."+" */buf[1] = 0;switch(c){case ’+’ : return T_PLUS;case ’-’ : return T_MINUS;case ’*’ : return T_TIMES;case ’/’ : return T_DIVIDE;case ’=’ : return T_EQUALS;default:
i = 0;while (isdigit(c)) {buf[i++] = c;c = nextchar();
}buf[i] = 0;if (i==0)return T_STOP;
elsereturn T_INTEGER;
}}
Refer to the following topics for more information related to the material discussedin this topic.
Related tasksChapter 25, “Debugging a C program in full-screen mode,” on page 245
Halting when certain functions are called in CThis topic describes how to halt just before or just after a routine is called by usingthe AT CALL and AT ENTRY commands. The “Example: sample C program fordebugging” on page 245 is used to describe these commands.
To use the AT CALL command, you must compile the calling program with the TESTcompiler option.
To halt just before read_token is called, enter the following command:AT CALL read_token ;
To use the AT ENTRY command, you must compile the called program with the TESTcompiler option.
To halt just after read_token is called, enter the following command:AT ENTRY read_token ;
To halt just after push is called and only when num equals 16, enter the followingcommand:AT ENTRY push WHEN num=16;
248 IBM z/OS Debugger V14.1.9 User's Guide

Modifying the value of a C variableTo LIST the contents of a single variable, move the cursor to the variable name andpress PF4 (LIST). The value is displayed in the Log window. This is equivalent toentering LIST TITLED variable on the command line.
“Example: sample C program for debugging” on page 245
Run the CALC program above to the statement labeled ▌CALC1▐, move the cursorover num and press PF4 (LIST). The following appears in the Log window:LIST ( num ) ;num = 2
To modify the value of num to 22, type over the num = 2 line with num = 22, pressEnter to put it on the command line, and press Enter again to issue the command.
You can enter most C expressions on the command line.
Now step into the call to push() by pressing PF2 (STEP) and step until thestatement labeled PUSHPOP2 is reached. To view the attributes of variable ptr,issue the z/OS Debugger command:DESCRIBE ATTRIBUTES *ptr;
The result in the Log window is similar to the following:ATTRIBUTES for * ptrIts address is 0BB6E010 and its length is 8
struct int_linkstruct int_link *next;int i;
You can use this action to browse structures and unions.
You can list all the values of the members of the structure pointed to by ptr withthe command:LIST *ptr ;
with results in the Log window appearing similar to the following:LIST * ptr ;(* ptr).next = 0x00000000(* ptr).i = 0
You can change the value of a structure member by issuing the assignment as acommand as in the following example:(* ptr).i = 33 ;
Halting on a line in C only if a condition is trueOften a particular part of your program works fine for the first few thousandtimes, but fails afterward because a specific condition is present. Setting a simpleline breakpoint is an inefficient way to debug the program because you need toexecute the GO command a thousand times to reach the specific condition. You caninstruct z/OS Debugger to continue executing a program until a specific conditionis present.
“Example: sample C program for debugging” on page 245
Chapter 25. Debugging a C program in full-screen mode 249
For example, in the main procedure of the program above, you want to stop atT_DIVIDE only if the divisor is 0 (before the exception occurs). Set the breakpointlike this:AT 40 { if(num2 != 0) GO; }
Line 40 is the statement labeled ▌CALC2▐. The command causes z/OS Debugger tostop at line 40. If the value of num2 is not 0, the program continues. You can enterz/OS Debugger commands to change the value of num2 to a nonzero value.
Debugging C when only a few parts are compiled with TEST“Example: sample C program for debugging” on page 245
Suppose you want to set a breakpoint at entry to the function push() in the filePUSHPOP.C. PUSHPOP.C has been compiled with TEST but the other files havenot. z/OS Debugger comes up with an empty Source window. To display thecompile units, enter the command:LIST NAMES CUS
The LIST NAMES CUS command displays a list of all the compile units that areknown to z/OS Debugger. Depending on the compiler you are using, or if"USERID.MFISTART.C(PUSHPOP)" is fetched later on by the application, this compileunit might not be known to z/OS Debugger. If it is displayed, enter:SET QUALIFY CU "USERID.MFISTART.C(PUSHPOP)"AT ENTRY push;GO ;
orAT ENTRY "USERID.MFISTART.C(PUSHPOP)":>pushGO;
If it is not displayed, set an appearance breakpoint as follows:AT APPEARANCE "USERID.MFISTART.C(PUSHPOP)" ;GO ;
The only purpose for this appearance breakpoint is to gain control the first time afunction in the PUSHPOP compile unit is run. When that happens, you can setbreakpoints at entry to push():AT ENTRY push;
You can also combine the breakpoints as follows:AT APPEARANCE "USERID.MFISTART.C(PUSHPOP)" AT ENTRY push; GO;
Capturing C output to stdoutTo redirect stdout to the Log window, issue the following command:SET INTERCEPT ON FILE stdout ;
With this SET command, you will capture not only stdout from your program, butalso from interactive function calls. For example, you can interactively call printfon the command line to display a null-terminated string by entering:printf(sptr);
You might find this easier than using LIST STORAGE.
250 IBM z/OS Debugger V14.1.9 User's Guide
Capturing C input to stdinTo redirect stdin input so that you can enter it from the command prompt, do thefollowing steps1. Enter the following command: SET INTERCEPT ON FILE stdin ;2. When z/OS Debugger encounters a C statement such as scanf, the following
message is displayed in the Log window:EQA1290I The program is waiting for input from stdinEQA1292I Use the INPUT command to enter up to a maximum of 1000
characters for the intercepted variable-format file.
3. Enter the INPUT command to enter the input data.
Refer to the following topics for more information related to the material discussedin this topic.
Related referencesIBM z/OS Debugger Reference and Messages
Calling a C function from z/OS DebuggerYou can start a library function (such as strlen) or one of the program functionsinteractively by calling it on the command line. The functions must comply withthe following requirements:v The functions cannot be in XPLINK applications.v The functions must have debug information available.
“Example: sample C program for debugging” on page 245
Below, we call push() interactively to push one more value on the stack just beforea value is popped off.AT CALL pop ;GO ;push(77);GO ;
The calculator produces different results than before because of the additionalvalue pushed on the stack.
Displaying raw storage in CA char * variable ptr can point to a piece of storage containing printablecharacters. To display the first 20 characters enter:LIST STORAGE(*ptr,20)
If the string is null terminated, you can also use an interactive function call on thecommand line, as in:puts(ptr) ;
Refer to the following topics for more information related to the material discussedin this topic.
Related tasks“Displaying and modifying memory through the Memory window” on page211
Chapter 25. Debugging a C program in full-screen mode 251

Debugging a C DLL“Example: sample C program for debugging” on page 245
Build PUSHPOP.C as a DLL, exporting push() and pop(). Build CALC.C andREADTOKN.C as the program that imports push() and pop() from the DLLnamed PUSHPOP. When the application CALC starts the DLL, PUSHPOP will notbe known to z/OS Debugger. Use the AT APPEARANCE breakpoint to gain control inthe DLL the first time code in that compile unit appears, as shown in the followingexample:AT APPEARANCE "USERID.MFISTART.C(PUSHPOP)" ;GO ;
The only purpose of this appearance breakpoint is to gain control the first time afunction in the PUSHPOP compile unit is run. When this happens, you can setbreakpoints in PUSHPOP.
Getting a function traceback in COften when you get close to a programming error, you want to know how you gotinto that situation, and especially what the traceback of calling functions is. To getthis information, issue the command:LIST CALLS ;
“Example: sample C program for debugging” on page 245
For example, if you run the CALC example with the commands:AT ENTRY read_token ;GO ;LIST CALLS ;
the Log window will contain something like:At ENTRY in C function CALC ::> "USERID.MFISTART.C(READTOKN)" :> read_token.From LINE 18 in C function CALC ::> "USERID.MFISTART.C(CALC)" :> main :> %BLOCK2.
which shows the traceback of callers.
Tracing the run-time path for C code compiled with TESTTo trace a program showing the entry and exit points without requiring anychanges to the program, place the following z/OS Debugger commands in a fileand USE them when z/OS Debugger initially displays your program. Assumingyou have a data set USERID.DTUSE(TRACE) that contains the following z/OSDebugger commands:int indent;indent = 0;SET INTERCEPT ON FILE stdout;AT ENTRY * { \
++indent; \if (indent < 0) indent = 0; \printf("%*.s>%s\n", indent, " ", %block); \GO; \
}AT EXIT * {\
if (indent < 0) indent = 0; \
252 IBM z/OS Debugger V14.1.9 User's Guide

printf("%*.s<%s\n", indent, " ", %block); \--indent; \GO; \
}
You can use this file as the source of commands to z/OS Debugger by entering thefollowing command:USE USERID.DTUSE(TRACE)
The trace of running the program listed below after executing the USE file will bedisplayed in the Log window.int foo(int i, int j) {
return i+j;}int main(void) {
return foo(1,2);}
The following trace in the Log window is displayed after running the sampleprogram, with the USE file as a source of input for z/OS Debugger commands:>main>foo<foo<main
If you do not want to create the USE file, you can enter the commands through thecommand line, and the same effect is achieved.
Finding unexpected storage overwrite errors in CDuring program run time, some storage might unexpectedly change its value andyou want to find out when and where this happens. Consider this example wherefunction set_i changes more than the caller expects it to change.struct s { int i; int j;};struct s a = { 0, 0 };
/* function sets only field i */void set_i(struct s * p, int k){
p–>i = k;p–>j = k; /* error, it unexpectedly sets field j also */
}main() {
set_i(&a,123);}
Find the address of a with the commandLIST &(a.j) ;
Suppose the result is 0x7042A04. To set a breakpoint that watches for a change instorage values starting at that address for the next 4 bytes, issue the command:AT CHANGE %STORAGE(0x7042A04,4)
When the program is run, z/OS Debugger will halt if the value in this storagechanges.
Chapter 25. Debugging a C program in full-screen mode 253

Finding uninitialized storage errors in CTo help find your uninitialized storage errors, run your program with theLanguage Environment TEST run-time and STORAGE options. In the followingexample:TEST STORAGE(FD,FB,F9)
the first subparameter of STORAGE is the fill byte for storage allocated from theheap. For example, storage allocated through malloc() is filled with the byte 0xFD.If you see this byte repeated through storage, it is likely uninitialized heap storage.
The second subparameter of STORAGE is the fill byte for storage allocated from theheap but then freed. For example, storage freed by calling free() might be filledwith the byte 0xFB. If you see this byte repeated through storage, it is likelystorage that was allocated on the heap, but has been freed.
The third subparameter of STORAGE is the fill byte for auto storage variables in anew stack frame. If you see this byte repeated through storage, it is likelyuninitialized auto storage.
The values chosen in the example are odd and large, to maximize early problemdetection. For example, if you attempt to branch to an odd address you will get anexception immediately.
“Example: sample C program for debugging” on page 245
As an example of uninitialized heap storage, run program CALC with theSTORAGE run-time option as STORAGE(FD,FB,F9) to the line labeled PUSHPOP2and issue the command:LIST *ptr ;
You will see the byte fill for uninitialized heap storage as the following exampleshows:LIST * ptr ;(* ptr).next = 0xFDFDFDFD(* ptr).i = -33686019
Halting before calling a NULL C functionCalling an undefined function or calling a function through a function pointer thatpoints to NULL is a severe error. To halt just before such a call is run, set thisbreakpoint:AT CALL 0
When z/OS Debugger stops at this breakpoint, you can bypass the CALL byentering the GO BYPASS command. This allows you to continue your debug sessionwithout raising a condition.
254 IBM z/OS Debugger V14.1.9 User's Guide

Chapter 26. Debugging a C++ program in full-screen mode
Note: This chapter is not applicable to IBM Developer for z Systems(non-Enterprise Edition), IBM Z Open Development, or IBM Z Open Unit Test.
The descriptions of basic debugging tasks for C++ refer to the following C++program.
“Example: sample C++ program for debugging”
Refer to the following topics for more information related to the material discussedin this topic.
Related tasksChapter 33, “Debugging C and C++ programs,” on page 323“Halting when certain functions are called in C++” on page 259“Modifying the value of a C++ variable” on page 260“Halting on a line in C++ only if a condition is true” on page 261“Viewing and modifying data members of the this pointer in C++” on page 261“Debugging C++ when only a few parts are compiled with TEST” on page 261“Capturing C++ output to stdout” on page 262“Calling a C++ function from z/OS Debugger” on page 263“Displaying raw storage in C++” on page 263“Debugging a C++ DLL” on page 263“Getting a function traceback in C++” on page 264“Tracing the run-time path for C++ code compiled with TEST” on page 264“Finding unexpected storage overwrite errors in C++” on page 265“Finding uninitialized storage errors in C++” on page 265“Halting before calling a NULL C++ function” on page 266
Example: sample C++ program for debuggingThe program below is used in various topics to demonstrate debugging tasks.
This program is a simple calculator that reads its input from a character buffer. Ifintegers are read, they are pushed on a stack. If one of the operators (+ - * /) isread, the top two elements are popped off the stack, the operation is performed onthem, and the result is pushed on the stack. The = operator writes out the value ofthe top element of the stack to a buffer.
CALC.HPP/*----- FILE CALC.HPP ------------------------------------------------*//* *//* Header file for CALC.CPP PUSHPOP.CPP READTOKN.CPP *//* a simple calculator *//*--------------------------------------------------------------------*/typedef enum toks {
T_INTEGER,T_PLUS,T_TIMES,T_MINUS,T_DIVIDE,T_EQUALS,T_STOP
} Token;extern "C" Token read_token(char buf[]);
© Copyright IBM Corp. 1992, 2019 255

class IntLink {private:int i;IntLink * next;
public:IntLink();~IntLink();int get_i();void set_i(int j);IntLink * get_next();void set_next(IntLink * d);
};class IntStack {
private:IntLink * top;
public:IntStack();~IntStack();void push(int);int pop();
};
CALC.CPP/*----- FILE CALC.CPP ------------------------------------------------*//* *//* A simple calculator that does operations on integers that *//* are pushed and popped on a stack *//*--------------------------------------------------------------------*/#include <stdio.h>#include <stdlib.h>#include "calc.hpp"IntStack stack;int main(){
Token tok;char word[100];char buf_out[100];int num, num2;for(;;){tok=read_token(word);switch(tok){
case T_STOP:break;
case T_INTEGER:num = atoi(word);stack.push(num); /* ▌CALC1▐ statement */break;
case T_PLUS:stack.push(stack.pop()+stack.pop());break;
case T_MINUS:num = stack.pop();stack.push(num-stack.pop());break;
case T_TIMES:stack.push(stack.pop()*stack.pop() );break;
case T_DIVIDE:num2 = stack.pop();num = stack.pop();stack.push(num/num2); /* ▌CALC2▐ statement */break;
case T_EQUALS:num = stack.pop();
256 IBM z/OS Debugger V14.1.9 User's Guide

sprintf(buf_out,"= %d ",num);stack.push(num);break;
}if (tok==T_STOP)
break;}return 0;
}
PUSHPOP.CPP/*----- FILE: PUSHPOP.CPP --------------------------------------------*//* *//* Push and pop functions for a stack of integers *//*--------------------------------------------------------------------*/#include <stdio.h>#include <stdlib.h>#include "calc.hpp"/*--------------------------------------------------------------------*//* input: num - value to push on the stack *//* action: get a link to hold the pushed value, push link on stack *//*--------------------------------------------------------------------*/void IntStack::push(int num) {
IntLink * ptr;ptr = new IntLink;ptr–>set_i(num);ptr–>set_next(top);top = ptr;
}/*--------------------------------------------------------------------*//* return: int value popped from stack (0 if stack is empty) *//* action: pops top element from stack and get return value from it *//*--------------------------------------------------------------------*/int IntStack::pop() {
IntLink * ptr;int num;ptr = top;num = ptr–>get_i();top = ptr–>get_next();delete ptr;return num;
}IntStack::IntStack() {
top = 0;}IntStack::~IntStack() {
while(top)pop();
}IntLink::IntLink() { /* constructor leaves elements unassigned */}IntLink::~IntLink() {}void IntLink::set_i(int j) {
i = j;}int IntLink::get_i() {
return i;}void IntLink::set_next(IntLink * p) {
next = p;}IntLink * IntLink::get_next() {
return next;}
Chapter 26. Debugging a C++ program in full-screen mode 257
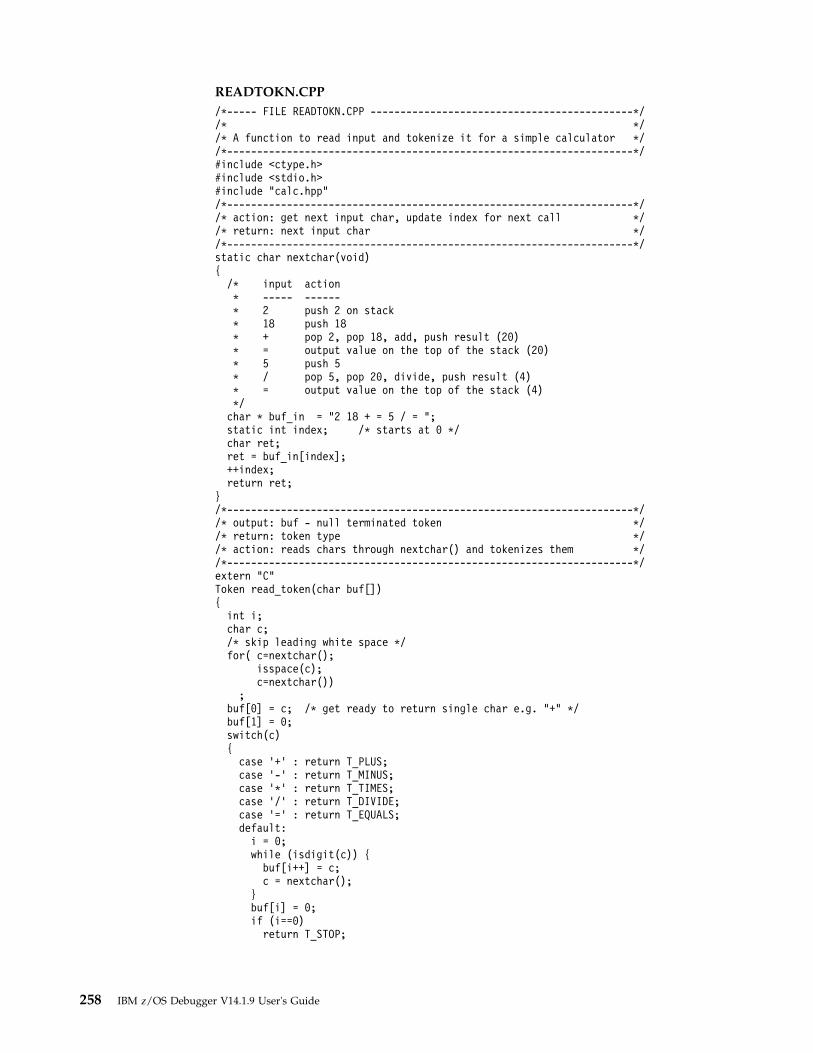
READTOKN.CPP/*----- FILE READTOKN.CPP --------------------------------------------*//* *//* A function to read input and tokenize it for a simple calculator *//*--------------------------------------------------------------------*/#include <ctype.h>#include <stdio.h>#include "calc.hpp"/*--------------------------------------------------------------------*//* action: get next input char, update index for next call *//* return: next input char *//*--------------------------------------------------------------------*/static char nextchar(void){
/* input action* ----- ------* 2 push 2 on stack* 18 push 18* + pop 2, pop 18, add, push result (20)* = output value on the top of the stack (20)* 5 push 5* / pop 5, pop 20, divide, push result (4)* = output value on the top of the stack (4)*/char * buf_in = "2 18 + = 5 / = ";static int index; /* starts at 0 */char ret;ret = buf_in[index];++index;return ret;
}/*--------------------------------------------------------------------*//* output: buf - null terminated token *//* return: token type *//* action: reads chars through nextchar() and tokenizes them *//*--------------------------------------------------------------------*/extern "C"Token read_token(char buf[]){
int i;char c;/* skip leading white space */for( c=nextchar();
isspace(c);c=nextchar())
;buf[0] = c; /* get ready to return single char e.g. "+" */buf[1] = 0;switch(c){case ’+’ : return T_PLUS;case ’-’ : return T_MINUS;case ’*’ : return T_TIMES;case ’/’ : return T_DIVIDE;case ’=’ : return T_EQUALS;default:
i = 0;while (isdigit(c)) {buf[i++] = c;c = nextchar();
}buf[i] = 0;if (i==0)return T_STOP;
258 IBM z/OS Debugger V14.1.9 User's Guide

elsereturn T_INTEGER;
}}
Refer to the following topics for more information related to the material discussedin this topic.
Related tasksChapter 26, “Debugging a C++ program in full-screen mode,” on page 255
Halting when certain functions are called in C++This topic describes how to halt just before or just after a routine is called by usingthe AT CALL or AT ENTRY commands. The “Example: sample C++ program fordebugging” on page 255 is used to describe these commands. Before you use eitherof these commands, you must do the following tasks:v To use the AT ENTRY command, you must compile the called program with the
TEST compiler option.v To use the AT CALL command, you must compile the calling program with the
TEST compiler option.
When you use either of these commands, include the C++ signature along with thefunction name.
To facilitate entering the breakpoint, you can display PUSHPOP.CPP in the Sourcewindow by typing over the name of the file on the top line of the Source window.This makes PUSHPOP.CPP your currently qualified program. You can then enterthe following command:LIST NAMES
z/OS Debugger displays the names of all the blocks and variables for the currentlyqualified program. z/OS Debugger displays information similar to the followingexample in the Log window:There are no session names.The following names are known in block CALC ::> "USERID.MFISTART.CPP(PUSHPOP)"IntStack::~IntStack()IntStack::IntStack()IntLink::get_i()IntLink::get_next()IntLink::~IntLink()IntLink::set_i(int)IntLink::set_next(IntLink*)IntLink::IntLink()
Now you can save some keystrokes by inserting the command next to the blockname.
To halt just before IntStack::push(int) is called, insert AT CALL next to thefunction signature and, by pressing Enter, the entire command is placed on thecommand line. Now, with AT CALL IntStack::push(int) on the command line, youcan enter the following command:AT CALL IntStack::push(int)
To halt just after IntStack::push(int) is called, enter the following command,which is the same way as the AT CALL command:AT ENTRY IntStack::push(int) ;
Chapter 26. Debugging a C++ program in full-screen mode 259

To halt just after IntStack::push(int) is called and only when num equals 16,enter the following command:AT ENTRY IntStack::push(int) WHEN num=16;
Modifying the value of a C++ variableTo list the contents of a single variable, move the cursor to the variable name andpress PF4 (LIST). The value is displayed in the Log window. This is equivalent toentering LIST TITLED variable on the command line.
“Example: sample C++ program for debugging” on page 255
Run the CALC program and step into the first call of functionIntStack::push(int) until just after the IntLink has been allocated. Enter the z/OSDebugger command:LIST TITLED num
z/OS Debugger displays the following in the Log window:LIST TITLED num;num = 2
To modify the value of num to 22, type over the num = 2 line with num = 22, pressEnter to put it on the command line, and press Enter again to issue the command.
You can enter most C++ expressions on the command line.
To view the attributes of variable ptr in IntStack::push(int), issue the z/OSDebugger command:DESCRIBE ATTRIBUTES *ptr;
The result in the Log window is:ATTRIBUTES for * ptrIts address is 0BA25EB8 and its length is 8
class IntLinksigned int istruct IntLink *next
So for most classes, structures, and unions, this can act as a browser.
You can list all the values of the data members of the class object pointed to by ptrwith the command:LIST *ptr ;
with results in the Log window similar to:LIST * ptr ; * ptr.i = 0 * ptr.next = 0x00000000
You can change the value of data member of a class object by issuing theassignment as a command, as in this example:(* ptr).i = 33 ;
Refer to the following topics for more information related to the material discussedin this topic.
Related tasks“Using C and C++ variables with z/OS Debugger” on page 324
260 IBM z/OS Debugger V14.1.9 User's Guide

Halting on a line in C++ only if a condition is trueOften a particular part of your program works fine for the first few thousandtimes, but fails under certain conditions. You don't want to set a simple linebreakpoint because you will have to keep entering GO.
“Example: sample C++ program for debugging” on page 255
For example, in main you want to stop in T_DIVIDE only if the divisor is 0 (beforethe exception occurs). Set the breakpoint like this:AT 40 { if(num2 != 0) GO; }
Line 40 is the statement labeled ▌CALC2▐. The command causes z/OS Debugger tostop at line 40. If the value of num is not 0, the program will continue. z/OSDebugger stops on line 40 only if num2 is 0.
Viewing and modifying data members of the this pointer in C++If you step into a class method, for example, one for class IntLink, the command:LIST TITLED ;
responds with a list that includes this. With the command:DESCRIBE ATTRIBUTES *this ;
you will see the types of the data elements pointed to by the this pointer. With thecommand:LIST *this ;
you will list the data member of the object pointed to and see something like:LIST * this ;(* this).i = 4(* this).next = 0x0
in the Log window. To modify element i, enter either the command:i = 2001;
or, if you have ambiguity (for example, you also have an auto variable named i),enter:(* this).i = 2001 ;
Debugging C++ when only a few parts are compiled with TEST“Example: sample C++ program for debugging” on page 255
Suppose you want to set a breakpoint at entry to function IntStack::push(int) inthe file PUSHPOP.CPP. PUSHPOP.CPP has been compiled with TEST but the otherfiles have not. z/OS Debugger comes up with an empty Source window. Todisplay the compile units, enter the command:LIST NAMES CUS
The LIST NAMES CUS command displays a list of all the compile units that areknown to z/OS Debugger.
Chapter 26. Debugging a C++ program in full-screen mode 261

Depending on the compiler you are using, or if USERID.MFISTART.CPP(PUSHPOP) isfetched later on by the application, this compile unit might or might not be knownto z/OS Debugger, and the PDS member PUSHPOP might or might not bedisplayed. If it is displayed, enter:SET QUALIFY CU "USERID.MFISTART.CPP(PUSHPOP)"AT ENTRY IntStack::push(int) ;GO ;
orAT ENTRY "USERID.MFISTART.CPP(PUSHPOP)":>pushGO
If it is not displayed, you need to set an appearance breakpoint as follows:AT APPEARANCE "USERID.MFISTART.CPP(PUSHPOP)" ;GO ;
You can also combine the breakpoints as follows:AT APPEARANCE "USERID.MFISTART.CPP(PUSHPOP)" AT ENTRY push; GO;
The only purpose of this appearance breakpoint is to gain control the first time afunction in the PUSHPOP compile unit is run. When that happens you can, forexample, set a breakpoint at entry to IntStack::push(int) as follows:AT ENTRY IntStack::push(int) ;
Capturing C++ output to stdoutTo redirect stdout to the Log window, issue the following command:SET INTERCEPT ON FILE stdout ;
With this SET command, you will not only capture stdout from your program, butalso from interactive function calls. For example, you can interactively use cout onthe command line to display a null terminated string by entering:cout << sptr ;
You might find this easier than using LIST STORAGE.
For CICS only, SET INTERCEPT is not supported.
Capturing C++ input to stdinTo redirect stdin input so that you can enter it from the command prompt, do thefollowing steps1. Enter the following command: SET INTERCEPT ON FILE stdin ;2. When z/OS Debugger encounters a C++ statement such as scanf, the following
message is displayed in the Log window:EQA1290I The program is waiting for input from stdinEQA1292I Use the INPUT command to enter up to a maximum of 1000
characters for the intercepted variable-format file.
3. Enter the INPUT command to enter the input data.
Refer to the following topics for more information related to the material discussedin this topic.
Related referencesIBM z/OS Debugger Reference and Messages
262 IBM z/OS Debugger V14.1.9 User's Guide

Calling a C++ function from z/OS DebuggerYou can start a library function (such as strlen) or one of the programs functionsinteractively by calling it on the command line. You can also start C linkagefunctions such as read_token. However, you cannot call C++ linkage functionsinteractively. The functions must comply with the following requirements:v The functions cannot be in XPLINK applications.v The functions must have debug information available.
“Example: sample C++ program for debugging” on page 255
In the example below, we call read_token interactively.AT CALL read_token;GO;read_token(word);
The calculator produces different results than before because of the additionaltoken removed from input.
Displaying raw storage in C++A char * variable ptr can point to a piece of storage that contains printablecharacters. To display the first 20 characters, enter;LIST STORAGE(*ptr,20)
If the string is null terminated, you can also use an interactive function call on thecommand line as shown in this example:puts(ptr) ;
You can also display storage based on offset. For example, to display 10 bytes at anoffset of 2 from location 20CD0, use the following command:LIST STORAGE(0x20CD0,2,10);
Refer to the following topics for more information related to the material discussedin this topic.
Related tasks“Displaying and modifying memory through the Memory window” on page211
Debugging a C++ DLL“Example: sample C++ program for debugging” on page 255
Build PUSHPOP.CPP as a DLL, exporting IntStack::push(int) and IntStack::pop().Build CALC.CPP and READTOKN.CPP as the program that importsIntStack::push(int) and IntStack::pop() from the DLL named PUSHPOP. When theapplication CALC starts, the DLL PUSHPOP is not known to z/OS Debugger. Usethe AT APPEARANCE breakpoint, as shown in the following example, to gain controlin the DLL the first time code in that compile unit appears.AT APPEARANCE "USERID.MFISTART.CPP(PUSHPOP)" ;GO ;
The only purpose of this appearance breakpoint is to gain control the first time afunction in the PUSHPOP compile unit is run. When this happens, you can setbreakpoints in PUSHPOP.
Chapter 26. Debugging a C++ program in full-screen mode 263

Getting a function traceback in C++Often when you get close to a programming error, you want to know how you gotinto that situation, especially what the traceback of calling functions is. To get thisinformation, issue the command:LIST CALLS ;
For example, if you run the CALC example with the following commands:AT ENTRY read_token ;GO ;LIST CALLS ;
the Log window contains something like:At ENTRY in C function "USERID.MFISTART.CPP(READTOKN)" :> read_token.From LINE 18 in C function "USERID.MFISTART.CPP(CALC)" :> main :> %BLOCK2.
which shows the traceback of callers.
Tracing the run-time path for C++ code compiled with TESTTo trace a program showing the entry and exit of that program without requiringany changes to it, place the following z/OS Debugger commands, shown in theexample below, in a file and USE them when z/OS Debugger initially displays yourprogram. Assume you have a data set that contains USERID.DTUSE(TRACE) andcontains the following z/OS Debugger commands:int indent;indent = 0;SET INTERCEPT ON FILE stdout;AT ENTRY * { \
++indent; \if (indent < 0) indent = 0; \printf("%*.s>%s\n", indent, " ", %block); \GO; \
}AT EXIT * {\
if (indent < 0) indent = 0; \printf("%*.s<%s\n", indent, " ", %block); \--indent; \GO; \
}
You can use this file as the source of commands to z/OS Debugger by entering thefollowing command:USE USERID.DTUSE(TRACE)
The trace of running the program listed below after executing the USE file isdisplayed in the Log window:int foo(int i, int j) {
return i+j;}int main(void) {
return foo(1,2);}
The following trace in the Log window is displayed after running the sampleprogram, using the USE file as a source of input for z/OS Debugger commands:
264 IBM z/OS Debugger V14.1.9 User's Guide

>main>foo(int,int)<foo(int,int)<main
If you do not want to create the USE file, you can enter the commands through thecommand line, and the same effect will be achieved.
Finding unexpected storage overwrite errors in C++During program run time, some storage might unexpectedly change its value andyou would like to find out when and where this happened. Consider this simpleexample where function set_i changes more than the caller expects it to change.struct s { int i; int j;};struct s a = { 0, 0 };
/* function sets only field i */void set_i(struct s * p, int k){
p–>i = k;p–>j = k; /* error, it unexpectedly sets field j also */
}main() {
set_i(&a,123);}
Find the address of a with the command:LIST &(a.j) ;
Suppose the result is 0x7042A04. To set a breakpoint that watches for a change instorage values, starting at that address for the next 4 bytes, issue the command:AT CHANGE %STORAGE(0x7042A04,4)
When the program is run, z/OS Debugger will halt if the value in this storagechanges.
Finding uninitialized storage errors in C++To help find your uninitialized storage errors, run your program with theLanguage Environment TEST run-time and STORAGE options. In the followingexample:TEST STORAGE(FD,FB,F9)
the first subparameter of STORAGE is the fill byte for storage allocated from theheap. For example, storage allocated through operator new is filled with the byte0xFD. If you see this byte repeated throughout storage, it is likely uninitializedheap storage.
The second subparameter of STORAGE is the fill byte for storage allocated from theheap but then freed. For example, storage freed by the operator delete might befilled with the byte 0xFB. If you see this byte repeated throughout storage, it islikely storage that was allocated on the heap, but has been freed.
The third subparameter of STORAGE is the fill byte for auto storage variables in anew stack frame. If you see this byte repeated throughout storage, you probablyhave uninitialized auto storage.
Chapter 26. Debugging a C++ program in full-screen mode 265

The values chosen in the example are odd and large, to maximize early problemdetection. For example, if you attempt to branch to an odd address, you will get anexception immediately.
As an example of uninitialized heap storage, run program CALC, with the STORAGErun-time option as STORAGE(FD,FB,F9), to the line labeled PUSHPOP2 and issue thecommand:LIST *ptr ;
You will see the byte fill for uninitialized heap storage as the following exampleshows:LIST * ptr ;(* ptr).next = 0xFDFDFDFD(* ptr).i = -33686019
Refer to the following topics for more information related to the material discussedin this topic.
Related referencesz/OS Language Environment Programming Guide
Halting before calling a NULL C++ functionCalling an undefined function or calling a function through a function pointer thatpoints to NULL is a severe error. To halt just before such a call is run, set thisbreakpoint:AT CALL 0
When z/OS Debugger stops at this breakpoint, you can bypass the call by enteringthe GO BYPASS command. This command allows you to continue your debugsession without raising a condition.
266 IBM z/OS Debugger V14.1.9 User's Guide

Chapter 27. Debugging an assembler program in full-screenmode
Note: This chapter is not applicable to IBM Developer for z Systems(non-Enterprise Edition), IBM Z Open Development, or IBM Z Open Unit Test.
The descriptions of basic debugging tasks for assembler refer to the followingassembler program.
“Example: sample assembler program for debugging”
Refer to the following topics for more information related to the material discussedin this topic.
Related tasksChapter 34, “Debugging an assembler program,” on page 347“Defining a compilation unit as assembler and loading debug data” on page270“Deferred LDDs” on page 271“Halting when certain assembler routines are called” on page 273“Displaying and modifying the value of assembler variables or storage” onpage 273“Halting on a line in assembler only if a condition is true” on page 274“Getting an assembler routine traceback” on page 274“Finding unexpected storage overwrite errors in assembler” on page 275
Example: sample assembler program for debuggingThe program below is used in various topics to demonstrate debugging tasks.
To run this sample program, do the following steps:1. Verify that the debug file for this assembler program is located in the SUBXMP
and DISPARM members of the yourid.EQALANGX data set.2. Start z/OS Debugger.3. To load the information in the debug file, enter the following commands:
LDD (SUBXMP,DISPARM)
This program is a small example of an assembler main routine (SUBXMP) that callsan assembler subroutine (DISPARM).
Load module: XMPLOAD
SUBXMP.ASM*************************************************************** ** NAME: SUBXMP ** ** A simple main assembler routine that brings up ** Language Environment, calls a subroutine, and ** returns with a return code of 0. ** ***************************************************************SUBXMP CEEENTRY PPA=XMPPPA,AUTO=WORKSIZE
USING WORKAREA,R13
© Copyright IBM Corp. 1992, 2019 267

* Invoke CEEMOUT to issue the greeting messageCALL CEEMOUT,(HELLOMSG,DEST,FBCODE),VL,MF=(E,CALLMOUT)
* No plist to DISPARM, so zero R1. Then call it.SLR R0,R0ST R0,COUNTERLA R0,HELLOMSGSR R01,R01 ssue a messageCALL DISPARM ▌CALL1▐
* Invoke CEEMOUT to issue the farewell messageCALL CEEMOUT,(BYEMSG,DEST,FBCODE),VL,MF=(E,CALLMOUT)
* Terminate Language Environment and return to the callerCEETERM RC=0
* CONSTANTSHELLOMSG DC Y(HELLOEND-HELLOSTR)HELLOSTR DC C’Hello from the sub example.’HELLOEND EQU *
BYEMSG DC Y(BYEEND-BYESTART)BYESTART DC C’Terminating the sub example.’BYEEND EQU *DEST DC F’2’ Destination is the LE message fileCOUNTER DC F’-1’
XMPPPA CEEPPA , Constants describing the code block* The Workarea and DSAWORKAREA DSECT
ORG *+CEEDSASZ Leave space for the DSA fixed partCALLMOUT CALL ,(,,),VL,MF=L 3-argument parameter listFBCODE DS 3F Space for a 12-byte feedback code
DS 0DWORKSIZE EQU *-WORKAREA
PRINT NOGENCEEDSA , Mapping of the dynamic save areaCEECAA , Mapping of the common anchor area
R0 EQU 0R01 EQU 1R13 EQU 13
END SUBXMP Nominate SUBXMP as the entry point
DISPARM.ASM*************************************************************** ** NAME: DISPARM ** ** Shows an assembler subroutine that displays inbound ** parameters and returns. ** ***************************************************************DISPARM CEEENTRY PPA=PARMPPA,AUTO=WORKSIZE,MAIN=NO
USING WORKAREA,R13* Invoke CEE3PRM to retrieve the command parameters for us
SLR R0,R0ST R0,COUNTERCALL CEE3PRM,(CHARPARM,FBCODE),VL,MF=(E,CALL3PRM) ▌CALL2▐
* Check the feedback code from CEE3PRM to see if everything worked.CLC FBCODE(8),CEE000BE GOT_PARM
* Invoke CEEMOUT to issue the error message for usCALL CEEMOUT,(BADFBC,DEST,FBCODE),VL,MF=(E,CALLMOUT)B GO_HOME Time to go....
GOT_PARM DS 0H* See if the parm string is blank.
LA R1,1SAVECTR ST R1,COUNTER
CL R1,=F’5’ ▌BUMPCTR▐
268 IBM z/OS Debugger V14.1.9 User's Guide

BH LOOPENDLA R1,1(,R1)B SAVECTR
LOOPEND DS 0HCLC CHARPARM(80),=CL80’ ’ Is the parm empty?BNE DISPLAY_PARM No. Print it out.
* Invoke CEEMOUT to issue the error message for usCALL CEEMOUT,(NOPARM,DEST,FBCODE),VL,MF=(E,CALLMOUT)B GO_TEST Time to go....
DISPLAY_PARM DS 0H* Set up the plist to CEEMOUT to display the parm.
LA R0,2ST R0,COUNTERLA R02,80 Get the size of the stringSTH R02,BUFFSIZE Save it for the len-prefixed string
* Invoke CEEMOUT to display the parm string for usCALL CEEMOUT,(BUFFSIZE,DEST,FBCODE),VL,MF=(E,CALLMOUT)
* AMODE TestingGO_TEST DS 0H
L R15,INAMODE24@BSM R14,R15
InAMode24 Equ *LA R1,DESTO R1,=X’FF000000’L R15,0(,R1)LA R15,2(,R15)ST R15,0(,R1)L R15,INAMODE31@BSM R14,R15
InAMode31 Equ ** Return to the callerGO_HOME DS 0H
LA R0,3ST R0,COUNTERCEETERM RC=0
* CONSTANTSDEST DC F’2’ Destination is the LE message fileCEE000 DS 3F’0’ Success feedback codeInAMode24@ DC A(InAMode24)InAMode31@ DC A(InAMode31+X’80000000’)BADFBC DC Y(BADFBEND-BADFBSTR)BADFBSTR DC C’Feedback code from CEE3PRM was nonzero.’BADFBEND EQU *NOPARM DC Y(NOPRMEND-NOPRMSTR)NOPRMSTR DC C’No user parm was passed to the application.’NOPRMEND EQU *PARMPPA CEEPPA , Constants describing the code block* ===================================================================WORKAREA DSECT
ORG *+CEEDSASZ Leave space for the DSA fixed partCALL3PRM CALL ,(,),VL,MF=L 2-argument parameter listCALLMOUT CALL ,(,,),VL,MF=L 3-argument parameter listFBCODE DS 3F Space for a 12-byte feedback codeCOUNTER DS FBUFFSIZE DS H Halfword prefix for following stringCHARPARM DS CL255 80-byte buffer
DS 0DWORKSIZE EQU *-WORKAREA
PRINT NOGENCEEDSA , Mapping of the dynamic save areaCEECAA , Mapping of the common anchor area
MYDATA DSECT ,MYF DS FR0 EQU 0R1 EQU 1
Chapter 27. Debugging an assembler program in full-screen mode 269

R2 EQU 2R3 EQU 3R4 EQU 4R5 EQU 5R6 EQU 6R7 EQU 7R8 EQU 8R9 EQU 9R10 EQU 10R11 EQU 11R12 EQU 12R13 EQU 13R14 EQU 14R15 EQU 15R02 EQU 2
END
Defining a compilation unit as assembler and loading debug dataBefore you can debug an assembler program, you must define the compilation unit(CU) as an assembler CU and load the debug data for the CU. This can only bedone for a CU that is currently known to z/OS Debugger as a disassembly CU.
You use the LOADDEBUGDATA command (abbreviated as LDD) to define a disassemblyCU as an assembler CU and to cause the debug data for this CU to be loaded.When you run the LDD command, you can specify either a single CU name or a listof CU names enclosed in parenthesis. Each of the names specified must be either:v the name of a disassembly CU that is currently known to z/OS Debuggerv a name that does not match the name of a CU currently known to z/OS
Debugger
When the CU name is currently known to z/OS Debugger, the CU is immediatelymarked as an assembler CU and an attempt is made to load the debug data asfollows:v If your assembler debug data is in a partitioned data set where the high-level
qualifier is the current user ID, the low-level qualifier is EQALANGX, and themember name is the same as the name of the CU that you want to debug noother action is necessary
v If your assembler debug data is in a different partitioned data set thanuserid.EQALANGX but the member name is the same as the name of the CU thatyou want to debug, enter the following command before or after you enter theLDD command: SET DEFAULT LISTINGS
v If your assembler debug data is in a sequential data set or is a member of apartitioned data set but the member name is different from the CU name, enterthe following command before or after the LDD: SET SOURCE
When the CU name specified on the LDD command is not currently known to z/OSDebugger, a message is issued and the LDD command is deferred until a CU by thatname becomes known (appears). At that time, the CU is automatically created asan assembler CU and an attempt is made to load the debug data using the defaultdata set name or the current SET DEFAULT LISTINGS specification.
After you have entered an LDD command for a CU, you cannot view the CU as adisassembly CU.
If z/OS Debugger cannot find the associated assembler debug data after you haveentered an LDD command, the CU is an assembler CU rather than a disassembly
270 IBM z/OS Debugger V14.1.9 User's Guide

CU. You cannot enter another LDD command for this CU. However, you can enter aSET DEFAULT LISTING command or a SET SOURCE command to cause the associateddebug data to be loaded from a different data set.
Deferred LDDsAs described in the previous section, you can use the LDD command to identify aCU as an assembler CU before the CU has become known to z/OS Debugger. Thisis known as a deferred LDD. In this case, whenever the CU appears, it isimmediately marked as an assembler CU and an attempt is made to load thedebug data from the default data set name or from the data set currently specifiedby SET DEFAULT LISTINGS.
If the debug data cannot be found in this way, you must using the SET SOURCEor SET DEFAULT LISTINGS command after the CU appears to cause the debugdata to be loaded from the correct data set. You can do this using a command suchas:AT APPEARANCE mycu SET SOURCE (mycu) hlq.qual1.dsn
Alternatively, you might wait until you have stopped for some other reason after"mycu" has appeared and then use the SET SOURCE or SET DEFAULT LISTINGcommands to direct z/OS Debugger to the proper data set.
Re-appearance of an assembler CUIf a CU from which valid assembler debug data has been loaded goes away andthen reappears (e.g., the load module is deleted and then reloaded), the CU isimmediately marked as an assembler CU and the debug data is reloaded from thedata set from which it was successfully loaded originally.
You do not need to (and cannot) issue another LDD for that CU because it isalready known as an assembler CU and the debug data has already been loaded.
Multiple compilation units in a single assemblyz/OS Debugger treats each assembler CSECT as a separate compilation unit (CU).If your assembler source contains more than one CSECT, then the EQALANGX filethat you create will contain debug information for all the CSECTs.
In most cases, all of the CSECTs in the assembly will be present in the load moduleor program object. However, in some cases, one or more of the assemblies mightnot be present or might be replaced by other CSECTs of the same name. There are,therefore, two ways of loading the debug data for assemblies containing multipleCSECTs:v When SET LDD ALL is in effect, the debug data for all CSECTs (CUs) in the
assembly is loaded as the result of a single LOADDEBUGDATA (LDD)command.
v When SET LDD SINGLE is in effect, a separate LDD command must be issuedfor each CSECT (CU). This form must be used when one or more of the CSECTsin the assembly are not present in the load module or program object or whenone or more of the CSECTs have been replaced by other CSECTs of the samename.
Chapter 27. Debugging an assembler program in full-screen mode 271

The following sections use an example assembly that generates two CSECTs:MYPROG and MYPROGA. The debug information for both of these CSECTs is inthe data set yourid.EQALANGX(MYPROG).
Loading debug data from multiple CSECTs in a singleassembly using one LDD command
If SET LDD ALL is in effect, follow the process described in this section. Thisprocess is the easiest way to load debug data for assemblies containing multipleCSECTs when all of the CSECTs are present in the load module or program object.
When you enter the command LDD MYPROG, z/OS Debugger finds and loads thedebug data for both MYPROG and MYPROGA. After the debug data is loaded,z/OS Debugger uses the debug data to create two CUs, one for MYPROG andanother for MYPROGA.
Loading debug data from multiple CSECTs in a singleassembly using separate LDD commands
If SET LDD SINGLE is in effect, follow the process described in this section.
When you enter the command LDD MYPROG, z/OS Debugger finds and loads thedebug information for both MYPROG and MYPROGA. However, because youspecified only MYPROG on the LDD command and SET LDD SINGLE is in effect,z/OS Debugger uses only the debug information for MYPROG. Then, if you enterthe command LDD MYPROGA, z/OS Debugger does the following steps:1. If you entered a SET SOURCE command before entering the LDD MYPROG
command, z/OS Debugger loads the debug data from the data set that youspecified with the SET SOURCE command.
2. If you did not enter the SET SOURCE command or if z/OS Debugger did notfind debug information in step 1, z/OS Debugger searches through allpreviously loaded debug information. If z/OS Debugger finds a name andCSECT length that matches the name and CSECT length of MYPROGA, z/OSDebugger uses this debug information.
Debugging multiple CSECTs in a single assembly after thedebug data is loaded
After you have loaded the debug data for both of the CSECTs in the assembly, youcan begin debugging either of the compile units. Although the contents of bothCSECTs appear in the source listing, you can only set breakpoints in the compileunit to which you are currently qualified.
When you look at the source listing, all lines contained in a CSECT to which youare not currently qualified have an asterisk immediately before the offset field andfollowing the statement number. If you want to set a line or statement breakpointon a statement that has this asterisk, you must first qualify to the containingcompile unit by using the following command:SET QUALIFY CU compile_unit_name;
After you enter this command, the asterisks are removed from the line on whichyou wanted to set a breakpoint. The absence of the asterisk indicates that you canset a line or statement breakpoint on that line.
You cannot use the SET QUALIFY command to qualify to an assembler compile unituntil after you have loaded the debug data for that compile unit.
272 IBM z/OS Debugger V14.1.9 User's Guide

Halting when certain assembler routines are calledThis topic describes how to halt just after a routine is called by using the AT ENTRYcommand. The “Example: sample assembler program for debugging” on page 267is used to describe these commands.
To halt after the DISPARM routine is called, enter the following command:AT ENTRY DISPARM
To halt after the DISPARM routine is called and only when R1 equals 0, enter thefollowing command:AT ENTRY DISPARM WHEN R1=0;
The AT CALL command is not supported for assembler routines. Do not use the ATCALL command to stop z/OS Debugger when an assembler routine is called.
Identifying the statement where your assembler program has stoppedIf you have many breakpoints set in your program, you can enter the followingcommand to have z/OS Debugger identify where your program has stopped:QUERY LOCATION
The z/OS Debugger Log window displays something similar to the followingexample:QUERY LOCATIONYou are executing commands in the ENTRY XMPLOAD ::> DISPARM breakpoint.The program is currently entering block XMPLOAD ::> DISPARM.
Displaying and modifying the value of assembler variables or storageTo list the contents of a single variable, move the cursor to an occurrence of thevariable name in the Source window and press PF4 (LIST). The value is displayedin the Log window. This is equivalent to entering LIST variable on the commandline.
For example, run the SUBXMP program to the statement labeled ▌CALL1▐ byentering AT 70 ; GO ; on the z/OS Debugger command line. Scroll up until yousee line 67. Move the cursor over COUNTER and press PF4 (LIST). The followingappears in the Log window:LIST ( COUNTER )COUNTER = 0
To modify the value of COUNTER to 1, type over the COUNTER = 0 line withCOUNTER = 1, press Enter to put it on the command line, and press Enter againto issue the command.
To list the contents of the 16 bytes of storage 2 bytes past the address contained inregister R0, type the command LIST STORAGE(R0->+2,16) on the command line andpress Enter. The contents of the specified storage are displayed in the Log window.LIST STORAGE( R0 -> + 2 , 16 )000C321E C8859393 96408699 969440A3 888540A2 *Hello from the s*
To modify the first two bytes of this storage to X'C182', type the command R0->+2<2> = X'C182'; on the command line and press Enter to issue the command.
Chapter 27. Debugging an assembler program in full-screen mode 273

Now step into the call to DISPARM by pressing PF2 (STEP) and step until the linelabeled CALL2 is reached. To view the attributes of variable COUNTER, issue thez/OS Debugger command:DESCRIBE ATTRIBUTES COUNTER
The result in the Log window is:ATTRIBUTES for COUNTER
Its address is 1B0E2150 and its length is 4DS F
Converting a hexadecimal address to a symbolic addressWhile you debug an assembler or disassembly program, you might want todetermine the symbolic address represented by a hexadecimal address. You can dothis by using the LIST command with the %WHERE built-in function. For example,the following command returns a string indicating the symbolic location ofX'1BC5C':LIST %WHERE(X’1BC5C’)
After you enter the command, z/OS Debugger displays the following result:PROG1+X’12C’
The result indicates that the address X'1BC5C' corresponds to offset X'12C' withinCSECT PROG1.
Halting on a line in assembler only if a condition is trueOften a particular part of your program works fine for the first few thousandtimes, but it fails under certain conditions. Setting a line breakpoint is inefficientbecause you will have to repeatedly enter the GO command.
“Example: sample assembler program for debugging” on page 267
In the DISPARM program, to stop z/OS Debugger when the COUNTER variable is setto 3, enter the following command:AT 78 DO; IF COUNTER ^= 3 THEN GO; END;
Line 78 is the line labeled ▌BUMPCTR▐. The command causes z/OS Debugger to stopat line 78. If the value of COUNTER is not 3, the program continues. Thecommand causes z/OS Debugger to stop on line 78 only if the value of COUNTERis 3.
Getting an assembler routine tracebackOften when you get close to a programming error, you want to know whatsequence of calls lead you to the programming error. This sequence is calledtraceback or traceback of callers. To get the traceback information, enter thefollowing command:LIST CALLS
“Example: sample assembler program for debugging” on page 267
For example, if you run the SUBXMP example with the following commands, theLog window displays the traceback of callers:
274 IBM z/OS Debugger V14.1.9 User's Guide

AT ENTRY DISPARMGOLIST CALLS
The Log window displays information similar to the following:At ENTRY IN Assembler routine XMPLOAD ::> DISPARM.From LINE 76.1 IN Assembler routine XMPLOAD ::> SUBXMP.
Finding unexpected storage overwrite errors in assemblerWhile your program is running, some storage might unexpectedly change its valueand you want to find out when and where this happened. Consider the followingexample, where the program finds a value unexpectedly modified:L R0,X’24’(R3)
To find the address of the operand being loaded, enter the following command:LIST R3->+X’24’
Suppose the result is X'00521D42'. To set a breakpoint that watches for a change instorage values starting at that address and for the next 4 bytes, enter the followingcommand:AT CHANGE %STORAGE(X’00521D42’,4)
When the program runs, z/OS Debugger stops if the value in this storage changes.
Chapter 27. Debugging an assembler program in full-screen mode 275

276 IBM z/OS Debugger V14.1.9 User's Guide

Chapter 28. Customizing your full-screen session
Note: This chapter is not applicable to IBM Developer for z Systems(non-Enterprise Edition), IBM Z Open Development, or IBM Z Open Unit Test.
You have several options for customizing your session. For example, you canresize and rearrange windows, close selected windows, change session parameters,and change session panel colors. This section explains how to customize yoursession using these options.
The window acted upon as you customize your session is determined by one ofseveral factors. If you specify a window name (for example, WINDOW OPEN MONITORto open the Monitor window), that window is acted upon. If the command iscursor-oriented, such as the WINDOW SIZE command, the window containing thecursor is acted upon. If you do not specify a window name and the cursor is notin any of the windows, the window acted upon is determined by the setting ofDefault window under the Profile Settings panel.
Refer to the following topics for more information related to the material discussedin this topic.
Related tasksChapter 21, “Using full-screen mode: overview,” on page 161Chapter 28, “Customizing your full-screen session”“Defining PF keys”“Defining a symbol for commands or other strings” on page 278“Customizing the layout of physical windows on the session panel” on page278“Customizing session panel colors” on page 280“Customizing profile settings” on page 282“Saving customized settings in a preferences file” on page 284
Defining PF keysTo define your PF keys, use the SET PFKEY command. For example, to define thePF8 key as SCROLL DOWN PAGE, enter the following command:SET PF8 "Down" = SCROLL DOWN PAGE ;
Use quotation marks (") for C and C++. You can use either apostrophes (') orquotation marks (") for assembler, COBOL, LangX COBOL, disassembly, and PL/I.The string set apart by the quotation marks or apostrophes (Down in this example)is the label that appears next to PF8 when you SET KEYS ON and your PF keydefinitions are displayed at the bottom of your screen.
Refer to the following topics for more information related to the material discussedin this topic.
Related references“Initial PF key settings” on page 177
© Copyright IBM Corp. 1992, 2019 277
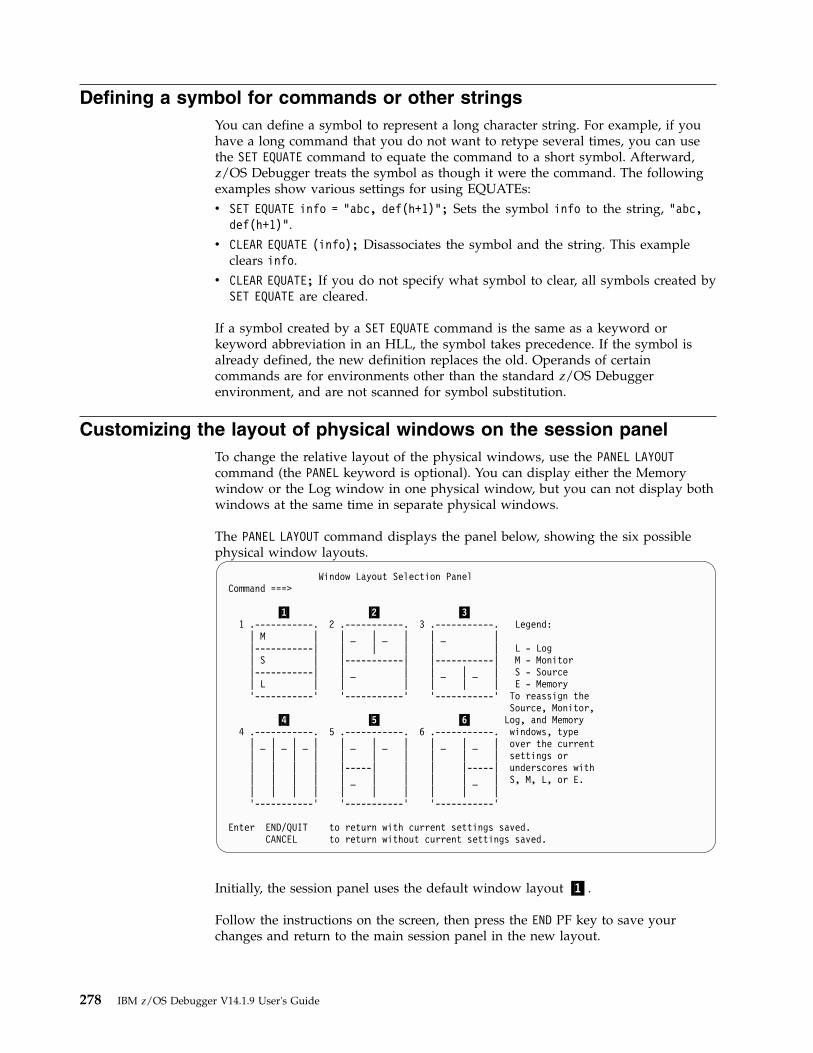
Defining a symbol for commands or other stringsYou can define a symbol to represent a long character string. For example, if youhave a long command that you do not want to retype several times, you can usethe SET EQUATE command to equate the command to a short symbol. Afterward,z/OS Debugger treats the symbol as though it were the command. The followingexamples show various settings for using EQUATEs:v SET EQUATE info = "abc, def(h+1)"; Sets the symbol info to the string, "abc,
def(h+1)".v CLEAR EQUATE (info); Disassociates the symbol and the string. This example
clears info.v CLEAR EQUATE; If you do not specify what symbol to clear, all symbols created by
SET EQUATE are cleared.
If a symbol created by a SET EQUATE command is the same as a keyword orkeyword abbreviation in an HLL, the symbol takes precedence. If the symbol isalready defined, the new definition replaces the old. Operands of certaincommands are for environments other than the standard z/OS Debuggerenvironment, and are not scanned for symbol substitution.
Customizing the layout of physical windows on the session panelTo change the relative layout of the physical windows, use the PANEL LAYOUTcommand (the PANEL keyword is optional). You can display either the Memorywindow or the Log window in one physical window, but you can not display bothwindows at the same time in separate physical windows.
The PANEL LAYOUT command displays the panel below, showing the six possiblephysical window layouts.
Window Layout Selection PanelCommand ===>
▌1▐ ▌2▐ ▌3▐1 .-----------. 2 .-----------. 3 .-----------. Legend:
| M | | _ | _ | | _ ||-----------| | | | | | L - Log| S | |-----------| |-----------| M - Monitor|-----------| | _ | | _ | _ | S - Source| L | | | | | | E - Memory’-----------’ ’-----------’ ’-----------’ To reassign the
Source, Monitor,▌4▐ ▌5▐ ▌6▐ Log, and Memory
4 .-----------. 5 .-----------. 6 .-----------. windows, type| _ | _ | _ | | _ | _ | | _ | _ | over the current| | | | | | | | | | settings or| | | | |-----| | | |-----| underscores with| | | | | _ | | | | _ | S, M, L, or E.| | | | | | | | | |’-----------’ ’-----------’ ’-----------’
Enter END/QUIT to return with current settings saved.CANCEL to return without current settings saved.
Initially, the session panel uses the default window layout ▌1▐.
Follow the instructions on the screen, then press the END PF key to save yourchanges and return to the main session panel in the new layout.
278 IBM z/OS Debugger V14.1.9 User's Guide

Note: You can choose only one of the six layouts. Also, only one of each type ofwindow can be visible at a time on your session panel. For example, you cannothave two Log windows on a panel.
Refer to the following topics for more information related to the material discussedin this topic.
Related tasks“Opening and closing physical windows”“Resizing physical windows”“Zooming a window to occupy the whole screen” on page 280“Saving customized settings in a preferences file” on page 284Related references“z/OS Debugger session panel” on page 161
Opening and closing physical windowsTo close a physical window, do one of the following tasks:v Type the WINDOW CLOSE command, move the cursor to the physical window you
want to close, then press Enter.v Enter one of the following commands:
– WINDOW CLOSE LOG
– WINDOW CLOSE MONITOR
– WINDOW CLOSE SOURCE
– WINDOW CLOSE MEMORY
v Assign the WINDOW CLOSE command to a PF key. Move the cursor to the physicalwindow you want to close, then press the PF key.
When you close a physical window, the remaining windows occupy the full area ofthe screen.
To open a physical window, enter one of the following commands:v WINDOW OPEN LOG
v WINDOW OPEN MONITOR
v WINDOW OPEN SOURCE
v WINDOW OPEN MEMORY
If you want to monitor the values of selected variables as they change during yourz/OS Debugger session, you must display the Monitor window in a physicalwindow. If it is not being displayed in a physical window, open a physicalwindow as described above. The Monitor window occupies the available spaceaccording to your selected physical window layout.
If you open a physical window and the contents assigned to it are not available,the physical window is empty.
Resizing physical windowsTo resize physical windows, do one of the following tasks:v Type WINDOW SIZE on the command line, move the cursor to where you want the
physical window boundary, then press Enter. The WINDOW keyword is optional.v Specify the number of rows or columns you want the physical window to
contain (as appropriate for the physical window layout) with the WINDOW SIZE
Chapter 28. Customizing your full-screen session 279
command. For example, to change the physical window that is displaying theSource window from 10 rows deep to 12 rows deep, enter the followingcommand:WINDOW SIZE 12 SOURCE
v Assign the WINDOW SIZE command to a PF key. Move the cursor to where youwant the physical window boundary, then press the PF key.
For the Memory window and the Monitor window, if you make a physicalwindow too narrow to properly display the contents of that window, z/OSDebugger does not allow you to edit (by typing over) the contents of the window.If this happens, make the physical window wider.
To restore physical window sizes to their default values for the current physicalwindow layout, enter the PANEL LAYOUT RESET command.
Zooming a window to occupy the whole screenTo toggle a window to full screen (temporarily not displaying the others), movethe cursor into that window and press PF10 (ZOOM). Press PF10 to toggle back.
PF11 (ZOOM LOG) toggles the Log window in the same way, without the cursorneeding to be in the Log window.
Customizing session panel colorsYou can change the color and highlighting on your session panel to distinguish thefields on the panel. Consider highlighting such areas as the current line in theSource window, the prefix area, and the statement identifiers where breakpointshave been set.
To change the color, intensity, or highlighting of various fields of the session panelon a color terminal, use the PANEL COLORS command. When you issue thiscommand, the panel shown below appears.
280 IBM z/OS Debugger V14.1.9 User's Guide
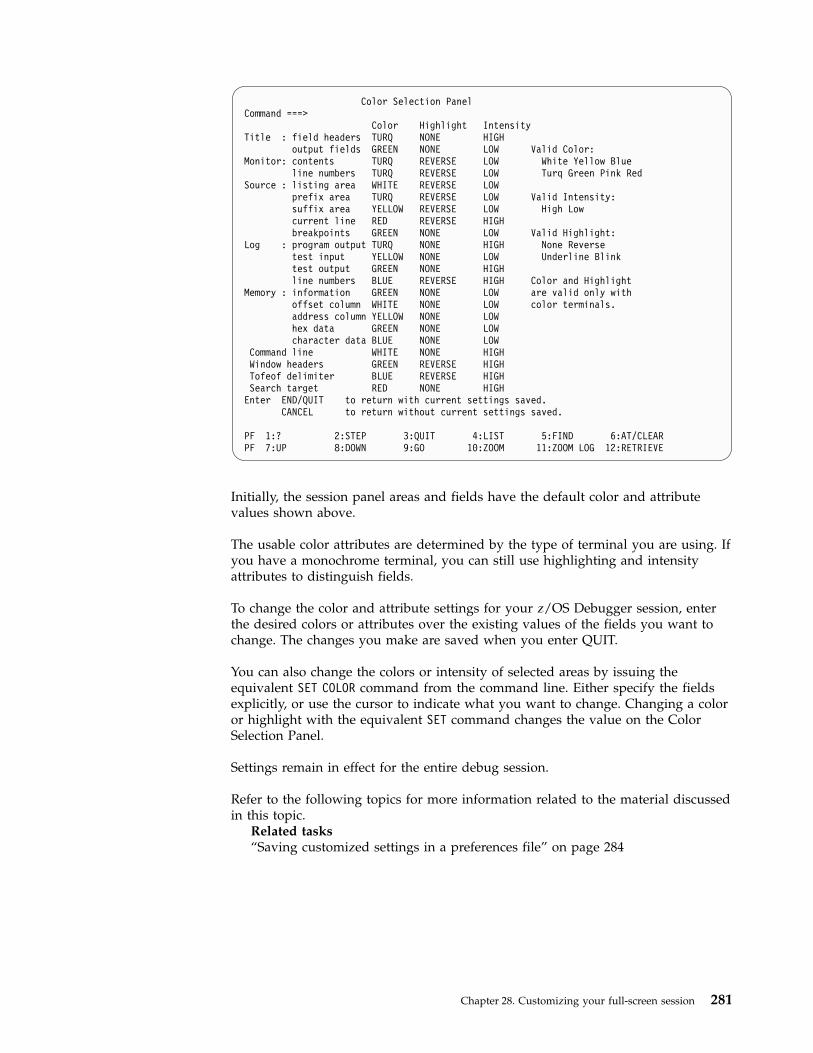
Color Selection PanelCommand ===>
Color Highlight IntensityTitle : field headers TURQ NONE HIGH
output fields GREEN NONE LOW Valid Color:Monitor: contents TURQ REVERSE LOW White Yellow Blue
line numbers TURQ REVERSE LOW Turq Green Pink RedSource : listing area WHITE REVERSE LOW
prefix area TURQ REVERSE LOW Valid Intensity:suffix area YELLOW REVERSE LOW High Lowcurrent line RED REVERSE HIGHbreakpoints GREEN NONE LOW Valid Highlight:
Log : program output TURQ NONE HIGH None Reversetest input YELLOW NONE LOW Underline Blinktest output GREEN NONE HIGHline numbers BLUE REVERSE HIGH Color and Highlight
Memory : information GREEN NONE LOW are valid only withoffset column WHITE NONE LOW color terminals.address column YELLOW NONE LOWhex data GREEN NONE LOWcharacter data BLUE NONE LOW
Command line WHITE NONE HIGHWindow headers GREEN REVERSE HIGHTofeof delimiter BLUE REVERSE HIGHSearch target RED NONE HIGHEnter END/QUIT to return with current settings saved.
CANCEL to return without current settings saved.
PF 1:? 2:STEP 3:QUIT 4:LIST 5:FIND 6:AT/CLEARPF 7:UP 8:DOWN 9:GO 10:ZOOM 11:ZOOM LOG 12:RETRIEVE
Initially, the session panel areas and fields have the default color and attributevalues shown above.
The usable color attributes are determined by the type of terminal you are using. Ifyou have a monochrome terminal, you can still use highlighting and intensityattributes to distinguish fields.
To change the color and attribute settings for your z/OS Debugger session, enterthe desired colors or attributes over the existing values of the fields you want tochange. The changes you make are saved when you enter QUIT.
You can also change the colors or intensity of selected areas by issuing theequivalent SET COLOR command from the command line. Either specify the fieldsexplicitly, or use the cursor to indicate what you want to change. Changing a coloror highlight with the equivalent SET command changes the value on the ColorSelection Panel.
Settings remain in effect for the entire debug session.
Refer to the following topics for more information related to the material discussedin this topic.
Related tasks“Saving customized settings in a preferences file” on page 284
Chapter 28. Customizing your full-screen session 281
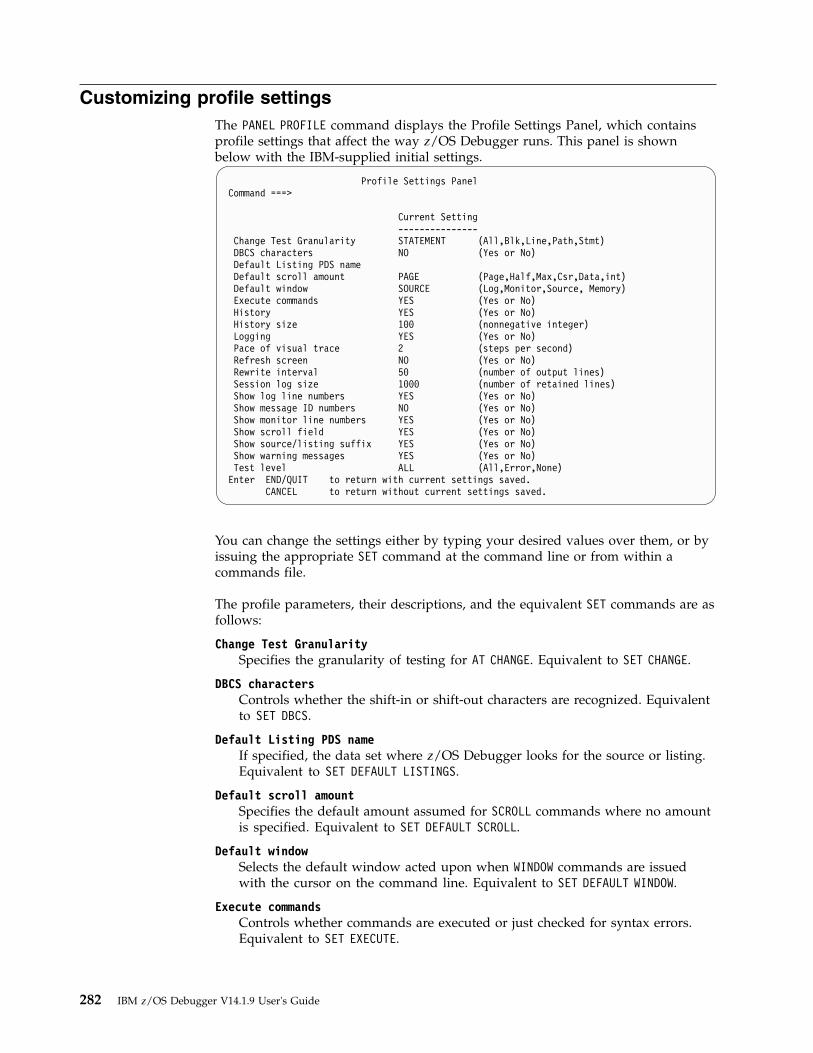
Customizing profile settingsThe PANEL PROFILE command displays the Profile Settings Panel, which containsprofile settings that affect the way z/OS Debugger runs. This panel is shownbelow with the IBM-supplied initial settings.
Profile Settings PanelCommand ===>
Current Setting---------------
Change Test Granularity STATEMENT (All,Blk,Line,Path,Stmt)DBCS characters NO (Yes or No)Default Listing PDS nameDefault scroll amount PAGE (Page,Half,Max,Csr,Data,int)Default window SOURCE (Log,Monitor,Source, Memory)Execute commands YES (Yes or No)History YES (Yes or No)History size 100 (nonnegative integer)Logging YES (Yes or No)Pace of visual trace 2 (steps per second)Refresh screen NO (Yes or No)Rewrite interval 50 (number of output lines)Session log size 1000 (number of retained lines)Show log line numbers YES (Yes or No)Show message ID numbers NO (Yes or No)Show monitor line numbers YES (Yes or No)Show scroll field YES (Yes or No)Show source/listing suffix YES (Yes or No)Show warning messages YES (Yes or No)Test level ALL (All,Error,None)Enter END/QUIT to return with current settings saved.
CANCEL to return without current settings saved.
You can change the settings either by typing your desired values over them, or byissuing the appropriate SET command at the command line or from within acommands file.
The profile parameters, their descriptions, and the equivalent SET commands are asfollows:
Change Test GranularitySpecifies the granularity of testing for AT CHANGE. Equivalent to SET CHANGE.
DBCS charactersControls whether the shift-in or shift-out characters are recognized. Equivalentto SET DBCS.
Default Listing PDS nameIf specified, the data set where z/OS Debugger looks for the source or listing.Equivalent to SET DEFAULT LISTINGS.
Default scroll amountSpecifies the default amount assumed for SCROLL commands where no amountis specified. Equivalent to SET DEFAULT SCROLL.
Default windowSelects the default window acted upon when WINDOW commands are issuedwith the cursor on the command line. Equivalent to SET DEFAULT WINDOW.
Execute commandsControls whether commands are executed or just checked for syntax errors.Equivalent to SET EXECUTE.
282 IBM z/OS Debugger V14.1.9 User's Guide

HistoryControls whether a history (an account of each time z/OS Debugger isentered) is maintained. Equivalent to SET HISTORY.
History sizeControls the size of the z/OS Debugger history table. Equivalent to SETHISTORY.
LoggingControls whether a log file is written. Equivalent to SET LOG.
Pace of visual traceSets the maximum pace of animated execution. Equivalent to SET PACE.
Refresh screenClears the screen before each display. REFRESH is useful when there is anotherapplication writing to the screen. Equivalent to SET REFRESH.
Rewrite intervalDefines the number of lines of intercepted output that are written by theapplication before z/OS Debugger refreshes the screen. Equivalent to SETREWRITE.
Session log sizeThe number of session log output lines retained for display. Equivalent to SETLOG.
Show log line numbersTurns line numbers on or off in the log window. Equivalent to SET LOGNUMBERS.
Show message ID numbersControls whether ID numbers are shown in z/OS Debugger messages.Equivalent to SET MSGID.
Show monitor line numbersTurns line numbers on or off in the Monitor window. Equivalent to SETMONITOR NUMBERS.
Show scroll fieldControls whether the scroll amount field is shown in the display. Equivalent toSET SCROLL DISPLAY.
Show source/listing suffixControls whether the frequency suffix column is displayed in the Sourcewindow. Equivalent TO SET SUFFIX.
Show warning messages (C and C++ and PL/I only)Controls whether warning messages are shown or conditions raised whencommands contain evaluation errors. Equivalent to SET WARNING.
Test levelSelects the classes of exceptions to cause automatic entry into z/OS Debugger.Equivalent to SET TEST.
A field indicating scrolling values is shown only if the screen is not large enoughto show all the profile parameters at once. This field is not shown in the examplepanel above.
You can change the settings of these profile parameters at any time during yoursession. For example, you can increase the delay that occurs between the execution
Chapter 28. Customizing your full-screen session 283

of each statement when you issue the STEP command by modifying the amountspecified in the Pace of visual trace field at any time during your session.
To modify the profile settings for your session, enter a new value over the oldvalue in the field you want to change. Equivalent SET commands are issued whenyou QUIT from the panel.
Entering the equivalent SET command changes the value on the Profile Settingspanel as well.
Settings remain in effect for the entire debug session.
Refer to the following topics for more information related to the material discussedin this topic.
Related tasks“Saving customized settings in a preferences file”
Saving customized settings in a preferences fileYou can place a set of commands into a data set, called a preferences file, and thenindicate that file should be used by providing its name in the preferences_filesuboption of the TEST run-time string. z/OS Debugger reads these commands atinitialization and sets up the session appropriately.
Below is an example preferences file.SET TEST ERROR;SET DEFAULT SCROLL CSR;SET HISTORY OFF;SET MSGID ON;DESCRIBE CUS;
Saving and restoring customizations between z/OS Debugger sessionsAll of the customizations described in Chapter 28, “Customizing your full-screensession,” on page 277 can be preserved between z/OS Debugger sessions by usingthe save and restore settings feature. See “Recording how many times each sourceline runs” on page 189 for instructions.
284 IBM z/OS Debugger V14.1.9 User's Guide

Part 5. Debugging your programs by using z/OS Debuggercommands
Note: Only some of the commands described in the chapters in this section areavailable in IBM Developer for z Systems (non-Enterprise Edition), IBM Z OpenDevelopment, or IBM Z Open Unit Test. For a list of these commands, seeAppendix A "z/OS Debugger commands supported in remote debug mode" inIBM z/OS Debugger Reference and Messages.
© Copyright IBM Corp. 1992, 2019 285

286 IBM z/OS Debugger V14.1.9 User's Guide

Chapter 29. Entering z/OS Debugger commands
z/OS Debugger commands can be issued in three modes: full-screen, line, andbatch. Some z/OS Debugger commands are valid only in certain modes orprogramming languages. Unless otherwise noted, z/OS Debugger commands arevalid in all modes, and for all supported languages.
For input typed directly at the terminal, input is free-form, optionally starting incolumn 1.
To separate multiple commands on a line, use a semicolon (;). This terminatingsemicolon is optional for a single command, or the last command in a sequence ofcommands.
For input that comes from a commands file or USE file, all of the z/OS Debuggercommands must be terminated with a semicolon, except for the C block command.
Refer to the following topics for more information related to the material discussedin this topic.
Related tasks“Entering commands on the session panel” on page 171“Abbreviating z/OS Debugger keywords” on page 288“Entering multiline commands in full-screen” on page 289“Entering multiline commands in a commands file” on page 289“Entering multiline commands without continuation” on page 290“Using blanks in z/OS Debugger commands” on page 290“Entering comments in z/OS Debugger commands” on page 291“Using constants in z/OS Debugger commands” on page 291“Getting online help for z/OS Debugger command syntax” on page 292Related referencesIBM z/OS Debugger Reference and Messages
Using uppercase, lowercase, and DBCS in z/OS Debugger commandsThe character set and case vary with the double-byte character set (DBCS) or thecurrent programming language setting in a z/OS Debugger session.
DBCSWhen the DBCS setting is ON, you can specify DBCS characters in the followingportions of all the z/OS Debugger commands:v Commentary textv Character data valid in the current programming languagev Symbolic identifiers such as variable names (for COBOL, this includes session
variables), entry names, block names, and so forth (if the names contain DBCScharacters in the application program).
When the DBCS setting is OFF, double-byte data is not correctly interpreted ordisplayed. However, if you use the shift-in and shift-out codes as data instead ofDBCS indicators, you should issue SET DBCS OFF.
© Copyright IBM Corp. 1992, 2019 287

If you are debugging in full-screen mode and your terminal is not DBCS capable,the SET DBCS ON command is not available.
Character case and DBCS in C and C++For both C and C++, z/OS Debugger sets the programming language to C. Whenthe current programming language setting is C, the following rules apply:v All keywords and identifiers must be the correct case. z/OS Debuggerdoes not
convert them to uppercase.v DBCS characters are allowed only within comments and literals.v Either trigraphs or the equivalent special characters can be used. Trigraphs are
treated as their equivalents at all times. For example, FIND "??<" would find notonly "??<" but also "{". An exception is that column specifications other than 1 *are not allowed in FIND or SET FIND BOUNDS if you search source code andtrigraphs are found.
v The vertical bar (|) can be entered for the following C and C++ operations:bitwise or (|), logical or (||), and bitwise assignment or (|=).
v There are alternate code points for the following C and C++ characters: verticalbar (|), left brace ({), right brace (}), left bracket ([), and right bracket (]).Although alternate code points will be accepted as input for the braces andbrackets, the primary code points will always be logged.
Character case in COBOL and PL/IWhen the current programming language setting is not C, commands can generallybe either uppercase, lowercase, or mixed. Characters in the range a through z areautomatically converted to uppercase except within comments and quoted literals.Also, in PL/I, only "|" and "¬" can be used as the boolean operators for OR andNOT.
Abbreviating z/OS Debugger keywordsWhen you issue the z/OS Debugger commands, you can truncate most commandkeywords. You cannot truncate reserved keywords for the different programminglanguages, system keywords (that is, SYS, SYSTEM, or TSO) or special case keywordssuch as BEGIN, CALL, COMMENT, COMPUTE, END, FILE (in the SET INTERCEPT and SET LOGcommands), GOTO, INPUT, LISTINGS (in the SET DEFAULT LISTINGS command), or USE.In addition, PROCEDURE can only be abbreviated as PROC.
The system keywords, and COMMENT, INPUT, and USE keywords, take precedenceover other keywords and identifiers. If one of these keywords is followed by ablank, it is always parsed as the corresponding command. Hence, if you want toassign the value 2 to a variable named TSO and the current programminglanguage setting is C, the "=" must be abutted to the reference, as in "TSO<nospace>= 2;" not "TSO<space>= 2;". If you want to define a procedure named USE,you must enter "USE<no space>: procedure;" not "USE<space>:: procedure;".
When you truncate, you need only enter enough characters of the command todistinguish the command from all other valid z/OS Debugger commands. Youshould not use truncations in a commands file or compile them into programsbecause they might become ambiguous in a subsequent release. The followingshows examples of z/OS Debugger command truncations:
If you enter the following command... It will be interpreted as...
A 3 AT 3
288 IBM z/OS Debugger V14.1.9 User's Guide

If you enter the following command... It will be interpreted as...
G GO
Q B B QUALIFY BLOCK B
Q Q QUERY QUALIFY
Q QUIT
If you specify a truncation that is also a variable in your program, the keyword ischosen if this is the only ambiguity. For example, LIST A does not display thevalue of variable A, but executes the LIST AT command, listing your current ATbreakpoints. To display the value of A, issue LIST (A).
In addition, ambiguous commands that cannot be resolved cause an error messageand are not performed. That is, there are two commands that could be interpretedby the truncation specified. For example, D A A; is an ambiguous truncation sinceit could either be DESCRIBE ATTRIBUTES a; or DISABLE AT APPEARANCE;. Instead, youwould have to enter DE A A; if you wanted DESCRIBE ATTRIBUTES a; or DI A A; ifyou wanted DISABLE AT APPEARANCE;. There are, of course, other variations thatwould work as well (for example, D ATT A;).
Entering multiline commands in full-screenIf you need to use more than one line to enter a command, you can do one of thefollowing actions:v Enter a continuation character when you reach the end of the command line.v Enter the POPUP command before you enter the command.
In either case, z/OS Debugger displays the Command pop-up window.
When you enter a command in interactive mode, the continuation character mustbe the last non-blank character in the command line. In the following example, thecontinuation character is the single-byte character set (SBCS) hyphen (-):LIST (" this is a very very very vvvvvvvvvvvvvvvvvvvvvvvvvvvvv –very long string");
If you want to end a line with a character that z/OS Debugger might interpret as acontinuation character, follow that character with another valid non-blankcharacter. For example, in C and C++, if you want to enter “i––”, you could enter“(i––)” or “i––;”. When the current programming language setting is C and C++,you can use the backslash character (\).
When z/OS Debugger is awaiting the continuation of a command in full-screenmode, the Command pop-up window remains open and displays the message“Current® command is incomplete, enter more input below”.
Entering multiline commands in a commands fileThe rules for line continuation when input comes from a commands file arelanguage-specific:v When the current programming language setting is C and C++, identifiers,
keywords, and literals can be continued from one line to the next if thebackslash continuation character is used. The following is an example of thecontinuation character for C:
Chapter 29. Entering z/OS Debugger commands 289

LIST (" this is a very very very vvvvvvvvvvvvvvvvvvvvvvvvvvvvv\very long string");
v When the current programming language setting is COBOL, columns 1-6 areignored by z/OS Debugger and input can be continued from one line to the nextif the SBCS hyphen (-) is used in column 7 of the next line. Command text mustbegin in column 8 or later and end in or before column 72.In literal string continuation, a quotation mark (") or apostrophe (') is required atthe end of the continued line. Then, a quotation mark (") or apostrophe (') isrequired at the beginning of the continuation line. The character following thequotation mark or apostrophe in the continuation line is considered to followimmediately after the last character in the continued line. The following is anexample of line continuation for COBOL:123456 LIST (" this is a very very very vvvvvvvvvvvvvvvvvvvvvvv"123456-"very long string");
Continuation is not allowed within a DBCS name or literal string when thecurrent programming language setting is COBOL.
Entering multiline commands without continuationYou can enter the following command parts on separate lines without using theSBCS hyphen (-) continuation character:v Subcommands and the END keyword in the PROCEDURE commandv The programming language neutral BEGIN command.v When the current programming language setting is C, statements that are part of
a compound or block statementv When the current programming language setting is COBOL:
– EVALUATE- Subcommands in WHEN and OTHER clauses- END-EVALUATE keyword
– IF- Subcommands in THEN and ELSE clauses- END-IF keyword
– PERFORM- Subcommands- Subcommands in UNTIL clause- END-PERFORM keyword
v When the current programming language setting is PL/I, the DO command is forconditional looping.
v When the current programming language setting is assembler, disassembly,LangX COBOL, or COBOL, use the language-neutral DO command.
Refer to the following topics for more information related to the material discussedin this topic.
BEGIN command in IBM z/OS Debugger Reference and MessagesDO command (PL/I) in IBM z/OS Debugger Reference and Messages
Using blanks in z/OS Debugger commandsBlanks cannot occur within keywords, identifiers, and numeric constants; however,they can occur within character strings. Blanks between keywords, identifiers, orconstants are ignored except as delimiters. Blanks are required when no otherdelimiter exists and ambiguity is possible.
290 IBM z/OS Debugger V14.1.9 User's Guide

Entering comments in z/OS Debugger commandsz/OS Debugger lets you insert descriptive comments into the command stream(except within constants and other comments); however, the comment formatdepends on the current programming language. The entire line, includingcomments and delimiter, must not extend beyond column 72.
For C++ only: Comments in the form "//" are not processed by z/OS Debugger inC++.v For all supported programming languages, comments can be entered by:
– Enclosing the text in comment brackets "/*" and "*/". Comments can occuranywhere a blank can occur between keywords, identifiers, and numericconstants. Comments entered in this manner do not appear in the session log.
– Using the COMMENT command to insert commentary text in the session log.Comments entered in this manner cannot contain embedded semicolons.
v When the current programming language setting is COBOL, comments can alsobe entered by using an asterisk (*) in column 7. This is valid for file input only.
v For assembler and disassembly, comments can also be entered by using anasterisk (*) in column 1.
Comments are most helpful in file input. For example, you can insert comments ina USE file to explain and describe the actions of the commands.
Using constants in z/OS Debugger commandsConstants are entered as required by the current programming language setting.Most constants defined for each of the supported HLLs are also supported byz/OS Debugger.
z/OS Debugger allows the use of hexadecimal addresses in COBOL and PL/I.
The COBOL H constant is a fullword address value that can be specified in hexusing numeric-hex-literal format (hexadecimal characters only, delimited by eitherquotation marks (") or apostrophes (') and preceded by H). The value isright-justified and padded on the left with zeros.
Note: The H constant can only be used where an address or POINTER variable canbe used. You can use this type of constant with the SET command. For example, toassign a hexadecimal value of 124BF to the variable ptr, specify:SET ptr TO H"124BF";
The COBOL hexadecimal notation for alphanumeric literals, such as MOVEX’C1C2C3C4’ TO NON-PTR-VAR, must be used for all other situations where ahexadecimal value is needed.
The PL/I PX constant is a hexadecimal value, delimited by apostrophes (') andfollowed by PX. The value is right-justified and can be used in any context inwhich a pointer value is allowed. For example, to display the contents at a givenaddress in hexadecimal format, specify:LIST STORAGE (’20CD0’PX);
Refer to the following topics for more information related to the material discussedin this topic.
Related tasks
Chapter 29. Entering z/OS Debugger commands 291

“Using constants in COBOL expressions” on page 300Related references“C and C++ expressions” on page 327
Getting online help for z/OS Debugger command syntaxYou can get help with z/OS Debugger command syntax by either pressing PF1 orentering a question mark (?) on the command line. This lists all z/OS Debuggercommands in the Log window.
To get a list of options for a command, enter a partial command followed by aquestion mark.
For example, in full-screen mode, enter on the command line:?WINDOW ?WINDOW CLOSE ?WINDOW CLOSE SOURCE
Now reopen the Source window with:WINDOW OPEN SOURCE
to see the results.
The z/OS Debugger SYSTEM and TSO commands followed by ? do not invoke thesyntax help; instead the ? is sent to the host as part of the system command. TheCOMMENT command followed by ? also does not invoke the syntax help.
292 IBM z/OS Debugger V14.1.9 User's Guide

Chapter 30. Debugging COBOL programs
Each version of the COBOL compiler provides enhancements that you can use todevelop COBOL programs. These enhancements can create different levels ofdebugging capabilities. The topics below describe how to use these enhancementswhen you debug your COBOL programs.
“Qualifying variables and changing the point of view in COBOL” on page 301“z/OS Debugger evaluation of COBOL expressions” on page 299Chapter 22, “Debugging a COBOL program in full-screen mode,” on page 217“Using COBOL variables with z/OS Debugger” on page 295“Using DBCS characters in COBOL” on page 297“Using z/OS Debugger functions with COBOL” on page 301“z/OS Debugger commands that resemble COBOL statements”“%PATHCODE values for COBOL” on page 297“Debugging VS COBOL II programs” on page 304
z/OS Debugger commands that resemble COBOL statementsTo test COBOL programs, you can write debugging commands that resembleCOBOL statements. z/OS Debugger provides an interpretive subset of COBOLstatements that closely resembles or duplicates the syntax and action of theappropriate COBOL statements. You can therefore work with familiar commandsand insert into your source code program patches that you developed during yourdebug session.
The table below shows the interpretive subset of COBOL statements recognized byz/OS Debugger.
Command Description
CALL Subroutine call
COMPUTE Computational assignment (including expressions)
Declarations Declaration of session variables
EVALUATE Multiway switch
IF Conditional execution
MOVE Noncomputational assignment
PERFORM Iterative looping
SET INDEX and POINTER assignment
This subset of commands is valid only when the current programming language isCOBOL.
Related referencesIBM z/OS Debugger Reference and Messages
COBOL command formatWhen you are entering commands directly at your terminal or workstation, theformat is free-form, because you can begin your commands in column 1 andcontinue long commands using the appropriate method. You can continue on thenext line during your z/OS Debugger session by using an SBCS hyphen (-) as acontinuation character.
© Copyright IBM Corp. 1992, 2019 293

However, when you use a file as the source of command input, the format for yourcommands is similar to the source format for the COBOL compiler. The first sixpositions are ignored, and an SBCS hyphen in column 7 indicates continuationfrom the previous line. You must start the command text in column 8 or later, andend it in column 72.
The continuation line (with a hyphen in column 7) optionally has one or moreblanks following the hyphen, followed by the continuing characters. In the case ofthe continuation of a literal string, an additional quotation mark is required. Whenthe token being continued is not a literal string, blanks following the last nonblankcharacter on the previous line are ignored, as are blanks following the hyphen.
When z/OS Debugger copies commands to the log file, they are formattedaccording to the rules above so that you can use the log file during subsequentz/OS Debugger sessions.
Continuation is not allowed within a DBCS name or literal string. This restrictionapplies to both interactive and commands file input.
Refer to the following topics for more information related to the material discussedin this topic.
Related references“COBOL compiler options in effect for z/OS Debugger commands”“COBOL reserved keywords”Enterprise COBOL for z/OS Language Reference
COBOL compiler options in effect for z/OS Debuggercommands
While z/OS Debugger allows you to use many commands that are either similar orequivalent to COBOL commands, z/OS Debugger does not necessarily interpretthese commands according to the compiler options you chose when compilingyour program. This is due to the fact that, in the z/OS Debugger environment, thefollowing settings are in effect:
DYNAMNOCMPR2NODBCSNOWORDNUMPROC(NOPFD)QUOTETRUNC(BIN)ZWBRelated referencesEnterprise COBOL for z/OS Language Reference
COBOL reserved keywordsIn addition to the subset of COBOL commands you can use while in z/OSDebugger, there are reserved keywords used and recognized by COBOL thatcannot be abbreviated, used as a variable name, or used as any other type ofidentifier.
Refer to the following topics for more information related to the material discussedin this topic.
Related referencesEnterprise COBOL for z/OS Language Reference
294 IBM z/OS Debugger V14.1.9 User's Guide

Using COBOL variables with z/OS Debuggerz/OS Debugger can process all variable types valid in the COBOL language.
In addition to being allowed to assign values to variables and display the values ofvariables during your session, you can declare session variables to suit your testingneeds.
“Example: assigning values to COBOL variables”
Refer to the following topics for more information related to the material discussedin this topic.
Related tasks“Accessing COBOL variables”“Assigning values to COBOL variables”“Displaying values of COBOL variables” on page 296“Declaring sessionvariables in COBOL” on page 299
Accessing COBOL variablesz/OS Debugger obtains information about a program variable by name, usinginformation that is contained in the symbol table built by the compiler. You makethe symbol table available to z/OS Debugger by compiling with the TEST compileroption.
Refer to the following topics for more information related to the material discussedin this topic.
Related tasks“Choosing TEST or NOTEST compiler suboptions for COBOL programs” onpage 27
Assigning values to COBOL variablesz/OS Debugger provides three COBOL-like commands to use when assigningvalues to variables: COMPUTE, MOVE, and SET. z/OS Debugger assigns valuesaccording to COBOL rules. See IBM z/OS Debugger Reference and Messages for tablesthat describe the allowable values for the source and receiver of the COMPUTE, MOVE,and SET commands.
Example: assigning values to COBOL variablesThe examples for the COMPUTE, MOVE, and SET commands use the declarationsdefined in the following COBOL program segment.01 GRP.
02 ITM-1 OCCURS 3 TIMES INDEXED BY INX1.03 ITM-2 PIC 9(3) OCCURS 3 TIMES INDEXED BY INX2.
01 B.02 A PIC 9(10).
01 D.02 C PIC 9(10).
01 F.02 E PIC 9(10) OCCURS 5 TIMES.
77 AA PIC X(5) VALUE ’ABCDE’.77 BB PIC X(5).
88 BB-GOOD-VALUE VALUE ’BBBBB’.77 XX PIC 9(9) COMP.77 ONE PIC 99 VALUE 1.77 TWO PIC 99 VALUE 2.77 PTR POINTER.
Chapter 30. Debugging COBOL programs 295

Assign the value of TRUE to BB-GOOD-VALUE. Only the TRUE value is valid forlevel-88 receivers. For example:SET BB-GOOD-VALUE TO TRUE;
Assign to variable xx the result of the expression (a + e(1))/c * 2.COMPUTE xx =(a + e(1))/c * 2;
You can also use table elements in such assignments as shown in the followingexample:COMPUTE itm-2(1,2)=(a + 1)/e(2);
The value assigned to a variable is always assigned to the storage for that variable.In an optimized program, a variable might be temporarily assigned to a register,and a new value assigned to that variable might not alter the value used by theprogram.
Assign to the program variable c , found in structure d , the value of the programvariable a , found in structure b:MOVE a OF b TO c OF d;
Note the qualification used in this example.
Assign the value of 123 to the first table element of itm-2:MOVE 123 TO itm-2(1,1);
You can also use reference modification to assign values to variables as shown inthe following two examples:MOVE aa(2:3)TO bb;MOVE aa TO bb(1:4);
Assign the value 3 to inx1, the index to itm-1:SET inx1 TO 3;
Assign the value of inx1 to inx2:SET inx2 TO inx1;
Assign the value of an invalid address (nonnumeric 0) to ptr:SET ptr TO NULL;
Assign the address of XX to ptr:SET ptr TO ADDRESS OF XX;
Assigns the hexadecimal value of X'20000' to the pointer ptr:SET ptr TO H’20000’;
Displaying values of COBOL variablesTo display the values of variables, issue the LIST command. The LIST commandcauses z/OS Debugger to log and display the current values (and names, ifrequested) of variables. For example, if you want to display the variables aa, bb,one, and their respective values at statement 52 of your program, issue thefollowing command:AT 52 LIST TITLED (aa, bb, one); GO;
296 IBM z/OS Debugger V14.1.9 User's Guide

z/OS Debugger sets a breakpoint at statement 52 (AT), begins execution of theprogram (GO), stops at statement 52, and displays the variable names (TITLED) andtheir values.
Put commas between the variables when listing more than one. If you do not wantto display the variable names when issuing the LIST command, issue LISTUNTITLED instead of LIST TITLED.
The value displayed for a variable is always the value that was saved in storagefor that variable. In an optimized program, a variable can be temporarily assignedto a register, and the value shown for that variable might differ from the valuebeing used by the program.
If you use the LIST command to display a National variable, z/OS Debuggerconverts the Unicode data to EBCDIC before displaying it. If the conversion resultsin characters that cannot be displayed, enter the LIST %HEX() command to displaythe unconverted Unicode data in hexadecimal format.
Using DBCS characters in COBOLPrograms you run with z/OS Debugger can contain variables and character stringswritten using the double-byte character set (DBCS). z/OS Debugger also allowsyou to issue commands containing DBCS variables and strings. For example, youcan display the value of a DBCS variable (LIST), assign it a new value, monitor itin the Monitor window (MONITOR), or search for it in a window (FIND).
To use DBCS with z/OS Debugger, enter:SET DBCS ON;
If you are debugging in full-screen mode and your terminal is not DBCS capable,the SET DBCS ON is not available.
The DBCS default for COBOL is OFF.
The DBCS syntax and continuation rules you must follow to use DBCS variables inz/OS Debugger commands are the same as those for the COBOL language.
For COBOL you must type a DBCS literal, such as G, in front of a DBCS value in aMonitor or Data pop-up window if you want to update the value.
Refer to the following topics for more information related to the material discussedin this topic.
Related referencesEnterprise COBOL for z/OS Language Reference
%PATHCODE values for COBOLThe table below shows the possible values for the z/OS Debugger variable%PATHCODE when the current programming language is COBOL.
–1 z/OS Debugger is not in control as the result of a path or attention situation.
0 Attention function (not ATTENTION condition).
1 A block has been entered.
2 A block is about to be exited.
Chapter 30. Debugging COBOL programs 297

3 Control has reached a label coded in the program (a paragraph name or sectionname).
4 Control is being transferred as a result of a CALL or INVOKE. The invoked routine'sparameters, if any, have been prepared.
5 Control is returning from a CALL or INVOKE. If GPR 15 contains a return code, ithas already been stored.
6 Some logic contained by an inline PERFORM is about to be executed. (Out-of-linePERFORM ranges must start with a paragraph or section name, and are identifiedby %PATHCODE = 3.)
7 The logic following an IF...THEN is about to be executed.
8 The logic following an ELSE is about to be executed.
9 The logic following a WHEN within an EVALUATE is about to be executed.
10 The logic following a WHEN OTHER within an EVALUATE is about to be executed.
11 The logic following a WHEN within a SEARCH is about to be executed.
12 The logic following an AT END within a SEARCH is about to be executed.
13 The logic following the end of one of the following structures is about to beexecuted:v An IF statement (with or without an ELSE clause)v An EVALUATE or SEARCHv A PERFORM
14 Control is about to return from a declarative procedure such as USE AFTER ERROR.(Declarative procedures must start with section names, and are identified by%PATHCODE = 3.)
15 The logic associated with one of the following phrases is about to be run:v [NOT] ON SIZE ERRORv [NOT] ON EXCEPTIONv [NOT] ON OVERFLOWv [NOT] AT END (other than SEARCH AT END)v [NOT] AT END-OF-PAGEv [NOT] INVALID KEY
16 The logic following the end of a statement containing one of the followingphrases is about to be run:v [NOT] ON SIZE ERRORv [NOT] ON EXCEPTIONv [NOT] ON OVERFLOWv [NOT] AT END (other than SEARCH AT END)v [NOT] AT END-OF-PAGEv [NOT] INVALID KEY.
Note: Values in the range 3–16 can be assigned to %PATHCODE only if your programwas compiled with an option supporting path hooks.
Refer to the following topics for more information related to the material discussedin this topic.
Related tasks“Choosing TEST or NOTEST compiler suboptions for COBOL programs” onpage 27
298 IBM z/OS Debugger V14.1.9 User's Guide

Declaring session variables in COBOLYou might want to declare session variables during your z/OS Debugger session.The relevant variable assignment commands are similar to their counterparts in theCOBOL language. The rules used for forming variable names in COBOL also applyto the declaration of session variables during a z/OS Debugger session.
The following declarations are for a string variable, a decimal variable, a pointervariable, and a floating-point variable. To declare a string named description,enter:77 description PIC X(25)
To declare a variable named numbers, enter:77 numbers PIC 9(4) COMP
To declare a pointer variable named pinkie, enter:77 pinkie POINTER
To declare a floating-point variable named shortfp, enter:77 shortfp COMP-1
Session variables remain in effect for the entire debug session.
Refer to the following topics for more information related to the material discussedin this topic.
Related tasks“Using session variables across different programming languages” on page 416Related referencesEnterprise COBOL for z/OS Language Reference
z/OS Debugger evaluation of COBOL expressionsz/OS Debugger interprets COBOL expressions according to COBOL rules. Somerestrictions do apply. For example, the following restrictions apply when arithmeticexpressions are specified:v Floating-point operands are not supported (COMP-1, COMP-2, external floating
point, floating-point literals).v Only integer exponents are supported.v Intrinsic functions are not supported.v Windowed date-field operands are not supported in arithmetic expressions in
combination with any other operands.
When arithmetic expressions are used in relation conditions, both comparandattributes are considered. Relation conditions follow the IF rules rather than theEVALUATE rules.
Only simple relation conditions are supported. Sign conditions, class conditions,condition-name conditions, switch-status conditions, complex conditions, andabbreviated conditions are not supported. When either of the comparands in arelation condition is stated in the form of an arithmetic expression (using operatorssuch as plus and minus), the restriction concerning floating-point operands appliesto both comparands. See IBM z/OS Debugger Reference and Messages for a table that
Chapter 30. Debugging COBOL programs 299

describes the allowable comparisons for the IF command. See the EnterpriseCOBOL for z/OS Programming Guide for a description of the COBOL rules ofcomparison.
Windowed date fields are not supported in relation conditions.
Refer to the following topics for more information related to the material discussedin this topic.
Related tasks“Displaying the results of COBOL expression evaluation”“Using constants in COBOL expressions”Enterprise COBOL for z/OS Programming GuideRelated referencesIBM z/OS Debugger Reference and Messages
Displaying the results of COBOL expression evaluationUse the LIST command to display the results of your expressions. For example, toevaluate the expression and displays the result in the Log window, enter:LIST a + (a - 10) + one;
You can also use structure elements in expressions. If e is an array, the followingtwo examples are valid:LIST a + e(1) / c * two;
LIST xx / e(two + 3);
Conditions for expression evaluation are the same ones that exist for programstatements.
Refer to the following topics for more information related to the material discussedin this topic.
Related references“COBOL compiler options in effect for z/OS Debugger commands” on page294Enterprise COBOL for z/OS Language Reference
Using constants in COBOL expressionsDuring your z/OS Debugger session you can use expressions that use stringconstants as one operand, as well as expressions that include variable names ornumber constants as single operands. All COBOL string constant types discussedin the Enterprise COBOL for z/OS Language Reference are valid in z/OS Debugger,with the following restrictions:v The following COBOL figurative constants are supported:
ZERO, ZEROS, ZEROESSPACE, SPACESHIGH-VALUE, HIGH-VALUESLOW-VALUE, LOW-VALUESQUOTE, QUOTESNULL, NULLSAny of the above preceded by ALLSymbolic-character (whether or not preceded by ALL).
v An N literal, which starts with N" or N’, is always treated as a national literal.
Additionally, z/OS Debugger allows the use of a hexadecimal constant thatrepresents an address. This H-constant is a fullword value that can be specified in
300 IBM z/OS Debugger V14.1.9 User's Guide
hex using numeric-hex-literal format (hexadecimal characters only, delimited byeither quotation marks (") or apostrophes (') and preceded by H). The value isright-justified and padded on the left with zeros. The following example:LIST STORAGE (H’20cd0’);
displays the contents at a given address in hexadecimal format. You can use thistype of constant with the SET command. The following example:SET ptr TO H’124bf’;
assigns a hexadecimal value of 124bf to the variable ptr.
Using z/OS Debugger functions with COBOLz/OS Debugger provides certain functions you can use to find out moreinformation about program variables and storage.
Using %HEX with COBOLYou can use the %HEX function with the LIST command to display the hexadecimalvalue of an operand. For example, to display the external representation of thepacked decimal pvar3, defined as PIC 9(9), from 1234 as its hexadecimal (orinternal) equivalent, enter:LIST %HEX (pvar3);
The Log window displays the hexadecimal string X’F0F0F0F0F0F1F2F3F4’.
Using the %STORAGE function with COBOLThis z/OS Debugger function allows you to reference storage by address andlength. By using the %STORAGE function as the reference when setting a CHANGEbreakpoint, you can watch specific areas of storage for changes. For example, tomonitor eight bytes of storage at the hex address 22222 for changes, enter:AT CHANGE %STORAGE (H’00022222’, 8)
LIST ’Storage has changed at Hex address 22222’
Qualifying variables and changing the point of view in COBOLQualification is a method of specifying an object through the use of qualifiers, andchanging the point of view from one block to another so you can manipulate datanot known to the currently executing block. For example, the assignment MOVE 5TO x; does not appear to be difficult for z/OS Debugger to process. However, youmight have more than one variable named x. You must tell z/OS Debugger whichvariable x to assign the value of five.
You can use qualification to specify to what compile unit or block a particularvariable belongs. When z/OS Debugger is invoked, there is a default qualificationestablished for the currently executing block; it is implicitly qualified. Thus, youmust explicitly qualify your references to all statement numbers and variablenames in any other block. It is necessary to do this when you are testing a compileunit that calls one or more blocks or compile units. You might need to specifywhat block contains a particular statement number or variable name when issuingcommands.
Chapter 30. Debugging COBOL programs 301

Qualifying variables in COBOLQualifiers are combinations of load modules, compile units, blocks, section names,or paragraph names punctuated by a combination of greater-than signs (>), colons,and the COBOL data qualification notation, OF or IN, that precede referencedstatement numbers or variable names.
When qualifying objects on a block level, use only the COBOL form of dataqualification. If data names are unique, or defined as GLOBAL, they do not need tobe qualified to the block level.
The following is a fully qualified object:load_name::>cu_name:>block_name:>object;
If required, load_name is the name of the load module. It is required only when theprogram consists of multiple load modules and you want to change thequalification to other than the current load module. load_name can also be the z/OSDebugger variable %LOAD.
If required, cu_name is the name of the compile unit. The cu_name must be the fullyqualified compile unit name. It is required only when you want to change thequalification to other than the currently qualified compile unit. It can be the z/OSDebugger variable %CU.
If required, block_name is the name of the block. The block_name is required onlywhen you want to change the qualification to other than the currently qualifiedblock. It can be the z/OS Debugger variable %BLOCK. If block_name is case sensitive,enclose the block name in quotation marks (") or apostrophes ('). If the name is notinside quotation marks or apostrophes, z/OS Debugger converts the name toupper case.
Below are two similar COBOL programs (blocks).MAIN...
01 VAR1.02 VAR2.
O3 VAR3 PIC XX.01 VAR4 PIC 99..
****************MOVE commands entered here****************
SUBPROG...01 VAR1.
02 VAR2.O3 VAR3 PIC XX.
01 VAR4 PIC 99.01 VAR5 PIC 99.
****************LIST commands entered here****************
You can distinguish between the main and subprog blocks using qualification. Ifyou enter the following MOVE commands when main is the currently executingblock:MOVE 8 TO var4;MOVE 9 TO subprog:>var4;MOVE ’A’ TO var3 OF var2 OF var1;MOVE ’B’ TO subprog:>var3 OF var2 OF var1;
302 IBM z/OS Debugger V14.1.9 User's Guide

and the following LIST commands when subprog is the currently executing block:LIST TITLED var4;LIST TITLED main:>var4;LIST TITLED var3 OF var2 OF var1;LIST TITLED main:>var3 OF var2 OF var1;
each LIST command results in the following output (without the commentary) inyour Log window:
VAR4 = 9; /* var4 with no qualification refers to a variable *//* in the currently executing block (subprog). *//* Therefore, the LIST command displays the value of 9.*/
MAIN:>VAR4 = 8 /* var4 is qualified to main. *//* Therefore, the LIST command displays 8, *//* the value of the variable declared in main. */
VAR3 OF VAR2 OF VAR1 = ’B’;/* In this example, although the data qualification *//* of var3 is OF var2 OF var1, the *//* program qualification defaults to the currently *//* executing block and the LIST command displays *//* ’B’, the value declared in subprog. */
VAR3 OF VAR2 OF VAR1 = ’A’/* var3 is again qualified to var2 OF var1 *//* but further qualified to main. *//* Therefore, the LIST command displays *//* ’A’, the value declared in main. */
The above method of qualifying variables is necessary for commands files.
Changing the point of view in COBOLThe point of view is usually the currently executing block. You can also get toinaccessible data by changing the point of view using the SET QUALIFY command.The SET keyword is optional. For example, if the point of view (current execution)is in main and you want to issue several commands using variables declared insubprog, you can change the point of view by issuing the following:QUALIFY BLOCK subprog;
You can then issue commands using the variables declared in subprog withoutusing qualifiers. z/OS Debugger does not see the variables declared in proceduremain. For example, the following assignment commands are valid with the subprogpoint of view:MOVE 10 TO var5;
However, if you want to display the value of a variable in main while the point ofview is still in subprog, you must use a qualifier, as shown in the followingexample:LIST (main:>var-name);
The above method of changing the point of view is necessary for command files.
Considerations when debugging a COBOL classThe block structure of a COBOL class created with Enterprise COBOL for z/OSand OS/390, Version 3 Release 1 or later, is different from the block structure of aCOBOL program. The block structure of a COBOL class has the followingdifferences:v The CLASS is a compile unit.
Chapter 30. Debugging COBOL programs 303

v The FACTORY paragraph is a block.v The OBJECT paragraph is a block.v Each method is a block.
A method belongs to either the FACTORY block or the OBJECT block. A fullyqualified block name for a method in the FACTORY paragraph is:class-name:>FACTORY:>method-name
A fully qualified block name for a method in the OBJECT paragraph is:class-name:>OBJECT:>method-name
When you are at a breakpoint in a method, the currently qualified block is themethod. If you enter the LIST TITLED command with no parameters, z/OSDebugger lists all of the data items associated with the method. To list all of thedata items in a FACTORY or OBJECT, do the following steps:1. Enter the QUALIFY command to set the point of view to the FACTORY or
OBJECT.2. Enter the LIST TITLED command.
For example, to list all of the object instance data items for a class calledACCOUNT, enter the following command:QUALIFY BLOCK ACCOUNT:>OBJECT; LIST TITLED;
Debugging VS COBOL II programsThere are limitations to debugging VS COBOL II programs compiled with the TESTcompiler option and linked with the Language Environment library. LanguageEnvironment callable services, including CEETEST, are not available. However, youmust use the Language Environment run time.
z/OS Debugger does not get control of the program at breakpoints that you set bythe following commands:v AT PATH
v AT CALL
v AT ENTRY
v AT EXIT
v AT LABEL
However, if you set the breakpoint with an AT CALL command that calls a non-VSCOBOL II program, z/OS Debugger does get control of the program. Use the ATENTRY *, AT EXIT *, AT GLOBAL ENTRY, and AT GLOBAL EXIT commands to setbreakpoints that z/OS Debugger can use to get control of the program.
Breakpoints that you set at entry points and exit statements have no statementassociated with them. Therefore, they are triggered only at the compile unit level.When they are triggered, the current view of the listing moves to the top and nostatement is highlighted. Breakpoints that you set at entry points and exitstatements are ignored by the STEP command.
If you are debugging your VS COBOL II program in remote debug mode, use thesame TEST run-time options as for any COBOL program.
304 IBM z/OS Debugger V14.1.9 User's Guide

Finding the listing of a VS COBOL II programThe VS COBOL II compiler does not place the name of the listing data set in theobject (load module). z/OS Debugger tries to find the listing data set in thefollowing location: userid.CUName.LIST. If the listing is in a PDS, direct z/OSDebugger to the location of the PDS in one of the following ways:v In full-screen mode, do one of the following options:
– Enter the SET DEFAULT LISTINGS command.– Enter the SET SOURCE command.– Enter the PANEL PROFILE command, which displays the Profile Settings panel.
Enter the new file name in the Default Listing PDS name field.– Enter the command PANEL LISTINGS command, which displays the Source
Identification Panel. Enter the name of the PDS over the existing name in theListings/Source File column, then press PF3.
v In remote debug mode, enter the command SET DEFAULT LISTINGS.v Use the EQADEBUG DD statement to define the location of the data set.v Code the EQAUEDAT user exit with the location of the data set.
For additional information about how you can debug VS COBOL II programs, seeUsing CODE/370 with VS COBOL II and OS PL/I, SC09-1862.
Chapter 30. Debugging COBOL programs 305

306 IBM z/OS Debugger V14.1.9 User's Guide

Chapter 31. Debugging a LangX COBOL program
Note: This chapter is not applicable to IBM Z Open Development or IBM Z OpenUnit Test .
You can use most of the z/OS Debugger commands to debug LangX COBOLprograms that have debug information available. Any exceptions are noted in IBMz/OS Debugger Reference and Messages. Before debugging a LangX COBOL program,prepare your program as described in Chapter 6, “Preparing a LangX COBOLprogram,” on page 73.
As you read through the information in this document, remember that OS/VSCOBOL programs are non-Language Environment programs, even though youmight have used Language Environment libraries to link and run your program.
VS COBOL II programs are non-Language Environment programs when you linkthem with the non-Language Environment library. VS COBOL II programs areLanguage Environment programs when you link them with the LanguageEnvironment library.
Enterprise COBOL programs are always Language Environment programs. Notethat COBOL DLL's cannot be debugged as LangX COBOL programs.
Read the information regarding non-Language Environment programs forinstructions on how to start z/OS Debugger and debug non-LanguageEnvironment COBOL programs, unless information specific to LangX COBOL isprovided.
Loading a LangX COBOL program's debug informationUse the LOADDEBUGDATA (LDD) command to indicate to z/OS Debugger that acompile unit is a LangX COBOL compile unit and to load the debug informationassociated with that compile unit. The LDD command can be used only for compileunits that are considered disassembly compile units. In the following example,mypgm is the compile unit name of an OS/VS COBOL program: LDD mypgm
z/OS Debugger locates the debug information in a data set with the followingname: yourid.EQALANGX(mypgm). If z/OS Debugger finds this data set, you canbegin to debug your LangX COBOL program. If z/OS Debugger does not find thedata set, enter the SET SOURCE or SET DEFAULT LISTINGS command to indicate toz/OS Debugger where to find the debug information.
Normally, compile units without debug information are not listed when you enterthe DESCRIBE CUS or LIST NAMES CUS commands. To include these compile units,enter the SET ASSEMBLER ON command. The next time you enter the DESCRIBE CUSor LIST NAMES CUS command, these compile units are listed.
© Copyright IBM Corp. 1992, 2019 307
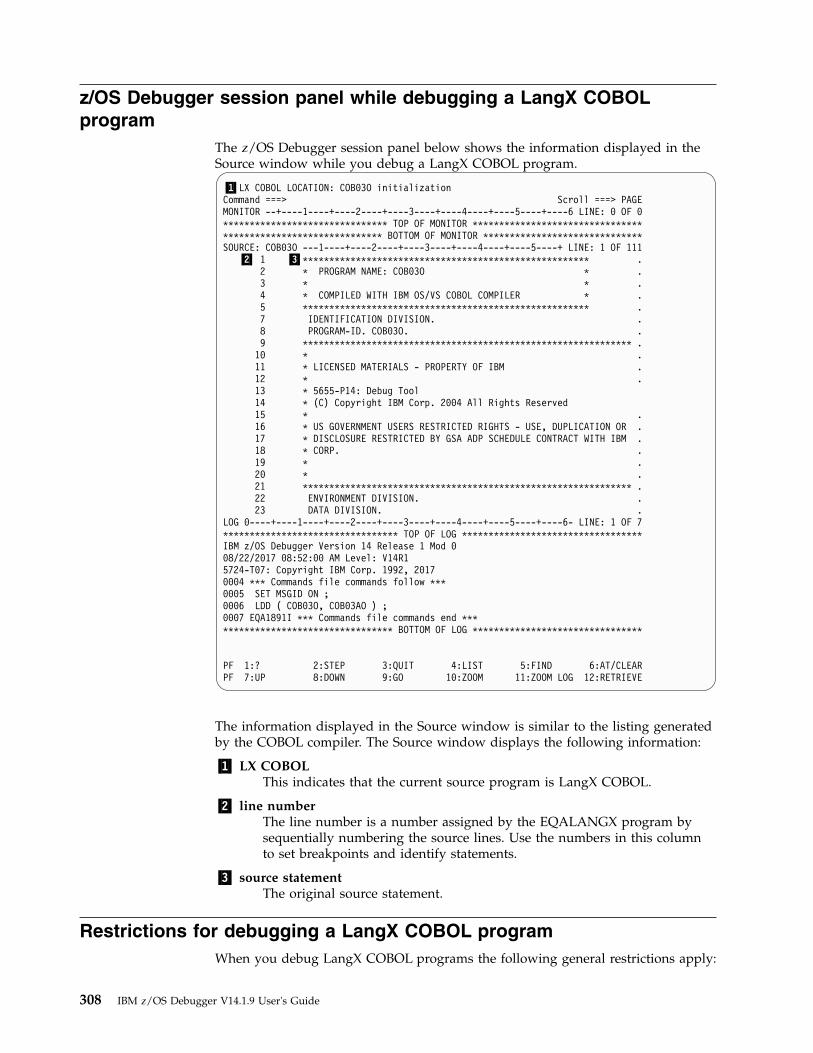
z/OS Debugger session panel while debugging a LangX COBOLprogram
The z/OS Debugger session panel below shows the information displayed in theSource window while you debug a LangX COBOL program.
▌1▐LX COBOL LOCATION: COB03O initializationCommand ===> Scroll ===> PAGEMONITOR --+----1----+----2----+----3----+----4----+----5----+----6 LINE: 0 OF 0******************************* TOP OF MONITOR ************************************************************** BOTTOM OF MONITOR ******************************SOURCE: COB03O ---1----+----2----+----3----+----4----+----5----+ LINE: 1 OF 111
▌2▐ 1 ▌3▐****************************************************** .2 * PROGRAM NAME: COB03O * .3 * * .4 * COMPILED WITH IBM OS/VS COBOL COMPILER * .5 ****************************************************** .7 IDENTIFICATION DIVISION. .8 PROGRAM-ID. COB03O. .9 ************************************************************** .10 * .11 * LICENSED MATERIALS - PROPERTY OF IBM .12 * .13 * 5655-P14: Debug Tool14 * (C) Copyright IBM Corp. 2004 All Rights Reserved15 * .16 * US GOVERNMENT USERS RESTRICTED RIGHTS - USE, DUPLICATION OR .17 * DISCLOSURE RESTRICTED BY GSA ADP SCHEDULE CONTRACT WITH IBM .18 * CORP. .19 * .20 * .21 ************************************************************** .22 ENVIRONMENT DIVISION. .23 DATA DIVISION. .
LOG 0----+----1----+----2----+----3----+----4----+----5----+----6- LINE: 1 OF 7********************************* TOP OF LOG **********************************IBM z/OS Debugger Version 14 Release 1 Mod 008/22/2017 08:52:00 AM Level: V14R15724-T07: Copyright IBM Corp. 1992, 20170004 *** Commands file commands follow ***0005 SET MSGID ON ;0006 LDD ( COB03O, COB03AO ) ;0007 EQA1891I *** Commands file commands end *********************************** BOTTOM OF LOG ********************************
PF 1:? 2:STEP 3:QUIT 4:LIST 5:FIND 6:AT/CLEARPF 7:UP 8:DOWN 9:GO 10:ZOOM 11:ZOOM LOG 12:RETRIEVE
The information displayed in the Source window is similar to the listing generatedby the COBOL compiler. The Source window displays the following information:
▌1▐ LX COBOLThis indicates that the current source program is LangX COBOL.
▌2▐ line numberThe line number is a number assigned by the EQALANGX program bysequentially numbering the source lines. Use the numbers in this columnto set breakpoints and identify statements.
▌3▐ source statementThe original source statement.
Restrictions for debugging a LangX COBOL programWhen you debug LangX COBOL programs the following general restrictions apply:
308 IBM z/OS Debugger V14.1.9 User's Guide

v When you compose z/OS Debugger commands, all expressions must beenclosed in apostrophes (')
v The AT CALL command is not supportedv The AT EXIT command is not supportedv The STEP RETURN command is not supportedv You cannot use the LIST command on a level-88 variables.v You cannot use the assignment statement to alter the contents of a level-88
variable.v If you enter a STEP command when stopped on a statement that returns control
to a higher-level program, the STEP command acts like a GO command.v The only path-points for the AT PATH statement that are supported in a LangX
COBOL program are Entry and Label.v There are behavioral differences between LangX COBOL programs and other
COBOL programs. LangX COBOL programs behave more like assemblerprograms than COBOL programs in many situations. For example, in COBOL, aCU is not known to z/OS Debugger until it is called, even if it is staticallylink-edited into the same load module as the calling CU. However, LangXCOBOL CU's are all known to z/OS Debugger when the module is loaded.
v If you are debugging a non-Language Environment VS COBOL II program thatuses the CALL statement to invoke a Language Environment program, youcannot stop at or debug the Language Environment program.
v The output of the DESCRIBE ATTRIBUTES command might not match the attributesoriginally coded in the following situations:– For packed decimal numbers (COMP-3) the PIC attribute always indicate an
odd number of digits. This might be one more digit than was coded in theoriginal PIC.
– The only non-numeric PIC code that is displayed by z/OS Debugger is 'X'.v Under CICS, the initialization of a non-Language Environment COBOL
transaction is single-threaded; therefore, when multiple users try to concurrentlydebug a non-Language Environment COBOL program, the CICS environmentinitializes one non-Language Environment COBOL transaction at a time.Consider the following example:1. Three users start a transaction that runs non-Language Environment COBOL
program.2. The transaction that started first is initialized first. The other two transactions
have to wait until that initialization is completed.3. After the initialization of the transaction that started first is done, the
transaction that started second is initialized. While this transaction is beinginitialized, the user of the transaction that started first can run his z/OSDebugger session and the user of the transaction that started third continuesto wait.
4. After the initialization of the transaction that started second is done, thetransaction that started third is initialized. While this transaction is beinginitialized, the users of the other two transactions can run their z/OSDebugger sessions.
5. After the initialization of the transaction that started third is done, all threeusers can run their z/OS Debugger sessions, independently, for the samenon-Language Environment COBOL program.
Chapter 31. Debugging a LangX COBOL program 309

%PATHCODE values for LangX COBOL programsThis table shows the possible values for the z/OS Debugger variable%PATHCODE when the current programming language is LangX COBOL:
%PATHCODE Entry Type
1 A block has been entered
3 Control has reached a label coded in the program.
Restrictions for debugging non-Language Environment programsIf you specify the TEST run-time option with the NOPROMPT suboption whenyou start your program, and z/OS Debugger is subsequently started by CALLCEETEST or the raising of a Language Environment condition, then you can debugboth Language Environment and non-Language Environment programs and detectboth Language Environment and non-Language Environment events in the enclavethat started z/OS Debugger and in subsequent enclaves. You cannot debugnon-Language Environment programs or detect non-Language Environment eventsin higher-level enclaves. After control has returned from the enclave in whichz/OS Debugger was started, you can no longer debug non-Language Environmentprograms or detect non-Language Environment events.
310 IBM z/OS Debugger V14.1.9 User's Guide

Chapter 32. Debugging PL/I programs
The topics below describe how to use z/OS Debugger to debug your PL/Iprograms.
Refer to the following topics for more information related to the material discussedin this topic.
Related concepts“z/OS Debugger evaluation of PL/I expressions” on page 317Related tasksChapter 24, “Debugging a PL/I program in full-screen mode,” on page 235Chapter 32, “Debugging PL/I programs”“Accessing PL/I program variables” on page 315Related references“z/OS Debugger subset of PL/I commands”“Supported PL/I built-in functions” on page 318
z/OS Debugger subset of PL/I commandsThe table below lists the z/OS Debugger interpretive subset of PL/I commands. Thissubset is a list of commands recognized by z/OS Debugger that either closelyresemble or duplicate the syntax and action of the corresponding PL/I command.This subset of commands is valid only when the current programming language isPL/I.
Command Description
Assignment Scalar and vector assignment
BEGIN Composite command grouping
CALL z/OS Debugger procedure call
DECLARE or DCL Declaration of session variables
DO Iterative looping and composite command grouping
IF Conditional execution
ON Define an exception handler
SELECT Conditional execution
PL/I language statementsPL/I statements are entered as z/OS Debugger commands. z/OS Debugger makesit possible to issue commands in a manner similar to each language.
The following types of z/OS Debugger commands will support the syntax of thePL/I statements:
ExpressionThis command evaluates an expression.
Block BEGIN/END, DO/END, PROCEDURE/END
These commands provide a means of grouping any number of z/OSDebugger commands into "one" command.
© Copyright IBM Corp. 1992, 2019 311
ConditionalIF/THEN, SELECT/WHEN/END
These commands evaluate an expression and control the flow of executionof z/OS Debugger commands according to the resulting value.
DeclarationDECLARE or DCL
These commands provide a means for declaring session variables.
LoopingDO/WHILE/UNTIL/END
These commands provide a means to program an iterative or conditionalloop as a z/OS Debugger command.
Transfer of ControlGOTO, ON
These commands provide a means to unconditionally alter the flow ofexecution of a group of commands.
The table below shows the commands that are new or changed for this release ofz/OS Debugger when the current programming language is PL/I.
Command Description or changes
ANALYZE Displays the PL/I style of evaluating an expression, and theprecision and scale of the final and intermediate results. z/OSDebugger does not support this command for Enterprise PL/Iprograms.
ON Performs as the AT OCCURRENCE command except it takes PL/Iconditions as operands.
BEGIN BEGIN/END blocks of logic.
DECLARE Session variables can now include COMPLEX (CPLX), POINTER,BIT, BASED, ALIGNED, UNALIGNED, etc. Arrays can be declaredto have upper and lower bounds. Variables can have precisionsand scales. You cannot declare arrays and structures when youdebug Enterprise PL/I programs.
DO The three forms of DO are added; one is an extension of C's do.1. DO; command(s); END;2. DO WHILE | UNTIL expression; command(s); END;3. DO reference=specifications; command(s); END;
IF The IF / ELSE does not require the ENDIF.
SELECT The SELECT / WHEN / OTHERWISE / END programming structureis added.
%PATHCODE values for PL/IThe table below shows the possible values for the z/OS Debugger variable%PATHCODE when the current programming language is PL/I.
0 An attention interrupt occurred.
1 A block has been entered.
2 A block is about to be exited.
3 Control has reached a label constant.
312 IBM z/OS Debugger V14.1.9 User's Guide

4 Control is being sent somewhere else as the result of a CALL or a functionreference.
5 Control is returning from a CALL invocation or a function reference. Register 15, ifit contains a return code, has not yet been stored.
6 Some logic contained in a complex DO statement is about to be executed.
7 The logic following an IF..THEN is about to be executed.
8 The logic following an ELSE is about to be executed.
9 The logic following a WHEN within a select-group is about to be executed.
10 The logic following an OTHERWISE within a select-group is about to be executed.
PL/I conditions and condition handlingAll PL/I conditions are recognized by z/OS Debugger. They are used with the ATOCCURRENCE and ON commands.
When an OCCURRENCE breakpoint is triggered, the z/OS Debugger %CONDITIONvariable holds the following values:
Triggered condition %CONDITION value
AREA AREA
ATTENTION CEE35J
COND ( CC#1 ) CONDITION
CONVERSION CONVERSION
ENDFILE ( MF ) ENDFILE
ENDPAGE ( MF ) ENDPAGE
ERROR ERROR
FINISH CEE066
FOFL CEE348
KEY ( MF ) KEY
NAME ( MF ) NAME
OVERFLOW CEE34C
PENDING ( MF ) PENDING
RECORD ( MF ) RECORD
SIZE SIZE
STRG STRINGRANGE
STRINGSIZE STRINGSIZE
SUBRG SUBSCRIPTRANGE
TRANSMIT ( MF ) TRANSMIT
UNDEFINEDFILE ( MF ) UNDEFINEDFILE
UNDERFLOW CEE34D
ZERODIVIDE CEE349
Note: For Enterprise PL/I programs, the following condition is not supported:v AT OCCURRENCE CONDITION conditions (name)
Chapter 32. Debugging PL/I programs 313

Note: The z/OS Debugger condition ALLOCATE raises the ON ALLOCATE conditionwhen a PL/I program encounters an ALLOCATE statement for a controlled variable.
These PL/I language-oriented commands are only a subset of all the commandsthat are supported by z/OS Debugger.
Entering commands in PL/I DBCS freeform formatStatements can be entered in PL/I's DBCS freeform. This means that statementscan freely use shift codes provided that the statement is not ambiguous.
This will change the description or characteristics of LIST NAMES in that:LIST NAMES db<.c.skk.w>ord
will search for<.D.B.C.Skk.W.O.R.D>
This will result in different behavior depending upon the language. For example,the following will find a<kk>b in C and <.Akk.b> in PL/I.LIST NAMES a<kk>*
where <kk> is shiftout-kanji-shiftin.
Freeform will be added to the parser and will be in effect while the currentprogramming language is PL/I.
Initializing z/OS Debugger for PL/I programs when TEST(ERROR, ...)run-time option is in effect
With the run-time option, TEST(ERROR, ...) only the following can initialize z/OSDebugger:v The ERROR conditionv Attention recognitionv CALL PLITESTv CALL CEETEST
z/OS Debugger enhancements to LIST STORAGE PL/I commandLIST STORAGE address has been enhanced so that the address can be a POINTER, aPx constant, or the ADDR built-in function.
PL/I support for z/OS Debugger session variablesPL/I will support all z/OS Debugger scalar session variables. In addition, arraysand structures can be declared.
Refer to the following topics for more information related to the material discussedin this topic.
Related tasks“Using session variables across different programming languages” on page 416
314 IBM z/OS Debugger V14.1.9 User's Guide

Accessing PL/I program variablesz/OS Debugger obtains information about a program variable by name usinginformation that is contained in the symbol table built by the compiler. The symboltable is made available to the compiler by compiling with TEST(SYM).
z/OS Debugger uses the symbol table to obtain information about programvariables, controlled variables, automatic variables, and program control constantssuch as file and entry constants and also CONDITION condition names. Basedvariables, controlled variables, automatic variables and parameters can be usedwith z/OS Debugger only after storage has been allocated for them in theprogram. An exception to this is DESCRIBE ATTRIBUTES, which can be used todisplay attributes of a variable.
Variables that are based on any of the following data types must be explicitlyqualified when used in expressions:v an OFFSET variablev an expressionv a pointer that is either BASED or DEFINEDv a parameterv a member of either an array or a structurev an address of a member of either an array or a structure
For example, assume you made the following declaration:DECLARE P1 POINTER;DECLARE P2 POINTER BASED(P1);DECLARE DX FIXED BIN(31) BASED(P2);
You would not be able to reference the variable directly by name. You can onlyreference it by specifying either:P2->DX
orP1->P2->DX
The following types of program variables cannot be used with z/OS Debugger:v iSUB defined variablesv Variables defined:
– On a controlled variable– On an array with one or more adjustable bounds– With a POSITION attributed that specifies something other than a constant
v Variables that are members of a based structure declared with the REFER options.
Refer to the following topics for more information related to the material discussedin this topic.
Related tasks“Choosing TEST or NOTEST compiler suboptions for PL/I programs” on page35
Accessing PL/I structuresThe examples in this topic assume the following declaration for a structure calledPAYROLL:
Chapter 32. Debugging PL/I programs 315

Declare 1 Payroll(100),2 Name,4 Last char(20),4 First char(15),
2 Hours,4 Regular Fixed Decimal(5,2),4 Overtime Fixed Decimal(5,2);
To display the 10th element in the array, enter the following command:LIST PAYROLL(10);
z/OS Debugger displays the following results:LIST PAYROLL ( 10 );PAYROLL.NAME.LAST(10)=’Johnson ’PAYROLL.NAME.FIRST(10)=’Eric ’PAYROLL.HOURS.REGULAR(10)=’40’PAYROLL.HOURS.OVERTIME(10)=’0’
To display the first and last name of the 31st element in the array, enter thefollowing command:LIST PAYROLL.NAME(31);
z/OS Debugger displays the following results:LIST PAYROLL.NAME ( 31 );PAYROLL.NAME.LAST(31)=’Rivers ’PAYROLL.NAME.FIRST(31)=’Doug ’
To display all the elements of the array by the order of each element in thestructure, enter the following command:LIST PAYROLL;
z/OS Debugger displays results similar to the following list, with ellipses (...) usedto indicate that additional information has been removed from this list to condensethe list:LIST PAYROLL;PAYROLL.NAME.LAST(1)=’Smith ’PAYROLL.NAME.LAST(2)=’Ramirez ’PAYROLL.NAME.LAST(3)=’Patel ’...PAYROLL.NAME.LAST(100)=’Li ’PAYROLL.NAME.FIRST(1)=’Jason ’PAYROLL.NAME.FIRST(2)=’Ricardo ’PAYROLL.NAME.FIRST(3)=’Aisha ’...PAYROLL.NAME.FIRST(100)=’Xian ’PAYROLL.HOURS.REGULAR(1)=’40’PAYROLL.HOURS.REGULAR(2)=’40’PAYROLL.HOURS.REGULAR(3)=’40’...PAYROLL.HOURS.REGULAR(100)=’40’PAYROLL.HOURS.OVERTIME(1)=’0’PAYROLL.HOURS.OVERTIME(2)=’2’PAYROLL.HOURS.OVERTIME(3)=’3’...PAYROLL.HOURS.OVERTIME(100)=’0’
To display all the elements of the array by the order in which the information isstored in memory, enter the following commands:SET LIST BY SUBSCRIPT ON;LIST PAYROLL;
316 IBM z/OS Debugger V14.1.9 User's Guide

z/OS Debugger displays results similar to the following list, with ellipses (...) usedto indicate that additional information has been removed from this list to condensethe list:LIST PAYROLL;PAYROLL.NAME.LAST(1)=’Smith ’PAYROLL.NAME.FIRST(1)=’Jason ’PAYROLL.HOURS.REGULAR(1)=’40’PAYROLL.HOURS.OVERTIME(1)=’0’PAYROLL.NAME.LAST(2)=’Ramirez ’PAYROLL.NAME.FIRST(2)=’Ricardo ’PAYROLL.HOURS.REGULAR(2)=’40’PAYROLL.HOURS.OVERTIME(2)=’2’PAYROLL.NAME.LAST(3)=’Patel ’PAYROLL.NAME.FIRST(3)=’Aisha ’PAYROLL.HOURS.REGULAR(3)=’40’PAYROLL.HOURS.OVERTIME(3)=’3’...PAYROLL.NAME.LAST(100)=’Li ’PAYROLL.NAME.FIRST(100)=’Xian ’PAYROLL.HOURS.REGULAR(100)=’40’PAYROLL.HOURS.OVERTIME(100)=’0’
z/OS Debugger evaluation of PL/I expressionsWhen the current programming language is PL/I, expression interpretation issimilar to that defined in the PL/I language, except for the PL/I language elementsnot supported in z/OS Debugger.
The z/OS Debugger expression is similar to the PL/I expression. If the source ofthe command is a variable-length record source (such as your terminal) and if theexpression extends across more than one line, a continuation character (an SBCShyphen) must be specified at the end of all but the last line.
z/OS Debugger cannot evaluate PL/I expressions until you step past the ENTRYlocation of the PL/I program.
All PL/I constant types are supported, plus the z/OS Debugger PX constant.
Refer to the following topics for more information related to the material discussedin this topic.
Related references“Unsupported PL/I language elements” on page 320
Chapter 32. Debugging PL/I programs 317

Supported PL/I built-in functionsz/OS Debugger supports the following built-in functions for PL/I for MVS & VM:
ABSACOSADDRALLALLOCATIONANYASINATANATANDATANHBINARYVALUEBINVALUE1
BITBOOLCHARCOMPLETIONCOSCOSDCOSHCOUNT
CSTG2
CURRENTSTORAGEDATAFIELDDATEDATETIMEDIMEMPTYENTRYADDRERFERFCEXPGRAPHICHBOUNDHEXHIGHIMAGLBOUNDLENGTHLINENOLOG
LOG1LOG2LOWMPSTRNULLOFFSETONCHARONCODEONCOUNTONFILEONKEYONLOCONSOURCEPLIRETVPOINTERPOINTERADDPOINTERVALUEPTRADD3
PTRVALUE4
REALREPEATSAMEKEYSINSINDSINHSQRTSTATUSSTORAGESTRINGSUBSTRSYSNULLTANTANDTANHTIMETRANSLATEUNSPECVERIFY
Note:
1. Abbreviation for BINARYVALUE2. Abbreviation for CURRENTSTORAGE3. Abbreviation for POINTERADD4. Abbreviation for POINTERVALUE
z/OS Debugger supports the following built-in functions for Enterprise PL/I:
318 IBM z/OS Debugger V14.1.9 User's Guide

ACOSADDRADDRDATAALLOCATION3
ASINATANATANDATANHBIF_DIMBINARYVALUEBINVALUECOPY1
COSCOSDCOSHCOUNTDATAFIELDDATE1
DATETIME1
DIMENSIONENDFILEENTRYADDR1,2
ERFERFCEXPFILEOPENGAMMAHBOUNDHEX
HEXIMAGEHIGH1
IANDIEORIORINDEXINOTISRLISLLLBOUNDLENGTHLINENOLOGLOG10LOG2LOGGAMMALOW1
LOWER2LOWERCASE1
MAXLENGTHNULLOFFSETOFFSETADDOFFSETSUBTRACTOFFSETDIFF
OFFSETVALUEORDINALNAMEORDINALPREDORDINALSUCCONCODEONCONDCONDONCHARONGSOURCEONSOURCEONCONDIDONCOUNTONFILEONKEYONLOCPAGENOPOINTERPTRPOINTERADDPTRADDPOINTERSUBTRACTPTRSUBTRACT
POINTERDIFFPTRDIFFPOINTERVALUEPTRVALUEPLIRETVRAISE2REPEAT1
SAMEKEYSEARCHSEARCHRSINSINDSINHSQRTSUBSTR1
SYSNULLTANTANDTANHTALLYTIME1
TRANSLATE1
UNSPEC1
UPPERCASE1
VERIFYVERIFYR
Note:
1. To use the built-in functions COPY, DATE, DATETIME, ENTRYADDR, HIGH,LOW, LOWERCASE, REPEAT, SUBSTR, TIME, TRANSLATE, UNSPEC, andUPPERCASE, you must apply the Language Environment runtime PTF forAPAR PQ94347 if you are running on z/OS Version 1 Release 6.
2. Pseudovariables are not supported for the ENTRYADDR built-in function underz/OS Debugger.
3. To use the ALLOCATION built-in function, you must apply the LanguageEnvironment runtime PTF for APAR PK16316 if you are running on z/OSVersion 1 Release 6 or Version 1 Release 7.
z/OS Debugger does not support the following built-in functions for EnterprisePL/I:
ABSALLANYBITBOOLCHARCOMPLETIONCSTG(2)CURRENTSTORAGEDEFINE STRUCTURE
EMPTYGRAPHICIMAGMPSTRREALSTATUSSTORAGESTRING
Chapter 32. Debugging PL/I programs 319
Refer to the following topics for more information related to the material discussedin this topic.
Related tasks“Using SET WARNING PL/I command with built-in functions”
Using SET WARNING PL/I command with built-in functionsCertain checks are performed when the z/OS Debugger SET WARNING commandsetting is ON and a built-in function (BIF) is evaluated:v Division by zerov The remainder (%) operator for a zero value in the second operandv Array subscript out of bounds for defined arraysv Bit shifting by a number that is negative or greater than 32v On a built-in function call for an incorrect number of parameters or for
parameter type mismatchesv On a built-in function call for differing linkage calling conventions
These checks are restrictions that can be removed by issuing SET WARNING OFF.
Unsupported PL/I language elementsThe following list summarizes PL/I functions not available:v Use of iSUBv Interactive declaration or use of user-defined functionsv All preprocessor directivesv Multiple assignmentsv BY NAME assignmentsv LIKE attributev FILE, PICTURE, and ENTRY data attributesv All I/O statements, including DISPLAYv INIT attributev Structures with the built-in functions CSTG, CURRENTSTORAGE, and STORAGEv The repetition factor is not supported for string constantsv GRAPHIC string constants are not supported for expressions involving other data
typesv Declarations cannot be made as sub-commands (for example in a BEGIN, DO, or
SELECT command group)
Debugging OS PL/I programsThere are restrictions on how you can debug OS PL/I programs, which aredescribed in Using CODE/370 with VS COBOL II and OS PL/I, SC09-1862-01.
The OS PL/I compiler does not place the name of the listing data set in the object(load module). z/OS Debugger tries to find the listing data set in the followinglocation: userid.CUName.LIST. If the listing is in a PDS, direct z/OS Debugger tothe location of the PDS in one of the following ways:v In full-screen mode, enter the following command:
SET DEFAULT LISTINGS my.listing.pds
v Use the EQADEBUG DD statement to define the location of the data set.v Code the EQAUEDAT user exit with the location of the data set.
320 IBM z/OS Debugger V14.1.9 User's Guide

Restrictions while debugging Enterprise PL/I programsWhile debugging Enterprise PL/I programs, you cannot use the followingcommands:v ANALYZE
v AT ALLOCATE (of a controlled variable)v AT OCCURRENCE CONDITION conditions (name)v GOTO LABEL
While debugging Enterprise PL/I programs, the following restrictions apply:v If you are running any version of VisualAge PL/I or Enterprise PL/I Version 3
Release 1 through Version 3 Release 3 programs, you cannot use the AT LABELcommand.
v If you are running Enterprise PL/I for z/OS, Version 3.4, or later, programs andyou comply with the following requirements, you can use the AT LABELcommand to set breakpoints (except at a label variable):– If you are running z/OS Version 1 Release 6, apply the Language
Environment PTF for APAR PQ99039.– If you are compiling with Enterprise PL/I Version 3 Release 4, apply PTFs for
APARs PK00118 and PK00339.v For expressions, you cannot do either of the following:
– preface variables with the block, CU, and load module qualification– Reference or list at the block entry
v You cannot use some of built-in functions. See “Supported PL/I built-infunctions” on page 318 for more information.
v You cannot use the DECLARE command to declare arrays, structures, or multiplevariables in one line
v The SET WARNING ON command has no effect.v To use the DESCRIBE ENVIRONMENT command, you must apply the Language
Environment runtime PTF for APAR PQ95664 if you are running z/OS Version 1Release 6.
v To use the DESCRIBE ATTRIBUTES command, you must apply the LanguageEnvironment runtime PTF for APAR PK30522 if you are running on z/OSVersion 1 Release 6 through Version 1 Release 8.
v For typed structures, the following restrictions apply:z/OS Debugger does not support the debugging of PL/I typed structures forprocedures compiled with the Enterprise PL/I V4R1 or earlier compiler releases.A typed structure is a variable or structure that is declared as TYPE X, where Xis declared using DEFINE STRUCTURE.z/OS Debugger supports the debugging of PL/I typed structures for procedurescompiled with the Enterprise PL/I V4R2 or later compilers. If you are runningwith Language Environment V1R11, V1R12 or V1R13, apply the PTFs forLanguage Environment APAR PM30489. You can use the TEST (SEPARATE)options at compile time to get the full benefit of this support.With a few exceptions, references to typed structures require the qualified nameof an elementary member. For nested typed structures, any parent that has atype reference in its declaration must be included in the qualification. Referencesto the structure type or references that are qualified to an intermediate level of atyped structure cannot be resolved. (See the Enterprise PL/I Language ReferenceManual for more information about typed structures.)Typed structure references are supported for the following:
Chapter 32. Debugging PL/I programs 321

– ASSIGNMENT:- A typed structure that is assigned to a typed structure of the same type- A handle that is assigned to a handle declared as the same type- A value that is assigned to an elementary member of a typed structure
– COMPARISONS– AUTOMONITOR– DESCRIBE ATTRIBUTES– LIST– LIST STORAGE()
322 IBM z/OS Debugger V14.1.9 User's Guide

Chapter 33. Debugging C and C++ programs
The topics below describe how to use z/OS Debugger to debug your C and C++programs.
“Example: referencing variables and setting breakpoints in C and C++ blocks” onpage 337
Refer to the following topics for more information related to the material discussedin this topic.
Related concepts“C and C++ expressions” on page 327“z/OS Debugger evaluation of C and C++ expressions” on page 331“Scope of objects in C and C++” on page 334“Blocks and block identifiers for C” on page 336“Blocks and block identifiers for C++” on page 336“Monitoring storage in C++” on page 344Related tasksChapter 25, “Debugging a C program in full-screen mode,” on page 245Chapter 26, “Debugging a C++ program in full-screen mode,” on page 255“Using C and C++ variables with z/OS Debugger” on page 324“Declaring session variables with C and C++” on page 326“Calling C and C++ functions from z/OS Debugger” on page 328“Intercepting files when debugging C and C++ programs” on page 332“Displaying environmental information for C and C++ programs” on page 338“Stepping through C++ programs” on page 342“Setting breakpoints in C++” on page 342“Examining C++ objects” on page 343“Qualifying variables in C and C++” on page 339Related references“z/OS Debugger commands that resemble C and C++ commands”“%PATHCODE values for C and C++” on page 326“C reserved keywords” on page 329“C operators and operands” on page 330“Language Environment conditions and their C and C++ equivalents” on page330
z/OS Debugger commands that resemble C and C++ commandsz/OS Debugger's command language is a subset of C and C++ commands and hasthe same syntactical requirements. z/OS Debugger allows you to work in alanguage you are familiar with so learning a new set of commands is notnecessary.
The table below shows the interpretive subset of C and C++ commands recognizedby z/OS Debugger.
Command Description
block ({}) Composite command grouping
break Termination of loops or switch commands
declarations Declaration of session variables
© Copyright IBM Corp. 1992, 2019 323
Command Description
do/while Iterative looping
expression Any C expression except the conditional (?) operator
for Iterative looping
if Conditional execution
switch Conditional execution
This subset of commands is valid only when the current programming language isC or C++.
In addition to the subset of C and C++ commands that you can use is a list ofreserved keywords used and recognized by C and C++ that you cannot abbreviate,use as variable names, or use as any other type of identifier.
Refer to the following topics for more information related to the material discussedin this topic.
Related references“C reserved keywords” on page 329z/OS XL C/C++ Language Reference
Using C and C++ variables with z/OS Debuggerz/OS Debugger can process all program variables that are valid in C or C++. Youcan assign and display the values of variables during your session. You can alsodeclare session variables with the recognized C declarations to suit your testingneeds.
Refer to the following topics for more information related to the material discussedin this topic.
Related tasks“Accessing C and C++ program variables”“Displaying values of C and C++ variables or expressions” on page 325“Assigning values to C and C++ variables” on page 325
Accessing C and C++ program variablesz/OS Debugger obtains information about a program variable by name using thesymbol table built by the compiler. If you specify TEST(SYM) at compile time, thecompiler builds a symbol table that allows you to reference any variable in theprogram.
Note: There are no suboptions for C++. Symbol information is generated bydefault when the TEST compiler option is specified.
Refer to the following topics for more information related to the material discussedin this topic.
Related tasks“Choosing TEST or DEBUG compiler suboptions for C programs” on page 41“Choosing TEST or DEBUG compiler suboptions for C++ programs” on page 46
324 IBM z/OS Debugger V14.1.9 User's Guide

Displaying values of C and C++ variables or expressionsTo display the values of variables or expressions, use the LIST command. The LISTcommand causes z/OS Debugger to log and display the current values (andnames, if requested) of variables, including the evaluated results of expressions.
Suppose you want to display the program variables X, row[X], and col[X], andtheir values at line 25. If you issue the following command:AT 25 LIST ( X, row[X], col[X] ); GO;
z/OS Debugger sets a breakpoint at line 25 (AT), begins execution of the program(GO), stops at line 25, and displays the variable names and their values.
If you want to see the result of their addition, enter:AT 25 LIST ( X + row[X] + col[X] ); GO;
z/OS Debugger sets a breakpoint at line 25 (AT), begins execution of the program(GO), stops at line 25, and displays the result of the expression.
Put commas between the variables when listing more than one. If you do not wantto display the variable names when issuing the LIST command, enter LISTUNTITLED.
You can also list variables with the printf function call as follows:printf ("X=%d, row=%d, col=%d\n", X, row[X], col[X]);
The output from printf, however, does not appear in the Log window and is notrecorded in the log file unless you SET INTERCEPT ON FILE stdout.
Assigning values to C and C++ variablesTo assign a value to a C and C++ variable, you use an assignment expression.Assignment expressions assign a value to the left operand. The left operand mustbe a modifiable lvalue. An lvalue is an expression representing a data object thatcan be examined and altered.
C contains two types of assignment operators: simple and compound. A simpleassignment operator gives the value of the right operand to the left operand.
Note: Only the assignment operators that work for C will work for C++, that is,there is no support for overloaded operators.
The following example demonstrates how to assign the value of number to themember employee of the structure payroll:payroll.employee = number;
Compound assignment operators perform an operation on both operands and givethe result of that operation to the left operand. For example, this expression givesthe value of index plus 2 to the variable index:index += 2
z/OS Debugger supports all C operators except the tenary operator, as well as anyother full C language assignments and function calls to user or C library functions.
Refer to the following topics for more information related to the material discussedin this topic.
Chapter 33. Debugging C and C++ programs 325

Related tasks“Calling C and C++ functions from z/OS Debugger” on page 328
%PATHCODE values for C and C++The table below shows the possible values for the z/OS Debugger variable%PATHCODE when the current programming language is C and C++.
–1 z/OS Debugger is not in control as the result of a path or attention situation.
0 Attention function (not ATTENTION condition).
1 A block has been entered.
2 A block is about to be exited.
3 Control has reached a user label.
4 Control is being transferred as a result of a function reference. The invokedroutine's parameters, if any, have been prepared.
5 Control is returning from a function reference. Any return code contained inregister 15 has not yet been stored.
6 Some logic contained by a conditional do/while, for, or while statement is aboutto be executed. This can be a single or Null statement and not a block statement.
7 The logic following an if(...) is about to be executed.
8 The logic following an else is about to be executed.
9 The logic following a case within an switch is about to be executed.
10 The logic following a default within a switch is about to be executed.
13 The logic following the end of a switch, do, while, if(...), or for is about to beexecuted.
17 A goto, break, continue, or return is about to be executed.
Values in the range 3–17 can only be assigned to %PATHCODE if your program wascompiled with an option supporting path hooks.
Declaring session variables with C and C++You might want to declare session variables for use during the course of yoursession. You cannot initialize session variables in declarations. However, you canuse an assignment statement or function call to initialize a session variable.
As in C, keywords can be specified in any order. Variable names up to 255characters in length can be used. Identifiers are case-sensitive, but if you want touse the session variable when the current programming language changes from Cto another HLL, the variable must have an uppercase name and compatibleattributes.
To declare a hexadecimal floating-point variable called maximum, enter the followingC declaration:double maximum;
You can only declare scalars, arrays of scalars, structures, and unions in z/OSDebugger (pointers for the above are allowed as well).
326 IBM z/OS Debugger V14.1.9 User's Guide

If you declare a session variable with the same name as a programming variable,the session variable hides the programming variable. To reference theprogramming variable, you must qualify it. For example:main:>x for the program variable xx for the session variable x
Session variables remain in effect for the entire debug session, unless they arecleared using the CLEAR command.
Refer to the following topics for more information related to the material discussedin this topic.
Related tasks“Using session variables across different programming languages” on page 416“Qualifying variables and changing the point of view in C and C++” on page339
C and C++ expressionsz/OS Debugger allows evaluation of expressions in your test program. Allexpressions available in C and C++ are also available within z/OS Debuggerexcept for the conditional expression (? :). That is, all operators such as +, -, %:,and += are fully supported with the exception of the conditional operator.
C and C++ language expressions are arranged in the following groups based onthe operators they contain and how you use them:
Primary expressionUnary expressionBinary expressionConditional expressionAssignment expressionComma expressionlvalueConstant
An lvalue is an expression representing a data object that can be examined andaltered. For a more detailed description of expressions and operators, see the Cand C++ Program Guides.
The semantics for C and C++ operators are the same as in a compiled C or C++program. Operands can be a mixture of constants (integer, floating-point,character, string, and enumeration), C and C++ variables, z/OS Debuggervariables, or session variables declared during a z/OS Debugger session. Languageconstants are specified as described in the C and C++ Language Referencepublications.
The z/OS Debugger command DESCRIBE ATTRIBUTES can be used to display theresultant type of an expression, without actually evaluating the expression.
The C and C++ language does not specify the order of evaluation for function callarguments. Consequently, it is possible for an expression to have a differentexecution sequence in compiled code than within z/OS Debugger. For example, ifyou enter the following in an interactive session:
Chapter 33. Debugging C and C++ programs 327

int x;int y;
x = y = 1;
printf ("%d %d %d%" x, y, x=y=0);
the results can differ from results produced by the same statements located in a Cor C++ program segment. Any expression containing behavior undefined by ANSIstandards can produce different results when evaluated by z/OS Debugger thanwhen evaluated by the compiler.
The following examples show you various ways z/OS Debugger supports the useof expressions in your programs:v z/OS Debugger assigns 12 to a (the result of the printf()) function call, as in:
a = (1,2/3,a++,b++,printf("hello world\n"));
v z/OS Debugger supports structure and array referencing and pointerdereferencing, as in:league[num].team[1].player[1]++;league[num].team[1].total += 1;++(*pleague);
v Simple and compound assignment is supported, as in:v.x = 3;a = b = c = d = 0;*(pointer++) -= 1;
v C and C++ language constants in expressions can be used, as in:*pointer_to_long = 3521L = 0x69a1;float_val = 3e-11 + 6.6E-10;char_val = ’7’;
v The comma expression can be used, as in:intensity <<= 1, shade * increment, rotate(direction);alpha = (y>>3, omega % 4);
v z/OS Debugger performs all implicit and explicit C conversions when necessary.Conversion to long double is performed in:long_double_val = unsigned_short_val;long_double_val = (long double) 3;
Refer to the following topics for more information related to the material discussedin this topic.
Related references“z/OS Debugger evaluation of C and C++ expressions” on page 331z/OS XL C/C++ Language Reference
Calling C and C++ functions from z/OS DebuggerYou can perform calls to user and C library functions within z/OS Debugger,unless your program was compiled with the FORMAT(DWARF) suboption of theDEBUG compiler option.
You can make calls to C library functions at any time. In addition, you can use theC library variables stdin, stdout, stderr, __amrc, and errno in expressionsincluding function calls.
The library function ctdli cannot be called unless it is referenced in a compile unitin the program, either main or a function linked to main.
328 IBM z/OS Debugger V14.1.9 User's Guide

Calls to user functions can be made, provided z/OS Debugger is able to locate anappropriate definition for the function within the symbol information in the userprogram. These definitions are created when the program is compiled withTEST(SYM) for C or TEST for C++.
z/OS Debugger performs parameter conversions and parameter-mismatchchecking where possible. Parameter checking is performed if:v The function is a library functionv A prototype for the function exists in the current compile unitv z/OS Debugger is able to locate a prototype for the function in another compile
unit, or the function itself was compiled with TEST(SYM) for C or with TEST forC++.
You can turn off this checking by specifying SET WARNING OFF.
Calls can be made to any user functions that have linkage supported by the C orC++ compiler. However, for C++ calls made to any user function, the functionmust be declared as:extern "C"
For example, use this declaration if you want to debug an application signalhandler. When a condition occurs, control passes to z/OS Debugger which thenpasses control to the signal handler.
z/OS Debugger attempts linkage checking, and does not perform the function callif it determines there is a linkage mismatch. A linkage mismatch occurs when thetarget program has one linkage but the source program believes it has a differentlinkage.
It is important to note the following regarding function calls:v The evaluation order of function arguments can vary between the C and C++
program and z/OS Debugger. No discernible difference exists if the evaluationof arguments does not have side effects.
v z/OS Debugger knows about the function return value, and all the necessaryconversions are performed when the return value is used in an expression.
v The functions cannot be in XPLINK applications.v The functions must have debug information available.
Refer to the following topics for more information related to the material discussedin this topic.
Related tasks“Choosing TEST or DEBUG compiler suboptions for C programs” on page 41“Choosing TEST or DEBUG compiler suboptions for C++ programs” on page 46Related referencesz/OS XL C/C++ Language Reference
C reserved keywordsThe table below lists all keywords reserved by the C language. When the currentprogramming language is C or C++, these keywords cannot be abbreviated, usedas variable names, or used as any other type of identifiers.
auto else long switchbreak enum register typedef
Chapter 33. Debugging C and C++ programs 329

case extern return unionchar float short unsignedconst for signed voidcontinue goto sizeof volatiledefault if static whiledo int struct _Packeddouble
C operators and operandsThe table below lists the C language operators in order of precedence and showsthe direction of associativity for each operator. The primary operators have thehighest precedence. The comma operator has the lowest precedence. Operators inthe same group have the same precedence.
Precedence level Associativity Operators
Primary left to right () [ ] . –>
Unary right to left ++ -- - + ! ~ &* (typename) sizeof
Multiplicative left to right * / %
Additive left to right + -
Bitwise shift left to right << >>
Relational left to right < > <= >=
Equality left to right ++ !=
Bitwise logical AND left to right &
Bitwise exclusive OR left to right ^ or ¬
Bitwise inclusive OR left to right |
Logical AND left to right &&
Logical OR left to right ||
Assignment right to left = += -= *= /=<<= >>= %= &= ^= |=
Comma left to right ,
Language Environment conditions and their C and C++ equivalentsLanguage Environment condition names (the symbolic feedback codes CEExxx) canbe used interchangeably with the equivalent C and C++ conditions listed in thefollowing table. For example, AT OCCURRENCE CEE341 is equivalent to AT OCCURRENCESIGILL. Raising a CEE341 condition triggers an AT OCCURRENCE SIGILL breakpointand vice versa.
Language Environmentcondition
Description Equivalent C/C++condition
CEE341 Operation exception SIGILL
CEE342 Privileged operation exception SIGILL
CEE343 Execute exception SIGILL
CEE344 Protection exception SIGSEGV
CEE345 Addressing exception SIGSEGV
330 IBM z/OS Debugger V14.1.9 User's Guide

Language Environmentcondition
Description Equivalent C/C++condition
CEE346 Specification exception SIGILL
CEE347 Data exception SIGFPE
CEE348 Fixed point overflow exception SIGFPE
CEE349 Fixed point divide exception SIGFPE
CEE34A Decimal overflow exception SIGFPE
CEE34B Decimal divide exception SIGFPE
CEE34C Exponent overflow exception SIGFPE
CEE34D Exponent underflow exception SIGFPE
CEE34E Significance exception SIGFPE
CEE34F Floating-point divide exception SIGFPE
z/OS Debugger evaluation of C and C++ expressionsz/OS Debugger interprets most input as a collection of one or more expressions.You can use expressions to alter a program variable or to extend the program byadding expressions at points that are governed by AT breakpoints.
z/OS Debugger evaluates C and C++ expressions following the rules presented inz/OS XL C/C++ Language Reference. The result of an expression is equal to the resultthat would have been produced if the same expression had been part of yourcompiled program.
Implicit string concatenation is supported. For example, "abc" "def" is accepted for"abcdef" and treated identically. Concatenation of wide string literals to stringliterals is not accepted. For example, L"abc"L"def" is valid and equivalent toL"abcdef", but "abc" L"def" is not valid.
Expressions you use during your session are evaluated with the same sensitivity toenablement as are compiled expressions. Conditions that are enabled are the sameones that exist for program statements.
During a z/OS Debugger session, if the current setting for WARNING is ON, theoccurrence in your C or C++ program of any one of the conditions listed belowcauses the display of a diagnostic message.v Division by zerov Remainder (%) operator for a zero value in the second operandv Array subscript out of bounds for a defined arrayv Bit shifting by a number that is either negative or greater than 32v Incorrect number of parameters, or parameter type mismatches for a function
callv Differing linkage calling conventions for a function callv Assignment of an integer value to a variable of enumeration data type where the
integer value does not correspond to an integer value of one of the enumerationconstants of the enumeration data type
v Assignment to an lvalue that has the const attributev Attempt to take the address of an object with register storage classv A signed integer constant not in the range -2**31 to 2**31
Chapter 33. Debugging C and C++ programs 331

v A real constant not having an exponent of 3 or fewer digitsv A float constant not larger than 5.39796053469340278908664699142502496E-79 or
smaller than 7.2370055773322622139731865630429929E+75v A hex escape sequence that does not contain at least one hexadecimal digitv An octal escape sequence with an integer value of 256 or greaterv An unsigned integer constant greater than the maximum value of 4294967295.
Refer to the following topics for more information related to the material discussedin this topic.
Related references“C and C++ expressions” on page 327z/OS XL C/C++ Language Reference
Intercepting files when debugging C and C++ programsSeveral considerations must be kept in mind when using the SET INTERCEPTcommand to intercept files while you are debugging a C application.
For CICS only: SET INTERCEPT is not supported for CICS.
For C++, there is no specific support for intercepting IOStreams. IOStreams isimplemented using C I/O which implies that:v If you intercept I/O for a C standard stream, this implicitly intercepts I/O for
the corresponding IOStreams' standard stream.v If you intercept I/O for a file, by name, and define an IOStream object
associated with the same file, IOStream I/O to that file will be intercepted.
Note: Although you can intercept IOStreams indirectly via C/370 I/O, thebehaviors might be different or undefined in C++.
You can use the following names with the SET INTERCEPT command during adebug session:v stdout, stderr, and stdin (lowercase only)v any valid fopen() file specifier.
The behavior of I/O interception across system() call boundaries is global. Thisimplies that the setting of INTERCEPT ON for xx in Program A is also in effect forProgram B (when Program A system() calls to Program B). Correspondingly,setting INTERCEPT OFF for xx in Program B turns off interception in Program Awhen Program B returns to A. This is also true if a file is intercepted in Program Band returns to Program A. This model applies to disk files, memory files, andstandard streams.
When a stream is intercepted, it inherits the text/binary attribute specified on thefopen statement. The output to and input from the z/OS Debugger log file behaveslike terminal I/O, with the following considerations:v Intercepted input behaves as though the terminal was opened for record I/O.
Intercepted input is truncated if the data is longer than the record size and thetruncated data is not available to subsequent reads.
v Intercepted output is not truncated. Data is split across multiple lines.v Some situations causing an error with the real file might not cause an error
when the file is intercepted (for example, truncation errors do not occur). Filesexpecting specific error conditions do not make good candidates for interception.
332 IBM z/OS Debugger V14.1.9 User's Guide

v Only sequential I/O can be performed on an intercepted stream, but filepositioning functions are tolerated and the real file position is not changed.fseek, rewind, ftell, fgetpos, and fsetpos do not cause an error, but have noeffect.
v The logical record length of an intercepted stream reflects the logical recordlength of the real file.
v When an unintercepted memory file is opened, the record format is always fixedand the open mode is always binary. These attributes are reflected in theintercepted stream.
v Files opened to the terminal for write are flushed before an input operationoccurs from the terminal. This is not supported for intercepted files.
Other characteristics of intercepted files are:v When an fclose() occurs or INTERCEPT is set OFF for a file that was intercepted,
the data is flushed to the session log file before the file is closed or the SETINTERCEPT OFF command is processed.
v When an fopen() occurs for an intercepted file, an open occurs on the real filebefore the interception takes effect. If the fopen() fails, no interception occurs forthat file and any assumptions about the real file, such as the ddname allocationand data set defaults, take effect.
v The behavior of the ASIS suboption on the fopen() statement is not supportedfor intercepted files.
v When the clrmemf() function is invoked and memory files have beenintercepted, the buffers are flushed to the session log file before the files areremoved.
v If the fldata() function is invoked for an intercepted file, the characteristics ofthe real file are returned.
v If stderr is intercepted, the interception overrides the Language Environmentmessage file (the default destination for stderr). A subsequent SET INTERCEPTOFF command returns stderr to its MSGFILE destination.
v If a file is opened with a ddname, interception occurs only if the ddname isspecified on the INTERCEPT command. Intercepting the underlying file name doesnot cause interception of the stream.
v User prefix qualifications are included in MVS data set names entered in theINTERCEPT command, using the same rules as defined for the fopen() function.
v If library functions are invoked when z/OS Debugger is waiting for input for anintercepted file (for example, if you interactively enter fwrite(..) when z/OSDebugger is waiting for input), subsequent behavior is undefined.
v I/O intercepts remain in effect for the entire debug session, unless you terminatethem by selecting SET INTERCEPT OFF.
Command line redirection of the standard streams is supported under z/OSDebugger, as shown below.
1>&2 If stderr is the target of the interception command, stdout is alsointercepted. If stdout is the target of the INTERCEPT command, stderr isnot intercepted. When INTERCEPT is set OFF for stdout, the stream isredirected to stderr.
2>&1 If stdout is the target of the INTERCEPT command, stderr is alsointercepted. If stderr is the target of the INTERCEPT command, stdout isnot intercepted. When INTERCEPT is set OFF for stderr, the stream isredirected to stdout again.
Chapter 33. Debugging C and C++ programs 333

1>file.namestdout is redirected to file.name. For interception of stdout to occur,stdout or file.name can be specified on the interception request. This alsoapplies to 1>>file.name
2>file.namestderr is redirected to file.name. For interception of stderr to occur,stderr or file.name can be specified on the interception request. This alsoapplies to 2>>file.name
2>&1 1>file.namestderr is redirected to stdout, and both are redirected to file.name. Iffile.name is specified on the interception command, both stderr andstdout are intercepted. If you specify stderr or stdout on the INTERCEPTcommand, the behavior follows rule 1b above.
1>&2 2>file.namestdout is redirected to stderr, and both are redirected to file.name. If youspecify file.name on the INTERCEPT command, both stderr and stdout areintercepted. If you specify stdout or stderr on the INTERCEPT command,the behavior follows rule 1a above.
The same standard stream cannot be redirected twice on the command line.Interception is undefined if this is violated, as shown below.
2>&1 2>file.nameBehavior of stderr is undefined.
1>&2 1>file.nameBehavior of stdout is undefined.
Refer to the following topics for more information related to the material discussedin this topic.
Related referencesz/OS XL C/C++ Programming Guide
Scope of objects in C and C++An object is visible in a block or source file if its data type and declared name areknown within the block or source file. The region where an object is visible isreferred to as its scope. In z/OS Debugger, an object can be a variable or functionand is also used to refer to line numbers.
Note: The use of an object here is not to be confused with a C++ object. Anyreference to C++ will be qualified as such.
In ANSI C, the four kinds of scope are:BlockFileFunctionFunction prototype
For C++, in addition to the scopes defined for C, it also has the class scope.
An object has block scope if its declaration is located inside a block. An object withblock scope is visible from the point where it is declared to the closing brace (})that terminates the block.
334 IBM z/OS Debugger V14.1.9 User's Guide

An object has file scope if its definition appears outside of any block. Such anobject is visible from the point where it is declared to the end of the source file. Inz/OS Debugger, if you are qualified to the compilation unit with the file staticvariables, file static and global variables are always visible.
The only type of object with function scope is a label name.
An object has function prototype scope if its declaration appears within the list ofparameters in a function prototype.
A class member has class scope if its declaration is located inside a class.
You cannot reference objects that are visible at function prototype scope, but youcan reference ones that are visible at file or block scope if:v For C variables and functions, the source file was compiled with TEST(SYM) and
the object was referenced somewhere within the source.v For C variables declared in a block that is nested in another block, the source file
was compiled with TEST(SYM, BLOCK).v For line numbers, the source file was compiled with TEST(LINE) GONUMBER.v For labels, the source file was compiled with TEST(SYM, PATH). In some cases
(for example, when using GOTO), labels can be referenced if the source file wascompiled with TEST(SYM, NOPATH).
z/OS Debugger follows the same scoping rules as ANSI, except that it handlesobjects at file scope differently. An object at file scope can be referenced fromwithin z/OS Debugger at any point in the source file, not just from the point in thesource file where it is declared. z/OS Debugger session variables always have ahigher scope than program variables, and consequently have higher precedencethan a program variable with the same name. The program variable can always beaccessed through qualification.
In addition, z/OS Debugger supports the referencing of variables in multiple loadmodules. Multiple load modules are managed through the C library functionsdllload(), dllfree(), fetch(), and release().
“Example: referencing variables and setting breakpoints in C and C++ blocks” onpage 337
Related concepts“Storage classes in C and C++”
Storage classes in C and C++z/OS Debugger supports the change and reference of all objects declared with thefollowing storage classes:
autoregisterstaticextern
Session variables declared during the z/OS Debugger session are also available forreference and change.
An object with auto storage class is available for reference or change in z/OSDebugger, provided the block where it is defined is active. Once a block finishesexecuting, the auto variables within this block are no longer available for change,but can still be examined using DESCRIBE ATTRIBUTES.
Chapter 33. Debugging C and C++ programs 335

An object with register storage class might be available for reference or change inz/OS Debugger, provided the variable has not been optimized to a register.
An object with static storage class is always available for change or reference inz/OS Debugger. If it is not located in the currently qualified compile unit, youmust specifically qualify it.
An object with extern storage class is always available for change or reference inz/OS Debugger. It might also be possible to reference such a variable in a programeven if it is not defined or referenced from within this source file. This is possibleprovided z/OS Debugger can locate another compile unit (compiled withTEST(SYM)) with the appropriate definition.
Blocks and block identifiers for CIt is often necessary to set breakpoints on entry into or exit from a given block orto reference variables that are not immediately visible from the current block. z/OSDebugger can do this, provided that all blocks are named. It uses the followingnaming convention:v The outermost block of a function has the same name as the function.v For C programs compiled with the ISD compiler option, blocks enclosed in this
outermost block are sequentially named: %BLOCK2, %BLOCK3, %BLOCK4, and so on inorder of their appearance in the function.
v For C programs compiled with the DWARF compiler option, blocks are namedin a non-sequential manner. To determine the names of the blocks, enter theDESCRIBE CU; command.
When these block names are used in the z/OS Debugger commands, you mightneed to distinguish between nested blocks in different functions within the samesource file. This can be done by naming the blocks in one of two ways:
Short formfunction_name:>%BLOCKzzz
Long formfunction_name:>%BLOCKxxx :>%BLOCKyyy: ... :>%BLOCKzzz
%BLOCKzzz is contained in %BLOCKyyy, which is contained in %BLOCKxxx. The shortform is always allowed; it is never necessary to specify the long form.
The currently active block name can be retrieved from the z/OS Debugger variable%BLOCK. You can display the names of blocks by entering:DESCRIBE CU;
Blocks and block identifiers for C++Block Identifiers tend to be longer for C++ than C because C++ functions can beoverloaded. In order to distinguish one function name from the other, each blockidentifier is like a prototype. For example, a function named shapes(int,int) in Cwould have a block named shapes; however, in C++ the block would be calledshapes(int,int).
You must always refer to a C++ block identifier in its entirety, even if the functionis not overloaded. That is, you cannot refer to shapes(int,int) as shapes only.
336 IBM z/OS Debugger V14.1.9 User's Guide

Note: The block name for main() is always main (without the qualifyingparameters after it) even when compiled with C++ because main() has extern Clinkage.
Since block names can be quite long, it is not unusual to see the name truncated inthe LOCATION field on the first line of the screen. If you want to find out where youare, enter:QUERY LOCATION
and the name will be shown in its entirety (wrapped) in the session log.
Block identifiers are restricted to a length of 255 characters. Any name longer than255 characters is truncated.
Example: referencing variables and setting breakpoints in C and C++blocks
The program below is used as the basis for several examples, described after theprogram listing.#pragma runopts(EXECOPS)#include <stdlib.h>
main(){
>>> z/OS Debugger is given <<<>>> control here. <<<
init();sort();
}
short length = 40;static long *table;
init(){
table = malloc(sizeof(long)*length);...}
sort (){ /* Block sort */
int i;for (i = 0; i < length–1; i++) { /* If compiled with ISD, Block %BLOCK2; */
/* if compiled with DWARF, Block %BLOCK8 */int j;for (j = i+1; j < length; j++) { /* If compiled with ISD, Block %BLOCK3; */
/* if compiled with DWARF, Block %BLOCK13 */static int temp;temp = table[i];table[i] = table[j];table[j] = temp;
}}
}
Scope and visibility of objects in C and C++ programsLet's assume the program shown above is compiled with TEST(SYM). When z/OSDebugger gains control, the file scope variables length and table are available forchange, as in:length = 60;
Chapter 33. Debugging C and C++ programs 337

The block scope variables i, j, and temp are not visible in this scope and cannot bedirectly referenced from within z/OS Debugger at this time. You can list the linenumbers in the current scope by entering:LIST LINE NUMBERS;
Now let's assume the program is compiled with TEST(SYM, NOBLOCK). Since theprogram is explicitly compiled using NOBLOCK, z/OS Debugger will never knowabout the variables j and temp because they are defined in a block that is nested inanother block. z/OS Debugger does know about the variable i since it is not in ascope that is nested.
Blocks and block identifiers in C and C++ programsIn the program above, the function sort has the following three blocks:
If program is compiled with the ISDcompiler option
If program is compiled with the DWARFcompiler option
sort sort
%BLOCK2 %BLOCK8
%BLOCK3 %BLOCK13
The following examples set a breakpoint on entry to the second block of sort:v If program is compiled with the ISD compiler option: at entry sort:>%BLOCK2;.v If program is compiled with the DWARF compiler option: at entry
sort:>%BLOCK8;.
The following example sets a breakpoint on exit of the first block of main and liststhe entries of the sorted table.at exit main {
for (i = 0; i < length; i++)printf("table entry %d is %d\n", i, table[i]);
}
The following examples list the variable temp in the third block of sort. This ispossible because temp has the static storage class.v If program is compiled with the ISD compiler option: LIST sort:>
%BLOCK3:temp;.v If program is compiled with the DWARF compiler option: LIST
sort:>%BLOCK13:temp;.
Displaying environmental information for C and C++ programsYou can also use the DESCRIBE command to display a list of attributes applicable tothe current run-time environment. The type of information displayed varies fromlanguage to language.
Issuing DESCRIBE ENVIRONMENT displays a list of open files and conditions beingmonitored by the run-time environment. For example, if you enter DESCRIBEENVIRONMENT while debugging a C or C++ program, you might get the followingoutput:Currently open files
stdoutsysprint
The following conditions are enabled:
338 IBM z/OS Debugger V14.1.9 User's Guide

SIGFPESIGILLSIGSEGVSIGTERMSIGINTSIGABRTSIGUSR1SIGUSR2SIGABND
Qualifying variables and changing the point of view in C and C++Qualification is a method of:v Specifying an object through the use of qualifiersv Changing the point of view
Qualification is often necessary due to name conflicts, or when a program consistsof multiple load modules, compile units, and/or functions.
When program execution is suspended and z/OS Debugger receives control, thedefault, or implicit qualification is the active block at the point of programsuspension. All objects visible to the C or C++ program in this block are alsovisible to z/OS Debugger. Such objects can be specified in commands without theuse of qualifiers. All others must be specified using explicit qualification.
Qualifiers depend, of course, upon the naming convention of the system whereyou are working.
“Example: using qualification in C” on page 340Related tasks“Qualifying variables in C and C++”“Changing the point of view in C and C++” on page 340
Qualifying variables in C and C++You can precisely specify an object, provided you know the following:v Load module or DLL namev Source file (compilation unit) namev Block name (must include function prototype for C++ block qualification).
These are known as qualifiers and some, or all, might be required whenreferencing an object in a command. Qualifiers are separated by a combination ofgreater than signs (>) and colons and precede the object they qualify. For example,the following is a fully qualified object:load_name::>cu_name:>block_name:>object
If required, load_name is the name of the load module. It is required only when theprogram consists of multiple load modules and when you want to change thequalification to other than the current load module. load_name is enclosed inquotation marks ("). If it is not, it must be a valid identifier in the C or C++programming language. load_name can also be the z/OS Debugger variable %LOAD.
If required, CU_NAME is the name of the compilation unit or source file. Thecu_name must be the fully qualified source file name or an absolute pathname. It isrequired only when you want to change the qualification to other than thecurrently qualified compilation unit. It can be the z/OS Debugger variable %CU. If
Chapter 33. Debugging C and C++ programs 339

there appears to be an ambiguity between the compilation unit name, and (forexample), a block name, you must enclose the compilation unit name in quotationmarks (").
If required, block_name is the name of the block. block_name can be the z/OSDebugger variable %BLOCK.
“Example: using qualification in C”
Refer to the following topics for more information related to the material discussedin this topic.
Related concepts“Blocks and block identifiers for C” on page 336
Changing the point of view in C and C++To change the point of view from the command line or a commands file, usequalifiers with the SET QUALIFY command. This can be necessary to get to data thatis inaccessible from the current point of view, or can simplify debugging when anumber of objects are being referenced.
It is possible to change the point of view to another load module or DLL, toanother compilation unit, to a nested block, or to a block that is not nested. TheSET keyword is optional.
“Example: using qualification in C”
Example: using qualification in CThe examples below use the following program.LOAD MODULE NAME: MAINMODSOURCE FILE NAME: MVSID.SORTMAIN.C
short length = 40;main (){
long *table;void (*pf)();
table = malloc(sizeof(long)*length);...pf = fetch("SORTMOD");(*pf)(table);...release(pf);...
}
LOAD MODULE NAME: SORTMODSOURCE FILE NAME: MVSID.SORTSUB.C
short length = 40;short sn = 3;void (long table[]){
short i;for (i = 0; i < length-1; i++) {short j;for (j = i+1; j < length; j++) {
float sn = 3.0;short temp;
340 IBM z/OS Debugger V14.1.9 User's Guide

temp = table[i];...>>> z/OS Debugger is given <<<>>> control here. <<<...table[i] = table[j];table[j] = temp;
}}
}
When z/OS Debugger receives control, variables i, j, temp, table, and length canbe specified without qualifiers in a command. If variable sn is referenced, z/OSDebugger uses the variable that is a float. However, the names of the blocks andcompile units differ, maintaining compatibility with the operating system.
Qualifying variables in Cv Change the file scope variable length defined in the compilation unit
MVSID.SORTSUB.C in the load module SORTMOD:"SORTMOD"::>"MVSID.SORTSUB.C":>length = 20;
v Assume z/OS Debugger gained control from main(). The following changes thevariable length:%LOAD::>"MVSID.SORTMAIN.C":>length = 20;
Because length is in the current load module and compilation unit, it can alsobe changed by:length = 20;
v Assume z/OS Debugger gained control as shown in the example programabove. You can break whenever the variable temp in load module SORTMODchanges in any of the following ways:AT CHANGE temp;AT CHANGE %BLOCK3:>temp;AT CHANGE sort:%BLOCK3:>temp;AT CHANGE %BLOCK:>temp;AT CHANGE %CU:>sort:>%BLOCK3:>temp;AT CHANGE "MVSID.SORTSUB.C":>sort:>%BLOCK3:>temp;AT CHANGE "SORTMOD"::>"MVSID.SORTSUB.C":>sort:>%BLOCK3:>temp;
The %BLOCK and %BLOCK3 variables in this example assume the program wascompiled with the ISD compiler option. If the example was compiled with theDWARF compiler option, enter the DESCRIBE PROGRAM command to determine thecorrect %BLOCK variables.
Changing the point of view in Cv Qualify to the second nested block in the function sort() in sort.
SET QUALIFY BLOCK %BLOCK2;
You can do this in a number of other ways, including:QUALIFY BLOCK sort:>%BLOCK2;
Once the point of view changes, z/OS Debugger has access to objects accessiblefrom this point of view. You can specify these objects in commands withoutqualifiers, as in:j = 3;temp = 4;
v Qualify to the function main in the load module MAINMOD in the compilationunit MVSID.SORTMAIN.C and list the entries of table.QUALIFY BLOCK "MAINMOD"::>"MVSID.SORTMAIN.C":>main;LIST table[i];
Chapter 33. Debugging C and C++ programs 341

Stepping through C++ programsYou can step through methods as objects are constructed and destructed. Inaddition, you can step through static constructors and destructors. These aremethods of objects that are executed before and after main() respectively.
If you are debugging a program that calls a function that resides in a header file,the cursor moves to the applicable header file. You can then view the functionsource as you step through it. Once the function returns, debugging continues atthe line following the original function call.
You can step around a header file function by issuing the STEP OVER command.This is useful in stepping over Library functions (for example, string functionsdefined in string.h) that you cannot debug anyway.
Setting breakpoints in C++The differences between setting breakpoints in C++ and C are described below.
Setting breakpoints in C++ using AT ENTRY/EXITAT ENTRY/EXIT sets a breakpoint in the specified block. You can set a breakpoint onmethods, methods within nested classes, templates, and overloaded operators. Anexample is given for each below.
A block identifier can be quite long, especially with templates, nested classes, orclass with many levels of inheritance. In fact, it might not even be obvious at firstas to the block name for a particular function. To set a breakpoint for thesenontrivial blocks can be quite cumbersome. Therefore, it is recommended that youmake use of DESCRIBE CU and retrieve the block identifier from the session log.
When you do a DESCRIBE CU, the methods are always shown qualified by theirclass. If a method is unique, you can set a breakpoint by using just the methodname. Otherwise, you must qualify the method with its class name. The followingtwo examples are equivalent:AT ENTRY method()
AT ENTRY classname::method()
The following examples are valid:
AT ENTRY square(int,int) 'simple' method squareAT ENTRY shapes::square(int) Method square qualified by its class
shapes.AT EXIT outer::inner::func() Nested classes. Outer and inner are
classes. func() is within class inner.AT EXIT Stack<int,5>::Stack() Templates.AT ENTRY Plus::operator++(int) Overloaded operator.AT ENTRY ::fail() Functions defined at file scope must
be referenced by the global scopeoperator ::
The following examples are invalid:
342 IBM z/OS Debugger V14.1.9 User's Guide

AT ENTRY shapes Where shapes is a class. Cannot setbreakpoint on a class. (There is noblock identifier for a class.)
AT ENTRY shapes::square Invalid since method square mustbe followed by its parameter list.
AT ENTRY shapes:>square(int) Invalid since shapes is a class name,not a block name.
Setting breakpoints in C++ using AT CALLAT CALL gives z/OS Debugger control when the application code attempts to callthe specified entry point. The entry name must be a fully qualified name. That is,the name shown in DESCRIBE CU must be used. Using the exampleAT ENTRY shapes::square(int)
to set a breakpoint on the method square, you must enter:AT CALL shapes::square(int)
even if square is uniquely identified.
Refer to the following topics for more information related to the material discussedin this topic.
Related tasks“Composing commands from lines in the Log and Source windows” on page178
Examining C++ objectsWhen displaying an C++ object, only the local member variables are shown.Access types (public, private, protected) are not distinguished among the variables.The member functions are not displayed. If you want to see their attributes, youcan display them individually, but not in the context of a class. When displaying aderived class, the base class within it is shown as type class and will not beexpanded.
Refer to the following topics for more information related to the material discussedin this topic.
Related tasks“Example: displaying attributes of C++ objects”
Example: displaying attributes of C++ objectsThe examples below use the following definitions.class shape { ... };
class line : public shape {member variables of class line...
}
line edge;
Displaying object attributes of C++ objectsTo describe the attributes of the object edge, enter the following command.DESCRIBE ATTRIBUTES edge;
The Log window displays the following output.
Chapter 33. Debugging C and C++ programs 343

DESCRIBE ATTRIBUTES edge;ATTRIBUTES for edge
Its address is yyyyyyyy and its length is xxclass line
class shapemember variables of class shape....
Note that the base class is shown as class shape _shape.
Displaying class attributes in C++To display the attributes of class shape, enter the following command.DESCRIBE ATTRIBUTES class shape;
The Log window displays the following output.DESCRIBE ATTRIBUTES class shape ;ATTRIBUTES for class shapeconst class shape...
Displaying static data in C++If a class contains static data, the static data will be shown as part of the classwhen displayed. For example:class A {
int x;static int y;
}
A obj;
You can also display the static member by referencing it as A::y since each objectof class A has the same value.
Displaying global data in C++To avoid ambiguity, variables declared at file scope can be referenced using theglobal scope operator ::. For example:int x;class A {
int x;...}
}
If you are within a member function of A and want to display the value of x at filescope, enter LIST ::x. If you do not use ::, entering LIST x will display the valueof x for the current object (i.e., this–>x).
Monitoring storage in C++You might find it useful to monitor registers (general-purpose and floating-point)while stepping through your code and assembly listing by using the LISTREGISTERS command. The compiler listing displays the pseudo assembly code,including z/OS Debugger hooks. You can watch the hooks that you stop on andwatch expected changes in register values step by step in accordance with thepseudo assembly instructions between the hooks. You can also modify the value ofmachine registers while stepping through your code.
You can list the contents of storage in various ways. Using the LIST REGISTERScommand, you can receive a list of the contents of the General Purpose Registersor the floating-point registers.
344 IBM z/OS Debugger V14.1.9 User's Guide

You can also monitor the contents of storage by specifying a dump-format displayof storage. To accomplish this, use the LIST STORAGE command. You can specify theaddress of the storage that you want to view, as well as the number of bytes.
Example: monitoring and modifying registers and storage in CThe examples below use the following C program to demonstrate how to monitorand modify registers and storage.int dbl(int j) /* line 1 */{ /* line 2 */
return 2*j; /* line 3 */} /* line 4 */int main(void){
int i;i = 10;return dbl(i);
}
If you compile the program above using the compiler options TEST(ALL),LIST, thenyour pseudo assembly listing will be similar to the listing shown below.* int dbl(int j)
ST r1,152(,r13)* {
EX r0,HOOK..PGM-ENTRY* return 2*j;
EX r0,HOOK..STMTL r15,152(,r13)L r15,0(,r15)SLL r15,1B @5L2DC A@5L2-ep)NOPR
@5L1 DS 0D* }@5L2 DS 0D
EX r0,HOOK..PGM-EXIT
To display a continuously updated view of the registers in the Monitor window,enter the following command:MONITOR LIST REGISTERS
After a few steps, z/OS Debugger halts on line 1 (the program entry hook, shownin the listing above). Another STEP takes you to line 3, and halts on the statementhook. The next STEP takes you to line 4, and halts on the program exit hook. Asindicated by the pseudo assembly listing, only register 15 has changed during thisSTEP, and it contains the return value of the function. In the Monitor window,register 15 now has the value 0x00000014 (decimal 20), as expected.
You can change the value from 20 to 8 just before returning from dbl() by issuingthe command:%GPR15 = 8 ;
Chapter 33. Debugging C and C++ programs 345

346 IBM z/OS Debugger V14.1.9 User's Guide

Chapter 34. Debugging an assembler program
To debug programs that have been assembled with debug information, you canuse most of the z/OS Debugger commands. Any exceptions are noted in IBM z/OSDebugger Reference and Messages. Before debugging an assembler program, prepareyour program as described in Chapter 7, “Preparing an assembler program,” onpage 77.
The SET ASSEMBLER and SET DISASSEMBLY commandsThe SET ASSEMBLER ON and SET DISASSEMBLY ON commands enable some of thesame functions. However, you must consider which type of CUs that you will bedebugging (assembler, disassembly, or both) before deciding which command touse. The following guidelines can help you decide which command to use:v If you are debugging assembler CUs but no disassembly CUs, you might want
to use the SET ASSEMBLER ON command. If you need the following functions, usethe SET ASSEMBLER ON command:– Use the LIST, LIST NAMES CUS, or DESCRIBE CUS commands to see the name of
disassembly CUs.– Use AT APPEARANCE to stop z/OS Debugger when the disassembly CU is
loaded.
If you don't need any of these functions, you don't need to use either command.v If you are debugging a disassembly CU, you must use the SET DISASSEMBLY ON
command so that you can see the disassembly view of the disassembly CUs. TheSET DISASSEMBLY ON command enables the functions enabled by SET ASSEMBLERON and also enables the following functions that are not available through theSET ASSEMBLER ON command:– View the disassembled listing in the Source window.– Use the STEP INTO command to enter the disassembly CU.– Use the AT ENTRY * command to stop at the entry point of disassembly CUs.
If you are debugging an assembler CU and later decide you want to debug adisassembly CU, you can enter the SET DISASSEMBLY ON command after you enterthe SET ASSEMBLER ON command.
Loading an assembler program's debug informationUse the LOADDEBUGDATA (or LDD) command to indicate to z/OS Debugger that acompile unit is an assembler compile unit and to load the debug informationassociated with that compile unit. The LDD command can be issued only forcompile units which have no debug information and are, therefore, considereddisassembly compile units. In the following example, mypgm is the compile unit(CSECT) name of an assembler program:LDD mypgm
z/OS Debugger locates the debug information in a data set with the followingname: yourid.EQALANGX(mypgm). If z/OS Debugger finds this data set, you canbegin to debug your assembler program. Otherwise, enter the SET SOURCE or SETDEFAULT LISTINGS command to indicate to z/OS Debugger where to find the
© Copyright IBM Corp. 1992, 2019 347

debug information. In remote debug mode, the remote debugger prompts you forthe data set information when the program is stepped into.
Normally, compile units without debug information are not listed when you enterthe DESCRIBE CUS or LIST NAMES CUS commands. To include these compile units,enter the SET ASSEMBLER ON command. The next time you enter the DESCRIBE CUSor LIST NAMES CUS command, these compile units are listed.
z/OS Debugger session panel while debugging an assembler programThe z/OS Debugger session panel below shows the information displayed in theSource window while you debug an assembler program.
Assemble LOCATION: PUBS :> 34Command ===> Scroll ===> CSRMONITOR --+----1----+----2----+----3----+----4----+----5----+----6----+----7----+----8----+----9----+---10----+--- LINE: 0 OF 0******************************************************* TOP OF MONITOR ************************************************************************************************************** BOTTOM OF MONITOR ******************************************************
SOURCE: PUBS +----1----+----2----+----3----+----4----+----5----+----6----+----7----+----8----+----9----+---10-- LINE: 60 OF 513
▌1▐34▌2▐ ▌3▐ * ▌7▐ .34 00000078 OPENIT EQU * .34 00000078 + OPEN ((2),INPUT) .34 ▌4▐ + CNOP 0,4 ALIGN LIST TO FULLWORD .34 00000078 4510 B080 + BAL 1,*+8 LOAD REG1 W/LIST ADDR. @L2A .35 0000007C + DC A(0) OPT BYTE AND DCB ADDR. .36 00000080 5021 0000 + ST 2,0(1,0) STORE INTO LIST @L1C. .37 00000084 9280 1000 + MVI 0(1),128 MOVE IN OPTION BYTE .38 00000088 0A13 + SVC 19 ISSUE OPEN SVC .39 ▌5▐▌6▐ CALL CEEMOUT,(STRING,DEST,0),VL Omitted feedback code .39 + SYSSTATE TEST @L3A .39 + CNOP 0,4 .
LOG 0----+----1----+----2----+----3----+----4----+----5----+----6----+----7----+----8----+----9----+---10----+---1 LINE: 1 OF 9********************************************************* TOP OF LOG **********************************************************IBM z/OS Debugger Version 14 Release 1 Mod 008/22/2017 08:52:00 AM Level: V14R15724-T07: Copyright IBM Corp. 1992, 20170004 EQA1872E An error occurred while opening file: INSPPREF. The file may not exist, or is not accessible.0005 Source or Listing data is not available, or the CU was not compiled with the correct compile options.0006 LDD PUBS ;0007 SET DEFAULT SCROLL CSR ;0008 AT 34 ;0009 GO ;******************************************************** BOTTOM OF LOG ********************************************************PF 1:? 2:STEP 3:QUIT 4:LIST 5:FIND 6:AT/CLEARPF 7:UP 8:DOWN 9:GO 10:ZOOM 11:ZOOM LOG 12:RETRIEVE
The information displayed in the Source window is similar to the listing generatedby the assembler. The Source window displays the following information:
▌1▐ statement numberThe statement number is a number assigned by the EQALANGX program.Use this column to set breakpoints and identify statements.
The same statement number can sometimes be assigned to more than oneline. Comments, labels and macro invocations are assigned the samestatement number as the machine instruction that follows these statements.All of these statements have the same offset within the CSECT, whichallows you to put the cursor on any of these lines and press PF6 to set abreakpoint. When the statement is reached, the focus is set on the last linewithin the statement that contains either a macro invocation or a machineinstruction.
▌2▐ An asterisk in the column preceding the offset indicates that the line iscontained in a compile unit to which you are not currently qualified.Before you attempt to set a line or statement breakpoint on that a line, youmust enter the SET QUALIFY CU compile_unit and specify the name of thecontaining compile unit for the compile_unit parameter.
348 IBM z/OS Debugger V14.1.9 User's Guide

▌3▐ offsetThe offset from the start of the CSECT. This column matches the left-mostcolumn in the assembler listing.
▌4▐ objectThe object code for instructions. This column matches the "Object Code"column in the assembler listing. Object code for data fields is notdisplayed.
▌5▐ modified instructionAn "X" in this column indicates an executable instruction that is modifiedby the program at some point. You cannot set a breakpoint on such aninstruction nor can you STEP into such an instruction.
▌6▐ macro generatedA "+" in this column indicates that the line is generated by macroexpansion. Lines generated by macro expansion appear only in thestandard view. These lines are suppressed when the NOMACGEN view isin effect.
▌7▐ source statementThe original source statement. This column corresponds to the "SourceStatement" column in the assembler listing.
Refer to the following topics for more information related to the material discussedin this topic.
Related referencesIBM z/OS Debugger Reference and Messages
%PATHCODE values for assembler programsThis table shows the possible values for the z/OS Debugger %PATHCODEvariable when the current programming language is Assembler:
%PATHCODE Entry type Instruction Additionalrequirements orcomments
1 A block has beenentered.
Any External symbolwhose offsetcorresponds to aninstruction
2 A block is about tobe exited.
BR R14(07FE)
BALR R14,R15(05EF)
These instructions areconsidered an Exitonly if thisinstruction is notfollowed by an validinstruction.
BASR R14,R15(0DEF)
BASSM R14,R15(0CEF)
BCR 15,x(07Fx)
3 Control has reached alabel coded in theprogram.
Any Label whose offsetcorresponds to aninstruction.
Chapter 34. Debugging an assembler program 349

%PATHCODE Entry type Instruction Additionalrequirements orcomments
4 Control is beingtransferred as a resultof a CALL.
BALR R14,R15(05EF)
BASR R14,R15(0DEF)
BASSM R14,R15(0CEF)
SVC (0A)
PC (B218)
BAL (45) Except BAL 1,xxx isnot considered aCALL
BAS (4D)
BALR x,y(05)
BASR x,y(0D)
BASSM x,y(0C)
BRAS (A7x5)
BRASL (C0x5)
5 Control is returningfrom a CALL.
Statement afterCALL
If the statement aftera CALL is aninstruction, it gets anentry here.
6 A conditional branchis about to beexecuted.
BC x (47x) x^=15 & X^=0
BCR x (07x) x^=15 & X^=0
BCT (46)
BCTR (06)
BCTGR (B946)
BXH (86)
BXHG (EB44)
BXLE (87)
BXLEG (EB45)
BRC x (A7x4) x^=15 & X^=0
BRCL (C0x4)
BRCT (A7x6)
BRCTG (A7x7)
BRXH (84)
BRXHG (EC44)
BRXLE (85)
BRXLG (EC45)
350 IBM z/OS Debugger V14.1.9 User's Guide

%PATHCODE Entry type Instruction Additionalrequirements orcomments
7 A conditional branchwas not executed andcontrol has"fallen-through" tothe next instruction.
Statement afterConditional Branch
8 An unconditionalbranch is about to beexecuted.
BC 15,x(47Fx)
BRC 15,x(A7F4)
BRCL 15,x(C0F4)
BSM (0B)
Using the STANDARD and NOMACGEN viewThe information displayed in the Source window for an assembler program can beviewed in either of two views. The STANDARD view shows all lines in theassembler listing including lines generated through macro expansion. TheNOMACGEN view omits lines generated by macro expansion and, therefore, issimilar to the assembler listing generated when PRINT NOGEN is in effect.
You can use the following commands to control the view that you see in theSource window for an assembler program:v SET DEFAULT VIEW is used to indicate the initial view that you see. The
setting that is in effect for SET DEFAULT VIEW when you enter theLOADDEBUGDATA (LDD) command for an assembler program determines theinitial view for that program.
v QUERY DEFAULT VIEW can be used to see the current setting of SETDEFAULT VIEW.
v QUERY CURRENT VIEW can be used to determine the view in effect for thecurrently qualified CU.
Debugging non-reentrant assemblerWhen a load module is marked as non-reentrant and loaded multiple timeswithout a corresponding delete, multiple copies of the load module exist inmemory at the same time. Because high level language programs are typicallymarked as reentrant by default, debugging non-reentrant programs primarilyapplies to the debugging of assembler programs. The following situations have thespecial considerations described in the following sections when debuggingnon-reentrant assembler programs:v Manipulating breakpointsv Manipulating local variables
The following descriptions apply only to full screen mode and line modedebugging. There are no corresponding features for supporting debugging ofnon-reentrant assembler when using the remote debugger.
Chapter 34. Debugging an assembler program 351

Manipulating breakpoints in non-reentrant assembler loadmodules
When you manipulate breakpoints in a compile unit in a non-reentrant loadmodule by using one of the following commands, the command applies to allcopies of the compile unit in load modules with the same name:v AT
v DISABLE AT
v ENABLE AT
v LIST AT
v CLEAR AT
v SET SAVE BPS
v SET RESTORE BPS
Manipulating local variables in non-reentrant assembler loadmodules
If you want refer to a local variable that is in a compile unit in a non-reentrantload module and multiple copies of that load module exist in memory, you mustidentify the copy of the compile unit to which you want the command to apply. Toidentify the copy of the compile unit, you must first obtain an address in thespecific compile unit. The following list describes some ways you can obtain anaddress in a specific compile unit:v Inspect a variable or register in the calling program for the address of the
specific compile unit.v Enter the QUERY LOCATION command to obtain the address of the specific compile
unit.v Enter the DESCRIBE CU command to see a list of addresses for each compile unit.
Then, enter the QUALIFY command with each address until you find the specificcompile unit.
After you obtain the address, enter the SET QUALIFY address; command, whereaddress is an address in the specific compile unit you identified.
Restrictions for debugging an assembler programWhen you debug assembler programs the following general restrictions apply:v Only application programs are supported. No support is provided for debugging
system routines, authorized programs, CICS exits, and so on.v Debugging of Private Code (also known as an unnamed CSECT or blank
CSECT) is not supported.v To debug subtasks that are started by the ATTACH macro, delay debug mode
must be in effect. Subtasks that are started by the ATTACH macro can bedebugged in one of the following circumstances:– If the main task starts in a non-Language Environment program, the task
must be started by calling EQANMDBG and supplying the TEST option. Formore information, see “Starting z/OS Debugger for programs that startoutside of Language Environment” on page 147.
– If the main task starts in a Language Environment program, or if a LanguageEnvironment program is the first program to be debugged, you must specifythe TEST run time option (for example, via a CEEOPTS DD statement).
352 IBM z/OS Debugger V14.1.9 User's Guide

For more information, see “Debugging subtasks created by the ATTACHassembler macro” on page 437.
v You cannot debug programs that do not use standard linkage conventions forregisters 13, 14, and 15 or that use the Linkage Stack. Not using standard linkageconventions or the Linkage Stack can cause the following commands to functionincorrectly:– LIST CALLS
– STEP RETURN
– STEP (when stopped at a return instruction)– %EPA
v Debugging of programs that use the MVS XCTL SVC is not supported.v Debugging of the 64-bit Language Environment-enabled and Language
Environment XPLINK programs is not supported.v CICS does not support 64-bit programs interfacing to CICS services; therefore,
z/OS Debugger does not support debugging of 64-bit programs under CICS.v Support for binary and decimal floating-point items requires 64-bit hardware
and Decimal Floating Point hardware (for decimal floating point support).v If your current hardware does not support 64-bit instructions or your program is
suspended at a point where the 64-bit General Purpose Registers are notavailable, the 64-bit General Purpose Registers are not available and anyreference to symbols for the 64-bit General Purpose Registers are treated asundefined.
v The 64-bit General Purpose Registers are available only in the compile unit inwhich z/OS Debugger is stopped at a breakpoint. If you use the QUALIFYcommand to qualify to a compile unit higher in the calling sequence, the 64-bitGeneral Purpose Registers are not accessible.
v When your program is suspended in a compile unit, that compile unit is theonly one from which you can access the 64-bit General Purpose Registers. If youuse the QUALIFY command to qualify to a different compile unit, you can nolonger access the 64-bit General Purpose Registers.
v Debugging of programs that use Access Register mode is not supported.v Debugging of programs that use the IDENTIFY macro or service is not
supported.v You cannot debug programs that were assembled with features that depend on
the GOFF option, for example, CSECT names longer than eight characters. If theprogram can assemble correctly without the GOFF option, then you can debugprograms that are assembled with the GOFF option.
v If you are debugging a program that uses ESTAE or ESTAEX, the programbehaves as if TRAP(OFF) were specified for all Abends while the ESTAE orESTAEX is active, except program checks. In other words, no condition is seenby z/OS Debugger. Any Abends except program checks are handled by theESTAE(X) exit in your program.
v If you are debugging a program that uses SPIE or ESPIE, the program behavesas if TRAP(OFF) were specified for all program checks while the SPIE or ESPIE isactive, except a program check that might arise from the use of the CALL z/OSDebugger command.
v The debugging of TSO Command Processors is not supported.v If you start debugging in a non-CICS load module that is not the "top" load
module, you cannot continue debugging after that load module returns to itscaller. In order to do this, you must invoke z/OS Debugger using CEEUOPT orsome other internal method. You cannot do this by using JCL alone.
Chapter 34. Debugging an assembler program 353
v Debugging of assembler or disassembly code requires the use of the DynamicDebug Facility. z/OS Debugger does not support the use of the Dynamic DebugFacility to debug code that is not known to the z/OS Contents Supervisor. Thiscan occur in situations similar to the following situations:– Debugging load modules loaded by a directed LOAD.– Debugging segments of code which have been relocated. For example, a
GETMAIN is used to obtain a new piece of storage. Then a section of code ismoved into this new piece of storage and control is passed to it for execution.
Restrictions for debugging a Language Environmentassembler MAIN program
When you debug a Language Environment-enabled assembler main program, thefollowing restrictions apply:v If z/OS Debugger is positioned at the entry point to the assembler main
program and you enter a STEP command, the STEP command stops at theinstruction that is after the prologue BALR instruction that initializes LanguageEnvironment. You cannot step through the portion of the prologue that is beforethe completion of Language Environment initialization.
v If you set a breakpoint in the prologue before the completion of LanguageEnvironment initialization, the breakpoint is accepted. However, z/OS Debuggerdoes not stop or gain control at this breakpoint.
To debug a Language Environment-conforming assembler MAIN program runningunder CICS, you must run with CICS Transaction Server, Version 3.1 or later.
Restrictions on setting breakpoints in the prologue ofLanguage Environment assembler programs
The following restrictions apply when you attempt to set explicit or implicitbreakpoints in the prologue of a Language Environment assembler program:v If you try to step across the portion of the prologue code that is between the
point where the stack extend routine is called and the LR 13,x instruction thatloads the address of the new DSA into register 13, the STEP command stops atthe instruction immediately following the LR 13,x instruction.
v If you try to set a breakpoint in the portion of the prologue code between thepoint where the stack extend routine is called and the LR 13,x instruction thatloads the address of the new DSA into register 13, z/OS Debugger will not setthe breakpoint.
Restrictions for debugging non-Language Environmentprograms
If you specify the TEST runtime option with the NOPROMPT suboption when you startyour program and z/OS Debugger is subsequently started by CALL CEETEST or theraising of a Language Environment condition, you can debug both LanguageEnvironment and non-Language Environment programs and detect both LanguageEnvironment and non-Language Environment events in the enclave that startedz/OS Debugger and in subsequent enclaves. You cannot debug non-LanguageEnvironment programs or detect non-Language Environment events in higher-levelenclaves. After control has returned from the enclave in which z/OS Debugger wasstarted, you can no longer debug non-Language Environment programs or detectnon-Language Environment events.
354 IBM z/OS Debugger V14.1.9 User's Guide

Restrictions for debugging assembler code that usesinstructions as data
z/OS Debugger cannot debug code that uses instructions as data. If your programreferences one or more instructions as data, the result can be unpredictable,including an abnormal termination (ABEND) of z/OS Debugger. This is becausez/OS Debugger sometimes replaces instructions with SVCs in order to createbreakpoints.
For example, z/OS Debugger cannot process the following code correctly:Entry1 BRAS 15,0
NOPR 0B Common
Entry2 BRAS 15,0NOPR 4
Common DS 0HIC 15,1(15)
In this code, the IC is used to examine the second byte of the NOPR instructions.However, if the NOPR instructions are replaced by an SVC to create a breakpoint,a value that is neither 0 nor 4 might be obtained, which causes unexpected resultsin the user program.
You can use the following coding techniques can be used to eliminate thisproblem:v Method 1: Change the code to reference constants instead of instructions.v Method 2: Define the referenced instructions by using DC instructions instead of
executable instructions.
Using Method 1, you can change the above example to the following code:Entry1 BAL 15,*+L’*+2
DC H’0’B Common
Entry2 BAL 15,*+L’*+2DC H’4’
Common DS 0HIC 15,1(15)
Using Method 2, you can change the above example to the following code:Entry1 BRAS 15,0
DC X’0700’B Common
Entry2 BRAS 15,0DC X’0704’
Common DS 0HIC 15,1(15)
Restrictions for debugging self-modifying assembler codez/OS Debugger defines two types of self-modifying code: detectable andnon-detectable. Detectable self-modifying code is code that either:v Modifies an instruction via a direct reference to a label on the instruction or on
an EQU * or DS 0H immediately preceding the instruction. For example:Inst1 NOP Label1
MVI Inst1+1,X’F0’
v Uses the EQAMODIN macro instruction to identify the instruction beingmodified. For example:
Chapter 34. Debugging an assembler program 355

EQAModIn Inst1Inst1 NOP Label1
LA R3,Inst1MVI 0(R3),X’F0’
Any self-modifying code that does not meet one of these criteria is classified asnon-detectable.
Handling of detectable self-modifying assembler codeWhen z/OS Debugger identifies detectable, self-modifying code, it indicates thesituation in the Source window by putting an "X" in the column immediatelybefore the column indicating a macro-generated instruction. A breakpoint cannotbe set on such an instruction nor will STEP stop on such an instruction.
The EQAMODIN macro in shipped in the z/OS Debugger sample library(hlq.SEQASAMP). This macro can be used to make non-detectable, self-modifyingcode detectable. It generates no executable code. Instead it simply addsinformation to the SYSADATA file to identify the specified operand as modified.The operand can be specified either as a label name or as "*" to indicate that theimmediately following instruction is modified.
Non-detectable self-modifying assembler codeIf your program contains non-detectable, self-modifying code that modifies aninstruction while the containing compilation unit is being debugged, the result canbe unpredictable, including an abnormal termination (ABEND) of z/OS Debugger.If your program contains self-modifying code that completely replaces aninstruction while the containing compilation unit is being debugged and you donot step through the code that modifies the instruction, the result might not be anABEND. However, z/OS Debugger might miss a breakpoint on that instruction ordisplay a message indicating an invalid hook address at delete. If you do stepthrough the code that modifies the instruction, the instruction that is moved maycontain a breakpoint causing a z/OS Debugger failure when the modifiedinstruction is executed.
The following coding techniques can be used to minimize problems debuggingnon-detectable, self-modifying code:v Define instructions to be modified by using DC instructions instead of
executable instructions. For example, use the instruction ModInst DCX’4700’,S(Target) instead of the instruction BC 0,Target.
Code that modifies an instruction definedby an instruction op-code
Code that modifies an instruction definedby a DC
ModInst BC 0,Target...MVI ModInst+1,X’F0’
ModInst DC X’4700’,S(Target)...MVI ModInst+1,X’F0’
v Do not modify part of an instruction. Instead, replace an instruction with onethat is generated with a DC or marked as modified by use of the EQAMODINmacro. The following table compares coding techniques:
356 IBM z/OS Debugger V14.1.9 User's Guide

Code that modifies an instruction Corresponding code that replaces aninstruction with one defined by a DC
ModInst BC 0,Target...MVI ModInst+1,X’F0’
ModInst BC 0,Target...MVC ModInst(4),NewInst...
NewInst DC X’47F0’,S(Target)
Code that modifies an instruction Corresponding code that replaces aninstruction marked by EQAMODIN
ModInst BC 0,Target...MVI ModInst+1,X’F0’
ModInst BC 0,Target...MVC ModInst(4),NewInst...EQAMODIN NewInst
NewInst BC 15,Target
Restrictions for debugging assembler programs that consistof multiple sections
When your assembler program consists of multiple sections, indicate that debuginformation should be loaded for all sections by using command SET LDD ALLbefore using the LDD command.
For more information, see “Multiple compilation units in a single assembly” onpage 271.
If the debug information is not loaded for all sections in the compile unit (CU), theresult can be unpredictable, and an abnormal termination (ABEND) might occur.
In the following example, the EX instruction and its target are coded in separateCSECTs of the program:A CSECT
L 15,B$BASEBASR 14,15
B CSECTLA 5,8EX 5,MVCBR 14
A CSECTB$BASE DC A(B)MVC MVC TO(0),FROMTO DC CL9’123456789’FROM DC CL9’987654321’
If the debug information is loaded for CSECT A that contains the target of the EXinstruction, but not loaded for CSECT B that contains the EX instruction, the EXinstruction will abend immediately after the STEP command is performed on theBASR 14,15 instruction.
Chapter 34. Debugging an assembler program 357

358 IBM z/OS Debugger V14.1.9 User's Guide

Chapter 35. Debugging a disassembled program
To debug programs that have been compiled or assembled without debuginformation, you can use the disassembly view. When you use the disassemblyview, symbolic information from the original source program (program variables,labels, and other symbolic references to a section of memory ) is not available. TheDYNDEBUG switch must be ON before you use the disassembly view.
If you are not familiar with the program that you are debugging, we recommendthat you have a copy of the listing that was created by the compiler or High LevelAssembler (HLASM) available while you debug the program. There are no specialassembly or compile requirements that the program must comply with to use thedisassembly view.
The SET ASSEMBLER and SET DISASSEMBLY commandsThe SET ASSEMBLER ON and SET DISASSEMBLY ON commands enable some of thesame functions. However, you must consider which type of CUs that you will bedebugging (assembler, disassembly, or both) before deciding which command touse. The following guidelines can help you decide which command to use:v If you are debugging assembler CUs but no disassembly CUs, you might want
to use the SET ASSEMBLER ON command. If you need the following functions, usethe SET ASSEMBLER ON command:– Use the LIST, LIST NAMES CUS, or DESCRIBE CUS commands to see the name of
disassembly CUs.– Use AT APPEARANCE to stop z/OS Debugger when the disassembly CU is
loaded.
If you don't need any of these functions, you don't need to use either command.v If you are debugging a disassembly CU, you must use the SET DISASSEMBLY ON
command so that you can see the disassembly view of the disassembly CUs. TheSET DISASSEMBLY ON command enables the functions enabled by SET ASSEMBLERON and also enables the following functions that are not available through theSET ASSEMBLER ON command:– View the disassembled listing in the Source window.– Use the STEP INTO command to enter the disassembly CU.– Use the AT ENTRY * command to stop at the entry point of disassembly CUs.
If you are debugging an assembler CU and later decide you want to debug adisassembly CU, you can enter the SET DISASSEMBLY ON command after you enterthe SET ASSEMBLER ON command.
Capabilities of the disassembly viewWhen you use the disassembly view, you can do the following tasks:v Set breakpoints at the start of any assembler instruction.v Step through the disassembly instructions of your program.v Display and modify registers.v Display and modify storage.v Monitor General Purpose Registers or areas of main storage.
© Copyright IBM Corp. 1992, 2019 359

v Switch the debug view.v Use most z/OS Debugger commands.
Starting the disassembly viewTo start the disassembly view:1. Enter the SET DISASSEMBLY ON command2. Open the program that does not contain debug data. z/OS Debugger then
changes the language setting to Disassem and the Source window displays theassembler code.
If you enter a program that does contain debug data, the language setting does notchange and the Source window does not display disassembly code.
The disassembly viewWhen you debug a program through the disassembly view, the Source windowdisplays the disassembly instructions. The language area of the z/OS Debuggerscreen (upper left corner) displays the word Disassem. The z/OS Debugger screenappears as follows:
Disassem LOCATION: MAIN initializationCommand ===> Scroll ===> PAGEMONITOR --+----1----+----2----+----3----+----4----+----5----+----6 LINE: 0 OF 0******************************* TOP OF MONITOR ************************************************************** BOTTOM OF MONITOR ******************************
SOURCE: MAIN +----1----+----2----+----3----+----4----+----5----+ LINE: 1 OF 1600 1950C770 47F0 F014 BC 15,20(,R15) .
▌A▐4 1950C774 00C3 ???? .6 1950C776▌B▐ C5C5 ???? .8 1950C778 0000 ???? .A 1950C77A 0080▌C▐ ???? .C 1950C77C 0000 ???? .E 1950C77E 00C4 ????▌D▐ .10 1950C780 47F0 F001 BC 15,1(,R15) .14 1950C784 90EC D00C STM R14,R12,12(R13) .18 1950C788 18BF LR R11,R15 ▌E▐ .1A 1950C78A 5820 B130 L R2,304(,R11) .1E 1950C78E 58F0 B134 L R15,308(,R11) .22 1950C792 05EF BALR R14,R15 .24 1950C794 1821 LR R2,R1 .26 1950C796 58E0 C2F0 L R14,752(,R12) .2A 1950C79A 9680 E008 OI 8(R14),128 .2E 1950C79E 05B0 BALR R11,0 .
LOG 0----+----1----+----2----+----3----+----4----+----5----+----6- LINE: 1 OF 5********************************* TOP OF LOG **********************************IBM z/OS Debugger Version 14 Release 1 Mod 008/22/2017 08:52:00 AM Level: V14R15724-T07: Copyright IBM Corp. 1992, 20170004 EQA1872E An error occurred while opening file: INSPPREF. The file may not0005 exist, or is not accessible.0006 SET DISASSEMBLY ON ;PF 1:? 2:STEP 3:QUIT 4:LIST 5:FIND 6:AT/CLEARPF 7:UP 8:DOWN 9:GO 10:ZOOM 11:ZOOM LOG 12:RETRIEVE
▌A▐ Prefix AreaDisplays the offset from the start of the CU or CSECT.
▌B▐ Columns 1-8Displays the address of the machine instruction in memory.
360 IBM z/OS Debugger V14.1.9 User's Guide

▌C▐ Columns 13-26Displays the machine instruction in memory.
▌D▐ Columns 29-32Displays the op-code mnemonic or ???? if the op-code is not valid.
▌E▐ Columns 35-70Displays the disassembled machine instruction.
When you use the disassembly view, the disassembly instructions displayed in thesource area are not guaranteed to be accurate because it is not always possible todistinguish data from instructions. Because of the possible inaccuracies, werecommend that you have a copy of the listing that was created by the compiler orby HLASM. z/OS Debugger keeps the disassembly view as accurate as possible byrefreshing the Source window whenever it processes the machine code, forexample, after a STEP command.
Performing single-step operations in the disassembly viewUse the STEP command to single-step through your program. In the disassemblyview, you step from one disassembly instruction to the next. z/OS Debuggerhighlights the instruction that it runs next.
If you try to step back into the program that called your program, set a breakpointat the instruction to which you return in the calling program. If you try to stepover another program, set a breakpoint immediately after the instruction that callsanother program. When you try to step out of your program, z/OS Debuggerdisplays a warning message and lets you set the appropriate breakpoints. Thenyou can do the step.
z/OS Debugger refreshes the disassembly view whenever it determines that thedisassembly instructions that are displayed are no longer correct. This refresh canhappen while you are stepping through your program.
Setting breakpoints in the disassembly viewYou can use a special breakpoint when you debug your program through thedisassembly view. AT OFFSET sets a breakpoint at the point that is calculated fromthe start of the entry point address of the CSECT. You can set a breakpoint byentering the AT OFFSET command on the command line or by placing the cursor inthe prefix area of the line where you want to set a breakpoint and press the ATfunction key or type AT in the prefix area.
z/OS Debugger lets you set breakpoints anywhere within the starting and endingaddress range of the CU or CSECT provided that the address appears to be a validop-code and is an even number offset. To avoid setting breakpoints at the wrongoffset, we recommend that you verify the offset by referring to a copy of the listingthat was created by the compiler or by HLASM.
Restrictions for debugging self-modifying codez/OS Debugger cannot debug self-modifying code. If your program containsself-modifying code that modifies an instruction while the containing compilationunit is being debugged, the result can be unpredictable, including an abnormaltermination (ABEND) of z/OS Debugger. If your program contains self-modifyingcode that completely replaces an instruction while the containing compilation unit
Chapter 35. Debugging a disassembled program 361

is being debugged, the result might not be an ABEND. However, z/OS Debuggermight miss a breakpoint on that instruction or display a message indicating aninvalid hook address at delete.
The following coding techniques can be used to minimize problems debuggingself-modifying code:1. Do not modify part of an instruction. Instead, replace an instruction. The
following table compares coding techniques:
Coding that modifies an instructions Coding that replaces an instruction
ModInst BC 0,Target...MVI ModInst+1,X’F0’
ModInst BC 0,Target...MVC ModInst(4),NewInst...
NewInst BC 15,Target
2. Define instructions to be modified by using DC instructions instead ofexecutable instructions. For example, use the instruction ModInst DCX’4700’,S(Target) instead of the instruction MVC ModInst(4),NewInst.
Displaying and modifying registers in the disassembly viewYou can display the contents of all the registers by using the LIST REGISTERScommand. To display the contents of an individual register, use the LIST Rxcommand, where x is the individual register number. You can also display thecontents of an individual register by placing the cursor on the register and pressingthe LIST function key. The default LIST function key is PF4. You can modify thecontents of a register by using the assembler assignment statement.
Displaying and modifying storage in the disassembly viewYou can display the contents of storage by using the LIST STORAGE command. Youcan modify the contents of storage by using the STORAGE command.
You can also use assembler statements to display and modify storage. For example,to set the four bytes located by the address in register 2 to zero, enter the followingcommand:R2-> <4>=0
To verify that the four bytes are set to zero, enter the following command:LIST R2->
Changing the program displayed in the disassembly viewYou can use the SET QUALIFY command to change the program that is displayed inthe disassembly view. Suppose you are debugging program ABC and you need toset a breakpoint in program BCD.1. Enter the command SET QUALIFY CU BCD on the command line. z/OS Debugger
changes the Source window to display the disassembly instructions forprogram BCD.
2. Scroll through the Source window until you find the instruction where want toset a breakpoint.
3. To return to program ABC, at the point where the next instruction is to run,issue the SET QUALIFY RESET command.
362 IBM z/OS Debugger V14.1.9 User's Guide

Restrictions for the disassembly viewWhen you debug a disassembled program, the following restrictions apply:v Applications that use the Language Environment XPLINK linking convention
are not supported.v The Dynamic Debug facility must be activated before you start debugging
through the disassembly view.v Debugging of assembler or disassembly code requires the use of the Dynamic
Debug Facility. z/OS Debugger does not support the use of the Dynamic DebugFacility to debug code that is not known to the z/OS Contents Supervisor. Thiscan occur in situations similar to the following situations:– Debugging load modules loaded by a directed LOAD.– Debugging segments of code which have been relocated. For example, a
GETMAIN is used to obtain a new piece of storage. Then a section of code ismoved into this new piece of storage and control is passed to it for execution.
When you debug a program through the disassembly view, z/OS Debugger cannotstop the application in any of the following situations:v The program does not comply with the first three restrictions that are listed
above.v Between the following instructions:
– After the LE stack extend has been called in the prologue code, and– Before R13 has been set with a savearea or DSA address and the backward
pointer has been properly set.
The application runs until z/OS Debugger encounters a valid save area backchain.
Chapter 35. Debugging a disassembled program 363

364 IBM z/OS Debugger V14.1.9 User's Guide
Part 6. Debugging in different environments
© Copyright IBM Corp. 1992, 2019 365

366 IBM z/OS Debugger V14.1.9 User's Guide

Chapter 36. Debugging DB2 programs
While you debug a program containing SQL statements, remember the followingbehaviors:v The SQL preprocessor replaces all the SQL statements in the program with host
language code. The modified source output from the preprocessor contains theoriginal SQL statements in comment form. For this reason, the source or listingview displayed during a debugging session can look very different from theoriginal source.
v The host language code inserted by the SQL preprocessor starts the SQL accessmodule for your program. You can halt program execution at each call to a SQLmodule and immediately following each call to a SQL module, but the calledmodules cannot be debugged.
v A host language SQL coprocessor performs DB2 precompiler functions atcompile time and replaces the SQL statements in the program with hostlanguage code. However, the generated host language code is not displayedduring a debug session; the original source code is displayed.
The topics below describe the steps you need to follow to use z/OS Debugger todebug your DB2 programs.v Chapter 8, “Preparing a DB2 program,” on page 81v “Processing SQL statements” on page 81v “Linking DB2 programs for debugging” on page 83v “Binding DB2 programs for debugging” on page 84v “Debugging DB2 programs in batch mode”v “Debugging DB2 programs in full-screen mode” on page 368
Refer to the following topics for more information related to the material discussedin this topic.
Related tasksChapter 8, “Preparing a DB2 program,” on page 81DB2 UDB for z/OS Application Programming and SQL Guide
Debugging DB2 programs in batch modeIn order to debug your program with z/OS Debugger while in batch mode, followthese steps:1. Make sure the z/OS Debugger modules are available, either by STEPLIB or
through the LINKLIB.2. Provide all the data set definitions in the form of DD statements (example: Log,
Preference, list, and so on).3. Specify your debug commands in the command input file.4. Run your program through the TSO batch facility.
Refer to the following topics for more information related to the material discussedin this topic.
Related tasksChapter 8, “Preparing a DB2 program,” on page 81
© Copyright IBM Corp. 1992, 2019 367

Debugging DB2 programs in full-screen modeIn full-screen mode, you can decide at debug time what debugging commands youwant issued during the test.
Using z/OS Debugger Setup Utility (DTSU)
The z/OS Debugger Setup Utility is available through IBM z/OS DebuggerUtilities.1. Start DTSU by using the TSO command or the ISPF panel option, if available.
Contact your system administrator to determine if the ISPF panel option isavailable.
2. Create a setup file. Remember to select the Initialize New setup file for DB2field.
3. Enter appropriate information for all the fields. Remember to enter the propercommands in the DSN command options and the RUN command optionsfields.
4. Enter the RUN command to run the DB2 program.
Using TSO commands
1. Ensure that either you or your system programmer has allocated all therequired data sets through a CLIST or REXX EXEC.
2. Issue the DSN command to start DB2.3. Issue the RUN subcommand to execute your program. You can specify the TEST
runtime option as a parameter on the RUN subcommand. The following examplestarts a COBOL program:RUN PROG(progname) PLAN(planname) LIB(’user.library’)
PARMS(’/TEST(,*,;,*)’)
The following example starts a non-Language Environment COBOL program:RUN PROG(EQANMDBG) PLAN(planname) LIB(’user.library’)
PARMS(’progname,/TEST(,*,;,*)’)
Using TSO/Call Access Facility (CAF)
1. Link-edit the CAF language interface module DSNALI with your program.2. Ensure that the data sets required by z/OS Debugger and your program have
been allocated through a CLIST or REXX procedure.3. Enter the TSO CALL command CALL ’user.library(name of your program)’, to
start your program. Include the TEST run-time option as a parameter in thiscommand.
In full-screen mode using a dedicated terminal without Terminal InterfaceManager
1. Specify the MFI%LU_name parameter as part of the TEST runtime option.2. Follow the other requirements for debugging DB2 programs either under TSO
or in batch mode.
In full-screen mode using the Terminal Interface Manager
1. Specify the VTAM%userid parameter as part of the TEST runtime option.2. Follow the other requirements for debugging DB2 programs either under TSO
or in batch mode.
368 IBM z/OS Debugger V14.1.9 User's Guide
After your program has been initiated, debug your program by issuing therequired z/OS Debugger commands.
Note: If your source does not come up in z/OS Debugger when you launch it,check that the listing or source file name corresponds to the MVS library name,and that you have at least read access to that MVS library.
Refer to the following topics for more information related to the material discussedin this topic.
Related tasksChapter 8, “Preparing a DB2 program,” on page 81“Starting z/OS Debugger for programs that start outside of LanguageEnvironment” on page 147Related referencesDB2 UDB for z/OS Administration Guide
Chapter 36. Debugging DB2 programs 369

370 IBM z/OS Debugger V14.1.9 User's Guide

Chapter 37. Debugging DB2 stored procedures
A DB2 stored procedure is a compiled high-level language (HLL) program that canrun SQL statements. z/OS Debugger can debug any stored procedure written inassembler (if the program type is MAIN), C, C++, COBOL, and PL/I in any of thefollowing debugging modes:v remote debug modev full-screen mode using the Terminal Interface Managerv batch mode
Before you begin, verify that you have completed all the tasks described inChapter 9, “Preparing a DB2 stored procedures program,” on page 85. Theprogram resides in an address space that is separate from the calling program. Thestored procedure can be called by another application or a tool such as the IBMDB2 Development Center.
Refer to the following topics for more information related to the material discussedin this topic.
Related tasksChapter 9, “Preparing a DB2 stored procedures program,” on page 85“Resolving some common problems while debugging DB2 stored procedures”Related referencesDB2 Application Programming and SQL Guide
Resolving some common problems while debugging DB2 storedprocedures
This topic describes the messages you might receive and resolution to the problemdescribed by those messages. This topic covers common problems.
Table 21. Common problems while debugging stored procedures and resolutions to those problems
Error code Error message Resolution
SQLCODE = 471, SQLERRMC = 00E79001 Stored procedure was stopped. Start the stored procedure using DB2Start Procedure command.
SQLCODE = 471, SQLERRMC = 00E79002 Stored procedure could not be startedbecause of a scheduling problem.
Try using the DB2 Start Procedurecommand. If this does not work,contact the DB2 Administrator toraise the dispatching priority of theprocedure.
SQLCODE = 471, SQLERRMC = 00E7900C WLM application environment nameis not defined or available.
Activate the WLM address spaceusing the MVS WLM VARY command,for example:
WLM VARY APPLENV=applenv,RESUME
where applenv is the name of theWLM address space.
© Copyright IBM Corp. 1992, 2019 371

Table 21. Common problems while debugging stored procedures and resolutions to those problems (continued)
Error code Error message Resolution
SQLCODE = 444, SQLERRMC (none) Program not found. Verify that the LOADLIB is in theSTEPLIB for the WLM or DB2 addressspace JCL and has the appropriateRACF Read authorization for otherapplications to access it.
SQLCODE = 430, SQLERRMC (none) Abnormal termination in storedprocedure
This can occur for many reasons. Ifthe stored procedure abends withoutcalling z/OS Debugger, analyze theProcedure for any logic errors. If theProcedure runs successfully withoutz/OS Debugger, there may a problemwith how the stored procedure wascompiled and linked. Be sure that theProcedure data set has the properRACF authorizations. There may be aproblem with the address space.Verify that the WLM or DB2 AddressSpace is correct. If there are anymodifications, be sure the region isrecycled.
372 IBM z/OS Debugger V14.1.9 User's Guide

Chapter 38. Debugging IMS programs
This topic describes the tasks involved in debugging IMS programs.
Using IMS Transaction Isolation to create a private message-processing region and select transactions to debug
Note: This section is not applicable to IBM Developer for z Systems(non-Enterprise Edition), IBM Z Open Development, or IBM Z Open Unit Test.
z/OS Debugger's IMS Transaction Isolation facility allows you to debug IMSmessage processing programs (MPPs) in an environment that is isolated from otherusers of the same programs.
Using the IMS Transaction Isolation facility, you can do the following tasks:1. Display a list of transactions available for a given IMS subsystem.2. From that list of transactions, register to debug a specific transaction in a
private message region that is created for your use.3. For transactions you are registered to debug, specify other pattern-matching
information, such as the content of messages that are sent to the transaction.This allows you to trap the transaction under specific conditions.
4. Start a private message-processing region based on the execution environmentof a selected transaction. The private message-processing region is configuredto use delay debug mode, and is hardcoded to read delay debug preferencesfrom your delay debug profile data set.
5. Customize your private message region by supplying personal libraries for theSTEPLIB concatenation.
To use the IMS Transaction Isolation facility, do the following tasks:1. Start IBM z/OS Debugger Utilities. For more information, see “Starting IBM
z/OS Debugger Utilities” on page 460.2. In the IBM z/OS Debugger Utilities panel (EQA@PRIM), type 4 in the Option
line and press Enter.3. In the Manage IMS Message Processing Programs panel (EQAPRIS), type 5 in
the Option line and press Enter.4. The IMS Transaction Isolation Facility panel (EQAPMPSL) is displayed. The
following screen highlights the fields in the panel.
© Copyright IBM Corp. 1992, 2019 373

--------------- IMS Transaction Isolation Facility ---------- Row 1 to 7 of 201Command ===> Scroll ===> PAGE
IMS system . . . . . . IMS1 ▌1▐
▌2▐ _ Manage additional libraries and delay debug options.Your region: @USRT001 Class 021 StoppedDelay debug data set: ’USRT001.DLAYDBG.EQAUOPTS’
Filters: ▌3▐/ Display full transaction list._ Display only transactions you are registered to debug._ Filter by name ==> dtmq
__▌4▐__50 Maximum number of transactions (0 - no limit)
(E) Edit (S) Start Region (P) Stop Region (R) Register (D) De-registerSel Transaction PSB name Reserved user Region name Status_ ▌5▐ ADDINV DFSSAM04_ ADDPART DFSSAM04_ APOL11 APOL1_ APOL12 APOL1_ APOL13 APOL1_ APOL14 APOL1F1=Help F3=Exit F4=IMSIDLst F7=Backward F8=Forward F12=Cancel
▌1▐ IMS SystemSpecify the IMS subsystem identifier where you debug.
Press F4 to receive a list of IMS subsystems that are set up for IMSTransaction Isolation.
▌2▐ Manage additional libraries and delay debug optionsPlace a forward slash (/) in the entry field and press Enter to displaythe Manage Additional Libraries and Delay Debug panel(EQAPMPRG).
▌3▐ FiltersYou can use these selections to change the transactions that aredisplayed for the selected IMS subsystem.
▌4▐ Maximum number of transactionsThis value limits the number of transactions displayed for the givenfilter. If there are more transactions matching the filter than thetransactions that are displayed, a message is displayed.
Note: If you set too high of a limit or enter 0 to set no limit, theperformance of this panel will be degraded considerably.
▌5▐ Transaction action characterThe following actions can be performed for each transaction listed:
Action Function Description
E Edit Displays the Edit pattern-matching parameters panel(EQAPMPED).
S Start Region Starts a private message-processing region based on the currentexecution environment for the selected transaction. If you donot start the region, it will also register to debug the transaction.
P Stop Region Stops the private message-processing region that you started.
R Register Register to debug the selected transaction. When a message forthe transaction is scheduled in the IMS subsystem, the messageis routed to your private message-processing region if allpattern-matching parameters are satisfied.
374 IBM z/OS Debugger V14.1.9 User's Guide

Action Function Description
D De-register Removes your registration to debug the selected transaction.Messages are no longer routed to your privatemessage-processing region for this transaction.
5. In the Manage Additional Libraries and Delay Debug panel (EQAPMPRG), youcan perform the following tasks:a. Edit the delay debug options data set.b. Specify Language Environment options for the private message region.c. Add data sets to the message region STEPLIB concatenation.When z/OS Debugger creates your private message-processing region, if youhave a delay debug options data set allocated, the private message-processingregion is in delay debug mode. This allows you to use the delay debug optionsdata set to control the TEST option that is used and the programs that aretrapped.If you do not have a delay debug data set allocated, z/OS Debugger creates theprivate message-processing region with a hardcoded CEEOPTS DD. Thehardcoded CEEOPTS DD contains the string TEST (ALL, *,PROMPT,VTAM%userid:*), where userid is your TSO user ID.All private message-processing regions started by IMS Isolation contain aCEEOPTS DD card. You can specify additional Language Environment optionsfor this CEEOPTS DD by using the Other run-time options field.To add a data set to your private message-processing region's STEPLIB, type anI in the Cmd column of the data set table at the bottom of the panel. This addsan empty line to the table that you can complete with a data set name and adisposition.Each data set in the table is added to the beginning of the STEPLIBconcatenation for the private message-processing region, in the order that isspecified in the table. You can change the relative position of the data sets inthe table by modifying the values in the Seq column.For more advanced manipulation of the DD card, you can type a forward slash(/) in the Cmd column for a DD card and press Enter. A menu is displayedwhere you can change the allocation parameters, the DCB parameters, andother characteristics that are specified on the DD card for a data set.
6. The following screen highlights the fields on the Edit pattern-matchingparameters panel (EQAPMPED).
Chapter 38. Debugging IMS programs 375

---------------------- Edit pattern-matching parameters ---------------------Command ===> __________________________________________ Scroll ===> CSR
Message processing program debug settings:
Region class . . . 021 Region name . . @USRT001Transaction . . . . ITOC05User ID to match . . USRT001 ▌1▐Transaction Message ITOC04______▌2▐___________________▌3▐ Match case / ▌4▐ Data is hex _
F1=Help F3=Exit F4=Run F5=Findnext F7=BackwardF8=Forward F10=Submit F12=Cancel
▌1▐ User ID to matchThis field designates the user ID or pattern that is used to matchagainst the user ID when a given instance of the selected transaction isrun. The value may be a full user ID or a pattern that ends with thecharacter '*'.
▌2▐ Transaction MessageData that you enter in this field is used to match against all messagesthat are scheduled for the selected transaction. If the string you type iscontained within the message, the message is considered a match, if theother pattern-matching parameters are also satisfied (see ▌3▐ and ▌4▐).
▌3▐ Match casePlace a forward slash (/) in the entry field to indicate that the string in"Transaction Message" is considered a match if all characters match,including their case.
▌4▐ Data is hexPlace a forward slash (/) in the entry field to indicate that the string in"Transaction Message" is a hexadecimal string.
Using IMS pseudo wait-for-input (PWFI) with IMS Transaction IsolationWhen you debug an IMS application program with the IMS Transaction Isolationfacility and the IMS region is using PWFI, z/OS Debugger might be unresponsiveif the region is waiting for a message after a GetUnique (GU) call statement isdone on the IOPCB.
With PWFI, when a GU call statement is done on the IOPCB with no messages, theIMS region goes into a wait state for a message and z/OS Debugger might appearunresponsive. If you use the /DIS A command, a status of WAIT-MESSAGE isdisplayed. When the status is WAIT-MESSAGE, you cannot stop the IMS region.
To stop the wait state and return to the caller of the program that did the GU onthe IOPCB, issue the IMS PSTOP command./PST REG xx TRAN tttttttt/PST REG JOBNAME jjjjjjjj TRAN tttttttt
376 IBM z/OS Debugger V14.1.9 User's Guide
|
||||
||||
||
||

After the IMS PSTOP command is issued, the control is then returned to the callerwith a QC status code and you can continue with the program. When the programends, you can stop the IMS region.
Debugging IMS batch programs interactively by running BTS in TSOforeground
If you want to debug an IMS batch program interactively, you can use full-screenmode using the Terminal Interface Manager or remote debug mode. This topicdescribes a third option, which is to run BTS in the TSO foreground, by doing thefollowing steps:1. Define a dummy transaction code on the ./T command to initiate your program2. Include a dummy transaction in the BTS input stream3. Start BTS in the TSO foreground.
FSS is the default option when BTS is started in the TSO foreground, and isavailable only when you are running BTS in the TSO foreground. FSS can onlybe turned off by specifying TSO=NO on the ./O command. When running inthe TSO foreground, all call traces are displayed on your TSO terminal bydefault. This can be turned off by parameters on either the ./O or ./Tcommands.
Note: If your source (C and C++) or listing (COBOL and PL/I) does not come upin z/OS Debugger when you launch it, check that the source or listing file namecorresponds to the MVS library name, and that you have at least read access tothat MVS library.
Debugging IMS batch programs in batch modeYou can use z/OS Debugger to debug IMS programs in batch mode. The debugcommands must be predefined and included in one of the z/OS Debuggercommands files, or in a command string. The command string can be specified asa parameter either in the TEST run-time option, or when CALL CEETEST or __ctest isused. Although batch mode consumes fewer resources, you must know beforehandexactly which debug commands you are going to issue. When you run BTS as abatch job, the batch mode of z/OS Debugger is the only mode available for use.
For example, you can allocate a data set, userid.CODE.BTSINPUT with individualmembers of test input data for IMS transactions under BTS.
Debugging non-Language Environment IMS MPPsYou can debug IMS message processing programs (MPPs) that do not run inLanguage Environment by doing the following tasks:1. Verify that your system is configured correctly and start a new region. See
“Verifying configuration and starting a region for non-Language EnvironmentIMS MPPs” on page 378 for instructions.
2. Choose a debugging interface. See “Choosing an interface and gatheringinformation for non-Language Environment IMS MPPs” on page 378 forinstructions.
3. Run the EQASET transaction, which identifies the debugging interface youchose and enables debugging. See “Running the EQASET transaction fornon-Language Environment IMS MPPs” on page 378.
Chapter 38. Debugging IMS programs 377
|||

4. Start the IMS transaction that is associated with the program you want todebug.
After you finish debugging your program, you can do one of the following:v Continue debugging another program.v Disable debugging and continue running the region for other tasks.v Disable debugging and shut down the region. If you want to debug an IMS
programs, you have to repeat tasks 2 to 4.
Verifying configuration and starting a region fornon-Language Environment IMS MPPs
Before you debug an IMS MPP that does not run in Language Environment, do thefollowing steps:1. Consult with your system administrator and verify that your system has been
configured to debug IMS programs that do not run in Language Environment.See the IBM z/OS Debugger Customization Guide for instructions on how toinclude the APPLFE=EQANIAFE parameter string in the JCL that starts aregion and EQANISET.
2. Start an IMS message processing region (MPR) that runs the EQANIAFEapplication front-end routine whenever a message processing program (MPP) isscheduled.
After you complete these steps, choose a debugging interface as described in“Choosing an interface and gathering information for non-Language EnvironmentIMS MPPs.”
Choosing an interface and gathering information fornon-Language Environment IMS MPPs
Choose from one of the following debugging interfaces and gather the indicatedinformation:v Use full-screen mode using a dedicated terminal without Terminal Interface
Manager. Obtain the terminal LU for this terminal. For example, TRMLU001. Ifyou are required to use the VTAM network identifier for the terminal LU, obtainthis information from your system programmer.
v Use full-screen mode using the Terminal Interface Manager. Obtain the user ID.For example, USERABCD.
v Use remote debug mode. Obtain the IP address and port number that the remotedebugger is listening to.
After you choose a debugging interface, run the EQASET transaction as describedin “Running the EQASET transaction for non-Language Environment IMS MPPs.”
Running the EQASET transaction for non-LanguageEnvironment IMS MPPs
Running the EQASET transaction indicates to the EQANIAFE application front-endroutine that you want to do one of the following functions:v Enable a debugging session with the preferences you indicatev Request information about your existing preferencesv Disable a debugging session
378 IBM z/OS Debugger V14.1.9 User's Guide

To enable a debugging session, select one of the following options:v To debug in full-screen mode using a dedicated terminal without Terminal
Interface Manager, enter the command EQASET MFI=terminal_LU_name. If you arerequired to specify a VTAM network identifier, enter the command EQASETMFI=network_identifier.terminal_LU_name.
v To debug in full-screen mode using the Terminal Interface Manager, enter thecommand EQASET VTAM=user_ID.
v To debug in remote debug mode, enter the command EQASETTCP=IP_address%port_number.
After you enter an EQASET command, on the same terminal, start the transactionthat is associated with the application program that you want to debug.
To request information about your existing preferences, enter the command EQASETSTATUS.
To disable a debugging session, enter the command EQASET OFF.
To re-enable a debugging session after using EQASET OFF, enter the commandEQASET ON.
Syntax of the EQASET transaction for non-LanguageEnvironment MPPsThe following diagram displays the syntax of the EQASET transaction fornon-Language Environment MPPs:
►► EQASET MFI=terminal_LU_name
network_identifier.VTAM=
user_IDTCP=
IP_address % port_numberVTCP=
IP_address % port_numberONOFFSTATUS
►◄
The EQASET transaction manages a separate debugging setting for each user thatruns the transaction. Each setting is identified by the user ID that is used to log onto the terminal where the transaction is run. For any user ID, only the lastdebugging preference (MFI, TCP, VTCP, or VTAM) entered is saved. You can usethe STATUS option to see the current debugging preference.
The following TEST runtime option string is constructed with the debuggingpreference:TEST(ALL,INSPIN,,debuggingPreference:*)
You cannot customize the other runtime options.
MFI=Use full-screen mode using a dedicated terminal without Terminal InterfaceManager. You must specify a dedicated terminal LU name for the debugsession. If your site requires that you specify the VTAM network identifier,
Chapter 38. Debugging IMS programs 379

prefix the name of the VTAM network identifier to the terminal LU name.Without specifying the terminal LU name, debugging is turned off. No space isallowed after the equal sign (=). The preference implies debugging is turnedon.
VTAM=Use full-screen mode using the Terminal Interface Manager. You must specifythe user ID that was used to log on to the Terminal Interface Manager. Withoutspecifying the user ID, debugging is turned off. No space is allowed after theequal sign (=). The preference implies debugging is turned on.
TCP= or VTCP=Use remote debug mode. Specify the TCP/IP address and port number of theworkstation where the remote debug daemon is running. Without specifyingthe IP address and port number, debugging is turned off. No space is allowedafter the equal sign (=). The preference implies debugging is turned on. Youcan specify the TCP/IP address in one of the following formats:
IPv4 You can specify the address as a symbolic address, such assome.name.com, or a numeric address, such as 9.112.26.333.
IPv6 You must specify the address as a numeric address, such as1080:0:FF::0970:1A21. If you use IPv6 format, you must use the TCP=option; you cannot use the VTCP= option.
ON Turn on debugging. This is valid only when a debugging preference (MFI, TCP,VTCP, or VTAM) has been set.
OFFTurn off debugging.
STATUSDisplay the current debugging preference. The EQASET transaction displaysonly the first 25 characters of the IP address.
Debugging Language Environment IMS MPPs without issuing /SIGNON
The Language Environment user exit for EQAD3CXT constructs the name of anMVS data set that contains the Language Environment runtime options, includingthe TEST runtime option. EQAD3CXT constructs the name of the MVS data set byassigning values to tokens that represent each qualifier in a data set name; itassigns the IMS user ID as the value for the &USERID token. However, if you donot sign on to IMS (by using /SIGN ON), the IMS user ID is either the same as theIMS LTERM ID or it is not defined. In either case, EQAD3CXT cannot locate theMVS data set. To specify that EQAD3CXT assigns a TSO user ID as the value forthe &USERID token, run the EQASET transaction specifying the TSOID option. Fora description of the EQASET transaction with the TSOID option, see “Syntax of theEQASET transaction for Language Environment MPPs.”
Syntax of the EQASET transaction for Language EnvironmentMPPs
The following diagram displays the syntax of the EQASET transaction forLanguage Environment MPPs:
380 IBM z/OS Debugger V14.1.9 User's Guide

►► EQASET TSOID=tso_user_ID
STATUS
►◄
When you use the EQASET transaction for Language Environment MPPs, itassociates the current IMS LTERM ID with the specified TSO user ID. EQADICXTcan construct a valid name for the MVS data set using the TSO user ID for the&USERID token.
TSOID=Identify a TSO user ID to use in place of the &USERID token in the LanguageEnvironment user exit. The TSO user ID must match the user ID used to createthe data set name, as described in “Creating and managing the TEST runtimeoptions data set” on page 114.
STATUSDisplay the current value for TSOID.
This option might also display information about debugging preferences fornon-Language Environment MPPs.
Creating setup file for your IMS program by using IBM z/OS DebuggerUtilities
Note: This section is not applicable to IBM Developer for z Systems(non-Enterprise Edition), IBM Z Open Development, or IBM Z Open Unit Test.
You can create setup files for your IMS Batch Messaging Process (BMP) programwhich describe how to create a custom region and defines the STEPLIBconcatenation statements that reference the data sets for your IMS program's loadmodule and the z/OS Debugger load module. You can also create and customize asetup file to create a private message region that you can use to test your IMSmessage processing program (MPP). Creating a private message region with classX allows you to test your IMS program run by transaction X and reduce the risk ofinterfering with other regions being used by other IMS programs.
To create a setup file for your IMS program by using IBM z/OS Debugger Utilities,do the following steps:1. Start IBM z/OS Debugger Utilities. If you do not know how to start IBM z/OS
Debugger Utilities, see “Starting IBM z/OS Debugger Utilities” on page 10.2. In the IBM z/OS Debugger Utilities panel (EQA@PRIM), type 4 in the Option
line and press Enter.3. In the Manage IMS Programs panel (EQAPRIS), type 2 in the Option line and
press Enter.4. In the Create Private Message Regions - Edit Setup File panel (EQAPFORA),
type in the information to create a new setup file or edit an existing setup file.Press Enter.Create a private message region to customize your application or z/OSDebugger libraries while you debug your application so that you do not impactother user's activities. Consult your system administrator for authorization andrules regarding the creation of private message regions.After you specify the setup information required to run your IMS program, youcan specify the information needed to create a private message region you can
Chapter 38. Debugging IMS programs 381

use to test your IMS program or specify how to run a BMP program. To specifythis setup information, do the following steps:
5. In the Edit Setup File panel (EQAPFORI), type in the information to start IMSbatch processor. Type a forward slash (/) in the field Enter / to modifyparameters, then press Enter to modify parameters for the batch processor.
6. In the Parameters for IMS Procedures panel (EQAPRIPM), use one of thefollowing values in the TYPE field to indicate which action you want done:v MSG to start a private message region.v BMP to run a BMP program.Enter other parameters as needed. Press PF1 for information about theparameters.
7. After you type in the specifications, you can submit your job for processing bypressing PF10.
Using IMS message region templates to dynamically swap transactionclass and debug in a private message region
Note: This section is not applicable to IBM Developer for z Systems(non-Enterprise Edition), IBM Z Open Development, or IBM Z Open Unit Test.
You can use predefined IMS message region templates to debug a specifictransaction in a private message region by using IBM z/OS Debugger Utilitiesoption 4.3 Swap IMS Transaction Class and Run Transaction (panel EQAPMPRS).This panel and its sub-panels allow you to take the following actions:1. Start a private message region from a predefined message region template. This
template specifies a message class that is reserved for debug purposes.2. Assign a transaction that you want to debug to the class for the private
message region.3. Schedule a message for the transaction.4. After you have finished debugging the transaction and it completes, the
transaction is assigned to its original class and the private message region isstopped.
To dynamically launch a private message region and run a specific transaction inthat region, complete the following steps:1. Start IBM z/OS Debugger Utilities. For detailed information, see “Starting IBM
z/OS Debugger Utilities” on page 10.2. In the IBM z/OS Debugger Utilities panel (EQA@PRIM), type 4 in the Option
line and press Enter.3. In the Manage IMS Programs panel (EQAPRIS), type 3 in the Option line and
press Enter.4. In the Debug IMS Transaction - Select Private Message Region panel
(EQAPMPRS), type a forward slash (/) beside the template you want to use,and press Enter. You can choose from the following types of templates:v Predefined templates from a common z/OS Debugger Setup Utility data setv Templates previously customized and stored in a private z/OS Debugger
Setup Utility data setIf you use a member from a private z/OS Debugger Setup Utility data set, youcan see the Create Private Message Regions - Edit Setup File panel(EQAPFORA). Enter the information to edit an existing setup file.
382 IBM z/OS Debugger V14.1.9 User's Guide

5. In the Specify Transaction and Additional Test Libraries panel (EQAPMPRT),type the transaction name that you want to launch in your private messageregion. You also need to enter any additional information to send when themessage is scheduled.You might want to add data sets to the message region STEPLIB concatenation.To add a data set, type an I in the Cmd column of the data set table at thebottom of the panel. This adds an empty line to the table that you can fill inwith a data set name and a disposition.Each data set in the table is added to the beginning of the STEPLIBconcatenation for the message region, in the order specified in the table. Youmight change the relative position of the data sets in the table by modifying thevalues in the Seq column.For more advanced manipulation of the DD card, you can type a forward slash(/) in the Cmd column for a DD card and press Enter. A menu is displayedwhere you can change the allocation parameters, the DCB parameters, andother characteristics that are specified on the DD card for a data set.
6. To start the private message region and schedule the transaction, run the z/OSDebugger IMS Transaction Swap Utility (the EQANBSWT Batch MessageProgram, hereafter referred to as EQANBSWT). This can be done in one of thetwo following ways:v Press PF4 to run the transaction. This starts EQANBSWT in the foreground
of your TSO session.v Press PF10 to submit. This displays a JCL deck that runs the EQANBSWT
program that you can submit to the Job Entry System by using the ISPFSUBMIT command.
EQANBSWT will start the private message region. By default, the TESTparameter will be the following:TEST(ALL,*,PROMPT,VTAM%userid:*)
The userid is your TSO user ID.If you want to use a different TEST parameter, type a forward slash (/) besidethe Enter / to modify parameters field, and press Enter. The EQAPFMTP panelis displayed. Specify the TEST parameter sub-options and session type, andpress PF3 to save.EQANBSWT will also start a second private message region, by using theNOTEST parameter, and serving the same class. This region allows additionalmessages scheduled for the transaction to be processed when the transaction isbeing debugged in the TEST region at the same time.EQANBSWT will then assign the transaction to the class served by the privatemessage region and schedule the transaction.When the transaction completes, EQANBSWT stops the private messageregions and assigns the transaction to the class to which it was initiallyassigned.The jobs that are started to run EQANBSWT and the two private messageregions use the job card you specified in IBM z/OS Debugger Utilities option 0,Job Card. Each job name is replaced by values that you entered in DebugUtilities option 4.0, Set IMS Program Options. If you do not set personaldefaults in option 4.0, system defaults are used.In certain circumstances, EQANBSWT does not complete normally. To interruptEQANBSWT, take one of the following steps:v If you ran EQANBSWT in the foreground by using the Run command, press
the ATTN or PA1 key and follow the prompts to stop the process.
Chapter 38. Debugging IMS programs 383

v If you ran EQANBSWT as a batch job by using the Submit command, issuethe STOP jobname MVS command, for example, by typing /P jobname in theSpool Display and Search Facility (SDSF).
7. When you want to leave the Specify Transaction and Additional Test Librariespanel (EQAPMPRT), you can save any changes you have made into a privatemessage region template.v If you selected a predefined message template in step 4, type SAVE AS and
press Enter. This displays the z/OS Debugger Foreground – Edit Setup Filepanel (EQAPFOR), where you can enter a data set name for your privatecopy of the template.
v Otherwise, press PF3 to Exit. Your changes are saved to the private templateyou opened in step 4.
Placing breakpoints in IMS applications to avoid the appearance ofz/OS Debugger becoming unresponsive
When you debug an IMS application program, the way IMS manages resourcesmight occasionally make z/OS Debugger appear unresponsive. To avoid thissituation, set breakpoints as close as possible to the location that you need todebug or at the GetUnique (GU) call statement. The information in this topic helpsyou understand how IMS's management of resources might appear to make z/OSDebugger unresponsive and helps you determine the approximate location to set abreakpoint to avoid this situation.
After you start an IMS transaction, IMS loads and runs the application programassociated with that transaction. IMS manages all the messages requested by andreturned to that application program, along with all the messages requested byand returned to other application programs running at the same time. IMS uses theprocessing limit count (PLCT) and other tools to ensure that application programsget the appropriate share of resources. As long as your IMS application programdoes not exceed the PLCT10, it continues running and processing messages orwaiting for the next message. However, if you are trying to debug the applicationprogram, the continued message processing or waiting for messages might makez/OS Debugger appear unresponsive. To avoid this situation, try one of thefollowing options at the beginning of your debug session, before you beginrunning the application program (for example, by entering the GO command):v Set a breakpoint as close as possible to the area you want to debug.v Set a breakpoint at the GU call statement.
Related referencesIMS System Definition Reference
10. IMS Quick reschedule allows application programs to process more than the PLCT for each physical schedule. Quick reschedulehelps eliminate processing overhead caused by unnecessary rescheduling and reloading of application programs.
384 IBM z/OS Debugger V14.1.9 User's Guide

Chapter 39. Debugging CICS programs
This topic describes tasks you can do while debugging CICS programs, anddescribes some restrictions.
Before you can debug your programs under CICS, verify that you have completedthe following tasks:v Ensured that all of the required installation and configuration steps for CICS
Transaction Server, Language Environment, and z/OS Debugger have beencompleted. For more information, refer to the installation and customizationguides for each product.
v Completed all the tasks in the following topics:– Chapter 4, “Planning your debug session,” on page 25– Chapter 5, “Updating your processes so you can debug programs with z/OS
Debugger,” on page 63– Chapter 10, “Preparing a CICS program,” on page 89– Chapter 18, “Starting z/OS Debugger under CICS,” on page 151
Displaying the contents of channels and containersYou can display the contents of CICS channels by using the DESCRIBE CHANNELcommand and the contents of a container by using the LIST CONTAINER command.
The section "Enhanced inter-program data transfer: channels as modern-dayCOMMAREAs" in the CICS Application Programming Guide describes the benefits ofcontainers and channels and how to use them in your programs.
To display a list of containers in the current channel, enter the command DESCRIBECHANNEL. To display a list of containers in another channel, enter the commandDESCRIBE CHANNEL channel_name, where channel_name is the name of a specificchannel. In either case, z/OS Debugger displays a list similar to the following list:
© Copyright IBM Corp. 1992, 2019 385

COBOL LOCATION: ZCONPRGA :> 274Command ===> Scroll ===> PAGEMONITOR -+----1----+----2----+----3----+----4----+----5----+----6- LINE: 1 OF 2******************************* TOP OF MONITOR ********************************
----+----1----+----2----+----3----+----4----0001 1 ********** AUTOMONITOR **********0002 01 DFHC0160 ’PrgA-ChanB-ContC’****************************** BOTTOM OF MONITOR ******************************
SOURCE: ZCONPRGA -1----+----2----+----3----+----4----+----5--- LINE: 272 OF 307272 * FLENGTH(LENGTH OF PrgA-ChanB-XXXXX) .273 * END-EXEC .274 Move ’PrgA-ChanB-ContC’ to dfhc0160 .275 Move ’PrgA-CHANB’ to dfhc0161 .276 Call ’DFHEI1’ using by content x’341670000720000002000000 .277 - ’00f0f0f0f5f3404040’ by content x’0000’ by reference .278 PrgA-ChanB-XXXXX by reference dfhc0160 by content LENGTH .279 PrgA-ChanB-XXXXX by content x’0000’ by content x’0000’ by .280 content x’0000’ by content x’0000’ by content x’0000’ by .281 content x’0000’ by content x’0000’ by content x’0000’ by .282 content x’0000’ by content x’0000’ by content x’0000’ by .283 content x’0000’ by content x’0000’ by content x’0000’ by .
LOG 0----+----1----+----2----+----3----+----4----+----5----+-- LINE: 147 OF 2890147 DESCRIBE CHANNEL * ;0148 CHANNEL PrgA-ChanB0149 CONTAINER NAME SIZE0150 ------------------------------------0151 PrgA-ChanB-ContC 210152 PrgA-ChanB-ContB 210153 PrgA-ChanB-ContA 210154 CHANNEL PRGA-CHANA0155 CONTAINER NAME SIZE0156 ------------------------------------0157 PRGA-CHANA-CONTC 21PF 1:? 2:STEP 3:QUIT 4:LIST 5:FIND 6:AT/CLEARPF 7:UP 8:DOWN 9:GO 10:ZOOM 11:ZOOM LOG 12:RETRIEVE
To display the contents of a container in the current channel, enter the commandLIST CONTAINER container_name, where container_name is the name of a particularchannel. To display the contents of a container in another channel, enter thecommand LIST CONTAINER channel_name container_name, where channel_name isthe name of another channel. In either case, z/OS Debugger displays the contentsof the container in a format similar to the following diagram:
386 IBM z/OS Debugger V14.1.9 User's Guide

COBOL LOCATION: ZCONPRGA :> 211.1Command ===> Scroll ===> PAGEMONITOR -+----1----+----2----+----3----+----4----+----5----+----6- LINE: 1 OF 2******************************* TOP OF MONITOR ********************************
----+----1----+----2----+----3----+----4----0001 1 ********** AUTOMONITOR **********0002 01 DFHC0160 ’PRGA-CHANA-CONTC’****************************** BOTTOM OF MONITOR ******************************
SOURCE: ZCONPRGA -1----+----2----+----3----+----4----+----5--- LINE: 209 OF 307209 * FLENGTH(LENGTH OF PrgA-ChanB-ContA) .210 * END-EXEC .211 Move ’PrgA-ChanB-ContA’ to dfhc0160 .212 Move ’PrgA-ChanB’ to dfhc0161 .213 Call ’DFHEI1’ using by content x’341670000720000002000000 .214 - ’00f0f0f0f3f5404040’ by content x’0000’ by reference .215 PrgA-ChanB-ContA by reference dfhc0160 by content LENGTH .216 PrgA-ChanB-ContA by content x’0000’ by content x’0000’ by .217 content x’0000’ by content x’0000’ by content x’0000’ by .218 content x’0000’ by content x’0000’ by content x’0000’ by .219 content x’0000’ by content x’0000’ by content x’0000’ by .220 content x’0000’ by content x’0000’ by content x’0000’ by .
LOG 0----+----1----+----2----+----3----+----4----+----5----+---- LINE: 15 OF 250015 STEP ;0016 DESCRIBE CHANNEL * ;0017 CHANNEL PRGA-CHANA0018 CONTAINER NAME SIZE0019 ------------------------------------0020 PRGA-CHANA-CONTC 210021 PRGA-CHANA-CONTB 210022 PRGA-CHANA-CONTA 210023 LIST CONTAINER PRGA-CHANA PRGA-CHANA-CONTC ;0024 000C7F78 D7D9C7C1 60C3C8C1 D5C160C3 D6D5E3C3 *PRGA-CHANA-CONTC*0025 000C7F88 60C4C1E3 C1 *-DATA *PF 1:? 2:STEP 3:QUIT 4:LIST 5:FIND 6:AT/CLEARPF 7:UP 8:DOWN 9:GO 10:ZOOM 11:ZOOM LOG 12:RETRIEVE
Refer to the following topics for more information related to the material discussedin this topic.v Related references
v DESCRIBE CHANNEL command in IBM z/OS Debugger Reference and Messages
v LIST CONTAINER command in IBM z/OS Debugger Reference and Messages
Controlling pattern-match breakpoints with the DISABLE and ENABLEcommands
This topic describes how you can use the DISABLE and ENABLE commands to controlpattern-match breakpoints. A pattern-match breakpoint is a breakpoint that isidentified by the name, or part of the name, of a load module or compile unitspecified in a DTCN or CADP profile.
The DISABLE command works with the debugging profile that started the currentdebugging session to prevent programs from being debugged. When you enter theDISABLE command, you specify the name, or part of the name, of a load module,compile unit, or both, that you do not want to debug. When z/OS Debugger findsa load module, compile unit, or both, whose name matches the name or part of thename (a pattern) that you specified, z/OS Debugger does not debug that program.When you enter the ENABLE command, you specify the pattern (the full name orpart of a name of a load module, compile unit, or both) that you want to debug.The pattern must match the name of a load module, compile unit, or both, thatyou specified in a previously entered DISABLE command.
Chapter 39. Debugging CICS programs 387

Before you begin, verify that you know which debugging profile started z/OSDebugger (DTCN or CADP) and the names you specified in the LoadMod::>CUfield (for DTCN) or the Program field, Compile Unit field, or both (for CADP).
To use the DISABLE command to prevent z/OS Debugger from debugging aprogram, do the following steps:1. If you don't remember what programs you might have disabled, enter the
command LIST DTCN or LIST CADP. This command lists the programs you havealready disabled. This step reminds you of the names of load modules,programs, or compile units you already disabled.
2. If you are running with a CADP profile, enter the command DISABLE CADPPROGRAM program_name CU compile_unit_name. program_name is the name of theprogram, or it matches the pattern of the name of a program, that you specifiedin the Program field and it is the program that you do not want to debug.compile_unit_name is the name of the compile unit, or it matches the pattern ofthe name of a compile unit, that you specified in the Compile Unit field and itis the compile unit that you do not want to debug. You can specify PROGRAMprogram_name, CU compile_unit_name, or both.For example, if you have the following circumstances, enter the commandDISABLE CADP PROGRAM ABD2 to prevent z/OS Debugger from debugging theprogram ABD2:v You specified ABD* in the Program field of the profile.v You have programs with the name ABD1, ABD2, ABD3, ABD4, and ABD5.
3. If you are running with a DTCN profile, enter the command DISABLE DTCNLOADMOD load_module_name CU compile_unit_name. load_module_name is thename of the load module, or it matches the pattern of the name of a loadmodule, that you specified in the LoadMod field and it is the load module thatyou do not want to debug. compile_unit_name is the name of the compile unit,or it matches the pattern of the name of a compile unit, that you specified inthe CU field and it is the compile unit that you do not want to debug. You canspecify LOADMOD load_module_name, CU compile_unit_name, or both.For example, if you have the following circumstances, enter the commandDISABLE DTCN CU STAR2 to prevent z/OS Debugger from debugging the compileunit STAR2:v You specified STAR* in the CU field of the profile.v You have compile units with the names STAR1, STAR2, STAR3, STAR4, and
STAR5.
To use the ENABLE command to allow a previously disabled program to bedebugged, do the following steps:1. If you don't remember the exact name of the disabled load module, program,
or compile unit, enter the command LIST DTCN or LIST CADP. This commandlists the programs you have disabled. Write down the name of the loadmodule, program, or compile unit that you want to debug.
2. If you are running with a CADP profile, enter the command ENABLE CADPPROGRAM program_name CU compile_unit_name, where program_name is the nameof the program and compile_unit_name is the name of the compile unit that youwrote down from step 1. If you only need to specify a program name, you donot have to type in the CU compile_unit_name portion of the command. If youonly need to specify a compile unit name, you do not have to type in thePROGRAM program_name portion of the command.
3. If you are running with a DTCN profile, enter the command ENABLE DTCNLOADMOD load_module_name CU compile_unit_name, where load_module_name is
388 IBM z/OS Debugger V14.1.9 User's Guide
the name of the load module and compile_unit_name is the name of the compileunit you wrote down from step 1. If you only need to specify a load modulename, you do not have to type in the CU compile_unit_name portion of thecommand. If you only need to specify a compile unit name, you do not have totype in the LOADMOD load_module_name portion of the command.
Refer to the following topics for more information related to the material discussedin this topic.
Related referencesDISABLE command in IBM z/OS Debugger Reference and MessagesENABLE command in IBM z/OS Debugger Reference and MessagesLIST CADP or DTCN command in IBM z/OS Debugger Reference and Messages
Preventing z/OS Debugger from stopping at EXEC CICS RETURNz/OS Debugger stops at EXEC CICS RETURN and displays the following message:CEE0199W The termination of a thread was signaled due to a STOP statement.
To prevent z/OS Debugger from stopping at every EXEC CICS RETURN statement inyour application and suppress this message, set the TEST level to ERROR by usingthe SET TEST ERROR command.
Early detection of CICS storage violationsCICS can detect various types of storage violations. The CICS Problem DeterminationGuide describes the types of storage violations that CICS can detect and when CICSdetects them automatically. You can request that z/OS Debugger detect one type ofstorage violation (whether the storage check zone of a user-storage element hasbeen overlaid). You can make this request at any time.
To instruct z/OS Debugger to check for storage violations, enter the commandCHKSTGV. z/OS Debugger checks the task that you are debugging for storageviolations.
You can instruct z/OS Debugger to check for storage violations more frequently byincluding the command as part of a breakpoint. For example, the followingcommands check for a storage violation at each statement in a COBOL programand causes z/OS Debugger to stop if a violation is detected in the currentprocedure:AT STATEMENT *
PERFORMCHKSTGV ;IF %RC = 0 THEN
GO ;END-IF ;
END-PERFORM ;
If you plan on running a check at every statement, run it on as few statements aspossible because the check causes overhead that can affect performance.
Refer to the following topics for more information related to the material discussedin this topic.
Related referencesCICS Problem Determination Guide
Chapter 39. Debugging CICS programs 389

Saving settings while debugging a pseudo-conversational CICSprogram
If you change the z/OS Debugger display settings (for example, color settings)while you debug a pseudo-conversational CICS program, z/OS Debugger mightrestore the default settings. To ensure that your changes remain in effect every timeyour program starts z/OS Debugger, store your display settings in the preferencesfile or the commands file.
Saving and restoring breakpoints and monitor specifications for CICSprograms
When you set any of the following specifications to AUTO, these specifications areused to control the saving and restoring of breakpoints and LOADDEBUGDATAspecifications between z/OS Debugger settings:v SAVE BPSv SAVE MONITORSv RESTORE BPSv RESTORE MONITORS
You set switches by using the SET command. The SAVE BPS and SAVEMONITORS switches enable the saving of breakpoints and monitor specificationsbetween debugging sessions. The RESTORE BPS and RESTORE MONITORSswitches control the restoring of breakpoints and monitor specifications at the startof subsequent debugging sessions. Setting these switches to AUTO enables theautomatic saving and restoring of this information. You must also enable the SAVESETTING AUTO switch so that these settings are in effect at the start ofsubsequent debugging sessions.
While you run in CICS, consider the following requirements:v You must log on as a user other than the default user.v The CICS region must have update authorization to the SAVE SETTINGS and
SAVE BPS data sets.
When you activate a DTCN profile for a full-screen debugging session and SAVEBPS, SAVE MONITORS, RESTORE BPS, and RESTORE MONITORS all specifyNOAUTO, z/OS Debugger saves most of the breakpoint and LOADDEBUGDATAinformation for that session into the profile. When the DTCN profile is deleted, thebreakpoint and LOADDEBUGDATA information is deleted.
See “Performance considerations in multi-enclave environments” on page 199 forinformation about performance savings and restoring settings, breakpoints, andmonitors under CICS.
Refer to the following topics for more information related to the material discussedin this topic.
Related referencesIBM z/OS Debugger Reference and Messages
Restrictions when debugging under CICSThe following restrictions apply when debugging programs with the z/OSDebugger in a CICS environment.
390 IBM z/OS Debugger V14.1.9 User's Guide
v You can use CRTE terminals only in single terminal mode and screen controlmode. You cannot use them in separate terminal mode.
v The __ctest() function with CICS does nothing.v The CDT# transaction is a z/OS Debugger service transaction used during
separate terminal mode debugging and is not intended for activation by directterminal input. If CDT# is started via terminal entry, it will return to the caller(no function is performed).
v Applications that issue EXEC CICS POST cannot be debugged in separateterminal mode or screen control mode.
v References to DD names are not supported. All files, including the log file, USEfiles, and preferences file, must be referred to by their full data set names.
v The commands TSO, SET INTERCEPT, and SYSTEM cannot be used.v CICS does not support an attention interrupt from the keyboard.v The CICS region must have read authorization to the preferences and commands
files.v If the EQAOPTS LOGDSN command does not specify a naming pattern, z/OS
Debugger does not automatically start the log file. You need to run the SET LOGON fileid command.If the EQAOPTS LOGDSN command specifies a naming pattern, z/OS Debuggerautomatically starts the log file by running the SET LOG ON fileid command.If you are not logged into CICS or are logged in under the default user ID, z/OSDebugger does not run the EQAOPTS LOGDSN command; therefore, z/OSDebugger does not automatically start a log file.The CICS region must have update authorization to the log file.
v Ensure that you allocate a log file big enough to hold all the log output from adebug session, because the log file is truncated after it becomes full. (A warningmessage is not issued before the log is truncated.)
v z/OS Debugger disables Omegamon RLIM processing for any CICS task whichis being debugged.
v You can start z/OS Debugger when a non-Language Environment assembler ornon-Language Environment COBOL program under CICS starts by defining adebug profile by using CADP or DTCN. But z/OS Debugger will only start on aCICS Link Level boundary, such as when the first program of the task starts orfor the first program to run at a new Link Level. For profiles defined in CADPor DTCN which list a non-Language Environment assembler or non-LanguageEnvironment COBOL program name that is dynamically called using EXECCICS LOAD/CALL, z/OS Debugger will not start. Non-Language Environmentassembler or non-Language Environment COBOL programs that are called inthis way are identified by z/OS Debugger in an already-running debuggingsession and can be stopped by using a command like AT APPEARANCE or ATENTRY. However, they cannot be used to trigger a z/OS Debugger sessioninitially.
Accessing CICS resources during a debugging sessionYou can gain access to CICS temporary storage and transient data queues duringyour debugging session by using the CALL %CEBR command. You can do all thefunctions you can currently do while in the CICS-supplied CEBR transaction. Foraccess to general CICS resources (for example, information about the CICS systemyou are debugging on or opening and reading a VSAM file) you can use the CALL%CECI command. This command gives control to the CICS-supplied CECI
Chapter 39. Debugging CICS programs 391

transaction. Press PF3 from inside CEBR or CECI to return to the debug session.For more information about CEBR and CECI, see CICS Supplied Transactions.
Accessing CICS storage before or after a debugging sessionYou can uses the DTST transaction to display and modify CICS storage. SeeAppendix H, “Displaying and modifying CICS storage with DTST,” on page 539for more information.
392 IBM z/OS Debugger V14.1.9 User's Guide
Chapter 40. Debugging ISPF applications
Debugging ISPF applications presents some challenges to the user because of theway ISPF application programs are invoked. The two main challenges are asfollows:v Providing TEST runtime options to the application.v Choosing a display device for your z/OS Debugger session.
You need to provide TEST runtime options. This can be done in one of thefollowing ways:v Edit the exec or panel that invokes the application and change the parameter
string that is passed to the program to add the TEST runtime options.v Allocate a CEEOPTS DD that contains the TEST runtime options.v Edit the application source code to add a call to CEETEST.
This method provides the simplest way to debug only the ISPF applicationsubroutine that you want to debug.
You need to select a display device for your z/OS Debugger session. This can bedone in one of the following ways:v Specify a display device by using the TEST runtime options.
– Use the same 3270 terminal as ISPF is using. When you run your program,specify the MFI suboption of the TEST runtime option. The MFI suboptionrequires no additional values if you are going to use the same 3270 terminalas ISPF is using.TEST(ALL,*,PROMPT,MFI:*)
PA2 refreshes the ISPF application panel and removes residual z/OSDebugger output from the emulator session. However, if z/OS Debuggersends output to the emulator session between displays of the ISPF applicationpanels, you need to press PA2 after each ISPF panel displays.When you debug ISPF applications or applications that use line mode inputand output, issue the SET REFRESH ON command. This command is executedand is displayed in the log output area of the Command/Log window.
– Use a separate 3270 terminal using full-screen mode using the TerminalInterface Manager (TIM).When you run your program, specify the VTAM suboption of the TEST runtimeoption. The VTAM suboption requires that you specify your user ID, as in thefollowing example:TEST(ALL,*,PROMPT,VTAM%user_id:*)
– Use a separate 3270 terminal using full-screen mode using a dedicatedterminal without Terminal Interface Manager.When you run your program, specify the MFI suboption of the TEST runtimeoption. The MFI suboption requires that you specify the VTAM LU name ofthe separate terminal that you started, as in the following example:TEST(ALL,*,PROMPT,MFI%terminal_id:*)
– Use remote debug mode and a remote GUI.When you run your program, specify the TCPIP suboption of the TEST runtimeoption. The TCPIP suboption requires that you specify the TCP/IP address ofyour workstation, as in the following example:
© Copyright IBM Corp. 1992, 2019 393

TEST(ALL,*,PROMPT,TCPIP&tcpip_workstation_id%8001:*)
The 2nd, 3rd, and 4th options above support debugging a batch ISPFprogram.
v Specify a display device via a call to CEETEST.The 1st parameter to CEETEST test is a 'command string' where the firstcommand in the string can be one of the following ones:– A null command. In this case, z/OS Debugger will use the same display as
ISPF is using.;
– A parameter that indicates you want to use full-screen mode using theTerminal Interface Manager (TIM) and the ID you logged on to TIM with.VTAM%GYOUNG:*;
– A parameter that indicates that you want to use remote debug mode andprovides the TCP/IP address of the workstation.TCPIP&9.51.66.92%8001:*;
The 2nd and 3rd options above support debugging a batch ISPF program.
Here is an example of using CEETEST in a COBOL program to provide both theTEST runtime options and the display device information.
This declaration in the DATA DIVISION indicates using the same 3270 terminalthat ISPF is using.01 COMMAND-STRING.
05 AA PIC 99 Value 1 USAGE IS COMPUTATIONAL.05 BB PIC x(60) Value ’;’.
This declaration in the DATA DIVISION indicates using full-screen mode using theTerminal Interface Manager.01 COMMAND-STRING.
05 AA PIC 99 Value 14 USAGE IS COMPUTATIONAL.05 BB PIC x(60) Value ’VTAM%GYOUNG:*;’.
This declaration in the DATA DIVISION indicates using remote debug mode.01 COMMAND-STRING.
05 AA PIC 99 Value 24 USAGE IS COMPUTATIONAL.05 BB PIC x(60) Value ’TCPIP&9.51.66.92%8001:*;’.
The 2nd and 3rd options above are needed if you are debugging a batch ISPFprogram.
These are the declarations needed in the DATA DIVISION for the 2nd parameter toCEETEST.01 FC.
02 CONDITION-TOKEN-VALUE.COPY CEEIGZCT.
03 CASE-1-CONDITION-ID.04 SEVERITY PIC S9(4) BINARY.04 MSG-NO PIC S9(4) BINARY.
03 CASE-2-CONDITION-IDREDEFINES CASE-1-CONDITION-ID.
04 CLASS-CODE PIC S9(4) BINARY.04 CAUSE-CODE PIC S9(4) BINARY.
03 CASE-SEV-CTL PIC X.03 FACILITY-ID PIC XXX.
02 I-S-INFO PIC S9(9) BINARY.
394 IBM z/OS Debugger V14.1.9 User's Guide

Here is the call to CEETEST that goes in the PROCEDURE DIVISION.CALL "CEETEST" USING COMMAND-STRING FC.
Related conceptsz/OS Debugger runtime options in IBM z/OS Debugger Reference and Messages“Starting z/OS Debugger with CEETEST” on page 131
Chapter 40. Debugging ISPF applications 395

396 IBM z/OS Debugger V14.1.9 User's Guide

Chapter 41. Debugging programs in a production environment
Programs in a production environment have any of the following characteristics:v The programs are compiled without hooks.v The programs are compiled with the optimization compiler option, usually the
OPT compiler option.v The programs are compiled with COBOL compilers that support the SEPARATE
suboption of the TEST compiler option.
This section helps you determine how much of z/OS Debugger's testing functionsyou want to continue using after you complete major testing of your applicationand move into the final tuning phase. Included are discussions of program sizeand performance considerations; the consequences of removing hooks, thestatement table, and the symbol table; and using z/OS Debugger on optimizedprograms.
Refer to the following topics for more information related to the material discussedin this topic.
Related tasks“Fine-tuning your programs for z/OS Debugger”“Debugging without hooks, statement tables, and symbol tables” on page 399“Debugging optimized COBOL programs” on page 400
Fine-tuning your programs for z/OS DebuggerAfter initial testing, you might want to consider the following options available toimprove performance and reduce size:v Compile your COBOL programs with optimization compiler options, as
described in “Debugging optimized COBOL programs” on page 400. You cannotdebug PL/I and C/C++ programs that are optimized.
v Removing the hooks, which can improve the performance of your program.v Removing the statement and symbol tables, which can reduce the size of your
program.
Removing hooksOne option for increasing the performance of your program is to compile with aminimum of hooks or with no hooks.v For C programs, compiling with the option TEST(NOLINE,BLOCK,NOPATH) causes
the compiler to insert a minimum number of hooks while still allowing you toperform tasks at block boundaries.
v For COBOL programs, compiling with the following compiler suboptions createsprograms that do not have hooks:– TEST(NONE) for any release of the Enterprise COBOL for z/OS Version 3, or
COBOL OS/390 & VM, Version 2, compiler– TEST(NOHOOK) for Enterprise COBOL for z/OS Version 4– TEST for Enterprise COBOL for z/OS Version 5
Using the Dynamic Debug facility, z/OS Debugger inserts hooks whiledebugging the program, allowing you to perform almost any debugging task.
© Copyright IBM Corp. 1992, 2019 397

Independent studies show that performance degradation is negligible because ofhook-overhead for PL/I programs. Also, in the event you need to request anattention interrupt, z/OS Debugger is not able to regain control withoutcompiled-in hooks. In such a case you can request an interrupt three times. Afterthe third time, z/OS Debugger is able to stop program execution and prompt youto enter QUIT or GO. If you enter QUIT, your z/OS Debugger session ends. If youenter GO, control is returned to your application.
Programs compiled with certain suboptions of the TEST compiler option havehooks inserted at compile time. However, if the Dynamic Debug facility isactivated (which is the default, unless altered by the DYNDEBUG EQAOPTS command)and the programs are compiled with certain compilers, the compiled-in hooks arereplaced with runtime hooks. This replacement is done to improve theperformance of z/OS Debugger. Certain path hook functions are limited when youuse the Dynamic Debug facility. To enable these functions, enter the SET DYNDEBUGOFF command, which deactivates the Dynamic Debug facility. See IBM z/OSDebugger Reference and Messages for a description of these commands.
It is a good idea to examine the benefits of maintaining hooks in light of theperformance overhead for that particular program.
Removing statement and symbol tablesIf you are concerned about the size of your program, you can remove the symboltable, the statement table, or both, after the initial testing period. For C and PL/Iprograms, compiling with the option TEST(NOSYM) inhibits the creation of symboltables.
Before you remove them, however, you should consider their advantages. Thestatement table allows you to display the execution history with statementnumbers rather than offsets, and error messages identify statement numbers thatare in error. The symbol table enables you to refer to variables and programcontrol constants by name. Therefore, you need to look at the trade-offs betweenthe size of your program and the benefits of having symbol and statement tables.
For programs that are compiled with the following compilers and with theSEPARATE suboption of the TEST compiler option, the symbol tables are saved in aseparate debug file. This arrangement lets you to retain the symbol tableinformation and have a smaller program:v Enterprise COBOL for z/OS, Version 6 Release 2v Enterprise COBOL for z/OS, Version 4v Enterprise COBOL for z/OS and OS/390, Version 3v COBOL for OS/390 & VM, Version 2 Release 2v COBOL for OS/390 & VM, Version 2 Release 1, with APAR PQ40298v Enterprise PL/I for z/OS, Version 3.5 or later
For C and C++ programs compiled with the C/C++ compiler of z/OS, Version 1.6or later, you can compile with the FORMAT(DWARF) suboption of the DEBUG compileroption to save debug information in a separate debug file. This produces a smallerprogram.
Programs compiled with the Enterprise COBOL for z/OS Version 5 compiler,Version 6 Release 1 compiler, or Version 6 Release 2 compiler with theTEST(NOSEPARATE) compiler option have all of their debug information (including
398 IBM z/OS Debugger V14.1.9 User's Guide

the symbol table) stored in a NOLOAD segment of the program object. This segmentis only loaded into memory when you are debugging the program object.
Debugging without hooks, statement tables, and symbol tablesz/OS Debugger can gain control at program initialization by using the PROMPTsuboption of the TEST run-time option. Even when you have removed all hooksand the statement and symbol tables from a production program, z/OS Debuggerreceives control when a condition is raised in your program if you specify ALL orERROR on the TEST run-time option, or when a __ctest(), CEETEST, or PLITEST isexecuted.
When z/OS Debugger receives control in this limited environment, it does notknow what statement is in error (no statement table), nor can it locate variables (nosymbol table). Thus, you must use addresses and interpret hexadecimal datavalues to examine variables. In this limited environment, you can:v Determine the block that is in control:
list (%LOAD, %CU, %BLOCK);orlist (%LOAD, %PROGRAM, %BLOCK);
v Determine the address of the error and of the compile unit:list (%ADDRESS, %EPA); (where %EPA is allowed)
v Display areas of the program in hexadecimal format. Using your listing, you canfind the address of a variable and display the contents of that variable. Forexample, you can display the contents at address 20058 in a C and C++ programby entering:LIST STORAGE (0x20058);
To display the contents at address 20058 in a COBOL or PL/I program, youwould enter:LIST STORAGE (X’20058’);
v Display registers:LIST REGISTERS;
v Display program characteristics:DESCRIBE CU; (for C)
DESCRIBE PROGRAM; (for COBOL)
v Display the dynamic block chain:LIST CALLS;
v Request assistance from your operating system:SYSTEM ...;
v Continue your program processing:GO;
v End your program processing:QUIT;
If your program does not contain a statement or symbol table, you can use sessionvariables to make the task of examining values of variables easier.
Even in this limited environment, HLL library routines are still available.
Chapter 41. Debugging programs in a production environment 399
Programs that are compiled with the following combination of compilers andcompiler options can have the best performance and smallest module size, whileretaining full debugging capabilities:v Enterprise COBOL for z/OS Version 5 and Version 6, with the TEST compiler
option.
Note: For Version 5, Version 6 Release 1, and Version 6 Release 2 with theTEST(NOSEPARATE) compiler option, the debug information in this case is kept ina NOLOAD segment in the program object that is only loaded when the debuggeris active.
v Enterprise COBOL for z/OS Version 4, with the TEST(NOHOOK,SEPARATE) compileroption.
v Enterprise COBOL for z/OS and OS/390 Version 3, with theTEST(NONE,SYM,SEPARATE) compiler option.
v COBOL for OS/390 & VM Version 2, with the TEST(NONE,SYM,SEPARATE)compiler option.
v Enterprise PL/I for z/OS Version 3.5 or later, with theTEST(ALL,SYM,NOHOOK,SEPARATE) compiler option.
Debugging optimized COBOL programsBefore you debug an optimized COBOL program, you must compile it with thecorrect compiler options. See “Choosing TEST or NOTEST compiler suboptions forCOBOL programs” on page 27.
The following list describes the tasks that you can do when you debug optimizedCOBOL programs:v You can set breakpoints. If the optimizer moves or removes a statement, you
cannot set a breakpoint at that statement.v You can display the value of a variable by using the LIST or LIST TITLED
commands. z/OS Debugger displays the correct value of the variable.v You can step through programs one statement at a time, or run your program
until you encounter a breakpoint.v You can use the SET AUTOMONITOR and PLAYBACK commands.v You can modify variables in an optimized program that was compiled with one
the following compilers:– Enterprise COBOL for z/OS, Version 4 and 5– Enterprise COBOL for z/OS and OS/390, Version 3 Release 2 or later– Enterprise COBOL for z/OS and OS/390, Version 3 Release 1 with APAR
PQ63235 installed– COBOL for OS/390 & VM, Version 2 Release 2– COBOL for OS/390 & VM, Version 2 Release 1 with APAR PQ63234 installed
However, results might be unpredictable. To obtain more predictable results,compile your program with Enterprise COBOL for z/OS, Version 4, and specifythe EJPD suboption of the TEST compiler option. However, variables that aredeclared with the VALUE clause to initialize them cannot be modified.
v If you are using Enterprise COBOL for z/OS, Version 4 and 5, and specify theEJPD suboption of the TEST compiler option, the JUMPTO and GOTO commands arefully enabled by the compiler for use in a debugging session.
v If you are using Enterprise COBOL for z/OS Version 4 and using OPT and theNOHOOK or NONE, and NOEJPD suboptions of the TEST compiler option, the GOTO and
400 IBM z/OS Debugger V14.1.9 User's Guide

JUMPTO commands are not enabled by the compiler. In this case, there is limitedsupport for GOTO and JUMPTO when you run the commands with SET WARNINGOFF. However, the results of using GOTO or JUMPTO in this case might beunpredictable and any problems encountered are not investigated by IBMservice.
v If you are using Enterprise COBOL for z/OS Version 5 and using OPT andNOEJPD of the TEST compiler option, the GOTO and JUMPTO are still allowed butyou need to first execute the SET WARNING OFF command. However, the results ofusing GOTO or JUMPTO in this case might be unpredictable and any problemsencountered are not investigated by IBM service.
The enhancements to the compilers help you create programs that can bedebugged in the same way that you debug programs that are not optimized, withthe following exceptionsv You cannot change the flow of your program.v You cannot use the AT CALL entry_name command. Instead, use the AT CALL *
command.v If the optimizer discarded a variable, you can refer to the variable only by using
the DESCRIBE ATTRIBUTES command. If you try to use any other command, z/OSDebugger displays a message indicating that the variable was discarded by theoptimization techniques of the compiler.
v If you use the AT command, the following restrictions apply:– You cannot specify a line number where all the statements have been
removed.– You cannot specify a range of line numbers where all the statements have
been removed.– You cannot specify a range of line numbers where the beginning point or
ending point specifies a line number where all the statements have beenremoved.
The Source window does display the variables and statements that the optimizerremoved, but you cannot use any z/OS Debugger commands on those variables orstatements. For example, you cannot list the value of a variable removed by theoptimizer.
Chapter 41. Debugging programs in a production environment 401

402 IBM z/OS Debugger V14.1.9 User's Guide
Chapter 42. Debugging UNIX System Services programs
You must debug your UNIX System Services programs in one of the followingdebugging modes:v remote debug modev full-screen mode using the Terminal Interface Manager
If your program spans more than one process, you must debug it in remote debugmode.
If one or more of the programs you are debugging are in a shared library and youare using dynamic debugging, you need to assign the environment variable_BPX_PTRACE_ATTACH a value of YES. This enables z/OS Debugger to set hooks inthe shared libraries. Programs that have a .so suffix are programs in a sharedlibrary. For more information about how to set environment variables, see yourUNIX System Services documentation.
Debugging MVS POSIX programsYou can debug MVS POSIX programs, including the following types of programs:v Programs that store source in HFS or zFSv Programs that use POSIX multithreadingv Programs that use fork/execv Programs that use asynchronous signals that are handled by the Language
Environment condition handler
To debug MVS POSIX programs in full screen mode or batch mode, the programmust run under TSO or MVS batch. If you want to run your program under theUNIX SHELL, you must debug in full-screen mode using the Terminal InterfaceManager or remote debug mode.
To debug any MVS POSIX program that spans more than one process, you mustdebug the program in remote debug mode. To customize the behavior of z/OSDebugger when a new process is created by fork or exec, use the EQAOPTSMULTIPROCESS command. For more information about EQAOPTS, see IBM z/OSDebugger Reference and Messages.
© Copyright IBM Corp. 1992, 2019 403

404 IBM z/OS Debugger V14.1.9 User's Guide

Chapter 43. Debugging non-Language Environment programs
There are several considerations that you must make when you debug programsthat do not run under the Language Environment. Some of these are unique toprograms that contain no Language Environment routines, others pertain onlywhen the initial program does not execute under control of the LanguageEnvironment, and still others apply to all programs that have mixtures ofnon-Language Environment and Language Environment programs.
Refer to the following topics for more information related to the material discussedin this topic.
Related tasksChapter 14, “Starting z/OS Debugger from the IBM z/OS Debugger Utilities,”on page 127
Debugging exclusively non-Language Environment programsWhen Language Environment is not active, you can debug only assembler,disassembly, or non-Language Environment COBOL programs. Debuggingprograms written in other languages requires the presence of an active LanguageEnvironment.
Debugging MVS batch or TSO non-Language Environment initialprograms
If the initial program that is invoked does not run under Language Environment,and you want to begin debugging before Language Environment is initialized, youmust use the EQANMDBG program to start both z/OS Debugger and your userprogram.
You do not have to use EQANMDBG to initiate a z/OS Debugger session if theinitial user program runs under control of the Language Environment, even ifother parts of the program do not run under the Language Environment.
When you use EQANMDBG to debug an assembler program that creates a COBOLreusable runtime environment, z/OS Debugger is not able to debug any COBOLprograms. You can create a COBOL reusable runtime environment in one of thefollowing ways:v Calling the preinitialization routine ILBOSTP0v Calling the preinitialization routine IGZERREv Specifying the runtime option RTEREUS.
Refer to the following topics for more information related to the material discussedin this topic.
Related referencesChapter 17, “Starting z/OS Debugger for batch or TSO programs,” on page 143z/OS Language Environment Debugging Guide
© Copyright IBM Corp. 1992, 2019 405

Debugging CICS non-Language Environment assembler ornon-Language Environment COBOL initial programs
The non-Language Environment assembler or non-Language Environment COBOLprogram that you specify in a DTCN or CADP profile that starts a debuggingsession must be one of the following:v The first program started for the CICS transaction.v The first program that runs for an EXEC CICS LINK or XCTL statement.
406 IBM z/OS Debugger V14.1.9 User's Guide
Part 7. Debugging complex applications
© Copyright IBM Corp. 1992, 2019 407

408 IBM z/OS Debugger V14.1.9 User's Guide

Chapter 44. Debugging multilanguage applications
To support multiple high-level programming languages (HLL), z/OS Debuggeradapts its commands to the HLLs, provides interpretive subsets of commands fromthe various HLLs, and maps common attributes of data types across the languages.It evaluates HLL expressions and handles constants and variables.
The topics below describe how z/OS Debugger makes it possible for you to debugprograms consisting of different languages, structures, conventions, variables, andmethods of evaluating expressions.
A general rule to remember is that z/OS Debugger tries to let the language itselfguide how z/OS Debugger works with it.
Refer to the following topics for more information related to the material discussedin this topic.
Related tasks“Qualifying variables and changing the point of view” on page 411“Debugging multilanguage applications” on page 415“Handling conditions and exceptions in z/OS Debugger” on page 413Related references“z/OS Debugger evaluation of HLL expressions”“z/OS Debugger interpretation of HLL variables and constants” on page 410“z/OS Debugger commands that resemble HLL commands” on page 410“Coexistence with other debuggers” on page 418“Coexistence with unsupported HLL modules” on page 418
z/OS Debugger evaluation of HLL expressionsWhen you enter an expression, z/OS Debugger records the programming languagein effect at that time. When the expression is run, z/OS Debugger passes it to thelanguage run time in effect when you entered the expression. This run time mightbe different from the one in effect when the expression is run.
When you enter an expression that will not be run immediately, you should fullyqualify all program variables. Qualifying the variables assures that proper contextinformation (such as load module and block) is passed to the language run timewhen the expression is run. Otherwise, the context might not be the one youintended when you set the breakpoint, and the language run time might notevaluate the expression.
Refer to the following topics for more information related to the material discussedin this topic.
Related references“z/OS Debugger evaluation of C and C++ expressions” on page 331“z/OS Debugger evaluation of COBOL expressions” on page 299“z/OS Debugger evaluation of PL/I expressions” on page 317
© Copyright IBM Corp. 1992, 2019 409

z/OS Debugger interpretation of HLL variables and constantsz/OS Debugger supports the use of HLL variables and constants, both as a part ofevaluating portions of your test program and in declaring and using sessionvariables.
Three general types of variables supported by z/OS Debugger are:v Program variables defined by the HLL compiler's symbol tablev z/OS Debugger variables denoted by the percent (%) signv Session variables declared for a given z/OS Debugger session and existing only
for the session
HLL variablesSome variable references require language-specific evaluation, such as pointerreferencing or subscript evaluation. Once again, the z/OS Debugger interprets eachcase in the manner of the HLL in question. Below is a list of some of the areaswhere z/OS Debugger accepts a different form of reference depending on thecurrent programming language:v Structure qualification
C and C++ and PL/I: dot (.) qualification, high-level to low-levelCOBOL: IN or OF keyword, low-level to high-level
v SubscriptingC and C++: name [subscript1][subscript2]...COBOL and PL/I: name(subscript1,subscript2,...)
v Reference modificationCOBOL name(left-most-character-position: length)
HLL constantsYou can use both string constants and numeric constants. z/OS Debugger acceptsboth types of constants in C and C++, COBOL, and PL/I.
z/OS Debugger commands that resemble HLL commandsTo allow you to use familiar commands while in a debug session, z/OS Debuggerprovides an interpretive subset of commands for each language. This consists ofcommands that have the same syntax, whether used with z/OS Debugger or whenwriting application programs. You use these commands in z/OS Debugger asthough you were coding in the original language.
Use the SET PROGRAMMING LANGUAGE command to set the current programminglanguage to the desired language. The current programming language determineshow commands are parsed. If you SET PROGRAMMING LANGUAGE to AUTOMATIC, everytime the current qualification changes to a module in a different language, thecurrent programming language is automatically updated.
The following types of z/OS Debugger commands have the same syntax (or asubset of it) as the corresponding statements (if defined) in each supportedprogramming language:
AssignmentThese commands allow you to assign a value to a variable or reference.
410 IBM z/OS Debugger V14.1.9 User's Guide

ConditionalThese commands evaluate an expression and control the flow of executionof z/OS Debugger commands according to the resulting value.
DeclarationsThese commands allow you to declare session variables.
LoopingThese commands allow you to program an iterative or logical loop as az/OS Debugger command.
MultiwayThese commands allow you to program multiway logic in the z/OSDebugger command language.
In addition, z/OS Debugger supports special kinds of commands for somelanguages.
Related references“z/OS Debugger commands that resemble C and C++ commands” on page 323“z/OS Debugger commands that resemble COBOL statements” on page 293
Qualifying variables and changing the point of viewEach HLL defines a concept of name scoping to allow you, within a single compileunit, to know what data is referenced when a name is used (for example, if youuse the same variable name in two different procedures). Similarly, z/OS Debuggerdefines the concepts of qualifiers and point of view for the run-time environmentto allow you to reference all variables in a program, no matter how manysubroutines it contains. The assignment x = 5 does not appear difficult for z/OSDebugger to process. However, if you declare x in more than one subroutine, thesituation is no longer obvious. If x is not in the currently executing compile unit,you need a way to tell z/OS Debugger how to determine the proper x.
You also need a way to change the z/OS Debugger's point of view to allow it toreference variables it cannot currently see (that is, variables that are not within thescope of the currently executing block or compile unit, depending upon the HLL'sconcept of name scoping).
Refer to the following topics for more information related to the material discussedin this topic.
Related tasks“Qualifying variables”“Changing the point of view” on page 413
Qualifying variablesQualification is a method you can use to specify to what procedure or load modulea particular variable belongs. You do this by prefacing the variable with the block,compile unit, and load module (or as many of these labels as are necessary),separating each label with a colon (or double colon following the load modulespecification) and a greater-than sign (:>), as follows:load_name::>cu_name:>block_name:>object
This procedure, known as explicit qualification, lets z/OS Debugger know preciselywhere the variable is.
Chapter 44. Debugging multilanguage applications 411
If required, load_name is the load module name. It is required only when theprogram consists of multiple load modules and when you want to change thequalification to other than the current load module. load_name can be the z/OSDebugger variable %LOAD.
If required, cu_name is the compile unit name. The cu_name is required only whenyou want to change the qualification to other than the currently qualified compileunit. cu_name can be the z/OS Debugger variable %CU.
If required, block_name is the program block name. The block_name is required onlywhen you want to change the qualification to other than the currently qualifiedblock. block_name can be the z/OS Debugger variable %BLOCK.
For PL/I only:v In PL/I, the primary entry name of the external procedure is the same as the
compile unit name. When qualifying to the external procedure, the procedurename of the top procedure in a compile unit fully qualifies the block. Specifyingboth the compile unit and block name results in an error. For example:LM::>PROC1:>variable
is valid.LM::>PROC1:>PROC1:>variable
is not valid.
For C++ only:v You must specify the full function qualification including formal parameters
where they exist. For example:1. For function (or block) ICCD2263() declared as void ICCD2263(void) within
CU "USERID.SOURCE.LISTING(ICCD226)" the correct block specification forC++ would include the parenthesis () as follows:qualify block %load::>"USERID.SOURCE.LISTING(ICCD226)":>ICCD2263()
2. For CU ICCD0320() declared as int ICCD0320(signed long int SVAR1, signedlong int SVAR2) the correct qualification for AT ENTRY is:AT ENTRY "USERID.SOURCE.LISTING(ICCD0320)":>ICCD0320(long,long)
Use the z/OS Debugger command DESCRIBE CUS to give you the correctBLOCK or CU qualification needed.Use the LIST NAMES command to show all polymorphic functions of a givenname. For the example above, LIST NAMES "ICCD0320*" would list allpolymorphic functions called ICCD0320.
You do not have to preface variables in the currently executing compile unit. Theseare already known to z/OS Debugger; in other words, they are implicitly qualified.
In order for attempts at qualifying a variable to work, each block must have aname. Blocks that have not received a name are named by z/OS Debugger, usingthe form: %BLOCKnnn, where nnn is a number that relates to the position of the blockin the program. To find out the name of z/OS Debugger for the current block, usethe DESCRIBE PROGRAMS command.
Refer to the following topics for more information related to the material discussedin this topic.
Related references
412 IBM z/OS Debugger V14.1.9 User's Guide

“Qualifying variables and changing the point of view in C and C++” on page339“Qualifying variables and changing the point of view in COBOL” on page 301
Changing the point of viewThe point of view is usually the currently executing block. You can get toinaccessible data by changing the point of view using the SET QUALIFY commandwith the following operand.load_name::>cu_name:>block_name
Each time you update any of the three z/OS Debugger variables %CU, %PROGRAM, or%BLOCK, all four variables (%CU, %PROGRAM, %LOAD, and %BLOCK) are automaticallyupdated to reflect the new point of view. If you change %LOAD using SET QUALIFYLOAD, only %LOAD is updated to the new point of view. The other three z/OSDebugger variables remain unchanged. For example, suppose your program iscurrently suspended at loadx::>cux:>blockx. Also, the load module loadz,containing the compile unit cuz and the block blockz, is known to z/OS Debugger.The settings currently in effect are:
%LOAD = loadx%CU = cux%PROGRAM = cux%BLOCK = blockx
If you enter any of the following commands:SET QUALIFY BLOCK blockz;
SET QUALIFY BLOCK cuz:>blockz;
SET QUALIFY BLOCK loadz::>cuz:>blockz;
the following settings are in effect:%LOAD = loadz%CU = cuz%PROGRAM = cuz%BLOCK = blockz
If you are debugging a program that has multiple enclaves, SET QUALIFY can beused to identify references and statement numbers in any enclave by resetting thepoint of view to a new block, compile unit, or load module.
Related tasksChapter 46, “Debugging across multiple processes and enclaves,” on page 421“Changing the point of view in C and C++” on page 340“Changing the point of view in COBOL” on page 303
Handling conditions and exceptions in z/OS DebuggerTo suspend program execution just before your application would terminateabnormally, start your application with the following runtime options:TRAP(ON)TEST(ALL,*,NOPROMPT,*)
When a condition is signaled in your application, z/OS Debugger prompts youand you can then dynamically code around the problem. For example, you caninitialize a pointer, allocate memory, or change the course of the program with theGOTO command. You can also indicate to Language Environment's conditionhandler, that you have handled the condition by issuing a GO BYPASS command. Be
Chapter 44. Debugging multilanguage applications 413

aware that some of the code that follows the instruction that raised the conditionmight rely on data that was not properly stored or handled.
When debugging with z/OS Debugger, you can (depending on your host system)either instruct the debugger to handle program exceptions and conditions, or passthem on to your own exception handler. Programs also have access to LanguageEnvironment services to deal with program exceptions and conditions.
Refer to the following topics for more information related to the material discussedin this topic.
Related tasks“Handling conditions in z/OS Debugger”“Handling exceptions within expressions (C and C++ and PL/I only)” on page415
Handling conditions in z/OS DebuggerYou can use either or both of the two methods during a debugging session toensure that z/OS Debugger gains control at the occurrence of HLL conditions.
If you specify TEST(ALL) as a run-time option when you begin your debug session,z/OS Debugger gains control at the occurrence of most conditions.
Note: z/OS Debugger recognizes all Language Environment conditions that aredetected by the Language Environment error handling facility.
You can also direct z/OS Debugger to respond to the occurrence of conditions byusing the AT OCCURRENCE command to define breakpoints. These breakpoints haltprocessing of your program when a condition is raised, after which z/OSDebugger is given control. It then processes the commands you specified whenyou defined the breakpoints.
There are several ways a condition can occur, and several ways it can be handled.
When a condition can occurA condition can occur during your z/OS Debugger session when:v A C++ application throws an exception.v A C and C++ application program executes a raise statement.v A PL/I application program executes a SIGNAL statement.v The z/OS Debugger command TRIGGER is executed.v Program execution causes a condition to exist. In this case, conditions are not
raised at consistency points (the operations causing them can consist of severalmachine instructions, and consistency points usually occur at the beginnings andends of statements).
v The setting of WARNING is OFF (for C and C++ and PL/I).
When a condition occursWhen an HLL condition occurs and you have defined a breakpoint with associatedactions, those actions are first performed. What happens next depends on how theactions end.v Your program's execution can be terminated with a QUIT command. If you are
debugging a CICS non-Language Environment assembler or non-LanguageEnvironment COBOL programs, QUIT ends z/OS Debugger and the task endswith an ABEND 4038.
414 IBM z/OS Debugger V14.1.9 User's Guide

v Control of your program's execution can be returned to the HLL exceptionhandler, using the GO command, so that processing proceeds as if z/OSDebugger had never been invoked (even if you have perhaps used it to changesome variable values, or taken some other action).
v Control of your program's execution can be returned to the program itself, usingthe GO BYPASS command, bypassing any further processing of this exceptioneither by the user program or the environment.
v PL/I allows GO TO out of block;, so execution control can be passed to someother point in the program.
v If no circumstances exist explicitly directing the assignment of control, yourprimary commands file or terminal is queried for another command.
If, after the execution of any defined breakpoint, control returns to your programwith a GO, the condition is raised again in the program (if possible and stillapplicable). If you use a GOTO to bypass the failing statement, you also bypass yourprogram's error handling facilities.
Refer to the following topics for more information related to the material discussedin this topic.
Related references“Language Environment conditions and their C and C++ equivalents” on page330“PL/I conditions and condition handling” on page 313z/OS Language Environment Programming GuideEnterprise COBOL for z/OS Language Reference
Handling exceptions within expressions (C and C++ and PL/Ionly)
When an exception such as division by zero is detected in a z/OS Debuggerexpression, you can use the z/OS Debugger command SET WARNING to controlz/OS Debugger and program response. During an interactive z/OS Debuggersession, such exceptions are sometimes due to typing errors and so are probablynot intended to be passed to the program. If you do not want errors in z/OSDebugger expressions to be passed to your program, use SET WARNING ON.Expressions containing such errors are terminated, and a warning message isdisplayed.
However, you might want to pass an exception to your program, perhaps to testan error recovery procedure. In this case, use SET WARNING OFF.
Refer to the following topics for more information related to the material discussedin this topic.
Related tasks“Using SET WARNING PL/I command with built-in functions” on page 320
Debugging multilanguage applicationsLanguage Environment simplifies the debugging of multilanguage applications byproviding a single run-time environment and interlanguage communication (ILC).
When the need to debug a multilanguage application arises, you can find yourselffacing one of the following scenarios:
Chapter 44. Debugging multilanguage applications 415

v You need to debug an application written in more than one language, whereeach language is supported by Language Environment and can be debugged byz/OS Debugger.
v You need to debug an application written in more than one language, where notall of the languages are supported by Language Environment, nor can they bedebugged by z/OS Debugger.
When writing a multilanguage application, a number of special considerationsarise because you must work outside the scope of any single language. TheLanguage Environment initialization process establishes an environment tailored tothe set of HLLs constituting the main load module of your application program.This removes the need to make explicit calls to manipulate the environment. Also,termination of the Language Environment environment is accomplished in anorderly fashion, regardless of the mixture of HLLs present in the application.
Refer to the following topics for more information related to the material discussedin this topic.
Related tasks“Debugging an application fully supported by Language Environment”“Using session variables across different programming languages”
Debugging an application fully supported by LanguageEnvironment
If you are debugging a program written in a combination of languages supportedby Language Environment and compiled by supported compilers, very little isrequired in the way of special actions. z/OS Debugger normally recognizes achange in programming languages and automatically switches to the correctlanguage when a breakpoint is reached. If desired, you can use the SETPROGRAMMING LANGUAGE command to stay in the language you specify; however, youcan only access variables defined in the currently set programming language.
When defining session variables you want to access from compile units of differentlanguages, you must define them with compatible attributes.
Refer to the following topics for more information related to the material discussedin this topic.
Related tasks“Using session variables across different programming languages”Related referencesz/OS Language Environment Programming Guide
Using session variables across different programminglanguages
While working in one language, you can declare session variables that you cancontinue to use after calling in a load module of a different language. The tablebelow shows how the attributes of session variables are mapped acrossprogramming languages. Session variables with attributes not shown in the tablecannot be accessed from other programming languages. (Some attributes supportedfor C and C++ or PL/I session variables cannot be mapped to other languages;session variables defined with these attributes cannot be accessed outside thedefining language. However, all of the supported attributes for COBOL session
416 IBM z/OS Debugger V14.1.9 User's Guide

variables can be mapped to equivalent supported attributes in C and C++ andPL/I, so any session variable that you declare with COBOL can be accessed from Cand C++ and PL/I.)
Machine attributes PL/I attributes C and C++ attributes COBOL attributes Assembler,disassembly, andLangX COBOLattributes
byte CHAR(1) unsigned char PICTURE X DS X orDS C
byte string CHAR(j) unsigned char[j] PICTURE X(j) DS XLj orDS CLj
halfword FIXED BIN(15,0) signed short int PICTURE S9(j≤4)USAGE BINARY
DS H
fullword FIXED BIN(31,0) signed long int PICTURE S9(4<j≤9)USAGE BINARY
DS F
floating point FLOAT BIN(21) orFLOAT DEC(6)
float USAGE COMP-1 DS E
long floating point FLOAT BIN(53) orFLOAT DEC(16)
double USAGE COMP-2 DS D
extended floatingpoint
FLOAT BIN(109) orFLOAT DEC(33)
long double n/a DS L
fullword pointer POINTER * USAGE POINTER DS A
Note: When registering session variables in PL/I, the DECIMAL type is always thedefault. For example, if C declares a float, PL/I registers the variable as a FLOATDEC(6) rather than a FLOAT BIN(21).
When declaring session variables, remember that C and C++ variable names arecase-sensitive. When the current programming language is C and C++, onlysession variables that are declared with uppercase names can be shared withCOBOL or PL/I. When the current programming language is COBOL or PL/I,session variable names in mixed or lowercase are mapped to uppercase. TheseCOBOL or PL/I session variables can be declared or referenced using any mixtureof lowercase and uppercase characters and it makes no difference. However, if thesession variable is shared with C and C++, within C and C++, it can only bereferred to with all uppercase characters (since a variable name composed of thesame characters, but with one or more characters in lowercase, is a differentvariable name in C and C++).
Session variables with incompatible attributes cannot be shared between otherprogramming languages, but they do cause session variables with the same namesto be deleted. For example, COBOL has no equivalent to PL/I's FLOAT DEC(33) orC's long double. With the current programming language COBOL, if a sessionvariable X is declared PICTURE S9(4), it will exist when the current programminglanguage setting is PL/I with the attributes FIXED BIN(15,0) and when the current
Chapter 44. Debugging multilanguage applications 417

programming language setting is C with the attributes signed short int. If thecurrent programming language setting is changed to PL/I and a session variable Xis declared FLOAT DEC(33), the X declared by COBOL will no longer exist. Thevariable X declared by PL/I will exist when the current programming languagesetting is C with the attributes long double.
Refer to the following topics for more information related to the material discussedin this topic.
Related references“z/OS Debugger interpretation of HLL variables and constants” on page 410
Creating a commands file that can be used across differentprogramming languages
If you want to create a commands file to use across different programminglanguages, “Creating a commands file” on page 186 describes some guidelines youshould follow to ensure that the commands files works correctly.
Coexistence with other debuggersCoexistence with other debuggers cannot be guaranteed because there can besituations where multiple debuggers might contend for use of storage, facilities,and interfaces that are intended for only one requester.
Refer to the following topics for more information related to the material discussedin this topic.
Related references“Coexistence with unsupported HLL modules”
Coexistence with unsupported HLL modulesCompile units or program units written in unsupported high- or low-levellanguages, or in older releases of HLLs, are tolerated. See Using CODE/370 with VSCOBOL II and OS PL/I for information about two unsupported HLLs that can beused with z/OS Debugger.
Refer to the following topics for more information related to the material discussedin this topic.
Related references“Coexistence with other debuggers”
418 IBM z/OS Debugger V14.1.9 User's Guide

Chapter 45. Debugging multithreading programs
You can run your multithreading programs with z/OS Debugger when POSIXpthread_create is used to create new threads under Language Environment. Whenmore than one thread is involved in your program, z/OS Debugger might bestarted by any or all of them. Because conflicting use of the terminal or log file, forexample, could occur if z/OS Debugger is operating on multiple threads, its use issingle-threaded. So, if your program runs as two threads (thread A and thread B)and thread A calls z/OS Debugger, z/OS Debugger accepts the request and beginsoperating on behalf of thread A. If, during that period, thread B calls z/OSDebugger, the request from thread B is held until the request from thread A iscomplete (for example, you issued a STEP or GO command). z/OS Debugger isthen released and can accept any pending invocation.
Restrictions when debugging multithreading applicationsv Debugging applications that create another thread is constrained because both
threads compete for the use of the terminal.v Only the variables and symbol information for compile units in the thread that
is being debugged are accessible.v The LIST CALL command provides a traceback of the compile units only in the
current thread.
Refer to the following topics for more information related to the material discussedin this topic.
Related referencesz/OS Language Environment Programming Guide
© Copyright IBM Corp. 1992, 2019 419

420 IBM z/OS Debugger V14.1.9 User's Guide

Chapter 46. Debugging across multiple processes andenclaves
There is a single z/OS Debugger session across all enclaves in a process.Breakpoints set in one process are restored when the new process begins in thenew session.
In full-screen mode or batch mode, you can debug a non-POSIX program thatspans more than one process, but z/OS Debugger can be active in only oneprocess. In remote debug mode, you can debug a POSIX program that spans morethan one process. The remote debugger can display each process.
When you are recording the statements that you run, data collection persists acrossmultiple enclaves until you stop recording. When you replay your statements, thedata is replayed across the enclave boundaries in the same order as they wererecorded.
A commands file continues to execute its series of commands regardless of whatlevel of enclave is entered.
Refer to the following topics for more information related to the material discussedin this topic.
Related tasks“Starting z/OS Debugger within an enclave”“Viewing z/OS Debugger windows across multiple enclaves” on page 422“Ending a z/OS Debugger session within multiple enclaves” on page 422“Using z/OS Debugger commands within multiple enclaves” on page 422
Starting z/OS Debugger within an enclaveAfter an enclave in a process activates z/OS Debugger, it remains activethroughout subsequent enclaves in the process, regardless of whether the run-timeoptions for the enclave specify TEST or NOTEST. z/OS Debugger retains the settingsspecified from the TEST run-time option for the enclave that activated it, until youmodify them with SET TEST. If your z/OS Debugger session includes more thanone process, the settings for TEST are reset according to those specified on the TESTrun-time option of the first enclave that activates z/OS Debugger in each newprocess.
If z/OS Debugger is first activated in a nested enclave of a process, and you stepor go back to the parent enclave, you can debug the parent enclave. However, ifthe parent enclave contains COBOL but the nested enclave does not, z/OSDebugger is not active for the parent enclave, even upon return from the childenclave.
Upon activation of z/OS Debugger, the initial commands string, primarycommands file, and the preferences file are run. They run only once, and affect theentire z/OS Debugger session. A new primary commands file cannot be started fora new enclave.
© Copyright IBM Corp. 1992, 2019 421

Viewing z/OS Debugger windows across multiple enclavesWhen an enclave starts another enclave, all compile units in the first enclave arehidden. You can change the point of view to a new compile unit (by using the SETQUALIFY command) only if that compile unit is in the current enclave.
Ending a z/OS Debugger session within multiple enclavesIf you specify the NOPROMPT suboption of the TEST runtime option for the nextprocess on the host, z/OS Debugger restores the saved breakpoints after it gainscontrol of that next process. However, z/OS Debugger might gain control of theprocess after many statements have been run. Therefore, z/OS Debugger might notrun some or all of the following breakpoints:v STATEMENT/LINE
v ENTRY
v EXIT
v LABEL
If you have not used these breakpoint types, you can specify NOPROMPT.
In a single enclave, QUIT closes z/OS Debugger. For CICS non-LanguageEnvironment programs (assembler or non-Language Environment COBOL), QUITcloses z/OS Debugger and the task ends with an ABEND 4038, regardless of thelink level.
In a nested enclave, however, QUIT causes z/OS Debugger to signal a severity 3condition that corresponds to Language Environment message CEE2529S. Thesystem is trying to cleanly terminate all enclaves in the process.
Normally, the condition causes the current enclave to terminate. Then, the samecondition will be raised in the parent enclave, which will also terminate. Thissequence continues until all enclaves in the process have been terminated. As aresult, you will see a CEE2529S message for each enclave that is terminated.
For CICS and MVS only: Depending on Language Environment run-time settings,the application might be terminated with an ABEND 4038. This termination isnormal and should be expected.
Using z/OS Debugger commands within multiple enclavesSome z/OS Debugger commands and variables have a specific scope for enclavesand processes. The table below summarizes the behavior of specific z/OSDebugger commands and variables when you are debugging an application thatconsists of multiple enclaves.
z/OS Debugger commandAffects current
enclave only
Affects entirez/OS Debugger
session Comments
%CAAADDRESS X
AT GLOBAL X
AT TERMINATION X
code coverageSTART X
code coverageSTOP X
422 IBM z/OS Debugger V14.1.9 User's Guide

z/OS Debugger commandAffects current
enclave only
Affects entirez/OS Debugger
session Comments
CLEAR AT X X In addition to clearing breakpoints set in thecurrent enclave, CLEAR AT can clear globalbreakpoints.
CLEAR DECLARE X
CLEAR LDD X
CLEAR VARIABLES X
Declarations X Session variables are cleared at the termination ofthe process in which they were declared.
DISABLE X X In addition to disabling breakpoints set in thecurrent enclave, DISABLE can disable globalbreakpoints.
ENABLE X X In addition to enabling breakpoints set in thecurrent enclave, ENABLE can enable globalbreakpoints.
LIST AT X X In addition to listing breakpoints set in thecurrent enclave, LIST AT can list globalbreakpoints.
LIST CALLS X Applies to all systems except MVS batch andMVS with TSO. Under MVS batch and MVS withTSO, LIST CALLS lists the call chain for the currentactive thread in the current active enclave.
For programs containing interlanguagecommunication (ILC), routines from previousenclaves are only listed if they are coded in alanguage that is active in the current enclave.Note: Only compile units in the current threadwill be listed for PL/I multitasking applications.
LIST CC X Only source statements for the current enclavewill be displayed.
LIST EXPRESSION X You can only list variables in the currently activethread.
LIST LAST X
LIST LDD X
LIST NAMES CUS X Applies to compile unit names. In the DebugFrame window, compile units in parent enclavesare marked as deactivated.
LIST NAMES LABELS X You can only list variables in the currently activethread.
LIST NAMES TEST X Applies to z/OS Debugger session variablenames.
MONITOR GLOBAL X Applies to Global monitors.
PLAYBACK ENABLE X The PLAYBACK command that informs z/OSDebugger to begin the recording session.
PLAYBACK DISABLE X The PLAYBACK command that informs z/OSDebugger to stop the recording session.
Chapter 46. Debugging across multiple processes and enclaves 423

z/OS Debugger commandAffects current
enclave only
Affects entirez/OS Debugger
session Comments
PLAYBACK START X The PLAYBACK command that suspends executionof the program and indicates to z/OS Debuggerto enter replay mode.
PLAYBACK STOP X The PLAYBACK command that terminates replaymode and resumes normal execution of z/OSDebugger.
PLAYBACK BACKWARD X The PLAYBACK command that indicates to z/OSDebugger to perform STEP and RUNTO commandsbackward, starting from the current point andgoing to previous points.
PLAYBACK FORWARD X The PLAYBACK command that indicates to z/OSDebugger to perform STEP and RUNTO commandsforward, starting from the current point andgoing to the next point.
PROCEDURE X
SET AUTOMONITOR1 X Controls the monitoring of data items at thecurrently executing statement.
SET COUNTRY1 X This setting affects both your application andz/OS Debugger.
At the beginning of an enclave, the settings arethose provided by Language Environment or youroperating system. For nested enclaves, theparent's settings are restored upon return from achild enclave.
SET EQUATE1 X
SET INTERCEPT1 X For C, intercepted streams or files cannot be partof any C I/O redirection during the execution of anested enclave. For example, if stdout isintercepted in program A, program A cannot thenredirect stdout to stderr when it does a system()call to program B. Also, not supported for PL/I.
SET NATIONAL LANGUAGE1 X This setting affects both your application andz/OS Debugger.
At the beginning of an enclave, the settings arethose provided by Language Environment or youroperating system. For nested enclaves, theparent's settings are restored upon return from achild enclave.
SET PROGRAMMING LANGUAGE1 X Applies only to programming languages in whichcompile units known in the current enclave arewritten (a language is "known" the first time it isentered in the application flow).
SET QUALIFY1 X Can only be issued for load modules, compileunits, and blocks that are known in the currentenclave.
SET TEST1 X
424 IBM z/OS Debugger V14.1.9 User's Guide

z/OS Debugger commandAffects current
enclave only
Affects entirez/OS Debugger
session Comments
TRIGGER condition2 X Applies to triggered conditions.2 Conditions canbe either an Language Environment symbolicfeedback code, or a language-oriented keyword orcode, depending on the current programminglanguage setting.
TRIGGER AT X X In addition to triggering breakpoints set in thecurrent enclave, TRIGGER AT can trigger globalbreakpoints.
Note:
1. SET commands other than those listed in this table affect the entire z/OSDebugger session.
2. If no active condition handler exists for the specified condition, the defaultcondition handler can cause the program to end prematurely.
Chapter 46. Debugging across multiple processes and enclaves 425

426 IBM z/OS Debugger V14.1.9 User's Guide

Chapter 47. Debugging a multiple-enclave interlanguagecommunication (ILC) application
When you debug a multiple-enclave ILC application with z/OS Debugger, use theSET PROGRAMMING LANGUAGE to change the current programming language setting.The programming language setting is limited to the languages currently known toz/OS Debugger (that is, languages contained in the current load module).
Command lists on monitors and breakpoints have an implied programminglanguage setting, which is the language that was in effect when the monitor orbreakpoint was established. Therefore, if you change the language setting, errorsmight result when the monitor is refreshed or the breakpoint is triggered.
© Copyright IBM Corp. 1992, 2019 427

428 IBM z/OS Debugger V14.1.9 User's Guide

Chapter 48. Debugging programs called by Java nativemethods
This topic describes how to debug, with z/OS Debugger, Java native methods andthe programs they call that are running in Language Environment. By insertingcalls to the Language Environment CWI service CEE3CBTS and callable serviceCEETEST into your Java native method or program and compiling your methodsor programs with the HOOK suboption of the TEST compiler option, you can debugyour application. These instructions describe how to insert the calls to CEE3CBTSand CEETEST directly into your method or program.
These instructions assume you understand the following items:v You understand Java JNI interface.v You have configured a remote debugger to debug the Java native method and
the programs it calls. You need to know the IP address and port ID of theremote debugger.
v You can modify the compilation parameters of the Java native method and theprograms it calls.
Do the following steps:1. Review the description of the Language Environment CWI service CEE3CBTS
in Language Environment Vendor Interfaces. For this situation, specify thefollowing values for the elements in the structure:v TCP/IP address, as described in the Language Environment Vendor Interfaces
v Debugger port ID, as described in the Language Environment Vendor Interfaces
v Client Process ID, assign a value of 0v Client Thread ID, assign a value of 0v Client IP address, assign a value of 0v Debug Flow, assign a value of 1
2. Choose which programs that the native method calls to debug. Decide whereyou want to start and stop debugging.
3. In the Java native method, add a call to CEE3CBTS with the AttachDebugfunction code and assign values to the debug context parameters.
4. In the Java native method or the programs it calls, add a call to CEETEST.CEETEST is the way you start z/OS Debugger for this situation.
5. In the Java native method, add a call to CEE3CBTS with the StopDebug functioncode to stop the debug session.
6. Run the JCL for your programs. Your remote debugging session starts.
After you finish debugging your Java native method and the programs called bythe Java native method, remove the modifications done in these steps beforemoving your application to a production environment.
Refer to the following topics for more information related to the material discussedin this topic.
Related tasks“Starting z/OS Debugger with CEETEST” on page 131“Choosing TEST or NOTEST compiler suboptions for COBOL programs” onpage 27
© Copyright IBM Corp. 1992, 2019 429

“Choosing TEST or NOTEST compiler suboptions for PL/I programs” on page35“Choosing TEST or DEBUG compiler suboptions for C programs” on page 41“Choosing TEST or DEBUG compiler suboptions for C++ programs” on page 46
Related referencesLanguage Environment Vendor Interfaces
430 IBM z/OS Debugger V14.1.9 User's Guide

Chapter 49. Solving problems in complex applications
This section describes some problems you might encounter while you try to debugcomplex applications and some possible solutions.
Debugging programs loaded from library lookaside (LLA)z/OS Debugger obtains information about programs in memory by using binderAPIs. The binder APIs must access information stored in the data set containingthe load module or program object. In most cases, z/OS can provide z/OSDebugger the data set name from which the program was loaded so z/OSDebugger can pass it to the binder APIs. However, z/OS does not have thisinformation for programs loaded from LLA.
When z/OS Debugger attempts to debug a program loaded from LLA, z/OSDebugger does the following steps:v z/OS Debugger checks for the allocation of DD name EQALOAD and checks
that it contains a member name that matches the program that LLA loaded.v If z/OS Debugger does not find a program by the specified name in EQALOAD,
z/OS Debugger checks for the allocation of DD name STEPLIB and checks thatit contains a member name that matches the program that LLA loaded.
v If z/OS Debugger does find a program by the specified name in one of theprevious steps and the length of this program matches the length of the programin memory, z/OS Debugger passes the data set name from the correspondingDD statement to the binder APIs to use it to obtain the information.
The following restrictions apply:v z/OS Debugger cannot always determine the exact length of the program in
memory. In certain situations, the length might be rounded to a multiple of 4K.Therefore, the length checking is not always exact and programs that mightappear the same length are not.
v The copy of the program found in DD name EQALOAD or DD name STEPLIBmust exactly match the copy in memory. If the program found does not exactlymatch the copy loaded from LLA (even though the lengths match),unpredictable problems, including abends, might occur.
v If you are running DTSU in foreground, you must use DD name EQALOAD.When a DD name of STEPLIB is specified when DTSU is running in the TSOforeground, DTSU uses a different DD name and, therefore, z/OS Debuggercannot find STEPLIB.
Debugging user programs that use system prefixed namesz/OS Debugger assumes that load module and compile unit names that begin withspecific prefixes are system components. For example, EQAxxxxx is a z/OSDebugger module, CEExxxxx is a Language Environment module, and IGZxxxxx isa COBOL module.
z/OS Debugger does not try to debug load modules or compile units that havethese prefixes for the following reasons:v z/OS Debugger might perform improper recursions that might result in
abnormally endings (ABENDs) or other erroneous behavior.
© Copyright IBM Corp. 1992, 2019 431

v z/OS Debugger assumes users do not have access to the source for these loadmodules and library routines.
v Creating debug information for these routines would waste significant amountsof memory and other resources.
If you have named a user load module or compile unit with a prefix that conflictswith one of these system prefixes, you can use the NAMES INCLUDE command andthe instructions described in this section to debug this load module or compileunit.
IMPORTANT: Do not use the NAMES INCLUDE command to debug systemcomponents (for example, z/OS Debugger, Language Environment, CICS, IMS, orcompiler run-time modules). If you attempt to do debug these system components,you might experience unpredictable failures. Only use this command to debug userprograms that are named with prefixes that z/OS Debugger recognizes as systemcomponents.
Displaying system prefixesYou can display a list of prefixes that z/OS Debugger recognizes as system prefixesby using the following commands:NAMES DISPLAY ALL EXCLUDED LOADMODS;NAMES DISPLAY ALL EXCLUDED CUS;
These commands display a list of names currently excluded at your request (byusing the NAMES EXCLUDE command), followed by a section displaying a list ofnames excluded by z/OS Debugger.
Refer to the following topics for more information related to the material discussedin this topic.
Related referencesNAMES command in IBM z/OS Debugger Reference and Messages
Debugging programs with names similar to systemcomponents
If the name of your program begins with one of the prefixes excluded by z/OSDebugger, use the NAMES INCLUDE command to indicate to z/OS Debugger thatyour program is a user load module or compile unit, not a system program.
Refer to the following topics for more information related to the material discussedin this topic.
Related references"NAMES command" in IBM z/OS Debugger Reference and Messages
Debugging programs containing data-only modulesSome programs contain load modules or compile units that have no executablecode. These modules are known as data-only modules. These modules areprevalent in assembler programs. In some situations, z/OS Debugger might notrecognize that these modules contain no executable instructions and attempt to seta breakpoint, which means overlaying the contents of these modules.
In these situations, you can use the NAMES EXCLUDE command to indicate to z/OSDebugger that these are data-only modules that contain no executable code. z/OSDebugger will not attempt to set breakpoints in these data-only modules. If the
432 IBM z/OS Debugger V14.1.9 User's Guide

NAMES EXCLUDE command is used to exclude a module that contains executableinstructions, the module might still appear in z/OS Debugger and z/OS Debuggermight still attempt to set breakpoints in the modules.
Refer to the following topics for more information related to the material discussedin this topic.
Related references"NAMES command" in IBM z/OS Debugger Reference and Messages
Optimizing the debugging of large applicationsz/OS Debugger was designed is to implicitly load the debug data for any compileunits compiled with the TEST or DEBUG compiler option. However, some very largeapplications can contain a large number of load modules or compile units that youdo not need to debug. In some cases, the creation and manipulation of debug datafor these load modules or compile units can consume a significant amount ofmemory, CPU time, and other resources.
You can handle this situation in one of the following ways:v Change the default behavior so that z/OS Debugger loads debug data only for
modules that you indicate that you want to debug.v Indicate to z/OS Debugger that you do not want to debug certain modules.
Using explicit debug mode to load debug data for onlyspecific modules
By default, z/OS Debugger automatically loads debug data whenever it encountersa high-level language compile unit compiled with the TEST or DEBUG compileroption. In most cases, this is the most convenient mode of operation because youdo not have to decide in advance which load modules and compile units you wantto debug. However, in some complex applications, manipulating this data mightcause a significant performance impact. In this case, you can use explicit debugmode to load debug data only for compile units that you indicate you want todebug.
You enable explicit debug mode by entering the SET EXPLICITDEBUG ON commandor by specifying the EQAOPTS EXPLICITDEBUG command. By default, this mode isOFF. In explicit debug mode, (except for cases described below) you must use theLOADDEBUGDATA (LDD) command to cause z/OS Debugger to load the debug data forthe compile units that you want to debug.
In most cases, you can use the SET EXPLICTDEBUG command to enable explicitdebug mode; however, in some cases you might need to use the EQAOPTSEXPLICITDEBUG command. Because z/OS Debugger does not process commandsuntil after it processes the initial load module and all the compile units it contains,if you want z/OS Debugger to not load debug data for compile units in the initialload module, use the EQAOPTS EXPLICITDEBUG command.
When explicit debug mode is active, z/OS Debugger loads debug data in only thefollowing cases:v For the compile unit where z/OS Debugger first became active and the first
compile unit in each enclave. In most cases, this is the entry compile unit for theinitial load module.
Chapter 49. Solving problems in complex applications 433

v Whenever z/OS Debugger loads a load module and you previously entered aLOADDEBUGDATA (LDD) command for that load module and compile unit or whenyou enter an LDD command for a compile unit in the current load module.
v Whenever z/OS Debugger processes a load module for any of the followingreasons and you previously specified the compile unit on a NAMES INCLUDE CUcommand:– It is the initial load module.– When z/OS Debugger loads a load module that you previously specified on
an LDD command.– When z/OS Debugger loads a load module that you previously specified on a
NAMES INCLUDE LOADMOD command.– It is a load module for which z/OS Debugger generated an implicit NAMES
INCLUDE LOADMOD command.v For the target of a deferred AT ENTRY which specifies both load module and
compile unit names and in which the compile unit name is not a source filename enclosed in quotation marks (").
v For the entry point compile unit of a load module that you specified in an ATLOAD command.
v In CICS, for the load module and compile units you specified in DTCN or theProgram and Comp Unit you specified in CADP, unless they contain an asterisk(*).
z/OS Debugger does not support the SET DISASSEMBLY ON command in explicitdebug mode. When explicit debug mode is active, z/OS Debugger forces SETDISASSEMBLY OFF and you will not be able to set it back to ON while in explicitdebug mode.
Excluding specific load modules and compile unitsIn some cases, you might know that there are certain load modules or compileunits that you do not want to debug. In this case, you can improve performance byinforming z/OS Debugger to not load debug data for these load modules orcompile units.
You can use the NAMES EXCLUDE command to indicate to z/OS Debugger that itdoes not need to maintain debug data for these modules. When you use the NAMESEXCLUDE command to exclude executable modules, there are situations where z/OSDebugger requires debug data for the excluded modules. The following list, whilenot comprehensive, describes some of the possible situations:v The entry point of an enclave.v The next higher-level compile unit when a STEP RETURN command is executing.v Compile units that appear in the call chain of a compile unit where z/OS
Debugger has suspended execution.v The next higher-level compile unit when the user-program has been suspended
at an AT EXIT breakpoint.
Also, when you enter a deferred AT ENTRY command, z/OS Debugger generatesan implicit NAMES INCLUDE command for the load module and compile unitthat is the target of the deferred AT ENTRY. If these names appear later in theprogram, z/OS Debugger will not exclude them even if you specified them in aprevious NAMES EXCLUDE command.
434 IBM z/OS Debugger V14.1.9 User's Guide
In all of the above situations, z/OS Debugger loads debug data as required andthese modules might become known to z/OS Debugger.
Refer to the following topics for more information related to the material discussedin this topic.
Related references"NAMES command" in IBM z/OS Debugger Reference and Messages
Displaying current NAMES settingsUse the NAMES DISPLAY command to display the current settings of the NAMEScommand.
Refer to the following topics for more information related to the material discussedin this topic.
Related references"NAMES command" in IBM z/OS Debugger Reference and Messages
Using the EQAOPTS NAMES command to include or exclude the initialload module
You cannot use the NAMES command on load modules or compile units that arealready known to z/OS Debugger; therefore, you cannot use the NAMES commandto indicate to z/OS Debugger that you want to include or exclude the initial loadmodule or the compile units contained in the initial load module. If you want todo this, you must specify the EQAOPTS NAMES command either at run time orthrough the EQAOPTS load module. To learn how to specify EQAOPTScommands, see the topic “EQAOPTS commands” in the IBM z/OS DebuggerReference and Messages or IBM z/OS Debugger Customization Guide.
Refer to the following topics for more information related to the material discussedin this topic.
Related references"NAMES command" in IBM z/OS Debugger Reference and Messages
Using delay debug mode to delay starting of a debug sessionBy default, z/OS Debugger starts a debug session at the first entry compile unit ofthe initial load module of an application. However, there are cases where theproblem is in some compile unit (for example, prog1) inside the application thatneeds debugging.
Currently, you enter AT ENTRY prog1 and GO commands when the debug sessionstarts.
However, in some complex applications, it can take some significant time beforeprog1 appears. In this case, you can use delay debug mode to delay the starting ofthe debug session until z/OS Debugger recognizes prog1.
z/OS Debugger is in the dormant state during the delay debug mode andmonitors only a few events. When z/OS Debugger recognizes prog1, z/OSDebugger comes out of delay debug mode, completes the initialization, and startsthe debug session.
Chapter 49. Solving problems in complex applications 435

Delay debug mode uses a delay debug profile data set that contains the programlist and TEST runtime option. This profile is used by z/OS Debugger to match theprogram name or C function name (compile unit) (and optionally a load modulename) with the names in the program list. If there is a match, z/OS Debuggercomes out of the delay debug mode and uses the TEST runtime to complete theinitialization. This data set is a physical sequential data set that is created andedited by using option B of the IBM z/OS Debugger Utilities: Delay Debug Profile.
You enable delay debug mode by using the EQAOPTS DLAYDBG command. Bydefault, delay debug mode is NO. When delay debug mode is enabled, you canspecify these additional commands:
DLAYDBGCND
You can use this command to indicate whether you want z/OS Debuggerto monitor condition events in the delay debug mode.
The default is DLAYDBGCND,ALL.
DLAYDBGDSN Delay debug profile data set naming pattern.
The default is userid.DLAYDBG.EQAUOPTS.
DLAYDBGTRC Delay debug pattern match trace message level.
This message level is used to generate error and informational messagesfor debugging purposes.
The default is 0, which indicates no trace messages.
DLAYDBGXRF
You can use this command to indicate that you want z/OS Debugger touse the cross reference file or the Terminal Interface Manager repository tofind the user ID when it constructs the delay debug profile data set name.
This command can be used in the IMS environment when an IMStransaction is started with a generic ID. With the RESPOSITORY option,the command can also be used in the DB/2 stored procedures environmentwhen a stored procedure runs under a generic ID.
See “Debugging tasks running under a generic user ID by using TerminalInterface Manager” on page 438 for a description of the steps required touse the REPOSITORY option of DLAYDBGXRF
Once z/OS Debugger completes the initialization, the delay debug mode cannot bereactivated.
Usage notesv The delay debug mode applys to non-CICS environments only.v The delay debug mode applies to programs compiled with the Enterprise
COBOL for z/OS and Enterprise PL/I for z/OS compilers, C functions compiledwith the z/OS V2.1 XL C/C++ compiler and non-Language Environmentprograms. Non-Language Environment compile units must be the initialprogram in a task or the target of a LINK or LINKX macro to be eligible fordelay debug pattern matching.For compile time and run time requirements of C functions, see “Delay debugmode for C requires the FUNCEVENT(ENTRYCALL) compiler suboption” onpage 45.
436 IBM z/OS Debugger V14.1.9 User's Guide

v The main program of the application must be a Language Environmentprogram, or a non-Language Environment program that is started by usingEQANMDBG.
v The TEST runtime option used to start z/OS Debugger at the beginning of theapplication must have PROMPT in the third suboption, for example,TEST(ALL,*,PROMPT,*).
v If the user exit method is used to start z/OS Debugger at the beginning of theapplication, the user exit data set should have a '*' as one of the names in theprogram name list name list, so that the pattern matching always succeeds andthe TEST runtime option is returned to Language Environment.In addition, the name of the user exit data set must be different from the nameof the delay debug profile data set.
v Use Delay Debug Profile to set up the delay debug profile data set. You can findthis tool under option B in IBM z/OS Debugger Utilities.
v The TEST runtime option in the delay debug profile must have PROMPT in thethird sub option, for example, TEST(ALL,*,PROMPT,*).
Refer to the following topics for more information related to the material discussedin this topic.
Related references
Debugging subtasks created by the ATTACH assembler macro
Under certain circumstances, you can debug multi-tasked applications that createtheir subtasks by using the ATTACH assembler macro. To debug subtasks, thefollowing conditions must be met:v SVC screening must be in effect. For information about enabling SVC screening
for your task, see SVCSCREEN in Chapter 15. EQAOPTS commands in the IBMz/OS Debugger Customization Guide.
v Delay debug mode must be active. For information about setting delay debugmode, see “Using delay debug mode to delay starting of a debug session” onpage 435.
v If the main program of the top-level task is not Language Environment-compliant, you must start the program by using EQANMDBG. For informationabout using EQANMDBG to start z/OS Debugger for non-LanguageEnvironment-compliant programs, see “Starting z/OS Debugger for programsthat start outside of Language Environment” on page 147.
To debug a program in the main task or in a subtask of the main task, you mustenter pattern matching arguments in the delay debug profile data set that matchesone of the programs that executes in the subtask.
Usage notes:
v Each task to be debugged in an address space uses an entirely separate copy ofz/OS Debugger. Therefore, commands such as LIST CALLS provide informationonly about the current task. z/OS Debugger does not provide information aboutany tasks that precede the current task in the parent chain.
v For remote debug users, each task is displayed in the Debug view as a separate"Incoming debug session".
v 3270 users can log on to the Terminal Interface Manager on multiple terminalsusing the same user ID. For each task to be debugged, a z/OS Debugger sessionstarts on an available terminal if the following conditions are met:
Chapter 49. Solving problems in complex applications 437
– The user chose full-screen mode using the Terminal Interface Manager in thedelay debug profile.
– The terminal that the user logged on is available, and is not in a z/OSDebugger session.
Debugging tasks running under a generic user ID by using TerminalInterface Manager
Note: This section is not applicable to IBM Developer for z Systems(non-Enterprise Edition), IBM Z Open Development, or IBM Z Open Unit Test.
If you use Terminal Interface Manager and want to debug an IMS transaction or aDB/2 stored procedure that runs under a generic user ID, take the following setupsteps first:1. The Terminal Interface Manager stared task must be started in repository mode
by using the -r startup option. See Starting the Terminal Interface Manager in theIBM z/OS Debugger Customization Guide for more information about this task.
2. The IMS message region or DB/2 stored procedure WLM started task wherethe task will execute must be running in delay debug mode. At a minimumthis requires that the TEST option be specified, and that an EQAOPTS loadmodule containing the DLAYDBG,YES command be present in theenvironment's search path.
3. You must have authority to debug tasks started by the given generic user ID.This authority is controlled by the EQADTOOL.GENERICID.generic-user-IDRACF facility.
Note: For the setup items, you may need to confer with your system programmerto ensure that the steps have been performed.
To debug a task stared by a generic user ID, take the following steps:1. Make a connection to the Terminal Interface Manager.2. Log on to Terminal Interface Manager with your login credentials. The
following panel is displayed:
z/OS DEBUGGER TERMINAL INTERFACE MANAGER
EQAY001I Terminal TRMLU004 connected for user USRT001EQAY001I Ready for z/OS Debugger
EQAY001I Data set name : ’USRT001.DLAYDBG.EQAUOPTS’ (default -- not loaded)
PF3=EXIT PF10=Edit LE options data set PF12=LOGOFF
3. Press PF10 to edit your LE options data set. Ensure that you select the delaydebug options data set. The default name for this data set isuserid.DLAYDBG.EQAUOPTS, but it might have been customized for your siteto use a different naming pattern.
4. On the Edit TEST runtime options data set panel, press PF8 to access theDB2/IMS information panel. Fill in the proper information for the IMStransaction or the DB/2 stored procedure that you want to debug. Thefollowing example shows how to debug IMS transaction "DTMQBR" defined inIMS system "IMS1":
438 IBM z/OS Debugger V14.1.9 User's Guide
|

z/OS DEBUGGER TERMINAL INTERFACE MANAGER* Supply additional options *
Enter IMS identifiers for IMS generic ID support:
IMS Subsystem ID : IMS1IMS Transaction ID : DTMQBR
Enter DB2 identifiers for DB2 generic ID support:
DB2 Stored Procedure Schema :
DB2 Stored Procedure External Name :
PF1=Help PF4=Save PF12=Cancel
5. Press PF4 to save the IMS or DB/2 information, and then press PF4 again tosave the delay debug preferences.
6. When you no longer want to debug the given task, you can deregister for thetask by using Terminal Interface Manager to edit the delay debug preferencesdata set and remove the task information from the IMS/DB2 options panel. Youcan also log off of Terminal Interface Manager.
Note: When the IMS transaction or DB/2 stored procedure executes under ageneric user ID in delay debug mode, z/OS Debugger communicates withTerminal Interface Manager to determine whether a user has signed on and wantsto debug the current task.
If the IMS or DB/2 information matches, the TIM user's TSO user ID is returned toz/OS Debugger. z/OS Debugger uses the TSO user ID to open the associateddelay debug preferences data set. If the pattern-matching arguments in the delaydebug preferences data set match, the debug preference will be used to start thez/OS Debugger user interface.
Chapter 49. Solving problems in complex applications 439

440 IBM z/OS Debugger V14.1.9 User's Guide

Part 8. Appendixes
© Copyright IBM Corp. 1992, 2019 441

442 IBM z/OS Debugger V14.1.9 User's Guide

Appendix A. Data sets used by z/OS Debugger
z/OS Debugger uses the following data sets:
C and C++ sourceThis data set is used as input to the compiler, and must be kept in apermanent PDS member, sequential file, or HFS or zFS file. The data setmust be a single file, not a concatenation of files. z/OS Debugger uses thedata set to show you the program as it is executing.
The C and C++ compilers store the name of the source data set inside theload module. z/OS Debugger uses this data set name to access the source.
This data set might not be the original source; for example, the programmight have been preprocessed by the CICS translator. If you use apreprocessor, you must keep the data set input to the compiler in apermanent data set for later use with z/OS Debugger.
As this data set might be read many times by z/OS Debugger, werecommend that you do one of the following:v Define it with the largest block size that your DASD can hold.v Instruct the system to compute the optimum block size, if your system
has that capability.
If you manage your source code with a library system that requires you tospecify the SUBSYS=ssss parameter when you allocate a data set, you oryour site need to specify the EQAOPTS SUBSYS command, which providesthe value for ssss. This support is not available when debugging a programunder CICS. To learn how to specify EQAOPTS commands, see the topic“EQAOPTS commands” in the IBM z/OS Debugger Reference and Messages orthe IBM z/OS Debugger Customization Guide.
If the following conditions apply to your situation, you do not need accessto the source because the .mdbg file has a copy of the source:v You are compiling with z/OS XL C/C++, Version 1.10 or later.v You compile your program with the FORMAT(DWARF) and FILE suboptions
of the DEBUG compiler option.v You create an .mdbg file and save (capture) the source with either of the
following commands:– the dbgld command with the -c option– the CDADBGLD command with the CAPSRC option
v You or your site specified YES for the EQAOPTS MDBG command11, whichrequires z/OS Debugger to search for the .dbg and source file in a.mdbg file.
COBOL listingThis data set is produced by the compiler and must be kept in apermanent PDS member, sequential file, or an HFS or zFS file. z/OSDebugger uses it to show you the program as it is executing.
11. In situations where you can specify environment variables, you can set the environment variable EQA_USE_MDBG to YES orNO, which overrides any setting (including the default setting) of the EQAOPTS MDBG command.
© Copyright IBM Corp. 1992, 2019 443
The COBOL compiler stores the name of the listing data set inside the loadmodule. z/OS Debugger uses this data set name to access the listing.
z/OS Debugger does not use the output that is created by the COBOL LISTcompiler option.
COBOL programs that have been compiled with the SEPARATE suboptiondo not need to save the listing file. Instead, you must save the separatedebug file SYSDEBUG.
For Enterprise COBOL for z/OS Version 5 and Version 6 Release 1,program listings do not need to be saved. The debug data and the sourcecode is saved in a NOLOAD segment in the program object.
For Enterprise COBOL for z/OS Version 6 Release 2, program listings donot need to be saved. The debug data and the source code are saved in aNOLOAD segment of the program object if you specified TEST orTEST(NOSEPARATE,SOURCE), and in a separate debug file if you specifiedTEST(SEPARATE,SOURCE).
The VS COBOL II compilers do not store the name of the listing data set.z/OS Debugger creates a name in the form userid.cuname.LIST and usesthat name to find the listing.
Because this data set might be read many times by z/OS Debugger, werecommend that you do one of the following:v Define it with the largest block size that your DASD can hold.v Instruct the system to compute the optimum blocksize, if your system
has that capability.
EQALANGX filez/OS Debugger uses this data set to obtain debug information aboutassembler and LangX COBOL source files. It can be a permanent PDSmember or sequential file. You must create it before you start z/OSDebugger. You can create it by using the EQALANGX program. Use theSYSADATA output from the High Level assembler or the listing from theIBM OS/VS COBOL, IBM VS COBOL II, or Enterprise COBOL compiler asinput to the EQALANGX program.
PL/I source (Enterprise PL/I only)This data set is used as input to the compiler, and must be kept in apermanent PDS member, sequential file, or HFS or zFS file. z/OSDebugger uses it to show you the program as it is executing.
The Enterprise PL/I compiler stores the name of the source data set insidethe load module. z/OS Debugger uses this data set name to access thesource.
This data set might not be the original source; for example, the programmight have been preprocessed by the CICS translator. If you use apreprocessor, you must keep the data set input to the compiler in apermanent data set, for later use with z/OS Debugger.
Because this data set might be read many times by z/OS Debugger, werecommend that you do one of the following:v Define it with the largest block size that your DASD can hold.v Instruct the system to compute the optimum block size, if your system
has that capability.
If you manage your source code with a library system that requires you tospecify the SUBSYS=ssss parameter when you allocate a data set, you or
444 IBM z/OS Debugger V14.1.9 User's Guide

your site need to specify the EQAOPTS SUBSYS command, which providesthe value for ssss. This support is not available when debugging a programunder CICS. To learn how to specify EQAOPTS commands, see the topic“EQAOPTS commands” in the IBM z/OS Debugger Reference and Messages orthe IBM z/OS Debugger Customization Guide.
PL/I listing (all other versions of PL/I compiler)This data set is produced by the compiler and must be kept in apermanent file. z/OS Debugger uses it to show you the program as it isexecuting.
The PL/I compiler does not store the name of the listing data set. z/OSDebugger looks for the listing in a data set with the name in the form ofuserid.cuname.LIST.
z/OS Debugger does not use the output that is created by the PL/Icompiler LIST option; performance improves if you specify NOLIST.
Because this data set might be read many times by z/OS Debugger, werecommend that you do one of the following:v Define it with the largest block size that your DASD can hold.v Instruct the system to compute the optimum block size, if your system
has that capability.
Separate debug fileThis data set is produced by the compiler and it stores information used byz/OS Debugger. To produce this file, you must compile your program withthe following compiler options:v The SEPARATE compiler suboption of the TEST compiler option, which is
available on the following compilers:– Enterprise COBOL for z/OS, Version 6 Release 2– Enterprise COBOL for z/OS, Version 4– Enterprise COBOL for z/OS and OS/390, Version 3– COBOL for OS/390 & VM, Version 2 Release 2– COBOL for OS/390 & VM, Version 2 Release 1 with APAR PQ40298– Enterprise PL/I for z/OS, Version 3.5 or later
The compiler uses the SYSDEBUG DD statement to name the separatedebug file.Enterprise COBOL for z/OS, Version 6 Release 2 does not store thename of the separate debug file in the program object. You must specifythe side file location through a SET SOURCE command, EQAUEDAT userexit, SET DEFAULT LISTINGS command, EQADEBUG DD name, orEQA_DBG_SYSDEBUG environment variable. With a SET SOURCEcommand, you can specify the exact location of the side file. If you use aSET DEFAULT LISTINGS command, EQADEBUG DD name orEQA_DBG_SYSDEBUG environment variable, and if the side file is notfound because the side file name does not match the CU name, z/OSDebugger will do an exhaustive search of the data sets specified by thesame method to locate the matching side file. The exhaustive searchmight be slow.For Enterprise COBOL for z/OS, Version 6 Release 2, with theTEST(SEPARATE,SOURCE) compiler option, when you specify the side filelocation, you can specify a PDS data set or z/OS UNIX System Servicesdirectory through a EQADEBUG DD card, SET DEFAULT LISTING command,EQAUEDAT user exit, or EQA_DBG_SYSDEBUG environment variable.
Appendix A. Data sets used by z/OS Debugger 445
v The FORMAT(DWARF) suboption of the DEBUG compiler option with z/OSC/C++, Version 1.6 or later. The compiler uses one of the followingmethods to name the separate debug file (also known as a .dbg file):– You specify a name with the FILE suboption– You specify a name with the SYSCDBG DD statement– If you do not specify a name, the compiler generates a name as
described in z/OS XL C/C++ User's Guide.
The file does not contain source. You must also save the source file.
Save the file in any of the following formats:v a permanent PDS memberv a sequential filev for COBOL or PL/I, an HFS or zFS filev for C or C++, a z/OS UNIX System Services file
The compiler stores the data set name of the separate debug file inside theload module. z/OS Debugger uses this data set name to access the debuginformation, unless you provide another data set name as described inAppendix B, “How does z/OS Debugger locate source, listing, or separatedebug files?,” on page 451.
Because this data set might be read many times by z/OS Debugger, do oneof the following steps to improve efficiency:v Define it with the largest block size that your DASD can hold.v Instruct the system to compute the optimum block size, if your system
has that capability.
.mdbg fileThe .mdbg file is created by the dbgld command or CDADBGLD utility. Itcontains all the .dbg files for all the programs in a load module or DLL.Beginning with z/OS XL C/C++, Version 1.10, z/OS Debugger can obtaininformation from this file if it also stores (captures) the source files. Createan .mdbg file with captured source by using the dbgld command with the-c option or the CDADBGLD utility with the CAPSRC option.
To learn how to use these commands, see z/OS XL C/C++ User's Guide.
Preferences file
This data set contains z/OS Debugger commands that customize yoursession. You can use it, for example, to change the default screen colors setby z/OS Debugger. Store this file in a permanent PDS member or asequential file.
You can specify a preferences file directly (for example, through the TESTruntime option) or through the EQAOPTS PREFERENCESDSN command. Forinstructions, see “Creating a preferences file” on page 169.
A CICS region must have read authorization to the preferences file.
Global preferences file
This is a preferences file generally available to all users. It is specifiedthrough the EQAOPTS GPFDSN command. To learn how to specifyEQAOPTS commands, see the topic “EQAOPTS commands” in the IBMz/OS Debugger Reference and Messages or the IBM z/OS DebuggerCustomization Guide. If a global preferences file exists, z/OS Debugger runsthe commands in the global preferences file before commands found in thepreferences file.
446 IBM z/OS Debugger V14.1.9 User's Guide

A CICS region must have read authorization to the global preferences file.
Commands file
This data set contains z/OS Debugger commands that control the debugsession. You can use it, for example, to set breakpoints or set up monitorsfor common variables. Store it in a permanent PDS member or a sequentialfile.
If you specify a preferences file, z/OS Debugger runs the commands in thecommands file after the commands specified in the preferences file.
You can specify a commands file directly (for example, through the TESTruntime option) or through the EQAOPTS COMMANDSDSN command. If it isspecified through the EQAOPTS COMANDSDSN command, it must be in a PDSor PDSE and the member name must match the name of the initial loadmodule in the first enclave. For instructions on creating a commands files,see “Creating a commands file” on page 186.
A CICS region must have read authorization to the commands file.
EQAOPTS fileThis data set contains EQAOPTS commands that control initial settings andoptions for the debug session. Store it in a permanent PDS member or asequential file. To learn how to specify EQAOPTS commands, see the topic“EQAOPTS commands” in the IBM z/OS Debugger Reference and Messages orthe IBM z/OS Debugger Customization Guide.
The record format must be either F or FB and the logical record lengthmust be 80.
A CICS region must have read authorization to the EQAOPTS file.
EQAUOPTS fileThis data set is used to hold parameters for the z/OS Debugger LanguageEnvironment user exit or for the delay debug processing.
The EQAUOPTS data set must be a sequential data set with a RECFM ofFB or VB, and an LRECL of 80 to 256.
For more information about this data set, see Chapter 12, “Specifying theTEST runtime options through the Language Environment user exit,” onpage 109 and “Using delay debug mode to delay starting of a debugsession” on page 435.
Log file
z/OS Debugger uses this file to record the progress of the debuggingsession. z/OS Debugger stores a copy of the commands you entered alongwith the results of the execution of commands. The results are stored ascomments. This allows you to use the log file as a commands file insubsequent debugging sessions. Store the log file in a permanent PDSmember or a sequential file. Because z/OS Debugger writes to this dataset, store the log file as a sequential file to relieve any contention for thisfile.
z/OS Debugger does not use log files in remote debug mode.
The log file specifications need to be one of the following options:v RECFM(F) or RECFM(FB) and 32<=LRECL<=256v RECFM(V) or RECFM(VB) and 40<=LRECL<=264
Appendix A. Data sets used by z/OS Debugger 447

You can specify a log file directly (for example, the INSPLOG DD or theSET LOG command) or through the EQAOPTS LOGDSN command. Forinstructions, see “Creating the log file” on page 188.
For DB2 stored procedures, to prevent multiple users from trying to usethe same log, do not use the EQAOPTS LOGDSN command.
For CICS, review the special circumstances described in “Restrictions whendebugging under CICS” on page 390.
Save settings file (SAVESETS)z/OS Debugger uses this file to save and restore, between z/OS Debuggersessions, the settings from the SET command. A sequential file withRECFM of VB and LRECL>=3204 must be used.
The default name for this data set is userid.DBGTOOL.SAVESETS. However,you can change this default by using the EQAOPTS SAVESETDSN command.In non-interactive mode (MVS batch mode without using a full-screenterminal), the DD name used to locate this file is INSPSAFE.
You can not save the settings information in the same file that you savebreakpoint and monitor specifications information.
Save settings files are not used for remote debug sessions.
Automatic save and restore of the settings is not supported under CICS ifthe current user is not logged-in or is logged in under the default user ID.If you are running in CICS, the CICS region must have updateauthorization to the save settings file.
Save settings files are not supported automatically when debugging DB2stored procedures.
You or your site can direct z/OS Debugger to create this file and enablesaving and restoring settings through the EQAOPTS SAVESETDSNALLOCcommand. For instructions, see “Saving and restoring settings, breakpoints,and monitor specifications” on page 196.
Save breakpoints and monitor specifications file (SAVEBPS)z/OS Debugger uses this file to save and restore, between z/OS Debuggersessions, the breakpoints, monitor specifications, and LDD specifications. APDSE or PDS data set with RECFM of VB and LRECL >= 3204 must beused. (We recommend you use a PDSE.)
The default name for this data set is userid.DBGTOOL.SAVEBPS. However,you can change this default by using EQAOPTS SAVEBPDSN command. Innon-interactive mode (MVS batch mode without using a full-screenterminal), the DD name used to locate this file is INSPBPM.
You can not save the breakpoint and monitor specifications information inthe same file that you save settings information.
Save breakpoints and monitor specifications files are not used for remotedebug sessions.
Automatic save and restore of the breakpoints and monitor specifications isnot supported under CICS if the current user is not logged-in or is loggedin under the default user ID. If you are running in CICS, the CICS regionmust have update authorization to the save breakpoints and monitorspecifications file.
Save breakpoints and monitor specifications files are not supportedautomatically when debugging DB2 stored procedures.
448 IBM z/OS Debugger V14.1.9 User's Guide
You or your site can direct z/OS Debugger to create this file and enablesaving and restoring breakpoints and monitor specifications through theEQAOPTS SAVEBPDSNALLOC command. For instructions, see “Saving andrestoring settings, breakpoints, and monitor specifications” on page 196.
Appendix A. Data sets used by z/OS Debugger 449

450 IBM z/OS Debugger V14.1.9 User's Guide

Appendix B. How does z/OS Debugger locate source, listing,or separate debug files?
z/OS Debugger obtains information (called debug information) it needs about acompilation unit (CU) by searching through the following sources.
Remote debugging in standard modez/OS Debugger obtains information (called debug information) it needs about acompilation unit (CU) by searching through the following sources:
For remote debugging in standard mode:v To debug Enterprise COBOL for z/OS V3.4 and V4 programs, specify the
location of the listing files by adding the EQAV4LST DD name or theEQA_DBG_V4LIST environment variable. Adding either of those values makes thelisting files available to the debugger. For example://EQAV4LST DD DSN=USER123.COBOL.LISTING,DISP=SHR
orENVAR("EQA_DBG_V4LIST=//’USER123.COBOL.LISTING’")
Note: EQAV4LST is only supported in batch.v To debug Enterprise COBOL for z/OS V6.2 programs with the debug
information in side files, complete the following steps:1. To generate the side files, compile the COBOL program with the
TEST(SEPARATE) compiler option, and specify the SYSDEBUG DD name to storethe generated side files.
2. Make the side files available to the debugger by specifying the location of theside files with the EQADEBUG DD name or the EQA_DBG_SYSDEBUGenvironment variable. For example://EQADEBUG DD DSN=USER123.COBOL.SYSDEBUG,DISP=SHR
orENVAR("EQA_DBG_SYSDEBUG=USER123.COBOL.SYSDEBUG")
If you are using the Source view instead of the default Expanded Source view,make the source files available to the debugger by specifying the location of thesource files with the EQASRCE DD name or the EQA_DBG_SRCE environmentvariable. This is used with data sets that contain only source files. For example://EQASRCE DD DSN=USER123.COBOL.SOURCE,DISP=SHR
orENVAR("EQA_DBG_SRCE=USER123.COBOL.SOURCE")
v To debug z/OS C and C++, and 31-bit Enterprise PL/I for z/OS programs withseparate side files, make the side files, which contain debugging information,available to the debugger by adding the EQADEBUG DD name to specify thelocation of the side files. For example://EQADEBUG DD DSN=USER123.PLI.DEBUG,DISP=SHR
To locate source files for C or C++ programs, add the EQASRCE DD name tospecify the location of the application source files. For example:
© Copyright IBM Corp. 1992, 2019 451

//EQASRCE DD DSN=USER123.CPP.SOURCE,DISP=SHR
z/OS Debugger uses the source code compiled by 31-bit Enterprise PL/I forz/OS to display the source. Thus, that source code needs to be in a catalogeddata set accessible to the debugger.To debug 64-bit Enterprise PL/I for z/OS programs, z/OS debugger also usesthe source code compiled by Enterprise PL/I for z/OS to display the source. Ifthe source file no longer exists in the location that was provided as the input tothe compiler, add the EQADEBUG DD to specify the location of the applicationsource files. For example://EQADEBUG DD DSN=USER123.PLI64.SOURCE,DISP=SHR
v To debug HLASM programs, specify the location of the SYSADATA files by addingthe EQAADATA DD name or the EQA_DBG_SYSADATA environment variable.Adding either of those values makes the debugging information available to thedebugger. For example://EQAADATA DD DSN=USER123.HLASM.SYSADATA,DISP=SHR
orENVAR("EQA_DBG_SYSADATA=//’USER123.HLASM.SYSADATA’")
z/OS Debugger uses the source code assembled by HLASM to display thesource. Thus, that source code needs to be in a cataloged data set accessible tothe debugger.
In the CICS subsystem, you can specify an environment variable using ENVAR (asshown in the previous text, except remove any //) in one of the following ways:v In DTCN, specify the environment variable in the Any other valid Language
Environment options field of the z/OS Debugger CICS Control - Menu 2menu.
v In CADP, specify the environment variable in the Other Language EnvironmentOptions section.
Non-remote debugging and remote debugging in Debug Toolcompatibility mode
z/OS Debugger obtains information (called debug information) it needs about acompilation unit (CU) by searching through the following sources:v In some cases, the debug information is stored in the load module. z/OS
Debugger uses this information, along with the source or listing file, to displaysource code on the screen.
v For IBM Enterprise COBOL for z/OS, Version 5, Version 6 Release 1, and Version6 Release 2 with the TEST(NOSEPARATE) compiler option programs, z/OSDebugger uses the debug information and the source files that are in aNOLOAD segment in the program object.
v For COBOL and PL/I CUs compiled with the SEPARATE suboption of the TESTcompiler option, z/OS Debugger uses the information stored in a separate file(called a separate debug file) that contains both the debug information and theinformation needed to display source code on the screen.
v For C and C++ CUs created and debugged under the following conditions, z/OSDebugger uses the debug information stored in the .dbg file along with thesource file to display code on the screen:– Compiled with the FORMAT(DWARF) suboption of the DEBUG compiler option
452 IBM z/OS Debugger V14.1.9 User's Guide

– Specified or defaulted to NO for the EQAOPTS MDBG command12
v For C and C++ CUs created and debugged under the following conditions, z/OSDebugger uses debug information and source code stored in the .mdbg file todisplay source code on the screen:– Compiled with the FORMAT(DWARF) suboption of the DEBUG compiler option– Compiled with z/OS XL C/C++, Version 1.10 or later– Created an .mdbg file with saved (captured) source for the load module or
DLL by using the -c option of the dbgld command or CAPSRC option of theCDADBGLD utility.
– Specified YES for the EQAOPTS MDBG command (which requires z/OSDebugger to search for .dbg and source files in a .mdbg file)13
v For assembler and LangX COBOL CUs, z/OS Debugger uses the informationstored in a separate file (called an EQALANGX file) that contains both thedebug information and the information needed to display source code on thescreen.
In all of these cases, there is a default data set name associated with each CU, loadmodule, or DLL. The way this default name is generated differs depending on thesource language and compiler used. To learn how each compiler generates thedefault name, see the compiler's programming guide or user's guide.
z/OS Debugger obtains the source or listing data, separate debug file data, orEQALANGX data from one of the following sources:v the default data set namev the SET SOURCE commandv the SET DEFAULT LISTINGS commandv the EQADEBUG DD statement
For C and C++ CUs, z/OS Debugger obtains the source data and separate debugfile data from different sources, depending on how you created the CU and whatvalue you specified for the EQAOPTS MDBG command.14 For CUs created anddebugged under the following conditions, z/OS Debugger obtains the source datafrom the source file and separate debug file data from the .dbg file:v Compiled with the FORMAT(DWARF) suboption of the DEBUG compiler optionv Specified NO for the EQAOPTS MDBG command15
z/OS Debugger obtains the source file from one of the following sources:v the default data set namev the SET SOURCE commandv the SET DEFAULT LISTINGS commandv the EQAUEDAT user exit (specifying function code 3)v The EQADEBUG DD namev the EQA_SRC_PATH environment variable
12. In situations where you can specify environment variables, you can set the environment variable EQA_USE_MDBG to YES orNO, which overrides any setting (including the default setting) of the EQAOPTS MDBG command.
13. In situations where you can specify environment variables, you can set the environment variable EQA_USE_MDBG to YES orNO, which overrides any setting (including the default setting) of the EQAOPTS MDBG command.
14. In situations where you can specify environment variables, you can set the environment variable EQA_USE_MDBG to YES orNO, which overrides any setting (including the default setting) of the EQAOPTS MDBG command.
15. In situations where you can specify environment variables, you can set the environment variable EQA_USE_MDBG to YES orNO, which overrides any setting (including the default setting) of the EQAOPTS MDBG command.
Appendix B. How does z/OS Debugger locate source, listing, or separate debug files? 453

z/OS Debugger obtains the .dbg file from one of the following sources:v the default data set namev the SET DEFAULT DBG commandv the EQAUEDAT user exit (specifying function code 35)v the EQADBG DD namev the EQA_DBG_PATH environment variable
Note that these lists do show only what can be processed, not the processing order.
For C and C++ CUs created and debugged under the following conditions, z/OSDebugger obtains the source data and separate debug file data from the .mdbg file:v Compiled with the FORMAT(DWARF) suboption of the DEBUG compiler optionv Compiled with z/OS XL C/C++, Version 1.10 or laterv Created an .mdbg file with saved (captured) source for the load module or DLL
by using the -c option of the dbgld command or CAPSRC option of theCDADBGLD utility.
v Specified YES for the EQAOPTS MDBG command (which requires z/OS Debuggerto search for a .dbg file in a .mdbg file)16
z/OS Debugger obtains the .mdbg file from one of the following sources:v the default data set namev the SET MDBG commandv the SET DEFAULT MDBG commandv the EQAUEDAT user exit (specifying function code 37)v the EQAMDBG DD statementv the EQA_MDBG_PATH environment variable
For each type of file (source, listing, separate debug file, .dbg, or .mdbg), z/OSDebugger searches through the sources in different order. The rest of the topics inthis chapter describe the order.
If you are using the EQAUEDAT user exit in your environment, the nameprovided in the user exit takes precedence if z/OS Debugger finds that file.
For .dbg and .mdbg files, z/OS Debugger does not search for the source until itfinds a valid .dbg or .mdbg file.
How does z/OS Debugger locate source and listing files?z/OS Debugger reads the source or listing file for a CU each time it needs todisplay information about that CU. While you are debugging your CU, the data setfrom which the file is read can change. Each time z/OS Debugger needs to read asource or listing file, it searches for the data set in the following order:1. SET SOURCE command2. SET DEFAULT LISTINGS command. If the EQAUEDAT user exit is implemented
and a EQADEBUG DD statement is not specified, the data set name might bemodified by the EQAUEDAT user exit.
3. if present, the EQADEBUG DD statement
16. In situations where you can specify environment variables, you can set the environment variable EQA_USE_MDBG to YES orNO, which overrides any setting (including the default setting) of the EQAOPTS MDBG command.
454 IBM z/OS Debugger V14.1.9 User's Guide

4. default data set name. If a data set with the default data set name cannot belocated, and if the EQAUEDAT user exit is implemented and a EQADEBUGDD statement is not specified, the data set name might be modified by theEQAUEDAT user exit.
How does z/OS Debugger locate COBOL and PL/I separatedebug files?
z/OS Debugger might read from an Enterprise COBOL for z/OS Version 4compiler (and earlier), Enterprise COBOL for z/OS Version 6 Release 2, or PL/Iseparate debug file more than once but it always reads the separate debug filefrom the same data set. After z/OS Debugger locates a valid separate debug file,you cannot direct z/OS Debugger to a different separate debug file. When the CUfirst appears, z/OS Debugger looks for the separate debug file in the followingorder:1. SET SOURCE command2. default data set name. If a data set with the default data set name cannot be
located, and if the EQAUEDAT user exit is implemented and a EQADEBUGDD statement is not specified, the data set name might be modified by theEQAUEDAT user exit.
3. SET DEFAULT LISTINGS command. If the EQAUEDAT user exit is implementedand a EQADEBUG DD statement is not specified, the data set name might bemodified by the EQAUEDAT user exit.
4. if present, the EQADEBUG DD statement5. For Enterprise COBOL for z/OS Version 6 Release 2, you can also provide an
environment variable EQA_DBG_SYSDEBUG to look for a separate debug file.
Enterprise COBOL for z/OS, Version 6 Release 2 does not provide default data setname of the separate debug file. You must specify the side file location through aSET SOURCE command, EQAUEDAT user exit, SET DEFAULT LISTINGS command,EQADEBUG DD name, or EQA_DBG_SYSDEBUG environment variable. With a SETSOURCE command, you can specify the exact location of the side file. If you use aSET DEFAULT LISTINGS command, EQADEBUG DD name or EQA_DBG_SYSDEBUGenvironment variable, and if the side file is not found because the side file namedoes not match the CU name, z/OS Debugger will do an exhaustive search of thedata sets specified by the same method to locate the matching side file. Theexhaustive search might be slow.
For Enterprise COBOL for z/OS, Version 6 Release 2, with theTEST(SEPARATE,SOURCE) compiler option, when you specify the side file location,you can specify a PDS data set or z/OS UNIX System Services directory through aSET DEFAULT LISTING command, EQAUEDAT user exit, EQADEBUG DD card, orEQA_DBG_SYSDEBUG environment variable.
The Enterprise COBOL for z/OS Version 5 compiler does not create a separatedebug file and the commands in this section do not apply.
The SET SOURCE command can be entered only after the CU name appears as a CUand the separate debug file is not found in any of the other locations. The SETDEFAULT LISTINGS command can be entered at any time before the CU nameappears as a CU or, if the separate debug file is not found in any of the otherpossible locations, it can be entered later.
Appendix B. How does z/OS Debugger locate source, listing, or separate debug files? 455
How does z/OS Debugger locate EQALANGX filesAn EQALANGX file, which contains debug information for an assembler or LangXCOBOL program, might be read more than once but it is always read from thesame data set. After z/OS Debugger locates a valid EQALANGX file, you cannotdirect z/OS Debugger to a different EQALANGX file. After you enter theLOADDEBUGDATA (LDD) command (which is run immediately or run when thespecified CU becomes known to z/OS Debugger), z/OS Debugger looks for theEQALANGX file in the following order:1. SET SOURCE command2. a previously loaded EQALANGX file that contains a CSECT that matches the
name and length of the program3. default data set name. If a data set with the default data set name cannot be
located, and if the EQAUEDAT user exit is implemented and a EQADEBUGDD statement is not specified, the data set name might be modified by theEQAUEDAT user exit.
4. SET DEFAULT LISTINGS command. If the EQAUEDAT user exit is implementedand a EQADEBUG DD statement is not specified, the data set name might bemodified by the EQAUEDAT user exit.
5. the EQADEBUG DD statement
Note: If z/OS Debugger detects a Language Environment-enabled EQAUEDATwhen Language Environment is not active, the exit will not be started.
The SET SOURCE command can be entered during any of the following situations:v Any time after the CU name appears as a disassembly CU.v If the CU is known when the LDD command is entered but then z/OS Debugger
does not find the EQALANGX file.v If the CU is not known to z/OS Debugger when the LDD command is entered
and then z/OS Debugger runs the LDD after the CU becomes known to z/OSDebugger.
The SET DEFAULT LISTINGS command can be entered any time before you enter theLDD command or, if the EQALANGX file is not found by the LDD command, afteryou enter the LDD command.
How does z/OS Debugger locate the C/C++ source file and the.dbg file?
If you compile with the FORMAT(DWARF) and FILE suboptions of the DEBUG compileroption and specify NO for the EQAOPTS MDBG command17, z/OS Debugger needsthe source file and the .dbg file. The following list describes how z/OS Debuggersearches for those files:v z/OS Debugger reads the source files for a CU each time it needs to display the
source code. z/OS Debugger searches for the source file by using the name thecompiler saved in the load module or DLL. If you move the source files to adifferent location, z/OS Debugger searches for the source file based on the inputfrom the following commands, user exit, or environment variable, in thefollowing order:1. In full screen mode, the SET SOURCE command.
17. In situations where you can specify environment variables, you can set the environment variable EQA_USE_MDBG to YES orNO, which overrides any setting (including the default setting) of the EQAOPTS MDBG command.
456 IBM z/OS Debugger V14.1.9 User's Guide

2. In remote debug mode, the EQA_SRC_PATH environment variable or whatyou enter in the Change Text File action from the editor view.
3. The EQADEBUG DD statement.4. The EQAUEDAT user exit, specifying function code 3. If you specify the
EQADEBUG DD statement, the EQAUEDAT user exit is not run.5. The SET DEFAULT LISTINGS command.
v z/OS Debugger might read the .dbg file more than once, but it always reads thisfile from the same data set. After z/OS Debugger locates this file and validatesits contents with the load module being debugged, you cannot redirect z/OSDebugger to search a different file. z/OS Debugger searches for the .dbg file byusing the name the compiler saved in the load module or DLL. If you move the.dbg file to a different location, z/OS Debugger searches for the .dbg file basedon the input from the following commands, user exit, or environment variable,in the following order:1. In remote debug mode, the EQA_DBG_PATH environment variable.2. The EQADBG DD statement.3. The EQAUEDAT user exit, specifying function code 35. If you specify the
EQADBG DD statement, the EQAUEDAT user exit is not run.4. The SET DEFAULT DBG command.
To learn more about the DEBUG compiler option, the dbgld command, and theCDADBGLD utility, see z/OS XL C/C++ User's Guide.
How does z/OS Debugger locate the C/C++ .mdbg file?For the following conditions, z/OS Debugger can obtain debug information andsource from a module map (.mdbg) file:v You do one of the following tasks:
– You or your site specifies YES for the EQAOPTS MDBG command and, forenvironments that support environment variables, you do not set theenvironment variable EQA_USE_MDBG to NO.
– You or your site specifies or defaults to NO for the EQAOPTS MDBG commandbut, for environments that support environment variables, you override thatoption by setting the environment variable EQA_USE_MDBG to YES.
v You compile your programs with z/OS XL C/C++, Version 1.10 or later
You use the dbgld command with the -c option or the CDADBGLD utility with theCAPSRC option to save (capture) the source files, as well as all the .dbg files,belonging to the programs that make up a single load module or DLL into onemodule map file (.mdbg file). Create an .mdbg file with captured source for anyload module or DLL that you want to debug because the .mdbg file makes it easierfor you to debug the load module or DLL. For example, if your load module isconsists of 10 programs and you do not create a module map file, you would needto keep track of 10 .dbg files and 10 source files. If you create a module map filefor that load module, you would need to keep track of just one .mdbg file.
z/OS Debugger might read the .mdbg file more than once, but it always reads thisfile from the same data set. After z/OS Debugger locates this file and validates itscontents with the load module being debugged, you cannot redirect z/OSDebugger to search a different file. z/OS Debugger searches for the .mdbg filebased on the input from the following commands, user exit, or environmentvariable, in the following order:1. The EQAUEDAT user exit, specifying function code 37.
Appendix B. How does z/OS Debugger locate source, listing, or separate debug files? 457
2. If you do not write the EQAUEDAT user exit or the user exit cannot find thefile, the default data set name, which isuserid.mdbg(load_module_or_DLL_name), or, in UNIX System Services,./load_module_or_DLL_name.mdbg.
If z/OS Debugger cannot find the .mdbg file, then it searches for the .mdbg filebased on the input from the following commands, DD statement, or environmentvariable, in the following order:1. The SET MDBG command2. The SET DEFAULT MDBG command3. The EQAMDBG DD statement.4. The EQA_MDBG_PATH environment variable.
To learn more about the DEBUG compiler option, the dbgld command, and theCDADBGLD utility, see z/OS XL C/C++ User's Guide.
458 IBM z/OS Debugger V14.1.9 User's Guide

Appendix C. Examples: Preparing programs and modifyingsetup files with IBM z/OS Debugger Utilities
Note: This chapter is not applicable to IBM Developer for z Systems(non-Enterprise Edition), IBM Z Open Development, or IBM Z Open Unit Test.
These examples show you how to use IBM z/OS Debugger Utilities to prepareyour programs and how to create, manage, and use a setup file. The examplesguide you through the following tasks:1. Creating personal data sets with the correct attributes.2. Starting IBM z/OS DebuggerUtilities.3. Compiling or assembling your program by using IBM z/OS Debugger Utilities.
If you do not use IBM z/OS Debugger Utilities, you can build your programthrough your usual methods and resume this example with the next step.
4. Modifying and using a setup file to run your program in the foreground or inbatch.
Creating personal data setsCreate the data sets with the names and attributes described below. Allocate 5tracks for each of the data sets. Partitioned data sets should be specified with 5blocks for the directory.
Table 22. Names and attributes to use when you create your own data sets.
Data set name LRECL BLKSIZE RECFM DSORG
prefix.SAMPLE.COBOL 80 * FB PO
prefix.SAMPLE.PLI 80 * FB PO
prefix.SAMPLE.C 80 * FB PO
prefix.SAMPLE.ASM 80 * FB PO
prefix.SAMPLE.DTSF 1280 * VB PO
* You can use any block size that is valid.
Copy the following members of the hlq.SEQASAMP data set into the personal datasets you just created:
SEQASAMP membername
Your sample data set Description of member
EQAWPP1 prefix.SAMPLE.COBOL(WPP1) COBOL source code
EQAWPP3 prefix.SAMPLE.PLI(WPP3) PL/I source code
EQAWPP4 prefix.SAMPLE.C(WPP4) C source code
EQAWPP5 prefix.SAMPLE.ASM(WPP5) Assembler source code
EQAWSU1 prefix.SAMPLE.DTSF(WSU1) setup file for EQAWPP1
EQAWSU3 prefix.SAMPLE.DTSF(WSU3) setup file for EQAWPP3
EQAWSU4 prefix.SAMPLE.DTSF(WSU4) setup file for EQAWPP4
EQAWSU5 prefix.SAMPLE.DTSF(WSU5) setup file for EQAWPP5
© Copyright IBM Corp. 1992, 2019 459

Starting IBM z/OS Debugger UtilitiesTo start IBM z/OS Debugger Utilities, do one the following options:v If IBM z/OS Debugger Utilities was installed as an option on an existing ISPF
panel, then select that option.v If IBM z/OS Debugger Utilities data sets were installed as part of your log on
procedure, enter the following command from ISPF option 6:EQASTART
v If IBM z/OS Debugger Utilities was installed as a separate application, enter thefollowing command from ISPF option 6:EX ’hlq.SEQAEXEC(EQASTART)’
The IBM z/OS Debugger Utilities primary panel (EQA@PRIM) is displayed. Onthe command line, enter the PANELID command. This command displays the nameof each panel on the upper left corner of the screen. These names are used asnavigation aids in the instructions provided in this section. After you completethese examples, you can stop the display of these names by entering the PANELIDcommand.
Compiling or assembling your program by using IBM z/OS DebuggerUtilities
To compile your program, do the following steps:1. In panel EQA@PRIM, select 1. Press Enter.2. In panel EQAPP, select one of the following option and then press Enter.v 1 to compile a COBOL program.v 3 to compile a PL/I programv 4 to compile a C or C++ programv 5 to assemble an assembler program
3. One of the following panels is displayed, depending on the language youselected in step 2:v EQAPPC1 for COBOL programs. Enter the following information in the
fields indicated:– Project = prefix
– Group= SAMPLE– Type=COBOL– Member=WPP1
v EQAPPC3 for PL/I programs.– Project = prefix
– Group= SAMPLE– Type=PLI– Member=WPP3
v EQAPPC4 for C and C++ programs.– Project = prefix
– Group= SAMPLE– Type=C– Member=WPP4
v EQAPPC5 for assembler programs.
460 IBM z/OS Debugger V14.1.9 User's Guide

– Project = prefix
– Group= SAMPLE– Type=ASM– Member=WPP5
4. If you are preparing an assembler program, enter the location of your CEElibrary in the Syslib data set Name field. For example: 'CEE.SCEEMAC'
5. Enter '/' to edit options and specify a naming pattern for the output data setsin the field Data set naming pattern. Press Enter.
6. One of the following panels is displayed, depending on the language youselected in step 2:v EQAPPC1A for COBOL programs.v EQAPPC3A for PL/I programs.v EQAPPC4A for C and C++ programs.v EQAPPC5A for assembler programs.
Look at the panel to review the following information:v test compiler optionsv naming patterns for output data sets
Press PF3 (Exit).7. One of the following panels is displayed, depending on the language you
selected in step 2:v EQAPPC1 for COBOL programs.v EQAPPC3 for PL/I programs.v EQAPPC4 for C and C++ programs.v EQAPPC5 for assembler programs.
Select "F" to process these programs in the foreground. Specify "N" for CICStranslator and "N" for DB2 precompiler. None of these programs contain CICSor DB2 instructions. Press Enter.
8. One of the following panels is displayed, depending on the language youselected in step 2:v EQAPPC1B for COBOL programs.v EQAPPC3B for PL/I programs.v EQAPPC4B for C and C++ programs.v EQAPPC5B for assembler programs.
Make a note of the data set name for Object compilation output. For a COBOLprogram, the data set name will look similar to the following name:prefix.SAMPLE.OBJECT(WPP1). You will use this name when you link yourobject modules. Press Enter.
9. If panel EQAPPA1 is displayed, press Enter.10. One of the following panels is displayed, depending on the language you
selected in step 2:v EQAPPC1C for COBOL programs.v EQAPPC3C for PL/I programs.v EQAPPC4C for C and C++ programs.v EQAPPC5C for assembler programs.
Check for a 0 or 4 return code. Type a "b" in the Listing field. Press Enter.
Appendix C. Examples: Preparing programs and modifying setup files with IBM z/OS Debugger Utilities 461

11. In panel ISRBROBA, browse the file to review the messages. When you aredone reviewing the messages, press PF3 (Exit).
12. One of the following panels is displayed, depending on the language youselected in step 2:v EQAPPC1C for COBOL programs.v EQAPPC3C for PL/I programs.v EQAPPC4C for C and C++ programs.v EQAPPC5C for assembler programs.
Press PF3 (Exit).13. One of the following panels is displayed, depending on the language you
selected in step 2:v EQAPPC1B for COBOL programs.v EQAPPC3B for PL/I programs.v EQAPPC4B for C and C++ programs.v EQAPPC5B for assembler programs.
Press PF3 (Exit).14. One of the following panels is displayed, depending on the language you
selected in step 2:v EQAPPC1 for COBOL programs.v EQAPPC3 for PL/I programs.v EQAPPC4 for C and C++ programs.v EQAPPC5 for assembler programs.
Press PF3 (Exit).15. In panel EQAPP, press PF3 (Exit) to return to EQA@PRIM panel.
To link your object modules, do the following steps:1. In panel EQA@PRIM, select 1. Press Enter.2. In panel EQAPP, select L. Press Enter.3. In panel EQAPPCL, specify "F" to process the programs in the foreground.
Then, choose one of the following options, depending on the language youselected in step 2v For the COBOL program, use the following values for each field: Project =
prefix, Group= SAMPLE, Type=OBJECT, Member=WPP1v For the PL/I program, use the following values for each field: Project =
prefix, Group= SAMPLE, Type=OBJECT, Member=WPP3v For the C program, use the following values for each field: Project = prefix,
Group= SAMPLE, Type=OBJECT, Member=WPP4v For the assembler program, use the following values for each field: Project
= prefix, Group= SAMPLE, Type=OBJECT, Member=WPP54. In panel EQAPPCL, specify the name of the other libraries you need to link to
your program. For example, in the field Syslib data set Name, specify theprefix of your CEE library: ’CEE.SCEELKED’. Press Enter.
5. In panel EQAPPCLB, make a note of the data set name in the Load link-editoutput field. You will use this name when you modify a setup file. PressEnter.
6. If panel EQAPPA1 is displayed, press Enter.7. In panel EQAPPCLC, check for a 0 return code. Type a "V" in the Listing field.
Press Enter.
462 IBM z/OS Debugger V14.1.9 User's Guide

8. In panel ISREDDE2, review the messages. After you review the messages,press PF3 (Exit).
9. In panel EQAPPCLC, press PF3 (Exit).10. In panel EQAPPCLB, press PF3 (Exit).11. In panel EQAPPCL, press PF3 (Exit).12. In panel EQAPP, press PF3 (Exit) to return to EQA@PRIM panel.
Modifying and using a setup fileThis example describes how to modify a setup file and then use it to run theexamples in the TSO foreground or run the examples in the background bysubmitting a MVS batch job.
Run the program in foregroundTo modify and run the setup file so your program runs in the foreground, do thefollowing steps:1. In panel EQA@PRIM, select 2. Press Enter.2. In panel EQAPFOR, select one of the following choices, depending on which
language you selected in step 2 in topic “Compiling or assembling yourprogram by using IBM z/OS Debugger Utilities” on page 460:v For the COBOL program, use the following values for each field: Project =
prefix, Group= SAMPLE, Type=DTSF, Member = WSU1v For the PL/I program, use the following values for each field: Project =
prefix, Group = SAMPLE, Type=DTSF, Member=WSU3v For the C program, use the following values for each field: Project = prefix,
Group= SAMPLE, Type=DTSF, Member=WSU4v For the assembler program, use the following values for each field: Project =
prefix, Group= SAMPLE, Type=DTSF, Member=WSU5
Press Enter.3. In panel EQAPFORS, do the following steps:
a. Replace &LOADDS. with the name of the load data set from step 5 in topic“Compiling or assembling your program by using IBM z/OS DebuggerUtilities” on page 460:
b. Replace &EQAPRFX. with the prefix your EQAW (z/OS Debugger) library.c. Replace &CEEPRFX. with the prefix your CEE (Language Environment)
library.d. Enter "e" in Cmd field next to CMDS DD name. In the window that is
displayed, if there is a QUIT ; statement at the end of the data set, removeit. Press PF3 (Exit).
e. Type "run" in command line. Press Enter.4. z/OS Debugger is started and the z/OS Debugger window is displayed. Enter
any valid z/OS Debugger commands to verify that you can debug theprogram. Enter "qq" in the command line to stop z/OS Debugger and close thez/OS Debugger window.
5. In panel EQAPFORS, check the return code message:v For the COBOL program, the return code (RC) is 0.v For the PL/I program, the return code (RC) is 1000.v For the C program, the return code (RC) is 0.v For the assembler program, the return code (RC) is 0.
Appendix C. Examples: Preparing programs and modifying setup files with IBM z/OS Debugger Utilities 463

Press PF3 (Exit). All the changes made to the setup file are saved.6. In panel EQAPFOR, press PF3 (Exit) to return to the panel EQA@PRIM.
Run the program in batchTo modify and run the setup file so that the program runs in batch, do thefollowing steps:1. In panel EQA@PRIM, select 0. Press Enter.2. In panel EQAPDEF, review the job card information. If there are any changes
that need to be made, make them. Press PF3 (Exit).3. In panel EQA@PRIM, select 2. Press Enter.4. In panel EQAPFOR, select one of the following choices, depending on which
language you selected in step 2 in topic “Compiling or assembling yourprogram by using IBM z/OS Debugger Utilities” on page 460:v For the COBOL program, use the following values for each field: Project =
prefix, Group = SAMPLE, Type = DTSF, Member =WSU1v For the PL/I program, use the following values for each field: Project =
prefix, Group = SAMPLE, Type = DTSF, Member =WSU3v For the C program, use the following values for each field: Project = prefix,
Group = SAMPLE, Type = DTSF, Member = WSU4v For the assembler program, use the following values for each field: Project
= prefix, Group = SAMPLE, Type = DTSF, Member = WSU5
Press Enter.5. If you ran the steps beginning in step 1 of topic “Run the program in
foreground” on page 463 you can skip this step. In panel EQAPFORS, do thefollowing steps:a. Replace &LOADDS. with the name of the load data set from step 5 in topic
“Compiling or assembling your program by using IBM z/OS DebuggerUtilities” on page 460.
b. Replace &EQAPRFX. with the prefix your EQAW (z/OS Debugger) library.c. Replace &CEEPRFX. with the prefix your CEE (Language Environment)
library.6. Enter "e" in the Cmd field next to CMDS DD name. If there is not ’QUIT ;’
statement at the end of the data set, then add the statement. Press PF3 (Exit).7. Type submit in command line. Press Enter.8. In panel ISREDDE2, type submit in the command line. Press Enter. Make a
note of the job number that is displayed.9. In panel ISREDDE2, press PF3 (Exit).
10. In panel EQAPFORS, press PF3 (Exit). The changes you made to the setup fileare saved.
11. In panel EQAPFOR, press PF3 (Exit) to return to EQA@PRIM panel. locate thejob output using the job number recorded. Check for zero return code and thecommand log output at the end of the job output.
464 IBM z/OS Debugger V14.1.9 User's Guide
Appendix D. z/OS Debugger JCL Wizard
z/OS Debugger JCL Wizard introduction
By using the EQAJCL ISPF edit macro, you can modify a JCL or proceduremember and create statements to invoke z/OS Debugger in various environments.You can also create statements to invoke z/OS Debugger using the TerminalInterface Manager or Remote GUI.
By using the z/OS Debugger JCL Wizard, you can build control statements tocomplete following tasks:v Invoke z/OS Debugger, accessing the Terminal Interface Manager or Remote
GUI.v Invoke z/OS Debugger for Language Environment (LE) or non-Language
Environment (non-LE) programs.v Include a request to invoke the Automonitor.v Include a request to set AT ENTRY breakpoints.v Include a request to SET WARN OFF or ON.v Define the libraries to search for z/OS Debugger source and debug information.
Note: If the program name or CSECT name for assembler is not the membername of the debug file, the wizard presents a list of members for each debugfile, and then users can select the corresponding member name.
v Provide a panel to enter the programs which require LDD statements.v Request Code Coverage invocation with or without an interactive Debug
session.v Request a Delayed Debug session.v Remove z/OS Debugger statements.v Show comments depicting how to access subprogram source and debug
information before being loaded into storage.
The user identifies the location of the statements by using an A (after) or B (before)line command. If no line command is supplied and more than one program wasidentified in the JCL or procedure member, the wizard lists all programs. You canselect the program that you want to debug from the list. If you want to provide anoverride value of procedure step, specify an A or B line command.
The z/OS Debugger JCL Wizard can create in-stream data. Therefore, it works witha procedure member for JES2 under z/OS 1.13 or later, and with JES3 under z/OS2.1 or later. If you do not run z/OS Debugger JCL Wizard in one of theenvironments that are described above, submitting JCL invoking procedures within-stream control statements fails.
Generation of the EQAMDBG DD statement for C/C++ mdbg files is notsupported.
© Copyright IBM Corp. 1992, 2019 465

z/OS Debugger JCL Wizard use cases
Help information
To see the help information, complete the following steps:1. You can edit or view JCL, a JCL procedure, or an include member in ISPF to
invoke z/OS Debugger JCL Wizard. Your installer can customize yourenvironment to use another name rather than EQAJCL, such as DEBUG. In thisuse case, the name EQAJCL is used to invoke the z/OS Debugger JCL Wizard.
2. The z/OS Debugger JCL Wizard Option Selection panel is displayed as follows.To see the Getting Started help panel, select PF1 from this panel.
3. To invoke z/OS Debugger, the z/OS Debugger JCL Wizard needs to create thenecessary JCL statements. The following options are provided:
466 IBM z/OS Debugger V14.1.9 User's Guide

4. You can invoke the z/OS Debugger JCL Wizard when you view or edit a JCLmember, a procedure member, or an include member. z/OS Debugger JCLWizard can create instream JCL statements. For procedures or includedmembers, instream JCL statements such as //SYSIN DD * are valid only whenyou use JES2 systems with z/OS V1.R13 or later, or JES3 systems with z/OSV2.1.0 or later.
5. To choose where new JCL lines are placed, use an A or B line command. If theA or B line commands are not used, a list of job steps is displayed for yourselection.
Note: The z/OS Debugger JCL Wizard does not create the JCL for all scenarios.For example, if you want to debug multiple job steps in a JCL member, you cancreate the JCL for the first z/OS Debugger invocation by using the z/OSDebugger JCL Wizard. However, you need to manually code the JCL to invokez/OS Debugger for the second step.
Appendix D. z/OS Debugger JCL Wizard 467

Debug a Language Environment program by using theTerminal Interface Manager
To debug a Language Environment program by using the z/OS Debugger JCLWizard, you can use the Terminal Interface Manager. To do the job, complete thefollowing steps:1. In the following panel, the program name is a symbolic name that is defined
by a SET statement. The z/OS Debugger JCL Wizard can process symbolicprogram names correctly. To invoke the z/OS Debugger JCL Wizard Optionspanel, type EQAJCL.
2. Select the Terminal Interface Manager option from the following panel.
468 IBM z/OS Debugger V14.1.9 User's Guide

3. All fields have field help available. To view the field help that is associatedwith the LE Program field, place the cursor in the LE Program field and pressPF1.
4. Enter YES if the program invoked by the "EXEC PGM=" statement isLanguage Environment enabled. Enter NO if the program is not LanguageEnvironment enabled. If the LE Program field is set incorrectly, z/OSDebugger is not invoked.
Appendix D. z/OS Debugger JCL Wizard 469

5. Type YES in the LE Program field if the program is a Language Environmentenabled program. If you want to set breakpoints at subprograms using the ATENTRY command, and request the Automonitor, specify a forward slash (/)for At Entry and Automonitor on.
6. After you choose to set AT ENTRY breakpoints for subprograms, thefollowing panel is displayed. If you are saving your settings or using theremote debugger, AT ENTRY breakpoints are remembered between debugsessions. To clear previous AT ENTRY Breakpoints before setting thesebreakpoints, enter the forward slash (/) in the Clear Previous AT ENTRYBreakpoints line.
Note: z/OS subprograms can be linked as static or dynamic. A staticsubprogram is included in the load module of the main program. A dynamicprogram is not included in the load module of the main program, butdynamically loaded into storage when the first CALL or a LOAD statement isissued. If you are using the remote debugger, and the load module name is
470 IBM z/OS Debugger V14.1.9 User's Guide

different that the program name, be sure to enter the load module name toidentify the correct AT ENTRY breakpoint. A program name is thePROGRAM-ID for COBOL, the first CSECT for assembler, or the label definedon the MAIN procedure of a PL/I program. For statically linked modules, youwill need the load module name of the main program, and the program nameof the subprogram name where you want to stop.
7. If more than one EXEC PGM statement is found in the JCL or procedure, andyou did not specify the A or B line command, a list of job steps is displayed.Choose the program you want to debug. You can choose only one step.
8. z/OS Debugger JCL Wizard has generated the appropriate statements toinvoke z/OS Debugger. The first and last generated lines are comment lines.Do not modify these comment lines. The //CEEOPTS statement defines theEQACMD command file DD name, and the VTAM% userid information toinvoke the Terminal Interface Manager.
Appendix D. z/OS Debugger JCL Wizard 471

The SET LOG OFF command indicates you do not want to retain your loginformation. Previous AT ENTRY breakpoints are cleared, and breakpoints forsubprograms SAM2 and SAM3 are set.The comment lines explain how to locate a program, and set breakpointsbefore invocation of the subprogram for the Terminal Interface Manager.To initiate this session, start the Terminal Interface Manager, sign on to theTerminal Interface Manager with your userid and password. Submit the job. Ifthe Terminal Interface Manager does not start a debug session, verify that thejob is not waiting for an initiator, or did not fail with a JCL error.
9. To remove the statements that are previously generated by the z/OSDebugger JCL Wizard, use the EQAJCL R command. The first and last linesgenerated are comment lines. If you modify the comment lines, the statementsthat are generated by the z/OS Debugger JCL Wizard cannot be removedproperly.
472 IBM z/OS Debugger V14.1.9 User's Guide

10. The JCL statements that are generated by z/OS Debugger JCL Wizard areremoved.
Debug a Language Environment program with the Remote GUIby using the A line command with a Procedure Step Overridewith the TEST parameter TCPIP
You can use the remote debugger, or GUI to debug Enterprise COBOL, COBOL forMVS and VM, Enterprise PL/I, later versions of C/C++ and assembler. To invokethe z/OS Debugger remote debugger with a line command to indicate where theJCL is placed, complete the following steps:1. In the following panel, issue the EQAJCL G1 command to bypass the options
screen, and request a debug session with remote debugger. Then, place thegenerated statements after the line that contains the TESTSAM1 EXECstatement at line 5.
Appendix D. z/OS Debugger JCL Wizard 473

2. Then, you need your IP Address from your workstation. To locate this IPaddress, start the remote debugger, and open the DEBUG perspective. Noteyour port number. It is generally 8001.
3. Paste your IP address into the IP address field. Enter the port number that isprovided by the remote debugger. You can optionally choose to add AT ENTRYbreakpoints, set the Automonitor on, and show comments on how to displaysubprograms before invocation.
4. The subprograms SAM2 and SAM3 are dynamically called. The load modulename of SAM2 and SAM3 is named SAM2 and SAM3 respectively. Therefore,only the program name is required.
474 IBM z/OS Debugger V14.1.9 User's Guide
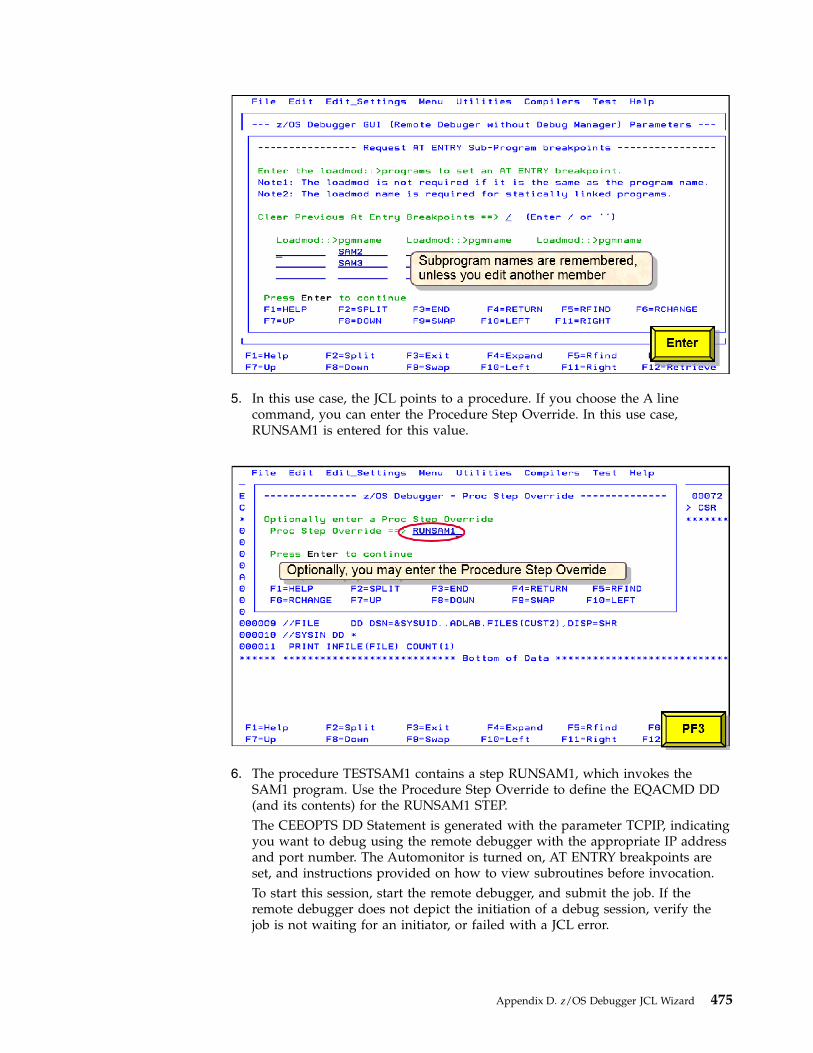
5. In this use case, the JCL points to a procedure. If you choose the A linecommand, you can enter the Procedure Step Override. In this use case,RUNSAM1 is entered for this value.
6. The procedure TESTSAM1 contains a step RUNSAM1, which invokes theSAM1 program. Use the Procedure Step Override to define the EQACMD DD(and its contents) for the RUNSAM1 STEP.The CEEOPTS DD Statement is generated with the parameter TCPIP, indicatingyou want to debug using the remote debugger with the appropriate IP addressand port number. The Automonitor is turned on, AT ENTRY breakpoints areset, and instructions provided on how to view subroutines before invocation.To start this session, start the remote debugger, and submit the job. If theremote debugger does not depict the initiation of a debug session, verify thejob is not waiting for an initiator, or failed with a JCL error.
Appendix D. z/OS Debugger JCL Wizard 475

Debug a Language Environment program with the Remote GUIby using Debug Manager
To debug a Language Environment program with the z/OS Debugger JCL Wizard,you can use the Debug Manager. To do the job, complete the following steps:1. In the following panel, issue the EQAJCL G2 command to bypass the options
screen, and request a debug session with the remote debugger.
2. Type YES in the LE Program field if the program is a Language Environmentenabled program. If you connected to the Remote System Explorer (RSE) withan ID other than the one you are logged on to TSO with, specify it in Userid.
476 IBM z/OS Debugger V14.1.9 User's Guide

3. If more than one EXEC PGM statement is found in the JCL or procedure, andyou did not specify the A or B line command, a list of job steps is displayed.Choose the program that you want to debug. You can choose only one step.
4. The procedure TESTSAM1 contains a step RUNSAM1, which invokes theSAM1 program. Use the Procedure Step Override to define the EQACMD DDand its contents for the RUNSAM1 STEP.The CEEOPTS DD Statement is generated with the parameter DBMDT, whichindicates that you want to debug with the remote debugger by using DebugManager. The Automonitor is turned off and you cannot update variables forOptimized COBOL.To start this session, start the remote debugger, connect to the Remote SystemsExplorer (RSE) from the remote debugger, and submit the job. If the remotedebugger does not depict the initiation of a debug session, verify that the job isnot waiting for an initiator, or failed with a JCL error.
Appendix D. z/OS Debugger JCL Wizard 477

Debug a non-Language Environment program by using theTerminal Interface Manager
You can use the z/OS Debugger JCL Wizard to invoke non-Language Environmentprograms. If you do not plan to test non-Language Environment programs, skipthis use case.
To debug a non-Language Environment program by using Terminal InterfaceManager, complete the following steps:1. To invoke the z/OS Debugger JCL Wizard for the terminal interface manager,
type EQAJCL T.
2. If you want to debug a non-Language Environment assembler program, enterNO in the LE Program field.
478 IBM z/OS Debugger V14.1.9 User's Guide
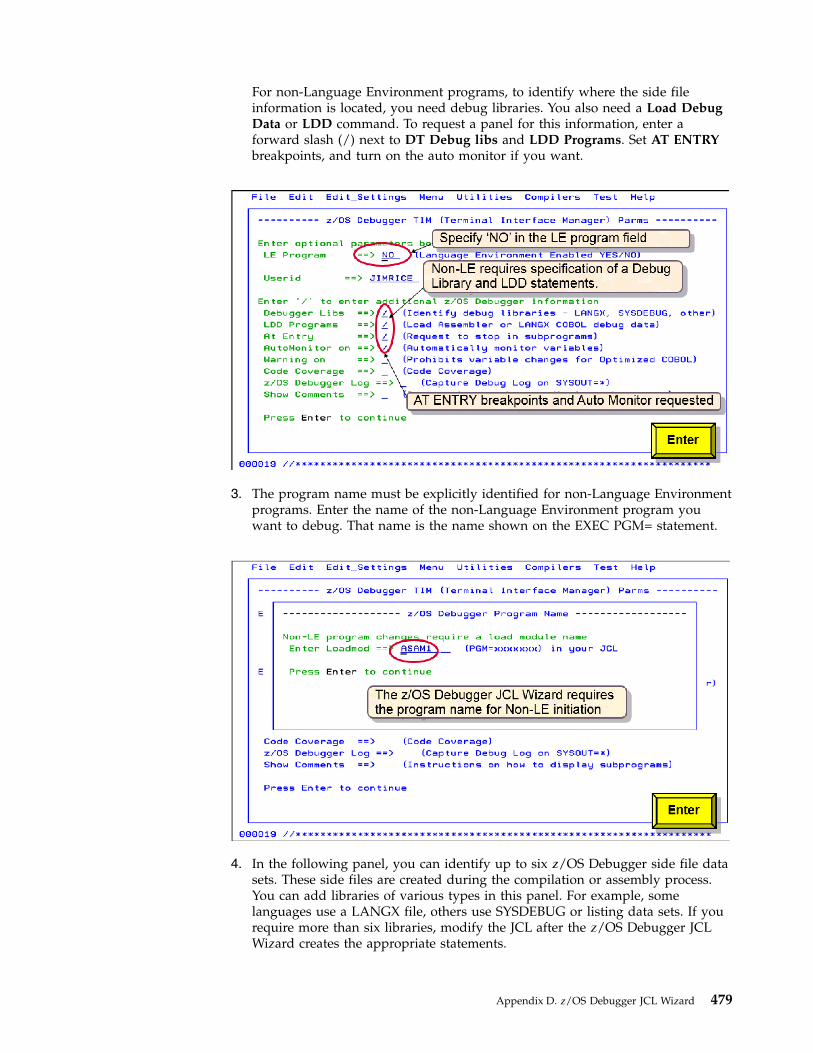
For non-Language Environment programs, to identify where the side fileinformation is located, you need debug libraries. You also need a Load DebugData or LDD command. To request a panel for this information, enter aforward slash (/) next to DT Debug libs and LDD Programs. Set AT ENTRYbreakpoints, and turn on the auto monitor if you want.
3. The program name must be explicitly identified for non-Language Environmentprograms. Enter the name of the non-Language Environment program youwant to debug. That name is the name shown on the EXEC PGM= statement.
4. In the following panel, you can identify up to six z/OS Debugger side file datasets. These side files are created during the compilation or assembly process.You can add libraries of various types in this panel. For example, somelanguages use a LANGX file, others use SYSDEBUG or listing data sets. If yourequire more than six libraries, modify the JCL after the z/OS Debugger JCLWizard creates the appropriate statements.
Appendix D. z/OS Debugger JCL Wizard 479

5. Enter the program names and subprogram names that are being debugged.These names are used for setting AT ENTRY breakpoints. Use this panel toidentify the non-Language Environment programs before you invoke the z/OSDebugger for the debugging session.
6. When you set breakpoints, generally only the program name is required.However, if the load module name is different from the program name, enterthe load module name next to the program name. In this use case, the ASAM2program load module name is ASAM2L.
480 IBM z/OS Debugger V14.1.9 User's Guide

7. The JCL to invoke z/OS Debugger is generated. Note that the program nameon line 3 was changed from ASAM1 to EQANMDBG. This program willinitiate the debug session, debugging ASAM1, the first program to be invoked.The VTAM%DNET424 requests z/OS Debugger to invoke the TerminalInterface Manager. This information is passed to the EQANMDBG program viathe EQANMDBG DD statement.LDD statements are generated for the programs ASAM1, ASAM2, and ASAM3.Breakpoints are set for ASAM2, and ASAM3, using the load modules ASAM2Land ASAM3L respectively.The EQADEBUG DD statement defines the side files, where the programsource and debug data can be found.
8. To remove the z/OS Debugger JCL statements, enter EQAJCL R.
Appendix D. z/OS Debugger JCL Wizard 481
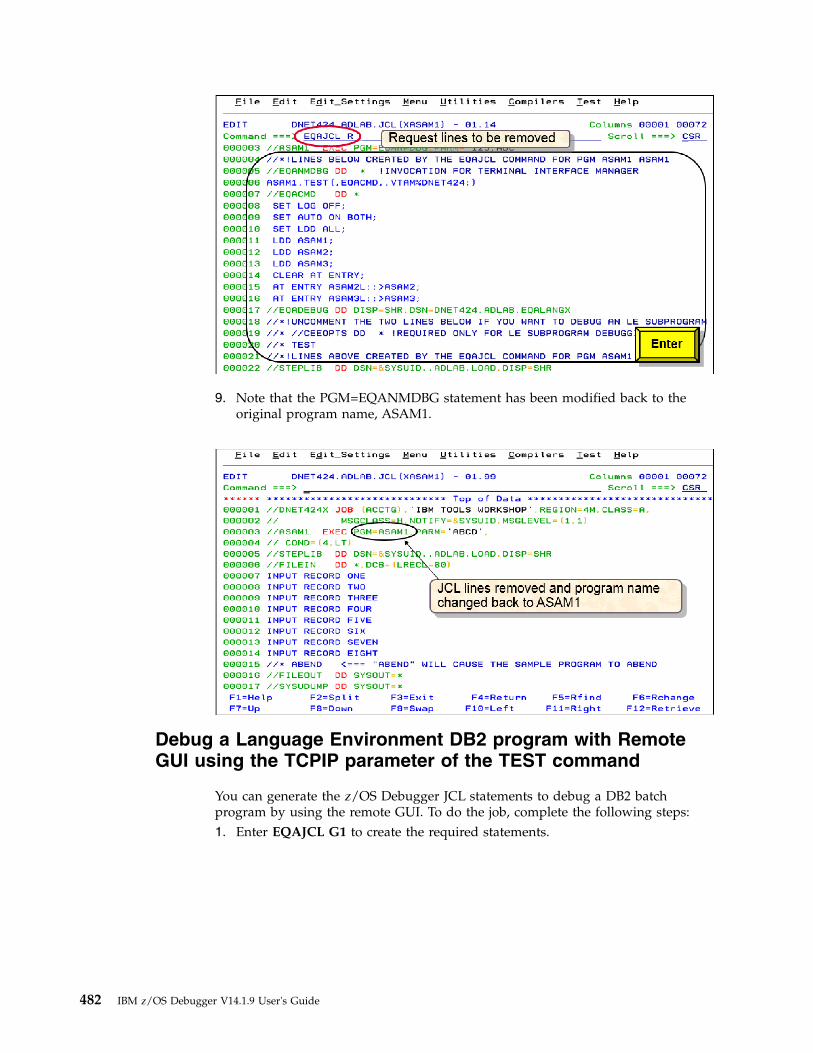
9. Note that the PGM=EQANMDBG statement has been modified back to theoriginal program name, ASAM1.
Debug a Language Environment DB2 program with RemoteGUI using the TCPIP parameter of the TEST command
You can generate the z/OS Debugger JCL statements to debug a DB2 batchprogram by using the remote GUI. To do the job, complete the following steps:1. Enter EQAJCL G1 to create the required statements.
482 IBM z/OS Debugger V14.1.9 User's Guide

2. The program is a Language Environment program, therefore, type YES to theLE Program field. The Automonitor is not needed for the remote debuggerwhen debugging Enterprise COBOL or PL/I programs. You can monitorvariables by right-clicking the variables pane, and requesting filter locals, thenselect Automonitor current or Automonitor Previous.
3. The JCL statements were generated for the batch DB2 program. This process isidentical to a non-DB2 program invocation.
Appendix D. z/OS Debugger JCL Wizard 483

Debug a non-Language Environment DB2 program by usingthe Remote GUI
You can create the JCL to start a z/OS Debugger session for a non-LanguageEnvironment DB2 batch program. To do the job, complete the following steps:1. Request to debug the non-Language Environment DB2 program on the GUI.
2. Set the Language Environment Program option to NO if the DB2 program isnon-Language Environment, and request the z/OS Debugger debug libraries,the LDD statements, and the Automonitor.
484 IBM z/OS Debugger V14.1.9 User's Guide

3. Enter the name of the non-Language Environment program, TRADERD.
4. Enter one or more debug libraries that are associated with the TRADERDprogram and subprograms that you want to debug.
Appendix D. z/OS Debugger JCL Wizard 485

5. The program name is required for the LDD statements.
6. To invoke non-Language Environment DB2 program, change the program namein the SYSTSIN statements from TRADERD to EQANMDBG, and enter theDD name EQANMDBG followed by the program name TRADERD, and theappropriate TEST parameters.Due to the complexity of locating and updating the SYSTSIN statements, thisscenario must be done manually. Follow the previous example to create theappropriate statements.
486 IBM z/OS Debugger V14.1.9 User's Guide
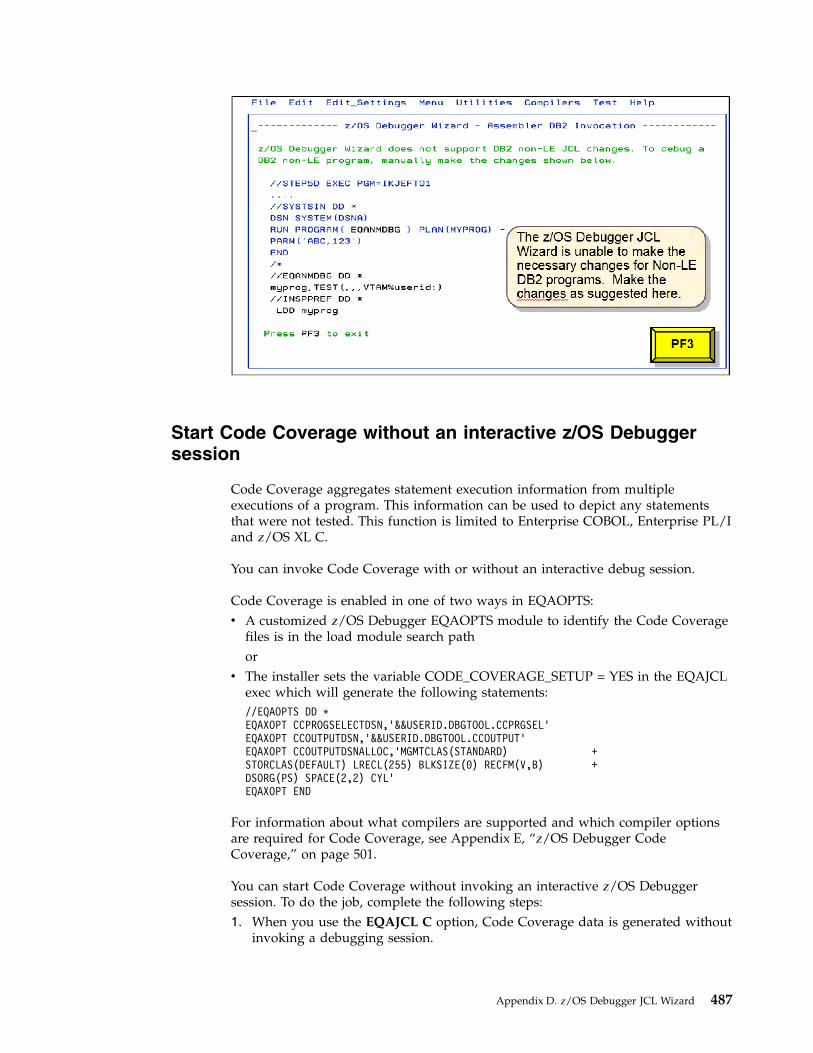
Start Code Coverage without an interactive z/OS Debuggersession
Code Coverage aggregates statement execution information from multipleexecutions of a program. This information can be used to depict any statementsthat were not tested. This function is limited to Enterprise COBOL, Enterprise PL/Iand z/OS XL C.
You can invoke Code Coverage with or without an interactive debug session.
Code Coverage is enabled in one of two ways in EQAOPTS:v A customized z/OS Debugger EQAOPTS module to identify the Code Coverage
files is in the load module search pathor
v The installer sets the variable CODE_COVERAGE_SETUP = YES in the EQAJCLexec which will generate the following statements://EQAOPTS DD *EQAXOPT CCPROGSELECTDSN,’&&USERID.DBGTOOL.CCPRGSEL’EQAXOPT CCOUTPUTDSN,’&&USERID.DBGTOOL.CCOUTPUT’EQAXOPT CCOUTPUTDSNALLOC,’MGMTCLAS(STANDARD) +STORCLAS(DEFAULT) LRECL(255) BLKSIZE(0) RECFM(V,B) +DSORG(PS) SPACE(2,2) CYL’EQAXOPT END
For information about what compilers are supported and which compiler optionsare required for Code Coverage, see Appendix E, “z/OS Debugger CodeCoverage,” on page 501.
You can start Code Coverage without invoking an interactive z/OS Debuggersession. To do the job, complete the following steps:1. When you use the EQAJCL C option, Code Coverage data is generated without
invoking a debugging session.
Appendix D. z/OS Debugger JCL Wizard 487

2. Select the program step name that you want to gather Code Coverage for.
3. To invoke z/OS Debugger and do Code Coverage, a Language Environmentvariable EQA_STARTUP_KEY=CC is added to the CEEOPTS DD. TheEQAOPTS DD statements are generated to provide the appropriate data setsfor code coverage. After the program completes, you can review the codecoverage information by using the IBM z/OS Debugger Utilities option E z/OSDebugger Code Coverage.
488 IBM z/OS Debugger V14.1.9 User's Guide

Start Code Coverage with an interactive z/OS Debuggersession using the Terminal Interface Manager
You can also create code coverage information during an interactive debuggingsession. To do the job, compete the following tasks:1. Enter EQAJCL T to navigate to the z/OS Debugger Terminal Interface Manager
menu.
2. Code Coverage is available for Enterprise COBOL, Enterprise PL/I or z/OS XLC programs that are compiled with certain compilers and with the appropriateoptions. To collect the code coverage information, enter a forward slash (/) forCode Coverage.
Appendix D. z/OS Debugger JCL Wizard 489
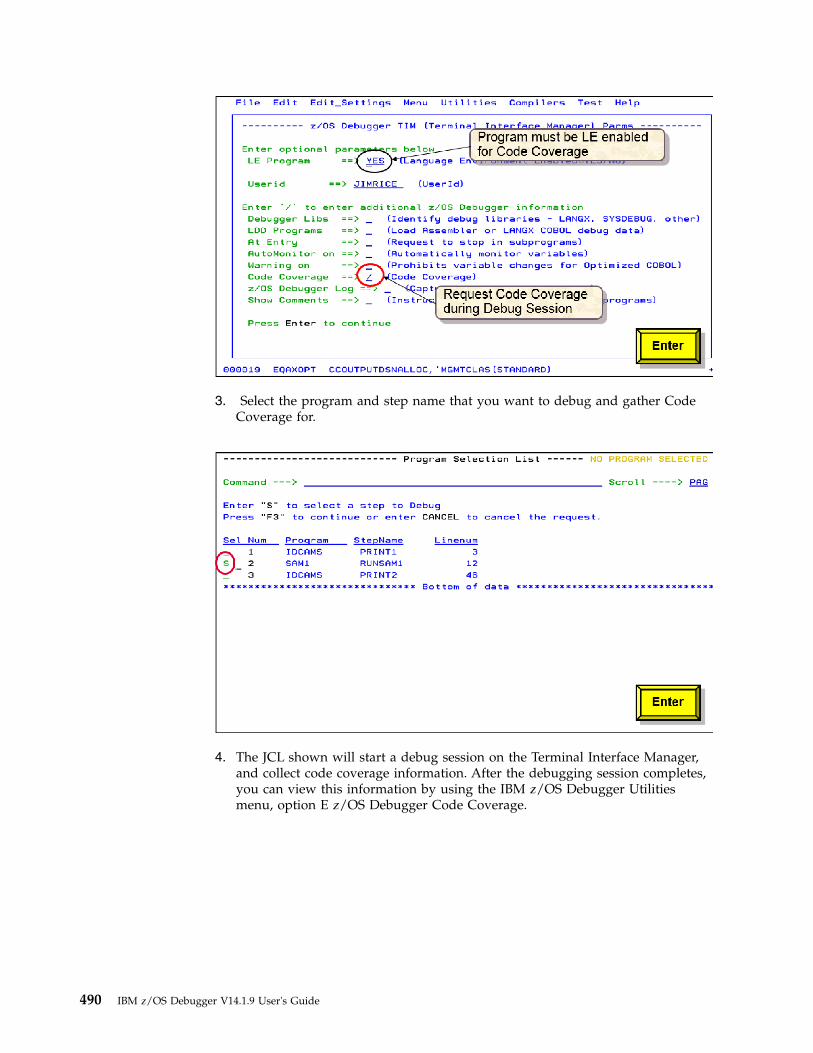
3. Select the program and step name that you want to debug and gather CodeCoverage for.
4. The JCL shown will start a debug session on the Terminal Interface Manager,and collect code coverage information. After the debugging session completes,you can view this information by using the IBM z/OS Debugger Utilitiesmenu, option E z/OS Debugger Code Coverage.
490 IBM z/OS Debugger V14.1.9 User's Guide

Debug a Language Environment VS COBOL II programcompiled with the NOTEST option by using the TerminalInterface Manager
If you do not debug VS COBOL II programs, skip this use case.
You can use one of the following ways to debug a VS COBOL II program:v Use the TEST compilation option.v Use the NOTEST compilation option, which is described in this use case. This
method is called LANGX COBOL in the z/OS Debugger manuals.
To debug Language Environment with a VS COBOL II Program compiled withNOTEST option by using the Terminal Interface Manager, complete the followingsteps:1. To debug VS COBOL II programs by using the Terminal Interface Manager,
enter EQAJCL T.
Appendix D. z/OS Debugger JCL Wizard 491
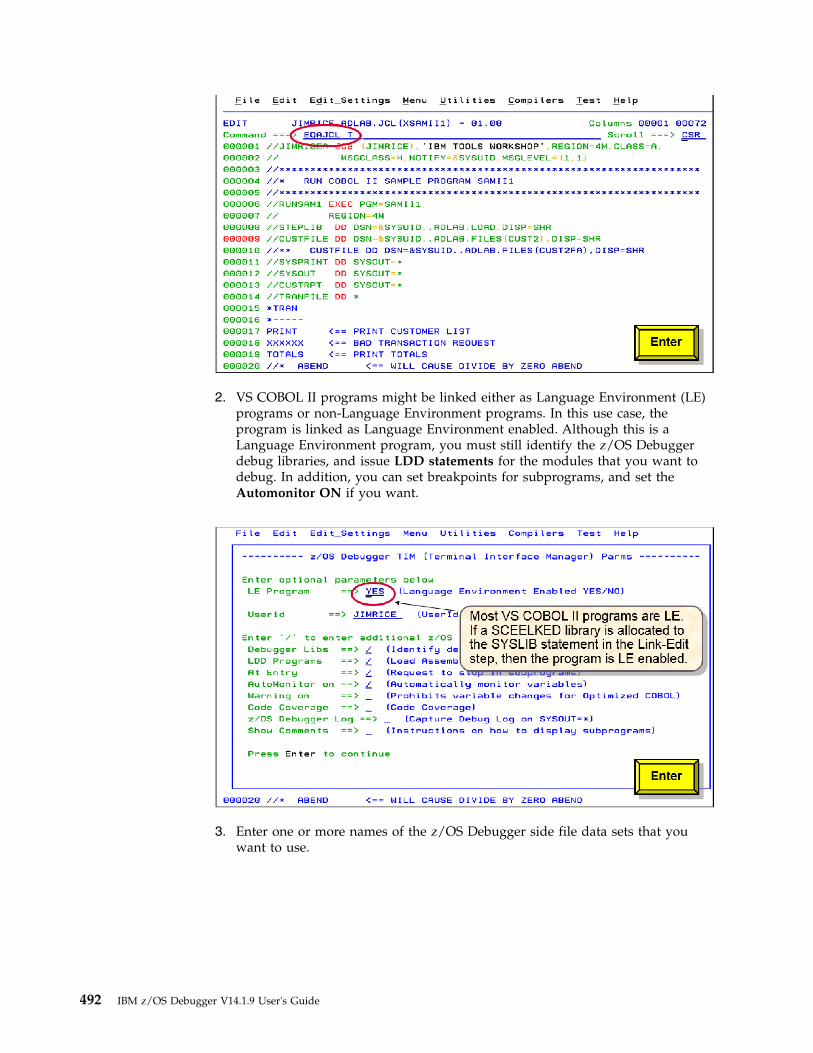
2. VS COBOL II programs might be linked either as Language Environment (LE)programs or non-Language Environment programs. In this use case, theprogram is linked as Language Environment enabled. Although this is aLanguage Environment program, you must still identify the z/OS Debuggerdebug libraries, and issue LDD statements for the modules that you want todebug. In addition, you can set breakpoints for subprograms, and set theAutomonitor ON if you want.
3. Enter one or more names of the z/OS Debugger side file data sets that youwant to use.
492 IBM z/OS Debugger V14.1.9 User's Guide

4. Enter the names of the main program and subprograms that you want todebug.
5. Enter the names of the subprograms that you want to set an entry breakpointfor.
Appendix D. z/OS Debugger JCL Wizard 493

6. The JCL for VS COBOL II z/OS Debugger invocation is created. To define thesource and debug information during the debug session, the LDD statementsand EQADEBUG libraries are required.
Debug a non-Language Environment program when the debugmember does not match the program name
1. To invoke z/OS Debugger JCL Wizard by using the Terminal InterfaceManager, enter EQAJCL T.
494 IBM z/OS Debugger V14.1.9 User's Guide

2. Enter No if the program is not a Language Environment program.
3. Enter the name of the non-Language Environment program that you want todebug. The program name is ASAM1 in this use case.
Appendix D. z/OS Debugger JCL Wizard 495
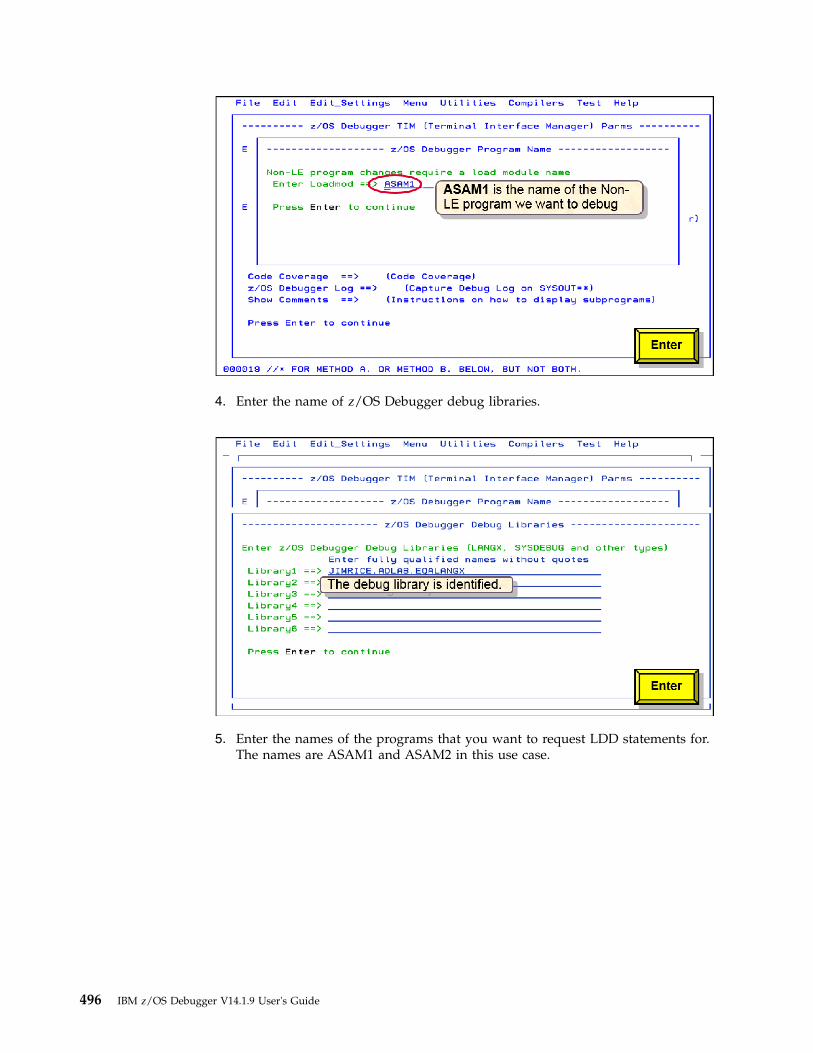
4. Enter the name of z/OS Debugger debug libraries.
5. Enter the names of the programs that you want to request LDD statements for.The names are ASAM1 and ASAM2 in this use case.
496 IBM z/OS Debugger V14.1.9 User's Guide

6. Enter S to select or deselect a debug member for program ASAM1. If theprogram name or CSECT name is the member name of the debug file, nomember ASAM1 was found.
7. The Set Source statement is built to map the program name with the debugmember name.
Appendix D. z/OS Debugger JCL Wizard 497

8. Enter S to select the step that runs program ASAM1.
9. The SET SOURCE statement is generated.
498 IBM z/OS Debugger V14.1.9 User's Guide

The end.
Appendix D. z/OS Debugger JCL Wizard 499

500 IBM z/OS Debugger V14.1.9 User's Guide

Appendix E. z/OS Debugger Code Coverage
Note: This chapter is not applicable to IBM Developer for z Systems(non-Enterprise Edition), IBM Z Open Development, or IBM Z Open Unit Test.
You can use IBM z/OS Debugger to generate, view, and report code coverageobservations. The code coverage observations can be generated interactively or inbatch mode.
There are five activities that are described here:1. Setup: Start a code coverage session with z/OS Debugger.2. Code coverage observations gathering: Using z/OS Debugger to generate the
code coverage observations.3. Selection and filtering: Creating a selection and filtering criteria to be used in
the creation of a report.4. Viewing: Viewing code coverage observations interactively.5. Report creation: Creating a code coverage report that is based on the selection
and filtering criteria that are provided.
Batch facilities are provided so that collection of the code coverage data, usingselection criteria to create extracted observations, and report creation can be donein unattended mode (batch).
Overview of z/OS Debugger Code CoverageYou can use z/OS Debugger to measure code coverage in your application testing.In this part, you can learn the basics of running the code coverage function ofz/OS Debugger from setup to generating reports. New users are encouraged toread this part to learn the basics of the tool, including how to create code coverageobservations and the use of the ISPF dialogs.
Introduction to z/OS Debugger Code Coveragez/OS Debugger Code Coverage measures test case code coverage in applicationprograms that are written in COBOL, PL/I and C and compiled with certaincompilers and compiler options. The code coverage function enables you to testyour application and generate information to determine which code statements areexecuted.
The code coverage function in z/OS Debugger has the following advantages:v You can use the same load modules that you use when you develop your
application to generate the code coverage data.v In some cases, the debugger can help reach sections of code that are difficult to
simulate with a test case during development. When such needs arise, z/OSDebugger marks the observations with special indicator so it is known thatinteraction with the user created a deviation from the normal logic of theprogram.
v You can run code coverage unattended using batch facilities.v XML is used to render information, which makes it easier for users to develop
their own facilities to present and evaluate information.
© Copyright IBM Corp. 1992, 2019 501

This section contains the following topics:v Graphical Overview of the process of starting a code coverage data gathering
session with z/OS Debugger, creating code coverage reports, and displaying thereports.
v Startupv EQAOPTSv IBM z/OS Debugger Utilities Option E. z/OS Debugger Code Coverage
– Observation Viewer. Option E.1: Browse code coverage observations.– z/OS Debugger Options. Option E.2: Create or modify z/OS Debugger Code
Coverage options.– Observation Selection Criteria. Option E.3: Create or modify the observation
selection criteria and source markers.– Observation Extraction. Option E.4: Extract code coverage observations using
selection criteria.– Report Generation. Option E.5: Create reports.
Collecting code coverage observations with z/OS DebuggerThe following figure shows the steps that are required for z/OS Debugger tocollect code coverage information. The key elements are as follows:v EQA_STARTUP_KEY. An environment variable that needs to be specified at the
start of the z/OS Debugger Code Coverage session.v An Options file that indicates what programs you want z/OS Debugger to
monitor to get code coverage observations.v EQAOPTS commands that indicate the location of the input and output data
sets.
The code coverage observations collection process is as follows:1. When the environment variable EQA_STARTUP_KEY is specified during
invocation of the debugger, z/OS Debugger collects code coverageobservations.
2. z/OS Debugger gathers code coverage data based on input from the Optionsfile.
Figure 3. Step 1 Gathering code coverage observations with z/OS Debugger
502 IBM z/OS Debugger V14.1.9 User's Guide
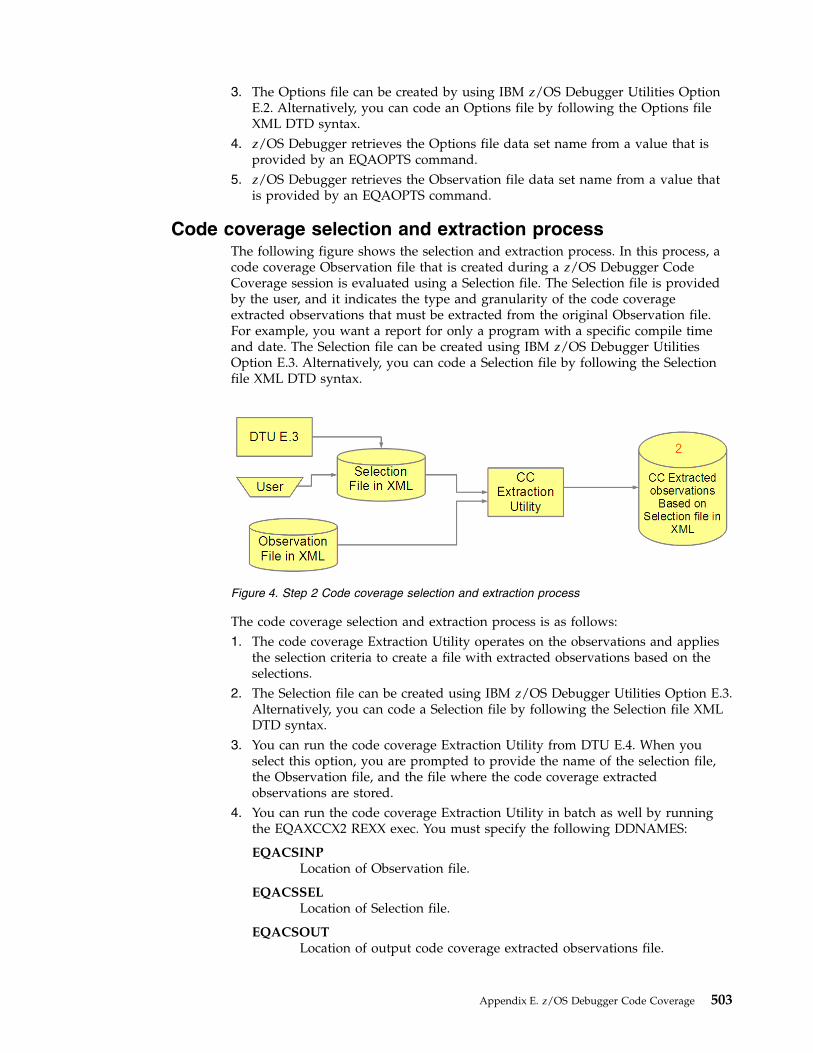
3. The Options file can be created by using IBM z/OS Debugger Utilities OptionE.2. Alternatively, you can code an Options file by following the Options fileXML DTD syntax.
4. z/OS Debugger retrieves the Options file data set name from a value that isprovided by an EQAOPTS command.
5. z/OS Debugger retrieves the Observation file data set name from a value thatis provided by an EQAOPTS command.
Code coverage selection and extraction processThe following figure shows the selection and extraction process. In this process, acode coverage Observation file that is created during a z/OS Debugger CodeCoverage session is evaluated using a Selection file. The Selection file is providedby the user, and it indicates the type and granularity of the code coverageextracted observations that must be extracted from the original Observation file.For example, you want a report for only a program with a specific compile timeand date. The Selection file can be created using IBM z/OS Debugger UtilitiesOption E.3. Alternatively, you can code a Selection file by following the Selectionfile XML DTD syntax.
The code coverage selection and extraction process is as follows:1. The code coverage Extraction Utility operates on the observations and applies
the selection criteria to create a file with extracted observations based on theselections.
2. The Selection file can be created using IBM z/OS Debugger Utilities Option E.3.Alternatively, you can code a Selection file by following the Selection file XMLDTD syntax.
3. You can run the code coverage Extraction Utility from DTU E.4. When youselect this option, you are prompted to provide the name of the selection file,the Observation file, and the file where the code coverage extractedobservations are stored.
4. You can run the code coverage Extraction Utility in batch as well by runningthe EQAXCCX2 REXX exec. You must specify the following DDNAMES:
EQACSINPLocation of Observation file.
EQACSSELLocation of Selection file.
EQACSOUTLocation of output code coverage extracted observations file.
Figure 4. Step 2 Code coverage selection and extraction process
Appendix E. z/OS Debugger Code Coverage 503

An example of using EQAXCCX2 in batch can be found inhlq.SEQASAMP(EQACCEXT).
Code coverage reporting processThe following figure shows the process for creating a XML report of the codecoverage results. The report can be created by using batch facilities or by usingIBM z/OS Debugger Utilities Option E.5 suboption 1. The input to the reportutility is the Selection file that is created by the user in the Step 2. Code Coverageselection and extraction process, the resulting data set from that process, and theCode Coverage extracted observations data set.
The code coverage XML report process is as follows:1. The code coverage Report Utility uses the code coverage extracted observations
that are created after you apply the selection criteria to create the code coveragereport.
2. The code coverage Report Utility also uses the Selection file that is created byusing DTU Option E.3 or coded manually by following the Selection file XMLDTD syntax to include only the selection criteria as part of the report.
3. You can start the code coverage Report Utility from DTU Option E.5 suboption1. When you select this option, you can provide the name of the Selection file,the extracted Observation file, and the file where the XML report is stored.
4. The code coverage Report Utility can be run in batch as well by running theEQAXCCR2 REXX exec with the XML parameter. You must specify thefollowing DDNAMES:
EQACRINPCode coverage extracted observations that are based on selectioncriteria.
EQACRSELCode coverage Selection file.
EQACROUTXML report output.
An example of using EQAXCCR2 in batch to generate a XML report can be foundin hlq.SEQASAMP(EQACCXRP).
Figure 5. Step 3 Code coverage report process
504 IBM z/OS Debugger V14.1.9 User's Guide

In addition to the XML report, you can also generate a Presentation report. This isgenerated by selecting DTU Option E.5 sub-option 2 or 3. In batch specify thePFMT parameter. An example of using EQAXCCR2 in batch to generate aPresentation report can be found in hlq.SEQASAMP(EQACCPRP).
Code coverage ViewerThe following figure shows the input to code coverage Viewer. The Viewerdisplays the results of a z/OS Debugger Code Coverage session. It takes as inputeither the code coverage Observation files first created by z/OS Debugger or thecode coverage extracted Observation file, that is the one created after you applythe selection criteria in Step 2. Code coverage selection and extraction process. With theViewer, you can display all the entries in either data set. You can sort the entriesand view an annotated listing that is associated with an entry.
v The Viewer is part of IBM z/OS Debugger Utilities. It is Option E.1 and allowsthe user to analyze the code coverage observations interactively.
v The Viewer processes either the Observation file created by z/OS Debugger (1 inthe figure) or the code coverage extracted Observation file created by the codecoverage Extraction Utility (2 in the figure).
v When you first select Option E.1, you are prompted to provide the name of thefile that you want the Viewer to use.
v The Viewer provides the following functionality:– Sorting entries.– Viewing an annotated listing associated with an entry. When you are viewing
an annotated listing, no selection criteria is applied. Every line of the listing isincluded and marked as executed or unexecuted as specified in theobservation.
Figure 6. Step 4 The Viewer
Appendix E. z/OS Debugger Code Coverage 505

Code coverage by using z/OS Debugger
Setup
Preparing your programOne of the benefits of using this approach to create code coverage observations isthat you can use the same load modules that you prepare for debugging yourapplication with z/OS Debugger. Programs written in COBOL, PL/I and C andcompiled with certain compiler options are supported.
Code Coverage is supported for Enterprise COBOL for z/OS and OS/390 Version3 and Enterprise COBOL for z/OS Version 4, 5, and above. The following compileroptions are required to ensure that the SYSDEBUG side file or program objectcontains the program source:v Enterprise COBOL for z/OS and OS/390 Version 3 - TEST(SEPARATE) with
NONE recommended but not required.v Enterprise COBOL for z/OS Version 4 - TEST(SEPARATE) with NOHOOK
recommended but not required.v Enterprise COBOL for z/OS Version 5 and 6.1 - TEST(SOURCE), Version 6.2 and
above - TEST(NOSEPARATE,SOURCE).
Code Coverage is supported for Enterprise PL/I for z/OS Version 4.2 and above in31-bit mode. The following compiler options are required to ensure that theSYSDEBUG side file contains the complete expanded program source andstatement table:v TEST(SEPARATE) - the ALL and NOHOOK sub-options are also recommended
but not required.v GONUMBER(SEPARATE) - required to produce the statement table in the
SYSDEBUG side file.v MACRO or PP(MACRO) - required if there are %INCLUDE statements in the
source. Using the MACRO suboption CASE(ASIS) will leave the case of thesource unchanged.
v LISTVIEW(AFTERALL) - required if include files, EXEC CICS commands, orSQL code are in the source.
Code Coverage is supported for IBM z/OS XL C. The following compiler optionsand program preparation are required:v You must run the following 2-stage compile process.
The first stage preprocesses the program, so the IBM z/OS Debugger has accessto fully expanded source. The second stage compiles the program.
v The first compile stage specifies compiler options PP(COMMENTS,NOLINES) toexpand INCLUDEs and macros. The output is SYSUT10 DD. SYSUT10 DD is theexpanded source file and is the input for the second compiler stage. Modify theSYSUT10 DD to enable z/OS Debugger, by saving it in a expanded sourcelibrary and specify a member name that is equal to the primary entry pointname or CSECT name of your application program.
v For the second compiler stage, use the DEBUG(FORMAT(DWARF)) option toplace the debug data in a separate file in one of these ways:UseDEBUG(FORMAT(DWARF),HOOK(LINE,NOBLOCK,PATH),SYMBOL,FILE(location)),or for better performance, useDEBUG(FORMAT(DWARF),NOHOOK,SYMBOL,FILE(location)).
506 IBM z/OS Debugger V14.1.9 User's Guide

v You cannot use an .mdbg file.v You cannot use DEBUG(FORMAT(ISD)) or TEST.v You cannot perform source extraction of a source stored on an HFS or zFS file.
For a full description of the compilers and the options, see Part 2, “Preparing yourprogram for debugging,” on page 21.
EQAOPTS commandsEQAOPTS commands are used to provide data set names for the XML output anda list of program names that require code coverage.
CCOUTPUTDSNSpecifies the file name of an MVS sequential data set. The file containscode coverage output in XML format.
A write-only data set is created if required, opened for appending at z/OSDebugger termination, written with code coverage data collected, and thenclosed and freed.
CCOUTPUTDSNALLOCSpecifies the allocation parameters in BPXWDYN format if a newCCOUTPUTDSN data set is to be created.
CCPROGSELECTDSNSpecifies the file name of an MVS sequential data set. The data set containsa list of compile unit names and is normally created and edited with DTUoption E.2. Code coverage data is collected when these compile units arerun. The program name in the list can contain a wildcard; for example,PRG1* specifies that code coverage data is collected for all programs whosenames begin with PRG1.
The data set is read-only and opened at the start of z/OS Debugger. Afterthe program list is read, the file is closed and freed.
Example:EQAXOPT CCOUTPUTDSN,’&&USERID.DBGTOOL.CCOUTPUT’EQAXOPT CCOUTPUTDSNALLOC,’MGMTCLAS(STANDARD) +
STORCLAS(DEFAULT) LRECL(255) BLKSIZE(0) RECFM(V,B) +DSORG(PS) SPACE(2,2) CYL’
EQAXOPT CCPROGSELECTDSN,’&&USERID.DBGTOOL.CCPRGSEL’
Notes:
v You can find this example in hlq.SEQASAMP(EQACCOPT).v EQAOPTS commands must be contained in fixed-length, eighty-byte records.v The continuation character "+" is in column 72.
For more information about EQAOPTS commands, see the chapter aboutEQAOPTS commands in IBM z/OS Debugger Reference and Messages.
EQA_STARTUP_KEYThe EQA_STARTUP_KEY is an environment variable. The format for specifyingthis environment variable is as follows: ENVAR("EQA_STARTUP_KEY=ACTION").
The values for the ACTION parameter are as follows:
CC An unattended z/OS Debugger Code Coverage session is requested. In thiscase, an interactive debug session is not launched.
DCC A combined z/OS Debugger session and Code Coverage session is
Appendix E. z/OS Debugger Code Coverage 507

requested. This allows the developer to have a debug session andconcurrently create code coverage data. If you use this option and changethe program logic path by using the GOTO and JUMPTO commands, theobservation is flagged indicating that the debug override is ON.
z/OS Debugger uses the EQA_STARTUP_KEY environment variable and TESTruntime options to determine whether to activate an interactive debug session andcode coverage session or not. The following table shows different combinations ofthe environment variable and TEST runtime options, and the resultant sessionactivation.
Note: There are two different code coverage sessions: z/OS Debugger codecoverage session and IBM Developer for z Systems code coverage session. z/OSDebugger handles the z/OS Debugger code coverage session. IBM Developer for zSystems handles the IBM Developer for z Systems code coverage session. The codecoverage data format and presentation are different in the two sessions.
EQA_STARTUP_KEYz/OS Debuggersession device
z/OS Debuggerinteractivedebug session
z/OS Debuggercode coveragesession
IBM Developerfor z Systemscode coveragesession
CC MFI (no 3270terminalavailable)
No Yes No
CC TCPIP/DBMDT No No Yes
DCC MFI/VTAM(target 3270terminalprovided)
Yes Yes No
DCC TCPIP/DBMDT Yes Yes No
Examples:v ’/TEST(ALL,*,PROMPT,MFI:*),ENVAR("EQA_STARTUP_KEY=CC")’
– Using DT MFI, and specifying CC.– Code Coverage observations are collected.
v ’/TEST(ALL,*,PROMPT,VTAM%userid:*),ENVAR("EQA_STARTUP_KEY=DCC")’
– Using z/OS Debugger MFI with the Terminal Interface Manager, andspecifying DCC.
– An interactive debug session is started and Code Coverage observations arecollected while it is running.
v ’/TEST(ALL,*,PROMPT,TCPIP&nn.nn.nn.nn%8001:*),ENVAR("EQA_STARTUP_KEY=DCC")’
– Using z/OS Debugger TCPIP with IBM Developer for z Systems, andspecifying DCC.
– An interactive debug session is started, and Code Coverage observations arecollected while the debug session is running.
Code coverage Options data setThe code coverage Options file contains information that is provided as input tothe z/OS Debugger Code Coverage engine. The file contains the following XMLtags. You can manually code the tags or use DTU option E.2 to create them.v <GROUPID1>: Group ID 1
If you want to group observations to form a set based on the characteristics ofthe applications, you can use this tag.
508 IBM z/OS Debugger V14.1.9 User's Guide

v <GROUPID2>: Group ID 2If you want a subgroup for the observation to form a subset based on thecharacteristics of the application, you can use this tag. During the analysis of theobservations, the user can sort based on the grouping.
v <EXTNAME>: Name of the program (COBOL PROGRAM-ID, PL/I externalprocedure name or C short CU name) that is targeted for code coverage.You can use a wildcard (*) either at the end of the name string, or you can useonly the wildcard if you want all programs in the application to be covered. TheDTU option E.2 panel allows up to 8 names. You can hand code more in theOptions data set if you need.
Here is an example of an Options file in XML rendering. In this example, theOptions file indicates that z/OS Debugger collects code coverage observations forprograms COB01A, COB01B, COBO1C, and COBO1D. z/OS Debugger marks theobservations as part of GROUP ID 1 PAYROLL and GROUP ID 2 TEST02.<GROUPID1>PAYROLL</GROUPID1><GROUPID2>TEST02</GROUPID2><EXTNAME>COB01A</EXTNAME><EXTNAME>COB01B</EXTNAME><EXTNAME>COBO1C</EXTNAME><EXTNAME>COBO1D</EXTNAME>
Generating code coverage extracted observationsDepending on the values that are provided in the Options file, z/OS Debuggergathers observations for all statements in the programs in the Options data set. Thenumber of observations can be large, and depends on the number of programs andthe statements in the programs.
To facilitate the evaluation of the observations, z/OS Debugger Code Coverageprovides a mechanism to define a subset of the observations in the final report.This is done by providing a selection mechanism that allows you to only includein the report the extracted observations for those programs that you are interestedin.
You can specify how z/OS Debugger selects such programs by providing aSelection file. You can create the Selection file by using IBM z/OS DebuggerUtilities Option E.3 or by manually coding the file by following the Selection fileXML DTD syntax.
Code Coverage selection data setYou use the selection data set to specify the criteria that is used in the evaluationof the code coverage observations to create a extracted observations data set and aset of statistics based on the selection provided. For example, you might want tosee only the results for a specific group, or a specific program even if the Optionsdata set indicated more than one program. This allows the user to define thegranularity of the information.
There are two different types of selection criteria attributes. The first group selectsthe entries that are to be extracted from the observation data set that is created byz/OS Debugger. The other group operates from within the subset that is createdafter applying the first group of attributes. The second set of attributes is designedfor further selection of the statements to be considered in the final statistical resultsbased on the contents of the program source.
Appendix E. z/OS Debugger Code Coverage 509
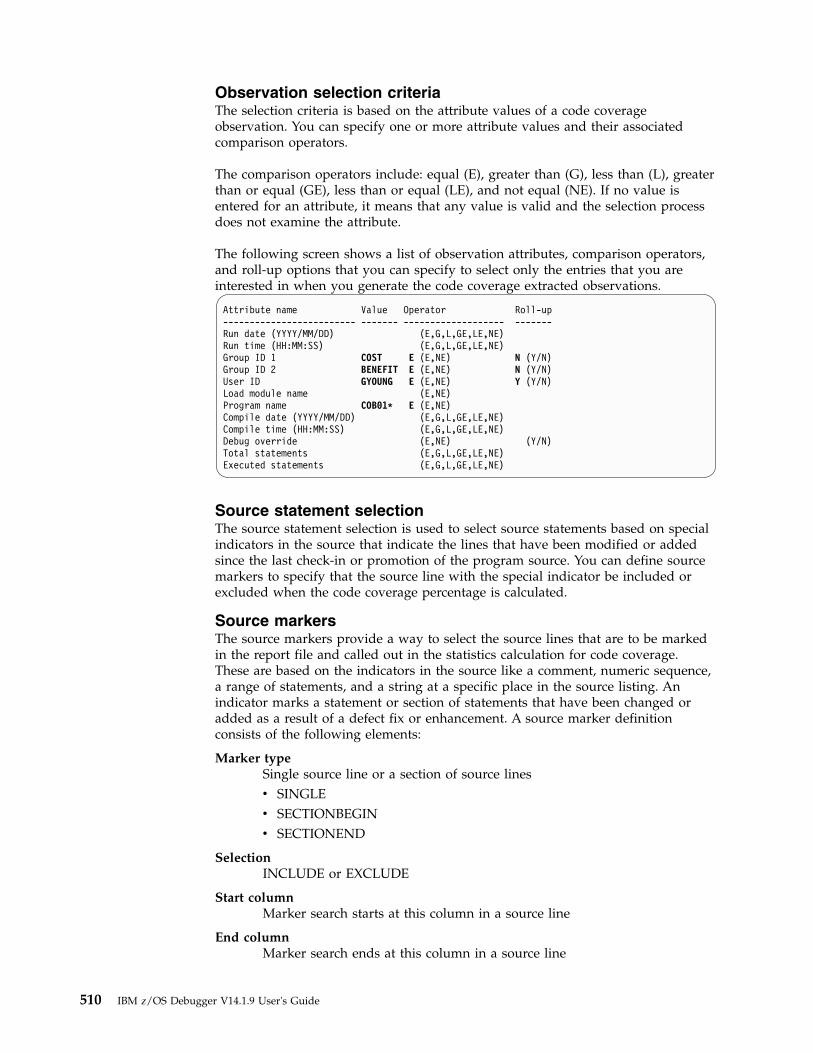
Observation selection criteriaThe selection criteria is based on the attribute values of a code coverageobservation. You can specify one or more attribute values and their associatedcomparison operators.
The comparison operators include: equal (E), greater than (G), less than (L), greaterthan or equal (GE), less than or equal (LE), and not equal (NE). If no value isentered for an attribute, it means that any value is valid and the selection processdoes not examine the attribute.
The following screen shows a list of observation attributes, comparison operators,and roll-up options that you can specify to select only the entries that you areinterested in when you generate the code coverage extracted observations.
Attribute name Value Operator Roll-up------------------------- ------- ------------------- -------Run date (YYYY/MM/DD) (E,G,L,GE,LE,NE)Run time (HH:MM:SS) (E,G,L,GE,LE,NE)Group ID 1 COST E (E,NE) N (Y/N)Group ID 2 BENEFIT E (E,NE) N (Y/N)User ID GYOUNG E (E,NE) Y (Y/N)Load module name (E,NE)Program name COB01* E (E,NE)Compile date (YYYY/MM/DD) (E,G,L,GE,LE,NE)Compile time (HH:MM:SS) (E,G,L,GE,LE,NE)Debug override (E,NE) (Y/N)Total statements (E,G,L,GE,LE,NE)Executed statements (E,G,L,GE,LE,NE)
Source statement selectionThe source statement selection is used to select source statements based on specialindicators in the source that indicate the lines that have been modified or addedsince the last check-in or promotion of the program source. You can define sourcemarkers to specify that the source line with the special indicator be included orexcluded when the code coverage percentage is calculated.
Source markersThe source markers provide a way to select the source lines that are to be markedin the report file and called out in the statistics calculation for code coverage.These are based on the indicators in the source like a comment, numeric sequence,a range of statements, and a string at a specific place in the source listing. Anindicator marks a statement or section of statements that have been changed oradded as a result of a defect fix or enhancement. A source marker definitionconsists of the following elements:
Marker typeSingle source line or a section of source linesv SINGLEv SECTIONBEGINv SECTIONEND
SelectionINCLUDE or EXCLUDE
Start columnMarker search starts at this column in a source line
End columnMarker search ends at this column in a source line
510 IBM z/OS Debugger V14.1.9 User's Guide

IndicatorCharacter (xxxx) or hex (X'nnnn')
Note:
v Multiple markers can be defined.v Section source markers must come in pairs, such as SECTIONBEGIN and
SECTIONEND.
The following table shows a sample of source markers:
Table 23. A sample of source markers
Marker type Selection Start column End column Indicator
SINGLE INCLUDE 73 80 PMR12345
SINGLE EXCLUDE 7 72 MOVE
SECTIONBEGIN INCLUDE 7 80 DEFECT123BEGIN
SECTIONEND INCLUDE 7 80 DEFECT123END
The first entry in the table indicates to mark as included in the report file and callout in the statistics calculation only statements that have the string PMR12345 incolumns 73 - 80.
The second entry in the table indicates to mark as excluded in the report file andcall out in the statistics calculation only statements that have the string MOVE incolumns 7 - 72.
The third and fourth entries in the table indicate to mark as included only thestatements beginning with the first statement that has the string DEFECT123BEGINbetween columns 7 - 80 until the statement that has the string DEFECT123ENDbetween columns 7 - 80.
The following example corresponds to the values in the above table.<SOURCEMARKER><MARKERTYPE>SINGLE</MARKERTYPE><SELECTION>INCLUDE</SELECTION><STARTCOLUMN>73</STARTCOLUMN><ENDCOLUMN>80</ENDCOLUMN><MARKERVALUE>C’PMR12345’</MARKERVALUE></SOURCEMARKER><SOURCEMARKER><MARKERTYPE>SINGLE</MARKERTYPE><SELECTION>EXCLUDE</SELECTION><STARTCOLUMN>7</STARTCOLUMN><ENDCOLUMN>72</ENDCOLUMN><MARKERVALUE>C’MOVE’</MARKERVALUE></SOURCEMARKER><SOURCEMARKER><MARKERTYPE>SECTIONBEGIN</MARKERTYPE><SELECTION>INCLUDE</SELECTION><STARTCOLUMN>7</STARTCOLUMN><ENDCOLUMN>80</ENDCOLUMN><MARKERVALUE>DEFECT123BEGIN</MARKERVALUE></SOURCEMARKER><SOURCEMARKER><MARKERTYPE>SECTIONEND</MARKERTYPE><SELECTION>INCLUDE</SELECTION>
Appendix E. z/OS Debugger Code Coverage 511

<STARTCOLUMN>7</STARTCOLUMN><ENDCOLUMN>80</ENDCOLUMN><MARKERVALUE>DEFECT123END</MARKERVALUE></SOURCEMARKER>
Based on the Selection options in the example above, the report marks the sectionsof the source that matches the specified selection.
Source marker use case example----+----1----+----2----+----3----+----4----+----5----+----6----+----7-|--+----800001 * ACCESS BY LOW LEVEL QUALIFIERS00002 MOVE ’KY’ TO STATE PMR1234500003 MOVE ’LEX’ TO CITY00004 MOVE ’VM ’ TO OP-SYS00005 PROGA.00006 PERFORM LOOP1 UNTIL TAPARM1 = 0 PMR1234500007 * DEFECT123BEGIN00008 IF TAPARM2 = 0 THEN00009 PERFORM PROCA.00010 * DEFECT123END
Based on the sample source markers above, the report shows the lines as follows:v Line 2 is both included and excludedv Lines 3 and 4 are excludedv Lines 6, 8, and 9 are included
The Selection file can be created by using IBM z/OS Debugger Utilities Option E.3,or you can code the file manually by following the Selection file XML DTD syntax.
IBM z/OS Debugger Utilities Option EThe z/OS Debugger Code Coverage option in IBM z/OS Debugger Utilitiesprovides facilities to complete the following tasks:v View the observations and sort themv Create and modify the Options file and the Selection filev Extract observations after you apply Selection filev Report creation
It includes five suboptions to perform such tasks.v Use Code Coverage observation viewer to sort and view code coverage
observations.v Use Code Coverage Options file to create/modify the Options file.v Use Code Coverage observation Selection file to create/modify the Selection file.v Use Code Coverage observation selection to extract code coverage observations
based on selection criteria.v Use Code coverage report generation to create reports.
The following screen shows IBM z/OS Debugger Utilities Option E suboptions.
512 IBM z/OS Debugger V14.1.9 User's Guide
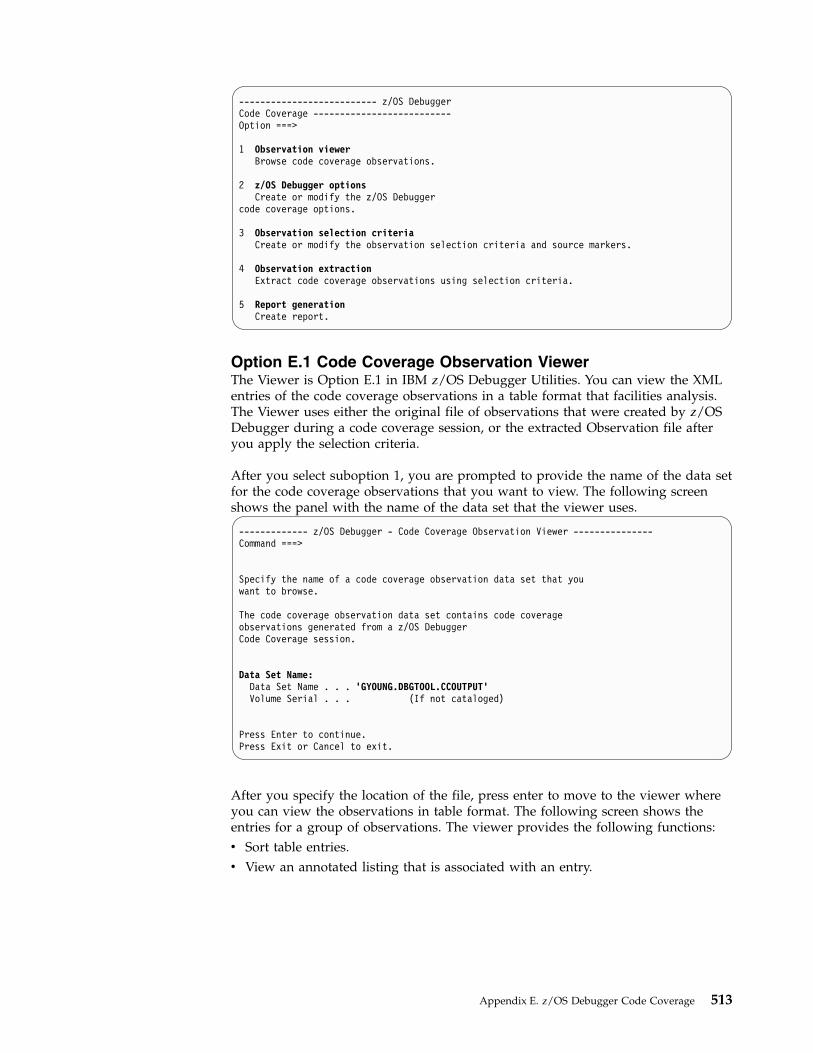
-------------------------- z/OS DebuggerCode Coverage --------------------------Option ===>
1 Observation viewerBrowse code coverage observations.
2 z/OS Debugger optionsCreate or modify the z/OS Debugger
code coverage options.
3 Observation selection criteriaCreate or modify the observation selection criteria and source markers.
4 Observation extractionExtract code coverage observations using selection criteria.
5 Report generationCreate report.
Option E.1 Code Coverage Observation ViewerThe Viewer is Option E.1 in IBM z/OS Debugger Utilities. You can view the XMLentries of the code coverage observations in a table format that facilities analysis.The Viewer uses either the original file of observations that were created by z/OSDebugger during a code coverage session, or the extracted Observation file afteryou apply the selection criteria.
After you select suboption 1, you are prompted to provide the name of the data setfor the code coverage observations that you want to view. The following screenshows the panel with the name of the data set that the viewer uses.
------------- z/OS Debugger - Code Coverage Observation Viewer ---------------Command ===>
Specify the name of a code coverage observation data set that youwant to browse.
The code coverage observation data set contains code coverageobservations generated from a z/OS DebuggerCode Coverage session.
Data Set Name:Data Set Name . . . ’GYOUNG.DBGTOOL.CCOUTPUT’Volume Serial . . . (If not cataloged)
Press Enter to continue.Press Exit or Cancel to exit.
After you specify the location of the file, press enter to move to the viewer whereyou can view the observations in table format. The following screen shows theentries for a group of observations. The viewer provides the following functions:v Sort table entries.v View an annotated listing that is associated with an entry.
Appendix E. z/OS Debugger Code Coverage 513
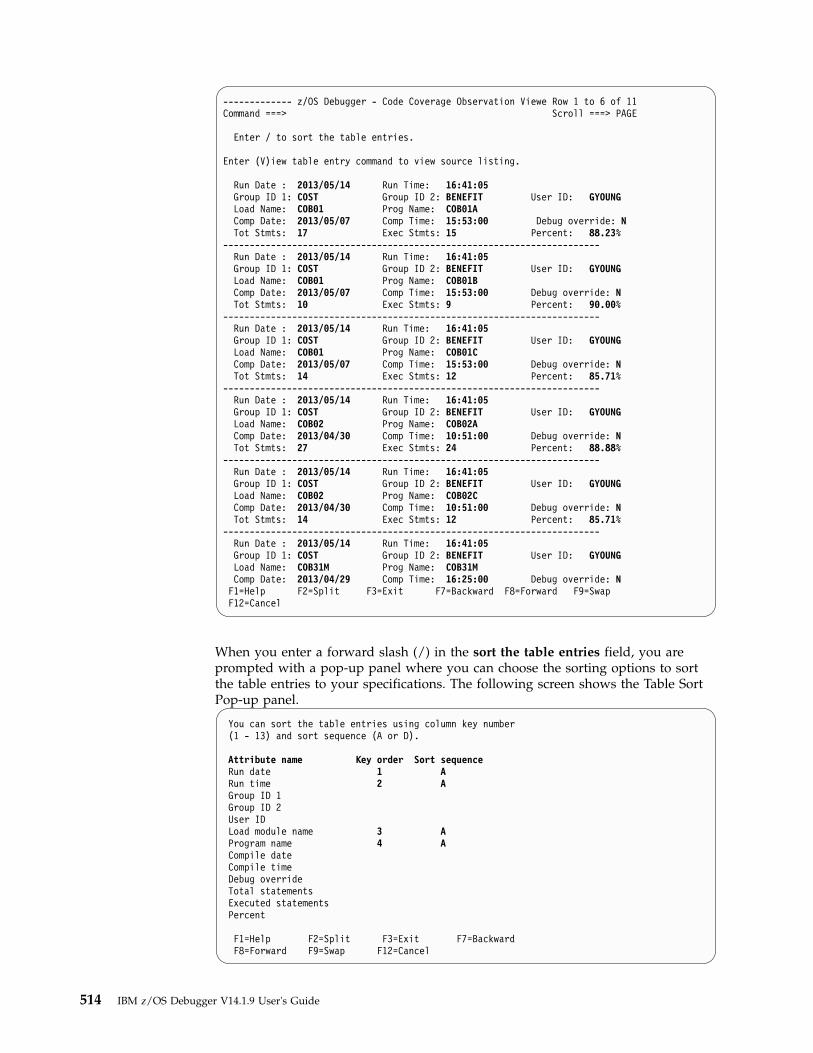
------------- z/OS Debugger - Code Coverage Observation Viewe Row 1 to 6 of 11Command ===> Scroll ===> PAGE
Enter / to sort the table entries.
Enter (V)iew table entry command to view source listing.
Run Date : 2013/05/14 Run Time: 16:41:05Group ID 1: COST Group ID 2: BENEFIT User ID: GYOUNGLoad Name: COB01 Prog Name: COB01AComp Date: 2013/05/07 Comp Time: 15:53:00 Debug override: NTot Stmts: 17 Exec Stmts: 15 Percent: 88.23%
-----------------------------------------------------------------------Run Date : 2013/05/14 Run Time: 16:41:05Group ID 1: COST Group ID 2: BENEFIT User ID: GYOUNGLoad Name: COB01 Prog Name: COB01BComp Date: 2013/05/07 Comp Time: 15:53:00 Debug override: NTot Stmts: 10 Exec Stmts: 9 Percent: 90.00%
-----------------------------------------------------------------------Run Date : 2013/05/14 Run Time: 16:41:05Group ID 1: COST Group ID 2: BENEFIT User ID: GYOUNGLoad Name: COB01 Prog Name: COB01CComp Date: 2013/05/07 Comp Time: 15:53:00 Debug override: NTot Stmts: 14 Exec Stmts: 12 Percent: 85.71%
-----------------------------------------------------------------------Run Date : 2013/05/14 Run Time: 16:41:05Group ID 1: COST Group ID 2: BENEFIT User ID: GYOUNGLoad Name: COB02 Prog Name: COB02AComp Date: 2013/04/30 Comp Time: 10:51:00 Debug override: NTot Stmts: 27 Exec Stmts: 24 Percent: 88.88%
-----------------------------------------------------------------------Run Date : 2013/05/14 Run Time: 16:41:05Group ID 1: COST Group ID 2: BENEFIT User ID: GYOUNGLoad Name: COB02 Prog Name: COB02CComp Date: 2013/04/30 Comp Time: 10:51:00 Debug override: NTot Stmts: 14 Exec Stmts: 12 Percent: 85.71%
-----------------------------------------------------------------------Run Date : 2013/05/14 Run Time: 16:41:05Group ID 1: COST Group ID 2: BENEFIT User ID: GYOUNGLoad Name: COB31M Prog Name: COB31MComp Date: 2013/04/29 Comp Time: 16:25:00 Debug override: NF1=Help F2=Split F3=Exit F7=Backward F8=Forward F9=SwapF12=Cancel
When you enter a forward slash (/) in the sort the table entries field, you areprompted with a pop-up panel where you can choose the sorting options to sortthe table entries to your specifications. The following screen shows the Table SortPop-up panel.
You can sort the table entries using column key number(1 - 13) and sort sequence (A or D).
Attribute name Key order Sort sequenceRun date 1 ARun time 2 AGroup ID 1Group ID 2User IDLoad module name 3 AProgram name 4 ACompile dateCompile timeDebug overrideTotal statementsExecuted statementsPercent
F1=Help F2=Split F3=Exit F7=BackwardF8=Forward F9=Swap F12=Cancel
514 IBM z/OS Debugger V14.1.9 User's Guide

You can view the annotated source listing for a program when it is available byentering V next to an entry. The source for the program associated with the entryis displayed. The source is annotated to show the code coverage. See “Annotatedlisting format” on page 520.
Option E.2 Code Coverage Options fileIn this option, you can create the Options file that is used as an input to z/OSDebugger at the start of a code coverage session. In this file, you can specify theprograms that you are interested in when the code coverage observations arecollected. The information that you provide is then converted to XML format. Asmentioned before, you can create this file yourself by hand coding the optionsfollowing the Options file XML DTD syntax (See “XML Tags used in the Optionsfile” on page 531).
After you choose Option E.2, you are prompted to provide the location of the filethat will be used to save the Options. If the file has not been previously created, itwill be created for you. In the following screen, you can see this panel.
--------------------- z/OS Debugger - Code Coverage Options ---------------------Command ===>
Specify the name of a code coverage options data set name that youwant to create or edit.
The data set contains a list of program names and group IDs that areused when collecting code coverage observations.
Data Set Name:Data Set Name . . . ’GYOUNG.DBGTOOL.CCPRGSEL’Volume Serial . . . (If not cataloged)
Press Enter to edit the data set.Press Exit or Cancel to exit.
After the Options file is created, you can proceed to the Options panel. You canspecify the programs that you want code coverage observations for and the groupor subgroup to use to group such results. The panel is tailored after other z/OSDebugger panels that are used for creating debug profiles. The following screenshows the Options panel. You have two sections in this panel:v Program selection.
– In this section, you can specify up to 8 programs or you can use an asterisk(*) instead of a program name or you can end the name of a program with anasterisk (*) to create a template for a group of programs with the same prefixin the name.
v Group selection.– You can use Group ID 1 and Group ID 2 for grouping results.– If you want to provide a group during the observation selection, you should
specify a group. If the group is in the Viewer, you can sort the entries in theViewer by the group.
– You can use a wildcard (*) or leave it blank if you do not want to use agroup.
Appendix E. z/OS Debugger Code Coverage 515

------------------- z/OS Debugger - Edit Code Coverage Options ------------------Command ===>
Program name list for code coverage. (* is a valid wild card character,by itself, or as the last character of a name)
Name 1: COB01* Name 2: COB02* Name 3: IGYTCARA Name 4:Name 5: Name 6: Name 7: Name 8:
Group ID is a container ID that allows you to catalog code coverageobservations.
Group ID 1: COSTGroup ID 2: BENEFIT
After you exit this panel, the Options file is written with your options using theOptions file XML DTD syntax (See “XML Tags used in the Options file” on page531). As mentioned before, you can skip the use of Option E.2 and hand code thecontents of the file.
Option E.3 Code Coverage observation Selection fileIn this option, you can specify the selection criteria that you want to use to extractonly the observations that you are interested in. When you first select this option,you provide the name of the data set that contains the Selection file. The followingscreen shows this panel.
---------- z/OS Debugger - Code Coverage Observation Selection Criteria ---------Command ===>
Specify the name of a code coverage observation selection criteriadata set that you want to create or edit.
The data set contains selection criteria and source markers used to selectcode coverage observations and percentage calculations.
Data Set Name:Data Set Name . . . ’GYOUNG.DBGTOOL.CCOBSSEL’Volume Serial . . . (If not cataloged)
Press Enter to edit the data set.Press Exit or Cancel to exit.
F1=Help F2=Split F3=Exit F7=Backward F8=Forward F9=SwapF12=Cancel
After you provide the name of the data set, press Enter to create or modify yourSelection file. The following screen shows the selection attributes panel.
516 IBM z/OS Debugger V14.1.9 User's Guide

------------- z/OS Debugger - Edit Code Coverage Selection Criteria -------------Command ===>
Specify code coverage observation selection criteria
Enter attribute value and comparison operator. Comparison operatorsare (E)qual, (G)reater, (L)ess, (GE) greater than or equal,(LE) less than or equal, and (NE) not equal.
Attribute name Value Operator RollupRun date (YYYY/MM/DD) (E,G,L,GE,LE,NE)Run time (HH:MM:SS) (E,G,L,GE,LE,NE)Group ID 1 COST E (E,NE) N (Y/N)Group ID 2 BENEFIT E (E,NE) N (Y/N)User ID GYOUNG E (E,NE) Y (Y/N)Load module name (E,NE)Program name COB01* E (E,NE)Compile date (YYYY/MM/DD) (E,G,L,GE,LE,NE)Compile time (HH:MM:SS) (E,G,L,GE,LE,NE)Debug override (E,NE) (Y/N)Total statements (E,G,L,GE,LE,NE)Executed statements (E,G,L,GE,LE,NE)
Specify source markers for code coverage percentage analysis
Marker type: SINGLE/SECTIONBEGIN/SECTIONENDSelection: INCLUDE/EXCLUDE
Marker type Selection Column Column StringStart End
SINGLE INCLUDE 73 75 PMRSINGLE EXCLUDE 73 80 PMR11114SECTIONBEGIN INCLUDE 7 80 DEFECT123BEGINSECTIONEND INCLUDE 7 80 DEFECT123END
F1=Help F2=Split F3=Exit F7=Backward F8=Forward F9=SwapF12=Cancel
The marker section allows only five markers to be specified. If you need more thanfive, you need to add the additional entries by hand using the Selection file XMLDTD syntax (See “XML tags used in the Selection file” on page 532).
Most of the field above are self-explanatory or have been described before in thisdocument. The following section describes the operators and the meaning of theRoll-Up fields.
Operators
E = Equal
G = Greater than
L = Less than
GE = Greater or Equal
LE = Less or Equal
NE = Not Equal
Roll-up
Appendix E. z/OS Debugger Code Coverage 517

The roll-up is a merge process. The selected observations are grouped intosubgroups with all observations that have the same load module name, programname, compile date and compile time. The roll-up is then performed within eachsubgroup and is based on four other attributes of the observations. Each of thefour attributes has a 'roll-up' option with value Yes or No. If Yes, it means that theobservations are qualified for merge when the attributes are the same or different.If No, it means that observations with different values of the attribute cannot bemerged. However, if they have the same value, they are qualified. The test isperformed on each of the four attributes. All tests must be positive before themerge takes place. The attributes of a observation that has the roll-up option areGroupID1, GroupID2, User ID, and DBGOV (Debug override). The merge ofqualified observations is to combine the executed statement lists together forgenerating the code coverage extracted observations. In the resultant observationafter the merge process, the attributes that have the roll-up option = 'Y' show avalue of '*' except the DBGOV attribute. This attribute shows a value of 'Y' if atleast one of the merged observations has the DBGOV attribute = 'Y'. It shows avalue of 'N' when all the merged observations have the DBGOV attribute = 'N'.
The qualified observations might come from different test cases; the executedstatement lists might overlap; and, by combining together, the code coveragepercentage might be improved.
Roll-up use case example
You can define the roll-up option of the four attributes as follows:Attribute Rollup option---------- -------------GroupID1 YGroupID2 YUserID YDbgOv Y
Here are two selected observations based on the selection criteria:# GrpID GrpID User Lmod CSECT Comp Comp DO tot exec %
ID1 ID2 ID Name Date Time stmt stmt- ----- ----- ---- ---- ----- ---------- -------- -- ---- ---- ----1 Pay1 Test1 ELIN LMD1 PRG1 2013/04/08 10:10:20 Y 100 80 80%2 Pay1 Test2 ELIN LMD1 PRG1 2013/04/08 10:10:20 N 100 50 50%
The roll-up process merges #1 and #2 together even when the values of GroupID2and DbgOv are different because the roll-up option of the two attributes is Yes.
After the two observations are merged, the code coverage percentage becomes 90%because the executed statements in #1 and #2 overlap.
Option E.4 Code Coverage observation extractionWith this option, you can create a file that contains the results from applying theselection file to the file that contains all observations created by a z/OS DebuggerCode Coverage session. When you select this panel in the following screen, youare prompted to provide the following files:v Input
– The location of the file with the code coverage observations– The location of the file with the selection criteria
v Output– The location of the file that contains the extracted code coverage observation
output
518 IBM z/OS Debugger V14.1.9 User's Guide

--------------- z/OS Debugger - Code Coverage Observation Selecton --------------Command ===>
The observation selection function extracts observations that meet theselection criteria from the observation data set. It writes the resultto the observation output data set.
Specify the name of a code coverage observation data set.
Data Set Name . . . ’GYOUNG.DBGTOOL.CCOUTPUT’
Specify the name of a code coverage selection criteria data set.
Data Set Name . . . ’GYOUNG.DBGTOOL.CCOBSSEL’
Specify the name of a code coverage observation output data set.
Data Set Name . . . ’GYOUNG.DBGTOOL.CCOUTPUT.SELECTED’
Press Enter to continue.Press Exit or Cancel to exit.
F1=Help F2=Split F3=Exit F7=Backward F8=Forward F9=SwapF12=Cancel
After you press Enter, you will get a confirmation message on the upper rightcorner, 'Observation extract OK'. If there is an error during the process, an errormessage is displayed. By pressing F1, a long message appears at the bottom of thepanel.
--------------- z/OS Debugger - Code Coverage Observatio Extract observations OKCommand ===>
The observation selection function extracts observations that meet theselection criteria from the observation data set. It writes the resultto the observation output data set.
Specify the name of a code coverage observation data set.
Data Set Name . . . ’GYOUNG.DBGTOOL.CCOUTPUT’
Specify the name of a code coverage selection criteria data set.
Data Set Name . . . ’GYOUNG.DBGTOOL.CCOBSSEL’
Specify the name of a code coverage observation output data set.
Data Set Name . . . ’GYOUNG.DBGTOOL.CCOUTPUT.SELECTED’
Press Enter to continue.Press Exit or Cancel to exit.
F1=Help F2=Split F3=Exit F7=Backward F8=Forward F9=SwapF12=Cancel
Option E.5 Code Coverage report generationWhen you select this option, a panel is displayed with three choices for the type ofreport that you want to create:v Create report in XML format.v Create report in Presentation format.
Appendix E. z/OS Debugger Code Coverage 519
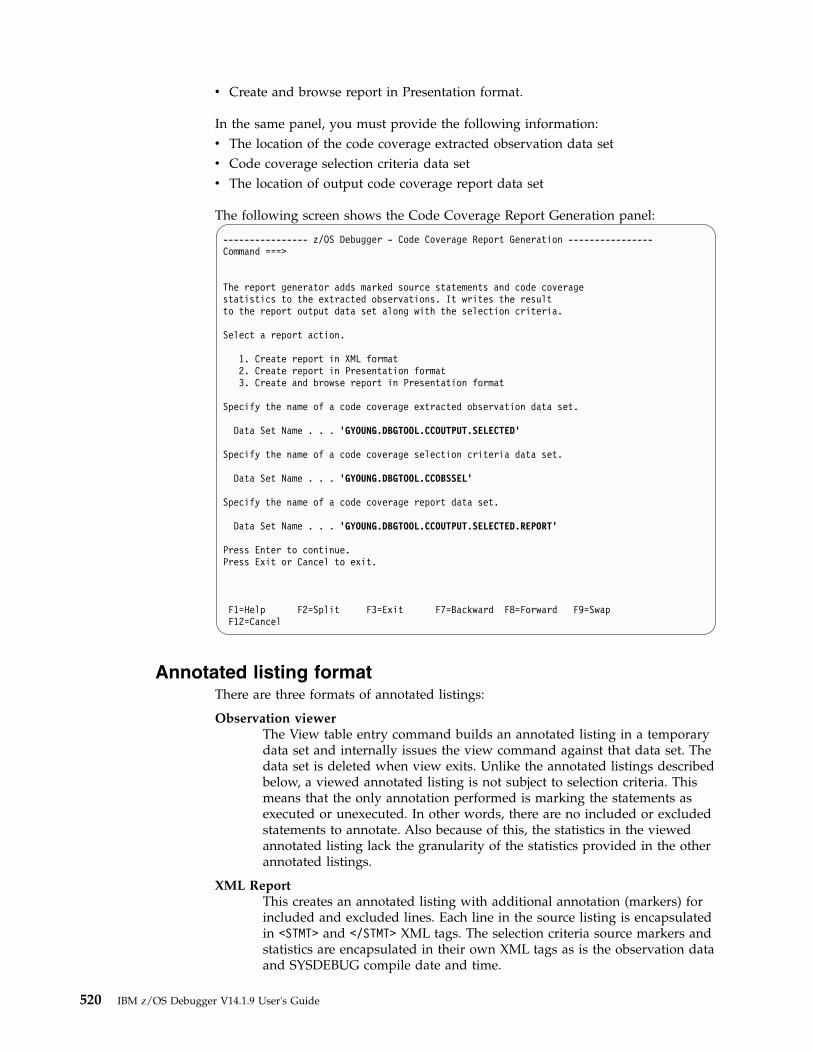
v Create and browse report in Presentation format.
In the same panel, you must provide the following information:v The location of the code coverage extracted observation data setv Code coverage selection criteria data setv The location of output code coverage report data set
The following screen shows the Code Coverage Report Generation panel:
---------------- z/OS Debugger - Code Coverage Report Generation ----------------Command ===>
The report generator adds marked source statements and code coveragestatistics to the extracted observations. It writes the resultto the report output data set along with the selection criteria.
Select a report action.
1. Create report in XML format2. Create report in Presentation format3. Create and browse report in Presentation format
Specify the name of a code coverage extracted observation data set.
Data Set Name . . . ’GYOUNG.DBGTOOL.CCOUTPUT.SELECTED’
Specify the name of a code coverage selection criteria data set.
Data Set Name . . . ’GYOUNG.DBGTOOL.CCOBSSEL’
Specify the name of a code coverage report data set.
Data Set Name . . . ’GYOUNG.DBGTOOL.CCOUTPUT.SELECTED.REPORT’
Press Enter to continue.Press Exit or Cancel to exit.
F1=Help F2=Split F3=Exit F7=Backward F8=Forward F9=SwapF12=Cancel
Annotated listing formatThere are three formats of annotated listings:
Observation viewerThe View table entry command builds an annotated listing in a temporarydata set and internally issues the view command against that data set. Thedata set is deleted when view exits. Unlike the annotated listings describedbelow, a viewed annotated listing is not subject to selection criteria. Thismeans that the only annotation performed is marking the statements asexecuted or unexecuted. In other words, there are no included or excludedstatements to annotate. Also because of this, the statistics in the viewedannotated listing lack the granularity of the statistics provided in the otherannotated listings.
XML ReportThis creates an annotated listing with additional annotation (markers) forincluded and excluded lines. Each line in the source listing is encapsulatedin <STMT> and </STMT> XML tags. The selection criteria source markers andstatistics are encapsulated in their own XML tags as is the observation dataand SYSDEBUG compile date and time.
520 IBM z/OS Debugger V14.1.9 User's Guide

Presentation ReportThe presentation format annotated listing is more viewer friendly and isnearly identical to an XML format report without the XML tags. Theselection criteria source markers, the statistics, and the observation data areincluded in the tables that follow the annotated listing. The report alsoindicates whether the SYSDEBUG compile date and time does not matchthe compile date and time that is recorded in the observation.
The annotated listing begins with a table of information about the observationsthat is similar to an entry in the Viewer. After that, the source listing is displayedwith annotation showing which executable lines were executed or not executed.XML and presentation reports also contain additional annotation for included andexcluded lines (as indicated by the source markers in the Selection file). The resultis written to the specified output data set. If option 3 was requested, the outputdata set is browsed via ISPF but not deleted upon exit.
Below is a sample of a presentation format annotated listing report for a COBOLprogram. There are 8 header lines including 2 blank ones, the rollup history, anumber of source lines, the selection criteria source markers, and the statistics. Theheader lines indicates the observation for which the report is generated. The rolluphistory indicates the origin of the observation.1Rpt Date : 2013/05/11 Rpt Time: 10:32:45
Run Date : 2013/05/10 Run Time: 09:22:49Group ID 1: COST Group ID 2: BENEFIT User ID: USER1Load Name: COB01 Prog Name: COB01AComp Date: 2013/05/07 Comp Time: 15:53:00 Debug override: NTot Stmts: 17 Exec Stmts: 15 Percent: 88.23%
Rollup History:Observation is not part of rollup.
----+-*A-1-B--+----2----+----3----+----4----+----5----+----6----+----7-|--+----81 * COB01A - COBOL EXAMPLE FOR DTCU23 IDENTIFICATION DIVISION.4 PROGRAM-ID. COB01A.5 ******************************************************************6 * Licensed Materials - Property of IBM *7 * *8 * 5655-M18: Debug Tool for z/OS *9 * 5655-M19: Debug Tool Utilities and Advanced Functions *10 * (C) Copyright IBM Corp. 1997, 2004 All Rights Reserved *11 * *12 * US Government Users Restricted Rights - Use, duplication or *13 * disclosure restricted by GSA ADP Schedule Contract with IBM *14 * Corp. *15 * *16 ******************************************************************171819 ENVIRONMENT DIVISION.2021 DATA DIVISION.2223 WORKING-STORAGE SECTION.24 01 TAPARM1 PIC 99 VALUE 5.25 01 TAPARM2 PIC 99 VALUE 2.26 01 COB01B PIC X(6) VALUE ’COB01B’.27 01 P1PARM1 PIC 99 VALUE 0.2829 01 TASTRUCT.30 05 LOC-ID.31 10 STATE PIC X(2).32 10 CITY PIC X(3).33 05 OP-SYS PIC X(3).3435 PROCEDURE DIVISION.3637 * THE FOLLOWING ALWAYS PERFORMED38
Appendix E. z/OS Debugger Code Coverage 521

39 * Defect456Begin4041 PROG. PMR1111242 * ACCESS BY TOP LEVEL QUALIFIER PMR1111243 I> MOVE ’ILCHIMVS’ TO TASTRUCT PMR111124445 * ACCESS BY MID LEVEL QUALIFIERS PMR1111346 I> MOVE ’ILSPR’ TO LOC-ID PMR1111347 I> MOVE ’AIX’ TO OP-SYS PMR111134849 * ACCESS BY LOW LEVEL QUALIFIERS PMR1111450 B> MOVE ’KY’ TO STATE PMR1111451 B> MOVE ’LEX’ TO CITY PMR1111452 B> MOVE ’VM ’ TO OP-SYS PMR1111453 . PMR111145455 PROGA.56 > PERFORM LOOP1 UNTIL TAPARM1 = 05758 > IF TAPARM2 = 0 THEN59 * PROCA NOT EXECUTED PMR1234560 I< PERFORM PROCA. PMR12345616263 I> PERFORM LOOP2 UNTIL TAPARM2 = 0 PMR1234564 .65 > STOP RUN66 .6768 PROCA.69 * PROCA NOT EXECUTED PMR1234570 I< MOVE 10 TO P1PARM1 PMR1234571 . PMR1234572 LOOP1.73 > IF TAPARM1 > 0 THEN74 > SUBTRACT 1 FROM TAPARM1.75 > CALL ’COB01B’76 .77 LOOP2. PMR1234578 I> IF TAPARM2 > 0 THEN PMR1234579 I> SUBTRACT 1 FROM TAPARM2. PMR123458081 * Defect456End
Start EndMarker type Selection Column Column String------------- --------- ------ ------ ------------------------------SINGLE INCLUDE 73 75 PMRSINGLE EXCLUDE 73 80 PMR11114SECTIONBEGIN INCLUDE 7 80 DEFECT123BEGINSECTIONEND INCLUDE 7 80 DEFECT123END
Statements Executed Percentage---------- -------- ----------
Total 17 15 88.23Included 8 6 75.00Excluded 0 0 0.00Incl/Excl 3 3 100.00
Below is a sample of a presentation format annotated listing report for a PL/Iprogram. The format is similar to other supported languages.1Rpt Date : 2013/09/10 Rpt Time: 11:53:14
Run Date : 2013/09/02 Run Time: 12:31:30Group ID 1: * Group ID 2: BENEFIT User ID: USER1Load Name: PLI01 Prog Name: PLI01AComp Date: 2013/09/02 Comp Time: 12:14:00 Debug override: NTot Stmts: 14 Exec Stmts: 11 Percent: 78.57%
Rollup History:
Group ID 1 Group ID 2 Load Name Prog Name--------------- --------------- --------------- ---------------COST BENEFIT PLI01 PLI01ACOST BENEFIT PLI01 PLI01A
----+----1----+----2----+----3----+----4----+----5----+----6----+----7-|--+----81 PLI01A:PROC OPTIONS(MAIN); /* PL/I DTCU TESTCASE */
522 IBM z/OS Debugger V14.1.9 User's Guide

2 /********************************************************************/3 /* Licensed Materials - Property of IBM */4 /* */5 /* 5655-P14: Debug Tool for z/OS */6 /* 5655-P15: Debug Tool Utilities and Advanced Functions */7 /* (C) Copyright IBM Corp. 1997, 2005 All Rights Reserved */8 /* */9 /* US Government Users Restricted Rights - Use, duplication or */10 /* disclosure restricted by GSA ADP Schedule Contract with IBM Corp.*/11 /* */12 /********************************************************************/1314 DCL EXPARM1 FIXED BIN(31) INIT(5);15 DCL EXPARM2 FIXED BIN(31) INIT(2);16 DCL PARM2 FIXED BIN(31) INIT(2);17 DCL PLI01B EXTERNAL ENTRY; /* */18 > DO WHILE (EXPARM1 > 0); /* THIS DO LOOP EXECUTED 5 TIMES*/19 > EXPARM1 = EXPARM1 -1; /* */20 B> CALL PLI01B(PARM2); /* PLI01B CALLED 5 TIMES */21 > END;22 > IF (EXPARM2 = 0) THEN /* THIS BRANCH ALWAYS TAKEN */23 < CALL PROC2A(EXPARM2); /* PROC2A NEVER CALLED */24 > DO WHILE (EXPARM2 > 0); /* DO LOOP EXECUTED TWICE */25 > EXPARM2 = EXPARM2 - 1;26 > END;27 > RETURN;2829 < PROC2A: PROCEDURE(P1PARM1); /* THIS PROCEDURE NEVER EXECUTED */30 DCL P1PARM1 FIXED BIN(31);31 < P1PARM1 = 10;32 < END PROC2A;33 I> END PLI01A;
Start EndMarker type Selection Column Column String------------- --------- ------ ------ ------------------------------SINGLE INCLUDE 2 80 PLI01SINGLE EXCLUDE 2 80 PLI01B
Statements Executed Percentage---------- -------- ----------
Total 14 11 78.57Included 1 1 100.00Excluded 0 0 0.00Incl/Excl 1 1 100.00
Below is a sample of a presentation format annotated listing report for a Cprogram. The format is similar to the other supported languages.1Rpt Date : 2013/10/31 Rpt Time: 08:07:42
Run Date : 2013/10/16 Run Time: 13:33:07Group ID 1: COST Group ID 2: BENEFIT User ID: GYOUNGLoad Name: C01 Prog Name: C01AComp Date: 2013/05/07 Comp Time: 15:53:00 Debug override: NTot Stmts: 12 Exec Stmts: 8 Percent: 66.66%
Rollup History:
Observation is not part of rollup
*...+....1....+....2....+....3....+....4....+....5....+....6....+....7....+....81 main()2 /********************************************************************/3 /* Licensed Materials - Property of IBM */4 /* */5 /* 5655-W70: Debug Tool for z/OS */6 /* Copyright IBM Corp. 1997, 2012 All Rights Reserved */7 /* */8 /* US Government Users Restricted Rights - Use, duplication or */9 /* disclosure restricted by GSA ADP Schedule Contract with IBM Corp.*/10 /* */11 /********************************************************************/1213 { /* DEFECT456BEGIN */14 I> int EXPARM1 = 5; PMR1357915 I> int EXPARM2 = 2; PMR1357916 extern void C01B(void);17 I< void PROCA(int); /* function not called */
Appendix E. z/OS Debugger Code Coverage 523
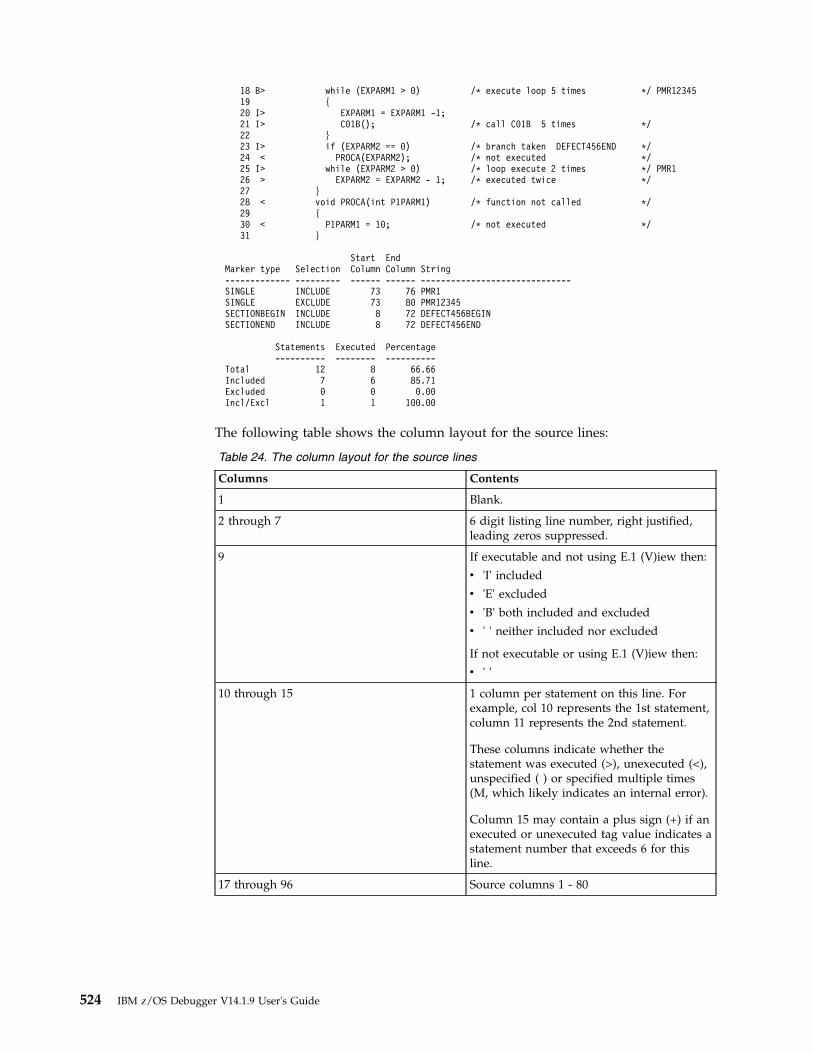
18 B> while (EXPARM1 > 0) /* execute loop 5 times */ PMR1234519 {20 I> EXPARM1 = EXPARM1 -1;21 I> C01B(); /* call C01B 5 times */22 }23 I> if (EXPARM2 == 0) /* branch taken DEFECT456END */24 < PROCA(EXPARM2); /* not executed */25 I> while (EXPARM2 > 0) /* loop execute 2 times */ PMR126 > EXPARM2 = EXPARM2 - 1; /* executed twice */27 }28 < void PROCA(int P1PARM1) /* function not called */29 {30 < P1PARM1 = 10; /* not executed */31 }
Start EndMarker type Selection Column Column String------------- --------- ------ ------ ------------------------------SINGLE INCLUDE 73 76 PMR1SINGLE EXCLUDE 73 80 PMR12345SECTIONBEGIN INCLUDE 8 72 DEFECT456BEGINSECTIONEND INCLUDE 8 72 DEFECT456END
Statements Executed Percentage---------- -------- ----------
Total 12 8 66.66Included 7 6 85.71Excluded 0 0 0.00Incl/Excl 1 1 100.00
The following table shows the column layout for the source lines:
Table 24. The column layout for the source lines
Columns Contents
1 Blank.
2 through 7 6 digit listing line number, right justified,leading zeros suppressed.
9 If executable and not using E.1 (V)iew then:
v 'I' included
v 'E' excluded
v 'B' both included and excluded
v ' ' neither included nor excluded
If not executable or using E.1 (V)iew then:
v ' '
10 through 15 1 column per statement on this line. Forexample, col 10 represents the 1st statement,column 11 represents the 2nd statement.
These columns indicate whether thestatement was executed (>), unexecuted (<),unspecified ( ) or specified multiple times(M, which likely indicates an internal error).
Column 15 may contain a plus sign (+) if anexecuted or unexecuted tag value indicates astatement number that exceeds 6 for thisline.
17 through 96 Source columns 1 - 80
524 IBM z/OS Debugger V14.1.9 User's Guide

Batch facilities
Extraction functionThis function selects, from an input file, code coverage observations that are basedon the selection criteria and writes to an output file in XML. The input of thecalling interface is as follows:
You can run the code coverage Extraction Utility in batch by running theEQAXCCX2 REXX exec. You must specify the following DDNAMES:
EQACSINPLocation of Observation file.
EQACSSELLocation of Selection file.
EQACSOUTLocation of output code coverage extracted observations file.
An example of using EQAXCCX2 in batch can be found inhlq.SEQASAMP(EQACCEXT).
All three files are allocated either as a sequential file or PDSE. The file formatshould be VB and LRECL=255. If it is a PDSE file, the data set name must include amember name.
Report functionsXML Report
This function composes a full XML file for reporting purpose. The file contains thedata for a report writer to write a readable report or an HTML file for the browser.A full report XML file contains the following two sections:v The observation section contains the selected observations. Each observation
includes statements which might be marked as included or excluded and codecoverage extracted observations XML tags that are generated from the reportgenerator.
v The selection criteria section contains the selection criteria and source markers.
The code coverage Report Utility can be started in batch by starting theEQAXCCR2 REXX exec with the XML parameter. You must specify the followingDDNAMES:
EQACRINPCode coverage extracted observations that are based on selection criteria.
EQACRSELCode coverage Selection file.
EQACROUTXML report output.
An example of using EQAXCCR2 in batch to generate a XML report can be foundin hlq.SEQASAMP(EQACCXRP).
All three files are allocated either as a sequential file or PDSE. The file format is VBfor the XML file, VBA for the Presentation file, and LRECL=255. If it is a PDSE file,the data set name must include a member name.
Appendix E. z/OS Debugger Code Coverage 525

Presentation report
A Presentation report can also be generated. It contains the same data as the XMLreport, except it is presented in a viewer friendly format.
To generate a Presentation report, specify PFMT as the parameter to EQAXCCR2.An example of using EQAXCCR2 in batch to generate a Presentation report can befound in hlq.SEQASAMP(EQACCPRP).
Batch examplesYou can find JCL samples in hlq.SEQASAMP for batch jobs. The JCL samples containthe steps to build a test case, and then to specify, gather, process, and documentcode coverage for the test case.
The following members contain JCL samples of gathering code coverage in batchjobs:
Table 25.
Member name Compiler
EQACC1VZ Enterprise COBOL for z/OS and OS/390 V3Enterprise COBOL for z/OS V3 and V4
EQACC2VZ Enterprise PL/I for z/OS V4.2 through V4.5 and V5
EQACC3VZ z/OS XL C
EQACC4VZ Enterprise COBOL for z/OS V5 and V6
The JCL samples consist of the following steps:1. Compile procedure2. Creating data sets3. Compiling the source4. Binding the output of the compiler to create a load module5. Clearing out the CCOUTPUT file6. Loading the CCPRGSEL Options file7. Loading the CCOBSSEL Selection file8. Running the load module, gathering code coverage data and writing out the
CCOUTPUT file9. Running DTU E.4 - Observation extraction
10. Running DTU E.5.1 - XML Report generation11. Running DTU E.5.2 - Presentation Report generation
Generating code coverage for CICS transactionsThis section shows a technique that you can use to generate a code coverageObservation file for a CICS transaction.
Prepare the following files outside of CICS:v An Options file, as previously discussed.v A sequential EQAOPTS file with the code coverage EQAOPTS commands as
previously discussed.v A z/OS Debugger commands file with a single GO command (containing the
string GO; starting at column 8)
526 IBM z/OS Debugger V14.1.9 User's Guide

In CICS, run the DTCN transaction and press PF9 (OPTions) and fill it in asfollows:
DTCN z/OS Debugger CICS Control - Menu 2 S07CICPB
Select z/OS Debugger options
Test Option ==> TEST Test/NotestTest Level ==> ERROR All/Error/NoneCommands File ==> GYOUNG.CC.CICS.GOCMDPrompt Level ==> PROMPTPreference File ==> *
EQAOPTS File ==> GYOUNG.CC.EQAOPTS
Any other valid Language Environment options==> ENVAR("EQA_STARTUP_KEY=CC")
PF1=HELP 2=GHELP 3=RETURN
Then press PF3 (RETURN), on this screen, PF4 (SAVE) on the main DTCN screen,and PF3 (EXIT) to exit DTCN. Then run your transaction. Each transaction you runwill append a new set of observations to the Observation file.
This will run the transaction in unattended mode. If you want to interact withz/OS Debugger while collecting observations, remove the Commands file from theOptions panel shown above, and change the value of EQA_STARTUP_KEY toDCC.
Generating code coverage in IMS Transaction IsolationTo generate code coverage in IMS Transaction Isolation, you need to define anEQA_STARTUP_KEY environment variable and an EQAOPTS commands data setin the Manage Additional Libraries and Delay Debug panel (EQAPMPRG).
For more information about panel EQAPMPRG, see “Using IMS TransactionIsolation to create a private message-processing region and select transactions todebug” on page 373.
On panel EQAPMPRG, define the following settings for IMS Transaction Isolation:v Add the EQA_STARTUP_KEY environment variable, for example,
ENVAR("EQA_STARTUP_KEY=CC"), in the Other run-time options field.v Add a data set that contains EQAOPTS commands configured for capturing
z/OS Debugger code coverage, for example, 'USER.EQAOPTS.LOAD' SHR, in thedata set table at the bottom of the panel.
Appendix E. z/OS Debugger Code Coverage 527

Manage additional libraries and delay debug options Row 1 from 2Command ===> Scroll ===> PAGE
Your private message region will be set up to use delay debugmode for processing debugging preferences. Type / below to edityour delay debug profile data set.
Edit delay debug profile data set
Other run-time options: ENVAR("EQA_STARTUP_KEY=CC")
The following DD cards will be added to the top of the STEPLIBconcatenation for the private message region that z/OS Debuggerwill launch. You may add, edit or delete data sets from thislist before launching the message region for testing.
Cmd Seq C DD Information (DSN/Sysin/Sysout/Dummy) DISP***************** Top of Data *******************
1 ’USER.EQAOPTS.LOAD’ SHR
XML tags for code coverageThis section contains a set of XML tags for code coverage.
XML tags definition for the Observation fileThe XML file contains the following XML tags and content:v All tags have a corresponding end tag </XXXXX>. The table shows the end tag
when it needs to be on the same line as the start tag.v The tag name is upper case.v The occurrence column shows the number of tags that are allowed in context.
Table 26. XML tags and the contents
XML tag Description Occurrence
<COMPILATIONUNIT> Compilation unitcontainer
>=1, per <LOADMODULE>
<COMPILEDATE> Compile date container 1, per<COMPILATIONUNIT>
<COMPILETIME> Compile time container 1, per<COMPILATIONUNIT>
<CSECT> CSECT or programcontainer
>=1, per<COMPILATIONUNIT>
<DAY>xxx</DAY> Day 1, per <COMPILEDATE> or<RUNDATE>
<DBGOV>x</DBGOV> Debug override (Y orN)
1, per <CSECT>
<DTCODECOVERAGEFILE> z/OS Debugger codecoverage data
>=1, per file
<DTCODECOVERAGEREPORT> Code coverage reportdata
1 or 0, per file
<EXCEXECD>xxx</EXCEXECD> Total number ofexcluded sourcestatements executed
1, per <STATISTICS>
528 IBM z/OS Debugger V14.1.9 User's Guide

Table 26. XML tags and the contents (continued)
XML tag Description Occurrence
<EXCPRCNT>xxx</EXCPRCNT> Percentage of excludedsource statementsexecuted
1, per <STATISTICS>
<EXCSTMTS>xxx</EXCSTMTS> Total number ofexcluded sourcestatements
1, per <STATISTICS>
<EXECUTED>x x</EXECUTED> List of the statement orline numbers that wereexecuted. Each numberseparated by a blank.
>=0, per <CSECT>
<EXTNAME>xxx</EXTNAME> Name of CSECT orprogram
1, per <CSECT>
<GROUPID1>xxx</GROUPID1> User provided groupID. Default is *.
1 or 0, per file
<GROUPID2>xxx</GROUPID2> User provided groupID. Default is *.
1 0r 0, per file
<HOURS>xxx</HOURS> Hours 1, per <COMPILETIME> or<RUNTIME>
<IECEXECD>xxx</IECEXECD> Total number ofincluded and excludedsource statementsexecuted
1, per <STATISTICS>
<IECPRCNT>xxx</IECPRCNT> Percentage of includedand excluded sourcestatements executed
1, per <STATISTICS>
<IECSTMTS>xxx</IECSTMTS> Total number ofincluded and excludedsource statements
1, per <STATISTICS>
<INCEXECD>xxx</INCEXECD> Total number ofincluded sourcestatements executed
1, per <STATISTICS>
<INCPRCNT>xxx</INCPRCNT> Percentage of includedsource statementsexecuted
1, per <STATISTICS>
<INCSTMTS>xxx</INCSTMTS> Total number ofincluded sourcestatements
1, per <STATISTICS>
<LOADMODULE> Load module container >=1, per file
<MARKEDSTMTS> Container for markedstatements
1, per <CSECT>
<MEMBERNAME>xxx</MEMBERNAME>
Name of the loadmodule
1, per <LOADMODULE>
<MINUTES>xxx</MINUTES> Minutes 1, per <COMPILETIME> or<RUNTIME>
<MONTH>xxx</MONTH> Month 1, per <COMPILEDATE> or<RUNDATE>
<ORIGINALCOLLECTION> Container for originalobservations that arerolled up
1, per<COMPILATIONUNIT>
Appendix E. z/OS Debugger Code Coverage 529

Table 26. XML tags and the contents (continued)
XML tag Description Occurrence
<ORIGINALOBSERVATION> Container for originalobservation that ismerged
>=1, per<ORIGINALCOLLECTION>
<PROGRAMDSCOMPILEDATE>xxx</PROGRAMDSCOMPILEDATE>
The compile datecontainer of data setthat contains programsource
1, per<COMPILATIONUNIT>
<PROGRAMDSCOMPILETIME>xxx</PROGRAMDSCOMPILETIME>
The compile timecontainer of data setthat contains programsource
1, per<COMPILATIONUNIT>
<PROGRAMDSNAME>xxx</PROGRAMDSNAME>
The name of data setthat contains programsource
1, per<COMPILATIONUNIT>
<PROGRAMDSTYPE>xxx</PROGRAMDSTYPE>
The type of data setthat contains programsource. Valid types are:
v 1 -COBOLSYSDEBUG(Enterprise COBOLfor z/OS V3 and V4)
v 2 - PLISYSDEBUG(Enterprise PL/I forz/OS V4.2 andabove)
v 4 - Program Object(Enterprise COBOLfor z/OS V5 andabove)
v 5 - Source (z/OS XLC)
1, per<COMPILATIONUNIT>
<RUNDATE> Date that the codecoverage data wassaved
1, per<DTCODECOVERAGEFILE>or <COVERAGEFILE >
<RUNTIME> Time that the codecoverage data wassaved
1, per<DTCODECOVERAGEFILE>or <COVERAGEFILE>
<SECONDS>xxx</SECONDS> Seconds 1, per <COMPILETIME> or<RUNTIME>
<STATISTICS> Container for codecoverage statistics
1, per <CSECT>
<STMT>xxx</STMT> Marked sourcestatement
>=1, per<MARKEDSTMTS>
<TOTEXECD>xxx</TOTEXECD> Total number of sourcestatements executed
1, per <STATISTICS>
<TOTPRCNT>xxx</TOTPRCNT> Percentage of sourcestatements executed
1, per <STATISTICS>
<TOTSTMTS>xxx</TOTSTMTS> Total number of sourcestatements
1, per <STATISTICS>
530 IBM z/OS Debugger V14.1.9 User's Guide

Table 26. XML tags and the contents (continued)
XML tag Description Occurrence
<UNEXECUTED>xx</UNEXECUTED>
List of the statement orline numbers that werenot executed. Eachnumber separated by ablank.
>=0, per <CSECT>
<USERID>xxx</USERID> User ID that generatesthe file. Default is *.
1 or 0, per file
<YEAR>xxx</YEAR> Year 1, per <COMPILEDATE> or<RUNDATE>
XML tag hierarchy for the Observation fileThe following sample XML output shows the hierarchical structure of the tags, thecontainers, and the tags within a container.<DTCODECOVERAGEFILE><RUNDATE><YEAR>....</YEAR><MONTH>....</MONTH><DAY>....</DAY></RUNDATE><RUNTIME><HOURS>....</HOURS><MINUTES>....</MINUTES><SECONDS>....</SECONDS></RUNTIME><GROUPID1>....</GROUPID1><GROUPID2>....</GROUPID2><USERID>....</USERID><LOADMODULE><MEMBERNAME>....</MEMBERNAME><COMPILATIONUNIT><PROGRAMDSNAME>....</PROGRAMDSNAME><PROGRAMDSTYPE>....</PROGRAMDSTYPE><COMPILEDATE><YEAR>....</YEAR><MONTH>....</MONTH><DAY>....</DAY></COMPILEDATE><COMPILETIME><HOURS>....</HOURS><MINUTES>....</MINUTES><SECONDS>....</SECONDS></COMPILETIME><CSECT><EXTNAME>....</EXTNAME><DBGOV>....</DBGOV><EXECUTED>....</EXECUTED><UNEXECUTED>....</UNEXECUTED></CSECT></COMPILATIONUNIT></LOADMODULE></DTCODECOVERAGEFILE>
XML Tags used in the Options fileThe following example shows the XML tags used in the Options file:
Appendix E. z/OS Debugger Code Coverage 531

<GROUPID1></GROUPID1><GROUPID2></GROUPID2><EXTNAME></EXTNAME><EXTNAME></EXTNAME><EXTNAME></EXTNAME><EXTNAME></EXTNAME>
The three tags are defined in the table of common tags and XML tags and thecontents.
XML tags used in the Selection fileThe following table shows the description of XML tags used in the Selection file:
Table 27. Description of XML tags used for selection criteria
Tag Description Occurrence
<ATTRIBUTE> A attribute criterioncontainer
>=1, per selection criteria file
<NAME>xxx</NAME> Name of selected attribute 1, per attribute criterion
<OPERATOR>xxx</OPERATOR>
Comparison operator used tosee if the attribute of anobservation comparessuccessfully
1, per attribute criterion
<ROLLUP>xxx</ROLLUP> Roll up characteristics of theattribute criterion. Validvalues are as follows:
v Y - Yes. Observations withdifferent values of theattributes can be merged(rolled up).
v N - No. Observations withdifferent values of theattributes cannot bemerged (rolled up).
1, per attribute with thefollowing names:
v GROUPID1
v GROUPID2
v USERID
v DBGOV
Table 28. Description of XML tags used for source maker
Tag Description Occurrence
<ENDCOLUMN>xxx</ENDCOLUMN>
The end column of a sourcestatement when searching forsource marker value.
1, per source marker
<MARKERTYPE>xxx</MARKERTYPE>
Marker type. Valid types areas follows:
v SECTIONBEGIN
v SECTIONEND
v SINGLE
1, per source marker
532 IBM z/OS Debugger V14.1.9 User's Guide
Table 28. Description of XML tags used for source maker (continued)
Tag Description Occurrence
<MARKERVALUE>xxx</MARKERVALUE>
A character string or hexvalue used to check if asource statement containssuch string or hex value.Attribute criterion. Validvalues are as follow:
v Y - Yes. Observations withdifferent values of theattributes can be merged(rolled up).
v N - No. Observations withdifferent values of theattributes cannot bemerged (rolled up).
1, per attribute with thefollowing names:
v GROUPID1
v GROUPID2
v USERID
v DBGOV
<SECTION>xxx</SECTION>
Include or exclude the sourcestatement that contains thesource maker value whencalculating the code coveragestatistics. Valid values are asfollows:
v INCLUDE
v EXCLUDE
1, per source marker
<SOURCEMARKER> A source maker container.Selected attribute container.
>=1, per source marker file
<STARTCOLUMN>xxx</STARTCOLUMN>
The start column of a sourcestatement when searching forsource marker value.
1, per source marker
Appendix E. z/OS Debugger Code Coverage 533

534 IBM z/OS Debugger V14.1.9 User's Guide

Appendix F. Notes on debugging in batch mode
Note: This chapter is not applicable to IBM Developer for z Systems(non-Enterprise Edition), IBM Z Open Development, or IBM Z Open Unit Test.
z/OS Debugger can run in batch mode, creating a noninteractive session.
In batch mode, z/OS Debugger receives its input from the primary commands file,the USE file, or the command string specified in the TEST run-time option, andwrites its normal output to a log file.
Note: You must ensure that you specify a log data set.
Commands that require user interaction, such as PANEL, are invalid in batch mode.
You might want to run a z/OS Debugger session in batch mode if:v You want to restrict the processor resources used. Batch mode generally uses
fewer processor resources than interactive mode.v You have a program that might tie up your terminal for long periods of time.
With batch mode, you can use your terminal for other work while the batch jobis running.
v You are debugging an application in its native batch environment, such asMVS/JES or CICS batch.
When z/OS Debugger is reading commands from a specified data set or file andno more commands are available in that data set or file, it forces a GO commanduntil the end of the program is reached.
When debugging in batch mode, use QUIT to end your session.
Refer to the following topics for more information related to the material discussedin this topic.
Related tasksChapter 16, “Starting z/OS Debugger in batch mode,” on page 141
© Copyright IBM Corp. 1992, 2019 535

536 IBM z/OS Debugger V14.1.9 User's Guide

Appendix G. Using IMS message region templates todynamically swap transaction class and debug in a privatemessage region
Note: This section is not applicable to IBM Developer for z Systems(non-Enterprise Edition), IBM Z Open Development, or IBM Z Open Unit Test.
You can use predefined IMS message region templates to debug a specifictransaction in a private message region by using IBM z/OS Debugger Utilitiesoption 4.3 Swap IMS Transaction Class and Run Transaction (panel EQAPMPRS).This panel and its sub-panels allow you to take the following actions:1. Start a private message region from a predefined message region template. This
template specifies a message class that is reserved for debug purposes.2. Assign a transaction that you want to debug to the class for the private
message region.3. Schedule a message for the transaction.4. After you have finished debugging the transaction and it completes, the
transaction is assigned to its original class and the private message region isstopped.
To dynamically launch a private message region and run a specific transaction inthat region, complete the following steps:1. Start IBM z/OS Debugger Utilities. For detailed information, see “Starting IBM
z/OS Debugger Utilities” on page 10.2. In the IBM z/OS Debugger Utilities panel (EQA@PRIM), type 4 in the Option
line and press Enter.3. In the Manage IMS Programs panel (EQAPRIS), type 3 in the Option line and
press Enter.4. In the Debug IMS Transaction - Select Private Message Region panel
(EQAPMPRS), type a forward slash (/) beside the template you want to use,and press Enter. You can choose from the following types of templates:v Predefined templates from a common z/OS Debugger Setup Utility data setv Templates previously customized and stored in a private z/OS Debugger
Setup Utility data setIf you use a member from a private z/OS Debugger Setup Utility data set, youcan see the Create Private Message Regions - Edit Setup File panel(EQAPFORA). Enter the information to edit an existing setup file.
5. In the Specify Transaction and Additional Test Libraries panel (EQAPMPRT),type the transaction name that you want to launch in your private messageregion. You also need to enter any additional information to send when themessage is scheduled.You might want to add data sets to the message region STEPLIB concatenation.To add a data set, type an I in the Cmd column of the data set table at thebottom of the panel. This adds an empty line to the table that you can fill inwith a data set name and a disposition.Each data set in the table is added to the beginning of the STEPLIBconcatenation for the message region, in the order specified in the table. Youmight change the relative position of the data sets in the table by modifying thevalues in the Seq column.
© Copyright IBM Corp. 1992, 2019 537
For more advanced manipulation of the DD card, you can type a forward slash(/) in the Cmd column for a DD card and press Enter. A menu is displayedwhere you can change the allocation parameters, the DCB parameters, andother characteristics that are specified on the DD card for a data set.
6. To start the private message region and schedule the transaction, run the z/OSDebugger IMS Transaction Swap Utility (the EQANBSWT Batch MessageProgram, hereafter referred to as EQANBSWT). This can be done in one of thetwo following ways:v Press PF4 to run the transaction. This starts EQANBSWT in the foreground
of your TSO session.v Press PF10 to submit. This displays a JCL deck that runs the EQANBSWT
program that you can submit to the Job Entry System by using the ISPFSUBMIT command.
EQANBSWT will start the private message region. By default, the TESTparameter will be the following:TEST(ALL,*,PROMPT,VTAM%userid:*)
The userid is your TSO user ID.If you want to use a different TEST parameter, type a forward slash (/) besidethe Enter / to modify parameters field, and press Enter. The EQAPFMTP panelis displayed. Specify the TEST parameter sub-options and session type, andpress PF3 to save.EQANBSWT will also start a second private message region, by using theNOTEST parameter, and serving the same class. This region allows additionalmessages scheduled for the transaction to be processed when the transaction isbeing debugged in the TEST region at the same time.EQANBSWT will then assign the transaction to the class served by the privatemessage region and schedule the transaction.When the transaction completes, EQANBSWT stops the private messageregions and assigns the transaction to the class to which it was initiallyassigned.The jobs that are started to run EQANBSWT and the two private messageregions use the job card you specified in IBM z/OS Debugger Utilities option 0,Job Card. Each job name is replaced by values that you entered in DebugUtilities option 4.0, Set IMS Program Options. If you do not set personaldefaults in option 4.0, system defaults are used.In certain circumstances, EQANBSWT does not complete normally. To interruptEQANBSWT, take one of the following steps:v If you ran EQANBSWT in the foreground by using the Run command, press
the ATTN or PA1 key and follow the prompts to stop the process.v If you ran EQANBSWT as a batch job by using the Submit command, issue
the STOP jobname MVS command, for example, by typing /P jobname in theSpool Display and Search Facility (SDSF).
7. When you want to leave the Specify Transaction and Additional Test Librariespanel (EQAPMPRT), you can save any changes you have made into a privatemessage region template.v If you selected a predefined message template in step 4, type SAVE AS and
press Enter. This displays the z/OS Debugger Foreground – Edit Setup Filepanel (EQAPFOR), where you can enter a data set name for your privatecopy of the template.
v Otherwise, press PF3 to Exit. Your changes are saved to the private templateyou opened in step 4.
538 IBM z/OS Debugger V14.1.9 User's Guide
Appendix H. Displaying and modifying CICS storage withDTST
Note: This chapter is not applicable to IBM Developer for z Systems(non-Enterprise Edition), IBM Z Open Development, or IBM Z Open Unit Test.
The DTST transaction enables you to display, scan, and modify CICS storage. It isa BMS transaction and runs on a 3270 terminal.
Starting DTSTThis topic describes the methods of starting DTST and gives examples.
Before you begin, if you need to modify storage, verify with your systemprogrammer that you have the authority to modify CICS key storage, USER keystorage, or both. "Authorizing DTST transaction to modify storage" in IBM z/OSDebugger Customization Guide describes the steps the system programmer must doto authorize you to modify CICS key storage, USER key storage, or both.
You can start the DTST transaction with or without specifying a base address. Abase address can be any of the following items:v A literal hexadecimal number (for example, 45CB00)v A 64 bit address (for example, 48_40B00000)v The name of a program (for example, MYPGM)v An offset calculation or indirection (for example, 45CB00+40)
You can also specify that DTST take a specific action when it starts. You specify anaction with one of the following characters:v P, which means to page forward or backward.v S, which means to search through storage until a specific target is found.
“Syntax of the DTST transaction” on page 544 describes all the parameters.
Examples of starting DTSTThe following examples illustrate how to enter the DTST command withparameters.
Example: Starting DTST and specifying a literal hexadecimal number
To display storage at address 45CB00, enter the command DTST 45CB00.
The base address is 45CB00.
Example: Starting DTST and specifying a 64 bit address
To display storage at address 48_40B00000, enter the command DTST48_40B00000.
The base address is 48_40B00000.
Example: Starting DTST and specifying a program name
To display program storage for program MYPROG, enter the commandDTST P=MYPROG.
© Copyright IBM Corp. 1992, 2019 539

The base address is the address of the program in storage.
Example: Starting DTST and specifying an offsetTo display storage at an negative offset of D0 bytes from address 45CB00,enter the command DTST 45CB00 - D0.
The result of the calculation (45CB00-D0) is the base address. In thisexample, the base address is 45CA30.
To display program storage at an positive offset of 28 bytes from thestarting address of program MYPROG, enter the command DTSTP=MYPROG+28.
If the starting address of program MYPROG is 8492A000, then the result ofthe calculation (8492A000+28) is the base address (8492A028).
If fullwords generate protection exceptions (for example, in fetch-protectedstorage), DTST displays question marks in the Storage Key field.
Example: Starting DTST with indirect addressing
To display storage by indirection, use an asterisk (*) to indicate 31-bitaddressing or an at sign (@) to indicate 24-bit addressing. DTST uses thefullword at that address as the base address.
If you want to use the fullword at address 45CB00 as the base address,enter the command DTST 45CB00*.
You can combine multiple offset or levels of indirection. For example, ifyou enter the command DTST 45CB00 + b* + 14** + 14*, DTST calculatesthe base address in the following order:1. Beginning with 45CB00, add B0. The result is 45CBB0.2. Go to location 45CBB0 to obtain the address at that location. For this
example, assume that the address is 29AD00.3. Add 14 to 29AD00. The result is 29AD14.4. Go to location 29AD14 to obtain the address at that location. For this
example, assume that the address is 1838AD.5. Go to location 1838AD to obtain the address at that location. For this
example, assume that the address is 251936.6. Add 14 to 251936 to get the result 25194A.7. Go to location 25194A to obtain the address at that location. For this
example, assume that the address is 3920AD. DTST opens the memorywindow and display the contents of storage beginning at 3920AD.
Example: Starting DTST with the BASE keywordThe BASE keyword can make it easier to write long command lines. TheBASE keyword is assigned the value of the base address of the previousDTST command. For example, if you enter the command DTST 45CB00+10*,BASE is assigned the value of the result of 45CB00+10*. If you want to usethe value of 45CB00+10* in a subsequent command, use the BASEkeyword. For example, DTST BASE+20*.
Example: Starting DTST with a scan requestYou can specify data that you are looking for by adding a scan request tothe DTST command. For example, to find the data ‘WORKAREA’ startingat base address 45CB00, enter the command DTST 45CB00,S='WORKAREA'.The scan starts at the base address and continues for 4K bytes. To find thedata ‘WORKAREA’ starting at base address 45CB00 at the beginning of
540 IBM z/OS Debugger V14.1.9 User's Guide

every double word, enter the command DTST 45CB00,S8='WORKAREA'. Youcan specify that the scan be done in a negative direction, which means thataddresses are decreasing in value.
Example: Starting DTST with a page number requestYou can specify a page you want displayed by adding a page request tothe DTST command. For example, to display storage that is 5 pages fromthe base address 45CB00, enter the command DTST 45CB00,P=5. This isequivalent to entering the command DTST 45CB00, then pressing the pagedown keys five times. If you enter the command DTST 45CB00,P=-5, it isequivalent to entering the command DTST 45CB00, then pressing the pageup keys five times.
Modifying storage through the DTST storage windowAfter you start the DTST transaction, the storage window is displayed. You canmodify the contents of storage being displayed in the storage window.
Before you begin, verify with your system programmer that you have the authorityto modify CICS key storage, USER key storage, or both. "Authorizing DTSTtransaction to modify storage" in IBM z/OS Debugger Customization Guide describesthe steps the system programmer must do to authorize you to modify CICS keystorage, USER key storage, or both.
After you verify that the previous DTST command ran successfully, you can do thefollowing steps to modify storage.1. Press PF9 to enter modify mode. The command line becomes protected, and
columns four through seven become unprotected.2. Move your cursor to data you want to modify and type in the new data. You
can modify several different locations at the same time.3. Press Enter. DTST verifies that the data you entered is valid. DTST makes all
modifications that contain valid data. If any word contains invalid data, theline contains that word is highlighted. You can correct the invalid data, thenpress Enter to verify the change.
4. Press any function key to end modify mode. However, you can not press anyof the following keys:v PF10v PF11v the CLEAR keyv the Enter key when you have typed in any modifications
Navigating through the DTST storage windowThere are several ways to navigate through the DTST storage window.
After you enter the DTST command, do the following steps:1. Choose one of the following methods to navigate through the window:v Use the PF7 or PF8 keys to move up or down a page, respectively.v Move your cursor to the command line and enter a new address. All spaces
are ignored, except the one after the transaction name (DTST) and any withinapostrophes (').
v Move your cursor over any fullword displayed in column 4 or 6, then pressEnter.
Appendix H. Displaying and modifying CICS storage with DTST 541

2. To close the DTST storage window, press the PF3 key.
DTST storage windowThe DTST storage window is the interface you use to display and modify storage.
+----------------------------------------------------------------------------+| Command : DTST 00100000 || Response : Normal || Page : HOME Storage Key : USER |+----------------------------------------------------------------------------+| 00100000 0000 00 | C4A3D983 826E6E6E A7E10888 A0050004 | DtRcb>>>x..h.... || 001▌1▐10 0▌2▐ ▌3▐| 001▌4▐12 000▌5▐00 000▌6▐00 000▌7▐00 | .......▌8▐...... || 00100020 0020 02 | A7E09170 8009D150 A7E152D8 00000000 | x.j...J.x..Q.... || 00100030 0030 03 | 00000001 000C5258 00000000 00000000 | ................ || 00100040 0040 04 | A6BF6098 800A4968 800B01DB 00000000 | w.-q.......Q.... || 00100050 0050 05 | 00000000 00000000 800B30CB 80140C10 | ...........H.... || 00100060 0060 06 | 8074B6A0 80155CA8 80160818 801683C0 | ......*y......c{ || 00100070 0070 07 | A6BFD338 00000000 A6BFD190 00000000 | w.L.....w.J..... || 00100080 0080 08 | 00000000 00000000 00000000 00000000 | ................ || 00100090 0090 09 | 00000000 00000000 00000000 00000000 | ................ || 001000A0 00A0 10 | 00000000 00000000 00000000 00000000 | ................ || 001000B0 00B0 11 | 00000000 00000000 00000000 00000000 | ................ || 001000C0 00C0 12 | 00000000 00000000 00000000 00000000 | ................ || 001000D0 00D0 13 | 00000000 00000000 00000000 00000000 | ................ || 001000E0 00E0 14 | 00000000 00000000 00000000 00000000 | ................ || 001000F0 00F0 15 | 00000000 00000000 00000000 00000000 | ................ |+----------------------------------------------------------------------------+| 1=Hlp 2=Retrv 3=End 5=RepeatScan 7=Up 8=Down 9=Modfy ENTER=ReCalc |+----------------------------------------------------------------------------+
The following list describes all the parts of the interface.
CommandThe most recent command you entered.
ResponseThe result of the most recent command you entered. If the command wassuccessful, the word Normal is displayed in this field. If the command wasunsuccessful, a message indicating the type of error that occurred in theprevious command is displayed.
Storage KeyDisplays one of the following values:
CICS Indicates that the CICS[hyphen]key storage is displayed.
USER Indicates that the USER[hyphen]key storage is displayed.
KEYn Indicates that Key n storage is displayed.
???? Indicates that the key is not recognized.
!!!! Indicates that the key was not obtained.
Column ▌1▐Displays the address of storage. The addresses are organized on a wordboundary. If you enter an address that is not on a word boundary, the bytespreceding the address, up to the beginning of the word, are padded withblanks.
Column ▌2▐Displays the offset of the address in column 1 from the base address. The offsetis displayed in hexadecimal.
542 IBM z/OS Debugger V14.1.9 User's Guide

Column ▌3▐Displays the line number (0 to 15) in the window. The line number isdisplayed in decimal.
Columns ▌4▐ through ▌7▐Displays the contents of storage in hexadecimal. Each column represents fourbytes.
Column ▌8▐Displays the contents of storage contents in EBCDIC.
Some of the following PF keys work only if the previous operation was successful.If the previous operation was successful, the word Normal is displayed in theResponse field.
PF1 (Help)Displays the help screen. The help screens display command syntax withexamples and lists all keywords.
PF2 (Retrieve)Retrieves the previous command from the command history. DTST stores up to10 commands in the command history, discarding the older commands to savenewer commands.
PF3 (Exit)Clears the screen and ends the transaction.
PF5 (RepeatScan)Repeats the scan operation.
PF7 (Up)Moves one page (256 bytes) back in storage. The base address is notrecalculated.
PF8 (Down)Moves one page (256 bytes) forward in storage. The base address is notrecalculated.
PF9 (Modify)Starts modify mode.
EnterDTST does one of the following tasks:v When the cursor is on a fullword, DTST uses that fullword as the base
address for the next command.v Recalculates the base address from the input string, even if it has not
changed, then changes the memory window so that the new base address isshown at the top of the screen.
Navigation keys for help screensDTST provides a number of online help screens. You can access these screens bypressing PF1 on the main screen (when you are not in modify mode), whichdisplays the main help index. You can navigate through the help screens by usingthe PF keys described in this topic.
PF3Close the help screen and return to the DTST storage window.
PF7Display the previous screen.
Appendix H. Displaying and modifying CICS storage with DTST 543

PF8Display the next screen.
PF10Display the main help index.
PF11Display the last help screen.
Syntax of the DTST transaction
The DTST transaction displays storage in a memory window. You can navigatethrough the storage area and modify storage.
►► DTST base_address
▼
,
request
►◄
base_address:
P = program_nameaddressBASE
+ displacement *- @
request:
request_letter = valuemodifier
The following list describes the parameters:
addressA hexadecimal value for a 31-bit address (for example, 45CB0) or for a 64-bitaddress using underscore notation (for example 48_40B00000).
BASEThe value of the base address of the previously entered DTST command,which ran successfully.
displacementA one to eight character hexadecimal value.
modifierIndicates the direction in which to conduct the action. The default is forward,which means an increasing value. For the backward direction, use the negativesign (-).
P Indicates that you are specifying the name of a program and you want thestarting address of that program to be used as the base address.
program_nameName of a program.
request_letterIndicates the action you want DTST to take. The request_letter can be one of thefollowing characters:
544 IBM z/OS Debugger V14.1.9 User's Guide

P Indicates that you want DTST to page up or down.
S Indicates that you want DTST to search through storage and stop when itfinds the target. The S request has the following syntax:
►► S 1 = 'text'- B hex_bytes
2H4W8D15DD
►◄
valueHexadecimal or decimal value or a string enclosed in quotation marks (") orapostrophes ('). It is used to indicate the number of pages you want DTST toscroll or the target of a search.
ExamplesTo indicate that you want to display the fifth page (or screen) of memory after theaddress x'01000000', enter the command DTST 01000000,P=5. This is equivalent toentering DTST 01000000, then pressing PF8 five times.
To indicate that you want to find x'00404040' starting at address x'01000000', enterthe command DTST 01000000,S=00404040.
Appendix H. Displaying and modifying CICS storage with DTST 545

546 IBM z/OS Debugger V14.1.9 User's Guide

Appendix I. z/OS Debugger Load Module Analyzer
Note: This chapter is not applicable to IBM Developer for z Systems(non-Enterprise Edition), IBM Z Open Development, or IBM Z Open Unit Test.
The z/OS Debugger Load Module Analyzer analyzes MVS load modules orprogram objects to determine the language translator (compiler or assembler) usedto generate the object for each CSECT. This program can process all or selectedload modules or program objects in a concatenation of PDS or PDSE data sets.
Choosing a method to start Load Module AnalyzerYou can start the Load Module Analyzer in one of the following ways:v Editing sample JCL provided in member EQAWLMA of data set hlq.SEQASAMP,
and then submitting the JCL to run as a batch job.v Selecting option 5 on the z/OS Debugger Utility ISPF panel.
Starting the Load Module Analyzer by using JCLTo start the Load Module Analyzer by using sample JCL, do the following steps:1. Make a copy of member EQAWLMA in data set hlq.SEQASAMP.2. Edit that copy, as instructed in the member.3. Submit the JCL.4. Review the results.
Starting the Load Module Analyzer by using IBM z/OS DebuggerUtilities
To start the Load Module Analyzer by using IBM z/OS Debugger Utilities, do thefollowing steps:1. Start IBM z/OS Debugger Utilities.2. Select option 5.3. Enter the appropriate information into each field on the panel, keeping in mind
the following behavior:v If you specify that you want a single load module or program object
analyzed, Load Module Analyzer is run in the TSO foreground.v If you specify that you want an entire PDS or PDSE analyzed, JCL is
generated to start Load Module Analyzer in MVS batch. Then, you mustsubmit or save the generated JCL.
Description of the JCL statements to use with Load Module AnalyzerBy default, the Load Module Analyzer program processes all members in the PDSor PDSE specified in the EQALIB DD statement. You can use control statements toinstruct Load Module Analyzer to process only specific members of the data setconcatenation.
The following information is included in the output for each CSECT:v CSECT name
© Copyright IBM Corp. 1992, 2019 547

v Segment number (present only for a multi-segment module)v CSECT offset in load module or segmentv CSECT length in hexadecimalv Program-ID as contained in the binder IDR datav Translator (compile or assembly) datev Program description as supplied for the specified program ID.v For OS/VS COBOL, PARM=RES or PARM=NORES.
– PARM=RES indicates that one or more OS/VS COBOL CSECTs in the loadmodule or program object were compiled with the RES compiler option.
– PARM=NORES indicates that all OS/VS COBOL CSECTs in the load moduleor program object were compiled with the NORES compiler option.
v If you specify LEINFO, LESCAN, or CKVOLFPRS:– If a Language Environment prologue was detected, information is included in
a string identified by LEINFO=(.... This string contains the LanguageEnvironment entry name or an asterisk to indicate that the name is the sameas the external symbol, Language Environment linkage type, source language,and translation date, time, and translator version.
– If no Language Environment prologue was detected, but the prologue appearsto be that of a known, non-Language Environment compiler, one of thefollowing is included: C/C++, COBOL, or PL/I.
– Otherwise, ASSEMBLER is included to indicate that the program is likely tobe an assembler program.
Description of DD names used by Load Module AnalyzerLoad Module Analyzer uses the following DD names:
EQALIBSpecifies a concatenation of PDS or PDSE data sets containing the loadmodules or program objects to be analyzed. If the same member is presentin more than one of the concatenated data sets, only the first member isprocessed.
EQAPRINTSpecifies the output report. It can be in fixed block record format(RECFM=FBA) with a logical record length of 133 or more (LRECL >=133)or in variable block record format (RECFM=VBA) with a logical recordlength of 137 or more (LRECL >= 137).
EQAINSpecifies the control statements. If you want only specific load modules orprogram objects to be processed, use the following syntax:SELECT MEMBER=load_module_name
If you want all load modules to be processed, you can omit this DDstatement, direct it to DUMMY, or direct it to empty data set. This filemust be in fixed block record format (RECFM=FB) with a logical recordlength of 80 (LRECL=80). Each control statement must be on a separateline. The entries are free-form and you can use blanks before or after eachkeyword and operator. You can include comments by placing an asterisk incolumn 1.
EQASYSPFSpecifies a list of system prefixes. This is a list of prefixes of names ofCSECTs that you want Load Module Analyzer to recognize as system
548 IBM z/OS Debugger V14.1.9 User's Guide

routines. The list helps limit the amount of output displayed for theseprefixes. This file must be in fixed block record format (RECFM=FB) with alogical record length of 80 (LRECL=80). z/OS Debugger provides data forthis file in member EQALMPFX of the table library (SEQATLIB). See“Description of EQASYSPF file format” on page 551 for a description ofthis file.
EQAPGMNMSpecifies a list of program names corresponding to program IDs found inthe load module IDR data. This file must be in fixed block record format(RECFM=FB) with a logical record length of 80 (LRECL=80). z/OSDebugger provides data for this file in member EQALMPGM of the tablelibrary (EQATLIB). See “Description of EQAPGMNM file format” on page552 for directions on how to add entries to this list.
Description of parameters used by Load Module AnalyzerYou can specify parameters by using the PARM= keyword of the EXEC JCLstatement. The parameter string passed to this program can consist of any of thefollowing parameters, separated by commas or blanks:
CKVOLFPRSLists only CSECTs or entries that use at least one of the AdditionalFloating-Point Registers 8 through 15. You cannot specify this parameter withthe OSVSONLY parameter. If you specify both, the last one specified is used.
COMPOPTSLists the compiler options known at run time for each compile unit. Note thatsome compiler options are not known at run time and, in some cases, onlycertain sub-options of a specific option might be known at run time.
Also, the options known at run time can vary depending on the release andversion of each compiler.
This option can be specified with an operand. For example:COMPOPTS=';'
In this case, the specified character is used to end each compiler option when itis listed; this makes scanning of the options simpler.
This option applies to the following compilers only:v Enterprise COBOLv COBOL for MVS & VMv VS COBOL IIv Enterprise PL/Iv z/OS XL C/C++
DATEFMT=dateformatSpecifies how dates are to be formatted. If a date from the binder CSECTidentification record (IDR) data does not appear to be a valid Julian date, it isnot reformatted. Use one of the following values:
YYYYMMDDSort format: YYYY/MM/DD. (Default)
MMDDYYYYU.S. standard format: MM/DD/YYYY.
DDMMYYYYEuropean standard format: DD/MM/YYYY.
Appendix I. z/OS Debugger Load Module Analyzer 549

LEINFOCauses the text for each CSECT and external entry point to be inspected for aLanguage Environment footprint. If one is found, information about theLanguage Environment entry point name, linkage type, source language, andtranslation date and time is included in the output for the CSECT or entry. Ifno Language Environment footprint is found, the prologue code is inspectedfor known non-Language Environment prologue formats. If one is discovered,the corresponding language is included in the output. Otherwise,“ASSEMBLER” is output.
In addition, for OS/VS COBOL and VS COBOL II, a NON-LEINFO section isincluded that contains the compile date and time and (for VS COBOL II only)the version of the compiler used.
LESCANCauses the actions described under the LEINFO parameter. In addition, thetext for each CSECT is scanned looking for “hidden” Language Environmententry points that do not correspond to an external symbol. For example, thesemight be present for C static functions. If such “hidden” entry points aredetected, the same output as described for LEINFO in generated.
LISTLDLists all label definition (LD) entries in addition to CSECT names.
LOUDSpecifies that the data read from the EQASYSPF and EQAPGMNM files isdisplayed in the output listing.
NATLANG=language_codeSpecifies the national language. Use one of the following values:
ENUMixed-case English. (Default)
UENUpper-case English.
JPNJapanese.
KORKorean.
OSVSONLYSpecifies that only CSECTs compiled with the OS/VS COBOL compiler are tobe displayed in the output. Information about all other CSECTs is suppressed.
You cannot specify this parameter with the CKVOLFPRS parameter. If youspecify both, the last one specified is used.
SHOWLIBSpecifies that the include indicator in the EQASYSPF file is to be ignored sothat all CSECTs are listed.
SORTBY=sort_optionSpecifies how to sort the names of the CSECTs in the output. Use one of thefollowing values:
OFFSETSort by offset; the order shown in the linkage editor or AMBLIST output.(Default)
550 IBM z/OS Debugger V14.1.9 User's Guide

NAMESorts by CSECT name.
PROGRAMSort by the translator program ID.
LANGUAGESorts by the source language and by the translator program ID.
DATESorts by the translation date.
Description of EQASYSPF file formatThis file contains a list of system prefixes. When Load Module Analyzer finds aCSECT that has a name prefixed by a name in this list and the entry for that prefixindicates that names beginning with that prefix are not to be included, LoadModule Analyzer does not display an individual entry for that CSECT. Instead, asingle line is displayed in the output for each prefix found that indicates that oneor more CSECTs with the specified prefix was found.
z/OS Debugger supplies data for this file in member EQALMPFX of the tablelibrary (SEQATLIB). If you want to add entries to this file, do one of the followingtasks:v Update the EQALMPFX member in hlq.SEQATLIB through the SMP/E
USERMOD in hlq.SEQASAMP(EQAUMOD3).v Create a data set containing the new entries. Then, concatenate this data set to
the one that ships with z/OS Debugger.
Each line in this file represents one entry. The entries are free-form; however, eachitem must be separated from the previous item by one or more blanks. You caninclude comments by placing an asterisk in column 1. Use the following syntax foreach line:prefix I L description
prefixA one to seven character prefix.
I Include indicator. Specify a "1" to indicate that each CSECT beginning with thisprefix is to be treated as an ordinary CSECT. Specify a "0" to indicate thatCSECTs beginning with this prefix are not to be listed individually.
L Language or system component indicator. Choose from one of the followingcharacters:
B COBOL
N Enterprise COBOL for z/OS, Version 4 or later
V OS/VS COBOL
P PL/I
E Enterprise PL/I
C C/C++
A Assembler
L Language Environment
S CICS
I IMS
Appendix I. z/OS Debugger Load Module Analyzer 551

2 DB2
M MVS
T TCP/IP
* Unclassified.
descriptionA twelve-character description of the component owning the prefix.
Description of EQAPGMNM file formatThis file contains a list of program names corresponding to program IDs found inthe load module IDR data. These names are used in the output to describe thelanguage translator used to generate the object for the corresponding CSECT.
z/OS Debugger provides data for this file in member EQALMPGM of the tablelibrary (SEQATLIB). If you want to add entries to this file, do one of the followingtasks:v Update the EQALMPRM member in hlq.SEQATLIB through the SMP/E
USERMOD in hlq.SEQASAMP(EQAUMOD4).v Create a data set containing the new entries. Then, concatenate this data set to
the one that ships with z/OS Debugger.
Each line represents one entry. The entries are free-form. The program numbermust begin in column 1 and each item must be separated from the previous itemby one or more blanks. You can include comments by placing an asterisk incolumn 1. You cannot use sequence numbers in this file. Use the following syntaxfor each line:program_name L program_description
program_nameA seven character program number.
L Language or system component indicator. See “Description of EQASYSPF fileformat” on page 551 for a list of possible values.
program_descriptionA description of the program.
Description of program output created by Load ModuleAnalyzer
The output for each load module or program object is displayed in the followingorder:v All members of the first EQALIB concatenation with each load module or
program object appearing in alphabetical orderv All members of the second EQALIB concatenation that are not duplicates of
members in the previous concatenation, with each load module or programobject appearing in alphabetical order
v All members of the next EQALIB concatenation that are not duplicates ofmembers in the previous concatenation, with each load module or programobject appearing in alphabetical order
Alias names are displayed in the following manner:
552 IBM z/OS Debugger V14.1.9 User's Guide
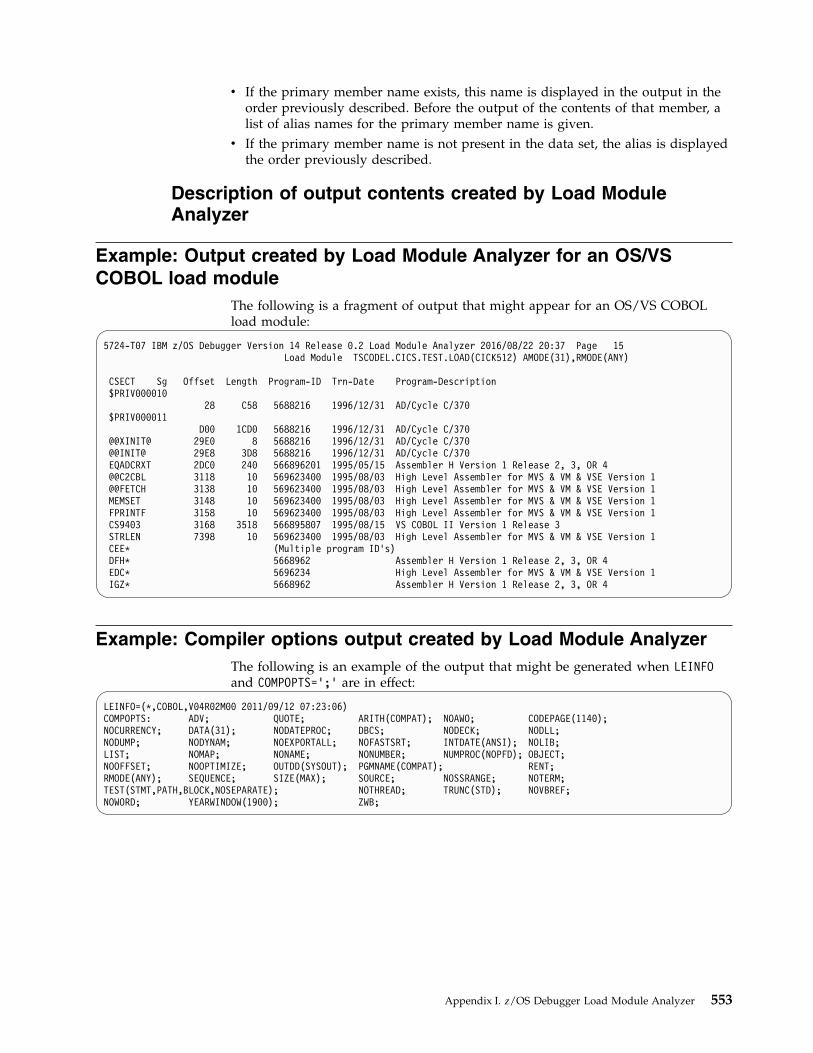
v If the primary member name exists, this name is displayed in the output in theorder previously described. Before the output of the contents of that member, alist of alias names for the primary member name is given.
v If the primary member name is not present in the data set, the alias is displayedthe order previously described.
Description of output contents created by Load ModuleAnalyzer
Example: Output created by Load Module Analyzer for an OS/VSCOBOL load module
The following is a fragment of output that might appear for an OS/VS COBOLload module:
5724-T07 IBM z/OS Debugger Version 14 Release 0.2 Load Module Analyzer 2016/08/22 20:37 Page 15Load Module TSCODEL.CICS.TEST.LOAD(CICK512) AMODE(31),RMODE(ANY)
CSECT Sg Offset Length Program-ID Trn-Date Program-Description$PRIV000010
28 C58 5688216 1996/12/31 AD/Cycle C/370$PRIV000011
D00 1CD0 5688216 1996/12/31 AD/Cycle C/370@@XINIT@ 29E0 8 5688216 1996/12/31 AD/Cycle C/370@@INIT@ 29E8 3D8 5688216 1996/12/31 AD/Cycle C/370EQADCRXT 2DC0 240 566896201 1995/05/15 Assembler H Version 1 Release 2, 3, OR 4@@C2CBL 3118 10 569623400 1995/08/03 High Level Assembler for MVS & VM & VSE Version 1@@FETCH 3138 10 569623400 1995/08/03 High Level Assembler for MVS & VM & VSE Version 1MEMSET 3148 10 569623400 1995/08/03 High Level Assembler for MVS & VM & VSE Version 1FPRINTF 3158 10 569623400 1995/08/03 High Level Assembler for MVS & VM & VSE Version 1CS9403 3168 3518 566895807 1995/08/15 VS COBOL II Version 1 Release 3STRLEN 7398 10 569623400 1995/08/03 High Level Assembler for MVS & VM & VSE Version 1CEE* (Multiple program ID’s)DFH* 5668962 Assembler H Version 1 Release 2, 3, OR 4EDC* 5696234 High Level Assembler for MVS & VM & VSE Version 1IGZ* 5668962 Assembler H Version 1 Release 2, 3, OR 4
Example: Compiler options output created by Load Module AnalyzerThe following is an example of the output that might be generated when LEINFOand COMPOPTS=';' are in effect:
LEINFO=(*,COBOL,V04R02M00 2011/09/12 07:23:06)COMPOPTS: ADV; QUOTE; ARITH(COMPAT); NOAWO; CODEPAGE(1140);NOCURRENCY; DATA(31); NODATEPROC; DBCS; NODECK; NODLL;NODUMP; NODYNAM; NOEXPORTALL; NOFASTSRT; INTDATE(ANSI); NOLIB;LIST; NOMAP; NONAME; NONUMBER; NUMPROC(NOPFD); OBJECT;NOOFFSET; NOOPTIMIZE; OUTDD(SYSOUT); PGMNAME(COMPAT); RENT;RMODE(ANY); SEQUENCE; SIZE(MAX); SOURCE; NOSSRANGE; NOTERM;TEST(STMT,PATH,BLOCK,NOSEPARATE); NOTHREAD; TRUNC(STD); NOVBREF;NOWORD; YEARWINDOW(1900); ZWB;
Appendix I. z/OS Debugger Load Module Analyzer 553

554 IBM z/OS Debugger V14.1.9 User's Guide

Appendix J. Running NEWCOPY on programs by using DTNPtransaction
Note: This chapter is not applicable to IBM Developer for z Systems(non-Enterprise Edition), IBM Z Open Development, or IBM Z Open Unit Test.
DTNP is a CICS transaction, supplied by z/OS Debugger, that runs the NEWCOPYbatch command which loads a new copy of an application program into an activeCICS region.
You can run the transaction in the following ways:v Enter the transaction name (DTNP). The transaction displays the z/OS Debugger
- NEWCOPY Program panel. Enter the name of the application program in theProgram Name field. To process multiple application programs at once, appendthe wildcard character (*) to the name. For example, LYN* indicates that youwant DTNP to process all programs that start with the letters "LYN". Press PF4.
v Enter the transaction name (DTNP), followed by the name of the program. Toprocess multiple application programs at once, append the wildcard character (*)to the name. For example, LYN* indicates that you want DTNP to process allprograms that start with the letters "LYN".
The transaction displays the results in the z/OS Debugger - NEWCOPY Programpanel. If the NEWCOPY action fails, the transaction runs the PHASEIN action, soCICS uses a new copy of the application for all new transaction requests.
Refer to the following topics for more information related to the material discussedin this topic.
Related tasksDescription of the CEMT SET PROGRAM command in CICS Transaction Server forz/OS: Supplied Transactions, SC34-7004.
© Copyright IBM Corp. 1992, 2019 555

556 IBM z/OS Debugger V14.1.9 User's Guide

Appendix K. Using the IBM Debug Tool plugins
IBM Debug Tool plugins are no longer being enhanced, but can still be installedwith IBM Debug for z Systems, IBM Developer for z Systems or IBM Developer forz Systems Enterprise Edition.
The same functionality, in general, is now available in the remote GUI in IBMDeveloper for z Systems and IBM Developer for z Systems Enterprise Edition viathese methods:v DTCN profiles can now be enabled by using the Remote CICS Application
debug launch configuration.v DTSP profiles can now be enabled by using the Remote IMS Application and
Remote DB2 Application debug launch configurations.v JCL generation can be accomplished by using Property Groups, and the various
JCL generation actions in both the Remote Systems view, and the z/OS Projectnavigator. Users can also use the MVS Batch Application launch configuration todynamically instrument and submit JCL to the host.
v Code Coverage can now be accomplished by using the various launches orinstrumenting JCL. The Code Coverage Results view allows users to work withcompiled code coverage results, Java code coverage results, and supportsimporting code coverage results in the Debug Tool format.
The DTCN Profile Manager, DTSP Profile Manager, Instrument JCL for Debugging,z/OS Debugger Code Coverage, and Load Module Analyzer plug-ins are availableto download from IBM DeveloperWorks Mainframe Development website as partof the IBM Developer for z Systems install offering. These plug-ins add thefollowing views to the Debug perspective of the remote debugger:v The DTCN Profiles view, which helps you create and manage DTCN profiles
for CICS on your z/OS system.v The DTSP Profile view, which helps you create and manage the TEST runtime
options data set (EQAUOPTS) on your z/OS system.v The Instrument JCL for Debugging view, which guides you through the process
of filling out information that it uses to instrument JCL to start z/OS Debuggerfor batch jobs.
v The z/OS Debugger Code Coverage view, which guides you through theprocess that measures test coverage in application programs.
v The Load Module Analyzer view, which helps you determine the languagetranslator (compiler and assembler) used to generate each CSECT in a loadmodule or program object.
To install these plug-ins, follow the steps found in the website at Download EclipseTools of IBM DeveloperWorks Mainframe Development. Use the IBM InstallationManager method to install the plug-ins, and select IBM Debug for z Systems >Debug Tool Plugins when you install or modify IBM Developer for z Systems.1. Verify that your system administrator has completed the following tasks
described in the IBM z/OS Debugger Customization Guide:v “Adding support for the DTCN Profiles view and APIs”v “Adding support for the DTSP Profile view”
2. Restart your Eclipse-based application.
© Copyright IBM Corp. 1992, 2019 557

Establishing a connection between the DTCN Profiles view for CICS and yourz/OS system
Specify the settings needed to establish a connection between the DTCN profilesview and your z/OS system by taking the following steps:1. Select Window > Show view > Other.2. Type "DTCN" in the text box at the top of the window. Select DTCN Local
profiles, DTCN Server Profiles, and click OK.3. Select Window > Show view > Other.4. Type "Host Connections" in the text box at the top of the window. Select Host
Connections and click OK.5. In the Host Connections view, select DTCN and click Add to create a
connection to DTCN.6. Specify the settings in the following fields and click Save and Close:
Name The name of the connection. It is autofilled by combining the hostname and port number that you specified with ":".
Host nameThe TCP/IP name or address of the z/OS system as described in“Defining the CICS TCPIPSERVICE resource” in the IBM z/OS DebuggerCustomization Guide.
Port numberThe port number of the z/OS system as described in “Defining theCICS TCPIPSERVICE resource” in the IBM z/OS Debugger CustomizationGuide.
Connection typeIf the server is not enabled with SSL as described in "Establishing asecured communication between the DTCN profile view for CICS andyour z/OS system" in the IBM z/OS Debugger Customization Guide, selectNON-SSL. Default value is NON-SSL.
Inactivate profileSelect Yes if you want your profile to be inactive during workbenchshutting down. Default value is Yes.
7. Select the DTCN connection you created, and click Connect.8. In the DTCN Signon window, specify the settings in the following fields, or
select Use existing Credentials if you have at least one credential defined, andclick OK.
Credentials NameThe name of the credential. You can leave it blank for default.
User IDThe ID that you use to log on to the CICS system.
Password or PassphraseThe password or passphrase that you use to log on to the CICS system.
The connection is successful when you see a green icon for the DTCNconnection. Otherwise, review the information you entered, correct anymistakes, and try the connection test again. You can also review the trace file(see “Locating the trace file of the DTCN Profile, the DTSP Profile, InstrumentJCL for Debugging, Code Coverage, and Load Module Analyzer view” on page567) for diagnostic information that can help identify a mistake.
558 IBM z/OS Debugger V14.1.9 User's Guide

9. In the DTCN Local Profiles view, right click DTCN Local Profiles, then clickon Create context menu to create local profiles. These profiles are saved onyour local workspace. The color highlighted local profile means that it is thesame as server profile.
Establishing a connection between the DTSP Profile view and your z/OS system
Specify the settings needed to establish a connection between the DTSP Profileview and your z/OS system by taking the following steps:1. Select Window > Show view > Other.2. Type "DTSP" in the text box at the top of the window. Select DTSP Local
Profiles, DTSP Server Profiles, and click OK.3. Select Window > Show view > Other.4. Type "Host Connections" in the text box at the top of the window. Select Host
Connections and click OK.5. In the Host Connections view, select Application Delivery Foundation for z
Systems and click Add to create a connection to the ADFz CommonComponents Server.
6. Specify the settings in the following fields and click Save and Close:
Name The name of the connection. It is autofilled by combining the hostname and port number that you specified with ":".
Host nameThe TCP/IP name or address of the z/OS system, which is set by thesystem administrator according to the instructions in “Installing theserver components for IBM Debug Tool DTCN and DTSP ProfileManager” in the IBM z/OS Debugger Customization Guide.
Port numberThe port number of the z/OS system, which is set by the systemadministrator according to the instructions in “Installing the servercomponents for IBM Debug Tool DTCN and DTSP Profile Manager”in the IBM z/OS Debugger Customization Guide.
Default encodingThe default encoding is "cp037". If you use a different encodingscheme, specify it in this field.
7. Click Window > Debug Tool > DTSP (non-CICS) in the navigation pane.8. In the Preferences window, select the Problem Determination Tools connection
you created from the Connection list and click Connect.9. If this is the first time you are connecting to the ADFz Common Components
Server, click Yes in the Certificate Information window.10. In the Problem Determination Tools Signon window, specify the settings in the
following fields, or select Use existing Credentials if you have at least onecredential defined, and click OK:
Credentials NameThe name of the credential. You can leave it blank for default.
User IdThe ID that you use to log on to the z/OS system. The DTSP Profilesubstitutes this ID for the &userid token in the Profile name patternfield.
Appendix K. Using the IBM Debug Tool plugins 559

Password or PassphraseThe password or passphrase that you use to log on to the z/OSsystem.
If you see a message that indicates the test was successful, click OK to closethe Preferences window. Otherwise, review the information you entered,correct any mistakes, and try the connection test again. You can also reviewthe trace file (see “Locating the trace file of the DTCN Profile, the DTSPProfile, Instrument JCL for Debugging, Code Coverage, and Load ModuleAnalyzer view” on page 567) for diagnostic information that can help identifya mistake.
11. In the DTSP Local Profiles view, right click DTSP Local Profiles, then clickon Create context menu to create local profiles. These profiles are saved onyour local workspace. The color highlighted local profile means that it is thesame as server profile.
In the views, you can right click anywhere to see a list of actions available. If youneed to change your connection settings, you can right click in any area of theDTSP Profile view and select Preferences.
Instrument JCL for Debugging Plug-inThe Instrument JCL for Debugging Plug-in provides a UI that guides you throughthe process of filling out information that it uses to instrument JCL to start z/OSDebugger for batch jobs.
You can access the Instrument JCL for Debugging Plug-in by taking the followingsteps:1. Select Window > Show view > Other.2. Type “Instrument JCL for Debugging” in the text box at the top of the window
or scroll down until you find this entry in the drop-down menu. Select andclick OK. The view contains the following options:
User SettingsModify job card, and specify the names of the commands andpreferences files.
System SettingsSpecify library location that contains specific z/OS Debugger andLanguage Environment components.
Prepare and Start Debug sessionSpecify a JCL and start debug session.
FTP Connection SettingsSpecify host name, user ID, and password for connection to server.
Customize Instrument JCL for debugging by taking the following steps:1. In the Instrument JCL for Debugging view, double click FTP Connection
Settings. Specify the settings in the corresponding fields, then click the TestConnection button to verify the settings, and then click OK.
Host nameThe TCP/IP name or address of the z/OS system.
User IDThe z/OS system user id.
560 IBM z/OS Debugger V14.1.9 User's Guide
PasswordThe z/OS system password.
2. In the Instrument JCL for Debugging view, double click User Settings to openthe User Settings view. In this view, provide the job card, session type,invocation method, and the location of the commands file and preferences file.
Job cardA job card image is used when there is no job card in the JCL whilemodifying the JCL for job submission. There is no default setting. Youmust enter a valid job card here.
Session typeSession type is the type of the display device where the debug sessionis displayed when z/OS Debugger starts.
Invocation methodInvocation method controls the method that the utility implements inthe JCL to start the debugger.
Commands file and preferences fileThey are part of the TEST run-time option string.
After you have filled in the information, click on the Save button in the upperleft corner of the view to save the settings.
3. In the Instrument JCL for Debugging view, double click System Settings toopen the System Settings view. In this view, provide the z/OS Debugger loadmodule library and Language Environment CEEBINIT load module library.
z/OS Debugger LibraryIf the text field is not blank, it is added to the STEPLIB DDconcatenation.
Language Environment CEEBINIT ModuleA partitioned data set that contains a member, CEEBINIT, module thathas been link-edited with the z/OS Debugger version (EQAD3CXT) ofthe Language Environment CEEBXITA user exit.
After you have filled in the information, click on the Save button in the upperleft corner of the view to save the settings.
4. In the Instrument JCL for Debugging view, double click Debug Information,Source and Listing Files. In this view, provide a user level file list and aninstallation file list.
User level file listThe files listed in the data set are added to the top of the EQADEBUGDD concatenation.
Installation file listThe files listed in the data set are added to the bottom of theEQADEBUG DD concatenation.
After you have filled in the information, click on the Save button in the upperleft corner of the view to save the settings.
5. In the Instrument JCL for Debugging view, double click Prepare and StartDebug Session. A wizard guides you through a set of steps required for theJCL Instrumentation for debugging. Specify the settings in the following wizardpages.
Wizard Page 1Specify a partially qualified data set name in the field as a filter, thenclick the Select button to retrieve a list of data set names. Only
Appendix K. Using the IBM Debug Tool plugins 561

partitioned or sequential data set names are supported. After the JCLdata set name is selected, click Next.
Wizard Page 2If the JCL data set is a partitioned data set, select one of the memberson this page and click Next. If it is a sequential data set from theprevious page, Wizard page 3 displays.
Wizard Page 3A list of steps in the selected JCL is displayed. Session type andinvocation method are displayed on top of the page. A Find icon isavailable to locate a character string in the step list. Select one of thesteps, session type and invocation method, then click Next.
Wizard Page 4 GUIIf the session type selected is GUI from the previous page, a GUI pageis displayed with the IP address of your workstation and the defaultport number. You can enter a different work station’s IP address andport number if you want. The workstation must have the remotedebugger installed and listen on the port number. Click Next.
Wizard Page 4 TIMIf the session type is TIM from the previous page, the TIM pagedisplayed. TIM is the z/OS Debugger TERMINAL INTERFACEMANAGER. Enter the user id to login the TIM terminal, then clickNext. The default value is the FTP user id.
Wizard Page 5The updated JCL is displayed and ready to submit. To assist viewingthe added lines, all insertions are enclosed in the comment lines://*>>> The JCL lines below were inserted by z/OS Debugger. <<<//*>>> The JCL lines above were inserted by z/OS Debugger. <<<
Wizard Page 6Enter a data set name if you want to save the updated JCL, then ClickNext.
Last Wizard PageJCL job is submitted. Job id is displayed.
Usage notes
1. JCLs that use PROC are not supported.2. If the invocation method described above in Prepare and Start Debug Session
Wizard 3 uses the z/OS Debugger Language Environment user exitEQAD3CXT, see the Specifying the TEST runtime options through the LanguageEnvironment user exit chapter in the IBM z/OS Debugger User's Guide or the IBMz/OS Debugger Customization Guide for further details about how to use the userexit.
3. The plug-in's default is to start a debug session by using the Debug perspectivein the remote GUI. However, you can direct the debug session to a TerminalInterface Manager session. See Starting a debugging session in full-screen modeusing the Terminal Interface Manager or a dedicated terminal for moreinformation on using Terminal Interface Manager.
562 IBM z/OS Debugger V14.1.9 User's Guide
z/OS Debugger Code Coverage Plug-in
z/OS Debugger Code Coverage Plug-in is a UI application that guides youthrough the process that measures test coverage in application programs which arewritten in COBOL, PL/I and C and are compiled with certain compilers andcompiler options. With this UI application in PD Tool Studio, you can test yourapplication and generate reports to determine which code statements have beenexecuted and unexecuted.
You can access z/OS Debugger Code Coverage Plug-in by taking the followingsteps:v Select Window > Show view > Other.v Type z/OS Debugger Code Coverage in the text box at the top of the window or
scroll down until you find this entry in the drop-down menu. Select and clickOK. The view contains the following options:
z/OS Debugger Code Coverage Option FilesModify the z/OS Debugger code coverage options.
Code Coverage Report GenerationCreate code coverage reports.
Establishing a connection between the Code Coverage view and your z/OSsystem
1. Select "Host connections view".2. In the Host Connections view, select Application Delivery Foundation for z
Systems and click Add to create a connection to the ADFz CommonComponents Server.
3. Specify the settings in the following fields and click Save and Close:
Name The name of the connection. It is auto filled in by combining the hostname and port number that you specified with a ":".
Host nameThe TCP/IP name or address of the z/OS system, which is set by thesystem administrator according to the instructions in "Server Overview"in the IBM Application Delivery Foundation for z Systems CommonComponents Customization Guide and User Guide.
Port numberThe port number of the z/OS system, which is set by the systemadministrator according to the instructions in "Server Overview" in theIBM Application Delivery Foundation for z Systems Common ComponentsCustomization Guide and User Guide.
Default encodingThe default encoding is "cp037". If you use a different encodingscheme, specify it in this field.
4. If this is the first time you are connecting to the ADFz Common ComponentsServer, click Yes in the Certificate Information window.
5. In the Problem Determination Tools Signon window, specify the settings in thefollowing fields, or select Use existing Credentials if you have at least onecredential defined, and click OK:
Credentials NameThe name of the credential. You can leave it blank for the default.
Appendix K. Using the IBM Debug Tool plugins 563

User IdThe ID that you use to log on to the z/OS system.
Password or PassphraseThe password or passphrase that you use to log on to the z/OS system.
Generate code coverage reports by taking the following steps:1. In the z/OS Debugger Code Coverage view, double click Code Coverage
Options File to open the option file editor. Specify the settings in thecorresponding fields, then click Create | Update.
Data set nameYou can enter an existing or new data set name, then click the Select...button to retrieve a data set list. Before you click the button, specifyinga partially qualified data set name is highly recommended. Retrievingall data sets from the server may be time-consuming. The partiallyqualified data set name used as a filter must begin with first qualifierof the data set you are looking for.
Program nameThe name of program targeted for code coverage. Up to 8 names areallowed. You can use a wild card either at the end the name string orstandalone if you want all programs in the application.
Group IDGroup ID 1: If you want to group observations to form a set based onthe characteristics of the applications, you can use this field.
Group ID 2: If you want a subgroup for the observation to form asubset based on the characteristics of the application, you can use thisfield. During the analysis of the observations the user can sort based onthe grouping.
2. In the z/OS Debugger Code Coverage view, double click Code CoverageReport Generation. A wizard guides you through code coverage reportgeneration. Specify the settings in the following wizard pages.
Wizard Page1Specify a partially qualified data set name in the field as a filter, thenclick the Select... button to retrieve a list of data set names. Before youclick the Select... button, specifying a partially qualified data set nameis highly recommended. Retrieving all data sets from the server maybetime-consuming. The partially qualified data set name used as a filtermust begin with first qualifier of the data set you are looking for. Afterthe output data set name is selected, click Next.
Wizard Page 2In the Observation selection criteria page, all fields are pre-populatedbased on the file you selected from the previous page. The selectionwizard page is where you specify the criteria that should be used in theevaluation of the code coverage observations in order to create a set ofstatistics based on the selection provided. You might want to see onlythe results for a specific group, or a specific program even if theOptions file indicated more than one program. This allows the user todefine the granularity of the information. You can specify one or moreattribute values and their associated comparison operator. After specifyselection criteria, click Next or Finish.
Wizard Page 3This Source Marker Page is optional. The source markers provide a
564 IBM z/OS Debugger V14.1.9 User's Guide

way to select source lines that are to be included or excluded in thestatistics calculation for code coverage. It is based on the indicators inthe source listing like a comment, numeric sequence, a range ofstatements, or a string at a specific place in the source listing. Anindicator marks a statement or section of statements that arechanged/added as a result of a defect fix or enhancement. Click Finishafter you have done with it.
3. In the z/OS Debugger Code Coverage report view, there are four menu iconson top of the view and three context menu items.
Expand AllExpand the tree view to the lowest level.
Collapse AllCollapse the tree view to the top level.
Export to XMLSave the report as XML.
Export to PDFSave the report as a PDF. This report includes the program source.
View/Update Selection CriteriaRight click on the top level of the tree view to display the context menuView/Update Selection Criteria. Click this menu item to display theObservation Selection Criteria wizard page, where you can update yourselections again. Notice that all fields are pre-populated based on yourprevious selections.
View Annotated SourceRight click on the lowest level of tree item to display two menu items.One of them is View Annotated Source. Executed lines are highlightedwith green color, and unexecuted lines are highlighted with red color.
View StatisticsRight click on the lowest level of tree item to display two menu items.Another one is View Annotated Source.
Load Module Analyzer Plug-in
Load Module Analyzer Plug-in (LMA) is a UI application that is used to determinethe language translator (compiler and assembler) used to generate each CSECT in aload module or program object. In addition it can display the compiler options forhigh-level languages and a variety of other information.
You can access the Load Module Analyzer Plug-in by taking the following steps:1. Select Window > Show view > Other.2. Type “Load Module Analyzer” in the text box at the top of the window or
scroll down until you find this entry in the drop-down menu. Select and clickOK. The view contains the following options:
Load Module Analyzer Report GenerationCreate load module analyzer reports.
Refresh Current UserDisplay available reports for the current logged in user.
Establishing a connection between the Load Module Analyzer view and yourz/OS system (refer to Code Coverage Plug-in section)
Appendix K. Using the IBM Debug Tool plugins 565

Generate Load Module Analyzer reports by taking the following steps:1. In the Load Module Analyzer view, click Launch Report Generating Wizard. A
wizard guides you through the Load Module Analyzer report generation.Specify the settings in the following wizard.
Wizard Page1Specify a partially qualified data set name in the field as a filter, thenclick the Select... button to retrieve a list of data set names. Before youclick the Select... button, specifying a partially qualified data set nameis highly recommended. Retrieving all data sets from the server maybetime-consuming. The partially qualified data set name used as a filtermust begin with first qualifier of the data set you are looking for. Afterthe output data set name is selected, click Next.
Wizard Page 2Report Preferences page, fill in the designated fields you would like foryour report, then click Next. There are several fields:
Display prefix and program dataAllows you to see the list of system prefixes and programnames known by the Load Module Analyzer program.
Show information for all compiler/system library routinesAllows you to see information about all system and libraryroutines instead of a summary by prefix.
Show all label definitionsAllows you to show all external names including both CSECT’sand label definitions.
Show compiler optionsAllows you to show all the compiler options known at run-timefor CU’s generated by certain compilers.
OS/VS COBOL onlyAllows you to limit output to only OS/VS COBOL programs.
CKVOLFPRSAllows you to limit the output to only programs that maycontain references to volatile floating point registers.
Show language environment informationAllows you to show information extracted from the LanguageEnvironment prologue blocks.
Scan for language environment informationAllows you to show information extracted from the Languageenvironment prologue blocks and to scan for LanguageEnvironment entry points that do not correspond to externalnames.
Sort byAllows you to sort the output for each load module by OFFSETin the load module, CU NAME, PROGRAM ID, LANGUAGE(COBOL, C/C++, PL/I, etc.), or translation DATE.
Date formatThis option specifies the date format to be used in programoutput.
Wizard Page 3The page is used to display a list of the members of a partitioned data
566 IBM z/OS Debugger V14.1.9 User's Guide

set. Select the members whose contents you would like to view. Youcan select individually or select all, click Next.
Wizard Page 4Confirmation page, there are several sections.
Report name fieldModify or use prefilled name.
Report summaryDisplay selections from previous wizard pages.
Report preferencesDisplay selections from previous wizard pages.
Save report to local directoryClick checkbox “Save to Local Files” will enable “Select FileDirectory” button.
2. In the Load Module Analyzer view, you can see the report list for current userby pressing Refresh Current user button. You can open them either by doubleclicking the reports from list or clicking Open Selection(s) in Report View. Toremove reports from the list, select reports, then click Remove Selection(s)from User Reports.
Locating the trace file of the DTCN Profile, the DTSP Profile,Instrument JCL for Debugging, Code Coverage, and Load ModuleAnalyzer view
When you do actions in the DTCN Profiles, DTSP Profile, Instrument JCL forDebugging, Code Coverage, or Load Module Analyzer view, the views saveinformation about the actions and results of the actions in the following files:v .com.ibm.pdtools.debugtool.dtcn.trace.log for the DTCN Profiles viewv .com.ibm.pdtools.debugtool.dtsp.trace.log for the DTSP Profiles viewv .com.ibm.pdtools.debugtool.bjfd.trace.log for the Instrument JCL for
Debugging viewv .com.ibm.pdtools.debugtool.dtcc.trace.log for the Code Coverage viewv .com.ibm.pdtools.debugtool.dtlma.trace.log for the Load Module Analyzer
view
The views save these files in the \.metadata folder of your workspace. (To find thepath name of your workspace, click File>Switch Workspace>Other... in yourEclipse-based application.) The example below shows the file information about acommon action and the action result.
Example: .debugtool.dtcn.trace file<?xml version="1.0" encoding="UTF-8"?><profilerecord><profileid>DCRAGGS</profileid><activation>A</activation><program><loadname>LOAD1</loadname><pgmname>COMP1</pgmname></program><program><loadname>LOAD2</loadname><pgmname>COMP2</pgmname></program><program>
Appendix K. Using the IBM Debug Tool plugins 567

<loadname>LOAD3</loadname><pgmname>COMP3</pgmname></program><transactionid>T67</transactionid><userid>DCRAGG</userid><netname>net</netname><clientip>123.123</clientip><commareaoffset>0</commareaoffset><containeroffset>0</containeroffset><urmdeb>Y</urmdeb><trigger>TEST</trigger><level>ALL</level><sesstype>TCP</sesstype><sessaddr>DBM</sessaddr><sessport>8001</sessport><commandfile>TEST</commandfile><preferencefile>*</preferencefile><promptlevel>PROMPT</promptlevel><pmplatform>PlatName</pmplatform></profilerecord>
The last line of the trace is one line; however, the line is wrapped in this exampleso that you can see the entire contents of the line.
Examples: .debugtool.dtsp.trace filesThe following example shows what the file might contain after you click on TestConnection in the DTSP (non-CICS) Preferences page:Test Connection button clicked -----getSocketIO parameters are below.Host: tlba07me.torolab.ibm.comPort: 5555UserId: vikramPattern: &userid.dbgtool.eqauoptsStart Service successful. The message was:Connected to DebugToolProvider DTSP query response: File exists.Connection was successful ---
The following example shows what the file might contain after you click on Finishin the update wizard:---- DTSP Finish button clicked ----Profile data set: vikram2.dbgtool.eqauoptsUEWizard: Read successful.DT_Update request worked fine. ------Retrieving Profile -----GetOtherProfiles: Socket is good -----GetOtherProfiles: Hashmap contains {otheropts=sto(ff), sessport=8002,sessaddr=9.65.111.33, level=ERROR, preferencefile=*, commandfile=*,trigger=TEST, sesstype=TCPIP, profiledata set=vikram2.dbgtool.eqauopts}
Examples: .debugtool.bjfd.trace filesThe following example shows what the file might contain after you click on SaveIcon in the Setting Editor view:[2013-09-26 10:18:11,633] 590320 INFO-- logging in to FTP server--[ com.ibm.pdtools.bjfd.controller.ftp.FTPJobManager.connect(FTPJobManager.java:74) ][2013-09-26 10:18:12,144] 590831 INFO-- login succeeded--[ com.ibm.pdtools.bjfd.controller.ftp.FTPJobManager.connect(FTPJobManager.java:79) ][2013-09-26 10:18:12,145] 590832 DEBUG-- Buffer Size:1024--[ com.ibm.pdtools.bjfd.controller.ftp.FTPJobManager.getDataSet(FTPJobManager.java:153) ][2013-09-26 10:18:12,146] 590833 DEBUG-- Buffer Size:1048576--[ com.ibm.pdtools.bjfd.controller.ftp.FTPJobManager.getDataSet(FTPJobManager.java:155) ][2013-09-26 10:18:12,147] 590834 DEBUG
568 IBM z/OS Debugger V14.1.9 User's Guide
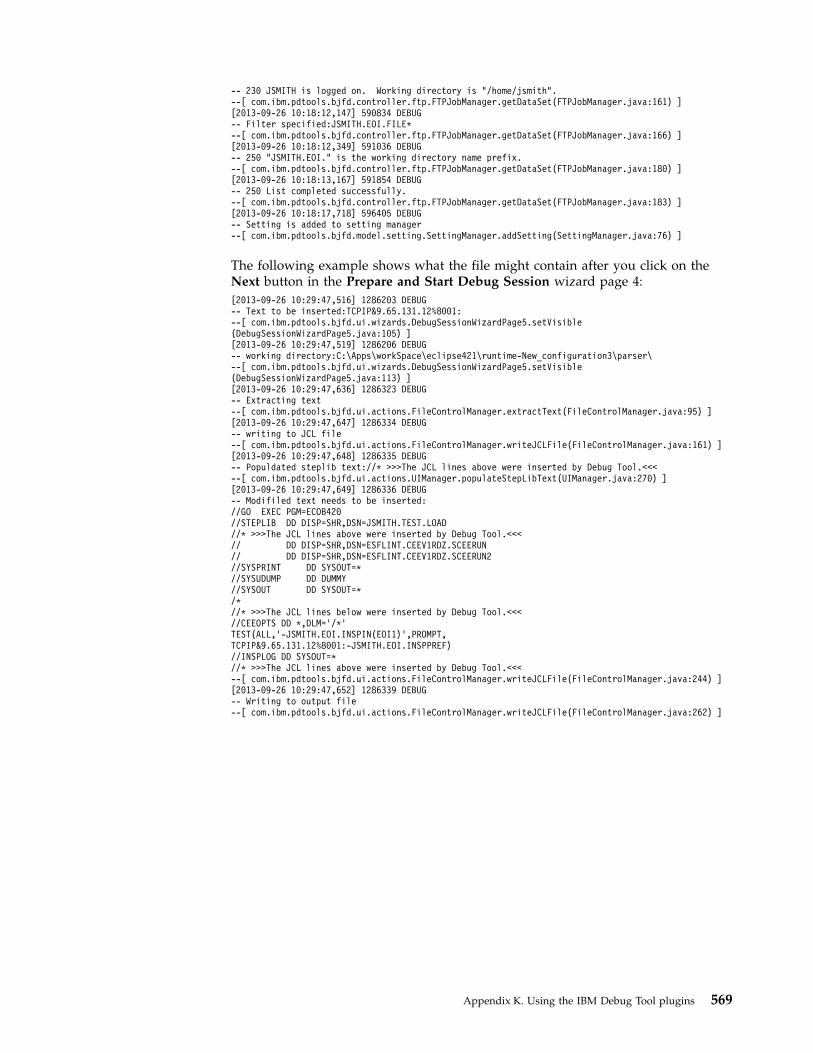
-- 230 JSMITH is logged on. Working directory is "/home/jsmith".--[ com.ibm.pdtools.bjfd.controller.ftp.FTPJobManager.getDataSet(FTPJobManager.java:161) ][2013-09-26 10:18:12,147] 590834 DEBUG-- Filter specified:JSMITH.EOI.FILE*--[ com.ibm.pdtools.bjfd.controller.ftp.FTPJobManager.getDataSet(FTPJobManager.java:166) ][2013-09-26 10:18:12,349] 591036 DEBUG-- 250 "JSMITH.EOI." is the working directory name prefix.--[ com.ibm.pdtools.bjfd.controller.ftp.FTPJobManager.getDataSet(FTPJobManager.java:180) ][2013-09-26 10:18:13,167] 591854 DEBUG-- 250 List completed successfully.--[ com.ibm.pdtools.bjfd.controller.ftp.FTPJobManager.getDataSet(FTPJobManager.java:183) ][2013-09-26 10:18:17,718] 596405 DEBUG-- Setting is added to setting manager--[ com.ibm.pdtools.bjfd.model.setting.SettingManager.addSetting(SettingManager.java:76) ]
The following example shows what the file might contain after you click on theNext button in the Prepare and Start Debug Session wizard page 4:[2013-09-26 10:29:47,516] 1286203 DEBUG-- Text to be inserted:TCPIP&9.65.131.12%8001:--[ com.ibm.pdtools.bjfd.ui.wizards.DebugSessionWizardPage5.setVisible(DebugSessionWizardPage5.java:105) ][2013-09-26 10:29:47,519] 1286206 DEBUG-- working directory:C:\Apps\workSpace\eclipse421\runtime-New_configuration3\parser\--[ com.ibm.pdtools.bjfd.ui.wizards.DebugSessionWizardPage5.setVisible(DebugSessionWizardPage5.java:113) ][2013-09-26 10:29:47,636] 1286323 DEBUG-- Extracting text--[ com.ibm.pdtools.bjfd.ui.actions.FileControlManager.extractText(FileControlManager.java:95) ][2013-09-26 10:29:47,647] 1286334 DEBUG-- writing to JCL file--[ com.ibm.pdtools.bjfd.ui.actions.FileControlManager.writeJCLFile(FileControlManager.java:161) ][2013-09-26 10:29:47,648] 1286335 DEBUG-- Populdated steplib text://* >>>The JCL lines above were inserted by Debug Tool.<<<--[ com.ibm.pdtools.bjfd.ui.actions.UIManager.populateStepLibText(UIManager.java:270) ][2013-09-26 10:29:47,649] 1286336 DEBUG-- Modifiled text needs to be inserted://GO EXEC PGM=ECOB420//STEPLIB DD DISP=SHR,DSN=JSMITH.TEST.LOAD//* >>>The JCL lines above were inserted by Debug Tool.<<<// DD DISP=SHR,DSN=ESFLINT.CEEV1RDZ.SCEERUN// DD DISP=SHR,DSN=ESFLINT.CEEV1RDZ.SCEERUN2//SYSPRINT DD SYSOUT=*//SYSUDUMP DD DUMMY//SYSOUT DD SYSOUT=*/*//* >>>The JCL lines below were inserted by Debug Tool.<<<//CEEOPTS DD *,DLM=’/*’TEST(ALL,’-JSMITH.EOI.INSPIN(EOI1)’,PROMPT,TCPIP&9.65.131.12%8001:-JSMITH.EOI.INSPPREF)//INSPLOG DD SYSOUT=*//* >>>The JCL lines above were inserted by Debug Tool.<<<--[ com.ibm.pdtools.bjfd.ui.actions.FileControlManager.writeJCLFile(FileControlManager.java:244) ][2013-09-26 10:29:47,652] 1286339 DEBUG-- Writing to output file--[ com.ibm.pdtools.bjfd.ui.actions.FileControlManager.writeJCLFile(FileControlManager.java:262) ]
Appendix K. Using the IBM Debug Tool plugins 569

570 IBM z/OS Debugger V14.1.9 User's Guide

Appendix L. Debugging a program processed by theAutomatic Binary Optimizer for z/OS
Note: This chapter is not applicable to IBM Z Open Development or IBM Z OpenUnit Test .
You can use the LangX COBOL support in z/OS Debugger to debug (withrestrictions) a load module or program object generated by the Automatic BinaryOptimizer for z/OS (ABO).
Before you debug, you must use the IPVLANGO utility to create a new LangX file.For more information about the IPVLANGO Automatic Binary Optimizer LangXfile update utility, see IBM Application Delivery Foundation for z Systems CommonComponents Customization Guide and User Guide.
ABO shuffles or removes instructions, which might result in moving or removingone or more statements, or collapsing several statements into one single statement.As a result, the debugging behavior might not be predictable and a visual randomstepping can be experienced during the debug session. In addition, it may not beobvious when a variable is actually set.
For an example of this potential unpredictable behavior, see Example of potentialunpredictable behavior when debugging an Automatic Binary Optimizer (ABO)optimized COBOL load module (http://www.ibm.com/support/docview.wss?uid=swg21971749).
To debug an ABO-processed program, complete the following steps:1. Compile the source using Enterprise COBOL for z/OS Version 3 or Version 4
with the options needed for LangX COBOL support.For more information about the LangX COBOL support, see Chapter 6,“Preparing a LangX COBOL program,” on page 73.
2. Link or bind your program.3. Run IPVLANGX against the COBOL listing from Step 1 to create a LangX file.
Steps 1, 2, and 3 are the normal LangX COBOL program preparation.4. Run ABO against the output from Step 2 to generate an ABO listing and an
optimized program.5. Run IPVLANGO against the LangX file from Step 3 and the listing output from
Step 4 to create a new LangX file.6. Debug the program generated by ABO in Step 4 with the LangX file from Step
5.
© Copyright IBM Corp. 1992, 2019 571

572 IBM z/OS Debugger V14.1.9 User's Guide

Appendix M. Support resources and problem solvinginformation
This section shows you how to quickly locate information to help answer yourquestions and solve your problems. If you have to call IBM support, this sectionprovides information that you need to provide to the IBM service representative tohelp diagnose and resolve the problem.v “Searching knowledge bases”v “Getting fixes” on page 574v “Subscribing to support updates” on page 574v “Contacting IBM Support” on page 575
Searching knowledge basesYou can search the available knowledge bases to determine whether your problemwas already encountered and is already documented.v “Searching IBM Knowledge Center”v “Searching product support documents”
Searching IBM Knowledge CenterYou can find this publication and documentation for many other products in IBMKnowledge Center at https://www.ibm.com/support/knowledgecenter.
Searching product support documentsIf you need to look beyond the information center to answer your question orresolve your problem, you can use one or more of the following approaches:v Find the content that you need by using the IBM Support Portal at
www.ibm.com/software/support or directly at www.ibm.com/support/entry/portal.The IBM Support Portal is a unified, centralized view of all technical supporttools and information for all IBM systems, software, and services. The IBMSupport Portal lets you access the IBM electronic support portfolio from oneplace. You can tailor the pages to focus on the information and resources thatyou need for problem prevention and faster problem resolution.Access a specific IBM Software Support site:– Application Performance Analyzer for z/OS Support– z/OS Debugger support– Enterprise COBOL for z/OS Support– Enterprise PL/I for z/OS Support– Fault Analyzer for z/OS Support– File Export for z/OS Support– File Manager for z/OS Support– WebSphere® Studio Asset Analyzer for Multiplatforms Support– Workload Simulator for z/OS and OS/390 Support
v Search for content by using the IBM masthead search. You can use the IBMmasthead search by typing your search string into the Search field at the top ofany ibm.com® page.
© Copyright IBM Corp. 1992, 2019 573

v Search for content by using any external search engine, such as Google, Yahoo,or Bing. If you use an external search engine, your results are more likely toinclude information that is outside the ibm.com domain. However, sometimesyou can find useful problem-solving information about IBM products innewsgroups, forums, and blogs that are not on ibm.com. Include "IBM" and thename of the product in your search if you are looking for information about anIBM product.
v The IBM Support Assistant (also referred to as ISA) is a free local softwareserviceability workbench that helps you resolve questions and problems withIBM software products. It provides quick access to support-related information.You can use the IBM Support Assistant to help you in the following ways:– Search through IBM and non-IBM knowledge and information sources across
multiple IBM products to answer a question or solve a problem.– Find additional information through product and support pages, customer
news groups and forums, skills and training resources and information abouttroubleshooting and commonly asked questions.
In addition, you can use the built in Updater facility in IBM Support Assistant toobtain IBM Support Assistant upgrades and new features to add support foradditional software products and capabilities as they become available.General information about the IBM Support Assistant can be found on the IBMSupport Assistant home page at http://www.ibm.com/software/support/isa.
Getting fixesA product fix might be available to resolve your problem. To determine what fixesand other updates are available, select a link from the following list:v Latest PTFs for Application Performance Analyzer for z/OSv Latest PTFs for Fault Analyzer for z/OSv Latest PTFs for File Manager for z/OSv Latest PTFs for z/OS Debuggerv Latest PTFs for IBM Developer for z Systems Enterprise Editionv Latest PTFs for ADFz Common Components
When you find a fix that you are interested in, click the name of the fix to read itsdescription and to optionally download the fix.
Subscribe to receive e-mail notifications about fixes and other IBM Supportinformation as described in Subscribing to Support updates..
Subscribing to support updatesTo stay informed of important information about the IBM products that you use,you can subscribe to updates. By subscribing to receive updates, you can receiveimportant technical information and updates for specific Support tools andresources. You can subscribe to updates by using the following:v RSS feeds and social media subscriptionsv My Notifications
RSS feeds and social media subscriptionsFor general information about RSS, including steps for getting started and a list ofRSS-enabled IBM web pages, visit the IBM Software Support RSS feeds site athttp://www.ibm.com/software/support/rss/other/index.html. For informationabout the RSS feed for the IBM System z Enterprise Development Tools &
574 IBM z/OS Debugger V14.1.9 User's Guide

Compilers information center, refer to the Subscribe to information center updatestopic in the information center at https://www.ibm.com/support/knowledgecenter.
My NotificationsWith My Notifications, you can subscribe to Support updates for any IBM product.You can specify that you want to receive daily or weekly email announcements.You can specify what type of information you want to receive (such aspublications, hints and tips, product flashes (also known as alerts), downloads, anddrivers). My Notifications enables you to customize and categorize the productsabout which you want to be informed and the delivery methods that best suit yourneeds.
To subscribe to Support updates, follow the steps below.1. Click My notifications to get started. Click Subscribe now! on the page.2. Sign in My notifications with your IBM ID. If you do not have an IBM ID,
create one ID by following the instructions.3. After you sign in My notifications, enter the name of the product that you want
to subscribe in the Product lookup field. The look-ahead feature lists productsmatching what you typed. If the product does not appear, use the Browse for aproduct link.
4. Next to the product, click the Subscribe link. A green check mark is shown toindicate the subscription is created. The subscription is listed under Productsubscriptions.
5. To indicate the type of notices for which you want to receive notifications, clickthe Edit link. To save your changes, click the Submit at the bottom of the page.
6. To indicate the frequency and format of the email message you receive, clickDelivery preferences. Then, click Submit.
7. Optionally, you can click the RSS/Atom feed by clicking Links. Then, copy andpaste the link into your feeder.
8. To see any notifications that were sent to you, click View.
Contacting IBM SupportIBM Support provides assistance with product defects, answering FAQs, andperforming rediscovery.
After trying to find your answer or solution by using other self-help options suchas technotes, you can contact IBM Support. Before contacting IBM Support, yourcompany must have an active IBM maintenance contract, and you must beauthorized to submit problems to IBM. For information about the types ofavailable support, see the information below or refer to the Support portfolio topicin the Software Support Handbook at http://www14.software.ibm.com/webapp/set2/sas/f/handbook/offerings.html.v For IBM distributed software products (including, but not limited to, Tivoli®,
Lotus®, and Rational products, as well as DB2 and WebSphere products that runon Windows, or UNIX operating systems), enroll in Passport Advantage® in oneof the following ways:
OnlineGo to the Passport Advantage Web site at https://www-01.ibm.com/software/passportadvantage/ and click How to Enroll.
Appendix M. Support resources and problem solving information 575

By phoneFor the phone number to call in your country, go to the Contacts page ofthe IBM Software Support Handbook on the Web at http://www14.software.ibm.com/webapp/set2/sas/f/handbook/contacts.htmland click the name of your geographic region.
v For customers with Subscription and Support (S & S) contracts, go to theSoftware Service Request Web site at http://www.ibm.com/support/servicerequest.
v For IBM eServer™ software products (including, but not limited to, DB2 andWebSphere products that run in zSeries, pSeries, and iSeries environments), youcan purchase a software maintenance agreement by working directly with anIBM sales representative or an IBM Business Partner. For more informationabout support for eServer software products, go to the IBM Technical SupportAdvantage Web site at http://www.ibm.com/servers/eserver/techsupport.html.
If you are not sure what type of software maintenance contract you need, call1-800-IBMSERV (1-800-426-7378) in the United States. From other countries, go tothe Contacts page of the IBM Software Support Handbook on the Web athttp://www14.software.ibm.com/webapp/set2/sas/f/handbook/contacts.htmland click the name of your geographic region for phone numbers of people whoprovide support for your location.
Complete the following steps to contact IBM Support with a problem:1. “Define the problem and determine the severity of the problem”2. “Gather diagnostic information” on page 5773. “Submit the problem to IBM Support” on page 577
To contact IBM Software support, follow these steps:
Define the problem and determine the severity of the problemDefine the problem and determine severity of the problem When describing aproblem to IBM, be as specific as possible. Include all relevant backgroundinformation so that IBM Support can help you solve the problem efficiently.
IBM Support needs you to supply a severity level. Therefore, you need tounderstand and assess the business impact of the problem that you are reporting.Use the following criteria:
Severity 1The problem has a critical business impact. You are unable to use theprogram, resulting in a critical impact on operations. This conditionrequires an immediate solution.
Severity 2The problem has a significant business impact. The program is usable, butit is severely limited.
Severity 3The problem has some business impact. The program is usable, but lesssignificant features (not critical to operations) are unavailable.
Severity 4The problem has minimal business impact. The problem causes littleimpact on operations, or a reasonable circumvention to the problem wasimplemented.
576 IBM z/OS Debugger V14.1.9 User's Guide

For more information, see the Getting IBM support topic in the Software SupportHandbook at http://www14.software.ibm.com/webapp/set2/sas/f/handbook/getsupport.html.
Gather diagnostic informationTo save time, if there is a Mustgather document available for the product, refer tothe Mustgather document and gather the information specified. Mustgatherdocuments contain specific instructions for submitting your problem to IBM andgathering information needed by the IBM support team to resolve your problem.To determine if there is a Mustgather document for this product, go to the productsupport page and search on the term Mustgather. At the time of this publication,the following Mustgather documents are available:v Mustgather: Read first for problems encountered with Application Performance
Analyzer for z/OS: http://www-01.ibm.com/support/docview.wss?uid=swg21265542
v Mustgather: Read first for problems encountered with z/OS Debugger:http://www-01.ibm.com/support/docview.wss?uid=swg21254711
v Mustgather: Read first for problems encountered with Fault Analyzer forz/OS:http://www-01.ibm.com/support/docview.wss?uid=swg21255056
v Mustgather: Read first for problems encountered with File Manager for z/OS:http://www-01.ibm.com/support/docview.wss?uid=swg21255514
v Mustgather: Read first for problems encountered with Enterprise COBOL forz/OS: http://www-01.ibm.com/support/docview.wss?uid=swg21249990
v Mustgather: Read first for problems encountered with Enterprise PL/I for z/OS:http://www-01.ibm.com/support/docview.wss?uid=swg21260496
If the product does not have a Mustgather document, please provide answers tothe following questions:v What software versions were you running when the problem occurred?v Do you have logs, traces, and messages that are related to the problem
symptoms? IBM Software Support is likely to ask for this information.v Can you re-create the problem? If so, what steps were performed to re-create the
problem?v Did you make any changes to the system? For example, did you make changes
to the hardware, operating system, networking software, and so on.v Are you currently using a workaround for the problem? If so, be prepared to
explain the workaround when you report the problem.
Submit the problem to IBM SupportYou can submit your problem to IBM Support in one of three ways:
Online using the IBM Support PortalClick Service request on the IBM Software Support site athttp://www.ibm.com/software/support. On the right side of the Servicerequest page, expand the Product related links section. Click Softwaresupport (general) and select ServiceLink/IBMLink to open an ElectronicTechnical Response (ETR). Enter your information into the appropriateproblem submission form.
Online using the Service Request toolThe Service Request tool can be found at http://www.ibm.com/software/support/servicerequest.
Appendix M. Support resources and problem solving information 577

By phoneCall 1-800-IBMSERV (1-800-426-7378) in the United States or, from othercountries, go to the Contacts page of the IBM Software Support Handbook athttp://www14.software.ibm.com/webapp/set2/sas/f/handbook/contacts.html and click the name of your geographic region.
If the problem you submit is for a software defect or for missing or inaccuratedocumentation, IBM Support creates an Authorized Program Analysis Report(APAR). The APAR describes the problem in detail. Whenever possible, IBMSupport provides a workaround that you can implement until the APAR isresolved and a fix is delivered. IBM publishes resolved APARs on the IBM Supportwebsite daily, so that other users who experience the same problem can benefitfrom the same resolution.
After a Problem Management Record (PMR) is open, you can submit diagnosticMustGather data to IBM using one of the following methods:v FTP diagnostic data to IBM. For more information, refer to http://www-
01.ibm.com/support/docview.wss?uid=swg21154524.v If FTP is not possible, e-mail diagnostic data to [email protected].
You must add PMR xxxxx bbb ccc in the subject line of your e-mail. xxxxx isyour PMR number, bbb is your branch office, and ccc is your IBM country code.Go to http://itcenter.mainz.de.ibm.com/ecurep/mail/subject.html for moredetails.
Always update your PMR to indicate that data has been sent. You can update yourPMR online or by phone as described above.
578 IBM z/OS Debugger V14.1.9 User's Guide

Appendix N. Accessibility
Accessibility features help a user who has a physical disability, such as restrictedmobility or limited vision, to use software products successfully. The accessibilityfeatures in z/OS provide accessibility for z/OS Debugger.
The major accessibility features in z/OS enable users to:v Use assistive technology products such as screen readers and screen magnifier
softwarev Operate specific or equivalent features by using only the keyboardv Customize display attributes such as color, contrast, and font size
The IBM System z Enterprise Development Tools & Compilers Information Center, andits related publications, are accessibility-enabled. The accessibility features of theinformation center are described at https://www.ibm.com/support/knowledgecenter.
Using assistive technologiesAssistive technology products work with the user interfaces that are found inz/OS. For specific guidance information, consult the documentation for theassistive technology product that you use to access z/OS interfaces.
Keyboard navigation of the user interfaceUsers can access z/OS user interfaces by using TSO/E or ISPF. Refer to z/OSTSO/E Primer, z/OS TSO/E User’s Guide, and z/OS ISPF User’s Guide Volume 1 forinformation about accessing TSO/E and ISPF interfaces. These guides describehow to use TSO/E and ISPF, including the use of keyboard shortcuts or functionkeys (PF keys). Each guide includes the default settings for the PF keys andexplains how to modify their functions.
Accessibility of this documentInformation in the following format of this document is accessible to visuallyimpaired individuals who use a screen reader:v HTML format when viewed from the IBM System z Enterprise Development Tools
& Compilers Information Center
Syntax diagrams start with the word Format or the word Fragments. Each diagramis preceded by two images. For the first image, the screen reader will say "Readsyntax diagram". The associated link leads to an accessible text diagram. When youreturn to the document at the second image, the screen reader will say "Skip visualsyntax diagram" and has a link to skip around the visible diagram.
© Copyright IBM Corp. 1992, 2019 579

580 IBM z/OS Debugger V14.1.9 User's Guide

Notices
This information was developed for products and services offered in the U.S.A.IBM might not offer the products, services, or features discussed in this documentin other countries. Consult your local IBM representative for information on theproducts and services currently available in your area. Any reference to an IBMproduct, program, or service is not intended to state or imply that only that IBMproduct, program, or service may be used. Any functionally equivalent product,program, or service that does not infringe any IBM intellectual property right maybe used instead. However, it is the user's responsibility to evaluate and verify theoperation of any non-IBM product, program, or service.
IBM may have patents or pending patent applications covering subject matter inthis document. The furnishing of this document does not give you any license tothese patents. You can send license inquiries, in writing, to:
IBM CorporationJ46A/G4555 Bailey AvenueSan Jose, CA 95141-1003U.S.A.
For license inquiries regarding double-byte (DBCS) information, contact the IBMIntellectual Property Department in your country or send inquiries, in writing, to:
Intellectual Property LicensingLegal and Intellectual Property LawIBM Japan, Ltd.3-2-12, Roppongi, Minato-ku, Tokyo 106-8711
The following paragraph does not apply to the United Kingdom or any othercountry where such provisions are inconsistent with the local law:
INTERNATIONAL BUSINESS MACHINES CORPORATION PROVIDES THISPUBLICATION “AS IS” WITHOUT WARRANTY OF ANY KIND, EITHEREXPRESS OR IMPLIED, INCLUDING, BUT NOT LIMITED TO, THE IMPLIEDWARRANTIES OF NON-INFRINGEMENT, MERCHANTABILITY OR FITNESSFOR A PARTICULAR PURPOSE.
Some states do not allow disclaimer of express or implied warranties in certaintransactions; therefore, this statement might not apply to you.
This information could include technical inaccuracies or typographical errors.Changes are periodically made to the information herein; these changes will beincorporated in new editions of the publication. IBM may make improvementsand/or changes in the product(s) and/or the program(s) described in thispublication at any time without notice.
© Copyright IBM Corp. 1992, 2019 581

Copyright licenseThis information contains sample application programs in source language, whichillustrates programming techniques on various operating platforms. You may copy,modify, and distribute these sample programs in any form without payment toIBM, for the purposes of developing, using, marketing or distributing applicationprograms conforming to the application programming interface for the operatingplatform for which the sample programs are written. These examples have notbeen thoroughly tested under all conditions. IBM, therefore, cannot guarantee orimply reliability, serviceability, or functions of these programs.
Programming interface informationThis book is intended to help you debug application programs. This publicationdocuments intended Programming Interfaces that allow you to write programs toobtain the services of z/OS Debugger.
Trademarks and service marksIBM, the IBM logo, and ibm.com are trademarks of International BusinessMachines Corp., registered in many jurisdictions worldwide. Other product andservice names might be trademarks of IBM or other companies. A current list ofIBM trademarks is available on the Web at “Copyright and trademark information”at www.ibm.com/legal/copytrade.shtml.
Java and all Java-based trademarks and logos are trademarks of Oracle and/or itsaffiliates.
Linux is a registered trademark of Linus Torvalds in the United States, othercountries, or both.
Microsoft, Windows, Windows NT, and the Windows logo are trademarks ofMicrosoft Corporation in the United States, other countries, or both.
UNIX is a registered trademark of The Open Group in the United States and othercountries.
MasterCraft is a trademark of Tata Consultancy Services Ltd.
582 IBM z/OS Debugger V14.1.9 User's Guide
Glossary
This glossary defines technical terms andabbreviations used in IBM z/OS Debugger User'sGuide documentation. If you do not find the termyou are looking for, refer to the IBM Glossary ofComputing Terms, located at the IBM Terminologyweb site:http://www.ibm.com/ibm/terminology
A
active blockThe currently executing block thatinvokes z/OS Debugger or any of theblocks in the CALL chain that leads up tothis one.
active serverA server that is being used by a remotedebug session. Contrast with inactiveserver. See also server.
alias An alternative name for a field used insome high-level programming languages.
animationThe execution of instructions one at atime with a delay between each so thatany results of an instruction can beviewed.
attention interruptAn I/O interrupt caused by a terminal orworkstation user pressing an attentionkey, or its equivalent.
attention keyA function key on terminals orworkstations that, when pressed, causesan I/O interrupt in the processing unit.
attributeA characteristic or trait the user canspecify.
AutosaveA choice allowing the user toautomatically save work at regularintervals.
B
batch Pertaining to a predefined series ofactions performed with little or nointeraction between the user and thesystem. Contrast with interactive.
batch jobA job submitted for batch processing. Seebatch. Contrast with interactive.
batch modeAn interface mode for use with the MFIz/OS Debugger that does not requireinput from the terminal. See batch.
block In programming languages, a compoundstatement that coincides with the scope ofat least one of the declarations containedwithin it.
breakpointA place in a program, usually specified bya command or a condition, whereexecution can be interrupted and controlgiven to the user or to z/OS Debugger.
C
CADP A CICS-supplied transaction used formanaging debugging profiles from a 3270terminal.
century window (COBOL)The 100-year interval in which COBOLassumes all windowed years lie. The startof the COBOL century window is definedby the COBOL YEARWINDOW compileroption.
command listA grouping of commands that can beused to govern the startup of z/OSDebugger, the actions of z/OS Debuggerat breakpoints, and various otherdebugging actions.
compileTo translate a program written in a highlevel language into a machine-languageprogram.
compile unitA sequence of HLL statements that makea portion of a program complete enoughto compile correctly. Each HLL producthas different rules for what comprises acompile unit.
compilerA program that translates instructionswritten in a high level programminglanguage into machine language.
© Copyright IBM Corp. 1992, 2019 583

conditionAny synchronous event that might needto be brought to the attention of anexecuting program or the languageroutines supporting that program.Conditions fall into two major categories:conditions detected by the hardware oroperating system, which result in aninterrupt; and conditions defined by theprogramming language and detected bylanguage-specific generated code orlanguage library code. An example of ahardware condition is division by zero.An example of a software condition isend-of-file. See also exception.
conversationalA transaction type that accepts input fromthe user, performs a task, then returns toget more input from the user.
currently qualifiedSee qualification.
D
data typeA characteristic that determines the kindof value that a field can assume.
data setThe major unit of data storage andretrieval, consisting of a collection of datain one of several prescribed arrangementsand described by control information towhich the system has access.
date fieldA COBOL data item that can be any ofthe following:v A data item whose data description
entry includes a DATE FORMATclause.
v A value returned by one of thefollowing intrinsic functions:
DATE-OF-INTEGERDATE-TO-YYYYMMDDDATEVALDAY-OF-INTEGERDAY-TO-YYYYDDDYEAR-TO-YYYYYEARWINDOW
v The conceptual data items DATE andDAY in the ACCEPT FROM DATE andACCEPT FROM DAY statements,respectively.
v The result of certain arithmeticoperations.
The term date field refers to both expandeddate field and windowed date field. See alsonondate..
date processing statementA COBOL statement that references a datefield, or an EVALUATE or SEARCHstatement WHEN phrase that references adate field.
DBCS See double-byte character set.
debug To detect, diagnose, and eliminate errorsin programs.
DTCNz/OS Debugger Control utility, a CICStransaction that enables the user toidentify which CICS programs to debug.
z/OS Debugger procedureA sequence of z/OS Debugger commandsdelimited by a PROCEDURE and acorresponding END command.
z/OS Debugger variableA predefined variable that providesinformation about the user's program thatthe user can use during a session. All ofthe z/OS Debugger variables begin with%, for example, %BLOCK or %CU.
debugging profileData that specifies a set of applicationprograms which are to be debuggedtogether.
defaultA value assumed for an omitted operandin a command. Contrast with initialsetting.
double-byte character set (DBCS)A set of characters in which eachcharacter is represented by two bytes.Languages such as Japanese, whichcontain more symbols than can berepresented by 256 code points, requiredouble-byte character sets. Because eachcharacter requires two bytes, the typing,displaying, and printing of DBCScharacters requires hardware andprograms that support these characters.
dynamicIn programming languages, pertaining toproperties that can only be establishedduring the execution of a program; for
584 IBM z/OS Debugger V14.1.9 User's Guide

example, the length of a variable-lengthdata object is dynamic. Contrast withstatic.
dynamic link library (DLL)A file containing executable code and databound to a program at load time or runtime. The code and data in a dynamiclink library can be shared by severalapplications simultaneously. See also loadmodule.
E
enclaveAn independent collection of routines inLanguage Environment, one of which isdesignated as the MAIN program. Theenclave contains at least one thread and isroughly analogous to a program orroutine. See also thread.
entry pointThe address or label of the firstinstruction executed on entering acomputer program, routine, or subroutine.A computer program can have a numberof different entry points, each perhapscorresponding to a different function orpurpose.
exceptionAn abnormal situation in the execution ofa program that typically results in analteration of its normal flow. See alsocondition.
executeTo cause a program, utility, or othermachine function to carry out theinstructions contained within. See alsorun.
execution timeSee run time.
execution-time environmentSee run-time environment.
expanded date fieldA COBOL date field containing anexpanded (four-digit) year. See also datefield and expanded year.
expanded yearIn COBOL, four digits representing ayear, including the century (for example,1998). Appears in expanded date fields.Compare with windowed year.
expressionA group of constants or variablesseparated by operators that yields a singlevalue. An expression can be arithmetic,relational, logical, or a character string.
eXtra Performance LINKage (XPLINK)A new call linkage between functions thathas the potential for a significantperformance increase when used in anenvironment of frequent calls betweensmall functions. XPLINK makessubroutine calls more efficient byremoving nonessential instructions fromthe main path. When all functions arecompiled with the XPLINK option,pointers can be used without restriction,which makes it easier to port newapplications to z/OS.
F
file A named set of records stored orprocessed as a unit. An element includedin a container: for example, an MVSmember or a partitioned data set. See alsodata set.
frequency countA count of the number of timesstatements in the currently qualifiedprogram unit have been run.
full-screen modeAn interface mode for use with anonprogrammable terminal that displaysa variety of information about theprogram you are debugging.
H
high level language (HLL)A programming language such as C,COBOL, or PL/I.
HLL See high level language.
hook An instruction inserted into a program bya compiler when you specify the TESTcompile option. Using a hook, you can setbreakpoints to instruct z/OS Debugger togain control of the program at selectedpoints during its execution.
I
inactive blockA block that is not currently executing, oris not in the CALL chain leading to theactive block. See also active block, block.
Glossary 585

index A computer storage position or register,the contents of which identify a particularelement in a table.
initial settingA value in effect when the user's z/OSDebugger session begins. Contrast withdefault.
interactivePertaining to a program or system thatalternately accepts input and thenresponds. An interactive system isconversational; that is, a continuousdialog exists between the user and thesystem. Contrast with batch.
I/O Input/output.
L
Language EnvironmentAn IBM software product that provides acommon run-time environment andcommon run-time services for IBM highlevel language compilers.
library routineA routine maintained in a programlibrary.
line modeAn interface mode for use with anonprogrammable terminal that uses asingle command line to accept z/OSDebugger commands.
line wrapThe function that automatically moves thedisplay of a character string (separatedfrom the rest of a line by a blank) to anew line if it would otherwise overrunthe right margin setting.
link-editTo create a loadable computer programusing a linkage editor.
linkage editorA program that resolves cross-referencesbetween separately compiled objectmodules and then assigns final addressesto create a single relocatable load module.
listing A printout that lists the source languagestatements of a program with allpreprocessor statements, includes, andmacros expanded.
load moduleA program in a form suitable for loading
into main storage for execution. In thisdocument this term is also used to referto a Dynamic Load Library (DLL).
logical windowA group of related debugging information(for example, variables) that is formattedso that it can be displayed in a physicalwindow.
M
minor nodeIn VTAM, a uniquely defined resourcewithin a major node.
multitaskingA mode of operation that provides forconcurrent performance, or interleavedexecution of two or more tasks.
N
network identifierIn TCP/IP, that part of the IP address thatdefines a network. The length of thenetwork ID depends on the type ofnetwork class (A, B, or C).
nonconversationalA transaction type that accepts input,performs a task, and then ends.
nondateA COBOL data item that can be any ofthe following:v A data item whose date description
entry does not include the DATEFORMAT clause
v A literalv A reference modification of a date fieldv The result of certain arithmetic
operations that may include date fieldoperands; for example, the differencebetween two compatible date fields.
The value of a nondate may or may notrepresent a date.
O
OptionsA choice that lets the user customizeobjects or parts of objects in anapplication.
offset The number of measuring units from anarbitrary starting point to some otherpoint.
586 IBM z/OS Debugger V14.1.9 User's Guide

P
panel In z/OS Debugger, an area of the screenused to display a specific type ofinformation.
parameterData passed between programs orprocedures.
partitioned data set (PDS)A data set in direct access storage that isdivided into partitions, called members,each of which can contain a program, partof a program, or data.
path pointA point in the program where control isabout to be transferred to another locationor a point in the program where controlhas just been given.
PDS See partitioned data set.
physical windowA section of the screen dedicated to thedisplay of one of the four logicalwindows: Monitor window, Sourcewindow, Log window, or Memorywindow.
prefix areaThe eight columns to the left of theprogram source or listing containing linenumbers. Statement breakpoints can beset in the prefix area.
primary entry pointSee entry point.
procedureIn a programming language, a block, withor without formal parameters, whoseexecution is invoked by means of aprocedure call. A set of related controlstatements. For example, an MVS CLIST.
processThe highest level of the LanguageEnvironment program managementmodel. It is a collection of resources, bothprogram code and data, and consists of atleast one enclave.
ProfileA choice that allows the user to changesome characteristics of the workingenvironment, such as the pace ofstatement execution in the z/OSDebugger.
programA sequence of instructions suitable forprocessing by a computer. Processing caninclude the use of an assembler, acompiler, an interpreter, or a translator toprepare the program for execution, aswell as to execute it.
program unitSee compile unit.
program variableA predefined variable that exists whenz/OS Debugger was invoked.
pseudo-conversational transactionThe result of a technique in CICS calledpseudo-conversational processing inwhich a series of nonconversationaltransactions gives the appearance (to theuser) of a single conversationaltransaction. See conversational andnonconversational.
Q
qualificationA method used to specify to whatprocedure or load module a particularvariable name, function name, label, orstatement id belongs. The SET QUALIFYcommand changes the current implicitqualification.
R
record A group of related data, words, or fieldstreated as a unit, such as one name,address, and telephone number.
record formatThe definition of how data is structuredin the records contained in a file. Thedefinition includes record name, fieldnames, and field descriptions, such aslength and data type. The record formatsused in a file are contained in the filedescription.
referenceIn programming languages, a languageconstruct designating a declared languageobject. A subset of an expression thatresolves to an area of storage; that is, apossible target of an assignmentstatement. It can be any of the following:a variable, an array or array element, or a
Glossary 587

structure or structure element. Any of theabove can be pointer-qualified whereapplicable.
run To cause a program, utility, or othermachine function to execute. An actionthat causes a program to begin executionand continue until a run-time exceptionoccurs. If a run-time exception occurs, theuser can use z/OS Debugger to analyzethe problem. A choice the user can maketo start or resume regular execution of aprogram.
run timeAny instant when a program is beingexecuted.
run-time environmentA set of resources that are used tosupport the execution of a program.
run unitA group of one or more object programsthat are run together.
S
SBCS See single-byte character set.
semantic errorAn error in the implementation of aprogram's specifications. The semantics ofa program refer to the meaning of aprogram. Unlike syntax errors, semanticerrors (since they are deviations from aprogram's specifications) can be detectedonly at run time. Contrast with syntaxerror.
sequence numberA number that identifies the recordswithin an MVS file.
session variableA variable the user declares during thez/OS Debugger session by usingDeclarations.
single-byte character set (SBCS)A character set in which each character isrepresented by a one-byte code.
Single Point of ControlThe control interface that sendscommands to one or more members of anIMSplex and receives commandresponses.
source The HLL statements in a file that makeup a program.
Source windowA z/OS Debugger window that contains adisplay of either the source code or thelisting of the program being debugged.
SPOC See Single Point of Control.
statementAn instruction in a program or procedure.
In programming languages, a languageconstruct that represents a step in asequence of actions or a set ofdeclarations.
static In programming languages, pertaining toproperties that can be established beforeexecution of a program; for example, thelength of a fixed-length variable is static.Contrast with dynamic.
step One statement in a computer routine. Tocause a computer to execute one or morestatements. A choice the user can make toexecute one or more statements in theapplication being debugged.
storageA unit into which recorded text can beentered, in which it can be retained, andfrom which it can be retrieved. The actionof placing data into a storage device. Astorage device.
subroutineA sequenced set of instructions orstatements that can be used in one ormore computer programs at one or morepoints in a computer program.
suffix areaA variable-sized column to the right ofthe program source or listing statements,containing frequency counts for the firststatement or verb on each line. z/OSDebugger optionally displays the suffixarea in the Source window. See also prefixarea.
syntactic analysisAn analysis of a program done by acompiler to determine the structure of theprogram and the construction of itssource statements to determine whether itis valid for a given programminglanguage. See also syntax checker, syntaxerror.
syntax The rules governing the structure of aprogramming language and the
588 IBM z/OS Debugger V14.1.9 User's Guide
construction of a statement in aprogramming language.
syntax errorAny deviation from the grammar (rules)of a given programming languageappearing when a compiler performs asyntactic analysis of a source program.See also syntactic analysis.
T
session variableSee session variable.
thread The basic line of execution within theLanguage Environment program model. Itis dispatched with its own instructioncounter and registers by the system.Threads can execute, concurrently withother threads. The thread is where actualcode resides. It is synonymous with aCICS transaction or task. See also enclave.
thread idA small positive number assigned byz/OS Debugger to a LanguageEnvironment task.
token A character string in a specific format thathas some defined significance in aprogramming language.
trigraphA group of three characters which, takentogether, are equivalent to a single specialcharacter. For example, ??) and ??( areequivalent to the left (<) and right (>)brackets.
U
utility A computer program in general supportof computer processes; for example, adiagnostic program, a trace program, or asort program.
V
variableA name used to represent a data itemwhose value can be changed while theprogram is running.
VTAMSee Virtual Telecommunications AccessMethod.
Virtual Telecommunications Access Method(VTAM)
IBM software that controls
communication and the flow of data in anSNA network by providing the SNAapplication programming interfaces andSNA networking functions. An SNAnetwork includes subarea networking,Advanced Peer-to-Peer Networking(APPN), and High-Performance Routing(HPR). Beginning with Release 5 of theOS/390 operating system, the VTAM forMVS/ESA function was included inCommunications Server for OS/390; thisfunction is called Communications Serverfor OS/390 - SNA Services.
An access method commonly used byMVS to communicate with terminals andother communications devices.
W
windowed date fieldA COBOL date field containing awindowed (two-digit) year. See also datefield and windowed year.
windowed yearIn COBOL, two digits representing a yearwithin a century window (for example,98). Appears in windowed date fields. Seealso century window (COBOL).
Compare with expanded year.
word wrapSee line wrap.
X
XPLINKSee eXtra Performance LINKage(XPLINK).
Glossary 589

590 IBM z/OS Debugger V14.1.9 User's Guide

Bibliography
IBM z/OS Debugger publicationsUsing CODE/370 wih VS COBOL II and OS PL/I, SC09-1862
IBM z/OS Debugger
You can access the IBM z/OS Debugger publications by visiting the followinglibrary pages:v IBM Debug for z Systems library page: http://www-01.ibm.com/support/
docview.wss?uid=swg27050482v IBM Developer for z Systems library page: http://www.ibm.com/support/
docview.wss?uid=swg27048563v IBM Z Open Development library page: https://www-01.ibm.com/support/
docview.wss?uid=ibm10738975v IBM Z Open Unit Test library page: https://www-01.ibm.com/support/
docview.wss?uid=ibm10787531IBM z/OS Debugger User's Guide, SC27-4642IBM z/OS Debugger Reference and Messages, SC27-4644IBM z/OS Debugger Reference Summary , SC27-4643IBM z/OS Debugger API User's Guide and Reference, SC27-4647IBM z/OS Debugger Customization Guide, SC27-4645Program Directory for IBM z/OS Debugger, GI13-4540COBOL and CICS Command Level Conversion Aid for OS/390 & MVS & VM:User's Guide, SC26-9400Program Directory for IBM COBOL and CICS Command Level Conversion Aid forOS/390 & MVS & VM, GI10-5080Japanese Program Directory for IBM COBOL and CICS Command Level ConversionAid for OS/390 & MVS & VM, GI10-6976Program Directory for IBM Application Delivery Foundation for z Systems CommonComponents, GI10-8969IBM Application Delivery Foundation for z Systems Common ComponentsCustomization Guide and User Guide, SC27-9050
High level language publicationsz/OS C and C++
Compiler and Run-Time Migration Guide, GC09-4913Curses, SA22-7820Language Reference, SC09-4815Programming Guide, SC09-4765Run-Time Library Reference, SA22-7821User's Guide, SC09-4767
© Copyright IBM Corp. 1992, 2019 591

Enterprise COBOL for z/OS, Version 6Customization Guide, SC27-8712Language Reference, SC27-8713Programming Guide, SC27-8714Migration Guide, GC27-8715Program directory, GI11-9180Licensed Program Specifications, GI13-4532
Enterprise COBOL for z/OS, Version 5Customization Guide, SC14-7380Language Reference, SC14-7381Programming Guide, SC14-7382Migration Guide, GC14-7383Program directory, GI11-9180Licensed Program Specifications, GI11-9181
Enterprise COBOL for z/OS, Version 4Compiler and Runtime Migration Guide, GC23-8527Customization Guide, SC23-8526Licensed Program Specifications, GI11-7871Language Reference, SC23-8528Programming Guide, SC23-8529
Enterprise COBOL for z/OS and OS/390, Version 3Migration Guide, GC27-1409Customization, GC27-1410Licensed Program Specifications, GC27-1411Language Reference, SC27-1408Programming Guide, SC27-1412
COBOL for OS/390 & VMCompiler and Run-Time Migration Guide, GC26-4764Customization under OS/390, GC26-9045Language Reference, SC26-9046Programming Guide, SC26-9049
Enterprise PL/I for z/OS, Version 5Language Reference, SC27-8940Licensed Program Specifications, GC27-4621Messages and Codes, GC27-8950Compiler and Run-Time Migration Guide, GC27-8930Programming Guide, GI13-4536
Enterprise PL/I for z/OS, Version 4Language Reference, SC14-7285Licensed Program Specifications, GC14-7283Messages and Codes, GC14-7286
592 IBM z/OS Debugger V14.1.9 User's Guide

Compiler and Run-Time Migration Guide, GC14-7284Programming Guide, GI11-9145
Enterprise PL/I for z/OS and OS/390, Version 3Diagnosis, SC27-1459Language Reference, SC27-1460Licensed Program Specifications, GC27-1456Messages and Codes, SC27-1461Migration Guide, GC27-1458Programming Guide, SC27-1457
VisualAge PL/I for OS/390Compiler and Run-Time Migration Guide, SC26-9474Diagnosis Guide, SC26-9475Language Reference, SC26-9476Licensed Program Specifications, GC26-9471Messages and Codes, SC26-9478Programming Guide, SC26-9473
PL/I for MVS & PMCompile-Time Messages and Codes, SC26-3229Compiler and Run-Time Migration Guide, SC26-3118Diagnosis Guide, SC26-3149Installation and Customization under MVS, SC26-3119Language Reference, SC26-3114Licensed Program Specifications, GC26-3116Programming Guide, SC26-3113Reference summary, SX26-3821
Related publicationsCICS
Application Programming Guide, SC34-6231Application Programming Primer, SC34-0674Application Programming Reference, SC34-6232
DB2 Universal Database™ for z/OSAdministration Guide, SC18-7413Application Programming and SQL Guide, SC18-7415Command Reference, SC18-7416Data Sharing: Planning and Administration, SC18-7417Installation Guide, GC18-7418Messages and Codes, GC18-7422Reference for Remote RDRA* Requesters and Servers, SC18-7424Release Planning Guide, SC18-7425SQL Reference, SC18-7426Utility Guide and Reference, SC18-7427
Bibliography 593

IMSIMS Application Programming: Database Manager, SC27-1286IMS Application Programming: EXEC DLI Commands for CICS & IMS, SC27-1288IMS Application Programming: Transaction Manager, SC27-1289
TSO/ECommand Reference, SA22-7782Programming Guide, SA22-7788System Programming Command Reference, SA22-7793User's Guide, SA22-7794
z/OSMVS JCL Reference, SA22-7597MVS JCL User's Guide, SA22-7598MVS System commands, SA22-7627
z/OS Language EnvironmentConcepts Guide, SA22-7567Customization, SA22-7564Debugging Guide, GA22-7560Programming Guide, SA22-7561Programming Reference, SA22-7562Run-Time Migration Guide, GA22-7565Vendor Interfaces, SA22-7568Writing Interlanguage Communication Applications, SA22-7563
594 IBM z/OS Debugger V14.1.9 User's Guide

Index
Special characters__ctest() function 139./E, BTS Environment command 110.mdbg
how z/OS Debugger locates 457.mdbg file 446.mdbg file, how to create 42, 47%CONDITION variable
for PL/I 313%PATHCODE variable
for C and C++ 326for PL/I 312values for COBOL 297
&PGMNAME 109&userid 559&USERID 109#pragma 45
specifying TEST compiler option 45specifying TEST run-time option
with 126
AABEND 4038 422abnormal end of application, setting
breakpoint at 413accessing PL/I program variables 315ALL suboption of TEST compiler option
(PL/I), effect of 40ALL, how Enterprise COBOL for z/OS,
Version 4, handles 35ALLOCATE command
managing file allocations 211allocating z/OS Debugger files
example of 146allocating z/OS Debugger load library
data setexample of 146
ALTER PROCEDURE statement, exampleof 87
applications 393Applid 94assembler
debugging a program in full-screenmode
displaying variable or storage 273finding storage overwrite
errors 275getting a function traceback 274modifying variables or
storage 273multiple CUs in single
assembly 271stopping at assembler routine
call 273stopping when condition is
true 274debugging non-reentrant 351defining CU as 270
assembler (continued)how z/OS Debugger locates
EQALANGX files 456loading debug data of 270QUERY LOCATION 273reappearing 271restrictions 352
assembler code using instructionsas data 355
detectable self-modifying 356non-detectable self-modifying 356non-Language Environment 354self-modifying 355while debugging MAIN
program 354with STORAGE run-time
option 354sample program for debugging 267self-modifying code, restrictions 361
assembler programloading debug information 347locating EQALANGX 347making assembler CUs known to
z/OS Debugger 348assembler programs
assembling, requirements 77requirements for debugging 77using z/OS Debugger Utilities to
assemble and create 79assembler, definition of xviiassembling your program, requirements
for 77assigning values to variables 295, 325AT commands
AT CALLbreakpoints, for C++ 343
AT ENTRYbreakpoints, for C++ 342
AT EXITbreakpoints, for C++ 342
attention interrupteffect of during Dynamic Debug 214effect of during interactive
sessions 214how to initiate 214required Language Environment
run-time options 214attributes of variables 416automatic saving and restoring of
settings, breakpoints, and monitorspecifications 197
automatic saving and restoring ofsettings, breakpoints, and monitorspecifications; disabling 198
available only with programs compiledwith
L prefix command 16M prefix command 16
Bbase address, how to specify for
MEMORY command 186base address, using in Memory
window 185batch mode 122
debugging DB2 programs in 367debugging IMS programs in 377description of 5for non-Language Environment
programs 147starting z/OS Debugger in 141using z/OS Debugger in 535
binder APIs 431blanks, significance of 290BLOCK suboption of TEST compiler
option (PL/I), effect of 40BLOCK, how Enterprise COBOL for
z/OS, Version 4, handles 35blocks and block identifiers
using, for C 336boundaries, setting for searches 183breakpoint
clearing 18implicit 122setting, introduction to 15skipping 18using DISABLE and ENABLE 18
breakpointsbefore calling a NULL function
in C 254in C++ 266
before calling an invalid program, inCOBOL 227
before calling an undefined program,in PL/I 243
halting if a condition is truein C 249in C++ 261in COBOL 222in LangX COBOL 233in PL/I 239
halting when certain COBOL routinesare called 220
halting when certain functions arecalled
in C 248in C++ 259in PL/I 238
halting when certain LangX COBOLroutines are called 232
placing in IMS programs 384recording, using SET
AUTOMONITOR 190setting a line 190setting, in C++ 342
breakpoints, setting in load modules thatare not loaded 190
breakpoints, setting in programs that arenot active 190
© Copyright IBM Corp. 1992, 2019 595

browse modeenabling and disabling 56introduction to 54list of commands not permitted 55remote debug mode
list of actions not permitted 56BTS Environment command (./E), when
to use 110
CC
compiling with c89 or c++ 67DEBUG compiler option, what it
controls 41debugging a program in full-screen
modecalling a C function from z/OS
Debugger 251capturing output to stdout 250debugging a DLL 252displaying raw storage 251displaying strings 251finding storage overwrite
errors 253finding uninitialized storage
errors 254getting a function traceback 252halting on line if condition
true 249halting when certain functions are
called 248modifying value of variable 249setting breakpoint to halt 254tracing run-time path for code
compiled with TEST 252when not all parts compiled with
TEST 250GONUMBER compiler option 44LP64 versus ILP32 43OPT(1) or OPT(2) compiler
options 44OPTIMIZE 43possible prerequisites 42, 43preparing, programs to debug 41sample program for debugging 245TEST compiler option, what it
controls 43user defined functions 43when to Dynamic Debug facility
with 42, 43C and C++
AT ENTRY/EXIT breakpoints 342blocks and block identifiers 336choosing between TEST and DEBUG
compiler option 41, 46commands
summary 323equivalents for Language
Environment conditions 330function calls for 328notes on using 288reserved keywords 329when to use FORMAT(DWARF) 41,
46
C/C++ file produced byDEBUG(FORMAT(DWARF)), how z/OSDebugger locates 456
C/C++ source files, how z/OS Debuggerlocates 456
C++AT CALL breakpoints 343DEBUG compiler option, what it
controls 47debugging a program in full-screen
modecalling a C++ function from z/OS
Debugger 263capturing output to stdout 262debugging a DLL 263displaying raw storage 263displaying strings 263finding storage overwrite
errors 265finding uninitialized storage
errors 265getting a function traceback 264halting on a line if condition
true 261modifying value of variable 260setting a breakpoint to halt 259,
266tracing the run-time path 264viewing and modifying data
members 261when not all parts compiled with
TEST 261examining objects 343GONUMBER compiler option 49LP64 versus ILP32 48OPT(1) or OPT(2) compiler
options 49OPTIMIZE 48overloaded operator 342possible prerequisites 47preparing, programs to debug 46sample program for debugging 255setting breakpoints 342stepping through C++ programs 342template in C++ 342TEST compiler option, what it
controls 48user defined functions 48using slashes to enter comments 291when to Dynamic Debug facility
with 48CADP
how to start z/OS Debuggerwith 153
how to use 101CAF (call access facility), using to start
DB2 program 368call access facility (CAF), using to start
DB2 program 368call_sub function, how to debug DB2
stored procedures invoked by 59capturing output to stdout
in C 250in C++ 262
CC...CC, Monitor prefix command 176CCCA 60CEE3CBTS 429
CEEBXITA 89description of how it works 109
CEEBXITA, comparing two methods oflinking 112
CEEBXITA, specifying message displaylevel in 111
CEEBXITA, specifying naming patternin 110
CEEROPT, usingfor IMS programs 105
CEETESTdescription 132examples, for C 134examples, for COBOL 136examples, for PL/I 137Starting z/OS Debugger with 131using 377
CEEUOPT runtime options module 83CEEUOPT to start z/OS Debugger under
CICS, using 154CEEUOPT, using
for IMS programs 105changing how Monitor window displays
values 200changing physical window layout in the
session panel 278changing the value of a variable,
introduction to 17character set 287characters, searching 182CICS
breakpoints, pattern-match 387CADP, how to use 101choosing a debugging mode for 52DPL 53DTCN profile, creating a 90DTCN profiles, displaying list of 93DTCN, fields on Advanced
Options 101DTCN, fields on Menu 2 99DTCN, fields on Primary Menu 94DTST transaction, description of
storage window 542DTST transaction, navigating through
DTST storage window 541DTST transaction, starting the 539DTST transaction, syntax of the 544DTST transaction, using to modify
storage 541list of general tasks to complete
for 89non-Language Environment programs,
passing runtime parameters to 102non-Language Environment programs,
starting z/OS Debugger for 102pseudo-conversational program 390region, reloading programs into an
active 555requirements for using z/OS
Debugger in 385restoring breakpoints 390restrictions for debugging 390saving breakpoints 390starting the log file 391starting z/OS Debugger under 151WAIT option 53
596 IBM z/OS Debugger V14.1.9 User's Guide

CICS debuggingRLIM processing 391
closing automonitor section of Monitorwindow 204
closing z/OS Debugger physicalwindows 279
COBOL 217CCCA 60command format 293debugging a program in full-screen
modecapturing I/O to system
console 223displaying raw storage 224finding storage overwrite
errors 226generating a run-time paragraph
trace 225modifying the value of a
variable 221setting a breakpoint to halt 220setting breakpoint to halt 227stopping on line if condition
true 222tracing the run-time path 224when not all parts compiled with
TEST 222, 234debugging COBOL classes 303debugging VS COBOL II
programs 304finding listing 305
EJPD suboption 28Enterprise, L prefix command only
available with 16Enterprise, M prefix command only
available with 16FACTORY 304how z/OS Debugger locates separate
debug file 455list of effect of ALL compiler
option 35list of effect of BLOCK compiler
option 35list of effect of NOSYM compiler
option 33list of effect of NOTEST compiler
option 32list of effect of PATH compiler
option 34list of effect of STMT compiler
option 34Load Module Analyzer 60non-Language Environment, QUERY
LOCATION 233NONE and NOHOOK with optimized
programs 32note on using H constant 291notes on using 288OBJECT 304OPT compiler option 28optimized programs, debugging 400paragraph names, finding 184paragraph trace, generating a COBOL
run-time 225possible prerequisites 30QUERY LOCATION 221reserved keywords 294
COBOL (continued)RESIDENT compiler option 31restrictions on accessing, data 195run-time options 125sample program for debugging 217,
229SOURCE compiler option 31TEST compiler option, what
suboptions to specify 27variables, using with z/OS
Debugger 295when to Dynamic Debug facility
with 28why you need to specify SYM 30Working-Storage Section,
displaying 202COBOL listing, data set 443COBOL, reusable runtime
environments 405coexistence of z/OS Debugger with other
debuggers 418coexistence with unsupported HLL
modules 418colors
changing in session panel 280columnar format, displaying value in
Monitor window in 208command
syntax diagrams xviiicommand format
for COBOL 293command line, z/OS Debugger 173Command pop-up window, changing size
of 168command sequencing, full-screen
mode 174commands
abbreviating 288DTSU, using to debug DB2
program 368for C and C++, z/OS Debugger
subset 323for PL/I, z/OS Debugger subset 311getting online help for 292interpretive subset
description 410multiline 289PLAYBACK 19prefix, using in z/OS Debugger 175truncating 288TSO, using to debug DB2
program 368commands (system), entering in z/OS
Debugger 175commands file 122, 447
example of specifying 141using log file as 189using session log as 123
Commands Filein DTCN, description of 99
commands file, how to create a 186commands, z/OS Debugger
COBOL compiler options ineffect 294
entering on the session panel 171entering using program function
keys 177
commands, z/OS Debugger (continued)order of processing 174retrieving with RETRIEVE
command 178that resemble COBOL statements 293
COMMANDSDSN, EQAOPTScommand 187, 447
Commarea data 101Commarea offset 101comments, inserting into command
stream 291Common pop-up window, how to enter
commands in 179compile unit 173
general description 411name area, z/OS Debugger 173qualification of, for C and C++ 339
compile units known to z/OS Debugger,displaying list of 213
compiler optionsCOBOL 27how to choose, for PL/I 36suggested 26which options to use for COBOL 28
compilinga C program on an HFS or zFS file
system 67a C++ program on an HFS or zFS file
system 68an OS/VS COBOL program 60Enterprise PL/I program on HFS or
zFS file system 66programs, introduction to 11
conditionhandling of 313, 414Language Environment, C and C++
equivalents 330considerations
when using the TEST run-timeoption 121
constantsentering 291HLL 410PL/I 317using in expressions, for COBOL 300z/OS Debugger interpretation of
HLL 410constructor, stepping through 342Container data 101Container name 101Container offset 101continuation character 174
for COBOL 293using in full-screen 289
continuing lines 289continuous display 201copying
JCL into a setup file using DTSU 128CREATE PROCEDURE statement,
example of 86creating
setup file using z/OS DebuggerUtilities 127
CRTE 53CSECT, debugging multiple, in one
assembly 272
Index 597

CSECT, loading multiple, in oneassembly 272
CU(s) 94CURSOR command
using 179, 180cursor commands
CLOSE 279CURSOR 180FIND 182OPEN 279SCROLL 164, 180SIZE 279using in z/OS Debugger 177WINDOW ZOOM 280
customer support 575customizing
PF keys 277Profile panel 121profile settings 282session settings 277
CWI, Language Environment 429
Ddata only modules, debugging 432DATA parameter
restrictions on accessing COBOLdata 195
data setsCOBOL listing 443PL/I listing 445PL/I source 444separate debug file 445specifying 188used by z/OS Debugger 443
data type of variable, displaying inMonitor window the 203
DB2assembling with assembler
programs 82compiling with C or C++
programs 82compiling with COBOL programs 81compiling with PL/I programs 81DB2 programs for debugging 81linking programs 83using z/OS Debugger with 367
DB2 programswhat files to keep 81
DB2 programs, binding 84DB2 stored procedures
compiling or assembling options touse 86
debugging modes supported 85NUMTCB 85restrictions 131specifying TEST runtime options
through EQAD3CXT 86starting z/OS Debugger from 157using z/OS Debugger with 371what to do before debugging 85
DBCSusing with C 288using with COBOL 297using with z/OS Debugger
commands 287
DEBUG and TEST compiler option,choosing between 41, 46
DEBUG compiler options 42, 47debug mode
delay 435, 438debug session
ending 214recording 166starting 155starting your program 155
debuggers, coexistence with other 418debugging
CICS programs 385CICS programs, choosing mode 52COBOL classes 303DB2 programs 367DB2 stored procedures 371DLL
in C 252in C++ 263
IMS programs, choosing mode 54in full-screen mode 161ISPF applications 393multithreading programs 419non-Language Environment
programs 405UNIX System Services programs 403
debugging profileshow to create one with DTCN 91
declared data type, displaying charactersin their 207
declared data type, modifying charactersthat cannot be displayed in their 207
declaring session variablesfor C 326for COBOL 299
deferred, description of 271deferring an LDD command 232DESCRIBE ALLOCATIONS command
managing file allocations 211DESCRIBE command
using 338description of how z/OS Debugger
locates CICS tasks to debug 152destructor, stepping through 342diagnostics, expression, for C and
C++ 331DISABLE command 388disassembly
changing program in disassemblyview 362
differences between SET ASSEMBLERand SET DISASSEMBLY 347, 359
displaying registers 362displaying storage 362modifying registers 362modifying storage 362performing single-step
operations 361restrictions on what you can
debug 363self-modifying code, restrictions 361setting breakpoints 361what you can do is disassembly
view 359disassembly view, description of 360disassembly view, how to start 360
Display Id 94in DTCN, description of 98
displayingenvironment information 338halted location 185lines at top of window, z/OS
Debugger 182raw storage
in C 251in C++ 263in COBOL 224in PL/I 240
source or listing file in full-screenmode 170
stringsin C 251in C++ 263
value of variable one time 200values of COBOL variables 296variable value 200variables or storage
in LangX COBOL 233displaying list of known compile
units 213displaying prefixes 432displaying the value of a variable,
introduction to 15displaying variable value 200displaying Working-Storage Section 202DLL debugging
in C 252in C++ 263
documents, licensed xiiiDOWN, SCROLL command 180DTCN
creating a profile 90data entry verification 93defining COMMAREA 92description of 151description of columns 94description of Session Type 98do not link to EQADCCXT with
particular COBOL compilers 89do not link to EQADCCXT with
particular PL/I compilers 89migrating from versions earlier than
V10 96modifying Language Environment
options 100using repository profile items 153
DTCN Profiles 557, 560DTCNFORCEFORCEIP, how Transaction
Id in DTCN works with 98DTCNFORCELOADMODID, how
Transaction Id in DTCN workswith 97
DTCNFORCENETNAME, howTransaction Id in DTCN workswith 98
DTCNFORCETERMID, how Terminal Idin DTCN works with 95
DTCNFORCETRANID, how TransactionId in DTCN works with 95
DTCNFORCEUSERID, how TransactionId in DTCN works with 97
DTNP 555DTSC 53
598 IBM z/OS Debugger V14.1.9 User's Guide
DTSP Profile 557, 560DTST
syntax of 544DTST transaction
description of storage window 542modifying storage after starting 541navigating through storage
window 541starting the 539syntax of the 544
DWARF suboption of FORMAT compileroption, when to use 41, 46
Dynamic Debugattention interrupts, support for 214
Dynamic Debug facility, how itworks 51
Eediting
setup file using z/OS Debugger SetupUtility 128
elements, unsupported, for PL/I 320ENABLE command 388enclave
multiple, debugging interlanguagecommunication application in 427
non-Language Environment 131starting 421
endingdebug session 214z/OS Debugger within multiple
enclaves 422English, specifying 10English, specifying uppercase 10entering
commands on session panel 171file allocation statements into setup
file 128program parameters into setup
file 128runtime option into setup file 128
entering long command with Commandpop-up window 179
entering multiline commands withoutcontinuation 290
entering PL/I statements, freeform 314Enterprise COBOL
compiler options to use 74Enterprise PL/I
restrictions 321Enterprise PL/I, definition of xviiiENU 10EQAD3CXT
comparing DB2 RUNOPTS to 109EQADCCXT 89EQADCCXT user exit 123EQADEBUG DD statement 171EQALANGX
creating for LangX COBOL 74EQALANGX file 444
how to create 78EQALANGX files, how z/OS Debugger
locates 451, 452, 456EQALMPFX 551EQALMPRM 552EQALOAD 431
EQANMDBGexample 150methods for starting z/OS Debugger
with 147passing parameters to 148, 149
using only EQANMDBG DDstatement 149
using only PARM 148EQAOPTS file, format options 447EQAOPTS file, where to specify, in
DTCN 100EQASET 378
when to run 110EQASTART, entering command 10EQASYSPF 551EQAUEDAT user exit 171EQAUOPT
how to create with IBM z/OSDebugger Utilities 117
how to create with TIM 115EQAWLMA 547EQUATE, SET command
description 278error numbers in Log window 213evaluating expressions
COBOL 299HLL 409
evaluation of expressionsC and C++ 331
examining C++ objects 343examples
assemblersample program for
debugging 267C
sample program fordebugging 245
C and C++assigning values to variables 325blocks and block identifiers 338expression evaluation 328monitoring and modifying
registers and storage 345referencing variables and setting
breakpoints 337scope and visibility of objects 337
C++displaying attributes 343sample program for
debugging 255setting breakpoints 343
CEETEST calls, for PL/I 137CEETEST function calls, for C 134CEETEST function calls, for
COBOL 136changing point of view, general 413COBOL
%HEX function 301%STORAGE function 301assigning values to COBOL
variables 295changing point of view 303displaying results of expression
evaluation 300displaying values of COBOL
variables 296qualifying variables 302
examples (continued)COBOL (continued)
sample program fordebugging 217
using constants inexpressions 301
declaring variables, for COBOL 299displaying program variables 325modifying setup files by using IBM
z/OS Debugger Utilities 459OS/VS COBOL
sample program fordebugging 229
PL/Iin PL/I 238sample program for
debugging 235PLITEST calls for PL/I 139preparing programs by using IBM
z/OS Debugger Utilities 459remote debug mode 125specifying TEST run-time option with
#pragma 126TEST run-time option 124using #pragma for TEST compiler
option 45using constants 291using continuation characters 289using qualification 339
exception handling for C and C++ andPL/I 415
excluding programs 434EXEC CICS RETURN
under CICS 389explicit debug mode 433expressions
diagnostics, for C and C++ 331displaying values, for C and
C++ 325displaying values, for COBOL 300evaluation for C and C++ 327, 331evaluation for COBOL 299evaluation of HLL 409evaluation, operators and operands
for C 330for PL/I 317using constants in, for COBOL 300
Ffeedback codes, when to use 134FIND command
using with windows 182FIND command, setting boundaries
with 183finding
characters or strings 182storage overwrite errors
in assembler 275in C 253in C++ 265in COBOL 226in LangX COBOL 234in PL/I 242
uninitialized storage errorsin C 254in C++ 265
Index 599

finding COBOL paragraph names,example of 184
fixes, getting 574FREE command
managing file allocations 211freeform input, PL/I statements 314full-screen mode
CICS, additional terminals 52continuation character, using in 289CURSOR 177CURSOR command 180debugging in 161description of 5example screen 13introduction to 11PANEL COLORS 280PANEL LAYOUT 278PANEL PROFILE 282SCROLL 180which why type of programs to
use 52WINDOW CLOSE 279WINDOW OPEN 279WINDOW SIZE 279WINDOW ZOOM 280
full-screen mode using the TerminalInterface Manager
description of 5starting a debugging session 143
function calls, for C and C++ 328function, calling C and C++ from z/OS
DebuggerC 251C++ 263
function, unsupported for PL/I 320functions
PL/I 318functions, z/OS Debugger
%HEXusing with COBOL 301
%STORAGEusing with COBOL 301
using with COBOL 301
Gglobal data 344global preferences file 446global scope operator 344GPFDSN, EQAOPTS command 446
HH constant (COBOL) 291halted location, displaying 185header fields, z/OS Debugger session
panel 163help, online
for command syntax 292hexadecimal format, displaying values
in 208hexadecimal format, how to display
value of variable 208hexadecimal format, how to monitor
value of variable 209
hexadecimal format, monitoring valuesin 209
HFS or zFS, compiling a C programon 67
HFS or zFS, compiling a C++ programon 68
HFS or zFS, compiling Enterprise PL/Iprogram on 66
highlighting, changing in z/OS Debuggersession panel 280
history area of Memory window 185history, z/OS Debugger command 178
retrieving previous commands 178hooks
compiling with 50compiling with, PL/I 35compiling without, COBOL 51removing from application 397, 399rules for placing in C programs 45,
46rules for placing in C++ programs 50
how to choose 42, 47
II/O, COBOL
capturing to system console 223IBM Knowledge Center, searching for
problem resolution 573IBM Support Assistant, searching for
problem resolution 573IBM z/OS Debugger Utilities
brief description of Load ModuleAnalyzer 8
brief description on preparingassembler 7
creating and managing setup files 8creating setup file for IMS
program 382, 537Delay Debug Profile 9how to start 10IMS Transaction and User ID Cross
Reference Table 9instructions for compiling or
assembling 460list of all utilities in 7managing debugging profiles 8Non-CICS Debug Session Start and
Stop Message Viewer 9overview of IMS BTS Debugging 9overview of IMS program preparation
tasks 8overview of JCL file conversion 9overview of JCL for Batch
Debugging 8overview of Job Cards 7overview of program preparation
tasks 7IBM z/OS Debugger Utilities, general
instructions on how to use 65ignoring programs 433improving performance in multi-enclave
environments 200improving z/OS Debugger
performance 397IMS
choosing a debugging mode for 54
IMS (continued)choosing method to specify TEST
runtime options 105JCL, sample doing replace link edit of
CEEBXITA into CEEBINIT 107making a user exit
application-specific 106making a user exit available
installation-wide 106making a user exit available
region-wide 106programs, debugging
interactively 377transaction isolation 373, 376
IMS MPPdebugging 377preparing to debug 378
INCLUDE files, how to automonitorvariables in, while in remote debugmode 36
INCLUDE files, how to debug PL/I 36information, displaying
environmental 338initial programs, non-Language
Environment 405CICS assembler 406non-Language Environment
COBOL 406input areas, order of processing, z/OS
Debugger 174INSPLOG
creating the log file 188example of using 147
INSPPREFexample of using 147
INSPSAFEexample of using 147
instructions on how to compile aprogram with IBM z/OS DebuggerUtilities 65
interfacesbatch mode 5full-screen mode 5full-screen mode using the Terminal
Interface Manager 5remote debug mode 6
interfaces, description of 4interLanguage communication (ILC)
application, debugging 427interlanguage programs, using with z/OS
Debugger 415Internet
searching for problem resolution 573interpretive subset
general description 410of C and C++ commands 323of COBOL statements 293of PL/I commands 311
INTERRUPT, Language Environmentrun-time option 214
IP Name/Addr 94IP Name/Address
in DTCN, description of 98IPv6 format (TCP/IP) 380ISPF
starting 175
600 IBM z/OS Debugger V14.1.9 User's Guide

JJapanese, specifying 10Java 429JCL sample, linking CEEBXITA into your
program 113JCL sample, runs z/OS Debugger in
batch mode 141JCL to create EQALANGX file 78JCL, list of changes to make to 63JNI 429JPN 10
Kkeywords, abbreviating 288knowledge bases, searching for problem
resolution 573KOR 10Korean, specifying 10
LLanguage Environment
conditions, C and C++equivalents 330
EQADCCXT user exit 123runtime options, precedence 123user exit, link, into private copy of
Language Environment runtimemodule 113
user exit, link, into yourprogram 113
user exits, how to prepare 110user exits, methods to modify sample
assembler 110Language Environment user exit, create
and manage data set used by 114language, specifying national 10LangX COBOL
%PATHCODE values 310debugging a program in full-screen
modedisplaying raw storage 233finding storage overwrite
errors 234setting a breakpoint to halt 232stopping on line if condition
true 233when not all parts compiled with
TEST 234how to prepare a 73loading debug information for 307session panel's appearance 308
LDD command, example 347LEFT, SCROLL command 180licensed documents xiiiline breakpoint, setting 190line continuation
for C 289for COBOL 290
link-edit assembler programhow to, by using z/OS Debugger
Utilities 80linking
DB2 programs 83EQADCCXT 89
LIST %HEX command 208LIST command
use to display value of variable onetime 201
LIST commandsLIST STORAGE
using with PL/I 314List pop-up window, description of 169listing
find, OS PL/I 320find, VS COBOL II 305
listing files, how z/OS Debuggerlocates 451, 452, 454
literal constants, entering 291LLA 431Load Module Analyzer 60, 547LoadMod::>CU(s)
in DTCN, description of 95LoadMod(s) 94LOCATION, description of 163log file 188, 447
creating 188using 188using as a commands file 189
log file, saving automonitor sectionto 205
Log windowdescription 166error numbers in 213retrieving lines from 178
log, session 123LOGDSN, EQAOPTS command 188, 448LOGDSNALLOC, EQAOPTS
command 188low-level debugging 344
MMAIN DB2 stored procedures 85managing file allocations 211manual restoring of settings, breakpoints,
and monitor specifications 199mdbg
how z/OS Debugger locates 457mdbg file 446MDBG, EQAOPTS command 42, 47, 48memory
displaying, introduction to 17MEMORY command, using 211Memory window
description of 167displaying with base address 211history area, navigating with 185opening an empty 185
Memory window, addresses that spantwo columns 186
Memory window, entering multiplecommands in 176
message display level, how to specify, inLanguage Environment user exit 111
modifyingvalue of variable by typing over 210value of variable by using
command 209modifying value of a C variable 249
MONITOR commandviewing output from, z/OS
Debugger 165MONITOR LIST command, using to
monitor variables 201MONITOR LIST TITLED WSS 202Monitor window
description 165opening and closing 210, 279
Monitor window, adding variablesto 204
Monitor window, replacing variablesin 203
monitoring 201monitoring storage in C++ 344more than one language, debugging
programs with 415moving around windows in z/OS
Debugger 179moving the cursor, z/OS Debugger 180moving to new level of Language
Environment 114multilanguage programs, using with
z/OS Debugger 415multiline commands
continuation character, using in 289without continuation character 290
multiple commands, entering in Memorywindow 176
multiple enclavesending z/OS Debugger 422interlanguage communication
application, debugging 427starting 421
multithreading 419restrictions 419
MVSstarting z/OS Debugger using TEST
run-time option 155MVS POSIX programs, debugging 403MVS, starting z/OS Debugger
under 145
Nname (default) of data set that saves
settings, breakpoints, and monitorsspecifications 197
NAMES 431NAMES command 435
using EQAOPTS 435NAMES EXCLUDE 434naming conflicts 431naming pattern, how to specify, in
Language Environment user exit 111national language, specifying 10NATLANG parameter 10navigating session panel windows 179Netname 94NetName
in DTCN, description of 97NOHOOK suboption of TEST compiler
option (PL/I), effect of 39NOMACGEN 351non-Language Environment
CICSpassing runtime parameters 102
Index 601

non-Language Environment (continued)CICS (continued)
Starting z/OS Debugger 102defining as 231how z/OS Debugger locates
EQALANGX files 456loading debug information 231restrictions 310
non-Language Environment initialprograms 405
CICS assembler 406non-Language Environment
COBOL 406non-Language Environment programs
debugging 405starting z/OS Debugger 147
non-reentrantbreakpoints 352debugging, assembler 351variables 352
NONE suboption of TEST compileroption (PL/I), effect of 39
NOSYM suboption of TEST compileroption (C), effect of 45
NOSYM suboption of TEST compileroption (PL/I), effect of 40
NOTEST compiler option (C), effectof 44
NOTEST compiler option (C++), effectof 49
NOTEST compiler option (PL/I), effectof 39
NOTEST suboption of TEST run-timeoption 121
NUMTCB 85
Oobjects
C and C++, scope of 334opening Memory window with base
address 211opening z/OS Debugger physical
windows 279operators and operands for C 330OPT
C compiler option 44C++ compiler option 49COBOL compiler option 28
OPTIMIZE, C compiler option 43OPTIMIZE, C++ compiler option 48optimized applications, debugging
large 433optimized COBOL programs, modifying
variables in 210, 296, 297optimized programs, compiling COBOL
with NONE and NOHOOK 32optimized programs, debugging
COBOL 400options module, CEEUOPT runtime 83OS PL/I programs, debugging 320OS PL/I, compiling 38OS PL/I, finding list for 320OS/VS COBOL 229
compiler options to use 73restrictions 308
outputC, capturing to stdout 250C++, capturing to stdout 262
overloaded operator 342overwrite errors, finding storage
in assembler 275in C 253in C++ 265in COBOL 226in LangX COBOL 234in PL/I 242
Ppanel
header fields, session 163Profile 282
PANEL command (full-screen mode)changing session panel colors and
highlighting 280PANEL PROFILE command 171paragraph trace, generating a COBOL
run-time 225PATH, how Enterprise COBOL for z/OS,
Version 4, handles 34performance
enhancing z/OS Debugger 82performance, improving z/OS
Debugger 397PF keys
defining 277using 177
PF4 key, using 201PHASEIN 555physical
opening and closing windows 279physical window, enlarging 181PL/I 235
AFTERALL 36AFTERCICS 36AFTERMACRO 36AFTERSQL 36built-in functions 318compiler options to use to
automonitor variables in INCLUDEfiles while in remote debugmode 36
compiler options to use when youwant to debug INCLUDE files 36
condition handling 313constants 317debugging a program in full-screen
modedisplaying raw storage 240finding storage overwrite
errors 242getting a function traceback 240halting on line if condition is
true 239modifying value of variable 239setting a breakpoint to halt 238setting breakpoint to halt 243tracing run-time path for code
compiled with TEST 241when not all parts compiled with
TEST 240debugging OS PL/I programs 320
PL/I (continued)finding listing 320
Enterprise, L prefix command onlyavailable with 16
Enterprise, M prefix command onlyavailable with 16
Enterprise, restrictions 321expressions 317how to choose compiler options
for 36how z/OS Debugger locates separate
debug file 455notes on using 288PLIBASE 38possible prerequisites 37preparing a program for
debugging 35QUERY LOCATION 238run-time options 125sample program for debugging 235session variables 314SIBMBASE 38statements 311structures, accessing 315TEST compiler option, what it
controls 35when to Dynamic Debug facility
with 38PL/I for MVS & VM, compiling 38PL/I listing, data set 445PL/I source, data set 444PL/I, definition of xviiiPLAYBACK commands
introduction to 19PLAYBACK BACKWARD
using 195PLAYBACK DISABLE
using 195PLAYBACK ENABLE
using 193PLAYBACK FORWARD
using 195PLAYBACK START
using 194PLAYBACK STOP
using 195PLIBASE 38PLITEST 138plug-ins
how to install 557plug-ins for remote debugger 557, 560point of view, changing
description 413for C and C++ 340with COBOL 303
POPUP command 168positioning lines at top of windows 182precompiling DB2 programs 81preference file 100, 121preferences file 446
customizing z/OS Debuggerwith 284
Preferences Filein DTCN, description of 100
preferences files, how to create a 169prefix area
z/OS Debugger 173
602 IBM z/OS Debugger V14.1.9 User's Guide

Prefix area, description of 165prefix commands
prefix area on session panel 173using in z/OS Debugger 175
prepare an assembler program, stepsto 77
preparinga PL/I program for debugging 35C programs for debugging 41C++ programs for debugging 46to replay recorded statements using
PLAYBACK START command 194prerequisites
for COBOL, possible 30previous commands, retrieving 178problem determination
describing problems 577determining business impact 576submitting problems 577
Profile name pattern 559profile settings, changing in z/OS
Debugger 282program
CICS, choosing debugging modefor 52
CICS, debugging 385DB2, debugging 367hook
compiling with, PL/I 35removing 397, 399rules for placing in C 45, 46, 50rules for placing in C++ 50
IMS, choosing debugging modefor 54
loaded from LLA 431multithreading, debugging 419preparation
considerations, size andperformance 397, 398, 399
TEST compiler option, forPL/I 35
TEST compiler option, for VSCOBOL II 31
reducing size 397source, displaying with z/OS
Debugger 164stepping through 192that z/OS Debugger ignores when
explicit debug mode is active 433UNIX System Services,
debugging 403variables
accessing for C and C++ 324variables, accessing for COBOL 295
Program IDs, specifying correct forC/C++ and Enterprise PL/Iprograms 96
programming language neutral, how towrite commands that are 187
pseudo-conversational program, savingsettings 390
PX constant (PL/I) 291
Qqualification
description, for C and C++ 339
qualification (continued)general description 411
qualifying variableswith COBOL 301
QUERY LOCATIONassembler 273COBOL 221LangX COBOL 233PL/I 238
RRACF access, combinations of EQAOPTS
BROWSE command and 56recording
breakpoints using SETAUTOMONITOR 190
number of times each source lineruns 189
restrictions on, statements 195session with the log file 188statements, introduction to 18statements, using PLAYBACK
ENABLE command 193stopping, using PLAYBACK DISABLE
command 195recording a debug session 166referencing variables, implications of 51reloading programs into an active CICS
region 555remote debug mode
commands not allowed while browsemode is active 56
description of 6examples of 125plug-ins for 557, 560where to find list of z/OS Debugger
commands supported by 6remote debug mode, PL/I, debugging
INCLUDE files 36removing statement and symbol
tables 398, 399replacing variables in Monitor
window 203replaying
statements, introduction to 18replaying recorded statements 194replaying statements
changing direction of 195direction of 194restrictions on 195stopping using PLAYBACK STOP
command 195using PLAYBACK commands 193using PLAYBACK START
command 194requirements
for debugging CICS programs 385reserved keywords
for C 329for COBOL 294
RESLIB 30restoring, manually; of settings,
breakpoints, and monitorspecifications 199
restrictions 294accessing COBOL data, for 195
restrictions (continued)arithmetic expressions, for
COBOL 299debugging OS PL/I programs 320debugging VS COBOL II
programs 304expression evaluation, for
COBOL 299location of source on HFS or zFS 66,
67, 68modifying variables in Monitor
window 210recording and replaying statements,
for 195string constants in COBOL 300when debugging multilanguage
applications 419when debugging under CICS 390when using a continuation
character 294while debugging assembler
programs 352while debugging Enterprise PL/I 321
RETRIEVE commandusing 178
retrieving commandswith RETRIEVE command 178
retrieving lines from Log or Sourcewindows 178
RIGHT, SCROLL command 180RLIM processing, CICS 391RUN subcommand 368run time
environment, displaying attributesof 338
option, TEST(ERROR, ...), forPL/I 314
options module, CEEUOPT 83run-time options
specifying the STORAGE option 125specifying the TRAP(ON) option 126specifying with COBOL and
PL/I 125running a program 192running in batch mode
considerations, TEST run-timeoption 122
running your program, introductionto 14
RUNOPTS (DB2)comparing EQAD3CXT to 109
RUNTO commandusing, to replay recorded
statements 194
Ssave breakpoints file 448save monitor specifications file 448save settings file 448SAVEBPDNSALLOC, EQAOPTS
command 448SAVEBPDSN, EQAOPTS command 448SAVEBPS 448SAVESETDSN, EQAOPTS command 448SAVESETDSNALLOC, EQAOPTS
command 448
Index 603

SAVESETS 448saving
breakpoints 196monitor specifications 196settings 196setup file using z/OS Debugger
Utilities 130saving (automatically) settings,
breakpoints, and monitorspecifications 197
saving and restoring customizations 284saving and restoring settings, how to
improve performance in environmentwith multiple enclaves 200
saving, disabling automatic of settings,breakpoints, and monitorspecifications 198
scenarioslist of C, debugging 42, 43, 49list of C++, debugging 47list of COBOL, debugging 28list of PL/I, debugging 36
scope of objects in C and C++ 334screen control mode, what is 52scroll area, z/OS Debugger 173SCROLL command
using 179search string, syntax of 183searching for characters or strings 182searching, how z/OS Debugger searches
for 183SELECT statement, example of 87self-modifying code, restrictions for
debugging 361separate debug file
COBOL and PL/I, how z/OSDebugger locates the 455
separate debug file files, how z/OSDebugger locates 451, 452
separate debug file, attributes to usefor 82
separate debug file, data set 445separate terminal mode, what is 53service, when you apply to Language
Environment 114session
variables, for PL/I 314session panel
changing colors and highlightingin 280
changing physical windowlayout 278
command line 173description 161header fields 163navigating 179order in which z/OS Debugger
accepts commands from 174PF keys
initial settings 177using 177
while debugging LangX COBOL 308windows
scrolling 180session panel, while debugging
assembler 348
session settingschanging in z/OS Debugger 277
session variablesdeclaring, for COBOL 299
SET AUTOMONITOR ON BOTHcommand, how it works 206
SET AUTOMONITOR ON command,example 206
SET AUTOMONITOR ON command,how it works 205
SET AUTOMONITOR ON PREVIOUScommand, how it works 206
SET commandsSET AUTOMONITOR
using to record breakpoints 190viewing output from 165
SET AUTOMONITOR ONmonitoring values of
variables 204SET DEFAULT SCROLL
using 164SET EQUATE
using 278SET INTERCEPT
using with C and C++programs 332
SET PFKEYusing in z/OS Debugger 177
SET QUALIFYusing with COBOL 303using, for C and C++ 340
SET REFRESHusing 393
SET SCROLL DISPLAY OFFusing 164
SET WARNINGusing with PL/I 320
SET DEFAULT LISTINGS command 171SET EXPLICITDEBUG 433SET QUALIFY
with multiple enclaves 422SET SOURCE command 171set up
overall steps to, debuggingsession 25
SET WARNING OFF, how to use 191setting
line breakpoint 190setting breakpoints, in C++ 342setting breakpoints, introduction to 15settings
changing z/OS Debugger profile 282changing z/OS Debugger
session 277setup file
copying JCL into, using DTSU 128creating, using z/OS Debugger
Utilities 127editing, using DTSU 128saving, using z/OS Debugger
Utilities 130setup files
overview of 8SIBMBASE 38single terminal mode, what is 52size, reducing program 397sizing physical windows 279
skipping programs 433Software Support
contacting 575describing problems 577determining business impact 576receiving updates 574submitting problems 577
Source display area, description of 165source file in window, changing 170source files, how z/OS Debugger
locates 451, 452, 454Source window
changing source files 170description 164displaying halted location 185retrieving lines from 178
SOURCE, PL/I compiler option 38source, program
displaying with z/OS Debugger 164SQLCODE 371Sta 94STANDARD 351starting
a debugging session in full-screenmode using the Terminal InterfaceManager 143
IBM z/OS Debugger Utilities 10your program from z/OS Debugger
Utilities 130z/OS Debugger from DB2 stored
procedures 157z/OS Debugger in full-screen mode,
introduction to 12starting a debug session 155starting interactive function calls
in C 251starting your program 155starting z/OS Debugger
__ctest(), using 139batch mode 141DB2 program with TSO 368from a Language Environment
program 131under CICS 151, 154under CICS, using CEEUOPT 154under MVS in TSO 145using the TEST run-time option 121with PLITEST 138with the CEETEST function call 131within an enclave 421
Starting z/OS Debuggerat different points 122
statement tables, removing 398, 399statements
PL/I 311, 314recording and replaying, introduction
to 18stdout, capturing output to
in C 250in C++ 262
STEP commandusing, to replay recorded
statements 194stepping
through a program 192through C++ programs 342
stepping, introduction to 14
604 IBM z/OS Debugger V14.1.9 User's Guide

STMT suboption of TEST compiler option(PL/I), effect of 40
STMT, how Enterprise COBOL for z/OS,Version 4, handles 34
stoppingz/OS Debugger session 19
storageclasses, for C 335displaying, introduction to 17LangX COBOL, displaying 233
storage errors, findingoverwrite
in assembler 275in C 253in C++ 265in COBOL 226in LangX COBOL 234in PL/I 242
uninitializedin C 254in C++ 265
STORAGE run-time option,specifying 125
storage, rawC, displaying 251C++, displaying 263COBOL, displaying 224PL/I, displaying 240
stored proceduresDB2, debugging 371
stringsyntax for searching 183
string substitution, using 278strings
C, displaying 251C++, displaying 263searching for in a window 182
SUB DB2 stored procedures 85substitution, using string 278SUBSYS
with C programs, what to doabout 69
Suffix area, description of 165suppressing the display of warning
messages 191SWAP command compared to scroll
commands 180SWAP command, when to use 180SYM suboption of TEST compiler option
(PL/I), effect of 39symbol tables, removing 398, 399syntax diagrams
how to read xviiiSYSCDBG 446SYSDEBUG 445system commands, issuing, z/OS
Debugger 175
TTCP/IP, specifying for IMS programs
(IPv4 or IPv6 formats) 380template in C++ 342temporary storage queue
how z/OS Debugger uses 90temporary storage queue, comparing
VSAM with 90
Term 94Terminal Id
in DTCN, description of 95Terminal Interface Manager
example of 142how to start 143
terminal mode, selecting correct DisplayID for each type of 99
terminology, z/OS Debugger xviiTEST compiler option
C, how to choose 43, 49COBOL, how to choose 28debugging C when only a few parts
are compiled with 250debugging C++ when only a few
parts are compiled with 261debugging COBOL when only a few
parts are compiled with 222debugging LangX COBOL when only
a few parts are compiled with 234debugging PL/I when only a few
parts are compiled with 240for PL/I 35PL/I, how to choose 36specifying NUMBER option with 30using #pragma statement to
specify 45versus DEBUG runtime option
(COBOL) 31TEST compiler option (C), effect of 44TEST compiler option (C++), effect of 50TEST run-time option
as parameter on RUNsubcommand 368
different ways to specify 57example of 124for CICS programs, how to
specify 58for DB2 programs, how to specify 58for DB2 stored procedures, how to
specify 59for IMS programs, how to specify 59for JES batch programs, how to
specify 58for PL/I 314for TSO programs, how to specify 58for UNIX System Services programs,
how to specify 58specifying with #pragma 126suboption processing order 121
TEST suboptions, redefining atruntime 121
this pointer, in C++ 261TIM
use to create TEST runtime optionsdata set 115
trace file for DTCN Profiles or DTSPProfile 567
trace, generating a COBOL run-timeparagraph 225
traceback, COBOL routine 224traceback, function
in assembler 274in C 252in C++ 264in PL/I 240
traceback, LangX COBOL routine 234
tracing run-time pathin C 252in C++ 264in COBOL 224in PL/I 241
Tran 94Transaction Id
in DTCN, description of 95TRAP, Language Environment run-time
option 214, 413TRAP(ON) run-time option,
specifying 126trigraph 288trigraphs
using with C 288TSO
starting z/OS Debugger using TESTrun-time option 155
TSO commandusing to debug DB2 program 368
TSO, starting z/OS Debugger under 145TSQ 90
UUEN 10uninitialized storage errors, finding
in C 254in C++ 265
UNIX System Servicescompiling a C program on 67compiling a C++ program 68compiling a Enterprise PL/I program
on 66using z/OS Debugger with 403
unsupportedHLL modules, coexistence with 418PL/I language elements 320
UP, SCROLL command 180URM debugging 101USE file 122User ID
in DTCN, description of 97
Vvalues
assigning to C and C++variables 325
assigning to COBOL variables 295variable
automonitor 16changing value of 17continuous display 16displaying value of 15modifying value
in C 249in C++ 260in COBOL 221in PL/I 239
one-time and continuous display 16one-time display 15using SET AUTOMONITOR ON
command to monitor value of 204value, displaying 200
variable, displaying data type of 203
Index 605

variablesaccessing program, for C and
C++ 324accessing program, for COBOL 295assigning values to, for C and
C++ 325assigning values to, for COBOL 295compatible attributes in multiple
languages 416displaying, for C and C++ 325displaying, for COBOL 296HLL 410qualifying 411session
declaring, for C and C++ 326session, for PL/I 314
viewing and modifying data members inC++ 261
VS COBOL IIcompiler options to use 74
VS COBOL II programs, additionalpreparation steps for 31
VS COBOL II programs, debugging 304VS COBOL II, finding list for 305VSAM, comparing CICS temporary
storage queue with 90VTAM
starting a debugging session througha, terminal 143
Wwarning, for PL/I 320window
description of Memory 167window id area, z/OS Debugger 173window, error numbers in 213windows, z/OS Debugger physical
changing configuration 278opening and closing 279resizing 279
windows, z/OS Debugger session panelopening and closing 279zooming 280
Working-Storage Section, displaying 202
XXPLINK
restriction on applications thatuse 363
Zz/OS Debugger
C and C++ commands, interpretivesubset 323
COBOL commands, interpretivesubset 293
commands, subset 410condition handling 414data sets 443enhancing performance of 82evaluation of HLL expressions 409exception handling, for C and C++
and PL/I 415
z/OS Debugger (continued)interfaces 4interpretation of HLL variables 410list of supported compilers 3list of supported subsystems 4multilanguage programs, using 415PL/I commands, interpretive
subset 311starting at different points 122starting under CICS 151starting under MVS in TSO 145starting your program with 155starting, by using z/OS Debugger
Utilities 127stopping, session 19terminology xviiusing in batch mode 535
z/OS Debugger Setup Utility 127z/OS Debugger Utilities
creating private message region forIMS program 381
creating setup file for IMSprogram 381
Deferred Breakpoints 9how to use, to link-edit 80instructions for modifying and using a
setup file 463instructions for running a program in
batch 464JCL Wizard 10Non-CICS Debug Session Start and
Stop Message Viewer 9specifying TEST runtime options for
IMS program 106starting your program 130using to assemble and create 79
ZOOM command, how and where touse 181
zooming a window, z/OS Debugger 280
606 IBM z/OS Debugger V14.1.9 User's Guide


IBM®
Product Number: 5724-T07
Printed in USA
SC27-4642-06


