Embed Size (px)
Citation preview
IBM Cloud Application Performance Management
Troubleshooting Guide
IBM
Contents
Troubleshooting - WebSphere Applications agent Health Center error durind starting server
Troubleshooting - Internet Service Monitoring agent - Renamed profile will have duplicate entries(original +renamed) in APM dashboard for 10 minutes after profile is renamed
Troubleshooting - WebSphere MQ Agent The sda file by the latest DDD tool cannot be uploaded to server on AIXplatform.Troubleshooting - Microsoft SharePoint agent - When you upgrade agent from 8.19.03.00 to 8.19.06.00, a messageappears on command prompt as - Agent is FAILED to install.Troubleshooting - Internet Service Monitoring Agent - Administrator cannot edit profiles if ESC button is used tocancel profile-edit operation..Troubleshooting - Internet Service Monitoring Agent - Double click event do not triggered in the Firefoxbrowser.Troubleshooting - Internet Service Monitoring Agent - Blank custom.properties file gets displayed on MIN when agentis in stopped state for more than 10 minutes..Troubleshooting - SAP HANA Database agent - SAP HANA Database Agent cannot connect to Master or StandbyHost in SAP HANA System- High Availability environment. .Troubleshooting - SAP HANA Database agent - SAP HANA Agent is not able to connect to all the tenant databasesof the SAP HANA Server. SAP HANA Agent is not able to connect to all the tenant databases of the SAP HANAServer..Troubleshooting - SAP HANA Database agent - For scaled-out Tenant Databases , data for Table Size informationand Alert Information cannot be differentiated..Troubleshooting - SAP HANA Database agent - HANA_Master_Down_Crit_SYS threshold will be triggered in casethe slave host is down in scale out architecture of the SAP HANA system..Troubleshooting - Internet Service Monitoring Agent - The agent is not listed in MSN on agent configuration panel ofAPMUI dashboard or the resources are not published on KASS server or the data is not visible on MIN..
Troubleshooting ICAM MSSQL Agent Database Resource takes some time for loading databases..Troubleshooting ICAM MSSQL Agent Blank database page is showed on the UI when database name containsspecial character '%'..
Troubleshooting ICAM MSSQL Agent In custom metric, user can select only one dimension at a time..Troubleshooting ICAM MSSQL Agent On flyover help, only metrics column information is displayed..
Troubleshooting IIS Agent - If IIS 81407 agent is installed on any of the Windows 2019 OS editions, then you may
not see the FTP sites details on the APM portal..Troubleshooting - Internet Servive Monitoring Agent The agent cannot not be stopped using itmcmd agent stop is onlinux platform..Troubleshooting Property values do not display correctly for WebSphere Application Servers resources.Troubleshooting Node JS V8 data collector installation errors.Troubleshooting - Cassandra agent The agent stores JMX password in plain text.Troubleshooting WAS agent is not showing data in Cloud App Management.Troubleshooting Inability to stop automated deletion of SID_alert.idx file.Troubleshooting Sybase Agent that is upgraded from 8.1.4.0.4 to the later version failed to display the upgrademessage on AIX environment.Troubleshooting Sybase Agent fails to start automatically after upgrade from 8.1.4.0.4 to the later version onRHEL.Troubleshooting DB2 agent - Incorrect memory usage percent value displayed on the Memory Usage (%)-Top 5widget.Troubleshooting Agents with multiple attribute group tables report different metrics.Troubleshooting Microsoft Exchange Server - While accessing through My Components, no data shown on thedashboard overview page of Microsoft Exchange Server 20132016.
Troubleshooting - Internet Servive Monitoring Agent For ISM Agent 7.4.0.4 supports are not seeded on MIN sideafter upgrading the agent from 8.1.4.0.4 to 8.1.4.0.5 packages..Troubleshooting -ISM Agent - Help () icon and Cancel button are truncated on DHCP, SMTP, TRANSX, ICMPmonitors configuration pages. .Troubleshooting - APM V8 Sybase Agent SDA fails for windows platform.Troubleshooting Availabilty Monitoring can't be accessed in the Clould APM trial..Troubleshooting - DB2 agent agent fails to start by using the itmcmd command.Troubleshooting - Tomcat agent was not able to register the startup parameters (for DC) if there were different startupscripts.Troubleshooting After upgrade of ITM V6V7 agent, it no longer communicates with the backup remote TivoliMonitoring Server.Troubleshooting - Internet Service Monitoring Agent Deploying multiple profile in a short interval of time..Troubleshooting - Internet Service Monitoring Agent cannot not be uninstalled completely using smai-agent.batuninstall_all.Troubleshooting - Internet Service Monitoring Agent Wrong Profile Entries may be displayed while editing theprofiles from different browsers simultaneously..
Troubleshooting - Internet Service Monitoring Agent On the configuration help for select service page done buttondoes not exist..Troubleshooting - Internet Service Monitoring AgentWhen user attempts to edit the configurable fields of TRANSX it cannot be edited
monitor, it cannot be edited..Troubleshooting - Internet Service Monitoring Agent when trying to edit the created profiles changes don't take effect
Troubleshooting - Internet Service Monitoring Agent when user attempts to edit the created profiles only advance tabfields can be edited.
Troubleshooting - DB2 agent Watchdog process (kcawd) in the OS agent is unable to start the Db2 agent.Troubleshooting - SAP Agent Function Module IBMMONITM_JOBS is taking more than expected time forexecution..Troubleshooting - Microsoft SQL Server agent Database Server Properties window does not display the upgradedversion of the SQL Server.Troubleshooting - Microsoft SQL Server agent DB INCLUDEEXCLUDE configuration panel supports only 256characters.Troubleshooting - Microsoft SQL Server agent The configuration file of the MS SQL Problem Detail data set cannothandle non-English ERRORLOG files.Troubleshooting - Microsoft SQL Server agent For some attributes of the MS SQL Device Detail and MS SQLFilegroup Details data sets incorrect data is displayed on the dashboard.Troubleshooting - Microsoft SQL Server agent No data is collected for the Table Detail attribute.Troubleshooting - Microsoft SQL Server agent Incorrect values on the APM portal for Database Detail, DeviceDetail, and Filegroup Detail attribute groups.Troubleshooting WebSphere Applications agent - WAS application cannot start after diagnotics or transactiontracking is enabled.Troubleshooting - NetApp Storage agent The Java Virtual Machine (JVM) heap space is out of memory.Troubleshooting - .NET agent No data available on the deep dive dashboard.Troubleshooting WebSphere Applications agent - Some data is not available in the J2C Connection Pool table.Troubleshooting WebSphere Applications agent - No data in the Cache Discards Count chart.Troubleshooting - NetApp Storage agent Data source connection retry count expires.Troubleshooting - NetApp Storage agent Enabling NetApp agent to work with various protocols configured onOnCommand components.Troubleshooting WebSphere Applications agent - Data collector configuration failed for Liberty due to criticalerror.Troubleshooting Supporting the installation of multiple agents on the same managed server but connected to differentAPM servers.Troubleshooting - APM UI Expiring Certificates (APM 8.1.4).Troubleshooting - APM UI Expiring Certificates (APM 8.1.3).Troubleshooting - Db2 agent Active Connections (History) group widget displays zero value for maximumconnections.Troubleshooting - Db2 agent Application Performance Dashboard does not display any information in the DatabasesStatus group widget.Troubleshooting - Unable to disable the firewall on RHEL V7.4 before installing the Cloud APM Server.Troubleshooting-Sterling Connect Direct agentData disappears from 'Scheduled Processes' group widget if yourecycle the agent multiple times or make changes in env file for Connect Direct agent..
Troubleshooting-Sterling Connect Direct agentError in fetching the data of scheduled processes..Troubleshooting-Db2 agentIf you use remote monitoring, data is not displayed on Slow SQL Statements-Top 5widget on APMUI, for active database..Troubleshooting- Db2 agentFor Db2 Agent remote monitoring, inactive and uncatalogued database are not displayedon the APMUI..Troubleshooting - Microsoft SQL agent - Unable to add more than 256 characters in the agent configuration
panel.
Troubleshooting - WebSphere Applications agent Agent instance does not show up after CTIRA_HOSTNAME isset.Troubleshooting - Agent Builder - agent not visible in Performance Management UI.Troubleshooting - Agent Builder - agent monitoring WebSphere Application Server MBeans fails.Troubleshooting - Agent Builder - silent configuration of agent fails.Troubleshooting - Agent Builder - agent is already running message when installing agent.Troubleshooting - Agent Builder - issues when viewing Attribute Details tab.Troubleshooting - Agent Builder - agent not found the Threshold Manager.Troubleshooting - Agent Builder - parameters for silent configuration.Troubleshooting - Agent Builder - SSH connection to Windows 2012 server fails.Troubleshooting - Agent Builder - inbound ping to a server fails.
Troubleshooting - Agent Builder - script agent built with older Agent Builder version fails.Troubleshooting - Agent Builder - no results when testing agent.Troubleshooting - Agent Builder - missing or unexpected data for Socket data set.Troubleshooting - Agent Builder - agent configuration can not be read from mapped drive.Troubleshooting - Agent Builder - authorization failures when agent uses SSH public key authentication.Troubleshooting - Agent Builder - ping attribute group on Windows slow to respond.Troubleshooting - Agent Builder - connecting to Microsoft SQL Server by using integrated authentication isfailing.Troubleshooting - Agent Builder - collecting metrics through the Windows APIs fails.Troubleshooting - Agent Builder - an agent monitoring SNMP V2 events does not receive traps..Troubleshooting - Agent Builder - SNMP attribute group not collecting data reliably.Troubleshooting - Agent Builder - on Windows systems, when installing two agents with scripts of the same name,the script gets overwritten.Troubleshooting - Agent Builder - subnodes from different agent instances have the same managed systemname..Troubleshooting - Agent Builder - no data for WMI or Perfmon data source.Troubleshooting - Agent Builder - agent monitoring service status displays UNKNOWN.Troubleshooting - Agent Builder - service or process monitoring returns zeros for metrics.Troubleshooting - Agent Builder - bad string values from SNMP.Troubleshooting - Agent Builder - core memory dump after you edit the .ref file.Troubleshooting - Agent Builder - script agent behaves oddly when the script is edited.
Troubleshooting - Agent Builder - a data set with the script data source does not return any data.Troubleshooting - Agent Builder - incorrect return code for Windows script.Troubleshooting - Agent Builder - specification error for reserved name.Troubleshooting - Agent Builder - log file data mismatch.Troubleshooting - Agent Builder - RAS1 log errors.Troubleshooting - Agent Builder - JMX data provider cannot connect to Oracle WebLogic Server on AIX.Troubleshooting - Agent Builder - error displayed when testing a JMX data set, MBeans do return data.Troubleshooting - Agent Builder - JMX Monitors not working with JBoss application server .Troubleshooting - Agent Builder - receiving JMX notifications.Troubleshooting - Agent Builder - ATTRIBUTE_ERROR displayed in the Performance Object Status attribute groupwhen testing agent.Troubleshooting - Agent Builder - negative or wrong attribute value in agent.Troubleshooting - Agent Builder - script agent fails to run a script with a space in its name.Troubleshooting - Agent Builder - no data or wrong data in Collect Data window.Troubleshooting - Agent Builder - JMX browser fails to connect to WebLogic 10.x.Troubleshooting - Agent Builder - Parse function in Parse Log window returns incorrect result.Troubleshooting - Agent Builder - workspace screen not responding on LinuxUNIX system over a CygwinXserver.Troubleshooting - Agent Builder - iFixes applied to the Agent Builder are not removed when the Agent Builder isuninstalled.Troubleshooting - Agent Builder - JRE or JDK not available.Troubleshooting - Agent Builder - error message truncated.Troubleshooting - Agent Builder - in script agent, you can not pass runtime parameters to the script.Troubleshooting - Agent Builder - project default location error.Troubleshooting - Agent Builder - uninstallation ends with an error.Troubleshooting - Agent Builder - Specifying the internal_logon connection property for Oracle.Troubleshooting - Agent Builder - JDBC connection to zOS DB2 database is failing.Troubleshooting - Agent Builder - On a Linux or UNIX system, the Browse button is not active when adding certaindata sources.Troubleshooting - Agent Builder - in a CIM array, only the first value is returned.Troubleshooting - Agent Builder - modifying the log file format for Log file data source.Troubleshooting - Agent Builder - finding out the version of Agent Builder on Linux and UNIX systems.Troubleshooting - Agent Builder - parsing a MIB file for SNMP fails.Troubleshooting - Agent Builder - Resource out of sync.
Troubleshooting Liberty data collector - Only request data is available on APM UI.Troubleshooting IPM v8.1.3 UI for Transaciton Tracking.
Troubleshooting - API Connect scenario Liberty data collector - No thread pool information when monitoring APIConnect controller.Troubleshooting - WebLogic agent requires non-IBM Java to use SSL connections.Troubleshooting - JBoss agent configuration for SSL needs to handle the certificate path.Troubleshooting Tomcat agent No transaction tracking data is available in the Tomcat agent dashboards.Troubleshooting Filesystem types and the OS agents.Troubleshooting OS agents and log file monitoring.Troubleshooting - API Connect scenario Nodes failed to stitch in the aggregated topology view on the Cloud APMdashboard.Troubleshooting - Liberty data collector No data in the Slowest Web Applications (history) widget when monitoringAPIC collective controller.Troubleshooting - WebSphere MQ agent Transaction tracking does not work.Troubleshooting Hadoop agent Test connection fails for a Hadoop cluster enabled with Kerberos authentication.Troubleshooting - SAP NetWeaver Java Stack agent The SAP NetWeaver Java Stack Instance does not start afterconfiguration..Troubleshooting - WebSphere Applications agent Health Center NPE error in data collector log.Troubleshooting - Response Time Monitoring agent Transaction Topology missing a node.Troubleshooting-Node.js data collector cannot see Memory usage Garbage Collection Event Loop Laterncy and EventLoop Tick data in dashboard.Troubleshooting Tomcat agent Transaction Tracking data is not displayed in some group widgets.Troubleshooting - WebSphere MQ agent KMQMI184E message appears during agent startup.Troubleshooting - Hybrid Gateway Unable to connect to the Tivoli Enterprise Portal Server.Troubleshooting Microsoft .NET agent No eventing threshold is triggered for critical GC status.Troubleshooting - Hybrid Gateway Tivoli Monitoring domain managed systems are not visible in the ApplicationPerformance Dashboard.Troubleshooting - WebSphere Applications agent Fail to start application server with core dump after configuringdata collector.
Troubleshooting - After using the JBoss admin console or CLI to reload a JBoss server that has been instrumented forTransaction Tracking and Deep Dive (TTDD), some of the TTDD MBeans are no longer registered with the JMXMBean server..Troubleshooting RabbitMQ agent Registry entry not deleted when agent is uninstalled.
Troubleshooting - WebSphere Applications agent Configuration utilities fail with WASX8009E error.Question about requirements Agent rows written per minute.Troubleshooting - WebSphere Applications agent Reconfiguration fails with exception in Jython Shutdown Closerthread.
Troubleshooting - WebSphere Applications Agent Cannot configure the data collector on Windows.Troubleshooting - WebSphere Applications agent Data collector gets confused with servers of the same name.Troubleshooting - WebSphere Applications agent The server componet does not work correctly after the datacollector is configured.Troubleshooting - IBM Integration Bus agent Cannot configure the agent for transaction tracking with file permissionerrors.Troubleshooting - WebSphere Applications Agent Recover the application server when the server fails to start.Troubleshooting - APM server installation fails with Service kafka failed to start error on a RHEL 6.8 system due toRHEL 4096 character limit.Troubleshooting - WebSphere Applications Agent MBean related errors found in the agent log file duringmigration.Troubleshooting - WebSphere Applications Agent Cannot uninstall the agent after the data collector isunconfigured.Troubleshooting - Non-ASCII characters do not display in the Performance Management console.Troubleshooting - Agent Builder - in script agent, the script does not run.Troubleshooting - Agent Builder - no help is displayed.Troubleshooting - Agent Builder fails to start, or starts but fails to display UI, or fails to test an agent, or terminatesabnormally.Troubleshooting - PM console page in IE browser can't be displayed.
Troubleshooting - WebSphere Applications Agent Configuration fails with CFG5026E error.Troubleshooting - WebSphere Application Agent GDCRequestListenerInvocationHandler exception in the trace-dc-bcm.log.Troubleshooting Queries about configuring the Microsoft SQL Server agent in a cluster environment.Troubleshooting - Active Directory agent LDAP Successful Bind attribute appears with value 0 on the dashboard.Troubleshooting - Active Directory agent Dashboard does not display the updated list of instances.Troubleshooting - Configuring the docker to receive performance data.Troubleshooting - OS agent and containers.Troubleshooting - Docker custom configuration and the Linux OS agent unable to collect metrics correctly.Troubleshooting - IBM Integration Bus agent Enabling transaction tracking causes integration server (executiongroup) to fail to start..Troubleshooting - Manual updates to the Performance Management server components are required if you change theIP address of the remote DB2 server.Troubleshooting - Microsoft SQL Server agent After removing multiple configured instances, services aredisabled.Troubleshooting Queries regarding .NET Framework version and related monitoring capabilities.Troubleshooting - WebSphere Application Agent Cannot configure the data collector with configuration utility.Troubleshooting - DataPower agent Content-Type incorrect after adding transform to policy.Troubleshooting - Agent Builder fails to parse MIB files for SNMP.Troubleshooting - Agent Builder - Resource is out of sync.Troubleshooting - Agent Builder - Script data source does not run the script on a Windows system.Troubleshooting - Agent Builder - Data source does not contain a key attribute.Troubleshooting - Agent Builder - error when trying to browse WMI or Windows services on local host by IP address
or host name.Troubleshooting - Agent Builder - Data source exceeds maximum data size.Troubleshooting - Agent Builder does not start, or does not display UI, or fails to start agent testing, or terminatesabnormally.Troubleshooting - Agent created by Agent Builder - no data displayed.Troubleshooting - some data missing for Tivoli Monitoring agents.Troubleshooting Hadoop agent Data sets are not displayed in the Attribute Details tab.Troubleshooting Hadoop agent The data source type for the Hadoop agent is displayed as Hadoop Hosts.Troubleshooting - some or all Tivoli Monitoring agents not available for adding to applications.Troubleshooting - SAP agent On SAP NetWeaver 7.0 with SAP Basis version 700, import of transport fails, and anABAP dump is generated.Troubleshooting - No data displayed for a Tivoli Monitoring agent.Troubleshooting Hadoop agent Additional eventing thresholds are displayed after upgrading the agent support.Troubleshooting Hadoop agent Events are not displayed.Troubleshooting - Diagnostic data not displayed for a Bluemux application.Troubleshooting - Microsoft IIS agent False events are triggered and displayed in the Events tab in the PerformanceManagement dashboard.Troubleshooting - VMware VI agent After MIN server upgrade to V8.1.3, error while navigating to the VirtualMachine Detail page.Troubleshooting Viewing triggered events for the log file agent (on Cloud).Troubleshooting Querying a log file configuration.Troubleshooting OS agents with log file event monitoring have a sub node limitation.Troubleshooting Defining monitoring rules for missing processes with long names in the Threshold Editor..Troubleshooting Multiple Performance Management V8 agents and similar log file configuration files.Troubleshooting WebSphere Applications Agent - Cannot run predefined TCR reports due to the lack of historicaltable.Troubleshooting WebSphere Applications Agent - Request data is inconsistent between the Performance Managementconsole and Tivoli Enterprise Portal.Troubleshooting WebSphere MQ Agent - Cannot run predefined TCR reports due to the lack of historical data.Troubleshooting - WebSphere MQ Agent Two sets of predefined event thresholds exist after agent upgrade.Troubleshooting - WebSphere MQ agent Cannot discover WebSphere MQ 64-bit library path.Troubleshooting - WebSphere Application Agent System performance is affected by high workload classes.Troubleshooting - Prerequisite Checker Properties.Troubleshooting - WebSphere Application Agent System performance is affected by high workload classes.Troubleshooting - WebSphere MQ Agent KMQMI116E message appears in agent log repeatedly.Troubleshooting - WebSphere Application Agent Error message gzip stdout Broken pipe appears duringinstallation.
Troubleshooting - Application Performance Dashboard shows Unknown status for Tivoli Monitoring agents.Troubleshooting - WebSphere Application Agent No data is available on Throughput and Average Response Timewidget.Troubleshooting - WebSphere Applications Agent Cannot see the WASNotConnected event on PerformanceManagement console.
Troubleshooting - WebSphere Applications Agent Cannot display Cell Name and Node Name on WAS Informationwidget.Troubleshooting - WebSphere Applications agent JDBC or EJB requests are missing from the diagnosticdashboards.
Troubleshooting - WebSphere Applications Agent WASOutofHeapSpace event is not triggered.Troubleshooting - HTTP Server agent Data is not properly dispalyed in the Performance Management UI and the ITMTEP workspace when ITCAM HTTP Server agent 7.1.0.3 iFix08 and Performance Management HTTP Server agentV8 are installed on the same server.Troubleshooting - WebSphere MQ agent Transaction tracking enablement impacted by WebSphere MQ upgrade.Troubleshooting - IBM Integration Bus agent IBM MQ queue is displayed as pseudo node in transaction instancetopologies.Troubleshooting JBoss server start up failure.Troubleshooting - Dashboard status in the navigator shows all applications as normal but warning and critical eventsare open.Troubleshooting - Windows OS agent A situation is triggered on an unexpected managed object.Troubleshooting - Windows OS agent The monitoring interval is too long.Troubleshooting - Windows OS agent Monitoring activity requires too many system resources.Troubleshooting - Windows OS agent A situation that is referencing percent disk time returns values that are greaterthan 100 percent.Troubleshooting - Windows OS agent The Monitored Logs widget and Event Logs widget show no records. .Troubleshooting - Windows OS agent Data is missing from the physical and logical disk views in PM.Troubleshooting - Windows OS agent The system runs out of memory while the agent is collecting data.Troubleshooting - Windows OS agent Log data accumulates too rapidly.Troubleshooting - Windows OS agent No performance data is displayed in workspace views, and no data isavailable for situations and historical logging.Troubleshooting - WebSphere Application agent Cannot take snapshot on the Heap Dump dashboard.Troubleshooting - DataPower agent no data in some DataPower widgets in the Performance Dashboard.Troubleshooting - DataPower agent backend faults not reported.Troubleshooting HMC agent dashboard attribute value issues.Troubleshooting IBM Integration Bus Monitoring Agent and the java process time delay.Troubleshooting Microsoft SharePoint Server agent Java runtime error while configuring the agent through IBMPerformance Management window.Troubleshooting - Windows OS agent When you edit the configuration for an existing monitoring agent the valuesdisplayed are not correct.Troubleshooting - Windows OS agent The Long Queue Name is not matched with the row data collected fromperfmon.Troubleshooting - Windows OS agent The CPU of the Windows OS agent server is high.Troubleshooting - Windows OS agent The process application components are available but the Availability statusshows PROCESS_DATA_NOT_ AVAILABLE.Troubleshooting - Windows OS agent the agent goes off-line when collecting the network port attribute due to reverseDNS look-up time-out.Troubleshooting - Windows OS agent high CPU usage after you install or configure the Windows OS agent..
Troubleshooting - Windows OS agent log related widgets have not data.Troubleshooting - Windows OS agent error message saying could not open DNS registry key.Troubleshooting - PM server installation does not complete.Troubleshooting - PM console in Chrome browser locks up on rapid clicking of menu items.fixed_8121 Troubleshooting - PM server disaster recovery or upgrade incomplete because of backup failure.Troubleshooting - UNIX OS agent situations created using the File Pattern attribute group always raise alerts.Troubleshooting - UNIX OS agent monitoring activity requires too much disk space.Troubleshooting - UNIX OS agent disk data collected by the agent does not match the df command output.Troubleshooting - UNIX OS agent data collection of metrics from kpx data provider affects the agent performance (orthe metrics are not relevant).Troubleshooting - UNIX OS agent unicode file names are not properly displayed in the File Information Viewer.Troubleshooting Installing, configuring, and running agents as a non-root user.Troubleshooting Microsoft Exchange Server agent Unable to see instances for both Exchange component types underMy Components.Troubleshooting - UNIX OS agent the agent process uses a large amount of system resources.Troubleshooting - UNIX OS agent attributes do not allow non-ASCII input in the situation editor.Troubleshooting - UNIX OS agent the agent is up in the console but the command binos-agent.sh status suggests theagent is down.Troubleshooting - UNIX OS agent configuration values are incorrectly displayed.Troubleshooting - UNIX OS agent the agent is running but not displaying data.Troubleshooting - UNIX OS agent the agent restarts repeatedly.Troubleshooting - Linux OS agent situations that are created by using the File Pattern attribute group are alwaysTRUE.Troubleshooting - Linux OS agent monitoring activity requires too much disk space.Troubleshooting - Linux OS agent attributes do not allow non-ASCII input in the situation editor.Troubleshooting - Linux OS agent the agent process uses a large amount of system resources.Troubleshooting - Linux OS agent the agent restarts repeatedly.Troubleshooting - Linux OS agent command installAPMAgents.sh fails.Troubleshooting - IBM Integration Bus agent Data is wrong after broker upgrade.Troubleshooting - IBM Integration Bus agent Cannot see accounting statistics data on the agent dashboard.Troubleshooting - IBM Integration Bus agent Java processes are still running after agent stops..Troubleshooting - WebSphere Applications agent Web service calls are rejected by external web service.Troubleshooting - WebSphere Applications agent Execeptions appear in the liberty server log after configuring datacollector.Troubleshooting - WebSphere Applications agent Unable to instrument constructor for class warning messageoccurs.Troubleshooting – Multiple agents Y-axis labels not displayed in dashboard charts.Troubleshooting - WebSphere Applications agent Cannot distinguish application servers on the same host from theComponents view.Troubleshooting - WebSphere Applications agent Some information missing from dashboards after a server alias ischanged.Troubleshooting - WebSphere Applications agent Monitoring does not work when the cluster name includes whitespace.
Troubleshooting - WebSphere Applications agent 'Unknown' is displayed for the application name in a groupwidget.Troubleshooting - WebSphere Applications agent Resource monitoring does not work.Troubleshooting - WebSphere Applications agent Errors and Warnings KPIs show normal status when no data isavailable.Troubleshooting - WebSphere Applications agent Empty fields are displayed on the Events tab.Troubleshooting - WebSphere Applications agent Group widgets that rely on historical data are not updating.Troubleshooting - WebSphere Applications agent After reconfiguring the agent for a WebSphere Portal server, aduplicate server appears in the user interface.Troubleshooting - WebSphere Applications agent Uninstallation of the agent fails on a Windows system.Troubleshooting - WebSphere Applications agent Reconfiguring the agent to perform resource monitoring fails.Troubleshooting - IBM Integration Bus agent The integration broker status is wrong on the dashboard.Troubleshooting - WebSphere Applications agent The javax.management.InstanceNotFoundException error found indata collector log .Troubleshooting - Installing or upgrading a component stops other components.Troubleshoot Uninstalling Custom Agent - Can't see modified version in APM.Troubleshooting - WebSphere Applications agent The thread pool related widgets are blank.Troubleshooting - WebSphere Applications agent Incompatibility issues with Response Time Montoring Agent.Troubleshooting - WebSphere Applications agent The agent causes the Business Process Manager to fail to start.Troubleshooting - WebSphere Applications agent Core dump errors occur when you enable method trace for anapplication server.Troubleshooting - WebSphere Applications agent The maximum pool size KPI displays a value of 0.Troubleshooting - WebSphere Applications agent Prompt to migrate data collector when the version has notchanged.Troubleshooting - WebSphere Applications agent Script does not run when threshold conditions are met.Troubleshooting - WebSphere Applications agent No request instances on the Request Instances dashboard.Troubleshooting - WebSphere Aplications agent Servers missing from the managed systems list on the AgentConfiguration page.Troubleshooting - WebSphere Applications agent Running the WebSphere update command fails.Troubleshoting - WebSphere Applications agent WebSphere Application Servers with duplicate nodes names andhost names are not displayed on the UI.Troubleshooting - WebSphere Applications Agent Monitoring data for servers on a host is not available after the hostwas shut down abruptly.Troubleshooting - WebSphere Applications agent “Role-based authorization check failed†messages inSystemOut.log file after reconfiguration.Troubleshooting - WebSphere Applications agent Feature appears not to be enabled in the server.xml file.Troubleshooting - WebSphere Applications agent Erroneous server start failed message displayed when WebSphereLiberty server restarts.Troubleshooting - WebSphere Applications agent Server not monitored when it has the same alias as anotherserver.Troubleshooting - Websphere Applications agent Simple configuration process does not work on WebSphere PortalServer.Troubleshoting - WebSphere Applications agent Several ssl.client.props files are created in the tmp directory.
Troubleshooting Websphere Applications agent Non-ASCII characters are unreadable on the Log Messagesdashboard.Troubleshooting - Can not see OS and Response time Agent in Application Component tab.Troubleshooting - WebSphere Applications agent Liberty server does not start after it was configured formonitoring.Troubleshooting - WebSphere Applications agent Data collector configuration fails with network interface error.Troubleshooting - WebSphere Applications agent On Linux systems, migrating the data collector fails.Troubleshooting - WebSphere Applications agent On Linux systems, configuring the data collector fails.Troubleshooting - WebSphere Applications agent Upgrading the agent fails.Troubleshooting - WebSphere Applications agent Agent installation fails with permission errors under a non-rootuser.Troubleshooting - WebSphere Applications agent Cannot diagnose remote EJB nodes in the Transaction Topologyview.Troubleshooting - WebSphere Applications agent The CTIRA_LOG_PATH variable does not work.WebSphere Applications agent Troubleshooting data display problems.Troubleshooting - WebSphere Applications agent Collecting information about agent status.Troubleshooting -Issue while Installing IBM Performance Management 8.1.1.Troubleshooting - Ruby agent unexpected warning messages during agent configuration.Troubleshooting - Response Time Monitoring agent CMS database option missing in iKeyman.Troubleshooting - Response Time Monitoring agent no active Response Time process found .Troubleshooting - Response Time Monitoring agent turning on debug tracing.Troubleshooting - Response Time Monitoring agent location of trace and log files .Troubleshooting - Response Time Monitoring agent location of configuration files.Troubleshooting - Response Time Monitoring agent agent configuration window is not displayed during upgrade.Troubleshooting - Response Time Monitoring agent installation repeatedly fails .Troubleshooting - Response Time Monitoring agent warning message displayed during UNIX agent installation .Troubleshooting - Response Time Monitoring agent failed or cancelled installations do not remove the GSKitlibraries.Troubleshooting - Response Time Monitoring agent after uninstalling, some support files remain.Troubleshooting - Response Time Monitoring agent support files are missing after the agent is uninstalled.Troubleshooting - Response Time Monitoring agent changing file permission error occurs when upgrading the agentwith a non-root user ID.Troubleshooting - Response Time Monitoring agent cannot start agents if the upgrade process is cancelled.Troubleshooting - WebSphere Applications agent The Log Messages (last 100 messages) widget is empty.Troubleshooting Reports Application Performance Usage report returns XQE-GEN-0018.Troubleshooting Reports Transaction Data Volume = 0 when using IHS Plugin for Response Time.Troubleshooting - Response Time Monitoring agent V8.1.1 may stop sending transaction tracking data after upgradeof APM Server from 8.1.0 to 8.1.1 .Troubleshooting - IPM8.1.1 Automatic log off after selecting Application Performance Dashboard.Troubleshooting - WebSphere Applications agent Cannot diagnose remote EJB nodes in the Transaction Topologyviews.Troubleshooting - WebSphere MQ agent terminates.
Troubleshooting - IBM Integration Bus agent terminates.Troubleshooting - Response Time Monitoring agent V8.1.1 fails to install .Troubleshooting - IM8.1 prereq check fails in non English (en_US) environment.Troubleshooting - IM8.1 prereq check warning message.Troubleshooting - Reports Logging out generates Error 403 AuthenticationFailed - fixed_812.Troubleshooting - Reports Application names are inconsistent in the All My Applications report.Troubleshooting - Reports The Close and Cancel buttons shown on Reports login screen do not work.Troubleshooting - Reports Reports Y-axis shows duplicate values - fixed 812.Troubleshooting - Reports Y-axis shows negative values - fixed_812.Troubleshooting - Reports Charts in PDF Reports in Firefox are pink - fixed_812.Troubleshooting - Microsoft SQL Server agent For some attributes no data is displayed on the dashboard.Troubleshooting - Microsoft SQL Server agen For the Stolen Pages Growth attribute negative values are displayed onthe dashboard.Troubleshooting - Microsoft SQL Server agent Dashboard displays incorrect value for some data sets when a customquery is applied.Troubleshooting - Microsoft SQL Server agent Dashboard shows no data for the primary replica in the AvailabilityGroup details data set.Troubleshooting - Microsoft SQL Server agent Incorrect data is displayed for two SQL Server databases withidentical names.Troubleshooting - Microsoft SQL Server agent Collection Status attribute returns a value of Inactive.Troubleshooting - Microsoft SQL Server agent Negative value is returned for Transactions per Second in theDatabase Detail data set.Troubleshooting - Microsoft SQL Server agent SQL Server agent takes long time to display data.Troubleshooting - Microsoft SQL Server agent Dashboard displays no data for databases with table level locking.Troubleshooting - WebSphere MQ agent The agent fails to start on Linux or UNIX systems.Troubleshooting - VMware VI agent Group widget titles are not translated.Troubleshooting - VMware VI agent Columns in some group widgets are not highlighted.Troubleshooting - VMware VI agent Situations in the Severity column display incorrect status.Troubleshooting - VMware VI agent Attribute groups for the ESX Server component are not displayed.Troubleshooting - VMware VI agent ESX Server component events are not displayed.Troubleshooting - SAP agent Configuration panels on a mySAP system does not show text in a multi-bytelanguage.Troubleshooting - Microsoft IIS agent Error Statistics (history) and Request Rate (history) group widgets displayincorrect data for some attributes.Troubleshooting - Microsoft IIS agent No data is displayed in the Error Statistics (history) and Request Rate (history)group widgets.Troubleshooting - Microsoft .NET agent Dashboards do not update or display data.Troubleshooting - Microsoft .NET agent Data is not displayed for the ASP.NET Applications Request Status(websockets) data set.Troubleshooting - Microsoft .NET agent Data is not displayed for some data sets.Troubleshooting - Microsoft .NET agent Application instances are not displayed.Troubleshooting - Uninstallation of monitoring agents fails.Troubleshooting - Agent Subscription Facility (ASF) activity log customization parameter.
Troubleshooting - Multiple agents Agent installation failed for agents with an existing IBM Tivoli Monitoring V6.2.3framework.Troubleshooting - Agent or framework installation fails.Troubleshooting - Thresholds are not applied to the monitoring agent.Troubleshooting - Threshold events have unknown severity after agent recycle.Troubleshooting - Historical data doesn't change after you adjust the time selector.Troubleshooting - Dashboard shows no events or event status.Troubleshooting - Dashboards show no data, partial data, or incorrect data from the monitoring agent.Troubleshooting - Dashboard error occurred while loading data (on premises).Troubleshooting - Application Dashboard takes a long time to display.Troubleshooting - Connection to the Performance Management console fails in Firefox.Troubleshooting - Network connection error in the Performance Management console.Troubleshooting - Getting Started links blocked in Chrome.Troubleshooting - Multiple agents High CPU usage.Troubleshooting - Performance Management server installation failure and the RPM database (on premises).Troubleshooting - Multiple agents Installation failed on AIX.Troubleshooting - HMC Base agent user Configuration.Troubleshooting - Microsoft Hyper-V Server agent No data is displayed in the Virtual Machine Detailsdashboard.Troubleshooting - SAP agent Monitoring agent does not start in an AIX V6.1 environment.Troubleshooting - SAP agent Values shown are not correct when you edit the configuration for an existing monitoringagent.Troubleshooting - SAP agent Transaction not valid error when you run the IBMMONITM_ transactions.Troubleshooting - SAP agent Tivoli Monitoring alert 9912 and SAP syslog message.Troubleshooting - SAP agent Same version installation warning during command-line installation on UNIX.Troubleshooting - SAP agent Runtime errors in relation to transport on the SAP system.Troubleshooting - SAP agent TSV_TNEW_PAGE_ALLOC_FAILED ABAP runtime error.Troubleshooting - SAP agent Return code 8 or return code 12 occurs on the main import step.Troubleshooting - SAP agent Attributes do not allow non-ASCII input when you are creating an eventingthreshold.Troubleshooting - SAP agent Non-ASCII characters that are entered into the configuration window do not show up orare not the correct characters.Troubleshooting - SAP agent mySAP server does not start when using port 3661.Troubleshooting - SAP agent mySAP application server is not discovered by the SAP agent.Troubleshooting - SAP agent Syslog messages and alert messages do not show correctly in non-Englishlanguages.Troubleshooting - Ruby agent Instance not discovered.Troubleshooting - Python agent injection codes not removed after uninstalling the agent.Troubleshooting - PHP agent injection codes not removed after uninstalling the agent.Troubleshooting - SAP agent Value lists are shown in English in the mySAP configuration panels.Troubleshooting - SAP agent Agent does not start if RFC library is not copied to the correct path.Troubleshooting - Microsoft Exchange Server agent Exchange Server 2013 component shows Exchange 2007 and
2010 instances.Troubleshooting - Linux KVM agent bash nc command not found message.Troubleshooting - Linux KVM agent Failed to connect to data source message.Troubleshooting - Node.js agent Configuration file not generated after configuring and starting the agent.Troubleshooting - Node.js agent No data in deep-dive Request Summary widget.Troubleshooting - Node.js agent URL filtering, incorrect URL can be displayed.Troubleshooting - SAP agent Managed system names that show up under SAP agent in the dashboard areincorrect.Troubleshooting - SAP agent Incorrect parameters.Troubleshooting - SAP agent ITM raised alert message in the SAP syslog.Troubleshooting - SAP agent Data collection stops or runs sluggishly.Troubleshooting - SAP agent Cannot locate the KDCB0_HOSTNAME setting.Troubleshooting - SAP agent Cannot connect to the SAP system by using the Logon Group mode.Troubleshooting - SAP agent Monitoring agent cannot connect to the mySAP System.Troubleshooting - Microsoft SQL Server agent In Windows 2003 system, a non-administrator user cannot configurethe SQL Server agent services.Troubleshooting - Microsoft SQL Server agent Historical Data Collection collects data after a slight delay.Troubleshooting - Microsoft SQL Server agent Installation failure with KGL and KGS components on 32-bitWindows 2003 system.Troubleshooting - Multiple agents Log data accumulates too rapidly.Troubleshooting - Multiple agents High CPU usage.Troubleshooting - Microsoft SQL Server agent Handle leak occurs during the collector process.Troubleshooting - Microsoft Hyper-V Server agent No data is displayed in the dashboard for the Linux virtualmachine.Troubleshooting - Microsoft Hyper-V Server agent Memory leak is observed.Troubleshooting - Microsoft .NET agent The CTIRA_LOG_PATH variable does not work.Troubleshooting - Oracle Database agent Instances not listed in My Components.Troubleshooting - Oracle Database agent Memory usage for krzstart or krzclient processes increases.Troubleshooting - Oracle Database agent Processes consume high CPU.Troubleshooting - Oracle Database agent Some columns for monitored Oracle RDBMS 10g instance display 0.Troubleshooting - SAP agent Agent transport errors.Troubleshooting - Microsoft IIS agent Availability status shows PROCESS_DATA_NOT_AVAILABLE.Troubleshooting - Microsoft IIS agent Monitoring data fails to be displayed.Troubleshooting - Microsoft IIS agent Managed system seems to be offline.Troubleshooting - SAP agent Agent repeatedly restarts.Troubleshooting - Microsoft Active Directory agent Upgrade issues with the agent converter package (SaaS).Troubleshooting - SAP agent Monitoring agent does not start in a non-ASCII environment.Troubleshooting - Linux KVM agent Host Memory and Virtual Machines data set attributes not available.Troubleshooting - Linux KVM agent CPU model and topology attributes not available on RHEL 5 and 6systems.Troubleshooting - DataPower agent AIX Installation.Troubleshooting - Oracle Database agent Uninstallation command does not uninstall agents.

Troubleshooting - Oracle Database agent Cannot load the configuration file.Troubleshooting - Oracle Database agent Cannot read remote alert log file on Windows systems.Troubleshooting - LinuxKVM agent fails to start return code 11.Troubleshooting - DB2 agent Agent uninstallation command reports failed uninstallation.Troubleshooting - DB2 agent Configuration failed with permission error for non-root user after installation with rootuser.Troubleshooting - DataPower agent Configuration failed with SSL security error.
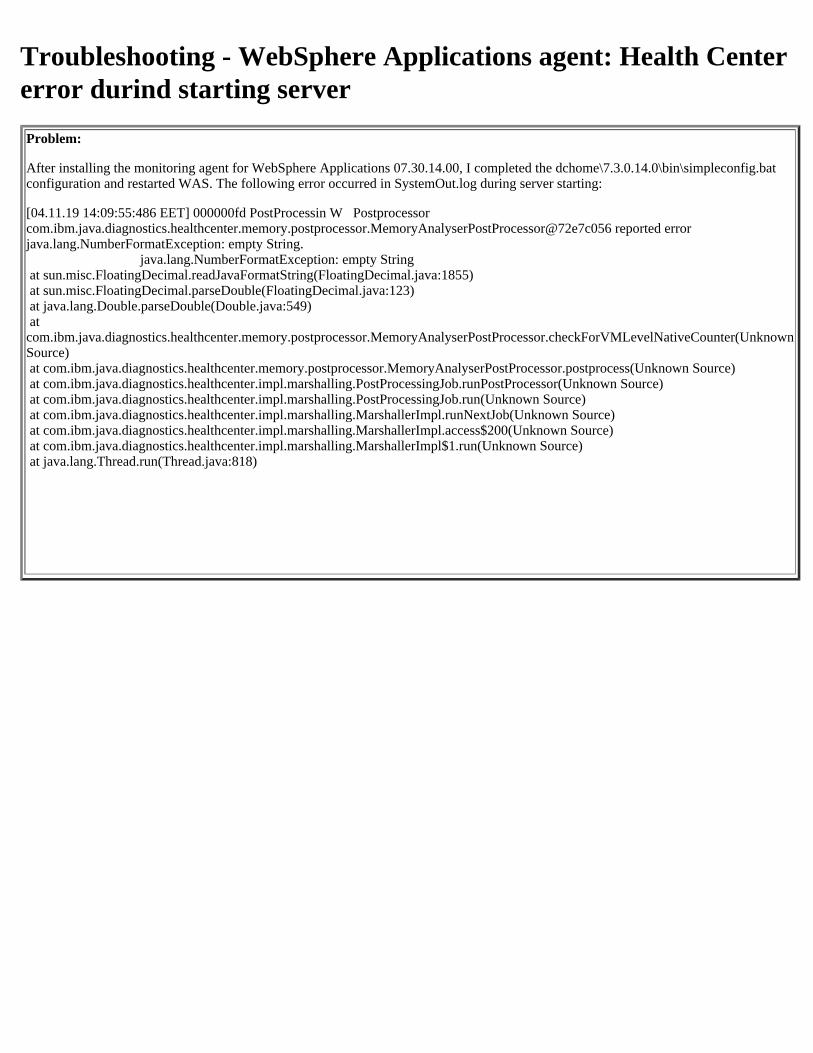
Troubleshooting - WebSphere Applications agent: Health Centererror durind starting serverProblem:
After installing the monitoring agent for WebSphere Applications 07.30.14.00, I completed the dchome\7.3.0.14.0\bin\simpleconfig.bat configuration and restarted WAS. The following error occurred in SystemOut.log during server starting:
[04.11.19 14:09:55:486 EET] 000000fd PostProcessin W Postprocessorcom.ibm.java.diagnostics.healthcenter.memory.postprocessor.MemoryAnalyserPostProcessor@72e7c056 reported errorjava.lang.NumberFormatException: empty String.
java.lang.NumberFormatException: empty String at sun.misc.FloatingDecimal.readJavaFormatString(FloatingDecimal.java:1855) at sun.misc.FloatingDecimal.parseDouble(FloatingDecimal.java:123) at java.lang.Double.parseDouble(Double.java:549) atcom.ibm.java.diagnostics.healthcenter.memory.postprocessor.MemoryAnalyserPostProcessor.checkForVMLevelNativeCounter(Unknown Source) at com.ibm.java.diagnostics.healthcenter.memory.postprocessor.MemoryAnalyserPostProcessor.postprocess(Unknown Source) at com.ibm.java.diagnostics.healthcenter.impl.marshalling.PostProcessingJob.runPostProcessor(Unknown Source) at com.ibm.java.diagnostics.healthcenter.impl.marshalling.PostProcessingJob.run(Unknown Source) at com.ibm.java.diagnostics.healthcenter.impl.marshalling.MarshallerImpl.runNextJob(Unknown Source) at com.ibm.java.diagnostics.healthcenter.impl.marshalling.MarshallerImpl.access$200(Unknown Source) at com.ibm.java.diagnostics.healthcenter.impl.marshalling.MarshallerImpl$1.run(Unknown Source) at java.lang.Thread.run(Thread.java:818)
Troubleshooting - Internet Service Monitoring agent -Renamed profile will have duplicate entries(original +renamed) in APM dashboard for 10 minutes afterprofile is renamed.Symptom- After profile is renamed, when administrator immediately checks entries of this profile in Application Performance Management Dashboard, duplicate entries of renamed profile exists.Original profile before rename and renamed profile both are seen in Application Performance Management dashboard.
Cause- syncing updated data to Application Performance Management dashboard is taking time.
Solution - Administrator should wait for 10 minutes to see updated renamed profile without any duplicate entry.
Troubleshooting - WebSphere MQ Agent: The sda fileby the latest DDD tool cannot be uploaded to server onAIX platformProblem:
The sda file by the latest DDD tool cannot be uploaded to server with the following error messages from agent log file:
(5D7F60A1.0000-18:kraajson.cpp,421,"IRA_JSON_FormatDataString") Unable to obtain JSON data buffer - size 67404716(5D7F60A1.0001-18:kraajson.cpp,680,"IRA_JSON_FormatDataCollection") Input JSON value is required - value NULL valueLength 0(5D7F60A1.0002-18:kraaomsg.cpp,1013,"IRA_outputAgentMessage") *CA-INFO: Custom metadata file/opt/ibm/apm/agent201903/aix526/mq/support/kmq_sda_8.1.9.0900.jar upload processing failed - Base64 encoding or JSON format error detected.
Cause:Â
It is caused by the memory problem about AIX ulimit setting.
Solution:
Use export LDR_CNTRL=MAXDATA=0x10000000 to resolve memory problem about AIX ulimit setting.
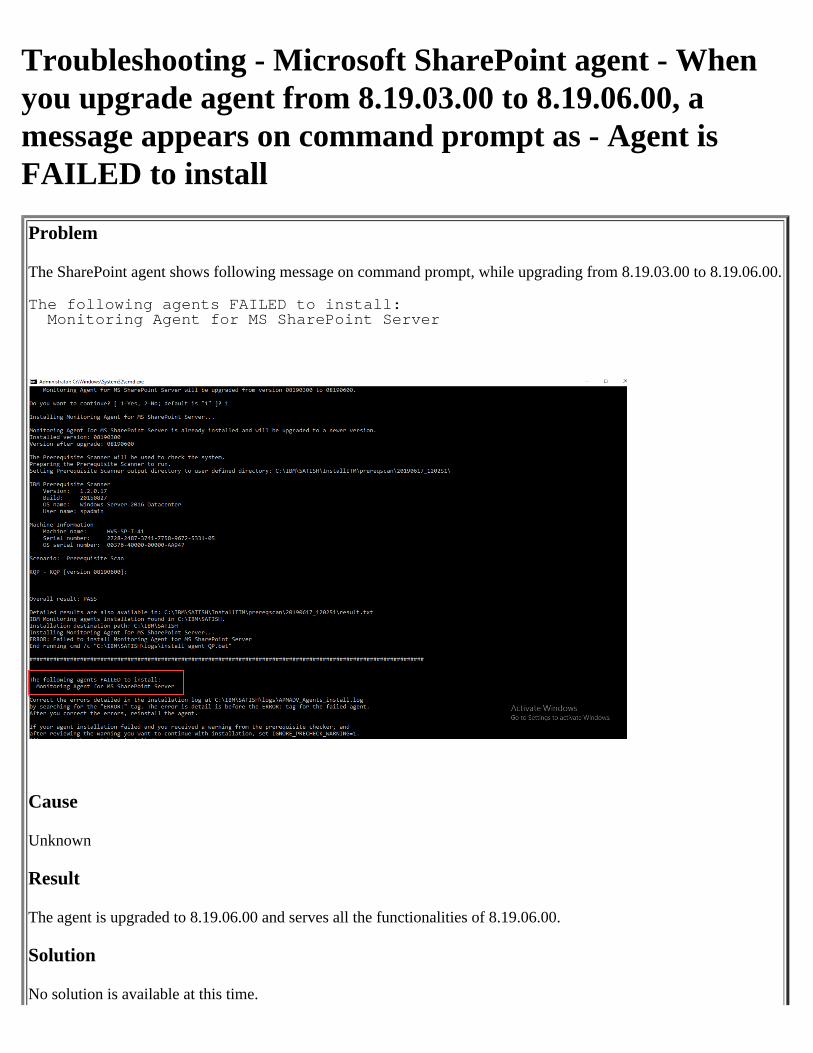
Troubleshooting - Microsoft SharePoint agent - Whenyou upgrade agent from 8.19.03.00 to 8.19.06.00, amessage appears on command prompt as - Agent isFAILED to install
Problem
The SharePoint agent shows following message on command prompt, while upgrading from 8.19.03.00 to 8.19.06.00.
The following agents FAILED to install: Monitoring Agent for MS SharePoint Server
Cause
Unknown
Result
The agent is upgraded to 8.19.06.00 and serves all the functionalities of 8.19.06.00.
Solution
No solution is available at this time.
Troubleshooting - Internet Service Monitoring Agent -Administrator cannot edit profiles if ESC button is used to cancelprofile-edit operation.Symptom- While editing profile, if administrator uses Esc button to cancel edit-operation then the administrator cannot edit the sameprofile for next 10 minutes.
Cause- To control simultaneous access to profiles, lock file is created for this feature. The lock file gets deleted once profile operationsare completed. The lock file creation and deletion operation button is on configuration panel.
Solution- Administrator must not use Esc button to cancel the current operation otherwise the administrator needs to delete the lock filemanually from the following location:
<MINinstallation_directory>/wlp/usr/servers/min/dropins/CentralConfigurationServer.war/data_source/is/$$<profile_name>$$<identifier>.lock.
Troubleshooting - Internet Service Monitoring Agent -Double click event do not triggered in the FirefoxbrowserSymptom- While editing profile, if administrator wants to set new values to sensitive fields, for example password, communityString etc., then administrator will not be able to edit sensitive fields if the administrator is using Firefox browser.
Solution- Administrator must use Chrome browser to create, edit profiles.

Troubleshooting - Internet Service Monitoring Agent -Blank custom.properties file gets displayed on MIN when agent is in stopped state for more than 10 minutes.Profiles must be redeployed on the MSN.
Troubleshooting - SAP HANA Database agent - SAPHANA Database Agent cannot connect to Master orStandby Host in SAP HANA System- High Availabilityenvironment.Solution - Create an entry in hosts file for Master and Standby Host.
Troubleshooting - SAP HANA Database agent - SAPHANA Agent is not able to connect to all the tenantdatabases of the SAP HANA Server. SAP HANA Agentis not able to connect to all the tenant databases of theSAP HANA Server. Solution - Create an entry in hosts file for the all the hosts on which tenant databases are created.
Troubleshooting - SAP HANA Database agent - Forscaled-out Tenant Databases , data for Table Sizeinformation and Alert Information cannot bedifferentiated.Alert information for SAP HANA systems older than version 1.00.122. No solution available at this point of time.
Troubleshooting - SAP HANA Database agent -HANA_Master_Down_Crit_SYS threshold will betriggered in case the slave host is down in scale outarchitecture of the SAP HANA system.No solution at this point of time due to technical limitations.
Troubleshooting - Internet Service Monitoring Agent -The agent is not listed in MSN on agent configurationpanel of APMUI dashboard or the resources are notpublished on KASS server or the data is not visible onMIN.
Symptoms: The agent is not listed in MSN on agent configuration panel of APMUI dashboard or the resources arenot published on KASS server or the data is not visible on MIN.
Cause: Port 9520 or port 9510 are already in use. Port 9520 is used for communication between agent & bridge andport 9510 is used for communication between bridge & monitors by default. If the ports are already in use the bridgeand agent module won't work properly.
Solution: To resolve the issue use the following steps:1) Check the status of Ports by using below commands-For Linux platform:
a. netstat| grep 9520b. netstat | grep 9510
For Windows platform:
a. netstat| find "9520"b. netstat | find "9510"
2) Stop the agent if status of port is TIME_WAIT/FIN_WAIT/CLOSE_WAIT/ SYN_RECV . Ideally, the port status must be ESTABILISHED.
3) Check the status of ports using the commands mentioned in step 1.4) Once the ports are free, restart agent.
Troubleshooting ICAM MSSQL Agent: DatabaseResource takes some time for loading databases.Symptoms: Issue is observed when user has created huge number of databases.
Cause: Intermittent issue when system is loaded with heavy processing.
Found in : ICAM 2019.2.0.1
Workaround: NA.
Troubleshooting ICAM MSSQL Agent: Blank databasepage is showed on the UI when database name containsspecial character '%'.Symptoms: Blank database page is showed on the UI for MSSQL Database resource when database name containsspecial character '%'.
Cause: Current known issue on UI.
Found in : ICAM 2019.2.0.1
Workaround: You can create or edit the database name by using any characters or special characters except '%'.
Troubleshooting ICAM MSSQL Agent: In custommetric, user can select only one dimension at a time.Symptoms: Issue is observed for the metric that the value depends on more than one dimensions.
Cause: Current known issue on UI.
Found in : ICAM 2019.2.0.1
Workaround: NA.
Troubleshooting ICAM MSSQL Agent: On flyover help,only metrics column information is displayed.Symptoms: Issue is observed for table widgets only.
Cause: Current known issue on UI.
Found in : ICAM 2019.2.0.1
Workaround: NA.
Troubleshooting: IIS Agent - If IIS 81407 agent isinstalled on any of the Windows 2019 OS editions, thenyou may not see the FTP sites details on the APMportal.
No workaround is available for this issue.
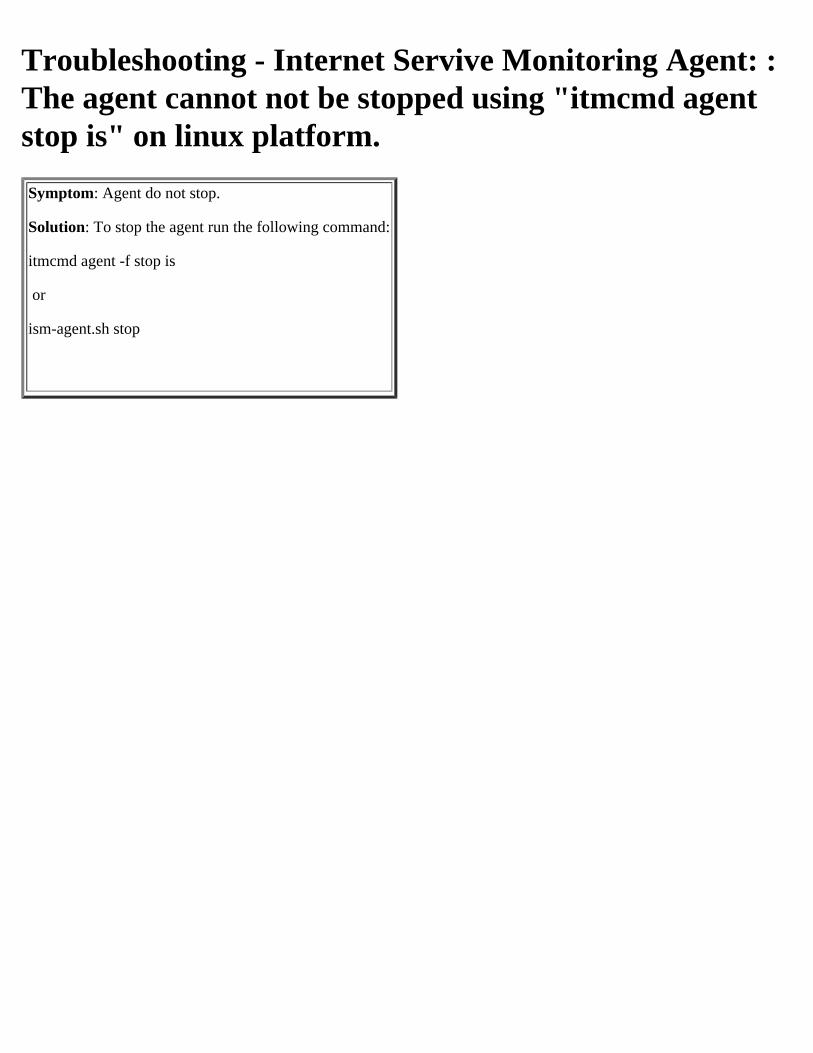
Troubleshooting - Internet Servive Monitoring Agent: :The agent cannot not be stopped using "itmcmd agentstop is" on linux platform.Symptom: Agent do not stop.
Solution: To stop the agent run the following command:
itmcmd agent -f stop is
or
ism-agent.sh stop
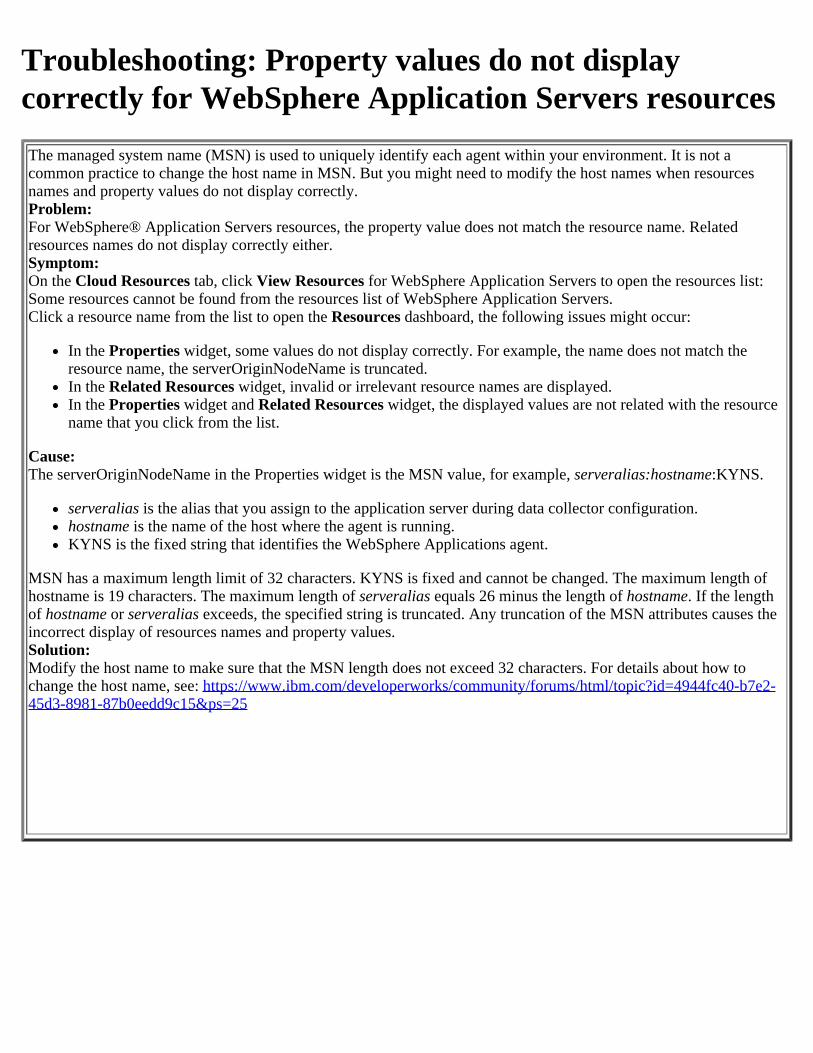
Troubleshooting: Property values do not displaycorrectly for WebSphere Application Servers resourcesThe managed system name (MSN) is used to uniquely identify each agent within your environment. It is not acommon practice to change the host name in MSN. But you might need to modify the host names when resourcesnames and property values do not display correctly.Problem:For WebSphere® Application Servers resources, the property value does not match the resource name. Relatedresources names do not display correctly either.Symptom:On the Cloud Resources tab, click View Resources for WebSphere Application Servers to open the resources list:Some resources cannot be found from the resources list of WebSphere Application Servers.Click a resource name from the list to open the Resources dashboard, the following issues might occur:
In the Properties widget, some values do not display correctly. For example, the name does not match theresource name, the serverOriginNodeName is truncated.In the Related Resources widget, invalid or irrelevant resource names are displayed.In the Properties widget and Related Resources widget, the displayed values are not related with the resourcename that you click from the list.
Cause:The serverOriginNodeName in the Properties widget is the MSN value, for example, serveralias:hostname:KYNS.
serveralias is the alias that you assign to the application server during data collector configuration.hostname is the name of the host where the agent is running.KYNS is the fixed string that identifies the WebSphere Applications agent.
MSN has a maximum length limit of 32 characters. KYNS is fixed and cannot be changed. The maximum length ofhostname is 19 characters. The maximum length of serveralias equals 26 minus the length of hostname. If the lengthof hostname or serveralias exceeds, the specified string is truncated. Any truncation of the MSN attributes causes theincorrect display of resources names and property values.Solution:Modify the host name to make sure that the MSN length does not exceed 32 characters. For details about how tochange the host name, see: https://www.ibm.com/developerworks/community/forums/html/topic?id=4944fc40-b7e2-45d3-8981-87b0eedd9c15&ps=25
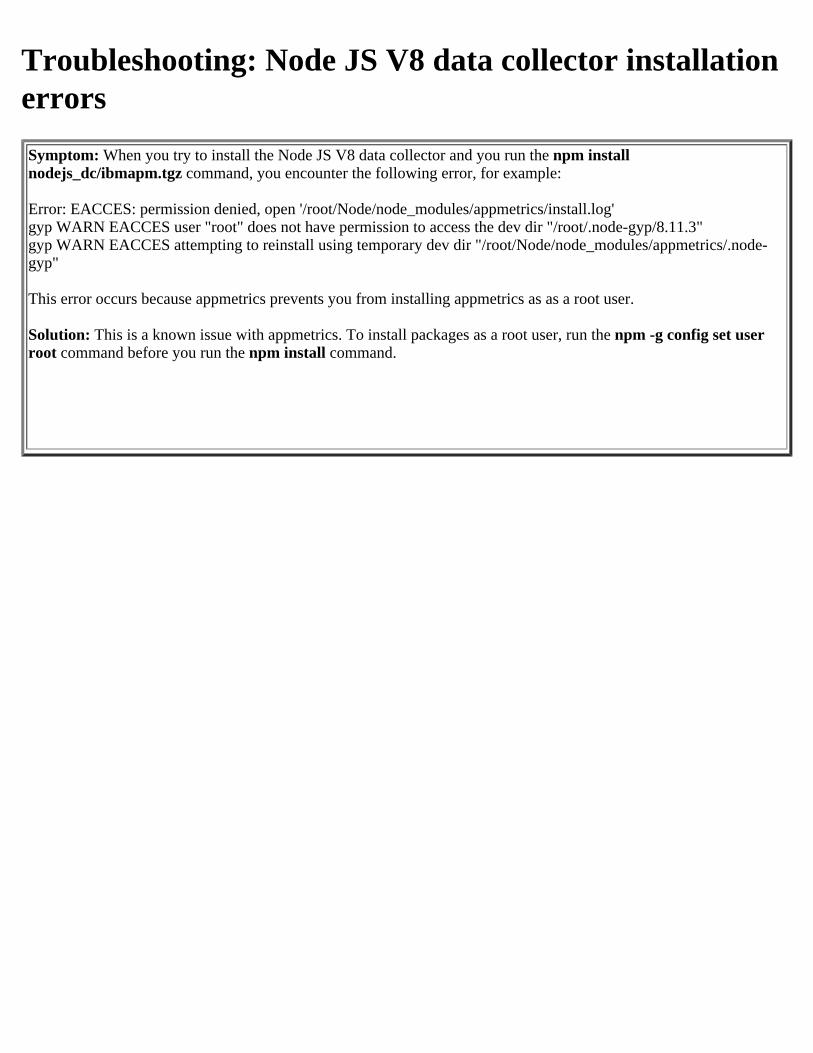
Troubleshooting: Node JS V8 data collector installationerrorsSymptom: When you try to install the Node JS V8 data collector and you run the npm installnodejs_dc/ibmapm.tgz command, you encounter the following error, for example:
Error: EACCES: permission denied, open '/root/Node/node_modules/appmetrics/install.log'gyp WARN EACCES user "root" does not have permission to access the dev dir "/root/.node-gyp/8.11.3"gyp WARN EACCES attempting to reinstall using temporary dev dir "/root/Node/node_modules/appmetrics/.node-gyp"
This error occurs because appmetrics prevents you from installing appmetrics as as a root user.
Solution: This is a known issue with appmetrics. To install packages as a root user, run the npm -g config set user root command before you run the npm install command.
Troubleshooting - Cassandra agent: The agent storesJMX password in plain text
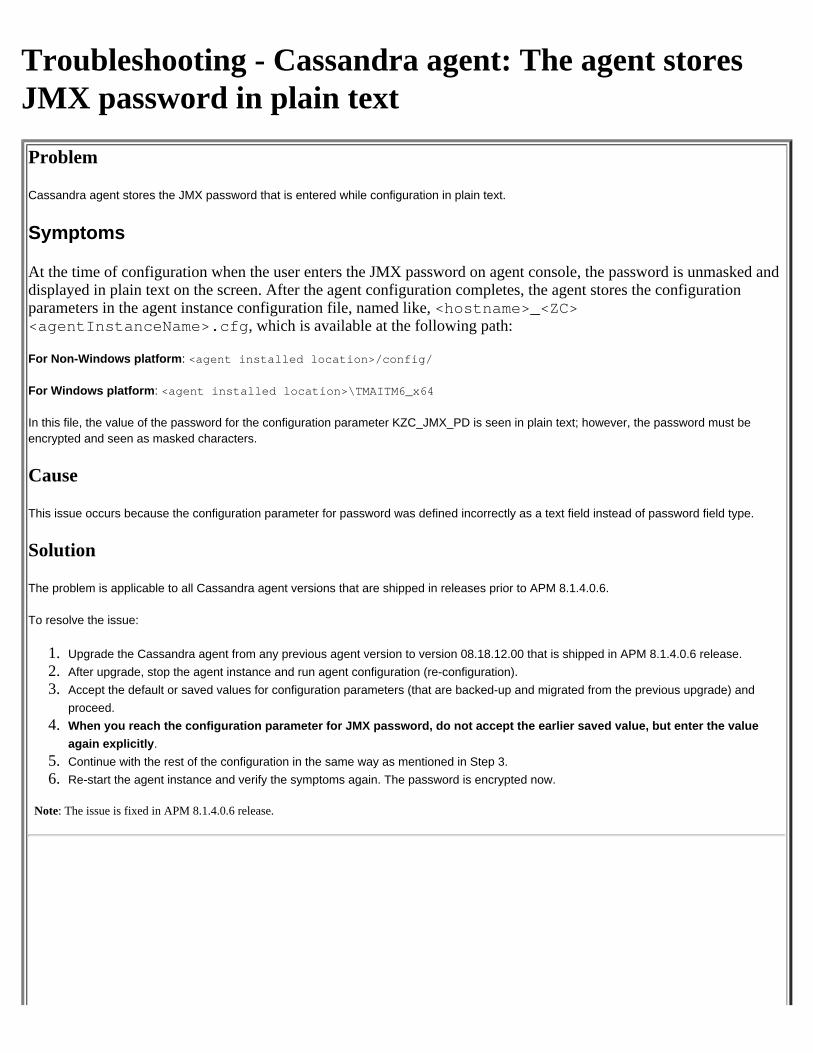
Problem
Cassandra agent stores the JMX password that is entered while configuration in plain text.
Symptoms
At the time of configuration when the user enters the JMX password on agent console, the password is unmasked anddisplayed in plain text on the screen. After the agent configuration completes, the agent stores the configurationparameters in the agent instance configuration file, named like, <hostname>_<ZC><agentInstanceName>.cfg, which is available at the following path:
For Non-Windows platform: <agent installed location>/config/
For Windows platform: <agent installed location>\TMAITM6_x64
In this file, the value of the password for the configuration parameter KZC_JMX_PD is seen in plain text; however, the password must beencrypted and seen as masked characters.
Cause
This issue occurs because the configuration parameter for password was defined incorrectly as a text field instead of password field type.
Solution
The problem is applicable to all Cassandra agent versions that are shipped in releases prior to APM 8.1.4.0.6.
To resolve the issue:
1. Upgrade the Cassandra agent from any previous agent version to version 08.18.12.00 that is shipped in APM 8.1.4.0.6 release.2. After upgrade, stop the agent instance and run agent configuration (re-configuration).3. Accept the default or saved values for configuration parameters (that are backed-up and migrated from the previous upgrade) and
proceed.4. When you reach the configuration parameter for JMX password, do not accept the earlier saved value, but enter the value
again explicitly.5. Continue with the rest of the configuration in the same way as mentioned in Step 3.6. Re-start the agent instance and verify the symptoms again. The password is encrypted now.
Note: The issue is fixed in APM 8.1.4.0.6 release.
Troubleshooting: WAS agent is not showing data inCloud App ManagementSymptom: In Cloud App Management, after you upgrade the WAS agent to version 7.3.0.14 ifix 06 in Windows and the Cloud App Management server to V 4.1, the WAS agent does not show data in Windows. In the Cloud App Management console, there are two instances of the Websphere Application Servers resource shown with the same name. One resource shows data and the other resource doesn't show any data.
Solution: This is a known issue. You can ignore the resource that is not showing data.
Troubleshooting: Inability to stop automated deletion of_alert.idx fileProblem: Inability to stop automated deletion of <SID>_alert.idx file.
Symptom: User sees all the open and closed CCMS alerts after every agent or SAP System restarts.
Cause : In SAP Agent 7.1.1 Fix Pack 14 deletion of CCMS related idx file deletion was automated in case SAP agentor SAP system restarts.
Solution:
For The SAP agent 7.1.1 Fix Pack 15, two configurable parameters are provided to delete the idx file when theSAP System and SAP Agent is restarted.
1. If user wants to enable deletion of idx file when the SAP Agent restarts, set the environment variable's value to'Y' or 'y'.
2. If user wants to enable deletion of idx file when the SAP System restarts, then set the environment variablevalue 'Y' or 'y'.
The values provided for the variables are 'Y' , 'y' to enable the deletion and 'N' , 'n' to disable the deletion of idxfile. If the modifications are done while the Agent is running then the user needs restart the agent. The defaultconfiguration for both parameters is set to 'N' which indicates that the deletion of idx file is disabled.To enable the idx file deletion on Windows: Instance specific configuration file KSAENV_<instance_name>needs to be modified.To enable the idx file deletion on Linux/Unix: As SAP Agent does not create instance specific environment file,there exists a single global file ".sa.environment" which needs to be modified. Please note the changes will beapplicable to all the Agent instances from the same $CANDLEHOME.
Troubleshooting: Sybase Agent that is upgraded from8.1.4.0.4 to the later version failed to display theupgrade message on AIX environmentProblem: Sybase Agent that is upgraded from 8.1.4.0.4 to the later version failed to display the upgrade message onAIX environment.
Workaround is not available.
Troubleshooting: Sybase Agent fails to startautomatically after upgrade from 8.1.4.0.4 to the laterversion on RHELProblem:
After Sybase agent is upgraded from 8.1.4.0.4 to the later version on RHEL , the agent fails to start automatically.
Workaround:
Start the agent manually after successful upgrade.
Command to start agent: <install_dir>/bin/sybase-agent.sh start <instance_name>
Troubleshooting: DB2 agent - Incorrect memory usagepercent value displayed on the "Memory Usage (%)-Top 5" widgetProblem:
The value for memory usage percent displays with wrong precision on "Memory Usage (%)-Top 5" widget.
Cause:
Some changes in the Memory Used Percentage attribute definition causes the precision issue.
Workaround:
You can get actual value from the Attribute Details tab.OrYou can read the value by multiplying 100. For example, you can read 0.5633 as 56.33.Also, the KUD_DB2_Database00.Memory Used Percentage attribute is used to get the value and you can have custom situation without any inverse impact.
Note: The issue occurs in APM 8.1.4.0.3, 8.1.4.0.4, and 8.1.4.0.5 release. This issue is fixed in APM 8.1.4.0.6.
Troubleshooting: Agents with multiple attribute grouptables report different metricsSymptom:Agents with multiple attribute group tables can potentially report different metrics. Here, the MqQueue agent is described to provide an example only to demonstrate the behavior that can occur for any resources where multiple attribute group tables contribute to the resource definition but have additional properties or metrics that differ from each other.
The MqQueue agent has five different attribute groups that can report on an instance of mqQueue. Each attribute group that reports on a given instance includes metric properties. These metric properties determine which metrics exist or do not exist for the mqQueue instance. As a result,the Queue resource is visible in one or more of the attribute tables. Then, information is generated that updates the Queue resource.
Each of the attribute tables may have a different set of properties and metrics depending on the context for the queue. Also it is possible that the same queue may be reported on by more than one attribute table. This behavior leads to visualized differences in both the property and the metric content visible for a given Queue, depending on which attribute tables provide information about the queue.
Some properties and metrics may be the same across the different attribute tables but there may also be different properties and metrics depending on the context for the attribute table. This leads to variance in what is visible for a given queue depending on which attribute table(s) or contexts(s) the queue reported against.
Solution:This is a known issue for which there is no solution.
Troubleshooting: Microsoft Exchange Server - Whileaccessing through "My Components", no data shown onthe dashboard overview page of Microsoft ExchangeServer 2013/2016Severity: 3Compid: 5725U05ES
Abstract:For APM Exchange agent, while accessing the APM dashboard through "My Components -> Microsoft ExchangeServer 2013 -> <Instance Name>"
for monitoring Microsoft Exchange Server 2013/2016 , the data is not shown on the overview page.
Environment:IBM Cloud Application Performance Management Version : 8.1.4.0Exchange Server version : 2013, 2016Exchange Agent Version : 06.31.14
Problem Description:When you use APM Monitoring Agent for Microsoft Exchange Server to monitor Exchange server 2013/2016,and you are accessing the APM dashboard through "My Components -> Microsoft Exchange Server 2013 -><Instance Name>",the APM UI is loading the dashboard for "Microsoft Exchange Server" component instead of "Microsoft ExchangeServer 2013".Hence there is no data shown on the overview page.
Detailed Recreation Procedure and messages that you see in the log files:
1. Install APM Monitoring Agent for Microsoft Exchange Server to monitor Microsoft Exchange Server 2013/2016.2. Configure and start the Exchange agent.3. On APM UI, navigate to "My Components -> Microsoft Exchange Server 2013 -> <Instance Name>".
It will load an overview page for "Microsoft Exchange Server" component instead of "Microsoft Exchange Server2013"
and there will be no data shown on overview page.
There are no specific messages in agent logs to determine this problem.
Workaround :
This is known behaviour for current Exchange Agent design.The exchange agent has two types of dashboards based on the Exchange Server version being monitored.Exchange server 2010 will be monitored through "Microsoft Exchange Server" component on APM dashboard; and
Exchange server 2013 and later will be monitored through "Microsoft Exchange Server 2013" component on APMdashboard.Both dashboard types display different widgets and data depending on the Exchange Server version.In order to see the data for exchange agent correctly, user needs to create an application by selecting the specificcomponent of the monitored exchange server version.Then user can access the dashboard through the particular application.Note: Do not access the dashboard through My Components.
Steps to create a new application to monitor Exchange Server 2013/2016:
1) On the Application Performance Dashboard, click Add Application.2) Enter a unique name for the application and click on Add Components, then selectMicrosoft Exchange Server 2013 from the list of the available components.3) Select the Agent instance that you want to monitor, then click on Add to add theselected agent nodes to the application, and click Back. The Application componentslist will be updated with the new component names.4) After you finished defining the application, close the application editor byclicking Save to save your changes.5) To view the data for Exchange agent, access the dashboard throughAll My Applications -> <Application_name> -> Components -> Microsoft Exchangeand then select agent from System Overview page.
Troubleshooting - Internet Servive Monitoring Agent: :For ISM Agent 7.4.0.4 supports are not seeded on MINside after upgrading the agent from 8.1.4.0.4 to 8.1.4.0.5packages.
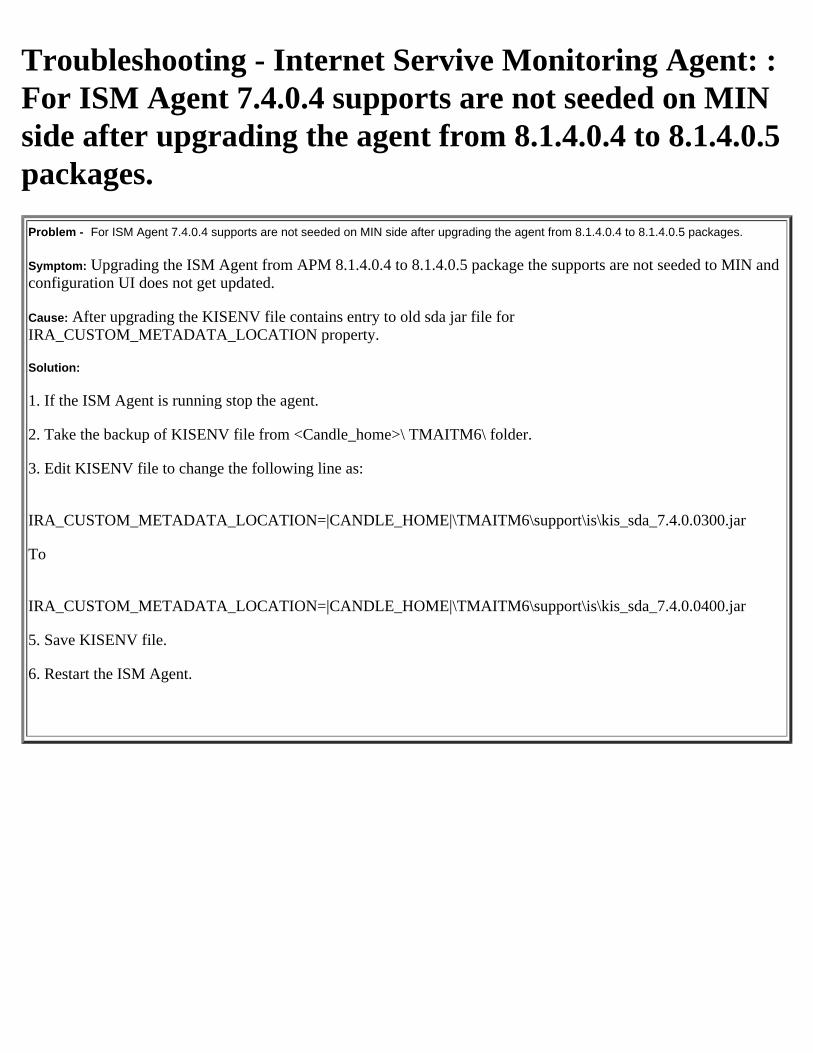
Problem - For ISM Agent 7.4.0.4 supports are not seeded on MIN side after upgrading the agent from 8.1.4.0.4 to 8.1.4.0.5 packages.
Symptom: Upgrading the ISM Agent from APM 8.1.4.0.4 to 8.1.4.0.5 package the supports are not seeded to MIN andconfiguration UI does not get updated.
Cause: After upgrading the KISENV file contains entry to old sda jar file forIRA_CUSTOM_METADATA_LOCATION property.
Solution:
1. If the ISM Agent is running stop the agent.
2. Take the backup of KISENV file from <Candle_home>\ TMAITM6\ folder.
3. Edit KISENV file to change the following line as:
IRA_CUSTOM_METADATA_LOCATION=|CANDLE_HOME|\TMAITM6\support\is\kis_sda_7.4.0.0300.jar
To
IRA_CUSTOM_METADATA_LOCATION=|CANDLE_HOME|\TMAITM6\support\is\kis_sda_7.4.0.0400.jar
5. Save KISENV file.
6. Restart the ISM Agent.
Troubleshooting -ISM Agent - Help (?) icon and Cancelbutton are truncated on DHCP, SMTP, TRANSX,ICMP monitors configuration pages.Problem:Help (?) icon and Cancel button are truncated on DHCP, SMTP, TRANSX, ICMP monitors' configuration pages.
Symptom: Help (?) icon and Cancel button on DHCP, SMTP, TRANSX, ICMP monitors' configuration pages are partially visible.
Cause: Screen resolution restrictions.
Solution: The maximum permissible screen resolution which is recommended by developers is 1366 X 768.
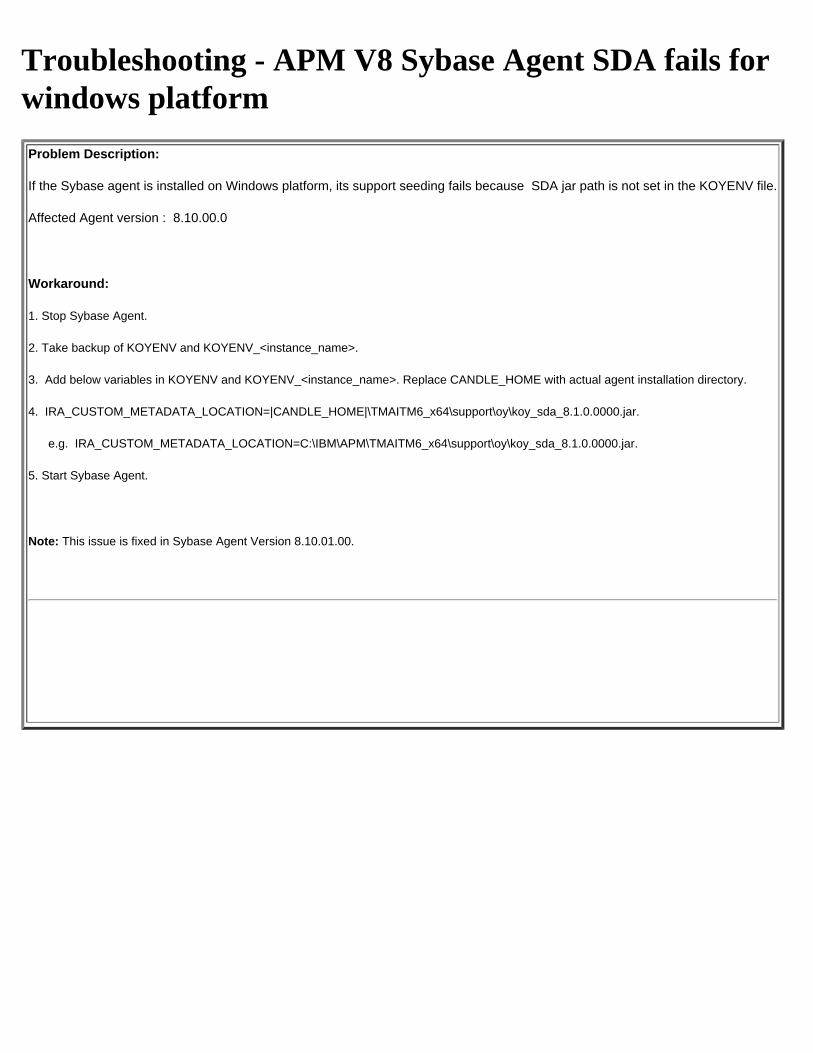
Troubleshooting - APM V8 Sybase Agent SDA fails forwindows platformProblem Description:
If the Sybase agent is installed on Windows platform, its support seeding fails because SDA jar path is not set in the KOYENV file.
Affected Agent version : 8.10.00.0
Workaround:
1. Stop Sybase Agent.
2. Take backup of KOYENV and KOYENV_<instance_name>.
3. Add below variables in KOYENV and KOYENV_<instance_name>. Replace CANDLE_HOME with actual agent installation directory.
4. IRA_CUSTOM_METADATA_LOCATION=|CANDLE_HOME|\TMAITM6_x64\support\oy\koy_sda_8.1.0.0000.jar.
e.g. IRA_CUSTOM_METADATA_LOCATION=C:\IBM\APM\TMAITM6_x64\support\oy\koy_sda_8.1.0.0000.jar.
5. Start Sybase Agent.
Note: This issue is fixed in Sybase Agent Version 8.10.01.00.
Troubleshooting: Availabilty Monitoring can't beaccessed in the Clould APM trial.
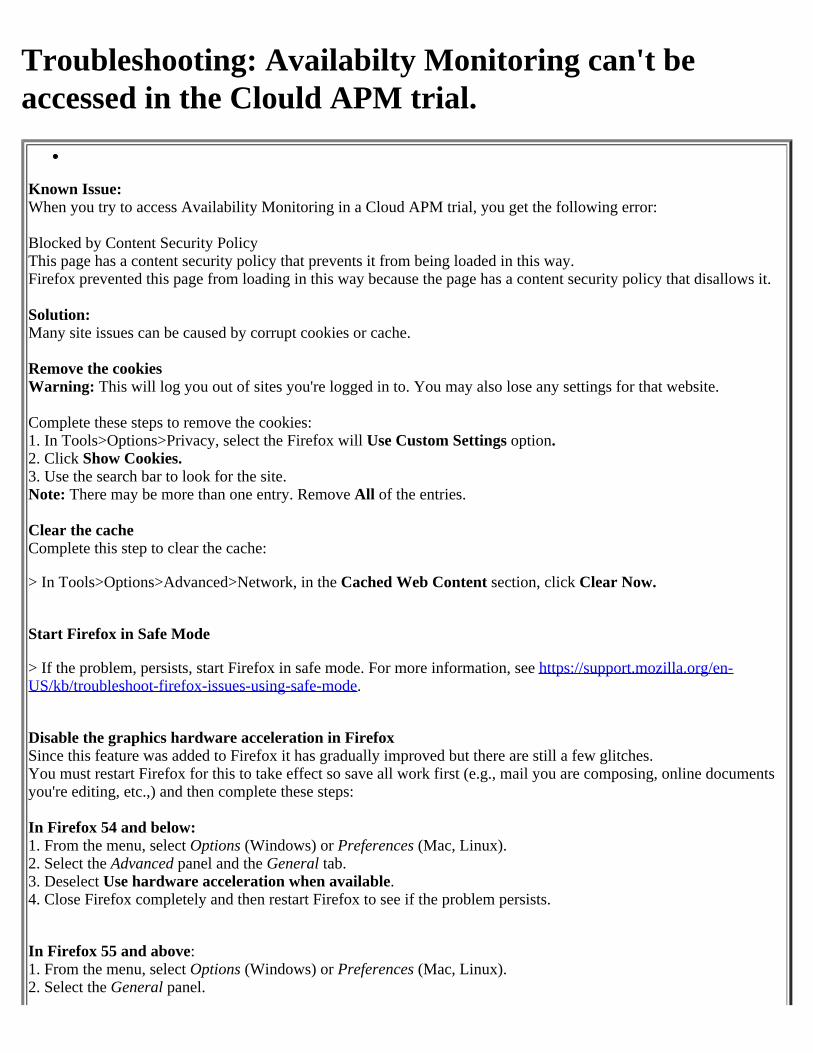
Known Issue:When you try to access Availability Monitoring in a Cloud APM trial, you get the following error:
Blocked by Content Security PolicyThis page has a content security policy that prevents it from being loaded in this way.Firefox prevented this page from loading in this way because the page has a content security policy that disallows it.
Solution:Many site issues can be caused by corrupt cookies or cache.
Remove the cookiesWarning: This will log you out of sites you're logged in to. You may also lose any settings for that website.
Complete these steps to remove the cookies:1. In Tools>Options>Privacy, select the Firefox will Use Custom Settings option.2. Click Show Cookies.3. Use the search bar to look for the site.Note: There may be more than one entry. Remove All of the entries.
Clear the cacheComplete this step to clear the cache:
> In Tools>Options>Advanced>Network, in the Cached Web Content section, click Clear Now.
Start Firefox in Safe Mode
> If the problem, persists, start Firefox in safe mode. For more information, see https://support.mozilla.org/en-US/kb/troubleshoot-firefox-issues-using-safe-mode.
Disable the graphics hardware acceleration in FirefoxSince this feature was added to Firefox it has gradually improved but there are still a few glitches.You must restart Firefox for this to take effect so save all work first (e.g., mail you are composing, online documentsyou're editing, etc.,) and then complete these steps:
In Firefox 54 and below:1. From the menu, select Options (Windows) or Preferences (Mac, Linux).2. Select the Advanced panel and the General tab.3. Deselect Use hardware acceleration when available.4. Close Firefox completely and then restart Firefox to see if the problem persists.
In Firefox 55 and above:1. From the menu, select Options (Windows) or Preferences (Mac, Linux).2. Select the General panel.

3. Under Performance, deselect Use recommended performance settings. Additional settings are displayed.4. Deselect Use hardware acceleration when available.5. Close Firefox completely and then restart Firefox to see if the problem persists.
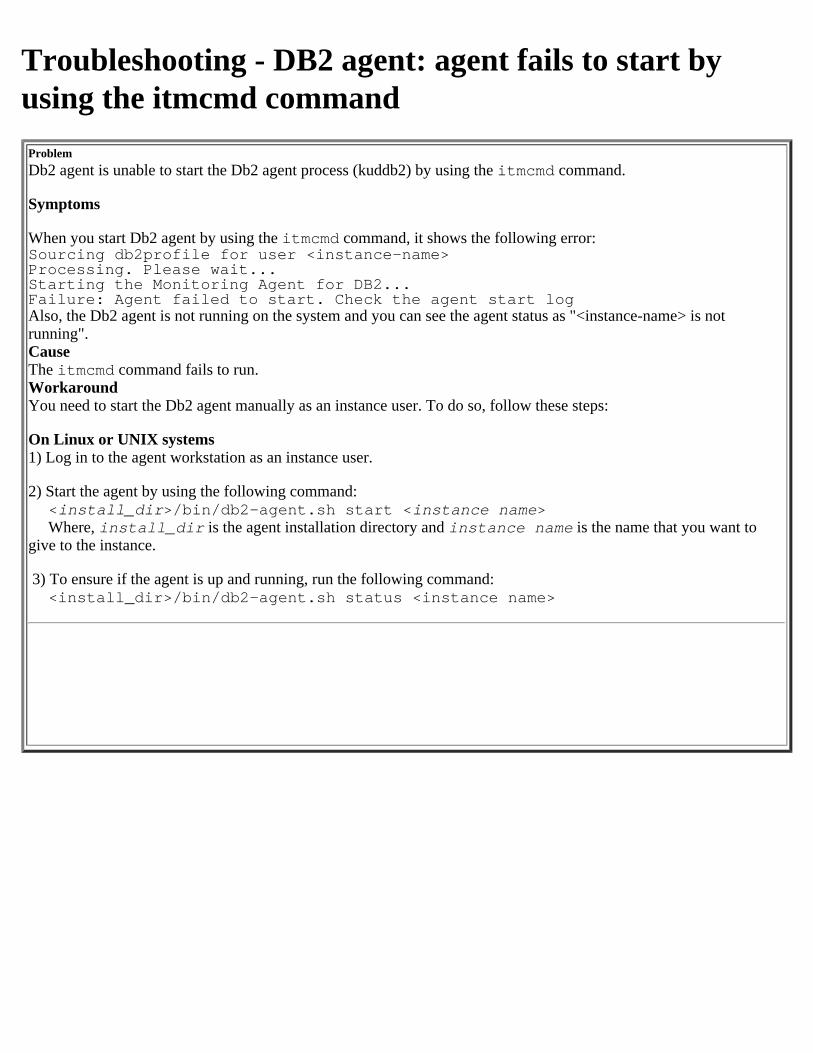
Troubleshooting - DB2 agent: agent fails to start byusing the itmcmd command
ProblemDb2 agent is unable to start the Db2 agent process (kuddb2) by using the itmcmd command.
Symptoms
When you start Db2 agent by using the itmcmd command, it shows the following error:Sourcing db2profile for user <instance-name>Processing. Please wait...Starting the Monitoring Agent for DB2...Failure: Agent failed to start. Check the agent start logAlso, the Db2 agent is not running on the system and you can see the agent status as "<instance-name> is notrunning".CauseThe itmcmd command fails to run.WorkaroundYou need to start the Db2 agent manually as an instance user. To do so, follow these steps:
On Linux or UNIX systems1) Log in to the agent workstation as an instance user.
2) Start the agent by using the following command:<install_dir>/bin/db2-agent.sh start <instance name>Where, install_dir is the agent installation directory and instance name is the name that you want to
give to the instance.
3) To ensure if the agent is up and running, run the following command:<install_dir>/bin/db2-agent.sh status <instance name>
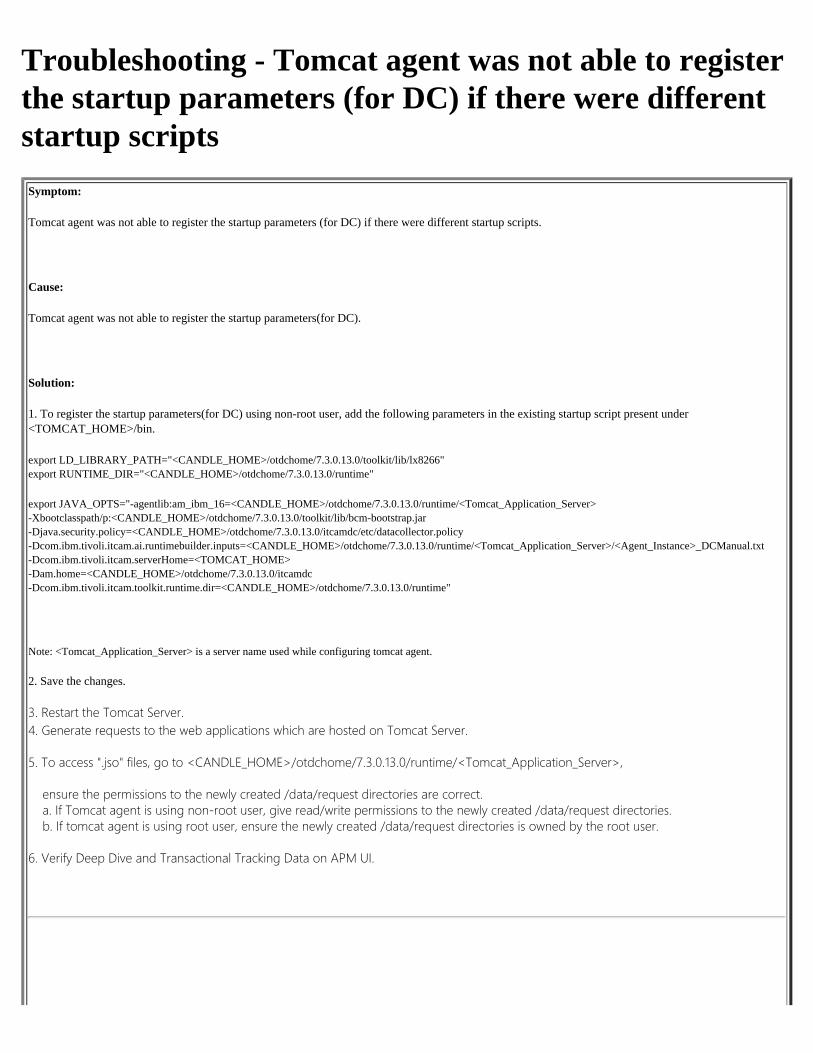
Troubleshooting - Tomcat agent was not able to registerthe startup parameters (for DC) if there were differentstartup scripts
Symptom:
Tomcat agent was not able to register the startup parameters (for DC) if there were different startup scripts.
Cause:
Tomcat agent was not able to register the startup parameters(for DC).
Solution:
1. To register the startup parameters(for DC) using non-root user, add the following parameters in the existing startup script present under<TOMCAT_HOME>/bin.
export LD_LIBRARY_PATH="<CANDLE_HOME>/otdchome/7.3.0.13.0/toolkit/lib/lx8266"export RUNTIME_DIR="<CANDLE_HOME>/otdchome/7.3.0.13.0/runtime"
export JAVA_OPTS="-agentlib:am_ibm_16=<CANDLE_HOME>/otdchome/7.3.0.13.0/runtime/<Tomcat_Application_Server>-Xbootclasspath/p:<CANDLE_HOME>/otdchome/7.3.0.13.0/toolkit/lib/bcm-bootstrap.jar-Djava.security.policy=<CANDLE_HOME>/otdchome/7.3.0.13.0/itcamdc/etc/datacollector.policy-Dcom.ibm.tivoli.itcam.ai.runtimebuilder.inputs=<CANDLE_HOME>/otdchome/7.3.0.13.0/runtime/<Tomcat_Application_Server>/<Agent_Instance>_DCManual.txt-Dcom.ibm.tivoli.itcam.serverHome=<TOMCAT_HOME>-Dam.home=<CANDLE_HOME>/otdchome/7.3.0.13.0/itcamdc-Dcom.ibm.tivoli.itcam.toolkit.runtime.dir=<CANDLE_HOME>/otdchome/7.3.0.13.0/runtime"
Note: <Tomcat_Application_Server> is a server name used while configuring tomcat agent.
2. Save the changes.
3. Restart the Tomcat Server.4. Generate requests to the web applications which are hosted on Tomcat Server.
5. To access ".jso" files, go to <CANDLE_HOME>/otdchome/7.3.0.13.0/runtime/<Tomcat_Application_Server>,
ensure the permissions to the newly created /data/request directories are correct.a. If Tomcat agent is using non-root user, give read/write permissions to the newly created /data/request directories.b. If tomcat agent is using root user, ensure the newly created /data/request directories is owned by the root user.
6. Verify Deep Dive and Transactional Tracking Data on APM UI.
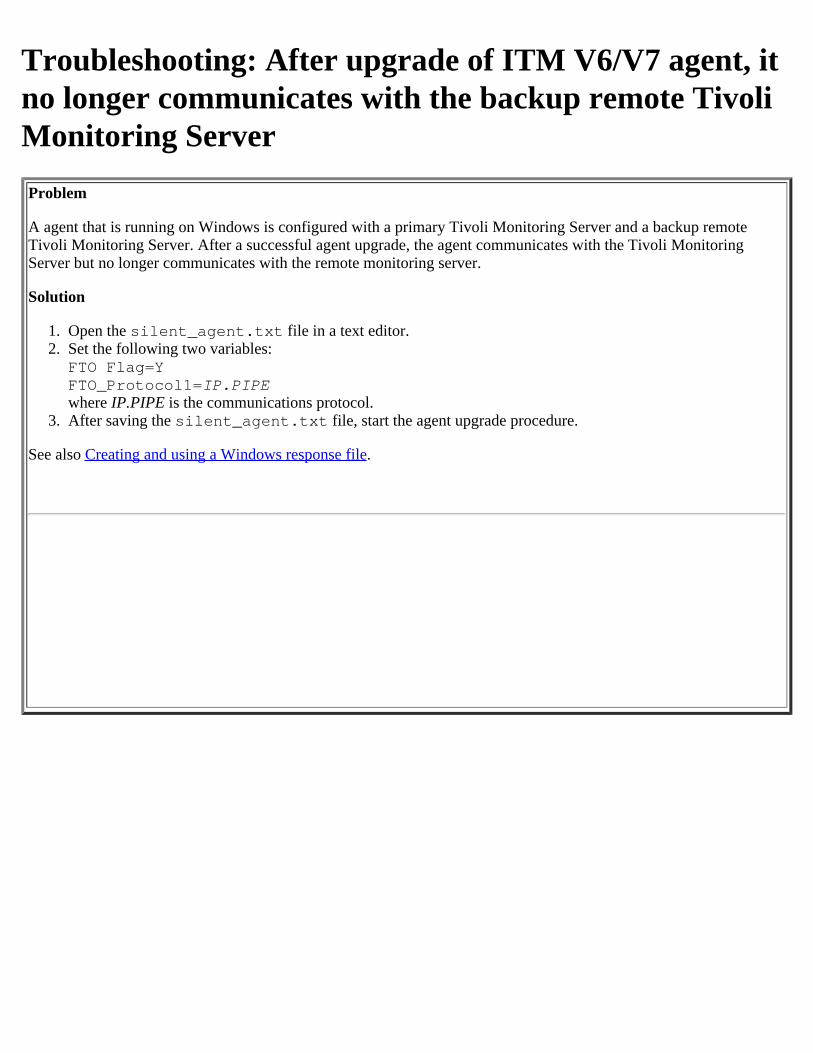
Troubleshooting: After upgrade of ITM V6/V7 agent, itno longer communicates with the backup remote TivoliMonitoring ServerProblem
A agent that is running on Windows is configured with a primary Tivoli Monitoring Server and a backup remoteTivoli Monitoring Server. After a successful agent upgrade, the agent communicates with the Tivoli MonitoringServer but no longer communicates with the remote monitoring server.
Solution
1. Open the silent_agent.txt file in a text editor.2. Set the following two variables:
FTO Flag=YFTO_Protocol1=IP.PIPEwhere IP.PIPE is the communications protocol.
3. After saving the silent_agent.txt file, start the agent upgrade procedure.
See also Creating and using a Windows response file.
Troubleshooting - Internet Servive Monitoring Agent:Deploying multiple profile in a short interval of time.Symptoms: No major impact on the performance but the following method is recommended.
Solution: In case of deploying multiple profiles in short interval of time , it is recommended to increase the ConfigurationCheckInterval to allow complete deployment of profiles before monitors start checking for the changes in the profiles. ConfigurationCheckInterval can be set through the monitor's property fileCANDLEHOME/tmaitm6/ism/etc/props/<monitorname>.props
Troubleshooting - Internet Servive Monitoring Agentcannot not be uninstalled completely using smai-agent.bat uninstall_all
Symptom: : Monitor services are not deleted from the system.
Solution: To uninstall all monitoring agents on the server using smai-agent.bat, first run the ism-agent.bat with"uninstall" as an argument and then run the smai-agent.bat. In case you have already uninstalled the ISM agent using smai-agent.bat services entries will remain. No solution available available at this time.

Troubleshooting - Internet Service Monitoring Agent: Wrong Profile Entries may be displayed while editing the profiles from different browsers simultaneously.Symptom: User could see miss match in the entries when profiles are edited simultaneously. Solution: User needs to close the profile popup and click on refresh from the grid.
Troubleshooting - Internet Servive Monitoring Agent:On the configuration help for select service page donebutton does not exist when.
Symptom:On the configuration help for select service page edit>help>done. Done button does not exists.
Solution: No solution at this time.
Troubleshooting - Internet Servive MonitoringAgent:When user attempts to edit the configurablefields of TRANSX monitor, it cannot be edited.Symptoms: TRANSX monitor does not allow to edit the configurable fields
Solution: No solution available at this time.

Troubleshooting - Internet Service Monitoring Agent: when trying to edit the created profiles changes doesn’t reflect after editing the profile.Symptoms:Changes cannot be seen after editing the created profiles.
Solution: User needs to click on refresh for the changes to get reflected.

Troubleshooting - Internet Servive Monitoring Agent:when user attempts to edit the created profiles onlyadvance tab fields can be edited
Symptoms: Except advance tab no other tab can be edited Solution: No solution available at this time
Troubleshooting - DB2 agent: Watchdog process(kcawd) in the OS agent is unable to start the Db2 agent
ProblemWhen the Db2 agent is stopped abruptly, the watchdog process (kcawd) in the Operating System (OS) agent fails tostart the Db2 agent on the Linux or UNIX operating systems.Symptoms
The Db2 agent is not running on the system and the OS agent log shows the following error:
(5B449DB1.0000-A:kcawd.cpp,589,"checkAvailability") Availability script failed and Agent <kudagent> isdown; rc = 1, command output <>
(5B449DB1.0001-A:kcawd.cpp,590,"checkAvailability") *** INFO: Starting unavailable Agent <kudagent>
(5B449DB1.0002-A:kcactrl.cpp,3389,"ProcessOpStateChange") *** WARNING: Agent ID <kudagent> 'RestartCount' exceeded and will not be restarted
(5B44A008.0000-A:kcawd.cpp,344,"checkRunningState") Agent <kudagent> 'Restart Count' exceeded <4>, do notcall cinfo/availability script
CauseThe watchdog process fails to run the itmcmd command.WorkaroundYou need to start the Db2 agent manually as an instance user. To do so, follow these steps:
On Linux or UNIX systems1) Log in to the agent workstation as an instance user.
2) Start the agent by using the following command:<install_dir>/bin/db2-agent.sh start <instance name>Where, install_dir is the agent installation directory and instance name is the name that you want to
give to the instance.
3) To ensure if the agent is up and running, run the following command:<install_dir>/bin/db2-agent.sh status <instance name>
Troubleshooting - SAP Agent: Function Module/IBMMON/ITM_JOBS is taking more than expectedtime for execution.Symptom: Function Module /IBMMON/ITM_JOBS executes slowly.
Solution: In order to resolve this issue, user has to create an entry in the database table /IBMMON/ITM_CNFG which is as following: PARM_NAME = BATCH_JOBS_PERF and VALUE_CHAR = YES. After creation of BATCH_JOBS_PERF entry, Function Module /IBMMON/ ITM_JOBS will fetch only those Batch Jobs which have status as "Active" or "Canceled/Aborted" and has the row count equivalent to Critical Constant value that is configured in the Transaction Code - /N/IBMMON/ITM_CONFIG. Note: If the Critical Constant value is not configured in the Transaction Code - /N/IBMMON/ITM_CONFIG then by default the Function Module/IBMMON/ITM_JOBS fetches the row count equivalent to 2500 entries.
Troubleshooting - Microsoft SQL Server agent:Database Server Properties window does not display theupgraded version of the SQL ServerSymptom:When you upgrade the SQL Server from V2005 to V2008 R2, V2012, or V2014 and configure the SQL Server agentlocally, the database version in the Database Server Properties window does not display the upgraded version of theSQL Server.
Solution:Remove the earlier instance of the SQL Server agent and create another instance.
Note:
This issue is valid with SQL Server upgrade version from 2005 to 2008 R2This issue is not a valid with SQL Server upgrade version from 2012 to 2014
Troubleshooting - Microsoft SQL Server agent: DBINCLUDE/EXCLUDE configuration panel supportsonly 256 charactersSymptom:The DB INCLUDE/EXCLUDE configuration panel supports only 256 characters. If you configure the SQL Serveragent with more than 256 characters, the following error message is displayed and you cannot reconfigure the agent:Unspecified error
Solution:This issue is a known issue and we do not have a solution.
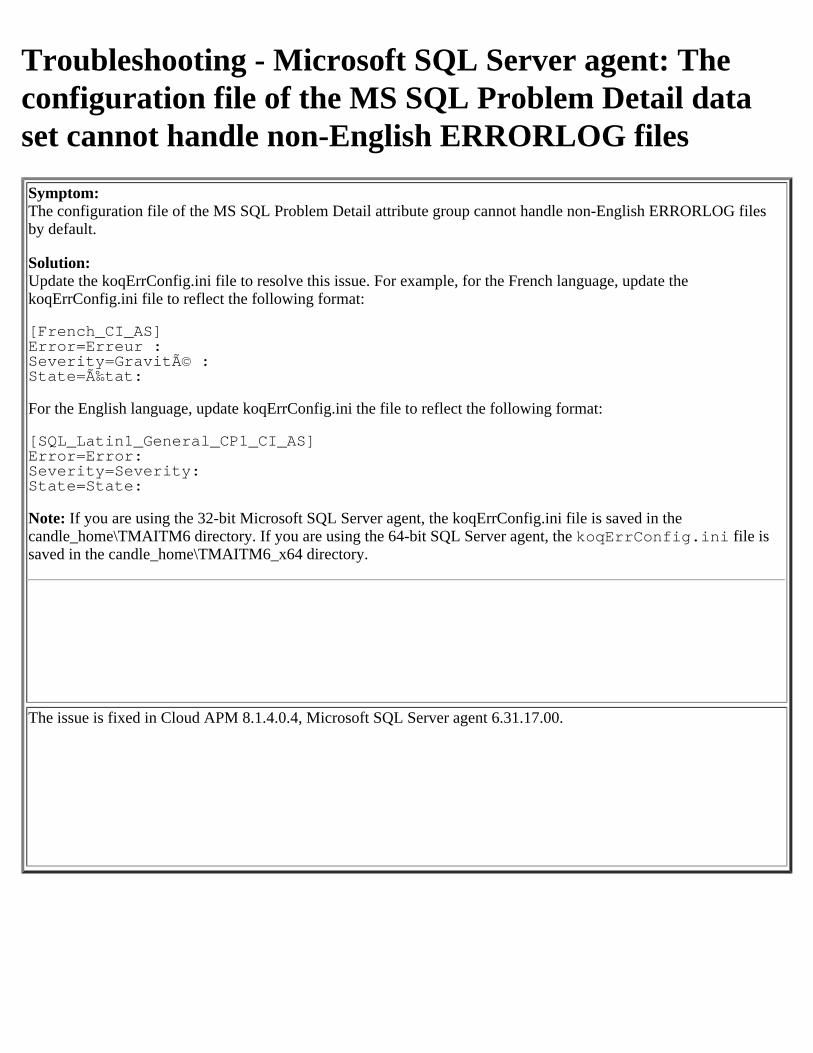
Troubleshooting - Microsoft SQL Server agent: Theconfiguration file of the MS SQL Problem Detail dataset cannot handle non-English ERRORLOG filesSymptom:The configuration file of the MS SQL Problem Detail attribute group cannot handle non-English ERRORLOG filesby default.
Solution:Update the koqErrConfig.ini file to resolve this issue. For example, for the French language, update thekoqErrConfig.ini file to reflect the following format:
[French_CI_AS]Error=Erreur :Severity=Gravité :State=État:
For the English language, update koqErrConfig.ini the file to reflect the following format:
[SQL_Latin1_General_CP1_CI_AS]Error=Error:Severity=Severity:State=State:
Note: If you are using the 32-bit Microsoft SQL Server agent, the koqErrConfig.ini file is saved in thecandle_home\TMAITM6 directory. If you are using the 64-bit SQL Server agent, the koqErrConfig.ini file issaved in the candle_home\TMAITM6_x64 directory.
The issue is fixed in Cloud APM 8.1.4.0.4, Microsoft SQL Server agent 6.31.17.00.
Troubleshooting - Microsoft SQL Server agent: Forsome attributes of the MS SQL Device Detail and MSSQL Filegroup Details data sets incorrect data isdisplayed on the dashboardSymptom:When the device type is FILESTREAM for an SQL Server database, the following attributes of the MS SQL DeviceDetail data set display negative or incorrect values for the database:
Device SizeDevice Free SpaceDevice Free Space Percent
Solution:This issue is a known issue and we do not have a solution.
The issue is fixed in Cloud APM 8.1.4.0.4, Microsoft SQL Server agent 6.31.17.00.
Troubleshooting - Microsoft SQL Server agent: No datais collected for the Table Detail attributeSymptom:
When a table is empty or when a new table is created, no data is collected for the Table Detail attribute.
Solution:This issue is a known issue and we do not have a solution.
The issue is fixed in Cloud APM 8.1.4.0.4, Microsoft SQL Server agent 6.31.17.00.
Troubleshooting - Microsoft SQL Server agent:Incorrect values on the APM portal for Database Detail,Device Detail, and Filegroup Detail attribute groups
Symptom: Incorrect values are getting displayed on APM portal for attributes in Database Detail, Device Detail, and Filegroup Detail attributegroups. This is applicable to SQL Server 2012 and SQL Server 2014 versions.
Cause: If you create a database with restricted growth and modify the initial size of the database to greater than its maxsize, then the query toSQL Server does not return new value of maxsize.
Solution:
Change the state of database to "Offline" and then make it "Online" again.
OR
Restart the SQL Server instance.
Note: The mentioned workaround is not applicable for the Filestream file.
The issue is fixed in Cloud APM 8.1.4.0.4, Microsoft SQL Server agent 6.31.17.00.
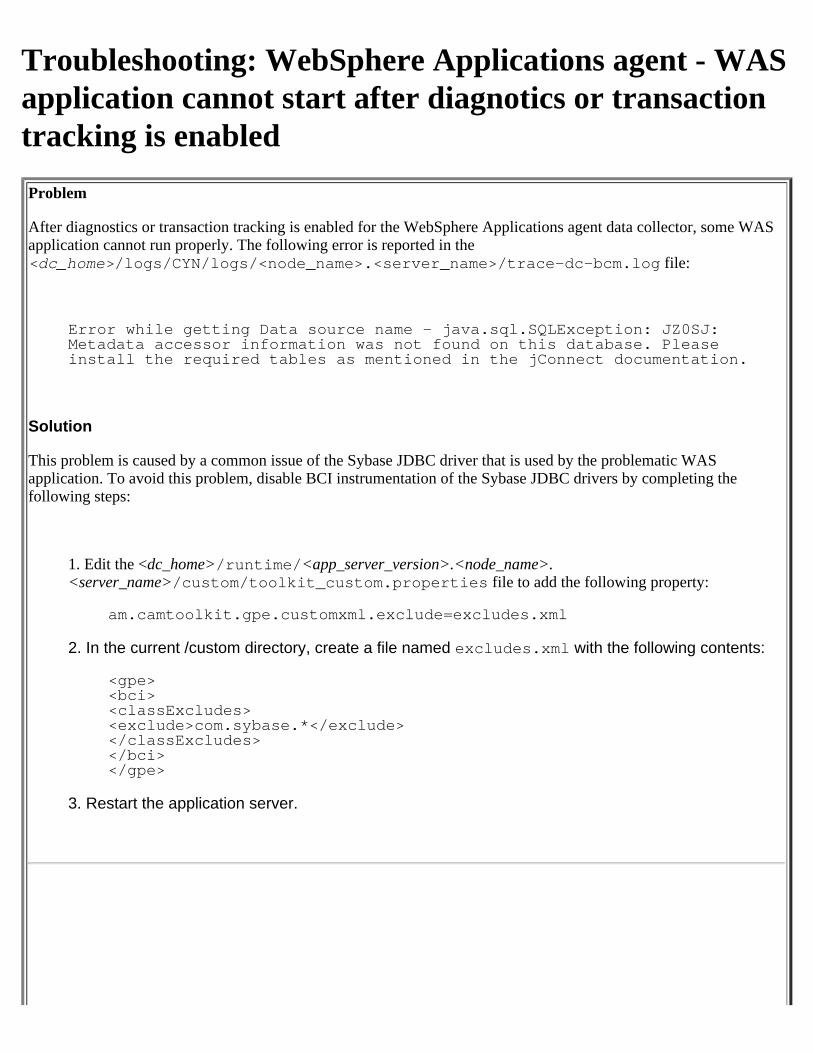
Troubleshooting: WebSphere Applications agent - WASapplication cannot start after diagnotics or transactiontracking is enabledProblem
After diagnostics or transaction tracking is enabled for the WebSphere Applications agent data collector, some WASapplication cannot run properly. The following error is reported in the<dc_home>/logs/CYN/logs/<node_name>.<server_name>/trace-dc-bcm.log file:
Error while getting Data source name - java.sql.SQLException: JZ0SJ:Metadata accessor information was not found on this database. Pleaseinstall the required tables as mentioned in the jConnect documentation.
Solution
This problem is caused by a common issue of the Sybase JDBC driver that is used by the problematic WASapplication. To avoid this problem, disable BCI instrumentation of the Sybase JDBC drivers by completing thefollowing steps:
1. Edit the <dc_home>/runtime/<app_server_version>.<node_name>.<server_name>/custom/toolkit_custom.properties file to add the following property:
am.camtoolkit.gpe.customxml.exclude=excludes.xml
2. In the current /custom directory, create a file named excludes.xml with the following contents:
<gpe><bci><classExcludes><exclude>com.sybase.*</exclude></classExcludes></bci></gpe>
3. Restart the application server.
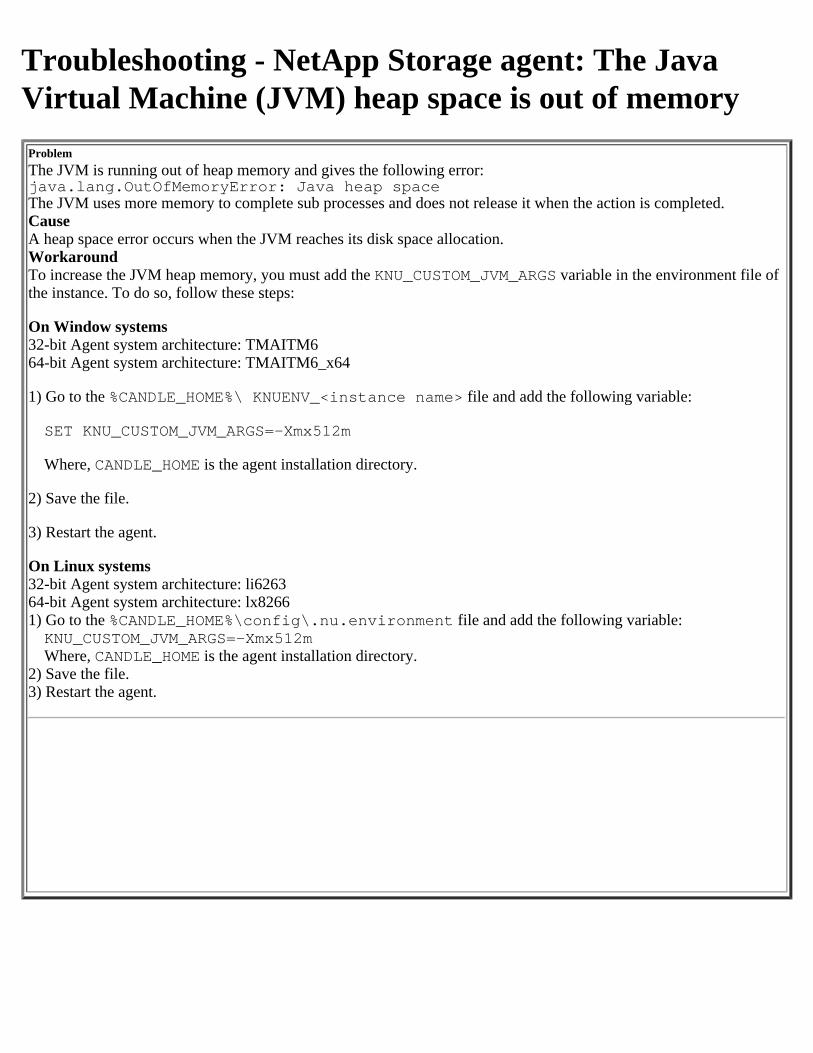
Troubleshooting - NetApp Storage agent: The JavaVirtual Machine (JVM) heap space is out of memory
ProblemThe JVM is running out of heap memory and gives the following error:java.lang.OutOfMemoryError: Java heap spaceThe JVM uses more memory to complete sub processes and does not release it when the action is completed.CauseA heap space error occurs when the JVM reaches its disk space allocation.WorkaroundTo increase the JVM heap memory, you must add the KNU_CUSTOM_JVM_ARGS variable in the environment file ofthe instance. To do so, follow these steps:
On Window systems32-bit Agent system architecture: TMAITM664-bit Agent system architecture: TMAITM6_x64
1) Go to the %CANDLE_HOME%\ KNUENV_<instance name> file and add the following variable:
SET KNU_CUSTOM_JVM_ARGS=-Xmx512m
Where, CANDLE_HOME is the agent installation directory.
2) Save the file.
3) Restart the agent.
On Linux systems32-bit Agent system architecture: li626364-bit Agent system architecture: lx82661) Go to the %CANDLE_HOME%\config\.nu.environment file and add the following variable:KNU_CUSTOM_JVM_ARGS=-Xmx512mWhere, CANDLE_HOME is the agent installation directory.
2) Save the file.3) Restart the agent.
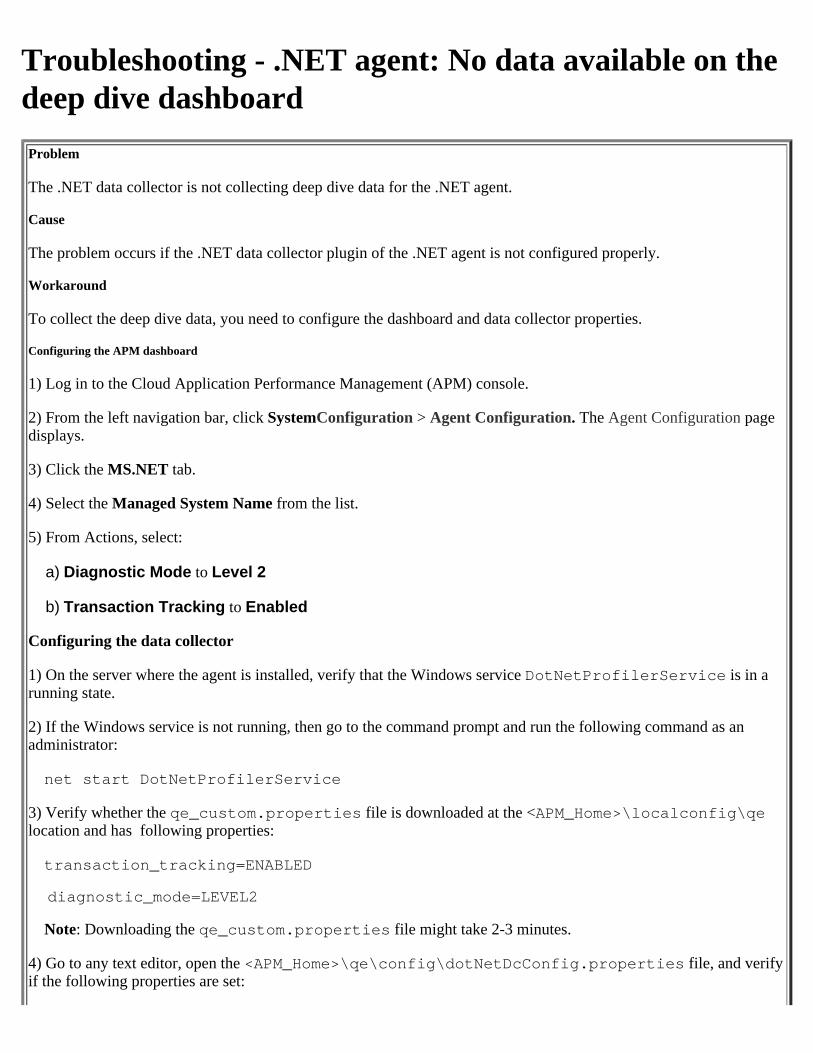
Troubleshooting - .NET agent: No data available on thedeep dive dashboardProblem
The .NET data collector is not collecting deep dive data for the .NET agent.
Cause
The problem occurs if the .NET data collector plugin of the .NET agent is not configured properly.
Workaround
To collect the deep dive data, you need to configure the dashboard and data collector properties.
Configuring the APM dashboard
1) Log in to the Cloud Application Performance Management (APM) console.
2) From the left navigation bar, click SystemConfiguration > Agent Configuration. The Agent Configuration pagedisplays.
3) Click the MS.NET tab.
4) Select the Managed System Name from the list.
5) From Actions, select:
a) Diagnostic Mode to Level 2
b) Transaction Tracking to Enabled
Configuring the data collector
1) On the server where the agent is installed, verify that the Windows service DotNetProfilerService is in arunning state.
2) If the Windows service is not running, then go to the command prompt and run the following command as anadministrator:
net start DotNetProfilerService
3) Verify whether the qe_custom.properties file is downloaded at the <APM_Home>\localconfig\qelocation and has following properties:
transaction_tracking=ENABLED
diagnostic_mode=LEVEL2
Note: Downloading the qe_custom.properties file might take 2-3 minutes.
4) Go to any text editor, open the <APM_Home>\qe\config\dotNetDcConfig.properties file, and verifyif the following properties are set:
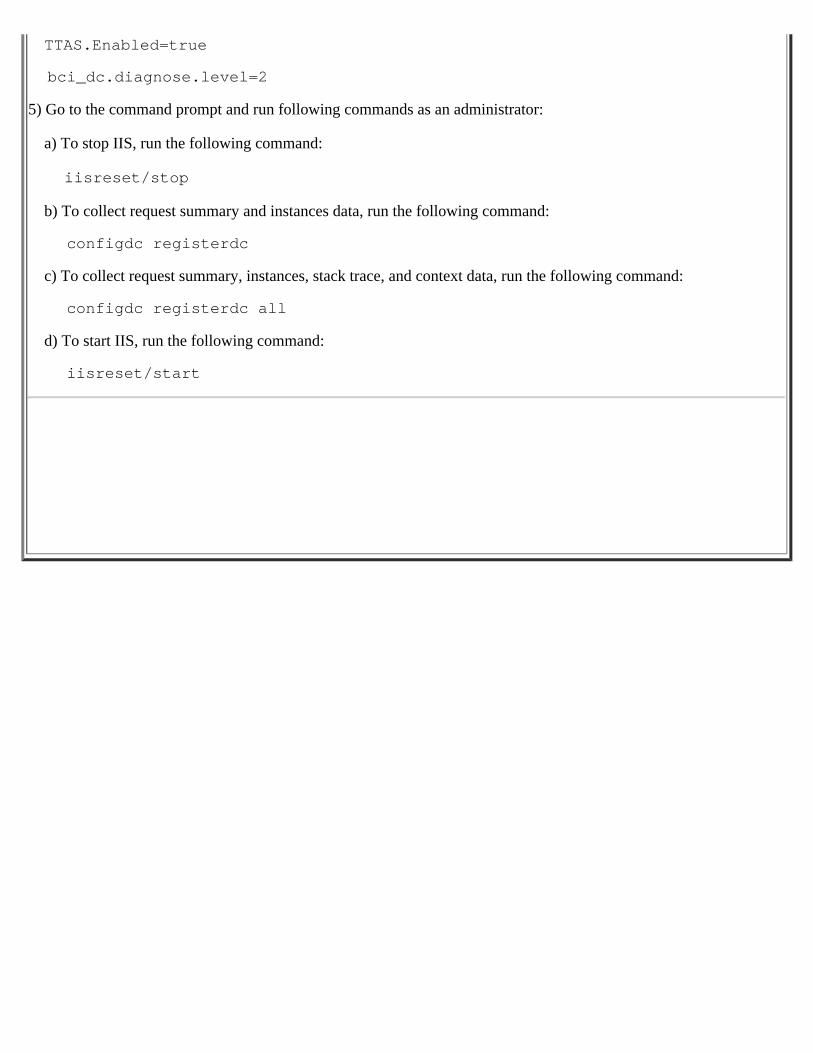
TTAS.Enabled=true
bci_dc.diagnose.level=2
5) Go to the command prompt and run following commands as an administrator:
a) To stop IIS, run the following command:
iisreset/stop
b) To collect request summary and instances data, run the following command:
configdc registerdc
c) To collect request summary, instances, stack trace, and context data, run the following command:
configdc registerdc all
d) To start IIS, run the following command:
iisreset/start
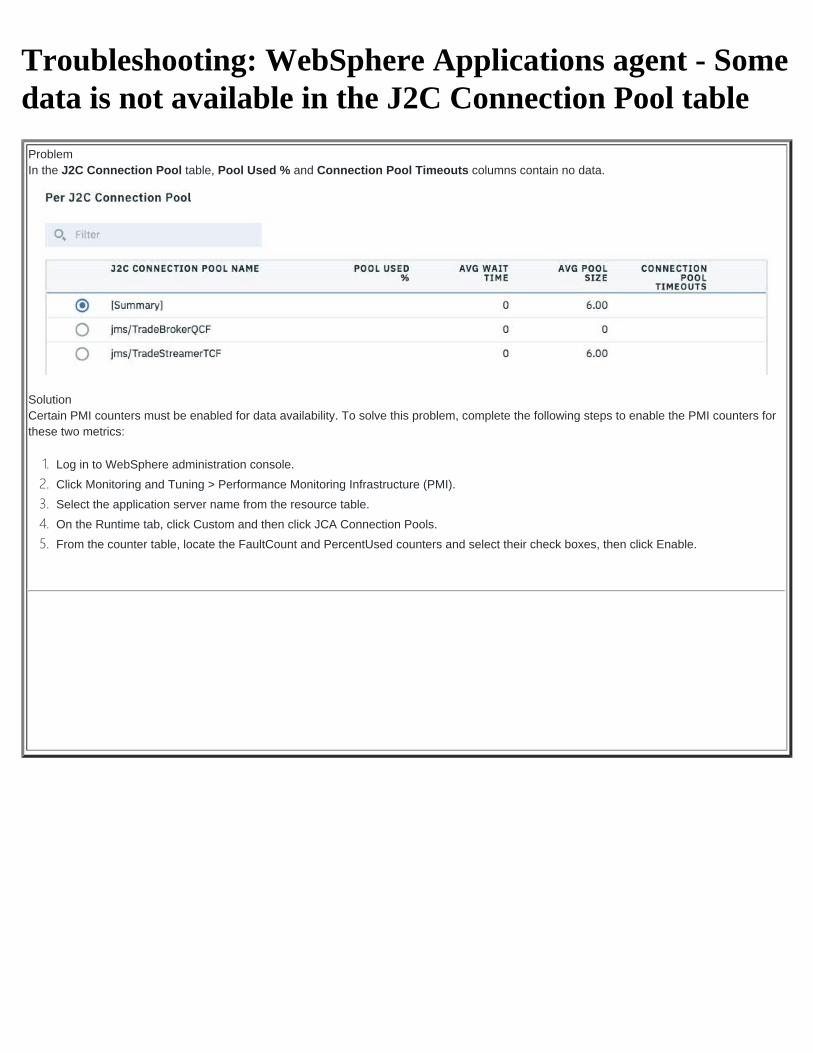
Troubleshooting: WebSphere Applications agent - Somedata is not available in the J2C Connection Pool table
ProblemIn the J2C Connection Pool table, Pool Used % and Connection Pool Timeouts columns contain no data.
SolutionCertain PMI counters must be enabled for data availability. To solve this problem, complete the following steps to enable the PMI counters forthese two metrics:
1. Log in to WebSphere administration console.2. Click Monitoring and Tuning > Performance Monitoring Infrastructure (PMI).3. Select the application server name from the resource table.4. On the Runtime tab, click Custom and then click JCA Connection Pools.5. From the counter table, locate the FaultCount and PercentUsed counters and select their check boxes, then click Enable.
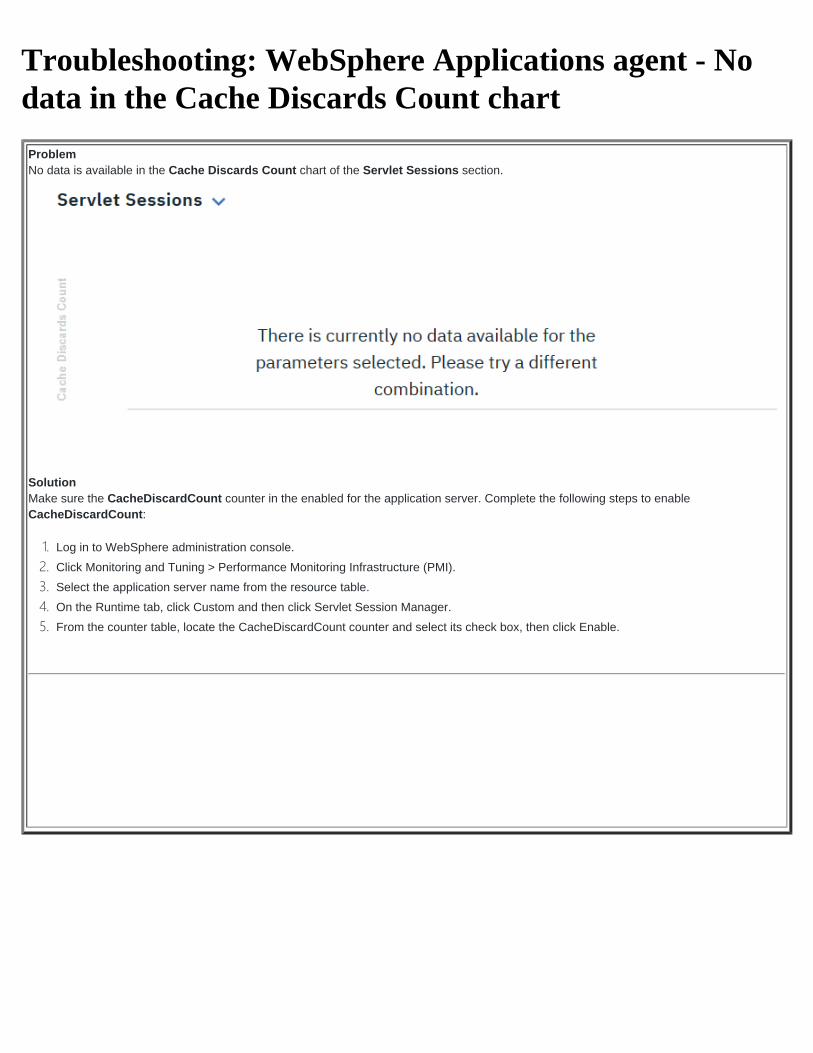
Troubleshooting: WebSphere Applications agent - Nodata in the Cache Discards Count chart
ProblemNo data is available in the Cache Discards Count chart of the Servlet Sessions section.
SolutionMake sure the CacheDiscardCount counter in the enabled for the application server. Complete the following steps to enableCacheDiscardCount:
1. Log in to WebSphere administration console.2. Click Monitoring and Tuning > Performance Monitoring Infrastructure (PMI).3. Select the application server name from the resource table.4. On the Runtime tab, click Custom and then click Servlet Session Manager.5. From the counter table, locate the CacheDiscardCount counter and select its check box, then click Enable.
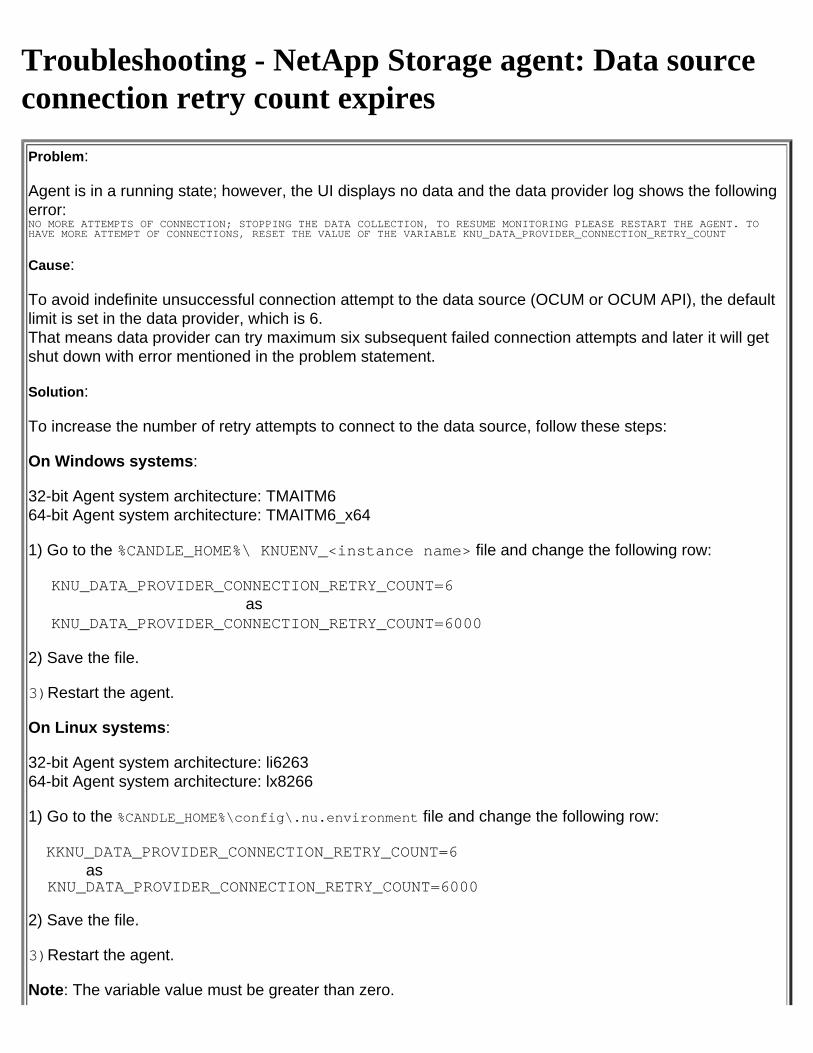
Troubleshooting - NetApp Storage agent: Data sourceconnection retry count expires
Problem:
Agent is in a running state; however, the UI displays no data and the data provider log shows the followingerror:NO MORE ATTEMPTS OF CONNECTION; STOPPING THE DATA COLLECTION, TO RESUME MONITORING PLEASE RESTART THE AGENT. TOHAVE MORE ATTEMPT OF CONNECTIONS, RESET THE VALUE OF THE VARIABLE KNU_DATA_PROVIDER_CONNECTION_RETRY_COUNT
Cause:
To avoid indefinite unsuccessful connection attempt to the data source (OCUM or OCUM API), the defaultlimit is set in the data provider, which is 6.That means data provider can try maximum six subsequent failed connection attempts and later it will getshut down with error mentioned in the problem statement.
Solution:
To increase the number of retry attempts to connect to the data source, follow these steps:
On Windows systems:
32-bit Agent system architecture: TMAITM664-bit Agent system architecture: TMAITM6_x64
1) Go to the %CANDLE_HOME%\ KNUENV_<instance name> file and change the following row:
KNU_DATA_PROVIDER_CONNECTION_RETRY_COUNT=6as
KNU_DATA_PROVIDER_CONNECTION_RETRY_COUNT=6000
2) Save the file.
3)Restart the agent.
On Linux systems:
32-bit Agent system architecture: li626364-bit Agent system architecture: lx8266
1) Go to the %CANDLE_HOME%\config\.nu.environment file and change the following row:
KKNU_DATA_PROVIDER_CONNECTION_RETRY_COUNT=6as
KNU_DATA_PROVIDER_CONNECTION_RETRY_COUNT=6000
2) Save the file.
3)Restart the agent.
Note: The variable value must be greater than zero.
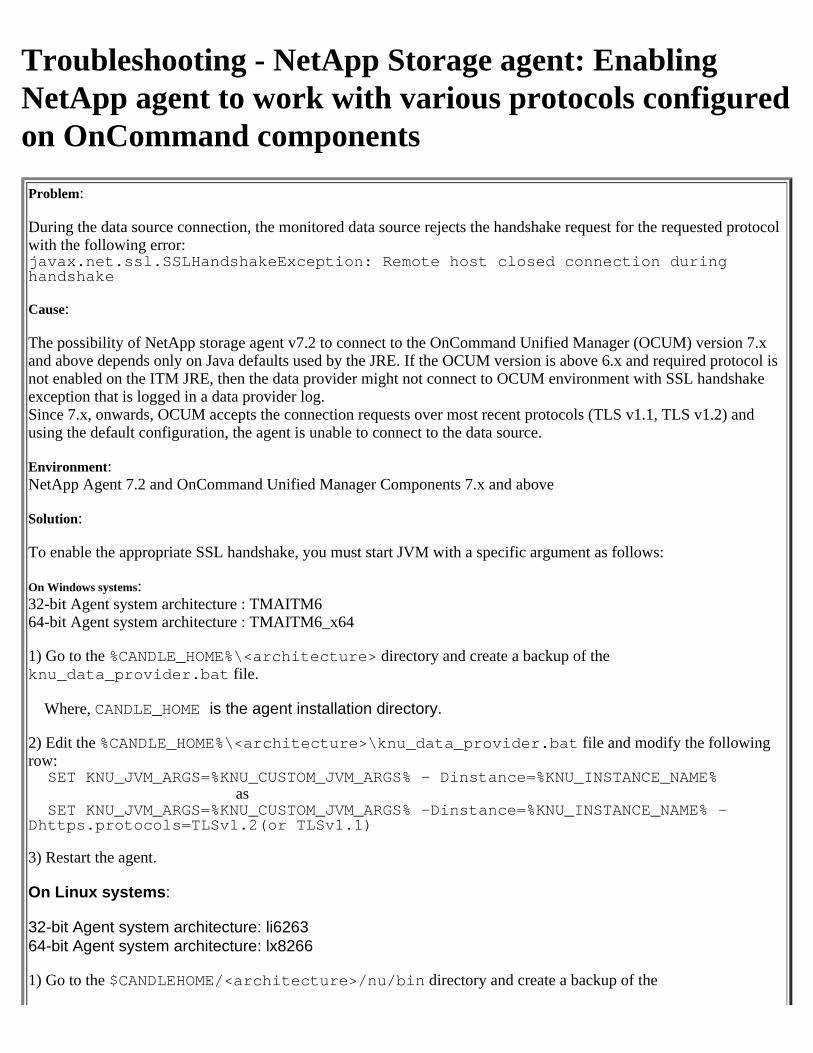
Troubleshooting - NetApp Storage agent: EnablingNetApp agent to work with various protocols configuredon OnCommand componentsProblem:
During the data source connection, the monitored data source rejects the handshake request for the requested protocolwith the following error: javax.net.ssl.SSLHandshakeException: Remote host closed connection duringhandshake
Cause:
The possibility of NetApp storage agent v7.2 to connect to the OnCommand Unified Manager (OCUM) version 7.xand above depends only on Java defaults used by the JRE. If the OCUM version is above 6.x and required protocol isnot enabled on the ITM JRE, then the data provider might not connect to OCUM environment with SSL handshakeexception that is logged in a data provider log. Since 7.x, onwards, OCUM accepts the connection requests over most recent protocols (TLS v1.1, TLS v1.2) andusing the default configuration, the agent is unable to connect to the data source.
Environment:NetApp Agent 7.2 and OnCommand Unified Manager Components 7.x and above
Solution:
To enable the appropriate SSL handshake, you must start JVM with a specific argument as follows:
On Windows systems:32-bit Agent system architecture : TMAITM664-bit Agent system architecture : TMAITM6_x64
1) Go to the %CANDLE_HOME%\<architecture> directory and create a backup of theknu_data_provider.bat file.
Where, CANDLE_HOME is the agent installation directory.
2) Edit the %CANDLE_HOME%\<architecture>\knu_data_provider.bat file and modify the followingrow: SET KNU_JVM_ARGS=%KNU_CUSTOM_JVM_ARGS% - Dinstance=%KNU_INSTANCE_NAME%
as SET KNU_JVM_ARGS=%KNU_CUSTOM_JVM_ARGS% -Dinstance=%KNU_INSTANCE_NAME% -Dhttps.protocols=TLSv1.2(or TLSv1.1)
3) Restart the agent.
On Linux systems:
32-bit Agent system architecture: li626364-bit Agent system architecture: lx8266
1) Go to the $CANDLEHOME/<architecture>/nu/bin directory and create a backup of the
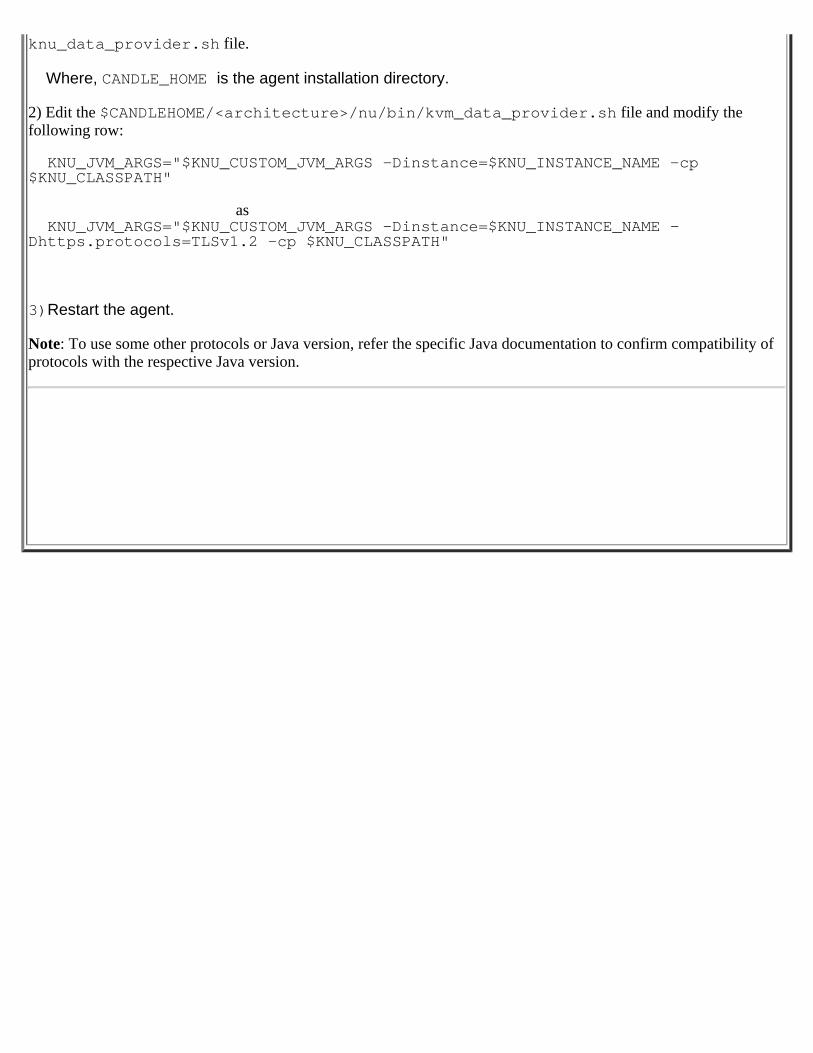
knu_data_provider.sh file.
Where, CANDLE_HOME is the agent installation directory.
2) Edit the $CANDLEHOME/<architecture>/nu/bin/kvm_data_provider.sh file and modify thefollowing row:
KNU_JVM_ARGS="$KNU_CUSTOM_JVM_ARGS -Dinstance=$KNU_INSTANCE_NAME -cp$KNU_CLASSPATH"
as KNU_JVM_ARGS="$KNU_CUSTOM_JVM_ARGS -Dinstance=$KNU_INSTANCE_NAME -Dhttps.protocols=TLSv1.2 -cp $KNU_CLASSPATH"
3)Restart the agent.
Note: To use some other protocols or Java version, refer the specific Java documentation to confirm compatibility ofprotocols with the respective Java version.
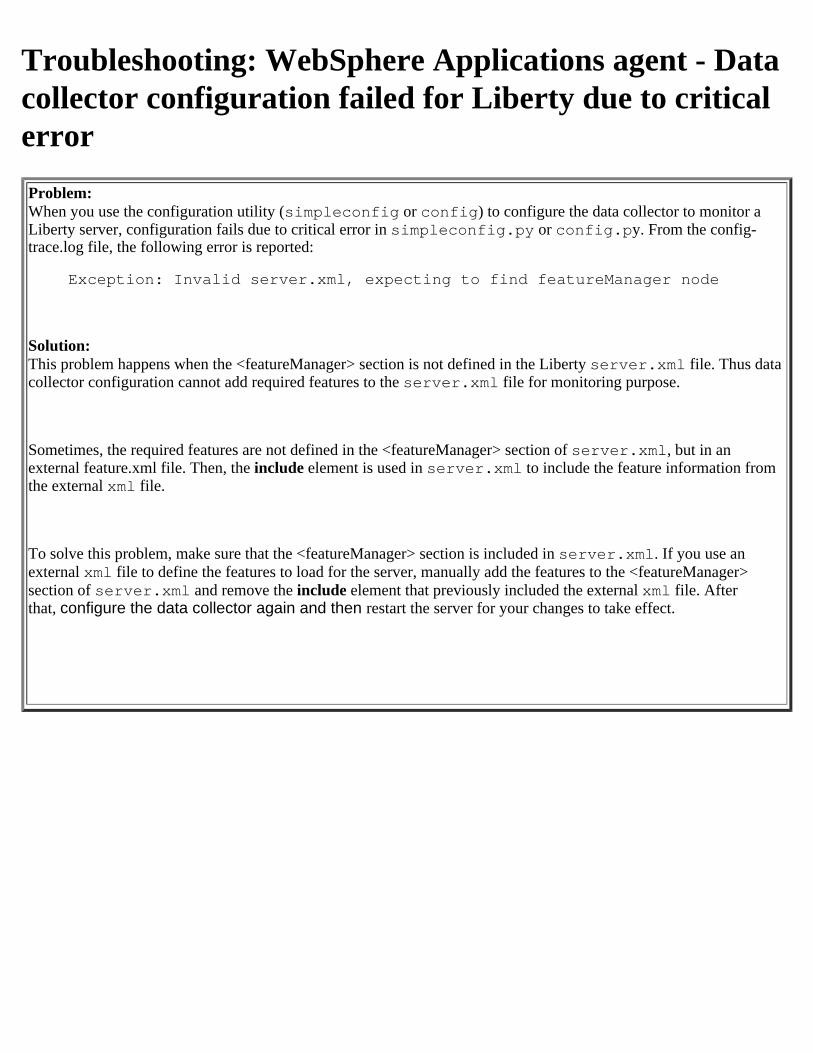
Troubleshooting: WebSphere Applications agent - Datacollector configuration failed for Liberty due to criticalerrorProblem:When you use the configuration utility (simpleconfig or config) to configure the data collector to monitor a Liberty server, configuration fails due to critical error in simpleconfig.py or config.py. From the config-trace.log file, the following error is reported:
Exception: Invalid server.xml, expecting to find featureManager node
Solution:This problem happens when the <featureManager> section is not defined in the Liberty server.xml file. Thus data collector configuration cannot add required features to the server.xml file for monitoring purpose.
Sometimes, the required features are not defined in the <featureManager> section of server.xml, but in an external feature.xml file. Then, the include element is used in server.xml to include the feature information from the external xml file.
To solve this problem, make sure that the <featureManager> section is included in server.xml. If you use an external xml file to define the features to load for the server, manually add the features to the <featureManager> section of server.xml and remove the include element that previously included the external xml file. After that, configure the data collector again and then restart the server for your changes to take effect.
Troubleshooting: Supporting the installation of multipleagents on the same managed server but connected todifferent APM serversScenario: IBM Cloud APM supports the scenario where a customer might install multiple agents on the same managed server but connected to different APM servers.It is important that the agents pointing to different servers are installed to different installation paths on the same system.
For example, you might install the Windows OS agent to connect to an APM server and a Microsoft SQL Server that connects to a different, customer-specific APM server. You must ensure that both agents are installed to different installation paths on the same system.
Troubleshooting - APM UI Expiring Certificates (APM8.1.4)
Updating APM 8.1.4 Default Certificates in UpgradedEnvironmentsProblem:
During the server upgrade processing from APM V8.1.3 to APM V8.1.4, the V8.1.3 APMUI certificate keystore andtruststore files are copied to a new V8.1.4 location where they are shared by the APMUI, Server1, OIDC, and UViewsservers. The default certificate contained in these files is set to expire on 21 April, 2019.
Symptom:
When the certificate expires, users will receive a "Secure Connection Failed" message in their browser instead of theAPM Login Page.
Solution:
Provided in the http://www.ibm.com/support/docview.wss?uid=swg22016073 technote.
Troubleshooting - APM UI Expiring Certificates (APM8.1.3)
Updating APM 8.1.3 UI Default Certificates Problem:
The APM V8.1.3 default certificate that is provided for the OIDC service is set to expire 2 years after the APMV8.1.3 server is installed. APM V8.1.3 was released (GA'd) on the 1st of May, 2016. This 2 year time frame isexpiring now or very soon for customers who installed APM V8.1.3 at the time it was released (GA'd) or soon after itreleased, and have not either configured custom certificates or upgraded to APM V8.1.4.
The 8.1.3 APMUI default certificate is hard-coded to expire 21 April, 2019.
Symptom:
When the OIDC certificate expires, users will receive a "Secure Connection Failed" message in their browser insteadof the APM 8.1.3 Login Page.
When the APMUI certificate expires, users will receive a "Your connection is not secure" message that indicates theAPM UI certificate is expired when navigating to APM Server port 9443.
Solution:
Provided in the http://www.ibm.com/support/docview.wss?uid=swg22016064 technote.
Troubleshooting - Db2 agent: Active Connections(History) group widget displays zero value formaximum connectionsSymptom:
For remote monitoring, Active Connections (History) group widget displays zero value for maximum number of connections to the database.
Cause:
If a database is cataloged with an alias name that is different from the actual database name on the server, then theagent fails to retrieve the correct cfg parameter for the database, due to a failure in the database connection. Therefore, the agent displays zero, which is the default value, for maximum number of connections to the database.
Workaround:
Catalog the database by using an alias name that is same as its actual database name on the server, and then restart the agent.
Solution:
Upgrade the Db2 agent to 8.1.4.0.4 release to resolve the issue.
Troubleshooting - Db2 agent: Application PerformanceDashboard does not display any information in theDatabases Status group widgetSymptom:
When an agent remotely monitors a server instance that is installed on the same machine as the agent, the Databases Status group widget does not display any data.
Cause:
If the host name of the server and the agent is same, then Db2 agent triggers local monitoring by default. Hence, the databases are fetched from a local server directory and not from a cataloged node. Due to this conflict between the server instance and the cataloged node, a database connection failure occurs, and the agent does not collect or display data.
Workaround:
If you install a server instance and its agent on the same machine, then you must configure the server instance for local monitoring instead of remote motoring.
Solution:
Upgrade the Db2 agent to 8.1.4.0.4 release to resolve the issue.
Troubleshooting - Unable to disable the firewall onRHEL V7.4 before installing the Cloud APM Server
Problem:
Before you install the Cloud APM server, you might want to temporarily disable your firewall. The followingcommands do not work to disable your firewall on Red Hat Linux Version 7.4:
service iptables stop
chkconfig iptables off
Solution:
For"Red Hat Linux V7.4, issue the following commands to disable your firewall:
service firewalld
systemctl disable firewalld
.
Troubleshooting-Sterling Connect Direct agent:Datadisappears from 'Scheduled Processes' group widget ifyou recycle the agent multiple times or make changes inenv file for Connect Direct agent.Symptom: Data disappears from Scheduled Processes group widget if you recycle agent multiple times or make changes in env file for Sterling Connect Direct agent. But data is again displayed on APM UI during the next execution of that disappeared scheduled process.
Cause: Sterling Connect Direct server and its SDK does not provide information about which file transfer process is executed for a schedule. Agent uses execution time, process name, file location and so on, to map process with its schedule. So, when agent starts\restarts, it might not be able to collect previous execution data for some of the scheduled processes. In such cases, agent does not show these schedules unless it gets executed at least once after agent start\restart
Solution: Agent shows data for scheduled processes in next 24 hours or 7 days, depending upon its next scheduled execution time.
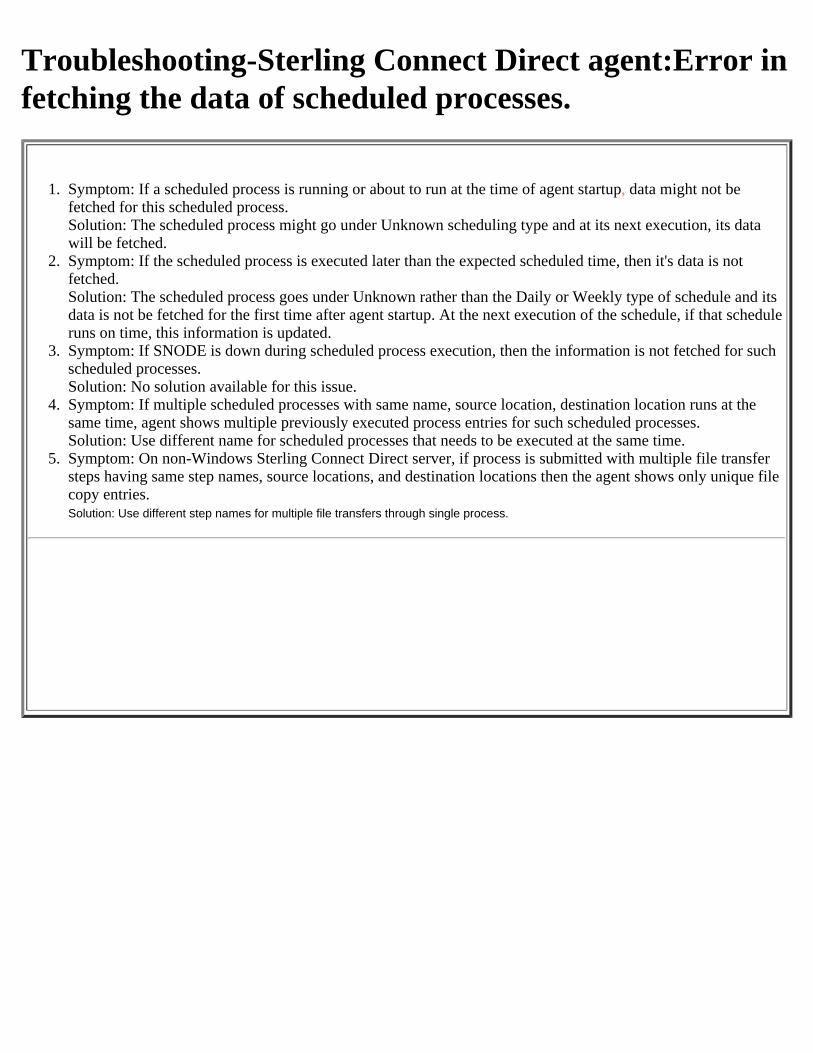
Troubleshooting-Sterling Connect Direct agent:Error infetching the data of scheduled processes.
1. Symptom: If a scheduled process is running or about to run at the time of agent startup, data might not befetched for this scheduled process.Solution: The scheduled process might go under Unknown scheduling type and at its next execution, its datawill be fetched.
2. Symptom: If the scheduled process is executed later than the expected scheduled time, then it's data is notfetched.Solution: The scheduled process goes under Unknown rather than the Daily or Weekly type of schedule and itsdata is not be fetched for the first time after agent startup. At the next execution of the schedule, if that scheduleruns on time, this information is updated.
3. Symptom: If SNODE is down during scheduled process execution, then the information is not fetched for suchscheduled processes.Solution: No solution available for this issue.
4. Symptom: If multiple scheduled processes with same name, source location, destination location runs at thesame time, agent shows multiple previously executed process entries for such scheduled processes.Solution: Use different name for scheduled processes that needs to be executed at the same time.
5. Symptom: On non-Windows Sterling Connect Direct server, if process is submitted with multiple file transfersteps having same step names, source locations, and destination locations then the agent shows only unique filecopy entries.Solution: Use different step names for multiple file transfers through single process.
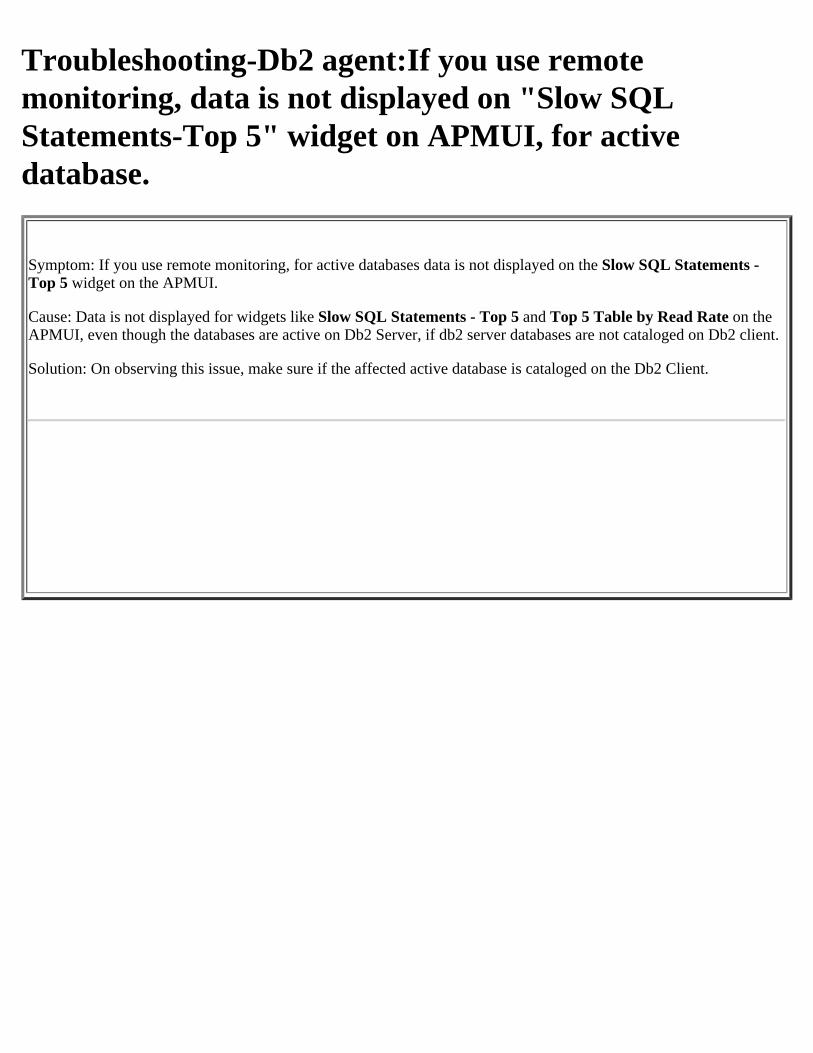
Troubleshooting-Db2 agent:If you use remotemonitoring, data is not displayed on "Slow SQLStatements-Top 5" widget on APMUI, for activedatabase.
Symptom: If you use remote monitoring, for active databases data is not displayed on the Slow SQL Statements -Top 5 widget on the APMUI.
Cause: Data is not displayed for widgets like Slow SQL Statements - Top 5 and Top 5 Table by Read Rate on theAPMUI, even though the databases are active on Db2 Server, if db2 server databases are not cataloged on Db2 client.
Solution: On observing this issue, make sure if the affected active database is cataloged on the Db2 Client.
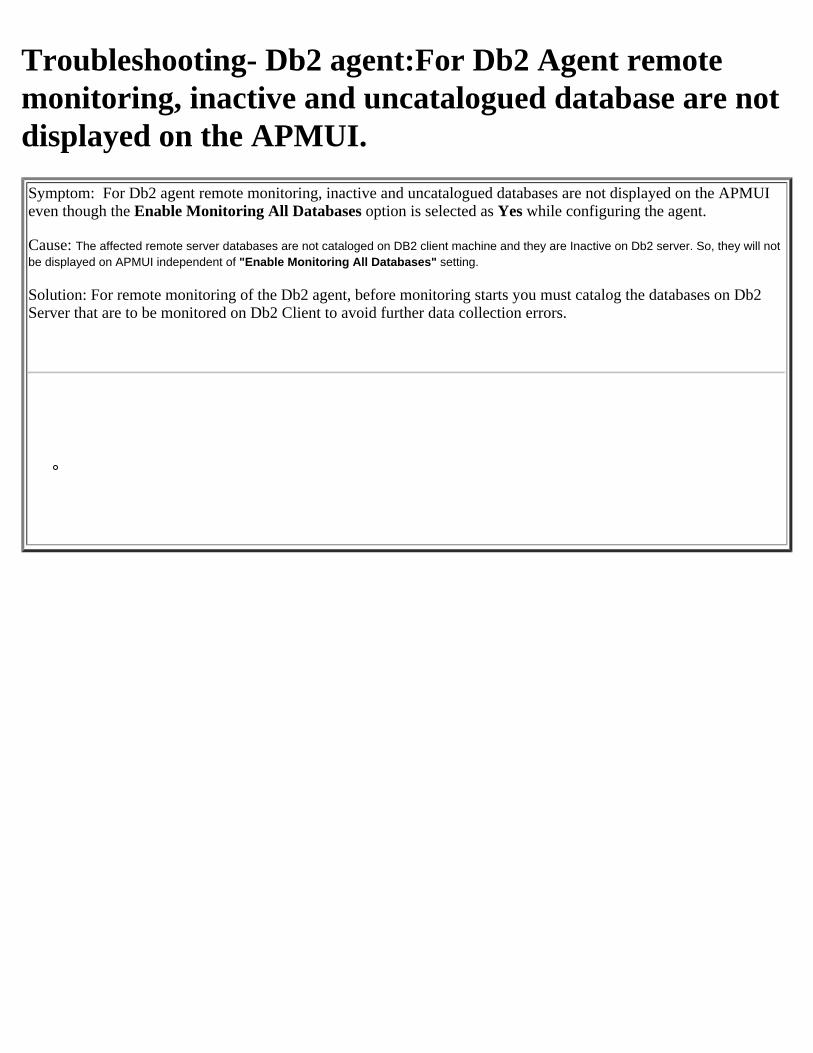
Troubleshooting- Db2 agent:For Db2 Agent remotemonitoring, inactive and uncatalogued database are notdisplayed on the APMUI.Symptom: For Db2 agent remote monitoring, inactive and uncatalogued databases are not displayed on the APMUIeven though the Enable Monitoring All Databases option is selected as Yes while configuring the agent.
Cause: The affected remote server databases are not cataloged on DB2 client machine and they are Inactive on Db2 server. So, they will notbe displayed on APMUI independent of "Enable Monitoring All Databases" setting.
Solution: For remote monitoring of the Db2 agent, before monitoring starts you must catalog the databases on Db2Server that are to be monitored on Db2 Client to avoid further data collection errors.
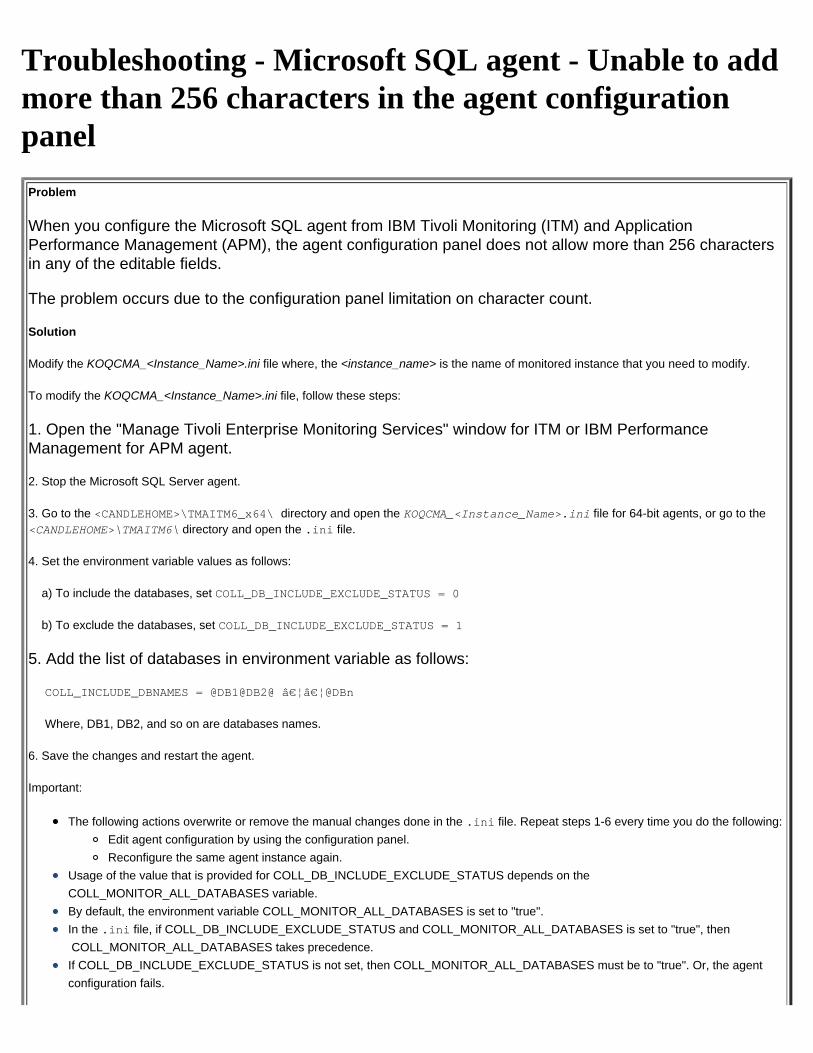
Troubleshooting - Microsoft SQL agent - Unable to addmore than 256 characters in the agent configurationpanel
Problem
When you configure the Microsoft SQL agent from IBM Tivoli Monitoring (ITM) and ApplicationPerformance Management (APM), the agent configuration panel does not allow more than 256 charactersin any of the editable fields.
The problem occurs due to the configuration panel limitation on character count.
Solution
Modify the KOQCMA_<Instance_Name>.ini file where, the <instance_name> is the name of monitored instance that you need to modify.
To modify the KOQCMA_<Instance_Name>.ini file, follow these steps:
1. Open the "Manage Tivoli Enterprise Monitoring Services" window for ITM or IBM PerformanceManagement for APM agent.
2. Stop the Microsoft SQL Server agent.
3. Go to the <CANDLEHOME>\TMAITM6_x64\ directory and open the KOQCMA_<Instance_Name>.ini file for 64-bit agents, or go to the<CANDLEHOME>\TMAITM6\ directory and open the .ini file.
4. Set the environment variable values as follows:
a) To include the databases, set COLL_DB_INCLUDE_EXCLUDE_STATUS = 0
b) To exclude the databases, set COLL_DB_INCLUDE_EXCLUDE_STATUS = 1
5. Add the list of databases in environment variable as follows:
COLL_INCLUDE_DBNAMES = @DB1@DB2@ ……@DBn
Where, DB1, DB2, and so on are databases names.
6. Save the changes and restart the agent.
Important:
The following actions overwrite or remove the manual changes done in the .ini file. Repeat steps 1-6 every time you do the following:Edit agent configuration by using the configuration panel.Reconfigure the same agent instance again.
Usage of the value that is provided for COLL_DB_INCLUDE_EXCLUDE_STATUS depends on theCOLL_MONITOR_ALL_DATABASES variable.By default, the environment variable COLL_MONITOR_ALL_DATABASES is set to "true".In the .ini file, if COLL_DB_INCLUDE_EXCLUDE_STATUS and COLL_MONITOR_ALL_DATABASES is set to "true", then COLL_MONITOR_ALL_DATABASES takes precedence.If COLL_DB_INCLUDE_EXCLUDE_STATUS is not set, then COLL_MONITOR_ALL_DATABASES must be to "true". Or, the agentconfiguration fails.
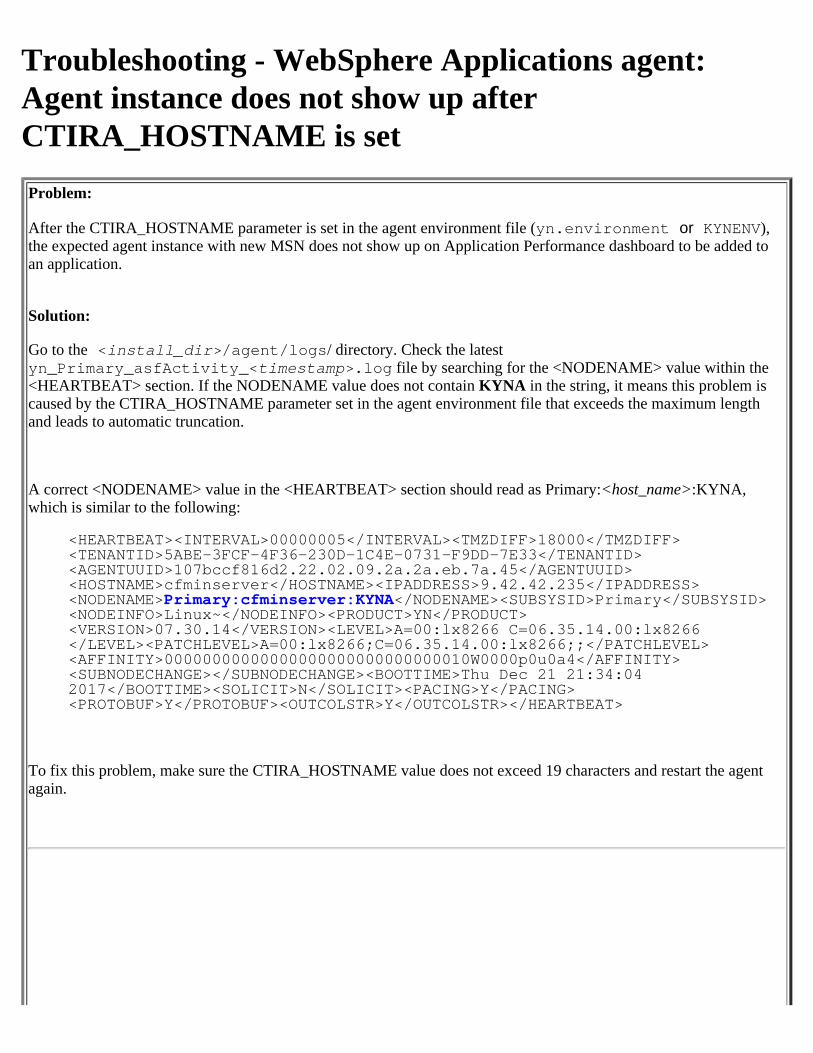
Troubleshooting - WebSphere Applications agent:Agent instance does not show up afterCTIRA_HOSTNAME is setProblem:
After the CTIRA_HOSTNAME parameter is set in the agent environment file (yn.environment or KYNENV),the expected agent instance with new MSN does not show up on Application Performance dashboard to be added toan application.
Solution:
Go to the <install_dir>/agent/logs/ directory. Check the latestyn_Primary_asfActivity_<timestamp>.log file by searching for the <NODENAME> value within the<HEARTBEAT> section. If the NODENAME value does not contain KYNA in the string, it means this problem iscaused by the CTIRA_HOSTNAME parameter set in the agent environment file that exceeds the maximum lengthand leads to automatic truncation.
A correct <NODENAME> value in the <HEARTBEAT> section should read as Primary:<host_name>:KYNA,which is similar to the following:
<HEARTBEAT><INTERVAL>00000005</INTERVAL><TMZDIFF>18000</TMZDIFF><TENANTID>5ABE-3FCF-4F36-230D-1C4E-0731-F9DD-7E33</TENANTID><AGENTUUID>107bccf816d2.22.02.09.2a.2a.eb.7a.45</AGENTUUID><HOSTNAME>cfminserver</HOSTNAME><IPADDRESS>9.42.42.235</IPADDRESS><NODENAME>Primary:cfminserver:KYNA</NODENAME><SUBSYSID>Primary</SUBSYSID><NODEINFO>Linux~</NODEINFO><PRODUCT>YN</PRODUCT><VERSION>07.30.14</VERSION><LEVEL>A=00:lx8266 C=06.35.14.00:lx8266</LEVEL><PATCHLEVEL>A=00:lx8266;C=06.35.14.00:lx8266;;</PATCHLEVEL><AFFINITY>00000000000000000000000000000010W0000p0u0a4</AFFINITY><SUBNODECHANGE></SUBNODECHANGE><BOOTTIME>Thu Dec 21 21:34:042017</BOOTTIME><SOLICIT>N</SOLICIT><PACING>Y</PACING><PROTOBUF>Y</PROTOBUF><OUTCOLSTR>Y</OUTCOLSTR></HEARTBEAT>
To fix this problem, make sure the CTIRA_HOSTNAME value does not exceed 19 characters and restart the agentagain.
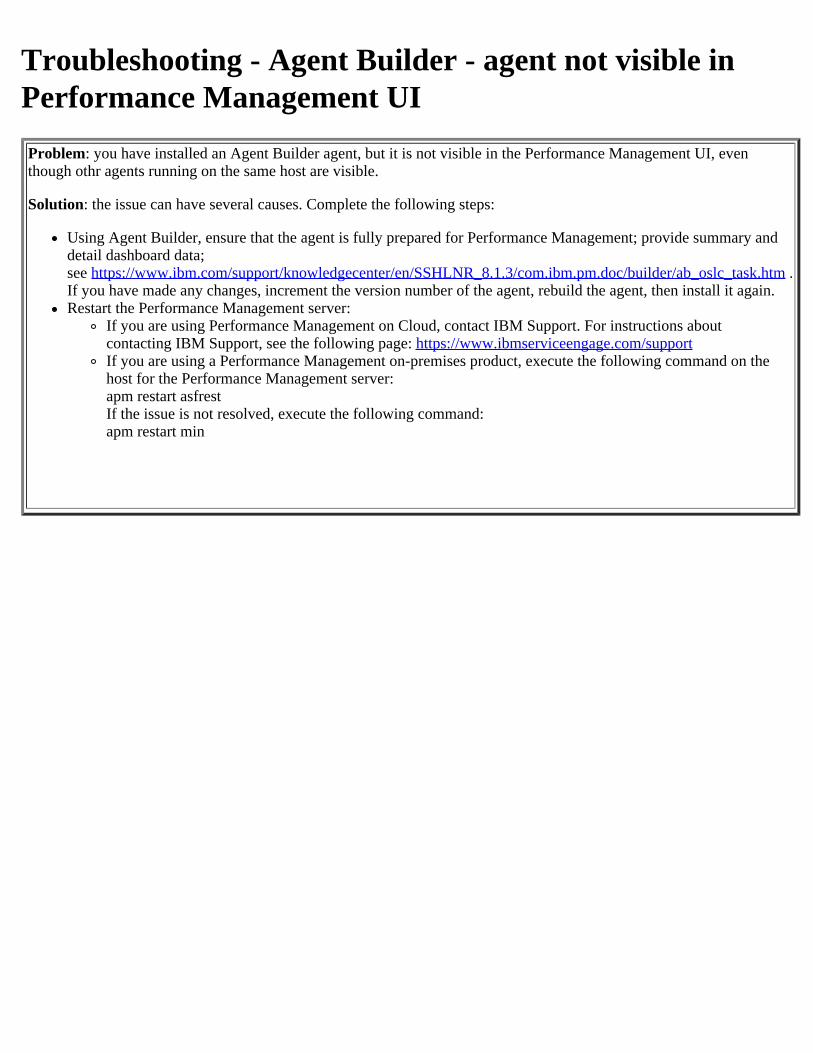
Troubleshooting - Agent Builder - agent not visible inPerformance Management UIProblem: you have installed an Agent Builder agent, but it is not visible in the Performance Management UI, eventhough othr agents running on the same host are visible.
Solution: the issue can have several causes. Complete the following steps:
Using Agent Builder, ensure that the agent is fully prepared for Performance Management; provide summary anddetail dashboard data;see https://www.ibm.com/support/knowledgecenter/en/SSHLNR_8.1.3/com.ibm.pm.doc/builder/ab_oslc_task.htm .If you have made any changes, increment the version number of the agent, rebuild the agent, then install it again.Restart the Performance Management server:
If you are using Performance Management on Cloud, contact IBM Support. For instructions aboutcontacting IBM Support, see the following page: https://www.ibmserviceengage.com/supportIf you are using a Performance Management on-premises product, execute the following command on thehost for the Performance Management server:apm restart asfrestIf the issue is not resolved, execute the following command:apm restart min
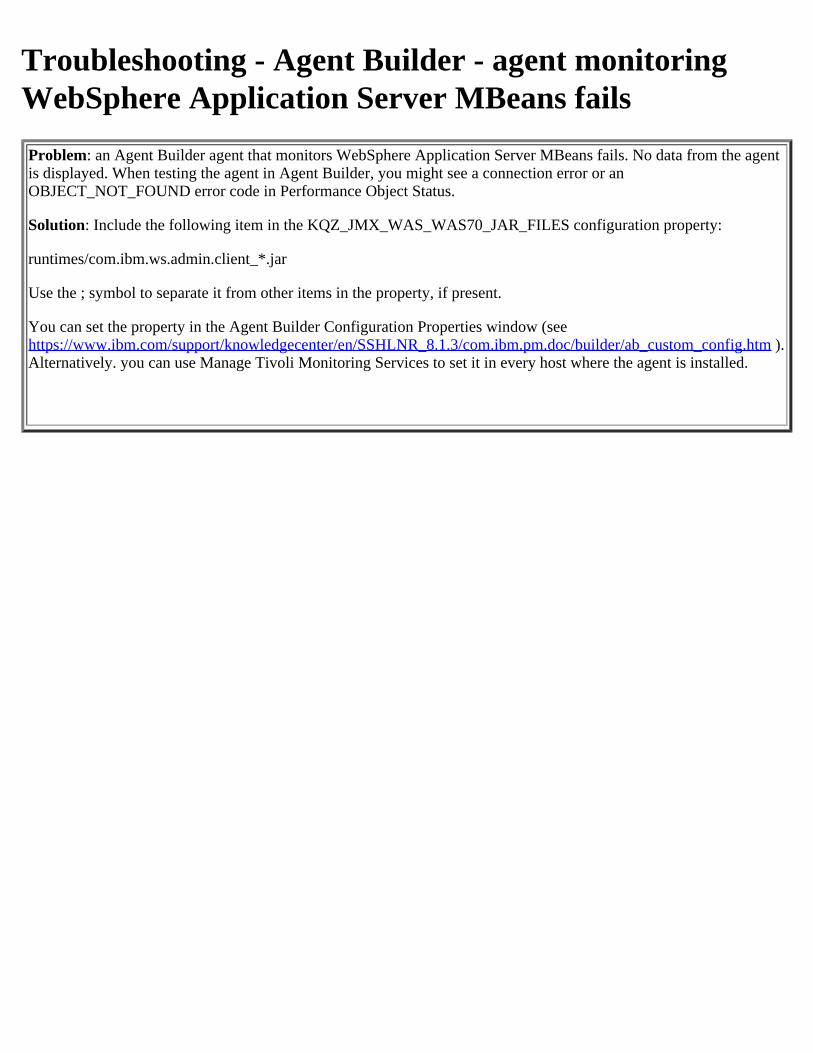
Troubleshooting - Agent Builder - agent monitoringWebSphere Application Server MBeans failsProblem: an Agent Builder agent that monitors WebSphere Application Server MBeans fails. No data from the agentis displayed. When testing the agent in Agent Builder, you might see a connection error or anOBJECT_NOT_FOUND error code in Performance Object Status.
Solution: Include the following item in the KQZ_JMX_WAS_WAS70_JAR_FILES configuration property:
runtimes/com.ibm.ws.admin.client_*.jar
Use the ; symbol to separate it from other items in the property, if present.
You can set the property in the Agent Builder Configuration Properties window (seehttps://www.ibm.com/support/knowledgecenter/en/SSHLNR_8.1.3/com.ibm.pm.doc/builder/ab_custom_config.htm ).Alternatively. you can use Manage Tivoli Monitoring Services to set it in every host where the agent is installed.

Troubleshooting - Agent Builder - silent configuration ofagent failsProblem: silent configuration of an Agent Builder agent fails. An "XML configuration result: Configuration failed on matching the data in the response file with the properties in the XML file" message is displayed.
Solution: Ensure that the silent configuration file is correct. In particular, ensure that all the mandatory configuration items are provided. The mandatory configuration items are not commented out in the sample configuration file that is shipped in the agent package. The sample file is installed in the install_dir/samples directory.

Troubleshooting - Agent Builder - "agent is alreadyrunning" message when installing agentProblem: when you install a new version of an Agent Builder agent on a system where an older version was installed, an "agent is already running" error message is displayed.
Solution: Ignore the message. The agent is changed to the new version correctly.

Troubleshooting - Agent Builder - issues when viewingAttribute Details tabProblem: you have installed an Agent Builder agent in a Performance Management environment. You click on a status overview (summary) dashboard for this agent to view details. The Attribute Details tab opens, and at the same time, the Status Overview tab is disabled, so you can not return to the overview dashboard.
Solution: use the latest version of Agent Builder to edit the agent. Ensure that the data for the Details page is defined. Rebuild the agent with a new version number and reinstall the agent.

Troubleshooting - Agent Builder - agent not found in the Threshold ManagerProblem: in an performance Management environment, you have installed an Agent Builder agent that has a subnote. You can not find the name of the agent in the Threshold Manager window.
Solution: Usually, an agent that has one or more subnodes appears in Threshold Manager under the name of one of the subnodes. All the attributes from the agent and all of its subnodes are available under this name.

Troubleshooting - Agent Builder - parameters for silentconfigurationProblem: you need to find the available parameters for the silent configuration file for an Agent Builder agent.
Solution: install the agent and check the sample silent configuration file which is located in the install_dir/samples directory.
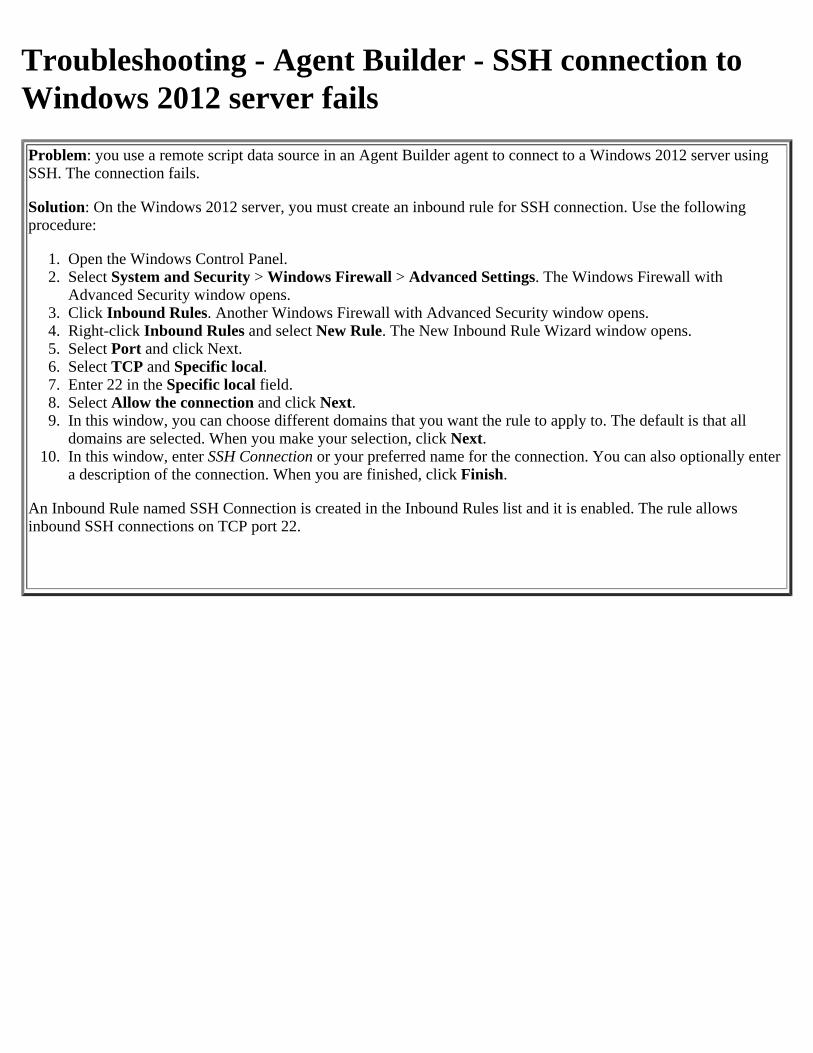
Troubleshooting - Agent Builder - SSH connection toWindows 2012 server failsProblem: you use a remote script data source in an Agent Builder agent to connect to a Windows 2012 server usingSSH. The connection fails.
Solution: On the Windows 2012 server, you must create an inbound rule for SSH connection. Use the followingprocedure:
1. Open the Windows Control Panel.2. Select System and Security > Windows Firewall > Advanced Settings. The Windows Firewall with
Advanced Security window opens.3. Click Inbound Rules. Another Windows Firewall with Advanced Security window opens.4. Right-click Inbound Rules and select New Rule. The New Inbound Rule Wizard window opens.5. Select Port and click Next.6. Select TCP and Specific local.7. Enter 22 in the Specific local field.8. Select Allow the connection and click Next.9. In this window, you can choose different domains that you want the rule to apply to. The default is that all
domains are selected. When you make your selection, click Next.10. In this window, enter SSH Connection or your preferred name for the connection. You can also optionally enter
a description of the connection. When you are finished, click Finish.
An Inbound Rule named SSH Connection is created in the Inbound Rules list and it is enabled. The rule allows inbound SSH connections on TCP port 22.
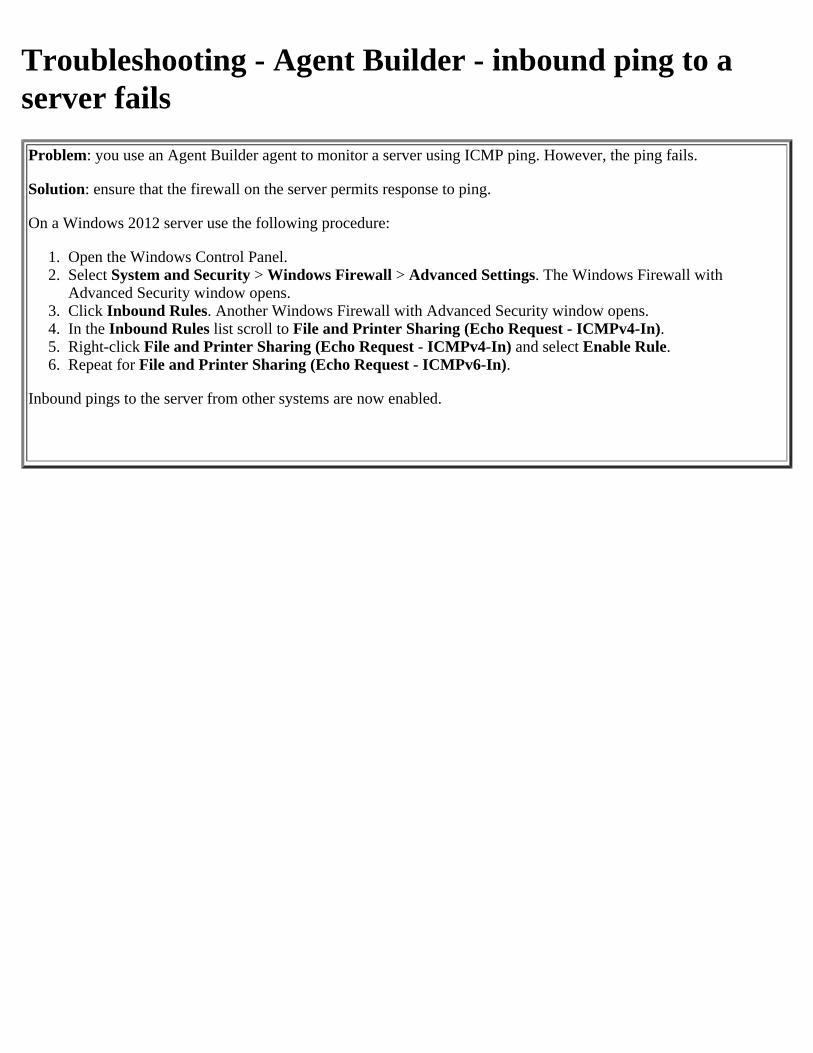
Troubleshooting - Agent Builder - inbound ping to aserver failsProblem: you use an Agent Builder agent to monitor a server using ICMP ping. However, the ping fails.
Solution: ensure that the firewall on the server permits response to ping.
On a Windows 2012 server use the following procedure:
1. Open the Windows Control Panel.2. Select System and Security > Windows Firewall > Advanced Settings. The Windows Firewall with
Advanced Security window opens.3. Click Inbound Rules. Another Windows Firewall with Advanced Security window opens.4. In the Inbound Rules list scroll to File and Printer Sharing (Echo Request - ICMPv4-In).5. Right-click File and Printer Sharing (Echo Request - ICMPv4-In) and select Enable Rule.6. Repeat for File and Printer Sharing (Echo Request - ICMPv6-In).
Inbound pings to the server from other systems are now enabled.

Troubleshooting - Agent Builder - script agent builtwith older Agent Builder version failsProblem: In an agent that is built with an Agent Builder version before 6.3, script data providers that use SSH are failing with messages similar to this:(5102BB3C.002C-B14:sshlibinterface.cpp,487, "Ssh_Interface_load") Failed to load the dynamic library k03ssh.dll : return code = 126 (5102BB3C.002D-B14:sshlibinterface.cpp,508, "Ssh_Interface_load") could not create libHandle (5102BB3C.002E-B14:shellqueryclass.cpp,247, "ShellQueryClass") Error initializing SSH Connector class
Solution: Rebuild the agent with Agent Builder version 6.3 or later.

Troubleshooting - Agent Builder - no results whentesting agentProblem: When testing an agent in Agent Builder you are not getting any results. Performance Object Status shows Timed Out (and possibly some other values that indicate there might be a problem).
Cause: Sometimes the trace settings can slow the agent down in the test mode enough that data is not visible inthe builder. This problem is most common in data sources like SOAP, JMX, and JDBC that use a Java provider.
Solution: Lower the Java Trace Level setting by choosing a value higher in the list. Usually agents work with a trace level of DEBUG_MID. Sometimes it is necessary to set the trace level to ERROR (which is the value that is used when the agent is installed).

Troubleshooting - Agent Builder - missing orunexpected data for Socket data setProblem: There is missing or unexpected data for a socket data set (attribute group) in an Agent Builder agent.
Solution: Check the agent log if there are missing rows of data for a socket attribute group or if the data is not as expected. If there is missing or unexpected data, check the log even if the Performance Object Status for the attribute group displays NO_ERROR, as NO_ERROR is displayed if any valid rows were returned.
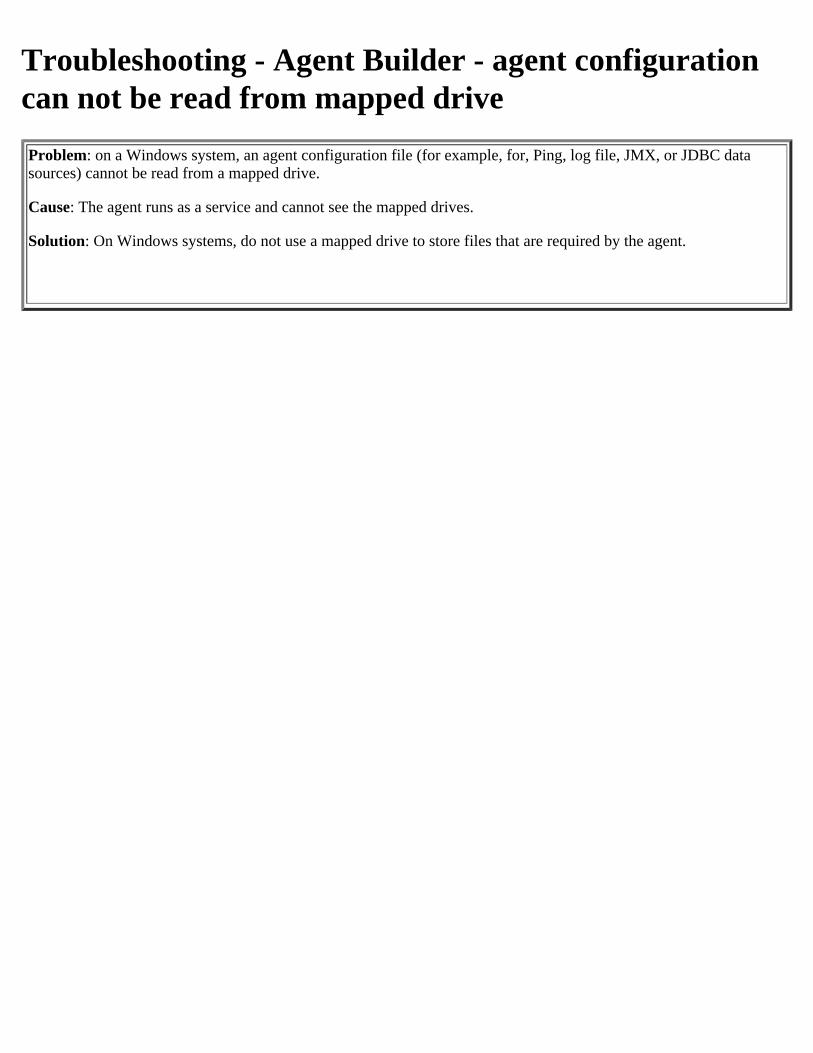
Troubleshooting - Agent Builder - agent configurationcan not be read from mapped driveProblem: on a Windows system, an agent configuration file (for example, for, Ping, log file, JMX, or JDBC data sources) cannot be read from a mapped drive.
Cause: The agent runs as a service and cannot see the mapped drives.
Solution: On Windows systems, do not use a mapped drive to store files that are required by the agent.
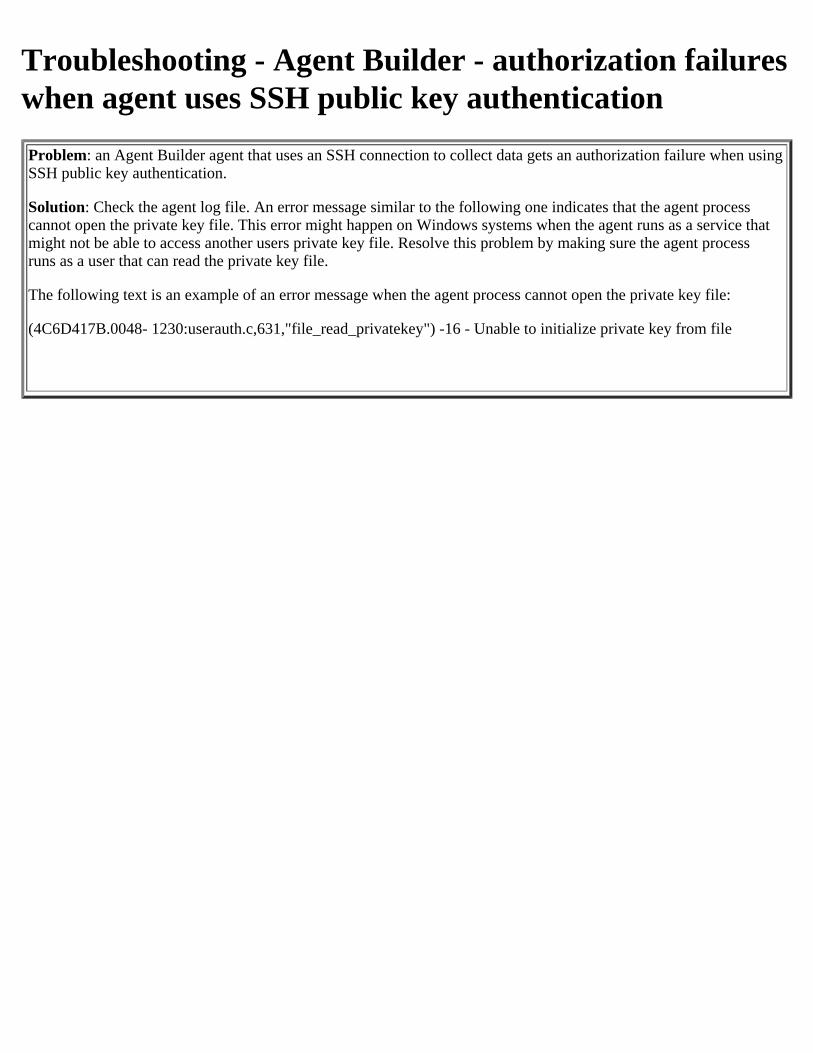
Troubleshooting - Agent Builder - authorization failureswhen agent uses SSH public key authenticationProblem: an Agent Builder agent that uses an SSH connection to collect data gets an authorization failure when using SSH public key authentication.
Solution: Check the agent log file. An error message similar to the following one indicates that the agent process cannot open the private key file. This error might happen on Windows systems when the agent runs as a service that might not be able to access another users private key file. Resolve this problem by making sure the agent process runs as a user that can read the private key file.
The following text is an example of an error message when the agent process cannot open the private key file:
(4C6D417B.0048- 1230:userauth.c,631,"file_read_privatekey") -16 - Unable to initialize private key from file

Troubleshooting - Agent Builder - ping attribute groupon Windows slow to respondProblem: It is a long time before you start getting data from a ping attribute group in an Agent Builder agent running on a Windows system.
Cause: Name resolution on Windows can take about 5 seconds to timeout if an IP address does not resolve to a host name. If you defined several devices that have this name resolution issue the ping attribute group takes longerthan expected to initialize.
Solution: Make sure the devices you define for ping can be resolved in DNS or by using entries in your local hosts file.
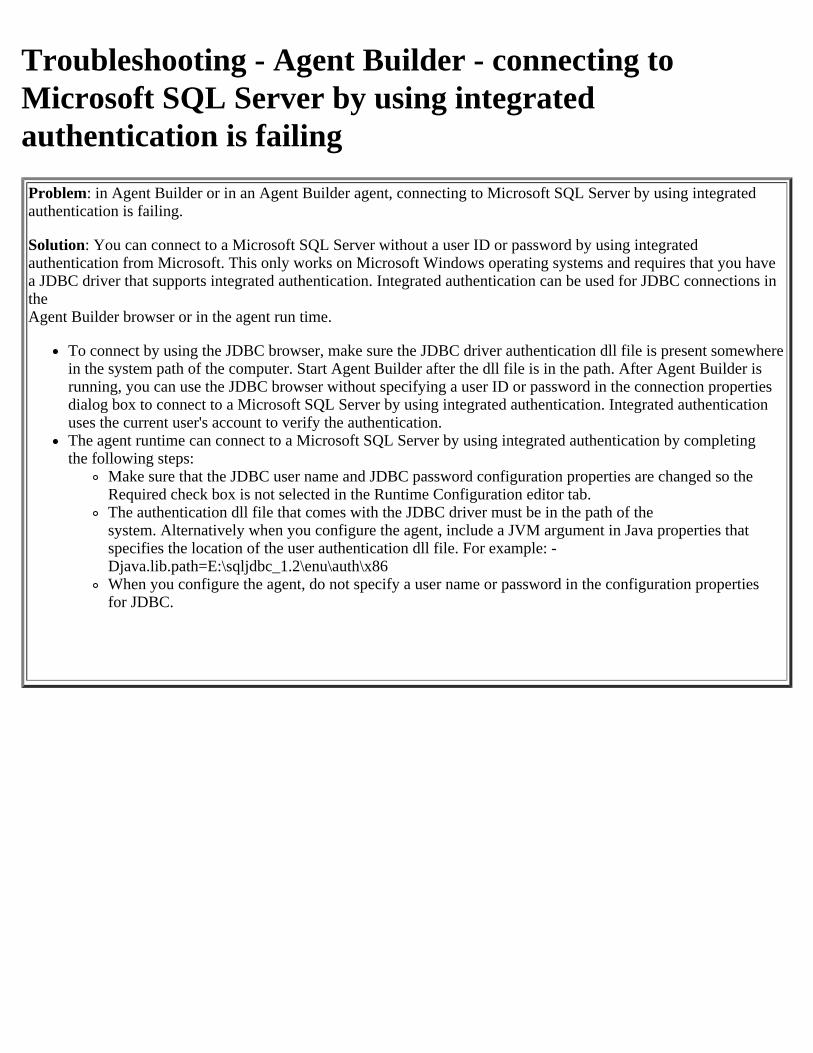
Troubleshooting - Agent Builder - connecting toMicrosoft SQL Server by using integratedauthentication is failingProblem: in Agent Builder or in an Agent Builder agent, connecting to Microsoft SQL Server by using integratedauthentication is failing.
Solution: You can connect to a Microsoft SQL Server without a user ID or password by using integratedauthentication from Microsoft. This only works on Microsoft Windows operating systems and requires that you havea JDBC driver that supports integrated authentication. Integrated authentication can be used for JDBC connections intheAgent Builder browser or in the agent run time.
To connect by using the JDBC browser, make sure the JDBC driver authentication dll file is present somewherein the system path of the computer. Start Agent Builder after the dll file is in the path. After Agent Builder isrunning, you can use the JDBC browser without specifying a user ID or password in the connection propertiesdialog box to connect to a Microsoft SQL Server by using integrated authentication. Integrated authenticationuses the current user's account to verify the authentication.The agent runtime can connect to a Microsoft SQL Server by using integrated authentication by completingthe following steps:
Make sure that the JDBC user name and JDBC password configuration properties are changed so theRequired check box is not selected in the Runtime Configuration editor tab.The authentication dll file that comes with the JDBC driver must be in the path of thesystem. Alternatively when you configure the agent, include a JVM argument in Java properties thatspecifies the location of the user authentication dll file. For example: -Djava.lib.path=E:\sqljdbc_1.2\enu\auth\x86When you configure the agent, do not specify a user name or password in the configuration propertiesfor JDBC.

Troubleshooting - Agent Builder - collecting metricsthrough the Windows APIs failsProblem: in an Agent Builder agent, collecting metrics through the Windows APIs fails.
Solution: To collect metrics from remote systems through the Windows APIs, the agent must be hosted on a Windows operating system. Remote registry administration must be enabled on the remote systems.
Troubleshooting - Agent Builder - an agent monitoringSNMP V2 events does not receive traps.Problem: an Agent Builder agent monitoring SNMP V2 events does not receive traps. The MIB for the monitoreddevice indicates the enterprise OID for the trap ends with a ".0". The received SNMP V2 traps contain thesnmpTrapOID.0 varbind with a value of enterprise OID.specific type.
Example: The received snmpTrapOID is: 1.3.6.1.4.1.1302.3.8.10.2.1.0.6
Enterprise OID defined in the MIB for this trap: 1.3.6.1.4.1.1302.3.8.10.2.1.0
Cause: The Agent Builder SNMP event receiver follows RFC 2089 so it can handle SNMP V1 and V2 traps. ThisRFC states that the last token of the snmpTrapOID.0 varbind is the specific trap field. This token and the precedingtoken if it is a 0 is removed from snmpTrapOID.0 to create the enterprise field. If your MIB includes enterprise OIDsthat end with a .0 but receives traps with the last two tokens that are removed from the snmpTrapOID, varbind doesnot match the enterprise OID in the MIB.
Solution: Make the following modification to your agent:
Edit the agent XML and find the lines that look like:
global_snmp_event_settings_for_group oids="1.3.6.1.4.1.1302.3.8.10.2.1.0-6"
Delete the .0 (including the dot), so it now looks like:
global_snmp_event_settings_for_groupoids="1.3.6.1.4.1.1302.3.8.10.2.1-6"
Regenerate and reinstall the agent.
Troubleshooting - Agent Builder - SNMP attributegroup not collecting data reliablyProblem: in an Agent Builder agent, data from an SNMP data source is collected intermittently or not at all. TheSNMP version and credentials are configured correctly.
The Performance Object Status Error Code for the attribute group shows NO RESPONSE RECEIVED.Note: This issue applies to SNMP attribute groups, sothe Object Type in the Performance Object Status table isSNMP.The agent trace file shows the following message:Timeout occurred. No response from agent.Here is a sample entry: (48A18C71.000A- 12:snmpqueryclass.cpp,1714,"internalCollectData") Timeout occurred. Noresponse from agent.
Cause: The IBM Tivoli Monitoring SNMP data provider is multithreaded to enhance performance. The SNMPdata source that is being monitored might not be able to respond to multiple incoming requests in a timely manner.
Solution: There are tuning options that can improve reliability of data collections:
Reduce the thread pool size. The default thread pool size is 15. Try reducing the size to 5. This setting can beadjusted in the agent ENV file by setting the CDP_DP_THREAD_POOL_SIZE environment variable.Increase the SNMP Response timeout. The default SNMP timeout is 2 seconds. Try increasing the timeout to 6seconds. This setting can be adjusted in the agent ENV file by setting theCDP_SNMP_RESPONSE_TIMEOUT environment variable.Reduce the number of SNMP retry attempts. The default number of SNMP retry attempts is 2. Try reducing thesize to 1. This setting can be adjusted in the agent ENV file by setting the CDP_SNMP_MAX_RETRIESenvironment variable.

Troubleshooting - Agent Builder - on Windows systems,when installing two agents with scripts of the samename, the script gets overwrittenProblem: On Windows operating systems, when two different agents are installed on the same monitoring environment, and they both have a script with the same name, the script from the last agent that wasinstalled or deployed overwrites any existing scripts of the same name. Scripts are copied into the instdir\tmaitm6 directory without a warning.
Solution: this behavior is expected because all scripts are written to the same directory for easy access. Use different script names in different agents.
Troubleshooting - Agent Builder - subnodes fromdifferent agent instances have the same managed systemname.Problem: Subnodes from different agent instances have the samemanaged system name.
Cause: The Managed System Name for a subnode consists of:
2 letter agent Product Code:first 24 characters of the Subnode ID:3 letter Subnode Type
The first 24 characters of subnode IDs must be unique for all instances of the subnode type in the monitoring environment.The agent automatically adds a product code prefix to prevent the subnodes from colliding with subnodes created by other agents. It automatically appends the subnode type to prevent collisions with other subnode types in the same agent. It uses the first 24 characters of the Subnode ID (which you control) as the final token.
No part of the Agent Instance or the Agent Host System is used in constructing the Subnode Managed System Name. If the same Subnode ID is used in several instances of the Agent, the Managed System Names collide. This name collision happens even for Agent Instances hosted on separatesystems. The result is the subnodes do not function.
Solution: set the CDP_DP_USE_HOSTNAME_IN_SUBNODE_MSN=Y environment variable.
Troubleshooting - Agent Builder - no data for WMI orPerfmon data sourceProblem: You try to monitor a WMI or Perfmon data source but no data is shown from an attribute group that collects data.
Solution: If the systems used for developing and testing the agent are different, the WMI classes and the Performance Monitor objects can be different too. Develop and test the agent on the same version of Windows and thesame version of the monitored application that you want to manage.

Troubleshooting - Agent Builder - agent monitoringservice status displays UNKNOWNProblem: You try to monitor a service with an Agent Builder agent but the message Status=UNKNOWN is displayed, even though you already verified that the agent has Administrator privileges.
Solution: The service is not installed on the system. When the view is being built for the Availability table, rows where the status is Unknown must be filtered out to prevent confusion. Filtering rows out is especially needed when an application is composed of a set of optional services. The lack of a service is not an error in this case; it is normal.
Troubleshooting - Agent Builder - service or processmonitoring returns zeros for metricsProblem: When you create an agent to monitor Service availability, the column values are not correct. All metrics,
including the Process ID, are zero.
For example:
For Services, you might receive the following information:
Status=UNKNOWN
and zeros for the availability metrics.
For Processes, you might receive the following information:
Status= PROCESS_DATA_NOT_AVAILABLE
and zeros for the availability metrics except for Process ID.
Solution: Ensure that the agent is being run under an Administrator ID.

Troubleshooting - Agent Builder - bad string valuesfrom SNMPProblem: strings collected from SNMP data source are wrong.
Cause: This behavior happens for OCTETSTRING types where the value is binary data and not strings. Binary data is not translated for display. It is forwarded as the binary data, resulting in wrong string representation.

Troubleshooting - Agent Builder - core memory dumpafter you edit the .ref fileProblem: Core memory dump with a seemingly innocent modification to the .ref file. For example, splitting attributes of an element in the .ref file onto different lines still produces valid XML, but the agent coredumps.
Solution: do not edit this file.

Troubleshooting - Agent Builder - script agent behavesoddly when the script is editedProblem: you edit the script that an agent calls and then the agent behaves oddly.
For instance, you edit the script and add a sleep 30 to simulate a timeout. The timeout occurs as expected during the next refresh of the group. Then you take out the sleep 30 and refresh the group again. The calculated values are now all set to 0.
Cause: this behavior happens when some values in the data set are rates or deltas, because the data set from the previous call is not available. No action is required.

Troubleshooting - Agent Builder - a data set with thescript data source does not return any dataProblem: you built a data set in an Agent Builder agent using the script data source, but the data set returns no data.
Solution: Read the log file and look for text that looks like:(46543D0F.0019-1A0C:shellqueryclass.cpp,331, "internalCollectData") Missing metrics. Skipping row. expected 15 tokens, parsed 2. Input:<FINDSTR>, separator:<:>This text indicates that your script returned data that did not match the defined format (in this case, items that are separated by a colon). It was attempting to parse the string that is contained within the first <> pair. Fix the script to return data in the correct format. You can test the result by editing the script in the agent directory without reinstalling or restarting the agent, because the agent calls the script each time to collect data.

Troubleshooting - Agent Builder - incorrect return codefor Windows scriptProblem: When an agent with a command return code data source runs a Windows .bat or .cmd script, the returned code is not reported correctly. The script exits with something like exit /b 2.
Solution: Use another ("wrapper") script to call the target script. The wrapper script must exit with the command:
exit %ERRORLEVEL%
Troubleshooting - Agent Builder - specification error forreserved nameProblem: You receive the following message:Specification Error: Application name begins with Tivoli reserved name.
Solution: Do not name your agents with any of the followingreserved names:
SNM*UAG*MAS*INT*
Case does not matter as lowercase is also incorrect.
Troubleshooting - Agent Builder - log file datamismatchProblem: in an Agent Builder agent that monitors a log file, a record rom the log file is not displayed or wrong data is displayed for the last entry or last few entries of the log.
Solution: Check for error messages in the trace file, for example, HOSTNAME_81_k81agent_465c087e-01.log.
Look for the following type of trace entries:
(465C08D7.0000-2A4:logmonitorqueryclass.cpp,506,"LogMonitorQuery Class::setInstanceData")Agent metric count and UA metric count do no match! Agent count=<7>, UAcount=<6>.(465C08D7.0001-2A4:logmonitorqueryclass.cpp,561,"LogMonitorQuery Class::setInstanceData")UA ran out of values foragent metric! Agent name=<rest>.
The Agent count indicates the number of attributes that are expected to be completed from a log file record. The UA count is the number of records that the data provider parsed from thelog record. A mismatch means that some of the attributes might be parsed from the log record. However, others might not because there was less data in the log record than expected. Make sure that the configuration of the log data source matches the actual format of the log file.
Troubleshooting - Agent Builder - RAS1 log errorsProblem: in an Agent Builder agent monitoring a process on Windows, you see RAS1 error messages in the log files, for example:
(46C30EA0.0000-2180:getprocesscmdline.cpp,387, "GetProcessCmdLine") Unable to read the process environment block. ReadProcessMemory returned 0.(46C30EA0.0001-2180:getprocesscmdline.cpp,589, "getPIDCommandLine") Failed to get process command line, pid(4) error: Only part of a ReadProcessMemory or WriteProcessMemory request was completed.
Cause: This error can occur on some systems for the process that represents the system in Windows. Theprocess environment block is not available for this process. System is a special process and normally is not one you are monitoring. If all of the data in your Availability table is completed, then this error does not represent a problem. You can verify by checking the PID printed in the trace against the PIDs for the processes you are monitoring.
Troubleshooting - Agent Builder - JMX data providercannot connect to Oracle WebLogic Server on AIXProblem: The JMX data provider fails to connect to the Oracle WebLogic Server when you run an Agent Builder agent on AIX.
Solution: This connection problem is a limitation that is documented by Oracle WebLogic. Connect to Oracle WebLogic remotely from an operating system with a compatible Sun Java runtime environment.
In this case, the agent must be configured to use the compatible Sun Java runtime environment instead of the IBM Java runtime environment.
Troubleshooting - Agent Builder - error displayed whentesting a JMX data set, MBeans do return dataProblem: The Performance Object status error code for your JMX data set (attribute group) isATTRIBUTE_ERROR. Data is beingreturned for the MBeans, so what does this mean?
Solution: A JMX attribute group that has an error code set to ATTRIBUTE_ERROR in the performance object status attribute group has one or more attributes that cannot be collected. This error not only indicates a problem with one or more attributes, but it is a performance issue as well.
To determine which attributes are having a problem, look for the exceptions in the JMX trace log file. The exceptions typically indicate the class path cannot locate a certain class or the attribute object cannot be serialized.
When you see this error, the attributes must be collected individually from the MBean Server instead of collecting all attributes in one remote call. This collection method can significantly affect the performance of the agent.
Troubleshooting - Agent Builder - JMX Monitors notworking with JBoss application serverProblem: JMX Monitors are not working with the JBoss application server.
Solution: The following action is needed to make JMX Monitors work.
Copy the connJboss-1.0.jar file from CANDLE_HOME/TMAITM6/kxx/jars/common/connectors/jboss (on Windows systems) or CANDLE_HOME/dynarch/kxx/jars/common/connectors/jboss (on Linux and UNIX systems) toJBoss_install/server/default/lib.
CANDLE_HOME is the IBM Tivoli Monitoring or IBM Performance Management installation directory.JBoss_install is the JBoss Application Server installation directory.
If you have a server configured other than the default server, the default part of the path is different for your server. If the JBoss server is running, it must be restarted after you copy this file.

Troubleshooting - Agent Builder - receiving JMXnotificationsProblem: you need to create a data source to receive notifications, but do not see an option to configure the data source in this way.
Solution: When you use the browser, take note of the MBean information that is displayed in the browser panel for the MBean you are working with. If the MBean contains items in the Attributes tab, then you get an attribute group that contains those metrics. If the MBean contains items in the Notifications tab, you get an event attribute group that contains a standard set of metrics for a Notification object. If both tabs contain values, then you get attribute groups for each.
If notifications are not defined for the MBean, the browser does not create the event attribute group. You can create the event attribute group manually by not clicking Browse to display the JMX browser. Instead, manually type in the Object Name pattern and click Finish. This action creates the same event attribute group that you get from the browser had notifications been detected. It also creates an attribute group to receive data with no attributes defined. This other attribute group can be deleted.
Troubleshooting - Agent Builder -ATTRIBUTE_ERROR displayed in the PerformanceObject Status attribute group when testing agentProblem: ATTRIBUTE_ERROR is displayed in the Performance Object Status attribute group when testing an agent in Agent Builder
Cause: If there is a data collection problem for a particular attribute from certain data sources, a test run of the agent in Agent Builder might display ATTRIBUTE_ERROR in the Performance Object Status attribute group.
To diagnose the issue, review the trace log files named Kxx_datasource_trace.log, for example, K25_JMX_trace.log. Agent Builder displays the log file location at the top of the window (when testing a single attribute group) or in the Attribute Group Test window (when testing the entire agent).
The log file will usually contain error messages showing the issue in more detail. For example, it might contain an "attribute not found on MBean" error for JMX.
Troubleshooting - Agent Builder - negative or wrongattribute value in agentProblem: you created an agent that includes a number that you expect to be a large positive number, but you see anegative or incorrect number.
Solution: make sure the attribute is configured as a 64-bit value and not a 32-bit value.
Also, you can handle overflows by creating another attribute that scales the large one to a more reasonable value. Forexample, if the number represents the size of the disk in bytes, it is more useful to use megabytes or even gigabytes.Use the following procedure to convert thevalue:
1. Select the Data Sources tab in the Agent Builder.2. Right-click the data source.3. Select New Derived Attribute...4. Choose a new name. For example, for Size, you can add units like Size_MB.5. Add a description.6. Select the appropriate data type. For example, Counter is correct for a total size.7. Create the formula.
Select the attribute. For example, Size.Convert the value appropriately. For instance, Size/1048576 converts from bytes to megabytes
You can now either leave the original attribute or hide it by selecting the attribute and clearing Display attribute in the Tivoli Enterprise Portal. Hide the original attribute if it is likely that it might overflow as a 32-bit or 64-bit signed value (whichever is configured).
Troubleshooting - Agent Builder - script agent fails torun a script with a space in its nameProblem: In a script data source, there is no data or a command return code is unusable. You see messages similar to the following text in the trace log:
(46C44462.0000-184C:commandwithtimeout.cpp,278, "CommandWithTimeout::threadMain") *Error: Failure in call to CreateProcess() for scriptscript1 not.bat Error The system cannot find the file specified.
This message shows that the agent tried to run the command script1with the argument not.bat.
Solution: If you call a script or other program with spaces in the name, use quotation marks around the name so that the space is not parsedby the command interpreter. For example,
this is a test.bat argument
becomes:
"this is a test.bat" argument

Troubleshooting - Agent Builder - no data or wrongdata in Collect Data windowProblem: When you click Collect Data in a Test window, no data is returned or the data is not what you expect.
Examples: Log file provider might not detect and process the file yet. Ping might report all zeros since the ping did not happen yet.
Solution: Click Collect Data a second time. If this action does not resolve the issue, you can click Check Results. The Data Collection Status window opens and shows you more information about the data collected.

Troubleshooting - Agent Builder - JMX browser fails toconnect to WebLogic 10.xProblem: The JMX browser fails to connect to WebLogic 10.x.
The configuration settings are correct, but connection errors in the traceKQZ.log file show that aCORBA.MARSHAL error occurred.
Solution: Copy the wlclient.jar and the wljmxclient.jar files from your WebLogic server installation into thejre/jre/lib/ext directory of the Agent Builder installation and restart Agent Builder. This action loads the WebLogic JAR files in the system class loader which makes sure the correct classes are loaded to create the JMX connection.
After you create your attribute groups by using the JMX browser, you must remove these two JAR files and restart Agent Builder.
Troubleshooting - Agent Builder - Parse function inParse Log window returns incorrect resultProblem: When you use the Parse function on the Parse Log window, incorrect results are returned, such as no rows shown.
Cause: The Test log file parser reads only the last 1,000 lines of the log file in tail mode.
Solution: Make sure the data that you are trying to test for occurs in the last 1000 lines of your sample log file.

Troubleshooting - Agent Builder - workspace screen notresponding on Linux/UNIX system over a CygwinXserverProblem: The Agent Builder workspace screen does not respond on a Linux or UNIX system over a Cygwin Xserver. When you start AgentBuilder, the options on the workspace screen are unavailable and you are unable to complete any actions.
Cause: an issue can happen with Eclipse interaction with the Xming and Cygwin tools. There is no fix available.

Troubleshooting - Agent Builder - iFixes applied to theAgent Builder are not removed when the Agent Builderis uninstalledProblem: If you apply an interim fix to Agent Builder, when you uninstall Agent Builder, the interim fix is not removed. When uninstalling, an installer message informs you that it was unable to remove all directories.
Solution: Remove the interim fix directories manually before you reinstall the Agent Builder.

Troubleshooting - Agent Builder - JRE or JDK notavailableProblem:You receive the following message:
A Java Runtime Environment (JRE) or Java Development Kit (JDK) must be available in order to run Agentbuilder. No Java virtual machine was found after searching the following locations: C:\ProgramFiles\IBM\ITM\AgentBuilder/jre/jre/bin/javaw.exe.
Solution: Open the install_dir/agentbuilder.ini file and modify any lines that have a leading space by removing the leading space.

Troubleshooting - Agent Builder - error messagetruncatedProblem: An error message in any of the Agent Builder wizards is truncated.
Solution: Resize the window to make it wider so that the entiremessage can be viewed.
Troubleshooting - Agent Builder - in script agent, youcan not pass runtime parameters to the scriptProblem: When you create a script agent, passing a runtime Parameter as an argument to the script at execution timedoes not work.
Cause: The command line cannot include environment variables. Runtime parameters must be referenced inside thescript.
Solution: Reference the variable inside the script.
For example, the command cannot be script ${K51_PROCNAME}. Instead, inside the script, reference the variable:
On Windows systems: PROCNAME=%K51_PROCNAME%On Linux or UNIX systems: PROCNAME=$K51_PROCNAME
Troubleshooting - Agent Builder - project defaultlocation errorProblem: On the New Agent Project page, if you clear the Use default location check box and then browse to, or type, the default location, Eclipse displays an error that the specified directory overlaps an existing workspace. If you type a subdirectory underneath this location, Eclipse displays an error that the directory overlaps an existing project.
Solution: If you want to use the default location, select the Use default location check box. Do not browse to, or type, the default location.

Troubleshooting - Agent Builder - uninstallation endswith an errorProblem: If the Agent Builder is running when you attempt to uninstall, the uninstaller ends with an error.
Solution: Close Agent Builder and manually delete the Agent Builder installation directory to complete the uninstallation.
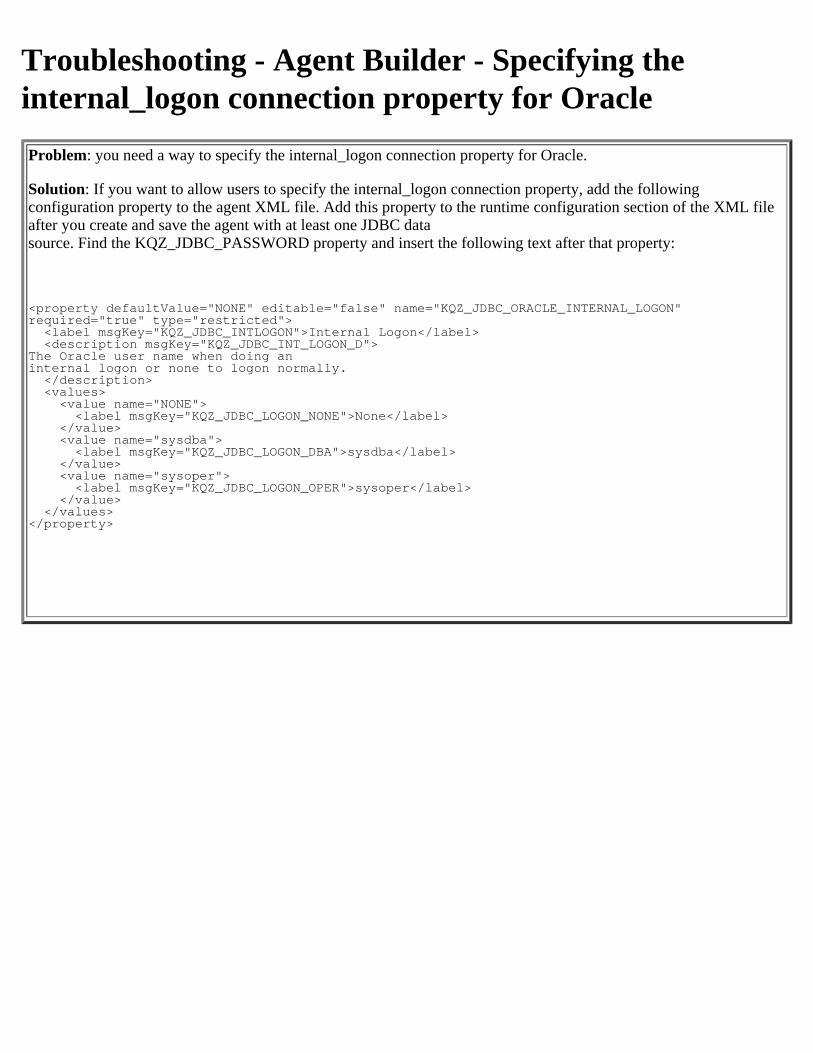
Troubleshooting - Agent Builder - Specifying theinternal_logon connection property for OracleProblem: you need a way to specify the internal_logon connection property for Oracle.
Solution: If you want to allow users to specify the internal_logon connection property, add the followingconfiguration property to the agent XML file. Add this property to the runtime configuration section of the XML fileafter you create and save the agent with at least one JDBC datasource. Find the KQZ_JDBC_PASSWORD property and insert the following text after that property:
<property defaultValue="NONE" editable="false" name="KQZ_JDBC_ORACLE_INTERNAL_LOGON" required="true" type="restricted"> <label msgKey="KQZ_JDBC_INTLOGON">Internal Logon</label> <description msgKey="KQZ_JDBC_INT_LOGON_D">The Oracle user name when doing aninternal logon or none to logon normally. </description> <values> <value name="NONE"> <label msgKey="KQZ_JDBC_LOGON_NONE">None</label> </value> <value name="sysdba"> <label msgKey="KQZ_JDBC_LOGON_DBA">sysdba</label> </value> <value name="sysoper"> <label msgKey="KQZ_JDBC_LOGON_OPER">sysoper</label> </value> </values></property>
Troubleshooting - Agent Builder - JDBC connection toz/OS DB2 database is failingProblem: JDBC connection to z/OS DB2 database is failing.
Cause: The z/OS DB2 connection fails if you are not using the JAR files that include the correct licensing information.
Solution: Make sure that you are using the correct set of JAR files.

Troubleshooting - Agent Builder - On a Linux or UNIXsystem, the Browse button is not active when addingcertain data sources
Problem: When Agent Builder is running on a Linux or UNIX system, you add a WMI, Perfmon, or Windows Event Log data source, and the Browse button is not active.
Cause: For Agent Builder on Linux or UNIX systems, you cannot use the Browse function when you are creating WMI, Perfmon, or Windows Event Log data sources. The Windows APIs must be available on the Agent Builder system to Browse these data sources.
You can still define these types of data sources when you run the Agent Builder on Linux or UNIX systems by specifying the data source information manually.
Troubleshooting - Agent Builder - in a CIM array, onlythe first value is returnedProblem: in a CIM data source, the source is an array. Only the first value in the array is returned.
Cause: this is a limitation in the current version of Agent Builder. Agent Builder does not have an array data type.
CIM String Arrays can contain variable length data. The agent concatenates all of the strings into a single value that is separated by a comma (,). To represent a string array correctly. verify that the overall length of the attribute is large enough to contain all of the expected values.
There is no delimiter in the Integer data type and the CIM data provider does not convert an integer array to string data. Therefore, in a CIM integer array, only the first value (integer) is returned.
Troubleshooting - Agent Builder - modifying the log fileformat for Log file data sourceProblem: when editing an existing Log file data source, you can add fields only at the end of the log record (Next field). When the application log format changes and adds a field that is not in the end, there is no way to modify the agent to work with the new log file format.
Solution: Generally, application log format remains static most of the time, and when it changes, it changes dramatically.
It is also often necessary to support the new and old log file formats in the same agent so that it works with both current and old versionsof the application.
The best way to handle this issue in an agent is to add an attribute group that represents the new log file format. When the agent is deployed to a system, you normally configure the name of the file to be monitored in the appropriate configuration variable. Use another configuration variable for the new format log file name, and configure only one of the variables on any system.This ensures that only the old or new attribute group is used in a specific instance of the
Troubleshooting - Agent Builder - finding out theversion of Agent Builder on Linux and UNIX systemsProblem: on some Linux and UNIX systems the GUI is not available and you can not view the version of Agent Builder in the GUI. However, you need to find out the version of Agent Builder that is installed in the system.
Solution: The directory name that matches the following pattern contains the current version of Agent Builder:
install_dir\features\com.ibm.tivoli.monitoring.agentkit_X.Y.Z.vYYYYMMDDHHmm
or
install_dir\features\com.ibm.tivoli.monitoring.agentkit_*
Troubleshooting - Agent Builder - parsing a MIB file forSNMP failsProblem: When you load a MIB file (for SNMP) into the Agent Builder, it does not parse. Error messages similar tothe following messages are displayed:
KQZ0022E Unexpected error parsing MIB file D:\mibs\mymib.MIB.Stack trace:com.ibm.tivoli.monitoring.agentkit.AgentException: KQZ0022E Unexpected error parsing MIB fileD:\mibs\mymib.MIB.at com.ibm.tivoli.monitoring.agentkit.actions.LoadInitialMIBData.run(Unknown Source)atorg.eclipse.jface.operation.ModalContext$ModalContextThread.run(ModalContext.java:113)
Caused by: java.lang.NullPointerExceptionatcom.tivoli.snmp.metadata.MibParser.OTdefinition(MibParser.java:1198) atcom.tivoli.snmp.metadata.MibParser.assignment (MibParser.java:1081)atcom.tivoli.snmp.metadata.MibParser.mibModule(MibParser.java:599)
(source line numbers can differ).
Cause: The MIB parser that is used by the Agent Builder uses the grammar that is defined by ASN.1 to parse theMIBs. Some MIB files do not follow the grammar correctly.
Solution: The parser can relax certain rules to accommodate the most common errors. The MIB must be corrected,but until that can be done you can turn off checking for common errors by completing the following steps:
1. On the Agent Builder menu bar, click Window > Preferences.2. Click Agent Generator in the selection pane.3. Select one of the following options in the MIB Parsing Options list:Allow types to start with lowercase letters: Allows types that people write in MIBs, such as valuesAllow numeric named numbers: Allows numbers that start with uppercase lettersAllow underscore in value name: Allows underscore charactersAllow values to begin with uppercase letters: Allows various (technically) invalid thingsIgnore duplicate MIBs: Turns off warning for duplicate MIB modules
If a MIB file still can not be parsed after these steps, you must fix the errors in the file and try ti parse the file again.

Troubleshooting - Agent Builder - Resource out of syncProblem: you edit the agent xml file outside the Agent Builder project. When you open the project in Agent Builder, you get the following error:
Unable to create this part due to an internal error.Reason for the failure: Resource is out of sync with the file system: /bounds/itm_toolkit_agent.xml.
Solution: To fix the error, click the project and press F5 to refresh. Then, close the Agent Editor and reopen it.
Troubleshooting: Liberty data collector - Only requestdata is available on APM UIProblem: The standalone data collector has been configured for Liberty in Bluemix (without installing the WebSphereApplications agent). Monitoring data can be displayed on the APM UI for the selected Liberty Runtime instance.However, after Cloud APM server is upgraded to V8.1.4, only request data can show up for the Liberty Runtimeinstance on the APM UI. Other widgets are empty.
Solution: Upgrade the standalone Liberty data collector by completing the following steps:
1. Unconfigure the data collector by rolling back the changes that are made in the jvm.options, server.env,and server.xml files for the Liberty server in local Liberty server home directory and delete the entire .gdcdirectory. See Unconfiguring the data collector for Bluemix applications.
2. Download the data collector package for the new version of the Cloud APM server.3. Configure the Liberty data collector with the new package again. See
Configuring the Liberty data collector for Bluemix applications.4. Log in to Bluemix and update the Liberty profile with the cf push command.
For detailed instructions about how to configure or unconfigure the standalone Liberty data collector (not limited toLiberty in Bluemix), use proper links in the following topic of Cloud APM Knowledge Center:
Cloud APM (on Cloud):https://www.ibm.com/support/knowledgecenter/SSMKFH/com.ibm.apmaas.doc/install/install_dc_upgrade.htmCloud APM, Private:https://www.ibm.com/support/knowledgecenter/SSHLNR_8.1.4/com.ibm.pm.doc/install/install_dc_upgrade.htm
Troubleshooting IPM v8.1.3 UI for TransacitonTrackingDo we have any documentation on how to debug/fix problems with Transaction Tracking views in the IPM UI? I am trying to configure the WebSphere MQ to show transaction details. When I pull up the page to see the information, I see "Dataprovider error" on all the views. Is there any documentation I can look at to correct what may be not working? I'm attaching a "screen shot" of the IPM UI
Troubleshooting - API Connect scenario: Liberty datacollector - No thread pool information when monitoringAPI Connect controllerProblem:
There is no thread pool information for the monitored API Connect controller.
Solution:
A solution is currently not available. In the API Connect scenario, the Liberty data collector can only get theinformation about default executor thread pool or large thread pool. The API Connect controller does not use defaultexecutor as the thread pool name, so no data is available on the widget.
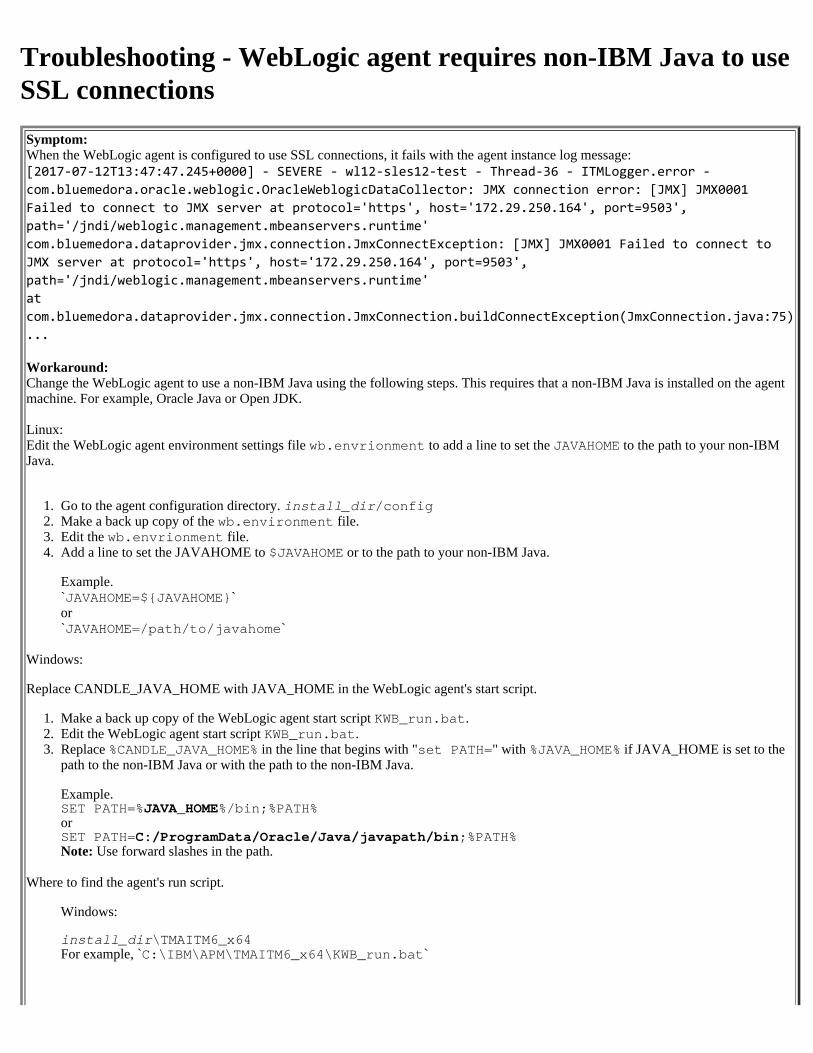
Troubleshooting - WebLogic agent requires non-IBM Java to useSSL connectionsSymptom:When the WebLogic agent is configured to use SSL connections, it fails with the agent instance log message:[2017-07-12T13:47:47.245+0000] - SEVERE - wl12-sles12-test - Thread-36 - ITMLogger.error -com.bluemedora.oracle.weblogic.OracleWeblogicDataCollector: JMX connection error: [JMX] JMX0001Failed to connect to JMX server at protocol='https', host='172.29.250.164', port=9503',path='/jndi/weblogic.management.mbeanservers.runtime'com.bluemedora.dataprovider.jmx.connection.JmxConnectException: [JMX] JMX0001 Failed to connect toJMX server at protocol='https', host='172.29.250.164', port=9503',path='/jndi/weblogic.management.mbeanservers.runtime'atcom.bluemedora.dataprovider.jmx.connection.JmxConnection.buildConnectException(JmxConnection.java:75)...
Workaround:Change the WebLogic agent to use a non-IBM Java using the following steps. This requires that a non-IBM Java is installed on the agentmachine. For example, Oracle Java or Open JDK.
Linux:Edit the WebLogic agent environment settings file wb.envrionment to add a line to set the JAVAHOME to the path to your non-IBMJava.
1. Go to the agent configuration directory. install_dir/config2. Make a back up copy of the wb.environment file.3. Edit the wb.envrionment file.4. Add a line to set the JAVAHOME to $JAVAHOME or to the path to your non-IBM Java.
Example.`JAVAHOME=${JAVAHOME}`or`JAVAHOME=/path/to/javahome`
Windows:
Replace CANDLE_JAVA_HOME with JAVA_HOME in the WebLogic agent's start script.
1. Make a back up copy of the WebLogic agent start script KWB_run.bat.2. Edit the WebLogic agent start script KWB_run.bat.3. Replace %CANDLE_JAVA_HOME% in the line that begins with "set PATH=" with %JAVA_HOME% if JAVA_HOME is set to the
path to the non-IBM Java or with the path to the non-IBM Java.
Example.SET PATH=%JAVA_HOME%/bin;%PATH%orSET PATH=C:/ProgramData/Oracle/Java/javapath/bin;%PATH%Note: Use forward slashes in the path.
Where to find the agent's run script.
Windows:
install_dir\TMAITM6_x64For example, `C:\IBM\APM\TMAITM6_x64\KWB_run.bat`
Whereinstall_dir
The path where the agent is installed. The default paths are as follows:
Linux: /opt/ibm/apm/agentWindows: C:\IBM\APM\TMAITM6_x64
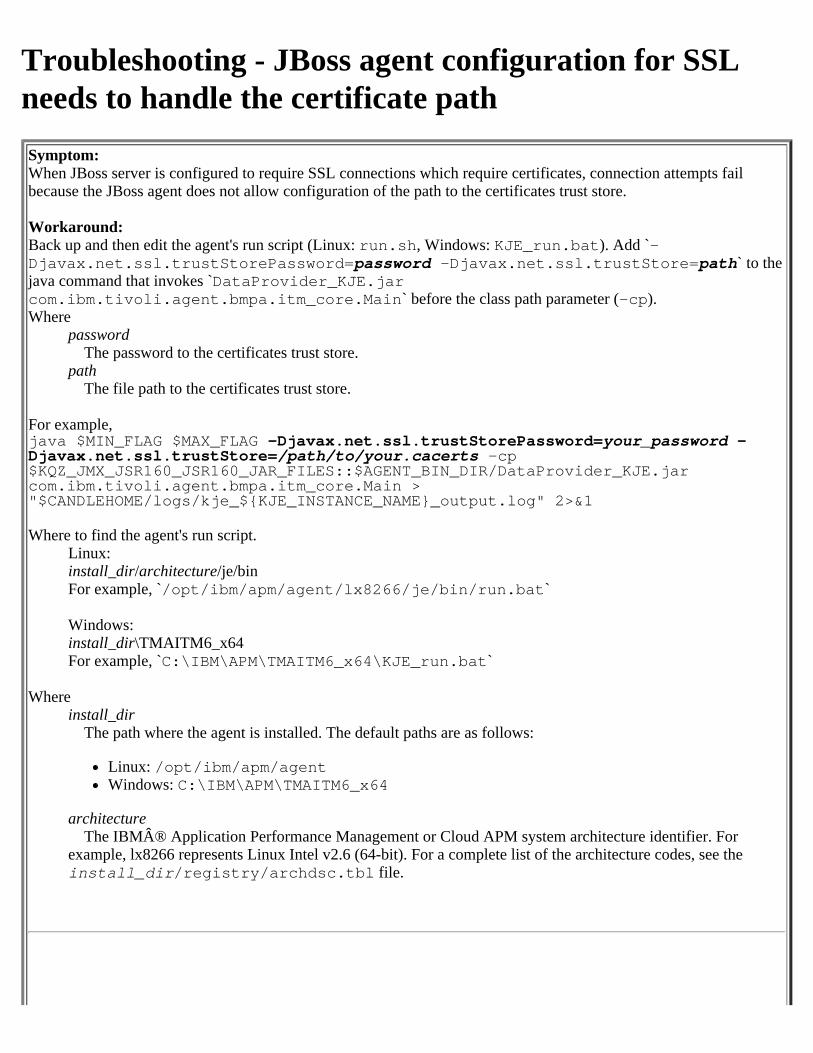
Troubleshooting - JBoss agent configuration for SSLneeds to handle the certificate pathSymptom:When JBoss server is configured to require SSL connections which require certificates, connection attempts failbecause the JBoss agent does not allow configuration of the path to the certificates trust store.
Workaround:Back up and then edit the agent's run script (Linux: run.sh, Windows: KJE_run.bat). Add `-Djavax.net.ssl.trustStorePassword=password -Djavax.net.ssl.trustStore=path` to thejava command that invokes `DataProvider_KJE.jarcom.ibm.tivoli.agent.bmpa.itm_core.Main` before the class path parameter (-cp).Where
password The password to the certificates trust store.path
The file path to the certificates trust store.
For example,java $MIN_FLAG $MAX_FLAG -Djavax.net.ssl.trustStorePassword=your_password -Djavax.net.ssl.trustStore=/path/to/your.cacerts -cp$KQZ_JMX_JSR160_JSR160_JAR_FILES::$AGENT_BIN_DIR/DataProvider_KJE.jarcom.ibm.tivoli.agent.bmpa.itm_core.Main >"$CANDLEHOME/logs/kje_${KJE_INSTANCE_NAME}_output.log" 2>&1
Where to find the agent's run script.Linux: install_dir/architecture/je/binFor example, `/opt/ibm/apm/agent/lx8266/je/bin/run.bat`
Windows: install_dir\TMAITM6_x64For example, `C:\IBM\APM\TMAITM6_x64\KJE_run.bat`
Whereinstall_dir
The path where the agent is installed. The default paths are as follows:
Linux: /opt/ibm/apm/agentWindows: C:\IBM\APM\TMAITM6_x64
architecture The IBM® Application Performance Management or Cloud APM system architecture identifier. Forexample, lx8266 represents Linux Intel v2.6 (64-bit). For a complete list of the architecture codes, see theinstall_dir/registry/archdsc.tbl file.
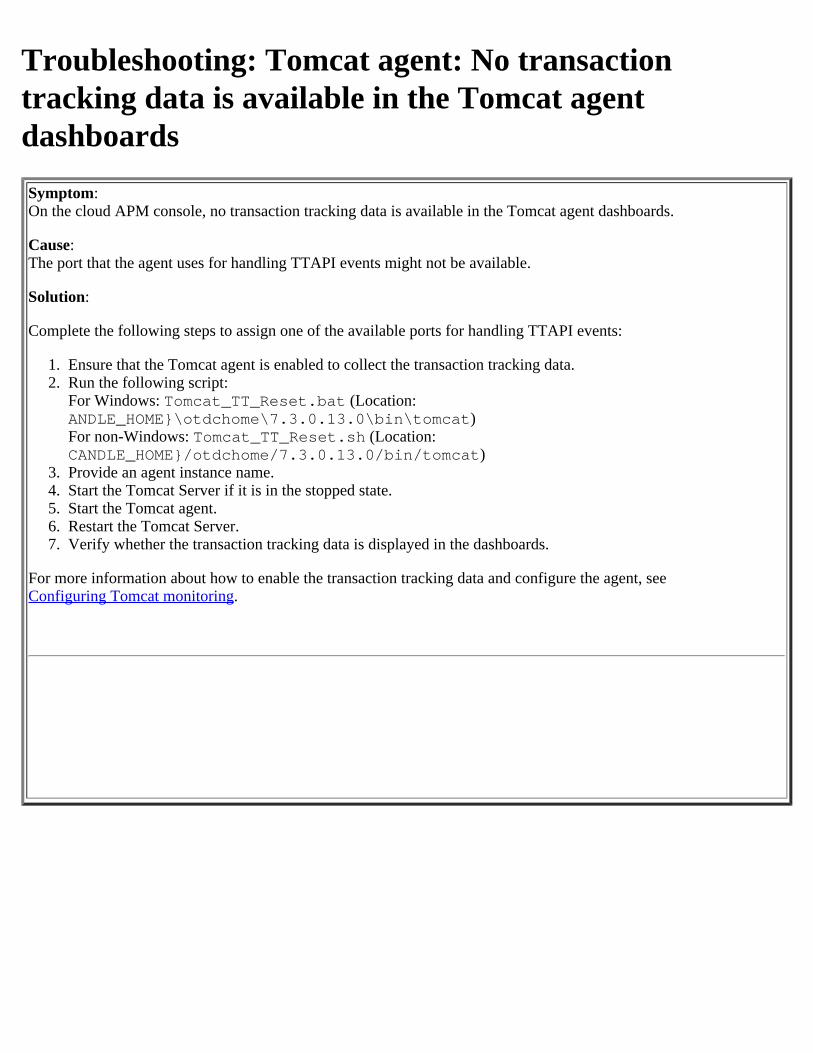
Troubleshooting: Tomcat agent: No transactiontracking data is available in the Tomcat agentdashboardsSymptom: On the cloud APM console, no transaction tracking data is available in the Tomcat agent dashboards.
Cause:The port that the agent uses for handling TTAPI events might not be available.
Solution:
Complete the following steps to assign one of the available ports for handling TTAPI events:
1. Ensure that the Tomcat agent is enabled to collect the transaction tracking data.2. Run the following script:
For Windows: Tomcat_TT_Reset.bat (Location:ANDLE_HOME}\otdchome\7.3.0.13.0\bin\tomcat)For non-Windows: Tomcat_TT_Reset.sh (Location:CANDLE_HOME}/otdchome/7.3.0.13.0/bin/tomcat)
3. Provide an agent instance name.4. Start the Tomcat Server if it is in the stopped state.5. Start the Tomcat agent.6. Restart the Tomcat Server.7. Verify whether the transaction tracking data is displayed in the dashboards.
For more information about how to enable the transaction tracking data and configure the agent, seeConfiguring Tomcat monitoring.
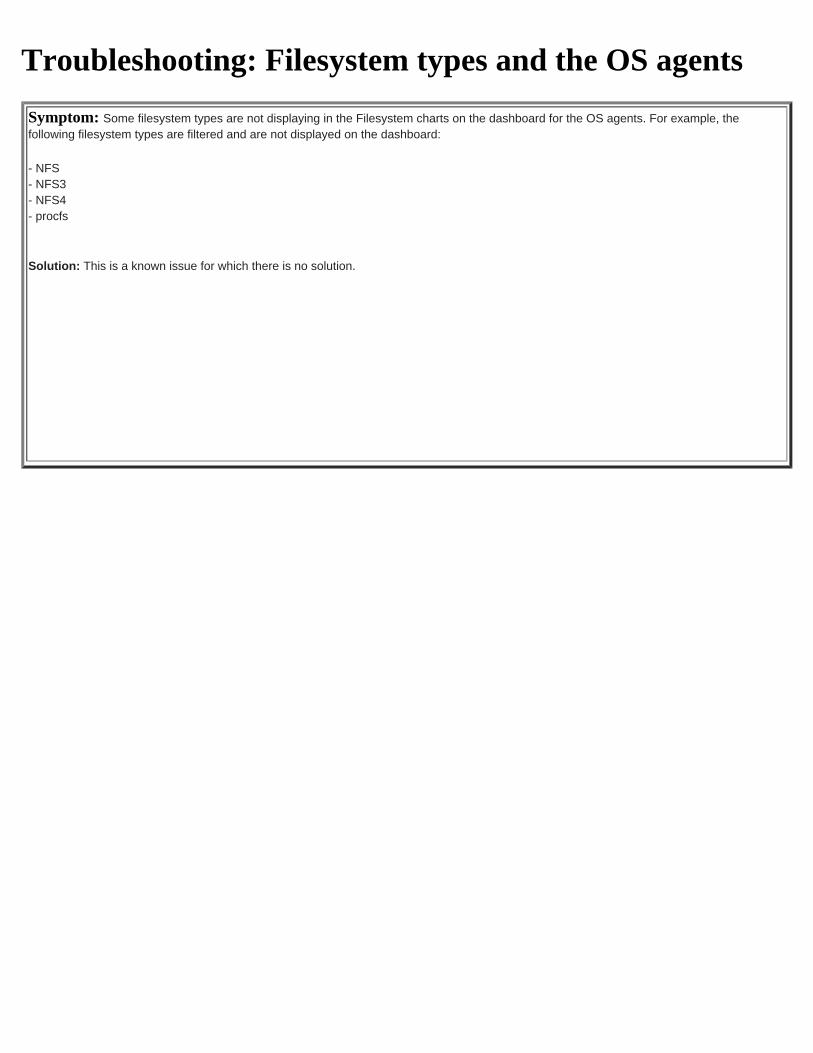
Troubleshooting: Filesystem types and the OS agentsSymptom: Some filesystem types are not displaying in the Filesystem charts on the dashboard for the OS agents. For example, thefollowing filesystem types are filtered and are not displayed on the dashboard:
- NFS- NFS3- NFS4- procfs
Solution: This is a known issue for which there is no solution.

Troubleshooting: OS agents and log file monitoringSymptom: If the log monitoring .conf and .fmt files are removed from a configuration, the logfile monitoring resource remains and it is not removed.
Solution: Restart the agent to clear the offline logfile monitoring resource.
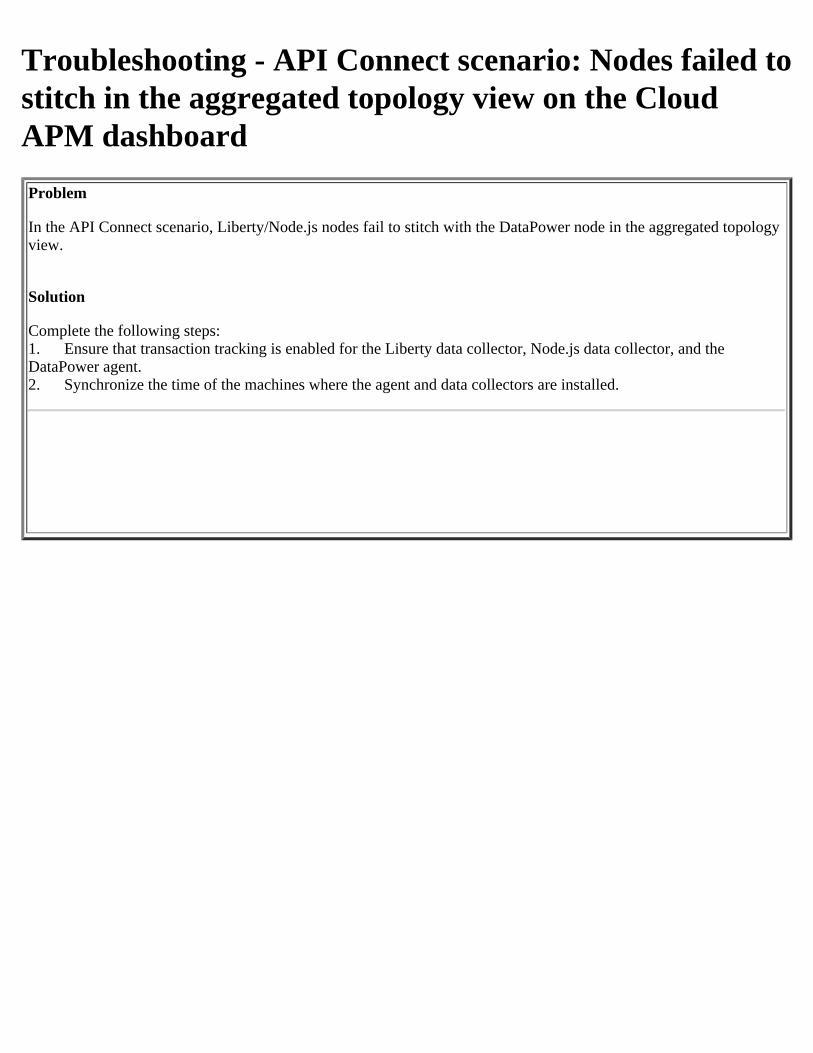
Troubleshooting - API Connect scenario: Nodes failed tostitch in the aggregated topology view on the CloudAPM dashboardProblem
In the API Connect scenario, Liberty/Node.js nodes fail to stitch with the DataPower node in the aggregated topologyview.
Solution
Complete the following steps:1. Ensure that transaction tracking is enabled for the Liberty data collector, Node.js data collector, and theDataPower agent.2. Synchronize the time of the machines where the agent and data collectors are installed.
Troubleshooting - Liberty data collector: No data in theSlowest Web Applications (history) widget whenmonitoring APIC collective controllerProblem
On the Cloud APM dashboard, there is no data in the Slowest Web Applications(history) from PMI widget for themonitored API Connect controller.
Solution
A solution is currently not available. There is no web application data displayed on the PMI interface because there isno application deployed on the API Connect controller.
Troubleshooting - WebSphere MQ agent: Transactiontracking does not workProblem:
The WebSphere MQ agent has been configured without specifying an agent name, which is used as the middlequalifier of MSN. After MQI application activity trace information collection is enabled at the queue manager andtransaction tracking is enabled for the agent, transaction tracking is not working and there are no topology viewsavailable for the agent.
Solution:
Although the agent name is an optional parameter during configuration, you must specify this parameter fortransaction tracking to work properly. Reconfigure the agent to specify an agent name. After configuration, a filenamed mq_tfe_<qmgr_name>.cfg should be created. This file controls the transaction tracking configurationwithin the WebSphere MQ agent.
Troubleshooting: Hadoop agent: Test connection failsfor a Hadoop cluster enabled with KerberosauthenticationSymptom:
In the configuration panel of the Hadoop agent, when you click the Test Connection button to verify connection tothe specified hosts of the Hadoop cluster that is secured with Kerberos SPENGO-based authentication, a messageabout the connection failure is displayed for all the Hadoop hosts.
Cause:
Verifying connection to hosts of a Hadoop cluster that is secured with Kerberos SPENGO-based authentication is notsupported.
Solution:
A solution is currently not available.
Troubleshooting - SAP NetWeaver Java Stack agent:The SAP NetWeaver Java Stack Instance does not startafter configuration.Symptom:
When you configure an instance of the SAP NetWeaver Java Stack agent along with data collector that is present withthe agent, the instance does not start.
On the Linux or AIX system, the following error message is displayed in the/usr/sap/<SID>/<InstanceID>/work/std_server0.out log file.
J Error occurred during initialization of VMJ Could not find agent library am_ibm_16 on the library path, with error:libam_ibm_16.so: cannot open shared object file: No such file or directoryJ [Last 4000 events in the event buffer]J <thread> <time> <id> <description>J 140107159955200 0.00 0x00000001 Protecting memory withrights 0 [0x00007f6d5e0a7000,0x00007f6d5e0a8000]F [Thr 140107159955200] *** LOG => SfCJavaVm: abort hook is called.
On the Windows system, the following error message is displayed in the<SAP_Installation_Drive>\usr\sap\<SID>\<InstanceID>\work\std_server0.out log file.J Error occurred during initialization of VMJ Could not find agent library am_ibm_16 on the library path, with error:am_ibm_16.dll: cannot open shared object file: No such file or directoryJ [Last 4000 events in the event buffer]J <thread> <time> <id> <description>J 140107159955200 0.00 0x00000001 Protecting memory withrights 0 [0x00007f6d5e0a7000,0x00007f6d5e0a8000]F [Thr 140107159955200] *** LOG => SfCJavaVm: abort hook is called.
Solution:Add the following environment variables to include the unmanaged libraries and to load the am_ibm_16 library.
For Linux:setenv LD_LIBRARY_PATH /<CANDLE_HOME>/svdchome/7.3.0.12.03/toolkit/lib/lx8266:/<CANDLE_HOME>/svdchome/7.3.0.12.03/toolkit/lib/lx8266/ttapisetenv LIBPATH /<CANDLE_HOME>/svdchome/7.3.0.12.03/toolkit/lib/lx8266:/<CANDLE_HOME>/svdchome/7.3.0.12.03/toolkit/lib/lx8266/ttapi
For AIX:LD_LIBRARY_PATH=<CANDLE_HOME>/svdchome/7.3.0.12.03/toolkit/lib/aix536:<CANDLE_HOME>/ svdchome/7.3.0.12.03/toolkit/lib/aix536/ttapi:$LD_LIBRARY_PATHLIBPATH=<CANDLE_HOME>/svdchome/7.3.0.12.03/toolkit/lib/aix536: <CANDLE_HOME>/svdchome/7.3.0.12.03/toolkit/lib/aix536/ttapi:$LIBPATH

For Windows:PATH=<CANDLE_HOME>\svdchome\7.3.0.12.03\toolkit\lib\win64; <CANDLE_HOME>\svdchome\7.3.0.12.03\toolkit\lib\win64\ttapi;%PATH%
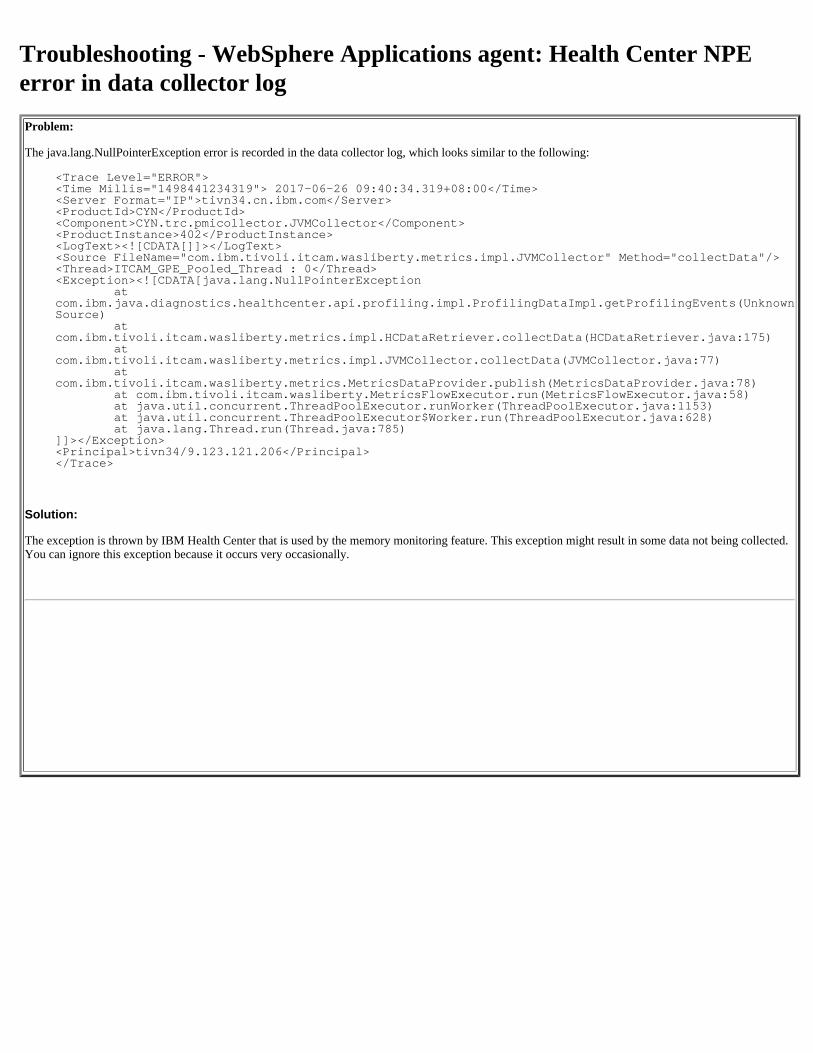
Troubleshooting - WebSphere Applications agent: Health Center NPEerror in data collector logProblem:
The java.lang.NullPointerException error is recorded in the data collector log, which looks similar to the following:
<Trace Level="ERROR"><Time Millis="1498441234319"> 2017-06-26 09:40:34.319+08:00</Time><Server Format="IP">tivn34.cn.ibm.com</Server><ProductId>CYN</ProductId><Component>CYN.trc.pmicollector.JVMCollector</Component><ProductInstance>402</ProductInstance><LogText><![CDATA[]]></LogText><Source FileName="com.ibm.tivoli.itcam.wasliberty.metrics.impl.JVMCollector" Method="collectData"/><Thread>ITCAM_GPE_Pooled_Thread : 0</Thread><Exception><![CDATA[java.lang.NullPointerException
atcom.ibm.java.diagnostics.healthcenter.api.profiling.impl.ProfilingDataImpl.getProfilingEvents(UnknownSource)
atcom.ibm.tivoli.itcam.wasliberty.metrics.impl.HCDataRetriever.collectData(HCDataRetriever.java:175)
atcom.ibm.tivoli.itcam.wasliberty.metrics.impl.JVMCollector.collectData(JVMCollector.java:77)
atcom.ibm.tivoli.itcam.wasliberty.metrics.MetricsDataProvider.publish(MetricsDataProvider.java:78)
at com.ibm.tivoli.itcam.wasliberty.MetricsFlowExecutor.run(MetricsFlowExecutor.java:58) at java.util.concurrent.ThreadPoolExecutor.runWorker(ThreadPoolExecutor.java:1153) at java.util.concurrent.ThreadPoolExecutor$Worker.run(ThreadPoolExecutor.java:628) at java.lang.Thread.run(Thread.java:785)
]]></Exception><Principal>tivn34/9.123.121.206</Principal></Trace>
Solution:
The exception is thrown by IBM Health Center that is used by the memory monitoring feature. This exception might result in some data not being collected.You can ignore this exception because it occurs very occasionally.
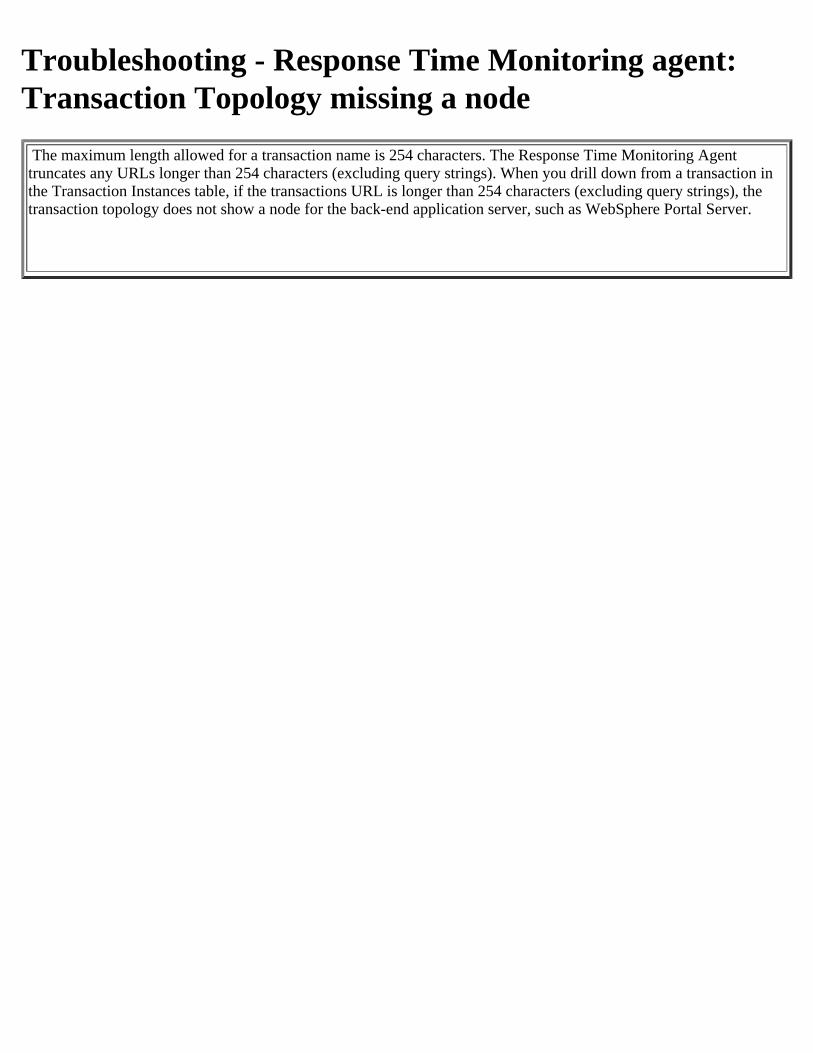
Troubleshooting - Response Time Monitoring agent:Transaction Topology missing a node The maximum length allowed for a transaction name is 254 characters. The Response Time Monitoring Agent truncates any URLs longer than 254 characters (excluding query strings). When you drill down from a transaction in the Transaction Instances table, if the transactions URL is longer than 254 characters (excluding query strings), the transaction topology does not show a node for the back-end application server, such as WebSphere Portal Server.
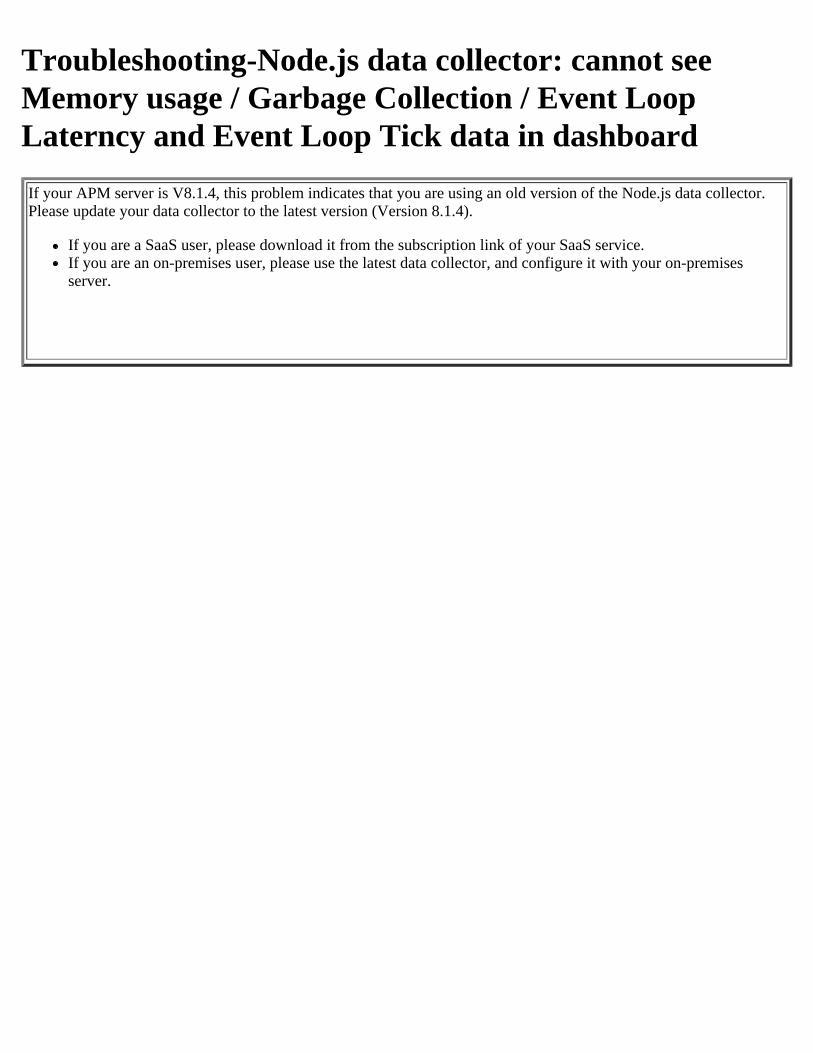
Troubleshooting-Node.js data collector: cannot seeMemory usage / Garbage Collection / Event LoopLaterncy and Event Loop Tick data in dashboardIf your APM server is V8.1.4, this problem indicates that you are using an old version of the Node.js data collector.Please update your data collector to the latest version (Version 8.1.4).
If you are a SaaS user, please download it from the subscription link of your SaaS service.If you are an on-premises user, please use the latest data collector, and configure it with your on-premisesserver.
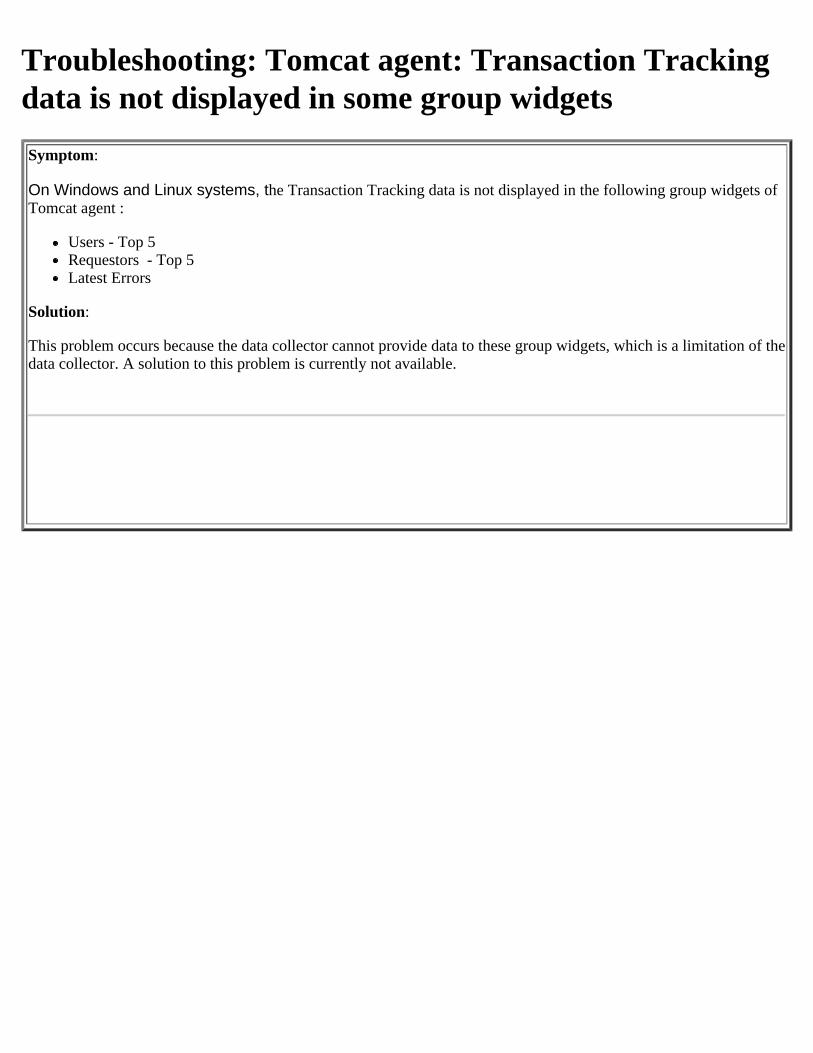
Troubleshooting: Tomcat agent: Transaction Trackingdata is not displayed in some group widgetsSymptom:
On Windows and Linux systems, the Transaction Tracking data is not displayed in the following group widgets ofTomcat agent :
Users - Top 5Requestors - Top 5Latest Errors
Solution:
This problem occurs because the data collector cannot provide data to these group widgets, which is a limitation of thedata collector. A solution to this problem is currently not available.
Troubleshooting - WebSphere MQ agent: KMQMI184Emessage appears during agent startupProblem:When the WebSphere MQ agent is started, the KMQMI184E message appears, indicating that an error occurs inopening some specific file. An example is as follows:
KMQMI184E Error in opening /qmgrs/QM_name/errors/AMQERR01.LOG file
Solution:
This problem happens mostly because the queue manager to be monitored has not yet been created at the point whenthe agent instance is created and started. The KMQMI184E message appears even though the queue manager iscreated afterwards.
To solve this problem, make sure that the queue manager to be monitored exists and then restart the WebSphere MQagent. If the problem persists, contact IBM Support.
Troubleshooting - Hybrid Gateway: Unable to connect to theTivoli Enterprise Portal ServerSymptom
After you configure the Hybrid Gateway a connection is not established with the Tivoli Enterprise Portal Server.
Cause
There is an error in the configuration or communication is blocked.
Solution:
To verify that the address, port, web communications protocol, user name and corresponding password of the Tivoli EnterprisePortal client are correctly configured, see these topics:
Configuring the Hybrid Gateway using the Cloud APM console (Cloud) topic:https://www.ibm.com/support/knowledgecenter/en/SSMKFH/com.ibm.apmaas.doc/install/integ_hybridgateway_config.htmConfiguring the Hybrid Gateway using the Cloud APM console (On Premises) topic:https://www.ibm.com/support/knowledgecenter/en/SSHLNR_8.1.3/com.ibm.pm.doc/install/integ_hybridgateway_config.htm
To verify that ports 15201 or 15200 are not blocked for http or https communication. I would suggest that you edit the ports from"15201" to "15200" or "15200 to 15201".For this one <If access to the portal server goes through a proxy server, verify that the address, port, and web protocol are correctlyconfigured.>, see step 6 of the topics in my first bullet point above. The following topics also explain how to configure the HybridGateway to use a forward proxy to communicate with the APM server:
Using a forward proxy to communicate with the Performance Management server (Cloud) topic:https://www.ibm.com/support/knowledgecenter/en/SSMKFH/com.ibm.apmaas.doc/install/integ_hg_forwardproxy.htmUsing a forward proxy to communicate with the Performance Management server (On Premises) topic:https://www.ibm.com/support/knowledgecenter/SSHLNR_8.1.3/com.ibm.pm.doc//install/integ_hg_forwardproxy.htm
Communication errors are usually found in the opt/ibm/wlp/usr/servers/hybridgateway/logs/console.log log

file and data related issues are usually found in the messages.log log file.
Troubleshooting: Microsoft .NET agent: No eventingthreshold is triggered for critical GC statusSymptom:
The Overview dashboard of the .NET agent shows the critical GC status. However, the Events tab does not show anyeventing threshold that is triggered because of critical GC status.
Cause:Currently, an eventing threshold is not available for this condition due to a UI limitation.
Solution:A solution is currently not available.
Troubleshooting - Hybrid Gateway: Tivoli Monitoringdomain managed systems are not visible in theApplication Performance DashboardSymptom
After you configure the IBM Performance Management Hybrid Gateway, the managed systems from your Tivoli Monitoring domainare not displayed in the Application Performance Dashboard.
Cause
The Tivoli Monitoring agents are not online, configured, or supported. The configured user does not have access to view themonitored applications.
Solution
Verify that the Tivoli Monitoring agents are included in the managed systems group and that the group is configured in theHybrid Gateway. For more information about the Hybrid Gateway, see Integrating with Tivoli Monitoring (SaaS) orIntegrating with Tivoli Monitoring (on premises).Verify that the Tivoli Monitoring agents are online. You can check the status of agents in the following ways:
View the Managed System Status workspace in the Tivoli Enterprise Portal. For more information about viewing theManaged System Status workspace, download the Tivoli Enterprise Portal Users Guide PDF and search on ManagedSystem Status.Use the Tivoli Monitoring tacmd viewAgent CLI command. For example, use the tacmd viewAgent -t LZ commandto list all Linux OS agents.
Verify that the Tivoli Monitoring agents are supported. For more information about supported agents, seeIntegrating with Tivoli Monitoring (SaaS) or Integrating with Tivoli Monitoring (on premises).Verify that the Tivoli Enterprise Portal Server user that is specified in the Hybrid Gateway configuration hasaccess to view all applications. For more information about the Hybrid Gateway, see "Integrating with TivoliMonitoring."Review the Hybrid Gateway log file at/opt/ibm/wlp/usr/servers/hybridgateway/logs/message.log.
I
Integrating with Tivoli Monitoring where is link for this?
Found this awesome video
https://developer.ibm.com/apm/videos/ibm-performance-management-8-1-3-integrating-tivoli-monitoring-hybrid-
gateway/
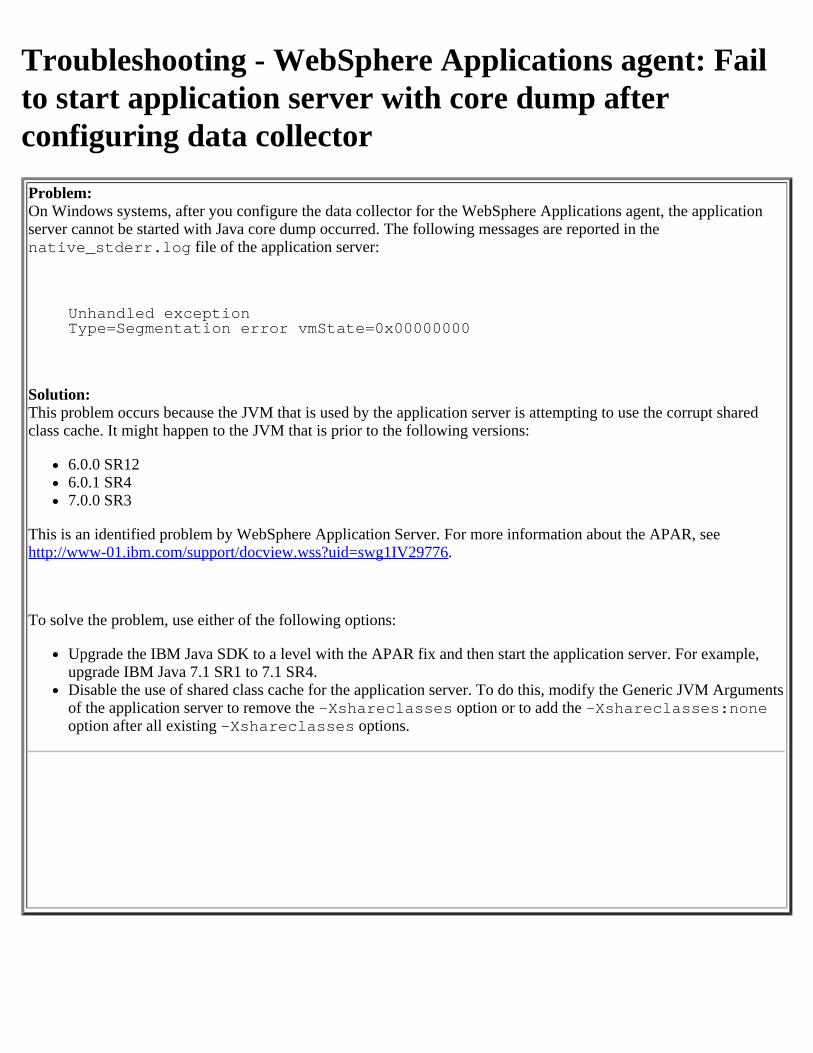
Troubleshooting - WebSphere Applications agent: Failto start application server with core dump afterconfiguring data collectorProblem:On Windows systems, after you configure the data collector for the WebSphere Applications agent, the applicationserver cannot be started with Java core dump occurred. The following messages are reported in thenative_stderr.log file of the application server:
Unhandled exceptionType=Segmentation error vmState=0x00000000
Solution:This problem occurs because the JVM that is used by the application server is attempting to use the corrupt sharedclass cache. It might happen to the JVM that is prior to the following versions:
6.0.0 SR126.0.1 SR47.0.0 SR3
This is an identified problem by WebSphere Application Server. For more information about the APAR, seehttp://www-01.ibm.com/support/docview.wss?uid=swg1IV29776.
To solve the problem, use either of the following options:
Upgrade the IBM Java SDK to a level with the APAR fix and then start the application server. For example,upgrade IBM Java 7.1 SR1 to 7.1 SR4.Disable the use of shared class cache for the application server. To do this, modify the Generic JVM Argumentsof the application server to remove the -Xshareclasses option or to add the -Xshareclasses:noneoption after all existing -Xshareclasses options.
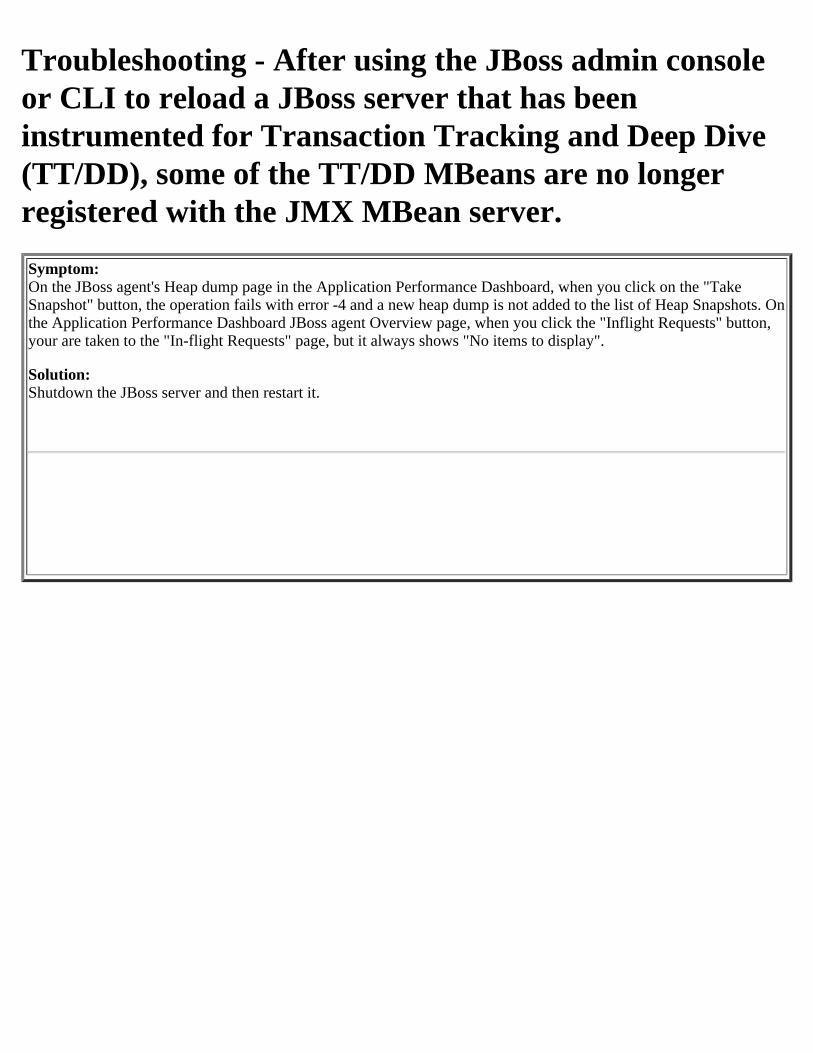
Troubleshooting - After using the JBoss admin consoleor CLI to reload a JBoss server that has beeninstrumented for Transaction Tracking and Deep Dive(TT/DD), some of the TT/DD MBeans are no longerregistered with the JMX MBean server.Symptom:On the JBoss agent's Heap dump page in the Application Performance Dashboard, when you click on the "TakeSnapshot" button, the operation fails with error -4 and a new heap dump is not added to the list of Heap Snapshots. Onthe Application Performance Dashboard JBoss agent Overview page, when you click the "Inflight Requests" button,your are taken to the "In-flight Requests" page, but it always shows "No items to display".
Solution:Shutdown the JBoss server and then restart it.
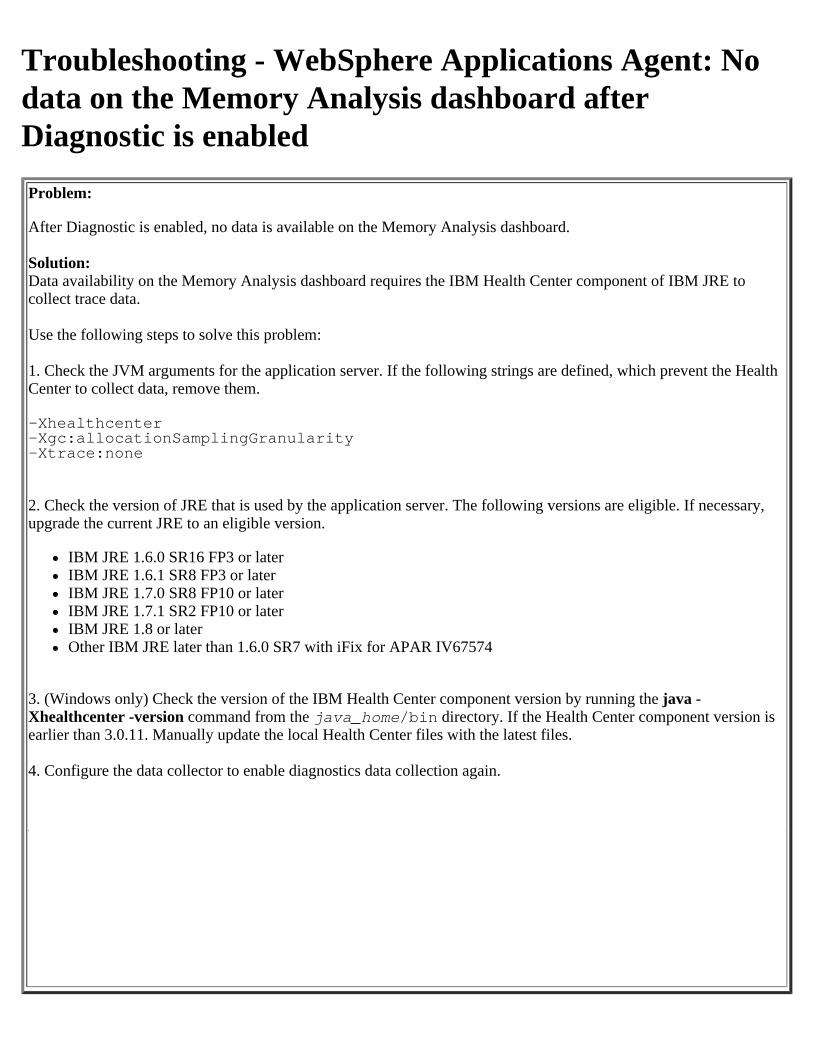
Troubleshooting - WebSphere Applications Agent: Nodata on the Memory Analysis dashboard afterDiagnostic is enabledProblem:
After Diagnostic is enabled, no data is available on the Memory Analysis dashboard.
Solution:Data availability on the Memory Analysis dashboard requires the IBM Health Center component of IBM JRE tocollect trace data.
Use the following steps to solve this problem:
1. Check the JVM arguments for the application server. If the following strings are defined, which prevent the HealthCenter to collect data, remove them.
-Xhealthcenter-Xgc:allocationSamplingGranularity-Xtrace:none
2. Check the version of JRE that is used by the application server. The following versions are eligible. If necessary,upgrade the current JRE to an eligible version.
IBM JRE 1.6.0 SR16 FP3 or laterIBM JRE 1.6.1 SR8 FP3 or laterIBM JRE 1.7.0 SR8 FP10 or laterIBM JRE 1.7.1 SR2 FP10 or laterIBM JRE 1.8 or laterOther IBM JRE later than 1.6.0 SR7 with iFix for APAR IV67574
3. (Windows only) Check the version of the IBM Health Center component version by running the java -Xhealthcenter -version command from the java_home/bin directory. If the Health Center component version isearlier than 3.0.11. Manually update the local Health Center files with the latest files.
4. Configure the data collector to enable diagnostics data collection again.
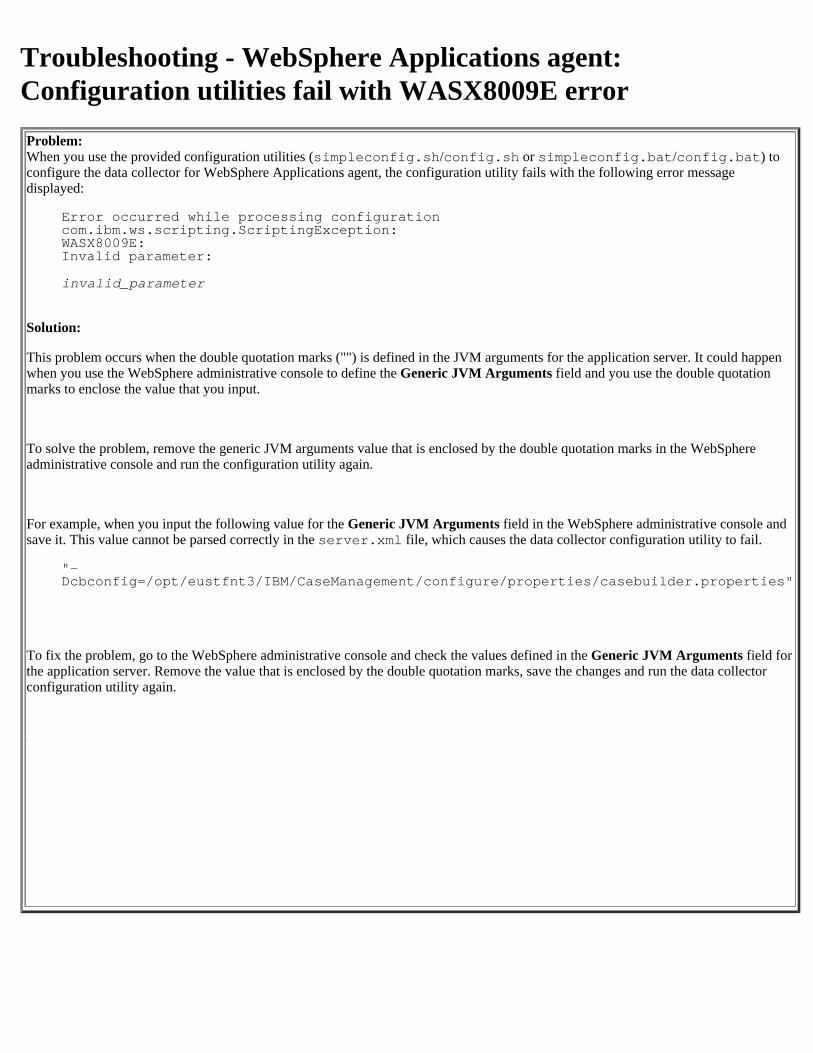
Troubleshooting - WebSphere Applications agent:Configuration utilities fail with WASX8009E errorProblem:When you use the provided configuration utilities (simpleconfig.sh/config.sh or simpleconfig.bat/config.bat) toconfigure the data collector for WebSphere Applications agent, the configuration utility fails with the following error messagedisplayed:
Error occurred while processing configurationcom.ibm.ws.scripting.ScriptingException:WASX8009E:Invalid parameter:
invalid_parameter
Solution:
This problem occurs when the double quotation marks ("") is defined in the JVM arguments for the application server. It could happenwhen you use the WebSphere administrative console to define the Generic JVM Arguments field and you use the double quotationmarks to enclose the value that you input.
To solve the problem, remove the generic JVM arguments value that is enclosed by the double quotation marks in the WebSphereadministrative console and run the configuration utility again.
For example, when you input the following value for the Generic JVM Arguments field in the WebSphere administrative console andsave it. This value cannot be parsed correctly in the server.xml file, which causes the data collector configuration utility to fail.
"-Dcbconfig=/opt/eustfnt3/IBM/CaseManagement/configure/properties/casebuilder.properties"
To fix the problem, go to the WebSphere administrative console and check the values defined in the Generic JVM Arguments field forthe application server. Remove the value that is enclosed by the double quotation marks, save the changes and run the data collectorconfiguration utility again.
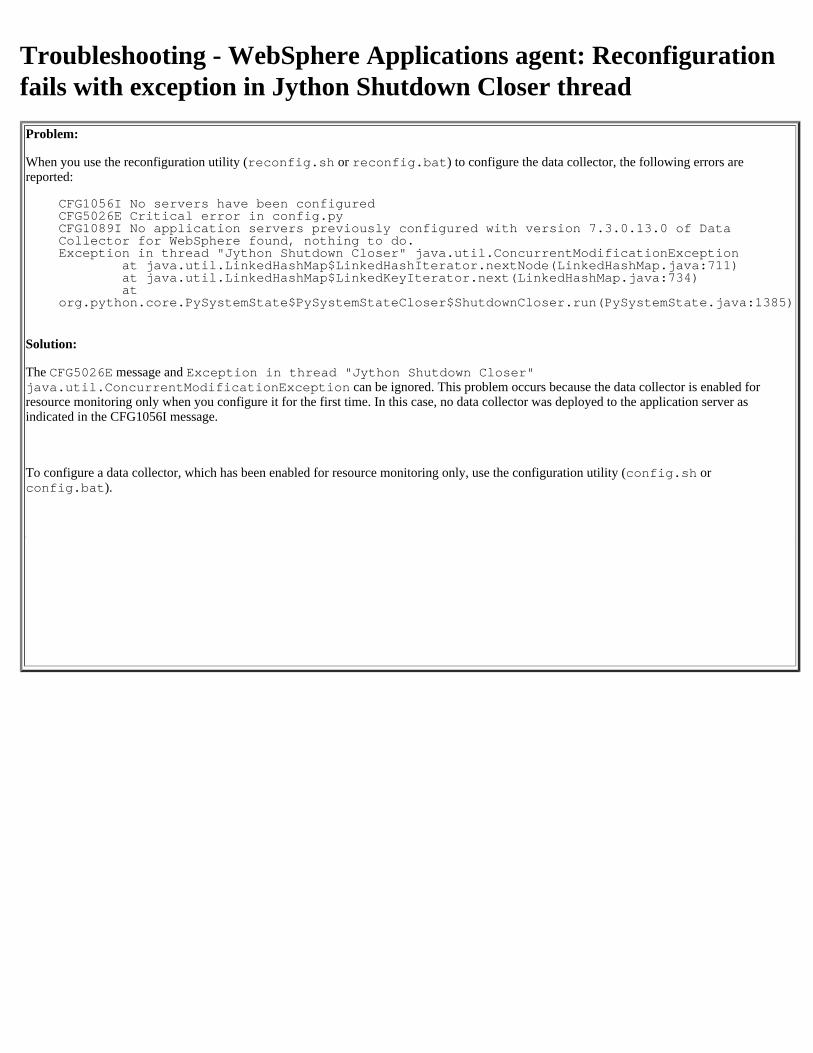
Troubleshooting - WebSphere Applications agent: Reconfigurationfails with exception in Jython Shutdown Closer threadProblem:
When you use the reconfiguration utility (reconfig.sh or reconfig.bat) to configure the data collector, the following errors arereported:
CFG1056I No servers have been configuredCFG5026E Critical error in config.pyCFG1089I No application servers previously configured with version 7.3.0.13.0 of DataCollector for WebSphere found, nothing to do.Exception in thread "Jython Shutdown Closer" java.util.ConcurrentModificationException
at java.util.LinkedHashMap$LinkedHashIterator.nextNode(LinkedHashMap.java:711) at java.util.LinkedHashMap$LinkedKeyIterator.next(LinkedHashMap.java:734) at
org.python.core.PySystemState$PySystemStateCloser$ShutdownCloser.run(PySystemState.java:1385)
Solution:
The CFG5026E message and Exception in thread "Jython Shutdown Closer"java.util.ConcurrentModificationException can be ignored. This problem occurs because the data collector is enabled forresource monitoring only when you configure it for the first time. In this case, no data collector was deployed to the application server asindicated in the CFG1056I message.
To configure a data collector, which has been enabled for resource monitoring only, use the configuration utility (config.sh orconfig.bat).
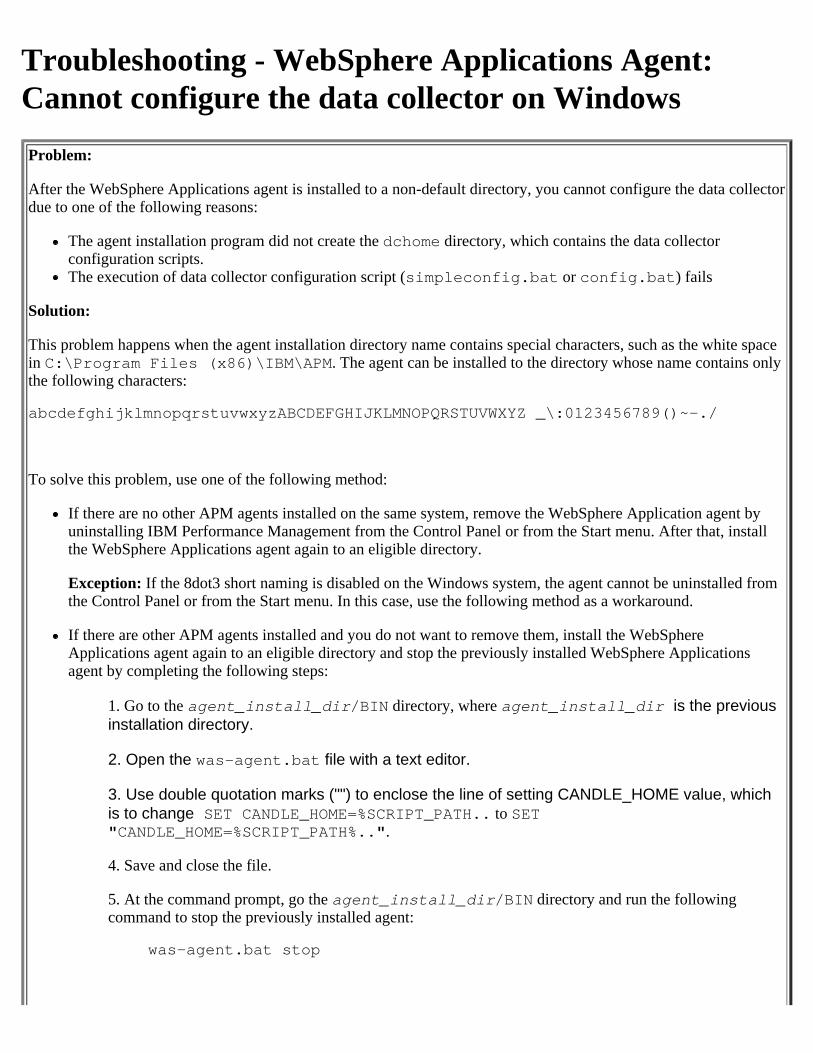
Troubleshooting - WebSphere Applications Agent:Cannot configure the data collector on WindowsProblem:
After the WebSphere Applications agent is installed to a non-default directory, you cannot configure the data collectordue to one of the following reasons:
The agent installation program did not create the dchome directory, which contains the data collectorconfiguration scripts.The execution of data collector configuration script (simpleconfig.bat or config.bat) fails
Solution:
This problem happens when the agent installation directory name contains special characters, such as the white spacein C:\Program Files (x86)\IBM\APM. The agent can be installed to the directory whose name contains onlythe following characters:
abcdefghijklmnopqrstuvwxyzABCDEFGHIJKLMNOPQRSTUVWXYZ _\:0123456789()~-./
To solve this problem, use one of the following method:
If there are no other APM agents installed on the same system, remove the WebSphere Application agent byuninstalling IBM Performance Management from the Control Panel or from the Start menu. After that, installthe WebSphere Applications agent again to an eligible directory.
Exception: If the 8dot3 short naming is disabled on the Windows system, the agent cannot be uninstalled fromthe Control Panel or from the Start menu. In this case, use the following method as a workaround.
If there are other APM agents installed and you do not want to remove them, install the WebSphereApplications agent again to an eligible directory and stop the previously installed WebSphere Applicationsagent by completing the following steps:
1. Go to the agent_install_dir/BIN directory, where agent_install_dir is the previousinstallation directory.
2. Open the was-agent.bat file with a text editor.
3. Use double quotation marks ("") to enclose the line of setting CANDLE_HOME value, whichis to change SET CANDLE_HOME=%SCRIPT_PATH.. to SET"CANDLE_HOME=%SCRIPT_PATH%..".
4. Save and close the file.
5. At the command prompt, go the agent_install_dir/BIN directory and run the followingcommand to stop the previously installed agent:
was-agent.bat stop
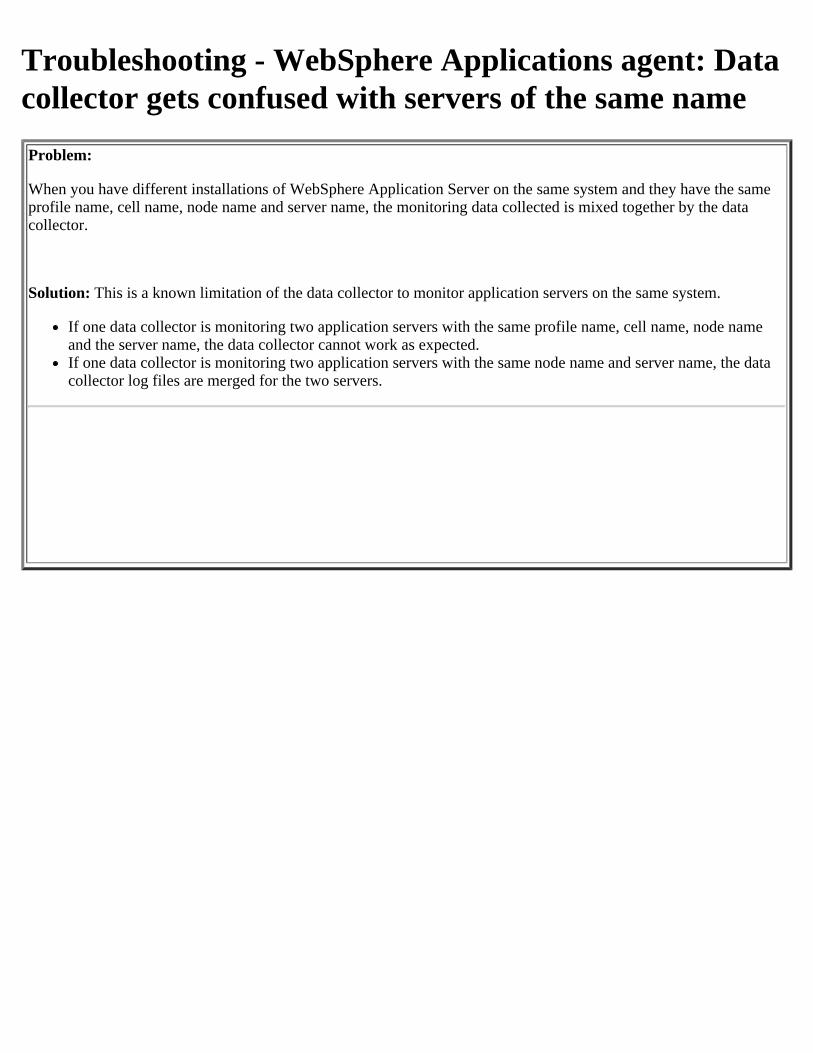
Troubleshooting - WebSphere Applications agent: Datacollector gets confused with servers of the same nameProblem:
When you have different installations of WebSphere Application Server on the same system and they have the sameprofile name, cell name, node name and server name, the monitoring data collected is mixed together by the datacollector.
Solution: This is a known limitation of the data collector to monitor application servers on the same system.
If one data collector is monitoring two application servers with the same profile name, cell name, node nameand the server name, the data collector cannot work as expected.If one data collector is monitoring two application servers with the same node name and server name, the datacollector log files are merged for the two servers.
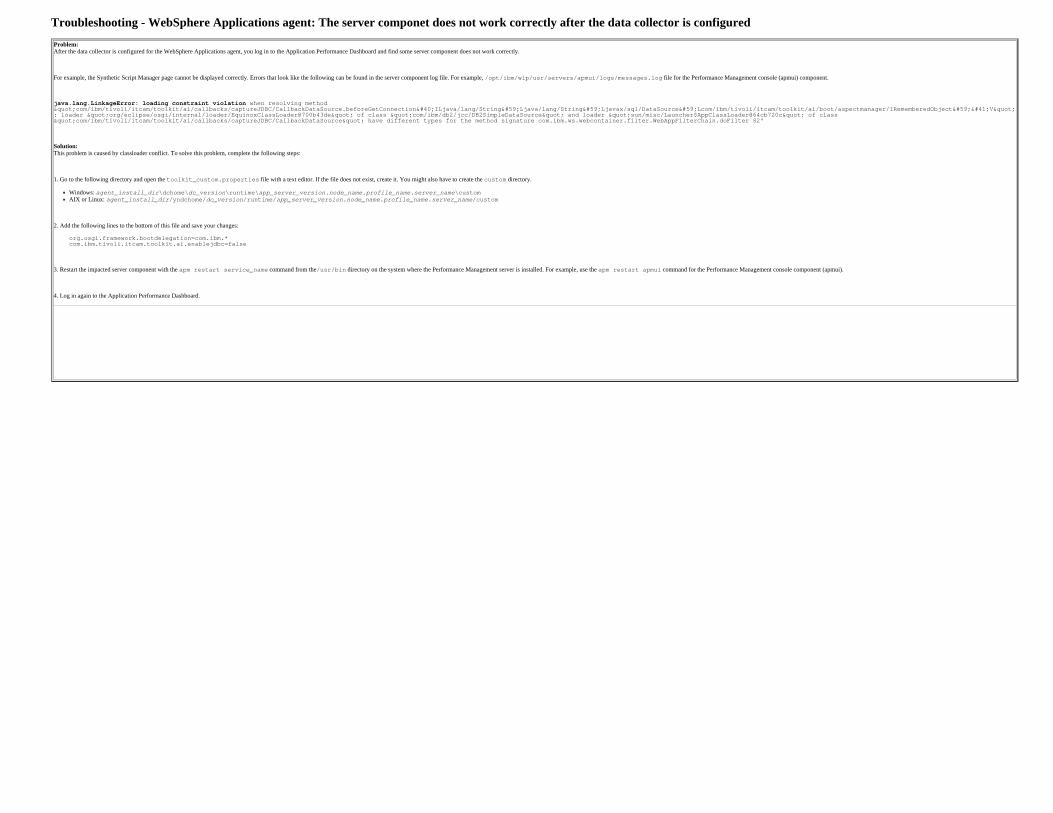
Troubleshooting - WebSphere Applications agent: The server componet does not work correctly after the data collector is configuredProblem:After the data collector is configured for the WebSphere Applications agent, you log in to the Application Performance Dashboard and find some server component does not work correctly.
For example, the Synthetic Script Manager page cannot be displayed correctly. Errors that look like the following can be found in the server component log file. For example, /opt/ibm/wlp/usr/servers/apmui/logs/messages.log file for the Performance Management console (apmui) component.
java.lang.LinkageError: loading constraint violation when resolving method"com/ibm/tivoli/itcam/toolkit/ai/callbacks/captureJDBC/CallbackDataSource.beforeGetConnection(ILjava/lang/String;Ljava/lang/String;Ljavax/sql/DataSource;Lcom/ibm/tivoli/itcam/toolkit/ai/boot/aspectmanager/IRememberedObject;)V": loader "org/eclipse/osgi/internal/loader/EquinoxClassLoader@700b43de" of class "com/ibm/db2/jcc/DB2SimpleDataSource" and loader "sun/misc/Launcher$AppClassLoader@64cb720c" of class"com/ibm/tivoli/itcam/toolkit/ai/callbacks/captureJDBC/CallbackDataSource" have different types for the method signature com.ibm.ws.webcontainer.filter.WebAppFilterChain.doFilter 82"
Solution:This problem is caused by classloader conflict. To solve this problem, complete the following steps:
1. Go to the following directory and open the toolkit_custom.properties file with a text editor. If the file does not exist, create it. You might also have to create the custom directory.
Windows: agent_install_dir\dchome\dc_version\runtime\app_server_version.node_name.profile_name.server_name\customAIX or Linux: agent_install_dir/yndchome/dc_version/runtime/app_server_version.node_name.profile_name.server_name/custom
2. Add the following lines to the bottom of this file and save your changes:
org.osgi.framework.bootdelegation=com.ibm.*com.ibm.tivoli.itcam.toolkit.ai.enablejdbc=false
3. Restart the impacted server component with the apm restart service_name command from the/usr/bin directory on the system where the Performance Management server is installed. For example, use the apm restart apmui command for the Performance Management console component (apmui).
4. Log in again to the Application Performance Dashboard.
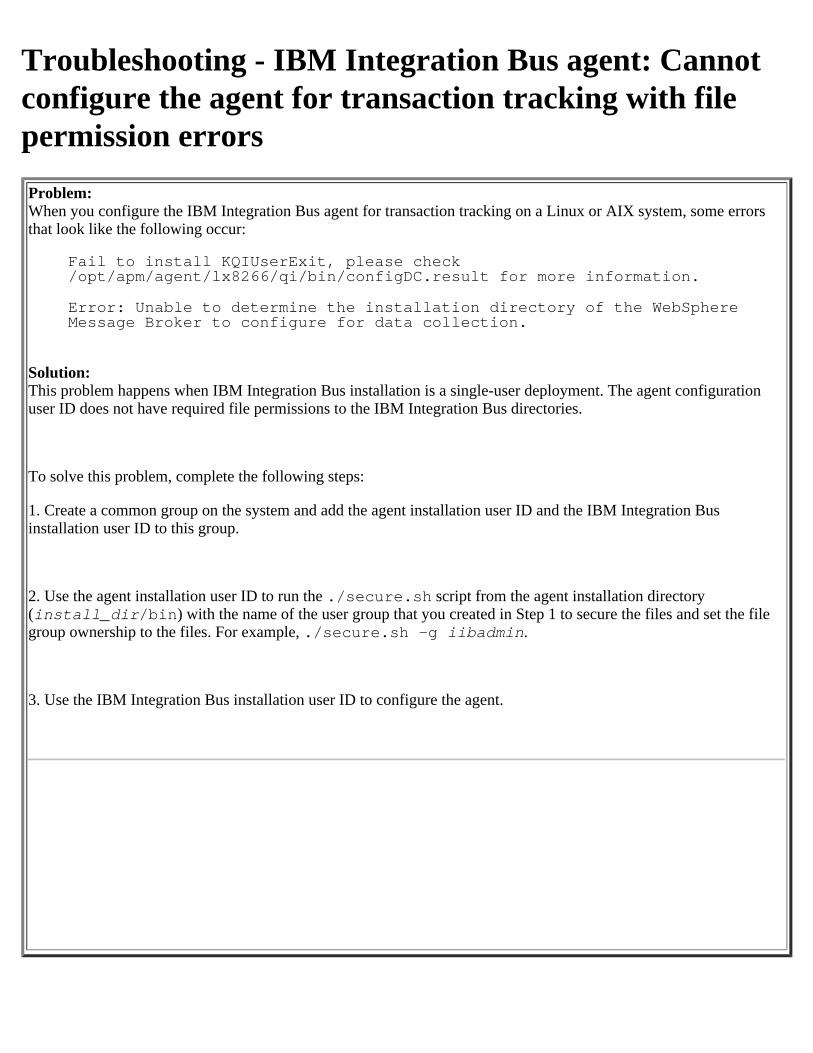
Troubleshooting - IBM Integration Bus agent: Cannotconfigure the agent for transaction tracking with filepermission errorsProblem:When you configure the IBM Integration Bus agent for transaction tracking on a Linux or AIX system, some errorsthat look like the following occur:
Fail to install KQIUserExit, please check/opt/apm/agent/lx8266/qi/bin/configDC.result for more information.
Error: Unable to determine the installation directory of the WebSphereMessage Broker to configure for data collection.
Solution:This problem happens when IBM Integration Bus installation is a single-user deployment. The agent configurationuser ID does not have required file permissions to the IBM Integration Bus directories.
To solve this problem, complete the following steps:
1. Create a common group on the system and add the agent installation user ID and the IBM Integration Businstallation user ID to this group.
2. Use the agent installation user ID to run the ./secure.sh script from the agent installation directory(install_dir/bin) with the name of the user group that you created in Step 1 to secure the files and set the filegroup ownership to the files. For example, ./secure.sh -g iibadmin.
3. Use the IBM Integration Bus installation user ID to configure the agent.
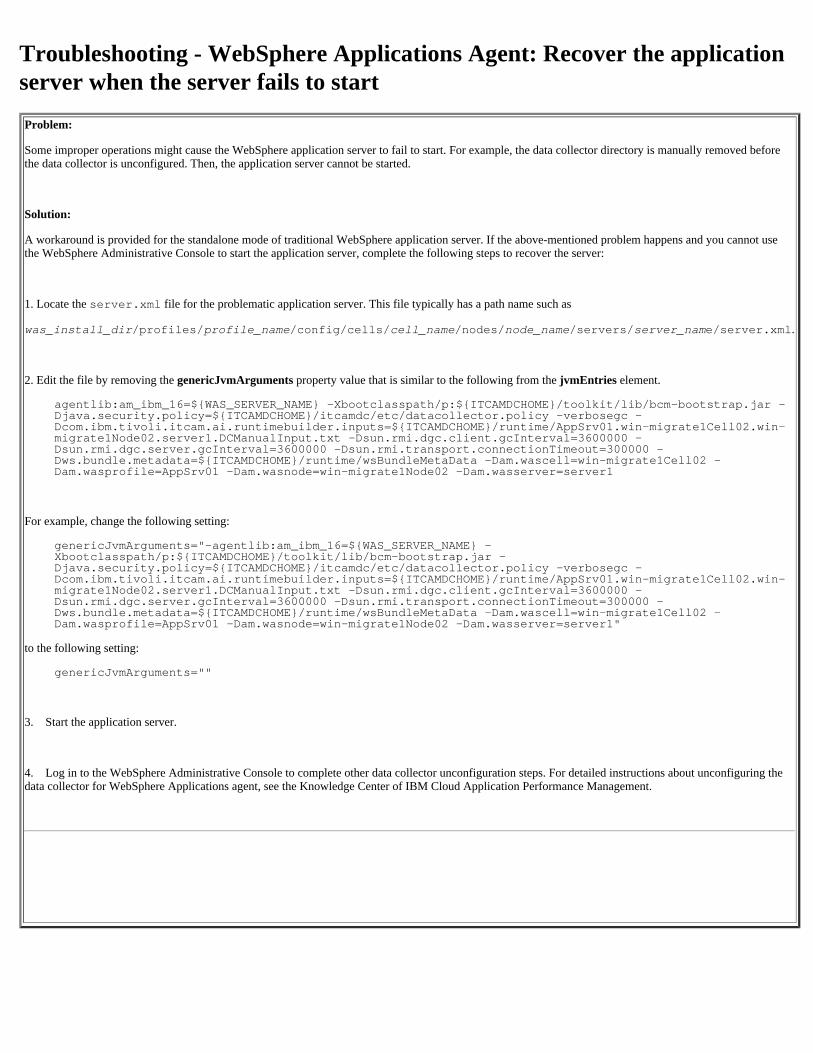
Troubleshooting - WebSphere Applications Agent: Recover the applicationserver when the server fails to startProblem:
Some improper operations might cause the WebSphere application server to fail to start. For example, the data collector directory is manually removed beforethe data collector is unconfigured. Then, the application server cannot be started.
Solution:
A workaround is provided for the standalone mode of traditional WebSphere application server. If the above-mentioned problem happens and you cannot usethe WebSphere Administrative Console to start the application server, complete the following steps to recover the server:
1. Locate the server.xml file for the problematic application server. This file typically has a path name such as
was_install_dir/profiles/profile_name/config/cells/cell_name/nodes/node_name/servers/server_name/server.xml.
2. Edit the file by removing the genericJvmArguments property value that is similar to the following from the jvmEntries element.
agentlib:am_ibm_16=${WAS_SERVER_NAME} -Xbootclasspath/p:${ITCAMDCHOME}/toolkit/lib/bcm-bootstrap.jar -Djava.security.policy=${ITCAMDCHOME}/itcamdc/etc/datacollector.policy -verbosegc -Dcom.ibm.tivoli.itcam.ai.runtimebuilder.inputs=${ITCAMDCHOME}/runtime/AppSrv01.win-migrate1Cell02.win-migrate1Node02.server1.DCManualInput.txt -Dsun.rmi.dgc.client.gcInterval=3600000 -Dsun.rmi.dgc.server.gcInterval=3600000 -Dsun.rmi.transport.connectionTimeout=300000 -Dws.bundle.metadata=${ITCAMDCHOME}/runtime/wsBundleMetaData -Dam.wascell=win-migrate1Cell02 -Dam.wasprofile=AppSrv01 -Dam.wasnode=win-migrate1Node02 -Dam.wasserver=server1
For example, change the following setting:
genericJvmArguments="-agentlib:am_ibm_16=${WAS_SERVER_NAME} -Xbootclasspath/p:${ITCAMDCHOME}/toolkit/lib/bcm-bootstrap.jar -Djava.security.policy=${ITCAMDCHOME}/itcamdc/etc/datacollector.policy -verbosegc -Dcom.ibm.tivoli.itcam.ai.runtimebuilder.inputs=${ITCAMDCHOME}/runtime/AppSrv01.win-migrate1Cell02.win-migrate1Node02.server1.DCManualInput.txt -Dsun.rmi.dgc.client.gcInterval=3600000 -Dsun.rmi.dgc.server.gcInterval=3600000 -Dsun.rmi.transport.connectionTimeout=300000 -Dws.bundle.metadata=${ITCAMDCHOME}/runtime/wsBundleMetaData -Dam.wascell=win-migrate1Cell02 -Dam.wasprofile=AppSrv01 -Dam.wasnode=win-migrate1Node02 -Dam.wasserver=server1"
to the following setting:
genericJvmArguments=""
3. Start the application server.
4. Log in to the WebSphere Administrative Console to complete other data collector unconfiguration steps. For detailed instructions about unconfiguring thedata collector for WebSphere Applications agent, see the Knowledge Center of IBM Cloud Application Performance Management.
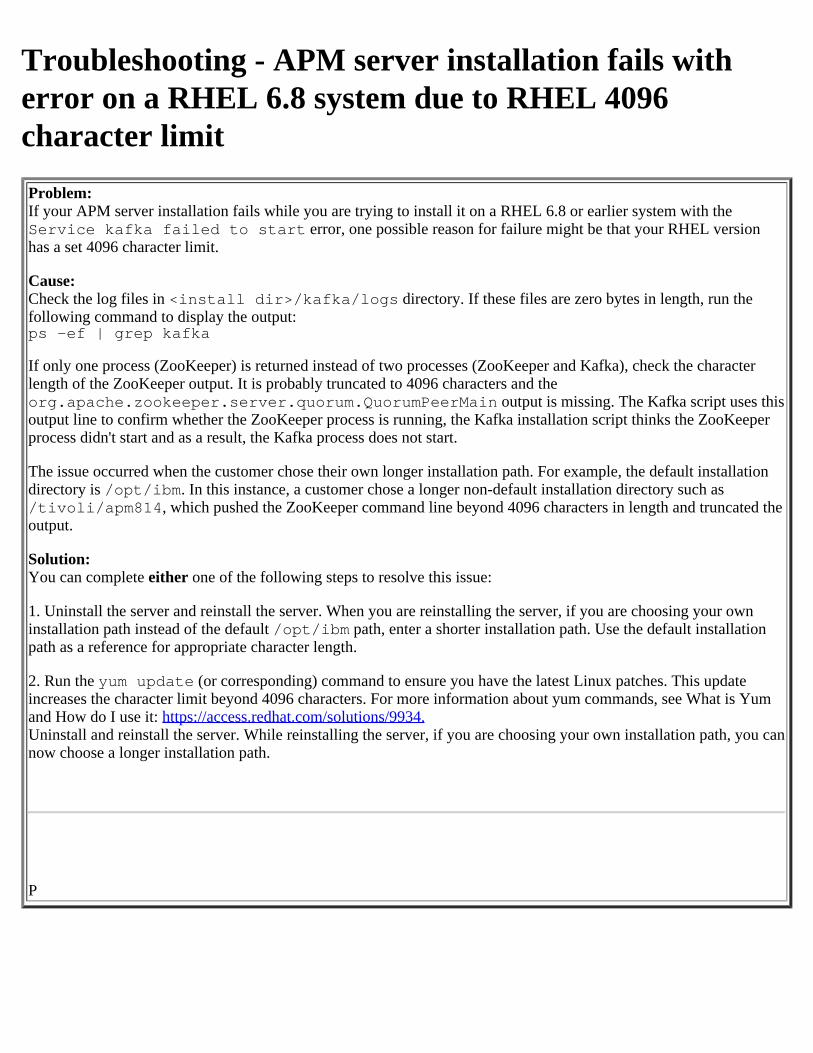
Troubleshooting - APM server installation fails witherror on a RHEL 6.8 system due to RHEL 4096character limitProblem:If your APM server installation fails while you are trying to install it on a RHEL 6.8 or earlier system with theService kafka failed to start error, one possible reason for failure might be that your RHEL versionhas a set 4096 character limit.
Cause:Check the log files in <install dir>/kafka/logs directory. If these files are zero bytes in length, run thefollowing command to display the output:ps -ef | grep kafka
If only one process (ZooKeeper) is returned instead of two processes (ZooKeeper and Kafka), check the characterlength of the ZooKeeper output. It is probably truncated to 4096 characters and theorg.apache.zookeeper.server.quorum.QuorumPeerMain output is missing. The Kafka script uses thisoutput line to confirm whether the ZooKeeper process is running, the Kafka installation script thinks the ZooKeeperprocess didn't start and as a result, the Kafka process does not start.
The issue occurred when the customer chose their own longer installation path. For example, the default installationdirectory is /opt/ibm. In this instance, a customer chose a longer non-default installation directory such as/tivoli/apm814, which pushed the ZooKeeper command line beyond 4096 characters in length and truncated theoutput.
Solution:You can complete either one of the following steps to resolve this issue:
1. Uninstall the server and reinstall the server. When you are reinstalling the server, if you are choosing your owninstallation path instead of the default /opt/ibm path, enter a shorter installation path. Use the default installationpath as a reference for appropriate character length.
2. Run the yum update (or corresponding) command to ensure you have the latest Linux patches. This updateincreases the character limit beyond 4096 characters. For more information about yum commands, see What is Yumand How do I use it: https://access.redhat.com/solutions/9934.Uninstall and reinstall the server. While reinstalling the server, if you are choosing your own installation path, you cannow choose a longer installation path.
P
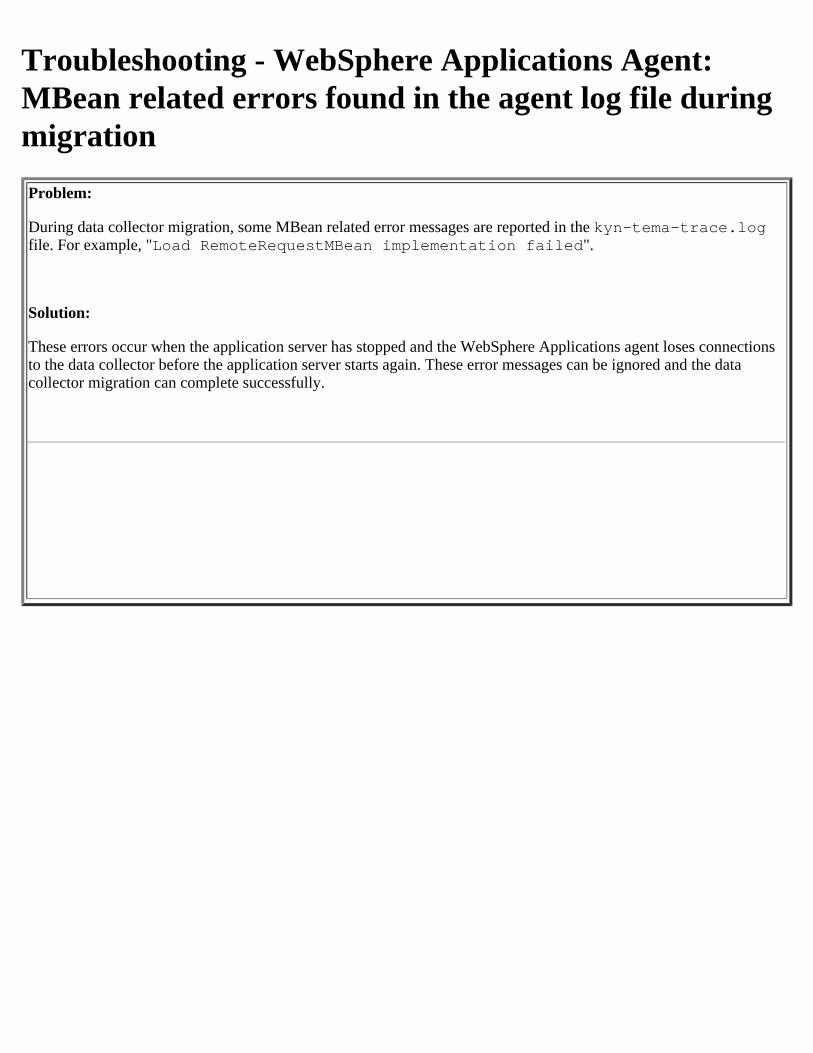
Troubleshooting - WebSphere Applications Agent:MBean related errors found in the agent log file duringmigrationProblem:
During data collector migration, some MBean related error messages are reported in the kyn-tema-trace.logfile. For example, "Load RemoteRequestMBean implementation failed".
Solution:
These errors occur when the application server has stopped and the WebSphere Applications agent loses connectionsto the data collector before the application server starts again. These error messages can be ignored and the datacollector migration can complete successfully.
Troubleshooting - WebSphere Applications Agent:Cannot uninstall the agent after the data collector isunconfiguredProblem:
Agent uninstallation process cannot complete and you are prompted to unconfigure the data collector before theuninstallation program can proceed. However, the data collector has already been unconfigured.
Solution:
This problem might be caused by the some files that are backed up in the following data collector runtimedirectory. Go to the data collector home directory and remove the entire runtime directory. Then try uninstalling theagent again.
Linux/AIX: install_dir\dchome\dc_version\runtimeWindows: install_dir/yndchome/dc_version/runtime
where, install_dir is the WebSphere Applications agent installation directory; dc_version is the versionnumber of the data collector. For example, /opt/ibm/apm/agent/dchome/7.3.0.11.0/runtime.
Troubleshooting - Non-ASCII characters do not displayin the Performance Management consoleProblem: This question has not been answered yet.Problem:
Non-ASCII characters do not display in the Performance Management console.
Solution:
If globalized data is sent by the agent to the Performance Management server, ensure that the local computer systemwhere the agent is installed supports UTF-8 encoding.
Troubleshooting - Agent Builder - in script agent, thescript does not runProblem: When you generate an agent with the script data provider and omit the .bat or .cmd extension in the script data source command, the script does not run.
Cause: The full name of the script is required.
Solution: Do not omit the extension of the script, for example, .bat or .cmd.
Troubleshooting - Agent Builder - no help is displayedProblem: No help is displayed when you click help links within Agent Builder
On an AIX system, you might see the following messages:
The context help for this user interface element could not be found. Open in dynamic help.
Clicking the Open in dynamic help link does not do anything.
Cause: On some AIX and Linux systems, Eclipse is unable to determine the default system browser.
Solution: Set the default browser in Agent Builder. For instructions,see http://www.ibm.com/support/knowledgecenter/SSMKFH/com.ibm.apmaas.doc/builder/ab_browser_default.htm

Troubleshooting - Agent Builder fails to start, or startsbut fails to display UI, or fails to test an agent, orterminates abnormallyProblem: Agent Builder fails to start, or starts but does not display its user interface, or fails to start testing for agent,or terminates abnormally.
Solution: In the user home directory, delete the following files:
p2
.agentbuilder_config
Important: On Windows systems the user home directory is in the HOMEPATH environment variable. On Linux systems the user home directory is in the HOME environment variable.
If this action does not resolve the issue, as a last resort, uninstall Agent Builder and reinstall it ina new directory.
Troubleshooting - PM console page in IE browser can'tbe displayedProblem:
On Internet Explorer, you receive "This page can't be displayed" error instead of the PerformanceManagement login screen, when you attempt to connect to the Performance Management server.
Cause:
Transport Layer Security version 1.2 is required on IBM Performance Management v8.1.2 (and later) andIBM Performance Management on Cloud. TLS 1.2 is not enabled by default on Internet Explorer 8, 9, and10, and must be enabled manually.
Solution:
Enable TLS 1.2 on Internet Explorer 8, 9, or 10:
1. In your Internet Explorer browser, select Settings > Internet Options2. In the Advanced tab, scroll to the Security options and select the Use TLS 1.2 check box.3. Restart your browser for the changes to take effect.
If enabling TLS 1.2 has no effect, try these diagnostics: Log in to the server from another browser type. Ifyou are not successful, check that the services are running with the apm status command, and restart ifnecessary. For more information, see Starting, stopping, and checking the status of server components.
Even after verifying the TLS 1.2 is enabled, still getting the same problem. I run APM 8.1.3
Have you tried logging in with a different browser? If so, which type(s) and version?

You do not mention the version of IE you are trying to use, please provide that information. The minimum level of browser supported in 813 is version 10. Are you able to try another browser? If no browser's work, login to the server and check the status of all the services using the "apmui status" command.
Troubleshooting - WebSphere Applications Agent:Configuration fails with CFG5026E errorProblem:
When you configure the data collector of WebSphere Applications agent with the configuration script(simpleconfig.sh/simpleconfig.bat or config.sh/config.bat), the configuration fails and theCFG5026E message similar to the following is displayed:
CFG5026E Critical error in simpleconfig.pyConfiguration of Data collector failed. Please check logs for details.
You might also find the CHKW3706E error in the config-trace.log file, which is similar to the following one:
CHKW3706E: Failed to validate contents of file cells/RHEL71-2Cell01/nodes/RHEL71-2Node01/servers/server1/resources.xml, Exceptionjava.lang.ClassCastException
Solution:
This problem occurs due to a defect of WebSphere Application Server V9.0. This defect has been fixed in WebSphereApplication Server 9.0 Fix Pack 1 and later releases. The CFG5026E or CHKW3706E error message can be ignoredwhen you are configuring the data collector for WebSphere Applications agent. The configuration can succeed eventhough these error messages appear.
Troubleshooting - WebSphere Application Agent:GDCRequestListenerInvocationHandler exception in thetrace-dc-bcm.logProblem:
When the application server is stopped, a lot of error messages similar to the following are found in the trace-dc-bcm.log.
<Trace Level="ERROR"><Time Millis="1476774023989"> 2016-10-18 15:00:23.989+08:00</Time><Server Format="IP">SuSE11-02.cn.ibm.com</Server><ProductId>CYN</ProductId><Component>CYN.trc.toolkit.gdc.GDCRequestListenerInvocationHandler</Component><ProductInstance>28610</ProductInstance><LogText><![CDATA[The popped request type id does not match the pushed one.The popped request type id is -1, while the pushed request type id is 2]]></LogText><SourceFileName="com.ibm.tivoli.itcam.gdc.GDCRequestListenerInvocationHandler"Method="handleRequestEnd()"/><Thread>WebContainer : 4</Thread><Principal>SuSE11-02/9.115.33.146</Principal></Trace>
Cause:
These messages appear because after the application server is stopped, the data collector starts to clear the thread contextand the GDC cannot get the request type after the thread context is removed.
Solution:
These error messages can be ignored in the case of application server shutdown.
Troubleshooting - Active Directory agent: LDAPSuccessful Bind attribute appears with value 0 on thedashboardSymptom:LDAP Successful Bind attribute appears with value 0 on the dashboard though this attribute is absent in Perfmon onWindows 2003 system while it appears as Undefined on Windows 2008 system.
Solution:This issue is a known issue and we do not have a solution.
Troubleshooting - Active Directory agent: Dashboarddoes not display the updated list of instancesSymptom:When you add or remove instances from the following Perfmon objects, the dashboard does not display the updatedlist of instances:
DFS Replication ConnectionsDFS Replication FoldersDFS Service Volumes
Solution:Recycle the Microsoft Active Directory agent after you add or remove an instance from the following Perfmonobjects:
DFS Replication ConnectionsDFS Replication FoldersDFS Service Volumes
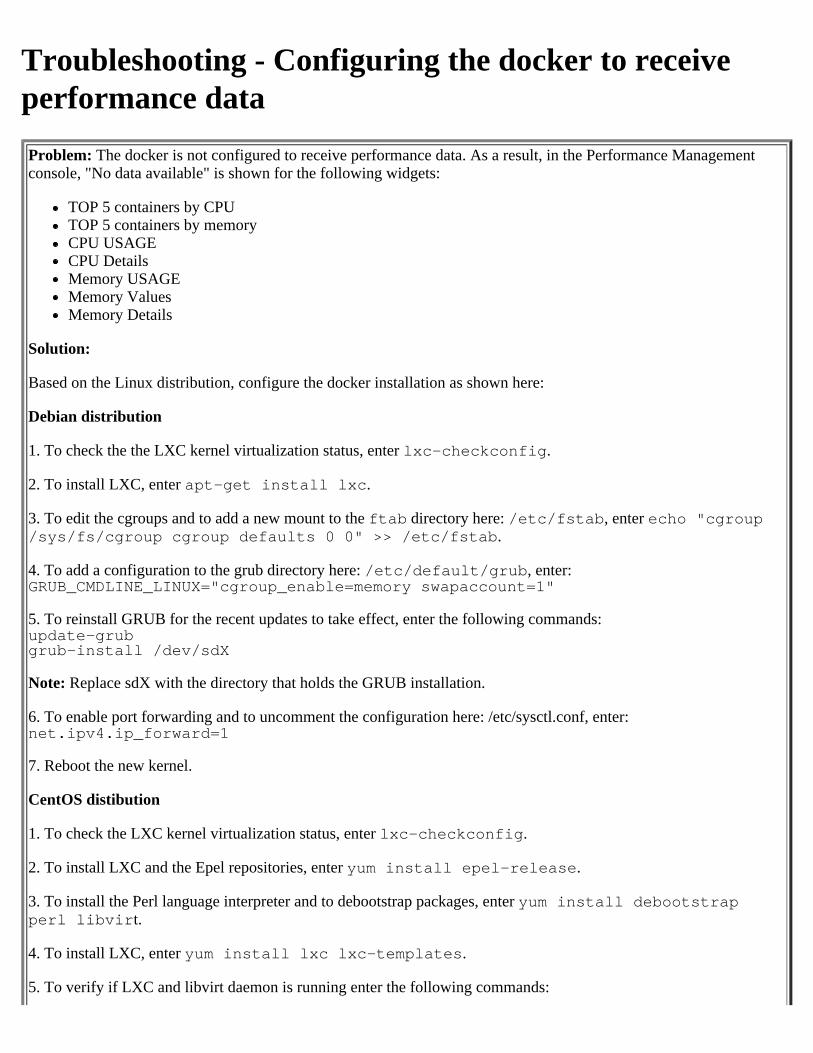
Troubleshooting - Configuring the docker to receiveperformance dataProblem: The docker is not configured to receive performance data. As a result, in the Performance Managementconsole, "No data available" is shown for the following widgets:
TOP 5 containers by CPUTOP 5 containers by memoryCPU USAGECPU DetailsMemory USAGEMemory ValuesMemory Details
Solution:
Based on the Linux distribution, configure the docker installation as shown here:
Debian distribution
1. To check the the LXC kernel virtualization status, enter lxc-checkconfig.
2. To install LXC, enter apt-get install lxc.
3. To edit the cgroups and to add a new mount to the ftab directory here: /etc/fstab, enter echo "cgroup/sys/fs/cgroup cgroup defaults 0 0" >> /etc/fstab.
4. To add a configuration to the grub directory here: /etc/default/grub, enter:GRUB_CMDLINE_LINUX="cgroup_enable=memory swapaccount=1"
5. To reinstall GRUB for the recent updates to take effect, enter the following commands:update-grubgrub-install /dev/sdX
Note: Replace sdX with the directory that holds the GRUB installation.
6. To enable port forwarding and to uncomment the configuration here: /etc/sysctl.conf, enter:net.ipv4.ip_forward=1
7. Reboot the new kernel.
CentOS distibution
1. To check the LXC kernel virtualization status, enter lxc-checkconfig.
2. To install LXC and the Epel repositories, enter yum install epel-release.
3. To install the Perl language interpreter and to debootstrap packages, enter yum install debootstrapperl libvirt.
4. To install LXC, enter yum install lxc lxc-templates.
5. To verify if LXC and libvirt daemon is running enter the following commands:

systemctl status lxc.service systemctl start lxc.service systemctl start libvirtd systemctl status lxc.service
6. To check the LXC kernel virtualization status, enter lxc-checkconfig.
7. To install the packages required for cgroups to function enter yum install libcgroup.
8. To start the cgconfig service, enter service cgconfig start.
9. Reboot the new kernel.

Troubleshooting - OS agent and containersKnown Issue:
In the Stopped Containers in Last 24 hours widget, the containers that exited recently are shown as being stopped in the last 24 hours. In error, the widget is also showing containers in a created state without any starting or stopping times.
This issue is a known issue and we do not have a solution.
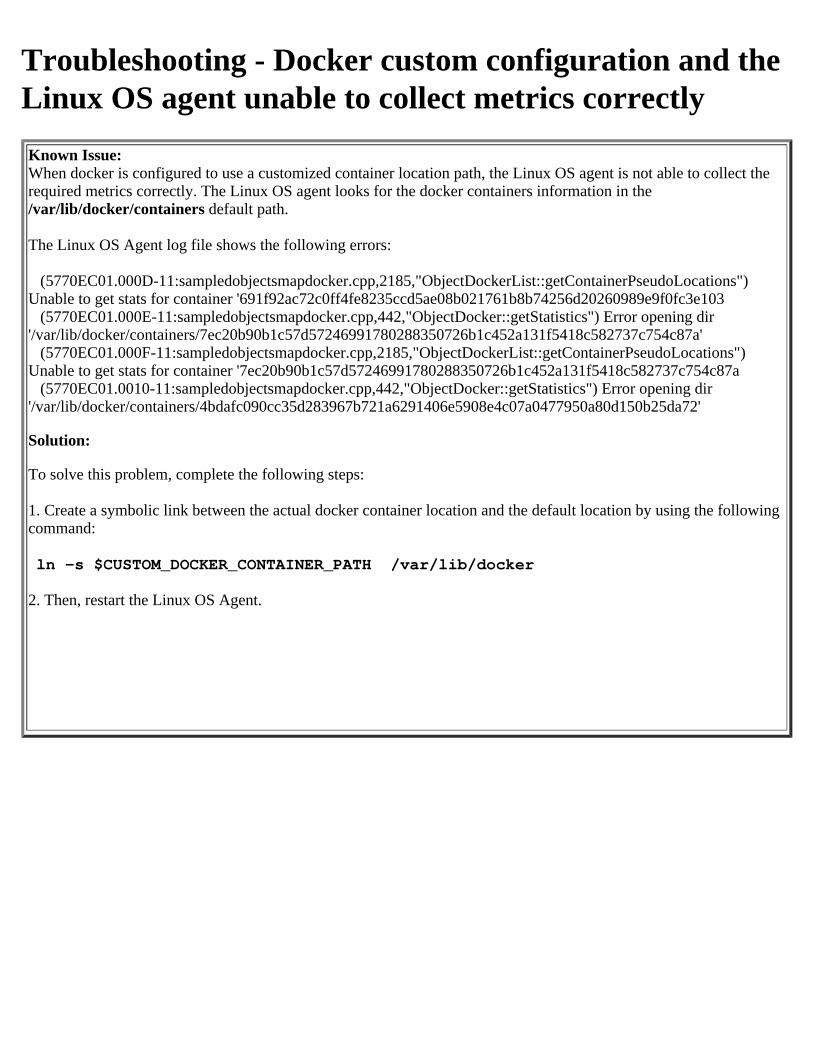
Troubleshooting - Docker custom configuration and theLinux OS agent unable to collect metrics correctlyKnown Issue:When docker is configured to use a customized container location path, the Linux OS agent is not able to collect therequired metrics correctly. The Linux OS agent looks for the docker containers information in the/var/lib/docker/containers default path.
The Linux OS Agent log file shows the following errors:
(5770EC01.000D-11:sampledobjectsmapdocker.cpp,2185,"ObjectDockerList::getContainerPseudoLocations")Unable to get stats for container '691f92ac72c0ff4fe8235ccd5ae08b021761b8b74256d20260989e9f0fc3e103 (5770EC01.000E-11:sampledobjectsmapdocker.cpp,442,"ObjectDocker::getStatistics") Error opening dir'/var/lib/docker/containers/7ec20b90b1c57d57246991780288350726b1c452a131f5418c582737c754c87a' (5770EC01.000F-11:sampledobjectsmapdocker.cpp,2185,"ObjectDockerList::getContainerPseudoLocations")Unable to get stats for container '7ec20b90b1c57d57246991780288350726b1c452a131f5418c582737c754c87a (5770EC01.0010-11:sampledobjectsmapdocker.cpp,442,"ObjectDocker::getStatistics") Error opening dir'/var/lib/docker/containers/4bdafc090cc35d283967b721a6291406e5908e4c07a0477950a80d150b25da72'
Solution:
To solve this problem, complete the following steps:
1. Create a symbolic link between the actual docker container location and the default location by using the followingcommand:
ln -s $CUSTOM_DOCKER_CONTAINER_PATH /var/lib/docker
2. Then, restart the Linux OS Agent.
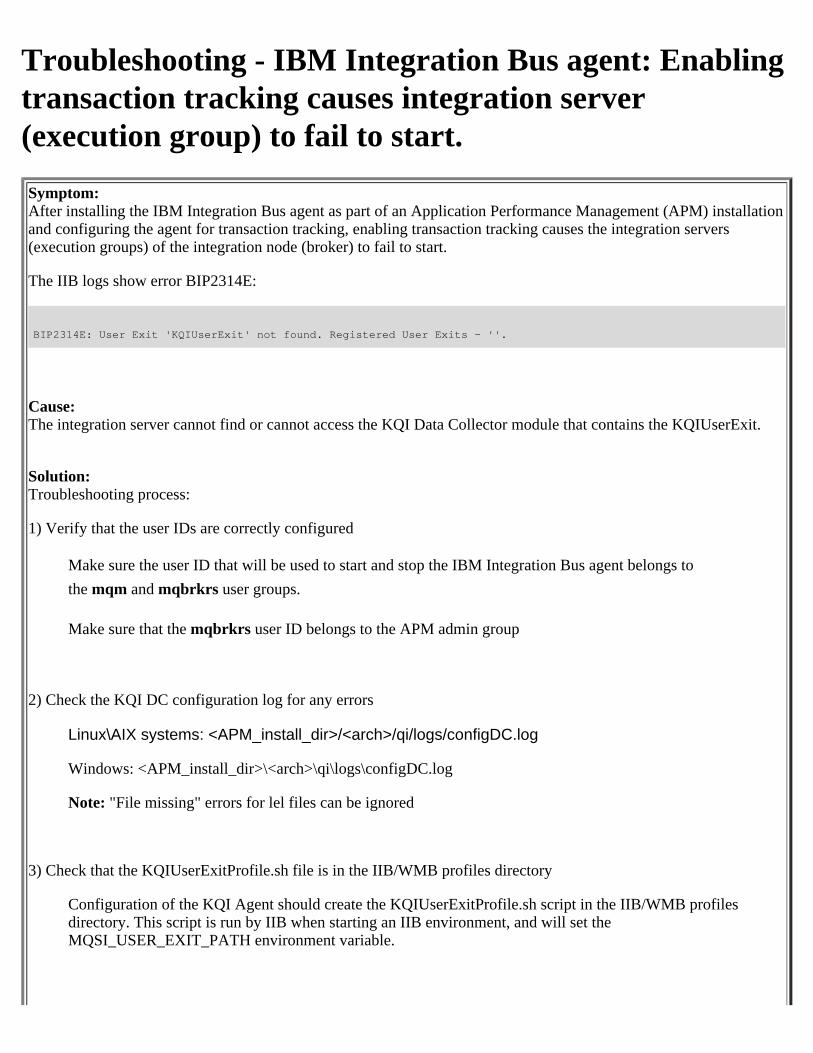
Troubleshooting - IBM Integration Bus agent: Enablingtransaction tracking causes integration server(execution group) to fail to start.Symptom: After installing the IBM Integration Bus agent as part of an Application Performance Management (APM) installationand configuring the agent for transaction tracking, enabling transaction tracking causes the integration servers(execution groups) of the integration node (broker) to fail to start.
The IIB logs show error BIP2314E:
BIP2314E: User Exit 'KQIUserExit' not found. Registered User Exits - ''.
Cause: The integration server cannot find or cannot access the KQI Data Collector module that contains the KQIUserExit.
Solution: Troubleshooting process:
1) Verify that the user IDs are correctly configured
Make sure the user ID that will be used to start and stop the IBM Integration Bus agent belongs tothe mqm and mqbrkrs user groups.
Make sure that the mqbrkrs user ID belongs to the APM admin group
2) Check the KQI DC configuration log for any errors
Linux\AIX systems: <APM_install_dir>/<arch>/qi/logs/configDC.log
Windows: <APM_install_dir>\<arch>\qi\logs\configDC.log
Note: "File missing" errors for lel files can be ignored
3) Check that the KQIUserExitProfile.sh file is in the IIB/WMB profiles directory
Configuration of the KQI Agent should create the KQIUserExitProfile.sh script in the IIB/WMB profilesdirectory. This script is run by IIB when starting an IIB environment, and will set theMQSI_USER_EXIT_PATH environment variable.
The IIB/WMB profiles directory:
Linux\AIX systems: /var/mqsi/common/profiles
Windows: C:\Documents and Settings\All Users\Application Data\IBM\MQSI\common\profiles
If this file is missing you should run the configDC script in the <APM_install_dir>/<arch>/qi/bindirectory
- Verify that the user has sufficient permissions to write to the IIB/WMB profiles directory.
- Navigate to the <APM_install_dir>/<arch>/qi/bin directory.
- Issue the following command to load the KK3UserExit user exit library for a WebSphere Message Brokerinstallation:
./configDC.sh -enablebroker_installation_directory
broker_installation_directory is an optional parameter, if this is omitted, the data collector will be configuredfor for all detected WMB or IIB installations. To configure for a specific installation specify the WMB or IIBinstallation directory.
For example, on an AIX system:
/opt/IBM/ITM/aix513/k3/bin/configDC.sh -enable
or
/opt/IBM/ITM/aix513/k3/bin/configDC.sh -enable /opt/IBM/mqsi/8.0.0.0
- Check that the KQIUserExitProfile.sh file is now present in the IIB/WMB profiles directory. If this file isstill missing contact IBM support.
4) Verify that the IIB administrator ID is a member of the APM admin group.
If the APM Installation is secured under an administrator ID, you must grant the IIB Administrator ID access tothe IIB agent data collector. Make sure that the IIB administrator ID is a member of the APMadministrators group.
5) Start a new IIB environment under the IIB administrator ID
Log in as the MB administrator and:
Linux\AIX systems: In a command shell, source the mqsiprofile
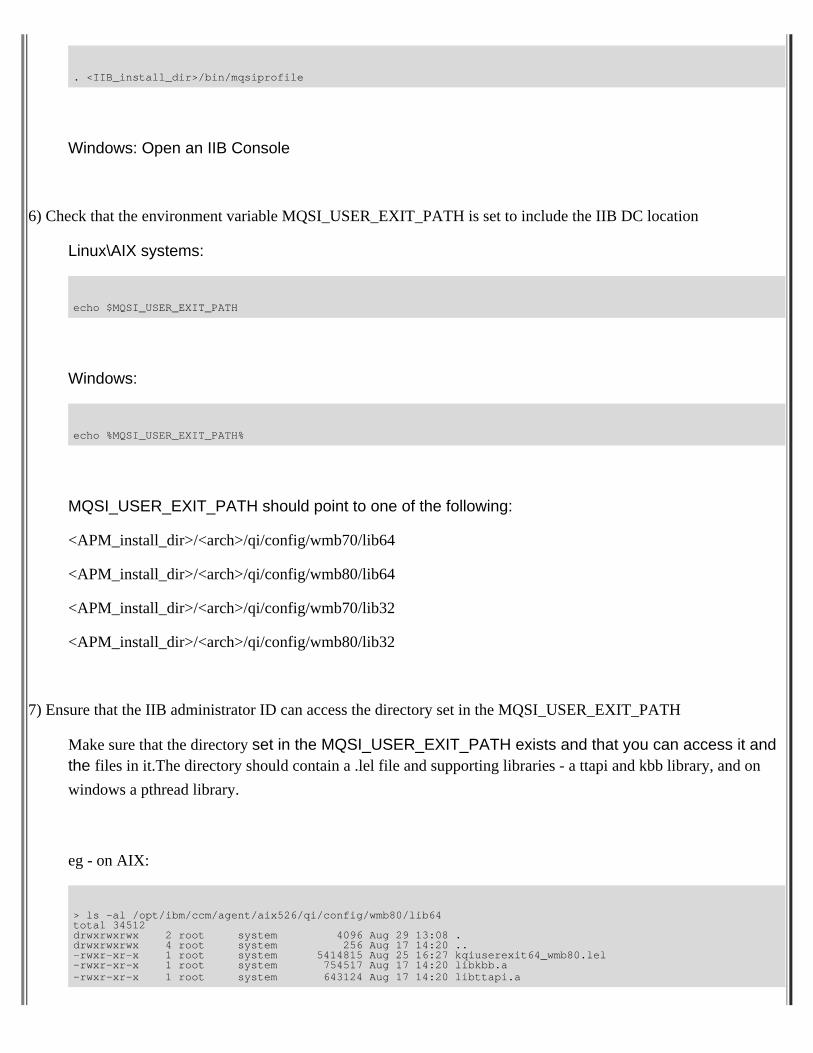
. <IIB_install_dir>/bin/mqsiprofile
Windows: Open an IIB Console
6) Check that the environment variable MQSI_USER_EXIT_PATH is set to include the IIB DC location
Linux\AIX systems:
echo $MQSI_USER_EXIT_PATH
Windows:
echo %MQSI_USER_EXIT_PATH%
MQSI_USER_EXIT_PATH should point to one of the following:
<APM_install_dir>/<arch>/qi/config/wmb70/lib64
<APM_install_dir>/<arch>/qi/config/wmb80/lib64
<APM_install_dir>/<arch>/qi/config/wmb70/lib32
<APM_install_dir>/<arch>/qi/config/wmb80/lib32
7) Ensure that the IIB administrator ID can access the directory set in the MQSI_USER_EXIT_PATH
Make sure that the directory set in the MQSI_USER_EXIT_PATH exists and that you can access it andthe files in it.The directory should contain a .lel file and supporting libraries - a ttapi and kbb library, and onwindows a pthread library.
eg - on AIX:
> ls -al /opt/ibm/ccm/agent/aix526/qi/config/wmb80/lib64total 34512drwxrwxrwx 2 root system 4096 Aug 29 13:08 .drwxrwxrwx 4 root system 256 Aug 17 14:20 ..-rwxr-xr-x 1 root system 5414815 Aug 25 16:27 kqiuserexit64_wmb80.lel-rwxr-xr-x 1 root system 754517 Aug 17 14:20 libkbb.a-rwxr-xr-x 1 root system 643124 Aug 17 14:20 libttapi.a

8) Ensure that the IIB administrator ID can write to the KQI DC logs directory
Check that you can access the <APM_install_dir>/<arch>/qi/logs directory
9) Start the integration node
Troubleshooting - Manual updates to the PerformanceManagement server components are required if youchange the IP address of the remote DB2 serverKnown Issue: If the Performance Management server is connected a remote DB2 server and you update the IPaddress of the remote DB2 server, you must manually update the Performance Management server components to usethe new IP address.
Solution: Complete the following task steps:
Note: Follow the procedure for updating the Performance Management server components if the following conditionsapply:
You are using a remote DB2 server.You configured the IP address of your remote DB2 server and not the host name.
This procedure does not cover migrating data from one DB2 server to another DB2 server.
1. Stop the Performance Management server. Enter:
apm stop_all
2. Update the databaseName attribute for each of the DB2 server data source definitions in theinstall_dir/wlp/usr/servers/server1/scr/conf/server_include.xml file. You must update two data sourcedefinitions for the SCR (SCR32) database and two data source definitions for the WAREHOUSE database.
3. Go to the install_dir/serveragents/config/apm_hostname_te.cfg file. Update the KQZ_JDBC_URL attribute withthe new IP address or host name.
4. Update the IP address values that are used in the Datamart cron jobs.a. On the Performance Management server, source the db2apm profile.
. ~db2apm/sqllib/db2profile
b. List the contents of the existing node directory.
db2 list node directory show detail > /tmp/old_nodes.txt
Verify that the results include an entry for APM_Node. For example:
Node 1 entry:Node name = APM_NODEComment =Directory entry type = LOCALProtocol = TCPIPHostname = 9.42.13.123Service name = 50000Remote instance name =System =Operating system type = None
c. Uncatalog APM_Node.
db2 uncatalog node apm_node
The following message is displayed:
DB20000I The UNCATALOG NODE command completed successfully.
d. Recatalog APM_NODE and specify the new IP address or host name of the DB2 server.
db2 catalog tcpip node APM_NODE remotenew_db2_server_name server service_name
Where service_name is the service name that was returned in step 4b. The following message isdisplayed:
DB20000I The CATALOG TCPIP NODE command completed successfully.
e. List the node directory to verify that the APM_NODE entry refers to the new IP address or host name ofthe DB2 server.
db2 list node directory show detail
A message similar to the following message is displayed:
Node x entry:Node name = APM_NODEComment =Directory entry type = LOCALProtocol = TCPIPHostname = new_db2_server_nameService name = 50000Remote instance name =System =Operating system type = None
f. Connect to the WAREHOUS database. The example uses the default password.
db2 connect to warehous user itmuser using db2Usrpasswd@08
A message similar to the following message is displayed:
Database Connection InformationDatabase server = DB2/LINUXX8664 10.5.5SQL authorization ID = ITMUSERLocal database alias = WAREHOUS
5. Update the database URLs in the Central Configuration Service.a. Start the Kafka Message Broker.
apm start kafka
b. Go to the Kafka bin directory.
cd /opt/ibm/kafka/bin
c. Connect to Apache Zookeeper.
./zkCli.sh -server localhost
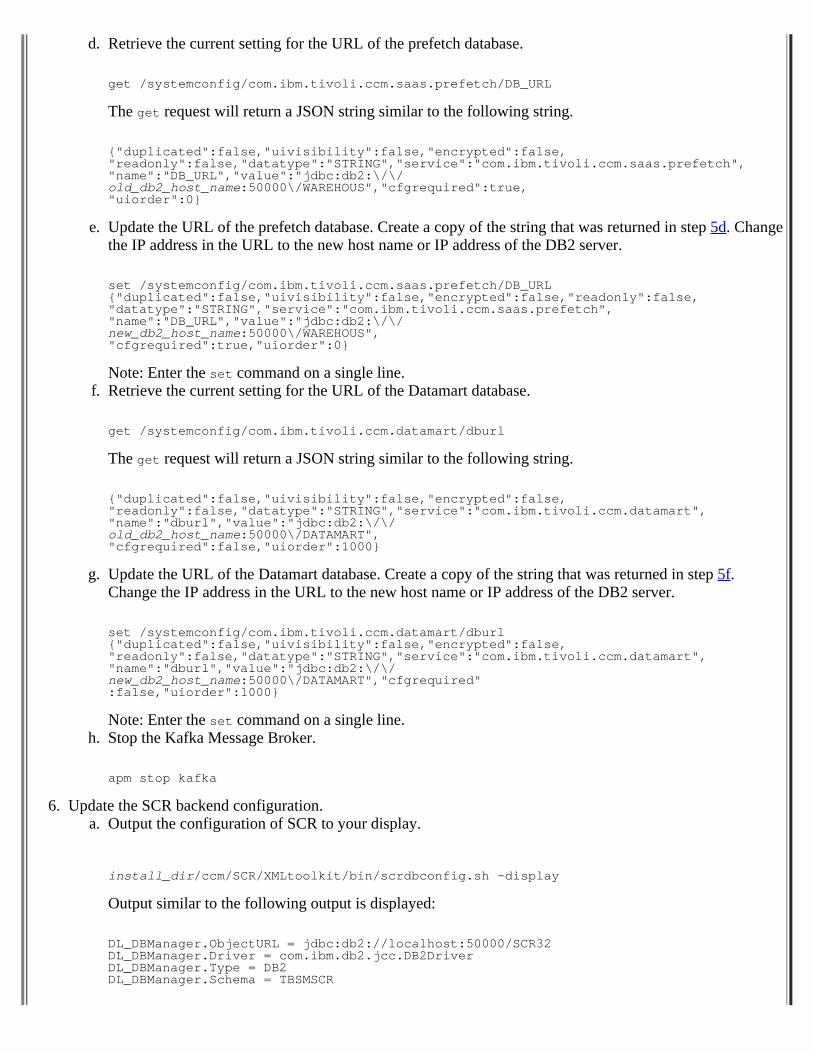
d. Retrieve the current setting for the URL of the prefetch database.
get /systemconfig/com.ibm.tivoli.ccm.saas.prefetch/DB_URL
The get request will return a JSON string similar to the following string.
{"duplicated":false,"uivisibility":false,"encrypted":false,"readonly":false,"datatype":"STRING","service":"com.ibm.tivoli.ccm.saas.prefetch","name":"DB_URL","value":"jdbc:db2:\/\/old_db2_host_name:50000\/WAREHOUS","cfgrequired":true,"uiorder":0}
e. Update the URL of the prefetch database. Create a copy of the string that was returned in step 5d. Changethe IP address in the URL to the new host name or IP address of the DB2 server.
set /systemconfig/com.ibm.tivoli.ccm.saas.prefetch/DB_URL{"duplicated":false,"uivisibility":false,"encrypted":false,"readonly":false,"datatype":"STRING","service":"com.ibm.tivoli.ccm.saas.prefetch","name":"DB_URL","value":"jdbc:db2:\/\/new_db2_host_name:50000\/WAREHOUS","cfgrequired":true,"uiorder":0}
Note: Enter the set command on a single line.f. Retrieve the current setting for the URL of the Datamart database.
get /systemconfig/com.ibm.tivoli.ccm.datamart/dburl
The get request will return a JSON string similar to the following string.
{"duplicated":false,"uivisibility":false,"encrypted":false,"readonly":false,"datatype":"STRING","service":"com.ibm.tivoli.ccm.datamart","name":"dburl","value":"jdbc:db2:\/\/old_db2_host_name:50000\/DATAMART","cfgrequired":false,"uiorder":1000}
g. Update the URL of the Datamart database. Create a copy of the string that was returned in step 5f.Change the IP address in the URL to the new host name or IP address of the DB2 server.
set /systemconfig/com.ibm.tivoli.ccm.datamart/dburl{"duplicated":false,"uivisibility":false,"encrypted":false,"readonly":false,"datatype":"STRING","service":"com.ibm.tivoli.ccm.datamart","name":"dburl","value":"jdbc:db2:\/\/new_db2_host_name:50000\/DATAMART","cfgrequired":false,"uiorder":1000}
Note: Enter the set command on a single line.h. Stop the Kafka Message Broker.
apm stop kafka
6. Update the SCR backend configuration.a. Output the configuration of SCR to your display.
install_dir/ccm/SCR/XMLtoolkit/bin/scrdbconfig.sh -display
Output similar to the following output is displayed:
DL_DBManager.ObjectURL = jdbc:db2://localhost:50000/SCR32DL_DBManager.Driver = com.ibm.db2.jcc.DB2DriverDL_DBManager.Type = DB2DL_DBManager.Schema = TBSMSCR
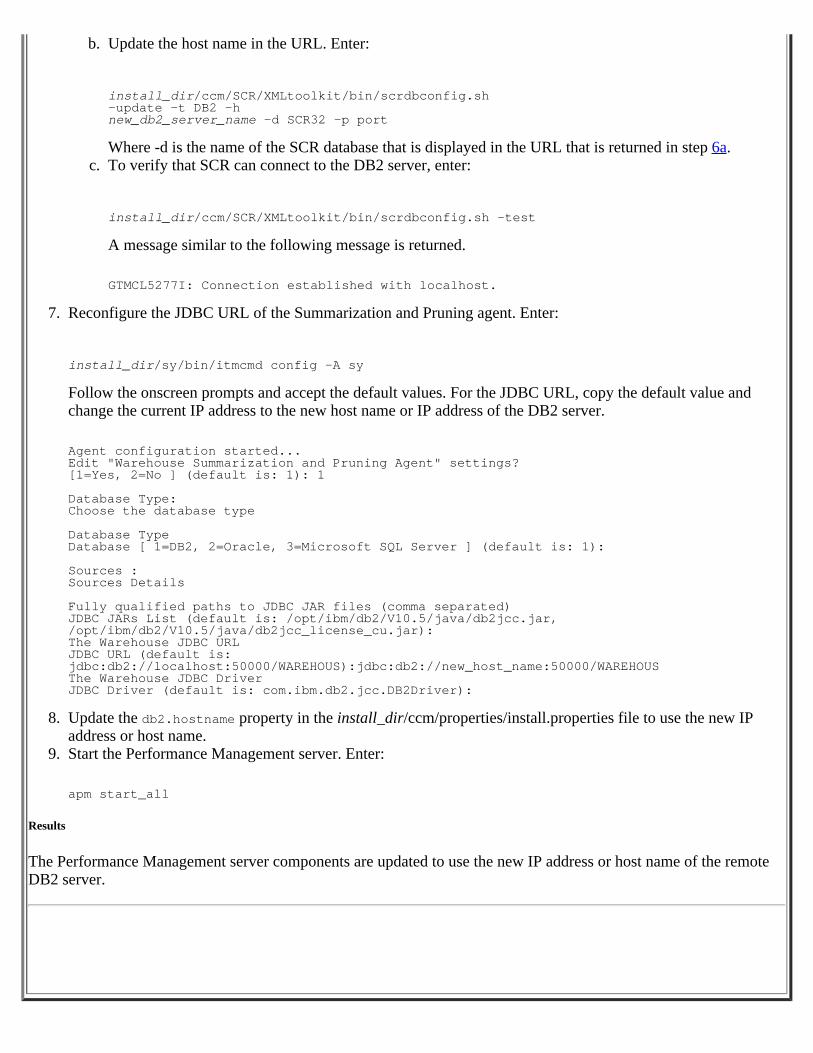
b. Update the host name in the URL. Enter:
install_dir/ccm/SCR/XMLtoolkit/bin/scrdbconfig.sh-update -t DB2 -hnew_db2_server_name -d SCR32 -p port
Where -d is the name of the SCR database that is displayed in the URL that is returned in step 6a.c. To verify that SCR can connect to the DB2 server, enter:
install_dir/ccm/SCR/XMLtoolkit/bin/scrdbconfig.sh -test
A message similar to the following message is returned.
GTMCL5277I: Connection established with localhost.
7. Reconfigure the JDBC URL of the Summarization and Pruning agent. Enter:
install_dir/sy/bin/itmcmd config -A sy
Follow the onscreen prompts and accept the default values. For the JDBC URL, copy the default value andchange the current IP address to the new host name or IP address of the DB2 server.
Agent configuration started...Edit "Warehouse Summarization and Pruning Agent" settings? [1=Yes, 2=No ] (default is: 1): 1
Database Type:Choose the database type
Database TypeDatabase [ 1=DB2, 2=Oracle, 3=Microsoft SQL Server ] (default is: 1):
Sources :Sources Details
Fully qualified paths to JDBC JAR files (comma separated)JDBC JARs List (default is: /opt/ibm/db2/V10.5/java/db2jcc.jar,/opt/ibm/db2/V10.5/java/db2jcc_license_cu.jar):The Warehouse JDBC URLJDBC URL (default is: jdbc:db2://localhost:50000/WAREHOUS):jdbc:db2://new_host_name:50000/WAREHOUSThe Warehouse JDBC DriverJDBC Driver (default is: com.ibm.db2.jcc.DB2Driver):
8. Update the db2.hostname property in the install_dir/ccm/properties/install.properties file to use the new IPaddress or host name.
9. Start the Performance Management server. Enter:
apm start_all
Results
The Performance Management server components are updated to use the new IP address or host name of the remoteDB2 server.
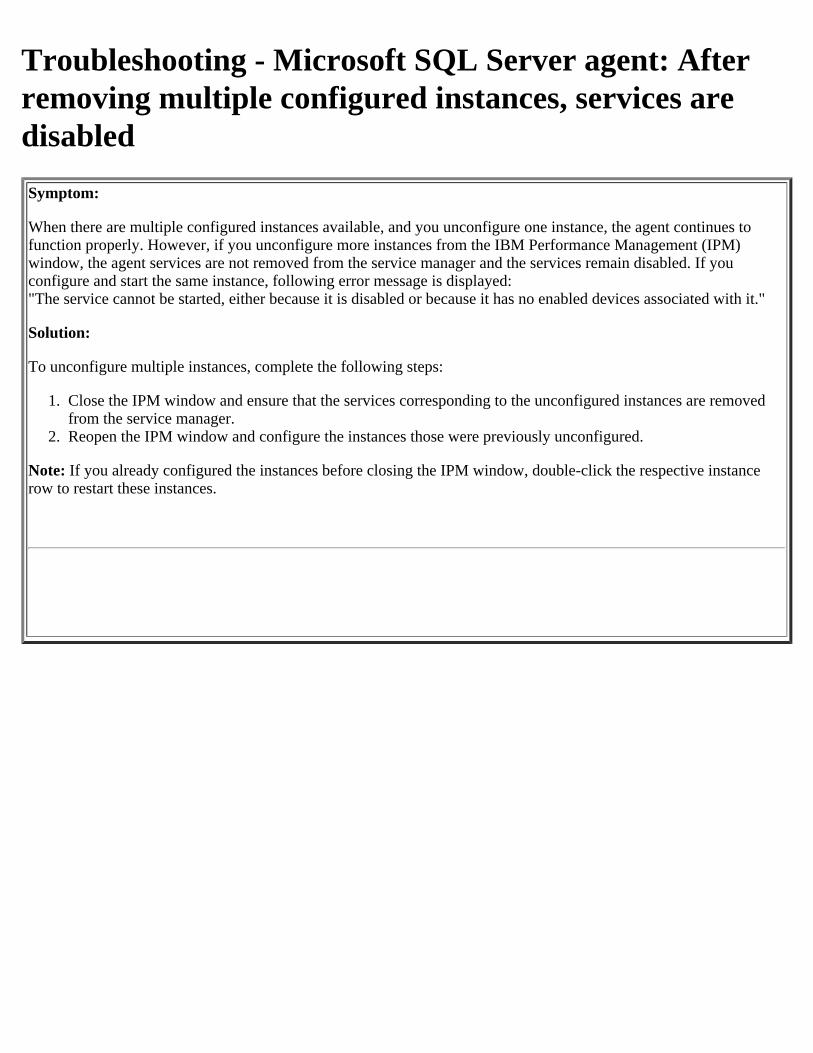
Troubleshooting - Microsoft SQL Server agent: Afterremoving multiple configured instances, services aredisabledSymptom:
When there are multiple configured instances available, and you unconfigure one instance, the agent continues tofunction properly. However, if you unconfigure more instances from the IBM Performance Management (IPM)window, the agent services are not removed from the service manager and the services remain disabled. If youconfigure and start the same instance, following error message is displayed:"The service cannot be started, either because it is disabled or because it has no enabled devices associated with it."
Solution:
To unconfigure multiple instances, complete the following steps:
1. Close the IPM window and ensure that the services corresponding to the unconfigured instances are removedfrom the service manager.
2. Reopen the IPM window and configure the instances those were previously unconfigured.
Note: If you already configured the instances before closing the IPM window, double-click the respective instancerow to restart these instances.
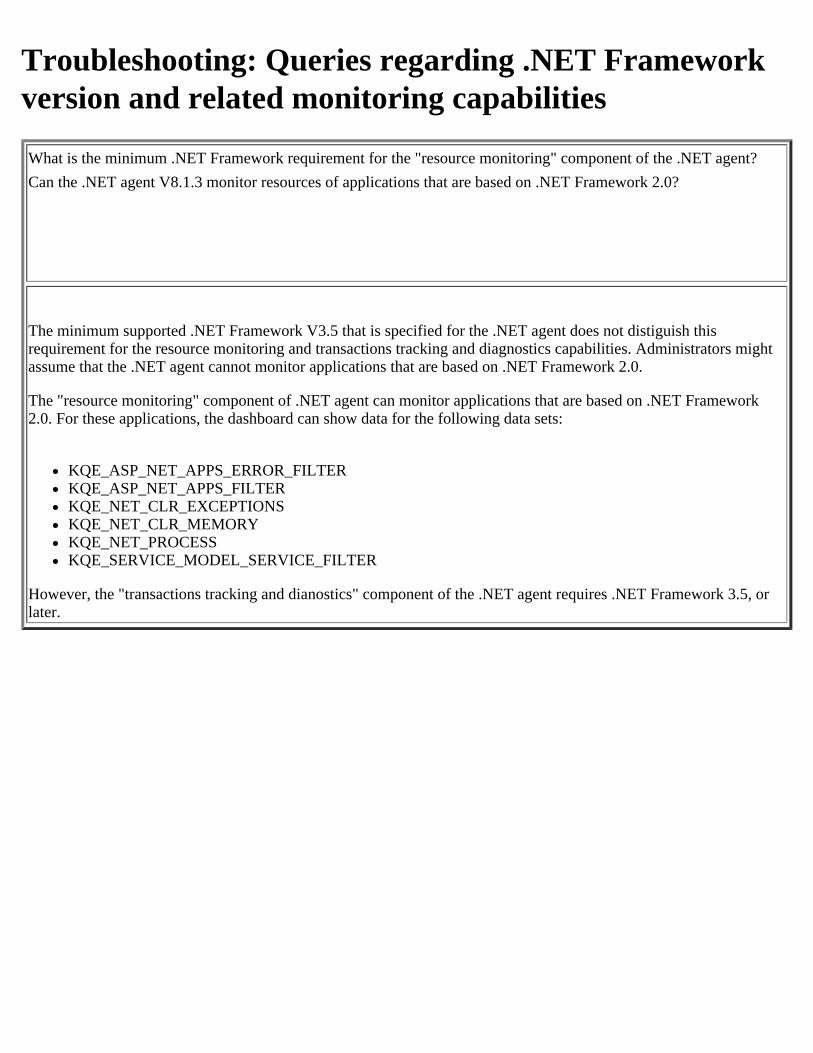
Troubleshooting: Queries regarding .NET Frameworkversion and related monitoring capabilities
What is the minimum .NET Framework requirement for the "resource monitoring" component of the .NET agent?Can the .NET agent V8.1.3 monitor resources of applications that are based on .NET Framework 2.0?
The minimum supported .NET Framework V3.5 that is specified for the .NET agent does not distiguish this requirement for the resource monitoring and transactions tracking and diagnostics capabilities. Administrators might assume that the .NET agent cannot monitor applications that are based on .NET Framework 2.0.
The "resource monitoring" component of .NET agent can monitor applications that are based on .NET Framework 2.0. For these applications, the dashboard can show data for the following data sets:
KQE_ASP_NET_APPS_ERROR_FILTERKQE_ASP_NET_APPS_FILTERKQE_NET_CLR_EXCEPTIONSKQE_NET_CLR_MEMORYKQE_NET_PROCESSKQE_SERVICE_MODEL_SERVICE_FILTER
However, the "transactions tracking and dianostics" component of the .NET agent requires .NET Framework 3.5, orlater.
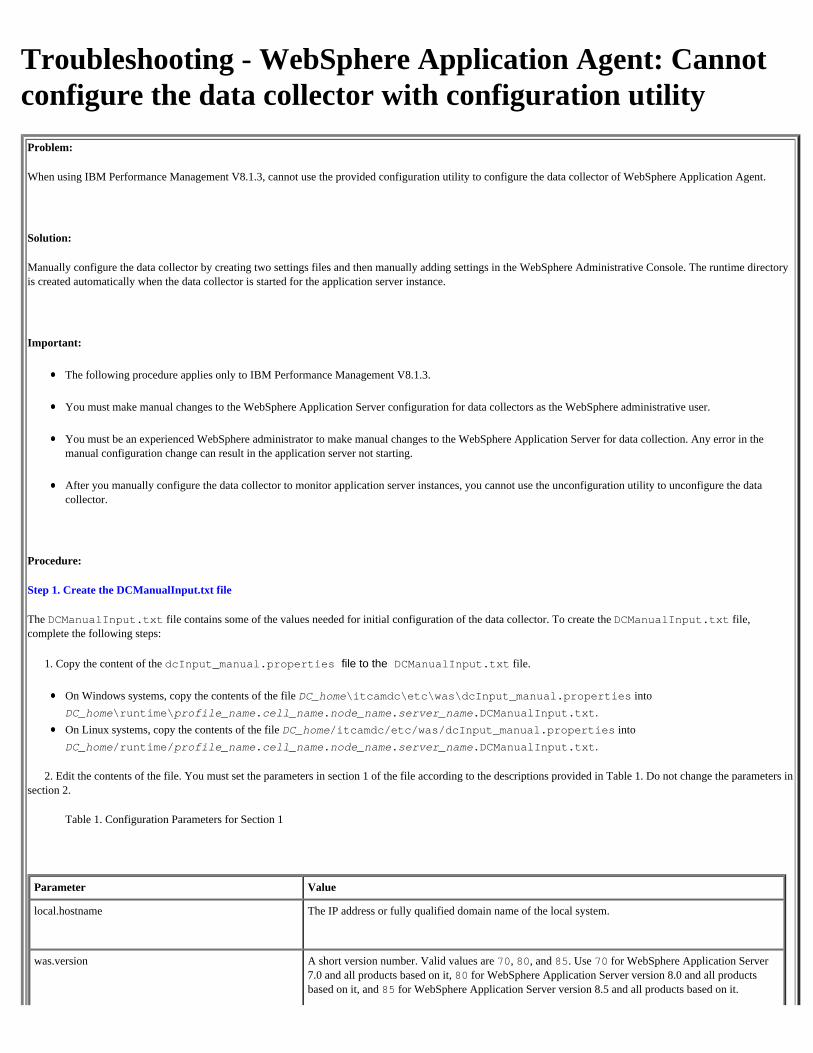
Troubleshooting - WebSphere Application Agent: Cannotconfigure the data collector with configuration utility
Problem:
When using IBM Performance Management V8.1.3, cannot use the provided configuration utility to configure the data collector of WebSphere Application Agent.
Solution:
Manually configure the data collector by creating two settings files and then manually adding settings in the WebSphere Administrative Console. The runtime directoryis created automatically when the data collector is started for the application server instance.
Important:
The following procedure applies only to IBM Performance Management V8.1.3.
You must make manual changes to the WebSphere Application Server configuration for data collectors as the WebSphere administrative user.
You must be an experienced WebSphere administrator to make manual changes to the WebSphere Application Server for data collection. Any error in themanual configuration change can result in the application server not starting.
After you manually configure the data collector to monitor application server instances, you cannot use the unconfiguration utility to unconfigure the datacollector.
Procedure:
Step 1. Create the DCManualInput.txt file
The DCManualInput.txt file contains some of the values needed for initial configuration of the data collector. To create the DCManualInput.txt file,complete the following steps:
1. Copy the content of the dcInput_manual.properties file to the DCManualInput.txt file.
On Windows systems, copy the contents of the file DC_home\itcamdc\etc\was\dcInput_manual.properties intoDC_home\runtime\profile_name.cell_name.node_name.server_name.DCManualInput.txt.On Linux systems, copy the contents of the file DC_home/itcamdc/etc/was/dcInput_manual.properties intoDC_home/runtime/profile_name.cell_name.node_name.server_name.DCManualInput.txt.
2. Edit the contents of the file. You must set the parameters in section 1 of the file according to the descriptions provided in Table 1. Do not change the parameters insection 2.
Table 1. Configuration Parameters for Section 1
Parameter Value
local.hostname The IP address or fully qualified domain name of the local system.
was.version A short version number. Valid values are 70, 80, and 85. Use 70 for WebSphere Application Server7.0 and all products based on it, 80 for WebSphere Application Server version 8.0 and all productsbased on it, and 85 for WebSphere Application Server version 8.5 and all products based on it.
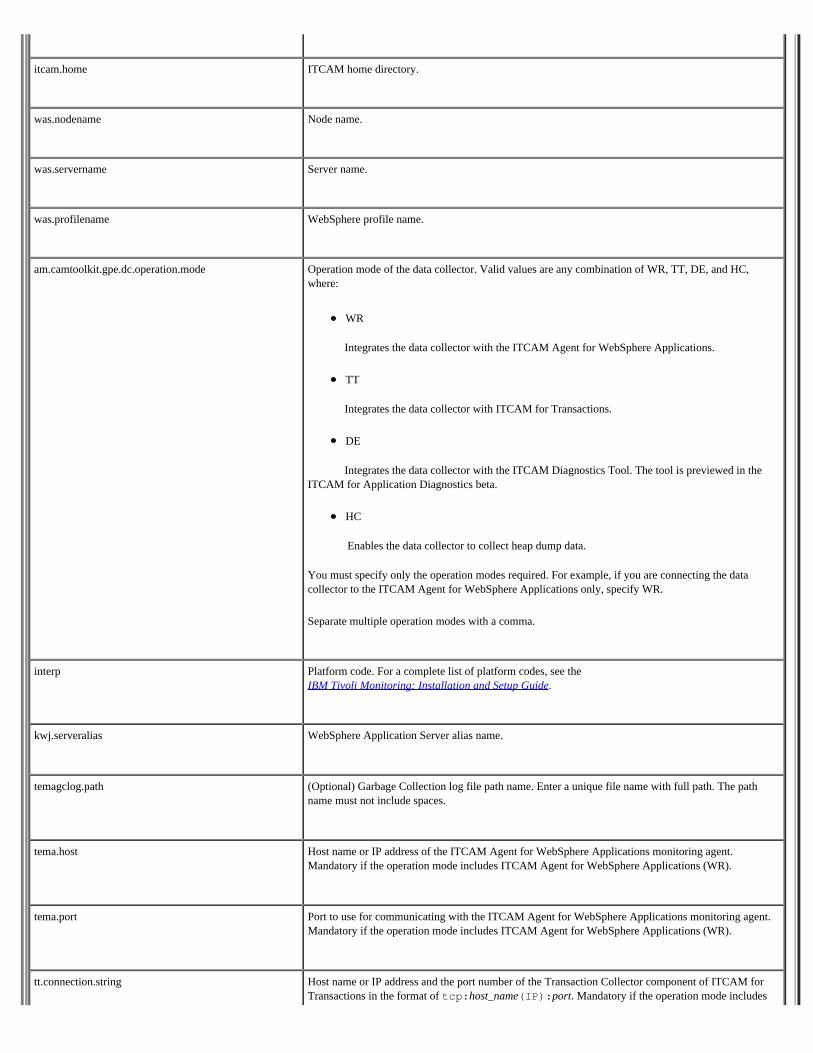
itcam.home ITCAM home directory.
was.nodename Node name.
was.servername Server name.
was.profilename WebSphere profile name.
am.camtoolkit.gpe.dc.operation.mode Operation mode of the data collector. Valid values are any combination of WR, TT, DE, and HC,where:
WR
Integrates the data collector with the ITCAM Agent for WebSphere Applications.
TT
Integrates the data collector with ITCAM for Transactions.
DE
Integrates the data collector with the ITCAM Diagnostics Tool. The tool is previewed in theITCAM for Application Diagnostics beta.
HC
Enables the data collector to collect heap dump data.
You must specify only the operation modes required. For example, if you are connecting the datacollector to the ITCAM Agent for WebSphere Applications only, specify WR.
Separate multiple operation modes with a comma.
interp Platform code. For a complete list of platform codes, see theIBM Tivoli Monitoring: Installation and Setup Guide.
kwj.serveralias WebSphere Application Server alias name.
temagclog.path (Optional) Garbage Collection log file path name. Enter a unique file name with full path. The pathname must not include spaces.
tema.host Host name or IP address of the ITCAM Agent for WebSphere Applications monitoring agent.Mandatory if the operation mode includes ITCAM Agent for WebSphere Applications (WR).
tema.port Port to use for communicating with the ITCAM Agent for WebSphere Applications monitoring agent.Mandatory if the operation mode includes ITCAM Agent for WebSphere Applications (WR).
tt.connection.string Host name or IP address and the port number of the Transaction Collector component of ITCAM forTransactions in the format of tcp:host_name(IP):port. Mandatory if the operation mode includes
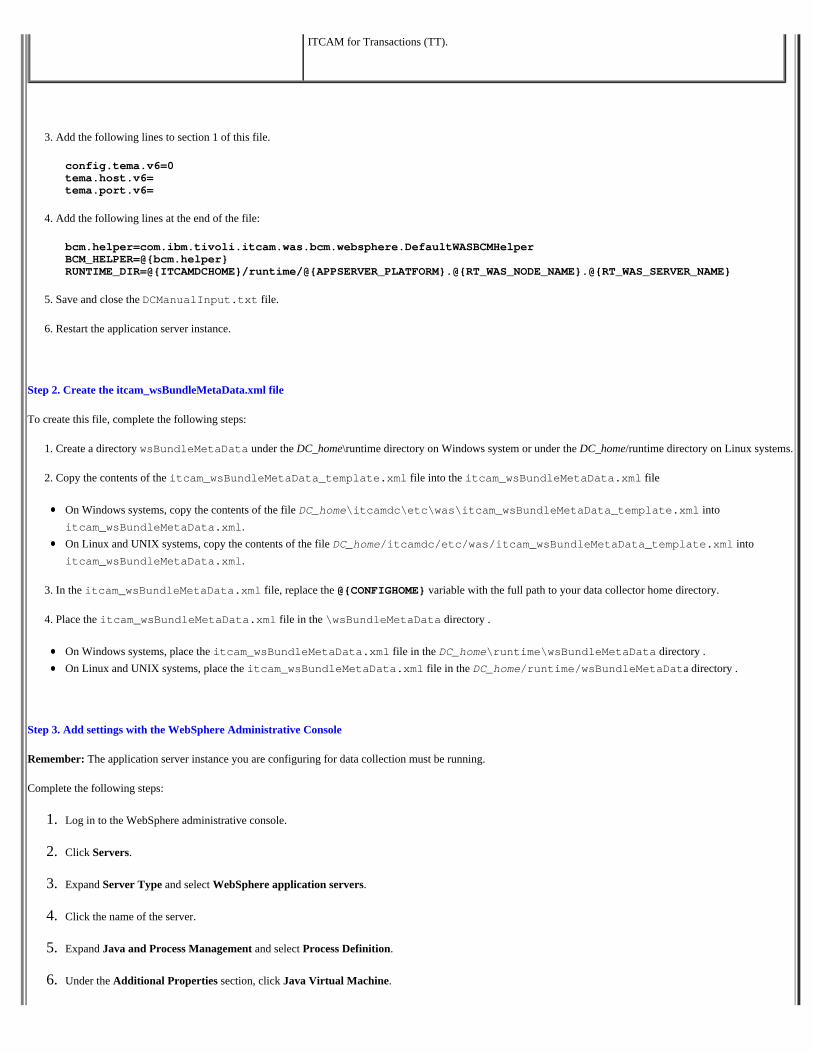
ITCAM for Transactions (TT).
3. Add the following lines to section 1 of this file.
config.tema.v6=0tema.host.v6=tema.port.v6=
4. Add the following lines at the end of the file:
bcm.helper=com.ibm.tivoli.itcam.was.bcm.websphere.DefaultWASBCMHelperBCM_HELPER=@{bcm.helper}RUNTIME_DIR=@{ITCAMDCHOME}/runtime/@{APPSERVER_PLATFORM}.@{RT_WAS_NODE_NAME}.@{RT_WAS_SERVER_NAME}
5. Save and close the DCManualInput.txt file.
6. Restart the application server instance.
Step 2. Create the itcam_wsBundleMetaData.xml file
To create this file, complete the following steps:
1. Create a directory wsBundleMetaData under the DC_home\runtime directory on Windows system or under the DC_home/runtime directory on Linux systems.
2. Copy the contents of the itcam_wsBundleMetaData_template.xml file into the itcam_wsBundleMetaData.xml file
On Windows systems, copy the contents of the file DC_home\itcamdc\etc\was\itcam_wsBundleMetaData_template.xml intoitcam_wsBundleMetaData.xml.On Linux and UNIX systems, copy the contents of the file DC_home/itcamdc/etc/was/itcam_wsBundleMetaData_template.xml intoitcam_wsBundleMetaData.xml.
3. In the itcam_wsBundleMetaData.xml file, replace the @{CONFIGHOME} variable with the full path to your data collector home directory.
4. Place the itcam_wsBundleMetaData.xml file in the \wsBundleMetaData directory .
On Windows systems, place the itcam_wsBundleMetaData.xml file in the DC_home\runtime\wsBundleMetaData directory .On Linux and UNIX systems, place the itcam_wsBundleMetaData.xml file in the DC_home/runtime/wsBundleMetaData directory .
Step 3. Add settings with the WebSphere Administrative Console
Remember: The application server instance you are configuring for data collection must be running.
Complete the following steps:
1. Log in to the WebSphere administrative console.
2. Click Servers.
3. Expand Server Type and select WebSphere application servers.
4. Click the name of the server.
5. Expand Java and Process Management and select Process Definition.
6. Under the Additional Properties section, click Java Virtual Machine.
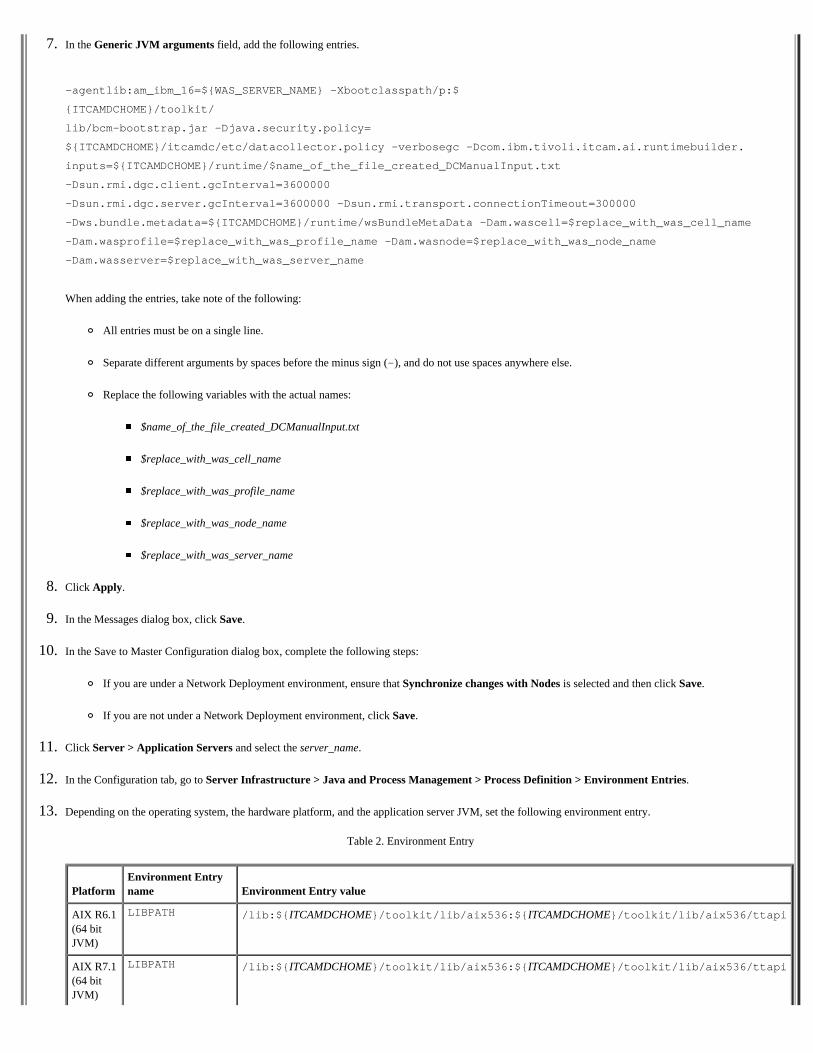
7. In the Generic JVM arguments field, add the following entries.
-agentlib:am_ibm_16=${WAS_SERVER_NAME} -Xbootclasspath/p:$
{ITCAMDCHOME}/toolkit/
lib/bcm-bootstrap.jar -Djava.security.policy=
${ITCAMDCHOME}/itcamdc/etc/datacollector.policy -verbosegc -Dcom.ibm.tivoli.itcam.ai.runtimebuilder.
inputs=${ITCAMDCHOME}/runtime/$name_of_the_file_created_DCManualInput.txt
-Dsun.rmi.dgc.client.gcInterval=3600000
-Dsun.rmi.dgc.server.gcInterval=3600000 -Dsun.rmi.transport.connectionTimeout=300000
-Dws.bundle.metadata=${ITCAMDCHOME}/runtime/wsBundleMetaData -Dam.wascell=$replace_with_was_cell_name
-Dam.wasprofile=$replace_with_was_profile_name -Dam.wasnode=$replace_with_was_node_name
-Dam.wasserver=$replace_with_was_server_name
When adding the entries, take note of the following:
All entries must be on a single line.
Separate different arguments by spaces before the minus sign (-), and do not use spaces anywhere else.
Replace the following variables with the actual names:
$name_of_the_file_created_DCManualInput.txt
$replace_with_was_cell_name
$replace_with_was_profile_name
$replace_with_was_node_name
$replace_with_was_server_name
8. Click Apply.
9. In the Messages dialog box, click Save.
10. In the Save to Master Configuration dialog box, complete the following steps:
If you are under a Network Deployment environment, ensure that Synchronize changes with Nodes is selected and then click Save.
If you are not under a Network Deployment environment, click Save.
11. Click Server > Application Servers and select the server_name.
12. In the Configuration tab, go to Server Infrastructure > Java and Process Management > Process Definition > Environment Entries.
13. Depending on the operating system, the hardware platform, and the application server JVM, set the following environment entry.
Table 2. Environment Entry
PlatformEnvironment Entryname Environment Entry value
AIX R6.1(64 bitJVM)
LIBPATH /lib:${ITCAMDCHOME}/toolkit/lib/aix536:${ITCAMDCHOME}/toolkit/lib/aix536/ttapi
AIX R7.1(64 bitJVM)
LIBPATH /lib:${ITCAMDCHOME}/toolkit/lib/aix536:${ITCAMDCHOME}/toolkit/lib/aix536/ttapi
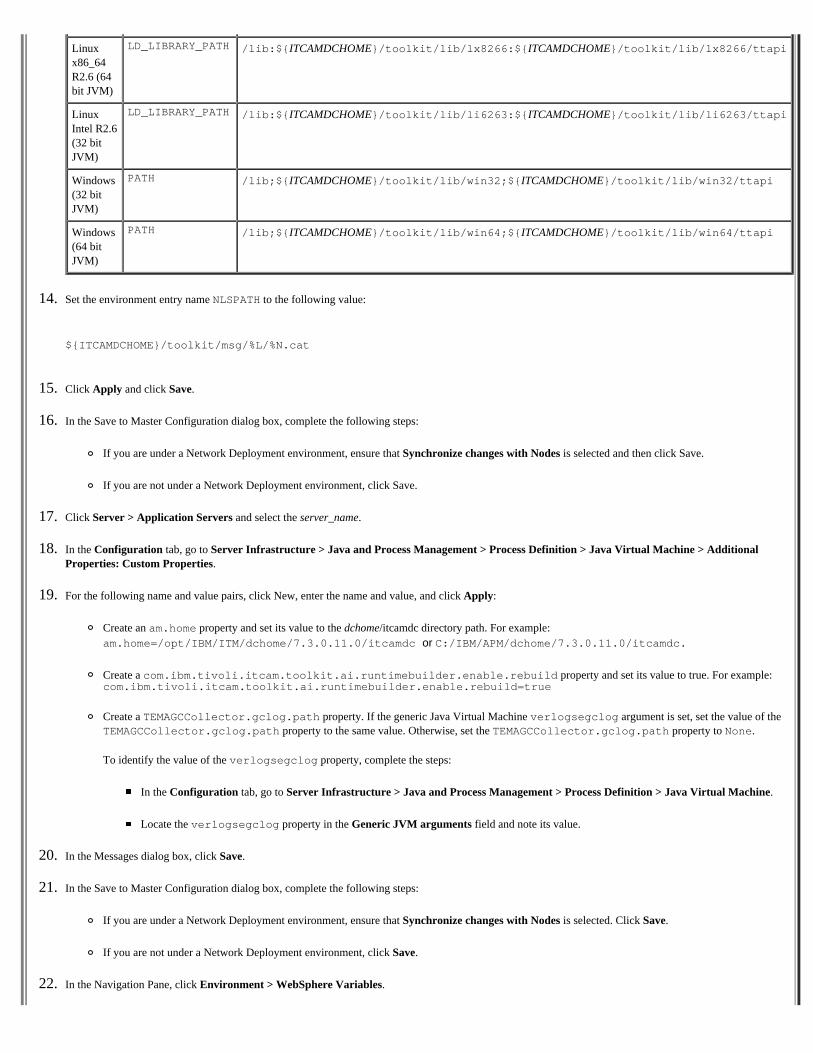
Linuxx86_64R2.6 (64bit JVM)
LD_LIBRARY_PATH /lib:${ITCAMDCHOME}/toolkit/lib/lx8266:${ITCAMDCHOME}/toolkit/lib/lx8266/ttapi
LinuxIntel R2.6(32 bitJVM)
LD_LIBRARY_PATH /lib:${ITCAMDCHOME}/toolkit/lib/li6263:${ITCAMDCHOME}/toolkit/lib/li6263/ttapi
Windows(32 bitJVM)
PATH /lib;${ITCAMDCHOME}/toolkit/lib/win32;${ITCAMDCHOME}/toolkit/lib/win32/ttapi
Windows(64 bitJVM)
PATH /lib;${ITCAMDCHOME}/toolkit/lib/win64;${ITCAMDCHOME}/toolkit/lib/win64/ttapi
14. Set the environment entry name NLSPATH to the following value:
${ITCAMDCHOME}/toolkit/msg/%L/%N.cat
15. Click Apply and click Save.
16. In the Save to Master Configuration dialog box, complete the following steps:
If you are under a Network Deployment environment, ensure that Synchronize changes with Nodes is selected and then click Save.
If you are not under a Network Deployment environment, click Save.
17. Click Server > Application Servers and select the server_name.
18. In the Configuration tab, go to Server Infrastructure > Java and Process Management > Process Definition > Java Virtual Machine > AdditionalProperties: Custom Properties.
19. For the following name and value pairs, click New, enter the name and value, and click Apply:
Create an am.home property and set its value to the dchome/itcamdc directory path. For example:am.home=/opt/IBM/ITM/dchome/7.3.0.11.0/itcamdc or C:/IBM/APM/dchome/7.3.0.11.0/itcamdc.
Create a com.ibm.tivoli.itcam.toolkit.ai.runtimebuilder.enable.rebuild property and set its value to true. For example:com.ibm.tivoli.itcam.toolkit.ai.runtimebuilder.enable.rebuild=true
Create a TEMAGCCollector.gclog.path property. If the generic Java Virtual Machine verlogsegclog argument is set, set the value of theTEMAGCCollector.gclog.path property to the same value. Otherwise, set the TEMAGCCollector.gclog.path property to None.
To identify the value of the verlogsegclog property, complete the steps:
In the Configuration tab, go to Server Infrastructure > Java and Process Management > Process Definition > Java Virtual Machine.
Locate the verlogsegclog property in the Generic JVM arguments field and note its value.
20. In the Messages dialog box, click Save.
21. In the Save to Master Configuration dialog box, complete the following steps:
If you are under a Network Deployment environment, ensure that Synchronize changes with Nodes is selected. Click Save.
If you are not under a Network Deployment environment, click Save.
22. In the Navigation Pane, click Environment > WebSphere Variables.

23. Set the following variables. For each variable, choose the server name as the scope.
Set ITCAMDCHOME to DC_home. For example, C:/IBM/APM/dchome/7.3.0.11.0.
Set ITCAMDCVERSION to the version.release.maintenance_level of the data collector. For example, 7.3.0.11.0
24. Click Apply and click Save.
25. In the Save to Master Configuration dialog box, complete the following steps:
If you are under a Network Deployment environment, ensure that Synchronize changes with Nodes is selected and then click Save.
If you are not under a Network Deployment environment, click Save.
26. Restart the application server instance. The data collector reads the settings files and creates the runtime directory.
.
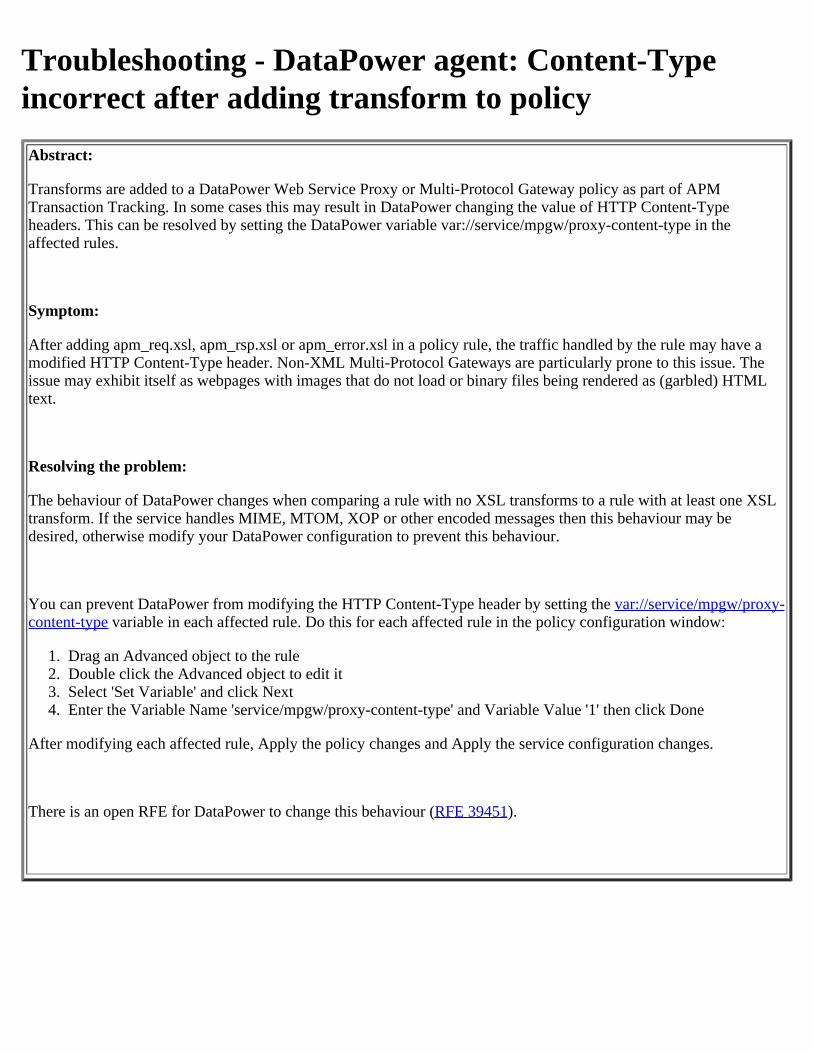
Troubleshooting - DataPower agent: Content-Typeincorrect after adding transform to policyAbstract:
Transforms are added to a DataPower Web Service Proxy or Multi-Protocol Gateway policy as part of APMTransaction Tracking. In some cases this may result in DataPower changing the value of HTTP Content-Typeheaders. This can be resolved by setting the DataPower variable var://service/mpgw/proxy-content-type in theaffected rules.
Symptom:
After adding apm_req.xsl, apm_rsp.xsl or apm_error.xsl in a policy rule, the traffic handled by the rule may have amodified HTTP Content-Type header. Non-XML Multi-Protocol Gateways are particularly prone to this issue. Theissue may exhibit itself as webpages with images that do not load or binary files being rendered as (garbled) HTMLtext.
Resolving the problem:
The behaviour of DataPower changes when comparing a rule with no XSL transforms to a rule with at least one XSLtransform. If the service handles MIME, MTOM, XOP or other encoded messages then this behaviour may bedesired, otherwise modify your DataPower configuration to prevent this behaviour.
You can prevent DataPower from modifying the HTTP Content-Type header by setting the var://service/mpgw/proxy-content-type variable in each affected rule. Do this for each affected rule in the policy configuration window:
1. Drag an Advanced object to the rule2. Double click the Advanced object to edit it3. Select 'Set Variable' and click Next4. Enter the Variable Name 'service/mpgw/proxy-content-type' and Variable Value '1' then click Done
After modifying each affected rule, Apply the policy changes and Apply the service configuration changes.
There is an open RFE for DataPower to change this behaviour (RFE 39451).
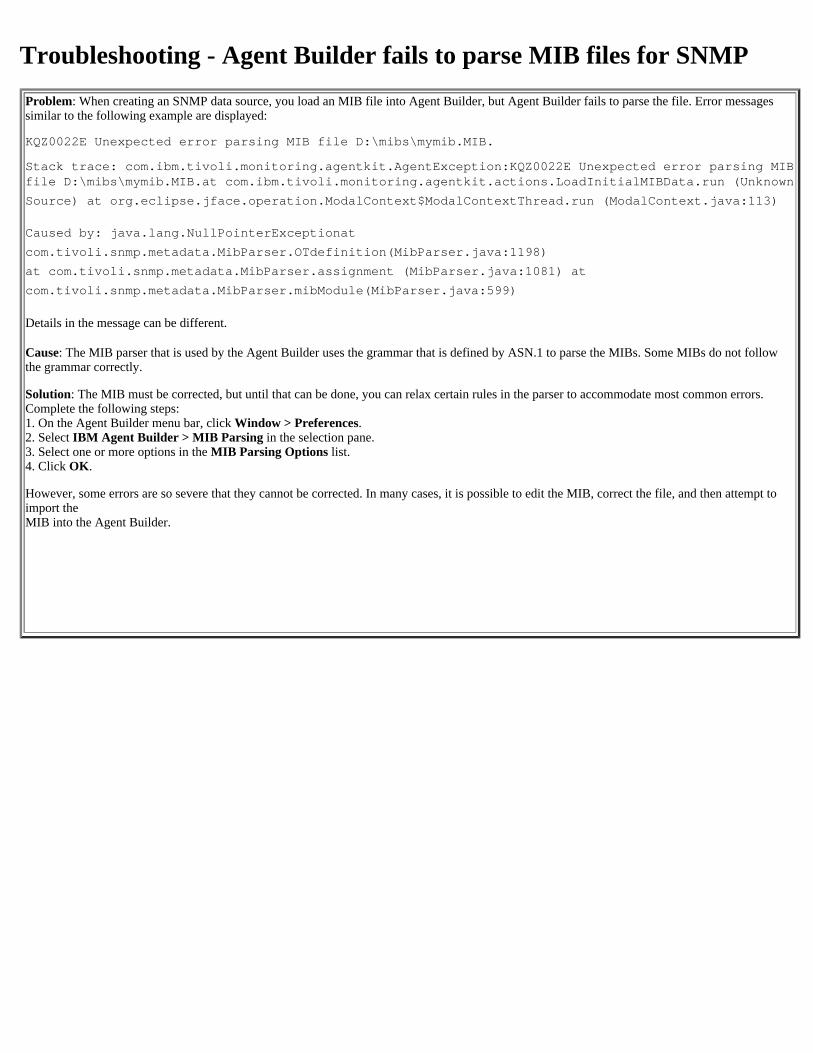
Troubleshooting - Agent Builder fails to parse MIB files for SNMPProblem: When creating an SNMP data source, you load an MIB file into Agent Builder, but Agent Builder fails to parse the file. Error messagessimilar to the following example are displayed:
KQZ0022E Unexpected error parsing MIB file D:\mibs\mymib.MIB.
Stack trace: com.ibm.tivoli.monitoring.agentkit.AgentException:KQZ0022E Unexpected error parsing MIBfile D:\mibs\mymib.MIB.at com.ibm.tivoli.monitoring.agentkit.actions.LoadInitialMIBData.run (Unknown
Source) at org.eclipse.jface.operation.ModalContext$ModalContextThread.run (ModalContext.java:113)
Caused by: java.lang.NullPointerExceptionat
com.tivoli.snmp.metadata.MibParser.OTdefinition(MibParser.java:1198)
at com.tivoli.snmp.metadata.MibParser.assignment (MibParser.java:1081) at
com.tivoli.snmp.metadata.MibParser.mibModule(MibParser.java:599)
Details in the message can be different.
Cause: The MIB parser that is used by the Agent Builder uses the grammar that is defined by ASN.1 to parse the MIBs. Some MIBs do not followthe grammar correctly.
Solution: The MIB must be corrected, but until that can be done, you can relax certain rules in the parser to accommodate most common errors.Complete the following steps:1. On the Agent Builder menu bar, click Window > Preferences.2. Select IBM Agent Builder > MIB Parsing in the selection pane.3. Select one or more options in the MIB Parsing Options list.4. Click OK.
However, some errors are so severe that they cannot be corrected. In many cases, it is possible to edit the MIB, correct the file, and then attempt to import theMIB into the Agent Builder.
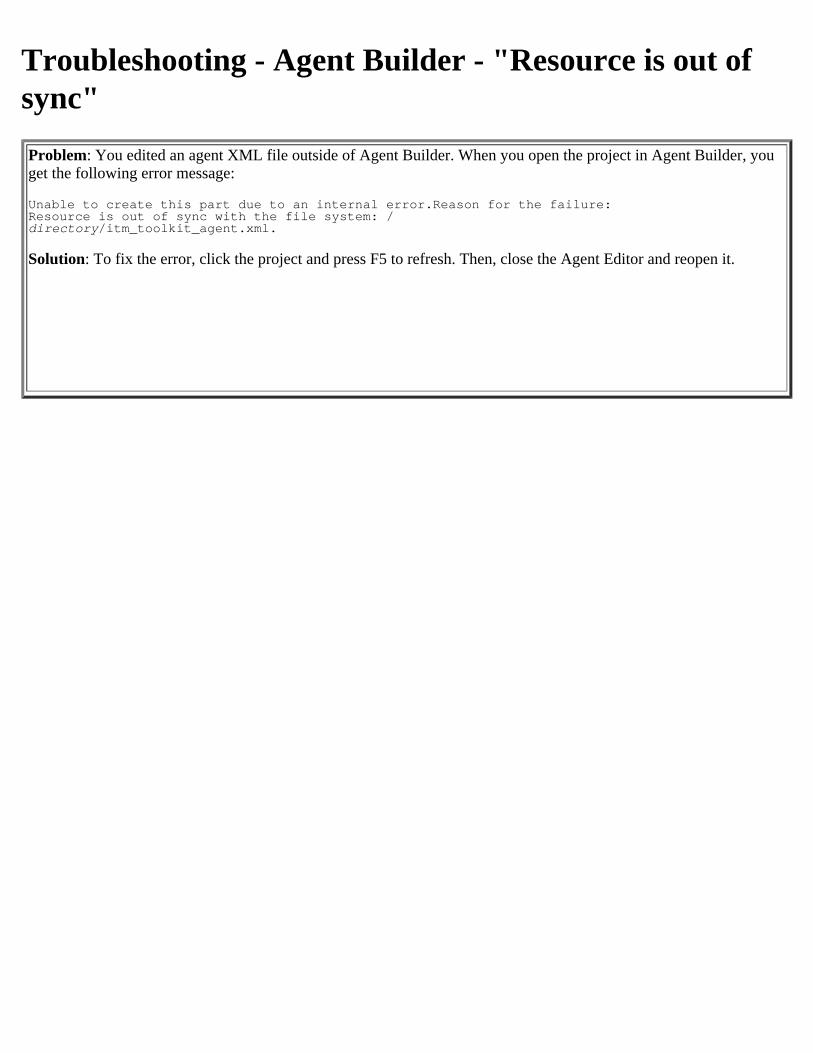
Troubleshooting - Agent Builder - "Resource is out ofsync"Problem: You edited an agent XML file outside of Agent Builder. When you open the project in Agent Builder, you get the following error message:
Unable to create this part due to an internal error.Reason for the failure: Resource is out of sync with the file system: /directory/itm_toolkit_agent.xml.
Solution: To fix the error, click the project and press F5 to refresh. Then, close the Agent Editor and reopen it.
Troubleshooting - Agent Builder - Script data sourcedoes not run the script on a Windows systemProblem: You generate an agent with a Script data source for the Windows environment, but the agent does not run the script.
Cause: You might have omitted the .bat or .cmd extension. Windows users often do not type the extension when running a script.
Solution: Do not omit the extension when you define the script name for the agent.
Troubleshooting - Agent Builder - "Data source doesnot contain a key attribute"Problem: When you save an agent, you might see the following error in the Problems View:
Data source DataSourceName does not contain a key attribute.
Solution: Edit the data set (attribute group). For instructions about editing a data set,see http://www.ibm.com/support/knowledgecenter/SSHLNR_8.1.3/com.ibm.pm.doc/builder/ab_edit_data_src.htm
If the data source can return only one row of data, select Produces a single data row for the data source.
If the data source can return multiple rows of data, select an appropriate attribute or attributes as keys. To set an attribute as a key attribute, edit the attribute and enable the Key Attribute option. For instructions about editing an attribute,see http://www.ibm.com/support/knowledgecenter/SSHLNR_8.1.3/com.ibm.pm.doc/builder/ab_editing_attributes.htm

Troubleshooting - Agent Builder - error when trying tobrowse WMI or Windows services on local host by IPaddress or host nameProblem: When you use the remote browsing option for WMI or Windows services and enter the IP address or host name of the local system, a failure occurs.
Cause: Browsing in this way is not supported. You receive an error that Agent Builder was unable to open a connection to the host.
Solution: If you want to browse WMI or services locally on the host that runs Agent Builder, select localhost from the list instead of entering the host name or IP address.
Troubleshooting - Agent Builder - "Data source exceedsmaximum data size"Problem: When you save an agent in Agent Builder, you might see the following error in the Problems View:
Data source DataSourceName exceeds the maximum data size of 8192 bytes
Cause: Tivoli Monitoring currently limits the amount of data that can be returned for each row in a table to 8192bytes, so if the potential data size exceeds this number, Agent Builder displays an error.
If your agent is intended for use only with Performance Management, you can safely ignore the error. PerformanceManagement does not limit the amount of data in a row.
However, any request for data from an attribute group causes collection of all the data. Defining largeattribute groups can increase processor and memory usage in the monitoring system. Where the data doesnot need to be displayed together, form smaller groups of data to optimize the behavior of the system.
For each data source in the agent, the Agent Builder computes the sizes of the attributes in the following ways:
Only attributes marked Display attribute in the Tivoli Enterprise Portal are counted.Each 32-bit numeric attribute is 4 bytes. Each 64-bit numeric attribute is 8 bytes.For each string attribute, the value for maximum size is used (with a maximum value of 2048 bytes).Ensure that the sizes listed for string attributes are set to reasonable values (under 100 bytes).
Troubleshooting - Agent Builder does not start, or doesnot display UI, or fails to start agent testing, orterminates abnormallyProblem: Agent Builder does not start, or starts but starts but does not display its user interface, or fails to start agenttesting, or terminates abnormally..
Solution:
On Linux systems, Agent Builder 6.3.3, shipped with Performance Management 8.1.3, is a 64-bitapplication. It will not run in a 32-bit Linux environment.Ensure that the prerequisites are met. For details, seehttp://www.ibm.com/support/knowledgecenter/SSHLNR_8.1.3/com.ibm.pm.doc/builder/ab_prerequisites.htmIn the user home directory, delete the following files:
p2.agentbuilder_config
Important: On Windows systems the user home directory is in the HOMEPATH environment variable. On Linux systems the user home directory is in the HOME environment variable.
Troubleshooting - Agent created by Agent Builder - nodata displayedSymptom: The Performance Management console displays no data for an agent that was created using Agent Builder. Data for other agents that monitor the same host is displayed.
Cause: This problem can be caused by one of several issues with a component of the Performance Management server.
Solution:If you are using Performance Management on Cloud, contact IBM Support. For instructions about contacting IBM Support, see the following page: https://www.ibmserviceengage.com/support
If you are using a Performance Management on premises product, execute the following command on the host for the Performance Management server.
apm restart asfrest
If the issue is not resolved, execute the following command:
apm restart min
Similar issue, Agent was built using the A up B. I m in 8.1.1 and using the AB 6.3.2.
The agent I built is multi instance and does not show in the APM GUI.What are the logs I should look at - to see the data flow.I have looked at agent_asfactivity.log and the envelope contents looks good. But yet the agent does not show up. Any tips or help would be appreciated on how to debug this ?
If the agent is not showing in APM UI at all, did you complete the steps to prepare the agent for APM?
http://www.ibm.com/support/knowledgecenter/SSHLNR_8.1.2/com.ibm.pm.doc/builder/ab_oslc_task.htm
Yes, prepared the agent for APM, now the agent is showing in APM UI but unable to add agent instance whencreating application for thsi agent, When adding application to this custom agent, it is not showing agent instance.
Here I created custom to monitor URLs, agent name is 'Locator'. Datasource is 'Data from Server-->HTTP'.
Enclosed screen shots.
First of all: if by any chance you have another custom agent in your environment and have based this one off it, there might be several special issues.
If this is not so, here are some checks to do on the agent system.
1. Make sure the agent installed properly and did not give errors at installation time.2. Is the agent running? Some agents will not start when you first install them so you have a chance to
configure them. For an agent of product code kxx with a name of fredinstalled in the default locationof /opt/ibm/apm/agent,
Check if the agent is running: ps -ef|grep kxxagentStart the agent: /opt/ibm/apm/agent/bin/fred-agent.sh start
3. Did the agent upload metadata? Look for "jar" in /opt/ibm/apm/agent/logs/xx_asfActivity_*.log, in anentry something like this:1160127123648000 OPLG: Custom metadata file/opt/ibm/apm/agent/lx8266/xx/support/kxx_sda_1.0.1.0000.jar uploadsuccessful to server URL http://9.42.48.183:80/1.0/monitoring/data.Note: On older systems (pre 8.1.3, and maybe pre 8.1.2) this message will
appear in the agent log instead of the asfActivity log.4. Has a subscription file for the agent been downloaded? Look
for /opt/ibm/apm/agent/localconfig/xx/xx_asfSubscription.xml. Note that we have often seen it take 15minutes after the agent uploads the SDA jar before the subscription file shows up.
5. Is the agent sending data? Look for <ENVELOPE> messagesin /opt/ibm/apm/agent/logs/xx_asfActivity_*.log.
6. If so, does it include the tables needed for OSLC (resource discovery)? Look at the <TABLENAME>tag inside <ENVELOPE> ... </ENVELOPE>.
7. If so, do the <ENVELOPE> messages actually contain data? For example, this shows that the agentis sending no data - the ROWCOUNT is 0:1160210073536000 SEND: <ENVELOPE><SUBSCRIBER>K77_defaultSubscription</SUBSCRIBER><REPORTDATA><WRITETIME>1160210073536000</WRITETIME><TMZDIFF>18000</TMZDIFF><SQLTABLE><TABLENAME>K77SEATS</TABLENAME><COLUMNS><NAME>ORIGINNODE</NAME><NAME>DAYS_UNTIL</NAME><NAME>EXPIRE_AT</NAME><NAME>KIND</NAME><NAME>SEATS</NAME><NAME>SEATS_AVAI</NAME><NAME>SEATS_USED</NAME><NAME>TIMESTAMP</NAME></COLUMNS><ROWCOUNT>0</ROWCOUNT></SQLTABLE></REPORTDATA></ENVELOPE>This likely indicates a problem with your data collection, so you need to debug the agent itself.
Also - are you using APM Cloud or On Premises?
We have created and installed two custom agents in our environment and facing the same issue for these two agents.
Below are the answers for your questions.
1. Make sure the agent installed properly and did not give errors at installation time.
The agent was installed properly and didn't have any errors
2. Is the agent running?
Yes, the agent is running. Below is the agent status[root@INHUSZ1-apmagents bin]# ./locator-agent.sh statusAgent is running. Process ID is 17486
3. Did the agent upload metadata?In the agent logfile we have the following entry only
1160405212750790KRACA001 Custom metadata file</opt/ibm/apm/agent/lx8266/07/support/k07_sda_1.0.0.0000.jar> size 73247 defined
We don't have "1160127123648000 OPLG: Custom metadata file/opt/ibm/apm/agent/lx8266/xx/support/kxx_sda_1.0.1.0000.jar upload successful to server URLhttp://9.42.48.183:80/1.0/monitoring/data"
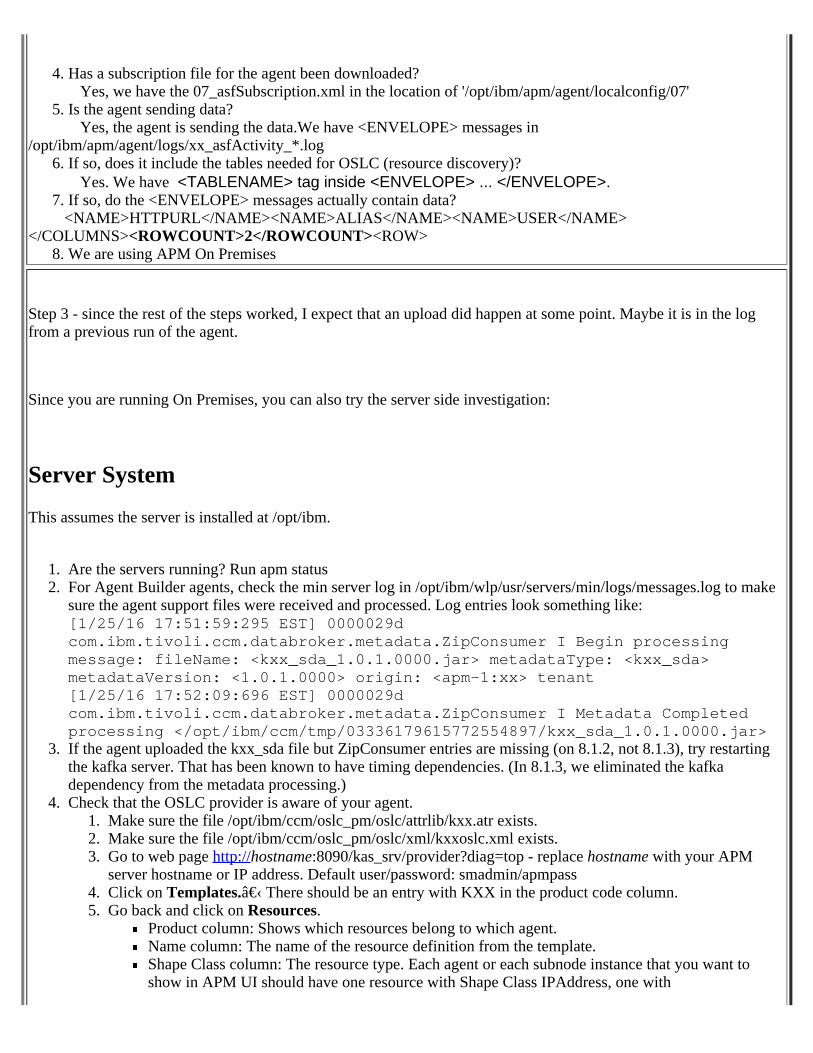
4. Has a subscription file for the agent been downloaded?Yes, we have the 07_asfSubscription.xml in the location of '/opt/ibm/apm/agent/localconfig/07'
5. Is the agent sending data?Yes, the agent is sending the data.We have <ENVELOPE> messages in
/opt/ibm/apm/agent/logs/xx_asfActivity_*.log6. If so, does it include the tables needed for OSLC (resource discovery)?
Yes. We have <TABLENAME> tag inside <ENVELOPE> ... </ENVELOPE>.7. If so, do the <ENVELOPE> messages actually contain data?
<NAME>HTTPURL</NAME><NAME>ALIAS</NAME><NAME>USER</NAME></COLUMNS><ROWCOUNT>2</ROWCOUNT><ROW>
8. We are using APM On Premises
Step 3 - since the rest of the steps worked, I expect that an upload did happen at some point. Maybe it is in the log from a previous run of the agent.
Since you are running On Premises, you can also try the server side investigation:
Server System
This assumes the server is installed at /opt/ibm.
1. Are the servers running? Run apm status2. For Agent Builder agents, check the min server log in /opt/ibm/wlp/usr/servers/min/logs/messages.log to make
sure the agent support files were received and processed. Log entries look something like:[1/25/16 17:51:59:295 EST] 0000029dcom.ibm.tivoli.ccm.databroker.metadata.ZipConsumer I Begin processingmessage: fileName: <kxx_sda_1.0.1.0000.jar> metadataType: <kxx_sda>metadataVersion: <1.0.1.0000> origin: <apm-1:xx> tenant[1/25/16 17:52:09:696 EST] 0000029dcom.ibm.tivoli.ccm.databroker.metadata.ZipConsumer I Metadata Completedprocessing </opt/ibm/ccm/tmp/03336179615772554897/kxx_sda_1.0.1.0000.jar>
3. If the agent uploaded the kxx_sda file but ZipConsumer entries are missing (on 8.1.2, not 8.1.3), try restartingthe kafka server. That has been known to have timing dependencies. (In 8.1.3, we eliminated the kafkadependency from the metadata processing.)
4. Check that the OSLC provider is aware of your agent.1. Make sure the file /opt/ibm/ccm/oslc_pm/oslc/attrlib/kxx.atr exists.2. Make sure the file /opt/ibm/ccm/oslc_pm/oslc/xml/kxxoslc.xml exists.3. Go to web page http://hostname:8090/kas_srv/provider?diag=top - replace hostname with your APM
server hostname or IP address. Default user/password: smadmin/apmpass4. Click on Templates.​ There should be an entry with KXX in the product code column.5. Go back and click on Resources.
Product column: Shows which resources belong to which agent.Name column: The name of the resource definition from the template.Shape Class column: The resource type. Each agent or each subnode instance that you want toshow in APM UI should have one resource with Shape Class IPAddress, one with
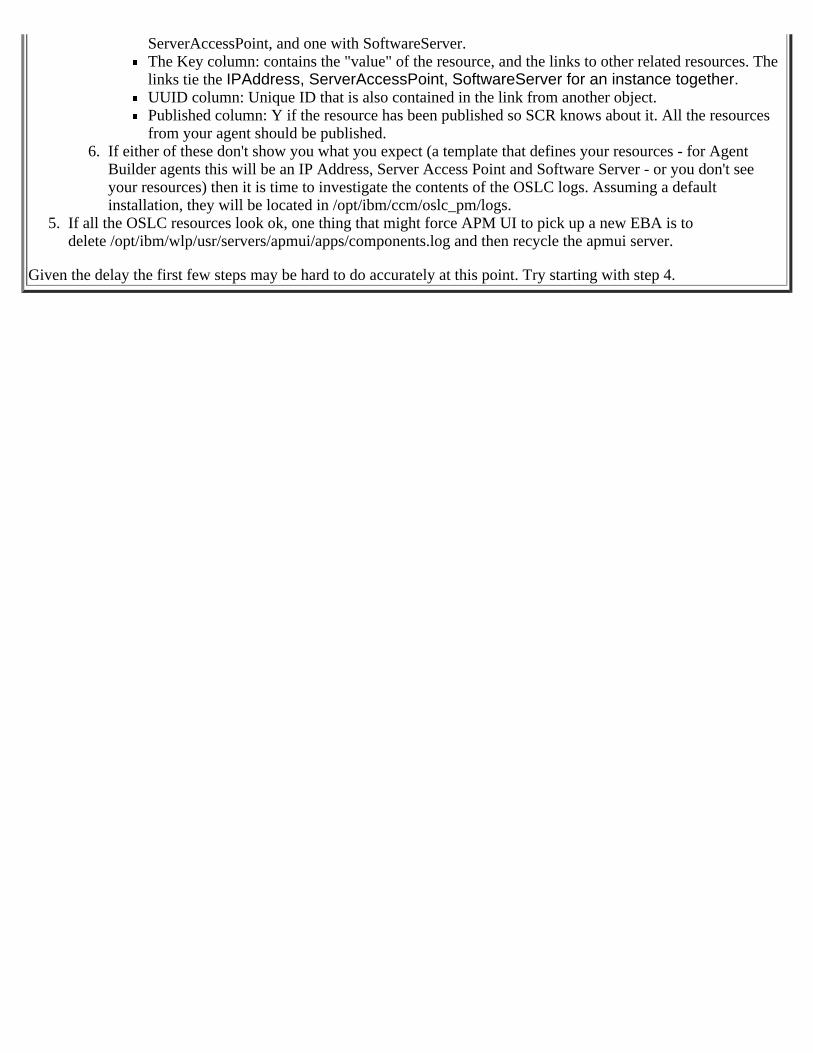
ServerAccessPoint, and one with SoftwareServer.The Key column: contains the "value" of the resource, and the links to other related resources. Thelinks tie the IPAddress, ServerAccessPoint, SoftwareServer for an instance together.UUID column: Unique ID that is also contained in the link from another object.Published column: Y if the resource has been published so SCR knows about it. All the resourcesfrom your agent should be published.
6. If either of these don't show you what you expect (a template that defines your resources - for AgentBuilder agents this will be an IP Address, Server Access Point and Software Server - or you don't seeyour resources) then it is time to investigate the contents of the OSLC logs. Assuming a defaultinstallation, they will be located in /opt/ibm/ccm/oslc_pm/logs.
5. If all the OSLC resources look ok, one thing that might force APM UI to pick up a new EBA is todelete /opt/ibm/wlp/usr/servers/apmui/apps/components.log and then recycle the apmui server.
Given the delay the first few steps may be hard to do accurately at this point. Try starting with step 4.

Troubleshooting - some data missing for TivoliMonitoring agentsProblem: Some data missing for Tivoli Monitoring agents when montoring a large number of agents
Symptom: If you use the Hybrid Gateway to view information from a large amount of Tivoli Monitoring gaents (over 400), some metric samples posted by the agent (every 5 minutes) might be skipped. This results in missing metric samples from the hybrid agents that can manifest as "No data available" messages in the Applicaton Performance Dashboards, or missing data points in historical displays.
Cause: This problem is caused by a performance issue with certain versions of Tivoli Monitoring.
Solution: Open a PMR against Tivoli Monitoring and request a provisional fix for APAR IV83613 on ITM6.3.0 FP5 or ITM6.3.0 FP6. Install this fix on your Tivoli Enterprise Portal Server.
Troubleshooting: Hadoop agent: Data sets are notdisplayed in the Attribute Details tabSymptom:
On the Performance Management Dashboard, the Attributes Details tab displays values only for theClusterOverview and Hosts nodes data sets. The other data sets and their values are not displayed.
Solution:
A solution is currently not available.
Troubleshooting: Hadoop agent: The data source typefor the Hadoop agent is displayed as Hadoop HostsSymptom:
In the Threshold Manager, the data source type is displayed as Hadoop Hosts for the Hadoop agent. All the predefinedeventing thresholds of the Hadoop agent are associated with Hadoop Hosts.
Solution:
To create a custom eventing threshold for monitoring Hadoop nodes, you must select Hadoop Hosts as thedata source type.
Remember: For earlier versions of Hadoop agent, the data source type is displayed as Hosts instead of Hadoop Hosts.In such cases, select the data source type as Hosts to create a custom eventing threshold.
Troubleshooting - some or all Tivoli Monitoring agentsnot available for adding to applicationsProblem: you have configured the Hybrid Gateway and added monitored systems to the Managed System Group for the Hybrid Gateway. However, you can not add some or all of the agents in this group to applications. The agents are not available for selection.
Cause: The version of the Tivoli Enterprise Portal Server is old.
Solution: Update the Tivoli Enterprise Portal Server to version 6.3.2.5 (6.3.2 Fix Pack 5). This version is a prerequisite for the Hybrid Gateway.
For more information about installing the Hybrid Gateway,see http://www.ibm.com/support/knowledgecenter/SSMKFH/com.ibm.apmaas.doc/install/integ_hybridgateway_install.htm
Troubleshooting - SAP agent: On SAP NetWeaver 7.0with SAP Basis version 700, import of transport fails,and an ABAP dump is generatedSymptom:
On SAP NetWeaver 7.0 with SAP Basis version 700, import of transport fails, and an ABAP dump is generated withthe following error message:"DDIC_TYPELENG_INCONSISTENT" having short text as "Inconsistency in length of DDIC data type"SWNCGLAGGUSERTCODE"."
Solution:
Complete the steps that are provided in SAP note 1610716 - Correcting runtime objects with the wrong alignment.
Troubleshooting - No data displayed for a TivoliMonitoring agentSymptom: Metric data from a Tivoli Monitoring agent is not displayed in Performance Management dashboards. "No data available" messages might be present in the dashboard widgets.
Diagnosis: The Hybrid Gateway message log files contain the following error message:
'KFWITM217E Request error: SQL1_CreateRequest failed, rc=202'
The message log files are located in the following directory on the machine where the Hybrid Gateway (HG)component is installed:
<HG_installation_root_dir>/wlp/usr/servers/hybridgateway/logs
Cause: The agent connects to a Tivoli Enterprise Monitoring Server. This Monitoring Server (Hub or remote)contains catalog files (*.cat) for an older version of the agent while a newer version of the agent is used. If the metricquery specified by the Hybrid Gateway includes at least one attribute that is not defined in the catalog files for thatagent, the query fails, and an rc=202 error message will be recorded in the Hybrid Gateway message log. Because thequery fails, data from the agent is not available in Performance Management.
Solution:1) Locate the Monitoring Servers associated with the agents for which the problem exists. The rc=202 error isreported in the Hybrd Gateway messages logs for these agents.2) Install the application support files for the most recent version of the agents on the Monitoring Servers. Forinstructions about installing application support files, see:http://www.ibm.com/support/knowledgecenter/SSTFXA_6.3.0.2/com.ibm.itm.doc_6.3fp2/install/agent_support.htm
Troubleshooting: Hadoop agent: Additional eventingthresholds are displayed after upgrading the agentsupportSymptom:
When you upgrade the Hadoop agent support from V8.1.2 to V8.1.2.1, the Events tab displays six additional eventingthresholds of the 8.1.2.1 release along with the eventing thresholds (File System Critical and Queue Critical) of the8.1.2 release.
Cause:
All these eventing thresholds are derived from the same attributes that are used by the File System Critical and QueueCritical eventing thresholds. Therefore, after you upgrade the agent support, the Events tab displays the alreadytriggered eventing thresholds of the 8.1.2 release and the newly triggered eventing thresholds of the 8.1.2.1 release.
Solution:
A solution is currently not available.
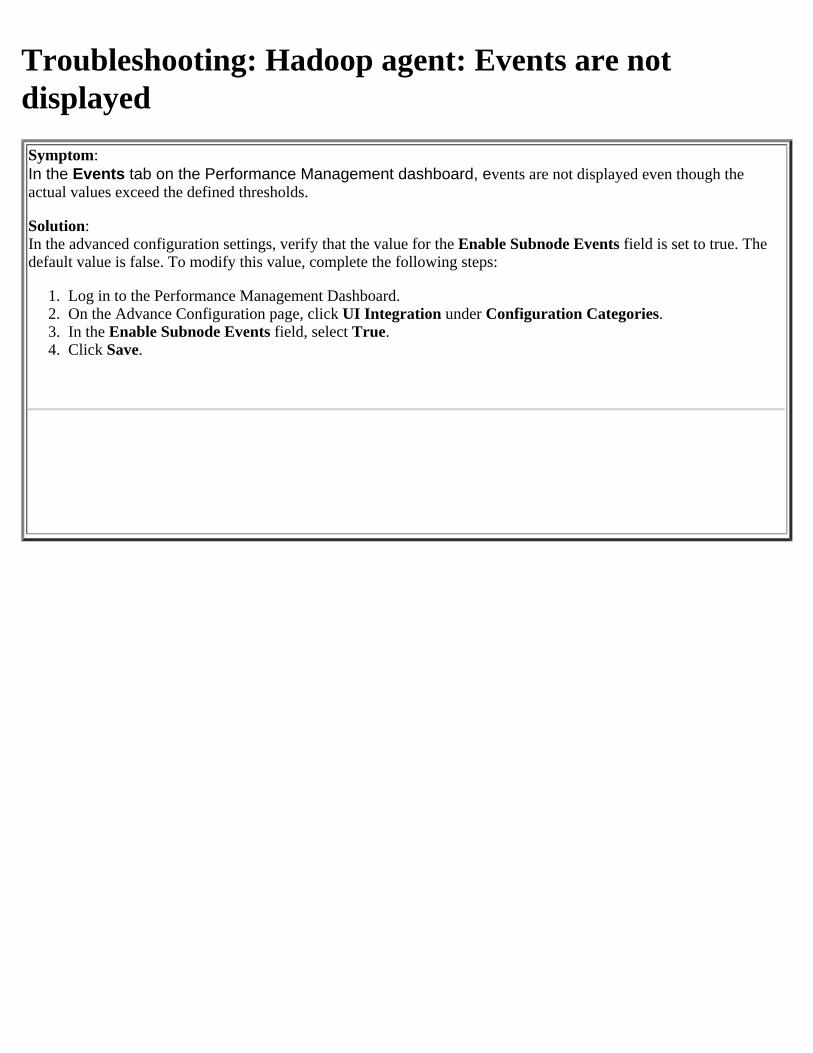
Troubleshooting: Hadoop agent: Events are notdisplayedSymptom: In the Events tab on the Performance Management dashboard, events are not displayed even though theactual values exceed the defined thresholds.
Solution: In the advanced configuration settings, verify that the value for the Enable Subnode Events field is set to true. Thedefault value is false. To modify this value, complete the following steps:
1. Log in to the Performance Management Dashboard.2. On the Advance Configuration page, click UI Integration under Configuration Categories.3. In the Enable Subnode Events field, select True.4. Click Save.

Troubleshooting - Diagnostic data not displayed for aBluemux applicationProblem: When monitoring an application in a Bluemix environment using your on-premies performance Management server, you attempt to drill-down from the summary widget using the Diagnose button and see no diagnostic data.
Solution: Use the Application navigation menu, located in the left-hand part of the window, to navigate to the individual application widget. For example, select the application My Components> Bluemix NodeJS applications > BI agent, or My Components > Ruby applications > BI agent.
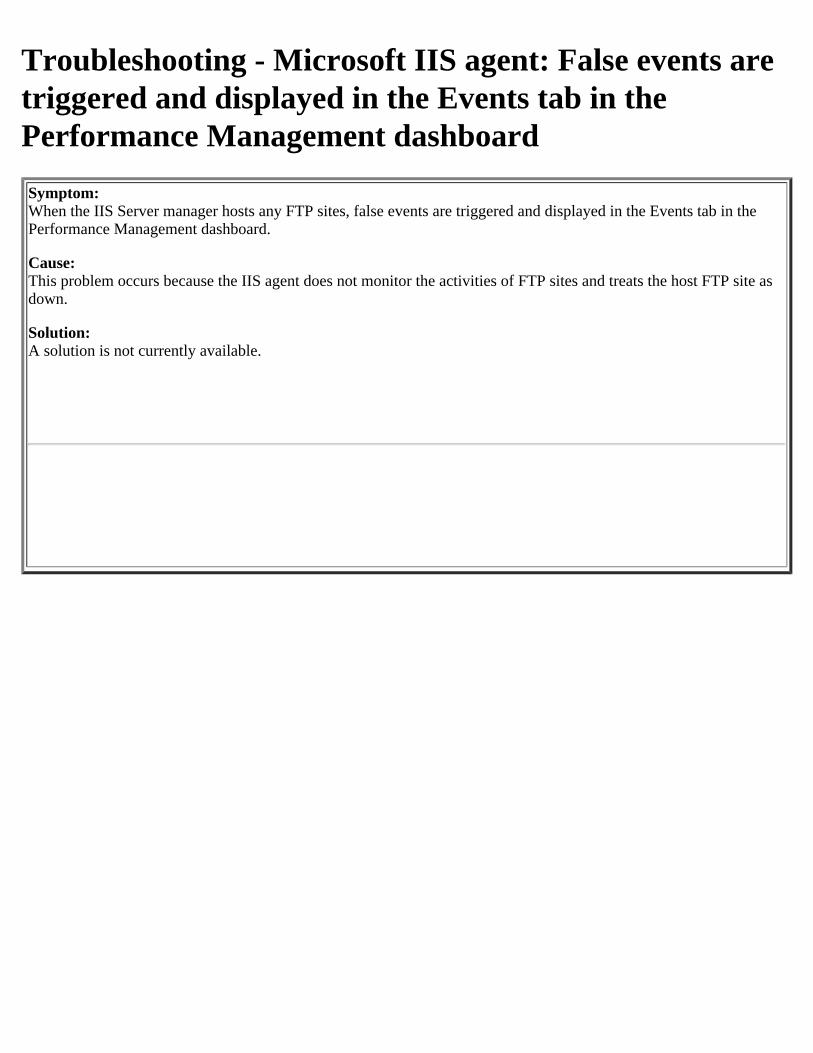
Troubleshooting - Microsoft IIS agent: False events aretriggered and displayed in the Events tab in thePerformance Management dashboardSymptom:When the IIS Server manager hosts any FTP sites, false events are triggered and displayed in the Events tab in thePerformance Management dashboard.
Cause:This problem occurs because the IIS agent does not monitor the activities of FTP sites and treats the host FTP site asdown.
Solution:A solution is not currently available.
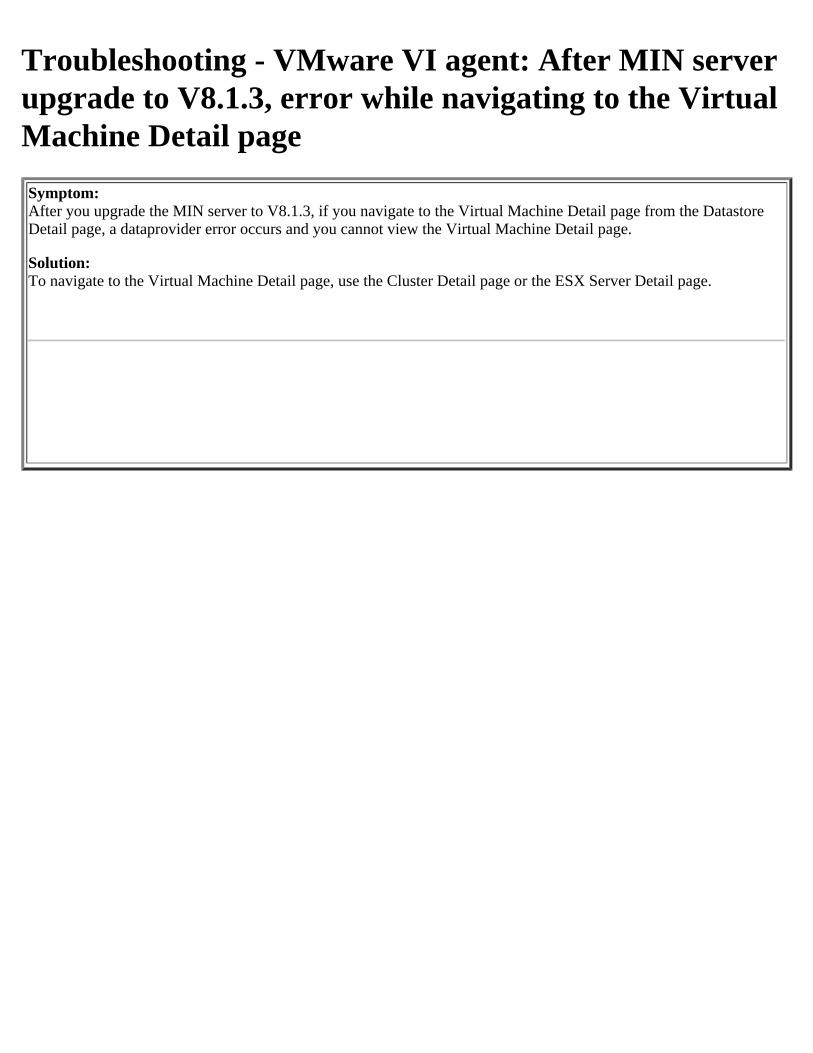
Troubleshooting - VMware VI agent: After MIN serverupgrade to V8.1.3, error while navigating to the VirtualMachine Detail pageSymptom:After you upgrade the MIN server to V8.1.3, if you navigate to the Virtual Machine Detail page from the DatastoreDetail page, a dataprovider error occurs and you cannot view the Virtual Machine Detail page.
Solution:To navigate to the Virtual Machine Detail page, use the Cluster Detail page or the ESX Server Detail page.

Troubleshooting: Viewing triggered events for the logfile agent (on Cloud)Problem: Subnode events are not showing in the Events tab for a selected main node.Solution: To view the triggered events in the Events tab, for Log File agent event monitoring, contact IBM Support and request the on Cloud System Administrator to resolve this issue.

Troubleshooting: Querying a log file configurationProblem: When you query a log file configuration, the OS agent shows an additional row in the monitored logs . This row does not include any information about the file name and it shows the file type as UNKNOWN. The row that is shown is correct as it actually shows the pattern that was entered by the user and whether or not this pattern matched any files.Solution: This is a known issue.
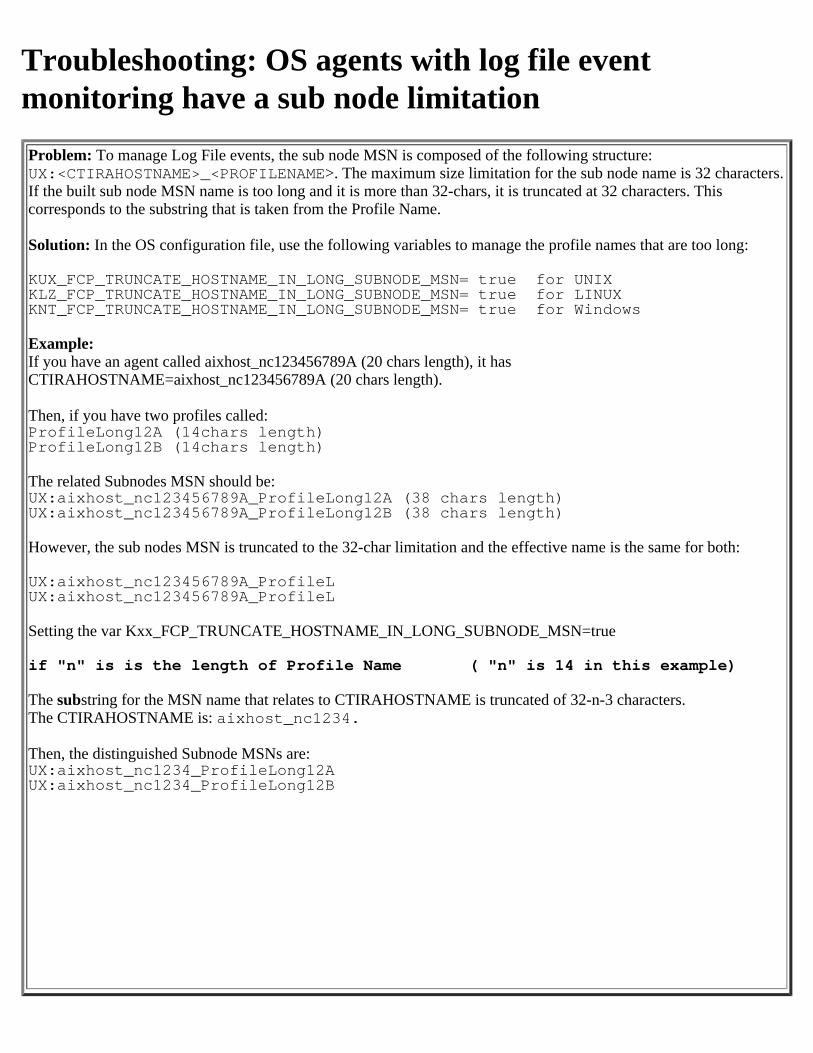
Troubleshooting: OS agents with log file eventmonitoring have a sub node limitationProblem: To manage Log File events, the sub node MSN is composed of the following structure:UX:<CTIRAHOSTNAME>_<PROFILENAME>. The maximum size limitation for the sub node name is 32 characters.If the built sub node MSN name is too long and it is more than 32-chars, it is truncated at 32 characters. Thiscorresponds to the substring that is taken from the Profile Name.
Solution: In the OS configuration file, use the following variables to manage the profile names that are too long:
KUX_FCP_TRUNCATE_HOSTNAME_IN_LONG_SUBNODE_MSN= true for UNIXKLZ_FCP_TRUNCATE_HOSTNAME_IN_LONG_SUBNODE_MSN= true for LINUXKNT_FCP_TRUNCATE_HOSTNAME_IN_LONG_SUBNODE_MSN= true for Windows
Example:If you have an agent called aixhost_nc123456789A (20 chars length), it hasCTIRAHOSTNAME=aixhost_nc123456789A (20 chars length).
Then, if you have two profiles called:ProfileLong12A (14chars length)ProfileLong12B (14chars length)
The related Subnodes MSN should be:UX:aixhost_nc123456789A_ProfileLong12A (38 chars length)UX:aixhost_nc123456789A_ProfileLong12B (38 chars length)
However, the sub nodes MSN is truncated to the 32-char limitation and the effective name is the same for both:
UX:aixhost_nc123456789A_ProfileLUX:aixhost_nc123456789A_ProfileL
Setting the var Kxx_FCP_TRUNCATE_HOSTNAME_IN_LONG_SUBNODE_MSN=true
if "n" is is the length of Profile Name ( "n" is 14 in this example)
The substring for the MSN name that relates to CTIRAHOSTNAME is truncated of 32-n-3 characters.The CTIRAHOSTNAME is: aixhost_nc1234.
Then, the distinguished Subnode MSNs are:UX:aixhost_nc1234_ProfileLong12AUX:aixhost_nc1234_ProfileLong12B
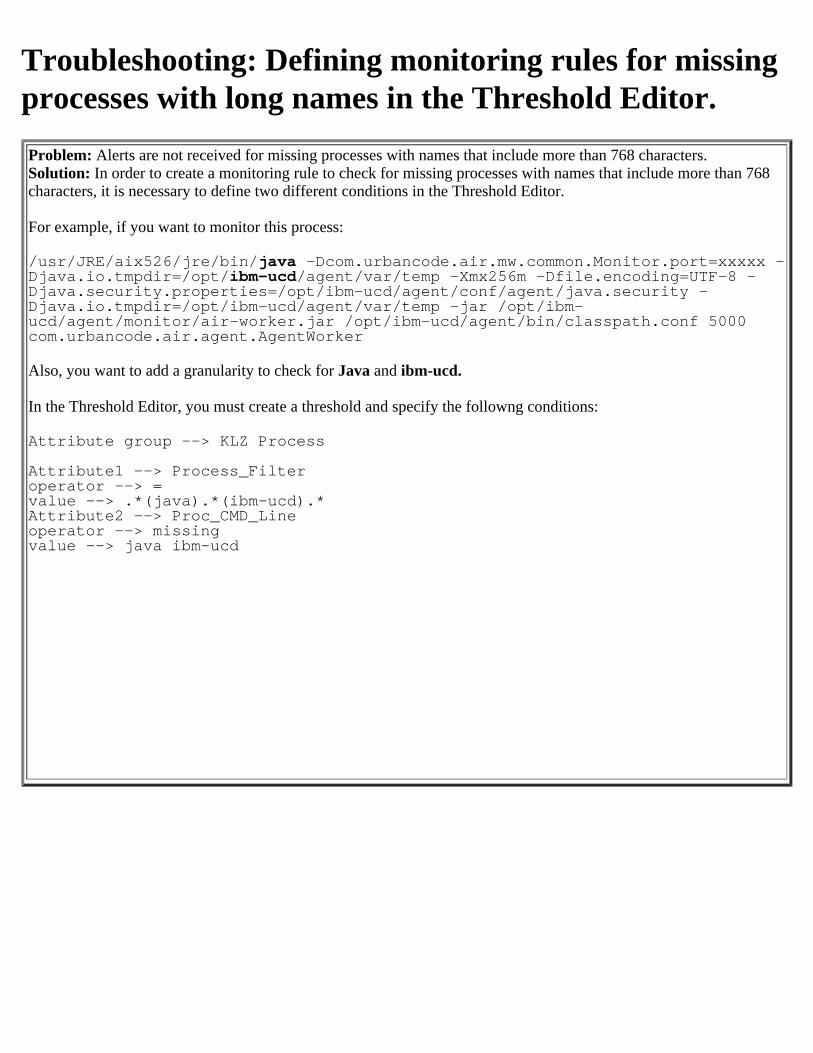
Troubleshooting: Defining monitoring rules for missingprocesses with long names in the Threshold Editor.Problem: Alerts are not received for missing processes with names that include more than 768 characters.Solution: In order to create a monitoring rule to check for missing processes with names that include more than 768characters, it is necessary to define two different conditions in the Threshold Editor.
For example, if you want to monitor this process:
/usr/JRE/aix526/jre/bin/java -Dcom.urbancode.air.mw.common.Monitor.port=xxxxx -ibm-ucdDjava.io.tmpdir=/opt/ /agent/var/temp -Xmx256m -Dfile.encoding=UTF-8 -
Djava.security.properties=/opt/ibm-ucd/agent/conf/agent/java.security -Djava.io.tmpdir=/opt/ibm-ucd/agent/var/temp -jar /opt/ibm-ucd/agent/monitor/air-worker.jar /opt/ibm-ucd/agent/bin/classpath.conf 5000 com.urbancode.air.agent.AgentWorker
Also, you want to add a granularity to check for Java and ibm-ucd.
In the Threshold Editor, you must create a threshold and specify the followng conditions:
Attribute group --> KLZ Process
Attribute1 --> Process_Filteroperator --> =value --> .*(java).*(ibm-ucd).*Attribute2 --> Proc_CMD_Lineoperator --> missingvalue --> java ibm-ucd
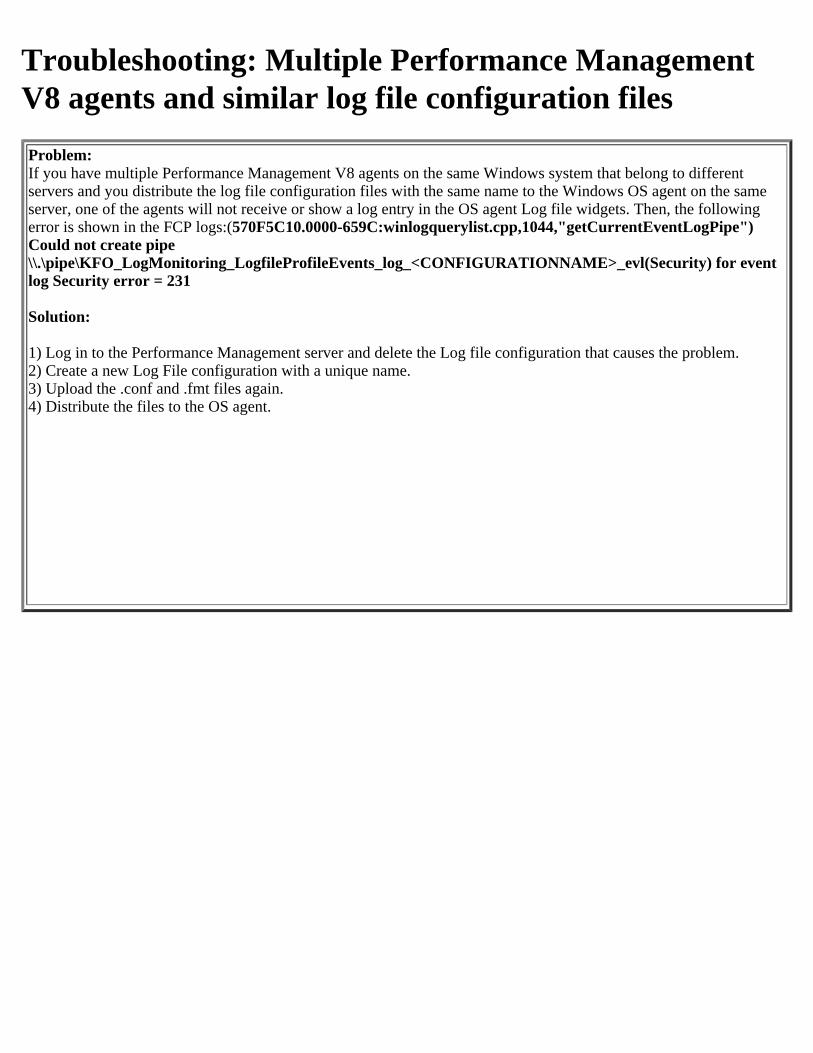
Troubleshooting: Multiple Performance ManagementV8 agents and similar log file configuration filesProblem:If you have multiple Performance Management V8 agents on the same Windows system that belong to differentservers and you distribute the log file configuration files with the same name to the Windows OS agent on the sameserver, one of the agents will not receive or show a log entry in the OS agent Log file widgets. Then, the followingerror is shown in the FCP logs:(570F5C10.0000-659C:winlogquerylist.cpp,1044,"getCurrentEventLogPipe")Could not create pipe\\.\pipe\KFO_LogMonitoring_LogfileProfileEvents_log_<CONFIGURATIONNAME>_evl(Security) for eventlog Security error = 231
Solution:
1) Log in to the Performance Management server and delete the Log file configuration that causes the problem.2) Create a new Log File configuration with a unique name.3) Upload the .conf and .fmt files again.4) Distribute the files to the OS agent.
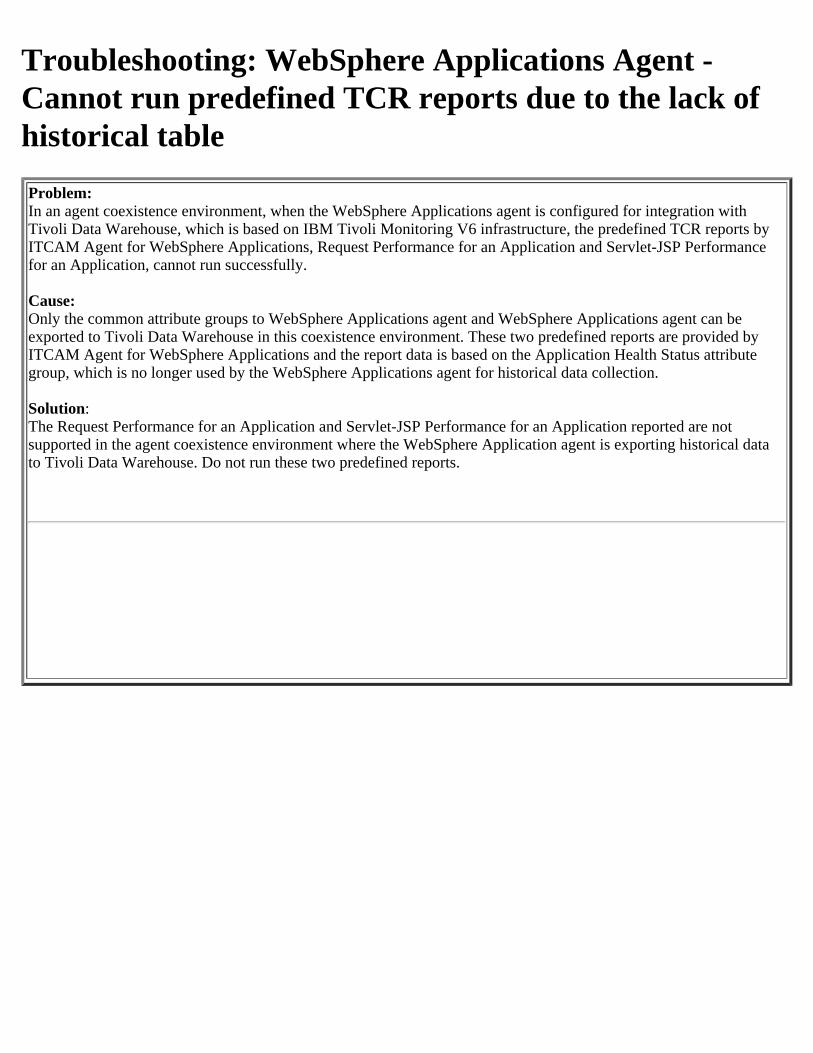
Troubleshooting: WebSphere Applications Agent -Cannot run predefined TCR reports due to the lack ofhistorical tableProblem:In an agent coexistence environment, when the WebSphere Applications agent is configured for integration withTivoli Data Warehouse, which is based on IBM Tivoli Monitoring V6 infrastructure, the predefined TCR reports byITCAM Agent for WebSphere Applications, Request Performance for an Application and Servlet-JSP Performancefor an Application, cannot run successfully.
Cause:Only the common attribute groups to WebSphere Applications agent and WebSphere Applications agent can beexported to Tivoli Data Warehouse in this coexistence environment. These two predefined reports are provided byITCAM Agent for WebSphere Applications and the report data is based on the Application Health Status attributegroup, which is no longer used by the WebSphere Applications agent for historical data collection.
Solution:The Request Performance for an Application and Servlet-JSP Performance for an Application reported are notsupported in the agent coexistence environment where the WebSphere Application agent is exporting historical datato Tivoli Data Warehouse. Do not run these two predefined reports.
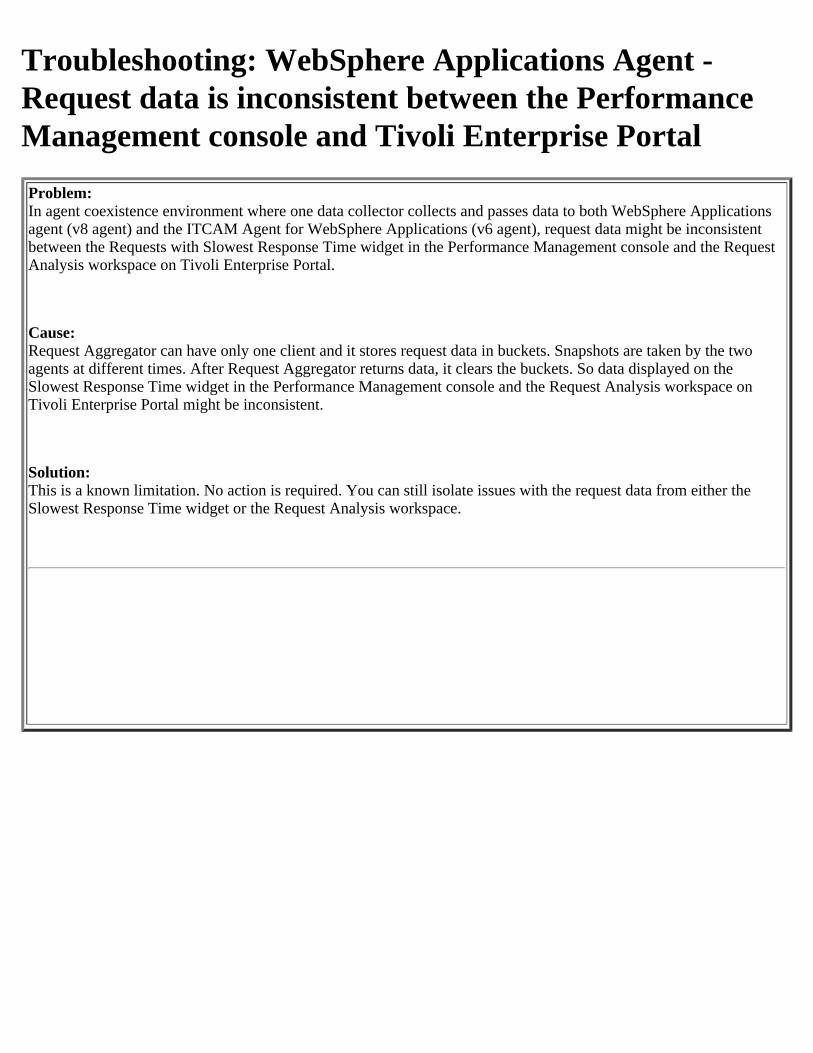
Troubleshooting: WebSphere Applications Agent -Request data is inconsistent between the PerformanceManagement console and Tivoli Enterprise PortalProblem:In agent coexistence environment where one data collector collects and passes data to both WebSphere Applicationsagent (v8 agent) and the ITCAM Agent for WebSphere Applications (v6 agent), request data might be inconsistentbetween the Requests with Slowest Response Time widget in the Performance Management console and the RequestAnalysis workspace on Tivoli Enterprise Portal.
Cause:Request Aggregator can have only one client and it stores request data in buckets. Snapshots are taken by the twoagents at different times. After Request Aggregator returns data, it clears the buckets. So data displayed on theSlowest Response Time widget in the Performance Management console and the Request Analysis workspace onTivoli Enterprise Portal might be inconsistent.
Solution:This is a known limitation. No action is required. You can still isolate issues with the request data from either theSlowest Response Time widget or the Request Analysis workspace.
Troubleshooting: WebSphere MQ Agent - Cannot runpredefined TCR reports due to the lack of historicaldataProblem:In an agent coexistence environment where both WebSphere MQ agent (v8 agent) and ITCAM Agent for WebSphereMQ (v6 agent) exist, the predefined TCR reports, Queue Full Report Detail and Top n Queue Full, cannot runsuccessfully for the WebSphere MQ agent (v8 agent).
Cause:The data sets that provide data for the Queue Full Report Detail and Top n Queue Full reports are not used byWebSphere MQ agent (v8 agent). So the WebSphere MQ agent (v8 agent) never collects data for these two reports.
Solution:The Queue Full Report Detail and Top n Queue Full reports are not applicable to the WebSphere MQ agent (v8agent). Do not run these two predefined reports against WebSphere MQ agent (v8 agent).
If you encounter this problem with the ITCAM Agent for WebSphere MQ (v6 agent), it might because historical datacollection is not enabled for the related data sets. So there are no historical data stored in Tivoli Data Warehouse togenerate the reports. To enable the historical data collection for these reports, use the PERFORM STARTMONstatement in the mq.cfg file by setting HISTORY parameter value to YES.
Troubleshooting - WebSphere MQ Agent: Two sets ofpredefined event thresholds exist after agent upgradeProblem:Two sets of event thresholds are available after agent upgrade. One set has the prefix of MQSeries, and the other hasthe prefix of MQ.
Cause:In Performance Management V8.1.3 (agent version is 7.3.0.4), all predefined event thresholds of WebSphere MQagent have changed the prefix from MQSeries to MQ. After agent upgrade, the previous set of event thresholds withthe prefix of MQSeries are still visible in the Threshold Manager.
Solution:After agent upgrade, use the event thresholds with the prefix of MQ. Predefined event thresholds with the prefix ofMQSeries are deprecated.
Troubleshooting - WebSphere MQ agent: Cannotdiscover WebSphere MQ 64-bit library pathProblem:
When the WebSphere MQ agent starts, the following message is displayed:
WebSphere MQ 64-bit library path can't be discovered.
Cause:
Some libraries of IBM MQ (WebSphere MQ) are required by the WebSphere MQ agent. The WebSphere MQ agentusually can automatically discover the 64-bit library path the IBM MQ (WebSphere MQ) that are installed on thesystem. This message is displays in the following circumstances:
No appropriate library path of IBM MQ (WebSphere MQ) is discovered by the WebSphere MQ agent.During agent configuration, user did not use the default value for the library path, which is automaticallydiscovered by the agent. Instead, user manually specified a library path to use. However, the specified path doesnot work for the WebSphere MQ agent.
Solution:Configure the agent again to provide the correct 64-bit library path of IBM MQ (WebSphere MQ) to use by the agent.For instructions about how to configure the agent, see IBM Performance Management Knowledge Center.
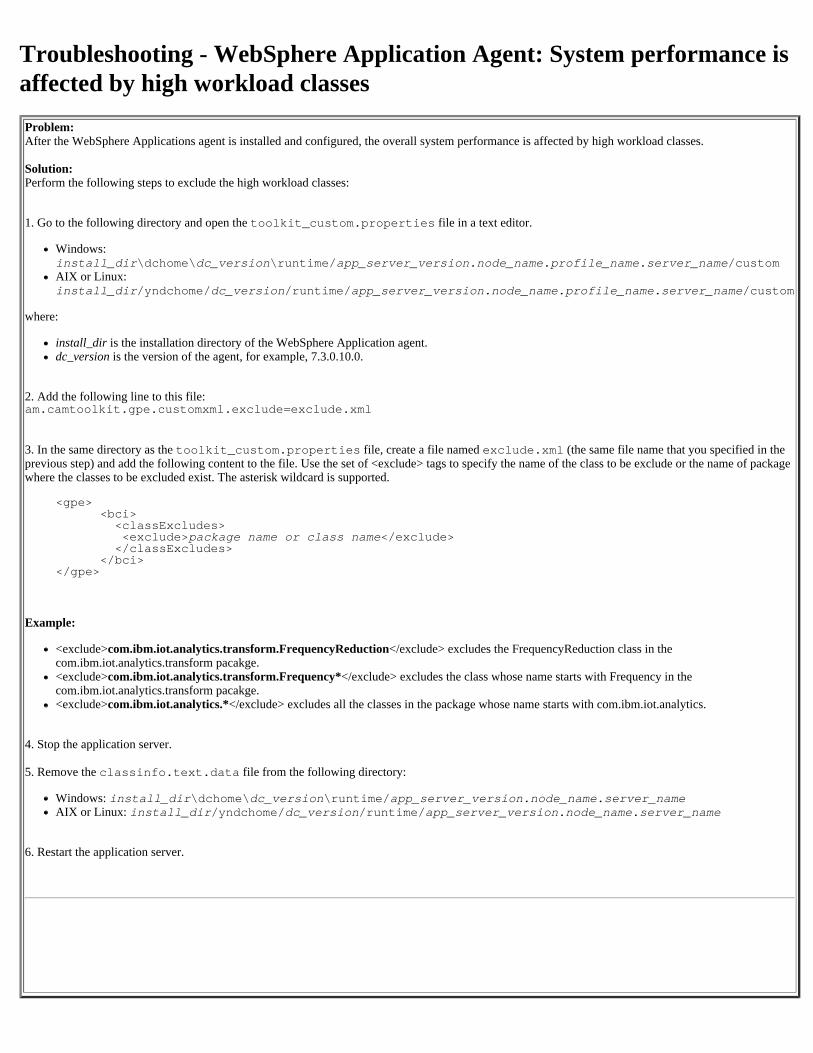
Troubleshooting - WebSphere Application Agent: System performance isaffected by high workload classesProblem:After the WebSphere Applications agent is installed and configured, the overall system performance is affected by high workload classes.
Solution:Perform the following steps to exclude the high workload classes:
1. Go to the following directory and open the toolkit_custom.properties file in a text editor.
Windows:install_dir\dchome\dc_version\runtime/app_server_version.node_name.profile_name.server_name/customAIX or Linux:install_dir/yndchome/dc_version/runtime/app_server_version.node_name.profile_name.server_name/custom
where:
install_dir is the installation directory of the WebSphere Application agent.dc_version is the version of the agent, for example, 7.3.0.10.0.
2. Add the following line to this file:am.camtoolkit.gpe.customxml.exclude=exclude.xml
3. In the same directory as the toolkit_custom.properties file, create a file named exclude.xml (the same file name that you specified in theprevious step) and add the following content to the file. Use the set of <exclude> tags to specify the name of the class to be exclude or the name of packagewhere the classes to be excluded exist. The asterisk wildcard is supported.
<gpe> <bci>
<classExcludes> <exclude>package name or class name</exclude> </classExcludes>
</bci></gpe>
Example:
<exclude>com.ibm.iot.analytics.transform.FrequencyReduction</exclude> excludes the FrequencyReduction class in thecom.ibm.iot.analytics.transform pacakge.<exclude>com.ibm.iot.analytics.transform.Frequency*</exclude> excludes the class whose name starts with Frequency in thecom.ibm.iot.analytics.transform pacakge.<exclude>com.ibm.iot.analytics.*</exclude> excludes all the classes in the package whose name starts with com.ibm.iot.analytics.
4. Stop the application server.
5. Remove the classinfo.text.data file from the following directory:
Windows: install_dir\dchome\dc_version\runtime/app_server_version.node_name.server_nameAIX or Linux: install_dir/yndchome/dc_version/runtime/app_server_version.node_name.server_name
6. Restart the application server.
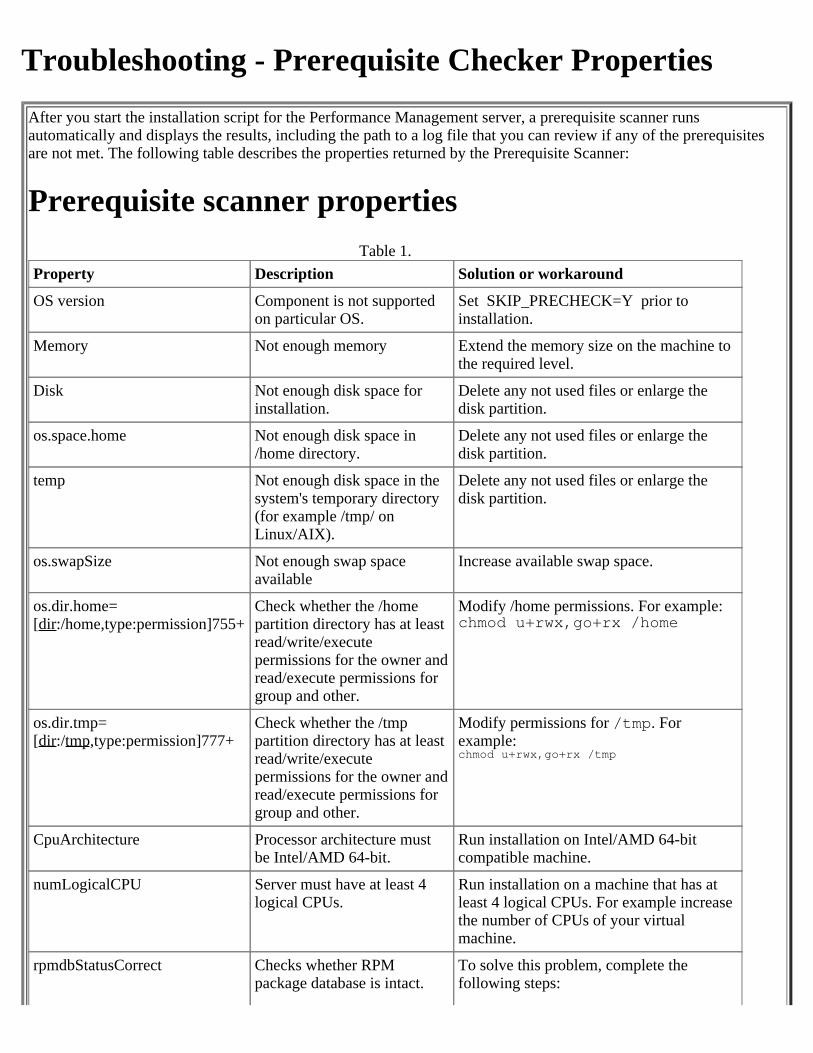
Troubleshooting - Prerequisite Checker PropertiesAfter you start the installation script for the Performance Management server, a prerequisite scanner runsautomatically and displays the results, including the path to a log file that you can review if any of the prerequisitesare not met. The following table describes the properties returned by the Prerequisite Scanner:
Prerequisite scanner propertiesTable 1.
Property Description Solution or workaround
OS version Component is not supportedon particular OS.
Set SKIP_PRECHECK=Y prior toinstallation.
Memory Not enough memory Extend the memory size on the machine tothe required level.
Disk Not enough disk space forinstallation.
Delete any not used files or enlarge thedisk partition.
os.space.home Not enough disk space in/home directory.
Delete any not used files or enlarge thedisk partition.
temp Not enough disk space in thesystem's temporary directory(for example /tmp/ onLinux/AIX).
Delete any not used files or enlarge thedisk partition.
os.swapSize Not enough swap spaceavailable
Increase available swap space.
os.dir.home=[dir:/home,type:permission]755+
Check whether the /homepartition directory has at leastread/write/executepermissions for the owner andread/execute permissions forgroup and other.
Modify /home permissions. For example:chmod u+rwx,go+rx /home
os.dir.tmp=[dir:/tmp,type:permission]777+
Check whether the /tmppartition directory has at leastread/write/executepermissions for the owner andread/execute permissions forgroup and other.
Modify permissions for /tmp. Forexample:chmod u+rwx,go+rx /tmp
CpuArchitecture Processor architecture mustbe Intel/AMD 64-bit.
Run installation on Intel/AMD 64-bitcompatible machine.
numLogicalCPU Server must have at least 4logical CPUs.
Run installation on a machine that has atleast 4 logical CPUs. For example increasethe number of CPUs of your virtualmachine.
rpmdbStatusCorrect Checks whether RPMpackage database is intact.
To solve this problem, complete thefollowing steps:
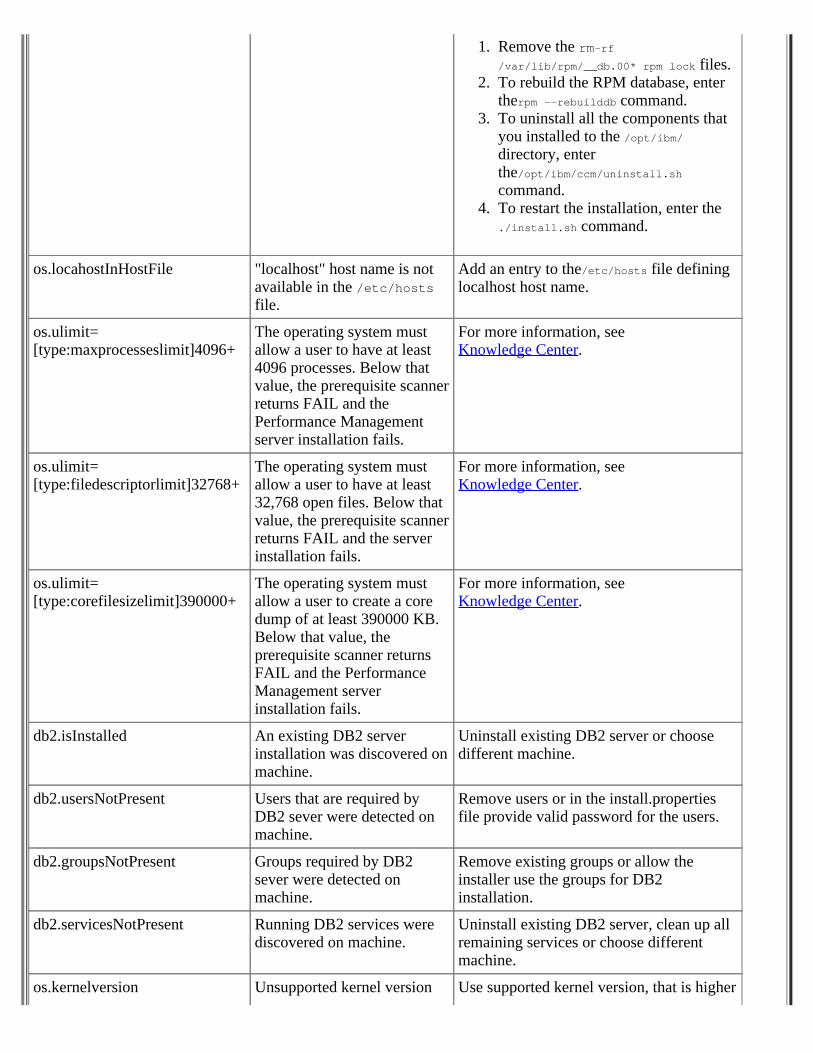
1. Remove the rm-rf/var/lib/rpm/__db.00* rpm lock files.
2. To rebuild the RPM database, entertherpm --rebuilddb command.
3. To uninstall all the components thatyou installed to the /opt/ibm/directory, enterthe/opt/ibm/ccm/uninstall.shcommand.
4. To restart the installation, enter the./install.sh command.
os.locahostInHostFile "localhost" host name is notavailable in the /etc/hostsfile.
Add an entry to the/etc/hosts file defininglocalhost host name.
os.ulimit=[type:maxprocesseslimit]4096+
The operating system mustallow a user to have at least4096 processes. Below thatvalue, the prerequisite scannerreturns FAIL and thePerformance Managementserver installation fails.
For more information, seeKnowledge Center.
os.ulimit=[type:filedescriptorlimit]32768+
The operating system mustallow a user to have at least32,768 open files. Below thatvalue, the prerequisite scannerreturns FAIL and the serverinstallation fails.
For more information, seeKnowledge Center.
os.ulimit=[type:corefilesizelimit]390000+
The operating system mustallow a user to create a coredump of at least 390000 KB.Below that value, theprerequisite scanner returnsFAIL and the PerformanceManagement serverinstallation fails.
For more information, seeKnowledge Center.
db2.isInstalled An existing DB2 serverinstallation was discovered onmachine.
Uninstall existing DB2 server or choosedifferent machine.
db2.usersNotPresent Users that are required byDB2 sever were detected onmachine.
Remove users or in the install.propertiesfile provide valid password for the users.
db2.groupsNotPresent Groups required by DB2sever were detected onmachine.
Remove existing groups or allow theinstaller use the groups for DB2installation.
db2.servicesNotPresent Running DB2 services werediscovered on machine.
Uninstall existing DB2 server, clean up allremaining services or choose differentmachine.
os.kernelversion Unsupported kernel version Use supported kernel version, that is higher
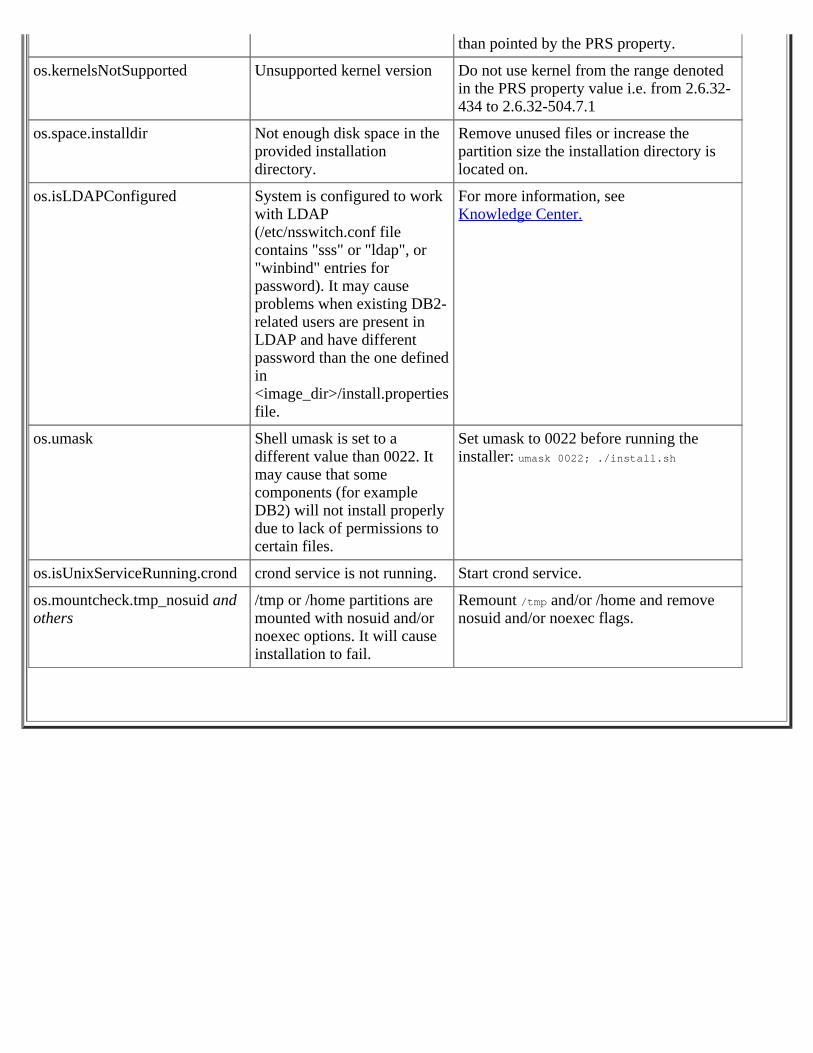
than pointed by the PRS property.
os.kernelsNotSupported Unsupported kernel version Do not use kernel from the range denotedin the PRS property value i.e. from 2.6.32-434 to 2.6.32-504.7.1
os.space.installdir Not enough disk space in theprovided installationdirectory.
Remove unused files or increase thepartition size the installation directory islocated on.
os.isLDAPConfigured System is configured to workwith LDAP(/etc/nsswitch.conf filecontains "sss" or "ldap", or"winbind" entries forpassword). It may causeproblems when existing DB2-related users are present inLDAP and have differentpassword than the one definedin<image_dir>/install.propertiesfile.
For more information, seeKnowledge Center.
os.umask Shell umask is set to adifferent value than 0022. Itmay cause that somecomponents (for exampleDB2) will not install properlydue to lack of permissions tocertain files.
Set umask to 0022 before running theinstaller: umask 0022; ./install.sh
os.isUnixServiceRunning.crond crond service is not running. Start crond service.
os.mountcheck.tmp_nosuid andothers
/tmp or /home partitions aremounted with nosuid and/ornoexec options. It will causeinstallation to fail.
Remount /tmp and/or /home and removenosuid and/or noexec flags.
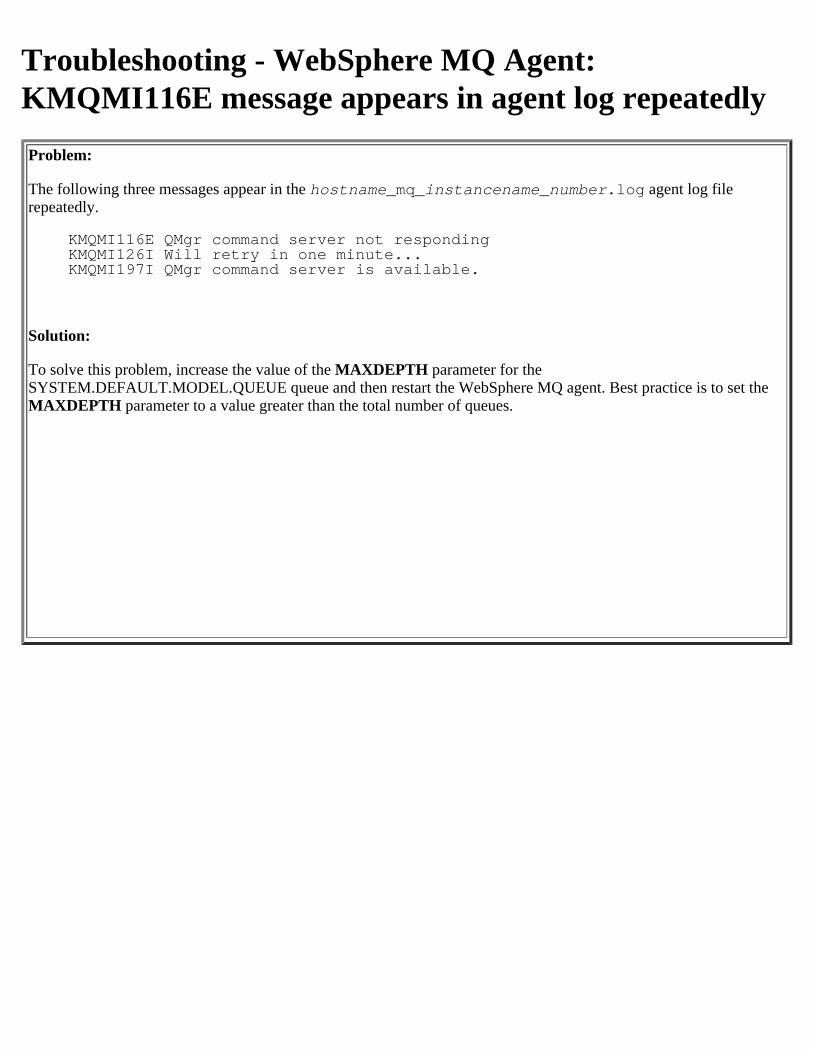
Troubleshooting - WebSphere MQ Agent:KMQMI116E message appears in agent log repeatedlyProblem:
The following three messages appear in the hostname_mq_instancename_number.log agent log filerepeatedly.
KMQMI116E QMgr command server not respondingKMQMI126I Will retry in one minute...KMQMI197I QMgr command server is available.
Solution:
To solve this problem, increase the value of the MAXDEPTH parameter for theSYSTEM.DEFAULT.MODEL.QUEUE queue and then restart the WebSphere MQ agent. Best practice is to set the MAXDEPTH parameter to a value greater than the total number of queues.
Troubleshooting - WebSphere Application Agent: Errormessage "gzip: stdout: Broken pipe" appears duringinstallation
Problem:
When you are installing an agent patch for WebSphere Application agent on an AIX system, the following error message is displayed and logged:
gzip: stdout: Broken pipe
Solution:
No user action is required. This message can be ignored. The installation can complete successfully.
Troubleshooting - Application Performance Dashboardshows Unknown status for Tivoli Monitoring agentsProblem: After applying a maintenance fix and configuring the Hybrid Gateway to send agent data to thePerformance Management console. Open the Application Performance Dashboard and select an application thatincludes the Tivoli Monitoring managed systems, such as "My Components". The status indicators for the TivoliMonitoring managed systems show an Unknown status.
Solution: Restart the Performance Management console with the apm restart apmui command as described inStarting, stopping, and checking the status of server components at http://ibm.biz/kc-ipm-serveradmin.
Troubleshooting - WebSphere Application Agent: Nodata is available on Throughput and Average ResponseTime widgetProblem:
If you are using ITCAM Agent for WebSphere Applications version 7.1 or 7.2 to connect to the PerformanceManagement server with the Hybrid Gateway, the Throughput and Average Response Time widget on the JVMGC dashboard contains no data in the Performance Management console:
Solution:
This is a known limitation of hybrid scenario. The queries used for filtering application names are different betweenthe one used by ITCAM Agent for WebSphere Applications version 7.1 or 7.2 and the one used by the PerformanceManagement console. No data is returned to the Performance Management console when the query of ITCAM Agentfor WebSphere Applications version 7.1 or 7.2 is used. As a result, the Throughput and Average Response Timewidget contains no data in the hybrid environment.
Troubleshooting - WebSphere Applications Agent:Cannot see the WASNotConnected event onPerformance Management consoleProblem:
If you are using ITCAM Agent for WebSphere Applications version 7.1 to connect to the Performance Managementserver with the Hybrid Gateway, the WASNotConnected situation never shows up on the Performance console.
Solution:
This is a known limitation of hybrid scenario. The WASNotConnected situation is not supported by PerformanceManagement console. To check the WASNotConnected situation, you still need to log on to Tivoli Enterprise Portal,which is a component of IBM Tivoli Monitoring.
Troubleshooting - WebSphere Applications Agent:Cannot display Cell Name and Node Name on WASInformation widgetProblem:
If you are using ITCAM Agent for WebSphere Applications version 7.1 to connect to the Performance Managementserver with the Hybrid Gateway, the ITCAM Agent for WebSphere Applications cannot provide the cell name andnode name of WebSphere Application Server node group on the WAS Information widget. Those columns are emptyon the APM UI.
Solution:
This is a known limitation of hybrid scenario. The Cell name and Node name KPIs that are used and displayed onPerformance Management console were added after ITCAM Agent for WebSphere Applications version 7.1 wasreleased. So the old quires used by ITCAM Agent for WebSphere Applications version 7.1 cannot return theappropriate values that can be displayed on the APM UI.
Troubleshooting - WebSphere Applications agent:JDBC or EJB requests are missing from the diagnosticdashboardsSymptom:Fewer JDBC or EJB requests might be displayed in the Diagnostics dashboards than expected. Inthe Request Sequence group widget, you might find that sub-requests for requests of type JDBCor EJB are missing from the method tree.Cause:In previous releases of the WebSphere Applications agent, diagnostics data included all JDBC andEJB requests, regardless of whether the request was good, bad, fast, or slow. To avoidperformance issues, starting in version 7.3.0.9 of the agent, only those JDBC and EJB requestswhose response time exceeds a threshold value are captured and displayed in the diagnosticsdashboards in the Performance Management console.Solution:To view all JDBC and EJB requests in the diagnostic dashboards and in the method tree, completethe following steps:1. Log in to the system on which the WebSphere Applications data collector is running.2. Navigate to the following directory:
On Windows: install_dir\dchome\7.3.0.9\gdc\etc
The default installation directory is C:\IBM\ITM.
On Linux: install_dir/yndchome/7.3.0.9/gdc/etc
The default installation directory is /opt/ibm/apm/agent.
On AIX: install_dir/yndchome/7.3.0.9/gdc/etc
The default installation directory is /opt/ibm/ccm/agent.3. Open both the jdbc.xml and ejb.xml files.4. To capture all JDBC and EJB requests, change<createDataRow>ifThresholdExceeded</createDataRow> to<createDataRow>true</createDataRow>5. To capture and display only those JDBC requests or EJB requests with response times thatexceed a specific threshold value in the Diagnostics dashboards, specify a value in the element <perfThreshold></perfThreshold>.6. Save the files.7. Restart the WebSphere Application Server.
Troubleshooting - WebSphere Applications Agent:WASOutofHeapSpace event is not triggeredProblem:
The WASOutofHeapSpace event is never triggered by the WebSphere Applications agent.
Solution:
The WASOutofHeapSpace event has been deprecated and is no longer supported by Performance Management.
Troubleshooting - HTTP Server agent: Data is notproperly dispalyed in the Performance Management UIand the ITM TEP workspace when ITCAM HTTPServer agent 7.1.0.3 iFix08 and PerformanceManagement HTTP Server agent V8 are installed on thesame serverSymptom
If the ITCAM HTTP Server agent version 7.1.0.3 iFix08 and the Performance Management HTTP Server agent V8are installed on the same server, incorrect data or no data is displayed in the Performance Management UI or in theITM TEP workspace.
Solution
On every Performance Management HTTP Server agent server, complete the following steps:
1. Copy and rename the monitored HTTP Server configuration file. For example:
cp /usr/local/apache24/config/httpd.conf/usr/local/apache24/config/httpd.conf.default
Note: Before you copy and rename the HTTP Server configuration file, make sure there is no other file that isnamed httpd.conf.default .
2. Go to the agent installation directory and open the khu configuration file <hostname>_<port>.conf. Forexample:
/opt/ibm/apm/agent/tmp/khu/linux_80.conf
3. Update the entry KhuShmemPath in this file to the new HTTP Server configuration file name as changed in step1. For example, change KhuShmemPath "/usr/local/apache24/conf/httpd.conf" to KhuShmemPath "/usr/local/apache24/conf/httpd.conf.default"
4. Restart HTTP Server.
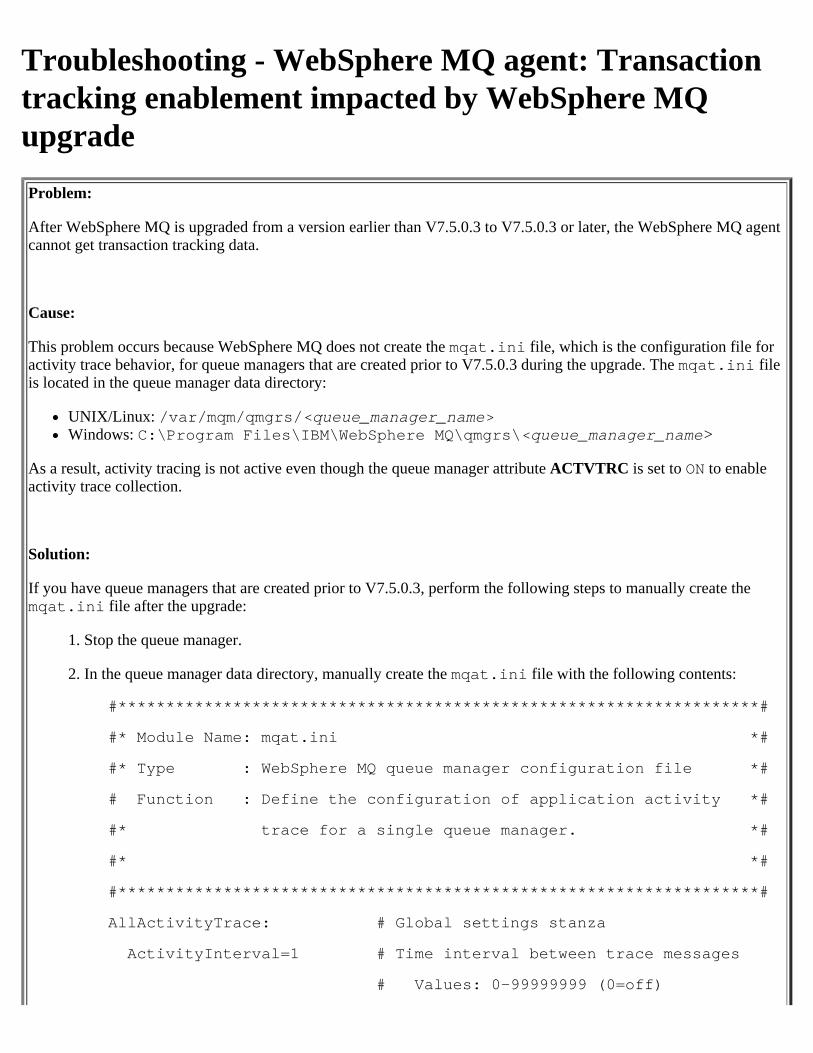
Troubleshooting - WebSphere MQ agent: Transactiontracking enablement impacted by WebSphere MQupgradeProblem:
After WebSphere MQ is upgraded from a version earlier than V7.5.0.3 to V7.5.0.3 or later, the WebSphere MQ agentcannot get transaction tracking data.
Cause:
This problem occurs because WebSphere MQ does not create the mqat.ini file, which is the configuration file foractivity trace behavior, for queue managers that are created prior to V7.5.0.3 during the upgrade. The mqat.ini fileis located in the queue manager data directory:
UNIX/Linux: /var/mqm/qmgrs/<queue_manager_name>Windows: C:\Program Files\IBM\WebSphere MQ\qmgrs\<queue_manager_name>
As a result, activity tracing is not active even though the queue manager attribute ACTVTRC is set to ON to enableactivity trace collection.
Solution:
If you have queue managers that are created prior to V7.5.0.3, perform the following steps to manually create themqat.ini file after the upgrade:
1. Stop the queue manager.
2. In the queue manager data directory, manually create the mqat.ini file with the following contents:
#*******************************************************************#
#* Module Name: mqat.ini *#
#* Type : WebSphere MQ queue manager configuration file *#
# Function : Define the configuration of application activity *#
#* trace for a single queue manager. *#
#* *#
#*******************************************************************#
AllActivityTrace: # Global settings stanza
ActivityInterval=1 # Time interval between trace messages
# Values: 0-99999999 (0=off)
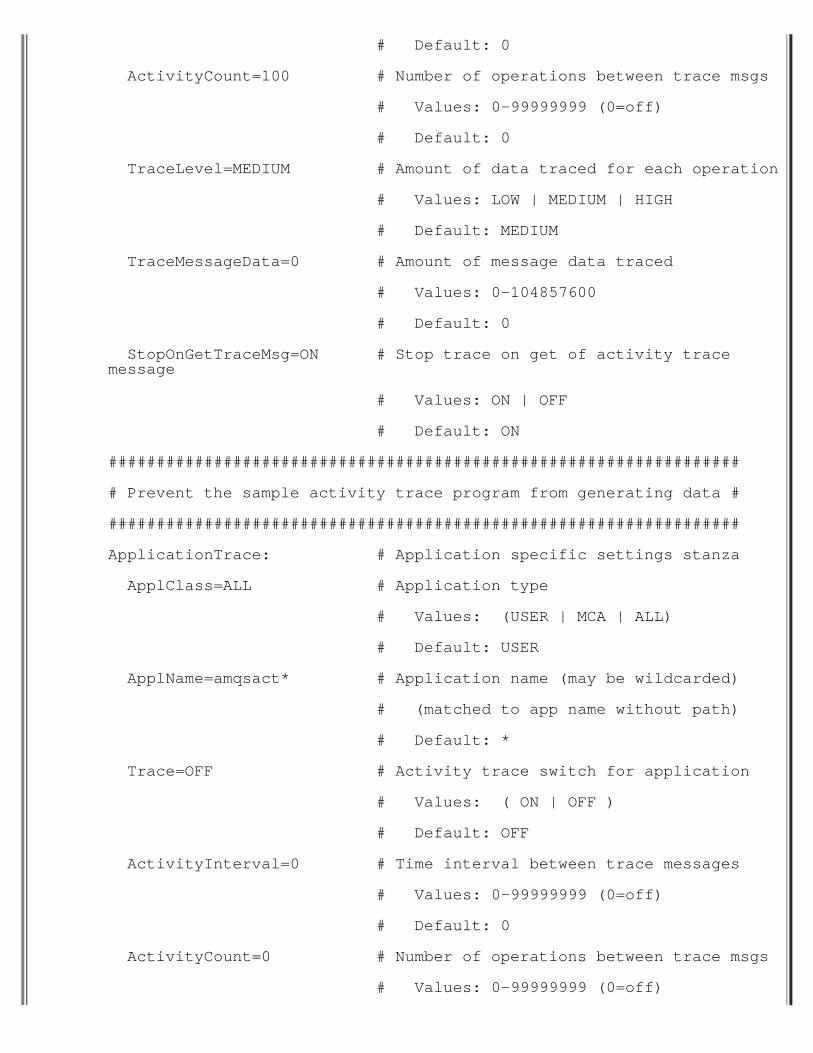
# Default: 0
ActivityCount=100 # Number of operations between trace msgs
# Values: 0-99999999 (0=off)
# Default: 0
TraceLevel=MEDIUM # Amount of data traced for each operation
# Values: LOW | MEDIUM | HIGH
# Default: MEDIUM
TraceMessageData=0 # Amount of message data traced
# Values: 0-104857600
# Default: 0
StopOnGetTraceMsg=ON # Stop trace on get of activity tracemessage
# Values: ON | OFF
# Default: ON
##################################################################
# Prevent the sample activity trace program from generating data #
##################################################################
ApplicationTrace: # Application specific settings stanza
ApplClass=ALL # Application type
# Values: (USER | MCA | ALL)
# Default: USER
ApplName=amqsact* # Application name (may be wildcarded)
# (matched to app name without path)
# Default: *
Trace=OFF # Activity trace switch for application
# Values: ( ON | OFF )
# Default: OFF
ActivityInterval=0 # Time interval between trace messages
# Values: 0-99999999 (0=off)
# Default: 0
ActivityCount=0 # Number of operations between trace msgs
# Values: 0-99999999 (0=off)
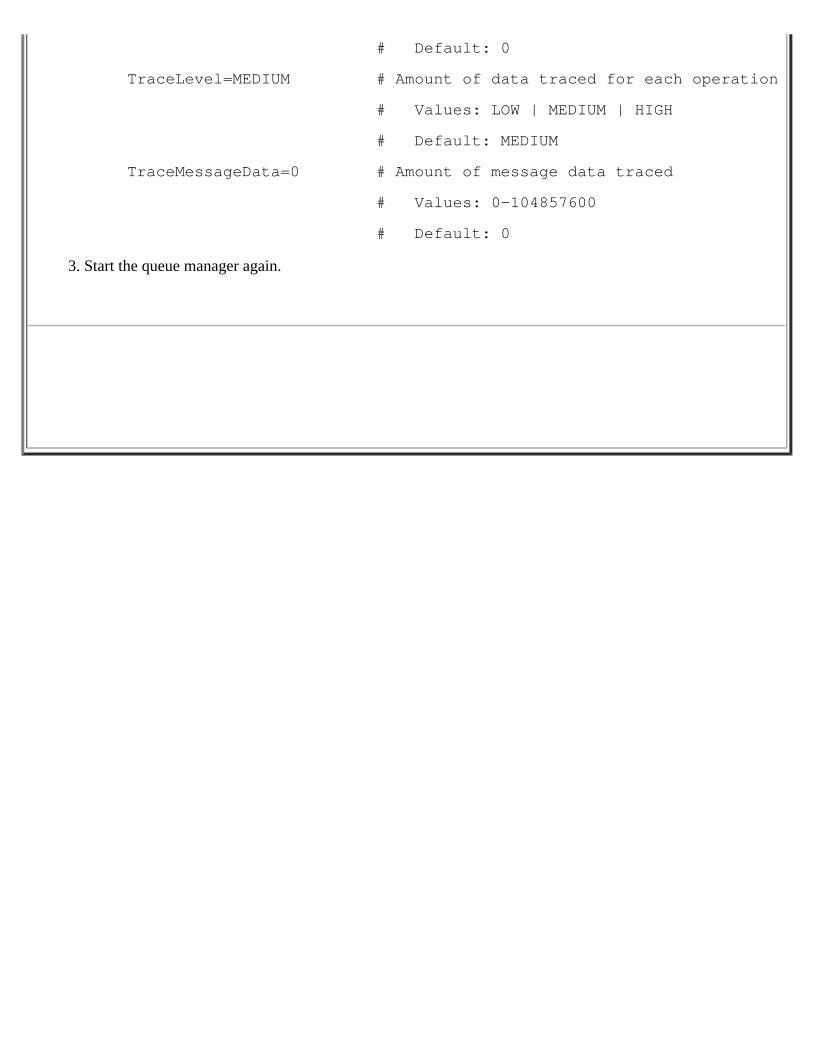
# Default: 0
TraceLevel=MEDIUM # Amount of data traced for each operation
# Values: LOW | MEDIUM | HIGH
# Default: MEDIUM
TraceMessageData=0 # Amount of message data traced
# Values: 0-104857600
# Default: 0
3. Start the queue manager again.
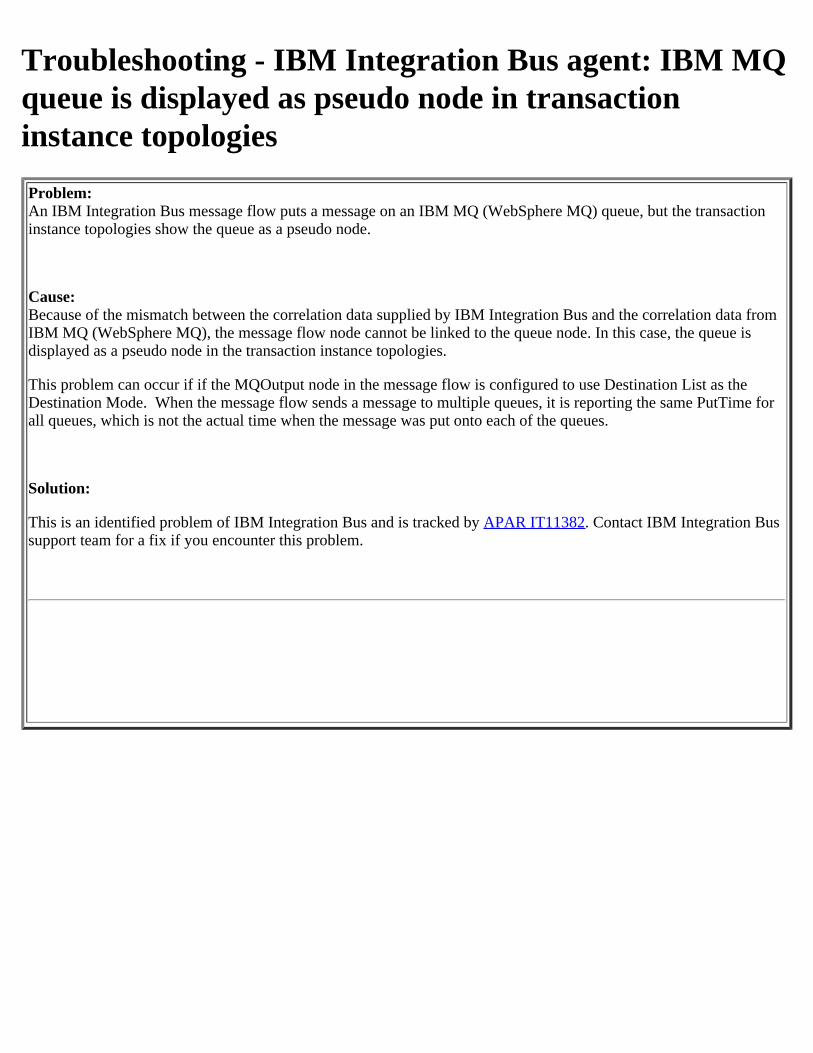
Troubleshooting - IBM Integration Bus agent: IBM MQqueue is displayed as pseudo node in transactioninstance topologiesProblem:An IBM Integration Bus message flow puts a message on an IBM MQ (WebSphere MQ) queue, but the transactioninstance topologies show the queue as a pseudo node.
Cause:Because of the mismatch between the correlation data supplied by IBM Integration Bus and the correlation data fromIBM MQ (WebSphere MQ), the message flow node cannot be linked to the queue node. In this case, the queue isdisplayed as a pseudo node in the transaction instance topologies.
This problem can occur if if the MQOutput node in the message flow is configured to use Destination List as theDestination Mode. When the message flow sends a message to multiple queues, it is reporting the same PutTime forall queues, which is not the actual time when the message was put onto each of the queues.
Solution:
This is an identified problem of IBM Integration Bus and is tracked by APAR IT11382. Contact IBM Integration Bussupport team for a fix if you encounter this problem.
Troubleshooting: JBoss server start up failureProblem:
The JBoss server start up fails when the ITCAM for J2EE agent v7.1.1 and the IBM Performance Management Agent for JBoss coexist on one machine. For example, if you need to monitor the JBoss AS application server version 5.1 or version 6.0 with the JBoss agent and the ITCAM for J2EE agent.
Solution:
You must remove the "-Dcom.sun.management.jmxremote" parameter from theJBOSS_HOME/bin/run.sh command.
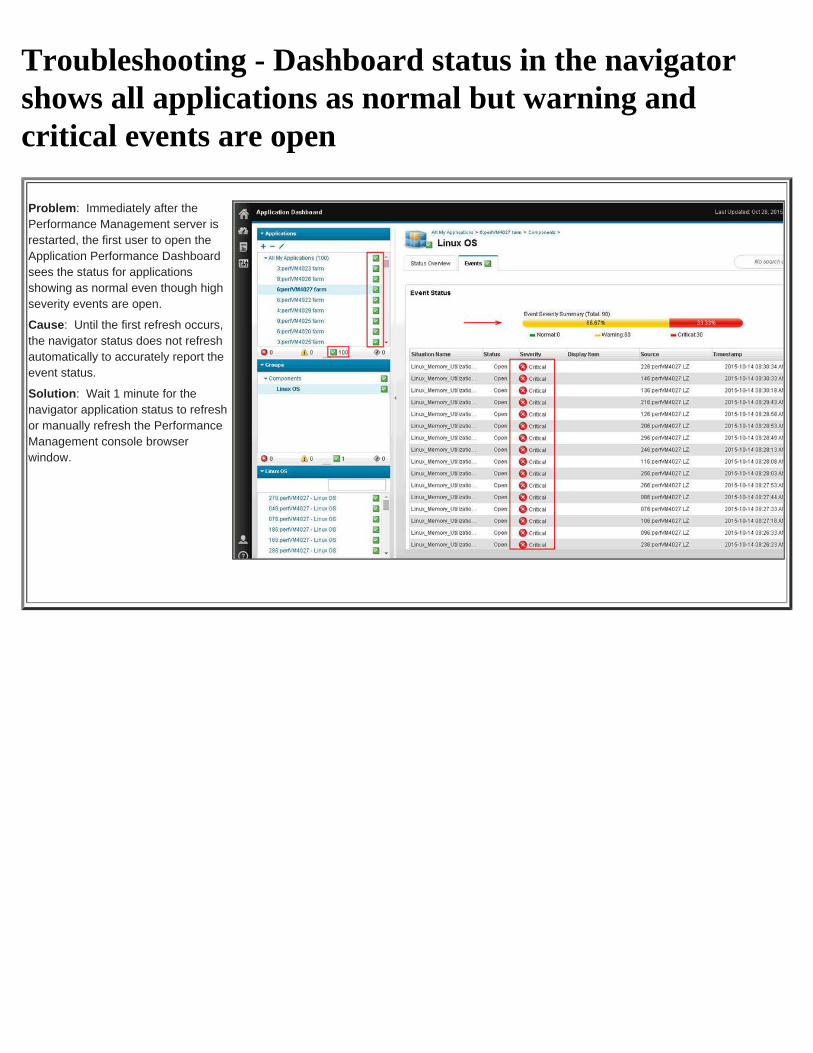
Troubleshooting - Dashboard status in the navigatorshows all applications as normal but warning andcritical events are open
Problem: Immediately after the Performance Management server is restarted, the first user to open the Application Performance Dashboard sees the status for applications showing as normal even though high severity events are open.
Cause: Until the first refresh occurs, the navigator status does not refresh automatically to accurately report the event status.
Solution: Wait 1 minute for the navigator application status to refresh or manually refresh the Performance Management console browser window.
Troubleshooting - Windows OS agent: A situation istriggered on an unexpected managed objectProblem:A situation is triggered on an unexpected managed object.
Solution:
Confirm that you have distributed and started the situation on the correct managed system.
Troubleshooting - Windows OS agent: The monitoringinterval is too longProblem:The monitoring interval is too long.
Solution:
Access the Threshold Manager for the situation that you want to modify. Check the Sampling interval area in the Formula tab. Adjust the time interval as needed.
Troubleshooting - Windows OS agent: Monitoringactivity requires too many system resourcesProblem:Monitoring activity requires too many system resources.
Cause:Some attributes might cosume large amount of system resources. The tablein Windows OS agent: performance impact of each attribute group describes the performance impact of specific attribute groups.
Solution:
If possible, decrease your use of the attribute groups that require greater system resources.
Troubleshooting - Windows OS agent: A situation thatis referencing percent disk time returns values that aregreater than 100 percentProblem:A situation that is referencing percent disk time returns values that are greater than 100 percent.
Cause:Windows Performance Monitoring (perfmon) generates these metrics, including percentage values that sometimes exceed 100.
Solution:
This behavior is determined by the operating system and cannot be changed.
Troubleshooting - Windows OS agent: The MonitoredLogs widget and Event Logs widget show no records.Problem:The Monitored Logs widget shows a record count of zero. The Event Logs widget shows no record.
Cause:Windows security logging is not turned on by default. Normally, no data is collected in the security log unless the Windows administrator turns it on. The Record Count = 0 data value that the monitoring agent returns in the Windows monitored logs report confirms that security logging is not turned on.
Solution:
Turn on the Windows security logging.
Troubleshooting - Windows OS agent: Data is missingfrom the physical and logical disk views in PMProblem:Data is missing from the physical and logical disk views in PM console.
Solution:
Open a DOS Window, issue "diskperf -y" and then reboot the Windows system.
Troubleshooting - Windows OS agent: The system runsout of memory while the agent is collecting dataProblem:The system runs out of memory while the agent is collecting data.
Solution:
Ensure that you have installed the newest Service Packs for the Microsoft .NET Framework. Depending on the levelof the Windows operating system that you are using, the required Service Pack is as follows:
.NET Framework 1.0 SP3
.NET Framework 1.1 SP1
Troubleshooting - Windows OS agent: Log dataaccumulates too rapidlyProblem:Log data accumulates too rapidly.
Cause:Check the RAS trace option settings. The trace options settings that you can set on the KBB_RAS1= and KDC_DEBUG= lines potentially generate large amounts of data.
Solution:
Change the RAS trace setting.
Troubleshooting - WebSphere Application agent:Cannot take snapshot on the Heap Dump dashboardProblem:After you click Take Snapshot on the Heap Dump dashboard, the Take Snapshot tool-tip displays the result of thetaking snapshot operation. However, the tool-tip indicates there are no items to display.
Cause:There is a timeout value set for the WebSphere Application agent. If the data collector cannot return data after thespecified period, the agent will return an empty result for the Take Snapshot tool-tip even though the taking snapshotoperation completes later.
Solution:Although the Take Snapshot tooltip indicates there are no items to display, it does not necessarily mean that the heapsnapshot is not taken. Click OK on the tool-tip and you can see the snapshot data on the widget.
Troubleshooting - DataPower agent: no data in someDataPower widgets in the Performance DashboardSymptom
In the Performance Dashboard, there is no data in the HTTP transaction and throughput DataPower widgets, and adataprovider error is displayed.
Cause
Transaction statistics are not enabled for the monitored DataPower appliance.
Solution
To enable transaction statistics:
1. Log onto the monitored DataPower appliance administrative console.2. Select Status > Connection > Transaction Rate.3. Click Show all domains and ensure all domains show tables and data.4. If any domains display Statistics is currently disabled, click disabled, set the Administrative state to
enabled and click Apply.
Troubleshooting - DataPower agent: backend faults notreportedAbstract:
SOAP faults received by DataPower from a backend system are not reported as a fault to ITCAM for SOA. Changesto the DataPower service are required.
Symptom:
SOAP faults received by DataPower from a backend system are not reported as a fault to ITCAM for SOA. A probeon the DataPower service shows that a response rule is handling the SOAP fault, not an error rule.
SOAP faults originating within the DataPower appliance may still be correctly reported as faults to ITCAM for SOA.
Resolving the problem:
Backend faults can easily be reported correctly as faults to ITCAM for SOA by disabling the processing of errors. Thesetting to toggle depends on the DataPower service type.
For Web Service Proxies
1. Go to the service's "Advanced Proxy Settings" tab2. Set "Process HTTP Errors" to "off"3. Click "Apply"
For Multi Protocol Gateways
1. Go to the service's "Advanced" settings tab2. Set "Process Backend Errors" to "off"3. Click "Apply"
Both of these are "on" by default. When these configuration settings are disabled, any backend message with a HTTP failure code (e.g. 500 Internal Server error) will be immediately handled as an error - not as a valid response.
If you do not want to disable these settings you will need to detect the fault in XSL transforms and handle them as faults - either rejecting them or redirecting the message to an error rule. If you require help with this, please contact WebSphere DataPower support to assist with your appliance configuration.
Troubleshooting: HMC agent dashboard attribute valueissuesProblem:
In the HMC agent dashboard, the 'CPU Units Used' and '"CPU Unit Used(%)' attribute values on the "Power Servers" page are showing as 'Data_Not_Available'.
Solution:
1. Edit the sample rate by HMC command as shown here:
chlparutil -r config -m <managed system name> -s <sample rate in second>
Note: The sample rate is disabled by default and values 0, 30 (30 seconds), 60 (60 seconds), 300 (5 minutes), 1800 (30 minutes), and 3600 (1 hour) are supported. A sample rate of 0 disables the utilization data collection.
2. Verify the sample rate by HMC command as shown here:
lslparutil -r config -m <managed system name>
3. Restart the HMC Base Agent and the attributes display correctly.
Troubleshooting: IBM Integration Bus MonitoringAgent and the java process time delayProblem:
After the IBM Integration Bus Monitoring Agent is stopped, the java child processes exit after a 3 minute timeout. This time delay occurs across single and multiple agent instances. The java processes are used to communicate with the Configuration Manager Proxy (CMP) interface and the timeout ensures that the processes exit safely.
Solution:
During the next release, the java child process will be improved to ensure that it terminates in time before the agent stopping process ends.
Troubleshooting: Microsoft SharePoint Server agent:Java runtime error while configuring the agent throughIBM Performance Management windowSymptom
When you configure the agent by using the IBM Performance Management window, the following error message related to Java Runtime Environment is displayed:
Java Runtime Environment not detected: Extended agent configuration is disabled. To enable it, install Tivoli Enterprise Services User Interface Extensions component. If remote configuration for the agent is supported, complete the configuration process using the Tivoli Enterprise Portal.
Solution
Use the silent response file to configure the agent. For information about configuring the agent by using the silent response file, see the Configuring the Microsoft SharePoint Server agent topic on the IBM Performance Management Knowledge Center.
Troubleshooting - Windows OS agent: When you editthe configuration for an existing monitoring agent thevalues displayed are not correctProblem:
When you edit the configuration for an existing monitoring agent the values displayed are not correct.
Cause:
The original configuration settings might include non-ASCII characters. These values were stored incorrectly and result in the incorrect display.
Solution:
Enter new values using only ASCII characters.

Troubleshooting - Windows OS agent: The Long QueueName is not matched with the row data collected fromperfmonProblem:
The Long Queue Name is not matched with the row data collected from perfmon.
Solution:
To allow the Long Queue Name to be matched with the row data collected from perfmon (all the remaining attributes for each MSMQ Queue) the first 63 bytes (characters) of the Queue Name must be unique. This is the only way that the queue name can be matched with the additional metrics that come back from perfmon (the source for the remaining attributes of the queue instance).
Troubleshooting - Windows OS agent: The CPU of theWindows OS agent server is highProblem:
The CPU of the Windows OS agent server is high.
Solution:
The PerfProc service is typically the one responsible for high CPU. Others, like TCP/IP, might also need to be disabled. Using the exctrlst.exe that you can download from the Microsoft site, you can disable the PerfProc and TCPIP services. Run the exctrlst.exe command to bring up the Extensible Counter List, where all of the counters are listed. You can deselect the Performance Counters Enabled box while highlighting PerfProc. Click Refresh to save the change. The same method can be used to disable the TCP/IP counter.
If these two services are stopped, widgets or situations based on Process and Network attribute groups will no longer function.
Troubleshooting - Windows OS agent: The processapplication components are available but theAvailability status shows PROCESS_DATA_NOT_AVAILABLEProblem:
The process application components are available but the Availability status showsPROCESS_DATA_NOT_ AVAILABLE.
Cause:
This problem occurs because the PerfProc performance object is disabled. When this condition exists, IBMMonitoring cannot collect performance data for this process.
Solution:
Do the following to confirm that this problem exists and resolve it:
Choose Run in the Windows Start menu. Type perfmon.exe in the Open field of the Run window. The Performancewindow is displayed. Click the plus sign (+) in the tool bar located above the right pane. The Add Counters window isdisplayed. Look for Process in the Performance object pull-down menu. Perform one of the following actions: If yousee Process in the pull-down menu, the PerfProc performance object is enabled and the problem is coming from adifferent source. You might need to contact IBM Software Support. If you do not see Process in the pull-down menu,use the Microsoft utility from the following Web site to enable the PerfProc performance object:
http://blogs.technet.com/mscom/archive/2008/12/18/the-mystery-of-the-missing-process-performance-counter-in-perfmon.aspx
The Process performance object becomes visible in the Performance object pull-down menu of the Add Counters windows, and IBM Monitoring is able to detect Availability data. Restart the monitoring agent.
Troubleshooting - Windows OS agent: the agent goesoff-line when collecting the network port attribute dueto reverse DNS look-up time-outProblem:
The agent goes off-line when collecting the network port attribute due to reverse DNS look-up time-out.
Cause:
This agent can hang when querying network ports information and the DNS reverse lookup is disabled. Several errors similar to the following will be logged:(4A7BDB8F.0000-1B90:knt67agt.cpp,243,"TakeSample") gethostbyaddrerror <11004> for IP addresserror <11004> for IP address(4A7BDB94.0000-1B90:knt67agt.cpp,243,"TakeSample") gethostbyaddrerror <11004> for IP addresserror <11004> for IP address
The agent appears to be off-line in the PM UI, and does not report any data for any widget.
Solution:
The environment variable REVERSE_LOOKUP_ACCEPTED_FAILURES that can be specified in the configuration file allows you to set the number of accepted failures in the reverse lookup. This action canreduce the hang time.
Troubleshooting - Windows OS agent: high CPU usageafter you install or configure the Windows OS agent.Problem:
The system is experiencing high CPU usage after you install or configure Monitoring Agent for WindowsOS.
Solution:
Agent process: View the memory usage of the KNTCMA process. If CPU usage seems to beexcessive, recycle the monitoring agent.Network Cards: The network card configurations can decrease the performance of a system. Eachof the stream of packets that a network card receives (assuming it is a broadcast or destined for theunder-performing system) must generate a CPU interrupt and transfer the data through the I/O bus. Ifthe network card in question is a bus-mastering card, work can be off-loaded and a data transferbetween memory and the network card can continue without using CPU processing power. Bus-mastering cards are generally 32-bit and are based on PCI or EISA bus architectures.
Troubleshooting - Windows OS agent: log relatedwidgets have not dataProblem:
The following issues occur:
The Monitored Logs widget shows a record count of zero (0).The Event Logs widget shows no records.
Cause:
Windows security logging is not turned on by default. Normally, no data is collected in the security log unless the Windows administrator turns it on. The Record Count = 0 data value that the monitoring agent returns in the Windows monitored logs report confirms that security logging is not turned on.
Solution:
No action is required.
Troubleshooting - Windows OS agent: error messagesaying could not open DNS registry keyProblem:
You see the following error message:
Could not open DNS registry key
Cause:
This message is informational only. The Windows agent reports the fact that it could not find a registry entry for the DNS Server Event Log. This means that the DNS Server is not installed.
Solution:
No action is required.
Troubleshooting - PM server installation does notcompleteRecovery from hang on starting/stopping Upstart-based services (MongoDB, Kafka, Zookeeper, Spark)
Problem:
The Performance Management server installation process does not complete after 30-60 minutes. The symptoms:
1. The 'status servicename' command displays a status different from 'stop/waiting' even though the process for theservice is not running. Usually the status is reported as 'start/killed' or 'stop/killed'.
2. Attempts to start or stop the service (via 'start servicename' or 'stop servicename') hang.
Cause:
Several components of IBM Performance Management are managed by Upstart, the default initialization system inRHEL 6.x: MongoDB, Kafka, Zookeeper, and Spark. In rare circumstances, it is possible that the process for theservice crashes and Upstart fails to restart the service.
Solution:
Restart the computer or VM, uninstall the incomplete product installation, and start the installation anew. For moreinformation, see the Results and What to do next sections in the IBM Knowledge Center topicDownloading and installing the server.
Troubleshooting - PM console in Chrome browser locksup on rapid clicking of menu itemsProblem:
The Performance Management console locks up when you rapidly click between different menu items. For example,after adding an application in the Application Performance Dashboard, you select System Configuration > ResourceGroup Manager from the navigation bar. The Resource Group Manager title is displayed but nothing else on the page.
Cause:
The Google Chrome browser v43 - v45 does not allow self-signed certificates and restricts the full displayintermittently.
Solution:
Upgrade to Chrome v46 or later, or upgrade to IBM Performance Management v8.1.2 as described inUpgrading your server. Alternatively, create a CA-signed certificate as described inConfiguring a CA custom certificate.
Troubleshooting - UNIX OS agent: situations createdusing the File Pattern attribute group always raise alertsProblem:Situations that are created by using the File Pattern attribute group are always TRUE.
Cause:
The Match Count attribute is not used for creating the situations. The Match Count attribute indicates the number of matches for the specified pattern in the specified file. The following formula with no Match Count attribute, for example, always raises alerts:
IF VALUE Unix_File_Pattern.File_Name EQ '/path/filename' AND VALUEUnix_File_Pattern.Match_Pattern EQ 'pattern'
Solution:The Match Count attribute must be used when you create situations for a match pattern. For example:
IF VALUE Unx_File_Pattern.File_Name EQ '/path/filename' AND VALUEUnix_File_Pattern.Match_Pattern EQ 'pattern' AND VALUEUnix_File_Pattern.Match_Count GT 0
Troubleshooting - UNIX OS agent: monitoring activityrequires too much disk spaceProblem:Monitoring activity requires too much disk space.
Cause:
Check the RAS trace logging settings. Some logging options, for example ALL, generate large amount of logs, making the log file size grow rapidly.
Solution:Change the RAS trace logging option.
Troubleshooting - UNIX OS agent: disk data collectedby the agent does not match the df command outputProblem:Disk data collected by the agent does not match the disk data collected by the df command.
Cause:
The df command provides the current total disk usage for all file systems accessible by the workstation. In contrast, disk data collected by the UNIX OS agent for the Space Used attributes includes the contribution from the reservedspace, if any. As a result, these attributes might report higher values than the df command's Used values which do not account for reserved space.In addition, disk data collected by the UNIX OS agent, expressed in percentages, is rounded up to the nearest integer.Percentages from the df command might not be rounded up to the nearest integer.
Solution:None.
Troubleshooting - UNIX OS agent: data collection ofmetrics from kpx data provider affects the agentperformance (or the metrics are not relevant)Problem:The data collection of metrics that are available from kpx data provider affects the agent performance (or the metrics are not relevant).
Cause:
On AIX 6.1 TL5 or later, the UNIX OS agent by default starts the process aixdp_daemon to collect all metrics available from the kpx data provider, and passes them back to the agent. New attribute groups include AIX AMS, AIX Defined Users, AIX Devices, AIX LPAR, AIX WPAR CPU, AIX WPAR File System, AIX WPAR Information, AIX WPAR Network, and AIX WPAR Physical Memory.
Solution:To disable the data collection, edit the .ux.environment file by setting the environment variableKUX_AIXDP=false. This variable is set to true be default.
Troubleshooting - UNIX OS agent: unicode file namesare not properly displayed in the File InformationViewerProblem:Unicode file names are not properly displayed in the File Information Viewer
Cause:
Due to incompatibilities in reading information from different language code pages, any file that has non-ASCII text will not be properly displayed in the File Information viewer.
Solution:None.
Troubleshooting: Installing, configuring, and runningagents as a non-root user
Problem:
Installing, configuring, and running agents as different non-root users causes permission errors.
Solution:
If you installed or configured your agent as a selected user and want to configure or run the agent as a different user, create a common group on the system.Make all agent management users members of this common group. Transfer ownership of all agent files and directories to this group.
Procedure:
1. Run the ./secure.sh script with the group name of the non-root user to secure the files and set the file group ownership to the files. Forexample: ./secure.sh -g db2iadm1
2. To update the system startup scripts, run the following script with root user or sudo user access: install_dir/bin/UpdateAutoRun.sh
3. Restart the OS agent and any other agents that were started as the non-root user.
Troubleshooting: Microsoft Exchange Server agent:Unable to see instances for both Exchange componenttypes under My ComponentsSymptom: On the Application Performance Management dashboard, instances of both the Exchange component types are notdisplayed under My Components. The instances of one of the component types (Microsoft Exchange Server orMicrosoft Exchange Server 2013) are shown under My Components.
Cause: For My Components, the Application Performance Management dashboard does not support two different componenttypes. Therefore, instances of only one Exchange component type, which is randomly selected at run time, aredisplayed under My Components.
Solution: This behavior for My Components is expected. However, the applications that you create, show the instances of boththe Exchange component types.
Troubleshooting - UNIX OS agent: the agent processuses a large amount of system resourcesProblem:The agent, especially the process kuxagent uses a large amount of system resources.
Cause and solution:
In most cases, the problem occurs during the backup. Any one of the following scenarios can cause this problem.
Multiple agents are running at the same time.
The computer that hosts the APM MIN Server was rebooted and the agent was installed by the root user account.
The agent is running during the backup
During the backup, some of the services might be interrupted, unavailable, or locked for some amount of time. While the backup process is running, the UNIX OS agent might wait for resources to be freed by the backup process. When the backup is completed and you check the agent, high CPU at this point is expected, because the agent is in an uncertain state (backup usually stops several kernel services that could cause this state). Therefore, stop all agents before you run the backup. Otherwise, there might be lost information, file, or API connections.
The agent is started during system boot up.
If you use scripts to stop and start the agent, do not start the agent from an init process script when you restart the system.

Troubleshooting - UNIX OS agent: attributes do notallow non-ASCII input in the situation editorProblem:Attributes do not allow non-ASCII input in the situation editor
Cause:
Any attribute that does not include "(Unicode)" might support only ASCII characters. For example "Attribute (Unicode)" supports unicode but "Attribute" without "(Unicode)" might only support ASCII characters.
Solution:None.
Troubleshooting - UNIX OS agent: the agent is up in theconsole but the command "bin/os-agent.sh status"suggests the agent is downProblem:The agent is shown in the PM console as running, but the check status command bin/os-agent.sh status shows that the agent fails to start and is not running.
Solution:
Check the config/.ux.environment file for any blank line. Delete the blank lines and restart the agent.
Troubleshooting - UNIX OS agent: configuration valuesare incorrectly displayedProblem:When you edit the configuration for an existing monitoring agent, the values displayed are not correct.
Solution:
The original configuration settings might include non-ASCII characters. Such values were stored incorrectly and result in incorrect display. Enter new values with only ASCII characters.
Troubleshooting - UNIX OS agent: the agent is runningbut not displaying dataProblem:The UNIX OS agent is started and running but no data is displayed on the Performance Management console.
Solution:
Check the following aspects:
1. Check the agent log files to see if there are connection issues.
2. If there are no connection issues, check whether the agent has terminated. To do that, search the word "terminated"in the log.
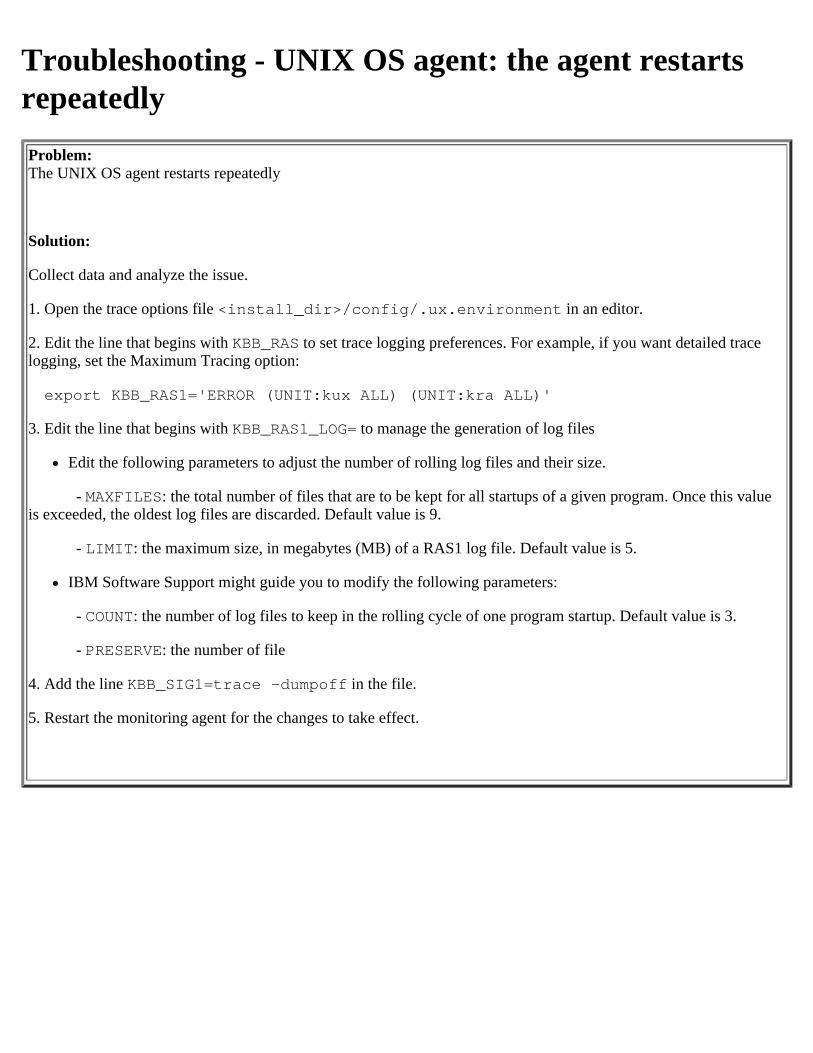
Troubleshooting - UNIX OS agent: the agent restartsrepeatedlyProblem:The UNIX OS agent restarts repeatedly
Solution:
Collect data and analyze the issue.
1. Open the trace options file <install_dir>/config/.ux.environment in an editor.
2. Edit the line that begins with KBB_RAS to set trace logging preferences. For example, if you want detailed tracelogging, set the Maximum Tracing option:
export KBB_RAS1='ERROR (UNIT:kux ALL) (UNIT:kra ALL)'
3. Edit the line that begins with KBB_RAS1_LOG= to manage the generation of log files
Edit the following parameters to adjust the number of rolling log files and their size.
- MAXFILES: the total number of files that are to be kept for all startups of a given program. Once this valueis exceeded, the oldest log files are discarded. Default value is 9.
- LIMIT: the maximum size, in megabytes (MB) of a RAS1 log file. Default value is 5.
IBM Software Support might guide you to modify the following parameters:
- COUNT: the number of log files to keep in the rolling cycle of one program startup. Default value is 3.
- PRESERVE: the number of file
4. Add the line KBB_SIG1=trace -dumpoff in the file.
5. Restart the monitoring agent for the changes to take effect.

Troubleshooting - Linux OS agent: situations that arecreated by using the File Pattern attribute group arealways TRUEProblem:Situations that are created by using the File Pattern attribute group are always TRUE.
Cause:
The Match_Count attribute is not used for creating the situations. For example:
[*IF *VALUE Linux_File_Pattern.File_Name *EQ '/path/filename' *AND *VALUE Linux_File_Pattern.Match_Pattern *EQ 'pattern']
Such situations are always TRUE.
Solution:The Match_Count attribute must be used when you create situations for a match pattern. For example:
[*IF *VALUE Linux_File_Pattern.File_Name *EQ '/path/filename' *AND *VALUE Linux_File_Pattern.Match_Pattern *EQ 'pattern' *AND *VALUELinux_File_Pattern.Match_Count *GT 0]
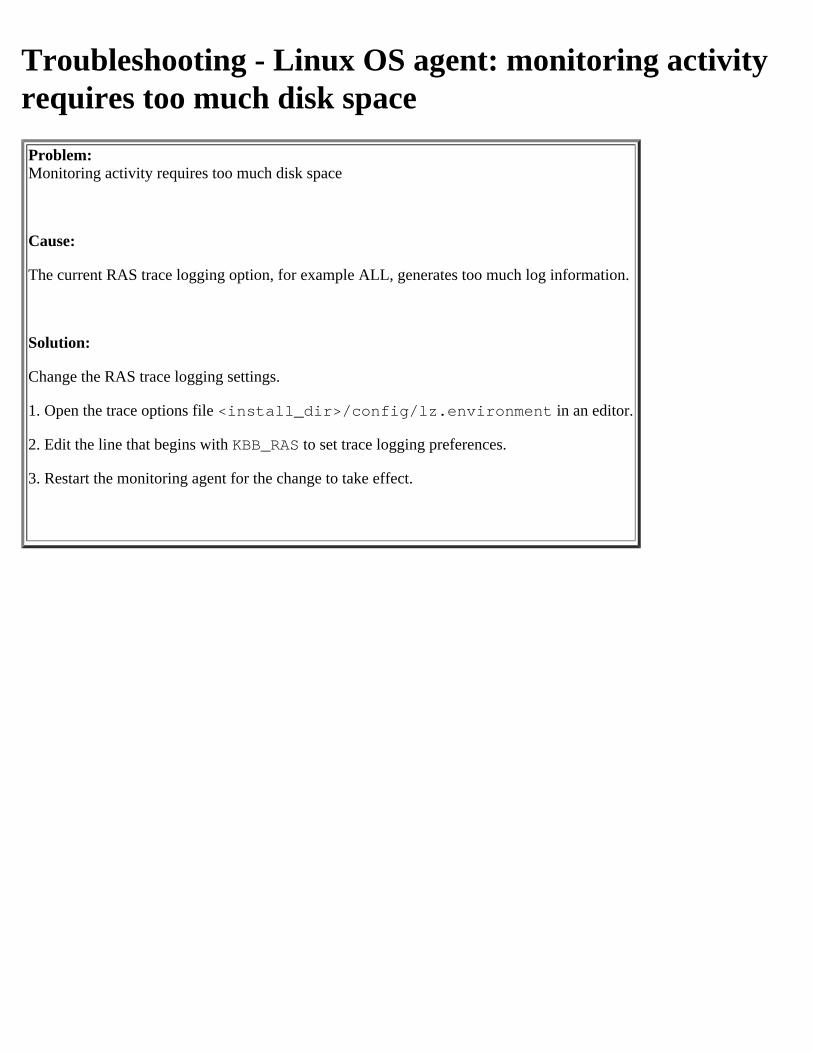
Troubleshooting - Linux OS agent: monitoring activityrequires too much disk spaceProblem:Monitoring activity requires too much disk space
Cause:
The current RAS trace logging option, for example ALL, generates too much log information.
Solution:
Change the RAS trace logging settings.
1. Open the trace options file <install_dir>/config/lz.environment in an editor.
2. Edit the line that begins with KBB_RAS to set trace logging preferences.
3. Restart the monitoring agent for the change to take effect.
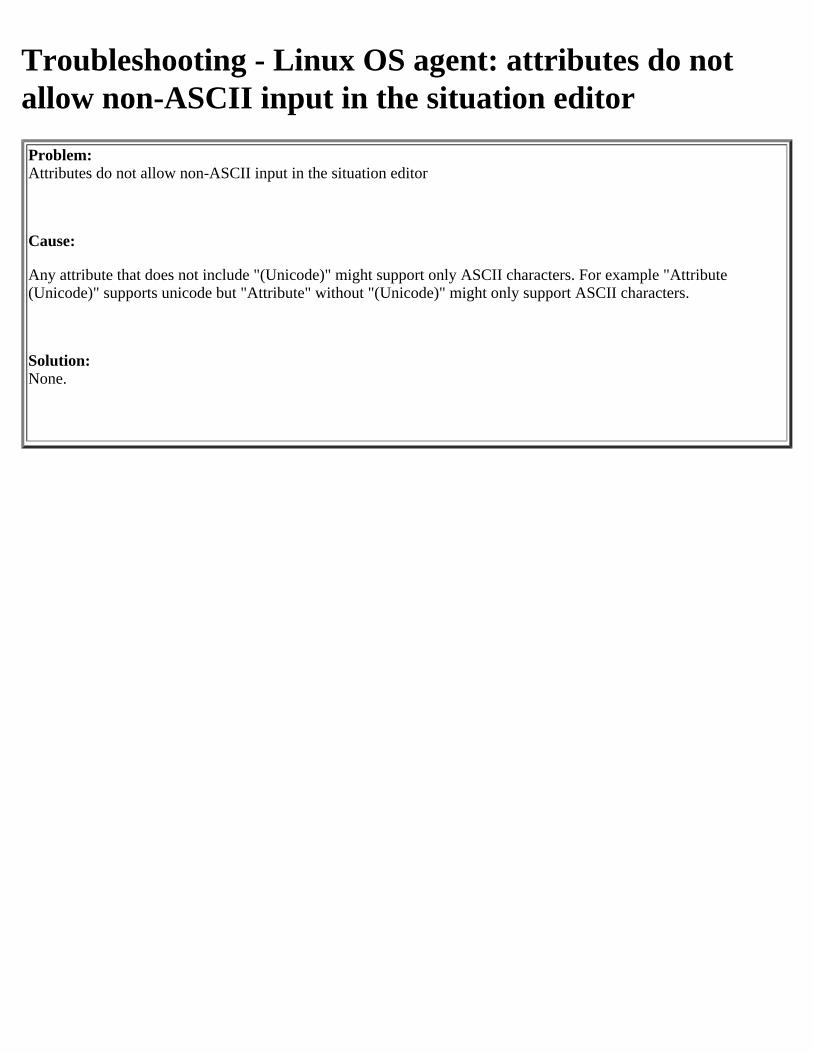
Troubleshooting - Linux OS agent: attributes do notallow non-ASCII input in the situation editorProblem:Attributes do not allow non-ASCII input in the situation editor
Cause:
Any attribute that does not include "(Unicode)" might support only ASCII characters. For example "Attribute (Unicode)" supports unicode but "Attribute" without "(Unicode)" might only support ASCII characters.
Solution:None.
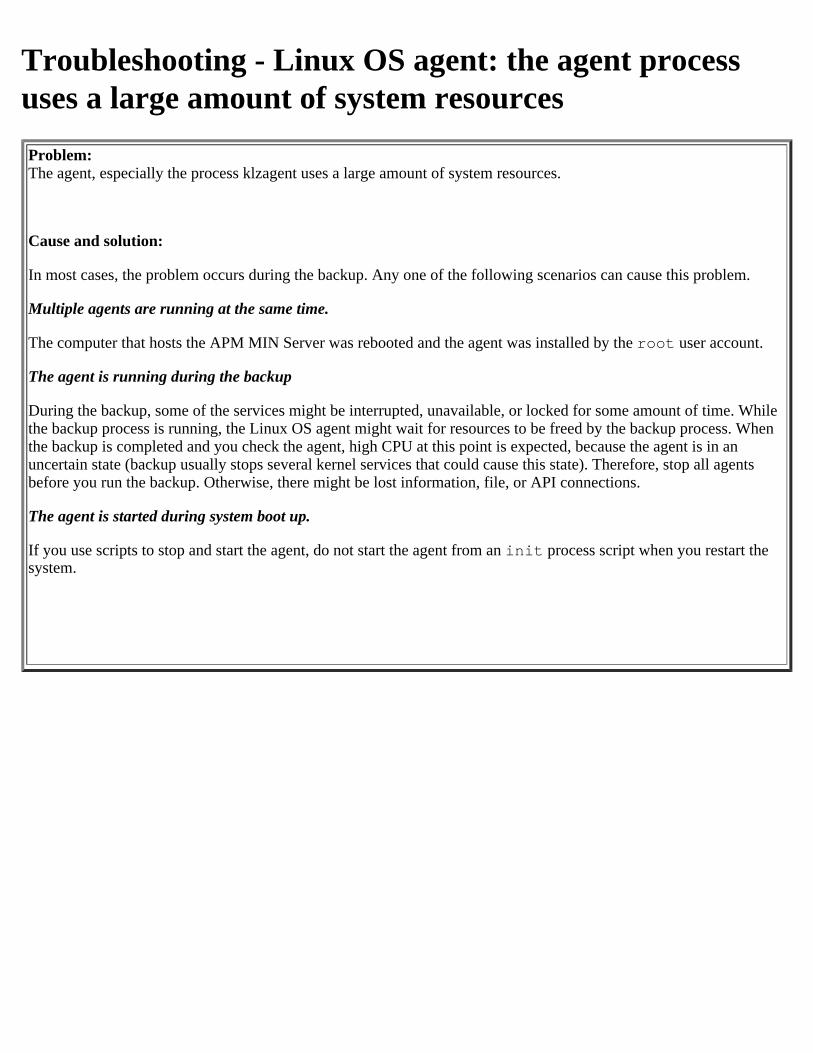
Troubleshooting - Linux OS agent: the agent processuses a large amount of system resourcesProblem:The agent, especially the process klzagent uses a large amount of system resources.
Cause and solution:
In most cases, the problem occurs during the backup. Any one of the following scenarios can cause this problem.
Multiple agents are running at the same time.
The computer that hosts the APM MIN Server was rebooted and the agent was installed by the root user account.
The agent is running during the backup
During the backup, some of the services might be interrupted, unavailable, or locked for some amount of time. While the backup process is running, the Linux OS agent might wait for resources to be freed by the backup process. When the backup is completed and you check the agent, high CPU at this point is expected, because the agent is in an uncertain state (backup usually stops several kernel services that could cause this state). Therefore, stop all agents before you run the backup. Otherwise, there might be lost information, file, or API connections.
The agent is started during system boot up.
If you use scripts to stop and start the agent, do not start the agent from an init process script when you restart the system.
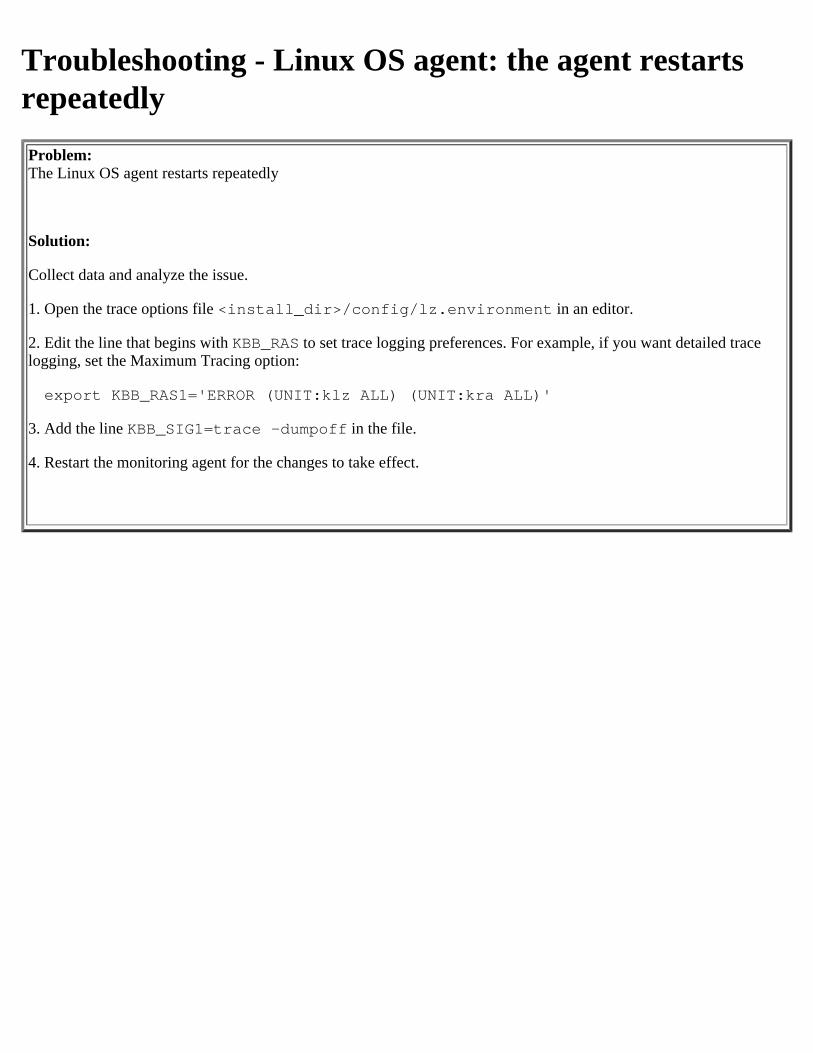
Troubleshooting - Linux OS agent: the agent restartsrepeatedlyProblem:The Linux OS agent restarts repeatedly
Solution:
Collect data and analyze the issue.
1. Open the trace options file <install_dir>/config/lz.environment in an editor.
2. Edit the line that begins with KBB_RAS to set trace logging preferences. For example, if you want detailed tracelogging, set the Maximum Tracing option:
export KBB_RAS1='ERROR (UNIT:klz ALL) (UNIT:kra ALL)'
3. Add the line KBB_SIG1=trace -dumpoff in the file.
4. Restart the monitoring agent for the changes to take effect.
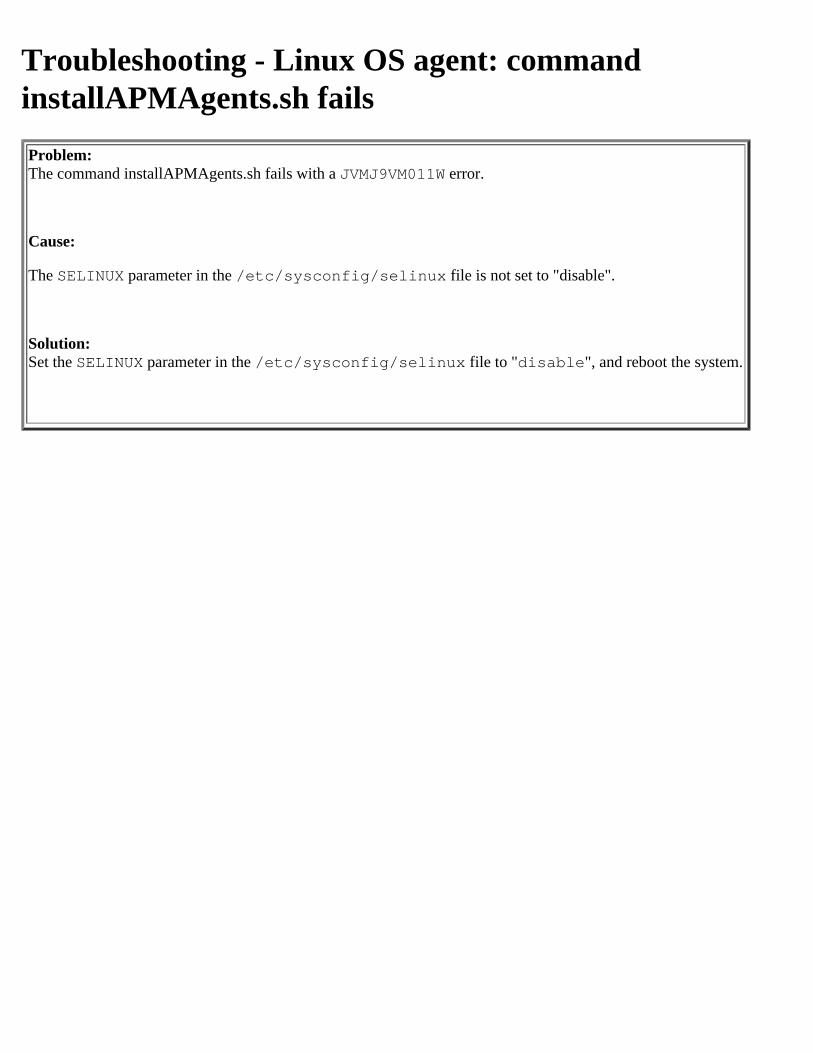
Troubleshooting - Linux OS agent: commandinstallAPMAgents.sh failsProblem:The command installAPMAgents.sh fails with a JVMJ9VM011W error.
Cause:
The SELINUX parameter in the /etc/sysconfig/selinux file is not set to "disable".
Solution:Set the SELINUX parameter in the /etc/sysconfig/selinux file to "disable", and reboot the system.
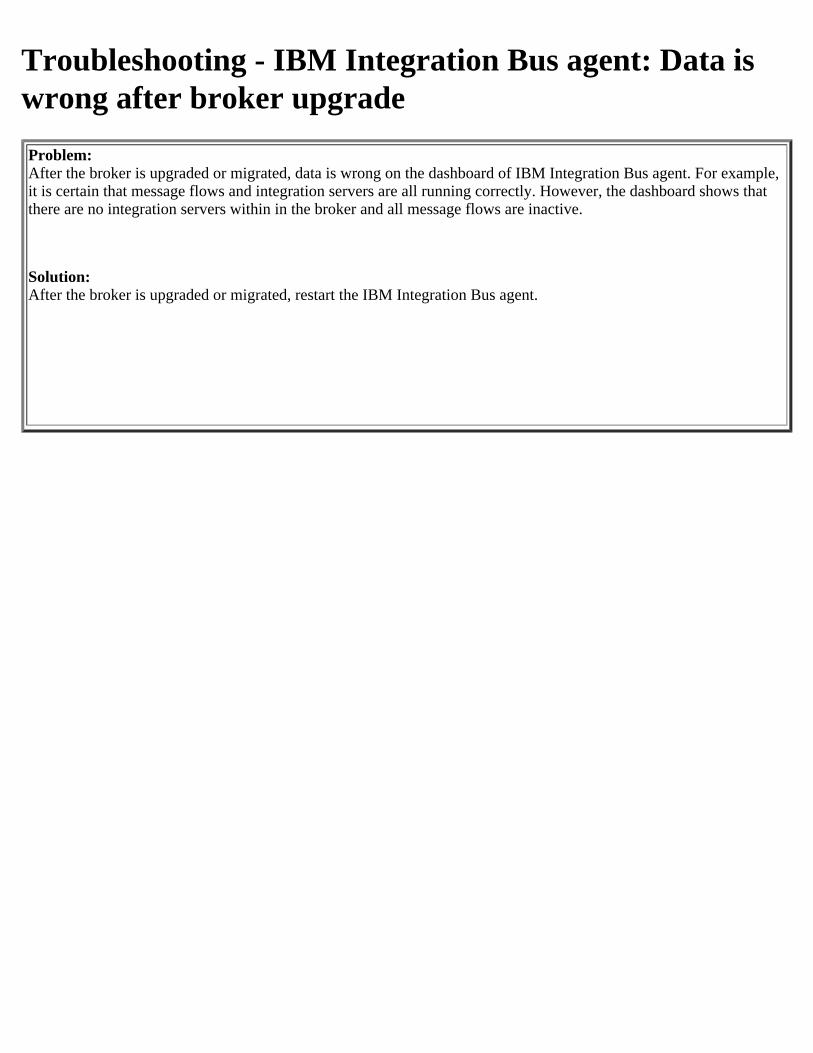
Troubleshooting - IBM Integration Bus agent: Data iswrong after broker upgradeProblem:After the broker is upgraded or migrated, data is wrong on the dashboard of IBM Integration Bus agent. For example, it is certain that message flows and integration servers are all running correctly. However, the dashboard shows that there are no integration servers within in the broker and all message flows are inactive.
Solution:After the broker is upgraded or migrated, restart the IBM Integration Bus agent.
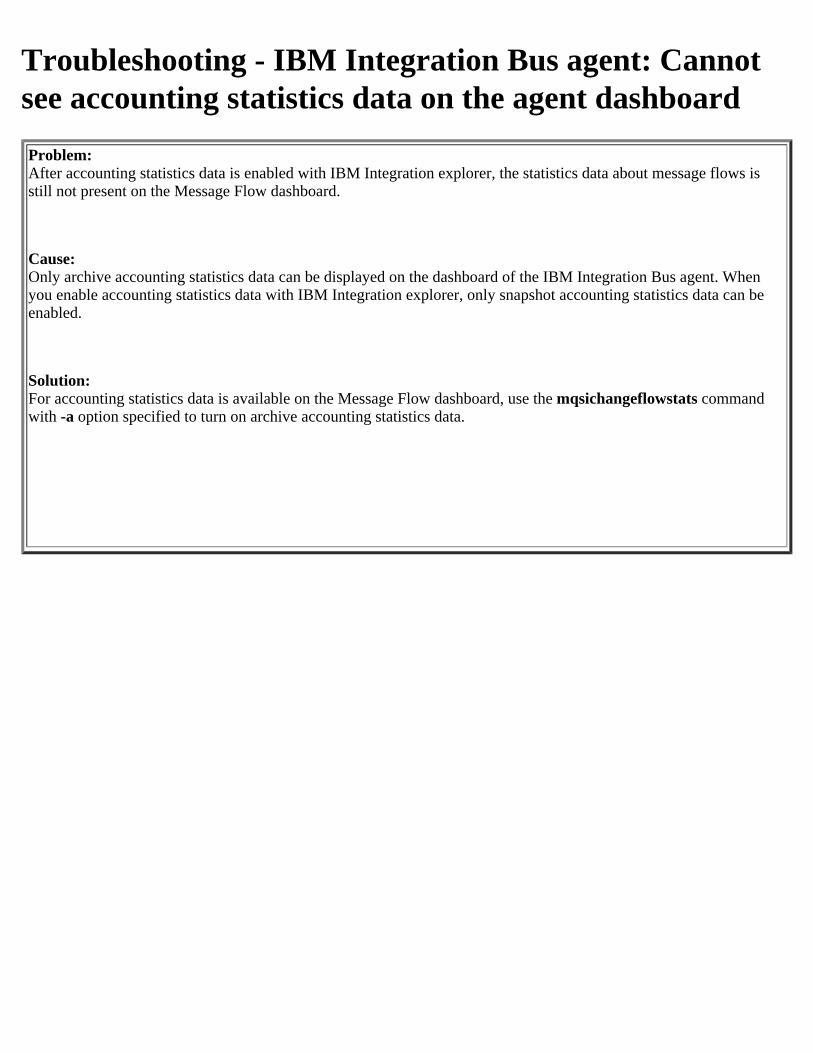
Troubleshooting - IBM Integration Bus agent: Cannotsee accounting statistics data on the agent dashboardProblem:After accounting statistics data is enabled with IBM Integration explorer, the statistics data about message flows is still not present on the Message Flow dashboard.
Cause:Only archive accounting statistics data can be displayed on the dashboard of the IBM Integration Bus agent. When you enable accounting statistics data with IBM Integration explorer, only snapshot accounting statistics data can be enabled.
Solution:For accounting statistics data is available on the Message Flow dashboard, use the mqsichangeflowstats command with -a option specified to turn on archive accounting statistics data.
Troubleshooting - IBM Integration Bus agent: Javaprocesses are still running after agent stops.Problem:After the IBM Integration Bus agent is stopped, all related Java process are still running.
Cause:When the agent is stopped, the agent process stops immediately. However, the related Java processes will exit after 3 heartbeat intervals, which is about 3 minutes.
Solution:No user action is required. Wait for 3 minutes and the Java processes can exit automatically.
Troubleshooting - WebSphere Applications agent: Web service calls are rejected byexternal web serviceProblem:
Web service calls that are monitored by the WebSphere Application agent are rejected by the external web service that is not monitored by the agent.
Cause:
To monitor the web service calls, the data collector inserts correlators to the JAX-WS SOAP headers. Those correlators might be treated by an external web server as unidentified elements in theSOAP headers, thus cause application disruption.
Solution:
You can disable the correlator insertion with the com.ibm.tivoli.itcam.dc.ttapi.webservice.disable.correlator.injection.mask property in the data collector toolkit properties file. The toolkitproperties file is named as follows:
Windows:install_dir\dchome\dc_version\runtime\app_server_version.node_name.profile_name.server_name\custom\toolkit_custom.properties
Linux or AIX:install_dir/yndchome/dc_version/runtime/app_server_version.node_name.profile_name.server_name/custom/toolkit_custom.properties
Tip: To change settings for all WebSphere servers monitored by the agent, use the toolkit_global_custom.properties file.
To disable correlator insertion for all web services, set the property in the toolkit properties file as follows:
com.ibm.tivoli.itcam.dc.ttapi.webservice.disable.correlator.injection.mask=true
To disable correlator insertion for some specific web services, use regular expression to specify the mask, which can filter out the web services whose URI, port name, or service name thatmatches the regular expression for correlator injection.
For example, if you set com.ibm.tivoli.itcam.dc.ttapi.webservice.disable.correlator.injection.mask=(.*)PingService(.*) in the toolkit properties file, the data collector will not insert correlators inany web service that contains PingService. Before you disable the correlator insertion, in the Transaction Instance Topology, a transaction is displayed like this and goes through 4 nodes:
A browser (9.65.79.190) --> IBM HTTP server ((/wssamplessei/demo) --> WebSphere server (/wssamplessei/demo) --> WebSphere server(WS:JaxWSServicesSamples#SampleServicesSei.war:pingOperation:OneWay with URI: http://localhost:9080/WSSampleSei/PingService, Port Name:PingService.PingServicePortHttpsSoap11Endpoint, Operation Name: pingOperation)
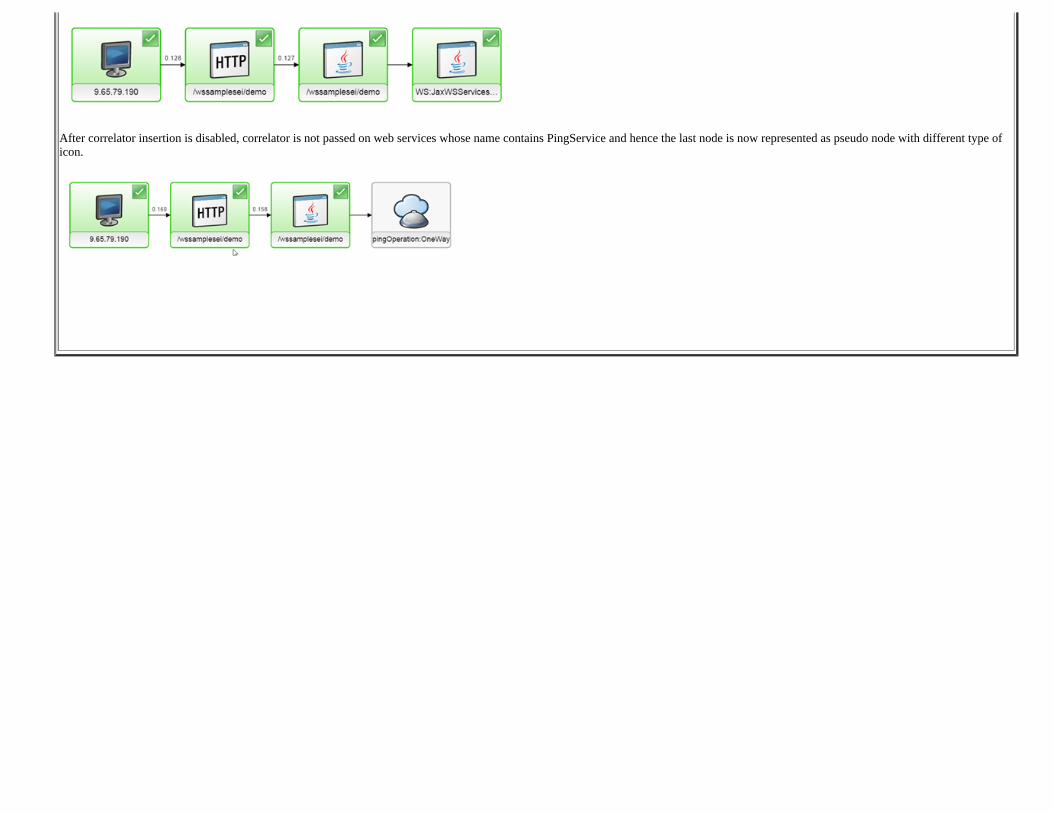
After correlator insertion is disabled, correlator is not passed on web services whose name contains PingService and hence the last node is now represented as pseudo node with different type oficon.
Troubleshooting - WebSphere Applications agent:Execeptions appear in the liberty server log afterconfiguring data collectorProblem:
After the data collector is configured to monitor a Liberty server based on Oracle JDK 1.8 on a Windows system,many exceptions are generated in the liberty server log. Most of the exceptions are indicated by the following errormessage or a similar one:
"java.lang.VerifyError: Expecting a stackmap frame.."....."Reason: Expected stackmap frame at this location. Bytecode: 0x0000000: 2ab7 013c 033c b200 2103 3399 001b 2a01 0x0000010: 1223 1301 3d12 2512 2712 2912 2b03 2ab6 0x0000020: 0031 b800 353c 2a04 b500 371b 9900 0801 0x0000030: 03b8 003d b11b 9900 0759 b800 54bf "
Cause:The problem is caused by Java 8 Update 11 or Java 7 Update 65, which has introduced a new bytecode verification. For details about this problem, see http://www.infoq.com/news/2014/08/Java8-U11-Broke-Tools.
Solution:
To solve this problem, set -noverify in JVM arguments to turn off class verification.
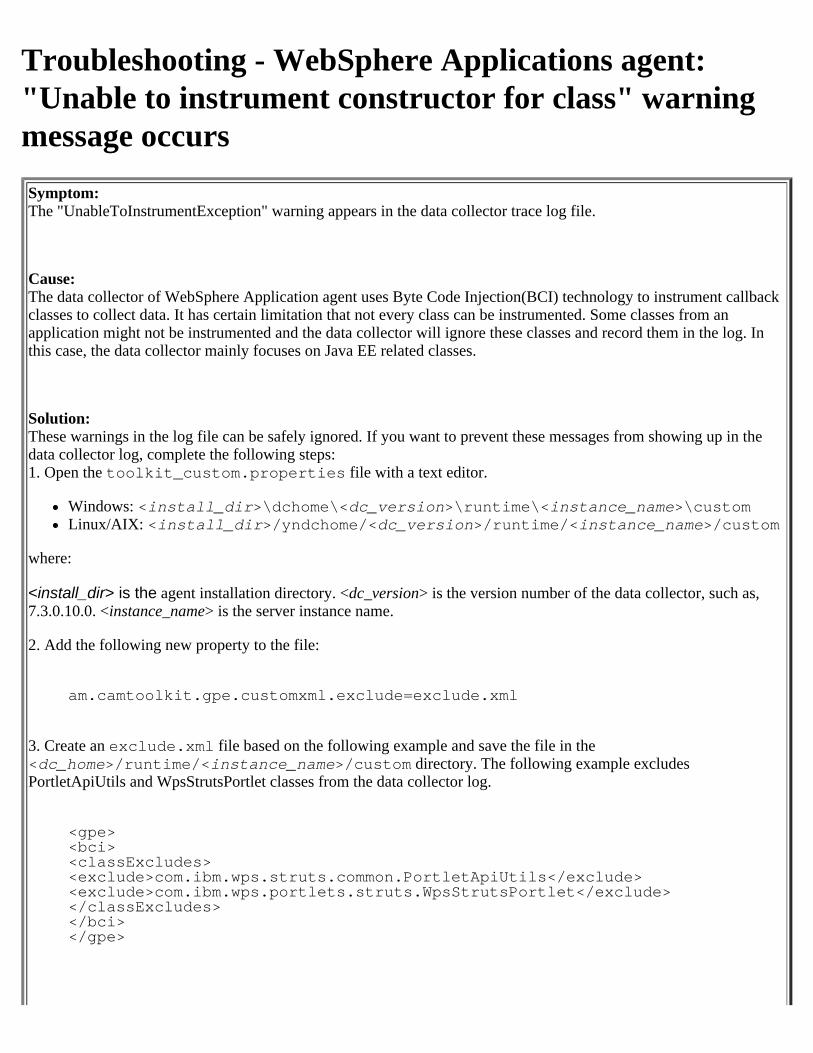
Troubleshooting - WebSphere Applications agent:"Unable to instrument constructor for class" warningmessage occursSymptom:The "UnableToInstrumentException" warning appears in the data collector trace log file.
Cause:The data collector of WebSphere Application agent uses Byte Code Injection(BCI) technology to instrument callbackclasses to collect data. It has certain limitation that not every class can be instrumented. Some classes from anapplication might not be instrumented and the data collector will ignore these classes and record them in the log. Inthis case, the data collector mainly focuses on Java EE related classes.
Solution:These warnings in the log file can be safely ignored. If you want to prevent these messages from showing up in thedata collector log, complete the following steps:1. Open the toolkit_custom.properties file with a text editor.
Windows: <install_dir>\dchome\<dc_version>\runtime\<instance_name>\customLinux/AIX: <install_dir>/yndchome/<dc_version>/runtime/<instance_name>/custom
where:
<install_dir> is the agent installation directory. <dc_version> is the version number of the data collector, such as,7.3.0.10.0. <instance_name> is the server instance name.
2. Add the following new property to the file:
am.camtoolkit.gpe.customxml.exclude=exclude.xml
3. Create an exclude.xml file based on the following example and save the file in the<dc_home>/runtime/<instance_name>/custom directory. The following example excludesPortletApiUtils and WpsStrutsPortlet classes from the data collector log.
<gpe><bci><classExcludes><exclude>com.ibm.wps.struts.common.PortletApiUtils</exclude><exclude>com.ibm.wps.portlets.struts.WpsStrutsPortlet</exclude></classExcludes></bci></gpe>

4. Restart WebSphere Application Server or Liberty server.
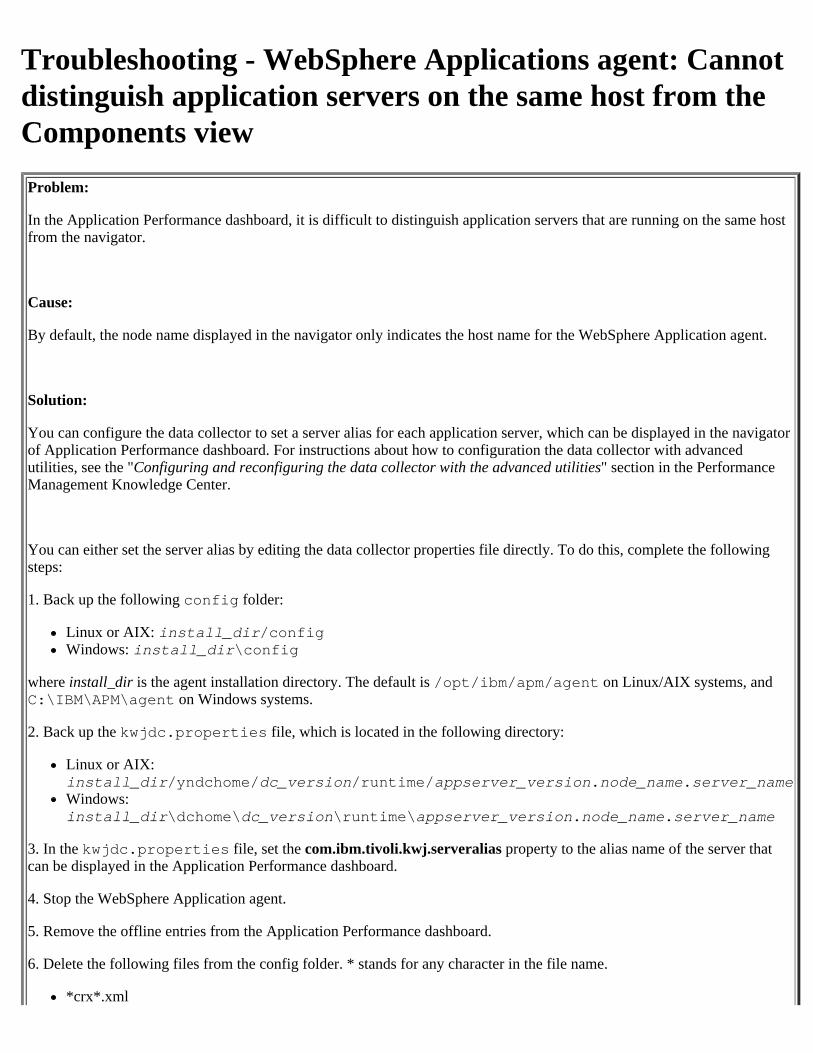
Troubleshooting - WebSphere Applications agent: Cannotdistinguish application servers on the same host from theComponents viewProblem:
In the Application Performance dashboard, it is difficult to distinguish application servers that are running on the same hostfrom the navigator.
Cause:
By default, the node name displayed in the navigator only indicates the host name for the WebSphere Application agent.
Solution:
You can configure the data collector to set a server alias for each application server, which can be displayed in the navigatorof Application Performance dashboard. For instructions about how to configuration the data collector with advancedutilities, see the "Configuring and reconfiguring the data collector with the advanced utilities" section in the PerformanceManagement Knowledge Center.
You can either set the server alias by editing the data collector properties file directly. To do this, complete the followingsteps:
1. Back up the following config folder:
Linux or AIX: install_dir/configWindows: install_dir\config
where install_dir is the agent installation directory. The default is /opt/ibm/apm/agent on Linux/AIX systems, andC:\IBM\APM\agent on Windows systems.
2. Back up the kwjdc.properties file, which is located in the following directory:
Linux or AIX:install_dir/yndchome/dc_version/runtime/appserver_version.node_name.server_nameWindows:install_dir\dchome\dc_version\runtime\appserver_version.node_name.server_name
3. In the kwjdc.properties file, set the com.ibm.tivoli.kwj.serveralias property to the alias name of the server thatcan be displayed in the Application Performance dashboard.
4. Stop the WebSphere Application agent.
5. Remove the offline entries from the Application Performance dashboard.
6. Delete the following files from the config folder. * stands for any character in the file name.
*crx*.xml

*_yn.xml
7. Start the WebSphere Application agent again.
8. Recycle the application server.
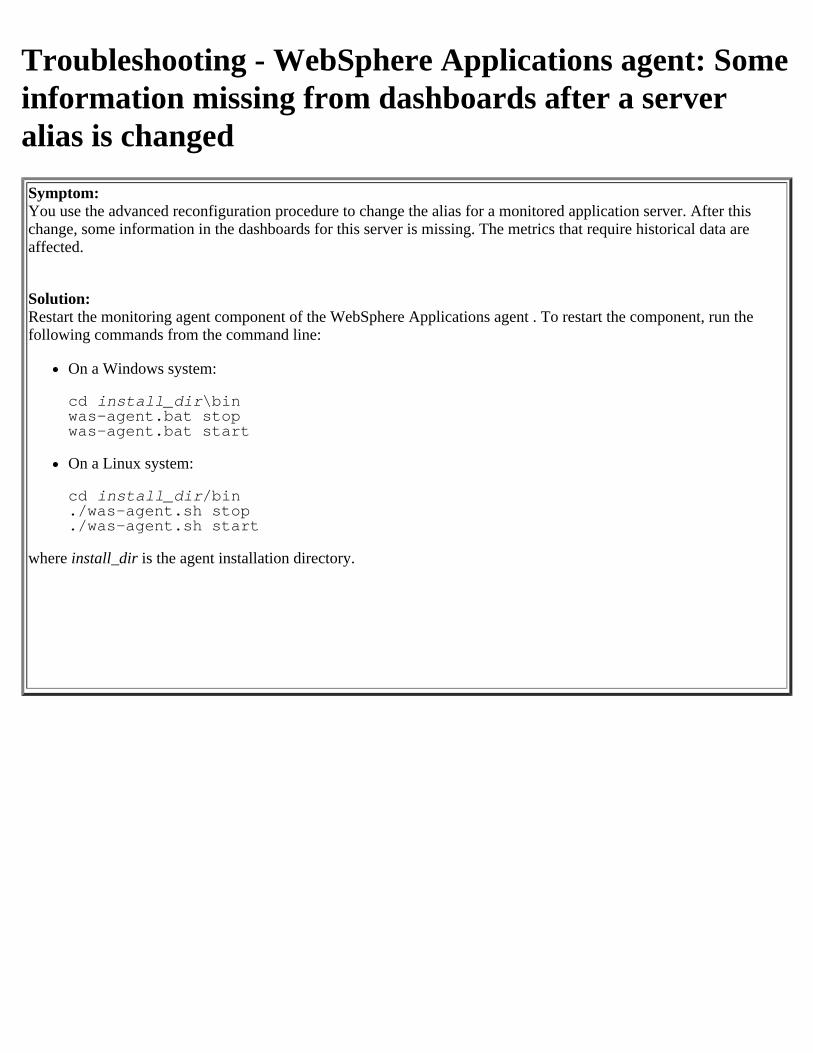
Troubleshooting - WebSphere Applications agent: Someinformation missing from dashboards after a serveralias is changedSymptom:You use the advanced reconfiguration procedure to change the alias for a monitored application server. After thischange, some information in the dashboards for this server is missing. The metrics that require historical data areaffected.
Solution:Restart the monitoring agent component of the WebSphere Applications agent . To restart the component, run thefollowing commands from the command line:
On a Windows system:
cd install_dir\binwas-agent.bat stopwas-agent.bat start
On a Linux system:
cd install_dir/bin./was-agent.sh stop./was-agent.sh start
where install_dir is the agent installation directory.
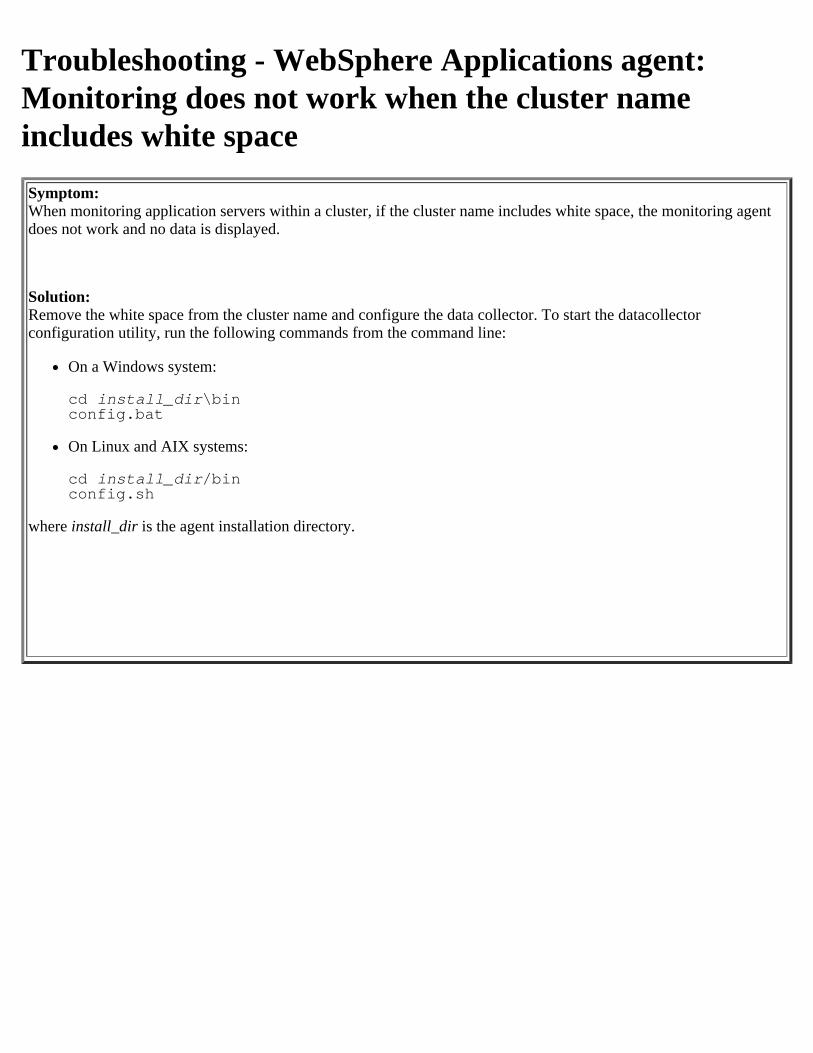
Troubleshooting - WebSphere Applications agent:Monitoring does not work when the cluster nameincludes white spaceSymptom:When monitoring application servers within a cluster, if the cluster name includes white space, the monitoring agentdoes not work and no data is displayed.
Solution:Remove the white space from the cluster name and configure the data collector. To start the datacollectorconfiguration utility, run the following commands from the command line:
On a Windows system:
cd install_dir\binconfig.bat
On Linux and AIX systems:
cd install_dir/binconfig.sh
where install_dir is the agent installation directory.
Troubleshooting - WebSphere Applications agent:'Unknown' is displayed for the application name in agroup widgetSymptom:In the WebSphere Applications group widget, the value 'unknown' might be displayed as the application name.
Cause:
The value 'unknown' might be displayed as the application name for one of the following reasons:
Some background requests were triggered that do not belong to any application.The data collector is unable to determine the application name from the application module.An exception occurred while the data collector was retrieving the application name.You are monitoring a WebSphere Liberty server. For WebSphere Liberty, the application name is not available.
Solution:No action is required.
Troubleshooting - WebSphere Applications agent:Resource monitoring does not workSymptom:When an application server instance is configured for PMI resource monitoring, without configuring the data collectorwithin the application server, no data is displayed.
The log files for the data collector might contain the following message:ADMC0016E: The system cannot create a SOAP connector
Solution:Complete the following steps:1. Ensure that the application server is running.2. Ensure that the DNS server is available and working properly.3. Run the data collector configuration script again to configure resource monitoring for the server instance. Do notconfigure the data collector within the application server.4. Restart the monitoring agent component of Agent for WebSphere Applications. To restart the component, run thefollowing commands from the command line:
On a Windows system:
cd install_dir\binwas-agent.bat stopwas-agent.bat start
On a Linux system:
cd install_dir/bin./was-agent.sh stop./was-agent.sh start
5. Wait 10 minutes and check the monitoring again.6. If no data is displayed, collect log file information using the kyncollect script and contact IBM support. Forinstructions about collecting log file information, see Collecting informationabout agent status.
Troubleshooting - WebSphere Applications agent:Errors and Warnings KPIs show normal status when nodata is availableSymptom:The Errors in log and Warnings in log key performance indicators (KPIs) on the dashboards in the Performance Management console show a status of normal (that is, green) when the agent is unconfigured.
Cause:
When there is no data available, the count of errors and warnings returns a value of zero.
Solution:When the agent is unconfigured, ignore that normal status that is displayed for the Errors in log and Warnings in log KPIs.
Troubleshooting - WebSphere Applications agent:Empty fields are displayed on the Events tabSymptom:On the Events tab of the Performance Management console, the Display Item and Node fields are empty.
Solution:The fields are not populated and can be ignored.
Troubleshooting - WebSphere Applications agent:Group widgets that rely on historical data are notupdatingSymptom:Some of the group widgets on the WebSphere Applications dashboards rely on historical data. If historical datacollection stops unexpectedly, the data in the group widgets is not refreshed.
Solution:Restart the monitoring agent component of the Monitoring Agent for WebSphere Applications. To restart thecomponent, run the following commands from the command line:
On a Windows system:
cd install_dir\binwas-agent.bat stopwas-agent.bat start
On a Linux system:
cd install_dir/bin./was-agent.sh stop./was-agent.sh start
where install_dir is the agent installation directory.
Troubleshooting - WebSphere Applications agent: Afterreconfiguring the agent for a WebSphere Portal server,a duplicate server appears in the user interfaceSymptom:The agent is configured to monitor a WebSphere Portal server. You use the reconfiguration utility to change monitoring settings for this server. A duplicate server appears in the user interface.
Solution:Unconfigure monitoring for the affected server and configure it again.
Tip: To avoid this issue, do not use the reconfiguration utility to change settings for a WebSphere Portal server. Instead, use the advanced configuration utility. This utility warns that the server is already configured, but still makes any required changes.
Troubleshooting - WebSphere Applications agent:Uninstallation of the agent fails on a Windows systemSymptom:When you uninstall the agent on a Windows system and you either do not stop the agent before you uninstall or aJMXServer process is still running, a message similar to the following message is displayed:
*Info* Stopping existing JMXServer instance nnnCannot delete "C:\IBM\ITM\dchome
Please exit any windows or files open under here.
Solution:To uninstall the agent, complete these steps:1. Stop the agent using the following commands, where install_dir is the agent installation directory:
cd install_dir\binwas-agent.bat stop
2. Issue the uninstallation command:
was-agent.bat uninstall
Troubleshooting - WebSphere Applications agent:Reconfiguring the agent to perform resource monitoringfailsSymptom:The agent is configured to monitor an application server instance with operational monitoring. You need to reconfigure the agent to monitor the server instance using PMI resource monitoring. However, the advanced reconfiguration utility does not make this change.
Solution:Use the unconfiguration utility to unconfigure the data collector for the application server instance. Then restart the application server instance and the monitoring agent component of the agent. For instructions on how to unconfigure the data collector, see Performance Management Knowledge Center.
Troubleshooting - IBM Integration Bus agent: Theintegration broker status is wrong on the dashboardProblem:On the IBM Integration Bus Summary dashboard, the integration broker status is Started but the broker has actually stopped.
Cause:This problem occurs when you stop the queue manager before you stop the broker, which is not a typical operation. The agent cannot get the broker status after the queue manager is disconnected.
Solution:To stop a broker, you can either stop only the broker, or stop the broker with its queue manager. Do not stop the queue manager before the broker. The IBM Integration Bus agent cannot get the broker data if the broker is not connected to its queue manager.
If the Queue manager connection status is NotConnected on the dashboard, the integration broker status displayed is the state of the broker before the queue manager stops, which might not be the actual broker status.
Troubleshooting - WebSphere Applications agent: Thejavax.management.InstanceNotFoundException errorfound in data collector logProblem:
When the WebSphere Applications agent is monitoring a Liberty profile server, thejavax.management.InstanceNotFoundException error is found in data collector trace files. The agent cannot getmonitoring data during the interval when this error occurs.
Cause:This problem has been reported in an APAR of WebSphere Application Server Liberty. For details of this APAR, seehttp://www-01.ibm.com/support/docview.wss?rs=180&uid=swg1PI32943.
Solution:Apply the fix for the APAR PI32943.
Troubleshooting - Installing or upgrading a componentstops other componentsSymptom:
The installation of Monitoring agent for Microsoft SQL forces the stop and restart of Monitoring agent for Windows OS.
Cause:
Before installing or upgrading any component (for example: framework, GSKit, JAVA, single agent type), Windows™ Installer temporarily stops all components currently running in the installed product location. The common installer remembers which components were previously running and restarts them after installation completes.
Solution:
When installing or upgrading components, you must manually restart any monitoring agent that is not automatically configured and started by the installer.

Troubleshoot Uninstalling Custom Agent - Can't seemodified version in APM I have a custom agent listening to SNMP. I have done some changes to the custom agent. (Product code and agent identifier are same). I have uninstalled previous agent and installed the newer version. I still see the attributes from previous version in APM dashboard.
What do I need to do to see modified agent?
Troubleshooting - WebSphere Applications agent: Thethread pool related widgets are blankProblem:
The following thread pool related widgets are blank:
Average Thread Pool UsageBusiest Thread Pools (history)Thread Pools[WebContainer] Usage (history)[WebContainer] - Average Pool Size (history)
Cause:
Only the default executor thread pool is supported by the WebSphere Application agent. If your application uses a thread pool other than the default, such as the large thread pool, the thread pool related widgets cannot display any information and are blank. For example, if the application is based on WebSphere Liberty, WebSphere Application Server chooses the thread pool based on the hardware threads that are available on the system.
Solution:
For data is available in these widgets, you must change the executor pool name to Default Executor by modifying the WebSphere Liberty server.xml file.
To do it, open the server.xml file and set the name attribute of the executor tag to Default Executor. If the executor tag does not exist in the file, create it.
Example:
<executor name="Default Executor" id="default" coreThreads="40"maxThreads="100" keepAlive="60s" stealPolicy="STRICT"rejectedWorkPolicy="CALLER_RUNS" />
Troubleshooting - WebSphere Applications agent:Incompatibility issues with Response Time MontoringAgentProblem:
If you have both WebSphere Application agent and Response Time Monitoring agent running on the same system, the WebSphere Application agent of Fix Pack 9 or higher is not compatible with Response Time Monitoring agent of Fix Pack 8 and earlier.
Cause:
The WebSphere Application agent upgraded the transaction tracking related functions in Fix Pack 9, which will cause the agent to be incompatible with Response Time Monitoring agent of an earlier version.
Solution:
It is recommended that you always use the same version of these two agents. For example, this incompatibility issue will arise when you have the WebSphere Application agent of Fix Pack 9 and Response Time Monitoring agent of Fix Pack 8 installed on the same system. To solve this problem, you can either upgrade the Response Time Monitoring agent to Fix Pack 9 or keep using the WebSphere Application agent of Fix Pack 8.
Note: For WebSphere Application agent of Fix Pack 8 or earlier, if you encounter the problem that Business Process Manager server fails to start. See the troubleshooting information here.
Troubleshooting - WebSphere Applications agent: Theagent causes the Business Process Manager to fail tostartProblem:
Business Process Manager (BPM) cannot be started. The log files indicate that it's the agent process that caused theproblem.
Cause:
The WebSphere Application agent whose version is earlier than Fix Pack 9 (on Cloud) or V8.1.1 (on premises) mightcause this problem. This problem has been fixed in Performance Management Fix Pack 9 (on Cloud) and V8.1.1 (onpremises), which were delivered in June 2015.
Solution:
To fix this problem, you can upgrade the WebSphere Application agent to Fix Pack 9 (on Cloud) / V8.1.1 (onpremises) or higher and then clear class caches. Alternatively, you can choose not to upgrade the agent, but onlyreplace some JAR files with the later version and clear class caches before starting the BPM server.
Upgrade the agent and fix the problem
1. Upgrade the WebSphere Application agent to Fix Pack 9 (on Cloud) / V8.1.1 (on premises) or later.
2. Stop the BPM server if it is running.
3. Clear the OSGi and class caches by running the following command:
Linux and AIX:
<bpm_profile_root>/bin/osgiCfgInit.sh
<bpm_profile_root>/bin/clearClassCache.sh
Windows:
<bpm_profile_root>\bin\osgiCfgInit.bat
<bpm_profile_root>\bin\clearClassCache.bat
where <bpm_profile_root> is installation directory of Business Process Manager profile. The default is/opt/IBM/WebSphere/AppServer/profiles/profile_name on Linux systems,/usr/IBM/WebSphere/AppServer/profiles/profile_name on AIX systems, andC:\IBM\WebSphere\AppServer\profiles\profile_name on Windows systems.
4. Restart the BPM server and check whether it starts correctly.
Stay on the current version and fix the problem
1. Download the installation image for WebSphere Application agent of Fix Pack 9 (on Cloud) / V8.1.1 (onpremises) or higher.
2. Stop the BPM server if it is running.
3. Find the following files in the installation image:
com.ibm.tivoli.itcam.classicsca_7.2.0.jarcom.ibm.tivoli.itcam.toolkitsca.classicsca_7.2.0.jar2
Tip: If you perform a fresh installation of the agent, you can find the files in theinstall_dir\agent\yndchome\dc_version\plugin directory on Windows systems or theinstall_dir/agent/yndchome/dc_version/bin directory on Linux and AIX systems, where:
install_dir is the agent installation directory. The default is C:\IBM\APM on Windows systems and/opt/ibm/apm on Linux and AIX systems.dc_version is the version number of the data collector, for example, 7.3.0.9.0.
4. Locate the two JAR files in the plugins directory of your current WebSphere Application agent, forexample, /opt/ibm/apm/agent/yndchome/7.3.0.8.0/plugins.
5. Overwrite the JAR files with the files you found in Step 2.
6. Clear the OSGi and class caches by running the following command:
Linux:
<bpm_profile_root>/bin/osgiCfgInit.sh
<bpm_profile_root>/bin/clearClassCache.sh
Windows:
<bpm_profile_root>\bin\osgiCfgInit.bat
<bpm_profile_root>\bin\clearClassCache.bat
where <bpm_profile_root> is installation directory of Business Process Manager profile. The default is/opt/IBM/WebSphere/AppServer/profiles/profile_name on Linux systems,/usr/IBM/WebSphere/AppServer/profiles/profile_name on AIX systems, andC:\IBM\WebSphere\AppServer\profiles\profile_name on Windows systems.
7. Restart the BPM server and check whether it starts correctly.
Troubleshooting - WebSphere Applications agent: Coredump errors occur when you enable method trace for anapplication serverSymptom:You might see OutofMemory errors when you enable method trace for an application server.Solution:Add an additional 128 MB to the current heap size on the application server. Complete these steps:1. Log in to the IBM WebSphere Application Server administrative console.2. Navigate to the Configuration tab on the administrative console:
a. Click Server > Application Servers and select the server_name.b. In the Configuration tab, navigate to Server Infrastructure > Java and ProcessManagement > Process Definition > Servant > Additional Properties: Java VirtualMachine.c. Edit the field Maximum Heap Size. If the default is not specified, then it assumes 256 MB.Add an additional 128 MB to the current heap size.
Troubleshooting - WebSphere Applications agent: Themaximum pool size KPI displays a value of 0Symptom:When no workload is generated for the DB connection pool, the maximum pool size KPI in the DB Connection Pools group widget displays a value of zero.Solution:Once workload is generated for the DB connection pool, the actual value of the maximum pool size KPI is shown.
Troubleshooting - WebSphere Applications agent:Prompt to migrate data collector when the version hasnot changedSymptom:After you upgrade your WebSphere Application agent, you might be prompted to migrate thedata collector even when no new version of the data collector was installed. After the upgradecompletes successfully, you might see a message similar to the following message:Please run : /opt/ibm/ccm/agent/install-images/kyn/dchome/7.3.0.3.0/bin/migrate.sh to upgrade to the new datacollectorlevel.Cause:When you update to a later maintenance level of the agent, the monitoring agent is upgraded butthe data collector is not.Solution:Verify that the data collector version has not changed. Complete these steps.1. Navigate to the dchome directory. The location is install_dir\dchome\ on Windows systems andinstall_dir/yndchome/ on Linux and AIX systems.2. Verify that no new DC_maintenance_level folder was not created. If no new folder wascreated, ignore the message.
Troubleshooting - WebSphere Applications agent:Script does not run when threshold conditions are metSymptom:In the Threshold Editor of the Performance Management console, in the Execute command field, you can specify a command or script to run when the conditions of a threshold are met. For thresholds defined for WebSphere Application Servers, the command or script does not run. Solution:A solution is not currently available.
Troubleshooting - WebSphere Applications agent: Norequest instances on the Request Instances dashboardSymptom:When you drill down from a request in the Requests with Slowest Response Time group widget to the Request Instances dashboard, you might not see any request instances in the Request Instances group widget. The Request Summary group widget is populated faster than the Request Instances group widget.Solution:Wait for the Request Instances group widget to update.
Troubleshooting - WebSphere Aplications agent:Servers missing from the managed systems list on theAgent Configuration pageSymptom:After you enable or disable method trace from the Agent Configuration page, occasionally, one or several of the servers disappear from the managed systems list. When the page refreshes, the servers reappear in the list.Solution:No action is required.
Troubleshooting - WebSphere Applications agent:Running the WebSphere update command failsSymptom:If you do not unconfigure the data collector before you delete an application server profile, data collector installation log and runtime data remains in the system, and running the WebSphereupdate command fails (typically with a JACL failed error message).Solution:Unconfigure the data collector for all monitored application server instances in a profile before deleting it.
Troubleshoting - WebSphere Applications agent:WebSphere Application Servers with duplicate nodesnames and host names are not displayed on the UISymptom:In WebSphere Liberty environments, when the same node name and host name is used for WebSphere Applications Servers across multiple virtual machines (VMs), only one node is displayed on the Performance Management console.Solution:In WebSphere Liberty environments, ensure that the node name and host name that are used for each WebSphere Application Server across VMs are unique.
Troubleshooting - WebSphere Applications Agent:Monitoring data for servers on a host is not availableafter the host was shut down abruptlySymptom:After a monitored host shuts down abruptly, monitoring of servers on the host stops. No data isdisplayed for the servers.Cause:Sometimes sudden shutdown leads to corruption of the monitoring agent configuration file.Because of the corrupted file, the monitoring agent component of WebSphere Applications agentfails to start.Solution:Complete the following steps:1. Change to the following directory:
On a Windows system, install_dir\TMAITM6_x64.On a Linux system, install_dir/config.
2. Rename the file hostname_yn.xml.3. Change to the following directory:
On a Windows system, install_dir\bin.On a Linux system, install_dir/bin.
4. Reconfigure and restart the monitoring agent component of the Monitoring Agent for WebSphere Applications:
On a Windows system, use a text editor (for example, Notepad) to create a new file namedresponse.txt with the following content:[INSTALLATION SECTION]License Agreement=I agree to use the software only in accordance with theinstalled license.Install Directory=install_dirInstall Folder=IBM Tivoli MonitoringEncryptionKey=IBMTivoliMonitoringEncryptionKey[FEATURES]KGL64CMA=Tivoli Enterprise Monitoring Agent Framework(86-x64 only)KYN64CMA=Monitoring Agent for WebSphere Applications(86-x64 only)[CMA_CONFIG]Protocol1=No TEMSFTO Flag=N[KYN_AGENT_CONFIG]configure_type=tema_configureIS_TEP=false
Save the file in the install_dir\bin directory, then run the following command:was-agent.bat config response.txt
On a Linux system, run the following command: ./was-agent.sh config
5. Restart the monitoring agent component of the Monitoring Agent for WebSphere Applications:
On a Windows system, run the following commands:

was-agent.bat stopwas-agent.bat start
On a Linux system, run the following commands:
./was-agent.sh stop
./was-agent.sh start
6. Back up the newly created hostname_yn.xml file.7. Delete the file that you renamed in step 2.

Troubleshooting - WebSphere Applications agent:Feature appears not to be enabled in the server.xml fileSymptom:In WebSphere Liberty environments, an error message similar to the following message mightappear in the default console log file (console.log) after the configuration of the data collectorupdates the server.xml file.[ERROR] CWWKE0702E: The bundle"com.ibm.tivoli.itcam.liberty.classloader.feature_72.0.6.qualifier [241]" could not be resolved. Reason: Missing Constraint:Import-Package:<class>; version="0.0.0"Where class is one of the following:
javax.servlet javax.servlet.http javax.servlet.jsp javax.jms javax.sql
Solution:The configuration of the data collector is not impacted. However, to resolve the issue, update the server.xml to include the missing packages.
Troubleshooting - WebSphere Applications agent:Erroneous server start failed message displayed whenWebSphere Liberty server restartsSymptom:A message similar to the following message is displayed on the console after a WebSphereLiberty server version 8.5.5.0, which has been configured for data collection, is restarted.Server <server_name> start failed. Check server logs for details.
Solution:The error message is displayed in error. For more information about the WebSphere Libertydefect that causes this error, see this APAR.To verify the status of a WebSphere Liberty server, complete these steps:1. Navigate to <WebSphere_liberty_profle_home>/bin.2. Issue the command server <server_name> status.The problem is fixed in WebSphere Liberty version 8.5.5.1.
Troubleshooting - WebSphere Applications agent:Server not monitored when it has the same alias asanother serverSymptom:When you use the advanced configuration utility (config.sh/bat) to configure the data collector and you assign the same alias name to different servers, only one server is monitored. Cause:The error occurs if you have assigned the aliases within a single execution of the configuration utility and when you run the utility multiples times to configure servers on the same node. The problem does not occur when you assign the same alias to servers on different nodes. Solution:Run the configuration utility and assign a unique alias to servers on the same node. To start the data collector configuration utility, run the following commands from the command line:On a Windows system:cd install_dir\dchome\7.3.0.9\bin config.batOn a Linux or AIX system:cd install_dir/yndchome/7.3.0.9/bin config.sh
Troubleshooting - Websphere Applications agent:Simple configuration process does not work onWebSphere Portal ServerSymptom:In a WebSphere Portal Server V7 environment, you cannot use the simple configuration process(that is, simpleconfig.bat/sh).
Solution:
Configure the data collector using the advanced configuration utility (that is config.bat/sh).
On Windows systems:install_dir\dchome\7.3.0.9\bin\config.batOn Linux and AIX systems:install_dir/yndchome/7.3.0.9/bin/config.sh
Troubleshoting - WebSphere Applications agent:Several ssl.client*.props files are created in the /tmpdirectorySymptom:When some application server instances are configured for only PMI resource monitoring (thedata collector is not configured within the application server) and the server instances are notrunning, ssl.client*.props files might be created under <tmp> directory. As the number of files being createdgrows, the file system might be impacted.
Solution:Complete one of the following solutions to either prevent the ssl.client*.props files from beingcreated or to reduce the number of files.
Ensure that all servers on the node that are enabled for resource monitoring are running.Remove the servers that are not running from the connection.properties file and restart the agent:
1. Open the connection.properties file in a text editor. On Linux systems, the file is located in theinstall_dir/yndchome/7.3.0.9/runtime/custom directory. On Windows systems, the fileis located in the install_dir\dchome\7.3.0.9\runtime\custom directory.2. Locate the lines for the servers that are not running and remove these lines.3. Save the file.4. Restart the agent.
On Windows systems:cd install_dir\binwas-agent.bat stopwas-agent.bat startOn Linux systems:cd install_dir/bin./was-agent.sh stop./was-agent.sh start
Create a cron script on Linux systems and a scheduled task on Windows systems to remove thessl.client*.props files periodically.
Troubleshooting: Websphere Applications agent: Non-ASCII characters are unreadable on the Log MessagesdashboardSymptom:If the WebSphere Application Server is enabled for a multibyte locale and log messages include non-ASCII characters, the characters are not readable on the Log Messages dashboard. Cause:A limitation in the current version of the agent.Solution:Use other means to view the log messages that include non-ASCII characters.
Troubleshooting - Can not see OS and Response timeAgent in Application Component tabI have installed IBM Performance Management Server 8.1
I have also configured and started Linux OS and Response Time agents.
I am trying to configure new application from APM console. I don't see any instances when I try selecting Linux OS agent from Application Component tab. How should I troubleshoot the issue?
Please check in logs /opt/ibm/apm/agent/logs/*klzagent* if agent connects to the server. If there is connection problem there should be entries that host can't be found.
These are last few lines from logs.
(55C222A9.0000-E:kraaomsg.cpp,942,"IRA_outputAgentMessage") *SFCP-INFO: Subscription Server Network Task started for server http://9.45.91.39:80/ccm/asf/request in FULL-DUPLEX mode.(55C222C6.0000-F:kbbssge.c,72,"BSS1_GetEnv") DNS_CACHE_REFRESH_INTERVAL="1"(55C22322.0000-7:kcawd.cpp,518,"checkAvailability") *** INFO: Starting Agent <kcawd> for the first time
I can also see the agent process is running and an open connection.[root@dpev247 os]# netstat -apo | grep '12799'unix 2 [ ACC ] STREAM LISTENING 5531507 12799/kcawd /opt/agents/os/lx8266/lz/bin/pasipc/.pas_wd_sock
Is the Application Component tab is where I should see it automatically? Or any other configuration needed.
Issue was caused by umask setting on the system when installing server. It was set to 0077, changing to 0022 fixed the problem.
Troubleshooting - WebSphere Applications agent:Liberty server does not start after it was configured formonitoringSymptomAfter you configure the data collector to monitor a WebSphere Application Server Liberty instance, the instance fails to start.
The server fails to start with the following message:Server server_name start failed. Check server logs for details
The console.log file, or the console if the server is started using the run option, contains a line with the following error message:JVMJ9TI001E Agent library am_ibm_16 could not be opened
Cause
The error message indicates that the version of JRE used to start the WebSphere Liberty server is different from the version of JRE used to run the configuration utility. As a WebSphere Libertyserver does not provide its own JRE, you must use the same version of JRE (bitness and vendor) for running the configuration utility and running the WebSphere Liberty server.
SolutionSet the JAVA_HOME environment variable to the version of the JRE that is used to run the Liberty server, and then rerun the configuration utility.
Troubleshooting - WebSphere Applications agent: Datacollector configuration fails with network interfaceerrorSymptomThe data collector configuration script fails with an error message that includes a failure in thejava.net.NetworkInterface.getNetworkInterfaces method.
Cause
This error happens with certain versions of the IBM JDK, including the 32-bit version that was shipped withWebSphere Application Server 8.0. It happens only when the host name is not set on the computer.
SolutionComplete one of the following steps:
Upgrade WebSphere Application Server to a recent fix pack. The versions of the IBM JDK included in recentfix packs do not have this issue.Set the JAVA_HOME environment variable to a different version of the IBM JVM. Version 1.5 or later isrequired.Configure the TCP/IP settings to set a valid host name.
Troubleshooting - WebSphere Applications agent: OnLinux systems, migrating the data collector failsSymptomIf you install a WebSphere application server or portal server on a Linux system using a non-root user account, themigration of the WebSphere Applications data collector fails.
Cause
If you use a non-root user account to install the application server, you need to ensure the account has sufficientpermissions for the agent files.
SolutionEnsure the account that you used to install the application server has read and write privileges to the following agentdirectories:
install_dir/yndchome/version/datainstall_dir/yndchome/version/bininstall_dir/yndchome/version/runtimeinstall_dir/yndchome/version/logs
where install_dir is the agent installation directory; version is the version of the data collector, for example, 7.3.0.9.0.
If required, assign privileges using the chmod 777 command and restart the migration utility. Change to theinstall_dir/yndchome/version/bin directory and run the migrate.sh command ininteractive or silent mode command with user root privileges. If the wsadmin user was used to install the applicationserver, run the simpleconfig.sh utility as the wsadmin user.
Follow the instructions in the "Migrating the data collector" section on Performance Management Knowledge Center.
Troubleshooting - WebSphere Applications agent: OnLinux systems, configuring the data collector failsSymptomIf you install a WebSphere application server or portal server on a Linux system using a non-root user account, theconfiguration of the WebSphere Applications data collector fails.
Cause
If you use a non-root user account to install the application server, you need to ensure the account has sufficientpermissions for the agent files.
SolutionEnsure the account that you used to install the application server has read and write privileges to the following agentdirectories:
install_dir/yndchome/version/datainstall_dir/yndchome/version/bininstall_dir/yndchome/version/runtimeinstall_dir/yndchome/version/logs
where install_dir is the agent installation directory; version is the version of the data collector, for example, 7.3.0.9.0.
If required, assign privileges using the chmod 777 command and restart the configuration utility. To run the simpleconfiguration utility, change to the install_dir/yndchome/version/bin directory and run thesimpleconfig.sh command with user root privileges. If the wsadmin user was used to install the application server,run the simpleconfig.sh utility as the wsadmin user.
Follow the instructions in the "Configuring the data collector for WebSphere Applications agent" section onPerformance Management Knowledge Center. If you are monitoring a portal server or reconfiguring the datacollector, see the "Configuring and reconfiguring the data collector with the advanced utilities".
Troubleshooting - WebSphere Applications agent:Upgrading the agent failsSymptomOn a Windows system, when you upgrade the agent, the upgrade might fail.
Cause
An upgrade fails if another process is using the ITM JRE. The upgrade process polls several processes to determine if they are running. When the ITM JRE process is polled, if it is running,the upgrade is not allowed.
SolutionStop the process that is using the ITM JRE. If the WebSphere Application Server is using the ITM JRE, stop the WebSphere Application Server.
Troubleshooting - WebSphere Applications agent:Agent installation fails with permission errors under anon-root userSymptomOn Linux systems, under a non-root user account, installation of the agent fails. A Permission denied error messages are displayed.
Cause
Installation under a non-root user account is not supported.
SolutionUse the root account to install the agent.
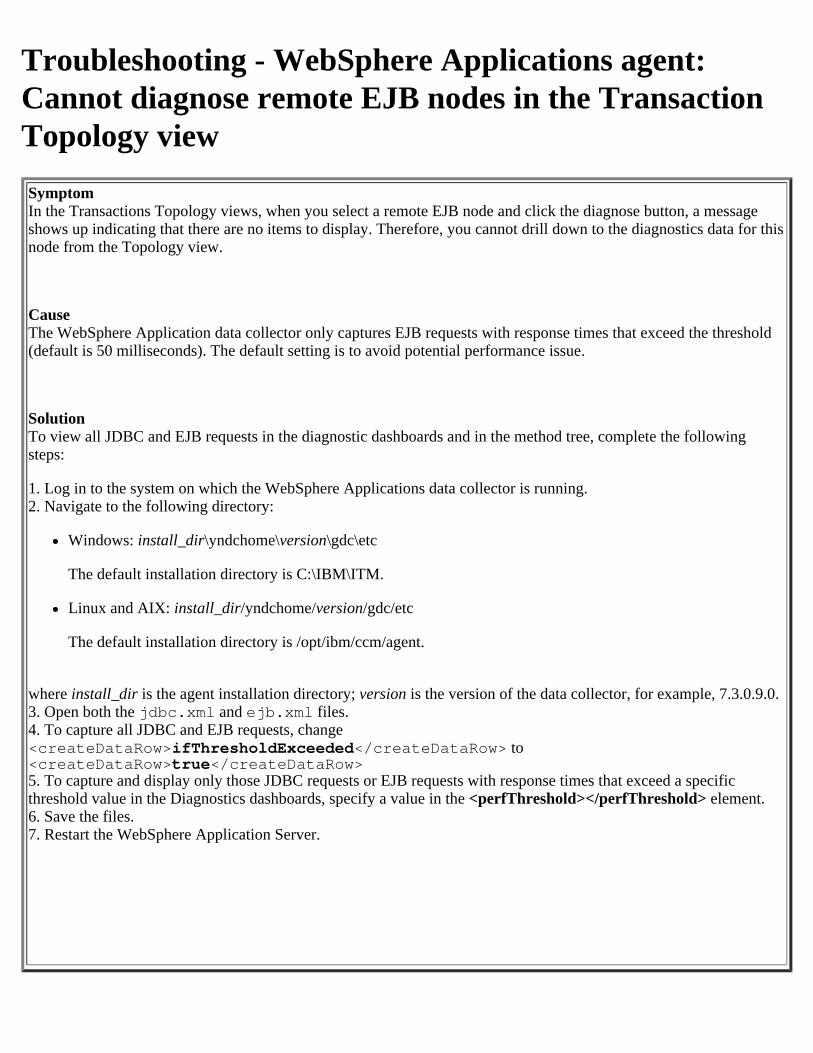
Troubleshooting - WebSphere Applications agent:Cannot diagnose remote EJB nodes in the TransactionTopology viewSymptomIn the Transactions Topology views, when you select a remote EJB node and click the diagnose button, a messageshows up indicating that there are no items to display. Therefore, you cannot drill down to the diagnostics data for thisnode from the Topology view.
CauseThe WebSphere Application data collector only captures EJB requests with response times that exceed the threshold(default is 50 milliseconds). The default setting is to avoid potential performance issue.
SolutionTo view all JDBC and EJB requests in the diagnostic dashboards and in the method tree, complete the followingsteps:
1. Log in to the system on which the WebSphere Applications data collector is running.2. Navigate to the following directory:
Windows: install_dir\yndchome\version\gdc\etc
The default installation directory is C:\IBM\ITM.
Linux and AIX: install_dir/yndchome/version/gdc/etc
The default installation directory is /opt/ibm/ccm/agent.
where install_dir is the agent installation directory; version is the version of the data collector, for example, 7.3.0.9.0.3. Open both the jdbc.xml and ejb.xml files.4. To capture all JDBC and EJB requests, change<createDataRow>ifThresholdExceeded</createDataRow> to<createDataRow>true</createDataRow>5. To capture and display only those JDBC requests or EJB requests with response times that exceed a specificthreshold value in the Diagnostics dashboards, specify a value in the <perfThreshold></perfThreshold> element.6. Save the files.7. Restart the WebSphere Application Server.
Troubleshooting - WebSphere Applications agent: TheCTIRA_LOG_PATH variable does not workSymptomAfter you modify the CTIRA_LOG_PATH value to change the log path, only part of the log files are saved in thenew directory. Other log files are still saved in the previous directory.
Cause
Two variables control the log path of the WebSphere Applications agent in the .yn.environment file. You mustconfigure both of them to change the log path.
SolutionIn the .yn.environment file, change both the CTIRA_LOG_PATH and LOGSHOME variables to thedirectory where you want to save the log files. The .yn.environment file is in the following directory:
Windows system: install_dir\TMAITM6_x64Linux system: install_dir/config
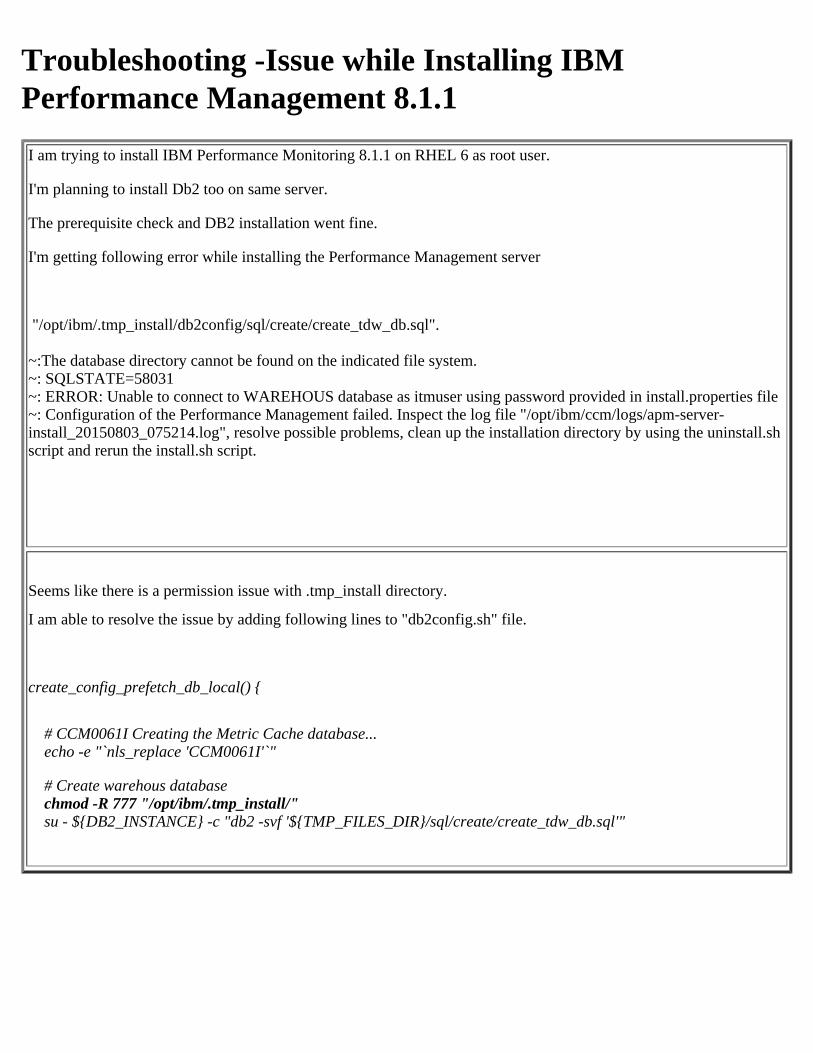
Troubleshooting -Issue while Installing IBMPerformance Management 8.1.1I am trying to install IBM Performance Monitoring 8.1.1 on RHEL 6 as root user.
I'm planning to install Db2 too on same server.
The prerequisite check and DB2 installation went fine.
I'm getting following error while installing the Performance Management server
"/opt/ibm/.tmp_install/db2config/sql/create/create_tdw_db.sql".
~:The database directory cannot be found on the indicated file system.~: SQLSTATE=58031~: ERROR: Unable to connect to WAREHOUS database as itmuser using password provided in install.properties file ~: Configuration of the Performance Management failed. Inspect the log file "/opt/ibm/ccm/logs/apm-server-install_20150803_075214.log", resolve possible problems, clean up the installation directory by using the uninstall.sh script and rerun the install.sh script.
Seems like there is a permission issue with .tmp_install directory.
I am able to resolve the issue by adding following lines to "db2config.sh" file.
create_config_prefetch_db_local() {
# CCM0061I Creating the Metric Cache database... echo -e "`nls_replace 'CCM0061I'`"
# Create warehous database chmod -R 777 "/opt/ibm/.tmp_install/" su - ${DB2_INSTANCE} -c "db2 -svf '${TMP_FILES_DIR}/sql/create/create_tdw_db.sql'"
Troubleshooting - Ruby agent: unexpected warningmessages during agent configurationSymptom
During the configuration process, you might see the following warning messages:
insserv: warning: script 'S01ITMAgents3' missing LSB tagsinsserv: warning: script 'ITMAgents3' missing LSB tags
Cause
These warning are caused by the agent missing some tags required by the chkconfig utility, used to manage system start-up files.
Solution
These warning messages will not affect the Performance Management agent configuration and can be safely ignored.
Troubleshooting - Response Time Monitoring agent:CMS database option missing in iKeymanSymptom: After exporting SSL certificates from a web server to the KFC Keystore, you cannot create a new keystore database and import the new key using iKeyman because the CMS option is missing from the Key database type list.
Cause: If you are using Java Runtime Environment 6 or later in your IBM Tivoli Monitoring environment to run the iKeyman utility to create the CMS keystore database, you must first enable the CMS provider in the Java Runtime Environment security file.
Solution: To enable the CMS provider, add the following phrase to theAGENT_HOME\TMAITM6\java60\jre\lib\security\java.security file:security.provider.10=com.ibm.security.cmskeystore.CMSProvider
Troubleshooting - Response Time Monitoring agent: noactive Response Time process foundSymptom: You might encounter an error when you attempt to start the kfcm120 process as a non-root user: No active WRM Process found.
Cause: The kfcm120 process fails to start because it cannot open the NIC. The kfcm120 process must run as root. Root is needed to communicate with the Network Interface.
Solution: To resolve this problem, reinstall the Response Time Monitoring agent and run the kfcm120 process as root using sudo or sm3ctl.
Troubleshooting - Response Time Monitoring agent:turning on debug tracingTo turn on debug tracing in Windows:
1. In the TEMS, right-click the TEMA.2. Select Advanced -> Edit Trace Parms.3. Set the RAS1 Filter to ERROR (UNIT:kt2 ALL) (UNIT:kt5 ALL) (UNIT:kra ALL) (UNIT:clog STATE).4. Restart the TEMA.
To turn on debug tracing in UNIX:
1. Edit the /opt/IBM/ITM/config/t*.ini file.2. Replace the KBB_RAS1='ERROR' line with the KBB_RAS1=ERROR (UNIT:kt2 ALL) (UNIT:kt5 ALL)
(UNIT:kra ALL) (UNIT:clog STATE) line.3. Restart the TEMA.
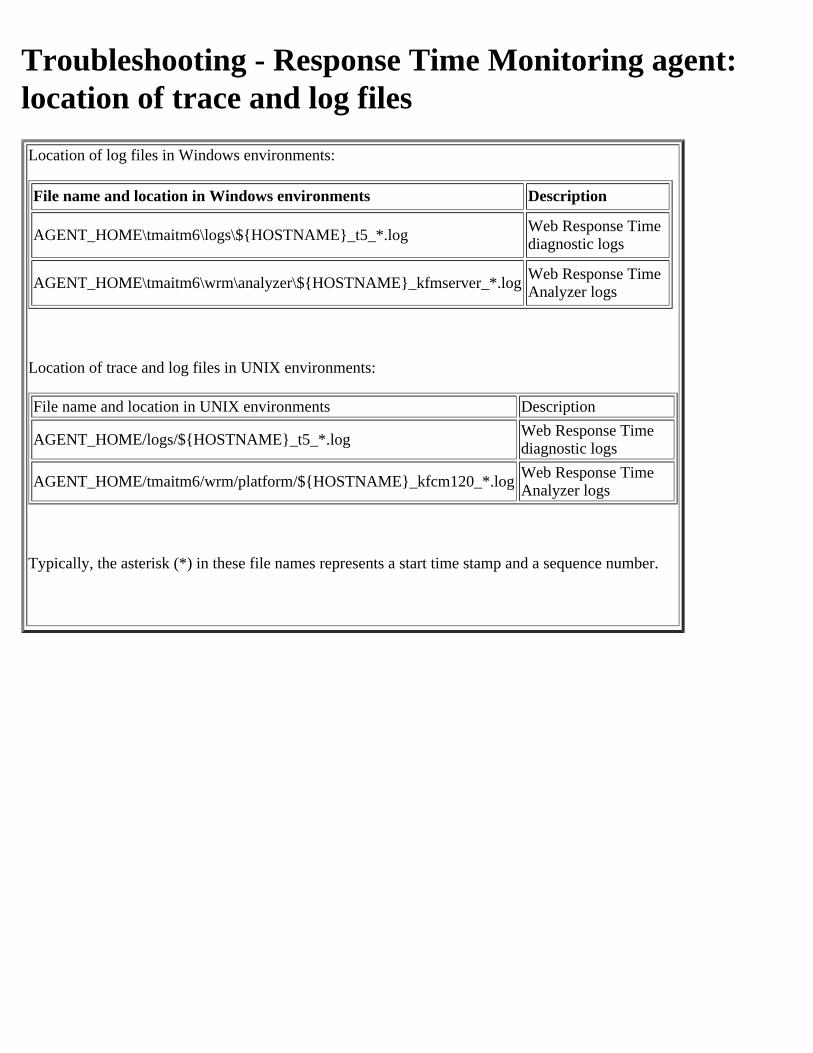
Troubleshooting - Response Time Monitoring agent:location of trace and log filesLocation of log files in Windows environments:
File name and location in Windows environments Description
AGENT_HOME\tmaitm6\logs\${HOSTNAME}_t5_*.log Web Response Timediagnostic logs
AGENT_HOME\tmaitm6\wrm\analyzer\${HOSTNAME}_kfmserver_*.log Web Response TimeAnalyzer logs
Location of trace and log files in UNIX environments:
File name and location in UNIX environments Description
AGENT_HOME/logs/${HOSTNAME}_t5_*.log Web Response Timediagnostic logs
AGENT_HOME/tmaitm6/wrm/platform/${HOSTNAME}_kfcm120_*.log Web Response TimeAnalyzer logs
Typically, the asterisk (*) in these file names represents a start time stamp and a sequence number.
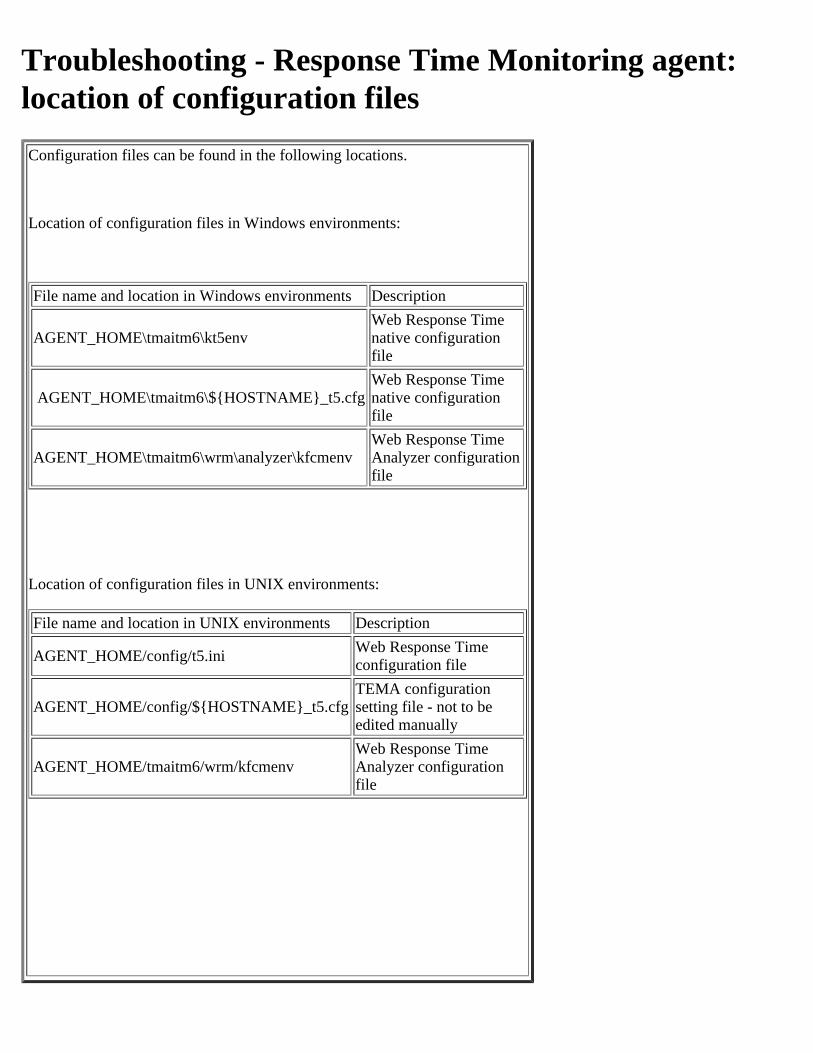
Troubleshooting - Response Time Monitoring agent:location of configuration filesConfiguration files can be found in the following locations.
Location of configuration files in Windows environments:
File name and location in Windows environments Description
AGENT_HOME\tmaitm6\kt5env Web Response Timenative configurationfile
AGENT_HOME\tmaitm6\${HOSTNAME}_t5.cfgWeb Response Timenative configurationfile
AGENT_HOME\tmaitm6\wrm\analyzer\kfcmenvWeb Response TimeAnalyzer configurationfile
Location of configuration files in UNIX environments:
File name and location in UNIX environments Description
AGENT_HOME/config/t5.ini Web Response Timeconfiguration file
AGENT_HOME/config/${HOSTNAME}_t5.cfgTEMA configurationsetting file - not to beedited manually
AGENT_HOME/tmaitm6/wrm/kfcmenvWeb Response TimeAnalyzer configurationfile
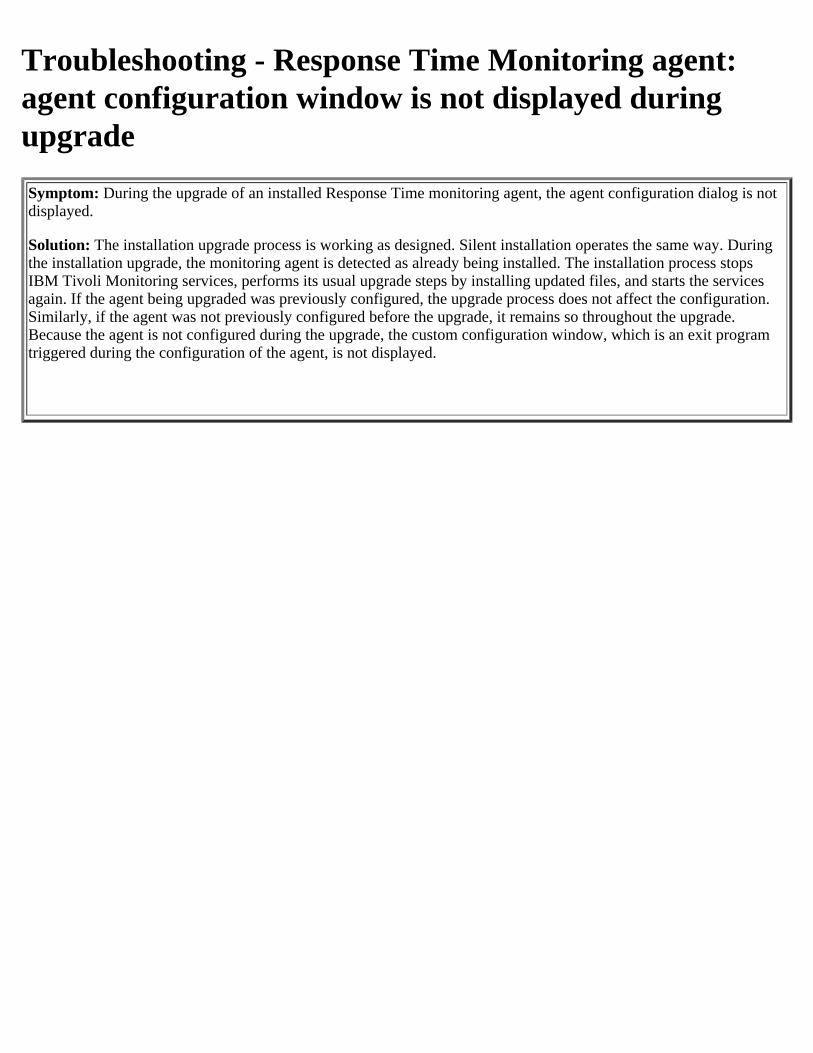
Troubleshooting - Response Time Monitoring agent:agent configuration window is not displayed duringupgradeSymptom: During the upgrade of an installed Response Time monitoring agent, the agent configuration dialog is not displayed.
Solution: The installation upgrade process is working as designed. Silent installation operates the same way. During the installation upgrade, the monitoring agent is detected as already being installed. The installation process stops IBM Tivoli Monitoring services, performs its usual upgrade steps by installing updated files, and starts the services again. If the agent being upgraded was previously configured, the upgrade process does not affect the configuration. Similarly, if the agent was not previously configured before the upgrade, it remains so throughout the upgrade. Because the agent is not configured during the upgrade, the custom configuration window, which is an exit program triggered during the configuration of the agent, is not displayed.
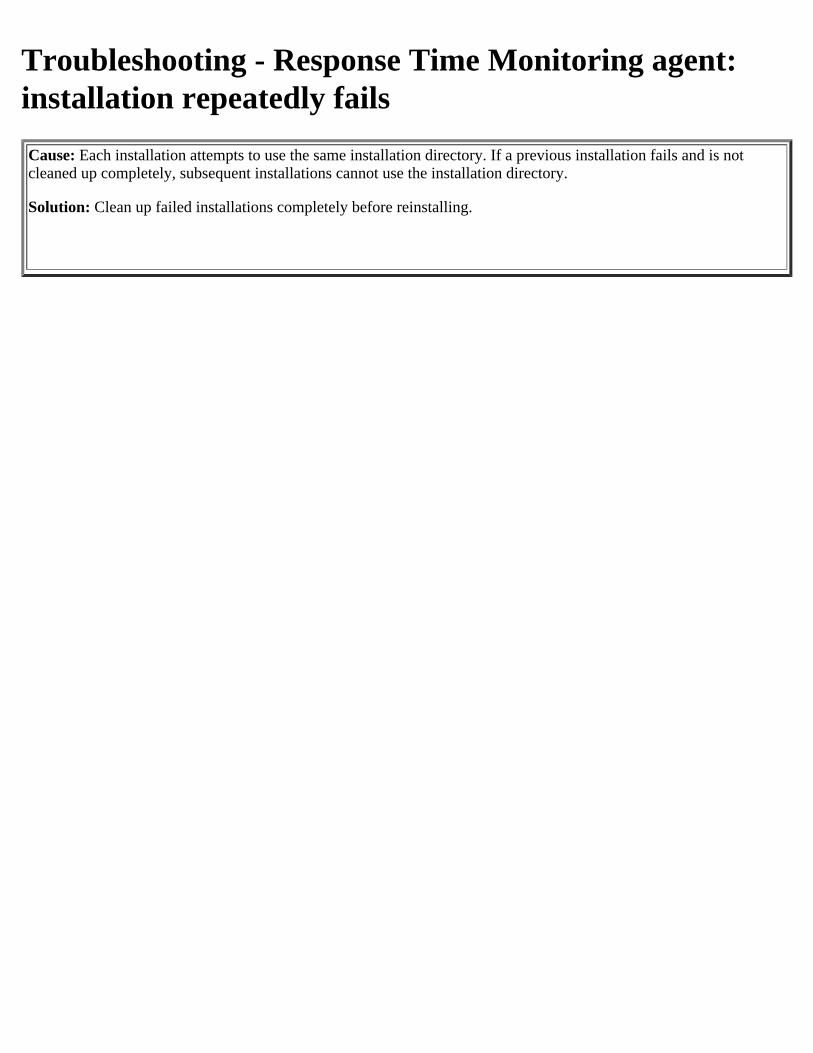
Troubleshooting - Response Time Monitoring agent:installation repeatedly failsCause: Each installation attempts to use the same installation directory. If a previous installation fails and is not cleaned up completely, subsequent installations cannot use the installation directory.
Solution: Clean up failed installations completely before reinstalling.
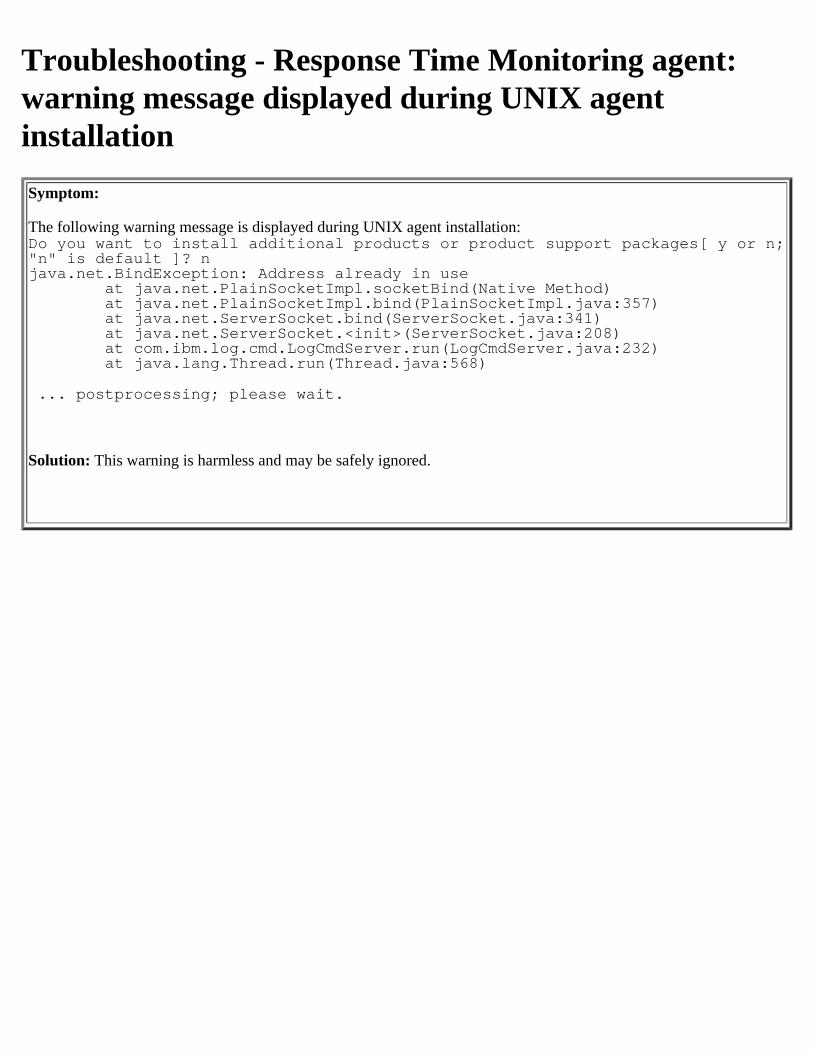
Troubleshooting - Response Time Monitoring agent:warning message displayed during UNIX agentinstallationSymptom:
The following warning message is displayed during UNIX agent installation:Do you want to install additional products or product support packages[ y or n;"n" is default ]? njava.net.BindException: Address already in use
at java.net.PlainSocketImpl.socketBind(Native Method) at java.net.PlainSocketImpl.bind(PlainSocketImpl.java:357) at java.net.ServerSocket.bind(ServerSocket.java:341) at java.net.ServerSocket.<init>(ServerSocket.java:208) at com.ibm.log.cmd.LogCmdServer.run(LogCmdServer.java:232) at java.lang.Thread.run(Thread.java:568)
... postprocessing; please wait.
Solution: This warning is harmless and may be safely ignored.
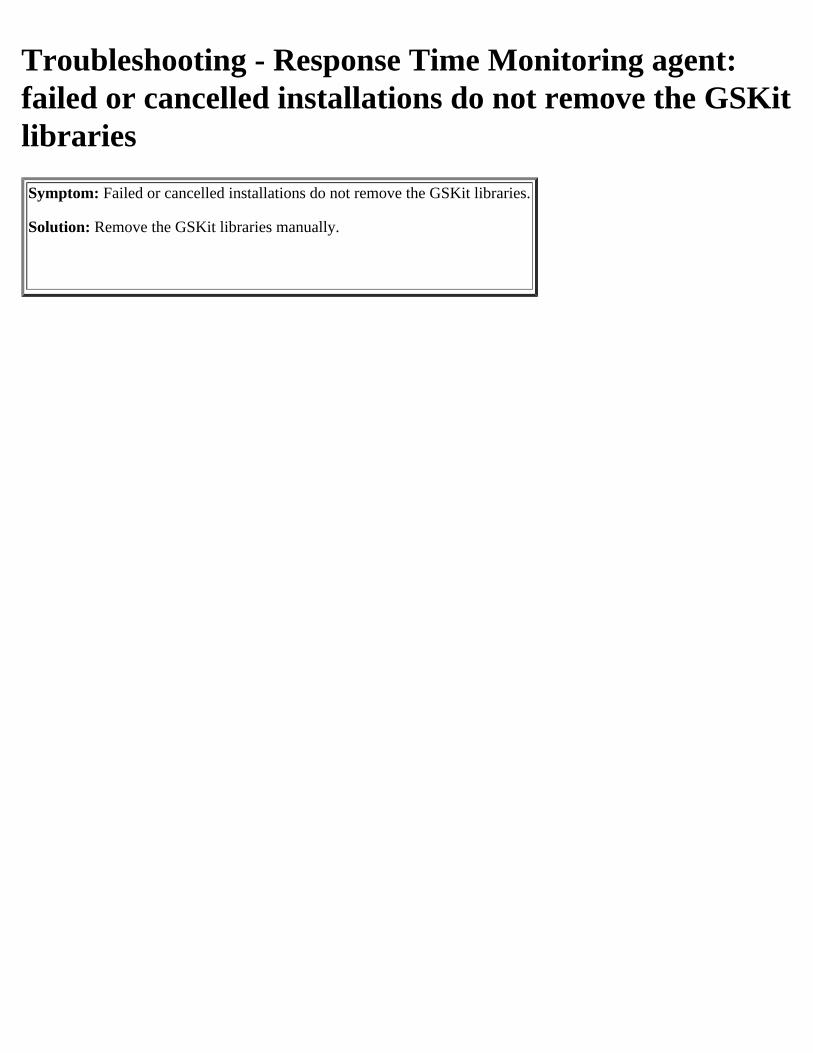
Troubleshooting - Response Time Monitoring agent:failed or cancelled installations do not remove the GSKitlibrariesSymptom: Failed or cancelled installations do not remove the GSKit libraries.
Solution: Remove the GSKit libraries manually.
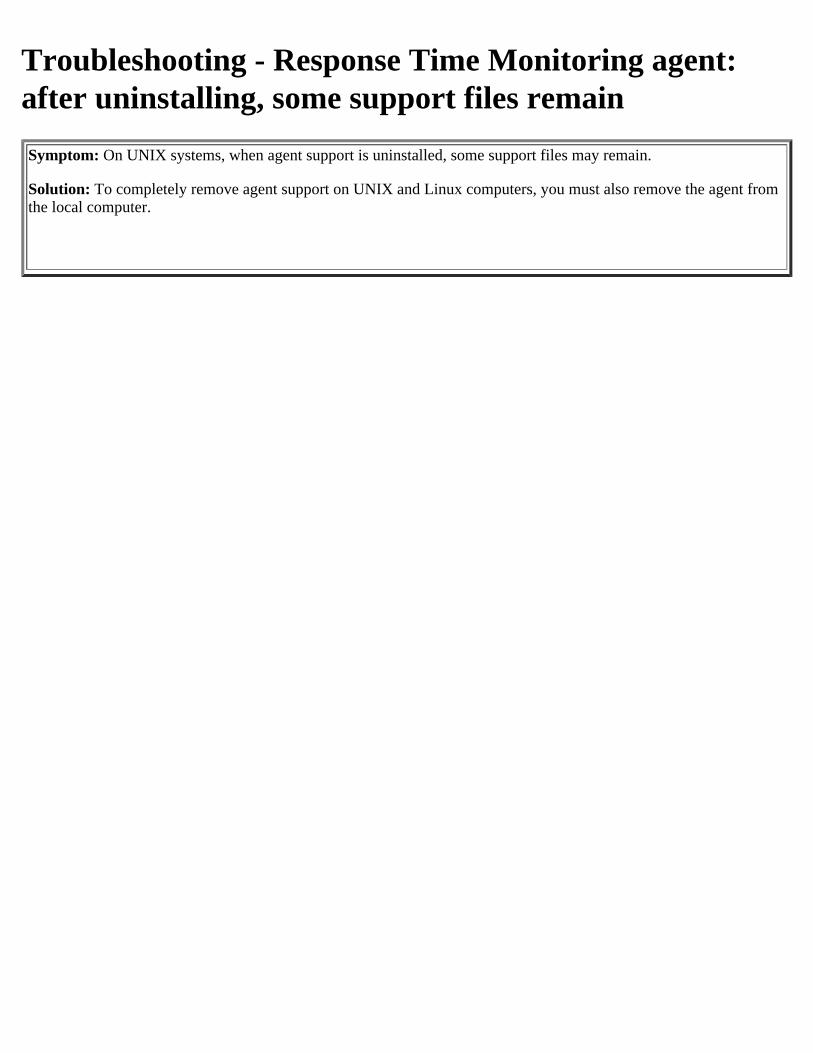
Troubleshooting - Response Time Monitoring agent:after uninstalling, some support files remainSymptom: On UNIX systems, when agent support is uninstalled, some support files may remain.
Solution: To completely remove agent support on UNIX and Linux computers, you must also remove the agent from the local computer.
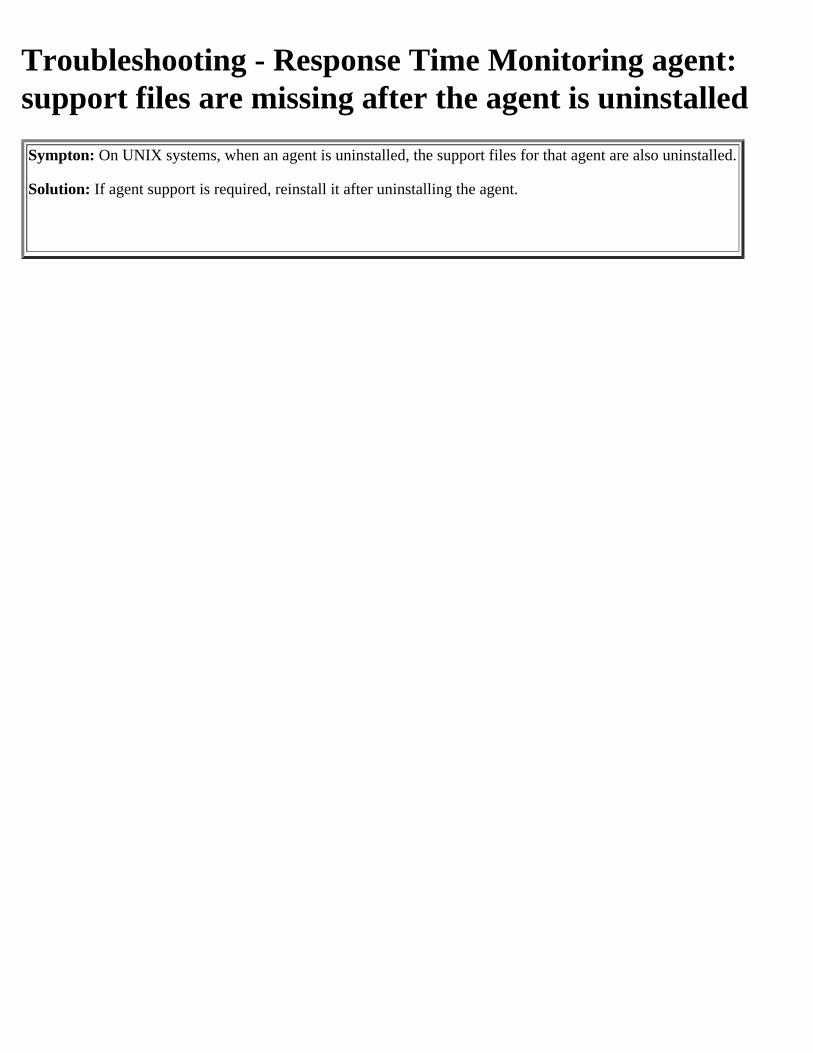
Troubleshooting - Response Time Monitoring agent:support files are missing after the agent is uninstalledSympton: On UNIX systems, when an agent is uninstalled, the support files for that agent are also uninstalled.
Solution: If agent support is required, reinstall it after uninstalling the agent.
Troubleshooting - Response Time Monitoring agent:changing file permission error occurs when upgradingthe agent with a non-root user IDSympton: On Linux or UNIX systems, a changing permission error occurs when upgrading the agent with a non-rootuser ID.
Solution: Upgrade the agent as the root user and then follow the instructions for "Changing file permissions" in theITCAM for Transactions Installation and Configuration Guide to grant permissions to a non-root user for running theagent.
Troubleshooting - Response Time Monitoring agent:cannot start agents if the upgrade process is cancelledSympton: If the upgrade process for a Response Time agent is cancelled before it finishes, you might not be able to start the agent again.
Solution: Allow the upgrade process to complete after it has started. Cancelling the upgrade process might damage the configuration files, and prevent the agent from starting correctly.
Troubleshooting - WebSphere Applications agent: TheLog Messages (last 100 messages) widget is emptySymptom:
The Log Messages (last 100 messages) widget is empty, even though there are log messages in theSystemOut.log file.
Explanation:
The Log Messages (last 100 messages) widget displays the most recent 100 error and warning log messages that arewritten in the SystemOut.log file during the past 10 minutes. If there are no error or warning messages generated during the past 10 minutes, this widget is empty.
Troubleshooting: Reports: Application PerformanceUsage report returns: XQE-GEN-0018Symptom
In the Application Performance and Usage report, on the Select Key Transaction for Application prompt page,when you select one or more transactions, the following error message is displayed:
XQE-GEN-0018 Query Service internal error has occurred, please see the log for details.
SolutionWait for weekly aggregation to run, and run the report again. The Application Performance and Usage reportdisplays data for an application that is based on the weekly aggregated table. When the weekly aggregated tablecontains no transactions for the application, for example, if weekly aggregation did not run yet, the report failsto get data and returns an error.
A similar error may also occur:
XQE-GEN-0002 An unexpected exception occurred: java.lang.StackOverflowError
Which has the same solution.
Troubleshooting: Reports: Transaction Data Volume =0 when using IHS Plugin for Response Time
Symptom
When using the IHS Plugin for the Response Time Agent the Transaction Data Volume is not reported in any of the Cognos Reports. Transaction count/volume is, however, present.
WorkaroundInstead of using the IHS Plugin you could consider changing to use the packet capture method ofmonitoring the IBM HTTP Server.
Troubleshooting - Response Time Monitoring agentV8.1.1 may stop sending transaction tracking data afterupgrade of APM Server from 8.1.0 to 8.1.1
Symptom:
Transaction Instances list and Transaction Instance topology may be blank/empty after the APM Server gets upgraded from 8.1.0 to 8.1.1
Cause:During the upgrade/migration of the APM Server it may disable Transaction Tracking for the Response Time Agent for a short time then re-enable, but the re-enable is not effective.
Solution:
Restart the Response Time Monitoring agents.
Troubleshooting - IPM8.1.1: Automatic log off afterselecting Application Performance DashboardAutomatic user log off after selecting Application Performance Dashboard
Symptom:
After starting the Performance Management console and selecting the Application Performance Dashboard (from thePerformance menu in the navigation bar or from the Getting Started page under View application status > Start Now),you are automatically logged out. If you select System Configuration or other menu options, no log out occurs; onlywhen you select the dashboard.
Cause:
A timing issues causes the user interface to perceive the Role Based Access Control (RBAC) service as unavailableand thus assume that no user is authorized to access the application dashboards.
Solution:
1. Stop and restart server1 with the apm stop_server1 and apm_start_server1 commands as described inhttp://www-01.ibm.com/support/knowledgecenter/SSHLNR_8.1.1/com.ibm.pm.doc/install/admin_server_startstop.htm.
2. Log in to the Performance Management console.
Troubleshooting - WebSphere MQ agent terminatesSymptom:The WebSphere MQ agent terminates and the error message indicates that there is signal memory access violation.
Errors similar to the following ones can also be found in the log file:(5553A53A.005C-1:kraaumsg.cpp,107,"CTRA_msg_no_transports") CTRA Server: no transports available, ffffffff. Server shutting down(5553A53A.005D-1:kraafmn.cpp,772,"kglpsrvr") RegisterHandlers() returned error code: -1!(5553A53A.005E-1:kraafmn.cpp,773,"kglpsrvr") Ignoring server start-up request!
Cause:This problem is caused by the host name, which is composed completely of digits. A fully numeric host name cannot be resolved to correct IP address.
Solution:Do not use a fully numeric string as the host name.
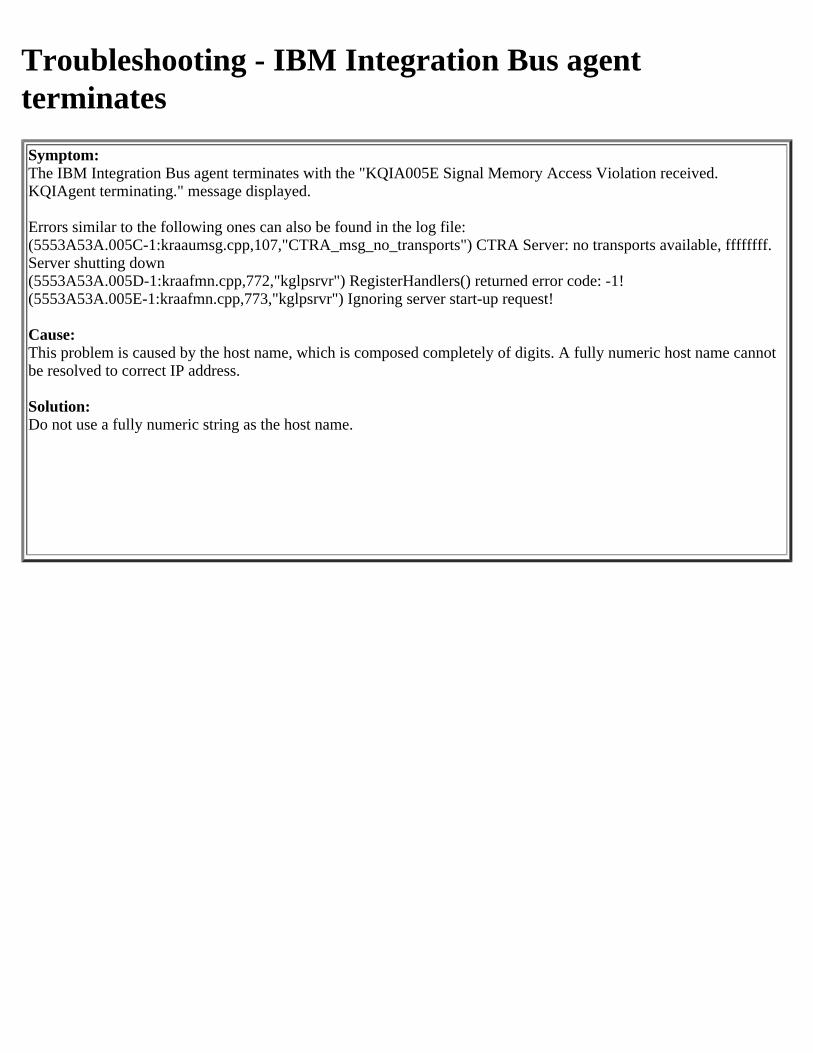
Troubleshooting - IBM Integration Bus agentterminatesSymptom:The IBM Integration Bus agent terminates with the "KQIA005E Signal Memory Access Violation received. KQIAgent terminating." message displayed.
Errors similar to the following ones can also be found in the log file:(5553A53A.005C-1:kraaumsg.cpp,107,"CTRA_msg_no_transports") CTRA Server: no transports available, ffffffff. Server shutting down(5553A53A.005D-1:kraafmn.cpp,772,"kglpsrvr") RegisterHandlers() returned error code: -1!(5553A53A.005E-1:kraafmn.cpp,773,"kglpsrvr") Ignoring server start-up request!
Cause:This problem is caused by the host name, which is composed completely of digits. A fully numeric host name cannot be resolved to correct IP address.
Solution:Do not use a fully numeric string as the host name.
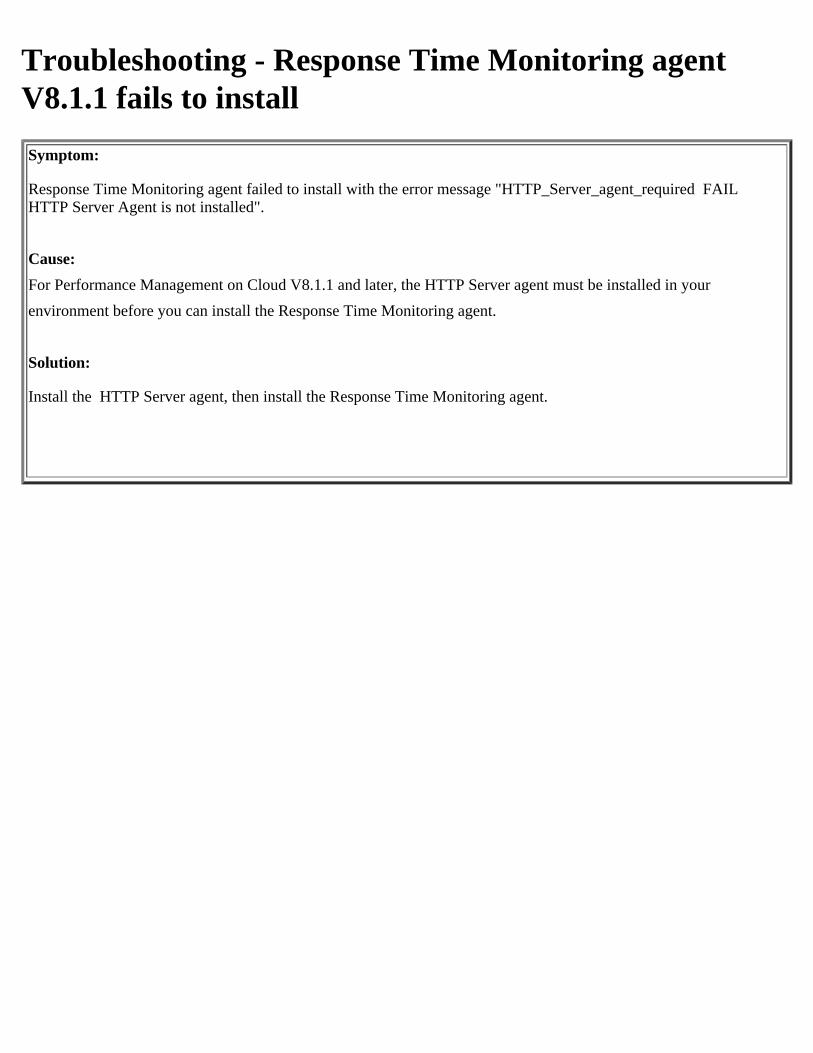
Troubleshooting - Response Time Monitoring agentV8.1.1 fails to installSymptom:
Response Time Monitoring agent failed to install with the error message "HTTP_Server_agent_required FAIL HTTP Server Agent is not installed".
Cause:For Performance Management on Cloud V8.1.1 and later, the HTTP Server agent must be installed in your environment before you can install the Response Time Monitoring agent.
Solution:
Install the HTTP Server agent, then install the Response Time Monitoring agent.
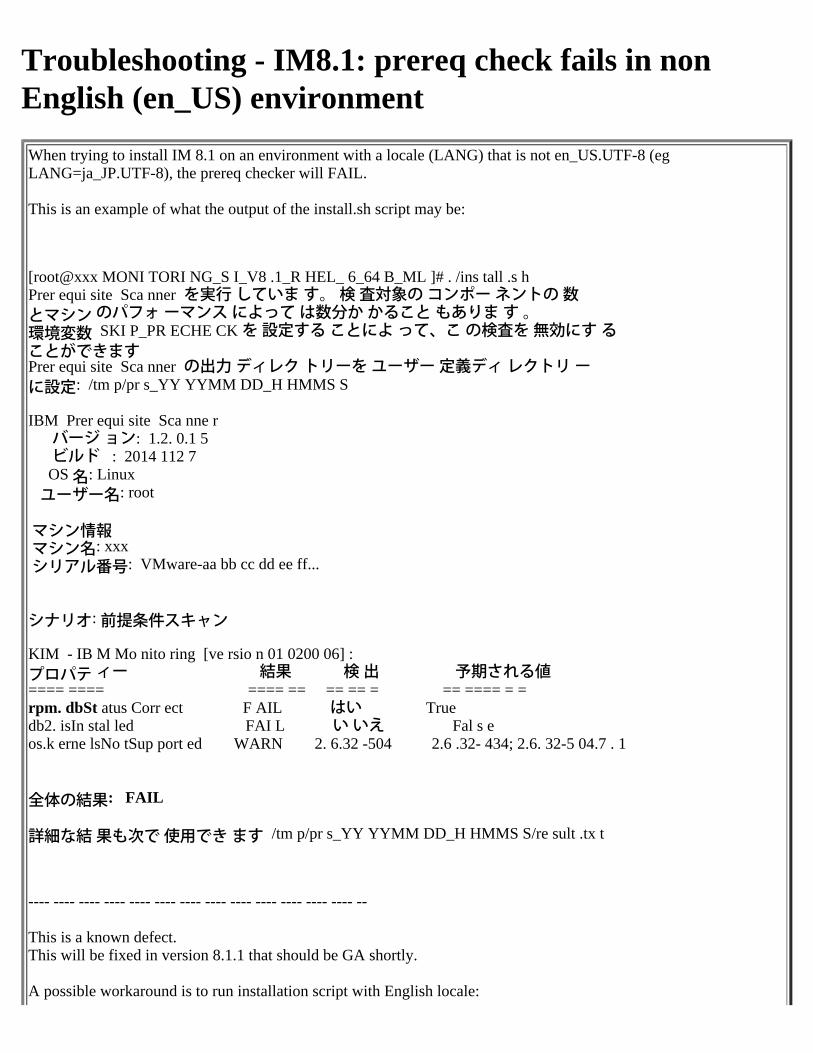
Troubleshooting - IM8.1: prereq check fails in nonEnglish (en_US) environmentWhen trying to install IM 8.1 on an environment with a locale (LANG) that is not en_US.UTF-8 (egLANG=ja_JP.UTF-8), the prereq checker will FAIL.
This is an example of what the output of the install.sh script may be:
[root@xxx MONI TORI NG_S I_V8 .1_R HEL_ 6_64 B_ML ]# . /ins tall .s hPrer equi site Sca nner を実行 していま す。 検 査対象の コンポー ネントの 数とマシン のパフォ ーマンス によって は数分か かること もありま す 。環境変数 SKI P_PR ECHE CK を 設定する ことによ って、こ の検査を 無効にす ることができますPrer equi site Sca nner の出力 ディレク トリーを ユーザー 定義ディ レクトリ ーに設定: /tm p/pr s_YY YYMM DD_H HMMS S
IBM Prer equi site Sca nne rバージ ョン: 1.2. 0.1 5ビルド : 2014 112 7OS 名: Linuxユーザー名: root
マシン情報マシン名: xxxシリアル番号: VMware-aa bb cc dd ee ff...
シナリオ: 前提条件スキャン
KIM - IB M Mo nito ring [ve rsio n 01 0200 06] :プロパテ ィー 結果 検 出 予期される値==== ==== ==== == == == = == ==== = =rpm. dbSt atus Corr ect F AIL はい Truedb2. isIn stal led FAI L い いえ Fal s eos.k erne lsNo tSup port ed WARN 2. 6.32 -504 2.6 .32- 434; 2.6. 32-5 04.7 . 1
全体の結果: FAIL
詳細な結 果も次で 使用でき ます /tm p/pr s_YY YYMM DD_H HMMS S/re sult .tx t
---- ---- ---- ---- ---- ---- ---- ---- ---- ---- ---- ---- ---- --
This is a known defect.This will be fixed in version 8.1.1 that should be GA shortly.
A possible workaround is to run installation script with English locale:

# LANG=C ./install.sh
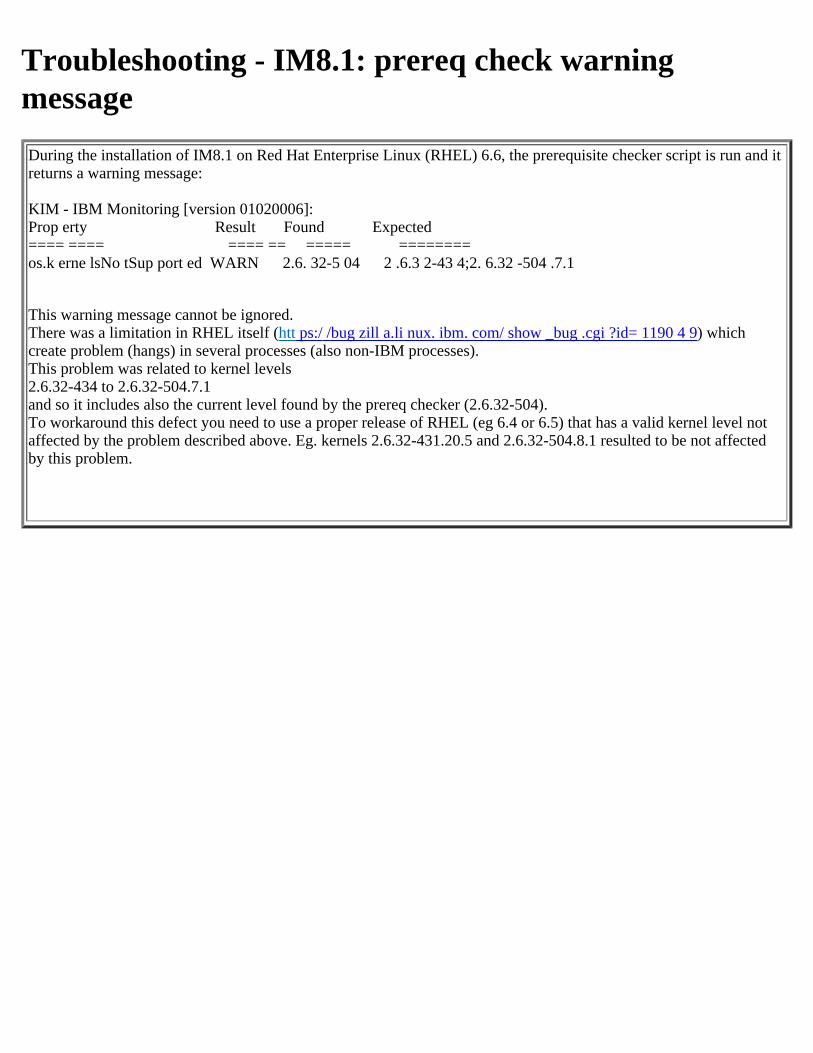
Troubleshooting - IM8.1: prereq check warningmessageDuring the installation of IM8.1 on Red Hat Enterprise Linux (RHEL) 6.6, the prerequisite checker script is run and it returns a warning message:
KIM - IBM Monitoring [version 01020006]:Prop erty Result Found Expected==== ==== ==== == ===== ========os.k erne lsNo tSup port ed WARN 2.6. 32-5 04 2 .6.3 2-43 4;2. 6.32 -504 .7.1
This warning message cannot be ignored.There was a limitation in RHEL itself (htt ps:/ /bug zill a.li nux. ibm. com/ show _bug .cgi ?id= 1190 4 9) which create problem (hangs) in several processes (also non-IBM processes).This problem was related to kernel levels2.6.32-434 to 2.6.32-504.7.1and so it includes also the current level found by the prereq checker (2.6.32-504).To workaround this defect you need to use a proper release of RHEL (eg 6.4 or 6.5) that has a valid kernel level not affected by the problem described above. Eg. kernels 2.6.32-431.20.5 and 2.6.32-504.8.1 resulted to be not affected by this problem.
Troubleshooting - Reports: Logging out generates:Error 403: AuthenticationFailed - fixed_812Symptom
In the Performance Management, when you click Log out after previously accessing a report from the samebrowser, the following error is displayed:
Error 403: AuthenticationFailed
SolutionThis is a known design issue.
Troubleshooting - Reports: Application names areinconsistent in the All My Applications report------------------------------------------------------------------------
SymptomWhen a single Response Time Monitoring Agent application is mapped to multiple Performance Managementapplications, only a single (randomly selected) custom Performance Management name is displayed in the AllMy Applications report. The data that is displayed is correct, but application name labels differ for differentcharts in the report.
SolutionThis issue is known. If you select an application in APM UI and then view a report that is based on thisapplication, the data is displayed correctly.

Troubleshooting - Reports: The Close and Cancelbuttons shown on Reports login screen do not workSymptom
When you click Actions>Launch to Reports, the Tivoli Common Reporting login window is displayed, youcannot return to the previous Performance Management window by clicking either the Cancel or Close buttons.
SolutionNo action is expected when you click Close or Cancel.
Troubleshooting - Reports: Reports: Y-axis showsduplicate values - fixed 812Symptom
Historical reports that are based on the Response Time Monitoring Agent, show duplicate data points on the y-axis.
SolutionThis occurs because the data points are formatted to two decimal points, whereas the actual numbers mightrequire three decimal places. For example, if the numbers are, 0.00 and 0.005, then these numbers are formattedto two decimal places and as a result appear as duplicates.
Troubleshooting - Reports: Y-axis shows negative values- fixed_812Symptom
Historical reports that are based on the Response Time Monitoring Agent return no data, the y-axis range orscale shows negative values.
SolutionThis is a known issue. It does not occur when the report returns data.
Troubleshooting - Reports: Charts in PDF Reports inFirefox are pink - fixed_812Symptom
When you view the Compare Performance of Multiple Application reports in PDF format in Firefox, youexperience formatting issues. Some of the charts in these reports are pink.
SolutionIf you experience this problem, choose one of the following alternatives:
Instead of viewing the PDF report embedded in Firefox, download the PDF report to a directory in yoursystem. Then, open the PDF report from that directory with a PDF reader.View the report in other supported formats, for example, HTML or XLS.Use an alternative browser, this problem is not observed in any other supported browsers, for example,Internet Explorer, Chrome, or Safari.
Troubleshooting - Microsoft SQL Server agent: Forsome attributes no data is displayed on the dashboardSymptom:On the dashboard, no data is displayed for some attributes. This problem occurs if a database name consists ofUnicode characters.
Solution:This issue is a known issue and we do not have a solution.
Troubleshooting - Microsoft SQL Server agen: For theStolen Pages Growth attribute negative values aredisplayed on the dashboardSymptom:On the dashboard, the Stolen Pages Growth attribute displays negative values. The value for the Stolen Pages Growthattribute is calculated on the basis of the previous and the current sample data.
Solution:This issue is a known issue and we do not have a solution.
Troubleshooting - Microsoft SQL Server agent:Dashboard displays incorrect value for some data setswhen a custom query is appliedSymptom:On the dashboard, incorrect values are displayed when a custom query is applied for the following data sets:
MS SQL Availability Groups SummaryMS SQL Availability Database SummaryMS SQL Availability Database DetailsMS SQL Availability Replicas Status Summary
Solution:Refresh the dashboard after applying the custom query for the following data sets:
MS SQL Availability Groups Summary MS SQL Availability Database Summary MS SQL Availability Database Details MS SQL Availability Replicas Status Summary
Troubleshooting - Microsoft SQL Server agent:Dashboard shows no data for the primary replica in theAvailability Group details data setSymptom:On the dashboard, no value is displayed for the primary replica in the Availability Group Details data set.
Cause:This problem occurs when you pause or stop the cluster service on the node that hosts the SQL Server agent.
Solution:Complete the following steps to resolve the problem:
1. In the Failover Cluster Manager, right-click the cluster node that hosts the SQL Server agent.2. If you have paused the cluster service on the node, click Resume. If you have stopped the cluster service on the
node, click Start.
Troubleshooting - Microsoft SQL Server agent:Incorrect data is displayed for two SQL Serverdatabases with identical namesSymptom:When you create two SQL Server databases with the same name, but precede one database name with a space and theother database name without a space, the dashboard does not displays the data properly.
Solution:The space at the beginning of the database name is truncated by the dashboard, making the two databases lookidentical.Avoid spaces at the beginning of a database name.
Troubleshooting - Microsoft SQL Server agent:Collection Status attribute returns a value of InactiveSymptom:The Collection Status attribute of the Server Summary data set returns a value of Inactive. A value of Inactiveindicates that the SQL Server agent data collector service has stopped. The collector service might enter this state if:
The collector service is manually stopped.An internal error has occurred.The SQL Server is stopped.
Solution:Ensure that the SQL Server is running. If the SQL Server is running and the Collection Status value is still Inactive,then restart the SQL Server agent.
Troubleshooting - Microsoft SQL Server agent:Negative value is returned for Transactions per Secondin the Database Detail data set
Symptom:Negative value is returned for Transactions per Second in the Database Detail data set when the user database has asimilar name to that of a system database.
Solution:This issue is a known issue and we do not have a solution.
Troubleshooting - Microsoft SQL Server agent: SQLServer agent takes long time to display dataSymptom:The SQL Server agent takes time to display data when a large number of databases (typically, more than 6000) arecreated on the SQL Server. The agent data collector service stops running if the memory used by the data collectorexceeds the threshold value because of a large number of databases on the SQL Server.
Solution:This issue is a known issue and we do not have a solution.
Troubleshooting - Microsoft SQL Server agent:Dashboard displays no data for databases with tablelevel lockingSymptom:If the table level locking hint (Holdlock, Tablock, and so on) is specified with the SELECT, INSERT, UPDATEand DELETE statements on multiple tables in an SQL Server database, the portal does not display data till the lock isreleased.
Solution:Release the locks.
Troubleshooting - WebSphere MQ agent: The agent fails to start on Linux or UNIX systemsSymptom:
The WebSphere MQ agent fails to start on a Linux or UNIX system. The following error messages are produced:
exec(): 0509-036 Cannot load program/csapps/tivoli/itm/aix513/mq/bin/kmqagent because of the following errors:0509-150 Dependent module libmqm_r.a(libmqm_r.o) could not be loaded.0509-022 Cannot load module libmqm_r.a(libmqm_r.o).0509-026 System error: A file or directory in the path name does not exist.
Cause:
The agent fails to start because it cannot find the required WebSphere MQ library files.
Solution:
Update the environment variables LIBPATH and SHLIB_PATH in the mq.ini file with the location of the 32-bit WebSphere MQ library files. You must add the location before thedefault directories (/usr/lib and /usr/mqm/lib).
For example, if your original definitions of the LIBPATH and SHLIB_PATH environment variable are as below:
LIBPATH=/usr/mqm/lib:$CANDLEHOME$/$BINARCH$/$PRODUCTCODE$/lib:$CANDLEHOME$/$ARCHITECTURE$/lib:$ICCRTE_DIR$/lib
SHLIB_PATH=$CANDLEHOME$/$BINARCH$/$PRODUCTCODE$/lib:$CANDLEHOME$/$ARCHITECTURE$/lib:/lib:/usr/lib:$JAVAHOME$/lib/IA64N/server/
Update the definitions of the LIBPATH and SHLIB_PATH environment variable as below:
LIBPATH=wmq_installdir/mqm/lib:/usr/mqm/lib:$CANDLEHOME$/$BINARCH$/$PRODUCTCODE$/lib:$CANDLEHOME$/$ARCHITECTURE$/lib:$ICCRTE_DIR$/lib
SHLIB_PATH=$CANDLEHOME$/$BINARCH$/$PRODUCTCODE$/lib:$CANDLEHOME$/$ARCHITECTURE$/lib:/lib:wmq_installdir/mqm/lib:/usr/lib:$JAVAHOME$/lib/IA64N/server/
where wmq_installdir is the installation directory of WebSphere MQ. The default installation directory of WebSphere MQ is /opt.

Troubleshooting - VMware VI agent: Group widgettitles are not translated
Symptom:Some group widget titles in the translated dashboards are displayed in English.Solution:A solution is not currently available.

Troubleshooting - VMware VI agent: Columns in somegroup widgets are not highlighted
Symptom:In some group widgets, the column names that you can click to open another page are not highlighted orunderlined.Solution:To know whether you can click a column name to open the detailed dashboard, complete any one of thefollowing steps:
Move the mouse pointer over a column name. The change in the mouse pointer indicates thatyou can click the particular column name.See the online help for a group widget. The online help specifies whether you can click aparticular column name to open the detailed dashboard.
Troubleshooting - VMware VI agent: Situations in theSeverity column display incorrect status
Symptom:The situations that are highlighted in green display the "Unknown" status in the severity column.Solution:A solution is not currently available.
Troubleshooting - VMware VI agent: Attribute groupsfor the ESX Server component are not displayed
Symptom:Attribute groups for the ESX Server component are not displayed at the VMware Virtual Infrastructure levelin the Attribute Details tab.Solution:A solution is not currently available.
Troubleshooting - VMware VI agent: ESX Servercomponent events are not displayed
Symptom:Events for the ESX Server component are not automatically displayed on the dashboard.Cause:The corresponding ESX Server is not added to the application.Solution:For instructions on adding, removing, and editing applications, see:
The "Managing applications" topic under the "Configuring" topic in the Application PerformanceManagement help, if you are using the lightweight infrastructure.The "Managing applications" topic in the SmartCloud Monitoring - Application Insight help, if youare using the Tivoli® Monitoring infrastructure.
Troubleshooting - SAP agent: Configuration panels on amySAP system does not show text in a multi-bytelanguageSymptom:
Text in the SAP agent configuration panels on a mySAP system does not show in the multi-byte language with whichyou logged on to mySAP.
Solution:
Ensure that you logged on to the mySAP system or SAPGUI by using a supported language. See the "Language"section in the "Configuring the SAP agent" in the IBM Performance Management (SaaS) Knowledge Center for a listof the languages that the SAP agent supports.
Troubleshooting - Microsoft IIS agent: Error Statistics(history) and Request Rate (history) group widgetsdisplay incorrect data for some attributesSymptom:In the dashboard, the Error Statistics (history) group widget and Request Rate (history) group widget displaysincorrect data for some attributes.
Cause:This problem occurs because the IIS Manager is configured to log data for some attributes in the log file.
Solution:When you configure the IIS Manager, ensure that you select all the options in the W3C Logging Fields window.
Troubleshooting - Microsoft IIS agent: No data isdisplayed in the Error Statistics (history) and RequestRate (history) group widgetsSymptom:On the dashboard, no data is displayed in the Error Statistics (history) group widget and Request Rate (history) groupwidget.
Cause:This problem can occur because of one of the following reasons:
1. The IIS Manager is configured to log the requests that are not in the W3C format.2. The path of the log file directory was incorrectly specified when the monitoring agent was configured.
Solution:To resolve this problem, ensure that the following conditions exist:
The IIS Manager is configured to log the requests that are in the W3C format.The path for the log file directory is specified correctly when you configure the Microsoft IIS agent.
Troubleshooting - Microsoft .NET agent: Dashboardsdo not update or display dataSymptom:When you are working with the Microsoft .NET agent and its deep dive dashboards, the group widgets might eitherdisplay no data or take long time to load data. Some of the group widgets do not display data or are slow to update.
Solution:
1. Verify that JSO files are being generated in the install_dir\dcruntime\data\request directory. IfJSO files are generated, complete these steps:
a. Modify the JSO file properties in the data collector properties file:i. From the install_dir\qe\config directory, open
the dotNetDcConfig.properties.inactive file in a text editor.ii. Decrease the maximum number of records stored in a JSO file. Modify the value of the
kqe_svc.requestRecordCount property. The default value is 1000.
iii. Decrease the maximum number of JSO files that are maintained in the output directory. Modify thevalue of the kqe_svc.maxJsoCount property. The default value is 30.
iv. Activate the configuration changes. Enter: cd install_dir\qe\bin configdc activateconfig
v. Restart the .NET application.
b. Modify the criteria for loading JSO files:
1. From the install_dir\TMAITM6_x64 directory and open the undotnetagent.bat filein a text editor.
2. Decrease the time span criteria of the JSO files to load. Modify the value of the -Dkqe.timespanproperty in the following line:
"%JAVA_HOME%\bin\java" -classpath %CLASSPATH%-Dkqe.cache.interval=%KQE_CACHE_INTERVAL% -Xmx1024m-Dkqe.timespan=1800 -Djlog.propertyFileDir.CYN=%KQE_LOG_CONFIG%-Dattributegroup.def.jar=%ATTRIBUTE_DEF%-Ddc.runtime.dir=%DC_RUNTIME_DIR% com.ibm.tivoli.monitoring.annotation.cpci.CommonAgentCustomClient> %STDOUT_LOG% 2>&1In this example, the agent loads JSO files that were generated in the last 30 minutes (1800seconds).
3. Restart the agent. Navigate to the install_dir\bin directory and enter the followingcommands:- dotnet-agent.bat stop- dotnet-agent.bat start
c. If you registered the data collector profiler to collect all types of diagnostics andtransaction tracking data, increase the maximum heap size of the data collector, if it is not large enough.
1. Enter cd install_dir\TMAITM6_x64
2. Open the rundotnetagent.bat script in a text editor.
3. Increase the value of the -Xmx parameter in the following line.
Important: The default value of -Xmx384m is provided for an environment where only requestdata is collected. If you want to collect all types of data, increase the value to -Xmx1024m or later.%JAVA_HOME%\bin\java" -classpath %CLASSPATH% -Dkqe.cache.interval=%KQE_CACHE_INTERVAL% -Xmx384m -Djlog.propertyFileDir.CYN=%KQE_LOG_CONFIG%-Dattributegroup.def.jar=%ATTRIBUTE_DEF%-Ddc.runtime.dir=%DC_RUNTIME_DIR%com.ibm.tivoli.monitoring.annotation.cpci.CommonAgentCustomClient> %STDOUT_LOG% 2>&1
4. Restart the agent. Navigate to the install_dir\bin directory and enter the following commands:- dotnet-agent.bat stop- dotnet-agent.bat start
5. Restart the .NET application.
If jso files are not generated, complete the following steps:
1. Verify that diagnostics data collection is enabled in the data collector configuration:a. From the install_dir\qe\bin directory, to view the data collector configuration enter
configdc getconfigb. Verify that the .NET Data Collector Enabled property is set to True and the HttpModule
property is set to Enabled. For example:Configuration Enabled: True.NET Data Collector Enabled: TrueTransaction Application Server Enabled: TrueTransaction Application Server Host: 127.0.0.1Transaction Application Server Port: 5456Profiler: EnabledSOAP: EnabledHttpModule: EnabledISAPI: EnabledTrace Log Garbage Collection: Disabled
2. Verify that the profiler service is started. From a command prompt, enter net status DotNetProfilerService.If it is stopped, enter net start DotNetProfilerService.
Troubleshooting - Microsoft .NET agent: Data is notdisplayed for the ASP.NET Applications Request Status(websockets) data setSymptom:For Windows Server 2008 R2 and Windows Server 2008 SP2 systems, the dashboard does notshow data for the ASP.NET Applications Request Status (websockets) data set.
Solution:You must reload the Performance Monitor (Perfmon) for ASP.NET Apps v4.0 to retrieve data for the ASP.NETApplications Request Status (WebSockets) data set. Complete the following steps to reload the Perfmon counters inWindows Server 2008 R2 and Windows Server 2008 SP2 systems.
1. Open the command prompt.2. Run the following command to open the System32 directory:
cd %Systemroot%\System323. To reload the Perfmon counters that are related to ASP.NET Apps v4.0, run the following command:
Lodctr /R C:\Windows\inf\ASP.NET_4.0.30319\0009\aspnet_perf.ini
4. Refresh the dashboard.
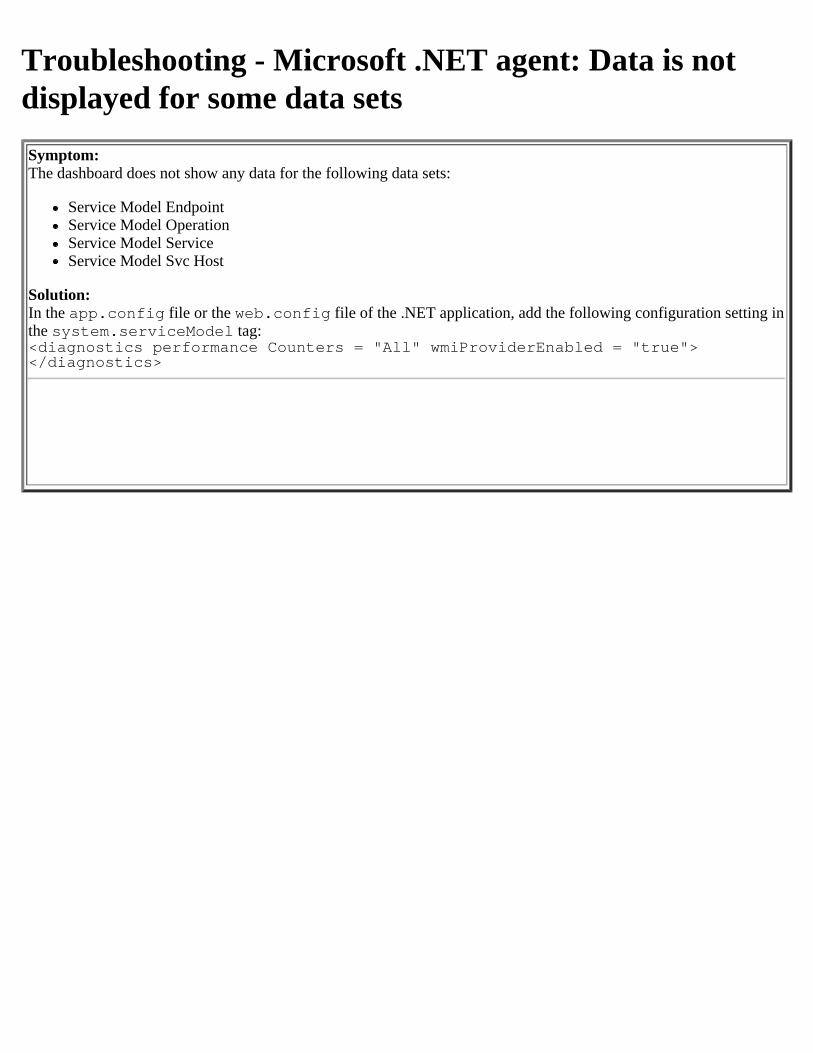
Troubleshooting - Microsoft .NET agent: Data is notdisplayed for some data setsSymptom:The dashboard does not show any data for the following data sets:
Service Model EndpointService Model OperationService Model ServiceService Model Svc Host
Solution:In the app.config file or the web.config file of the .NET application, add the following configuration setting inthe system.serviceModel tag:<diagnostics performance Counters = "All" wmiProviderEnabled = "true"></diagnostics>
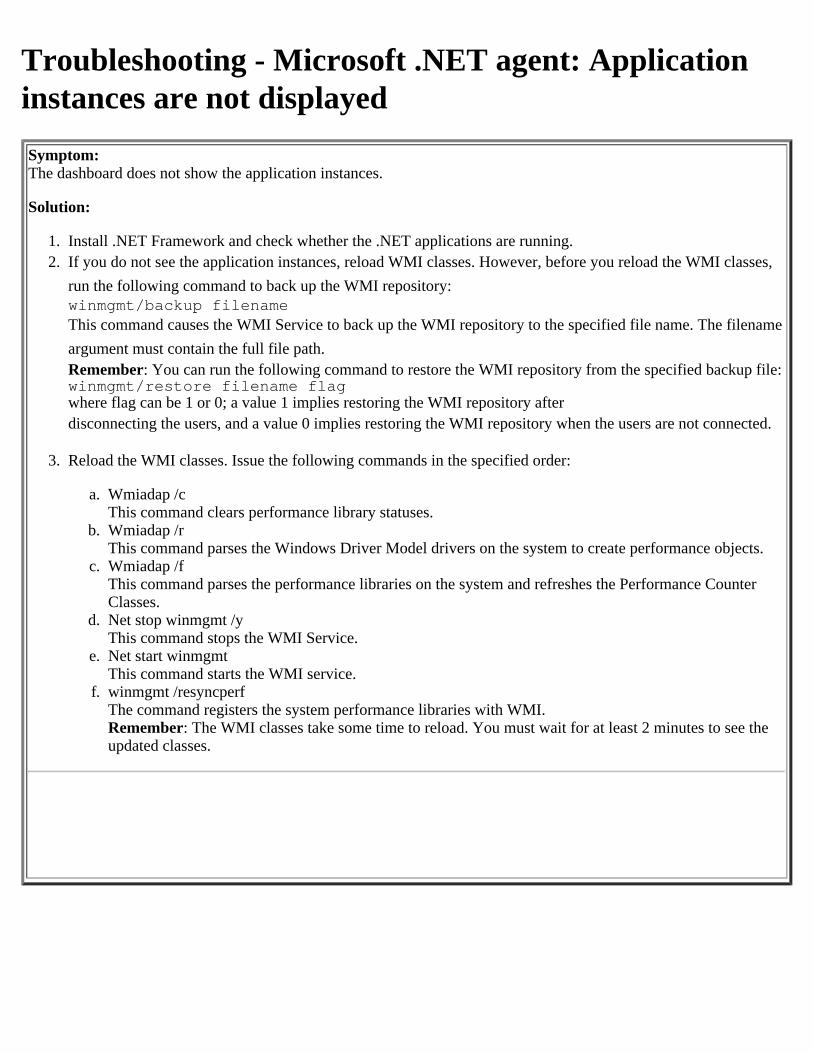
Troubleshooting - Microsoft .NET agent: Applicationinstances are not displayedSymptom:The dashboard does not show the application instances.
Solution:
1. Install .NET Framework and check whether the .NET applications are running.2. If you do not see the application instances, reload WMI classes. However, before you reload the WMI classes,
run the following command to back up the WMI repository:winmgmt/backup filenameThis command causes the WMI Service to back up the WMI repository to the specified file name. The filenameargument must contain the full file path.Remember: You can run the following command to restore the WMI repository from the specified backup file:winmgmt/restore filename flagwhere flag can be 1 or 0; a value 1 implies restoring the WMI repository afterdisconnecting the users, and a value 0 implies restoring the WMI repository when the users are not connected.
3. Reload the WMI classes. Issue the following commands in the specified order:
a. Wmiadap /cThis command clears performance library statuses.
b. Wmiadap /rThis command parses the Windows Driver Model drivers on the system to create performance objects.
c. Wmiadap /fThis command parses the performance libraries on the system and refreshes the Performance CounterClasses.
d. Net stop winmgmt /yThis command stops the WMI Service.
e. Net start winmgmtThis command starts the WMI service.
f. winmgmt /resyncperfThe command registers the system performance libraries with WMI.Remember: The WMI classes take some time to reload. You must wait for at least 2 minutes to see theupdated classes.
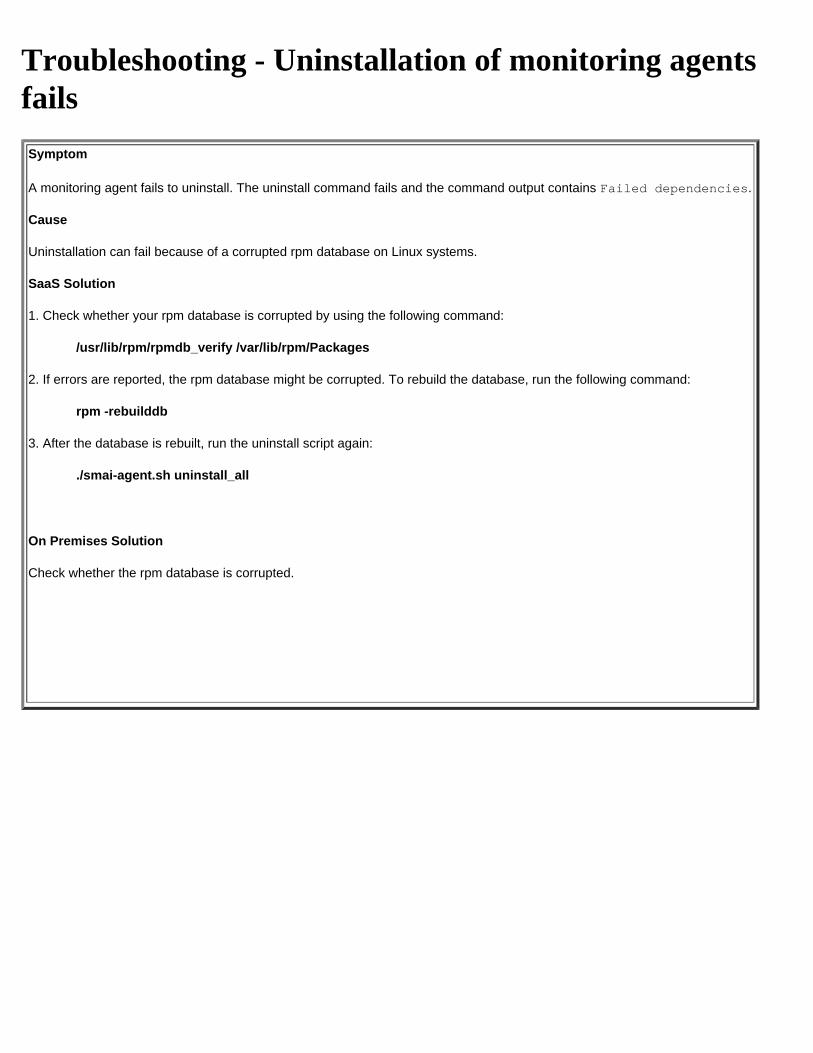
Troubleshooting - Uninstallation of monitoring agentsfailsSymptom
A monitoring agent fails to uninstall. The uninstall command fails and the command output contains Failed dependencies.
Cause
Uninstallation can fail because of a corrupted rpm database on Linux systems.
SaaS Solution
1. Check whether your rpm database is corrupted by using the following command:
/usr/lib/rpm/rpmdb_verify /var/lib/rpm/Packages
2. If errors are reported, the rpm database might be corrupted. To rebuild the database, run the following command:
rpm -rebuilddb
3. After the database is rebuilt, run the uninstall script again:
./smai-agent.sh uninstall_all
On Premises Solution
Check whether the rpm database is corrupted.
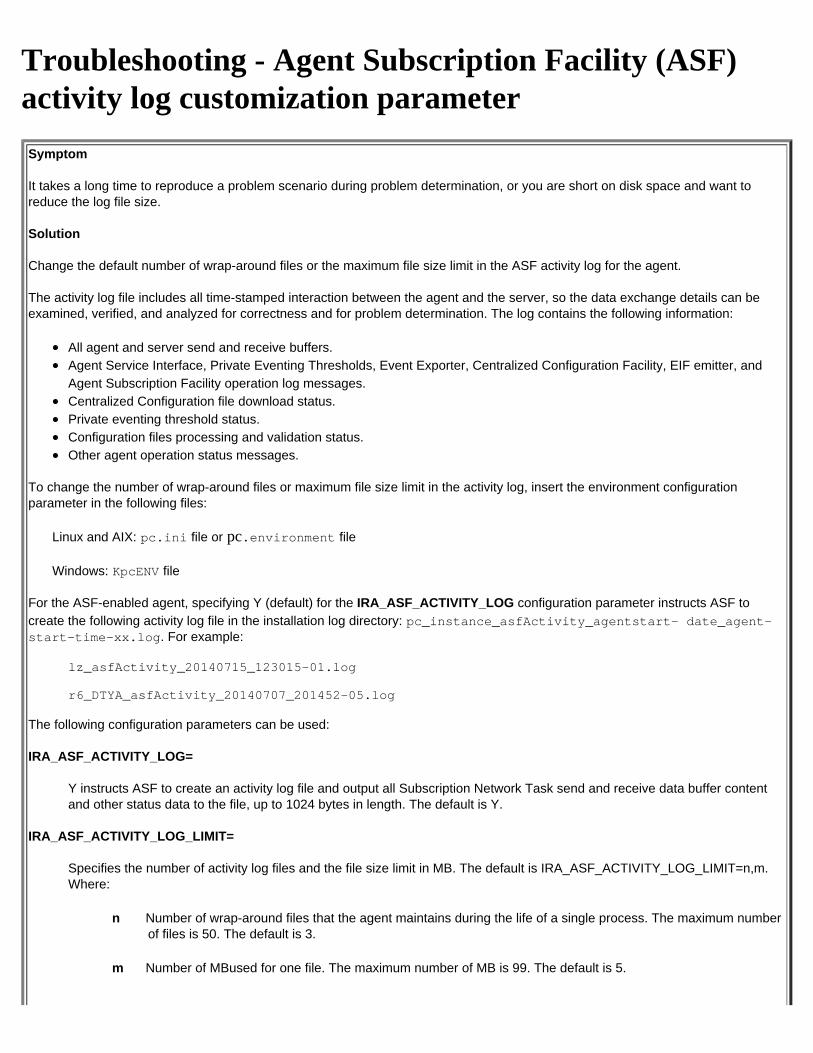
Troubleshooting - Agent Subscription Facility (ASF)activity log customization parameterSymptom
It takes a long time to reproduce a problem scenario during problem determination, or you are short on disk space and want toreduce the log file size.
Solution
Change the default number of wrap-around files or the maximum file size limit in the ASF activity log for the agent.
The activity log file includes all time-stamped interaction between the agent and the server, so the data exchange details can beexamined, verified, and analyzed for correctness and for problem determination. The log contains the following information:
All agent and server send and receive buffers.Agent Service Interface, Private Eventing Thresholds, Event Exporter, Centralized Configuration Facility, EIF emitter, andAgent Subscription Facility operation log messages.Centralized Configuration file download status.Private eventing threshold status.Configuration files processing and validation status.Other agent operation status messages.
To change the number of wrap-around files or maximum file size limit in the activity log, insert the environment configurationparameter in the following files:
Linux and AIX: pc.ini file or pc.environment file
Windows: KpcENV file
For the ASF-enabled agent, specifying Y (default) for the IRA_ASF_ACTIVITY_LOG configuration parameter instructs ASF tocreate the following activity log file in the installation log directory: pc_instance_asfActivity_agentstart- date_agent-start-time-xx.log. For example:
lz_asfActivity_20140715_123015-01.log
r6_DTYA_asfActivity_20140707_201452-05.log
The following configuration parameters can be used:
IRA_ASF_ACTIVITY_LOG=
Y instructs ASF to create an activity log file and output all Subscription Network Task send and receive data buffer contentand other status data to the file, up to 1024 bytes in length. The default is Y.
IRA_ASF_ACTIVITY_LOG_LIMIT=
Specifies the number of activity log files and the file size limit in MB. The default is IRA_ASF_ACTIVITY_LOG_LIMIT=n,m.Where:
n Number of wrap-around files that the agent maintains during the life of a single process. The maximum numberof files is 50. The default is 3.
m Number of MBused for one file. The maximum number of MB is 99. The default is 5.
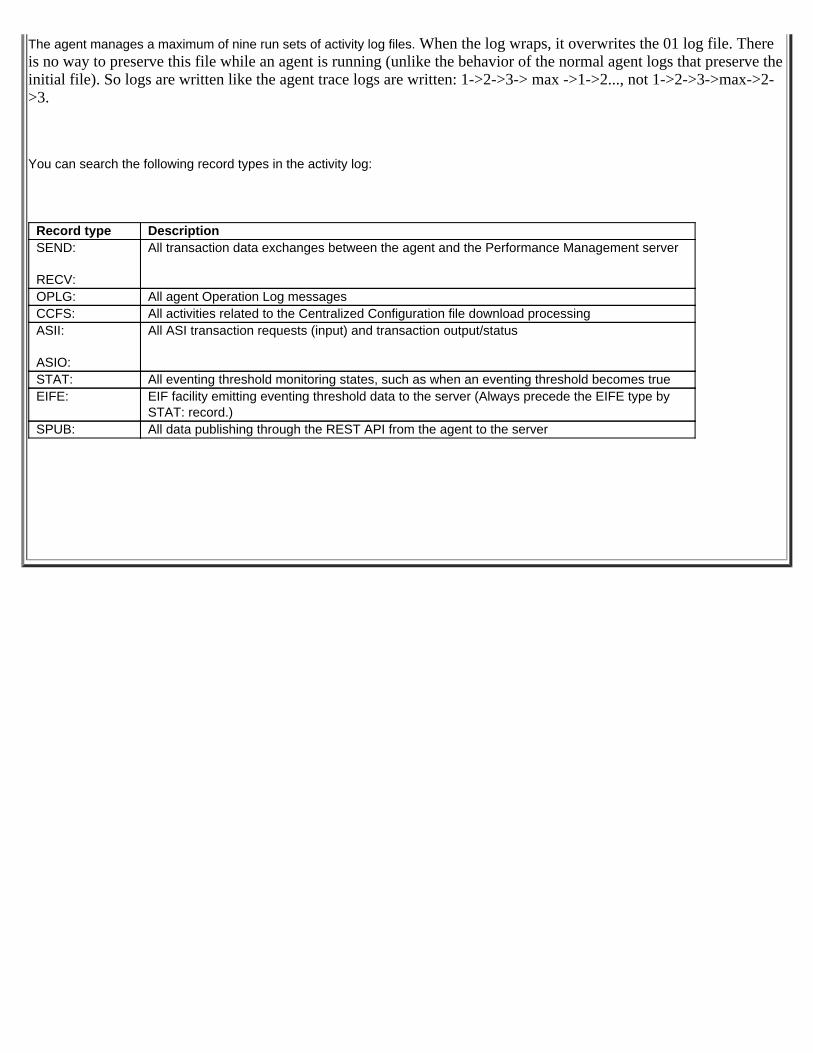
The agent manages a maximum of nine run sets of activity log files. When the log wraps, it overwrites the 01 log file. Thereis no way to preserve this file while an agent is running (unlike the behavior of the normal agent logs that preserve theinitial file). So logs are written like the agent trace logs are written: 1->2->3-> max ->1->2..., not 1->2->3->max->2->3.
You can search the following record types in the activity log:
Record type DescriptionSEND:
RECV:
All transaction data exchanges between the agent and the Performance Management server
OPLG: All agent Operation Log messagesCCFS: All activities related to the Centralized Configuration file download processingASII:
ASIO:
All ASI transaction requests (input) and transaction output/status
STAT: All eventing threshold monitoring states, such as when an eventing threshold becomes trueEIFE: EIF facility emitting eventing threshold data to the server (Always precede the EIFE type by
STAT: record.)SPUB: All data publishing through the REST API from the agent to the server
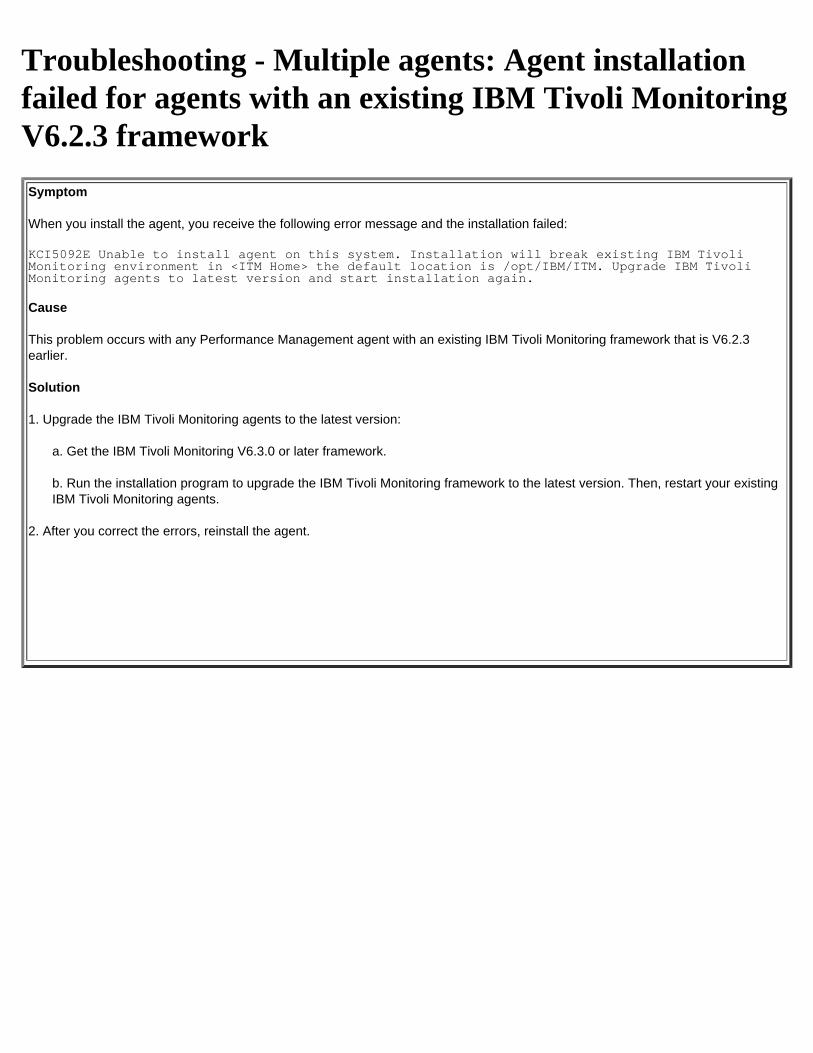
Troubleshooting - Multiple agents: Agent installationfailed for agents with an existing IBM Tivoli MonitoringV6.2.3 frameworkSymptom
When you install the agent, you receive the following error message and the installation failed:
KCI5092E Unable to install agent on this system. Installation will break existing IBM TivoliMonitoring environment in <ITM Home> the default location is /opt/IBM/ITM. Upgrade IBM TivoliMonitoring agents to latest version and start installation again.
Cause
This problem occurs with any Performance Management agent with an existing IBM Tivoli Monitoring framework that is V6.2.3earlier.
Solution
1. Upgrade the IBM Tivoli Monitoring agents to the latest version:
a. Get the IBM Tivoli Monitoring V6.3.0 or later framework.
b. Run the installation program to upgrade the IBM Tivoli Monitoring framework to the latest version. Then, restart your existingIBM Tivoli Monitoring agents.
2. After you correct the errors, reinstall the agent.
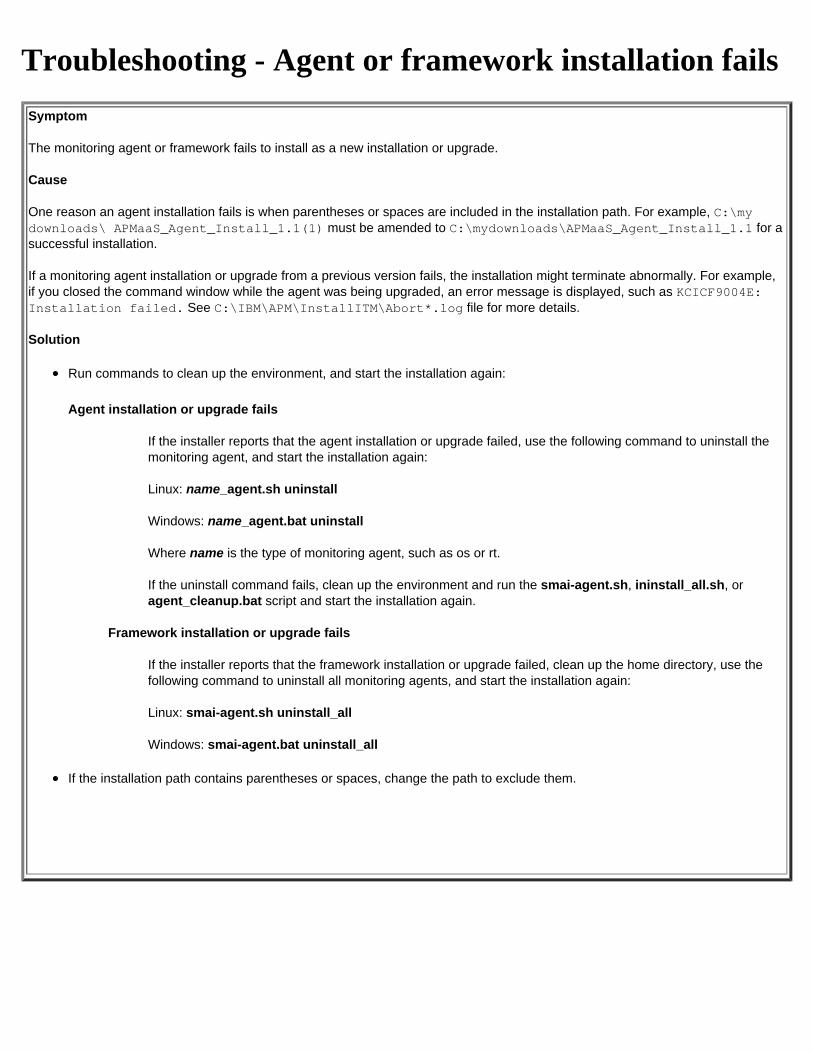
Troubleshooting - Agent or framework installation failsSymptom
The monitoring agent or framework fails to install as a new installation or upgrade.
Cause
One reason an agent installation fails is when parentheses or spaces are included in the installation path. For example, C:\mydownloads\ APMaaS_Agent_Install_1.1(1) must be amended to C:\mydownloads\APMaaS_Agent_Install_1.1 for asuccessful installation.
If a monitoring agent installation or upgrade from a previous version fails, the installation might terminate abnormally. For example,if you closed the command window while the agent was being upgraded, an error message is displayed, such as KCICF9004E:Installation failed. See C:\IBM\APM\InstallITM\Abort*.log file for more details.
Solution
Run commands to clean up the environment, and start the installation again:
Agent installation or upgrade fails
If the installer reports that the agent installation or upgrade failed, use the following command to uninstall themonitoring agent, and start the installation again:
Linux: name_agent.sh uninstall
Windows: name_agent.bat uninstall
Where name is the type of monitoring agent, such as os or rt.
If the uninstall command fails, clean up the environment and run the smai-agent.sh, ininstall_all.sh, oragent_cleanup.bat script and start the installation again.
Framework installation or upgrade fails
If the installer reports that the framework installation or upgrade failed, clean up the home directory, use thefollowing command to uninstall all monitoring agents, and start the installation again:
Linux: smai-agent.sh uninstall_all
Windows: smai-agent.bat uninstall_all
If the installation path contains parentheses or spaces, change the path to exclude them.
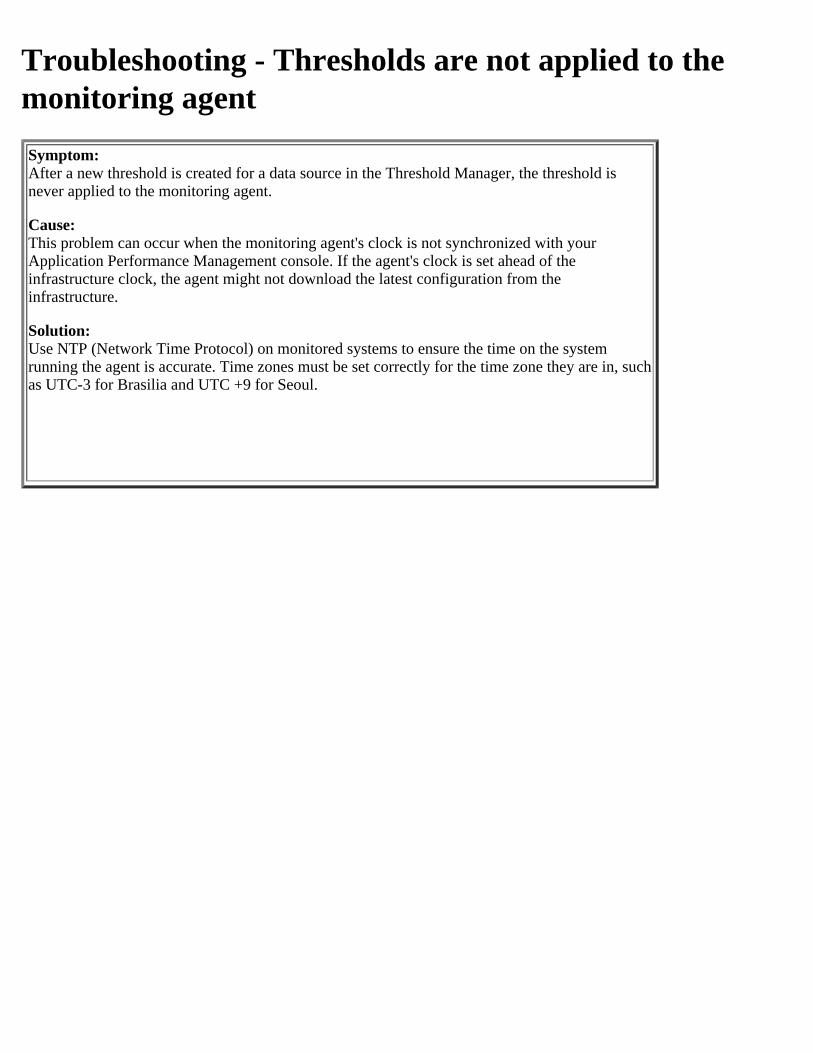
Troubleshooting - Thresholds are not applied to themonitoring agentSymptom:After a new threshold is created for a data source in the Threshold Manager, the threshold is never applied to the monitoring agent.
Cause:This problem can occur when the monitoring agent's clock is not synchronized with your Application Performance Management console. If the agent's clock is set ahead of the infrastructure clock, the agent might not download the latest configuration from the infrastructure.
Solution:Use NTP (Network Time Protocol) on monitored systems to ensure the time on the system running the agent is accurate. Time zones must be set correctly for the time zone they are in, such as UTC-3 for Brasilia and UTC +9 for Seoul.

Troubleshooting - Threshold events have unknownseverity after agent recycleIf the monitoring agent is stopped and restarted, the event severity information is lost and any new events show a severity of Unknown.
Troubleshooting - Historical data doesn't change afteryou adjust the time selectorSome of the dashboard widgets show metrics that are based on a time range. You can adjust the time selector for widgets whose values are derived from historical data. If you adjusted the time but the widgets do not change to show the new time range, adjust the time for All Applications.
Symptom:In the displayed dashboard, you adjusted the time selector from the default Last 4 Hours or other value but the historical widgets are not updated to the chosen time range.
Solution:Open the time selector, choose the time range, and select All Applications. The All Applications option applies the time range to all defined applications in your monitored environment.
Troubleshooting - Dashboard shows no events or eventstatusProblem:
If you can see metrics from a data source but no severity indicator is displayed in the Application Performance Dashboard Events tab, or no threshold events are being reported, you might need to restart the monitoring agent.
Solution:
The monitoring agents for Performance Management server require a certain version number, see Dependencies in the IBM Monitoring Knowledge Center. If you have an earlier version of the monitoring agent installed, you must stop and restart the agent before it can send events to the Performance Management server. You must also restart the agent after updating the thresholds or historical data collection before you can see the effect of your changes.
If the thresholds are for the Monitoring Agent for Ruby, edit the application to confirm thatEnable Ruby App Situations is set and the instances that you want to monitor are selected. Formore information, see Managing Applications and the Ruby agent note afterstep 5 in the Managing Applications topic in the IBM Monitoring Knowledge Center.
Troubleshooting - Dashboards show no data, partialdata, or incorrect data from the monitoring agentIf you do not see data in the Application Performance Dashboard for a particular monitoring agent, checkfor time out errors and ensure you are using NTP (Network Time Protocol) on the monitored system.Additionally, review the agent-specific solutions in this topic.
Symptom:In the Application Performance Dashboard ( Performance > Application PerformanceDashboard), you see no data, partial data, or incorrect data for a specific agent or agents afterselecting an item in the Groups or Instance section of the navigator.
Cause:This problem can occur when the monitoring agent's clock is not synchronized with your Application PerformanceManagement console. If the agent's clock is set ahead of theinfrastructure clock, the agent might not download the latest configuration from theinfrastructure.
Solution:Use NTP (Network Time Protocol) on monitored systems to ensure the time on the systemrunning the agent is accurate. Time zones must be set correctly for the time zone they are in, suchas UTC-3 for Brasilia and UTC +9 for Seoul.If your problem was not solved by using NTP, review the logs to investigate further.
All monitoring agents:
On the system where the monitoring agent is installed, review the most recent agent logfor any command timeout messages. Agent log names arehost_name_pc_agent_instance_name_timestamp.log
wherehost_name is the name of the system on which the agent is installedpc is the two-character product code, such as kj or kmagent_instance_name is the name that was given to the instance during agentconfigurationtimestamp is the time and date when the log was savedand the path isLinux/AIX: install_dir/logsWindows: install_dir\TMAITM6_x64\logs
If you see that command timeout messages appear frequently, the agent's shell script mightbe taking too long to return with information and is timing out. The time out period iscontrolled in the pc_agent_instance_name.config file by the CDP_DP_SCRIPT_TIMEOUTenvironment variable, which has a default value of 30 seconds. SetCDP_DP_SCRIPT_TIMEOUT and CDP_DP_REFRESH_INTERVAL to higher values to give the scriptsenough time to complete successfully.
PHP agent:
Your Apache version might be lower than the supported version. Check the ApacheHTTP Server httpd.conf configuration file and ensure that both the mod_status and
ExtendedStatus On options are enabled. For more information, see Configuring the PHP agent.
Ensure the PHP agent plug-in in WordPress is activated. For more information, see Configuring the PHP agent.
In the WordPress List widget, you might see PHP or a different text string listed underWordPress Document Root. This text string does not follow the standard format for theWordPress Document Root. This error might be caused by a PHP module exception. Toensure the PHP modules are working, execute thephp -m command. Correct any moduleswith warnings or exceptions.
Ruby agent:
On the system where the monitoring agent is installed, review thekm_agent_instance_name_script.log for any entries with CMD=CONNECTION that start withapp_name#app_root_directory#IP_address#port_number#pid#mem.
Each line following the timestamp corresponds to a different Ruby application. Forexample, if a user has an application named "MongoStore" with root directory/root/Ruby/mongodb_store, one of the rows might look like this example:
MongoStore#/root/Ruby/mongodb_store#9.42.14.228#4444#20522#4959124 9.42.14.228 corresponds to the IP address of the systemthat the application is on 4444 corresponded to theapplication's listening port number 20522 corresponds to the product ID of the application 4959124 corresponded to the system's memory
If the line starts with the pound sign (#) instead of the app_name, you must reconfigurethe Ruby agent instance to include the Ruby runtime binary location.
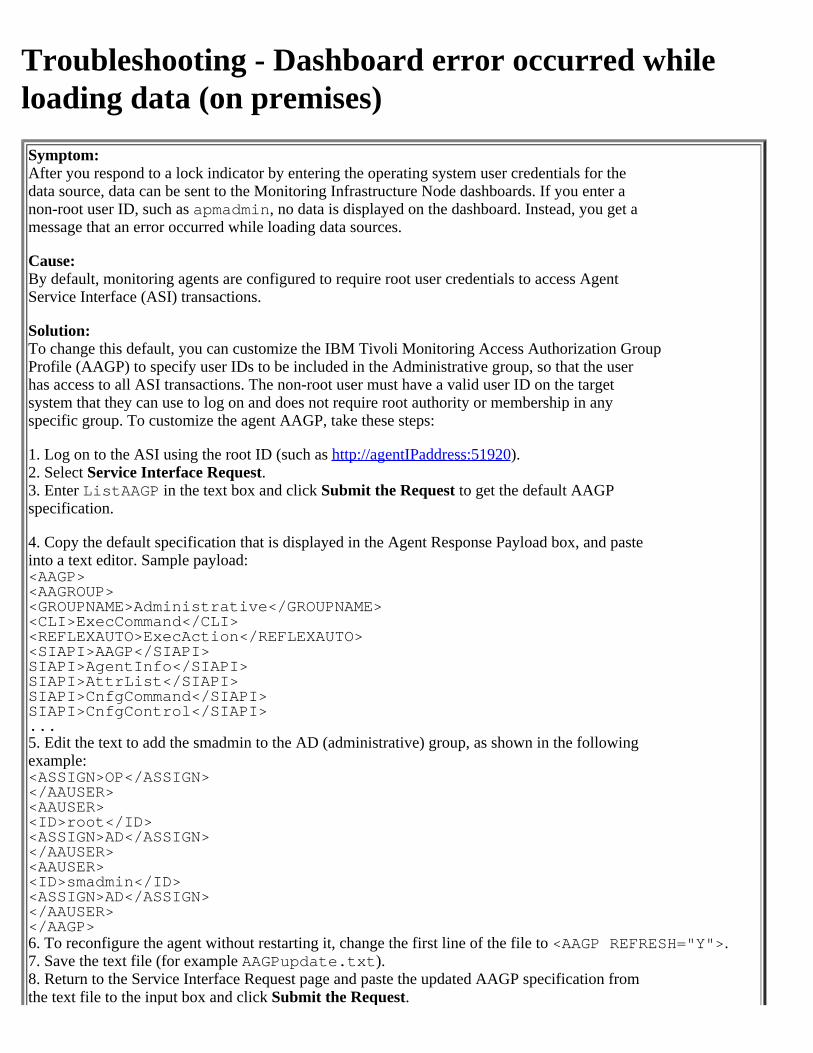
Troubleshooting - Dashboard error occurred whileloading data (on premises)Symptom:After you respond to a lock indicator by entering the operating system user credentials for thedata source, data can be sent to the Monitoring Infrastructure Node dashboards. If you enter anon-root user ID, such as apmadmin, no data is displayed on the dashboard. Instead, you get amessage that an error occurred while loading data sources.
Cause:By default, monitoring agents are configured to require root user credentials to access AgentService Interface (ASI) transactions.
Solution:To change this default, you can customize the IBM Tivoli Monitoring Access Authorization GroupProfile (AAGP) to specify user IDs to be included in the Administrative group, so that the userhas access to all ASI transactions. The non-root user must have a valid user ID on the targetsystem that they can use to log on and does not require root authority or membership in anyspecific group. To customize the agent AAGP, take these steps:
1. Log on to the ASI using the root ID (such as http://agentIPaddress:51920).2. Select Service Interface Request.3. Enter ListAAGP in the text box and click Submit the Request to get the default AAGPspecification.
4. Copy the default specification that is displayed in the Agent Response Payload box, and pasteinto a text editor. Sample payload:<AAGP><AAGROUP><GROUPNAME>Administrative</GROUPNAME><CLI>ExecCommand</CLI><REFLEXAUTO>ExecAction</REFLEXAUTO><SIAPI>AAGP</SIAPI>SIAPI>AgentInfo</SIAPI>SIAPI>AttrList</SIAPI>SIAPI>CnfgCommand</SIAPI>SIAPI>CnfgControl</SIAPI>...5. Edit the text to add the smadmin to the AD (administrative) group, as shown in the followingexample:<ASSIGN>OP</ASSIGN></AAUSER><AAUSER><ID>root</ID><ASSIGN>AD</ASSIGN></AAUSER><AAUSER><ID>smadmin</ID><ASSIGN>AD</ASSIGN></AAUSER></AAGP>6. To reconfigure the agent without restarting it, change the first line of the file to <AAGP REFRESH="Y">.7. Save the text file (for example AAGPupdate.txt).8. Return to the Service Interface Request page and paste the updated AAGP specification fromthe text file to the input box and click Submit the Request.

After the "Request completed successfully" response is displayed, the agent has a new file namedlz_aagpcnfg.txt in the $CANDLEHOME$/localconfig/lz directory. It has the configuration necessary for the user (such as smaiuser) to access ASI transactions and for the Performance Managementserver to connect to the agent and retrieve data.
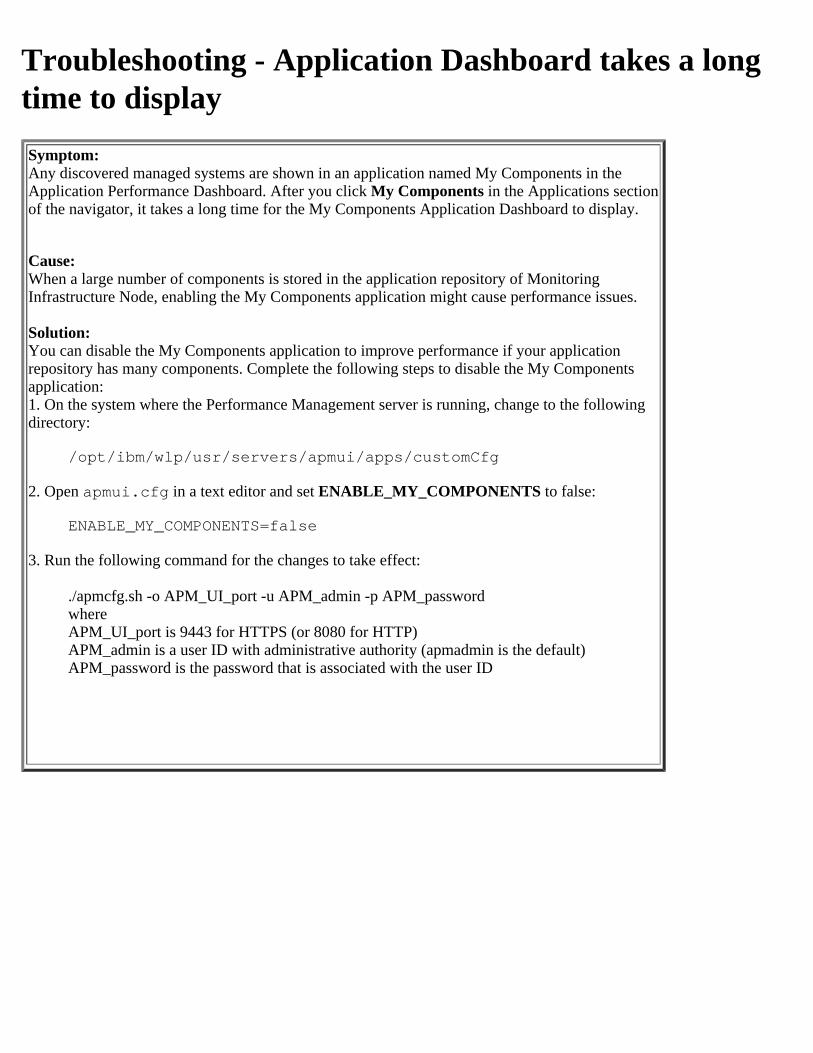
Troubleshooting - Application Dashboard takes a longtime to displaySymptom:Any discovered managed systems are shown in an application named My Components in theApplication Performance Dashboard. After you click My Components in the Applications sectionof the navigator, it takes a long time for the My Components Application Dashboard to display.
Cause:When a large number of components is stored in the application repository of MonitoringInfrastructure Node, enabling the My Components application might cause performance issues.
Solution:You can disable the My Components application to improve performance if your applicationrepository has many components. Complete the following steps to disable the My Componentsapplication:1. On the system where the Performance Management server is running, change to the followingdirectory:
/opt/ibm/wlp/usr/servers/apmui/apps/customCfg
2. Open apmui.cfg in a text editor and set ENABLE_MY_COMPONENTS to false:
ENABLE_MY_COMPONENTS=false
3. Run the following command for the changes to take effect:
./apmcfg.sh -o APM_UI_port -u APM_admin -p APM_passwordwhereAPM_UI_port is 9443 for HTTPS (or 8080 for HTTP)APM_admin is a user ID with administrative authority (apmadmin is the default)APM_password is the password that is associated with the user ID
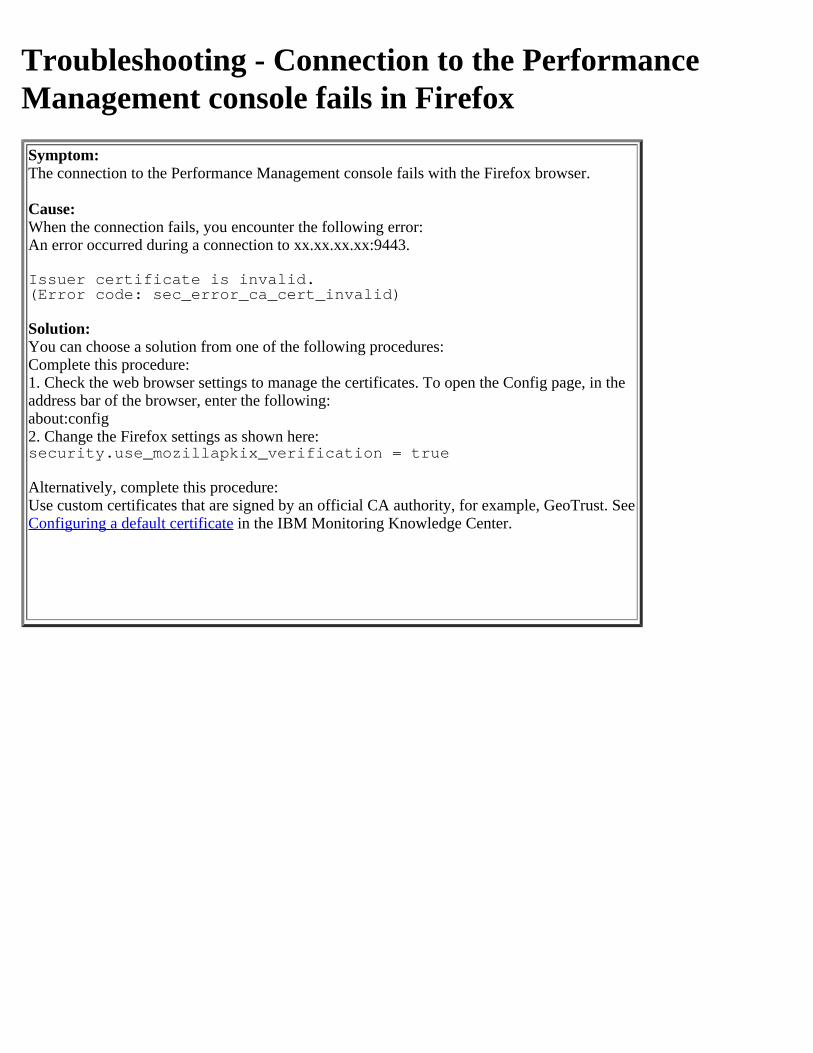
Troubleshooting - Connection to the PerformanceManagement console fails in FirefoxSymptom:The connection to the Performance Management console fails with the Firefox browser.
Cause:When the connection fails, you encounter the following error:An error occurred during a connection to xx.xx.xx.xx:9443.
Issuer certificate is invalid.(Error code: sec_error_ca_cert_invalid)
Solution:You can choose a solution from one of the following procedures:Complete this procedure:1. Check the web browser settings to manage the certificates. To open the Config page, in theaddress bar of the browser, enter the following:about:config2. Change the Firefox settings as shown here:security.use_mozillapkix_verification = true
Alternatively, complete this procedure:Use custom certificates that are signed by an official CA authority, for example, GeoTrust. SeeConfiguring a default certificate in the IBM Monitoring Knowledge Center.
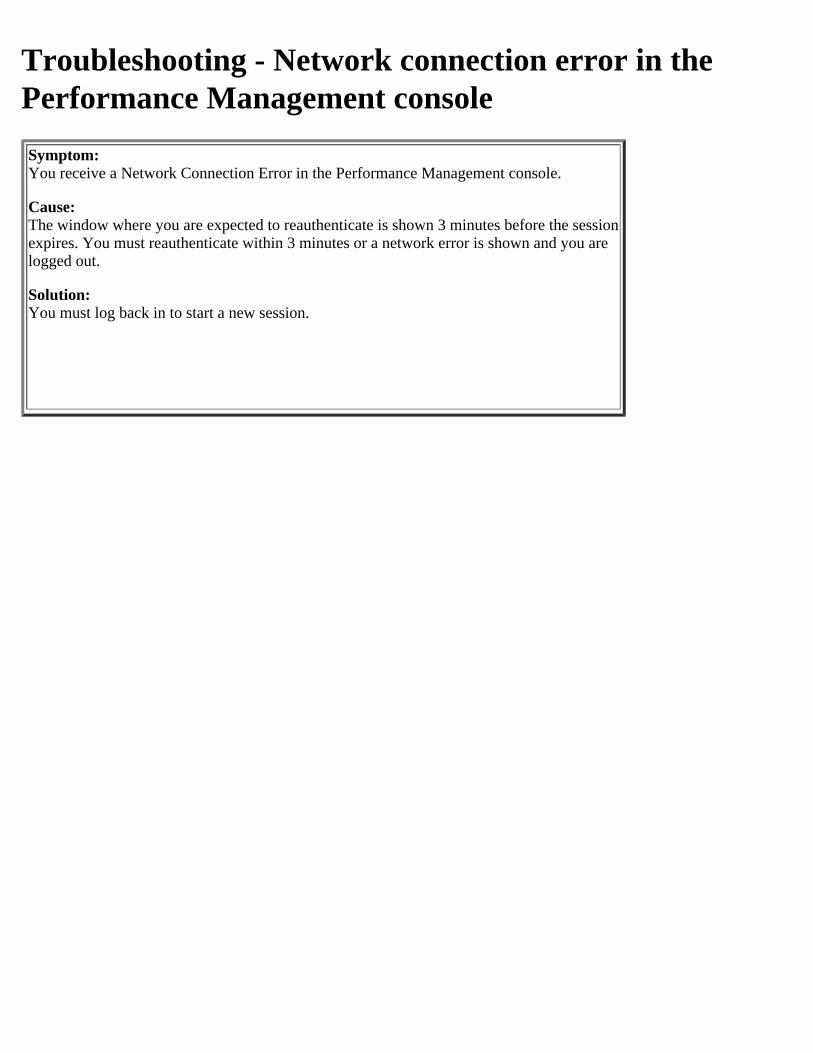
Troubleshooting - Network connection error in thePerformance Management consoleSymptom:You receive a Network Connection Error in the Performance Management console.
Cause:The window where you are expected to reauthenticate is shown 3 minutes before the session expires. You must reauthenticate within 3 minutes or a network error is shown and you are logged out.
Solution:You must log back in to start a new session.
Troubleshooting - Getting Started links blocked inChromeSymptom:When using the Chrome v21 or later browser, you are blocked from opening the links in the Getting Started page.
Cause:Starting with Chrome v21, any unsecured (HTTP rather than HTTPS) or unauthenticated browser links are blocked.
Solution:Click the shield tool and select "Load unsafe script"" to continue to the page. Alternatively, right-click the link and select "Open in new tab" or "Open in new browser" to continue to the page.
Troubleshooting - Multiple agents: High CPU usageThe following agents might have this problem:
Oracle Database agentDB2 agentMicrosoft Exchange Server agentMicrosoft SQL Server agentMicrosoft IIS agentMicrosoft .NET agent
Symptom:The system is experiencing high CPU usage.
Solution:
Agent process
View the CPU usage of the process:
Oracle agent: KRZCMA process DB2 agent: kuddb2 process Microsoft Exchange Server agent: KEXCMA process Microsoft SQL Server agent: KOQCMA process Microsoft IIS agent: KQ7CMA process Microsoft .NET agent: KQECMA process
If CPU usage seems to be excessive, restart the monitoring agent.
Note: As the number of remote systems is increased, the CPU, memory, and network utilization on the agent server also increase. A dedicated agent server might be added to the environment to handle a large agentless monitoring environment.
Network cards
The network card configurations can decrease the performance of a system. Each stream of packets that a network card receives (assuming that it is a broadcast or destined for the under-performing system) must generate a CPU interrupt and transfer the data through the I/O bus. If the network card in question is a bus-mastering card, work can be offloaded and a data transfer between memory and the network card can continue without using CPU processing power. Bus-mastering cards are 32 bit and are based on PCI or EISA bus architectures.
Troubleshooting - Performance Management serverinstallation failure and the RPM database (on premises)Symptom:If the Performance Management server installation fails, the log files might show a problem with theRPM database.Problem:When the Performance Management server installation fails, you might encounter the following error:
Mon Feb 9 08:02:56 CST 2015: rpmdb: PANIC: fatal region error detected; runrecoveryMon Feb 9 08:02:56 CST 2015: error: db3 error(-30974)from dbenv->open: DB_RUNRECOVERY: Fatal error, run database recoveryMon Feb 9 08:02:56 CST 2015: error: cannot open Packages index using db3 -(-30974)Mon Feb 9 08:02:56 CST 2015: error: cannot open Packages database in/var/lib/rpm
Solution:To solve this problem, complete the following steps:1. Remove the rm -rf /var/lib/rpm/__db.00* rpm lock files.2. To rebuild the RPM database, enter the rpm --rebuilddb command.3. To uninstall all the components that you installed to /opt/ibm/, enter the /opt/ibm/ccm/uninstall.sh command.
4. To restart the installation, enter the./install.sh command.
Troubleshooting - Multiple agents: Installation failed onAIXThe following agents might have this problem:
DataPower agent HTTP Server agent Oracle Database agent
Symptom:The installation failed on an AIX system because the default .tar command truncated a long path.On AIX systems, the existing .tar command has some size limits that restrict file names to 100characters, and restrict UID and GID values to o77777777.
Solution:Extract the files from the archive file. To extract the archive file, obtain the fix that is provided inAPAR IV20002 (http://www-01.ibm.com/support/docview.wss?uid=isg1IV20002).Alternatively, you can use GNU tar to extract the files. To install GNU tar, go tohttp://www-03.ibm.com/systems/power/software/aix/linux/toolbox/alpha.htmlOptionally, you can directly download the tar rpm to the AIX system:ftp://ftp.software.ibm.com/aix/freeSoftware/aixtoolbox/RPMS/ppc/tar/tar-1.22-1.aix6.1.ppc.rpm
Run the following command:rpm -i tar-1.22-1.aix6.1.ppc.rpmThen, use the GNU tar to extract the archive by using the following command: /opt/freeware/bin/tar -xf package.tar
Troubleshooting - HMC Base agent user: ConfigurationSymptoms:When you start the agent instance, there are some prompts in the console and the HMC baseagent dashboards do not contain any data as shown here:Password:Password:Password:username@hmchostname password:username@hmchostname password:
In the kph_data_provider__instance name_startup.logagent log file, the following logs areshown:
"Failed to logon to the hmc server, please check if username and passwordare correct""stopping the hmc base data provider process, please reconfigure with correctusername,then restart agent!"
Cause:The agent instance is configured with the incorrect HMC console user or the user does not havehscviewer authority.
Solution:Complete the following steps:1. Stop the agent.2. Run the /aix526/ph/bin/setup_hmc_key.pl perl script and include the correct HMC username to generate the ssh keys to access the HMC console server.3. Configure the agent with the same user name that you applied in step 2.4. Start the agent.
Troubleshooting - Microsoft Hyper-V Server agent: Nodata is displayed in the Virtual Machine DetailsdashboardSymptom:On the Virtual Machine Details dashboard, no data is displayed in any of the group widgets.
Cause:The Virtual Machine Details page displays data that the Hyper-V agent collects from the OS agent, which is installedon the virtual machine. An OS agent that works in a SaaS environment is not yet available for the following systems:
CentOSDebian LinuxOracle LinuxSUSE LinuxUbuntuFreeBSD
Therefore, if the virtual machine runs on any of these guest systems, no data is displayed in the Virtual MachineDetails page.
Solution:A solution is currently not available.
Troubleshooting - SAP agent: Monitoring agent doesnot start in an AIX V6.1 environmentSymptom:
The SAP agent does not start in an AIX V6.1 environment that has a Technology Level (TL) less than TL8 and a timezone of Asia/Calcutta.
Solution:
To resolve this problem, complete one of the following steps:
Change the time zone to TZ=CST6CDT, and then start the agent.Upgrade the AIX 6.1 environment to include TL8 level, and then start the agent.
Troubleshooting - SAP agent: Values shown are notcorrect when you edit the configuration for an existingmonitoring agentSymptom:
When you edit the configuration for an existing monitoring agent, the values that are shown are not correct.
Solution:
The original configuration settings might include non-ASCII characters. These values were stored incorrectly andresult in the incorrect display. Enter new values by using only ASCII characters.
Troubleshooting - SAP agent: Transaction not validerror when you run the /IBMMON/ITM_* transactionsSymptom:
When you run the /IBMMON/ITM_* transactions, you get an error that indicates that the transaction is not valid.
Solution:
Preface all /IBMMON/ITM_* transactions with /n or /o.
Troubleshooting - SAP agent: Tivoli Monitoring alert9912 and SAP syslog messageSymptom:
You receive Tivoli Monitoring alert 9912: CCMS alerts collection did not complete, SAPsyslog message ??ccms_rfc_error????, or both of these alerts. You might also receive ABAP dumpsfrom the /IBMMON/ITM_ALERTS and /IBMMON/ITM_CCMS_ALERTS function modules that are provided by theSAP agent.
Solution:
Tivoli Monitoring Alert 99112 typically indicates a problem with the mySAP CCMS rather than with the SAP agent.Review the syslog message to help troubleshoot the problem in the SAP CCMS environment. Verify that CCMSperforms properly.
Contact IBM Software Support to get instructions on how to reduce or prevent the monitoring agent ABAP dumpswhile CCMS problems are investigated.
Troubleshooting - SAP agent: Same version installationwarning during command-line installation on UNIXSymptom:
During the command-line installation on UNIX, you choose to install a component that is already installed, and yousee the following warning:
WARNING - you are about to installthe SAME version of "component"
where component is the name of the component that you are attempting to install.
Solution:
You must exit and restart the installation process. You cannot return to the list where you selected components toinstall. When you run the installer again, do not attempt to install any component that is already installed.
Troubleshooting - SAP agent: Runtime errors inrelation to transport on the SAP systemSymptom:
Runtime errors in relation to transport on the SAP system.
Solution:
When you import the transport on the SAP system, you must not start the SAP agent instance that is configured tomonitor that SAP system.
Before you delete the transport from the SAP system, you must stop the SAP agent instance that is configured tomonitor that SAP system.
Troubleshooting - SAP agent:TSV_TNEW_PAGE_ALLOC_FAILED ABAP runtimeerrorSymptom:
The TSV_TNEW_PAGE_ALLOC_FAILED ABAP runtime error occurred in SAP because of huge data volume.
Solution:
To resolve this problem, you must increase the ABAP heap size. To increase the heap size in SAP, complete thefollowing steps:
1. Run T-Code SE38.2. In the Program name text box, enter RSMEMORY, and execute.3. Under the Other parameters section, set the value for abap/heap area dia parameter, and then, click Copy.
Note: The recommended size of ABAP heap size is 2 GB. However, you can increase the size.
Troubleshooting - SAP agent: Return code 8 or returncode 12 occurs on the main import stepSymptom:
Return code 8 or return code 12 occurs on the main import step.
Solution:
This return code is related to DYNPRO format incompatibility or export/import (specifically table EUDB)incompatibility. These errors occur if the R3trans program is old or the Basis support package maintenance is low.
Upgrade R3trans program or Basis support level SAP Notes that describe the minimum R3trans and Basis supportpackages are documented in the following OSS Notes: 330267, 454321, 743155.
Troubleshooting - SAP agent: Attributes do not allownon-ASCII input when you are creating an eventingthresholdSymptom:
When you are creating an eventing threshold, attributes do not allow non-ASCII input.
Solution:
None. Any attribute that does not include "(Unicode)" might support only ASCII characters. For example, "Attribute(Unicode)" supports Unicode but "Attribute" without "(Unicode)" might support ASCII characters only.
Troubleshooting - SAP agent: Non-ASCII charactersthat are entered into the configuration window do notshow up or are not the correct charactersSymptom:
Non-ASCII characters that are entered into the configuration window for the monitoring agent do not show up or arenot the correct characters.
Solution:
Enter only ASCII characters into these fields.
Troubleshooting - SAP agent: mySAP server does notstart when using port 3661Symptom:
The mySAP server does not start when using port 3661.
Solution:
Change the current setting of KDC_FAMILIES=$NETWORKPROTOCOL$ to KDC_FAMILIES=HTTPS:0 in bothof the SAP agent.configuration files (*.config and *.ini).
Troubleshooting - SAP agent: mySAP application serveris not discovered by the SAP agentSymptom:
A mySAP application server is not discovered by the SAP agent.
Solution:
Check to make sure that there is at least one (preferably two) dialog process on that instance. The SAP agent requiresa dialog work process in which to run the agent supplied ABAP that monitors the instance.
Troubleshooting - SAP agent: Syslog messages and alertmessages do not show correctly in non-EnglishlanguagesSymptom:
Text strings, such as syslog messages and alert messages do not show correctly in non-English languages. Thisproblem is more likely to occur with double-byte languages.
Solution:
Set the SAP_CODEPAGE environment variable.Manually edit the RAS1 trace logging parameters, using the following steps:
1. Specify RAS1 trace options by changing trace parameters in a control file.2. Open the trace options file.
On Windows systems: install_dir\TAMITM6_x64\KSAENVOn UNIXsystems: export KBB_RAS1='ERROR (UNIT:ksa ALL) (UNIT:kra ALL)'
3. Edit the line that begins with KBB_RAS1= to set trace logging preferences. For example, if you want detailedtrace logging, set the Maximum Tracing option:
On Windows systems: KBB_RAS1=ERROR (UNIT:ksa ALL) (UNIT:kra ALL)On UNIX systems: export KBB_RAS1='ERROR (UNIT:ksa ALL) (UNIT:kra ALL)'
4. Edit the line that begins with KBB_RAS1_LOG= to manage the generation of log files:Edit the following parameters to adjust the number of rolling log files and their size.
MAXFILES: the total number of files that are to be kept for all startups of a program. When thisvalue is exceeded, the oldest log files are discarded. Default value is 9.LIMIT: the maximum size, in megabytes (MB) of an RAS1 log file. Default value is 5.
IBM Software Support might guide you to modify the following parameters:COUNT: the number of log files to keep in the rolling cycle of one program startup. Default valueis 3.PRESERVE: the number of files that are not to be reused in the rolling cycle of one programstartup. Default value is 1.
The KBB_RAS1_LOG parameter also provides for the specification of the log file directory, log filename, and the inventory control file directory and name. Do not modify these values or log informationcan be lost.
5. Restart the monitoring agent so that your changes take effect.
Troubleshooting - Ruby agent: Instance not discoveredSymptom
While attempting to add a Ruby instance to an application, you do not see a started instance in the list. The Ruby instance was added to an application but does not appear in the Application Performance Dashboard.
Cause
The Ruby instance was started with daemonized Ruby processes. For example, you started the Ruby on Rails application using the rails server command with a -d argument.
Solution
Do not run Ruby application in a daemon process.
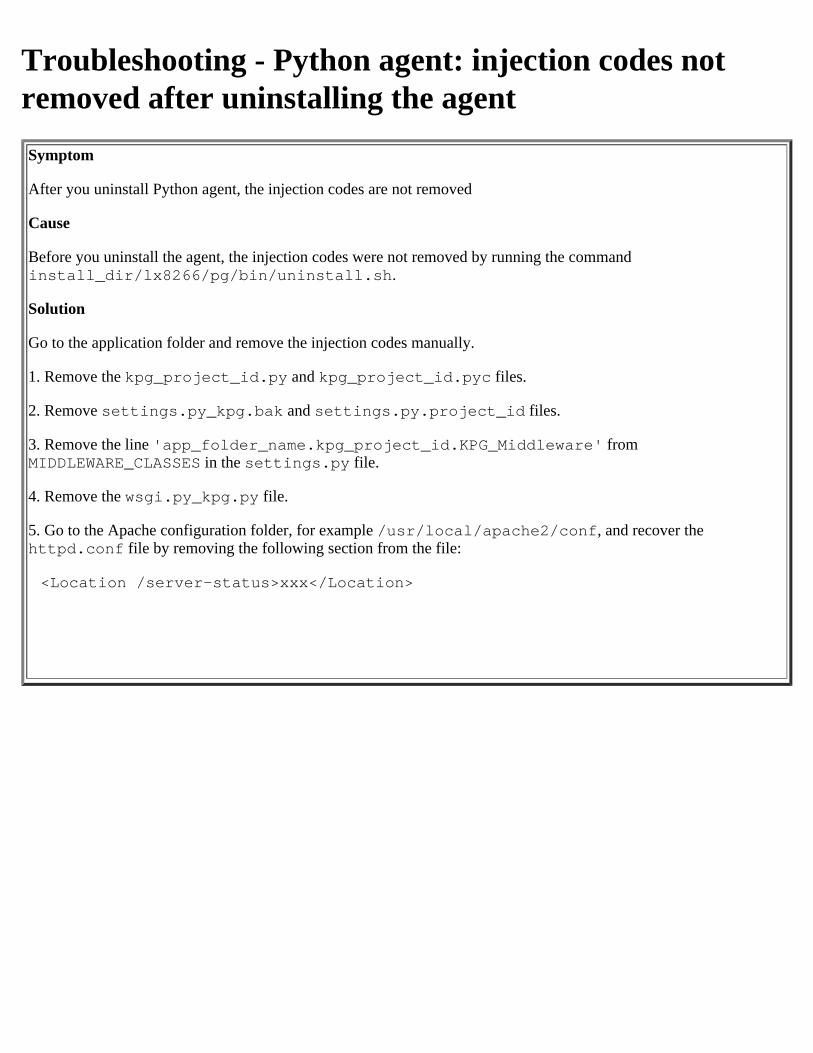
Troubleshooting - Python agent: injection codes notremoved after uninstalling the agentSymptom
After you uninstall Python agent, the injection codes are not removed
Cause
Before you uninstall the agent, the injection codes were not removed by running the commandinstall_dir/lx8266/pg/bin/uninstall.sh.
Solution
Go to the application folder and remove the injection codes manually.
1. Remove the kpg_project_id.py and kpg_project_id.pyc files.
2. Remove settings.py_kpg.bak and settings.py.project_id files.
3. Remove the line 'app_folder_name.kpg_project_id.KPG_Middleware' fromMIDDLEWARE_CLASSES in the settings.py file.
4. Remove the wsgi.py_kpg.py file.
5. Go to the Apache configuration folder, for example /usr/local/apache2/conf, and recover thehttpd.conf file by removing the following section from the file:
<Location /server-status>xxx</Location>
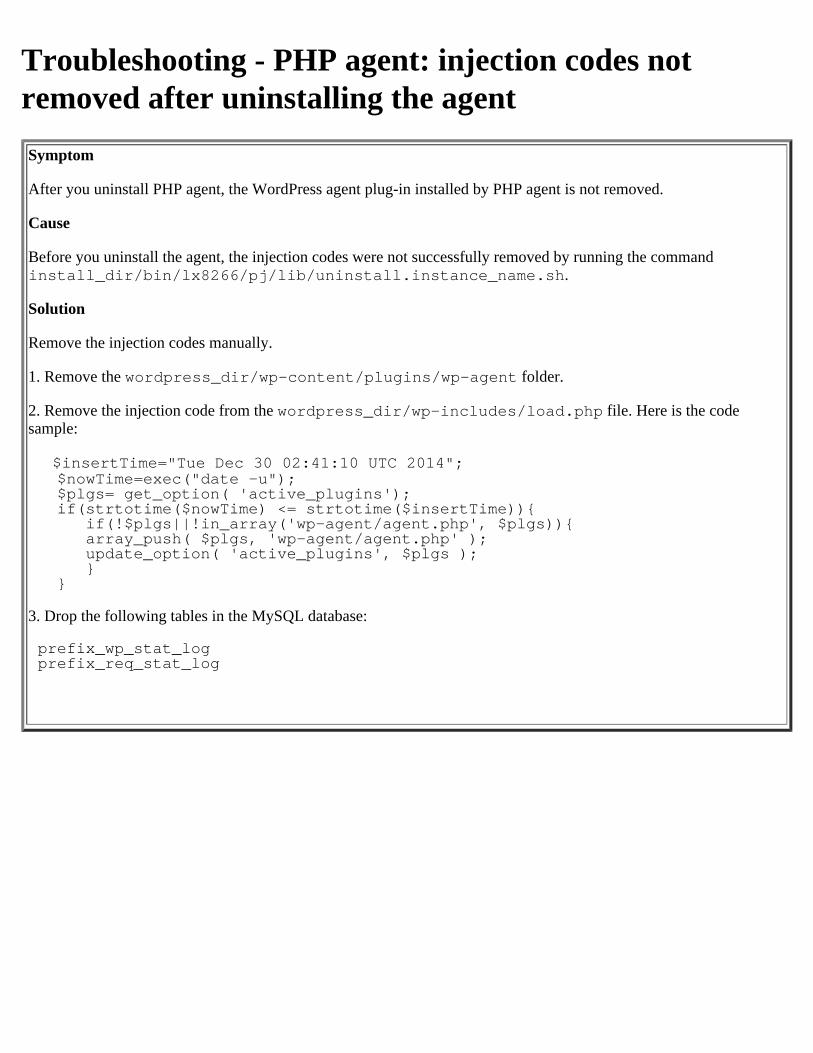
Troubleshooting - PHP agent: injection codes notremoved after uninstalling the agentSymptom
After you uninstall PHP agent, the WordPress agent plug-in installed by PHP agent is not removed.
Cause
Before you uninstall the agent, the injection codes were not successfully removed by running the commandinstall_dir/bin/lx8266/pj/lib/uninstall.instance_name.sh.
Solution
Remove the injection codes manually.
1. Remove the wordpress_dir/wp-content/plugins/wp-agent folder.
2. Remove the injection code from the wordpress_dir/wp-includes/load.php file. Here is the codesample:
$insertTime="Tue Dec 30 02:41:10 UTC 2014"; $nowTime=exec("date -u"); $plgs= get_option( 'active_plugins'); if(strtotime($nowTime) <= strtotime($insertTime)){
if(!$plgs||!in_array('wp-agent/agent.php', $plgs)){ array_push( $plgs, 'wp-agent/agent.php' ); update_option( 'active_plugins', $plgs ); }
}
3. Drop the following tables in the MySQL database:
prefix_wp_stat_logprefix_req_stat_log
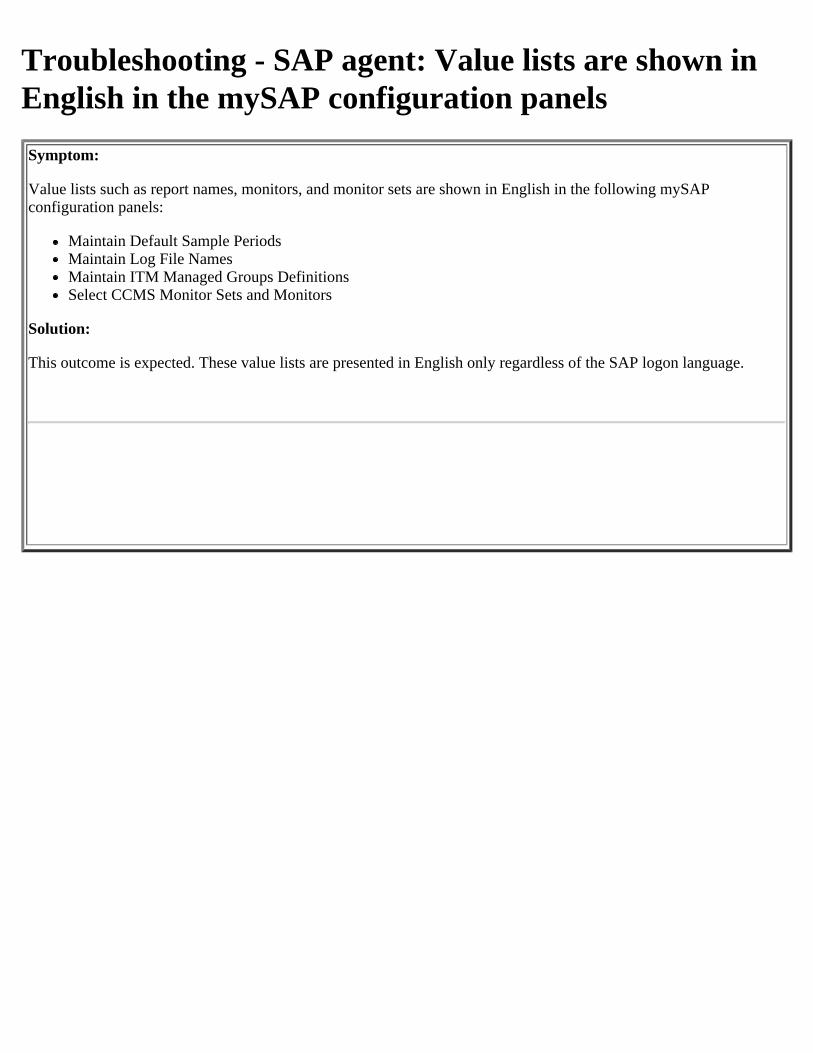
Troubleshooting - SAP agent: Value lists are shown inEnglish in the mySAP configuration panelsSymptom:
Value lists such as report names, monitors, and monitor sets are shown in English in the following mySAPconfiguration panels:
Maintain Default Sample PeriodsMaintain Log File NamesMaintain ITM Managed Groups DefinitionsSelect CCMS Monitor Sets and Monitors
Solution:
This outcome is expected. These value lists are presented in English only regardless of the SAP logon language.
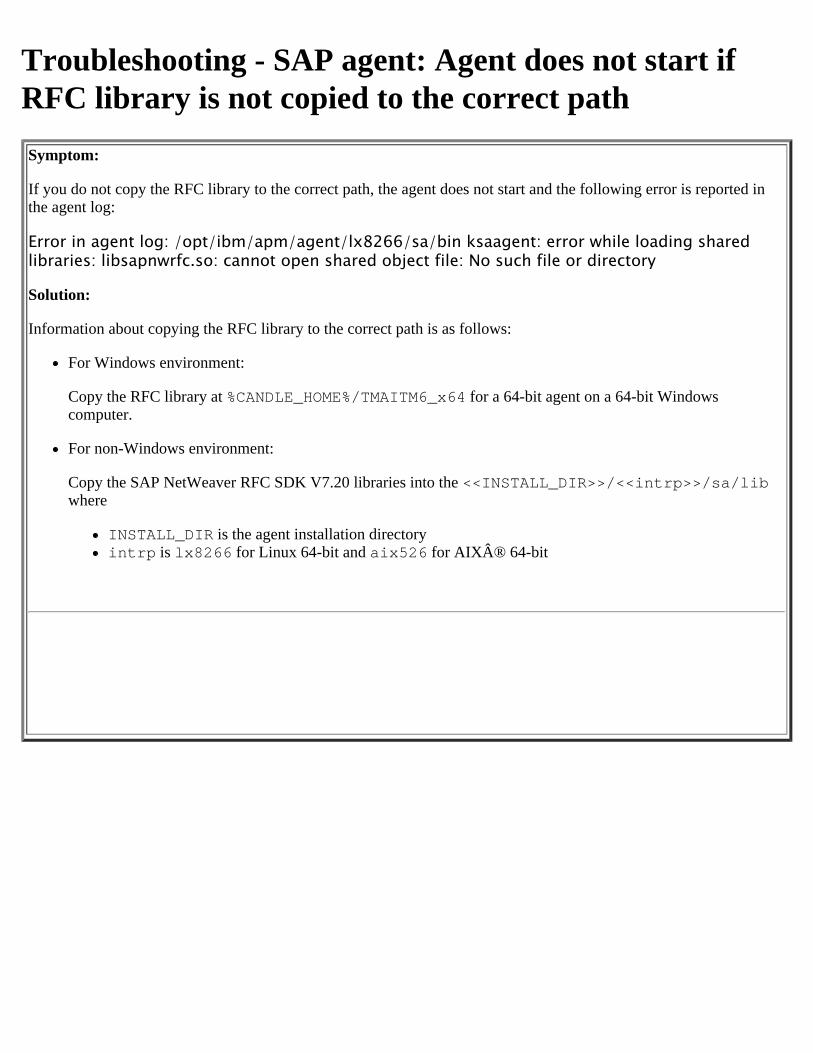
Troubleshooting - SAP agent: Agent does not start ifRFC library is not copied to the correct pathSymptom:
If you do not copy the RFC library to the correct path, the agent does not start and the following error is reported inthe agent log:
Error in agent log: /opt/ibm/apm/agent/lx8266/sa/bin ksaagent: error while loading sharedlibraries: libsapnwrfc.so: cannot open shared object file: No such file or directory
Solution:
Information about copying the RFC library to the correct path is as follows:
For Windows environment:
Copy the RFC library at %CANDLE_HOME%/TMAITM6_x64 for a 64-bit agent on a 64-bit Windowscomputer.
For non-Windows environment:
Copy the SAP NetWeaver RFC SDK V7.20 libraries into the <<INSTALL_DIR>>/<<intrp>>/sa/libwhere
INSTALL_DIR is the agent installation directoryintrp is lx8266 for Linux 64-bit and aix526 for AIX® 64-bit
Troubleshooting - Microsoft Exchange Server agent:Exchange Server 2013 component shows Exchange 2007and 2010 instancesSymptom:On the Application Performance Dashboard, when you select the Microsoft Exchange Server 2013 component underMy Components, the Exchange Server 2007 and 2010 instances are displayed as instances of Microsoft ExchangeServer 2013 along with instances of Exchange Server 2013. The dashboard shows incomplete data for the ExchangeServer 2007 and 2010 instances.
Cause:This problem occurs when Exchange Server 2007 and 2010 instances are selected as instances of the MicrosoftExchange Server 2013 component when you create an application.
Solution:Always ensure that you select the correct monitored Exchange Server instances for each component of ExchangeServer when you create an application. For example, if you want to monitor Exchange Server 2007 or 2010, selectExchange 2007 or 2010 instances for the Microsoft Exchange Server component. If you want to monitor ExchangeServer 2013, select Exchange Server 2013 instances for the Microsoft Exchange Server 2013 component.
Troubleshooting - Linux KVM agent: bash: nc:command not found messageSymptom:You turn on the extra libvirt messages by using the export LIBVIRT_DEBUG=yes command. Then, when you run the virsh -chypervisor uri command, you see the following message:
bash: nc: command not found
Solution:Install the netcat-openbsd package on the host of the hypervisor that you want to monitor.
Troubleshooting - Linux KVM agent: Failed to connectto data source messageSymptom:
In the agent log, you see the messageSEVERE: DataSource.connect: failed to connect to data source ip address
Solution:
1. Find the hypervisor URI of the host that failed to connect. The URI is listed in a message justbefore the failed to connect message.2. On the computer where the agent is installed, enter the export LIBVIRT_DEBUG=yes commandfollowed by the virsh -chypervisor uri that failed command.3. Review the extra debug messages for symptoms of an underlying problem.
Troubleshooting - Node.js agent: Configuration file notgenerated after configuring and starting the agentSymptom
After configuring and starting the agent, the configuration file plugin_3000_conf.json is not generated in the directoryinstall_dir/lx8266/nj/bin/plugin/lib, where install_dir is the installation directory of Node.js agent.
Cause
The environment variable AGENT_BIN_DIR is not correctly set.
Solution
Correct the value of the environment variable AGENT_BIN_DIR by running the following commands ininstall_dir/bin directory:./nodejs-agent.sh stopunset CANDLEHOME./nodejs-agent.sh start
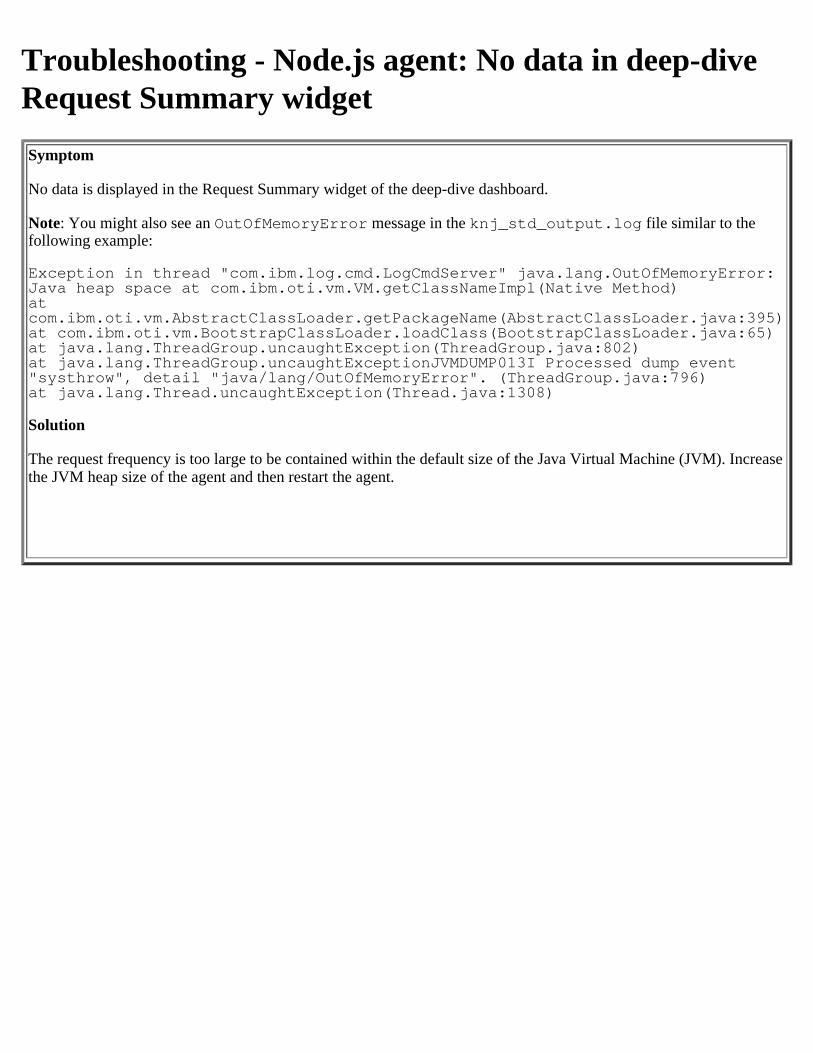
Troubleshooting - Node.js agent: No data in deep-diveRequest Summary widgetSymptom
No data is displayed in the Request Summary widget of the deep-dive dashboard.
Note: You might also see an OutOfMemoryError message in the knj_std_output.log file similar to the following example:
Exception in thread "com.ibm.log.cmd.LogCmdServer" java.lang.OutOfMemoryError: Java heap space at com.ibm.oti.vm.VM.getClassNameImpl(Native Method)atcom.ibm.oti.vm.AbstractClassLoader.getPackageName(AbstractClassLoader.java:395) at com.ibm.oti.vm.BootstrapClassLoader.loadClass(BootstrapClassLoader.java:65) at java.lang.ThreadGroup.uncaughtException(ThreadGroup.java:802)at java.lang.ThreadGroup.uncaughtExceptionJVMDUMP013I Processed dump event"systhrow", detail "java/lang/OutOfMemoryError". (ThreadGroup.java:796)at java.lang.Thread.uncaughtException(Thread.java:1308)
Solution
The request frequency is too large to be contained within the default size of the Java Virtual Machine (JVM). Increasethe JVM heap size of the agent and then restart the agent.
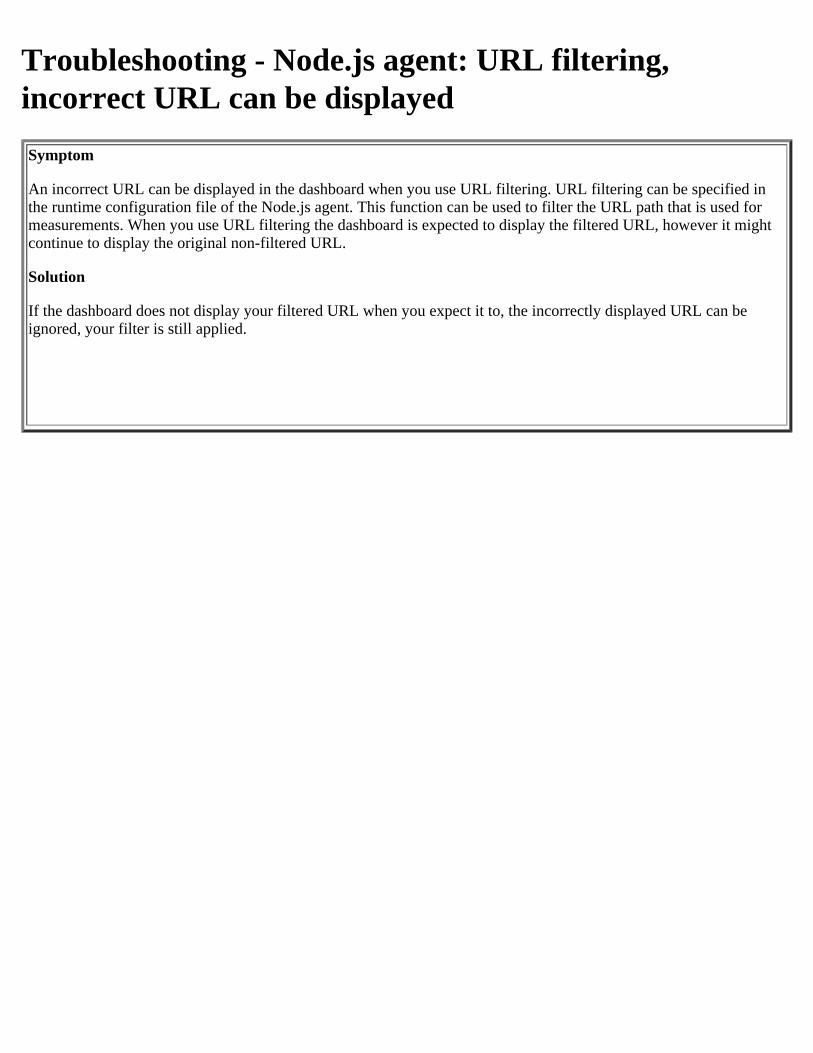
Troubleshooting - Node.js agent: URL filtering,incorrect URL can be displayedSymptom
An incorrect URL can be displayed in the dashboard when you use URL filtering. URL filtering can be specified in the runtime configuration file of the Node.js agent. This function can be used to filter the URL path that is used for measurements. When you use URL filtering the dashboard is expected to display the filtered URL, however it might continue to display the original non-filtered URL.
Solution
If the dashboard does not display your filtered URL when you expect it to, the incorrectly displayed URL can be ignored, your filter is still applied.
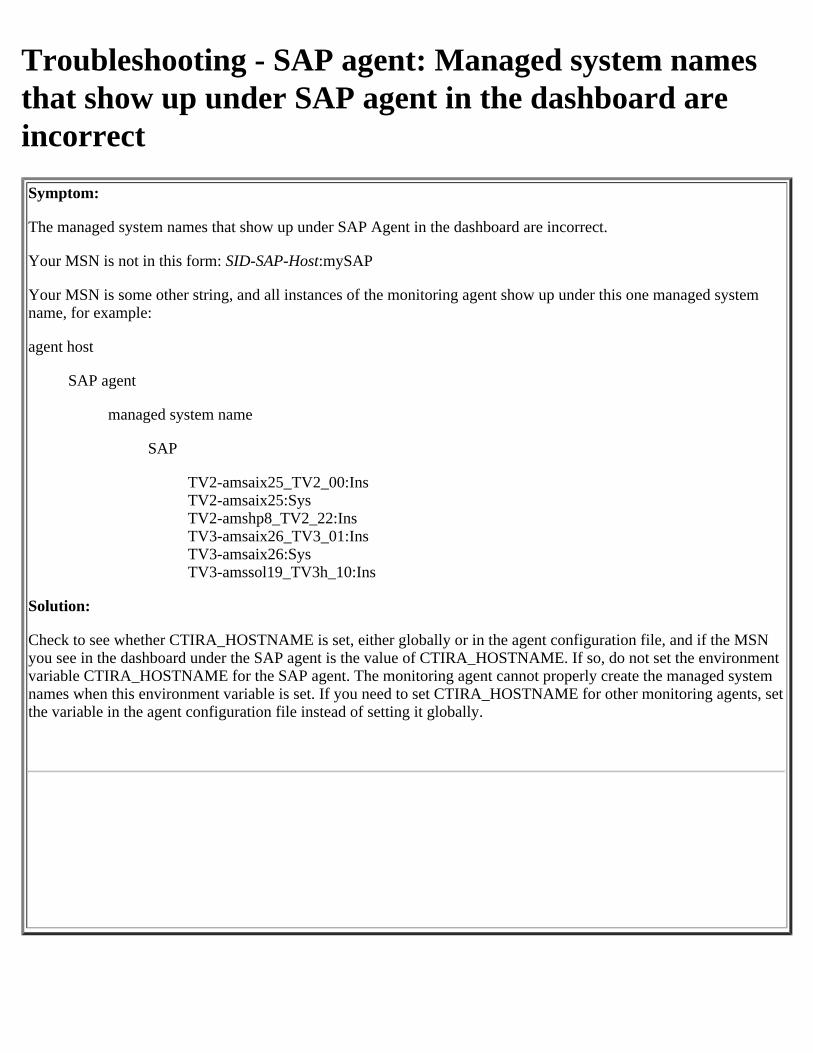
Troubleshooting - SAP agent: Managed system namesthat show up under SAP agent in the dashboard areincorrectSymptom:
The managed system names that show up under SAP Agent in the dashboard are incorrect.
Your MSN is not in this form: SID-SAP-Host:mySAP
Your MSN is some other string, and all instances of the monitoring agent show up under this one managed systemname, for example:
agent host
SAP agent
managed system name
SAP
TV2-amsaix25_TV2_00:InsTV2-amsaix25:SysTV2-amshp8_TV2_22:InsTV3-amsaix26_TV3_01:InsTV3-amsaix26:SysTV3-amssol19_TV3h_10:Ins
Solution:
Check to see whether CTIRA_HOSTNAME is set, either globally or in the agent configuration file, and if the MSNyou see in the dashboard under the SAP agent is the value of CTIRA_HOSTNAME. If so, do not set the environmentvariable CTIRA_HOSTNAME for the SAP agent. The monitoring agent cannot properly create the managed systemnames when this environment variable is set. If you need to set CTIRA_HOSTNAME for other monitoring agents, setthe variable in the agent configuration file instead of setting it globally.
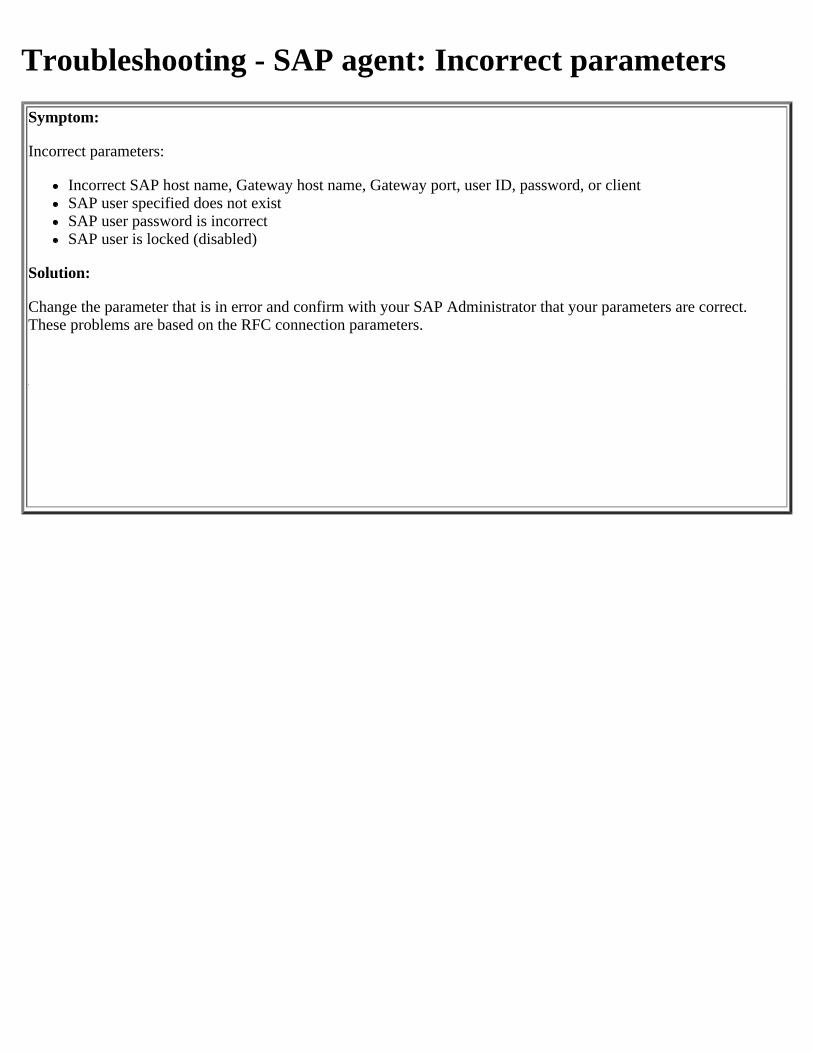
Troubleshooting - SAP agent: Incorrect parametersSymptom:
Incorrect parameters:
Incorrect SAP host name, Gateway host name, Gateway port, user ID, password, or clientSAP user specified does not existSAP user password is incorrectSAP user is locked (disabled)
Solution:
Change the parameter that is in error and confirm with your SAP Administrator that your parameters are correct.These problems are based on the RFC connection parameters.
Troubleshooting - SAP agent: ITM raised alert messagein the SAP syslogSymptom:
Many of the following messages are in the SAP syslog: ITM raised alert 9911 - Excessive datacollected for R/3 Database Detail.
Solution:
This alert message is generated by the monitoring agent and indicates that the number of database detail rows that aregenerated by the ABAP data provider exceeded the configured maximum number of rows to return.
The R/3_Data_Base_Detail data set returns a row for every object with more than 20 extents or for every row that isin a space critical condition. Reduce the number of rows that are reported by removing all space critical conditions inthe database and reorganizing to less than 20 extents. This reduction improves the database performance, and reducesthe number of database detail rows returned.
Troubleshooting - SAP agent: Data collection stops orruns sluggishlySymptom:
Data collection stops or runs sluggishly on your SAP systems with Oracle databases.
Solution:
Data collection problems might occur when the SAP program, RSDB_TDB, which collects the Oracle statistics, doesnot work correctly. Too many data rows are stored in MONI. Collection might stop or run sluggishly on busysystems. See SAP Notes: 591801, 713211.
To correct this problem, perform the following steps:
1. Have your SAP Administrator implement these SAP notes.2. Run the specified program, RSORAUD0, with the recommended cleanup options.3. Update the Oracle statistics manually through transaction DB02.
After you implement these steps, the number of rows that are returned to the agent is correct, thevolume of data in MONI does not increase, and agent data collection periods are normal.
Troubleshooting - SAP agent: Cannot locate theKDCB0_HOSTNAME settingSymptom:
Cannot locate the KDCB0_HOSTNAME setting.
Solution:
Go to install_dir/config and edit the sa_3-character-id.config file. Set theKDCB0_HOSTNAME parameter to the IP address of a network card on this computer. If you use multiple networkinterface cards (NICs), use the Primary IP address of the network interface.
Troubleshooting - SAP agent: Cannot connect to theSAP system by using the Logon Group modeSymptom:
You cannot connect to the SAP system by using the Logon Group mode.
Solution:
Use the following new environment variables:
SAPLOGONGROUP: Name of the SAP logon group.SAPMSGSERVER: Host name of the SAP message server. Alternatively, use an IP address.SAPMSGSERVICE: Message service name, for example, sapmsTV1 or a full message service port number, forexample, example: 3601.SAPROUTESTRING: Route string to the SAP system.
Note: You must include the service names in the following operating system services files:
UNIX systems: /etc/servicesWindows systems: \windows\systems32\drivers\etc\services
Troubleshooting - SAP agent: Monitoring agent cannotconnect to the mySAP SystemSymptom:The SAP agent cannot connect to the mySAP System. The agent is started but no :Ins or :Sys managed nodes areshown when you add the "SAP Application" and "SAP System" application.
Solution:Ensure that you configured the agent with the correct mySAP logon information (user ID, password, client).Reconfigure, and restart.
Check the RAS1 log for connection errors. An RAS1 error such as the following indicates that the agent could not logon on with the connection parameters specified during agent configuration:Failure on call to /IBMMON/ITM_VERIFY_LOGON. Verify that all the values are correct. For moreinformation, see "Configuring the SAP agent" topic in the IBM Performance Management (SaaS) Knowledge Center.
Ensure that the mySAP system, application server the agent connects to, or both are running and can accept newconnections. Use transactions SMGW and SM04 to determine whether there are free connections on the applicationserver for the monitoring agent to use.
Use the fully qualified host name or IP addresses if you are configuring the agent by using simple host names.
Ensure that no firewalls are blocking access to mySAP.
Troubleshooting - Microsoft SQL Server agent: InWindows 2003 system, a non-administrator user cannotconfigure the SQL Server agent servicesSymptom:In Windows 2003 system, a non-administrator user cannot configure the SQL Server agent services through theChange Startup option in the Manage Monitoring Services window.
Solution:To configure the SQL Server agent services on a Windows 2003 system, perform the following steps:
1. On the Windows Start menu, click Run.2. Type services.msc, and click OK.3. In the Services window, perform these steps for the agent service and the agent collector service:
a. Right-click the service, and click Properties.b. Click the Log On tab.c. Click This account.d. Type the user name.e. In the Password and Confirm Password field, enter password, and click OK.
4. In the Manage Monitoring Services window, right-click the SQL Server agent service, and click Recycle.
Troubleshooting - Microsoft SQL Server agent:Historical Data Collection collects data after a slightdelaySymptom:Historical Data Collection takes some seconds more than the configured data collection interval time to finish datacollection. This delay gives an impression that some data rows are missing when the collection interval is 1 minute.
Solution:Keep the collection interval to a minimum of 5 minutes and use a smaller interval for an attribute group if it is critical.
Troubleshooting - Microsoft SQL Server agent:Installation failure with KGL and KGS components on32-bit Windows 2003 systemSymptom:The installation of Microsoft SQL Server agent fails with a KGL and KGS component error on a 32-bit Windows2003 system.
Cause:The prerequisite scanner does not work on a 32-bit Windows 2003 system.
Solution:Ensure that the prerequisite scanner does not run during the agent installation. To skip the prerequisite scanner, addthe SET SKIP_PRECHECK=Y variable in the mssql-agent.bat file.
Troubleshooting - Multiple agents: Log dataaccumulates too rapidlyThe following agents might have this problem:
Microsoft Exchange Server agentMicrosoft Hyper-V Server agentMicrosoft IIS agentMicrosoft .NET agent
Symptom:Log data accumulates too rapidly.
Solution:Check the RAS trace option settings. The trace option settings that are specified on the KBB_RAS1= and KDC_DEBUG= lines generate large amounts of data.
Troubleshooting - Microsoft SQL Server agent: Handleleak occurs during the collector processSymptom:For the SQL Server agent, a handle leak occurs during the collector process when the Active Server Pagesperformance object uses the aspperf.dll file.
Solution:The Active Server Pages performance object loads on your local computer. If you are not using this performanceobject for any other application, disable this performance object by completing the following steps:
1. Add the Disable Performance Counter (DWORD) registry entry with value equal to 1.2. Add the DWORD registry entry to the
HKEY_LOCAL_MACHINE\SYSTEM\CurrentControlSet\services\ASP\Performance registrysubkey.
For more information about disabling the performance object, seeMicrosoft Support Knowledge Base article 2962962
Troubleshooting - Microsoft Hyper-V Server agent: Nodata is displayed in the dashboard for the Linux virtualmachineSymptom:On the Virtual Machine page for the Linux virtual machine, no data is displayed in any of the group widgets. TheVirtual Machine Details group widget shows the no-os value for the Operating System widget.
Cause:This problem occurs because of NetworkManager on the Linux virtual machine that is hosted on the Hyper-V Server.NetworkManager causes some instability in the ethernet configuration, which is a known issue with Linux virtualmachines that are hosted on Hyper-V Servers.
Solution:Complete the following steps on the virtual machine to turn off NetworkManager and start the network service:
1. On the command line, enter and run the following commands in the order indicated:a. service NetworkManager stopb. chkconfig NetworkManager offc. service network startd. chkconfig network on
2. In the ifcfg-eth0 file, enter NM_Controlled=no to prevent NetworkManager from startingautomatically.
If this problem still persists, complete these steps:
1. Add the host name of the virtual machine in the host file that is available at the etc/hosts path.2. Restart the virtual machine.3. Refresh the dashboard.
Troubleshooting - Microsoft Hyper-V Server agent:Memory leak is observedSymptom:If the Microsoft Hyper-V Server agent is installed on Windows Server 2008, Service Pack 2, a memory leak isobserved.
Solution:Install the hot fix for Windows Server 2008, Service Pack 2 from Microsoft Support website.
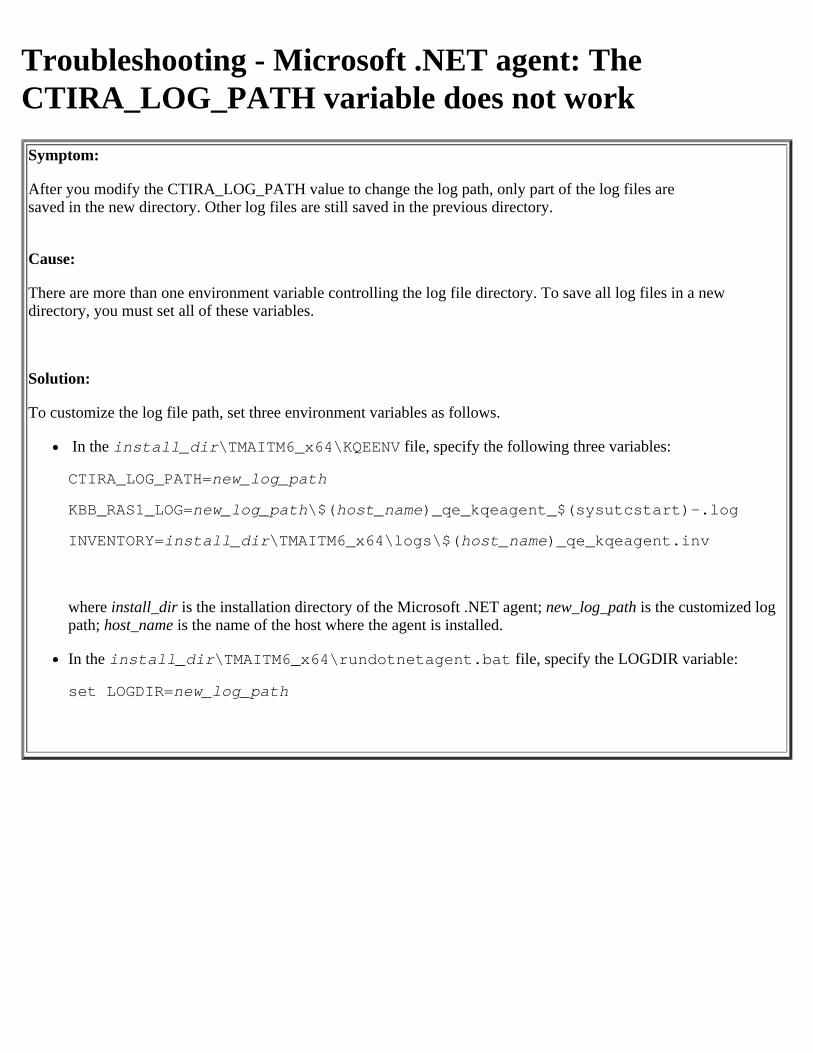
Troubleshooting - Microsoft .NET agent: TheCTIRA_LOG_PATH variable does not workSymptom:
After you modify the CTIRA_LOG_PATH value to change the log path, only part of the log files aresaved in the new directory. Other log files are still saved in the previous directory.
Cause:
There are more than one environment variable controlling the log file directory. To save all log files in a newdirectory, you must set all of these variables.
Solution:
To customize the log file path, set three environment variables as follows.
In the install_dir\TMAITM6_x64\KQEENV file, specify the following three variables:
CTIRA_LOG_PATH=new_log_path
KBB_RAS1_LOG=new_log_path\$(host_name)_qe_kqeagent_$(sysutcstart)-.log
INVENTORY=install_dir\TMAITM6_x64\logs\$(host_name)_qe_kqeagent.inv
where install_dir is the installation directory of the Microsoft .NET agent; new_log_path is the customized logpath; host_name is the name of the host where the agent is installed.
In the install_dir\TMAITM6_x64\rundotnetagent.bat file, specify the LOGDIR variable:
set LOGDIR=new_log_path
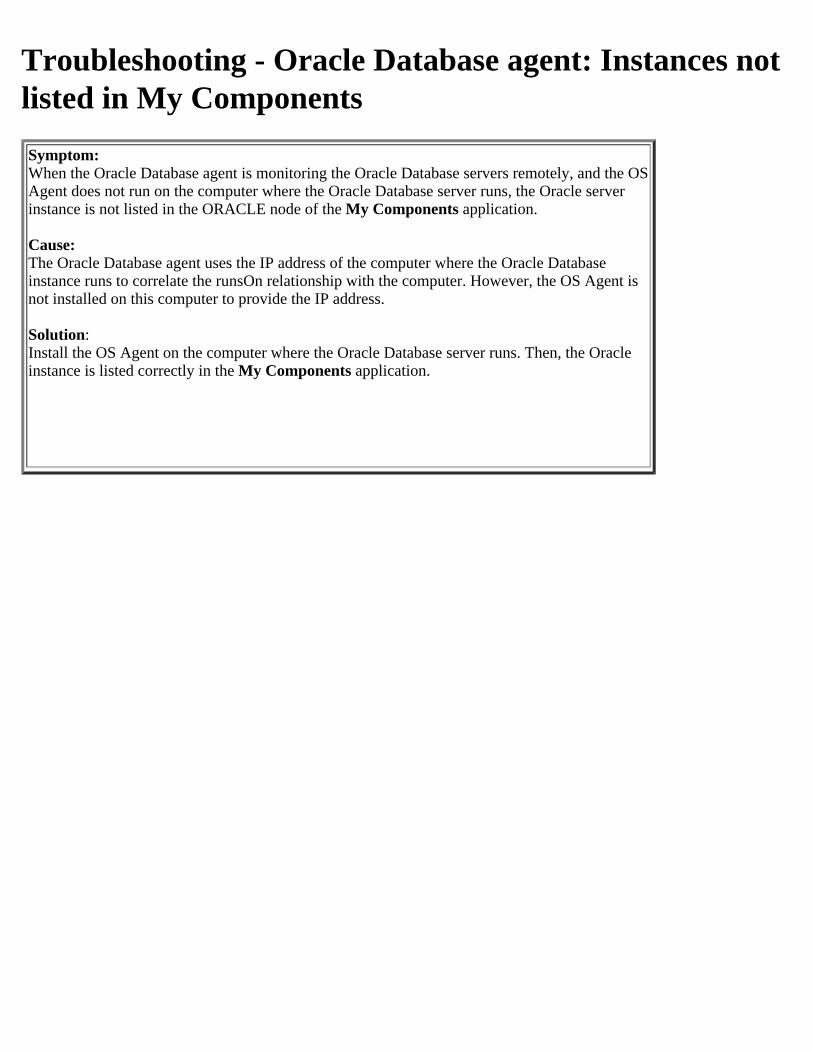
Troubleshooting - Oracle Database agent: Instances notlisted in My ComponentsSymptom:When the Oracle Database agent is monitoring the Oracle Database servers remotely, and the OS Agent does not run on the computer where the Oracle Database server runs, the Oracle server instance is not listed in the ORACLE node of the My Components application.
Cause:The Oracle Database agent uses the IP address of the computer where the Oracle Database instance runs to correlate the runsOn relationship with the computer. However, the OS Agent is not installed on this computer to provide the IP address.
Solution:Install the OS Agent on the computer where the Oracle Database server runs. Then, the Oracle instance is listed correctly in the My Components application.
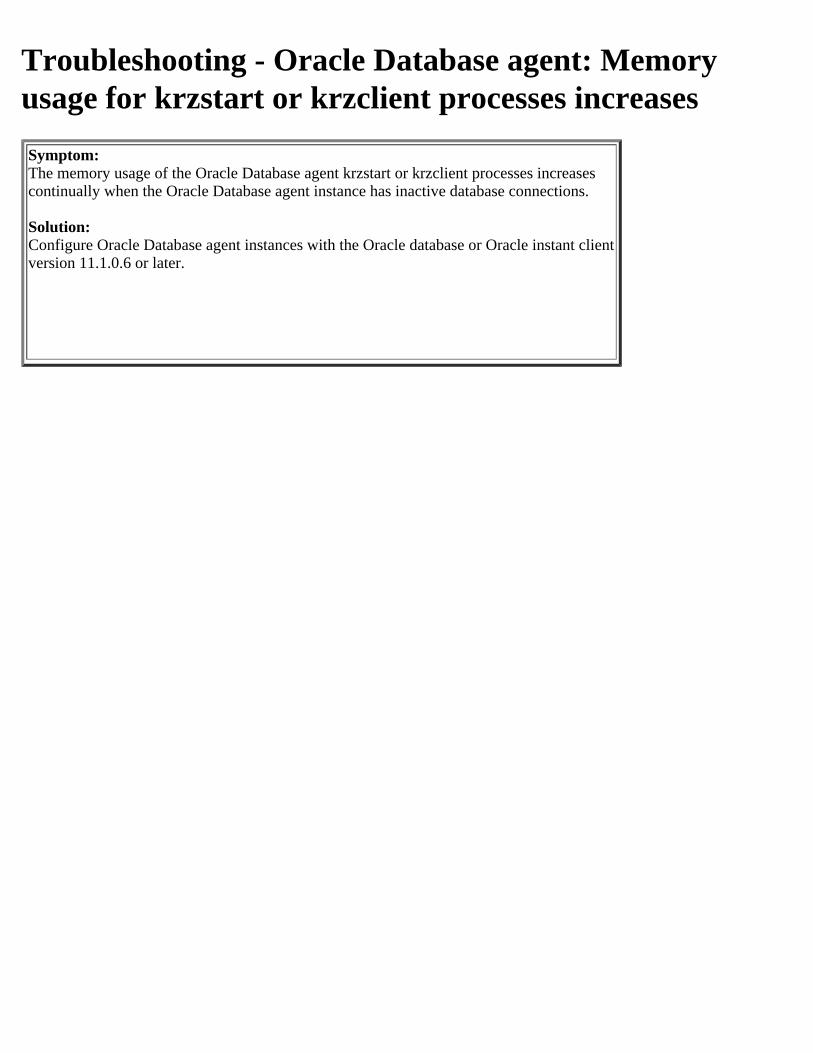
Troubleshooting - Oracle Database agent: Memoryusage for krzstart or krzclient processes increasesSymptom:The memory usage of the Oracle Database agent krzstart or krzclient processes increases continually when the Oracle Database agent instance has inactive database connections.
Solution:Configure Oracle Database agent instances with the Oracle database or Oracle instant client version 11.1.0.6 or later.
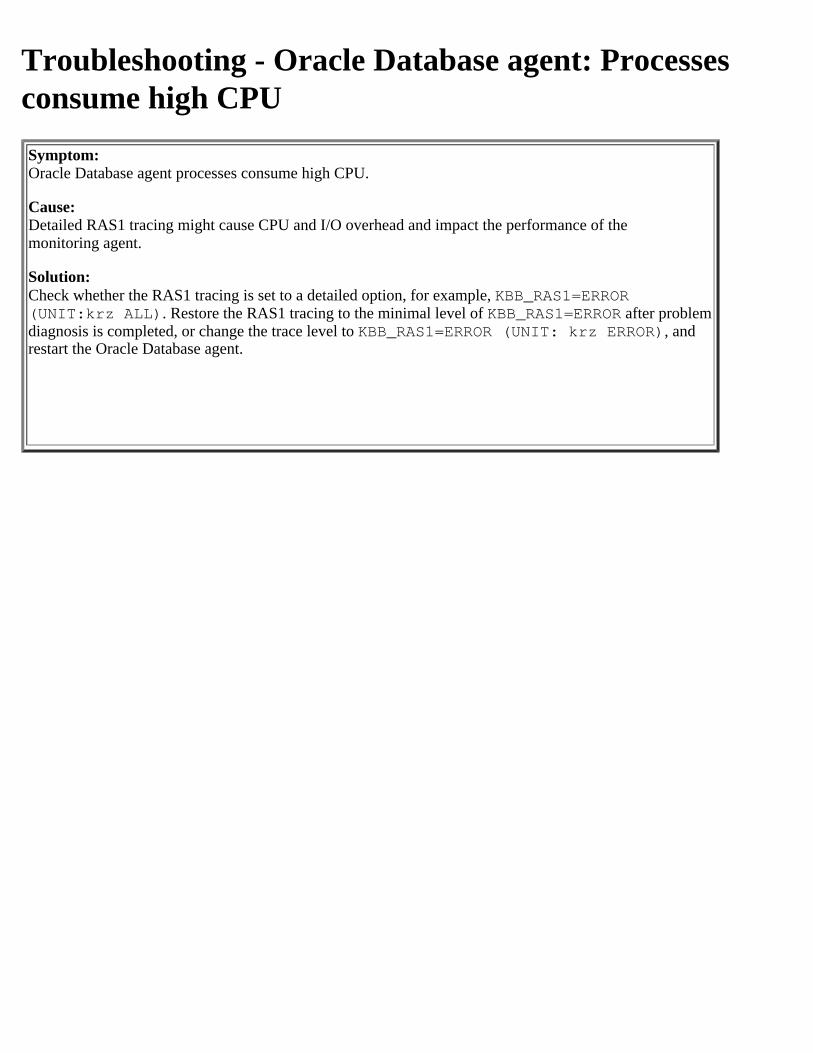
Troubleshooting - Oracle Database agent: Processesconsume high CPUSymptom:Oracle Database agent processes consume high CPU.
Cause:Detailed RAS1 tracing might cause CPU and I/O overhead and impact the performance of the monitoring agent.
Solution:Check whether the RAS1 tracing is set to a detailed option, for example, KBB_RAS1=ERROR(UNIT:krz ALL). Restore the RAS1 tracing to the minimal level of KBB_RAS1=ERROR after problem diagnosis is completed, or change the trace level to KBB_RAS1=ERROR (UNIT: krz ERROR), and restart the Oracle Database agent.
Troubleshooting - Oracle Database agent: Somecolumns for monitored Oracle RDBMS 10g instancedisplay 0Symptom:A 0 (zero) is displayed in the following columns for the monitored Oracle RDBMS 10g instance:
Unused Capacity column and the % Free column in the ASM Disk Group Capacity workspace under theRDBMS subnodeUnused Capacity column and the % Free column in the ASM Disk Capacity workspace under the RDBMSsubnode
Cause:0 is the value that is reported by the Oracle database. The value of the free_mb column in theOracle views, v$asm_disk and v$asm_diskgroup, is 0 if the value is queried from a databaseinstance. This problem exists for Oracle RDBMS 10g. For detailed information, see Oraclemetalink 294325.1.The free_mb attribute value is the free space in an ASM DISKGROUP (V$ASM_DISKGROUP) orin an ASM DISK (V$ASM_DISK).Solution:Configure the agent and connect it to an ASM instance. The following correct values aredisplayed under the ASM subnode:
In the ASM Disk Group Capacity workspace, in the Unused Capacity column and % Free columnIn the ASM Disk Capacity workspace, in the Unused Capacity column and % Free column
Troubleshooting - SAP agent: Agent transport errorsSymptom:Agent transport errors.
Solution:
Update the following SAP kernel executables to the latest level:R3transtp
Verify that the cofile and data transport files have correct authorizations and owners: sapsid:sapsysCheck the syntax of the following commands:
tp addtobuffertp import
For more information about these commands, see Step 5 in the "Using SAP transport and defining the user"section in the IBM Performance Management (SaaS) Knowledge Center.
Ensure that the default user /IBMMON/ITM_AUTH roles were created during transport import.
You can use the CUA to monitor an SAP system. To use the predefined user ID and authorization role tomonitor an SAP system set up with Central User Administration, complete one of the following steps:
Install the transport into the Central User Administration parent logical system client.Manually create the user ID or role in the client where you want to install the transport. The user ID orrole is in the client where the transport is installed (imported).Manually create the user ID or role in the Central User Administration parent logical system client. Then,distribute the user ID or role to the client where the agent runs.Manually create the user ID or role in the Central User Administration parent logical system client andrun the agent in this client.
Troubleshooting - Microsoft IIS agent: Availabilitystatus shows PROCESS_DATA_NOT_AVAILABLESymptom:The process application components are available, but the Availability status showsROCESS_DATA_NOT_AVAILABLE.
Solution:This problem occurs because the PerfProc performance object is disabled. When this condition exists, dashboardcannot collect performance data for this process. Use the following steps to confirm that this problem exists and toresolve it:
1. In the Windows Start menu, click Run.2. Type perfmon.exe in the Open field of the Run window. The Performance window is displayed.3. Click the plus sign (+) in the toolbar. The Add Counters window is displayed.4. Look for Process in the Performance object menu.5. Complete one of the following actions:
If you see Process in the menu, the PerfProc performance object is enabled and the problem is comingfrom a different source. You might need to contact IBM Software Support.If you do not see Process in the menu, use the Microsoft utility from the Microsoft.com Operationswebsite to enable the PerfProc performance object.The Process performance object becomes visible in the Performance object menu of the Add Counterswindows, and IBM Tivoli Monitoring is able to detect Availability data.
6. Restart the monitoring agent.
Troubleshooting - Microsoft IIS agent: Monitoring datafails to be displayedSymptom:Regular (non-historical) monitoring data fails to be displayed.
Solution:Check the formation of the queries that you use to gather data. For example, look for invalid SQL statements.
Troubleshooting - Microsoft IIS agent: Managed systemseems to be offlineSymptom:A managed system seems to be offline.
Solution:
1. In the Applications pane, click My Components. In the Groups pane, expand Components and then selectMicrosoft Internet Information Services. The Instances pane in the lower left of the window shows the list ofIIS server instances and their status.
2. If a system is offline, check network connectivity and the status of the specific system or application.
Troubleshooting - SAP agent: Agent repeatedly restartsSymptom:The SAP agent repeatedly restarts.
Solution:You can collect data to analyze this problem as follows:
1. Access the install_dir/config/.sa.environment file.2. Add the following line: KBB_SIG1=trace -dumpoff
Troubleshooting - Microsoft Active Directory agent:Upgrade issues with the agent converter package (SaaS)Symptom:On Windows 32-bit, data is not shown for the Monitoring Agent for Microsoft Active Directory on the Performance Management console.
Cause:When you upgrade the converter package from FP7 to FP8, data does not display.
Solution:On Windows 32-bit, after you upgrade the agent converter package from FP7 to FP8, you must restart the Monitoring Agent for Microsoft Active Directory.
Troubleshooting - SAP agent: Monitoring agent doesnot start in a non-ASCII environmentSymptom:The monitoring agent does not start in a non-ASCII environment.
Solution:Check the agent configuration to ensure that all of the values are correctly represented. To viewthese parameters, go to the Manage Monitoring Services window, select the agent instance, andclick Reconfigure. In the subsequent windows, review and modify configuration parameters asneeded.
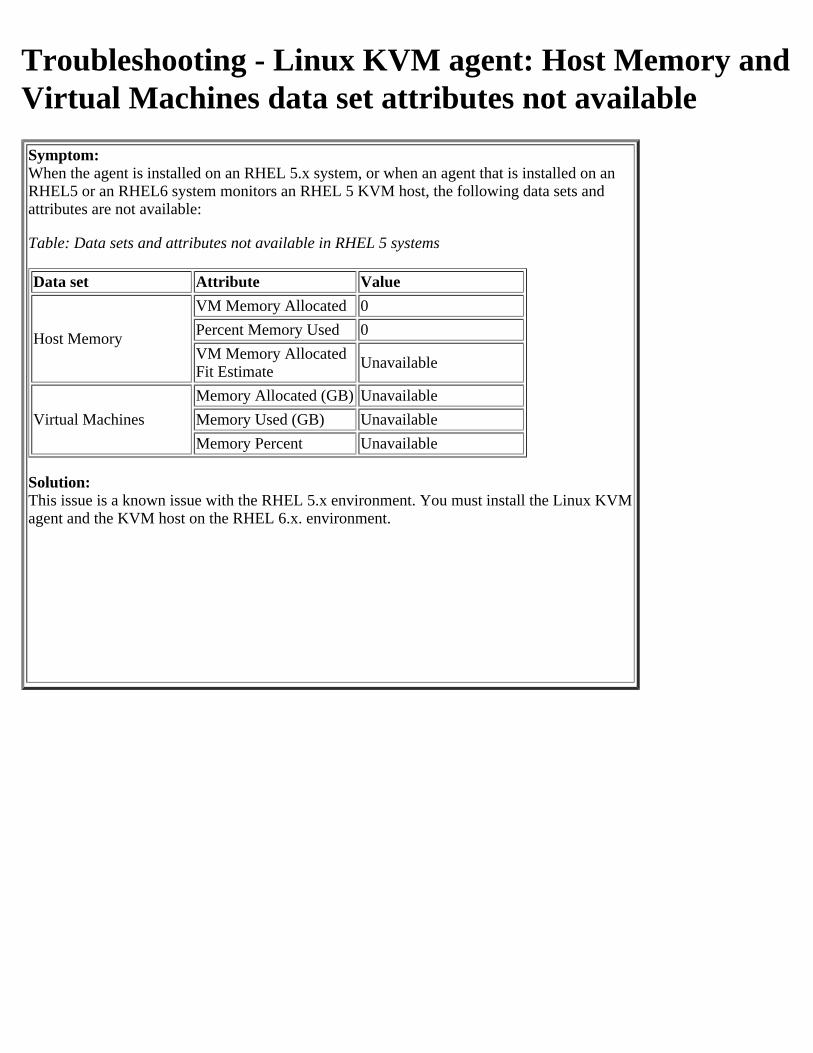
Troubleshooting - Linux KVM agent: Host Memory andVirtual Machines data set attributes not availableSymptom:When the agent is installed on an RHEL 5.x system, or when an agent that is installed on anRHEL5 or an RHEL6 system monitors an RHEL 5 KVM host, the following data sets andattributes are not available:
Table: Data sets and attributes not available in RHEL 5 systems
Data set Attribute Value
Host Memory
VM Memory Allocated 0Percent Memory Used 0VM Memory AllocatedFit Estimate Unavailable
Virtual MachinesMemory Allocated (GB) UnavailableMemory Used (GB) UnavailableMemory Percent Unavailable
Solution:This issue is a known issue with the RHEL 5.x environment. You must install the Linux KVM agent and the KVM host on the RHEL 6.x. environment.
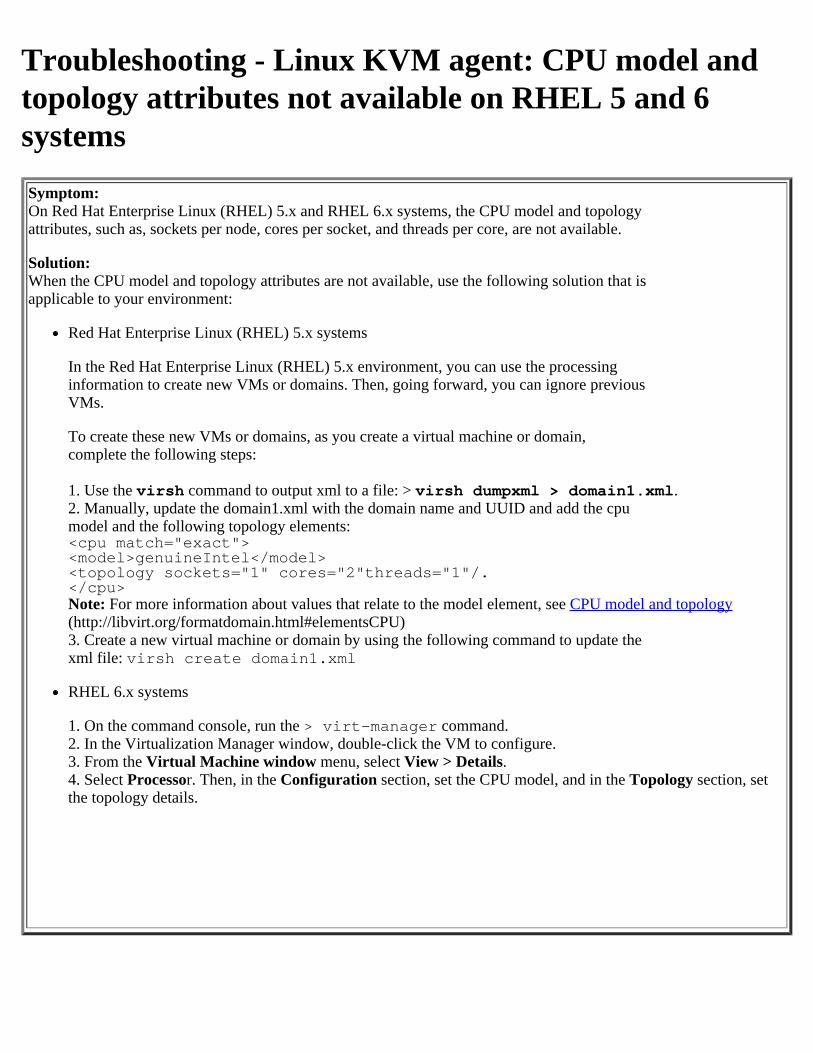
Troubleshooting - Linux KVM agent: CPU model andtopology attributes not available on RHEL 5 and 6systemsSymptom:On Red Hat Enterprise Linux (RHEL) 5.x and RHEL 6.x systems, the CPU model and topologyattributes, such as, sockets per node, cores per socket, and threads per core, are not available.
Solution:When the CPU model and topology attributes are not available, use the following solution that isapplicable to your environment:
Red Hat Enterprise Linux (RHEL) 5.x systems
In the Red Hat Enterprise Linux (RHEL) 5.x environment, you can use the processinginformation to create new VMs or domains. Then, going forward, you can ignore previousVMs.
To create these new VMs or domains, as you create a virtual machine or domain,complete the following steps:
1. Use the virsh command to output xml to a file: > virsh dumpxml > domain1.xml.2. Manually, update the domain1.xml with the domain name and UUID and add the cpumodel and the following topology elements:<cpu match="exact"><model>genuineIntel</model><topology sockets="1" cores="2"threads="1"/.</cpu>Note: For more information about values that relate to the model element, see CPU model and topology(http://libvirt.org/formatdomain.html#elementsCPU)3. Create a new virtual machine or domain by using the following command to update thexml file: virsh create domain1.xml
RHEL 6.x systems
1. On the command console, run the > virt-manager command.2. In the Virtualization Manager window, double-click the VM to configure.3. From the Virtual Machine window menu, select View > Details.4. Select Processor. Then, in the Configuration section, set the CPU model, and in the Topology section, setthe topology details.
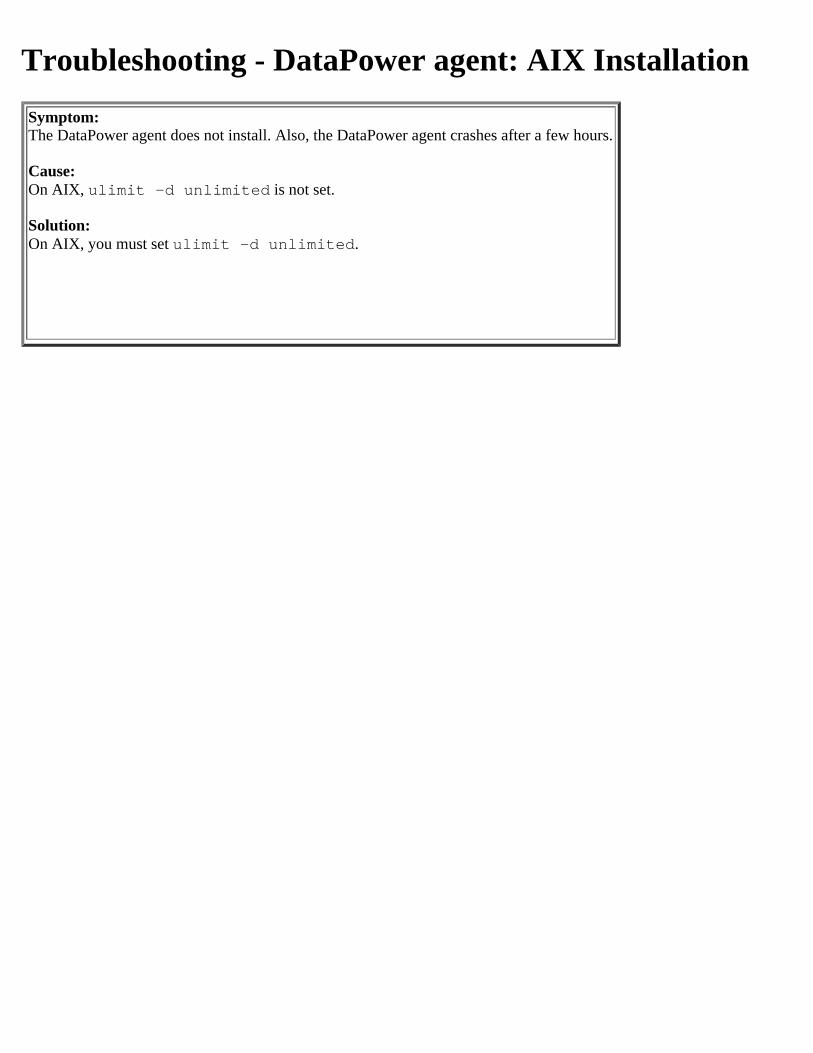
Troubleshooting - DataPower agent: AIX InstallationSymptom:The DataPower agent does not install. Also, the DataPower agent crashes after a few hours.
Cause:On AIX, ulimit -d unlimited is not set.
Solution:On AIX, you must set ulimit -d unlimited.
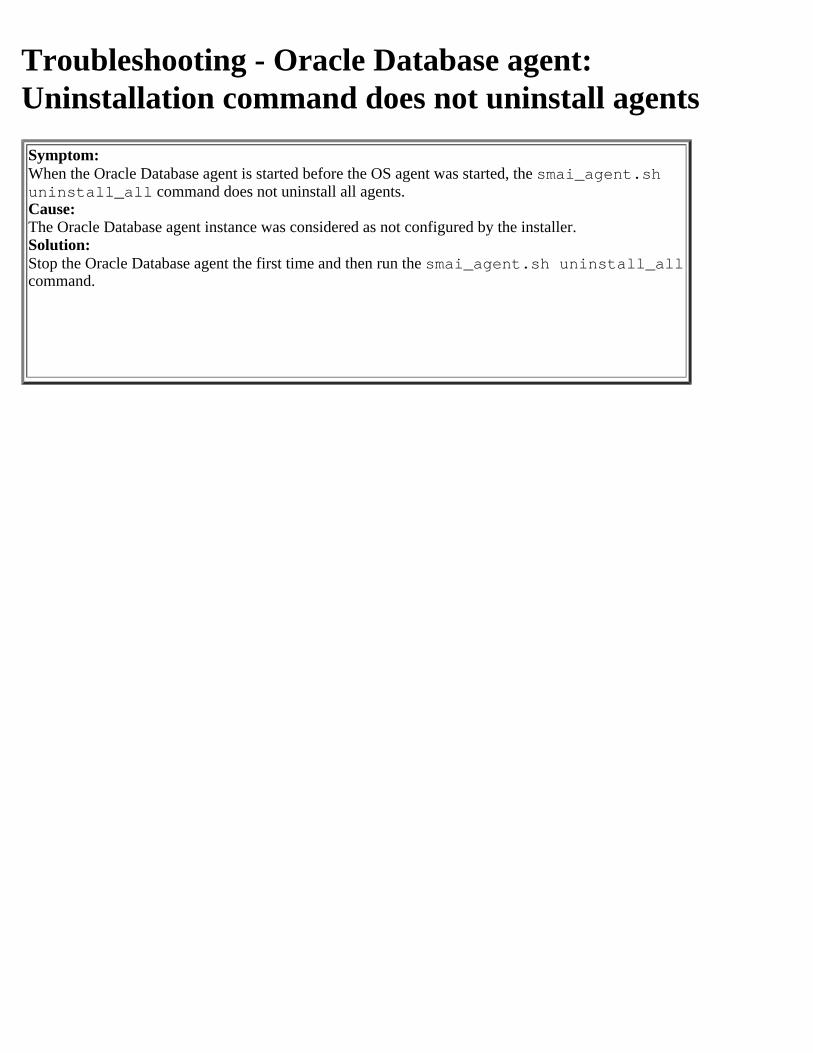
Troubleshooting - Oracle Database agent:Uninstallation command does not uninstall agentsSymptom:When the Oracle Database agent is started before the OS agent was started, the smai_agent.sh uninstall_all command does not uninstall all agents.Cause:The Oracle Database agent instance was considered as not configured by the installer.Solution:Stop the Oracle Database agent the first time and then run the smai_agent.sh uninstall_all command.
Troubleshooting - Oracle Database agent: Cannot loadthe configuration fileSymptom:The agent cannot load the configuration file and cannot be started when the system OS hostname is not consistent with the NetBIOS host name.
Cause:This problem happens because the XML configuration tool generates the configuration file byusing the OS host name file (OS_hostname_rz_agent_instance.cfg), but the agent loads the
configuration file by using the NetBIOS/NetworkAdapter host name file(NetBIOS_hostname_rz_agent_instance.cfg).
Solution:Implement one of the following solutions:
Change the system OS host name to match the NetBIOS host name, and reconfigure the agent.Copy the OS_hostname_rz_agent_instance.cfg file to theNetBIOS_hostname_rz_agent_instance.cfg file.On a UNIX system, link the OS_hostname_rz_agent_instance.cfg file to theNetBIOS_hostname_rz_agent_instance.cfg file.
Troubleshooting - Oracle Database agent: Cannot readremote alert log file on Windows systemsSymptom:The Oracle Database agent cannot read the remote alert log file on Windows systems.
Solution:When you configure the Oracle Database agent to access the remote alert log file, apply thefollowing guidelines:
The remote file path must follow the universal naming convention. For example,\\tivx015\path\alert_orcl.log. And file path in a mapped network drive is not supported.The Oracle Database agent must run under an interactive user account, instead of the system account.The files on the remote server can be accessed without a password, or the remote server is connected by usingthe Oracle Database agent user account.
Troubleshooting - LinuxKVM agent fails to start returncode 11Symptom:After installation, the Linux KVM agent instance fails to start.The following message is shown in the agent log:
(4CF55620.003F-1:kbbssge.c,52,"BSS1_GetEnv") KBB_SIG1="-asyncoff -syncoff-dumpoff"(4CF55620.0040-1:signalmanager.cpp,170,"startManagerThread") Error starting signal managerthread.Return code = 11; Resource temporarilyunavailable. Use the return code and message to investigate the failure.Agent is terminating.
Cause:The cause of the problem is the pdksh public domain Korn shell.Solution:You must uninstall the pdksh shell and install the ksh rpm that is included on the Linux installation media.
Troubleshooting - DB2 agent: Agent uninstallationcommand reports failed uninstallationSymptomAfter using the ./smai-agent.sh uninstall_all command, the DB2 agent was uninstalled successfully, but an error reported that uninstallation failed.
CauseThe DB2 agent process that was running was not stopped and file dependencies caused some common components to be uninstalled.
SolutionUse the DB2 agent process ID for the process that is running and stop it. Then, rerun thefollowing uninstallation command: ./smai-agent.sh uninstall_all.
Troubleshooting - DB2 agent: Configuration failed withpermission error for non-root user after installationwith root userSymptom:The configuration failed with a permission error when you installed the DB2® agent as a root user and then switched to non-root user to configure and start agent.Cause:A non-root user does not have permission to write files to the root folder.Solution:Run the ./secure.sh script with the group name of the non-root user to secure the files and set the file group ownership to the files. Example: ./secure.sh -g db2iadm1.
For details about the secure.sh script, see Securing the agent installation files on AIX.
Troubleshooting - DataPower agent: Configurationfailed with SSL security errorSymptom:The configuration fails with an error message after the DataPower® appliance with SSL version 3is disabled.Cause:A security issue caused the problem.Solution:Complete the following steps:1. Download the cert from the xxx.pem Data Power® appliance file that is used in the SSL profile.2. Copy the cert file to the agent, and import the cert by using this command:
cd ../JRE/lx8266/bin./keytool -import -trustcacerts -alias ligitalsso -keystore/opt/ibm/apm/agent/JRE/lx8266/lib/security/cacerts -storepasschangeit -file /opt/ibm/apm/TLSTEST-sscert.pem
3. Add the pem file during the agent configuration when you complete the SSL profile. The agentconfiguration file is shown here:
SECTION=DPS:dp23 [ { DP_PORT=5550 } { DP_UID=admin } {SOAP_HOST=9.123.xxx.xxx }{ DP_PASSWORD=\{AES256:keyfile:a\}TXw7lXT3aCUO0sMq8y3Asw\=\= }{ DP_SSL_PROFILE=/opt/ibm/apm/TLSTEST-sscert.pem } ]
Notices
This information was developed for products and services offered in the US. This material might beavailable from IBM in other languages. However, you may be required to own a copy of the product orproduct version in that language in order to access it.
IBM may not offer the products, services, or features discussed in this document in other countries.Consult your local IBM representative for information on the products and services currently available inyour area. Any reference to an IBM product, program, or service is not intended to state or imply that onlythat IBM product, program, or service may be used. Any functionally equivalent product, program, orservice that does not infringe any IBM intellectual property right may be used instead. However, it is theuser's responsibility to evaluate and verify the operation of any non-IBM product, program, or service.
IBM may have patents or pending patent applications covering subject matter described in thisdocument. The furnishing of this document does not grant you any license to these patents. You can sendlicense inquiries, in writing, to:
IBM Director of LicensingIBM CorporationNorth Castle Drive, MD-NC119Armonk, NY 10504-1785US
For license inquiries regarding double-byte character set (DBCS) information, contact the IBM IntellectualProperty Department in your country or send inquiries, in writing, to:
Intellectual Property LicensingLegal and Intellectual Property LawIBM Japan Ltd.19-21, Nihonbashi-Hakozakicho, Chuo-kuTokyo 103-8510, Japan
INTERNATIONAL BUSINESS MACHINES CORPORATION PROVIDES THIS PUBLICATION "AS IS"WITHOUT WARRANTY OF ANY KIND, EITHER EXPRESS OR IMPLIED, INCLUDING, BUT NOT LIMITED TO,THE IMPLIED WARRANTIES OF NON-INFRINGEMENT, MERCHANTABILITY OR FITNESS FOR APARTICULAR PURPOSE. Some jurisdictions do not allow disclaimer of express or implied warranties incertain transactions, therefore, this statement may not apply to you.
This information could include technical inaccuracies or typographical errors. Changes are periodicallymade to the information herein; these changes will be incorporated in new editions of the publication.IBM may make improvements and/or changes in the product(s) and/or the program(s) described in thispublication at any time without notice.
Any references in this information to non-IBM websites are provided for convenience only and do not inany manner serve as an endorsement of those websites. The materials at those websites are not part ofthe materials for this IBM product and use of those websites is at your own risk.
IBM may use or distribute any of the information you provide in any way it believes appropriate withoutincurring any obligation to you.
Licensees of this program who wish to have information about it for the purpose of enabling: (i) theexchange of information between independently created programs and other programs (including thisone) and (ii) the mutual use of the information which has been exchanged, should contact:
IBM Director of LicensingIBM CorporationNorth Castle Drive, MD-NC119Armonk, NY 10504-1785US
© Copyright IBM Corp. 2020 1379
Such information may be available, subject to appropriate terms and conditions, including in some cases,payment of a fee.
The licensed program described in this document and all licensed material available for it are provided byIBM under terms of the IBM Customer Agreement, IBM International Program License Agreement or anyequivalent agreement between us.
The performance data discussed herein is presented as derived under specific operating conditions.Actual results may vary.
Information concerning non-IBM products was obtained from the suppliers of those products, theirpublished announcements or other publicly available sources. IBM has not tested those products andcannot confirm the accuracy of performance, compatibility or any other claims related to non-IBMproducts. Questions on the capabilities of non-IBM products should be addressed to the suppliers ofthose products.
Statements regarding IBM's future direction or intent are subject to change or withdrawal without notice,and represent goals and objectives only.
This information is for planning purposes only. The information herein is subject to change before theproducts described become available.
This information contains examples of data and reports used in daily business operations. To illustratethem as completely as possible, the examples include the names of individuals, companies, brands, andproducts. All of these names are fictitious and any similarity to actual people or business enterprises isentirely coincidental.
COPYRIGHT LICENSE:
This information contains sample application programs in source language, which illustrate programmingtechniques on various operating platforms. You may copy, modify, and distribute these sample programsin any form without payment to IBM, for the purposes of developing, using, marketing or distributingapplication programs conforming to the application programming interface for the operating platform forwhich the sample programs are written. These examples have not been thoroughly tested under allconditions. IBM, therefore, cannot guarantee or imply reliability, serviceability, or function of theseprograms. The sample programs are provided "AS IS", without warranty of any kind. IBM shall not beliable for any damages arising out of your use of the sample programs.
Each copy or any portion of these sample programs or any derivative work must include a copyright notice as follows: © (your company name) (year). Portions of this code are derived from IBM Corp. Sample Programs. © Copyright IBM Corp. 2018.
TrademarksIBM, the IBM logo, and ibm.com are trademarks or registered trademarks of International BusinessMachines Corp., registered in many jurisdictions worldwide. Other product and service names might betrademarks of IBM or other companies. A current list of IBM trademarks is available on the web at"Copyright and trademark information" at www.ibm.com/legal/copytrade.shtml.
Linux is a trademark of Linus Torvalds in the United States, other countries, or both.
Microsoft, Windows, Windows NT, and the Windows logo are trademarks of Microsoft Corporation in theUnited States, other countries, or both.
UNIX is a registered trademark of The Open Group in the United States and other countries.
Java and all Java-based trademarks and logos are trademarks or registered trademarks of Oracle and/orits affiliates.
Terms and conditions for product documentationPermissions for the use of these publications are granted subject to the following terms and conditions.
Applicability
These terms and conditions are in addition to any terms of use for the IBM website.
Personal use
You may reproduce these publications for your personal, noncommercial use provided that all proprietarynotices are preserved. You may not distribute, display or make derivative work of these publications, orany portion thereof, without the express consent of IBM.
Commercial use
You may reproduce, distribute and display these publications solely within your enterprise provided thatall proprietary notices are preserved. You may not make derivative works of these publications, orreproduce, distribute or display these publications or any portion thereof outside your enterprise, withoutthe express consent of IBM.
Rights
Except as expressly granted in this permission, no other permissions, licenses or rights are granted, eitherexpress or implied, to the publications or any information, data, software or other intellectual propertycontained therein.
IBM reserves the right to withdraw the permissions granted herein whenever, in its discretion, the use ofthe publications is detrimental to its interest or, as determined by IBM, the above instructions are notbeing properly followed.
You may not download, export or re-export this information except in full compliance with all applicablelaws and regulations, including all United States export laws and regulations.
IBM MAKES NO GUARANTEE ABOUT THE CONTENT OF THESE PUBLICATIONS. THE PUBLICATIONS AREPROVIDED "AS-IS" AND WITHOUT WARRANTY OF ANY KIND, EITHER EXPRESSED OR IMPLIED,INCLUDING BUT NOT LIMITED TO IMPLIED WARRANTIES OF MERCHANTABILITY, NON-INFRINGEMENT, AND FITNESS FOR A PARTICULAR PURPOSE.
IBM Online Privacy StatementIBM Software products, including software as a service solutions, ("Software Offerings") may use cookiesor other technologies to collect product usage information, to help improve the end user experience, totailor interactions with the end user or for other purposes. In many cases no personally identifiableinformation is collected by the Software Offerings. Some of our Software Offerings can help enable you tocollect personally identifiable information. If this Software Offering uses cookies to collect personallyidentifiable information, specific information about this offering's use of cookies is set forth in thefollowing paragraphs.
Depending upon the configurations deployed, this Software Offering may use session cookies that collecteach user's user name for purposes of session management, authentication, and single sign-onconfiguration. These cookies can be disabled, but disabling them will also likely eliminate thefunctionality they enable.
If the configurations deployed for this Software Offering provide you as customer the ability to collectpersonally identifiable information from end users via cookies and other technologies, you should seek
© Copyright IBM Corp. 2020

your own legal advice about any laws applicable to such data collection, including any requirements fornotice and consent.
For more information about the use of various technologies, including cookies, for these purposes, SeeIBM's Privacy Policy at http://www.ibm.com/privacy and IBM's Online Privacy Statement at http://www.ibm.com/privacy/details the section entitled "Cookies, Web Beacons and Other Technologies" andthe "IBM Software Products and Software-as-a-Service Privacy Statement" at http://www.ibm.com/software/info/product-privacy.
© Copyright IBM Corp. 2020


