Embed Size (px)
Citation preview
BUILDING RESEARCH JOURNAL
VOLUME 55, 2007 NUMBER 3
Hysteresis analysis of prestressed brick frame with strawbale
masonry-infill subjected to seismic loads
A A Adedeji
Department of Civil Engineering, University of Ilorin, Ilorin, Nigeria
Email: [email protected]
Pseudo-dynamic earthquake response tests, of a one quarter (¼) scale model
three storeys prestressed bricks frames stiffened with cement plastered
strawbale masonry, was conducted. The structure was idealized as plane
frames. The analysis utilised the hysteresis models for members’ models as
time-independent. The force-displacement relationship of the members’
models was evaluated by the approximate method on the basis of the
material properties and structural geometry. A hysteretic model was
investigated with straw bale infill panel to determine the hysteretic
parameters, stiffness deterioration and strength degradation due to seismic
loadings. The average design thickness, for the cement-plastered strawbale
stiffens the prestressed burnt-brick frame, was obtained.
Keywords: seismic; masonry-infill; strawbale, finite element; degradation,
prestressed brick
1. Introduction
A number of past studies (Klinger and Bertero 1978; Bertero and Brokken 1983; Mander and
Nair 1994) focused on evaluating the experimental behavior of masonry infilled frames to
obtain formulations of limit strength and equivalent stiffness. A more rigorous analysis of
structures with masonry infilled frames requires an analytical model of the force –
deformation response of masonry infill. While a number of finite element models have been
developed to predict the response of infilled frames (Dhanasekar and Page 1986. Mosalam
1996, Malnotra 2002), such micro modeling is time-consuming for analysis of large
structures. Alternatively, a macro model allows treatment of the entire infill panel as a single
unit.
Saneinejad and Hobbs (1995) developed a method based on the equivalent diagonal strut
approach for the analysis and design of frames with masonry infill walls subjected to in-
plane forces. The UBC required that the shear walls acting independently of the ductile
moment-resisting portions of the frame shall resist total required seismic forces. It is also
required that design force distributions along elevations of the structure for both axial-

150
flexural and shear design shall be the same. It has been observed from the research carried
out by Ahmet et al (1984) the UBC later claim could be realized by shear design based on
calculation that demands that consider actual flexural capacity of the walls. The actual
contribution of the edge members (columns and beams) panel RC/ prestressed concrete
should be considered in evaluating available shear strength. Therefore the study has
recommended that in designing and evaluating of strength of wall, cross section should be
considered rather than the assumption of edge column acting as axially loaded members that
should resist all vertical members from the loads acting on the wall.
Based on the aforementioned claim, the objective of this paper was to provide the
average design thickness for the cement-plastered strawbale stiffens the prestressed burnt-
brick frame. Data on strength and deformation of the structure are the input for the analytical
models. The plastered strawbale wall was connected to the frame with mortar (1:6 cement-
sand mix) to constitute a simple support. This is shown in Fig. 1. The project also covers the
hysteresis analysis of the straw bale wall infill in terms of stiffness deterioration and strength
degradation in order to determine the response of the infill due to dynamic loading.
Prestressed brick beam
B Tendon
A
Bar tie A’
Joint mortar
Strawbale
wall
B’
VERTICAL SECTION SECTION B-B’
Prestressed brick column
HORIZONTAL SECTION A-A’
Fig. 1.Infill-frame interaction
A A Adedeji
151
2. Modelling of Structural Members 2.1 Frame: Beam and Column Members
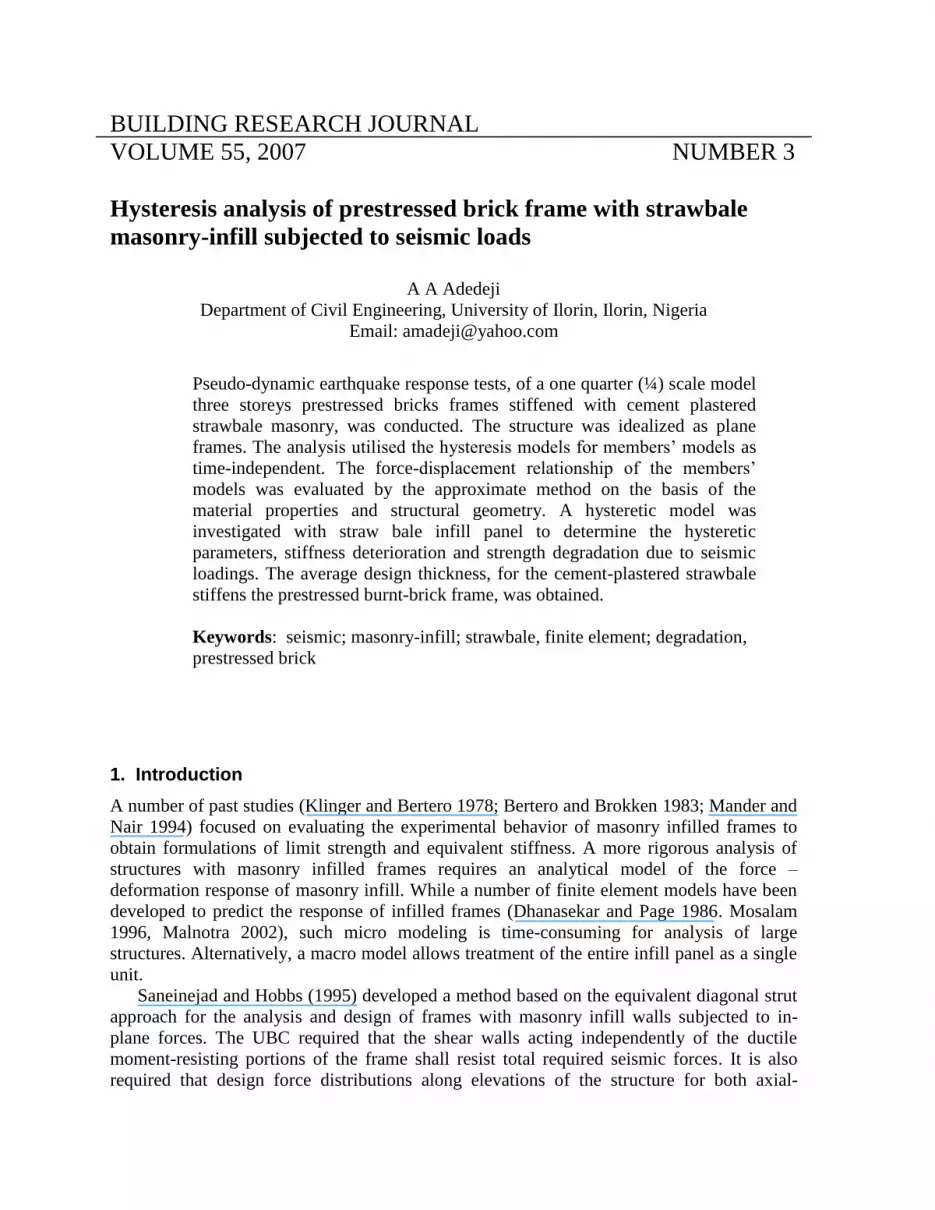
A one-dimensional model was used for beam and column in this paper. The beam or column
member was idealized as a perfectly idealized elastic massless line element with two
nonlinear rotational springs at he two ends. The model could have two rigid zones outside the
rotational spring.
2.2 Analytical Model of strawbale Infill Shear walls can be idealized as (a) an equivalent column taking flexural and shear
deformation into account, (b) a braced frame in which the shear deformation is represented
by deformation of diagonal elements, where the structural deformation is by the deformation
of vertical element and (c) short line represent along the height with each short segment with
hysteretic characteristics. These models have advantages and disadvantages. In most cases
the horizontal boundary beams are assumed to be rigid.
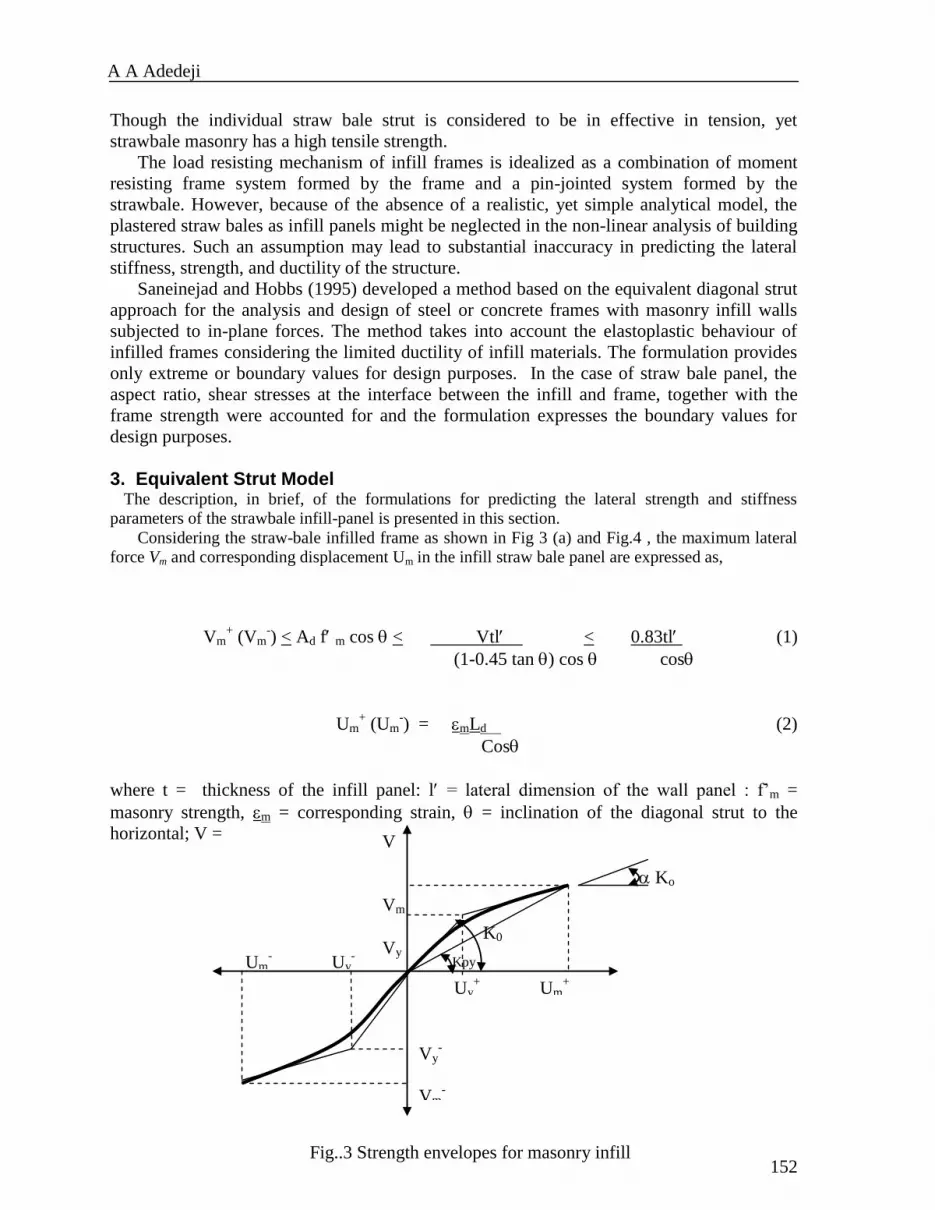
The proposed analytical model assumes that the contribution of the straw bale wall infill
panel (Fig. 3a) to the response of the infilled frame can be modeled by replacing the panel by
a system of two diagonal straw bale wall compression struts (Fig 3(b)). Since the tensile
strength of masonry is negligible, the individual straw bale strut is considered to be in
effective in tension. However, the combination of both diagonal struts provides a lateral load
resisting mechanism for the opposite lateral directions of loading. The lateral force-
deformation relationship for the structural straw bale infill panel is assumed to be a smooth
curve bounded by a bilinear strength envelope until the yield force Vy and then on a post
yield degraded stiffness until the maximum force Vm is reached (Fig 3). The corresponding
lateral displacement values are denoted as Vy and Um respectively.
2. 2.1 Strawbale Wall as Infill Panel
The use of strawbale infill for the construction of a building in place of conventional
materials is its cheapness, availability and flexibility in terms of workability and strength.
Rigid zone
Elastic element
Non-linear rotational
Springs
Fig. 2. One-dimensional model for beam and column
Hysteresis analysis of prestressed brick frame with strawbale
masonry-infill subjected to seismic loads
152
Though the individual straw bale strut is considered to be in effective in tension, yet
strawbale masonry has a high tensile strength.
The load resisting mechanism of infill frames is idealized as a combination of moment
resisting frame system formed by the frame and a pin-jointed system formed by the
strawbale. However, because of the absence of a realistic, yet simple analytical model, the
plastered straw bales as infill panels might be neglected in the non-linear analysis of building
structures. Such an assumption may lead to substantial inaccuracy in predicting the lateral
stiffness, strength, and ductility of the structure.
Saneinejad and Hobbs (1995) developed a method based on the equivalent diagonal strut
approach for the analysis and design of steel or concrete frames with masonry infill walls
subjected to in-plane forces. The method takes into account the elastoplastic behaviour of
infilled frames considering the limited ductility of infill materials. The formulation provides
only extreme or boundary values for design purposes. In the case of straw bale panel, the
aspect ratio, shear stresses at the interface between the infill and frame, together with the
frame strength were accounted for and the formulation expresses the boundary values for
design purposes.
3. Equivalent Strut Model The description, in brief, of the formulations for predicting the lateral strength and stiffness
parameters of the strawbale infill-panel is presented in this section.
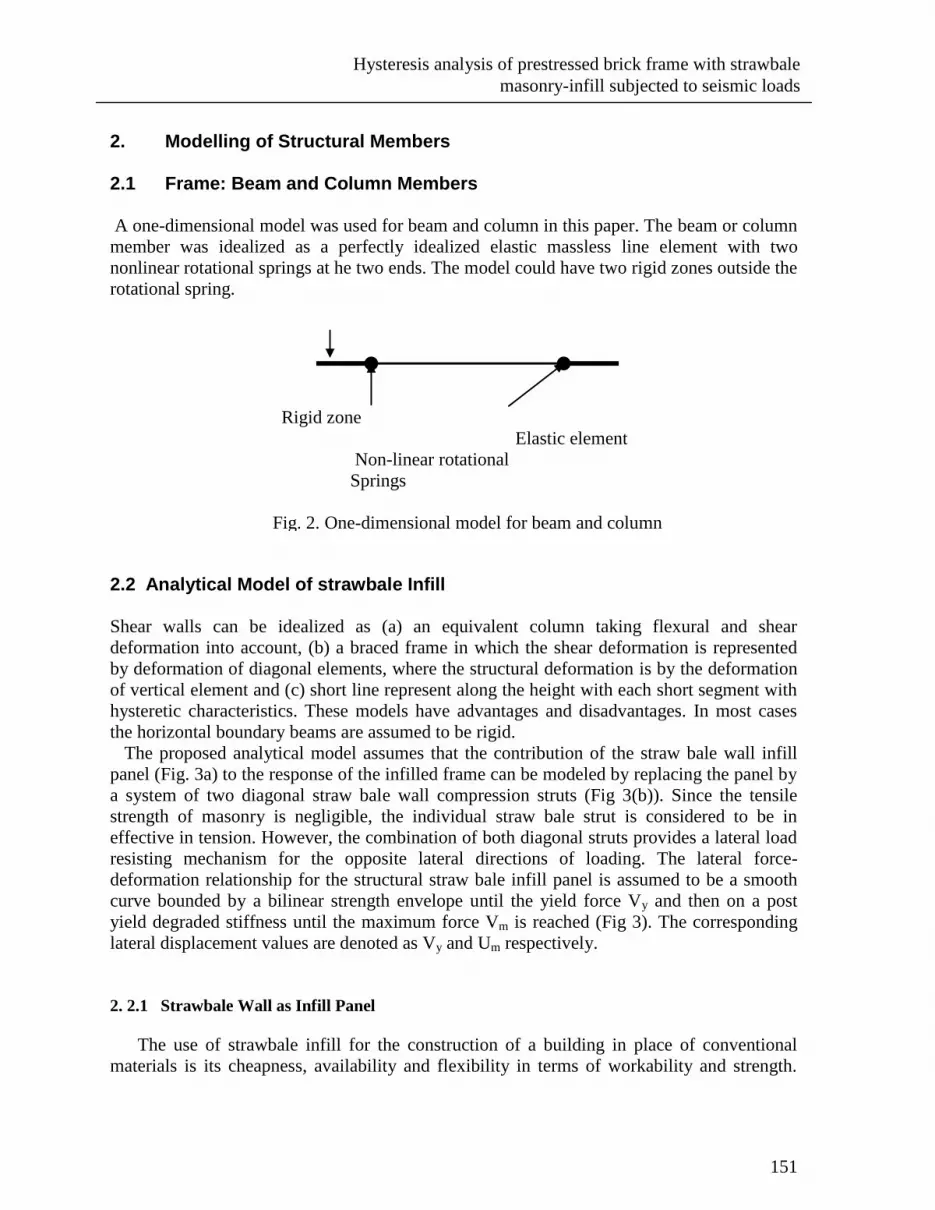
Considering the straw-bale infilled frame as shown in Fig 3 (a) and Fig.4 , the maximum lateral
force Vm and corresponding displacement Um in the infill straw bale panel are expressed as,
Vm+ (Vm
-) < Ad f m cos < Vtl < 0.83tl (1)
(1-0.45 tan ) cos cos
Um+ (Um
-) = mLd (2)
Cos
where t = thickness of the infill panel: l = lateral dimension of the wall panel : f’m =
masonry strength, m = corresponding strain, = inclination of the diagonal strut to the
horizontal; V =
Fig..3 Strength envelopes for masonry infill
K0
Kpy Um- Uy
-
Uy+ Um
+
Vy-
Vm-
V
Vm
Vy
Ko
A A Adedeji
153
V = shear strength (average of 0.347 N/mm2), of straw bale wall; and Ad , Ld = area and
length of the equivalent diagonal struts respectively calculated as,
Ad = (1- c)c t h c + b t l b < 0.5t h f a / fc (3)
c c cos
and
(a) Straw bale wall infill frame sub assemblage
Straw bale
infill panel
h
h
Frame
1
1
(b) Straw bale wall infill panel
Fig. 4. Wall equivalent diagonal strut
(1
-
b)
h
b h
l
h
Hysteresis analysis of prestressed brick frame with strawbale
masonry-infill subjected to seismic loads
154
Ld = ((1 - c )2 h
2 + L
2 (4)
Where the quantities c, b, = ratio of wall length (breadth) to the contact length between the
infill and frame respectively, c, b, compressive and shear stress of wall respectively, a,
and c, compressive strength for frame and wall respectively. Saneinejad and Hobbs (1995)
proposed the formulations of the equivalent strut model. The initial stiffness Ko of the infill
straw bale wall panel is estimated using the following formula.
)5(2
m
m
oU
VK
The lateral yield force Vy and corresponding displacement Uy of the infill panel may be
calculated from geometry as;
)6(1
)(
mom
yy
UKVVV
)7()1(
)(
o
mom
yyK
UKVUU
where = ratio of post yield stiffness (Kpy) to initial (Ko) stiffness (See Fig. 2)
4. Seismic Load Analysis 4.1 Time-independent smooth hysteresis model
A smooth hysteretic model proposed by Beber and wen (1981) is used for the structural
straw bale masonry infill panel. The model, which was developed based on the Bouc–Wen
model for hysteresis behaviour furnishes a smooth hysteresis force-displacement relationship
between force V and displacement U is,
Vi = Vy [i + (1 - ) Zi] (8)
Where = ductility calculated as Ui/Uy, subscript i = instantaneous values, subscript y =
yield values, and Z = hysteretic component determined by solving the following differential
equation by Reinhorn (1995) as;
dZi = [aeff – Zi n [ sgn (di Z) + ]] d (9)
where signum function sgn( x) = 1 for x > 0 and = -1 for x < 0; aeff , , and = constants
that control the shape of the generated hysteretic loops (Assumed values aeff = 1, and = =
0.5. At x = 0, the effect of cyclic loading is neglected) and n controls the rate of transition
from the elastic to yield state.
4.2. Stiffness decay The yielding system in general is the loss of stiffness due to deformation beyond yield
point. The stiffness decay is incorporated directly in the hysteretic model by including the
control parameter in equation (9) for hysteretic parameter Z in which is obtained by
pivotal deterioration method (Valles et al, 1996).
A A Adedeji
155
dZi =[ aeff - Zin[ sgn(diZ)+] ] di/ (10)
)11(]1)1([
ik
ik
S
S
for I > 1.0
where Sk = multiplier for Vs to define the pivot for stiffness deterioration. A default value of
Sk is taken to be 5.
4.3 Strength degradation
Degrading systems such as straw bale wall infill panels will also exhibit loss of strength in
the inelastic range. The strength deterioration is modeled by reducing the yield force Vy from
the original value Vyo at each step k,
Vyk = Vy
k (1 – DI) (12)
in which DI = cumulative damage parameter dependent on the maximum attained
ductility, max, and the cumulative energy dissipated ( Valles 1996).
)13()1(
25.011
12
1max
Sp
cy
p
c
d
V
VSDI
where max, c = maximum and monotonic ductility capacity and parameters Sp1 and Sp2
control the rate of deterioration for maximum and monotonic ductility respectively. The
damage index was derived from fatigue consideration (Reinhorn et al, 1995).
4.4. Cracking slip model
Opening and closing of masonry cracks resulting in the pinching of hysteresis loops is a
commonly observed phenomenon in masonry structural systems subjected to cyclic loading.
The concept of slip lock element proposed by Baber and Noori (1984) was adopted in this
study to formulate a hysteretic model. A slip–lock element is incorporated in series so that
displacement ductility = 1 + 2, with the smooth degrading element 1. The displacement
ductility component 2 due to the slip-lock element is defined by the following relationship:
d2 = a f(Z) dZ (14)
in which a = (As(2-1), at As is the parameter for varying the slip length due to crack opening
in the panel and 2 = ductility attained at the load reversal prior to the current unloading or
reloading cycle.) is the slip length and assumed to be a function of the attained ductility while
the function f(Z) is defined as:
(Z) = exp((Z -Z1 )2) (15)
Zs2
Hysteresis analysis of prestressed brick frame with strawbale
masonry-infill subjected to seismic loads
156
at -1< Z, and Z1 < 1
where Z1 = value of Z at which f(Z) reaches its maximum; Zs = range of Z , about Z = Z1
, in which the slip occurs. Derived from Eq.(9), (14), and (15), the hysteretic parameter Z
will satisfy the following differential equation (Reinhorn. 1995).
)16(
]))sgn(({[)(
exp1
]}).sgn(({[
2
2
ZdZa
Z
ZZa
ZdZa
d
dZ
n
eff
s
n
eff
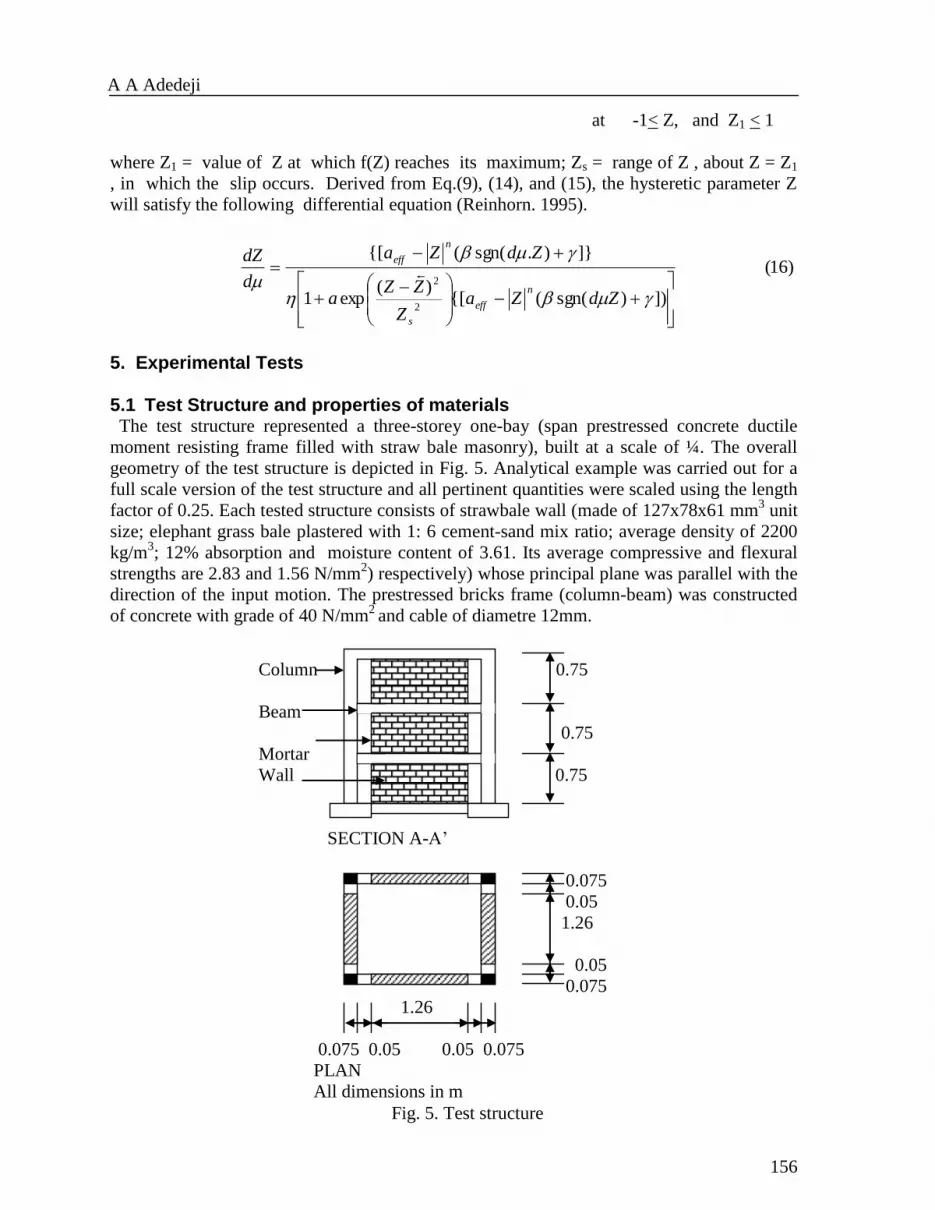
5. Experimental Tests 5.1 Test Structure and properties of materials The test structure represented a three-storey one-bay (span prestressed concrete ductile
moment resisting frame filled with straw bale masonry), built at a scale of ¼. The overall
geometry of the test structure is depicted in Fig. 5. Analytical example was carried out for a
full scale version of the test structure and all pertinent quantities were scaled using the length
factor of 0.25. Each tested structure consists of strawbale wall (made of 127x78x61 mm3 unit
size; elephant grass bale plastered with 1: 6 cement-sand mix ratio; average density of 2200
kg/m3; 12% absorption and moisture content of 3.61. Its average compressive and flexural
strengths are 2.83 and 1.56 N/mm2) respectively) whose principal plane was parallel with the
direction of the input motion. The prestressed bricks frame (column-beam) was constructed
of concrete with grade of 40 N/mm2
and cable of diametre 12mm.
Column 0.75
Beam
0.75
Mortar
Wall 0.75
SECTION A-A’
0.075
0.05
1.26
0.05
0.075
1.26
0.075 0.05 0.05 0.075
PLAN
All dimensions in m
Fig. 5. Test structure
A A Adedeji

157
Design gravity loads comprised of 70 kN (self weight and live load). Seismic design
effects were determined using modal spectral analysis. The design spectral ordinates were set
so that the first-mode shear base was equal to the design base shear required by the UBC
1982 for a ductile moment-resisting space frame. Also, the response spectrum was selected to
reflect soil condition that superseded by a layer of sandy soil. Earthquake design actions were
determined with a three dimensional elastic analysis model based on the cross section of
columns and beams. The three dimensional structure was idealized as a pseudo-three-
dimensional model in which only the planar modes of the main structural systems (walls and
frames) were considered. The considerations of stiffness and strength of frame elements
perpendicular to the plane of the transverse walls and frames were not considered. Perfect
base fixity of the frames was assumed.
Horizontal floor level responses have been recoded in lateral and main direction.
At 3.2 m/s2, the structure did not increase its response. The maximum base shear of 129
kN is obtained at the roof displacement of 12.3 mm.
5.2 Test and Instrumentation Tests included earthquake simulation of varying intensity and followed by low amplitude
free vibration tests. The simulations were conducted by applying unilateral horizontal base
motions parallel to the direction frame. The input signals to the shaking table modeled
accelerated history for uniaxial tests are as indicated in Table 1 with a total of four
earthquake records. These values were used as input ground motions in the dynamic analysis.
These values are notations used for individual ground motion, the components of earthquake
motion record, peak ground acceleration (aeff) in terms acceleration due to gravity (g), peak
ground velocity (vg), significant duration of the accelerogram (tSD) and the normalized
characteristics intensity (In).
Table 1 Characteristics of selected input earthquake ground motion Ground
motion
Notation Peak
ground
acceleration
(aeff)
Peak
ground
velocity
(vg) m/s
Significant
duration
(tSD), s
normalized
characteristics
intensity (In)
El Centro ELCENT 0.35g 0.34 24 2.66
Haruka-oki HARU 0.42g 0.46 6 2.12
Silmar SYLM 0.84g 0.61 47 1.71
Hacinohe HACH 0.23g 0.34 28 1.52
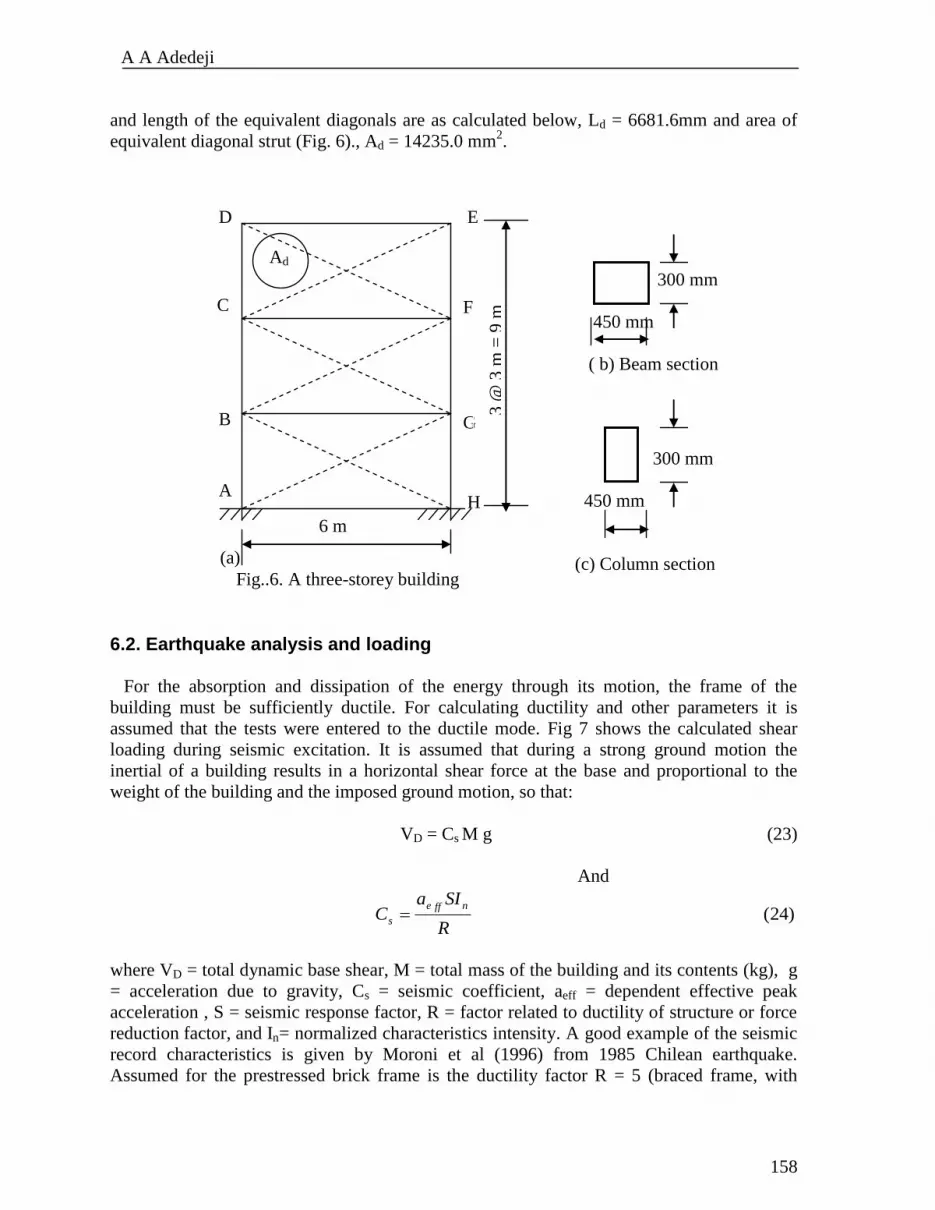
6. Typical Analysis Example 6.1. Sections properties
Beam and column sectional area are shown in Fig. 6 . Second moment of area (Ib) = 2.278
x 10-3 m
4(Ic) = 6.75 x 10
-4 mm
4 respectively. The straw bale wall is measured acting as
diagonal members of the frame in this analysis. It acts as a stiffening element and the area
Hysteresis analysis of prestressed brick frame with strawbale
masonry-infill subjected to seismic loads
158
and length of the equivalent diagonals are as calculated below, Ld = 6681.6mm and area of
equivalent diagonal strut (Fig. 6)., Ad = 14235.0 mm2.
6.2. Earthquake analysis and loading
For the absorption and dissipation of the energy through its motion, the frame of the
building must be sufficiently ductile. For calculating ductility and other parameters it is
assumed that the tests were entered to the ductile mode. Fig 7 shows the calculated shear
loading during seismic excitation. It is assumed that during a strong ground motion the
inertial of a building results in a horizontal shear force at the base and proportional to the
weight of the building and the imposed ground motion, so that:
VD = Cs M g (23)
And
)24(R
SIaC
nffe
s
where VD = total dynamic base shear, M = total mass of the building and its contents (kg), g
= acceleration due to gravity, Cs = seismic coefficient, aeff = dependent effective peak
acceleration , S = seismic response factor, R = factor related to ductility of structure or force
reduction factor, and In= normalized characteristics intensity. A good example of the seismic
record characteristics is given by Moroni et al (1996) from 1985 Chilean earthquake.
Assumed for the prestressed brick frame is the ductility factor R = 5 (braced frame, with
C
A
B
D E
F
G
H
3 @
3 m
= 9
m
6 m
(a)
Fig..6. A three-storey building
300 mm
450 mm
(c) Column section
300 mm
450 mm
( b) Beam section
Ad
A A Adedeji
159
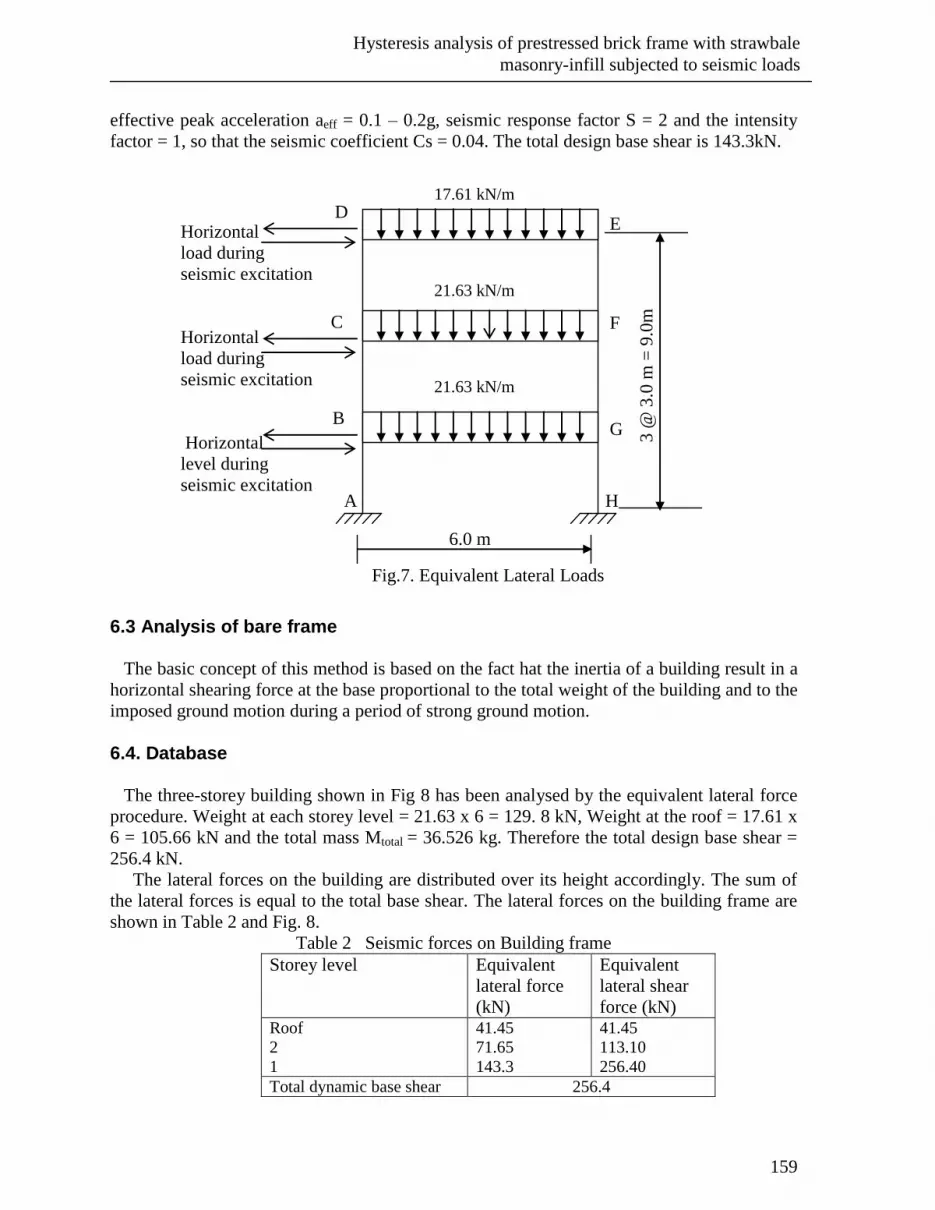
effective peak acceleration aeff = 0.1 – 0.2g, seismic response factor S = 2 and the intensity
factor = 1, so that the seismic coefficient Cs = 0.04. The total design base shear is 143.3kN.
6.3 Analysis of bare frame
The basic concept of this method is based on the fact hat the inertia of a building result in a
horizontal shearing force at the base proportional to the total weight of the building and to the
imposed ground motion during a period of strong ground motion.
6.4. Database
The three-storey building shown in Fig 8 has been analysed by the equivalent lateral force
procedure. Weight at each storey level = 21.63 x 6 = 129. 8 kN, Weight at the roof = 17.61 x
6 = 105.66 kN and the total mass Mtotal = 36.526 kg. Therefore the total design base shear =
256.4 kN.
The lateral forces on the building are distributed over its height accordingly. The sum of
the lateral forces is equal to the total base shear. The lateral forces on the building frame are
shown in Table 2 and Fig. 8.
Table 2 Seismic forces on Building frame
Storey level Equivalent
lateral force
(kN)
Equivalent
lateral shear
force (kN) Roof
2
1
41.45
71.65
143.3
41.45
113.10
256.40
Total dynamic base shear 256.4
A
B
C
D E
F
G
H
3 @
3.0
m =
9.0
m
6.0 m
17.61 kN/m
21.63 kN/m
21.63 kN/m
Fig.7. Equivalent Lateral Loads
Horizontal
load during
seismic excitation
Horizontal
load during
seismic excitation
Horizontal
level during
seismic excitation
Hysteresis analysis of prestressed brick frame with strawbale
masonry-infill subjected to seismic loads
160
The maximum lateral force and corresponding displacement in the infill straw bale panel
are as follows:
At = 32o and using equations (1) to (7), Vm
+ (Vm
-) = 14486.4N = 14486N, while the
corresponding displacement Um+ (Um
-) = 23.6mm. The initial stiffness Ko of the infill panel is
estimated Ko =1227.63N/mm, the lateral yield force and displacement of the infill panel is
14193 .4 N and Uy +(Uy
-) = 11. 7mm. Using different straw bale thickness, the result of the
analysis for the stiffness deterioration and shear decay are shown in Table 3.
Table 3 Stiffness deterioration and shear decay of straw bale infill for the
thickness (t) = 300m
Instantaneous
value, (i)
Displacement
Ui (mm)
Lateral force
Vi (N)
Shear decay
(Vm - Vi (N)
Initial stiffness
Ko (N/mm) 1
2
3
4
5
6
11.7000
11.8183
11.9169
11.9988
12.3825
23.6000
14340.1
14365.2
14386.2
14403.6
14485.1
14486.4
146.3
121.20
100.2
82.80
1.30
0.00
25.009
20.511
16.817
13.801
0.209
0.000
CASE II, t = 275mm, Ad = 13048.8mm2, Vm = 13279.2N, Um = 23.6mm, KO=1125. 4N/mm,
Vy = 13145.1 N, Uy = 11.7mm.The result of the analysis is shown in Table.2
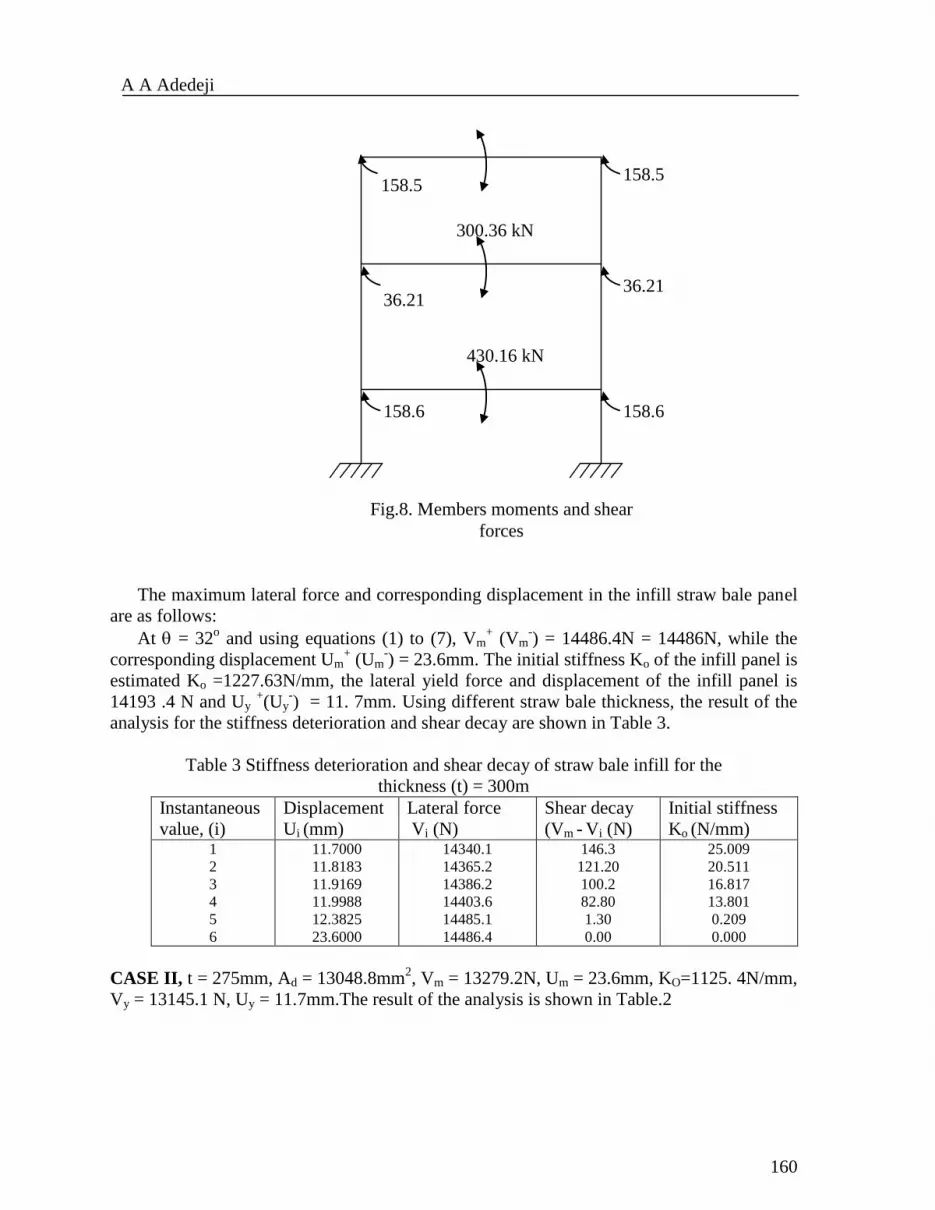
Fig.8. Members moments and shear
forces
430.16 kN
300.36 kN
158.5
36.21
158.6 158.6
36.21
158.5
A A Adedeji

161
Table 2 Stiffness Deterioration and shear Decay of straw bale infill for the
thickness (t) = 275mm
Instantaneous
value (Test
No) i
Displacement
Ui (mm)
Lateral force
Vi (N)
Shear decay Vm
- Vi (N)
Stiffness initial
Ko (N/mm)
1
2
3
4
5
6
11.7000
11.8179
11.9162
11.9979
12.3803
23.6000
13145.1
13168.1
13187.2
13203.1
13277.6
13279.2
134.10
111.10
92.00
76.10
1.60
0.00
22.923
18.802
15.441
12.686
0.259
0.000
At the instantaneous value 6, other cases (CASES III and IV) with varying wall
thicknesses (t) are:
CASE III at t = 250mm,
Ad = 11862.53mm2, Vm = 12071.9N, Um = 23.6mm, KO=1023. 05N/mm, and Vy = 11949.9
N, Uy = 11.7mm .
CASE IV, t = 200mm,
Ad = 10961.62mm2, Vm = 11155.2N, Um = 23.6mm, KO=945. 36N/mm and Vy = 11042. 5N,
Uy = 11.7mm.
6.5. Deflection check
Maximum deflection of masonry wall is 24 mm. This value is greater than 23.7mm that was
obtained in the analysis. Thus, the maximum deflection of the straw bale infill is less than the
maximum allowed for masonry walls with the same dimensions (6.000 x 3.500 m).
It is beyond the scope of this paper to verify the accuracy of the spectra response on the
basis of the shake table runs and because of the compressed time-scale of the laboratory
study (at Department of Civil Engineering, University of Ilorin), it would not be correct to
make such correlation. However, it is worthy to examine how well the actual peak response
agreed with those determined from the linear response from actual base motion. The results
are shown in Table 4.
Table 4. Observed and measured response maxima for base isolated motion Response Table
acceleration
Peak
acceleration
Spectral
acceleration
Base
shear
kN
Total
weight of
the
structure
kN
Base
moment
kNm
Roof
displacement
Mm
Observed
(prototype)
1.07 0.58 0.59 129 210 95.8 12.3
Calculated - 0.1 - 143 365.62 158.6 23.6
6.6. Dynamic response results
At calculated Z =1, the stiffness decay is incorporated in the hysteretic model by
including the control parameter for the hysteretic parameter (i > 1.0). The default value of
Hysteresis analysis of prestressed brick frame with strawbale
masonry-infill subjected to seismic loads
162
Sk = 5 is recommended. The results of iteration of dynamic response characteristics from the
analysis are as shown in the Tables 5 and 6 for 200 and 250 only.
Table 5 Dynamic response characteristics of straw bale infill thickness (t) = 200mm Displacement
(Ui)
Ductility
(i)
Control
parameter (i)
Hysteretic
Component (dZi)
Lateral force
(Vi), N
Shear decay
(Vm –Vi), N
11.7 1.0 1 1 11042.5 112.70
11.8205 1.0103 0.9983 1.0017 11.062.22 92.98
11.9210 1.0189 0.9969 1.0031 11078.66 76.54
12.0045 1.0260 0.9957 1.0043 11092.32 62.88
12.0737 1.0319 0.9948 1.0053 11103.64 51.56
12.1311 1.0368 0.9940 1.0061 11113 42.20
12.1782 1.0409 0.9933 1.0067 11120.72 34.48
12.2171 1.0442 0.9928 1.0073 11127.09 28.11
12.2491 1.0469 0.9923 1.0077 11132.33 22.87
12.2754 1.0492 0.9920 1.0081 11136.64 18.56
12.971 1.0510 0.9917 1.0084 11140.13 15.03
12.3148 1.0526 0.9914 1.0087 11143.08 12.12
Table 6 Dynamic response characteristics of straw bale infill thickness (t) = 250mm Displacement
(Ui)
Ductility
(i)
Control
parameter (i)
Hysteretic
Component (dZi)
Lateral force
(Vi), N
Shear decay
(Vm-Vi), N
11.7 1 1 1 11949.9 122
11.8224 1.0105 0.9983 1.0017 11971.58 100.32
11.9245 1.0192 0.9968 1.0032 11989.65 82.25
12.0094 1.0264 0.9957 1.0044 12004.67 67.23
12.0797 1.0325 0.9947 1.0054 12017.12 54.78
12.1378 1.0374 0.9939 1.0062 12027.41 44.49
12.1858 1.0415 0.9932 1.0069 12035.9 36.00
12.2253 1.0449 0.9927 1.0074 12042.9 29.00
12.2578 1.0477 0.9922 1.0079 12048.66 23.24
12.2846 1.0500 0.9918 1.0082 12053.4 18.51
12.3066 1.0518 0.9915 1.0086 12057.29 14.62
12.3246 1.0534 0.9913 1.0088 12060.48 11.46
Other dynamic response results for t = 275 and 300 are not shown here, but are represented in
the graphical forms. The strength deterioration is modeled by reducing the yield force Vy
from Vyo at each step k.
7. Results and Discussion
It was observed, from the result of the analysis, that the maximum lateral force the straw
bale infill can be subjected to increases with the thickness of the infill panel. For thickness of
200mm,Vm = 11155.2N; for t = 250mm,Vm = 12071.9N; for t = 275mm, Vm =13279.2N and
for t = 300mm, Vm = 14486N. Also, the stiffness and strength (hysteretic properties) of the
straw bale wall infill decreases after the yield force. The yield force (Vy) being 14193.4N for
t=300mm; 13145.1N for t = 275mm; 11949.9N for t = 250mm and 11042.5N for t = 200mm.
The maximum deflection of the infill was obtained to be 23.7mm, which was less than the
A A Adedeji
163
maximum 24mm specified for masonry infill walls. Also, it was found out that the hysteretic
parameters deteriorate at a rate proportional to the thickness of the infill panel
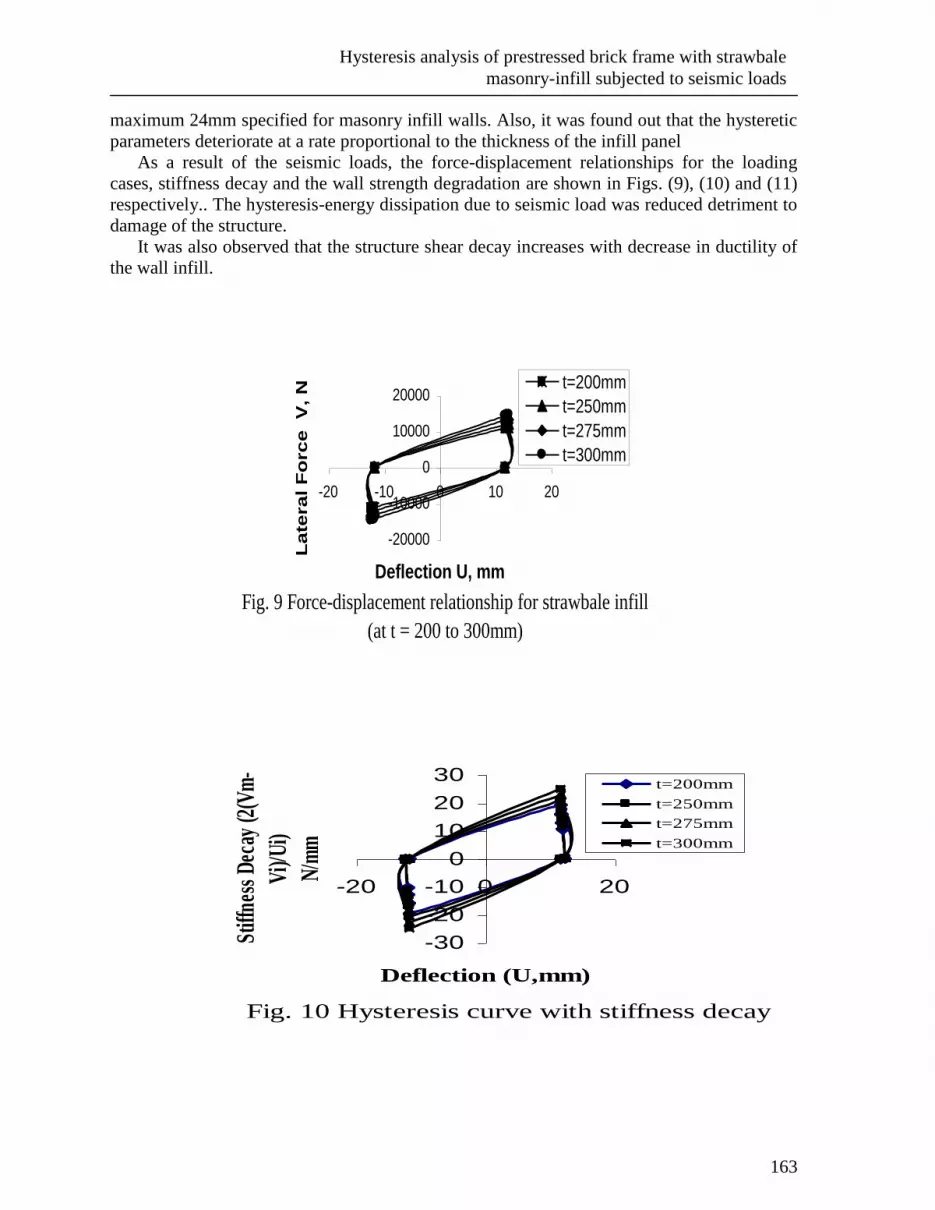
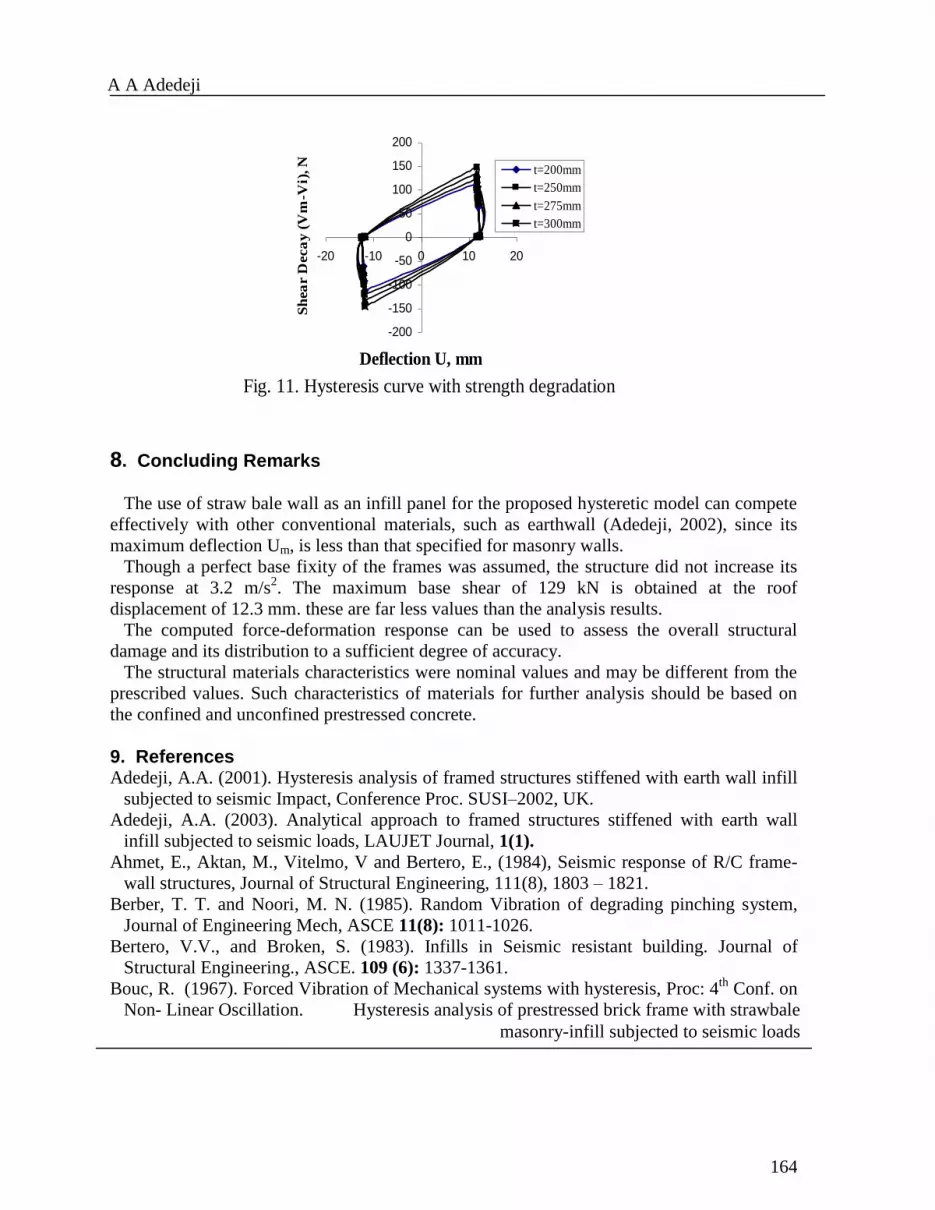
As a result of the seismic loads, the force-displacement relationships for the loading
cases, stiffness decay and the wall strength degradation are shown in Figs. (9), (10) and (11)
respectively.. The hysteresis-energy dissipation due to seismic load was reduced detriment to
damage of the structure.
It was also observed that the structure shear decay increases with decrease in ductility of
the wall infill.
Fig. 9 Force-displacement relationship for strawbale infill
(at t = 200 to 300mm)
-20000
-10000
0
10000
20000
-20 -10 0 10 20
Deflection U, mm
La
tera
l F
orc
e V
, N t=200mm
t=250mm
t=275mm
t=300mm
Fig. 10 Hysteresis curve with stiffness decay
-30
-20
-10
0
10
20
30
-20 0 20
Deflection (U,mm)
Stiff
ness
Dec
ay (2
(Vm
-
Vi)/
Ui)
N/m
m
t=200mm
t=250mm
t=275mm
t=300mm
Hysteresis analysis of prestressed brick frame with strawbale
masonry-infill subjected to seismic loads
164
Fig. 11. Hysteresis curve with strength degradation
-200
-150
-100
-50
0
50
100
150
200
-20 -10 0 10 20
Deflection U, mm
Sh
ea
r D
eca
y (
Vm
-Vi)
, N
t=200mm
t=250mm
t=275mm
t=300mm
8. Concluding Remarks
The use of straw bale wall as an infill panel for the proposed hysteretic model can compete
effectively with other conventional materials, such as earthwall (Adedeji, 2002), since its
maximum deflection Um, is less than that specified for masonry walls.
Though a perfect base fixity of the frames was assumed, the structure did not increase its
response at 3.2 m/s2. The maximum base shear of 129 kN is obtained at the roof
displacement of 12.3 mm. these are far less values than the analysis results.
The computed force-deformation response can be used to assess the overall structural
damage and its distribution to a sufficient degree of accuracy.
The structural materials characteristics were nominal values and may be different from the
prescribed values. Such characteristics of materials for further analysis should be based on
the confined and unconfined prestressed concrete.
9. References Adedeji, A.A. (2001). Hysteresis analysis of framed structures stiffened with earth wall infill
subjected to seismic Impact, Conference Proc. SUSI–2002, UK.
Adedeji, A.A. (2003). Analytical approach to framed structures stiffened with earth wall
infill subjected to seismic loads, LAUJET Journal, 1(1).
Ahmet, E., Aktan, M., Vitelmo, V and Bertero, E., (1984), Seismic response of R/C frame-
wall structures, Journal of Structural Engineering, 111(8), 1803 – 1821.
Berber, T. T. and Noori, M. N. (1985). Random Vibration of degrading pinching system,
Journal of Engineering Mech, ASCE 11(8): 1011-1026.
Bertero, V.V., and Broken, S. (1983). Infills in Seismic resistant building. Journal of
Structural Engineering., ASCE. 109 (6): 1337-1361.
Bouc, R. (1967). Forced Vibration of Mechanical systems with hysteresis, Proc: 4th
Conf. on
Non- Linear Oscillation.
A A Adedeji
Hysteresis analysis of prestressed brick frame with strawbale
masonry-infill subjected to seismic loads
165
Dhanasekar, M.., and Page, A.W. (1986). The influence of brick masonry infill properties on
behaviour of infilled frames, Proc., Instin. of Civ. Engrs., London England, Part 2. 593-
605
Ibrahim, E.A. (2001). Hysteresis analysis of framed structures, B. Eng. Project, Submitted to
the Dept. of Civil Engineering, University of Ilorin., Ilorin, Nigeria.
Klinger, R.E., and Bertero, V. V (1978). Earthquake resistance of infilled frames, Journal of
Structural Engineering, ASCE.104 (6)
Madan, A., Reinhorn, A.M, Mander, J.B, (1997). Modeling of masonry infill panels for
structural analysis, Journal of Structural Engineering, ASCE 123(10)
Mander, J.B., and Nair, B. (1994). Seismic resistance of brick-infilled steel frames with and
without retrofit, The masonry J. 12 (2): 24-37.
Malnotra, P. K. (2002) Cyclic demand spectrum. Earthquake Engineering and Structural
Dynamics, (31):1441-1457.
Morom 1996
Mosalam, K.M. (1996). Modelling of the non-linear Seismic behaviour of gravity load
designed infilled frames, 1995 EERI student Paper, Los Angeles, Calif.
Reinhorn, A. M., Madan, A.,Valles, R. E., Reichman, Y and Mander, J. B. (1995), Modelling
of masonry infill panels for structural analysis, NCEER-95-0018, Nat.Centre of Earthquake
Engineering, New York, Buffalo, N. Y.
Saneinejad, A., and Hobbs, B. (1995). Inelastic design of infilled frames. Journal of
Structural Engineering. ASCE, 121 (4): 634-650.
Smith, J.W. (1988), “Vibration of Structures”. Application in Civil Engineering Design.
London, Chapman and Hall, pp. 177-190.
10. Symbols aeff = Dependent effective peak acceleration
A b = Sectional area of beam
Ac = Sectional area of column
Ad = Area of equivalent diagonal strut.
As = Parameter varying the slip length due to crack opening in the panel
Cs = Seismic coefficient
DI = Cumulative damage parameter
fb = Brick compressive strength.
f m = Characteristic strength of straw bale wall.
Gk = Dead load
g = Acceleration due to gravity
h = Vertical dimension of in fill panel.
Ib = Moment of inertia of bean
Ic = Moment of inertia of column
Iw = Second moment of area of equivalent diagonal strut
In = normalized characteristics intensity
i = Instantaneous value.
Ko = Initial stiffness.
L = Lateral dimension of infill panel.
Ld = Length of the equivalent diagonal strut.
M = Total mass of the building and its contents
A A Adedeji
166
n = Transitional rates.
Qk = Live load
R = Ductility factor of the structure
{r} = Displacement vector
S = Seismic response factor
Sp1 ,Sp2 = Control the rate of deterioration for maximum and monotonic ductility respectively
Sk = Default value.
t =Thickness of infill panel.
tSD = significant duration of the accelerogram)
U = Ultimate load
Um = Corresponding maximum displacement.
Uy = Corresponding yield displacement.
V = Base shear
VD = Total dynamic base shear
Vm = Maximum lateral force.
Vy = Lateral yield force.
Vb = Total dynamic base shear
vg = peak ground velocity
Z = Hysteresis component.
b = Bond strength of straw bale [wall].
β = Constant that control the shape of the generated hysteresis
εm = Corresponding strain.
= Inclination of diagonal strut
i = Ductility
= Control parameter.
C = Basic compressive strength of straw bale
b = Shear stress of plain straw bale wall.
xy = Tangential stress


