Embed Size (px)
Citation preview

Hyperlipoproteinemia in Nagase analbuminemic rats: effects of pravastatin on plasma (apo)lipoproteins and 1ecithin:cholesterol acyltransferase activity
A. Van Tol,ls* E. H. J. M. Jansen,t H. A. Koomans,** and J. A. Joles**
Department of Biochemistry: Erasmus University, Rotterdam; Laboratory for Toxicology,t National Institute of Public Health and Environmental Protection (RIVM), Bilthoven; and Department of Nephrology:* University Hospital, Utrecht, The Netherlands
Abstract The present study demonstrates very high levels of plasma lipids and high density lipoprotein (HDL) apolipopro- teins (apoA-I and apoE) in female Nagase analbuminemic rats (NAR) fed a semi-synthetic diet in order to further increase the hyperlipidemia present in this strain. Plasma apoB-containing lipoproteins (very low, intermediate, and low density lipopro- teins) were also elevated in NAR. Plasma cholesterol was mainly present in lipoprotein particles with a density between 1.02 and 1.12 g/ml. Separation of lipoprotein classes by gel filtration showed that the major cholesterol-carrying lipoprotein fractions in NAR plasma are apoE-rich HDL and apoA-I-rich HDL. The high HDL levels in NAR are explained, at least partly, by the two- to threefold elevated activity of plasma 1ecithin:cholesterol acyltransferase (LCAT). The lysophosphatidylcholine generated in the LCAT reaction, as well as plasma free fatty acids, are bound to lipoproteins in NAR plasma. A study was carried out to determine whether the elevated LDL and apoE-rich HDL levels could be corrected by administration of the HMG-CoA reductase inhibitor pravastatin (at a dose of 1 mg/kg per day). Pravastatin treatment results in a 43% decrease in plasma tri- glycerides in NAR, but not in Sprague-Dawley (SDR) rats, and had no significant effect on plasma total cholesterol, phospho- lipids, apolipoproteins A-I, A-IV, B, or E, as well as on plasma LCAT activity levels in NAR or SDR.-Van Tol, A., E. H. J. M. Jansen, H. A. Koomans, and J. A. Joles. Hyperlipoproteine- mia in Nagase analbuminemic rats: effects of pravastatin on plasma (ap0)lipoproteins and 1ecithin:cholesterol acyltransferase activity. J Lipid Res. 1991. 32: 1719-1728.
Supplementary key words analbuminemia apoA-1 apoA-IV apoB apoE cholesterol free fatty acids HMG-CoA reductase inhibitor lysolecithin triglycerides
Hyperlipidemia in the Nagase analbuminemic rat (NAR) (1, 2) is characterized by increased plasma levels of both cholesterol and triglycerides, the latter being mostly present in very low density lipoproteins (VLDL) (3). High density lipoproteins (HDL), including an apoE- rich subfraction, are the major cholesterol-carrying lipo- proteins in normal rats, as well as in NAR (4-6).
Lecithin:cholesterol acyltransferase (LCAT, EC 2.3.1.43) is a key enzyme for the esterification of cholesterol in plasma (7-12). As rats have no measurable plasma cholesteryl ester transfer protein activity, LCAT is a very important determinant for plasma HDL-cholesterol con- centrations in this species (9, 12). It was reported that the plasma cholesterol esterification rate by LCAT is de- creased in patients with hypoalbuminemia and hyper- lipidemia due to the nephrotic syndrome (13, 14). This coincides with the low levels of plasma HDL often found in this disease (15). However, two siblings with anal- buminemia demonstrated increases in HDL,, as well as LCAT activity (16). In order to find out whether anal- buminemia per se has specific effects on H D L and LCAT, we measured HDL subfractions, LCAT activity levels, and rates of cholesterol esterification in NAR plasma.
Inhibitors of 3-hydroxy-3-methylglutaryl coenzyme A (HMG-CoA) reductase, the rate limiting enzyme in cho- lesterol biosynthesis, have been given to hypoalbumi- nemic patients with the nephrotic syndrome. This treat- ment resulted in decreases in plasma total cholesterol, LDL-cholesterol and apoB, as well as in small increases in HDL-cholesterol and plasma apoA-I (17, 18). Adminis- tration of an HMG-CoA reductase inhibitor to patients
Abbreviations: apo, apolipoprotein; CE, cholesteryl esters; FFA, free fatty acids; HDL, high density lipoprotein; HMG-CoA, 3-hydroxy-3- methylglutaryl coenzyme A; IDL, intermediate density lipoprotein; LCAT, 1ecithin:cholesterol acyltransferase; LDL, low density lipopro- tein; LPC, lysophosphatidylcholine; MW, molecular weight; NAR, Nagase analbuminemic rats; PL, phospholipids; SDS, sodium dodecyl sulfate; SDR, Sprague-Dawley rats; TG, triglycerides; UC, unesterified cholesterol; VLDL, very low density lipoprotein; FPLC, fast protein liquid chromatography.
'To whom reprint requests should be addressed at: Department of Biochemistry I, Erasmus University Rotterdam, P.O. Box 1738, 3000 DR Rotterdam, The Netherlands.
Journal of Lipid Research Volume 32, 1991 1719
by guest, on July 10, 2011w
ww
.jlr.orgD
ownloaded from
with familial hypercholesterolemia caused a twofold in- crease in LCAT activity (19).
As we found that the female NAR, fed a semi-synthetic diet, is one of the most severe hypercholesterolemic rat models available (mean plasma cholesterol level of 10 mM), we tested the effect of a reductase inhibitor on the hyper- cholesterolemia and the LCAT reaction in NAR. Prava- statin was chosen because it is water-soluble; it was ad- ministered by a subcutaneously implanted osmotic pump.
METHODS
Animals
Adult female NAR from our own colony (which was founded with animals generously donated by Dr. S. Nagase, Tokyo, Japan) and adult female SDR (Harlan-CPB, Zeist, The Netherlands) were housed three to a cage under conventional conditions. The animals were fed a semi-synthetic diet (Hope Farms, Woerden, The Nether- lands) containing 20% casein-protein, 10% corn starch, 5% cellulose, 53% glucose monohydrate, and 5% soy- bean oil (by weight). The remaining 7% consisted of salts, vitamins, and trace elements. Six animals of each strain were treated with pravastatin, dissolved in isotonic saline at a concentration of 4 mg/ml. The pravastatin solution was administered using a subcutaneously implanted os- motic pump (Alzet", 2ML4; volume - 2 ml). These pumps, which administer their contents at a constant rate over 28 days, delivered a dose of 1 mg pravastatidkg per day. The untreated rats (six of each strain) had osmotic pumps containing isotonic saline only. Rats treated with pravastatin or saline did not differ in body weight. On the 28th day after pump implantation, the animals were weighed in the fed state (body weights were between 250 and 300 g) and subsequently exsanguinated by puncture of the abdominal aorta under fentanyl-diazepam anesthe- sia. Blood was collected in chilled K-EDTA-coated tubes and immediately centrifuged at 4OC for 10 min at 1000 Q
Plasma for lipid and apolipoprotein analyses was stored at -8OOC until analyzed. Plasma used for lipoprotein isola- tion was used directly after isolation. The study was ap- proved by the Utrecht University Board for study in ex- perimental animals.
Lipid and apolipoprotein analyses
Enzymatic methods were used for the determination of total plasma cholesterol (TC) and triglycerides (E). The kits were obtained from Boehringer GmbH (Mannheim, Germany). Unesterified cholesterol (UC) and phospho- lipids (PL) were also assayed enzymatically, using kits from Wako Chemicals GmbH (Neuss, Germany). Choles- teryl esters (CE) were calculated as the difference between TC and UC. Free fatty acids (FFA) were assayed in
plasma and isolated lipoprotein fractions using a kit from Wako Chemicals GmbH. Plasma apolipoproteins A-I, A-IV, and E were measured by electro-immunoassay as described previously (20). Plasma apoB was determined by radial immunodiffusion as described (21), using a specific antiserum raised in rabbits against purified rat LDL (22). Plasma apoB concentrations, expressed in ar- bitrary units (A.U.), were calculated as percentages of a rat serum standard pool (obtained from 50 rats) run simultaneously on the plates with the plasma samples. Six different dilutions of the serum standard pool were run on each plate. All samples were run in triplicate. The stan- dard pool was stored at -8OOC in batches of 0.25 ml. The data are expressed in A.U. because of the insolubility of purified apoB and the lack of sufficient quantities of pure apoB for use as an absolute standard. The within-day and between-day coefficients of variation of the apoB assay were 2 % and 6%, respectively. Plasma levels as low as 5 A.U. could be detected.
LCAT activity assays
Plasma levels of LCAT activity were measured using excess exogenous substrate, as described (23). In addition, the rate of cholesterol esterification was determined with endogenous substrates by incubating total plasma and as- saying the decrease in UC at 37OC, as described (24). The rate was constant during the first hour of incubation. This rate may be given as the absolute rate (in nmol/ml plasma per h), or as the fractional esterification rate (% of plasma UC converted to CE/h).
Lipoprotein isolation by density gradient ultracentrifugation
The plasma was pooled into two samples per subgroup. Each pooled sample was derived from equal amounts of plasma obtained from three rats. Plasma lipoproteins in this pooled sample were separated by density gradient ultracentrifugation (25) into six fractions (very low den- sity lipoprotein, VLDL, d < 1.006 g/ml; intermediate den- sity lipoprotein, IDL, d 1.006-1.019 g/ml; low density lipoprotein; LDL, d 1.019-1.063 g/ml; high density lipoprotein 2; HDL2, d 1.063-1.125 g/ml; HDL,, d 1.125- 1.21 g/ml; and an infranatant with d>1.21 g/ml). Lipo- protein TC, TG, and PL were measured as described above. Lipoprotein protein concentration was measured colorimetrically with a kit from Bio-Rad Laboratories (Munich, Germany).
Apolipoprotein composition of total plasma and of each lipoprotein fraction was analyzed by polyacrylamide gel electrophoresis in the presence of sodium dodecyl sul- phate (SDS), as described previously and evaluated with an image analysis system (26). The polyacrylamide gra- dient gels consisted of a linear gradient of acrylamide from 4 to 10% and a constant 2.6% N'N'-bis-methylene- acrylamide. Standardization was performed using a mix-
1720 Journal of Lipid Research Volume 32, 1991
by guest, on July 10, 2011w
ww
.jlr.orgD
ownloaded from
ture of two commercial preparations (Bio-Rad, Rich- mond, CA, and Serva, Heidelberg, Germany) containing proteins with the following molecular masses: 6.5, 12.5, 21.0, 29,0, 45.0, 66.2, 92.5, 116, and 200 kDa. The unknown proteins were characterized by their molecular masses using linear extrapolation between the two next standard proteins in the gel. Plasma albumin was deter- mined immunoturbimetrically using rabbit anti-rat albu- min obtained from Nordic (Tilburg, The Netherlands). As a reference we used rat albumin (Fraction V, Sigma, St. Louis, MO). The detection limit of this assay is 0.05 g/ml.
Lipoprotein separation by gel filtration
Plasma pools from either SDR or NAR (three to six animals/group) were analyzed by gel filtration using an FPLC system (27), with some modifications. A Superose 6 and a Superose 12 prep-grade column (2 x 100 ml, Phar- macia, Uppsala, Sweden) were used in sequence and 2-ml plasma samples were applied. The lipoproteins were eluted at a flow of 0.12 ml/min (during 1000 min). Subsequently, the non-lipoprotein components were washed from the columns at a flow of 1.33 ml/min (90 min). Lipoprotein collection started after 500 min in 30 fractions of 2.0 ml each. The elution buffer was 150 mM NaCl, containing 2 mM Na-phosphate, 5 mM EDTA, and 0.02% NaN, (pH 7.4). In some experiments, with special emphasis on lipoprotein-deficient plasma fractions, 36 fractions of 2.4 ml each were collected. The fractions were analyzed for TG, Tc, PL, FFA, and apolipoproteins A-I, B, and E. Average recoveries were 88% (TG, n=2), 101% (E, n=4), 98% (PL, n=3), 86% (apoA-I, n=2), 101% (apoB, n=2), 74% (apoE, n=2), and 129% (FFA, n=2). The FFA levels measured in the isolated fractions were not cor- rected for turbidity occurring in the assay of the void
volume fractions (chylomicrons/VLDL); this resulted in high values, which caused the >loo% recovery.
Statistical analysis
Values were subjected to a completely randomized two- way analysis of variance. If a variance ratio (F) reached statistical significance (P < 0.05), the differences between the means were analyzed by the least significant difference test (28), using the interaction mean square error to cal- culate the least significant difference. Results are ex- pressed as arithmetic means with their standard errors (SEM).
RESULTS
Plasma TC, UC, CE, TG, and PL were all much higher in the NAR than in the SDR (P < 0.01; Table 1). Pravastatin treatment in NAR reduced TG levels to 3.0 f 0.3 mM, as compared to 5.3 f 0.3 mM in the saline-treated animals (P < O.Ol), but did not affect the low TG level of -0.7 mM found in the SDR. Plasma cholesterol and PL levels were not affected by pravastatin in either rat strain.
Plasma apolipoproteins A-I, B, and E were all increased in NAR (P < 0.01), the most striking difference being in the apoA-I levels, which were 4-5 times higher in the NAR than in the SDR. Plasma apoA-IV was not different between the two strains. Plasma apolipoprotein levels were not affected by pravastatin treatment (Table 1).
Density gradient ultracentrifugation showed that cho- lesterol levels were elevated in all lipoprotein fractions in the NAR, when compared with the SDR. The fraction with density 1.02-1.063 g/ml contained 62% of total plasma cholesterol in the NAR, as compared to 51% in
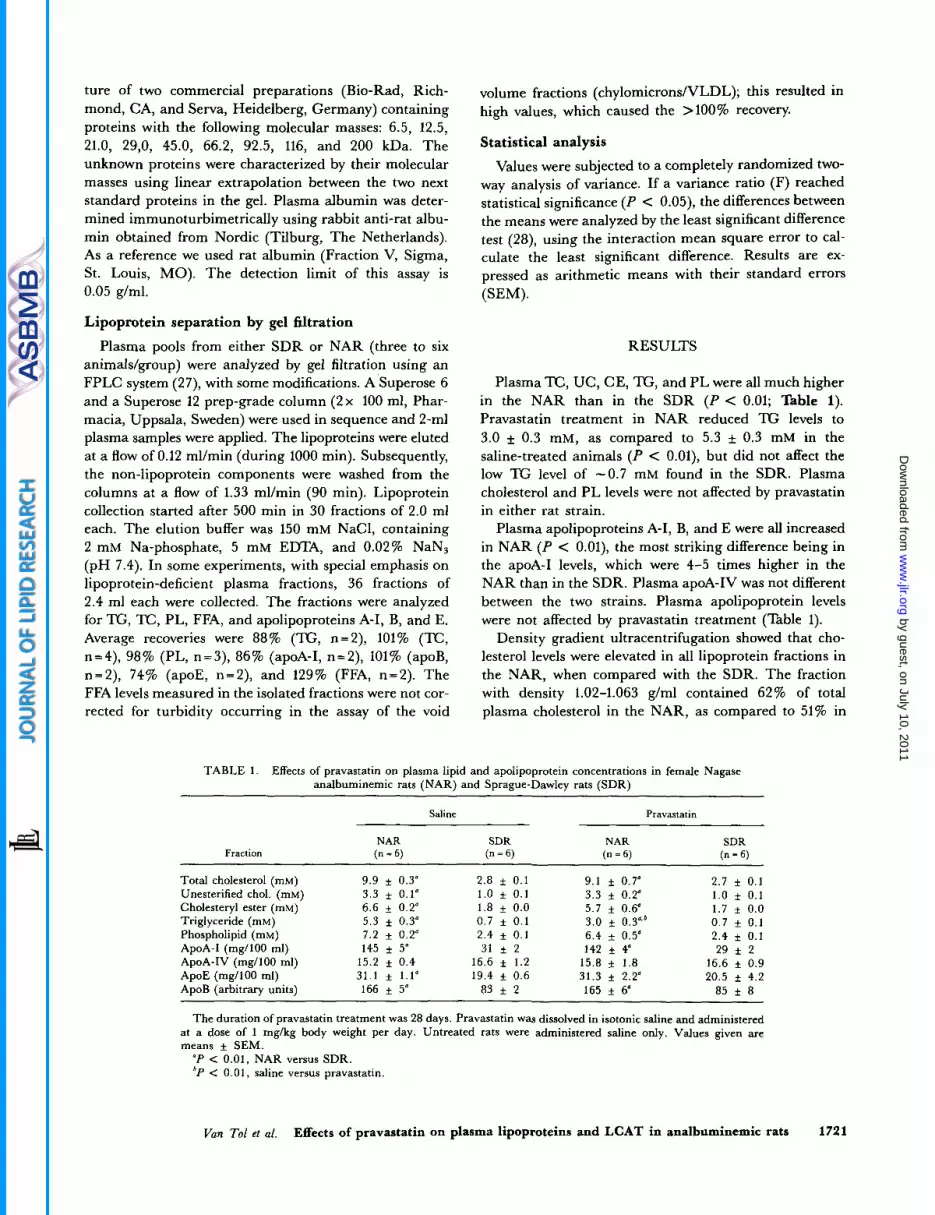
TABLE 1 . Effects of pravastatin on plasma lipid and apolipoprotein concentrations in female Nagase analbuminemic rats (NAR) and Sprague-Dawley rats (SDR)
Saline Pravastatin
NAR SDR NAR SDR Fraction (n = 6) (n = 6) (n = 6) (n = 6)
Total cholesterol (mM) Unesterified chol. (mM) Cholesteryl ester (mM) Triglyceride (mM) Phospholipid (mM) ApoA-I (mg/l00 ml) ApoA-IV (mg1100 ml) ApoE (mg/100 ml) ApoB (arbitrary units)
9 .9 * 0.3" 3.3 f 0.1" 6.6 f 0.2" 5.3 * 0.3" 7.2 f 0.2" 145 f 5"
15.2 f 0.4 31.1 f 1 . 1 " 166 f 5"
2.8 * 0.1 1.0 f 0.1 1.8 f 0.0 0.7 f 0.1 2.4 f 0.1 31 f 2
16.6 f 1.2 19.4 5 0.6
83 f 2
9.1 f 0.7"
5.7 f 0.6" 3.0 f 0.3".* 6 .4 f 0.5" 142 f 4O
15.8 f 1.8 31.3 f 2.2" 165 f 6"
3.3 f 0.2" 2.7 * 0.1 1.0 f 0.1 1 . 7 f 0.0 0.7 f 0.1 2.4 f 0.1 29 f 2
16.6 f 0.9 20.5 f 4.2
85 f 8
The duration of pravastatin treatment was 28 days. Pravastatin was dissolved in isotonic saline and administered at a dose of 1 mg/kg body weight per day. Untreated rats were administered saline only. Values given are means f SEM. "P < 0.01. NAR versus SDR. 'P < 0.01, saline versus pravastatin.
Van To1 et al. Effects of pravastatin on plasma lipoproteins and LCAT in analbuminemic rats 1721
by guest, on July 10, 2011w
ww
.jlr.orgD
ownloaded from
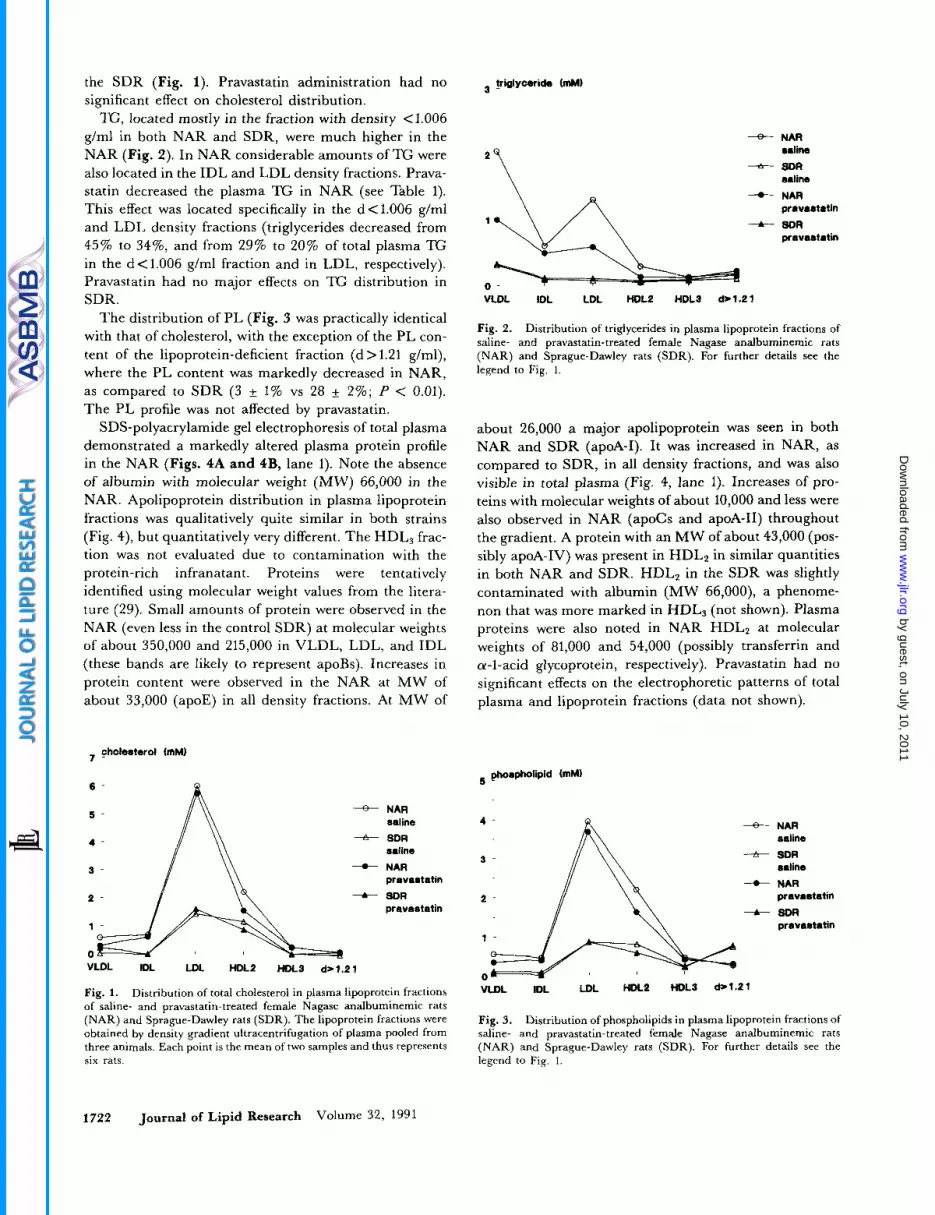
the SDR (Fig. 1). Pravastatin administration had no significant effect on cholesterol distribution.
TG, located mostly in the fraction with density <I006 g/ml in both NAR and SDR, were much higher in the NAR (Fig. 2). In NAR considerable amounts of TG were also located in the IDL and LDL density fractions. Prava- statin decreased the plasma TG in NAR (see Table 1). This effect was located specifically in the d<1.006 g/ml and LDL density fractions (triglycerides decreased from 45% to 3476, and from 29% to 20% of total plasma TG in the d<1.006 g/ml fraction and in LDL, respectively). Pravastatin had no major effects on TG distribution in SDR.
The distribution of PL (Fig. 3 was practically identical with that of cholesterol, with the exception of the PL con- tent of the lipoprotein-deficient fraction (d > 1.21 g/ml), where the PL content was markedly decreased in NAR, as compared to SDR ( 3 + 1% vs 28 2%; P < 0.01). The PL profile was not affected by pravastatin.
SDS-polyacrylamide gel electrophoresis of total plasma demonstrated a markedly altered plasma protein profile in the NAR (Figs. 4A and 4B, lane 1). Note the absence of albumin with molecular weight (MW) 66,000 in the NAR. Apolipoprotein distribution in plasma lipoprotein fractions was qualitatively quite similar in both strains (Fig. 4), but quantitatively very different. The HDL3 frac- tion was not evaluated due to contamination with the protein-rich infranatant. Proteins were tentatively identified using molecular weight values from the litera- ture (29). Small amounts of protein were observed in the NAR (even less in the control SDR) at molecular weights of about 350,000 and 215,000 in VLDL, LDL, and IDL (these bands are likely to represent apoBs). Increases in protein content were observed in the NAR at MW of about 33,000 (apoE) in all density fractions. At MW of
cholesterol tmM) 7 -
+ NAR
+ SDR saline
saline
pravaatatin
pravaatatin
--t NAR
t- SDR
VLDL IDL LDL HDLP HDL3 dr1.21
Fig. 1. Distribution of total cholesterol in plasma lipoprotein fractions of saline- and pravastatin-treated female Nagase analbuminemic rats (NAR) and Sprague-Dawley rats (SDR). The lipoprotein fractions were obtained by density gradient ultracentrifugation of plasma pooled from three animals. Each point is the mean of two samples and thus represents six rats.
friglyceride (mM)
* NAR
+ SDR
--t NAR
t- SDR
salina
saline
pava8tatin
pravsstotin
VLDL IDL LDL HDLP HDL3 d*1.21
Fig. 2. Distribution of triglycerides in plasma lipoprotein fractions of saline- and pravastatin-treated female Nagase analbuminemic rats (NAR) and Sprague-Dawley rats (SDR). For further details see the legend to Fig. 1.
about 26,000 a major apolipoprotein was seen in both NAR and SDR (apoA-I). It was increased in NAR, as compared to SDR, in all density fractions, and was also visible in total plasma (Fig. 4, lane 1). Increases of pro- teins with molecular weights of about 10,000 and less were also observed in NAR (apoCs and apoA-11) throughout the gradient. A protein with an MW of about 43,000 (pos- sibly apoA-IV) was present in HDL2 in similar quantities in both NAR and SDR. HDLz in the SDR was slightly contaminated with albumin (MW 66,000), a phenome- non that was more marked in HDL3 (not shown). Plasma proteins were also noted in NAR HDLl at molecular weights of 81,000 and 54,000 (possibly transferrin and a-1-acid glycoprotein, respectively). Pravastatin had no significant effects on the electrophoretic patterns of total plasma and lipoprotein fractions (data not shown).
phospholipid (mM) 5
- A 4 -
3 -
2 -
- NAR
+ SDR
--t NAR
-+-sDR
saline
d i n e
provastatin
pravaatatin
- VLDL IDL LDL HM2 HDL3 ds1.21
Fig. 3. Distribution of phospholipids in plasma lipoprotein fractions of saline- and pravastatin-treated female Nagase analbuminemic rats (NAR) and Sprague-Dawley rats (SDR). For further details see the legend to Fig. 1.
1722 Journal of Lipid Research Volume 32, 1991
by guest, on July 10, 2011w
ww
.jlr.orgD
ownloaded from

A
.t ' Y
37- 33-
25-
11-
1 2 3 4
- 365 - 3 4 8 B
- 215
190--
153- W 138-
115- * - - 81
='s" --75
5
43-I-. 40- 33-
25--
11-
1
- 349 - 333
- 2 1 5
- 66
Fig. 4A. SDS-polyacrylamide gel electrophoresis of total plasma proteins and apolipoproteins from lipoprotein fractions isolated from saline-treated female Nagase analbuminemic rats (NAR). The lipoprotein fractions were obtained by density gradient ultracentrifugation. Lane 1: total plasma. The approximate molecular masses (kDa) of the major protein bands in total plasma are indicated on the left. Lane 2: VLDL density range; Lane 3: IDL density range; Lane 4 LDL density range; Lane 5: HDL2 density range. The approximate molecular masses (kDa) of the major protein bands in the lipoprotein fractions of various densities (lanes 2-5) are indicated on the right. Volumes of 0.5. 37.5, 37.5, 37.5, and 37.5 p1 of total plasma or lipoprotein fraction were applied to the gels for samples 1-5, respectively. This resulted in 27, 3.4, 4.9, 75, and 47 pg of protein applied, respectively. 4B. SDS-polyacrylamide gel electrophoresis of total plasma proteins and apolipoproteins from lipoprotein fractions isolated from saline-treated female Sprague-Dawley rats (SDR). Volumes of 0.5, 37.5, 37.5, 37.5, and 37.5 pI of total plasma or lipoprotein fractions were applied to the gels for samples 1-5, respectively. This resulted in 24. 0.4, 0.2, 12.4. and 18.8 pg of protein applied, respectively. For further details see the legend to Fig. 4A.
Lipoprotein profiles obtained after gel filtration of SDR and NAR plasma are shown in Fig. 5 (TG and apoB), Fig. 6 (E), Fig. 7 (apoE), and Fig. 8 (apoA-I). The data in Fig. 5 show that TG are present mostly in particles with the size of VLDL or larger (all present in the void volume) in both SDR and NAR. Both TG and apoB were strongly elevated in this fraction from NAR plasma. Fig. 5 also shows that plasma apoB is mainly present in LDL-sized particles of molecular masses > 103 kDa. The vertical line in Figs. 5-10 indicates the peak elution volume of IgM with a molecular mass of 1 x 10³ kDa. The increased levels of plasma TC in NAR were recovered in the same three fractions that also occur in normal rat plasma (particles with the size of chylomicronsNLDL, large apoE-rich HDL, and smaller apoA-I-rich HDL (compare Figs. 6-8). Fig. 7 shows that the increase in total plasma apoE (Table 1) in NAR is located mostly in large-sized, apoE-rich HDL (fractions 15-20). The apoA-I-rich HDL of relatively small size was depleted of apoE and further enriched in apoA-I in NAR (see Figs. 7 and 8). Only a relatively small amount of total plasma cholesterol was present in lipopro- teins with the size of apoB-containing LDL (particle mass
*.O 1 1.5
VI W
0 g 1.0 -I z E
0.5
0.0
FRACTION N W E R
Fig. 5. Triglyceride and apoB profiles obtained after gel filtration of plasma from NAR (closed symbols) and SDR (open symbols). Plasma samples (2 ml) were chromatographed on a Superose 6 and a Superose 12 column connected in sequence. Column fractions were assayed for TC (squares) and apoB (circles). TG contents are given in pmollml of injected plasma (summation of all fractions results in total plasma concentration in mM). ApoB is given in arbitrary units (A.U., see Methods). The vertical line represents the peak elution volume of I& with molecular mass 10' kDa. The column was further calibrated as described in ref. 27.
Van To1 et al. Effects of pravastatin on plasma lipoproteins and LCAT in analbuminemic rats 1723
by guest, on July 10, 2011w
ww
.jlr.orgD
ownloaded from

0.5 o'6 1 I
0 5 l b l k 20 25 30 FRACTION NUMBER
Fig. 6. Total cholesterol profiles obtained after gel filtration of plasma from NAR (closed symbols) and SDR (open symbols). Column fractions were assayed for TC, given in pmol/ml of injected plasma (summation of all fractions results in total plasma concentration in mM). For further details see the legend to Fig. 5.
about 2x203 kDa, as can be seen by comparing Figs. 5 and 6.
Albumin determined by immunoturbidimetry was 48 f 1 g/l in the saline-treated SDR and 42 1 g/1 in the pravastatin-treated SDR. Albumin was consistently below the detection limit (0.05 g/l) in all NAR samples. This raises the question where plasma FFA and LPC are located in plasma from analbuminemic animals. Fig. 9 and Fig. 10 show the distributions in NAR and SDR plasma of FFA and PL, respectively. In these experiments 36 fractions of 2.4 ml each were collected in order to include the lipo- protein-deficient fractions in the analyses. It is clear that, in contrast to the normal situation, substantial amounts of FFA were bound to all lipoprotein classes in analbu- minemia, whereas FFA were mostly bound to proteins with molecular masses <lo0 kDa (albumin) in normal animals (Fig. 9).
25 0
20 0
15.0 w 0
U 10.0
5 0
0 0 , I I I I 5
FRACTION NUMBER
I 10 15 20 25 30
Fig. 7. ApoE profiles obtained after gel filtration of plasma from NAR (closed symbols) and SDR (open symbols). Column fractions were as- sayed for apoE, using a quantitative electroimmunoassay (20). ApoE levels are expressed in pglml of injected plasma (summation of all frac- tions results in total plasma concentration in pg/ml plasma).
250
200
I 150 U
0
100
50
0 I I I I I I
FRACTION NUMBER 0 5 10 15 20 25 30
Fig. 8. ApoA-I profiles obtained after gel filtration of plasma from NAR (closed symbols) and SDR (open symbols). For further details see the legend to Fig. 7.
I ILC p u a p u ~ l p l u ~ I U I I I C S , mown in rig. iu, connrm the data obtained by density gradient ultracentrifugation (Fig. 3). In the lipoprotein-deficient plasma (fractions 27-35) we observed a decreased PL level in NAR. The various phospholipid classes present in HDL subfractions and in the lipoprotein-deficient plasma fraction (molecu- lar mass e100 kDa), obtained from SDR or NAR, are shown in Fig. 11. The lipids were visualized with iodine after separation by thin-layer chromatography on silica gel plates. It can be seen that the lipoprotein-deficient fraction from NAR contains very little LPC, when com- pared with the same fraction from SDR. On the other hand, fractions 27-35 do contain more phosphatidylcho- line in NAR than in SDR, due to the smaller average size of apoA-I-rich HDL in NAR, when compared to SDR
60.0
50.0
u7
U * >
9 40.0
E 30.0 Q LL
Lu 20.0
LL
10.0
0.0
5 l b FRACTION 1b NUMBER 2b i 5 3b 3k
Fig. 9. Free fatty acid profiles obtained after gel filtration of plasma from NAR (closed symbols) and SDR (open symbols). FFA levels in total plasma were 0.14 f 0.07 mM for NAR and 0.25 f 0.15 mM for SDR (n=6). Thirty-six fractions (of 2.4 ml each) were assayed for FFA, ex- pressed in nmol/ml of injected plasma. For further details see the legend to Fig. 5.
1724 Journal of.Lipid Research Volume 32, 1991
by guest, on July 10, 2011w
ww
.jlr.orgD
ownloaded from

0.5 -
0.4 -
v) 2 0.3 - a 2 D
:: 0.2 - a
0.1 -
0.0 7 I
I 1 I I I 1 I 0 5 10 15 20 25 30 35
FRACTION NUMBER
Fig. 10. Phospholipid profile obtained after gel filtration of plasma from NAR (closed symbols) and SDR (open symbols). Thirty-six frac- tions (of 2.4 ml each) were assayed for PL, expressed in pmollml of in- jected plasma. For further details see the legend to Fig. 5.
(see Figs. 6 and 10). It is clear that extra LPC is recovered in the lipoprotein fractions from NAR.
LCAT activity levels, as well as absolute plasma choles- terol esterification rates, were about twice as high in NAR as in SDR (P < 0.01; Table 2). The high plasma UC levels in NAR gave rise to a reduced fractional esterifica- tion rate, despite the elevated absolute rates. LCAT activi- ties, measured in various ways, were not significantly affected by pravastatin treatment (Table 2).
DISCUSSION
Plasma lipid levels were markedly higher in the NAR than in the SDR, as expected (2, 3). TG (-7-fold), cholesterol (-4-fold; both the esterified and the un- esterified form), and PL (%fold) levels were all extremely elevated in the female animals fed the semi-synthetic diet used in the present study. Mean plasma apoA-I, apoB, and apoE levels were 4.7-, 2.0-, and 1.6-fold increased in the NAR, respectively.
PE - PC
SM - LPC
origin 12-18 19-26 27-35 12-18 19-26 27-35
Pooled fractions Pooled fractions
SDR NAR Fig. 11. Separation of phospholipid classes of HDL-sized plasma lipoproteins and the lipoprotein-deficient fractions from NAR and SDR plasma. Equal volumes of the indicated fractions from the gel filtration experiments shown in Fig. 10 were pooled and extracted with chloro- form-methanol 2:l and applied on silica thin-layer plates. The chro- matogram was developed at mom temperature with chloroform- methanol-acetic acid-water 100:50:18:8 (vlv). The lipids were stained with iodine. The location of reference PL is indicated by the arrows: PE. phosphatidylethanolamine; PC, phosphatidylcholine; SM, sphingomye- lin; LPC, lysophosphatidylcholine.
The lipoprotein profile in the NAR, as determined by density gradient ultracentrifugation, was characterized by very high cholesterol and phospholipid levels in the frac- tion with a density between 1.019 and 1.063 g/ml. The as- sessment of total plasma PL, TC, and apolipoproteins, as mentioned above, suggests an increase in HDL levels, whereas the largest increase in cholesterol was found in the LDL density range (see Figs. 1 and 3). This apparent contradiction may be explained by the notion that the bulk of rat lipoproteins in the LDL density range carry HDL apolipoproteins (apoE, apoA-I, and apoCs; see Fig. 4). The ultimate proof that the extreme hypercholesterole- mia in NAR was due to elevated HDL levels was obtained
TABLE 2. Effect of pravastatin on plasma LCAT activity in female Nagase analbuminemic rats (NAR) and Sprague-Dawley rats (SDR)
Saline Pravastat in
Parameter
LCAT activity with exogenous substrate (arbitrary units) 130 f 7' 56 f 2 127 f 7' 68 f 2 Absolute esterification rate (nmollmllh) 324 f 36' 187 f 12 411 f 32' 184 f 7 Fractional esterification rate (%lh) 9.9 f 2.7' 19.3 f 1.9 12.8 f 2.6' 18.3 f 2.7
Plasma LCAT activity (expressed as enzyme activity with exogenous substrate) and endogenous cholesterol esterification rate (nmollmllh) in NAR and SDR after 28 days of pravastatin administration. Pravastatin was dissolved in isotonic saline and given at a dose of I mglkg body weight per day. Untreated rats were administered saline only. Values given are means f SEM. "P < 0.01, NAR versus SDR.
Van To1 et 01. Effects of pravastatin on plasma lipoproteins and LCAT in analbuminemic rats 1725
by guest, on July 10, 2011w
ww
.jlr.orgD
ownloaded from
from the gel filtration experiments shown in Figs. 5-8. Only a minor part of the plasma cholesterol in NAR was present on LDL-sized, apoB-containing lipoproteins, while the bulk was present on apoE-rich HDL and apoA- I-rich HDL, a situation comparable to normoalbuminemic rats (4, 9, 30-32). Several arguments are in accordance with elevated levels of apoE-rich HDL in the NAR. First, Fig. 4A shows only small amounts of high molecular mass proteins (>200 kDa), and relatively large amounts of proteins with molecular masses <50 kDa in the LDL density range. Second, the cholesterol peak in Fig. 6 (particles with average masses of 730 kDa) does not coin- cide with LDL-apoB (see Fig. 5 ) , but with the major peak of apoE in the NAR profile (see Fig. 7). It is clear, how- ever, that the plasma levels of typical LDL (particle mass 2.103 kDa and apoA-I-rich HDL (particle mass 325 kDa) are also increased in NAR (see Figs. 5 and 8, respec- tively). The presence of small amounts of apoA-I in the VLDL density fraction (see Fig. 4) indicates the presence of chylomicrons, which is not surprising because the rats were used in the post-absorptive state.
The TG distribution (Fig. 2 ) indicates considerable amounts of TG in the IDL and LDL fractions of NAR plasma, whereas TG were practically restricted to the d<1.006 g/ml fraction in SDR plasma. This is in agree- ment with the increased amounts of TG-rich particles with sizes in the VLDL-LDL range, observed after gel filtration (Fig. 5). Consequently, the lipoprotein composi- tions of IDL and LDL are quite different between the two strains, e.g., the LDL density fraction from NAR has a molar ratio of TC/TG of 4.6, versus a ratio of 18.1 in the LDL density fraction from SDR plasma. This may be connected with reduced lipoprotein lipase activities in NAR, measured in postheparin plasma (33), as well as in adipose tissue ( 3 ) . However, normal fractional catabolic rates for chylomicron- and VLDL-TG were reported (33).
Striking findings of the present study are the very high rates of plasma cholesterol esterification (coinciding with high plasma LCAT activity levels) and the altered distri- bution of plasma LPC and FFA between lipoproteins and other plasma proteins (albumin) after density gradient ultracentrifugation and gel filtration in NAR, as com- pared with control SDR. The PL distribution (Figs. 3 and 10) was similar to the cholesterol distribution in both strains, with the exception of the lipoprotein-deficient fractions, with d > 1.21 g/ml and molecular mass < 100 kDa. The PL concentration in the d > 1.21 g/ml fraction of plasma from NAR was extremely low (see Fig. 3). The major component of this PL fraction in normal rats was LPC, a product of the LCAT reaction, bound to albumin (7-10). The data in Fig. 11 indeed indicate that the NAR has a decreased concentration of LPC in its lipoprotein- deficient plasma fraction. It has been suggested that low albumin levels and low LCAT activity in the nephrotic
syndrome are linked by depletion of the acceptor of the reaction product LPC (13). However, Cohen et al. (13) reported only a decreased fractional esterification rate. Their data indicate that the patients probably had normal absolute esterification rates. They also measured normal LCAT activity levels in their patients, using excess ex- ogenous substrate. In the present study we report a high level of plasma CE, as well as increased LCAT activity levels and absolute rates of plasma cholesterol esterifica- tion in analbuminemic rats. Similarly, in two analbumi- nemic human siblings, high levels of LCAT activity have been described (16).
The absence of albumin presents potential problems related to hemolysis. LPC is a potent hemolytic agent (34) and indeed small increases in unbound LPC may account for the increased in vitro hemolysis and slight anemia ob-. served in NAR (35). Obviously the NAR is protected effectively in vivo against severe hemolytic effects. This may be due to the observed binding of LPC (and FFA) to lipoproteins (Figs. 9 and 11).
Continuous subcutaneous administration of the hydro- philic HMG-CoA reductase inhibitor, pravastatin, was tolerated well by the rats. In a previous study Uoles, J. A., N. Willekes-Koolschijn, H. A. Koomans, A. Van Tol, M. M. Geelhoed-Mieras, D. Crommelin, L. Van Bloois, M. Krajnc-Franken, L. H. Cohen, A. M. Griffioen, and D. W. Erkelens, unpublished results), we demonstrated increases in hepatic microsomal HMG-CoA reductase ac- tivity in NAR and SDR after similar subcutaneous treat- ment with pravastatin, confirming uptake of the drug. Pravastatin did not affect any lipid parameter in SDR. The only change effected by pravastatin in the present study was a 43% decrease in plasma TG in the NAR. It has been reported that pravastatin decreases VLDL syn- thesis in rats (36). The reduction in VLDL-TG and LDL- TG, observed in the pravastatin-treated NAR in the pres- ent study, may therefore be due to a reduction in hepatic VLDL synthesis. Reduction in plasma TG has been de- scribed after oral administration of pravastatin, using much higher doses than those used in the present study (37). The same study reports the absence of hypocholes- terolemic effects in rats. Pravastatin decreases plasma LDL, TG levels, and VLDL-apoB synthetic rates in pa- tients with primary hypercholesterolemia (38).
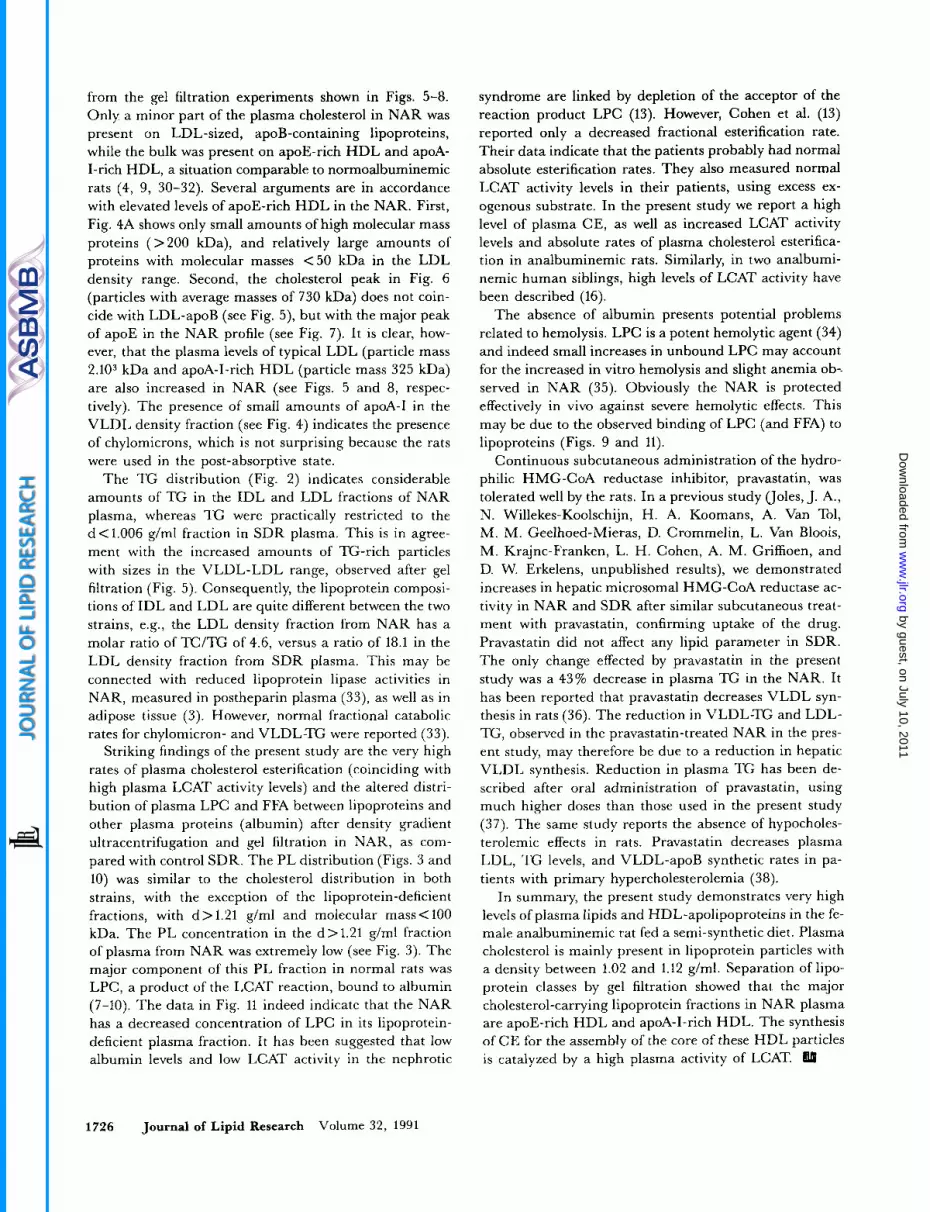
In summary, the present study demonstrates very high levels of plasma lipids and HDL-apolipoproteins in the fe- male analbuminemic rat fed a semi-synthetic diet. Plasma cholesterol is mainly present in lipoprotein particles with a density between 1.02 and 1.12 g/ml. Separation of lipo- protein classes by gel filtration showed that the major cholesterol-carrying lipoprotein fractions in NAR plasma are apoE-rich HDL and apoA-I-rich HDL. The synthesis of C E for the assembly of the core of these HDL particles is catalyzed by a high plasma activity of LCAT. I
1726 Journal of Lipid Research Volume 32, 1991
by guest, on July 10, 2011w
ww
.jlr.orgD
ownloaded from
The apolipoprotein assays, density gradient ultracentrifugation, electrophoresis, gel filtration, and LCAT activity measurements were performed by M. M. Geelhoed-Mieras, N. Willekes- Koolschijn, C. Laan, T. van Gent, and L. M. Scheek, respec- tively, whom we thank for their expert technical assistance. This research was supported by the Netherlands Heart Foundation, grant no. 88.223 and Squibb B.V., Rijswijk, The Netherlands. Pravastatin was provided by Squibb Inc., Princeton, NJ.
Manuscript received 27 Novembn 1990, in revised form 22 Jub 1991, and in re-revised form 20 August 1991.
1.
2.
3.
4.
5.
6.
7.
8.
9.
10.
11.
12.
13.
14.
REFERENCES Nagase, S., K. Shimamune, and S. Shumiya. 1979. Albumin-deficient rat mutant. Science. 205: 590-593. Takahashi, M., K. Kusumi, S. Shumiya, and S. Nagase. 1983. Plasma lipid concentrations and enzyme activities in Nagase analbuminemic rats (NAR). Exp. Anim. 32: 39-46. Kikuchi, H., S. Tamura, S. Nagase, and S. Tsuiki. 1983. Hypertriacylglycerolemia and adipose tissue lipoprotein li- pase activity in the Nagase analbuminemic rat. Biochim. Bi-
Weisgraber, K. H., R. W. Mahley, and G. Assmann. 1977. The rat arginine-rich apoprotein and its redistribution fol- lowing injection of radioiodinated lipoproteins into normal and hypercholesterolemic rats. Atherosclerosis. 28: 121-140. Joles, J. A,, N. Willekes-Koolschijn, A. Van Tol, M. M. Geelhoed-Mieras, L. H. J. C. Danse, E. Van Garderen, W. Kortlandt, D. W. Erkelens, and H. A. Koomans. 1991. Hyperlipoproteinemia in one-year-old analbuminemic rats. Atherosclerosis. 88: 3 5-47. Dallinga-Thie, G. M., P. H. E. Groot, and A. Van Tol. 1985. Distribution of apolipoprotein A-IV among lipopro- tein subclasses in rat serum. J. Lipid Res. 26: 970-976. Glomset, J. A. 1963. Further studies of the mechanism of the plasma cholesterol esterification reaction. Biochim. Biophys. Acta. 70: 389-395. Glomset, J. A. 1968. The plasma 1ecithin:cholesterol acyl- transferase reaction. J. Lipid Res. 9: 155-167. Eisenberg, S. 1984. High density lipoprotein metabolism. J. Lipid Res. 25: 1017-1058. Switzer, S., and H. A. Eder. 1965. Transport of lysolecithin by albumin in human and rat plasma. J. Lipid Res. 6:
Chueng, M. C., A. C. Wolf, K. D. Lum, J. H. Tollefson, and J. J. Albers. 1986. Distribution and localization of leci- thin:cholesterol acyltransferase and cholesteryl ester trans- fer activity in A-I-containing lipoproteins. J Lipid Res. 27:
Oschry, Y., and S. Eisenberg. 1982. Rat plasma lipopro- teins: re-evaluation of a lipoprotein system in an animal de- void of cholesteryl ester transfer activity. J. Lipid Res. 23:
Cohen, S. L., D. G. Cramp, A. D. Lewis, and T. R. Tick- ner. 1980. The mechanism of hyperlipidemia in nephrotic syndrome - Role of low albumin and the LCAT reaction. Clin. Chim. Acta. 104: 393-400. Nayak, S. S., N. Bhaskaranand, K. S. Kamath, M. Baliga, A. Venkatesh, and A. R. Aroor. 1990. Serum apolipopro- teins A and B, 1ecithin:cholesterol acyltransferase activities and urinary cholesterol levels in nephrotic syndrome pa-
ophys. Acta. 744: 165-170.
506-511.
1135-1144.
1099-1106.
tients before and during steroid treatment. Nephron. 54:
15. Jungst, D., W. H. Caselmann, P. Kutschera, P. Weisweiler. 1987. Relation of hyperlipidemia in serum and loss of high density lipoproteins in urine in the nephrotic syndrome. Clin. Chim. Acta. 168: 159-167.
16. Baldo-Enzi, G., M. R. Baiocchi, G. Vigna, C. Andrian, C. Mosconi, and R. Fellin. 1987. Analbuminaemia: a natural model of metabolic compensatory systems. J. Inher. Metab.
17. Rabelink, A. J., R. J. Hen&, D. W. Erkelens, J. A. Joles, and H. A. Koomans. 1988. Effects of symvastatin and cho- lestyramine on lipoprotein profile in hyperlipidaemia of neDhrotic svndrome. Lancet. ii: 1335-1338.
234-239.
DiS. 10: 317-329.
18.
19.
20.
21.
22.
23.
24.
25.
26.
27.
28.
29.
30.
31.
Golper, T. A., R. Illingworth, C. D. Morris, and W. M. Bennett. 1989. Lovastatin in the treatment of multifactorial hyperlipidemia associated with proteinuria. Am. J. Kidney Dis. 13: 312-320. Weisweiler, P. 1988. Simvastatin and bezafibrate: effects on serum lipoproteins and 1ecithin:cholesterol acyltransferase activity in familial hypercholesterolemia. Eur. J. Clin. Pharmacol. 35: 579-583. Dallinga-Thie, G. M., P. H. E. Groot, and A. Van To]. 1985. Electroimmunoassay of rat apolipoproteins A-I, A-IV, and E. A procedure for sample treatment to increase the sensitivity in diluted fractions. J Lipid Res. 26: 889-892. Albers, J. J., V. G. Cabana, and W. R. Hazzard. 1975. Im- munoassay of human plasma apolipoprotein B. Metabolism.
Van 't Hooft, F. M., and A. Van Tol. 1985. The sites of degradation of purified rat low density lipoprotein and high density lipoprotein in the rat. Biochim. Biophys. Acta. 836: 344-353. Glomset, J. A., and J. L. Wright. 1964. Some properties of a cholesterol esterifying enzyme in human plasma. Biochim. Biophys. Acta. 89: 266-276. Van To], A., L. M. Scheek, and J. E. M. Groener. 1991. Net mass transfer of cholesteryl esters from low density lipo- proteins to high density lipoproteins in plasma from normolipidemic subjects. Atherosclet: Thromb. 11: 55-63. Redgrave, T. G., D. C. K. Roberts, and C. E. West. 1975. Separation of plasma lipoproteins by density-gradient ultracentrifugation. Anal. Biochem. 65: 42-49. Joles, J. A., E. H. J. M. Jansen, C. A. Laan, N. Willekes- Koolschijn, W. Kortlandt, and H. A. Koomans. 1989. Plasma proteins in growing analbuminemic rats fed on a diet of low-protein content. Br. J. Nutt: 61: 485-494. Van Gent, T., and A. Van Tol. 1990. Automated gel perme- ation chromatography of plasma lipoproteins by prepara- tive fast protein liquid chromatography. J Chromatogt: 525:
Snedecor, G. W., and W. G. Cochran. 1979. Statistical Methods. Iowa State University Press, Ames, IA. Chapters 10/11. Chapman, M. J. 1980. Animal lipoproteins: chemistry, structure, and comparative aspects. J. Lipid Res. 21:
Lusk, L. T., L. F. Walker, L. H. Dubien, and G. S. Getz. 1979. Isolation and partial characterization of high-density lipoprotein (HDLI) from rat plasma by gradient ultracen- trifugation. Biochem. J 183: 83-90. Dallinga-Thie, G. M., V. L. M. Schneijderberg, and A. Van Tol. 1986. Identification and characterization of rat serum lipoprotein subclasses. Isolation by chromatography on
24: 1339-1351.
433-441.
789-855.
Van Tol et al. Effects of pravastatin on plasma lipoproteins and LCAT in analbuminemic rats 1727
by guest, on July 10, 2011w
ww
.jlr.orgD
ownloaded from
agarose columns and sequential immunoprecipitation. J. Lipid Res. 27: 1035-1043.
32. Groener, J. E. M., T. Van Gent, and A. Van To]. 1989. Effect of lipid transfer protein on plasma lipids, apolipo- proteins and metabolism of high-density lipoprotein cho- lesteryl ester in the rat. Biochim. BiophyJ. Acta. 1002: 93-100.
33. Davies, R. W., I. Staprans, E N. Hutchison, and G. A. Kaysen. 1990. Proteinuria, not altered albumin metabo- lism, affects hyperlipidemia in the nephrotic rat. J. Clin. Invest. 86: 600-606.
34. Klibansky, C., and A. de Vries. 1963. Quantitative study of erythrocyte-lysolecithin interaction. Biochim. Biophys. Acta. 70: 176-187.
35. Sugiyama, K., T. Emori, S. Shumiya, and S. Nagase. 1984. Anemia and potassium permeability of red blood cells in
analbuminemic rats. E.$. Anim. 33: 307-318. 36. Yoshino, G., T. Kazumi, T. Kasama, M. Iwai, I. Iwatani,
K. Matsuba, M. Matsushita, and S. Baba. 1988. Effect of CS-514 (pravastatin) on VLDL-triglyceride kinetics in rats. Atherosclerosis. 73: 191-195.
37. Tsujita, Y., M. Kuroda, K. Tanzawa, M. Arai, I. Kaneko, M. Tanaka, H. Masuda, C. Tarumi, Y. Watanabe, and S. Fujii. 1986. CS-514, a competitive inhibitor of 3-hydroxy-3- methylglutaryl coenzyme A reductase: tissue selective in- hibition of sterol synthesis and hypolipidemic effect on vari- ous animal species. Biochim. Biophys. Acta. 877: 50-60.
38. Vega, G. L., R. M. Krauss, and S. M. Grundy. 1990. Pravastatin therapy in primary moderate hypercholester- olaemia: changes in metabolism of apolipoprotein B- containing lipoproteins. J. Znt. Med. 227: 81-94.
1728 Journal of Lipid Research Volume 32, 1991
by guest, on July 10, 2011w
ww
.jlr.orgD
ownloaded from


