Embed Size (px)
Citation preview
GZAGeolinvironmcrital, Inc.
Engf~ineers and
Scientists
January 7,2008File No. 41.0017869.10
Mr. Robert EversEnercon Services, Inc.Indian Point Energy Center450 BroadwayBuchanan, NY 10511-0308
Subject: Hydrogeologic Site Investigation ReportIndian Point Energy CenterBuchanan, New York
One dgmwter Drive
Norwowod
Massachusetts
02062
781-278-3700
FAX 781-278.5701www'€,.gzwa.to m
Dear Mr. Evers:
GZA GeoEnvironmental, Inc. (GZA) is pleased to provide the attached HydrogeologicSite Investigation Report for the Indian Point Energy Center. The report provides asummary of the investigative methods, findings/conclusions and recommendations forwork conducted from September 2005 through thie end of September 2007.
If you have any questions, please contact either David or Matt.
GZA appreciates the opportunity to provide continued support to Enercon Services andEntergy.
Sincerely,
GZA GEOENVIRONMENTAL, INC.
David M. Winslow, Ph.D., P.G. Matthew J. Barvenik, LSPAssociate Principal Senior Principal
Mi•hael Powers, P.E.Stenor Principal
An FcjunI OIpporrunuy F.inployer NU/V/H
TABLE OF CONTENTS
X (- 1TIVIV ',TTMM4ARV Vi;11..............................................................
1.0
!.1
1.2
2.0
INTRODUCTION ....................... o ................. 1
PURPOSE .................................. ......................................................................................... I
BACKGRO UND .................................................................................................................... 2
SCOPE OF SERVICES ............................................................. 6
2.1 PHASE I. .............. ............................................ o ................................................ 6
2.2 PHA SE II ................................................................................... . ............................................. 7
2.3 PHASE Ill ................................................................................................................................... 8
3.0 CONCEPTUAL HYDROGEOLOGIC MODEL ....................... 9
3.1 HFYDROGEOLOGIC SETTING ................................. 10
3.2 GENERAL GROUNDWATER FLOW PATTERNS .................................................... 10
3.3 IDENTIFIED CONTAMINANT SOURCES ............................ .................................... 11
3.4 CONTAMINANTS OF INTEREST ............ ......................................................................... I I
3.5 IDENTIFIED RECEPTORS ...................................... . ....................................................... 12
4.0 FIELD INVESTIGATIONS ....... 15
4.1 GEOLOGIC RECONNAISSANCE ............................. 16
4.24.2.14.2.24.2.34.2.4
TEST DRILLING .... ........... ............ ....................................... ................. 7..................... A17Bedrock Borings ........................................ .............................................................................. 19Overburden Borings ............................................................................................................ 21Borehole Developm ent ....................................................................................................... 22Borehole Geophysical Analysis .......................................................................................... 22
4.3 W ELL INSTA LLATIO NS ................................................ .. ............................................ 234.3.1 Bedrock W ells ......................................................................................................................... 234.3.1.1 Open Rock W ells .......................................................................................................... 234.3.1.2 W aterloo M ulti-Level Completion W ells .................................................................... 244.3.1.3 Nested W ells ........................................................................................................................ 264.3.2 Overburden W ells ...................................................................................... .............................. 264.3.3 W ellhead Completion ........................................................................................................ 274.3.4 W ell Nom enclature .......................................................................................................... .274.3.5 W ellhead Elevation Surveying ....... ............................................................................... 28
1
4.4 HYDRAULIC TESTING ................................................................................................. 284.4.1 Short Duration Specific Capacity Tests .............................................................................. 284.4.2 Rising Head Hydraulic Conductivity Tests ....................................................................... 294.4.3 Bedrock Packer Extraction Hydraulic Conductivity Testing ............................................ 304.4.4 Pumping Test ........................................................................................................... 33
4.5 WATER SAMPLING .......................................................................................................... 354.5.1 On-SiteGroundwater Sampling ............................................................................................... 354.5.1.1 Purging ..................................... . . ........... 364.5.1.2 Low Flow Sampling ....................................................................................................... 364.5.1.3 Waterloo Low Flow Sampling...................................................................................... 374.5.1.4 Discrete Interval Packer Sampling ............................................................................... 374.5.2 On-Site Surface Water Sampling ......................................... 374.5.3 Off-Site Groundwater Sampling ...................................................................................... 384.5.4 Off-Site Surface Water Sampling ....................................................................................... 38
4.6 PIEZOMETRIC LEVELS AND PRESSURE TRANSDUCER DATA ............................ 39.4.6.1 Transducer Types and Data Retrieval................................................................................. 394.6.2 Data Availability and Preservation ..................................................................................... 40
4.7 TRACER TESTING ............................................................................................................... 404.7.1 Injection W ell Construction ................................................................................................ 414.7.2 Background Sampling ................................................ 414.7.3 Sam pling Stations............................................................................... 414.7.4 A nalysis Schedule ................................................................................................................... 42
4.8 ADDITIONAL GEOPHYSICAL TESTING TO EVALUATE FLOW PATHS ............. 42
5.0 LABORATORY TESTING ..................................................... 44
5.1 RADIOLOGICAL .................................................................................................................... 445.1.1 Hydrogeologic Site Investigation Analytical Data ............................................................ 44
5.2 ORGANIC TRACER ................................................................................................................ 46
5.3 WATER QUALITY PARAMETERS ................................................................................ 46
6.0 HYDROGEOLOGIC SETTING .............................................. 476.1 REGIONAL S TNG.. .- . . . . . . .476.1 REGIONA SETTING ........... .... ;............... .............. . ............................................................. 4
6.2 GROUNDWATER RECHARGE ................................................................................. 4 ......... 47
6.3 GROUNDWATER DISCHARGE ............... ....................................................................... 48
6.4 GEOLOGY ............................................................................................................................... 496.4.1 O verburden G eology ..............................................................................................................64.2 Bedrock G eology ............................................. ................................... ............................... 506.4.3 Groundwater in Bedrock ................................................................................................... 526.4.4 Regional Scale Geostructure .............................................................................................. 536.4.5 Site Scale G eostructure ...................................................................... ................................ 536.4.6 Borehole Scale Geostructure ............................................................................................. 536.4.7 G eologic Faults 55.................................................................................................................. 55
.6.4.8 Bedrock Structure Visualization ......................................... ................................................. 56
ii
6.4.9 Bedrock Surface Elevations and Preferential Groundwater Flow Pathways ....................... 57
6.5 AQUIFER PROPERTIES ................................................................................................... 586.5.1 Hydraulic Conductivity ..................................................... 596.5.2 Eff ective Porosity .................................................................................................................... 61
6.6 TIDAL INFLUENCES....................................................................... .................................. 626.6.1 G roundw ater Levels ............................................................................................................... 636.6.2 Groundwater Temperature ................................................................................................... 656.6.2.1 M onitoring W ell M W -38 .............................................................................................. 666.6.2.2 Monitoring Well MW-48 ............................................ 676.6.3 Aqueous Geochemistry ... .......... I .................................. 706.6.3.1 Sampling .............................................................................................................. 716.6.3.2 W ater Q uality Evaluation ................................................................................................... 71
6.7 GROUNDWATER FLOW PATTERNS ......................................................................... 726.7.1 Groundwater Flow Direction ............................................................................................. 736.7.2 G roundwater Flow Rates .................................................................................................... 746.7.2.1 Seepage Velocities ....................................................................................................... 746.7.2.2 Groundwater Flux ............................................................................................. 75
7._0 GROUNDWATER TRACER TEST RESULTS ....................... 79
7.1 TRACER INJECTION ................................................................. .............................. 79..........79
7.2 TRACER CONCENTRATION MEASUREMENTS ..................................................... 81
7.3 SPATIAL DISTRIBUTION AND EXTENT OF FLUORESCEIN IN GROUNDWATER81
7.4 TEMPORAL DISTRIBUTION OF FLUORESCEIN IN GROUNDWATER ................... 84
7.5 FLUORESCEIN IN DRAINS, SUMPS AND THE DISCHARGE CANAL ....................... 87
7.6 M AJOR FINDINGS ................................................................................................................ 88
8.0 CONTAMINANT SOURCES AND RELEASE MECHANISMS. 89
8.1 UNIT 2 SOURCE AREA .......................................................................................................... 908.1.1 Direct Tritium Sources ................................................ 928.1.2 Indirect Storage Sources of Tritium ....................................... ........................................ 97
8.2 UNIT I SOURCE AREA ......................................... I01
9.0 GROUNDWATER CONTAMINATION FATE ANDTRANSPORT .................................................................... ............ 114
9.1 AREAL EXTENT OF GROUNDWATER CONTAMINATION .................................... 115
9.2 DEPTH OF GROUNDWATER CONTAMINATION ....................... 115
9.3 UNIT 2 TRITIUM PLUME BEHAVIOR ......................................... ................................. 1159.3.1 Short Term Tritium Fluctuations .......................................................................................... 1189.3.2 Long Term Variations in Tritium Concentrations ................................................................. 120
iii
9.49.4.19.4.2
UNIT I STRONTIUM PLUME BEHAVIOR ...................................................................... 122Short Term Strontium Concentrations .............. ........................................................... 124Long Term Variations in Strontium Groundwater Variations ............................................... 124
10.0 FINDINGS AND CONCLUSIONS ..................................... .... 127
10.1 NATURE AND EXTENT OF CONTAMINANT MIGRATION ................... 127
10.2 SOURCES OF CONTAMINATION ................... ................................................................. 128
10.3 GROUNDWATER CONTAMINANT TRANSPORT ......................................................... 130
10.4 GROUNDWATER MASS FLUX CALCULATIONS ....................... 131
10.5 GROUNDWATER MONITORING ...................................................................................... 132
10.6 COMPLETED VQQ !1 "2"•................................................. .... .............................. a.
11.0 RECOMMENDATIONS ..... VIA.... ... ... ... .... ... ... ... .... ... ... ... I"•A
TABLES
TABLE 4.1
TABLE 4.2TABLE 4.3TABLE 4.4TABLE 4.5TABLE 5.1TABLE 6.1
FIGURES
FIGURE 1. 1FIGURE 1.2FIGURE 1.3FIGURE 3.1FIGURE 3.2FIGURE 3.3FIGURE 3.4FIGURE 4.1FIGURE 4.2FIGURE 4.3FIGURE 4.4FIGURE 6.1FIGURE 6.2
SUMMARY OF WELL LOCATIONS AND INSTALLATIONDEPTHSWELL NOMENCLATUREWELL HEAD ELEVATION CHANGESHYDRAULIC CONDUCTIVITY ESTIMATESTRANSDUCER INFORMATIONGROUNDWATER ANALYTICAL DATAGROUNDWATER ELEVATIONS
SITE LOCUS PLANSITE PLANEXPLORATION LOCATION AND DATA SUMMARY PLANWATERSHED BOUNDARY MAPREGIONAL TOPOGRAPHYREGIONAL GROUNDWATER FLOWCONTAMINANT SOURCE MAPPNEUMATIC SLUG TEST MANIFOLD SCHEMATICPACKER TEST ASSEMBLAGE SCHEMATICUSGS WELL LOCATION MAPRESERVOIR LOCATION MAPGROUNDWATER/SURFACE WATER INTERFACESITE AREA USGS GEOLOGIC MAP
iv
FIGURE 6.3FIGURE 6.4FIGURE 6.5FIGURE 6.6FIGURE 6.7FIGURE 6.8FIGURE 6.9FIGURE 6.10
FIGURE 6.11
FIGURE 6.12
FIGURE 6.13FIGURE 6.14FIGURE 6.15
FIGURE 6.16
FIGURE 6.17FIGURE 6.18
FIGURE 6.19
FIGURE 6.20
FIGURE 7. 1FIGURE 7.2
FIGURE 7.3
FIGURE 8.1FIGURE 8.2FIGURE 8.3
FIGURE 9.1FIGURE 9.2FIGURE 9.3FIGURE 9.4
APPENDICES
APPENDIX AAPPENDIX BAPPENDIX C
SITE UNCONSOLIDATED GEOLOGIC MAPSITE GEOLOGICAL MAPREGIONAL LINEAMENT MAPSITE LINEAMENT MAPPOLAR PROJECTIONSPROFILE LOCATIONSFRACTURE PROFILE PROJECTIONSTRANSMISSIVE FRACTURE LOCATIONS LOWTRANSMISSIVITYTRANSMISSIVE FRACTURE LOCATIONS MODERATETRANSMISSIVITYTRANSMISSIVE FRACTURE LOCATIONS HIGHTRANSMISSIVITYFRACTURE STRIKE ORIENTATION AT ELEVATION 10FRACTURE STRIKE ORIENTATION AT ELEVATION -100AMBIENT AND PUMPING GROUNDWATER CONTOURSWITH TIDAL RESPONSE AND TEMPERATURESTIFF DIAGRAMS OF MW-38, MW-48, HUDSON RIVER, ANDDISCHARGE CANALSHALLOW GROUNDWATER CONTOURSUNITS 1 AND 2 HYDROLOGIC CROSS SECTIONS A-A' ANDB-B'SHALLOW GROUNDWATER CONTOUR MAP WITHSTREAMTUBESDEEP GROUNDWATER CONTOUR MAP WITHSTREAMTUBESSCHEMATIC OF INJECTION WELL LOCATION AND DESIGNBOUNDING TRACER (FLUORESCEIN) CONCENTRATIONISOPLETHS' IN GROUNDWATERCURRENT TRACER (FLUORESCEIN) CONCENTRATIONISOPLETHS'IN GROUNDWATERBOUNDING UNIT 2 ACTIVITY ISOPLETHSBOUNDING UNIT I ACTIVITY ISOPLETHSBOUNDING CESIUM (Cs), COBALT (Co) AND NICKEL (Ni)ACTIVITY IN GROUNDWATERUNIT 2 TRITIUM PLUME CROSS SECTION A-A'UNIT I STRONTIUM PLUME CROSS SECTION B-B'CURRENT UNIT 2 ACTIVITY ISOPLETHSCURRENT UNIT I ACTIVITY ISOPLETHS
LIMITATIONSBORING LOGSGEOPHYSICAL BOREHOLE LOGS
V
APPENDIX DAPPENDIX EAPPENDIX FAPPENDIX GAPPENDIX HAPPENDIX IAPPENDIX JAPPENDIX KAPPENDIX LAPPENDIX MAPPENDIX NAPPENDIX 0APPENDIX PAPPENDIX QAPPENDIX RAPPENDIX S
WELL CONSTRUCTION LOGSSURVEY RESULTSSPECIFIC CAPACITY TEST LOGSHYDRAULIC CONDUCTIVITY CALCULATIONSSLUG TEST FIELD LOGSPACKER TEST FIELD LOGSLOW FLOW SAMPLING LOGSCD WITH PIEZOMETRIC DATAHYDROGRAPHSTRANSDUCER INSTALLATION LOGSORGANIC TRACER TEST RESULTSSURFACE GEOPHYSICAL SURVEY REPORTSOUL PROCEDURES AND CRITERIAFRACTURE SET DATABASEGROUNDWATER CONTOUR MAPSRAINFALL MODEL FLUX CALCULATIONS
Vi
ACRONYMS
ADT Aquifer Drilling and TestingAGS Advanced Geological ServicesALARA As Low As Reasonably AchievableAREOR Annual Radiological Environmental Operating ReportATV Acoustical TeleviewerCSS Containment Spray SumpCSB Chemical Systems BuildingCSM Conceptual Site ModelEPA Environmental Protection AgencyEVS Environmental Visualization SoftwareGA Geophysical Applications, Inc.GPR Ground Penetrating RadarGZA GZA GeoEnvironmental, Inc.IP Indian PointIP1-CSB Indian Point Unit I Chemical Systems BuildingIPI-FHB Indian Point Unit I Fuel Handling BuildingIPI-SFDS Indian Point Unit I Sphere Foundation Drain SumpIPI-SFPS Indian Point Unit I Spent Fuel PoolIPI-CB Indian Point Unit I Containment BuildingIP2-FSB Indian Point Unit 2 Fuel Storage BuildingIP2-PAB Indian Point Unit 2 Primary Auxiliary BuildingIP2-SFP Indian Point Unit 2 Spent Fuel PoolSIP2-TB Indian Point Unit 2 Turbine Generator BuildingIP2-TY Indian Point Unit 2 Transformer YardIP2-VC Indian Point Unit 2 Vapor ContainmentK Hydraulic ConductivityNGVD 29 National Geodetic Vertical Datum of 1929NYSDEC New York State Department of Environmental ConservationMGM Million Gallons per MinuteMNA Monitored Natural AttenuationMW Monitoring WellNEl Nuclear Energy InstituteNCD North Curtain DrainNRC Nuclear Regulatory CommissionOCA Owner Controlled AreaOTV Optical TeleviewerRWST Reactor Water Storage TankRQD Rock Quality DesignationSFDS Sphere Foundation Drain SumpSFP Spent Fuel PoolSOP Standard Operating ProcedureSSC Structures, Systems and ComponentsTGB Turbine Generator BuildingTY Transformer YardUSGS United States Geological SurveyVC Vapor Containment
vii
EXECUTIVE SUMMARY
Gin"
This report presents the results of a two-year comprehensive hydrogeologic siteinvestigation of the Indian Point Energy Center (Site) conducted by GZAGeoEnvironmental, Inc. (GZA). The study was initiated in response to an apparentrelease of Tritium to the subsurface, initially discovered in August of 2005 during Unit2 construction activities associated with the Independent Spent Fuel Storage InstallationProject. These investigations were subsequently expanded to include areas of the Sitewhere credible potential sources of leakage might exist, and encompassed all threereactor units. Ultimately, these investigations traced the contamination back to twoseparate structures, the Unit 2 and Unit I Spent Fuel Pools (SFPs). The twocommingled plumes, resulting from these SFPs releases, have been fully characterizedand their extent, activity and impact determined. The two primary radionuclidecontaminants of interest were found to be Tritium and Strontium. Other contaminants,Cesium, Cobalt, and Nickel, have been found in a subset of the groundwater samples,but always in conjunction with Tritium or Strontium. Therefore, while the focus of theinvestigation was on Tritium and Strontium, it inherently addresses the full extent ofgroundwater radionuclide contamination. The investigations have further shown thatthe contaminated groundwater can not migrate off-property to the North, East or South.The plumes ultimately discharge to the Hudson River to the West.
Throughout the two years of the investigation, the groundwater mass flux andradiological release to the Hudson River have been assessed. These assessments, alongwith the resulting Conceptual Site Model, have been used by Entergy to assess doseimpact. At no time have analyses of existing Site conditions yielded any indication ofpotential adverse environmental or health risk. In fact, radiological assessments haveconsistently shown that the releases to the environment are a small percentage ofregulatory limits.
SOURCES OF CONTAMINATION
As stated above, the investigations found that the groundwater contamination is theresult of releases from the Unit 2 and the Unit 1 SFPs. Our studies found no evidenceof any release from Unit 3.
The predominant radionuclide found in the plume from the Unit 2 SFP pool is Tritium.The releases were due to: 1) historic damage in 1990 to the SFP liner, with subsequentdiscovery and repair in 1992; and 2) a weld imperfection in the stainless steel TransferCanal liner identified by Entergy in September 2007, and repaired in December 2007.To the extent possible, the Unit 2 pool liner has been fully tested and repairs have beencompleted. The identified leakage has therefore been eliminated and/or controlled byEntergy. Specifically, Entergy has: 1) confirmed that the damage to the liner associatedwith the 1992 release was repaired by the prior owner and is no longer leaking; 2)installed a containment system (collection box) at the site of the leakage discovered in2005, which precludes further release to the groundwater; and 3) after an exhaustive
viii
liner inspection, identified a weld imperfection in the Transfer Canal liner that was thenprevented from leaking by draining the canal. The weld was then subsequently repairedby Entergy in mid-December 2007. Therefore, all identified Unit 2 SFP leaks have beenaddressed. Water likely remains between the Unit 2 SFP stainless steel liner and theconcrete walls, and thus additional active leaks can not be completely ruled out.However, if they exist at all, the data indicate they must be small and of little impact tothe groundwater.
The Unit I plume is characterized by Strontium from legacy leakage of the Unit I fuelpools. At present, the Unit I pools have been drained with the exception of the Unit 1West Fuel Pool which still contains spent fuel. This West Pool leaks water under thefuel building and is responsible for the Unit 1 Strontium groundwater plume discoveredin 2006. Prior to that time, the previous owner had identified leakage from the WestFuel Pool in the 1990's and was managing the leakage by collecting it from a re-configured footing drain that surrounded the fuel building. However, based on thegroundwater investigation, it has been determined that the pool leakage managementprogram was not successful in collecting all of the leakage. As a result, uncollectedcontaminants released from the Unit 1 Spent Fuel Pools, past and present, have beenobserved during the groundwater investigation effort at various locations near the site ofUnit 1. In response to the finding that the leak collection system was not functioning asbelieved, Entergy promptly initiated a program to reduce the concentration ofradionuclides in the Unit 1 West Pool's water, beginning in April 2006, via enhanceddemineralization water treatment. The planned fuel removal and pool draining willcompletely eliminate this release source by year end 2008.
EXTENT OF CONTAMINATION
The groundwater contamination is, and will remain, limited to the Indian Point EnergyCenter property, because the migration of Site contaminants is controlled bygroundwater flow, which, in turn, is governed by the post-construction hydrogeologicsetting. Plant construction required reduction in bedrock surface elevations andinstallation of foundation drains. These man-made features have lowered thegroundwater elevations beneath the facility, redirecting groundwater to flow to the Westtowards the Hudson River; and not to the North, East or South. Because of the natureand age of the releases, groundwater contaminant migration rates, and interdictions byEntergy to eliminate/control releases, the groundwater contaminant plumes havereached their maximum spatial extent and should now decrease over time.
LONG TERM MONITORING
Long term groundwater monitoring is ongoing; a network of multi-level groundwatermonitoring installations has been established at the facility. These "wells" are locateddowngradient of, and in close proximity to, both existing and potential releaselocations. Groundwater testing is performed quarterly on the majority of these wells,with the rest remaining on standby to provide added detail, if required. The resultinginformation is provided on a yearly basis to the Nuclear Regulatory Commission
ix
(NRC). The information is used to assess changes in groundwater relative to doseimpact assessment and to detect future releases, should they occur.
In addition to the groundwater samples from the network of monitoring wells, Entergyobtained various off-Site samples of environmental media including off-Site wells,reservoirs and the Hudson River. In addition, Entergy participated in a fish samplingprogram with the NRC and New York State Department of Environmental Conservation(NYSDEC). None of the samples analyzed, including the samples split with regulatoryagencies, detected any radioactivity in excess of environmental background levels.
GZA believes that the recommended remediation technology discussed below will causethe concentrations of radionuclides in the groundwater plumes to decrease over time.The continued monitoring of groundwater is expected to demonstrate that trend andsupport the conclusion that the identified leaks have been terminated. However, GZAexpects that contaminant concentrations will fluctuate over time due to naturalvariations in groundwater recharge and that a potential future short term increase inconcentrations does not, in and of itself, indicate a new leak. It is further emphasizedthat the groundwater releases to the river are only a small percentage of the regulatorylimits, which are of no threat to public health.
PROPOSED REMEDIATION
GZA has recommended the following corrective measures to Entergy, which they areimplementing:
1. Repair the identified Unit 2 Transfer Canal liner weld imperfection (completedDecember 2007).
2. Continue source term reduction in the Unit I West Pool via the installeddemineralization system (ongoing until completion. of No. 3 below).
3. Remove the remaining Unit 1 fuel and drain the West Pool (in-process).4. Implement long term groundwater monitoring (in-process).
The proposed remediation technology is source elimination/control (Nos. I and 3above) with subsequent Monitored Natural Attenuation, or MNA. MNA is a recognizedand proven remedial approach that allows natural processes to reduce contaminantconcentrations. The associated monitoring is intended to verify that reductions areoccurring in an anticipated manner. The Indian Point Energy Center Site is well suitedfor this approach because: 1) interdictions to eliminate or reduce releases have beenmade; 2) the nature and extent of contamination is known; 3) the contaminant plumes.have reached their maximum extent; and 4) the single receptor of the contamination, theHudson River, is monitored, with radiological assessments consistently demonstratingthat the releases to the environment are a small percentage of regulatory limits, and nothreat to public health or safety.
x
1.0 INTRODUCTION
This report presents the results of hydrogeological studies performed byGZA GeoEnvironmental, Inc. (GZA) at the Indian Point Energy Center (IPEC) inBuchanan, New York (Site). See Figure 1.11 for a Locus Plan. The report was prepared byGZA under the terms of an agreement with Enercon Services, Inc. for Entergy NuclearNortheast, and describes services completed between September 2005 (the beginning ofour services) and September 2007.
Our investigations were conducted in a cooperative and open manner. Entergy providedfull and open access and there were regular and frequent meetings with representatives ofthe United States Nuclear Regulatory Commission (NRC), the United States GeologicalSurvey (USGS), and the New York State Department of Environmental Conservation(NYSDEC). Further, we presented our preliminary findings at a number of externalstakeholder and public meetings.
From the onset of the investigations, GZA routinely computed the groundwater mass flux2
and associated radiological release to the Hudson River. Using these data, the potentialimpacts of releases to the river were assessed by Entergy and compared to existingregulatory thresholds. At no time did these analyses yield any indication of potentialadverse environmental or health risk as assessed by Entergy as well as the principalregulatory authorities. In fact, radiological assessments have consistently shown that thereleases to the environment are a small percentage of regulatory limits, and no threat topublic health or safety. In this regard, it is also important to note that the groundwater isnot used as a source of drinking water on or near the Site.
This report documents two years of comprehensive hydrogeological investigations.The text of the report describes Site conditions, GZA's investigations, and findings, andpresents conclusions and recommendations. Supporting information is provided in tables,on figures and in appendices. To understand how we formed our opinions, it is importantto review the report in its entirety, including Appendix A Limitations.
1.1 PURPOSE
The overall purpose of our services was to identify the nature and extent of radiologicalgroundwater contamination that originates at IPEC, and assess the hydrogeologicalimplications of that contamination. More specifically, our objectives were to:
• Identify the nature and extent of radiological groundwater contamination;° Establish the sources of the radiological groundwater contamination:
Figures referenced by specific number are contained as full size drawings in Volume 3 of this report. Additionalsmaller scale figures, photographs, etc. are embedded within the text for immediate reference.2 Flux (or mass flux) is defined as the amount of groundwater that flows through a unit subsurface area per unit time.
1
- Evaluate the mechanisms controlling the groundwater transport of radiologicalcontamination;
• Estimate both the mass of groundwater transporting contaminants, and theradiological activity associated with these contaminant pathways;
* Develop a groundwater monitoring network that addresses IPEC's short term andlong term needs, and is consistent with the Nuclear Energy histitute's (NEI's)Groundwater Protection Initiative; and
* Recommend, as required, appropriate remedial measures.
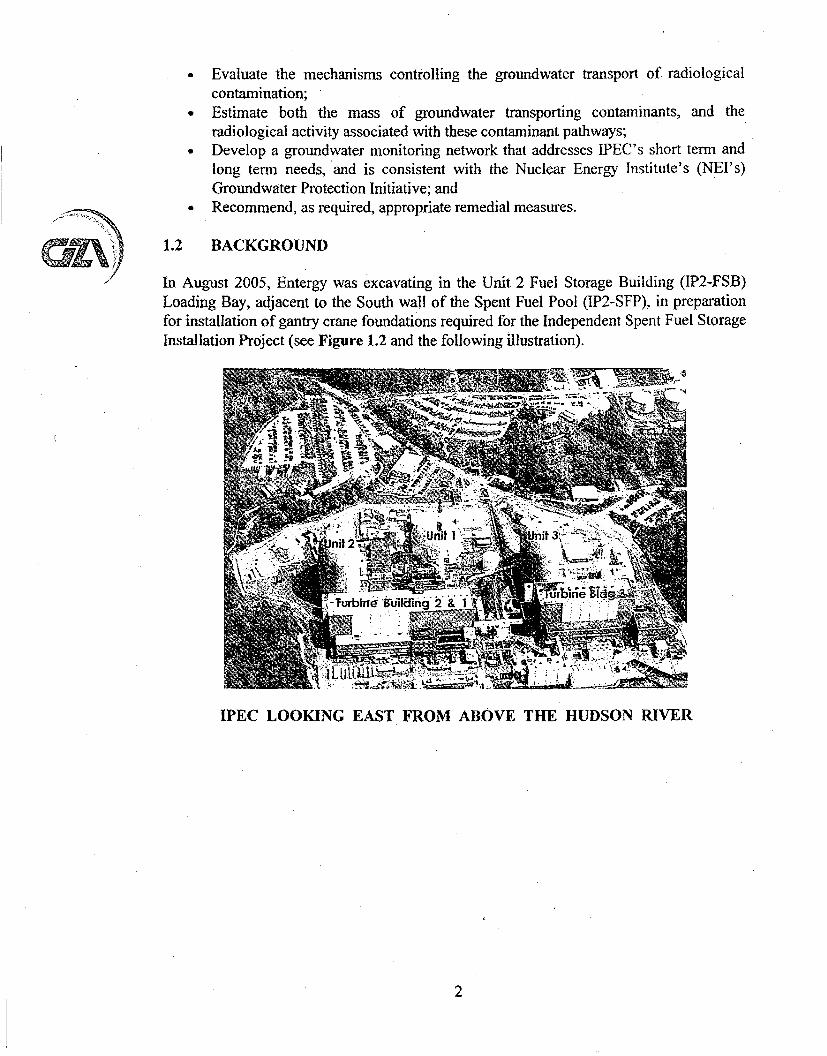
1.2 BACKGROUND
In August 2005, Entergy was excavating in the Unit 2 Fuel Storage Building (IP2-FSB)Loading Bay, adjacent to the South wall of the Spent Fuel Pool (IP2-SFP), in preparationfor installation of gantry crane foundations required for the Independent Spent Fuel StorageInstallation Project (see Figure 1.2 and the following illustration).
//
IPEC LOOKING EAST FROM ABOVE THE HUDSON RIVER
2
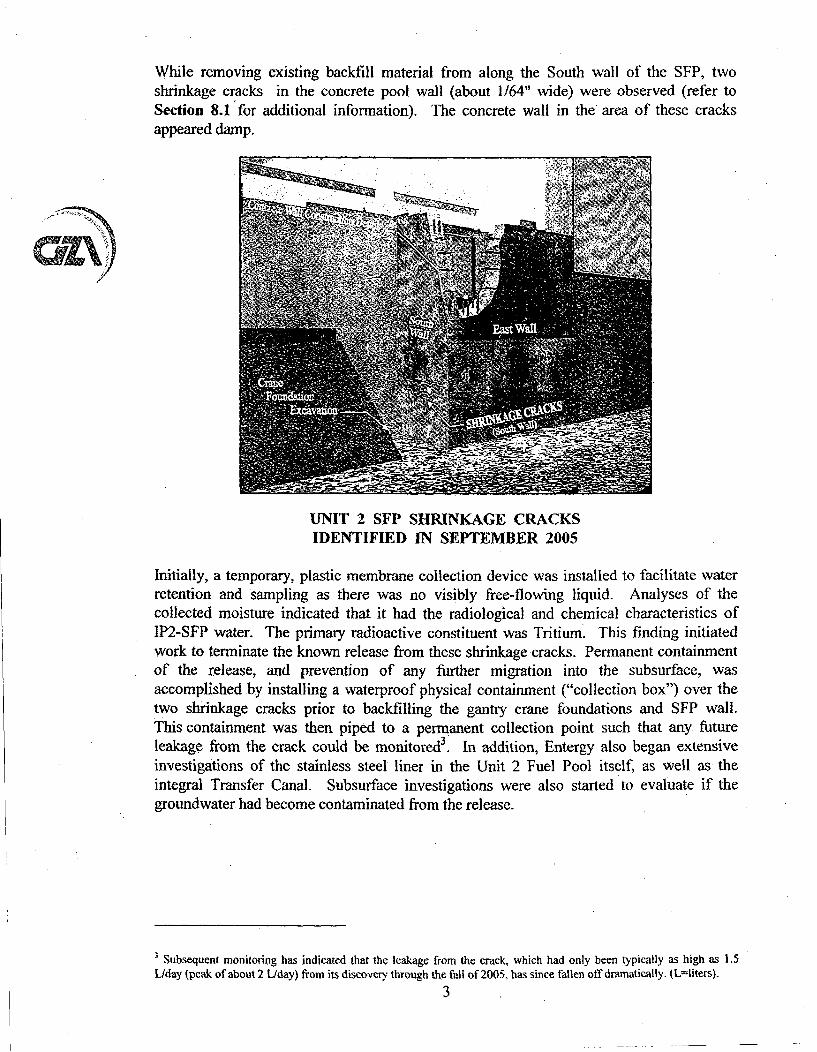
While removing existing backfill material from along the South wall of the SFP, twoshrinkage cracks in the concrete pool wall (about 1/64" wide) were observed (refer toSection 8.1 for additional information). The concrete wall in the area of these cracksappeared damp.
77 -
UNIT 2 SFP SHRINKAGE CRACKSIDENTIFIED IN SEPTEMBER 2005
Initially, a temporary, plastic membrane collection device was installed to facilitate waterretention and sampling as there was no visibly free-flowing liquid. Analyses of thecollected moisture indicated that it had the radiological and chemical characteristics of1P2-SFP water. The primary radioactive constituent was Tritium. This finding initiatedwork to terminate the known release from these shrinkage cracks. Permanent containmentof the release, and prevention of any further migration into the subsurface, wasaccomplished by installing a waterproof physical containment ("collection box") over thetwo shrinkage cracks prior to backfilling the gantry crane foundations and SFP wall.This containment was then piped to a permanent collection point such that any futureleakage from the crack could be monitored3. In addition, Entergy also began extensiveinvestigations of the stainless steel liner in the Unit 2 Fuel Pool itself, as well as theintegral Transfer Canal. Subsurface investigations were also started to evaluate if thegroundwater had become contaminated from the release.
Subsequent monitoring has indicated that the leakage from the crack, which had only been typically as high as 1.5L/day (peak of about 2 Llday) from its discovery through the fall of 2005, has since fallen off dramatically. (L=liters).
3
As part of these early investigations, Entergy sampled groundwater on September 29, 2005from a nearby existing downgradient monitoring well, MW-I 11. This monitoring well islocated between the IP2-SFP and the downgradient Hudson River to the West (see Figure1.3 for well location). The analysis results, reported on October 5, 2005, indicated anelevated Tritium concentration. The elevated Tritium in MW-I II was consistent with arelease from the shrinkage cracks that had migrated into the on-Site groundwater. Entergytherefore began an extensive investigation to understand the extent of the Unit 2groundwater contamination and potential impacts to the environment.
Although the early subsurface investigations were focused primarily on potential sources ofcontamination, the project team also reviewed: regional hydrogeological information,plant design/construction details, and available Site-specific groundwater monitoringresults. This early work led to three conclusions:
* The recently identified shrinkage cracks had resulted in releases of Tritium to thegroundwater;
* It was unlikely that contaminated groundwater was migrating off-property to theNorth, East or South; and
• Tritium-contaminated groundwater likely had, and would continue to, migrate tothe Hudson River to the West.
In response to these three early conclusions, Entergy tasked GZA with developing anetwork of groundwater monitoring wells. The primary objectives for this network were tofacilitate comprehensive investigation of the IP2-SFP Tritium. release location, as well asevaluate the potential for releases at other locations across the Site. Additional objectivesincluded:
• Monitoring of the southern boundary of the Site (previously identified by others asdowngradient);
• Monitoring attenuation of the contaminant plume(s) identified on-Site;° Early detection of leaks in areas of ongoing active operations, should they occur in
the future; and• Monitoring of the groundwater adjacent to the Hudson River to provide the
required groundwater data for Entergy's radiological impact evaluations.
The groundwater monitoring network ultimately developed by GZA, and supported byEntergy, was comprised of shallow and deep installations at 59 monitoring locations.These installations were completed in both soil overburden and bedrock The installations.generally include multi-level instrumentation which allows acquisition of depth-discretegroundwater samples and automatic recording of depth-specific groundwater elevations viaelectronic pressure transducers. The wells were drilled in a phased manner, with resulting
4
data being used to modify and guide the work of subsequent investigations. This iterativeprogression is in accordance with the Observational Method4 approach (see Section 2.0).
During the course -of the expanded investigations in 2006, Strontium-90 was detected in,and downgradient of, the western portion of the Unit 2 Transformer Yard (IP2-TY). Whilethe transformer yard is located immediately downgradient of the Unit 2 Spent Fuel Pool(IP2-SFP), the source of this Strontium in the groundwater could not reasonably beassociated with a release from the IP2-SFP. This conclusion was particularly appropriatewhen evaluated in light of the sampling data from. the upgradient transformer yard wellsand ultimately from wells directly adjacent to the SFP itself. The ongoing subsurfaceinvestigation program was therefore further expanded to encompass not only the IP2-SFPsource area, but also other potential sources across the entire Site, including Units 1 and 3.These subsequent phases of investigation ultimately established the retired Unit 1 plant asthe source of the Strontium contamination identified5 in the groundwater.More specifically, the Unit 1 fuel storage pool complex, where historic legacy pool leakagewas known to exist, was confirmed as the Strontium source. This fuel pool complex iscollectively termed the Unit 1 Spent Fuel Pools (IP1-SFPs). Following detection ofradionuclides in the groundwater associated with IP1-SFPs, Entergy accelerated efforts toreduce activity in the IP 1-SFPs, along with acceleration of the already ongoing planning forthe subsequent fuel rod removal and complete pool drainage.
As indicated above, later phases of the investigations encompassed the entire Site,including all three Units (IP1, IP2 and iP3). These investigations found no evidence ofreleases to the groundwater from the IPEC Unit 3 plant complex. In this regard, it isimportant to note that the design and construction of the IP3-SFP incorporates a secondaryleak detection telltale drain system, in addition to the primary stainless steel liner.The earlier Unit I and Unit 2 SFPs were not designed with this feature.
4 a. Use of the Observational Method in the Investigation and Monitoring of a Spent Fuel Pool Release, Barvenik, et.al., NEI Groundwater Workshop, Oct. 2007.
b. Use of the Observational Method in the Remedial Investigation and Cleanup of Contaminated Land, Dean, AiR.and M.J. Barvenik, The Seventh Geotechnique Symposium - Geotechnical Aspects of Contaminated Land, sponsored bythe Institution of Civil Engineers, London, Volume XLII, Number 1, March 1992.
c. Advantages and Limitations of the Observational Method in Applied Soil Mechanics, Peck, R.B.. (eotechnique1969, No. 2, 171-187.5 In addition to Strontium, other radionuclides (Nickel, Cobalt and Cesium) were also sporadically detected ingroundwater. These other radionuclides were continuously assessed within the context of the overall hydrologic model.Based upon their occurrence. Strontium, in combination with Tritium, provides full delineation of radiologicalgroundwater plumes at the IPEC Site.
5
2.0 SCOPE OF SERVICES
This section outlines the scope of our two-plus year-long investigation. Consistent withwell established hydrogeologic practices, GZA followed the Observational Method.That is, GZA developed a Conceptual Site Model (see Section 3.0) that described ourunderstanding of groundwater flow and contaminant transport at IPEC, and performedinvestigations to test the validity of our model. In response to test data, we revised themodel and/or performed additional testing to clarify findings. This iterative, step-wisephased approach allows for better focused testing, and a more comprehensive review ofdata. It also reduces the chances of missing critical information, and generally completesstudies in less time. GZA executed the scope in three phases.
2.1 PHASE I
Phase I investigations commenced in September 2005. Consistent with the concerns raisedby the observed IP2-SFP crack leakage, the Phase I investigation program focused on:1) Identifying the groundwater flow paths which would intercept potential releases fromIP2-SFP; and 2) Evaluating groundwater contaminant fate and transport mechanisms inthis area of the facility. This work included:
" Identification, retrieval and evaluation of historic geologic, hydrogeologic andgeotechnical reports to form the basis of our initial Conceptual Site Model (CSM);
* Development of an initial CSM;" Identification, retrieval and evaluation of historic facility Site plans and
construction details pursuant to the impact of man-made features on groundwaterflow directions and Tritium migration, with subsequent refinement of the CSM;
" Installation of nine groundwater monitoring wells, a number of which containedmultiple sampling levels, in the area of the Tritium release;
• Installation of four stilling wells 6, three within the Discharge Canal and one in theHudson River, to allow groundwater elevations to be compared to these surfacewater elevations (to evaluate if the Hudson River is the ultimate discharge point forany potential IP2-SFP release);
* Performance of elevation and location surveys to establish reference points forgroundwater elevation measurement;
o Installation of electronic pressure transducers in newly drilled boreholes andpreviously existing wells to continuously monitor groundwater elevationfluctuations, as influenced by climatic/seasonal variability, tidal influences and thedrilling of nearby boreholes (to assess interconnections between boreholes atdifferent locations);
* Geophysical borehole testing to provide further bedrock fracture identification,location and groundwater flow information;
6 Stilling wells are typically constructed of slotted pipe or well screen. Phey are placed in surface water bodies to house
pressure transducers for water level measurement. Their purpose is to dampen-out high frequency pressure fluctuationsin the water body, typically due to flow-induced turbulence, such that more representative readings can be obtained.Stilling wells are not included as monitoring wells with reference to numbers of monitoring wells installed,
6
" Packer testing of specific bedrock boreholes to provide initial depth-specificgroundwater samples, measurement of depth-specific groundwater elevations andflow capacity of the fracture zones;
" Completion of the boreholes as screened overburden wells, open bedrock wells, ormulti-level monitoring wells as appropriate for the subsurface conditionsencountered;
" Testing of open bedrock and screened boreholes to measure formation groundwaterflow capacity;
• Ground Penetrating Radar (GPR) analysis of the key locations to evaluate top ofbedrock elevations relative to preferential groundwater flow through soil backfill;
" Sampling of groundwater from the monitoring wells and analyzing the samples forTritium and gamma emitters; and
" Computation of the groundwater flux and radiological activity to the Hudson Riverfor use by Entergy in their dose computations.
2.2 PHASE II
Phase 11 investigations commenced in January 2006. The focus of this work was to:1) Confirm initial findings; 2) Better estimate the quantity of contaminated groundwater atthe facility that discharges to the Hudson River; and 3) Establish a network of wellssuitable for identifying potential leaks at all three units across the Site and for long termmonitoring of groundwater. This phase of work included:
• Re-evaluation of our CSM to guide the selection of borehole locations and establishtesting requirements;
" Identification of accessible areas from which to drill boreholes to measuregroundwater elevations and the contaminant concentrations;
" Drilling of 23 additional boreholes through soil and bedrock to depths of up to200 feet, including coring to provide bedrock core samples for inspection (to locatefractures in the bedrock which likely conduct groundwater flow);
" Performance of elevation and location surveys to establish reference points forgroundwater elevation measurement;
• Installation of electronic pressure transducers in newly drilled boreholes tocontinuously monitor groundwater elevation fluctuations, as influenced byclimatic/seasonal variability, tidal influences and the drilling of nearby boreholes(to assess interconnections between boreholes at different locations);
• Geophysical borehole testing to provide further bedrock fracture identification,location and groundwater flow information;
" Packer testing of specific bedrock boreholes to provide depth-specific groundwatersamples, measurement of depth-specific groundwater elevations and flow capacityof the fracture zones;
• Completion of the boreholes as screened overburden wells, open bedrock wells, ormulti-level monitoring wells as appropriate for the subsurface conditionsencountered;
• Conducting tests on open bedrock and screened boreholes to measure formationgroundwater flow capacity;
* Ground Penetrating Radar (GPR) analysis of the key locations to evaluate top ofbedrock elevations relative to preferential groundwater flow through soil backfill;
7
• Sampling of groundwater from the monitoring wells and analyzing the samples forTritium and additional radionuclides of interest (including Strontium, gammaemitters, Nickel-63 and transuranics); and
• Re-computing the groundwater flux and radiological activity to the Hudson River(based on the more current data and refined CSM) for use by Entergy in their dosecomputations.
2.3 PHASE IH
Phase HII investigations commenced in June 2006. The focus of the Phase HII work was to:1) Better delineate the extent of Strontium detected during Phase II investigations; and2) Improve characterization of bedrock aquifer properties to allow evaluation of remedialalternatives. This phase of work included:
& Re-evaluation of our CSM to guide the selection of borehole locations and establish.testing requirements;
* Installation of additional wells (MW-53 through MW-67 and U 1 -CSS) to furtherdelineate the horizontal extent of groundwater contamination (this work was begunin Phase II);
• Installation of deep wells (MW-54, -60, -61, -62, -63, -66, and -67) to establish thevertical extent of contamination;
• Conducting hydraulic tests on boreholes and completed wells to assess thetransmissivity of bedrock fracture zones and overburden;
* Installation of electronic pressure transducers in newly drilled boreholes andexisting wells to continuously monitor groundwater elevation fluctuations due toclimatic/seasonal variability, tidal influences and the drilling of nearby boreholes(to assess interconnections between boreholes at different locations);
* Geophysical borehole testing to provide further bedrock fracture identification,location and groundwater. flow information;
• Packer testing of specific bedrock boreholes to provide depth-specific groundwatersamples, measurement of depth-specific groundwater elevations and flow capacityof the fracture zones;
• Completion of the boreholes as screened overburden wells, open bedrock wells, ormulti-level monitoring wells as appropriate for the subsurface conditionsencountered;.
• Conducting a 72-hour Pumping Test to assess hydraulic properties of the bedrockas well as to assess the feasibility of managing Tritium-contaminated groundwaterthrough hydraulic containment;
• Performance of a tracer test. to better assess contaminant migration and transportmechanisms, particularly in the unsaturated zone;
0 Sampling of groundwater from the monitoring Wells and analyzing the samples forradionuclides; and
* Re-computing the groundwater flux and radiological activity to the Hudson River(based on the more current data and refined CSM) for use by Entergy in their dosecomputations.
8

3.0 CONCEPTUAL HYDROGEOLOGIC MODEL
C AGz'
This section, together with associated figures, constitutes our Conceptual Site Model(CSM). The key components of the model consisted of: the hydrogeologic setting; generalgroundwater flow patterns; identified contaminant sources; contaminants of potentialconcern; and identified receptors. GZA used the CSM to guide our investigations, identifyand fill data gaps, assess the reasonableness of findings, and develop parameterscontrolling contaminant transport. It was an iterative process and, as studies progressed,we modified the CSM to better fit observed conditions. With completion of theinvestigations and further refinement of the CSM, our CSM was consistent with both theSite-specific project data and published data for the area.
The CSM incorporates our understanding of Site construction practices as they influencecontaminant migration. Critical in this regard is that, according to construction plans, leanconcrete was used as backfill material for foundation walls in a number of locations,primarily associated with Unit 1 structures. We also note that in some areas whereconstruction plans show soil backfill, we found that lean concrete was actually used.This is likely due to the relatively low cost of concrete during the 1950's and theuniqueness of the construction for these first nuclear power plants. At the subsequentlyconstructed Units 2 and 3, it appears soil or blast rock was the material most commonlyused as backfill against foundation walls.
SCHEMATIC REPRESENTATION OF GROUNDWATER FLOW INTO THESITE FROM THE NORTH, SOUTH, AND EAST
9
3.1 HYDROGEOLOGIC SETTING
The Site watershed is limited in areal extent. GZA assumed that the top of the watersheddefines a no-flow boundary in the aquifer. The distance from the upgradient no-flowboundary located at the top of the watershed, to the river, is on the order of 2,200 feet(see Figure 3.1). This length limits the volume of precipitation available for aquiferrecharge. Recharge is further limited by the density of structures and areal extent ofpaving, which induces direct run-off. An average annual recharge rate of 5.5 inches peryear was initially selected7 as representative for the Site area, which is the USGS estimatedaverage in Westchester County where IPEC is located.
3.2 GENERAL GROUNDWATER FLOW PATTERNS
Groundwater flow takes place in three dimensions. In general, flow at the top of thewatershed is largely downward and flow near the river's edge is largely upward. In themid-section of the watershed, flows are predominantly horizontal. Based on the location ofthe Site in the watershed and information indicating that the top of the bedrock is morefractured, GZA initially estimated, and later confirmed that the bottom of the localgroundwater flow to be at or above elevation -200 feet (National Geodetic Vertical Datumof 19298, NGVD 29)9. Note that temporal and spatial variations in areal recharge rates,rock heterogeneities, and tidal influences cause local variations from these general flowpatterns. In fact, Site groundwater flow patterns in some areas are dominated by shallowanthropogenic Site features. These features include pumping from building foundationdrains, foundation walls, subsurface utilities, and flows in the intake structures andDischarge Canal.
Based upon the regional topography, Site topography (see Figure 3.2), anthropogenicinfluences, and the geostructural setting, even at the initial stages of the investigations GZAexpected that groundwater would flow into IPEC from the North, East and South, and thendischarge to the Hudson River, with portions of the flow being intercepted by the coolingwater intake and Discharge Canal (see Figure 3.3). However, based on our review ofreports available at the start of the investigations, it was unclear what the role thatanisotropic bedrock structure played in groundwater migration. That is, there wasinformation suggesting groundwater flows would have a primarily southern component(see Section 6.4 for a description of the regional area and Site-specific geologic setting).
As discussed in Section 6.0. the initial average areal recharge rate of 5.5 inches/year was subsequently increasedsomewhat as we refined our CSM.
8 The National Geodetic Vertical Datum of 1929 (NGVD 29) is the renamed Sea Level Datum of 1929. The datum wasrenamed because it is a hybrid model, and not a pure model of mean sea level, the geoid, or any other equipotentialsurface. NGVD 29. which is based on "an averaging" of multiple points in the US and Canada, is the vertical "sealevel" control datum established for vertical control surveying in the United States of America by the General Adjustmentof 1929. The datum is used to measure elevation or altitude above, and depression or depth below. "mean sea level"(MSL). It is noted that there is no single MSL, because it varies from place to place and over time.
9 During a mid-phase of the work, we concluded that the bottom of the local groundwater flow may be deeper, morelikely between elevations -200 to -350 feet NGVD 29. This conjecture was based on the observed vertical distribution ofheads, bedrock fracture patterns, and the observed contaminant concentrations at the time. We therefore increased ourdrilling depth to 350 feet (multi-level monitoring well installation MW-67) to investigate this issue. Subsequently, themost recent data better fit with a 200-foot-deep flow model.
10
Based on our studies, including a full-scale Pumping Test and tidal response testing, wehave shown that in the area of groundwater contamination, and on the scale of thecontaminant plumes, the direction and quantity of groundwater flow can be estimated usingan equivalent porous media model. We state this recognizing that an individual bedrockzone may represent flow in a single or limited number of fractures which over a relativelyshort distance is not representative of average conditions. In terms of our equivalentporous media model, this condition represents an aquifer heterogeneity. However, oversufficient volumes of bedrock (which is the case for the work at IPEC), the bedrockgroundwater flux can be estimated based on an equivalent porous media model usingDarcy's Law'°.
3.3 IDENTIFIED CONTAMINANT SOURCES
GZA, in conjunction with facility personnel, conducted a review of available constructiondrawings, aerial photographs, prior reports, and documented releases, and interviewedEntergy personnel to identify potential groundwater contaminant sources.
That review, in conjunction with the observed distribution of contaminants, identifiedIP2-SFP and IP 1 -SFPs, along with legacy piping associated with Unit 1, as sources of theradiological groundwater contamination. The locations of these structures are shown onFigure 3.4. No release was identified in the Unit 3 area. This finding is consistent with,and reflects, changes in construction practices over time". Refer to Section 8.0 foradditional information pursuant to source area description.
3.4 CONTAMINANTS OF INTEREST
Throughout this report, Tritium and Strontium are discussed as the principal radiologicalconstituents associated with the groundwater contamination investigation performed atIPEC. Both radionuclides served as the most representative contaminant tracer tools fromthe perspective of frequency of observed occurrence, as well as contaminant transport 12
across the Site. Other radionuclides (primarily Cs-137, Ni-63, Co-60) were moresporadically identified and isolated to specific locations within the Site.These radionuclides are encompassed by the Unit 2 (Tritium) and Unit I (Strontium)plumes. We also note these other radionuclides carry a smaller potential radiologicalimpact as compared to Strontium. These contaminants were also continuously assessedwithin the context of the overall site hydrological model as well as the plume informationgleaned from the Unit I and Unit 2 plume data. All detected radionuclides have been
10 Interpretation of Hydraulic Tests and Implications Towards Representative Elementary Volume for Bedrock Systems.
Thomas Ballerstero, October 2003, AGU San Francisco." The absence of Unit 3 sources is attributed to the design upgrades incorporated in the more recently constructed IP3-SFP.12 A combination of Tritium and Strontium allow full characterization of radiological groundwater plume nature and
extent at the IPEC Site given their divergent behavior in the subsurface. Tritium is completely conserved in thegroundwater with no partitioning to natural or anthropogenic subsurface materials. It, therefore, moves with and as fastas the groundwater, and thus serves as an indicator of the leading edge of a recent release. Strontium provides strongpartitioning characteristics and long half-life. It is, therefore, an indicator of older, historic releases.
11
accounted for by Entergy in their dose assessment analyses (radiological impactevaluations). Accounting for these data was performed via USNRC Annual Reportingdocuments that have been made public (year-end 2005 and 2006) and will continue to bereported on (Refer to RG1.21 report). Additional discussion of the identified sources ofcontaminants and the properties affecting contaminant migration are provided inSections 8.0 and 9.0.
3.5 IDENTIFIED RECEPTORS
%• The NRC has set forth guidance for calculations of radiation dose to the public, and IPECo kfollows this guidance for radioactive effluents, including those from groundwater. IPEC is
required to perform an environmental pathway analysis to determine the possible ways inwhich radioactivity released to the Hudson River can cause radiation dose. Receptors forradioactive releases to the environment are considered to be actual or hypotheticalindividuals exposed to radioactive materials either directly or indirectly.
Title 10 of the Code of Federal Regulations, Part 50 (10CFR50) Appendix I states:"Account shall be taken of the cumulative effect of all sources and pathways within theplant contributing to the particular type of effluent being considered."1OCFR5O Appendix I provides numerical guidelines on liquid releases of radioactivity,such that releases "will not result in an estimated annual dose or dose commitment fromliquid effluents for any individual in an unrestricted area from all pathways of exposure inexcess of 3 millirems to the total body or 10 millirems to any organ.
IPEC has reviewed the potential pathways that result in dose to the public and are viablefor the Site. Potential pathways considered included drinking water consumption, aquaticfoods, exposure to shoreline sediments, swimming, boating, and.irrigation. As discussedbelow, drinking water is not a viable pathway for releases to the Hudson River. RegulatoryGuide 1.109, "Calculation of Annual Doses to Man from Routine Releases of ReactorEffluents for the Purpose of Evaluating Compliance with 10 CFR 50, Appendix I" providesguidance and acceptable methodologies for calculating radiation dose from environmentalreleases. The NRC guidance uses the maximum exposed individual approach, where dosesare calculated to hypothetical individuals in each of four age groups (infant, child, teen, andadult). Maximum individuals are characterized as "maximum" with regard to foodconsumption and occupancy. Regulatory Guide 1.109 describes a pathway as "significant"if a conservative evaluation yields an additional dose increment of at least 10 percent of thetotal from all pathways. Based on the above description, the only significant pathway forliquid releases is for consumption of aquatic foods; i.e., Hudson River fish andinvertebrates.
The specific methodology used to calculate doses from liquid radioactive effluents is basedon NRC guidance and is contained in the Indian Point Offsite Dose Calculation Manual(ODCM). The volume of groundwater traversing the site and discharging intothe HudsonRiver, as estimated by GZA using the data as presented in this groundwater report, is usedin conjunction with measured concentrations of radionuclides in groundwater to estimatethe total amount of radionuclides to the Hudson River, and their potential dose impact.In 2005 and 2006, groundwater releases resulted in a small fraction of the offsite doselimits established by the NRC for each site. This dose is calculated from measured
12
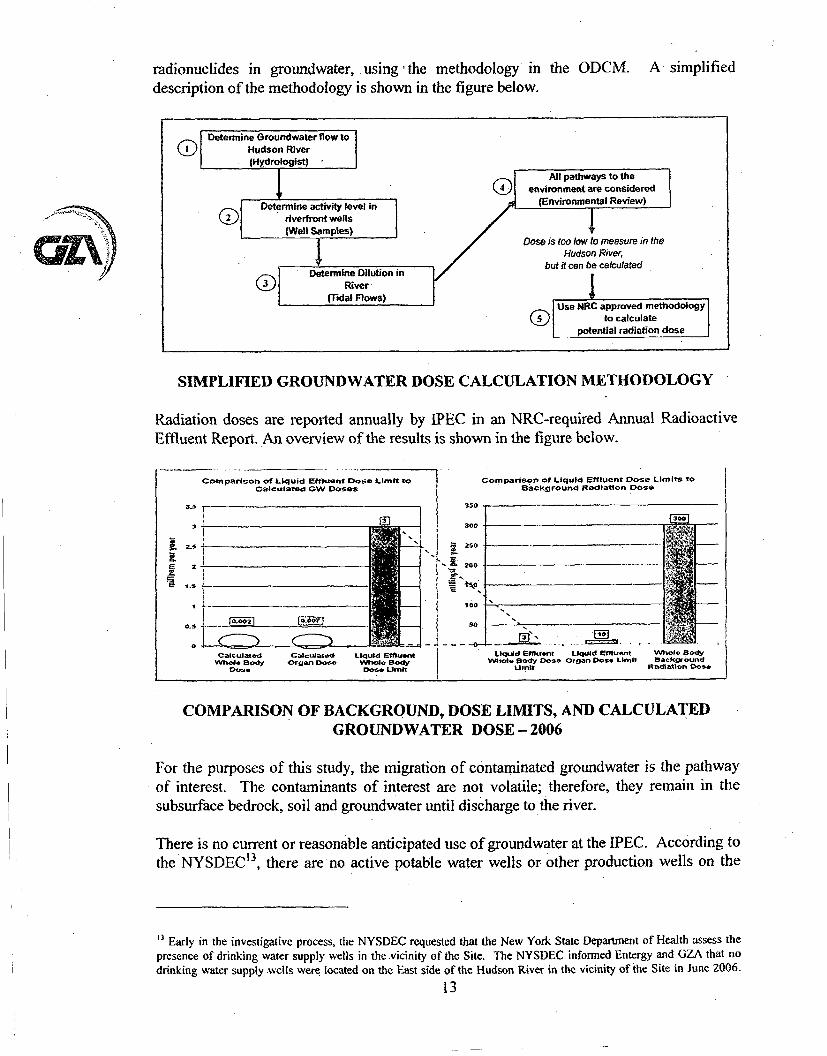
radionuclides in groundwater, using the methodology in the ODCM.description of the methodology is shown in the figure below.
A simplified
SIMPLIFIED GROUNDWATER DOSE CALCULATION METHODOLOGY
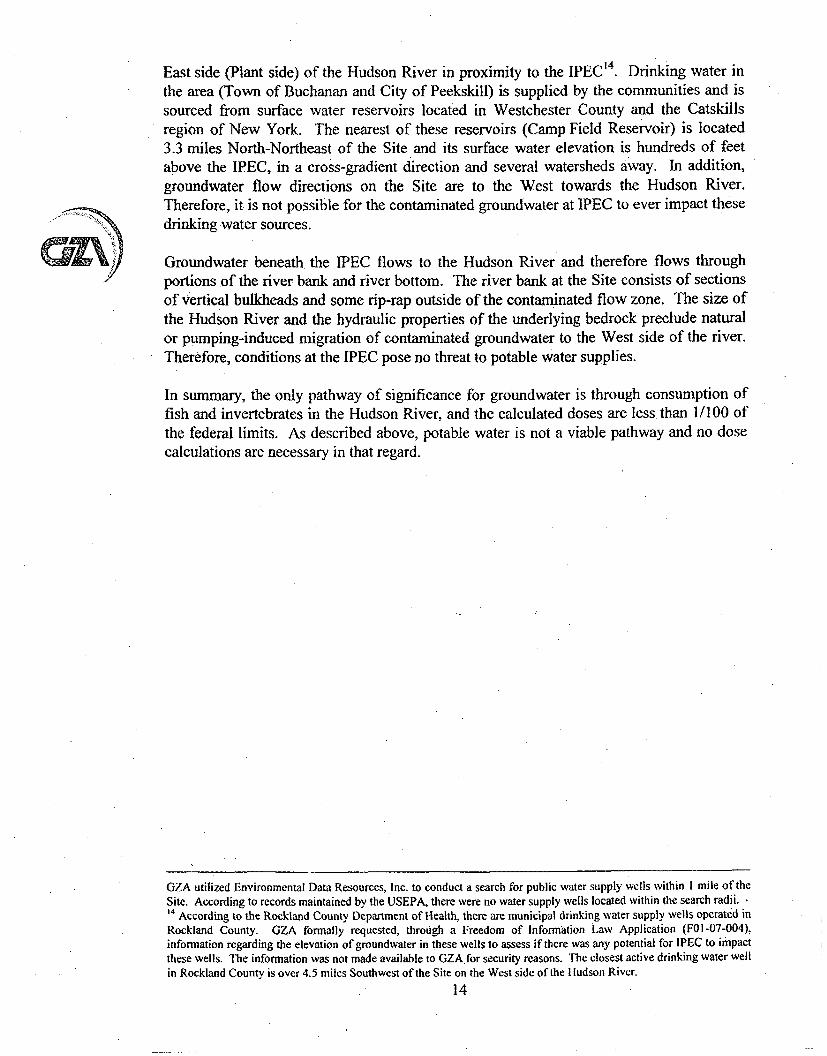
Radiation doses are reported annually by IPEC in an NRC-required Annual RadioactiveEffluent Report. An overview of the results is shown in the figure below.
Comparison of Liquid Effluent Dose Limit toCalculated GW Doses
Comparison of Liquid Effluent Dose Limits toBackground Radiation Dose
COMPARISON OF BACKGROUND, DOSE LIMITS, AND CALCULATEDGROUNDWATER DOSE - 2006
For the purposes of this study, the migration of contaminated groundwater is the pathwayof interest. The contaminants of interest are not volatile; therefore, they remain in thesubsurface bedrock, soil and groundwater until discharge to the river.
There is no current or reasonable anticipated use of groundwater at the IPEC. According tothe NYSDEC 3 , there are no active potable water wells or other production wells on the
'3 Early in the investigative process, the NYSDEC requested that the New York State Department of Health assess thepresence of drinking water supply wells in the vicinity of the Site. The NYSDEC informed Entergy and GZA that nodrinking water supply wells were located on the East side of the Hudson River in the vicinity of the Site in June 2006.
13
East side (Plant side) of the Hudson River in proximity to the IPEC14. Drinking water inthe area (Town of Buchanan and City of Peekskill) is supplied by the communities and issourced from surface water reservoirs located in Westchester County and the Catskillsregion of New York. The nearest of these reservoirs (Camp Field Reservoir) is located3.3 miles North-Northeast of the Site and its surface water elevation is hundreds of feetabove the IPEC, in a cross-gradient direction and several watersheds away. In addition,groundwater flow directions on the Site are to the West towards the Hudson River.Therefore, it is not possible for the contaminated groundwater at IPEC to ever impact thesedrinking water sources.
Groundwater beneath the IPEC flows to the Hudson River and therefore flows throughportions of the river bank and river bottom. The river bank at the Site consists of sectionsof vertical bulkheads and some rip-rap outside of the contaminated flow zone. The size ofthe Hudson River and the hydraulic properties of the underlying bedrock preclude naturalor pumping-induced migration of contaminated groundwater to the West side of the river.Therefore, conditions at the IPEC pose no threat to potable water supplies.
In summary, the only pathway of significance for groundwater is through consumption offish and invertebrates in the Hudson River, and the calculated doses are less than 1/100 ofthe federal limits. As described above, potable water is not a viable pathway and no dosecalculations are necessary in that regard.
GZA utilized Environmental Data Resources, Inc. to conduct a search for public water supply wells within I mile of theSite. According to records maintained by the USEPA, there were no water supply wells located within the search radii. •14 According to the Rockland County Department of Health, there are municipal drinking waler supply wells operated inRockland County. GZA formally requested, through a Freedom of Information Law Application (FOI-07-004),information regarding the elevation of groundwater in these wells to assess if there was any potential for IPEC to impactthese wells. The information was not made available to GZA.for security reasons. [he closest active drinking water wellin Rockland County is over 4.5 miles Southwest of the Site on the West side of the Hudson River.
14
4.0 FIELD INVESTIGATIONS
This section provides a description of our field activities. The studies were conducted in threephases between October 2005 and September 2007. Field activities were performed, inaccordance with general industry practice and regulatory guidelines, to develop and validateour CSM (see Section 3.0).
The field exploration program was developed by GZA in cooperation with Enercon andEntergy. A team of GZA engineers, geologists and scientists was present to observe anddocument drilling efforts, classify soil and rock samples, direct field testing (packer tests, etc.)and collect other hydrogeologic data. Borehole development, well installation and packertesting were performed by GZA and the drilling contractor, Aquifer Drilling and Testing(ADT), New Hyde Park, New York. The exploration program also included the use ofgeophysical exploration techniques to help identify underground utilities, evaluate thelocation of the bedrock surface, and evaluate the nature of bedrock fractures in selectboreholes. Advanced Geological Services (AGS) and Geophysical Applications, Inc. (GA),both under GZA's oversight, conducted this work.
The following provides a broad overview of our investigations. Refer to subsequentsubsections for more information.
Geological Reconnaissance
0 Review of Relevant Geological Literature and Previous Reports0 Site Reconnaissance to Observe Outcrops of Bedrock* Geostructural Logging of the Rock Wall within the IP2-FSB Crane Foundation
Excavation
Test Drilling - Planning, Execution, Post-Drill Activity
" Review of Existing Utility Plans• Surface Geophysical Utility Surveys (to further locate utilities)" Vacuum Excavation of 39 boreholes (for safety; to reduce risk of encountering
underground utilities or structures)" Test Boring Advancement (bedrock borings, overburden borings)• Borehole Development (to remove rock cuttings and drill water; preparation for
hydraulic testing in boreholes)" Borehole Geophysical Surveys (to evaluate fractures along the borehole wall)
Monitoring Well Installations
• Bedrock Wells• Open Rock Wells• Waterloo Systems• Nested Wells• Overburden Wells• Wellhead Completion
15
• Wellhead Elevation Surveying
Hydraulic Testing to Evaluate Hydraulic Conductivity of Bedrock
• Specific Capacity Testing* Rising Head Hydraulic Conductivity Testing (pneumatic and hydraulic slug tests)• Bedrock Packer Hydraulic Conductivity Testing
A Pumping Test (a 72 hour Pump Test to evaluate the hydraulic properties of thebedrock)
aWater Sampling
* On-Site Sampling of Groundwater, Surface Water and Facility Water• Off-Site Sampling of Groundwater and Surface Water
Groundwater Elevation Monitoring and Pressure Transducer Data
* Installation of In-Situ and Geokon Transducers& Data Retrieval
Organic Dye Tracer Testing
* Injection Well Construction• Tracer Introduction* Sampling Methods
Geophysical Testing - Identification of Preferential Groundwater Flow Paths
* Ground Penetrating Radar Surveys at Unit 2, Unit 3 and the Owner ControlledArea (OCA) Access Road
, Seismic Refraction, GPR and Electromagnetic Surveys between the ProtectedArea and southern Warehouse
As-built locations of the explorations are shown on Figure 1.3. Table 4.1 provides asummary of well locations and installation details. The following sections describe the keyaspects of the completed work. Explorations logs, test records and additional information arepresented in the Appendices.
4.1 GEOLOGIC RECONNAISSANCE
To develop a preliminary understanding of the subsurface conditions expected to occurbeneath the Site, GZA reviewed USGS publications relating to the local and regional geologyas well as available Site-specific geologic reports. GZA further conducted a reconnaissanceof the Site to identify the type of bedrock exposed, relative fracture density and locations ofexpected overburden. Specifically included was the logging of the rock wall in theconstruction excavation at Unit 2 (refer to Section 6.0 for additional detail on Site Geology).This information was used to help design the subsurface investigation methods.
16
4.2 TEST DRILLING
Forty-seven borings were completed by GZA as part of this program, forty-two of theseborings were converted to monitoring installations, one was converted to a recovery well andone was converted to a tracer injection point' 5 . Boring logs for the bedrock borings and theadditional overburden borings are provided in Appendix B. Boring locations and elevationsare provided in Table 4.1. Final sampling elevations are also provided in Table 4.1.Test Boring/Monitoring Installation locations are shown on Figure 1.3. In viewing the figure,note that test boring designations are the same as the monitoring installation' 6 designations(see Section 4.3.4). In addition, a tracer injection point was installed along the side of thecasing of MW-30 (see Section 7.0 for details).
Prior to advancement of the borings, a utility identification and clearance program wasimplemented to reduce the risk of encountering underground utilities, and to maintain thesafety of on-Site personnel during drilling activities. GZA personnel, AGS personnel andSite personnel first performed a reconnaissance of the proposed boring locations.Site personnel then utilized Site plans to assess the potential presence of subsurface utilitiesin the area of the proposed boring locations. Following this initial screening, AGSpersonnel performed a surface geophysical survey of the area around the proposed boringlocations using GPR and radiofrequency utility locating equipment. The results of thesurvey were marked on the ground surface using spray paint. Entergy personnel performeda final reconnaissance prior to approving the locations.
'. Borings are defined as test sites that were excavated with hand held or mechanical drilling devices. Monitoring
installations are defined as boreholes (or wellbores) that were completed to allow groundwater monitoring and generallyinclude multiple monitoring levels over the depth of the boring (either "'nested well" casings within one borehole orWaterloo multi-level completions). In several instances, a monitoring installation location designation, such as MW-49,may have two discrete borings, in which case it is counted as two installations, but represented on the figures as a singlelocation for clarity. Attempted borings which met refusal and had to be re-drilled are not included in the boring count.16 Monitoring installations are commonly referred to as Monitoring wells, which in this usage, may include multiple,individual well casings. This generic usage is also used herein.
17
SURFACE GEOPHYSICAL SURVEY
At thirty nine of the boring locations, overburden was vacuum-excavated until bedrock wasencountered, or to the practical limits of the vacuum excavation technique. To furtherreduce the risk associated with the drilling program, during advancement, of the borings tobedrock, a downhole magnetometer was utilized every two feet to assess the presence ofmetallic objects potentially related to subsurface utilities.
The test borings were performed by ADT with a combination of three drill rigs:a track-mounted CME LC55 rotary drill rig, a truck-mounted CME 75 rotary drill rig, and anelectric track-mounted Davie DK 515 rotary drill rig. The original program consisted ofadvancing borings into bedrock to desired terminal depths using wire line HQ direct rotarycoring techniques. This resulted in a nominal 3.85-inch diameter borehole.Where overburden was present, either a four-inch or six-inch casing was installed into therock and grouted in place.
At certain locations where overburden occurred beyond the bottom of the vacuum-excavatedtest pits, soil samples were collected at 5-foot intervals, from the bottom of thevacuum-excavated test pit, using a 2-inch outside diameter (OD) split-spoon sampler drivenby a 140-pound hammer falling 30 inches, to characterize soils. These samples were visuallyclassified using the Burmnister Classification System. At all locations, eithervacuum-excavated test pits or hand-excavated test pits were performed to clear utilities priorto advancing boreholes. Grab samples were collected during the advancement of the test pitsto visually characterize the overburden soils.
18
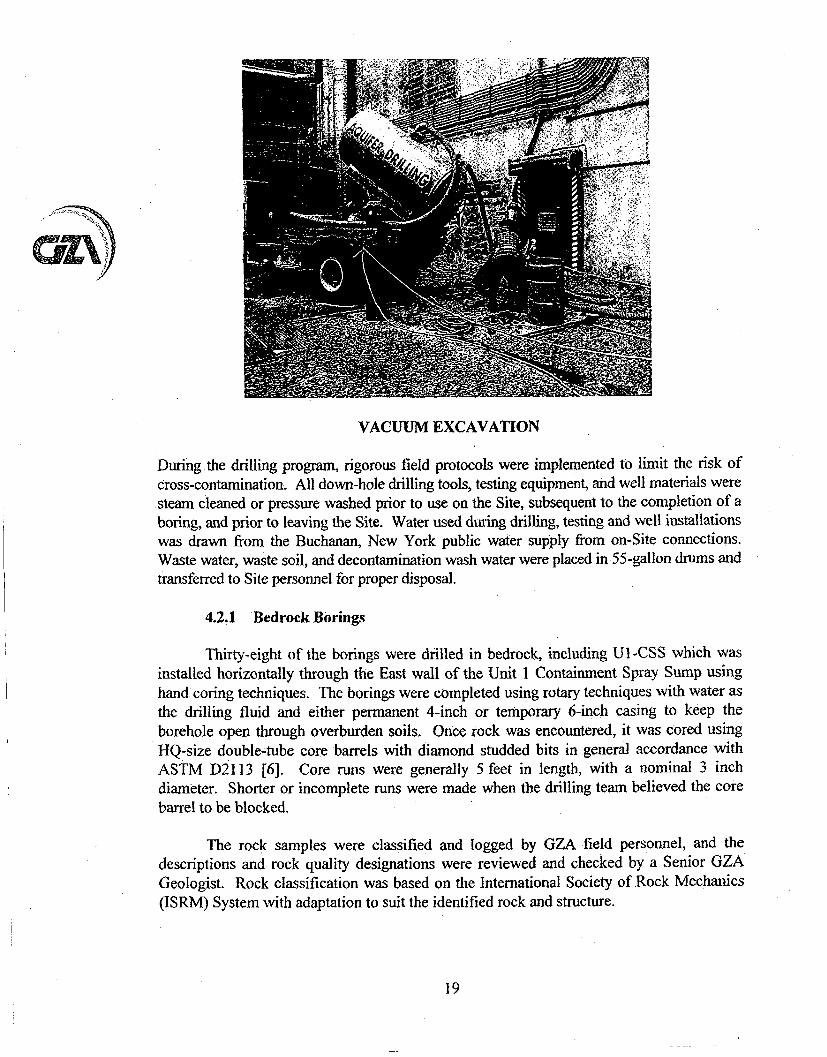
VACUUM EXCAVATION
During the drilling program, rigorous field protocols were implemented to limit the risk ofcross-contamination. All down-hole drilling tools, testing equipment, and well materials weresteam cleaned or pressure washed prior to use on the Site, subsequent to the completion of aboring, and prior to leaving the Site. Water used during drilling, testing and well installationswas drawn from the Buchanan, New York public water supply from on-Site connections.Waste water, waste soil, and decontamination wash water were placed in 55-gallon drums andtransferred to Site personnel for proper disposal.
4.2.1 Bedrock Borings
Thirty-eight of the borings were drilled in bedrock, including UI-CSS which wasinstalled horizontally through the East wall of the Unit I Containment Spray Sump usinghand coring techniques. The borings were completed using rotary techniques with water asthe drilling fluid and either permanent 4-inch or temporary 6-inch casing to keep theborehole open through overburden soils. Once rock was encountered, it was cored usingHQ-size double-tube core barrels with diamond studded bits in general accordance withASTM D21 13 [6]. Core runs were generally 5 feet in length, with a nominal 3 inchdiameter. Shorter or incomplete runs were made when the drilling team believed the corebarrel to be blocked.
The rock samples were classified and logged by GZA field personnel, and thedescriptions and rock quality designations were reviewed and checked by a Senior GZAGeologist. Rock classification was based on the International Society of Rock Mechanics(ISRM) System with adaptation to suit the identified rock and structure.
19
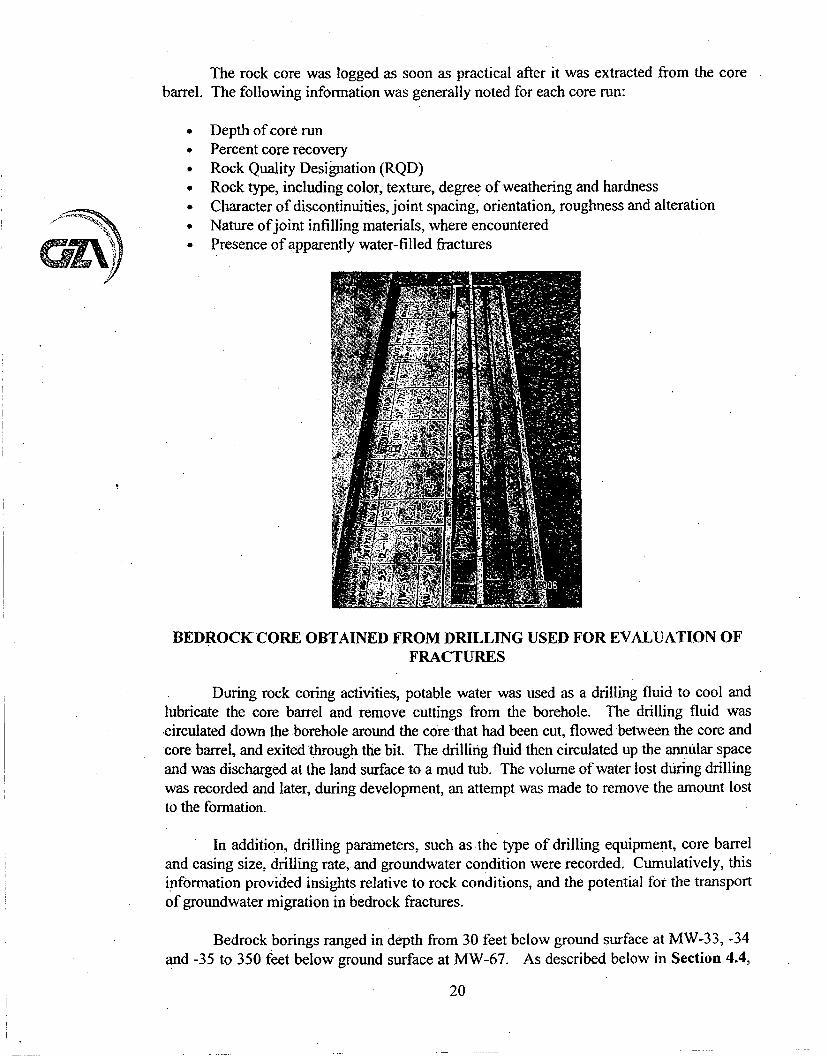
The rock core was logged as soon as practical after it was extracted from the corebarrel. The following information was generally noted for each core run:
0
0
0
0
0
Depth of core runPercent core recoveryRock Quality Designation (RQD)Rock type, including color, texture, degree of weathering and hardnessCharacter of discontinuities, joint spacing, orientation, roughness and alterationNature ofjoint infilling materials, where encounteredPresence of apparently water-filled fractures
GZX)')
BEDROCK CORE OBTAINED FROM DRILLING USED FOR EVALUATION OFFRACTURES
During rock coring activities, potable water was used as a drilling fluid to cool andlubricate the core barrel and remove cuttings from the borehole. The drilling fluid wascirculated down the borehole around the core that had been cut, flowed between the core andcore: barrel, and exited through the bit. The drilling fluid then circulated up the annular spaceand was discharged at the land surface to a mud tub. The volume of water lost during drillingwas recorded and later, during development, an attempt was made to remove the amount lostto the formation.
In addition, drilling parameters, such as the type of drilling equipment, core barreland casing size, drilling rate, and groundwater condition were recorded. Cumulatively, thisinformation provided insights relative to rock conditions, and the potential for the transportof groundwater migration in bedrock fractures.
Bedrock borings ranged in depth from 30 feet below ground surface at MW-33, -34and -35 to 350 feet below ground surface at MW-67. As described below in Section 4.4,
20
the majority of the rock borings were completed as monitoring well locations.One exception was MW-61, which was abandoned when a length of HQ casing separatedin the borehole due to drilling difficulties related to a 70-foot length of clay-filled faultgouge, and could not be retrieved. The boring was subsequently grouted and a secondboring, designated MW-66, was advanced approximately 10 feet East of the MW-61location.
As discussed earlier, one boring, UI-CSS, was installed using a hand-held coringmachine through the East wall of the IPI-CSS. This borehole was advanced horizontallyapproximately 70 inches into the bedrock to the East of the Superheater Building.
4.2.2 Overburden Borings
In areas where groundwater was encountered in the overburden deposits, overburden(soil) borings were drilled to further evaluate water quality in the shallow aquifer.Five borings, designated MW-49, -52, -62, -63, and -66 were advanced immediately adjacentto the bedrock boring of the same name. In addition, three overburden borings, designatedMW-38 and MW-64, were advanced at stand alone locations. MW-38 was advanced toassess groundwater quality and migration pathways along the Discharge Canal. MW-64 wasadvanced to determine the backfill material and construction properties of the DischargeCanal as it runs beneath the Superheater Building, and was terminated at a depth of 3 feetwhen concrete was encountered beneath the slab of the building. Additionally, a tracerinjection well (T1-Ul-1) was installed within overburden above the North Curtairn Drain(NCD) along the North wall of the PIP-FHB.
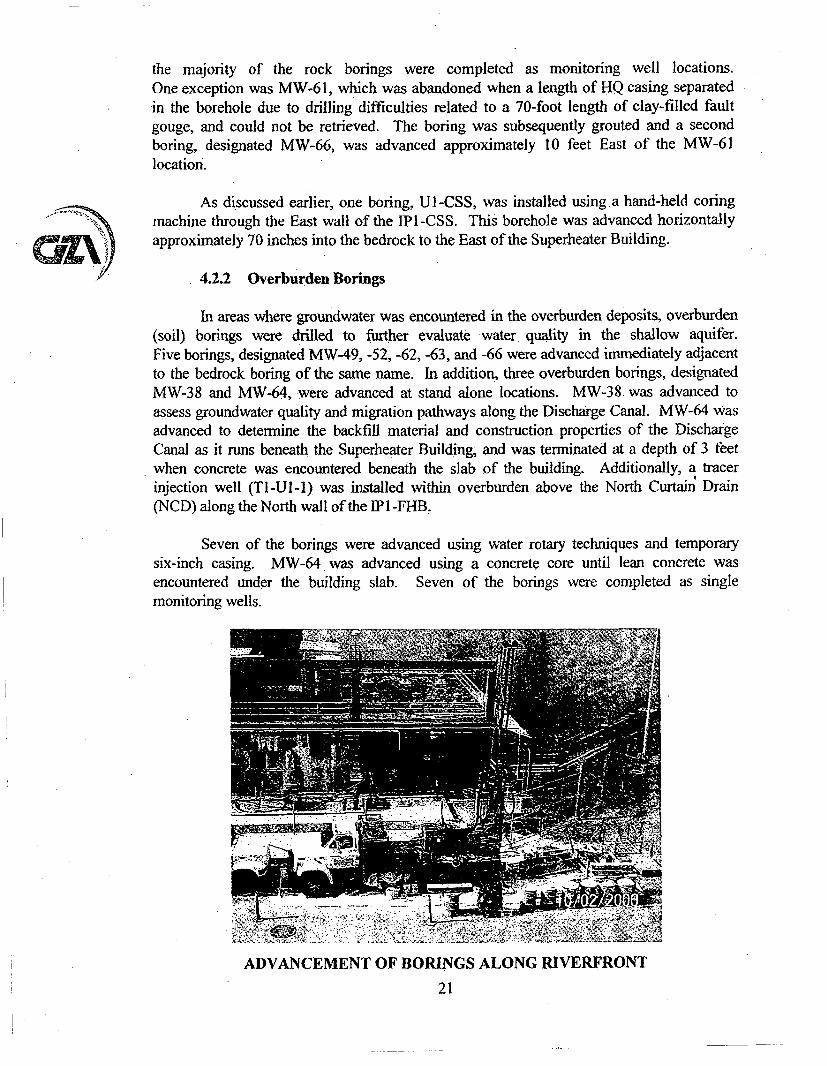
Seven of the borings were advanced using water rotary techniques and temporarysix-inch casing. MW-64 was advanced using a concrete core until lean concrete wasencountered under the building slab. Seven of the borings were completed as singlemonitoring wells.
ADVANCEMENT OF BORINGS ALONG RIVERFRONT
21
4.2.3 Borehole Development
After drilling was completed and prior to conducting hydraulic tests within a borehole,borehole development was conducted to remove rock cuttings from the borings, which couldotherwise restrict water flow into the fractures and alter packer testing results, as well as toremove drilling water lost to the formation during drilling. The boreholes were developedeither by pumping and surging with a 3.7-inch surge block and a Grundfos Redi-Flo 2submersible pump, or by pumping with a submersible pump along the length of the borehole.Sufficient water was pumped out of the borehole to account for water lost during drilling anduntil well water was visually free of turbidity.
4.2.4 Borehole Geophysical Analysis
Upon completion of borehole development, a suite of geophysical surveys wasconducted in select boreholes (borehole geophysics was biased towards the deeperboreholes) by GA of Holliston, Massachusetts to obtain information on the presence ofwater bearing fractures in the rock. This work took place between November 2005 andJuly 2007, and involved twenty-three borings MW-30, -31, -32, -33, -34, -39, -40, -51, -52,-53, -54, -55, -56, -57, -58, -59, -60, -62, -63, -65, -66, -67 and RW-1.
GA performed fluid resistivity, temperature and conductivity logging; heat pulseflow meter logging; and optical and acoustical televiewer logging (OTV/ATV). A MountSopris model 4MXA or 4MXB logging winch equipped with a Mount Sopris modelMGX- 11 electronics console recorded conventional logs at each well. All conventional logdata was recorded at 0.1 -foot depth increments.
Fluid temperature and fluid resistivity logs were recorded during the first downwardlogging run at each borehole using a Mount Sopris caliper probe with a fluidtemperature/fluid resistivity subassembly. These fluid logs were obtained using adownward logging speed of approximately 4 to 5 feet per minute. Caliper data weresubsequently recorded while pulling the same probe upward at approximately 10 feet perminute.
ATV data were obtained using an Advanced Logic Technologies (ALT) modelAB140 acoustical televiewer probe with a Mount Sopris winch and an ALT model Aboxelectronics console. ATV data were recorded at 0.01-foot depth intervals with 288 pixelsfor a 360-degree scan around the borehole wall. Logging speeds were approximately,4 feetper minute with this probe.
OTV data were recorded using an ALT model OB 140 probe, also with a MountSopris winch and the ALT electronics console. OTV data were stored at depth incrementsof 0.007 feet, with 288 pixels for each 360-degree scan around the borehole wall.OTV logging speeds were also approximately 4 feet per minute.
A pair of centralizer assemblies positioned the ATV and OTV probes near themiddle of each borehole. Each centralizer included four stainless steel bow springs,clamped to the probe housings with brass compression fittings, at positions recommended
22
by the probe manufacturer to minimize the risk of interference with the probes' threeinternal component magnetometers.
Flowmeter data were recorded with a Mount Sopris model HPF-2293 heat-pulseflow-meter probe at specific depths selected from field graphs of the caliper, fluidtemperature and fluid resistivity logs. Flowmeter data were initially recorded underambient conditions. The same test depths were subsequently repeated while pumping at0.4 to 0.75 gallons per minute (gpm) with a Grundfos, Fultz or Whale pump. The pumpwas positioned a few feet below the observed static water level in each well. In some cases,the pump was operated so as to maintain the water level some number of feet below thestatic level (if the well produced little water and the water level was constantly droppingwhile pumping).
A detailed description of the geophysical logging results for each borehole isincluded in Appendix C.
4.3 WELL INSTALLATIONS
Bedrock and overburden monitoring installations were constructed in boreholes to allow forfuture recording of groundwater levels and the collection of groundwater quality samples.Further, we installed nested piezometers in single boreholes to screen multiple levels ofbedrock and overburden within a single borehole and alleviate the need for multiple boringsin areas not easily accessed. For specific well installation details, refer to the wellconstruction logs provided in Appendix D. In addition, eighteen monitoring wells werepreviously installed at the Site prior to this investigation and included: MW-101, MW-103,MW-104, MW-105, MW-107, MW-108, MW-109, MW-110, MW-111, MW-112, U3-1,U3-2, U3-3, U3-4S, U3-4D, U3-TI, U3-T2 and 1-2.
4.3.1 Bedrock Wells
Following borehole advancement and testing, GZA evaluated the rock cores,geophysical logs, and other hydrologic and radionuclide test data to assess fracture spacingand potential yield. Using these data, GZA selected intervals within the boreholes to becompleted as permanently screened monitoring wells. The selected well screen intervals wereintended to span hydraulically active zones within the bedrock.
4.3.1.1 Open Rock Wells
Four bedrock borings, designated MW-33, -34, -35 and -46, were left asopen borehole monitoring points. MW-46 is located in the Unit 3 Transformer Yard(IP3-TY), and MW-33, -34 and -35 are located in the Unit 2 Transformer Yard (1P2-TY)where the water table spans the hydraulically active shallow bedrock. The wetted lengthsof the borehole were appropriate for one sampling zone at these locations.
Recovery well RW-l, located in the IP2-FSB truck bay, is also an openborehole. The borehole was installed and a Pumping Test conducted (described in Section4.4.4) to test the feasibility of using hydraulic containment in the vicinity of Unit 2, shouldit be found appropriate. This location was used as the pumping well during the Pumping
23
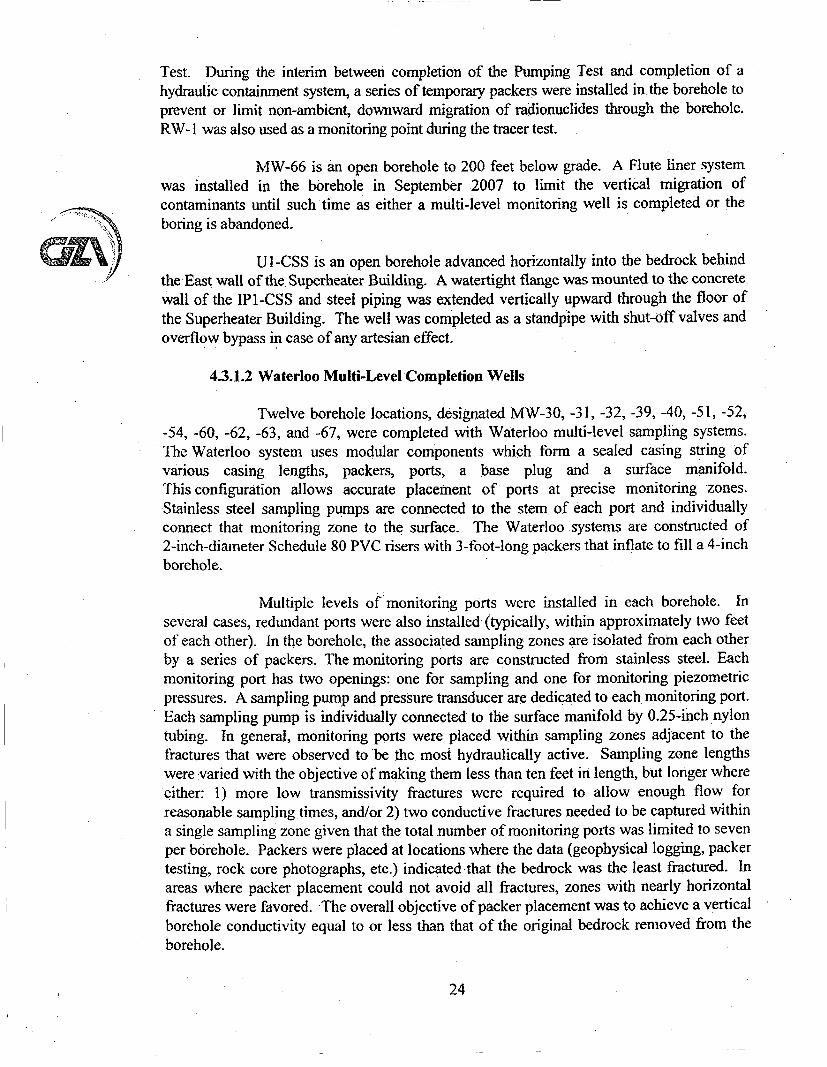
Test. During the interim between completion of the Pumping Test and completion of ahydraulic containment system, a series of temporary packers were installed in the borehole toprevent or limit non-ambient, downward migration of radionuclides through the borehole.RW- I was also used as a monitoring point during the tracer test.
MW-66 is 'an open borehole to 200 feet below grade. A Flute liner systemwas installed in the borehole in September 2007 to limit the vertical migration ofcontaminants until such time as either a multi-level monitoring well is completed or theboring is abandoned.
UI-CSS is an open borehole advanced horizontally into the bedrock behindthe East wall of the Superheater Building. A watertight flange was mounted to the concrete.wall of the IP1-CSS and steel piping was extended vertically upward through the floor ofthe Superheater Building. The well was completed as a standpipe with shut-off valves andoverflow bypass in case of any artesian effect.
4.3.1.2 Waterloo Multi-Level Completion Wells
Twelve borehole locations, designated MW-30, -31, -32, -39, -40, -51, -52,-54, -60, -62, -63, and -67, were completed with Waterloo multi-level sampling systems.The Waterloo system uses modular components which form a sealed casing string ofvarious casing lengths, packers, ports, a base plug and a surface manifold.This configuration allows accurate placement of ports at precise monitoring zones.Stainless steel sampling pumps are connected to the stem of each port and individuallyconnect that monitoring zone to the surface. The Waterloo systems are constructed of2-inch-diameter Schedule 80 PVC risers with 3-foot-long packers that inflate to fill a 4-inchborehole.
Multiple levels of monitoring ports were installed in each borehole. Inseveral cases, redundant ports were also installed (typically, within approximately two feetof each other). In the borehole, the associated sampling zones are isolated from each otherby a series of packers. The monitoring ports are constructed from stainless steel. Eachmonitoring port has two openings: one for sampling and one for monitoring piezometricpressures. A sampling pump and pressure transducer are dedicated to each monitoring port.Each sampling pump is individually connected to the surface manifold by 0.25-inch nylontubing. In general, monitoring ports were placed within sampling zones adjacent to thefractures that were observed to be the most hydraulically active. Sampling zone lengthswere varied with the objective of making them less than ten feet in length, but longer whereeither: 1) more low transmissivity fractures were required to allow enough flow forreasonable sampling times, and/or 2) two conductive fractures needed to be captured withina single sampling zone given that the total number of monitoring ports was limited to sevenper borehole. Packers were placed at locations where the data (geophysical logging, packertesting, rock core photographs, etc.) indicated that the bedrock was the least fractured. Inareas where packer placement could not avoid all fractures, zones with nearly horizontalfractures were favored. The overall objective of packer placement was to achieve a verticalborehole conductivity equal to or less than that of the original bedrock removed from theborehole.
24
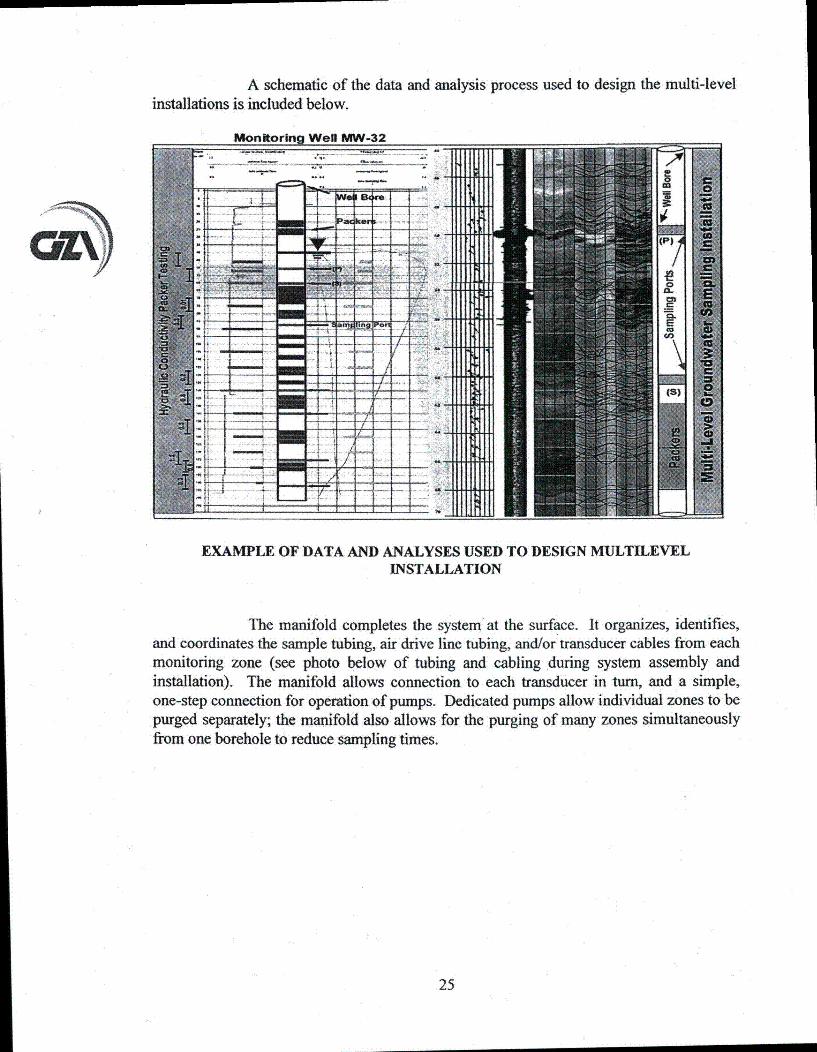
A schematic of the data and analysis process used to design the multi-levelinstallations is included below.
Monitoring Welt MW-32
F F ..........L.................F
CZV
EXAMPLE OF DATA AND ANALYSES USED TO DESIGN MULTILEVELINSTALLATION
The manifold completes the system at the surface. It organizes, identifies,and coordinates the sample tubing, air drive line tubing, and/or transducer cables from eachmonitoring zone (see photo below of tubing and cabling during system assembly andinstallation). The manifold allows connection to each transducer in turn, and a simple,one-step connection for operation of pumps. Dedicated pumps allow individual zones to bepurged separately; the manifold also allows for the purging of many zones simultaneouslyfrom one borehole to reduce sampling times.
25
I
SAMPLING PORTS, TUBING AND CABLING FOR MULTI- LEVEL SYSTEMASSEMBLY AND INSTALLATION
4.3.1.3 Nested Wells
Nested monitoring wells were installed in 18 locations, designated MW-36,-37, -41, -42, -43, -44, -45, -47, -48, -49, -50, -53, -55, -56, -57, -58, -59, and -65.In general, the nested wells consisted of the installation of one or more one-inch diameterSchedule 80 PVC wells screened at varying intervals in bedrock and a two-inch Schedule80 PVC well in the shallow West sampling zone of the boring, either in the bedrock oroverburden.
In general, well screens consisting of 0.02-inch slotted PVC pipe wereinstalled at lengths between 2 and 10 feet. Once the screened intervals were selected, thePVC well point was lowered into the boring to tie desired depth. Appropriately: sized filterpack material was placed from one foot below the screened interval to a minimum of one footabove the screened interval. The depth of the filter pack was measured on several occasionsduring installation to assess the affects of bridging and verify that the filter pack material wasplaced at the required depths. The intervals between well screens were sealed using bentonitepellets.
4.3.2 Overburden Wells
Three wells, MW-38, -49-26, -52-12 were completed as either two-inch diameter orfour-inch diameter groundwater monitoring wells. The wells were constructed of Schedule40 PVC screen and solid riser to ground surface. A 0.02-inch slot size was selected for the
26
well screens based on existing knowledge of the Site soil conditions. From fieldobservations, the shallow groundwater table was expected to be influenced by daily tidalfluctuations of approximately 2.7 feet. Consequently, well screens were installed such thatthe top of the screens were above mean high-tide water levels and of sufficient length toaccommodate groundwater sampling needs. The annular space around the screen and riserwas backfihled with #2 filter sand to approximately 2 feet above the top of the screen. Theremaining annular space was backfilled with bentonite and grout.
In order to sample two intervals in deep fill and overburden deposits observed nearthe Hudson River (in borings at MW-62, -63, and -66), GZA installed two one-inchSchedule 40 PVC wells, or one one-inch and one two-inch well, at these three locations.
COne of the well screens spanned the tidally influenced shallow water table, and one at thetop of rock in a more gravel-rich layer beneath silty, historic, river bottom sediments.
In addition, GZA installed one tracer injection well situated in the overburden abovethe Unit 1 North Curtain Drain. This well is constructed of two-inch Schedule 40 PVC.The screened interval was backfilled with #2 filter sand to approximately 2 feet above thescreen. The remaining annular space was backfilled with bentonite grout. A second tracerinjection point was completed adjacent to MW-30's casing.
4.3.3 Wellhead Completion
To protect the monitoring installations against damage and the elements, mostinstallations were finished at the ground surface with an 8-inch or 12-inch flush mountprotective casing with a concrete pad. To accommodate the multi-purge, samplingmanifold of the Waterloo Systems well installations, the wellheads were completed with a2 foot by 2 foot by 2 foot well vault. The well vaults were concreted in-place by Entergysubcontractors after the completion of the rock borings. The well vaults are equipped withhinged diamond plate steel lids that are rated for truck wheel loads.
43.4 Well Nomenclature
GZA designated names to newly installed monitoring installations17, typically withthe prefix "MW-". Nomenclature of single-interval installations, such as MW-33, weredesignated a number typically indicative of the order in which locations were selected priorto drilling. Nomenclature of installations containing Waterloo systems or nestedpiezometers, such as MW-30-69, were designated a number followed by a monitoring depthinterval. In Waterloo installations, the depth interval suffix is indicative of the depth to thesampling port from the top of the well casing. In nested piezometers, the monitoring depthinterval suffix is indicative of the depth to the bottom of the piezometer from the top of thewell riser. These depths are rounded to the nearest foot.
Throughout the course of the investigation, alterations were made to well casingsand adjacent ground surfaces due to equipment installation, hydraulic conductivity testing,
17 Monitoring installations are commonly referred to as Monitoring wells, which in this usage, may include multiple,individual well casings This generic usage is also used herein.
27
well vault installation, and Site construction activities. In May 2007, GZA reassigned thenames of multilevel installations to maintain the above described nomenclature basis as aneasily verifiable tool in the field. Changes in installation nomenclature are provided inTable 4.2. It should be noted that the provided groundwater and tracer test analytical data,piezometric data, well construction and development logs, transducer installation logs,sampling logs, hydraulic conductivity testing logs, and survey reports dated prior to May2007 reference the original designated installation nomenclature.
4.3.5 Wellhead Elevation Surveying
As-built surveys of the newly installed monitoring installations were performed inDecember 2005, March 2006, April 2006, November 2006, January 2007, and May 2007 byBadey and Watson, Inc. Figure 1.3 reflects the surveyed locations. The survey results aresummarized in Appendix E and in Table 4.1. Note that Appendix E survey reports datedprior to May 2007 reference original installation nomenclature. Table 4.3 includes changesin casing and ground surface elevations and dates of alterations and resurveys throughout thecourse of the investigation. Elevations are reported with respect to the National GeodeticVertical Datum of 1929 (NGVD 29)18, which is also the datum used by the plant.
4.4 HYDRAULIC TESTING
Four types of in situ tests were performed on existing and newly installed monitoring wells tocharacterize hydrogeologic properties of the bedrock and overburden, and facilitate theselection of well screen and piezometric sampling intervals. These included short durationspecific capacity tests, rising head hydraulic conductivity tests, bedrock packer hydraulicconductivity tests, and the Pumping Test. The following sections describe the equipment andprocedures used during this testing program.
4.4.1 Short Duration Specific Capacity Tests
A total of eight specific capacity tests and eight extraction tests were performed toassess hydraulic conductivity (K). See Table 4.4 for a summary of hydraulic conductivitydata.
The testing was conducted by pumping water from the well at a constant rate in orderto achieve "measurable drawdown" within the well that would stabilize after a relatively shortperiod of time. "Measurable drawdown" was considered between 1.5 and 10 feet for thepurposes of this study. Once drawdown apparently stabilized, pumping was allowed tocontinue at a constant rate for at least thirty additional minutes before pumping ceased.
"T The National Geodetic Vertical Datum of 1929 (NGVD 29) is the renamed Sea Level Datum of 1929. The datum was
renamed because it is a hybrid model, and not a pure model of mean sea level, the gpoid, or any other equipotentialsurface. NGVD29, which is based on "an averaging" of multiple points in the US and Canada. is the vertical "sea level"control datum established for vertical control surveying in the United States of America by the General Adjustment of1929. The datum is used to measure elevation or altitude above, and depression or depth below, "mean sea level"(MSL). It is noted that there is no single MSL, because it varies from place to place and over time.
28
If measurable drawdown within the well could not be achieved, and the maximumcapacity of the pump was reached, pumping was allowed to continue at a constant rate forapproximately thirty minutes, and the pump was turned off. If the characteristics of themonitoring well and immediately surrounding hydrogeology did not allow for a more suitablemethod of hydraulic testing, the well was characterized as having a K value "greater than" thevalue estimated at the maximum pumping rate.
If stabilized drawdown within the well could not be achieved, and the water level inthe well continued to decline after attempts to minimize pumping rate to the minimumpumping capability of the pump, the pump was turned off. If alternative methods of testingcould not be appropriately implemented due to well characteristics, water levels during therecovery period of this test were analyzed and interpreted for K values.
A Grundfos II Readi-Flo submersible pump or peristaltic pump was used for specificcapacity testing, and drawdown was measured using an electronic water level meter and/orpressure transducers. Flow rates were either measured using an in-line flow meter, orestimated by measuring the time required to fill a calibrated container. Transducer-loggedwater level measurements were typically recorded at thirty second or one minute intervals,while manual water level measurements were typically logged every one to five minutes.The entire pumping duration for each test was typically between thirty and ninety minutes.
GZA performed specific capacity tests between January 2006 and April 2007.Measurements were also recorded during borehole development. The logs are included inAppendix F.
4.4.2 Rising Head Hydraulic Conductivity Tests
A total of forty-three rising head hydraulic conductivity tests were performed ateighteen monitoring wells at the Site. Rising head K tests (slug tests) were. performed inMW-36-41, -36-53, -37-57, -41-64, and -42-51 via traditional slug testing. Pneumatic slugtests were performed in monitoring wells MW-53-120, -55-24, -55-24, -55-35, -55-54,
•-56-85, -57-20, -57-45, -58-65, -59-31, -59-45, -59-68, and -65-80. Hydraulic conductivity.(and transmissivity) estimates were then calculated from those results. The calculations forthe hydraulic conductivity estimates are provided in Appendix G.
At each of the traditional slug tested monitoring wells, the resting (static) waterlevel was measured along with the depth and diameter of the well. A pressure transducerwas installed within the screened portion of the tested well to record water level,measurements at 10 second intervals. Pressure transducers in immediately adjacent wellsalso recorded water level measurements at 10 second to one minute intervals. During thefirst part of the slug test a rod (slug) of approximately 7 feet long was quickly inserted intothe tested well below the water table in order to nearly instantaneously displace a volume ofwater equivalent to the volume of the slug. The raised head of the water column was thendissipated back down to its initial static level. When equilibration at static water level wasreached a rising head test was conducted. The slug was quickly withdrawn from themonitoring well, resulting in a nearly instantaneous decline in the water level within thetested well. The lowered head of the water column recovered to its initial static water level.
29
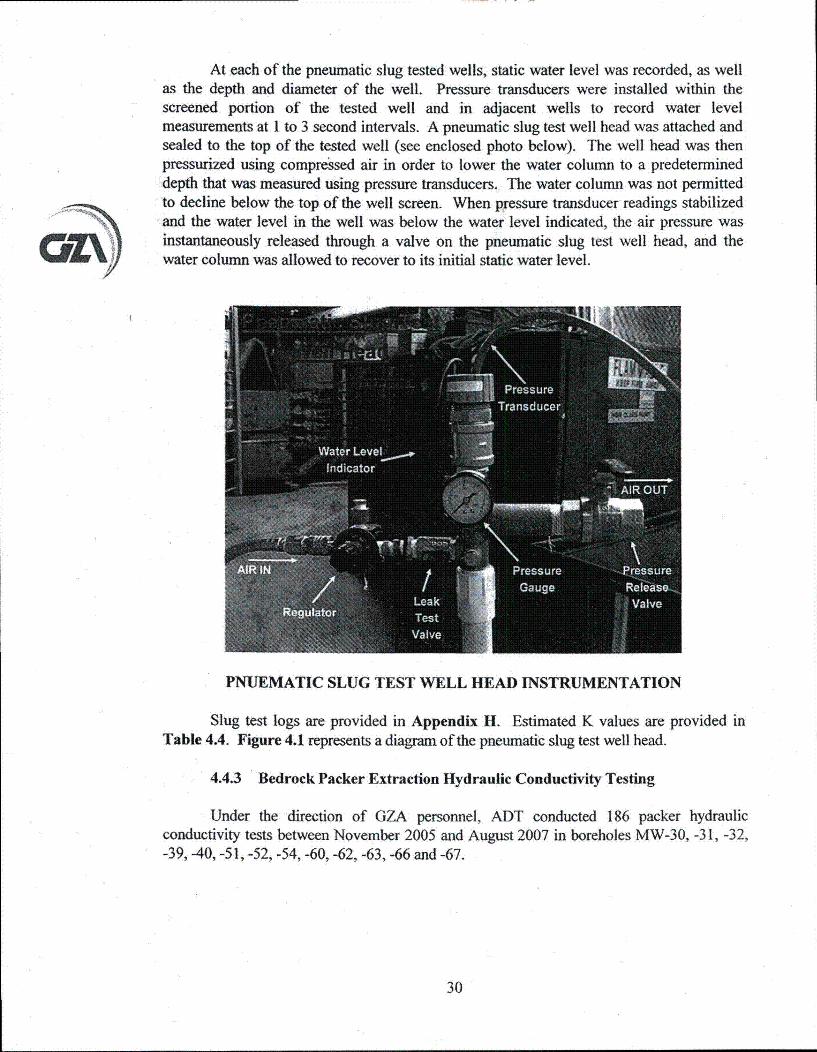
At each of the pneumatic slug tested wells, static water level was recorded, as wellas the depth and diameter of the well. Pressure transducers were installed within thescreened portion of the tested well and in adjacent wells to record water levelmeasurements at 1 to 3 second intervals. A pneumatic slug test well head was attached andsealed to the top of the tested well (see enclosed photo below). The well head was thenpressurized using compressed air in order to lower the water column to a predetermineddepth that was measured using pressure transducers. The water column was not permittedto decline below the top of the well screen. When pressure transducer readings stabilizedand the water level in the well was below the water level indicated, the air pressure wasinstantaneously released through a valve on the pneumatic slug test well head, and thewater column was allowed to recover to its initial static water level.07EV
PNUEMATIC SLUG TEST WELL HEAD INSTRUMENTATION
Slug test logs are provided in Appendix H. Estimated K values are provided inTable 4.4. Figure 4.1 represents a diagram of the pneumatic slug test well head.
4.4.3 Bedrock Packer Extraction Hydraulic Conductivity Testing
Under the direction of GZA personnel, ADT conducted 186 packer hydraulicconductivity tests between November 2005 and August 2007 in boreholes MW-30, -31, -32,-39, -40, -51, -52, -54, -60, -62, -63, -66 and -67.
30
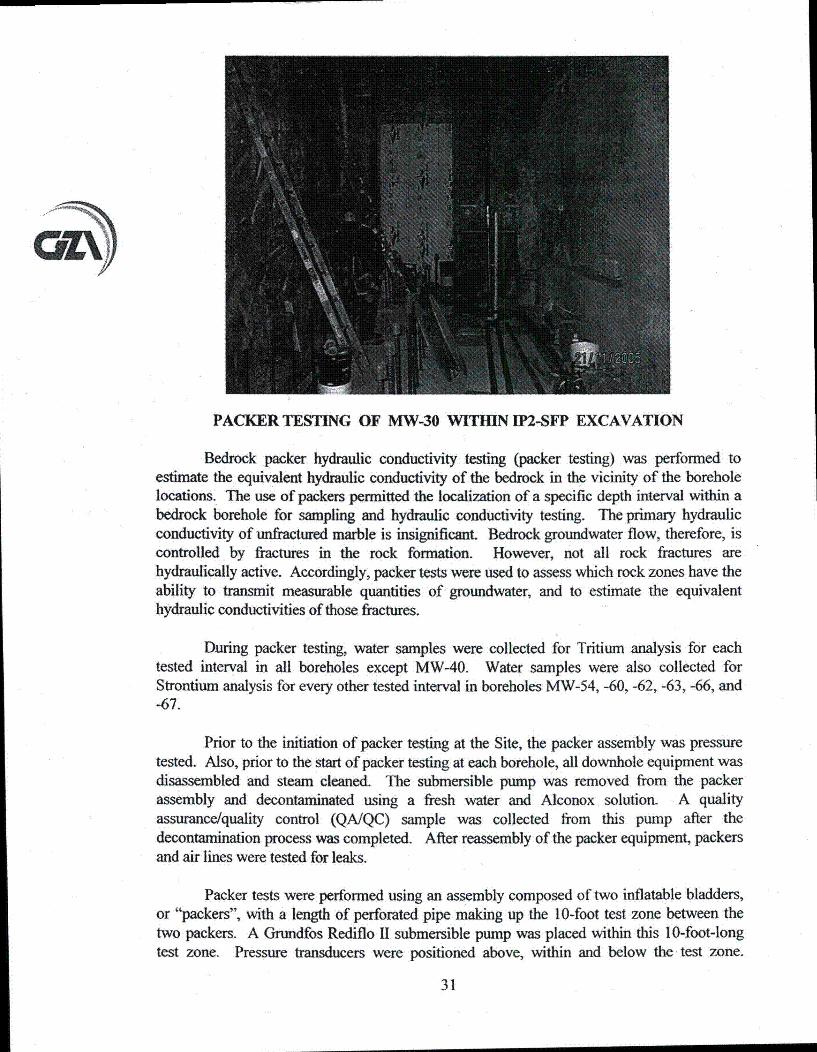
PACKER TESTING OF MW-30 WITHIN IP2-SFP EXCAVATION
Bedrock packer hydraulic conductivity testing (packer testing) was performed toestimate the equivalent hydraulic conductivity of the bedrock in the vicinity of the boreholelocations. The use of packers permitted the localization of a specific depth interval within abedrock borehole for sampling and hydraulic conductivity testing. The primary hydraulicconductivity of unfiactured marble is insignificant Bedrock groundwater flow, therefore, iscontrolled by fractures in the rock formation. However, not all rock fractures arehydraulically active. Accordingly, packer tests were used to assess which rock zones have theability to transmit measurable quantities of groundwater, and to estimate the equivalenthydraulic conductivities of those fractures.
During packer testing, water samples were collected for Tritium analysis for eachtested interval in all boreholes except MW-40. Water samples were also collected forStrontium analysis for every other tested interval in boreholes MW-54, -60, -62, -63, -66, and-67.
Prior to the initiation of packer testing at the Site, the packer assembly was pressuretested. Also, prior to the start of packer testing at each borehole, all downhole equipment wasdisassembled and steam cleaned. The submersible pump was removed from the packerassembly and decontaminated using a fresh water and Alconox solution. A qualityassurance/quality control (QA/QC) sample was collected from this pump after thedecontamination process was completed. After reassembly of the packer equipment, packersand air lines were tested for leaks.
Packer tests were performed using an assembly composed of two inflatable bladders,or "packers", with a length of perforated pipe making up the 10-foot test zone between thetwo packers. A Grundfos Rediflo II submersible pump was placed within this 10-foot-longtest zone. Pressure transducers were positioned above, within and below the test zone.
31
I
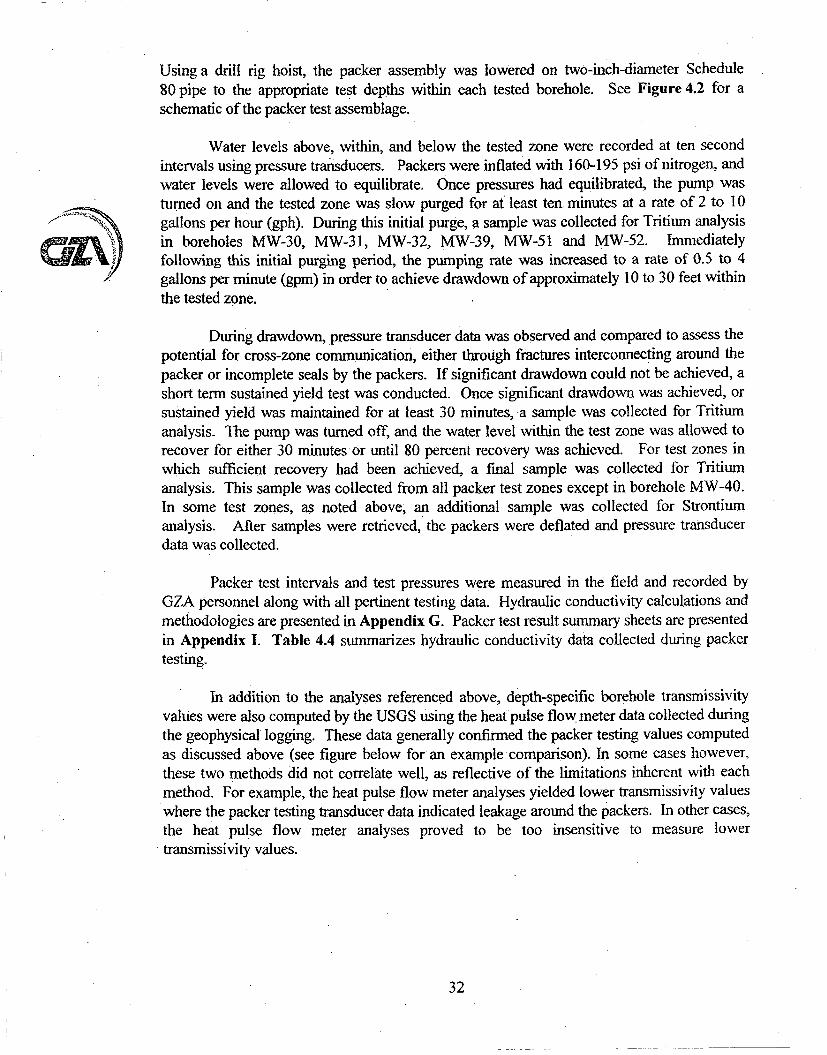
Using a drill rig hoist, the packer assembly was lowered on two-inch-diameter Schedule80 pipe to the appropriate test depths within each tested borehole. See Figure 4.2 for aschematic of the packer test assemblage.
Water levels above, within, and below the tested zone were recorded at ten secondintervals using pressure transducers. Packers were inflated with 160-195 psi of nitrogen, andwater levels were allowed to equilibrate. Once pressures had equilibrated, the pump wasturned on and the tested zone was slow purged for at least ten minutes at a rate of 2 to 10gallons per hour (gph). During this initial purge, a sample was collected for Tritium analysisin boreholes MW-30, MW-31, MW-32, MW-39, MW-51 and MW-52. Immediatelyfollowing this initial purging period, the pumping rate was increased to a rate of 0.5 to 4gallons per minute (gpm) in order to achieve drawdown of approximately 10 to 30 feet withinthe tested zone.
During drawdown, pressure transducer data was observed and compared to assess thepotential for cross-zone communication, either through fractures interconnecting around thepacker or incomplete seals by the packers. If significant drawdown could not be achieved, ashort term sustained yield test was conducted. Once significant drawdown was achieved, orsustained yield was maintained for at least 30 minutes, a sample was collected for Tritiumanalysis. The pump was turned off, and the water level within the test zone was allowed torecover for either 30 minutes or until 80 percent recovery was achieved. For test zones inwhich sufficient recovery had been achieved, a final sample was collected for Tritiumanalysis. This sample was collected from all packer test zones except in borehole MW-40.In some test zones, as noted above, an additional sample was collected for Strontiumanalysis. After samples were retrieved, the packers were deflated and pressure transducerdata was collected.
Packet test intervals and test pressures were measured in the field and recorded byGZA personnel along with all pertinent testing data. Hydraulic conductivity calculations andmethodologies are presented in Appendix G. Packer test result summary sheets are presentedin Appendix I. Table 4.4 summarizes hydraulic conductivity data collected during packertesting.
In addition to the analyses referenced above, depth-specific borehole transmissivityvalues were also computed by the USGS using the heat pulse flow. meter data collected duringthe geophysical logging. These data generally confrmed the packer testing values computedas discussed above (see figure below for an example comparison). In some cases however,these two methods did not correlate well, as reflective of the limitations inherent with eachmethod. For example, the heat pulse flow meter analyses yielded lower transmissivity valueswhere the packer testing transducer data indicated leakage around the packers. In other cases,the heat pulse flow meter analyses proved to be too insensitive to measure lowertransmissivity values.
32
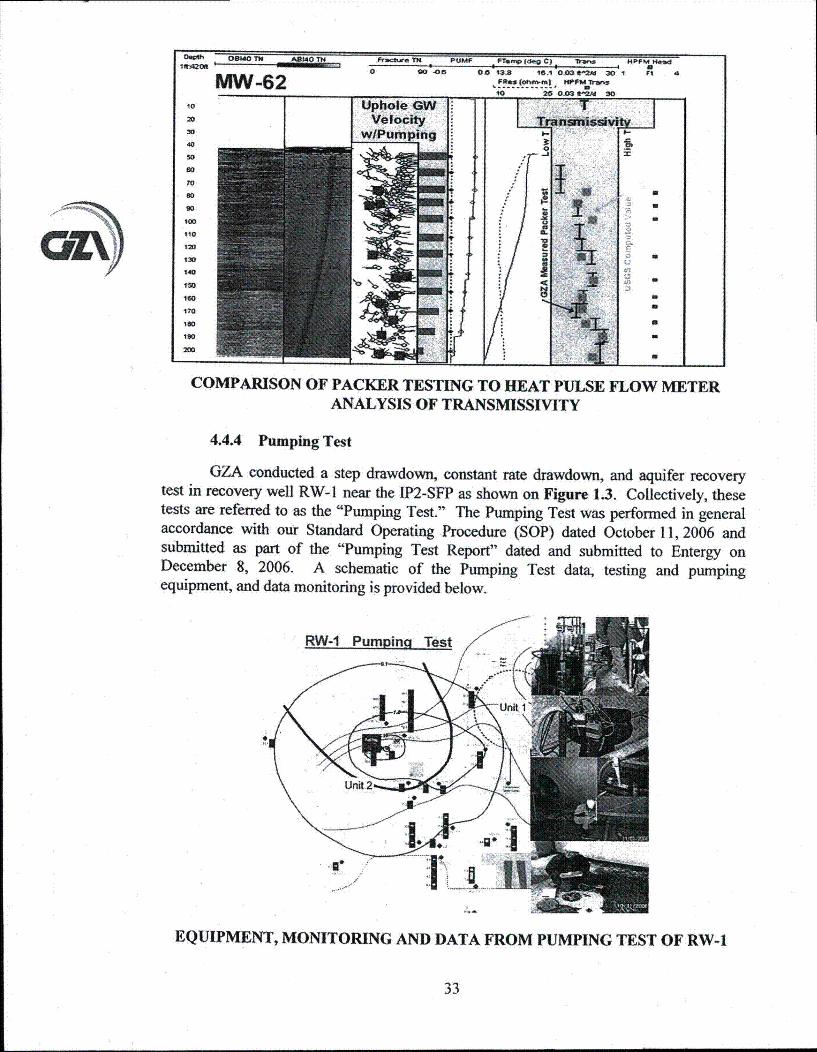
Ilb-
U ii
1WPE
ISO
ISO
COMPARISON OF PACKER TESTING TO HEAT PULSE FLOW METERANALYSIS OF TRANSMISSIVrTY
4.4.4 Pumping Test
GZA conducted a step drawdown, constant rate drawdown, and aquifer recoverytest in recovery well RW-1 near the IP2-SFP as shown on Figure 1.3. Collectively, thesetests are referred to as the "Pumping Test." The Pumping Test was performed in generalaccordance with our Standard Operating Procedure (SOP) dated October 11, 2006 andsubmitted as part of the "Pumping Test Report" dated and submitted to Entergy onDecember 8, 2006. A schematic of the Pumping Test data, testing and pumpingequipment, and data monitoring is provided below.
EQUIPMENT, MONITORING AND DATA FROM PUMPING TEST OF RW-1
33
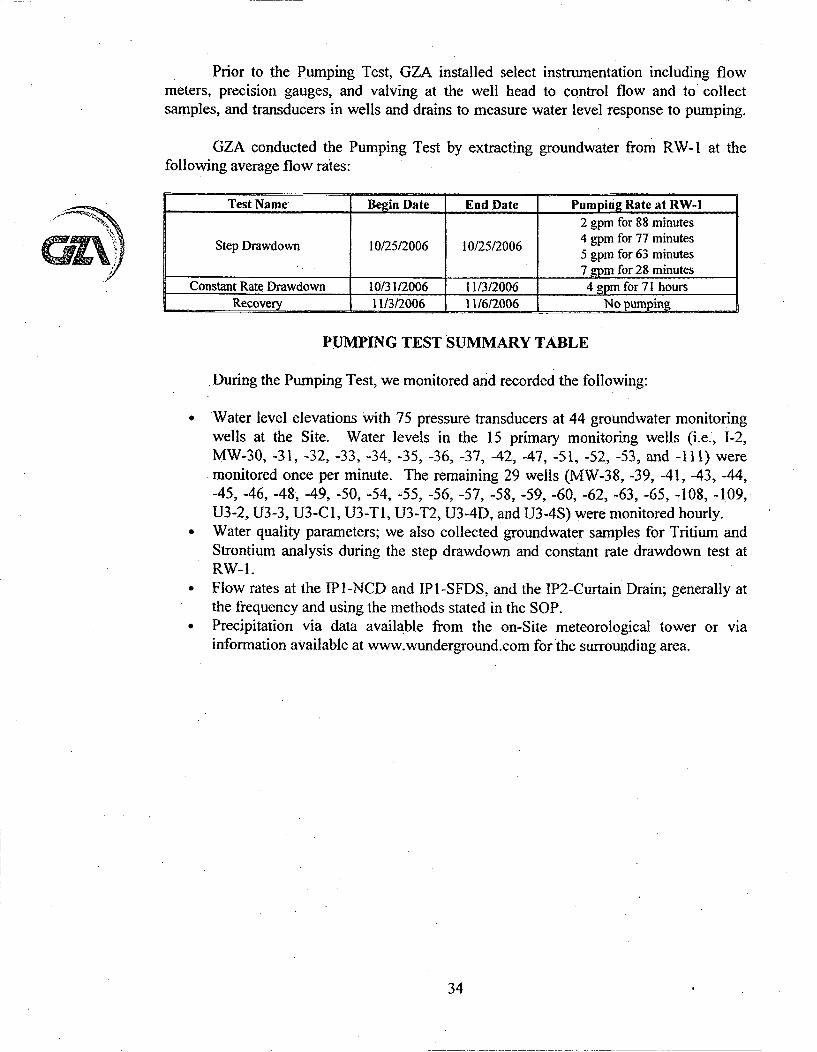
Prior to the Pumping Test, GZA installed select instrumentation including flowmeters, precision gauges, and valving at the well head to control flow and to collectsamples, and transducers in wells and drains to measure water level response to pumping.
GZA conducted the Pumping Test by extracting groundwater from RW-1 at thefollowing average flow rates:
Test Name Begin Date End Date Pumping Rate at RW-12 gpm for 88 minutes
Step Drawdown 10/25/2006 10/25/2006 4 wm for 77 minutes5 gpm for 63 minutes
_ _7 Mpm for 28 minutesConstant Rate Drawdown 10/31/2006 11/3/2006 4 gpm for 71 hours
11/3/2006 11/6/2006 No pumping
PUMPING TEST SUMMARY TABLE
During the Pumping Test, we monitored and recorded the following:
Water level elevations with 75 pressure transducers at 44 groundwater monitoringwells at the Site. Water levels in the 15 primary monitoring wells (i.e., 1-2,MW-30, -31, -32, -33, -34, -35, -36, -37, -42, -47, -51, -52, -53, and -111) weremonitored once per minute. The remaining 29 wells (MW-38, -39, -41, -43, -44,-45, -46, -48, -49, -50, -54, -55, -56, -57, -58, -59, -60, -62, -63, -65, -108, -109,U3-2, U3-3, U3-C1, U3-T1, U3-T2, U3-4D, and U3-4S) werermonitored hourly.Water quality parameters; we also collected groundwater samples for Tritium andStrontium analysis during the step drawdown and constant rate drawdown test atRW-1.
a Flow rates at the IPI-NCD and IPI-SFDS, and the IP2-Curtain Drain; generally atthe frequency and using the methods stated in the SOP.
0 Precipitation via data available from the on-Site meteorological tower or viainformation available at wwwv.wunderground.com for the surrounding area.
34
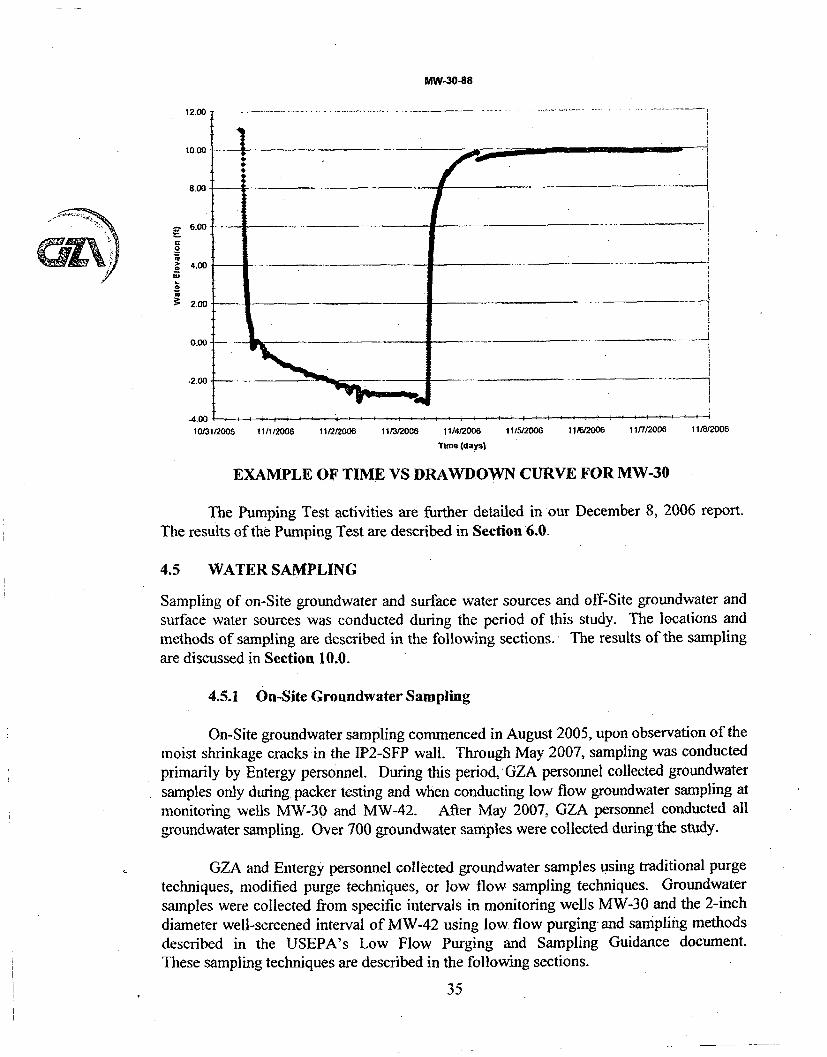
MW-30-88
12.00
. .. ,. 6.00 ... ......
4.00 --
0.00 ----
-2.00 _
-4010/31/2006 11/1/2006 11/2/2006 11/3/2006 11/4/2006 11/5/2006 1116/2006 11/7/2006 11/8/2006
Time (days)
EXAMPLE OF TIME VS DRAWDOWN CURVE FOR MW-30
The Pumping Test activities are further detailed in our December 8, 2006 report.The results of the Pumping Test are described in Section 6.0.
4.5 WATER SAMPLING
Sampling of on-Site groundwater and surface water sources and off-Site groundwater andsurface water sources was conducted during the period of this study. The locations andmethods of sampling are described in the following sections. The results of the samplingare discussed in Section 10.0.
4.5.1 On-Site Groundwater Sampling
On-Site groundwater sampling commenced in August 2005, upon observation of themoist shrinkage cracks in the 1P2-SFP wall. Through May 2007, sampling was conductedprimarily by Entergy personnel. During this period, GZA personnel collected groundwatersamples only during packer testing and when conducting low flow groundwater sampling atmonitoring wells MW-30 and MW-42. After May 2007, GZA personnel conducted allgroundwater sampling. Over 700 groundwater samples were collected during the study.
GZA and Entergy personnel collected groundwater samples using traditional purgetechniques, modified purge techniques, or low flow sampling techniques. Groundwatersamples were collected from specific intervals in monitoring wells MW-30 and the 2-inchdiameter well-screened interval of MW-42 using low flow purging and sampling methodsdescribed in the USEPA's Low Flow Purging and Sampling Guidance document.These sampling techniques are described in the following sections.
35
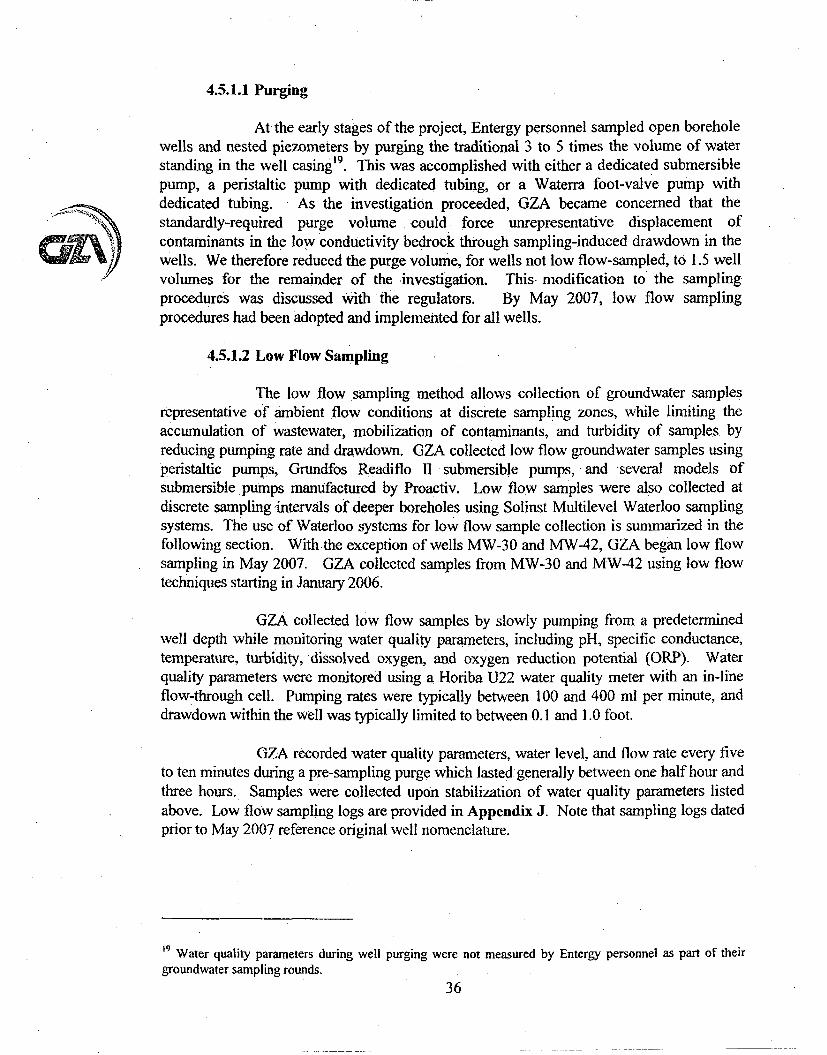
4.5.1.1 Purging
At the early stages of the project, Entergy personnel sampled open boreholewells and nested piezometers by purging the traditional 3 to 5 times the volume of waterstanding in the -well casing' 9. This was accomplished with either a dedicated submersiblepump, a peristaltic pump with dedicated tubing, or a Waterra foot-valve pump withdedicated tubing. As the investigation proceeded, GZA became concerned that thestandardly-required purge volume could force unrepresentative displacement ofcontaminants in the low conductivity bedrock through sampling-induced drawdown in thewells. We therefore reduced the purge volume, for wells not low flow-sampled, to 1.5 wellvolumes for the remainder of the :investigation. This- modification to the samplingprocedures was discussed With the regulators. By May 2007, low flow samplingprocedures had been adopted and implemented for all wells.
4.5.1.2 Low Flow Sampling
The low flow sampling method allows collection of groundwater samplesrepresentative of ambient flow conditions at discrete sampling zones, while limiting theaccumulation of wastewater, mobilization of contaminants, and turbidity of samples byreducing pumping rate and drawdown. GZA collected low flow groundwater samples usingperistaltic pumps, Grundfos Readiflo II submersible pumps, and several models ofsubmersible pumps manufactured by Proactiv. Low flow samples were also collected atdiscrete samplingintervals of deeper boreholes using Solinst Multilevel Waterloo samplingsystems. The use of Waterloo systems for low flow sample collection is summarized in thefollowing section. With the exception of wells MW-30 and MW-42, GZA began low flowsampling in May 2007. GZA collected samples from MW-30 and MW-42 using low flowtechniques starting in January 2006.
GZA collected low flow samples by slowly pumping from a predetenninedwell depth while monitoring water quality parameters, including pH, specific conductance,temperature, turbidity, dissolved oxygen, and oxygen reduction potential (ORP). Waterquality parameters were monitored using a Horiba U22 water quality meter with an in-lineflow-through cell. Pumping rates were typically between 100 and 400 ml per minute, anddrawdown within the well was typically limited to between 0.1 and 1.0 foot.
GZA recorded water quality parameters, water level, and flow rate every fiveto ten minutes during a pre-sampling purge which lasted generally between one half hour andthree hours. Samples were collected upon stabilization of water quality parameters listedabove. Low flow sampling logs are provided in Appendix J. Note that sampling logs datedprior to May 2007 reference original well nomenclature.
19 Water quality parameters during well purging were not measured by Entergy personnel as part of theirgroundwater sampling rounds.
36
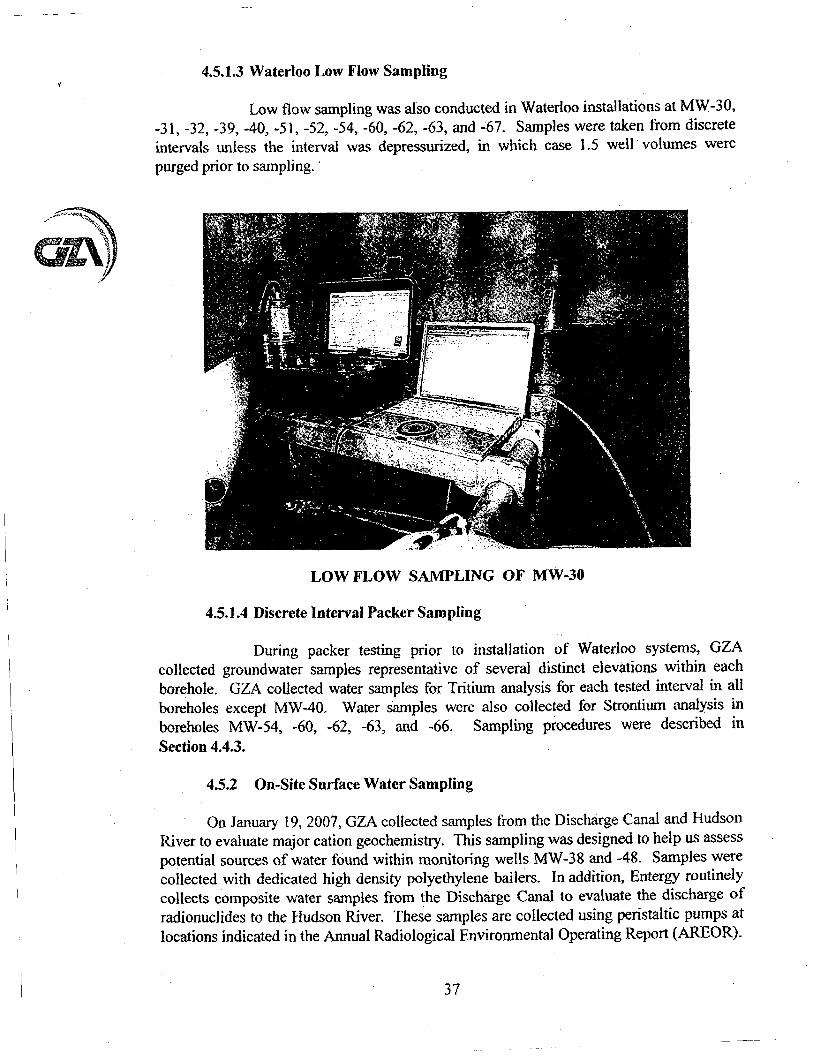
4.5.1.3 Waterloo Low Flow Sampling
Low flow sampling was also conducted in Waterloo installations at MW-30,-3-1, -32, -39, -40, -51, -52, -54, -60, -62, -63, and -67. Samples were taken from discreteintervals unless the interval was depressurized, in which case 1.5 well volumes werepurged prior to sampling.
/
... . .... ..-. : . • .
LOW FLOW SAMPLING OF MW-30
4.5.1.4 Discrete Interval Packer Sampling
During packer testing prior to installation of Waterloo systems, GZAcollected groundwater samples representative of several distinct elevations within eachborehole. GZA collected water samples for Tritium analysis for each tested interval in allboreholes except MW-40. Water samples were also collected for Strontium analysis inboreholes MW-54, -60, -62, -63, and -66. Sampling procedures were described inSection 4.4.3.
4.5.2. On-Site Surface Water Sampling
On January 19, 2007, GZA collected samples from the Discharge Canal and HudsonRiver to evaluate major cation geochemistry. This sampling was designed to help us assesspotential sources of water found within monitoring wells MW-38 and -48. Samples werecollected with dedicated high density polyethylene bailers. In addition, Entergy routinelycollects composite water samples from the Discharge Canal to evaluate the discharge ofradionuclides to the Hudson River. These samples are collected using peristaltic pumps atlocations indicated in the Annual Radiological Environmental Operating Report (AREOR).
37
4.5.3 Off-Site Groundwater Sampling
At the beginning stages of the investigation, prior to a thorough understanding ofthe hydrogeology of the Site, several off-Site groundwater wells were sampled by Entergypersonnel to assess the potential for off-Site contamination. These data are presented in theAREOR and the sampling is conducted under the Radiological Environmental MonitoringProgram (REMP). During the course of this study, the normal sampling frequencies wereincreased to either monthly or quarterly to assess regional background concentrations ofcontaminants of interest, These sampling points included: four USGS monitoring wells,three LaFarge property wells, and the Fifth Street well in Buchanan. Figure 4.3 shows thelocations of the USGS Wells. Figure 1.3 portrays the location of the LaFarge wells.Please refer to the AREOR for the location of the Fifth Street well.
USGS Wells - On December 5 and 6, 2006, GZA personnel, accompanied by aNew York State Department of Environmental Conservation (NYSDEC) representative,collected groundwater samples from four USGS groundwater monitoring wells to assessbackground concentrations for Tritium, Strontium and Cesium in the region. The wellswere located in Harriman State Park, Rockland County, (R0543); Carmel, New York,Putnam County (P1217); Fort Montgomery, New York, Orange County (local municipalwater monitoring well); and Doodletown, New York, Rockland County (RO18). All fourmonitoring wells were completed in bedrock. The NYSDEC provided GZA with boreholegeophysical data.. All four wells exhibited upward vertical gradients. GZA selectedsample locations based upon the flowmeter data so as to sample the groundwater at a depthjust below where it was presumed to be exiting the borehole. The groundwater sampleswere transported to Entergy under chain of custody procedures. Entergy personnel thenshipped the samples to Areva Laboratories in Westboro, Massachusetts for analysis ofTritium, Strontium and Cesium.
LaFarge Wells - GZA personnel supervised the collection of groundwater. samplesfrom the Lafarge property immediately South of the Site from groundwater monitoringwells MW-I through MW-3. Samples were collected by LaFarge's environmentalconsultant, Groundwater and Environmental Services, Inc., under the oversight of Entergypersonnel, GZA and NYSDEC representatives on September 19, 2006. Groundwatersamples were collected using a bladder pump following low flow procedures describedbelow. The depths of the wells are shown on Table 4.1.
Fifth Street Well - Entergy personnel, accompanied by NRC and NYSDECpersonnel, collected samples from the Fifth Street well in Buchanan, New York onNovember 30, 2005. This well is a former private drinking water well no longer in use.
4.5.4 Off-Site Surface Water Sampling
During the course of this study, off-Site surface water was sampled at the followinglocations: the Camp Field Reservoir and the New Croton Reservoir, Algonquin Creek,Trap Rock Quarry, the LaFarge property (Gypsum Plant) outfall, and the Hudson River(see Figure 4.4 for the locations of the Reservoirs). The sampling frequency discussed inthe AREOR was increased during the investigation. Detailed sample locations arediscussed in the AREOR.
38
4.6 PIEZOMETRIC LEVELS AND PRESSURE TRANSDUCER DATA
GZA measured piezometric levels at 67 locations at the Site over time (between October 2005and September 2007) using a system of electronic pressure transducers. These measurementswere converted to groundwater elevations (NGVD 29) by referencing the depth of thetransducer below the water table at a given time to the elevation of the top of the monitoringwell riser. GZA used the resulting data to estimate hydraulic properties of the soil andbedrock, and assess the effects of precipitation, tidal influences, seasonality, and pumping ongroundwater flow patterns.
This section describes the methods we used to collect and manage this data. Discussions onthe use of the data are presented in Sections 6.0 and 10.0.
4.6.1 Transducer Types and Data Retrieval
GZA used two types of transducers, depending on the well type and application.In open wells, GZA installed MiniTroll and LevelTroll transducers, which are ventedpneumatic transducers with internal dataloggers. These transducers are manufactured byIn-Situ® Inc. In wells equipped with Waterloo systems, GZA installed non-vented vibratingwire transducers manufactured by Geokon® Inc. Each of these transducers was connected toa Geokon datalogger box located within the well vault.
GZA selected and installed pressure transducers within the appropriate operatingpressure range required for each well or well interval. Table 4.5 provides the accuracy of thetransducers as reported by In-Situ and Geokon. This table also provides the type of transducerused in each well or well interval.
GZA collected data from In-Situ transducers typically every one to three months, oras needed. We exported data collected from each transducer from data files recognizableonly by Win-Situ software into Microsoft@ Excel® spreadsheets. Generally, no externaldata manipulation was required for these data reports. On occasion, adjustments to datawere required to correct for daylight savings time, or to correct for measured disturbance ofthe transducer position within the well.
GZA collected water level data from each Geokon datalogger typically every twoweeks to two months, or as needed. After collection, we exported the raw data into Excelspreadsheets and converted reported water levels to water elevations. Because the Geokontransducers are not vented, we adjusted total pressures to account for barometric pressurechanges. Into each data report, GZA incorporated: 1) the barometer reading recordedduring wellhead zeroing of the respective transducer; and 2) the barometric pressuresrecorded at or near the Site at the time the total pressures were recorded. Barometricpressures for this project were recorded on an on-going basis on Site using a Geokontransducer exposed to atmosphere. At different times, the barometric pressure transducerwas installed several feet above the maximum water table in MW-3 1, MW-65, andMW-56. For verification, GZA also used barometric pressure data collected by West PointMilitary Academy, less than ten miles from the Site.
39
4.6.2 Data Availability and Preservation
A compact disk containing piezometric data collected between October 2005 andSeptember 2007 is provided in Appendix K. The data is organized by well number inExcel spreadsheets. Note that piezometric data dated prior to May 2007 reference originalwell nomenclature.
Graphs of water levels between October 2005 and February 2007 are presented inS. .Appendix L. Transducer installation logs are provided in Appendix M. As indicated by
* • the legend on the first sheet of this Appendix, colors on these graphs illustrate changes in/ groundwater temperature. Each graph presents water levels from wells that are grouped
together based on proximity to each other and association with selected Site features.Well locations are shown in Figure 1.3.
4.7 TRACER TESTING
To further test the Conceptual Site Model and assess groundwater flow paths from thesource areas, GZA conducted an organic tracer test consisting of the injection ofFluorescein (a common dye used in anti-freeze) at a tracer introduction point located closeto a potential source of Tritium at IP2-FSB. The injection well was installedapproximately four feet South of the expansion crack observed in the South wall of theIP2-SFP, adjacent to monitoring well MW-30. The injection well was designed to allowthe injection of tracer onto the top of bedrock located at elevation 52 feet. This elevationcorresponds to the bottom of the IP2-SFP. Tracer was then gravity fed into the injectionwell and flushed with water. After injection, routine sampling and monitoring for the
20presence of tracer in Site wells commenced and continued for 27 weeks
The tracer introduction was made on February 8. 2007. Tap water was introduced into theinjection well adjacent to MW-30 beginning at 10:30 hours. By 10-41 hours, 30 gallons ofwater had been introduced into the injection well to wet the surfaces of the material downgradient from the injection well. The water introduction was then suspended while tenpounds of Fluorescein dye mixture containing approximately 75% dye and 25% diluent, allof which had previously been dissolved in ten gallons of water, was introduced into theinjection well. The dye mixture was introduced between 10:42 and 10:50 hours. Tap waterintroduction was resumed at 10:51 hours and continued until 11:40 hours. A total of210 gallons of water was used: 30 gallons to wet the surfaces, 10 gallons to dissolve thetracer, and 170 gallons to flush the tracer out of the dry well into the surrounding bedrockfracture system. Water introduction was made at a mean rate of three gallons per minute.
Sampling and monitoring continued through mid-August 2007, which constituted thecompletion of the test. The well locations monitored during the organic tracer test and thesampling results are presented in Appendix N.
20 In addition to the routine sampling, specific wells were sampled for a longer period of time as part of shortterm variability testing (see Section 9.0).
40
The following sections describe the key elements of the test. The results of the tracer testare discussed in Section 7.0.
4.7.1 Injection Well Construction
Following excavation of soil and rock along the southern wall of the IP2-SFP forthe construction of a new foundation for a heavier crane, the top of rock was exposed alongthe South wall of the IP2-SFP at elevation 52 feet. Prior to pouring a mud-mat,construction of the crane foundation and backfilling of the excavation, GZA installed onegroundwater monitoring well (MW-30) and one dye injection well. The dye injection wellwas constructed of one-inch Schedule 40 PVC pipe which terminated at elevation 52 feet.In order to provide a reservoir for the dye to accumulate in prior to seeping into bedrockfractures, a one-foot-thick layer of ¾-inch crushed stone was placed on the top of rock overan. area approximately 6 feet by 6 feet square. A'mud-mat was poured over the crushedstone layer and across the entire floor of the excavation. The excavation was thenbackfilled. This injection well design allowed for the dye to be injected on the top of rockand infiltrate into the bedrock in a similar manner as water leaking from the South wall ofthe IP2-SFP.
4.7.2 Background Sampling
Prior to injection of dye, GZA collected background samples to assess the potentialof Fluorescein to be present in the subsurface. Almost all sample locations (whichincluded manholes, surface water bodies, nested wells, Waterloo wells) were sampled forapproximately one week periods two to five times prior to dye introduction. This set ofdata helped in the selection of dye type and quantity, and assured that background levels ofFluorescein were not an obstacle to conducting the groundwater tracing investigation.
4.7.3 Sampling Stations
Sampling stations were selected by GZA for their relevance to the project.Some stations were established as control stations. Control stations were established todetect any fluorescent compounds not introduced as part of this investigation which mightenter the study area- Most sampling stations were established to detect dyes introducedduring this investigation.
Sampling stations included manholes into the Site drainage system, open waterssuch as the Discharge Canal and the Hudson River, clusters of nested wells, open boreholewells, and wells with Waterloo packer systems installed. Primary reliance for the detectionof dye was placed on activated carbon samplers except at Waterloo locations. One carbonsampler was placed in each well and two were placed in open water locations and inmanholes. Open water locations may have strong currents that could damage or wash awaya sampler. Placing two samplers at these locations helped ensure that data would becollected for any given time interval and provided duplicate samples for quality assurance.At Waterloo wells, water was the only sampling medium.
Carbon samplers are continuous, accumulative samplers that virtually assure thatdye migrating with groundwater is not missed at sampling locations. These samplers,
41

however, provide information on the concentration of dye at a specific time.Because water is an instantaneous sample instead of a continuous sample the Waterloowells were sampled more frequently.
The sampling schedule was designed to help ensure that the time the tracer arrivedwas recorded, and that it would be unlikely that a transient event would fail to be detectedat any sampling location. The latter point only applies to the Waterloo sampling locations,since carbon packets collect samples continuously. Grab samples of water only representthe conditions at the instant the water is collected.
High frequency (or high intensity) sampling stations were selected based primarilyon three criteria:
• The boundaries of the Unit 1 plume. Most wells that are located within the plumewere sampled frequently.
• The premise that non-detections of dye could be as important as detections.Therefore, a "halo" of wells expected to have no detectable dye were. sampledsurrounding the Unit I plume so that the boundaries of the tracer plume would bewell defined.
* That there was the possibility of poor correspondence between the tracer plume andthe Unit 1 plume at some locations, and that the network might have to be adjustedto maintain the halo of non-detection sampling locations. This resulted in frequentreview of the sampling network, and sampling stations were moved from the lowintensity to high intensity sampling schedule as tracer was detected near themargins of the high intensity sampling network.
4.7.4 Analysis Schedule
Samples were typically shipped from the Site on the sample collection day or the nextday to accommodate next day delivery. Primary samples (both carbon and water) wereanalyzed within five working days after receipt. Water samples analyzed because of tracerdetections in the associated carbon samplers were analyzed within five working daysfollowing the carbon analyses. Results were communicated to both Ozark UndergroundLaboratory (OUL) and GZA project management for review of the detections andconsideration of whether or not the sampling network should be modified.
4.8 ADDITIONAL GEOPHYSICAL TESTING TO EVALUATE FLOW PATHS
In addition to the downhole geophysical testing described in Section 4.2.4, a series ofgeophysical surveys was conducted to assess the depth to bedrock in certain areas of theSite and to identify the potential presence of preferential groundwater flow paths alongutility trenches cut into bedrock. The major findings of the surveys are graphically shownon Figure 1.3.
Under the oversight of GZA, AGS conducted surface geophysical surveys to assess depth tobedrock within the IP2-TY, along the North side of IP2-Turbine Generator Building (TB),within the IP3-TY and along the OCA access road on the southern side of the ProtectedArea. AGS used ground penetrating radar (GPR) and electromagnetic (EM) survey
42
equipment to complete the surveys. The survey reports are attached in Appendix 0. Theresults of the surveys indicate that bedrock is fairly shallow beneath the areas investigated,except for the areas along the Hudson River where the depth to bedrock increases.
Specifically, the following work was completed:
* A GPR survey was conducted to assess depth to bedrock and potential utilitytrenches cut into bedrock in the IP3-TY.
• A GPR survey was conducted to assess the potential for contaminants to entergroundwater through leaking stormwater pipes (E-Series) and flow withgroundwater towards the Hudson River within utility trenches cut into rock alongthe OCA access road on the South side of the Protected Area, and to identify depthto bedrock and any utility trenches cut into rock along this roadway.
. In order to assess the presence of subsurface utility trenches to provide preferentialpathways for contaminated groundwater to flow to the North, thus accounting forthe impacts to groundwater observed in monitoring well MW-48 and MW-38, AGSperformed a geophysical survey consisting of a seismic refraction survey, GPRsurvey, and an EM survey to provide information on bedrock topography on thesouthern side of the Site between the Protected Area and the southern warehouse.
• In addition, several utilities were identified using EM survey techniques. However,no information regarding the nature of the backfill along the utilities could bediscerned from the geophysical information.
)
The findings of the geophysical survey work are discussed in Section 6.0.
43
5.0 LABORATORY TESTING
Entergy and GZA arranged for, and managed, the analyses of groundwater samples.Between October 2005 and the end of September 2007, over 700 samples were analyzedfor radiological contaminants, and, as part of the tracer test, nearly 4,400 samples wereanalyzed for Fluorescein. In addition, a limited number of samples were analyzed forselected water quality parameters. This section describes the respective testing programsas well as some of the Quality Assurance/Quality Control (QA/QC) procedures used to
-Aso assess the validity of the data.
5.1 RADIOLOGICAL
Entergy and GZA personnel both collected groundwater samples for radiological analysisfrom existing and newly installed wells between October 2005 and September 2007.Groundwater samples were sent by Entergy personnel via chain of custody to outsidelaboratories for analysis of select parameters including Tritium, Strontium, gamma emitters(including Cesium, and Cobalt), and Nickel2 1: Samples were analyzed at the followinglaboratories: IPEC, Teledyne Brown Engineering, Inc., located at 2508 Quality Lane,Knoxville, Tennessee; Areva NP, Inc. located at 29 Research Drive, Westboro,Massachusetts; James A Fitzpatrick, NPP Environmental Laboratory, located at 268 LakeRoad, Lycoming, New York; and General Engineering Laboratories located at 2040 SavageRoad, Charleston, South Carolina. The results of the groundwater analyses aresummarized in Table 5.1. Note that the sample nomenclature for groundwater analytical.data collected after May 2007 are provided in the figures, however, location nomenclatureprior to May 2007 may differ 22 due to subsequent casing reference point upgrades.
5.1.1 Hydrogeologic Site Investigation Analytical Data
Groundwater samples were typically analyzed for the following: Tritium by EPAMethod 906; Strontium by EPA Method 905; and gamma emitters (including Cesium andCobalt). In addition, transuranics and Nickel (as well as other "hard to detect"radionuclides) were also analyzed in specific instances, as appropriate.
Quality control criteria utilized during this investigation included the following asappropriate: laboratory blanks; field duplicates; laboratory duplicates; laboratory controlsamples; matrix spikes and matrix spike duplicates; initial and continuing calibrations;instrument tuning; internal standards; and regulatory split samples.
2' Tritium and Strontium were the primary radionuclides focused on during the current work pursuant to source
identification, groundwater flow analysis and contaminant plume delineation. Radionuclides other than Tritium andStrontium also exist to a limited, extent and arc fully addressed within the context of the Unit 2 Tritium and Unit IStrontium discussions.2 See Section 4.3.4. Note, however: 1) Hligh priority and fast track sampling preceded casing elevation surveys andvault installation in several cases, 2) low flow sampling within a well screen resulted in collection of samples at depthsdiffering from the well nomenclature, and 3) reinstallation of Waterloo multilevel wells to upgrade packer assemblies. Inaddition, sample intervals are designated by depth from top of casing,
44
An overall evaluation of the data indicates that the sample handling, shipment andanalytical procedures have been complied with, and the analytical results should beuseable. However, during one time period (August and September 2006), Strontiumanalytical results from Teledyne Brown Engineering, Inc. were as much as an order ofmagnitude different than split samples analyzed by the NRC and the NYSDOH.(Following verification of this information, the laboratory was dropped from theinvestigation program.) Therefore, that sample set was not utilized as part of theinvestigation.
Data Collection and Tracking
The data collection and data tracking phase included the following:
" Preparing all sample bottle labels and chain-of-custody forms;" Documenting all required data in field log books and field logs;" Performing data entry of the sampling information into Entergy's database
system; and• Quality assurance/quality control reviews of all data entry.
Laboratory Analysis
The laboratory analysis phase included the following:
* Regular communication between the laboratory and the project laboratory datamanager;
* Reviewing the laboratory's sample receipt acknowledgement form;0 Documenting the project's progress in Entergy's database system; and• Laboratory preparation of the Electronic Data Deliverable (EDD).
Data Loading
The data loading phase included the following:
4
4
4
Loading all EDDs into the database;Resolving any data loading issues;Creating a post-load report for content review; andNotifying the project team when EDDs were available.
Data Visualization and Analysis
The data visualization and analysis phase included the initial data review by theproject team and the production of data queries and draft reports to interpret the data. Thisphase was accomplished through the use of query tools and preformatted reports in thedatabase.
45
5.2 ORGANIC TRACER
Sampling for the tracer was based on both activated carbon samplers and on grab watersamples. All analyses were conducted using a Shimadzu RF5301 fluorescencespectrophotometer operated under a synchronous scan protocol. Details of the analytical.approach are presented in the Ozark Underground Laboratory (OUL) procedures andcriteria document (Appendix P).
5.3 WATER QUALITY PARAMETERS
Groundwater samples were collected from monitoring wells MW-38, MW-48-23, andMW-48-38 and also from the Discharge Canal and Hudson River. The groundwater wascollected as a grab sample using low flow sampling techniques. The surface water samplesfrom the top of the water column were collected using bailers. The samples were collectedat high and low tides. Groundwater samples were also collected at mid tide23. Thesamples were sent under chain-of-custody procedures to Life Science Laboratories, Inc.,Brittonfield Parkway, Suite 200, East Syracuse, NY 13057. The samples were analyzedfor Bicarbonate Alkalinity (as CaCO 3) under EPA Method M2320; Iron, Magnesium,Sodium, and Calcium under EPA Method 6010; and Sulfate and Chloride under EPAMethod E300.
23 Sample nomenclature was as follows: Monitoring Location Name-Depth Interval (if applicable). Tide Interval
(HeHigh, M=Mid, L=Low) and replicate number (if applicable).
46
6.0 HYDROGEOLOGIC SETTING
This section describes the hydrogeologic setting at IPEC. Our description is based on aliterature search and the findings of our field investigation program. The hydrogeology isdescribed in reference to' the two components of an unconfined aquifer found at IPEC;overburden and bedrock. Both the overburden (in select areas) and bedrock aregroundwater-bearing zones which are monitored at the Site. Refer to Section 4.0 for asummary of the groundwater monitoring system.
6.1 REGIONAL SETTING
The surface topography in the region of the Site slopes downward relatively steeplytowards the Hudson River and is characterized by ground surface elevations rangingbetween approximately 10 and approximately 140 feet above the National GeodeticVertical Datum of 1929 (NGVD 29). Refer to Figures 1.3 and 3.2 for Site and regionaltopographical maps.
The Hudson River is a tidally influenced estuary in the vicinity of the Site, generallyexperiencing two high tides and two low tides daily. Near high tide, the river experiences aflood current running North. Near low tide, the river experiences an ebb current flowingSouth. Surface water elevations of the Hudson River as measured at Peekskill, NY,approximately two miles North of the Site, from October 20, 2005 through May 8, 2006have ranged from -1.31 feet to 3.26 feet NGVD 29. On-Site measurements indicate thatthe Hudson River elevations vary between -1.1 feet to 3.8 feet NGVD 29.
Other surface water features include the cooling water Discharge Canal with a meansurface water elevation of approximately 1.7 feet above the Hudson River. The DischargeCanal is shown on Figure 1.3. The Discharge Canal conveys up to 1.76 million gallons perminute (MGM) from Units 2 and 3, discharging to the Hudson River. As shown on cross-sections A-A' and B-B' on Figure 1.3, the walls of the canal are constructed of lowstructural concrete. However, the current condition and thickness of the canal bottom isvariable and appears to range from a 0.5-foot-thick mud slab in the IP2 area (based onconstruction drawings) to a bedrock bottom in the IP I area.
Stormwater at developed portions of the region and Site is directed towards and collectedin catch basins and discharged to surface water bodies. Stormwater discharges from theSite are routed to the cooling water Discharge Canal24, the Hudson River, or thegroundwater regime through leaks from the storm system.
6.2 GROUNDWATER RECHARGE
Groundwater recharge at and near the Site is limited to precipitation. That is, there is nosignificant artificial recharge or irrigation in the area. Precipitation in the vicinity of the
24 There are stormwater outfalls that discharge directly to the Hludson River.
47
Site is approximately 36 inches per year2'. Recognizing that a portion of precipitation islost to evaporation, transpiration, and run-off, direct recharge to an aquifer was estimated.Large scale modeling performed by the USGS for Westchester County, NY26, suggests thatgroundwater recharge to glacial till-covered bedrock hills, typical of the conditions nearIndian Point, ranges from 3.6 to 7.5 inches per year with an average of 5.5 inches per year.Our experience in a similar hydrogeologic setting27 found higher natural recharge rates,averaging approximately 10 inches per year. Considering all available information, webelieve recharge at the Site is between 1/10 and 1/3 of precipitation. Based on ourevaluation, we estimate recharge on and up-gradient of the Site is approximately 10inches/year 28. Note that for the purposes of this study (as opposed to water supplyevaluations), it is conservative to use high estimates for recharge.
6.3 GROUNDWATER DISCHARGE
Groundwater flows from areas of higher heads to areas of lower heads along the path ofleast resistance. At the Site, discharge from the groundwater occurs into the DischargeCanal, the Hudson River, and to system underdrains. As evidenced by Site groundwatercontours, groundwater discharge is not uniform along the -river or to the Discharge Canal.That is, the aquifer in aieas of the Site with higher transmissivities (lower resistance toflow) will discharge more water than other areas. Similarly, the water table fluctuatesseasonally (due to long term changes in average recharge rates) and locally during rainfallevents and periods of snow melt. Consequently, groundwater discharge is not constant intime. Additionally, changes in the river %elevation cause additional short term variations indischarge rates.
The Hudson River is the regional sink in the area. As such, groundwater from the uplandareas to either side of the river valley flow towards and discharge to the river underambient conditions, see Figure 6.10. Groundwater from IPEC does not flow under theriver to the other side (e.g., to Rockland County) under ambient conditions. Further,because of the hydraulic properties of the bedrock, as well as the size of the Hudson Riverin this area, there is no reason to believe that pumping or injection (non-ambientconditions) could induce such flows.
This precipitation value is a 10 year average of data available from the on-Site meteorological station.26 USGS. Water Use, Ground-Water Recharge and Availability, and Quality of•Water in the Greenwich Area. Fairfield
County, Connecticut and Westchester County, New York,. 2000-2002.27 Calibrated Groundwater Model, Central Landfill Super Fund Site, Johnston Rhode Island. June 200628 Areal Recharge varies temporarily and spatially. The average of 10 inches per year is an estimated watershed-wide,long term average. The development at the Site induces additional runoff. We believe that this potential decrease inareal recharge is offset by recharge from exfiltration of leaky stormwater systems. As discussed in Section 6.7. thisappears to be the case.
48
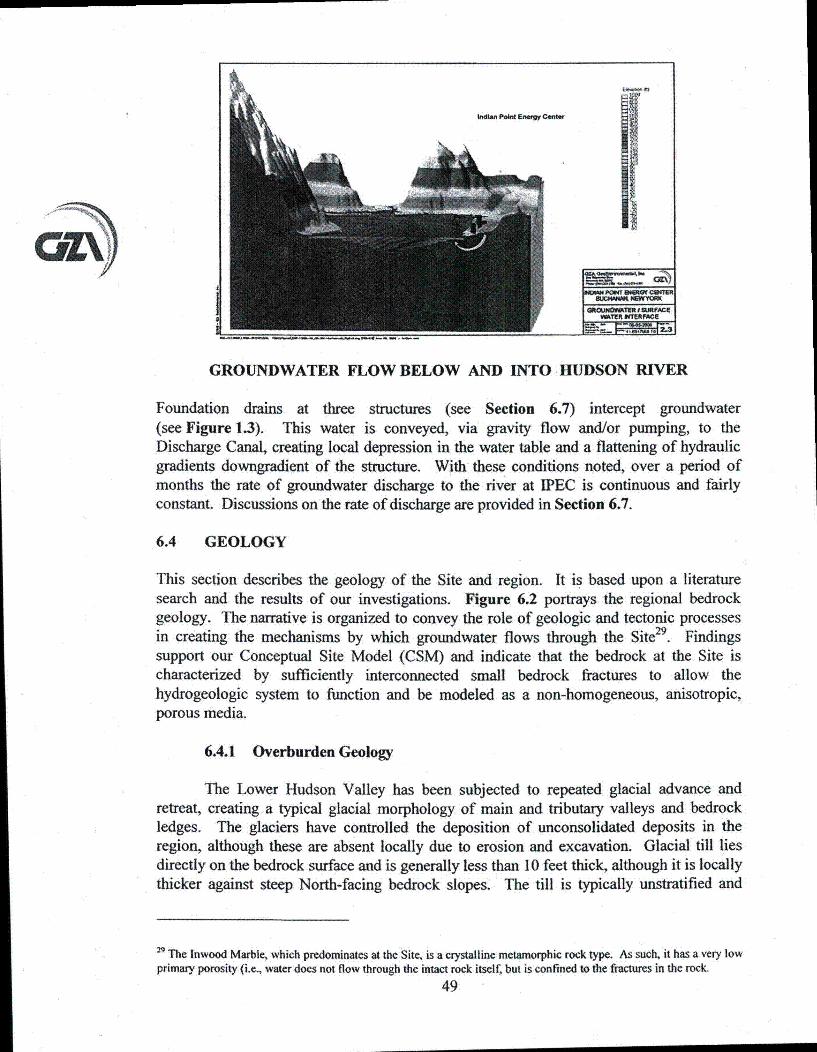
dm~CaTROLGRW MFAC.CVATER NTRrME
3-=Z P77Mý.2.3
GROUNDWATER FLOW BELOW AND INTO HUDSON RIVER
Foundation drains at three structures (see Section 6.7) intercept groundwater(see Figure 1.3). This water is conveyed, via gravity flow and/or pumping, to theDischarge Canal, creating local depression in the water table and a flattening of hydraulicgradients downgradient of the structure. With these conditions noted, over a period ofmonths the rate of groundwater discharge to the river at IPEC is continuous and fairlyconstant. Discussions on the rate of discharge are provided in Section 6.7.
6.4 GEOLOGY
This section describes the geology of the Site and region. It is based upon a literaturesearch and the results of our investigations. Figure 6.2 portrays the regional bedrockgeology. The narrative is organized to convey the role of geologic and tectonic processesin creating the mechanisms by which groundwater flows through the Site29. Findingssupport our Conceptual Site Model (CSM) and indicate that the bedrock at the Site ischaracterized by sufficiently interconnected small bedrock fractures to allow thehydrogeologic system to function and be modeled as a non-homogeneous, anisotropic,porous media.
6.4.1 Overburden Geology
The Lower Hudson Valley has been subjected to repeated glacial advance andretreat, creating a typical glacial morphology of main and tributary valleys and bedrockledges. The glaciers have controlled the deposition of unconsolidated deposits in theregion, although these are absent locally due to erosion and excavation. Glacial till liesdirectly on the bedrock surface and is generally less than 10 feet thick, although it is locallythicker against steep North-facing bedrock slopes. The till is typically unstratified and
" The Inwood Marble, which predominates at the Site, is a crystalline metamorphic rock type. As such, it has a very lowprimary porosity (i.e. water does not flow through the intact rock itself, but is confined to the fractures in the rock.
49
poorly sorted. Locally, it consists of a silty, fine- to medium-grained, brown, sandy matrixcontaining fine gravel to boulder-size bedrock fragments. Fluvial and lacustrine glacialdeposits occur in valley bottoms and valley walls. The glacio-fluvial deposits are typicallymedium to coarse sand and gravel with minor silt. The lacustrine deposits are finelylaminated and varved clays fining upwards to fine- to medium-grained sand, and thefluvial/deltaic sediments are mixtures of coarser sands and gravels and finer sands to clays.Recent deposits are essentially flood plain and marsh deposits along the Hudson River, itstributaries, and small enclosed drainage basins.
Overburden geology at the Site is limited to a layer ranging from ground surface tobetween 3.5 and 59 feet below ground surface (bgs), with thicknesses generally increasingtowards the Hudson River. Overburden materials are dominated by anthropogenic fill(borings MW-41, -49, -52, as well as the upper 20 feet of -39, -48, -61, -62, -63, -66 and67). Soil-based fill materials at the Site consist primarily of silty clay, sand and gravelmixtures (i.e., regraded/transported on-site glacial till) or gravel/cobble/boulder-size blastrock. In areas adjacent to structures excavated into bedrock, the fill occurs as concrete,.compacted granular soils, and blast rock fill. Native materials occur as open areas ofglacial till overlying bedrock, or silty clays, organic silt and clay, and sandy materialoverlain by granular fill. A 20- to 50-foot-thick sequence of river sediments (organic silts)is found along the Hudson River above bedrock in borings MW-38, -48, -61, -62, -63, -66and 67 The approximate location of natural materials is shown on Figure 6.3.
6.4.2 Bedrock Geology
The geology of the Site has been investigated and reported by Dames & Moore(1975) prior to this program. Figures 6.2 and 6.4 show the bedrock geology of the regionand the Site, respectively. The current investigations have added substantial detail to thisassessment which shows that the bedrock beneath the Site is considerably fractured andcontains sufficient interconnectivity to support groundwater flow, at the scale of the Site, asflow through a non-homogeneous, anisotropic, porous. media.
The Site is located in a complex of Cambro-Ordovician rocks represented by theManhattan Formation and Inwood Marble Formation in angular unconformity. The Sitelies predominantly upon the Inwood Marble Formation as an angular unconformity withthe Manhattan Formation. The oldest rock is the Inwood Formation, which was derivedfrom deposition of carbonate materials in a shallow inland sea during the Cambrianthrough the early Ordovician period. The Manhattan Formation is interpreted to post-datethe Middle Ordovician regional unconformity with the Inwood Marble and representssediments derived from continental or volcanic island materials in deeper waters.
Duripg the Ordovician period, an island arc system consisting of a series ofvolcanic islands appeared off the coast of what is currently North America as a subductionzone developed in response to oceanic crust colliding with continental crust. The presenceof the volcanic island arc system resulted in interlayering of volcanic material with thesedimentary rocks of the Inwood Marble and Manhattan Formations. As continuedsubduction occurred and continental land mass began to collide with continental NorthAmerica during the Taconic and Acadian Orogenies, the rocks of the Inwood Marble
50
Formation and the Manhattan Formation underwent substantial metamorphism anddeformation.
The Inwood Marble is a relatively pure carbonate rock of dolomitic and/or calcicmineralogy with silica rich zones. The rock tends to be coarsely sacherroidal with remnantfoliation and intercalated mica schist. The color and crystalline texture vary from place toplace due to the various levels of metamorphism; the color is typically white to blue grey.The metamorphic grade is locally elevated due to. minor intrusions. The common mineralsare calcite, dolomite, muscovite, quartz, pyrite and microcline. The Manhattan Formationis represented on the Site by two distinct members. The lower member is an assemblage ofschist, schistose gneiss and amphibolites intercalated with marble, white quartzite andfine-grained metapelite. The marble bearing lower member of the Manhattan Formationlikely represents transition from a shallow carbonate sea to deeper water sedimentation andmaybe the equivalent to the Balmville Limestone which occurs in Dutchess County30 .The middle member is garnet rich mica schist. The upper member consists of biotite-muscovite mica schist with quartz-feldspar laminae.
The original sediments have undergone repeated intense phases of burial,metamorphism, uplift, folding and faulting due to: three phases of continental collision (theTaconic, Acadian, and Alleghanian); continental rifting as the present Atlantic Oceanbegan to form in the Mesozoic; erosion/uplift; and recent glacial rebound. All of theseprocesses have resulted in the presence of fractures that affect the hydraulic properties ofthe material. The main deformational events are represented by multiple superimposedtextures and structures including faults, healed breccias, crenulations, foliation slips,micro-faults, and continuous/truncated joints/fractures. The first phase of fold deformation(F1 ) was essentially ductile and produced isoclinal folds contemporaneous with the mostintense metamorphism. It was at this time that the dominant foliation likely developedalong original bedding planes. The cooling period following this phase marks the onset ofregional brittle faulting and development of fractures along the bedding planes. Thesecond phase of folding (F2) is characterized by flexural slip, indicative of brittleconditions, producing distinct fault and fracture orientations: a conjugate system normal tothe foliation; West-Northwest and North-South conjugate strike-slip faults; Northwestfaults and fractures parallel to the direction of extension; and thrust and extension fracturesparallel to the foliation.
The Cortlandt Complex (a large igneous intrusion located East of the Site) wasintruded during the F2 phase. The post-Cortlandt dislocations were associated with a thirdphase of folding (F3) causing a mutual rotation of the structural elements producing acomplex of conjugate features with a wide range of orientations as described byDames & Moore and found during our study. On the Site, the regional features arerepresented by North-Northeast and North-Northwest trending faults in cross-cuttingrelationships, representing a conjugate system with a North-South regional compressiondirection. The final tectonic event was associated with a shear system oriented North-East,reactivating movement along Northeast-trending faults and minor North-Northeast toNorth-Northwest-trending faults. In addition to these major events, there has been minor
"o In Vermont, this unit is equivalent to the Whipple Marble.
51
normal movement on North-South and Northwest-trending faults associated withcontinental rifting during the Mesozoic Era.
Finally, post-deformational uplift and glacial rebound have resulted in a series offractures related to expansion, after the rock mass/ice load was removed during erosion andglacial retreat. These manifest themselves as semi-sinuous or undulating horizontal relieffractures.
6.4.3 Groundwater in Bedrock
In metamorphic bedrock such as the marble present at the Site, groundwater occursand migrates in open spaces such as fractures. These void spaces are termed secondaryporosity. The primary porosity consists of void spaces within the rock matrix itself.The Inwood Marble has a very low primary porosity which does not contribute to the flowor storage of significant volumes of water. Therefore, the presence of fractures and faultsultimately determines the hydraulic conductivity of the bedrock mass. The fractureaperture spacing and the degree of fracture interconnectivity are dominant variables in howgroundwater flows through the fractured bedrock environment. Groundwater flows fromareas of higher hydraulic head to areas of lower hydraulic head along fractures providingthe least resistance. If the structure of the rock is dominated by fractures and foliations of asingle orientation, then groundwater flow will be along this orientation towards areas oflower hydraulic head. Also, if fractures are separated by large distances and notinterconnected, groundwater will flow in a relatively limited number of fractures and flowwill be governed by the orientation of local structures within the rock. This may result ingroundwater flow occurring along paths that may not be reflected in topography. However,if there are abundant sets of fractures of differing orientations relatively close together andinterconnected, groundwater flow will typically mimic topography.
GZA found no evidences of solution features (i.e., cavities, voids). Such features(if present) can control the direction of groundwater flow. Carbonate rocks have relativelyhigh solubility under certain ambient surface conditions. This can result in solutioncavities and caves known as karst systems. In these situations, groundwater can flowpredominantly along open cavities and result in preferential pathways. Our assessment ofover 3,200 linear feet of rock core and 2,950 linear feet of borehole geophysical logs foundno evidence of any large scale solution features. Minor, discontinuous vugs (small unfilledcavities) and voids were observed primarily along partially healed fractures with euhedralcalcite crystals growing into fractures. This evidence suggests that prior to denudation,resulting in exposure of the rocks to the current elevations; hydrothermal fluids werepercolating through open fractures. Mineralization occurred along the fracture planesresulting in a significant number of healed fractures observed in the rock. In some cases,the fractures were partially healed, resulting in the occurrence of vugs in some of the morebrecciated. zones. The presence of calcite deposition in fractures supports our observationsthat solution features are not prevalent at the Site. That is, open fractures are due totectonic forces, that carbonate is precipitating within the fractures, and no large solutioncavity process is occurring.
Since earlier conceptual models for the Site hypothesized that groundwater flowwould be to the South-Southeast along the original Fl foliation and fracture sets, we
52
performed a detailed structural analysis of the bedrock to assess whether groundwater flowwould be dominated by discrete fracture flow or would behave more in accordance withflow through porous media. This analysis had implications relative to on-Site contaminantmigration and the potential for off-Site migration via dominant fracture sets.
6.4.4 Regional Scale Geostructure
GZA assessed regional fracture patterns presented in the Dames & Moore (1975)report as a photo lineament analysis (Figure 6.5). On the regional scale of the lineamentanalysis, there are three sets of intersecting fracture orientations. The major strikeorientations within a 15 mile radius of the Site indicated a Northeast, North, and East-Westtrend. A review of the major tributaries to the Hudson River indicates the drainage patternis predominantly aligned with similar orientations and generally structurally controlled.
6.4.5 Site Scale Geostructure
On a Site scale, GZA projected the fracture plane orientations calculated from theborehole geophysical data onto one elevation (elevation 10 feet) to create a Site lineamentanalysis (Figure 6.6). Assessment of the more permeable fractures on this projectionshowed that fractures were oriented consistent with the regional assessment (Northeast,North and East-West), and that fracture orientations intersect one another. In addition, ourSite scale lineament analysis showed a number of Northwest orientated fractures locatedbetween Unit I and Unit 2 in the area where the Unit I and Unit 2 plumes commingle.Evaluation of the preconstruction bedrock topography also indicated that this was a lowpoint in the bedrock surface. Low points in marble bedrock surfaces are usually associatedwith areas of higher fracture density or faulting as these would be areas more prone toweathering, erosion and glacial gouging. This presents further evidence for a zone ofhigher transmissivity.
Based upon the regional and Site scale lineament analyses, it was apparent that themultiple fracture orientations result -in intersections of fracture planes. However, moredetailed analysis was required. Therefore, GZA assessed the individual rock cores andfracture orientations calculated from the borehole geophysical analysis.
6.4.6 Borehole Scale Geostructure
Twenty-three of the, forty-seven boreholes were evaluated using acousticalteleviewer (ATV) and optical televiewer (OTV) borehole logging techniques byGeophysical Applications, Inc. The ATV data establishes naturally occurring joint/fracturedip angles and planer dip directions for planer features intersecting a borehole.
The apparent joint/fracture orientations and depths were input into a stereographicframework using DIPS software developed by RocScience, Inc. of Toronto, Canada, aftercorrection from magnetic North to true North. The stereographic projections are a southernhemispheric view and are equal-angle based. The program presents the joint/fracture dipand dip direction in a tabular format with customizing options, and allows joint/fracture setselection to establish groups of domains and families of geostructural data.
53
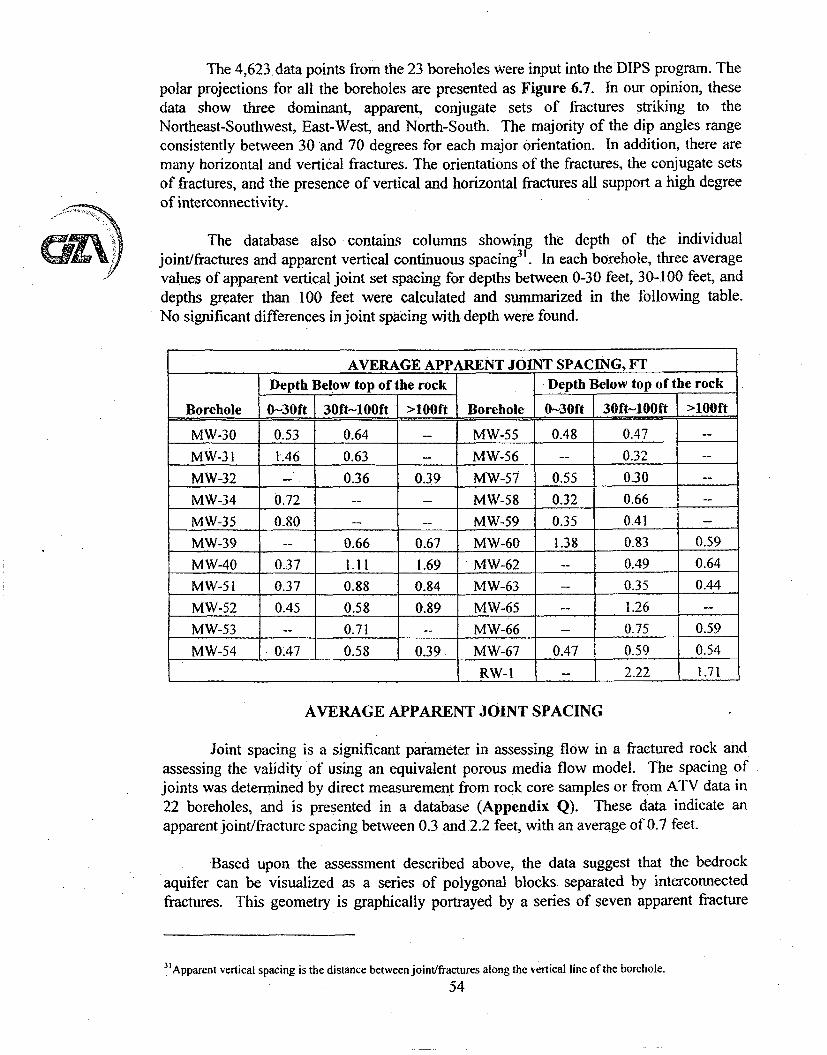
The 4,623 data points from the 23 boreholes were input into the DIPS program. Thepolar projections for all the boreholes are presented as Figure 6.7. In our opinion, thesedata show three dominant, apparent, conjugate sets of fractures striking to theNortheast-Southwest, East-West, and North-South. The majority of the dip angles rangeconsistently between 30 and 70 degrees for each major orientation. In addition, there aremany horizontal and vertical fractures. The orientations of the fractures, the conjugate setsof fractures, and the presence of vertical and horizontal fractures all support a high degreeof interconnectivity.
The database also contains columns showing the depth of the individualjoint/fractures and apparent vertical continuous spacing3 1. In each borehole, three averagevalues of apparent vertical joint set spacing for depths between 0-30 feet, 30-100 feet, anddepths greater than 100 feet were calculated and summarized in the following table.No significant differences in joint spacing with depth were found.
AVERAGE APPARENT JOINT SPACING, FTDepth Below top of the rock Depth Below top of the rock
Borehole 0-30ft 30ft-100ft >100ft Borehole 0-30ft 30ft-100ft >100ft
MW-30 0.53 0.64 - MW-55 0.48 0.47 --
MW-31 1.46 0.63 -- MW-56 -- 0.32 --
MW-32 - 0.36 0.39 MW-57 0.55 0.30 --
MW-34 0.72 - - MW-58 0.32 0.66 --
MW-35 0.80 -- - MW-59 0.35 0.41 --
MW-39 -- 0.66 0.67 MW-60 1.38 0.83 0.59MW-40 0.37 1.11 1.69 MW-62 -- 0.49 0.64MW-51 0.37 0.88 0.84 MW-63 - 0.35 0.44MW-52 0.45 0.58 0.89 MW-65 -- 1.26 -
MW-53 -- 0.71 -- MW-66 - 0.75 0.59MW-54 0.47 0.58 0.39 MW-67 0.47 0.59 0.54
T RW-l - 2.22 1.71
AVERAGE APPARENT JOINT SPACING
Joint spacing is a significant parameter in assessing flow in a fractured rock andassessing the validity of using an equivalent porous media flow model. The spacing ofjoints was determined by direct measurement from rock core samples or from ATV data in22 boreholes, and is presented in a database (Appendix Q). These data indicate anapparent joint/fracture spacing between 0.3 and.2.2 feet, with an average of 0.7 feet.
Based upon the assessment described above, the data suggest that the bedrockaquifer can be visualized as a series of polygonal blocks separated by interconnectedfractures. This geometry is graphically portrayed by a series of seven apparent fracture
3 'Apparent vertical spacing is the distance between joint/fractures along the vertical line of the borehole.
54
profiles designated A-A' through G-G' presented on Figure 6.9; profile locations arepresented in Figure 6.8. The profiles show the orientation and potential connectivity of thegeostructure if the ATV borehole measured planes extended for 1,000 feet (500 feet oneither side of the borehole). The joint/fracture lines represent the trace of the planeprojected onto a vertical profile. Additional illustrations of the fracture orientations inthree dimensions are presented in Section 6.4.8.
6.4.7, Geologic Faults
The groundwater flow pattern and thus contaminant transport can be furtherinfluenced by the presence of faults. These faults can either act as barriers or conduits toflow depending on the presence of clay-rich fault gouge. Rock core samples revealedsignificant clay fault gouge zones that generally ranged between 0.2 and 0.7 vertical feetthick at borehole locations MW-31, -50, -54, -60, and -61. These zones were encounteredat depths ranging between 39 and 200 feet below existing grades. The dip angles weremeasured by the ATV methods and ranged between 49 and 82 degrees at locationsMW-31, MW-54, and MW-60, with dip directions toward the East (MW-54) and theSoutheast (MW-31 and MW-60). No ATV measurements were conducted at MW-50 orMW-61. At MW-61, no core was recovered between 156 feet bgs and 221 feet bgs.Collection of split spoon samples in this interval verified the presence of a clay-filled faultgouge. This boring likely intersected a steeply dipping North-South trending fault. Thepresence of this fault is consistent with faults previously mapped by Dames & Moore(1975). The near vertical orientation of the fault is further supported by observations ofbedrock core from locations MW-66, advanced within 8 feet of MW-61. No fault gougewas observed in this boring. A fracture zone was noted between 136 and 145 feet bgs andis characterized by low RQDs, however, this fracture zone did not exhibit clay filled faultgouge and was more consistent with tightly spaced fractures.
Because the fault extends to the top of the bedrock, the question arises as to why wedid not observe the fault zone above 156 feet bgs at MW-61. This is due to the geometryof the fault. The fault zone is sub-vertical, i.e. less than 90 degrees, but also may vary inorientation with depth. As the boring was advanced deeper into the bedrock, it intersectedthe fault zone at 156 feet bgs. The boring continued within the fault, in a near verticalportion of the fault, to the termination of the boring.
Furthermore, the rock core samples revealed several fracture zones ranging betweenapproximately 0.5 feet and 110 feet thick. Significant zones of poor to no recovery areevident at MW-50, MW-61 and MW-66: boring MW-50 and MW-54 were aligned alongor near the trace of historic faults mapped by Dames & Moore (1975). MW-49 and MW-61, may be aligned along the extension of a historic fault mapped by Dames & Moore(1975). The poor recovery observed at MW-50 and MW-61 is indicative of clay gouge that"was washed out during the drilling process (which is consistent with, but not fully verifiedby, the split spoon samples containing clay, recovered in these borings). We further notethe presence of this fault zone does not appear to materially alter groundwater flowdirections or contaminant migration towards the Hudson River.
Figure 6.4 portrays faults mapped on the Site by Dames & Moore (1975). Thereare three major groups of faults with associated fractures identified at and in the vicinity of
55
the Site. These groups have azimuths of approximately 45, 75, and 290 degrees. The Eastto N75E faults consist of conjugate faults where the sinistral set strikes West to N70Wdipping southward, and the dextral set strikes East to N75E dipping southward. Thesefaults are most often offset or truncated by younger faults. West striking faults in theInwood Formation are typically characterized by breccias which have been healed by a re-crystallized calcite cement.
An additional fault or fracture zone appears (not shown on Figure 6.4) to extendfrom the Hudson River Southwest between Units 1 and 2, as expressed by fractureorientations and a low in the preconstruction bedrock contours. This appears be a zone ofhigher transmissivity as indicated by inflections in groundwater contours, tidal responsemeasurements, and the shape of the contaminant plume.
6.4.8 Bedrock Structure Visualization
In order to aid in the visualization of the role bedrock structure plays ongroundwater flow as well as show the apparent interconnectivity at the Site, GZA importeddata collected throughout the various phases of investigation into a 3-dimensionalvisualization model. The Environmental Visualization Software (EVS) software suite,created by CTech Development Corporation, was the primary software application used forthe development of this model. This software package provides real-time model rendering,animation/flyover capabilities, database and GIS interface utilities, and numerous imageoutput options. EVS also provides the ability to interpolate variably spaced datasets viakriging, an established geostatistical technique. The EVS kriging process selects anoptimal semi-variogram model for each kriged dataset in order to estimate unknownvalues, and provides statistical confidence for estimated values. The results of theseanalyses can then be rendered across three dimensions (x, y and z) to provide a spatiallyreferenced visualization model.
GZA incorporated the borehole geophysical data provided by GA, the packertesting results, and the USGS evaluation of the HPFM data into the 3-dimensionalvisualization model. Our goal was to illustrate transmissive fracture locations. For manyof the zones identified as transmissive, several fractures likely contribute to the estimatedtransmissivity. In these cases, a percentage of the estimated zone transmissivity was.allocated to each contributing fracture based on the HPFM results and ATV/OTV logs.In addition, multiple fractures in close proximity and exhibiting similar planarcharacteristics were combined to present a single planar feature to avoid redundancy in themodel. The fracture data set was imported into the 3-dimensional visualization modelintact.
Figures 6.10 through 6.14 present the locations of transmissive fractures withineach boring. Fractures are represented as disks with 50 foot radii. A single disk representsthe strike direction and dip angle of a transmissive fracture feature. Fracture disks are alsocolor coded to reflect the assigned transmissivity value. Boring designations and locationshighlighted in yellow indicate the borings for which geophysical and transmissivityinformation was available. Boring designations and locations highlighted in white arelacking geophysical data; therefore, fractures are not presented. The transmissive fracturedata set was divided into low transmissive (0.02 - 10 ft2/day, Figure 6.10), moderate
56
transmissive (10 - 50 ft2 /day, Figure 6.11) and high transmissive (50 -250 ft2/day, Figure6.12) subsets. While there are limited geophysical data for borings located to the Southand East of the Site, the available data do indicate that there appears to be a zone composedof more transmissive fractures within the center of the Site. This observation coincideswith a low in the bedrock as elucidated by preconstruction bedrock contours (Figure 6.4).This historic depression 'may be the result of weathered or fractured bedrock beingsusceptible to glacial advance and retreat, indicating the potential for a fault to be presentin this area. This is consistent with the observation of a lineament West of Unit 2 towardthe Hudson River discussed above.
Figure 6.13 represents the same fracture data set, but with the fracture disk radiusextended to 250 feet. A horizontal cutting plane has been extended across the Site atelevation 10 feet, identifying the strike direction of each fracture as it intersects the plane.For a selected diameter of disk, the width of the strike line has significance. A shallowdipping disk would have more contact with the horizontal cutting plane than a steeplydipping disk. Accordingly, a wider strike line indicates a fracture strike direction with ashallower dip angle. The East-West lineament is clearly visible in this figure, alignedapproximately from Unit 2 toward the Hudson River, and comprised of moderate and hightransmissive fractures. Figure 6.14 represents the same horizontal slice concept; however,the slice plane is now placed at elevation -100 feet. There are no high transmissivefractures intersected at this elevation, indicating high transmissive fractures are morepredominant at shallow depths. This is consistent with Figure 6.13, the Conceptual SiteModel, hydraulic conductivity tests and previous reports (Tectonics, 2004). Because weobserved no decrease in fracture spacing with depth (see Section 6.4.6), this suggests thehydraulic aperture of fractures decreases with depth.
While there are some localized trends in fracture strike direction, there is anabundance of intersecting fractures on a Site-wide scale occurring at all elevations.In addition, the fracture disk component of the 3-dimensional visualization model has beenreviewed to identify potential fracture connections on a borehole-to-borehole scale.No significant interconnections were identified. These observations suggest that bedrock ishighly fragmented on a Site-wide scale, high transmissive fractures are not continuousacross IPEC, and groundwater flow through the Site may be modeled as flow through anon-homogeneous, anisotropic, porous media.
6.4.9 Bedrock Surface Elevations and Preferential Groundwater FlowPathways
The results of the surface geophysical surveys are portrayed on Figure 1.3.The geophysical survey identified apparent bedrock at depths of between 2 and 18 feetbelow ground surface (bgs) within the IP2-TY. A depression in the bedrock surface existsin the vicinity of monitoring well MW- 111. Bedrock in the depression was found at adepth of 16 to 18 feet bgs. Along the North side of the IP2-TB, apparent depth to bedrockwas approximately 8 to 12 feet bgs and only intermittent groundwater associated withrainfall events has been encountered. This is likely the depth bedrock was cut in order toaccommodate the service water lines. No discrete utility trenches were observed in thebedrock. Based upon the results of the geophysical survey it is more likely that bedrockwas cut to a depth to accommodate deep subsurface utilities and potentially dewatering,
57
rather than install utilities in individual trenches. On the eastern, western and southernsides of the Transformer yard, rock was encountered between 2 feet and 7 feet bgs.No groundwater was encountered in the overburden in these areas. However, groundwaterwas encountered in the backfill found along the western wall of the Discharge Canal, whichforms the eastern boundary of the IP2-TY.
Within the IP3-TY, the approximate depth to bedrock ranged between 7.5 and 10.5feet bgs. Generally the northern and southern ends of the survey area had the deepest andshallowest depths to bedrock, respectively. Again, the surveys did not exhibit evidence ofindividual utility trenches cut into bedrock. No groundwater was observed in overburdenwithin borings advanced within the IP3-TY.
To assess the potential for contaminants to enter groundwater through leakingstormwater pipes (E-Series) and flow with groundwater towards the Hudson River withinutility trenches cut into rock along the OCA access road on the South side of the ProtectedArea, the depth to bedrock and utility trenches cut into rock along this roadway wasevaluated. The approximate depth to bedrock ranged between 8 and 16 feet bgs. Bedrockreflectors appeared to be less defined in this survey area compared to other areas at theSite. Many potential utilities were observed in the survey area, however it appears that onelarge bedrock trench was excavated to accommodate the utilities as well as the roadway.The bedrock appeared to be deeper near the "delta gate" along the East side of the surveyarea, reaching an apparent depth of 16 feet bgs. Further to the West the apparent bedrocksurface was observed at a depth of approximately 8 feet bgs.
Seismic data collected around the warehouse on the South side of the ProtectedArea provided good subsurface information to a depth of approximately 50 feet bgs.In general, the apparent bedrock surface was found at depths of approximately groundsurface on the East side of the survey area and sloped down to depths greater than 45 feetto the West. Near MW-48, the bedrock was located at 25 feet bgs. Topography of thebedrock interface ranged from flat to highly variable over relatively short distances andthere were a few locations where the bedrock interface "disappeared" or was locatedgreater than 40 to 45 feet bgs. Over most of the area, the bedrock interface was moregradual and slightly undulating along the profile lines. In general, the depth to bedrock wasgreater then 20 feet across most of the survey area, indicating that subsurface utilitieswould not be cut into bedrock trenches.
6.5 AQUIFER PROPERTIES
Our investigations demonstrate that, for the purposes of evaluating groundwater flux,bedrock beneath the Site can be modeled as flow in porous media. Following are thehydraulic properties we assigned to our equivalent conceptual porous media model.
58
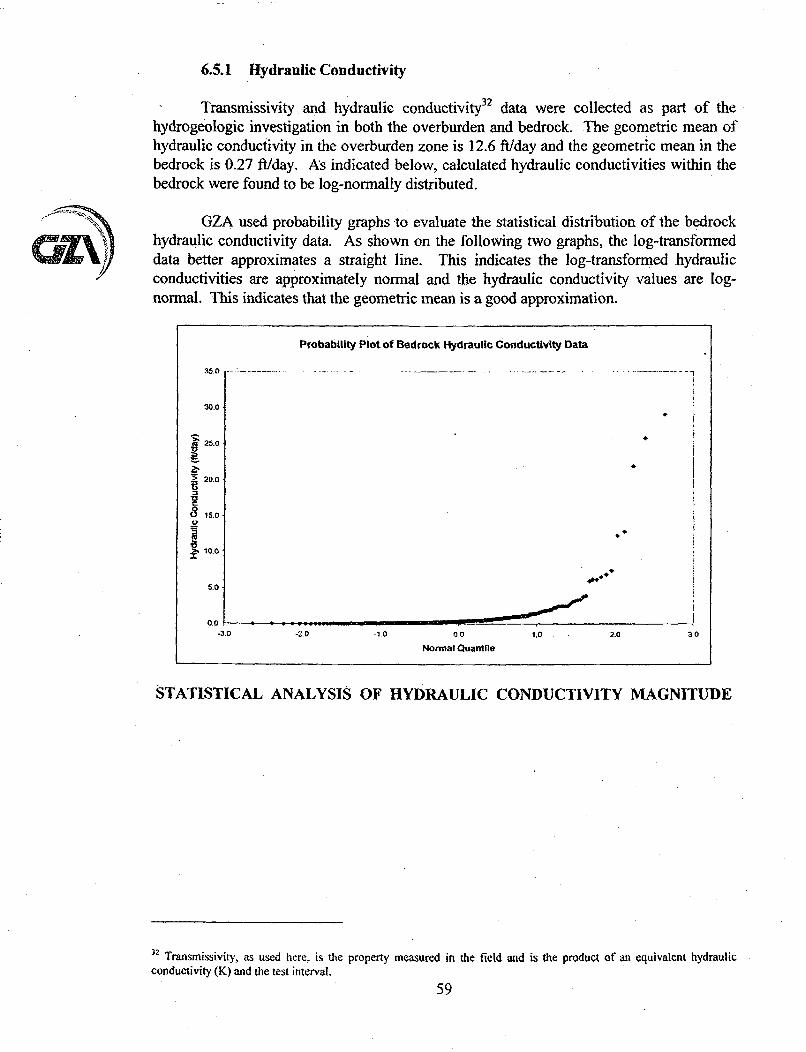
6.5.1 Hydraulic Conductivity
Transmissivity and hydraulic conductivity32 data were collected as part of thehydrogeologic investigation in both the overburden and bedrock. The geometric mean ofhydraulic conductivity in the overburden zone is 12.6 ft/day and the geometric mean in thebedrock is 0.27 ft/day. As indicated below, calculated hydraulic conductivities within thebedrock were found to be log-normally distributed.
GZA used probability graphs to evaluate the statistical distribution of the bedrockhydraulic conductivity data. As shown on the following two graphs, the log-transformeddata better approximates a straight line. This indicates the log-transformed hydraulicconductivities are approximately normal and the hydraulic conductivity values are log-normal. This indicates that the geometric mean is a good approximation.
Probability Plot of Bedrock Hydraulic Conductivity Data
35.0 - :. . . .. .
30.0
25.0
20.0
15.0
•10.0
5.0
00.0.3.0 -2.0 -1.0 0.0 1.0 - 2,0 3.0
Normal Quantile
STATISTICAL ANALYSIS OF HYDRAULIC CONDUCTIVITY MAGNITUDE
'2 Transmissivity, as used here, is the property measured in the field and is the product of an equivalent hydraulicconductivity (K) and the test interval.
59
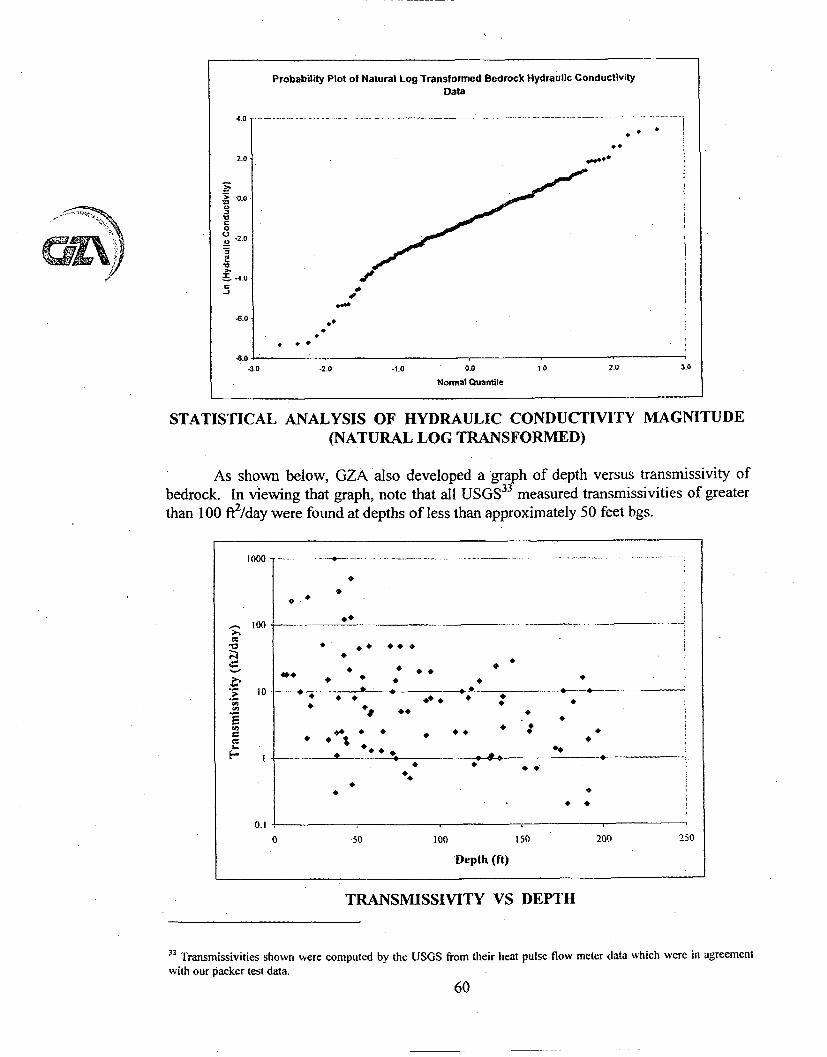
Probability Plot of Natural Log Transformed Bedrock Hydraulic ConductivityData
4.0 . . . . . . . . . . .......-.....-..... .......-. ..
2.0
0.0
0-2.0
-4.0
-6.0
-8.0-3.0 -2.0 -1 _0 0.0 1.0 2.0 3.0
Normal Quantile
STATISTICAL ANALYSIS OF HYDRAULIC CONDUCTIVITY MAGNITUDE(NATURAL LOG TRANSFORMED)
As shown below, GZA also developed a graph of depth versus transmissivity ofbedrock. In viewing that graph, note that all USGS33 measured transmissivities of greaterthan 100 fR2/day were found at depths of less than approximately 50 feet bgs.
10 0 0 ..... ... . I - . . .. ... .. .. .. .. . . .. . ...... . . . ..
100
41
10 •
4
I00 50 100 1 200 250
2Depth 4.(t
10. -.-..* •AB ~.. ........ . . -- 4 -- .---... _" 4* * 4*.4 .4
U' 4 4.
U 4. . 4
4.
44. 1
0..4
0.50 100 150 200 2_50
•Depth (ft)
TRANSMISSIVITY VS DEPTH
33 Transmissivities shown were computed by the USGS from their heat pulse flow meter data which were in agreement.with our packer test data.
60
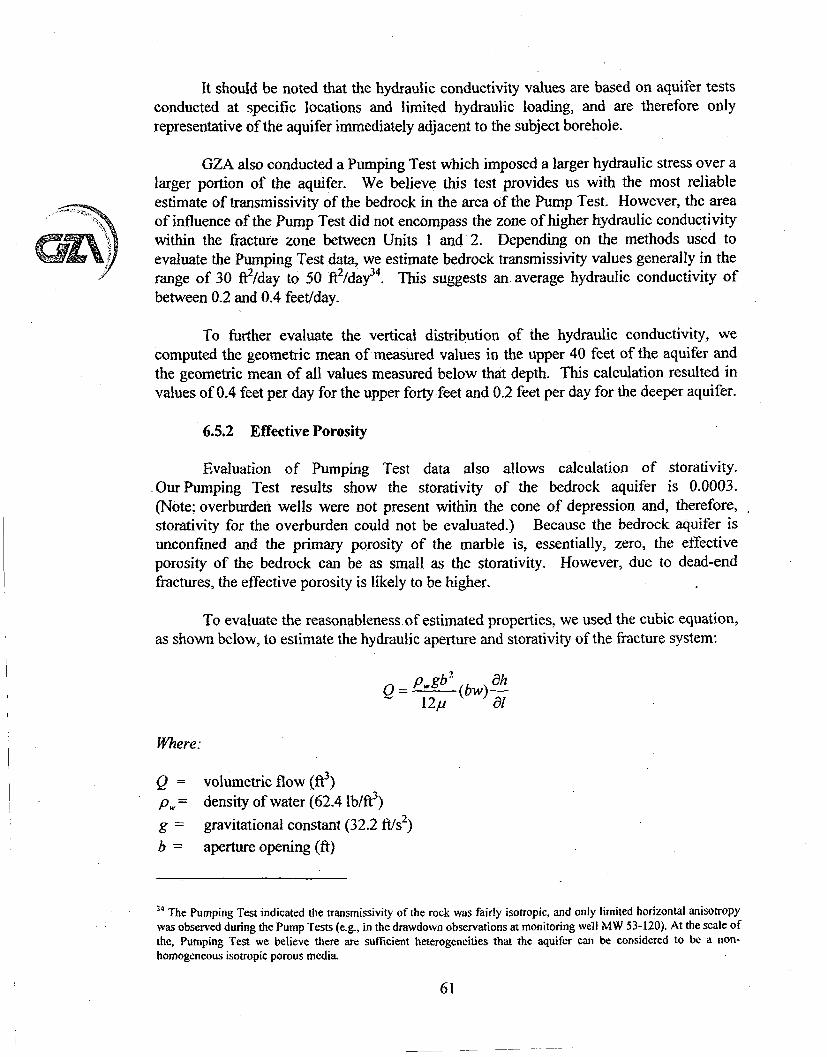
It should be noted that the hydraulic conductivity values are based on aquifer testsconducted at specific locations and limited hydraulic loading, and are therefore onlyrepresentative of the aquifer immediately adjacent to the subject borehole.
GZA also conducted a Pumping Test which imposed a larger hydraulic stress over alarger portion of the aquifer. We believe this test provides us with the most reliableestimate of transmissivity of the bedrock in the area of the Pump Test. However, the areaof influence of the Pump Test did not encompass the zone of higher hydraulic conductivitywithin the fracture zone between Units 1 and 2. Depending on the methods used toevaluate the Pumping Test data, we estimate bedrock transmissivity values generally in therange of 30 &/day to 50 ft2/day3 4. This suggests an average hydraulic conductivity ofbetween 0.2 and 0.4 feet/day.
To further evaluate the vertical distribution of the hydraulic conductivity, wecomputed the geometric mean of measured values in the upper 40 feet of the aquifer andthe geometric mean of all values measured below that depth. This calculation resulted invalues of 0.4 feet per day for the upper forty feet and 0.2 feet per day for the deeper aquifer.
6.5.2 Effective Porosity
Evaluation of Pumping Test data also allows calculation of storativity..Our Pumping Test results show the storativity of the bedrock aquifer is 0.0003.(Note: overburden wells were not present within the cone of depression and, therefore,storativity for the overburden could not be evaluated.) Because the bedrock aquifer isunconfined and the primary porosity of the marble is, essentially, zero, the effectiveporosity of the bedrock can be as small as the storativity. However, due to dead-endfractures, the effective porosity is likely to be higher.
To evaluate the reasonableness of estimated properties, we used the cubic equation,as shown below, to estimate the hydraulic aperture and storativity of the fracture system:
0 = _ b (bw) -h12pu al
Where:
Q = volumetric flow (ft3)ps.= density of water (62.4 lb/ft3)g = gravitational constant (32.2 ft/s 2)b = aperture opening (ft)
14 The Pumping Test indicated the transmissivity of the rock was fairly isotropic, and only limited horizontal anisotropywas observed during the Pump rests (e.g., in the drawdown observations at monitoring well MW 53-120). At the scale ofthe, Pumping Test we believe there are sufficient heterogeneities that the aquifer can be considered to be a non-homogeneous isotropic porous media.
61
p = dynamic viscosity of water (0.0006733 lb/ft*s)w = fracture width perpendicular to the flow direction (ft)
-h = groundwater gradiental
From this, the concept of an equivalent hydraulic conductivity has been developed 35:
K pwgnb3
12p
Where:
Variables are as previously defined, and;
n = number of open features per unit distance across the rock face
Using a fracture spacing of one foot and an equivalent bulk hydraulic conductivityof 0.27 feet per day (9 x 10⁻⁵ cm/sec), this calculation indicates a hydraulic aperture ofapproximately 75 microns, and a theoretical minimum porosity of 2.4 x 1 0 A4.
The calculated porosity is in good agreement with estimates of storativity developed fromPumping Test data (Section 4.4.4) and tidal responses (Section 6.6).
In summary, the measured effective porosity of the bedrock aquifer isapproximately 0.0003.
6.6 TIDAL INFLUENCES
As discussed previously, the Hudson River, adjacent to the Site, rises and falls in responseto ocean tides. Based on our measurements, this tidal variation (the numerical differencebetween low water and subsequent high water elevations) in 2006 ranged fromapproximately 1.4 feet to 4.3 feet, and averaged approximately 2.7 feet. This variationoccurred between approximately elevation -1.5 feet to 3.7 feet NGVD 29 (i.e., the low tideelevations were typically above elevation -1.5 feet and the high tide elevations weretypically below elevation 3.7 feet). These data are in good agreement with publishedinformation (see Section 6.1).
This natural variation produced measured effects that helped us better understandhydrogeologic information obtained at the Site. One such effect is water level changes inmonitoring wells at the Site. The observed changes demonstrate that the bedrock aquifer issignificantly fractured, and provided additional insight into aquifer properties.
Discharge of heated cooling water, in conjunction with tidal influences, produced a secondeffect; temporal temperature changes in groundwater in wells located near the Discharge
3, Snow, D.T. 1968. Rock Fracture. Spacings, Openings, and Porosities. Journal of Soil Mechanics., Found. Div. Proc.Am. Soc. Civil Engrs., v. 94, p. 73-91.
62
an
Canal. We used that information to help explain water quality data collected from twospecific wells (MW-38 and MW-48, originally proposed as southern boundary monitoringwells), which did not initially conform with our Conceptual Site Model (see Section 6.6.2below). These two effects are described in the following sections.
6.6.1 Groundwater Levels
The tidal-induced variations in surface water levels near the edge of the Site'saquifer (in the river and intake structures and Discharge Canal36) induced pressure changesin groundwater that were observed in monitoring wells at the IPEC. As a generalstatement, these responses (as anticipated) varied over time as sinusoidal-like curves thatdecreased in amplitude and exhibited greater lag time with increased distances from theriver/Discharge Canal37.
At the time of our tidal response study, there were 87 transducers installed in49 monitoring wells. As shown on the following graph, we observed measurable hydraulicresponses to tidal variations at 43 of these transducer locations. In viewing that graph, notedistances are measured from the edge of the Hudson River. We chose this as the boundarybecause data suggests the river has more influence on piezometric levels in the bedrockaquifer than do the intake structures and Discharge Canal. We further note that: 1) 41 ofthe 44 pressure transducers within 400 feet of the Hudson responded to tidal variations;2) at greater distances, tidal responses may have occurred but were too small to be recordedbecause of the accuracy of the transducers; and 3) the tidal response in wells located in thehigher hydraulic conductivity area between Units 1 and 2 was more pronounced than inother areas. Cumulatively, these data demonstrate:
0
a
The aquifer is in strong hydratlic communication with the Hudson River; andThe bedrock aquifer is well-fractured.
36 The elevation of the water in the Discharge Canal rises and falls with the river elevation, but is maintainedapproximately 20 inches above the river level.37 Observed variations from this trend, in our opinion, are consistent with anticipated heterogeneities in an equivalentporous media model.
63
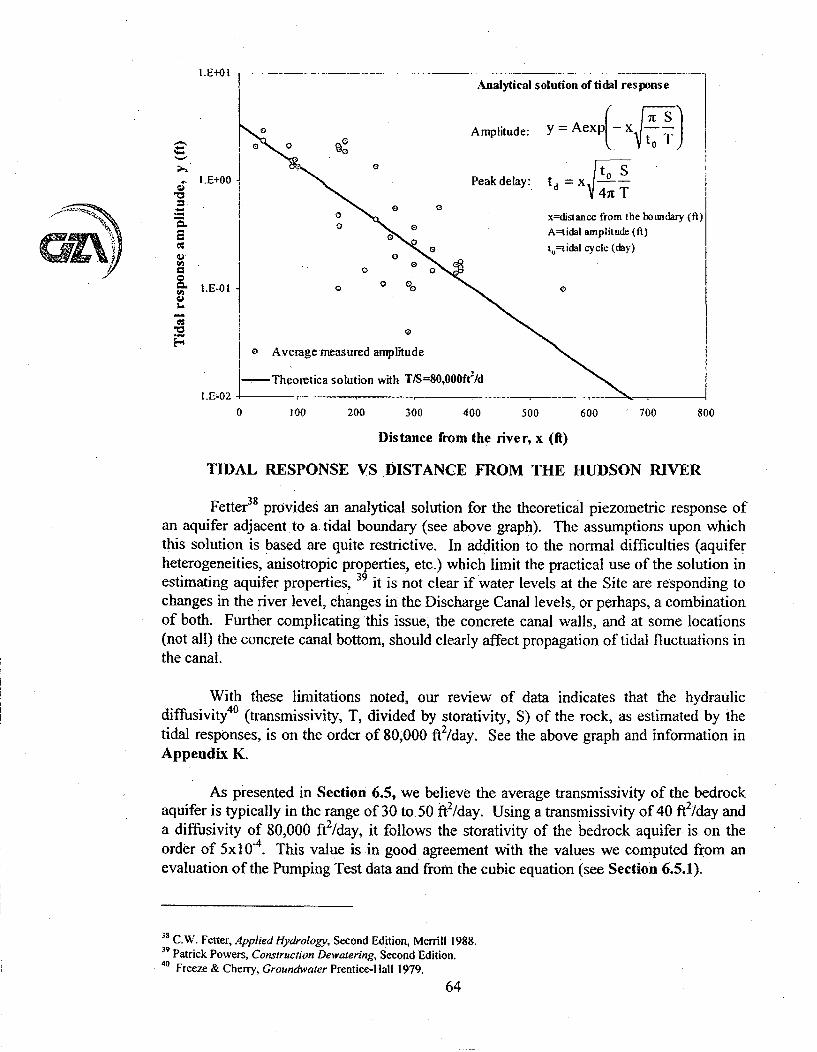
I. E+O I
J
2-
C:
I.E+O0
1.E-01
Analytical solution of tidal response
o Amplitude: y= AexpK S
0 to SPeak delay: t d = 4~T
0o x=distance from the boLtmdary (fi)0 0' 0 A-tidal amplitude (ft)
0t=tidal cycle (day)
00
0 Average measured amplitude
-Theoretica solution with T/S=80,000ft2/d
100 200 300 400 500 600 700 800
1'.Eý02 I0
Distance from the river, x (fI)
TIDAL RESPONSE VS DISTANCE FROM THE HUDSON RIVER
Fetter3" provides an analytical solution for the theoretical piezometric response ofan aquifer adjacent to a tidal boundary (see above graph). The assumptions upon whichthis solution is based are quite restrictive. In addition to the normal difficulties (aquiferheterogeneities, anisotropic properties, etc.) which limit the practical use of the solution inestimating aquifer properties, 39 it is not clear if water levels at the Site are responding tochanges in the river level, changes in the Discharge Canal levels, or perhaps, a combinationof both. Further complicating this issue, the concrete canal walls, and at some locations(not all) the concrete canal bottom, should clearly affect propagation of tidal fluctuations inthe canal.
With these limitations noted, our review of data indicates that the hydraulicdiffusivity (transmissivity, T, divided by storativity, S) of the rock, as estimated by thetidal responses, is on the order of 80,000 ft2/day. See the above graph and information inAppendix K.
As presented in Section 6.5, we believe the average transmissivity of the bedrockaquifer is typically in the range of 30 to 50 fW2/day. Using a transmissivity of 40 ft2/day anda diffusivity of 80,000 ft2/day, it follows the storativity of the bedrock aquifer is on theorder of 5x 10⁻⁴. This value is in good agreement with the values we computed from anevaluation of the Pumping Test data and from the cubic equation (see Section 6.5.1).
3s C.W. Fetter, Applied Hydrology, Second Edition, Merrill 1988.39 Patrick Powers, Construction Dewatering, Second Edition.40 Freeze & Cherry, Groundwater Prentice-I]all 1979.
64
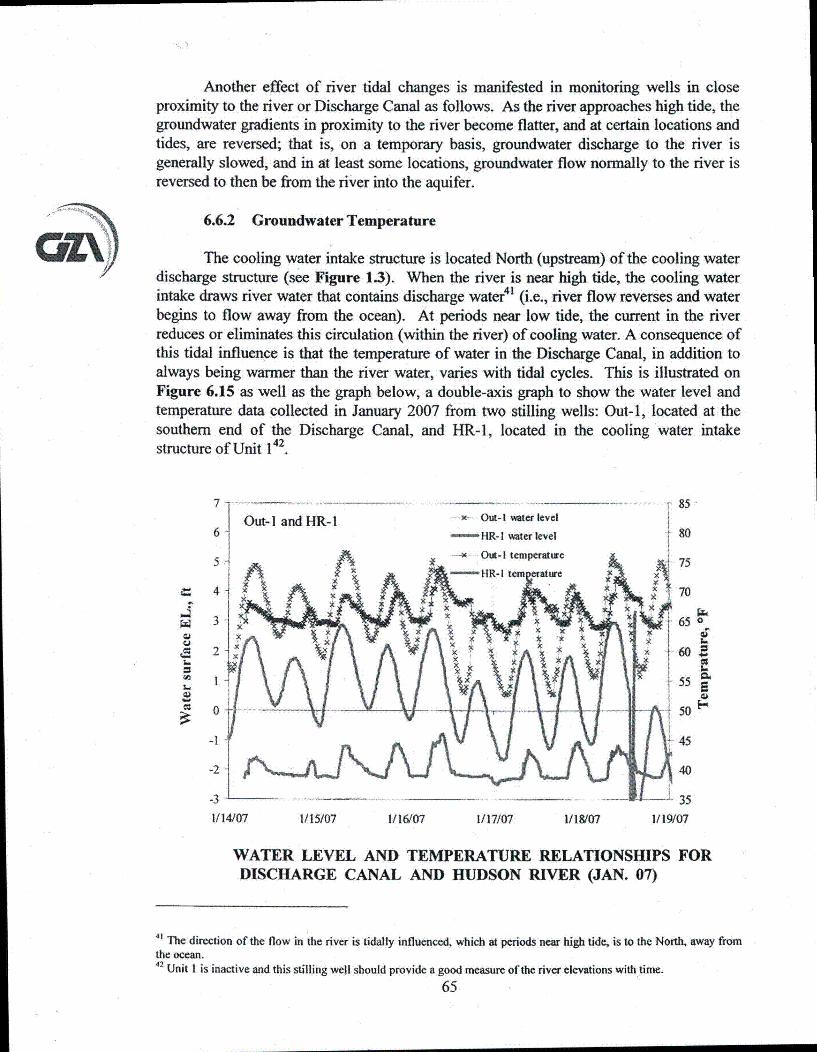
Another effect of river tidal changes is manifested in monitoring wells in closeproximity to the river or Discharge Canal as follows. As the river approaches high tide, thegroundwater gradients in proximity to the river become flatter, and at certain locations andtides, are reversed; that is, on a temporary basis, groundwater discharge to the river isgenerally slowed, and in at least some locations, groundwater flow normally to the river isreversed to then be from the river into the aquifer.
6.6.2 Groundwater Temperature
The cooling water intake structure is located North (upstream) of the cooling waterdischarge structure (see Figure 1.3). When the river is near high tide, the cooling waterintake draws river water that contains discharge water4l (i.e., river flow reverses and waterbegins to flow away from the ocean). At periods near low tide, the current in the riverreduces or eliminates this circulation (within the river) of cooling water. A consequence ofthis tidal influence is that the temperature of water in the Discharge Canal, in addition toalways being warmer than the river water, varies with tidal cycles. This is illustrated onFigure 6.15 as well as the graph below, a double-axis graph to show the water level andtemperature data collected in January 2007 from two stilling wells: Out-i, located at thesouthern end of the Discharge Canal, and HR-1, located in the cooling water intakestructure of Unit 142.
L.
7
6
5
4
3
2
1
0
85
8o
75
70
65 0
60~
55
45
40
-1
-2
-3
1/14/07
35
1/15/07 1/16/07 1/17/07 1/18/07 1/19/07
WATER LEVEL AND TEMPERATURE RELATIONSHIPS FORDISCHARGE CANAL AND HUDSON RIVER (JAN. 07)
41 The direction of the flow in the river is tidally influenced, which at periods near high tide, is to the North, away fromthe ocean.42 Unit 1 is inactive and this stilling well should provide a good measure of the river elevations with time.
65
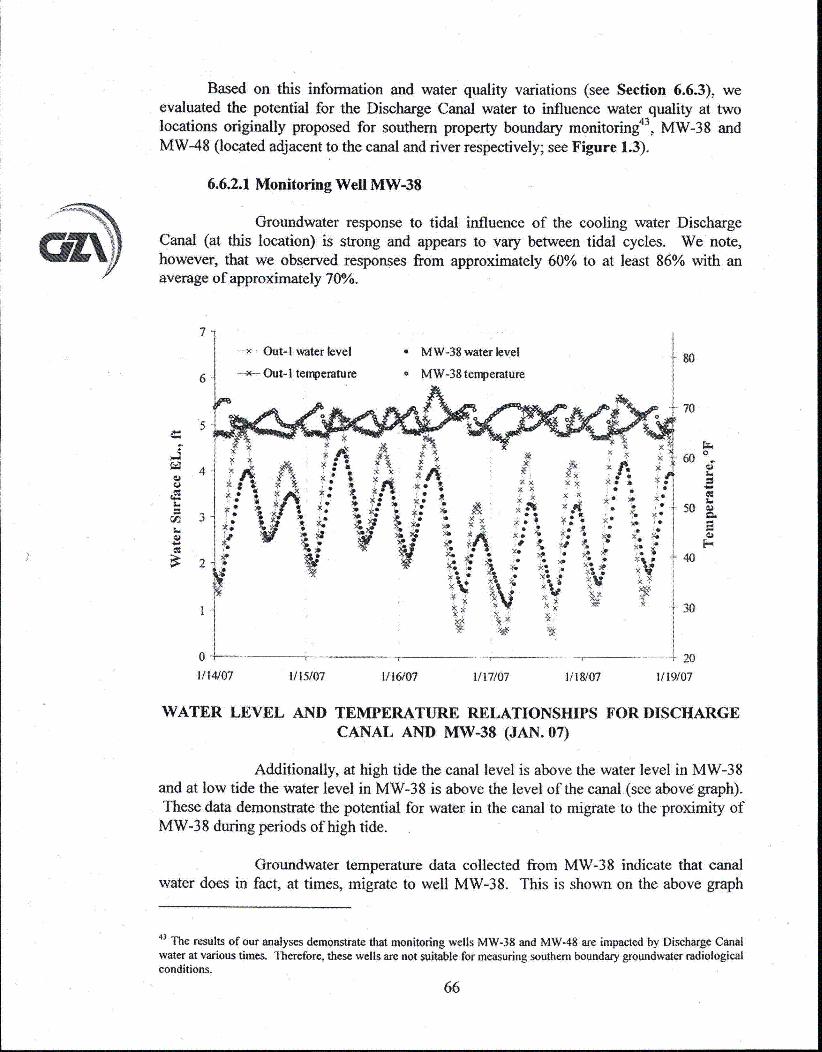
Based on this information and water quality variations (see Section 6.6.3), weevaluated the potential for the Discharge Canal water to influence water quality at twolocations originally proposed for southern property boundary monitoring", MW-38 andMW-48 (located adjacent to the canal and river respectively; see Figure 1.3).
6.6.2.1 Monitoring Well MW-38
Groundwater response to tidal influence of the cooling water DischargeCanal (at this location) is strong and appears to vary between tidal cycles. We note,however, that we observed responses from approximately 60% to at least 86% with anaverage of approximately 70%.
OZ
7
6
4
3
40
8o
70
60
50
40
IX
i 30
0 / 01/14/07 1/15/07 1/161607 1/17/07 1/18/07
. 20
1/19/07
WATER LEVEL AND TEMPERATURE RELATIONSHIPS FOR DISCHARGECANAL AND MW-38 (JAN. 07)
Additionally, at high tide the canal level is above the water level in MW-38and at low tide the water level in MW-38 is above the level of the canal (see above graph).These data demonstrate the potential for water in the canal to migrate to the proximity ofMW-38 during periods of high tide.
Groundwater temperature data collected from MW-38 indicate that canalwater does in fact, at times, migrate to well MW-38. This is shown on the above graph
43 The results of our analyses demonstrate that monitoring wells MW-38 and MW-48 are impacted by Discharge Canalwater at various times. TIherefore, these wells are not suitable for measuring southern boundary groundwater radiologicalconditions.
66
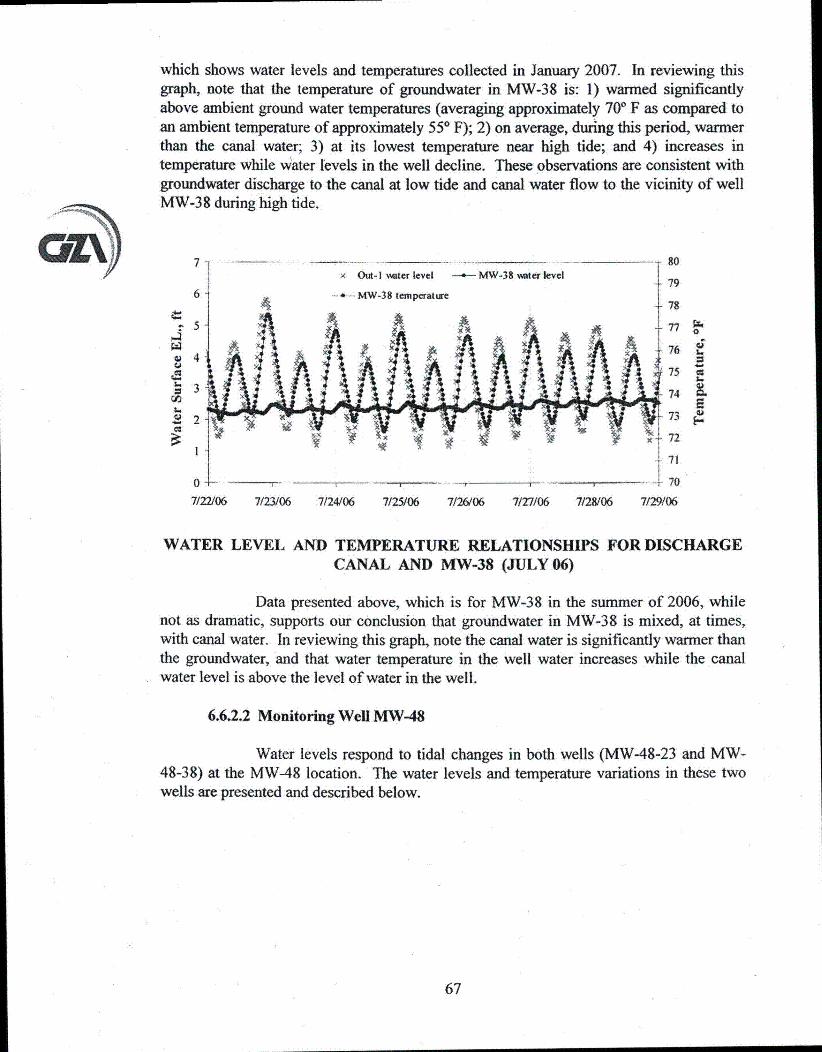
which shows water levels and temperatures collected in January 2007. In reviewing thisgraph, note that the temperature of groundwater in MW-38 is: 1) warmed significantlyabove ambient ground water temperatures (averaging approximately 700 F as compared toan ambient temperature of approximately 550 F); 2) on average, during this period, warmerthan the canal water; 3) at its lowest temperature near high tide; and 4) increases intemperature while w•ater levels in the well decline. These observations are consistent withgroundwater discharge to the canal at low tide and canal water flow to the vicinity of wellMW-38 during high tide.
CLX) 7
6
.4-
I..
79
t 78
-T77
-76
75S74
72,,o71
0
E
0 74/0 7 7 7/60 7/2/0 77/22/06 7/2,3/06 7/24/06 7/25/06 7/26(06 7/27/06 7/28/06
-r 7u
T/29/06
WATER LEVEL AND TEMPERATURE RELATIONSHIPS FOR DISCHARGECANAL AND MW-38 (JULY 06)
Data presented above, which is for MW-38 in the summer of 2006, whilenot as dramatic, supports our conclusion that groundwater in MW-38 is mixed, at times,with canal water. In reviewing this graph, note the canal water is significantly warmer thanthe groundwater, and that water temperature in the well water increases while the canalwater level is above the level of water in the well.
6.6.2.2 Monitoring Well MW-48
Water levels respond to tidal changes in both wells (MW-48-23 and MW-48-38) at the MW-48 location. The water levels and temperature variations in these twowells are presented and described below.
67
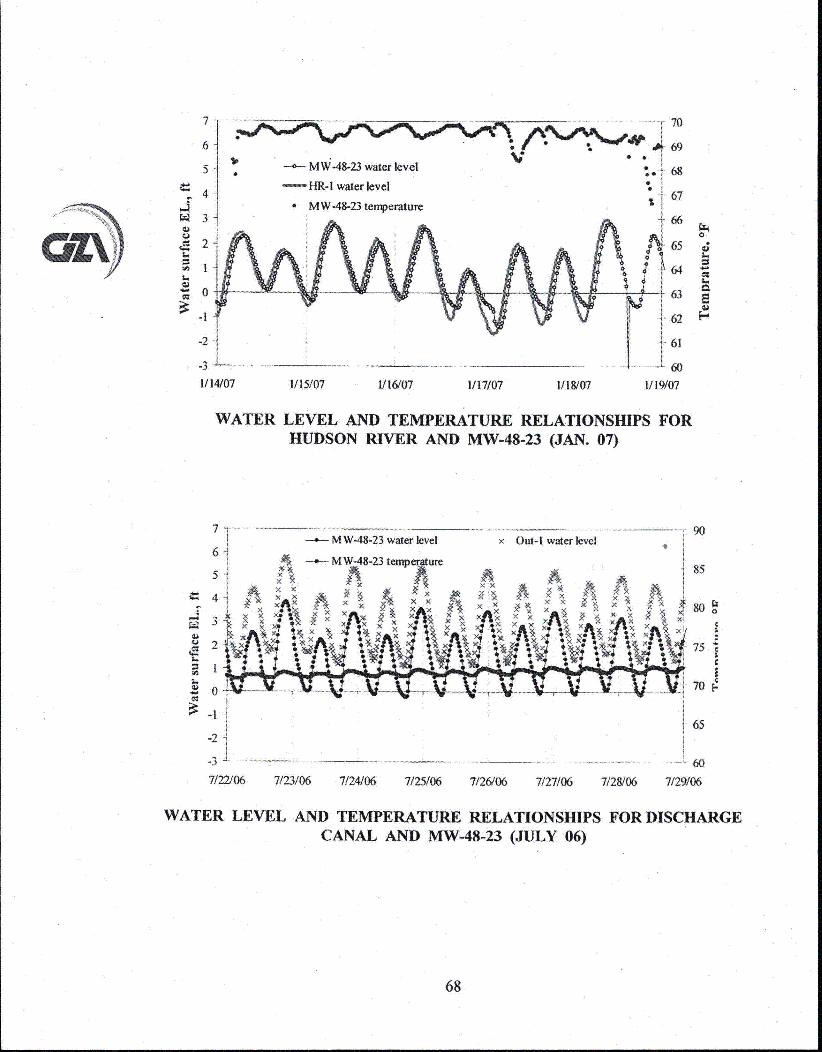
QZ\1-4
7 -. I - .- . ......-.- ....... 1 -.. 7 0
.6~ '695 * --*--MW-48-23 water level 68
4HR-I water level4-t 67
MW-48-23 temperature
2- 65
640 - .63
-IV 62
-2-• 61
-3 .. .... .. - 60
1/14/07 1/15/07 1/16/07 1/17/07 1/18/07 1/19/07
WATER LEVEL AND TEMPERATURE RELATIONSHIPS FORHUDSON RIVER AND MW-48-23 (JAN. 07)
I.,
7 ....... . . . . ... 90- MW-48-23 water level x Out-I water level
6 jt • --e-- MW-48-23 temperaure 5
5 6
-2 x
-. - .. . . .. . . . 60
7/22=06 7/23/06 7/24/06 7/25/06 7/26/06 7/27/06 7/28/06 7/29/06
WATER LEVEL AND TEMPERATURE RELATIONSHIPS FOR DISCHARGECANAL AND MW-48-23 (JULY 06)
68
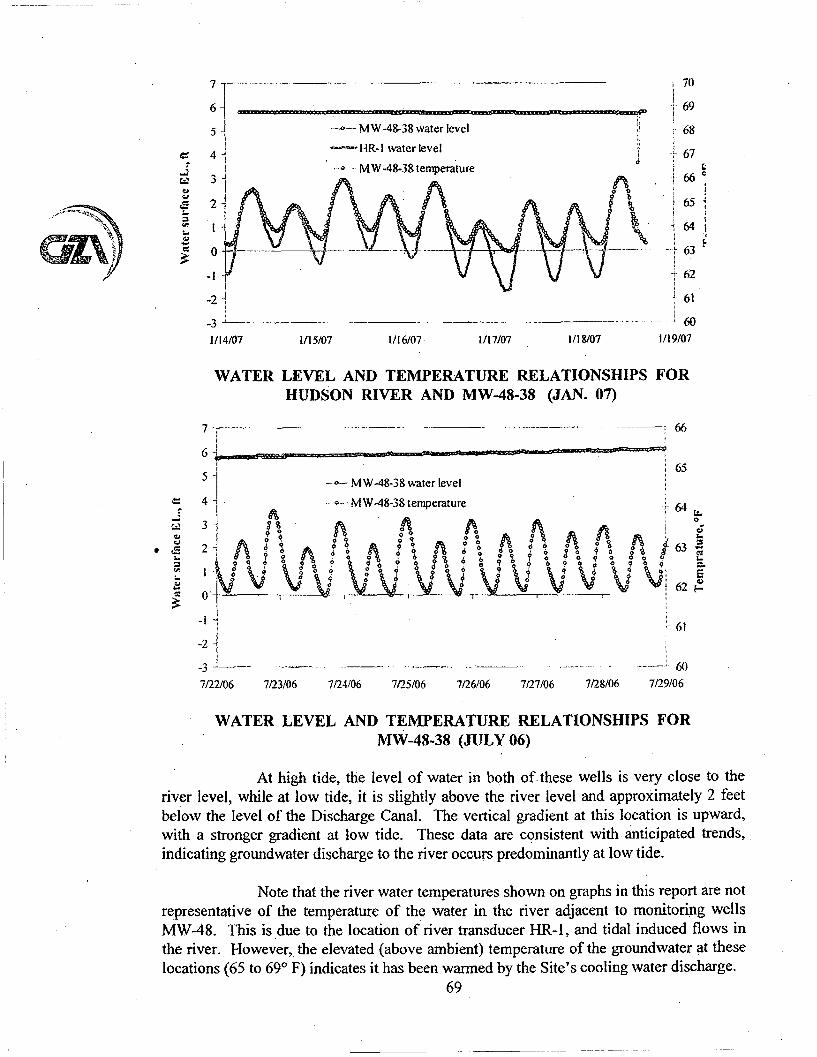
5 A14
3
2
0
-1
-2
-3 2_.-
1/14/07
MW-48.-38 water level
HR-1 water level
MW-48-38 temperature
70
69
68
67
.t 66c
654
! KUI
62
61
1/15/07 1/16/07 1117/07 1/18/07
. 601/19/07
WATER LEVEL AND TEMPERATURE RELATIONSHIPS FORHUDSON RIVER AND MW-48-38 (JAN. 07)
7 -
U
1~
U
66
65
64•0
63
62.
61-1
-2
-3 . -----
7/22/06 7/23/06 7/24/06 7/25/06 7/26106-. 60
7/27/06 7/28/06 7/29/06
WATER LEVEL AND TEMPERATURE RELATIONSHIPS FORMW-48-38 (JULY 06)
At high tide, the level of water in both of these wells is very close to theriver level, while at low tide, it is slightly above the river level and approximately 2 feetbelow the level of the Discharge Canal. The vertical gradient at this location is upward,with a stronger gradient at low tide. These data are consistent with anticipated trends,indicating groundwater discharge to the river occurs predominantly at low tide.
Note that the river water temperatures shown on graphs in this report are notrepresentative of the temperature of the water in the river adjacent to monitoring wellsMW-48. This is due to the location of river transducer HR-I, and tidal induced flows inthe river. However, the elevated (above ambient) temperature of the groundwater at theselocations (65 to 69' F) indicates it has been warmed by the Site's cooling water discharge.
69
The temperature of water in monitoring well MW-48-23 varies with sometide cycles, with the coolest temperature being near high tide in the winter, and the warmesttemperature being near high tide in the summer. This pattern of temperature change isconsistent with this monitoring well receiving river water at times of high tide.
The temperature of water in monitoring well MW-48-38 does not appear tovary with tidal cycles. We interpret these data to mean that physical water quality in
44.monitoring well MW-48-38 is not typically influenced by large exchanges of river waterThe elevated groundwater temperature at this location, and the piezometric data, suggest,however, that flows created by purging of the well prior to sampling, at times of high tide,could induce river water flow to this location.
6.6.3 Aqueous Geochemistry
Routine groundwater monitoring indicated the presence of Tritium in a limitednumber of samples collected from monitoring wells MW-38 and MW-48. MW-38 wasoriginally installed under the first phase of investigation to bound the southern extent ofTritium contamination at the Site along the cooling water, Discharge Canal. However,subsequent sampling events indicated the presence of Tritium in groundwater at thislocation. The presence of Tritium in this well did not fit our CSM or what we knew ofgroundwater flow at the Site. A second well, MW-48, was installed at the southern Siteboundary along the Hudson River to establish if any Tritium would potentially migrateoff-Site. Tritium was detected intermittently in groundwater samples collected at thislocation as well. As neither of these locations was hydraulically downgradient of identifiedrelease areas, another mechanism other than groundwater migration from the release areawas postulated. This mechanism involved releases from the legacy piping that conveyedcontaminated water from the IPI-SFDS to the "E"-series stormwater piping that runsbeneath the access road on the South side of the Protected Area and discharges stormwaterto the cooling water Discharge Canal. While evaluating this hypothesis, we foundevidence, as discussed in Section 6.62, that at certain tidal cycles, water from theDischarge Canal and the Hudson River may back flow into these groundwater monitoringwells. To help identify the source of Tritium in these two wells, we developed a focusedwater quality program specific to these wells. Generally, the water quality programinvolved analyzing select aqueous geochemical parameters in groundwater and surfacewater samples. Evaluation of these data can allow conclusions to be drawn regarding thesource of the sampled water.
Both data sets (elevation and water chemistry) indicate that water collected fromthese wells may contain river or cooling water from the Discharge Canal. Based on thesefindings, we recommend that groundwater sample laboratory results from these welllocations not be used to evaluate the extent of groundwater contamination or contaminant
44 Relatively large exchanges of water are required to overcome the thermal mass of the subsurface deposits surroundingthe well bore. Therefore, while smaller exchanges of groundwater/river water may go undetected via temperature change,they may still be large enough to adversely impact radiological water quality, particularly in consideration of the datafrom the proximate well screens. Also see discussion in Section 6.6.3.
70
flux to the Hudson River and that these wells not be incorporated into the Long TermMonitoring Plan as Boundary Wells.
6.6.3.1 Sampling
Groundwater samples were collected from monitoring wells MW-38,MW-48-23, and MW-48-38 and from the Discharge Canal and Hudson River onJanuary 19, 2007. These samples were analyzed for bicarbonate alkalinity (as CaCO3),magnesium, sodium, calcium, sulfate, and chloride. The data was graphed on Stiffdiagrams and is shown on Figure 6.16.
6.6.3.2 Water Quality Evaluation
GZA used the six water quality indicators (bicarbonate alkalinity[as CaCO3], magnesium, sodium, calcium, sulfate, and chloride) to assess whether or notDischarge Canal and/or river water was present or mixed with groundwater at the twolocations of interest (note that the MW-48 monitoring well location contains a shallow anda deep well). A summary of our findings follows.
" The river and canal samples are chemically similar and are dominated by sodiumand chloride. The sodium and chloride contents are highest at the mid tidesampling event. These data indicate that at mid tide there was a greater verticalmixing of river water which caused the water to contain more sodium andchloride 45.
" The MW-48-23 samples collected at low, mid and high tide are all geochemicallysimilar and are dominated by the sodium and chloride ions. However, theelectrolyte concentration of these two ions is approximately half of that measured inthe river or canal samples. Additionally, at low tide, there is slightly less sodiumchloride and slightly more bicarbonate anion than at mid or high tide. We believethis indicates that at low tide, this location receives relatively more groundwater.
* Samples collected from MW-48-38 at low, mid, and high tide were generally alldominated by calcium and magnesium cations and chloride and bicarbonate anions.These samples also contained similar sodium, chloride, calcium, bicarbonate,magnesium, and sulfate electrolyte concentrations. However, at mid and high tide,there was somewhat more calcium, magnesium, and bicarbonate measured in thesesamples. It is further noted that the cation/anion imbalance for the MW-48-38samples (except MW-48-38-LI) was greater than 5%. This indicates a lack ofaccuracy or the presence of unanalyzed ions in the groundwater samples.While samples from MW-48-38 currently appear more representative ofgroundwater than those from wells MW-38 and MW-48-23, it is not certain thatthey are always fully representative of groundwater only 46.
45 We believe the river and canal samples are similar (in part) because the river sample location was situated immediatelydown-river of the Discharge Canal outfall. In addition, the river sampling location visibly appears to remain within thedischarge water heat plume. Therefore, the river samples are likely Discharge Canal water or at. least mixed with what isbeing discharged from the canal.46. For example, 573 pCi/L of Tritium was detected in this interval on September 5, 2006. Tritium had never previouslybeen detected and has since not been detected in this interval. It may be that this sample was misidentified in the fieldand the sample was actually obtained from the upper interval of this well where Tritium is routinely detected. However,
71
The samples collected from MW-38 at low, mid and high tide are all geochemicallysimilar and are dominated by the sodium and chloride ions. However, theelectrolyte concentration of these two ions is less than half of that measured in theriver or canal samples- Additionally, at low tide, there is slightly less sodium andchloride than at mid or high tide. We believe this likely indicates that at low tide,this location sees relatively more groundwater.
These data indicate that water samples collected from MW-38 and MW-48-23 are largely representative of the proximate surface water bodies at the Site. Recognizingthe source of water in these wells, the other chemistry data (e.g., Tritium and Strontium)are suspect and should not be used for evaluation of groundwater contaminant migration orflux. Based on the available data, MW-48-38 may provide samples more representative ofSite groundwater than MW-38 and MW-48-23. However, further analysis would benecessary to allow this well to be recommended as a southern boundary monitoringlocation, particularly in light of the above analysis pursuant to the proximate well screensand the potential for false positives. Given the demonstrated groundwater flow directionsin this area47 , it is GZA's opinion that an additional southern boundary monitoring location(in addition to MW-51 and MW-40) is not required proximate to MW-48-38.
6.7 GROUNDWATER FLOW PATTERNS
A major purpose of this groundwater investigation was to identify the fate and level ofgroundwater contaminant migration. The contaminants of potential concern are soluble ingroundwater, and at somewhat varying rates, move with it. This section provides adescription of identified groundwater flow patterns in and downgradient of identifiedcontaminant release areas. The piezometric data, shown in Table 6.1, which form thebasis of this evaluation are independent of chemical data collected at the same monitoringlocations. Consequently, our evaluation of piezometric data provides an assessment ofwhere contaminants are expected to migrate in various time frames. Refer to Section 9.0for information on the observed distribution of contaminants and a discussion ondiscrepancies between anticipated and observed conditions.
Testing has indicated that the bedrock is sufficiently fractured to, on the scale of the Site,behave as a non-homogeneous, anisotropic, vertically porous media. This finding indicatesthat groundwater flow is perpendicular to lines of equal heads. This assessment appearsparticularly valid in horizontal (East-West & North-South) directions.
The nature of bedrock fracturing suggests the hydraulic conductivity is higher in thehorizontal than in the vertical direction. Furthermore it appears the upper portions of therock are more conductive than the deep rock except within the zone of higher hydraulicconductivity between Units 1 and 2. These findings suggest that the bulk of the
it also is possible that this sample is reflective of river water induced into the well through sampling and/or the specificconditions existing at the time the sample was taken.
47 While the representativeness of the chemistry data in these wells (MW-38, MW-48-23 and MW-48-38) is not certain,the groundwater elevation data is reliable for establishing flow direction.
72
groundwater moves at shallower depth, with small masses being reflected deeper into therock mass than would be seen in anisotropic aquifer.
6.7.1 Groundwater Flow Direction
Groundwater elevations from pressure transducers at a representative low tide havebeen used to construct a potentiometric surface map of the aquifer beneath the Site(see Figure 6.17). We chose this data set after evaluating a number of piezometric datasets. More specifically we have mapped six groundwater conditions:
" Low tide during the drier portion of the year (2/12/07)* High tide during the wetter portion of the year (3/28/07)• Low tide during the wetter portion of the year (3/28/07), High tide during the drier portion of the year (2/12/07)• Groundwater elevations at sample locations with the greatest Tritium impact during
wet season- Groundwater elevations at sample locations with the greatest Tritium impact during
the dry season
Based on this evaluation, it appears that there is not a great deal of change ingroundwater flow patterns over time (see Appendix S). However, as groundwaterelevations have a smaller tidal response (amplitude) than the fluctuations of the river, lowtide is a time with a relatively high degree of groundwater flux from the Site. Furthermore,low tide during the drier portion of the year likely represents a period of highestgroundwater flux.
Groundwater flow is in three dimensions. A representative set of groundwaterelevations was used to construct a cross-sectional groundwater contour map as shown onFigure 6.18. This figure is based on a 1:1 horizontal to vertical hydraulic conductivity.Because horizontal fractures transmit flow in only a horizontal direction, and verticalfractures transmit flow in both a horizontal and vertical direction, the aquifer is verticallyanisotropic with a preference for horizontal flow. Conversely, if the vertical hydraulicconductivity decreases with depth, the groundwater flow should be driven deeper thanshown on the figure, but would still ultimately discharge to the Hudson River. Based onthe observed vertical distribution of piezometric heads, the deepest flow paths of potentialinterest for this investigation originate near Unit 2. Based on the observed verticaldistribution of contaminants (see Section 9.2), these flow paths are limited to depths ofbetween 200 and 300 feet below ground surface.
As discussed previously, groundwater flow patterns are also influenced byanthropogenic sources and sinks. The groundwater sources/sinks are shown on Figure 1.3and are summarized below:
Unit I Chemical Systems Building (IPI-CSB) Foundation Drain: This draindischarges into the Sphere Foundation Drain Sump (SFDS) and is designed tomaintain groundwater elevations beneath IP-1-CSB subbasement to an elevation ofapproximately 12 feet NGVD 29. The reported groundwater extraction rate fromthis drain is approximately 10 gallons per minute (gpm).
73
• IPl-NCD: This drain is designed to maintain groundwater elevations beneath theUnit I containment building (IPI-CB) and the Unit I Fuel Handling Building (IPI-FHB) at an elevation ranging from 33 to 42 feet NGVD 29. The reportedgroundwater extraction rate from this drain is approximately 5 gpm.
• Unit 2 Footing Drain: This drain is designed to maintain groundwater elevationsbeneath the Unit 2 Vapor Containment (IP2-VC) at an elevation ranging fromapproximately 13 to 42 feet NGVD 29. The long term flow rate from this drain isnot known, but short term measurements made prior to and during the PumpingTest indicate it is likely on the order of 5 gpm.
" Unit 3 Footing Drain: IP3-VC is known to have a Curtain Drain. However,specifics of its construction were not available. It is known that a pipe thatconnects to the Unit 3 Curtain Drain is currently under water in a manholeNortheast of Unit 3. Due to this condition, it is unknown how much or whether ornot this drain is removing groundwater.
• Unit 1, 2, and 3 storm drains: The storm drains surrounding Units 1, 2, and 3 wereconstructed of corrugated metal piping. These pipes and associated utility trencheshave been shown to allow at least some infiltrationlexfiltration. That is, dependingon rainfall and location, these structures may either receive groundwater or rechargethe aquifer.
6.7.2 Groundwater Flow Rates
In the interest of evaluating conditions when a relatively large amount ofgroundwater (and associated constituents) flux to the Hudson River occurs, our discussionof lateral groundwater flow direction focuses on the low tide potentiometric surfacecontours as shown on Figures 6.19 and 6.20. These groundwater contours show thatgroundwater generally flows toward the Site from the North, East and South, with agenerally westerly flow direction across the. Site with a gradient averaging about 0.06 feetper feet.
6.7.2.1 Seepage Velocities
We used Darcy's Law to estimate the average groundwater seepage velocityacross the Site:
dh IV = K A I
dl n,
Where:
V average linear groundwater velocityK = hydraulic conductivity (0.27 feet/day [see Section 6.50])d groundwater gradient (0.06)dln, - effective porosity (assumed to be 0.0003 based on specific yield measured during
Pumping Test)
74
Based on this equation and Site data, we computed the average groundwaterseepage velocity to be on the order of 55 ft/day. This is an upper end estimate in that itdoes not account for the effect of dead-end fractures and irregularities in fracture apertures.That is, we believe the effective porosity is larger than that indicated by hydraulic testing.
Also note that this is an average velocity with flow rate in individual fractures beingcontrolled by the local gradient and hydraulic aperture of the fracture. Based on the tracertest (see Section 7.3.2), actual measured average seepage rates were substantially less than55 ft/day.
6.7.2.2 Groundwater Flux
To estimate groundwater flows (i.e., groundwater mass flux) beneath theIPEC, a calibrated analytical groundwater flow model was constructed. This model wasbased on two independent equations, both of which provide groundwater flow estimates.The first of these equations is based on a mass balance. That is, on a long term average,the groundwater discharging from the aquifer is equal to the aquifer recharge. The secondequation is "Darcy's Law", which states the flow per unit width of aquifer is equal to thetransmissivity of the aquifer multiplied by the hydraulic gradient.
As discussed in the following subsections using Site-specific data for thegoverning parameters, both of these independent methods provided similar results.Because we were conservative (that is, we chose values for both equations that we believemay somewhat overestimate flows), we believe the model is appropriate for its intendeduse for estimating the mass of groundwater discharging to the Hudson River as part of doseimpact computations"8 . Please note, this model is not, therefore, conservative for allpurposes. For example, we believe it would likely overestimate the yield of extractionwells should they be developed at the facility.
While the calculated groundwater flux from the Site directly to the river(approximately 13 gpm) may intuitively seem small, it is consistent with our ConceptualSite Model and the identified hydrogeological setting.
Mass Balance
The mass balance approach recognizes that the only substantial source ofrecharge to aquifer is areal recharge derived from precipitation. Precipitation in the areareportedly varies from 49 inches per year (30-year average) to 36 inches per year (10-yearaverage) at the IPEC Meteorological Station. Areal recharge is that portion of precipitationthat reaches the water table (total precipitation minus run-off, evaporation andtranspiration). The average areal recharge is dependent on total precipitation, the natureand timing of individual storm events, soil types, topography, plant cover, the percentageof impervious cover (roads, buildings, etc.) and precipitation recharge through exfiltrating
48 It is noted that the dose impact computations reported for 2006 were based on the mass balance modelonly. These analyses were completed prior to obtaining sufficient data to implement the Darcy's Law model.It is recommended that future dose impact computations also be based on the mass balance model, but withupgrades based on Darcy's Law analyses.
75
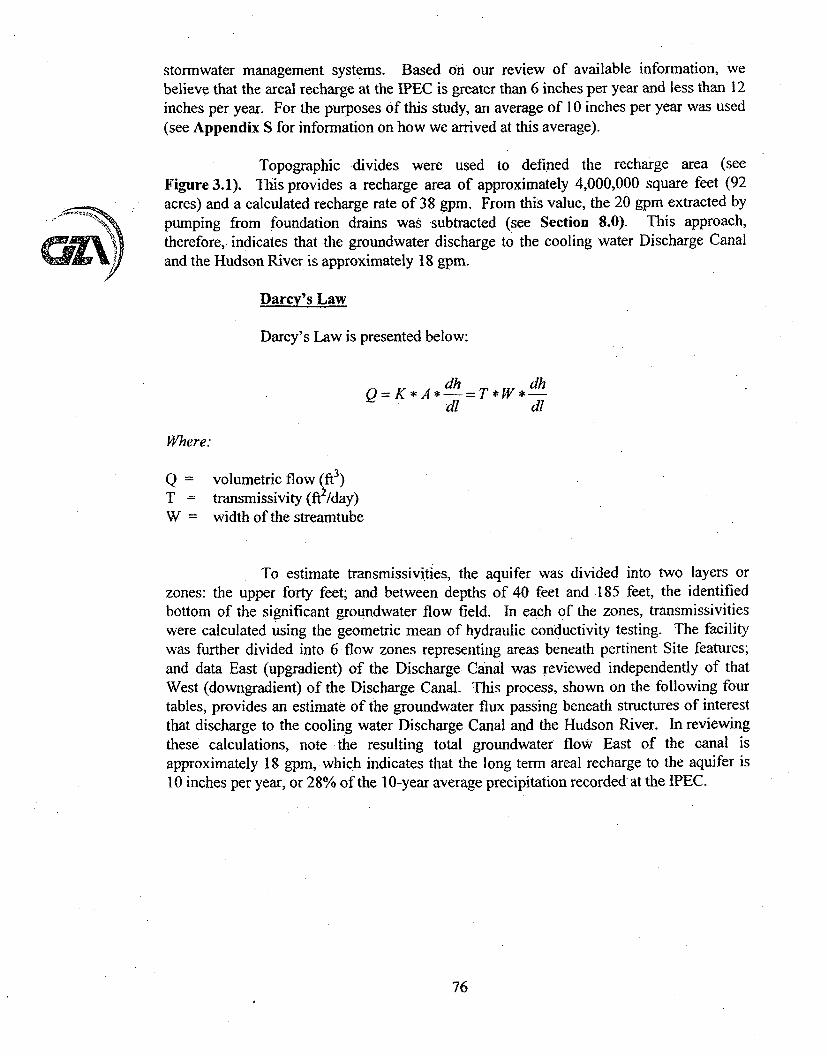
stormwater management systems. Based on our review of available information, webelieve that the areal recharge at the IPEC is greater than 6 inches per year and less than 12inches per year. For the purposes of this study, an average of 10 inches per year was used(see Appendix S for information on how we arrived at this average).
Topographic divides were used to defined the recharge area (seeFigure 3.1). This provides a recharge area of approximately 4,000,000 square feet (92acres) and a calculated recharge rate of 38 gpm. From this value, the 20 gpm extracted bypumping from foundation drains was subtracted (see Section 8.0). This approach,therefore, indicates that the groundwater discharge to the cooling water Discharge Canaland the Hudson River is approximately 18 gpm.
N
Darcy's Law
Darcy's Law is presented below:
Adh dhQ=K * A * = T *W* -dl dl
Where:
Q = volumetric flow (ft3)T = transmissivity (fl2/day)W = width of the streamtube
To estimate transmissivities, the aquifer was divided into two layers orzones: the upper forty feet; and between depths of 40 feet and 185 feet, the identifiedbottom of the significant groundwater flow field. In each of the zones, transmissivitieswere calculated using the geometric mean of hydraulic conductivity testing. The facilitywas further divided into 6 flow zones representing areas beneath pertinent Site features;and data East (upgradient) of the Discharge Canal was reviewed independently of thatWest (downgradient) of the Discharge Canal. This process, shown on the following fourtables, provides an estimate of the groundwater flux passing beneath structures of interestthat discharge to the cooling water Discharge Canal and the Hudson River. In reviewingthese calculations, note the resulting total groundwater flow East of the canal isapproximately 18 gpm, which indicates that the long term areal recharge to the aquifer is10 inches per year, or 28% of the 10-year average precipitation recorded at the IPEC.
76
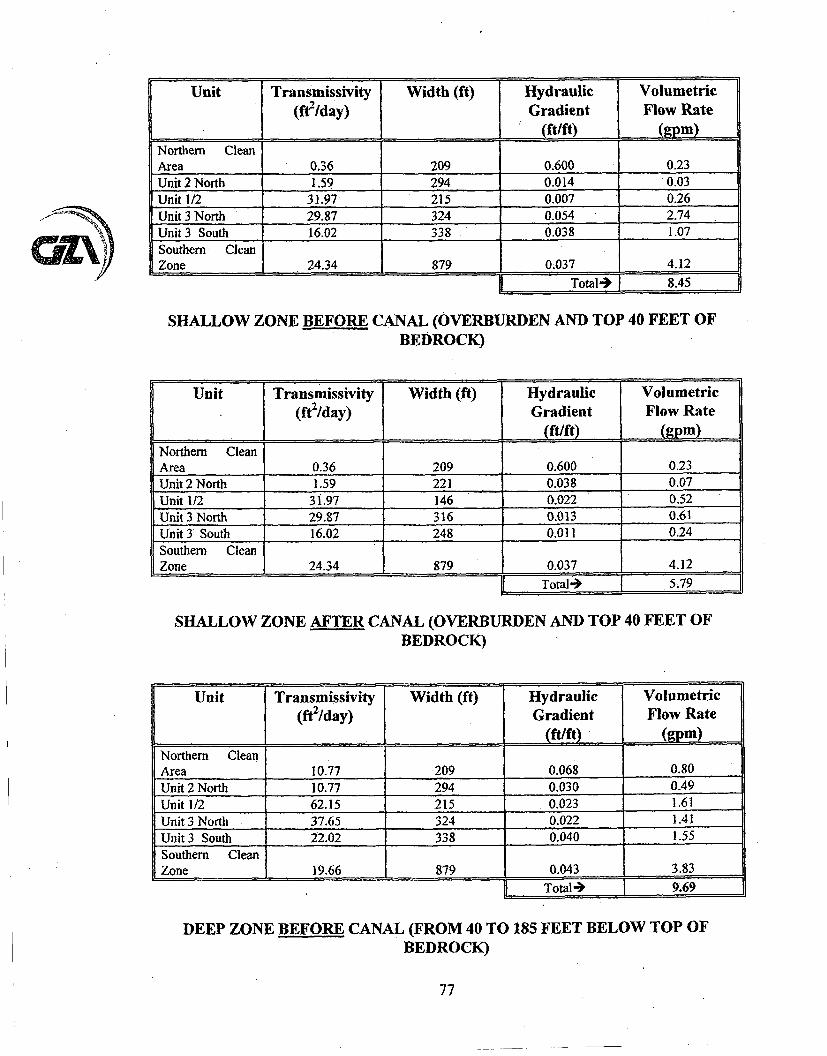
Unit Transmissivity Width (ft) Hydraulic Volumetric(ft/day) Gradient Flow Rate
_ (ft/ft) (gpm)Northern CleanArea 0.36 209 0.600 0.23Unit 2 North 1.59 294 0.014 0.03Unit 1/2 31.97 215 0.007 0.26Unit 3 North 29.87 324 0.054 2.74Unit 3 South 16.02 338 0.038 1.07Southern% CleanZone 24.34 879 0.037 4.12
Total-4 8.45
SHALLOW ZONE BEFORE CANAL (OVERBURDEN AND TOP 40 FEET OFBEDROCK)
Unit Transmissivity Width (ft) Hydraulic Volumetric(ft 2/day) Gradient Flow Rate1(ft/ft) I (gpm)
Northern Clean
Area 0.36 209 0.600 0.23Unit. 2 North 1.59 221 0.038 0.07Unit 1/2 31.97 146 0.022 0.52Unit 3 North 29.87 316 0.013 0.61Unit 3 South 16.02 248 0.011 0.24Southern CleanZone 24.34 879 0.037 4.12
Total- 5.79
SHALLOW ZONE AFTER CANAL (OVERBURDEN AND TOP 40 FEET OFBEDROCK)
Unit Transmissivity Width (ft) Hydraulic Volumetric(ft 2/day) Gradient Flow Rate
.... __•__,_,(ft/ft) " ,,,(gpm )Northern CleanArea 10.77 209 0.068 0.80Unit 2 North 10.77 294 0.030 0.49Unit 1/2 62.15 215 0.023 1.61Unit 3 North 37.65 324 0.022 1.41Unit 3 South 22.02 338 0.040 1.55Southern CleanZone 19.66 879 0.043 3.83
,__,___"__,,.__, .r''
Total4 9.69
DEEP ZONE BEFORE CANAL (FROM 40 TO 185 FEET BELOW TOP OFBEDROCK)
77
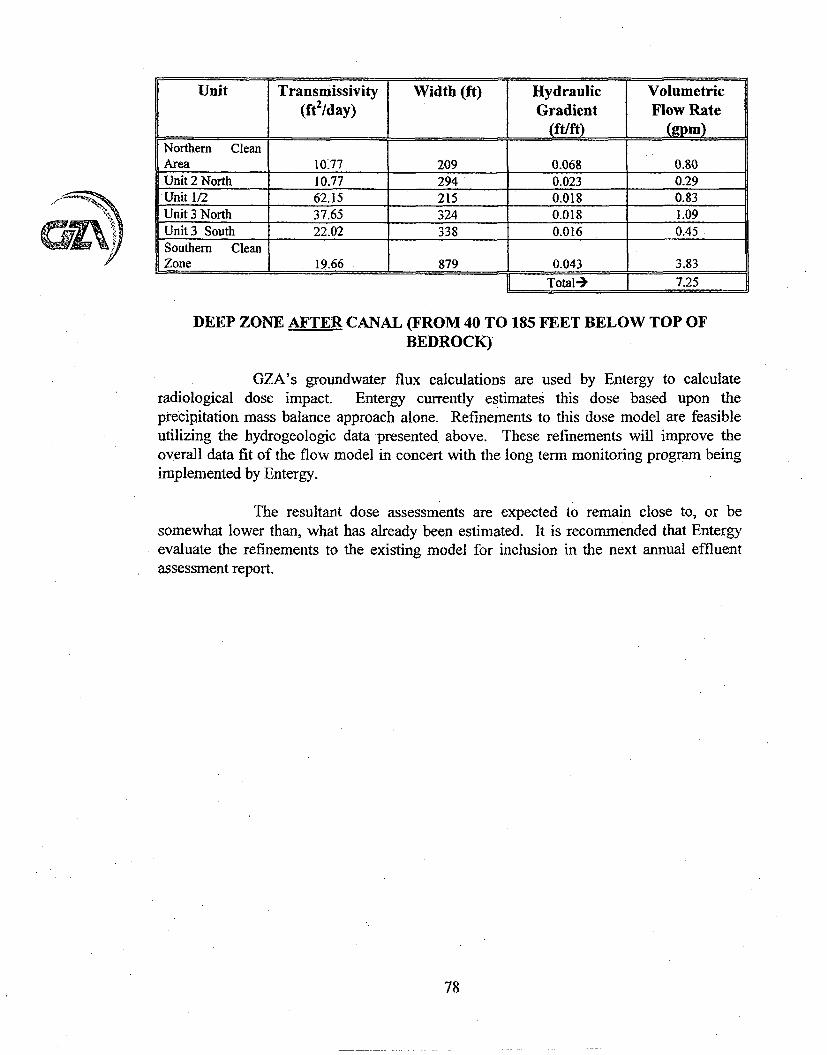
Unit Transmissivity Width (ft) Hydraulic Volumetric(ft 2/day) Gradient Flow Rate
Northern Clean
Area 10'77 209 0.068 0.80.Unit 2 North 10.77 294 0.023 0.29Unit 1/2 62.15 215 0.018 0.83Unit 3 North 37.65 324 0.018 1.09Unit 3 South 22.02 338 0.016 0.45Southern CleanZone 19.66 879 0.043 3.83
I Total- 7.25
DEEP ZONE AFTER CANAL (FROM 40 TO 185 FEET BELOW TOP OFBEDROCK)
GZA's groundwater flux calculations are used by Entergy to calculateradiological dose impact. Entergy currently estimates this dose based upon theprecipitation mass balance approach alone. Refinements to this dose model are feasibleutilizing the hydrogeologic data presented above.. These refinements will improve theoverall data fit of the flow model in concert with the long term monitoring program beingimplemented by Entergy.
The resultant dose assessments are expected to remain close to, or besomewhat lower than, what has already been estimated. It is recommended that Entergyevaluate the refinements to the existing model for inclusion in the next annual effluentassessment report.
78
7.0 GROUNDWATER TRACER TEST RESULTS
A tracer test was conducted to help assess groundwater migration pathways from IP2-SFP.As discussed in the following sections, the test also helped to confirm migration pathwaysfrom Unit 1. The test was designed to simulate a leak from IP2-SFP, in that the tracer(Fluorescein) was released directly to the bedrock at the base of the structure, immediatelybelow the shrinkage cracks associated with the 2005 release. The bedrock surface at thislocation is approximately elevation 51 feet, and thus approximately 40 feet above the watertable (as measured in the immediately adjacent MW-30 - see Figure 7.1). This approachwas taken (recognizing it would complicate tracer flow paths relative to injection directlyinto the groundwater) to provide better understanding of the role of unsaturated bedrock instoring and transporting Tritium.
A major difference in the test, as compared to possible releases at IP2-SFP, is the rate ofthe injection. The 2005 Tritium release was measured at a peak rate of approximately2 liters per day (0.005 gpm), as opposed to the tracer injection that occurred relativelyinstantaneously (as compared to the Tritium release) at a rate of approximately 3.5 gpmover approximately an hour. This higher injection rate was used to insure that a sufficientmass of Fluorescein was released at a known time. As anticipated, and discussed insubsequent sections, this practice appears to have enhanced the lateral spreading of thetracer in the unsaturated zone.
7.1 TRACER INJECTION
Preparation for the injection began on January 29 2007 with the injection of potable waterto test the ability of the injection point4 9, T1-U2-I, to accept water and to pre-wet fractures.The first potable water injection was conducted on January 29, 2007. Fivehundred gallons of water (measured using an inline totaling water meter) was introduced asfast as the water source would permit (approximately 8.5 gpm). The water level in the welldid not rise significantly. The second potable water injection was conducted onJanuary 30, 2007. A total of 1,012 gallons of tap water was introduced at a mean rate ofapproximately 8.3 gpm.
The piezometric data collected during that period from wells MW-30, MW-31, MW-33,MW-34 and MW-35 were reviewed for evidence of groundwater mounding. (Note:transducers were not installed in RW-I and MW-32 on that date.) Mounding, on the orderof 0.5 to 1 foot, was recorded at MW-3 1. No response was noted at the other four nearbymonitored locations. Note that MW-31 is located upgradient of the injection point from asaturated zone groundwater flow perspective, and unsaturated zone flow in this direction is
49 The injection point as shown on Figure 7.2 is constructed from two-inch steel pipe that ends in a tee and perforatedpiping running directly on the bedrock surface, well above the water table. This perforated piping was covered withapproximately 0.5 feet of crushed stone extending from the bedrock excavation face to the South face of the SFP. over alength of approximately 8 feet. The crushed stone was covered with filter fabric prior to placing the concrete mud-matfor gantry crane foundation construction, the mud-mat covers the entire bedrock excavation "floor" adjacent to the Southside of the SFP.
79
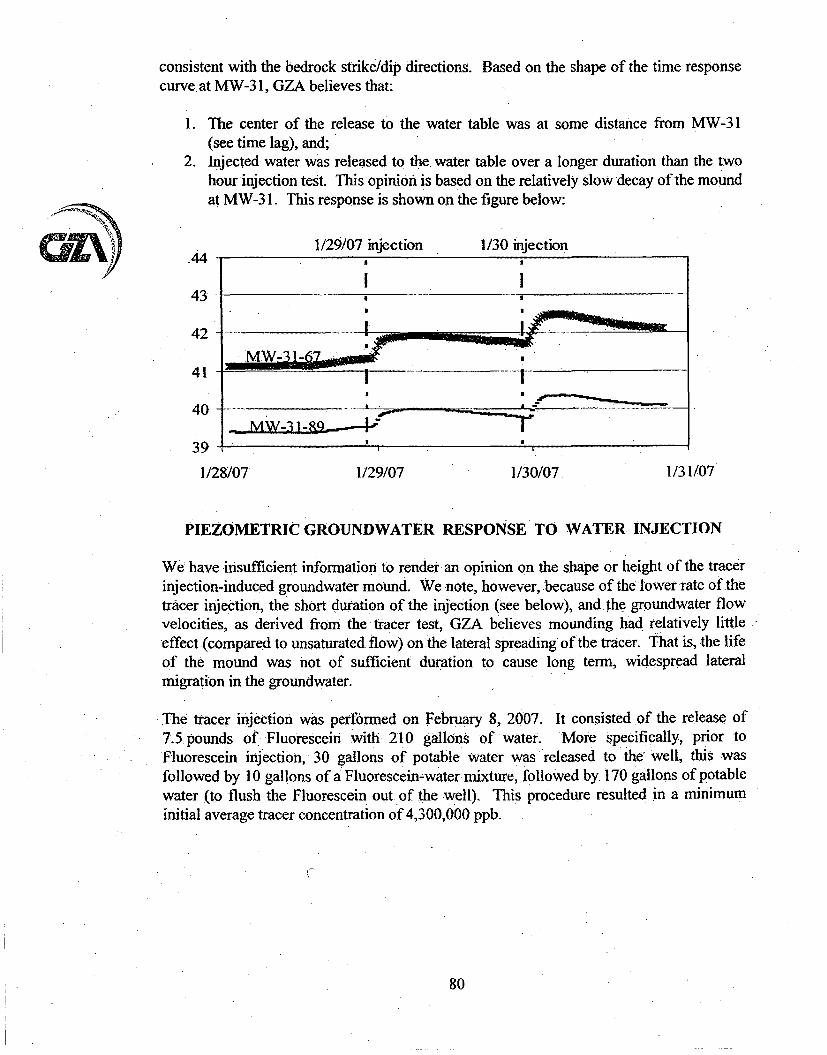
consistent with the bedrock strike/dip directions. Based on the shape of the time responsecurve at MW-3 1, GZA believes that:
I. The center of the release to the water table was at some distance from MW-31(see time lag), and;
2. Injected water was released to the water table over a longer duration than the twohour injection test. This opinion is based on the relatively slow decay of the moUndat MW-3 1. This response is shown on the figure below:
AIM tr,
/N1/29/07 injection 1/30 injection
44
43
42
41
40
39-. MW--3 I8
1/28/07 1/29/07 1/30/07 1/31/07
PIEZOMETRIC GROUNDWATER RESPONSE TO WATER INJECTION
We have insufficient information to render an opinion on the shape or height of the tracerinjection-induced groundwater mound. We note, however, because of the lower rate of thetracer injection, the short duration of the injection (see below), and the groundwater flowvelocities, as derived from the tracer test, GZA believes mounding had relatively littleeffect (compared to unsaturated flow) on the lateral spreading of the tracer. That is, the lifeof the mound was not of sufficient duration to cause long .term, widespread lateralmigration in the groundwater.
The tracer injection was perfirned on February 8, 2007. It consisted of the release of7.5pounds of Fluorescein with 210 gallons of water. More specifically, prior toFluorescein injection, 30 gallons of potable water was released to the well, this wasfollowed by 10 gallons of a Fluorescein-water mixture, followed by 170 gallons of potablewater (to flush the Fluorescein out of the well). This procedure resulted in a minimuminitial average tracer concentration of 4,300,000 ppb.
80
7.2 TRACER CONCENTRATION MEASUREMENTS
The concentrations of Fluorescein in groundwater were routinely measured betweenFebruary 8, 2007 and August 21, 200750 at 63 locations. This resulted in the collectionanalysis of 4,488 samples, including background samples, charcoal samplers and watersamples. These data are tabulated and presented on time-concentration graphs inAppendix N.
Measurements of Fluorescein concentrations were made by two methods. The first isthrough aqueous sample analysis (1,969 individual samples). These water sample analysesprovide direct concentration measurements, at the time of sampling, with a detection limitof less than I ppb.
A second method entailed desorbtion of Fluorescein from packets of activated carbon(carbon samplers) suspended in the groundwater flow path at multi-level samplinglocations. This method provides a measure of the mass of Fluorescein moving through amonitoring well screen over the period the activated carbon is in the well. However, theactual concentration of Fluorescein in the groundwater is not determinable from this test.Among other things, carbon sample analyses are useful in establishing that the Fluoresceinmass being transported by groundwater did not pass sampling locations between discretesampling events. This was important for this study because of the potential for hightransport rates (see Section 6.0).
7.3 SPATIAL DISTRIBUTION AND EXTENT OF FLUORESCEIN INGROUNDWATER
The groundwater tracer test was developed primarily to identify groundwater migrationpathways. We have divided our discussion on observed pathways into three subsections:unsaturated zone migration, the lateral distribution of Fluorescein, and the Verticaldistribution of Fluorescein.
Unsaturated Zone Transport
By design, Fluorescein was released atop the bedrock, in the unsaturated zone.The bedrock structure (strike and dip direction of bedrock fractures) therefore played adominant role in controlling tracer migration to the water table. This is witnessed by thesignificant Fluorescein concentrations observed in the upgradient monitoring well MW-331and MW-32 (see below) and at lower concentrations in the more distant and upgradientUnit I monitoring well MW-42.
The observed unsaturated zone migration to the South and East is consistent withthe observed bedrock fracturing (see Section 6.0). This mechanism is also evidenced bydata showing the highest Fluorescein concentration (49,000 pico-curies per liter - pCi/L) 5
50 In addition to the routine sampling, specific wells were sampled for a longer period -of time as part of short termvariability testing (see Section 9.0).51 pCi/L is a standard unit of radiation measurement.
81
being found in well MW-32, located 60 feet to the South of the injection location, and notin MW-30, located immediately below the injection location.
In reviewing tracer test results, it should be recognized that the Fluorescein releasedat a single location on the bedrock was not released to the water table at a single location,rather, it reached the water table over an undefined area that likely extends to the East ofMW-31, to the South to MW-42, and likely not far to the North of the injection well.As discussed in Section 7.5, this limits our ability to evaluate migration rates, but increasesour ability to understand likely Tritium migration pathways from IP2-SFP.
The spreading of Fluorescein in the unsaturated zone was likely more pronouncedthan the spreading of Tritium because of the higher release rate. The tracer test, however,.supports data that shows the Unit 2 plume to extend upgradient of the source area andlaterally to Unit 1 to the South of IP2-SFB.
GZX,
Lateral Distribution
Two conditions were selected to show the lateral distribution of Fluorescein in amanner illustrating conditions influencing the migration of groundwater in the vicinity ofIP2-SFB. These are:
1. The maximum observed concentrations; and,2. Conditions just prior to, and including, June 14, 2007.
While the maximum observed concentrations do not illustrate an actual condition,the resulting figure is useful in highlighting migration pathways. We chose June 14th
because it represents conditions approximately 4 months after the injection. Withestimated Fluorescein transport rates on the order of 4 to 9 feet per day (see Section 7.4),conditions proximate to that date clearly illustrate the effects of subsurface storage on bothFluorescein and TritiumS2.
Lateral Distribution.- Maximum Obseryed Concentrations
The distribution of the observed maximum concentrations of Florescein, at anydepth,: in groundwater is shown on Figure 7.2. This figure was developed based on boththe observed concentrations and our understanding of groundwater flow directions(inferred from groundwater contours). This figure does not show conditions at any singletime; rather it represents our interpretation of the highest tracer concentration, at any timeduring the test, at a location. In reviewing that figure please note:
The maximum observed tracer concentration was 49,000 ppb; approximately 1% ofthe calculated average injection concentration. We interpret these data to mean thatthere is considerable :spreading and mixing of the tracer in the unsaturated andshallow- saturated zones.
52 Later dates were not selected because of the associated reduction in the sampling frequency and/or number of samplinglocations.
82
C Jew
" The 50 ppb contour represents approximately 1/100,000 the concentration of theinjected tracer. Because Tritium concentrations in IP2-SFP are approximately20,000,000 pCi/L this contour (50 ppb Fluorescein) represents the detection limit ofa release of Tritium from 1P2-SFP (at the injection well).
" The general shape of the resulting plume is strikingly similar to the observed Unit 2plume, see Figure- 8.1. This supports our interpretation of contaminant migrationfrom IP2-SFP.
* Because tracer was detected in MW-42 and MW-53, the test can be used to helpassess migration pathways from Unit 1.. The observed distribution of Fluorescein inthe vicinity of Unit I supports our interpretation of the migration of Strontium, witha westward migration towards the Hudson River in a fairly narrow zone (see Figure7.2).
" The low concentrations to the West (downgradient) of the cooling water DischargeCanal (as compared to East of the canal) indicate the canal received a significantmass of the tracer, as opposed to direct discharge to the river.
" Concentrations found in Manhole Five (MH-5) indicate the IP-2 Curtain Drainreceived tracer (see Section 7.5).
Lateral Distribution - June 14, 2007
GZA's interpretation of the distribution of Fluorescein in groundwater proximate toJune 14, 2007 is shown on Figure 7.3. Again, concentrations are the highest measured atany depth. While not ideal for the observed concentrations, the contour interval wasselected to match the contour intervals shown on Figure 7.2. In reviewing that figure,please note:
* The shape of the plume is more representative of an ongoing release than of a four-month-old instantaneous release in a strong groundwater flow field. This supportsother data-which indicate water is stored in the unsaturated bedrock (and potentiallywithin the upper water bearing zone) and is released to the groundwater flow fieldover time.The center of the Fluorescien mass in groundwater, in the release area, shifted tothe North. (See data for wells MW-30 and MW-32 on Figures 7.2 and 7.3). GZAinterprets these data to mean:
• There is more storage in the unsaturated zone in proximity to IP2-FSB, thanto the South or West; andThe relatively high injection rate resulted in more lateral spreading of thetracer than would have resulted from a slow, long duration release.
Vertical Distribution
The table provided below presents data on the vertical distribution of Fluoresceinalong the center line of the tracer plume (see Figure 7.2 for-well locations). It presents themaximum observed concentration at each depth and the approximate concentration 53
proximate to June 14, 2007.
53 Data estimated for the June 14th date are based on time concentration graphs (see Appendix N).
83
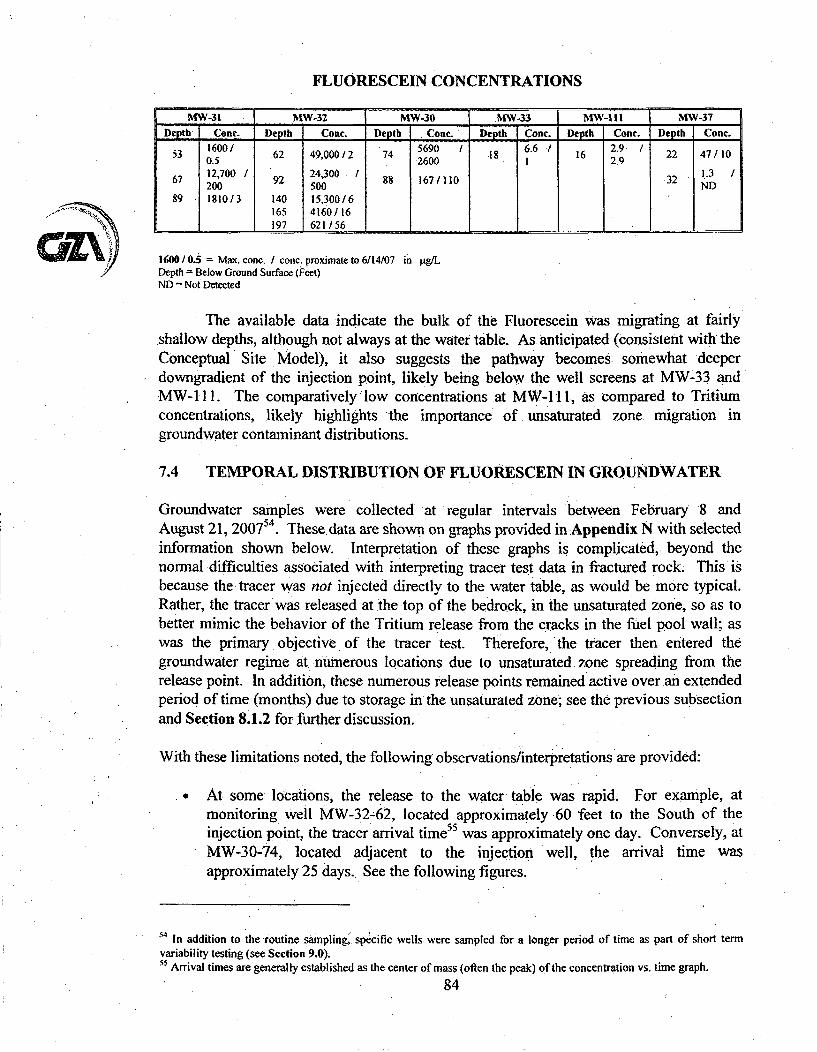
FLUORESCEIN CONCENTRATIONS
MW-31 MW-32 MW-30 MW-33 MW-I I I INV-37Depth Conc. Depth Conc. Depth . Cone. Depth Cone. Depth Conc. Depth Cone.
53 1600/ .62 49,000/2 74 5690 1 6.6 1I 2.9 100. 2 4,0 41g16 22 47 /1005 2600 1 2.9
67 12,700 / 24,300 1 88 167/110 32 1.3 /200 92 500 ND
89 1810/3 140 15,300/6165 4160/16197 621/56
1600 / 05 = Max. cone. / conc. proximate to 6/14/07 in p-.g/LDepth = Below Ground Surface (Feet)ND = Not Detected
The available data indicate the bulk of the Fluorescein was migrating at fairlyshallow depths, although not always at the water table. As anticipated (consistent with theConceptual Site Model), it also suggests the pathway becomes somewhat deeperdowngradient of the injection point, likely being below the well screens at MW-33 andMW-1 11. The comparatively low concentrations at MW-I 11, as compared to Tritiumconcentrations, likely highlights the importance of unsaturated zone migration ingroundwater contaminant distributions.
7.4 TEMPORAL DISTRIBUTION OF FLUORESCEIN IN GROUNDWATER
Groundwater samples were collected at regular intervals between February 8 andAugust 21, 2007:54. These data are shown on graphs provided in:Appendix N with selectedinformation shown below. Interpretation of these graphs is complicated, beyond thenormal difficulties associated with interpreting tracer test data in fractured rock. This isbecause the tracer was not injected directly to the water table, as would be more typical.Rather, the tracer was released at the top of the bedrock, in the unsaturated zone, so as tobetter mimic the behavior of the Tritium release from the cracks in the fuel pool wall; aswas the primary objective, of the tracer test. Therefore, 'the tracer then entered thegroundwater regime at numerous locations due to unsaturated zone spreading from therelease point. In addition, these numerous release points remained active over an extendedperiod of time (months) due to storage in the unsaturated zone; see the previous subsectionand Section 8.1.2 for further discussion.
With these limitations noted, the following observations/interpretations are provided:
• At some locations, the release to the water table was rapid. For example, atmonitoring well MW-32-62, located approximately 60 feet to the South of theinjection point, the tracer arrival time55 was approximately one day. Conversely, atMW-30-74, located adjacent to the injection well, the arrival time wasapproximately 25 days. See the following figures.
54 In addition to the routine sampling. specific wells were sampled for a longer period of time as part of short termvariability testing (see Section 9.0).55 Arrival times aregenerally established as the center of mass (often the peak) of the concentration vs. time graph.
84
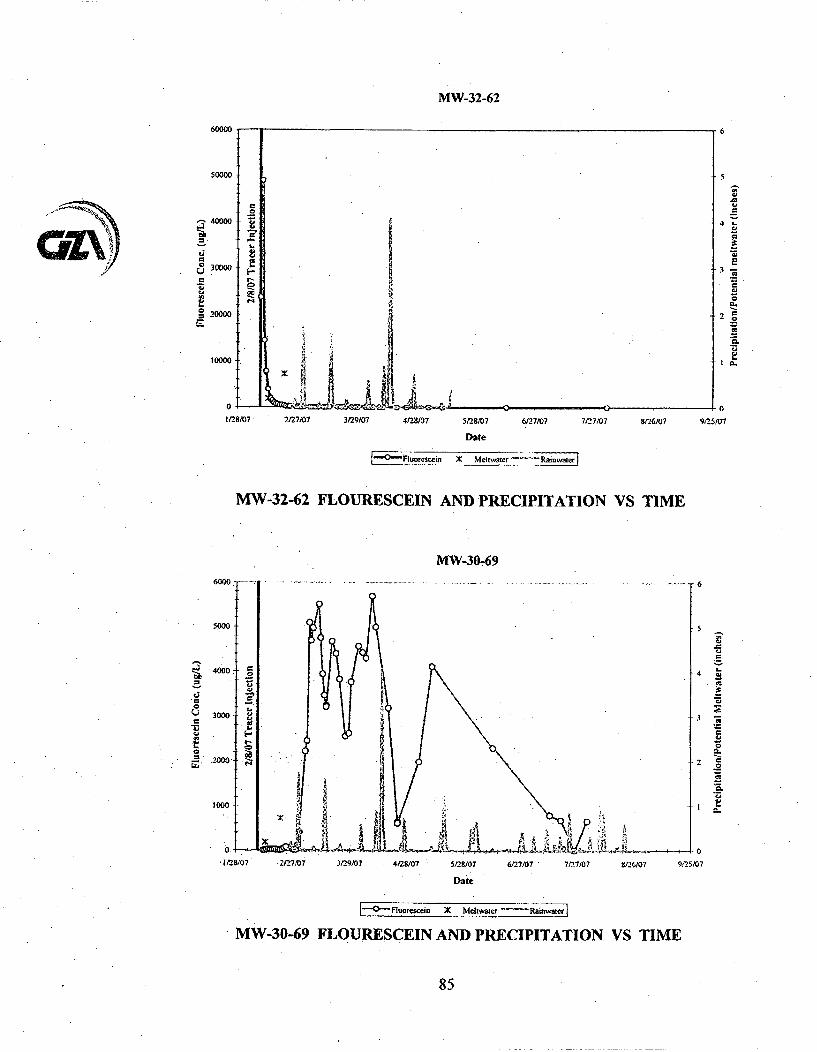
MW-32-62
ZN
60000
50000
-- 40000
30000
200
U.
5
L0
1/28107 2/27/07 3/29/07 4/2r8/07 5128/07 6/27/07 7/27W07 8/26/07 9/-5/07
Date
=I-F=,orcsceun X Meltwater an1e
MW-32-62 FLOURESCEIN AND PRECIPITATION VS TIME
MW-30-69
3
C;
0Q
GD
t0
GD0
0
GDGD
I ~0~
A
0
8P6/07 0/251071128M7 * 2/27/07 3/29/07 4/28/07 5P28/07 6/27/07 7/27/07
Date
"- -ýrcsccin X Metwtver ii;- .,
FLOURESCEIN AND PRECIPITATION VS TIMEMW-30-69
85
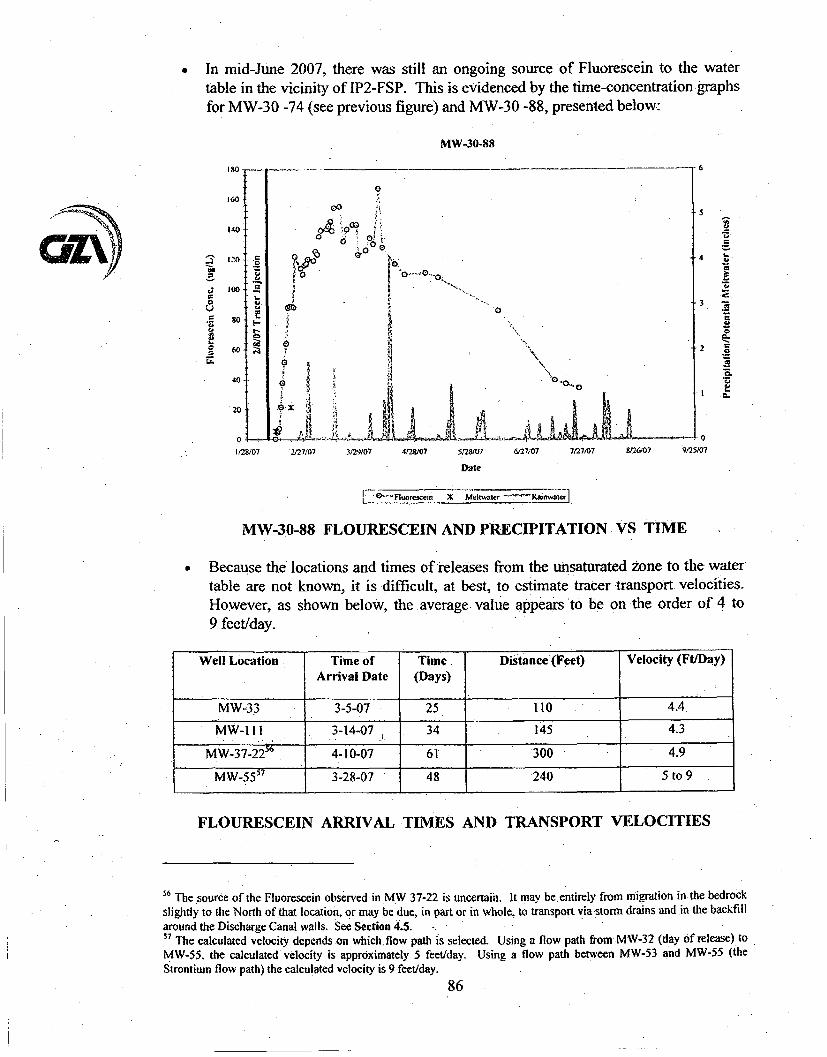
In mid-June 2007, there was still an ongoing source of Fluorescein to the watertable in the vicinity of IP2-FSP. This is evidenced by the time-concentration graphsfor MW-30 -74 (see previous figure) and MW-30 -88, presented below:
MW-30-88
Z. -'
GZX) ;aCa
S~
2
*1=1~*
.44
00.CC
.0.
1-8/07 2t27107 3N29/07 4/28/07 5P8107 6/27107 7/27/07 8/26/07 9425/07
Date
1770 " Fluorescein. X Mehtwaler -- f Rainwater]
MW-30-88 FLOURESCEIN AND PRECIPITATION VS TIME
Because the locations and times of releases from the unsaturated zone to the watertable are not known, it is difficult, at best, to estimate tracer transport. velocities.However, as shown below, the average value appears =to be on the order of 4. to9 feet/day.
FLOURESCEIN ARRIVAL TIMES AND TRANSPORT VELOCITIES
56 The source of the Fluorescein observed in MW 37-22 is uncertain. It may beentirely from migration in the bedrock
slightly to the North of that location, or may be due, in part or in whole, to transport via storm drains and .in the.backfillaround the Discharge Canal walls. See Section 4.5. -.5 The calculated velocity depends -on whichflow path is selected. Using a flow path from MW-32 (day of release). toMW-55, the calculated velocity is approximately 5 feet/day. Using a flow path between MW-53 and MW-55 (theStrontium flow path) the calculated velocity is 9 feet/day.
86
Also note, the carbon sampler data supports these estimates to the extent that no evidenceof significant Fluorescein migration between aqueous sampling events was found.
The observed tracer migration rates are approximately 1/5 to 1/10 the calculatedgroundwater velocity of 55 ft/day, see Section 6.7.2. GZA attributes the differencebetween the "observed" and the "computed" transport velocities primarily to the effectiveporosity of the bedrock. That is, we believe the actual effective porosity is considerablylarger (more on the order of 0.003) than that computed from our analyses of the PumpingTest (see Section 6.5.1); the aquifer response testing (see Section 6.6.1); or the hydraulicaperture of the bedrock (see Section 6.5.2). This slower transport velocity helps to ekplainthe observed long term temporal variations in both tracer and Tritium groundwaterconcentrations, and supports the use of a porous media flow model. As a practical matter,this slower transport velocity encourages the use of conventional groundwater monitoringfrequencies (quarterly ' or longer); and reduces concerns over the possibility of highconcentrations of contaminants migrating by a monitoring location between samplingevents.
7.5 FLUORESCEIN IN DRAINS, SUMPS AND THE DISCHARGE CANAL
Fluorescein was also detected within storm drain catch basins, foundation drain sumps, andthe Discharge Canal. Fluorescein was detected in manholes MH-4, MH-5 and MH-6.In reviewing these data, note:
MH-5 receives discharge from the IP2-VC Curtain Drain system. The presence oftracer in this manhole indicates that tracer entered the Curtain Drain system due tolateral spreading at the release point during injection. Once in the Curtain Drainsystem, the tracer migrated to MH-5.Water in MH-5 flows towards the cooling water Discharge Canal passing throughMH-4, discharging at MH-4A.
° The concentrations detected in MH-4 are very similar to the Fluoresceinconcentrations detected in samples collected from MH-5, while Fluorescein was notdetected in samples collected from the downstream manhole MH-4A. Thissuggests that either dilution in MH-4A reduced Fluorescein to below methoddetection limits, and/or the tracer is lost via exfiltration from piping between MH-4and MH-4A. This loss (if it occurs) in conjunction with flow in the canal backfill,could explain the Fluorescein observed in MW-37. Available data are not adequateto fully address this issue. In any event, the test further demonstrates the need toaccount for the Tritium being transported in the IP2-VC Curtain Drain (see Section7.6).I In reviewing data, note that the tracer concentrations in MH-6 are lower than theconcentrations observed in MH-5 (peak in MH-6 of 14.4 ppb as opposed to a peakin MH-5 of 43.1 ppb). We attribute the concentrations in MH-6 to groundwater-.infiltration in the area of the identified tracer plume. Also note the flow fromMH-6 is to MH-5.
Fluorescein was also detected in the IPI-NCD, the IP1-SFDS, and the Containment SpraySump (CSS). We have attributed the presence of tracer at these locations to unsaturatedzone migration to the vicinity and West of MW-42. The concentration and arrival times at
87
these three locations are not easily explained but, taken as a whole, are consistent with theobserved migration of Tritium.
Fluorescein was detected at low concentrations, at various times, in carbon samplescollected from the cooling water Discharge Canal. Because of the substantial dilution inthe canal, the extended release of tracer to the canal and the low concentrations of tracerfound in the samples, we believe these data represent background conditions58 , and cannotbe used to evaluate the tracer test.
7.6 MAJOR FINDINGS
As an overview, the tracer test, supports our CSM and the observed distribution ofcontaminated groundwater. GZA also concludes that:
Unsaturated zone flow is important to the migration of contaminants releasedabove the water table in the vicinity of Unit 2. Bedrock fractures induce this flowto the South and East of the release.
* There is significant storage of contaminated groundwater above the water table orin zones of low hydraulic conductivity (homogeneities) in the saturated zone. Thesefeatures allow a long-lived release of contaminants to the Site groundwater flowfield.Observed tracer- migration rates are lower than calculated theoretical migrationrates. As a practical matter, this "migration" indicates that the use of the estimatedaverage hydraulic conductivity (0.27 ft/day or lxl0A cm/sec) will overestimate thevolume of groundwater migrating through a given area. That is, we attribute thelower transport velocity to be due, in part, to a lower average hydraulicconductivity.In our opinion, the tracer test, in conjunction with the Tritium release, indicates thatthe existing network of monitoring wells can be used to monitor groundwater atIPEC.
'5 It is noted that Fluorescein is the primary colorant in automobile coolant anti-freeze. Therefore, leaks from cars toparking lot/road surfaces can impact surface water bodies via storm drain systems and/or direct runoff. Fluorescein wasdetected in the Discharge Canal prior to, initiation of the tracer injection, further indicating its presence as background.
88
PALX),
8.0 CONTAMINANT SOURCES AND RELEASE MECHANISMS
GZA conducted a review of available construction drawings, aerial photographs, priorreports, and documented releases, and interviewed Entergy personnel to assess potentialcontaminant sources. The primary59 radiological sources identified were the Unit 2 SpentFuel Pool (IP2-SFP) located in the Unit 2 Fuel Storage Building (IP2-FSB) and the Unit IFuel Pool Complex (IP1-SFPs)60 in the Unit I Fuel Handling Building (IP1-FHB. Thesetwo distinct sources are responsible for the Unit 2 plume and the Unit I plume,respectively.
No release was identified in the Unit 3 area. The absence of Unit 3 sources is attributed tothe design upgrades incorporated in the more recently constructed IP3-SFP. Theseupgrades include a stainless steel liner (consistent with Unit 2 but not included in theUnit 1 design) and an additional, secondary leak detection drain system not included in theUnit 2 design.
The identified specific. source mechanisms associated with the IP2-SFP and the IP I -SFPsare discussed in the following sections.. We have segregated this source discussion basedon primary contaminant type; those classified as primarily Tritium sources, as associatedwith the Unit 2 :plume, and those classified as primarily Strontium sources, as associatedwith the Unit 1 plume. While the groundwater plumes emanating from their respectivesource areas can clearly be characterized using each plume's primary eonstituent,radionuclides other than Tritium and Strontium also exist to a limited extent and are fullyaddressed within the context of the Unit 2 and Unit 1 plume discussions61.
Discussion of the two primary source types will be parsed further as follows:
The Unit 2 (Tritium) plume source analyses will be split into: 1) "direct sources"defined as releases to the exterior of Systems Structures -and Components (SSCs);and 2) "indirect storage sources" related to natural hyidrogeologic mechanisms inthe unsaturated zone (such as adsorption and dead-end fractures) and potentialanthropogenic contaminant retention mechanisms (such as certain subsurfacefoundation construction details);The Unit I (Strontium) plume source analyses will be split into the mechanismsspecific to the individual plume flow paths identified.
59 In addition to sources that directly impact groundwater, atmospheric deposition from permitted air discharges was alsoidentified as a potential.source of diffuse, low level Tritium impact to the groundwater.o All of the pools in the IPI-SFPs contained radionuclides in the past. However, only the West pool currently contains
any remaining fuel rods and all of the other IPI pools have been drained of water. It is also noted that the Unit I Westpool has been undergoing increased processing to significantly reduce the amount of radioactive material in the pools.Once fuel i's removed, the IP I-SFPs will no longer constitute an active source of groundwater contamination.6' Contaminants associated with the Unit 2 leak were found to be essentially comprised of Tritium. The Unit I plume iscomprised primarily of Strontium, but also includes Tritium and sporadic observation of Cesium-137, Nickel-63 andCobalt-60 at low levels in some wells downgradient of the IPI-SFP (see Figure 8.3). Entergy accounts for allradionuclides that can be expected to reach the river in their required regulatory reporting of estimated dose impact.
89
8.1 UNIT 2 SOURCE AREA
The majority of the Tritium detected in the groundwater at the Site was traced to IP2-SFP.This pool contains water with maximum Tritium concentrations of up to40,000,000 pCi/L62 .
The highest Tritium levels measured in groundwater (up to 601,000 pCi/L63 ) were detectedearly in the investigation at MW-30. This location is immediately adjacent to IP2-SFP anddirectly below the 2005 shrinkage cracks. As shown on Figure 8.1, the Tritiumcontamination ("the plume64") then tracks with downgradient groundwater flow 65 throughthe Unit 2 Transformer Yard, under the Discharge Canal and discharges to the river66
between the Unit 2 and Unit 1 intake structures. During review of the following sections,it is important to recognize that only small quantities of pool leakage (on the order ofliters/day) will result in the Tritium groundwater plume observed on the Site.
62 In contrast, the levels of Tritium in the Unit I. West pool .are only on.the order of 250,000 pCi/L, Strontium
concentrations in IP2_SFP are on the order of 500 pCi/L.63 The 601,000 pCi/L Tritium concentration was measured during packer testing of the open borehole prior to multi-level
comnpletion. This value is therefore actually a lower bound estimate for depth-:specific Tritium concentrations at thattime. If the multi-level sampling. instrumentation could have been completed prior to obtaining these data (not possiblebecause the packer testing was required to design the multi-level installation). samples Would have yielded equal orhigher concentrations. This conclusion reflects the limited standard length and temporary emplacement of the packersused during the packer testing,.and thusthe greater-potential for mixing and dilution between zones. as compared to thenumerous packers permanently installed in the multi-level. completions.6 It is noted that Figure 8.1 does. not show an actual Tritium plume; .the isopleths presented contour upper boundconcentrations for.samples taken at any time and any depth at a particular location, rather than a 3-dimensional snapshotof concentrations at a single time. As such, this "plume" is an overstatement of the contaminant levels existing at anytime. It should also be noted that the lightest colored contour interval begins at one-quarter the USEPA drinking waterstandard. While drinking water standards do not apply to the Site.(there are no drinking water wells on or proximate tothe Site), they do provide a recognized, and highly conservative, benchmark for comparison purposes). Lower, butpositive detectionsoutside the colored contours are shown as colored data blocks. See figure for additional notes.63 It is recognized that low concentrations of Tritium likely extend to the South. all.the way to Unit I. This conclusion issupported by: 1) the low Tritium concentrations remaining in IPI-SFPs (250,00OpCi/L), 2) the data from MW-42 andMW-53; and 3) the Tritium balance between that released by the IP1-SFPs leak and that collected b.y the NCD. Thetransport. mechanism is through unsaturated zone flow which follows bedrock fracture strike/dip directions rather thangroundwater flow direction (see schematic of unsaturated zone flow mechanism included below). The levels of Tritiumdetected upgradient of 1P2-SFP in monitoring wells MW-31 and MW-32 are also due to unsaturated zone transport fromIP2-SFP along the generally southerly striking and easterly dipping bedrock fractures (see structural geology analysis inSection 6.0 and tracer test discussions in Section 7.0).66 As the Tritium moves under the Discharge Canal, a significant amount discharges directly to the canal before theplume reaches the Hudson River.
90
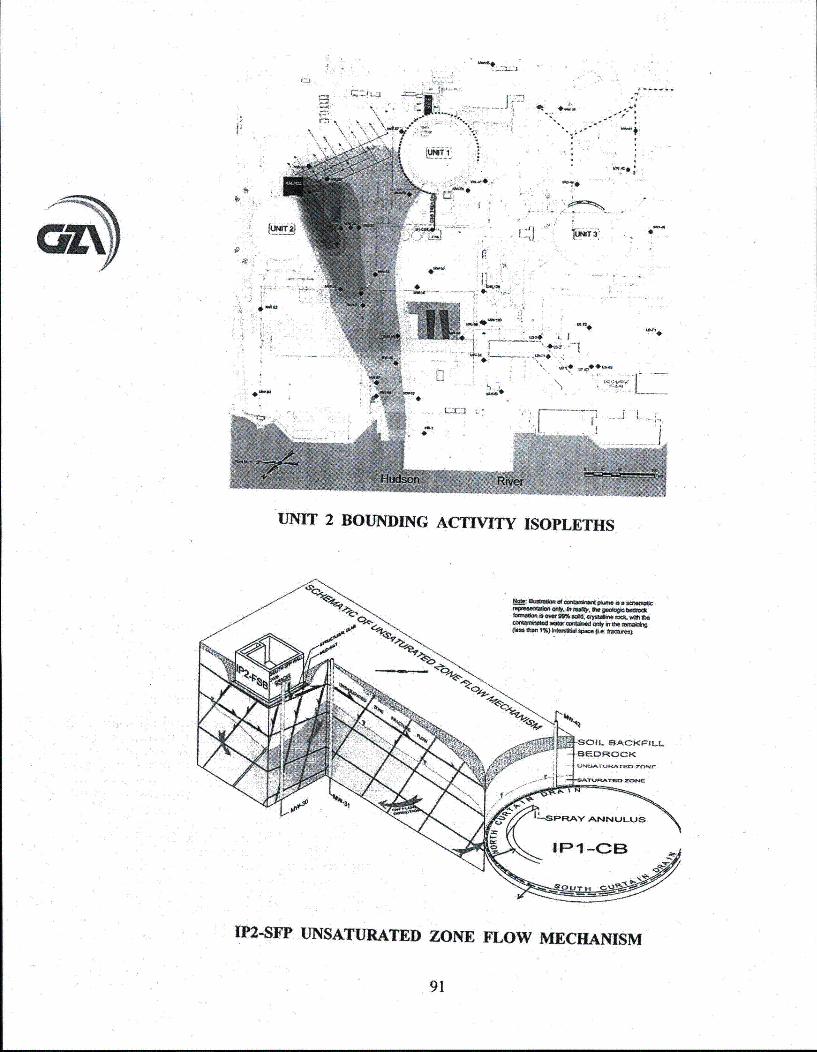
mvet4•L.[
f~i~j
N '---'7
A iU~T1
1 -e-- I
* *,* -*
-- ll ý ý - I -- I...
CJZ4'
4
4--- C-.-
fuNa3
r
-4
s..4: .~j
-S -V *t~~ tfflp@*t~~~
N)
L~LJ~
tm4.
*14
UNIT 2 BOUNDING ACTIVITY ISOPLETHS
1P2-SFP UNSATURATED ZONE FLOW MECHANISM
91
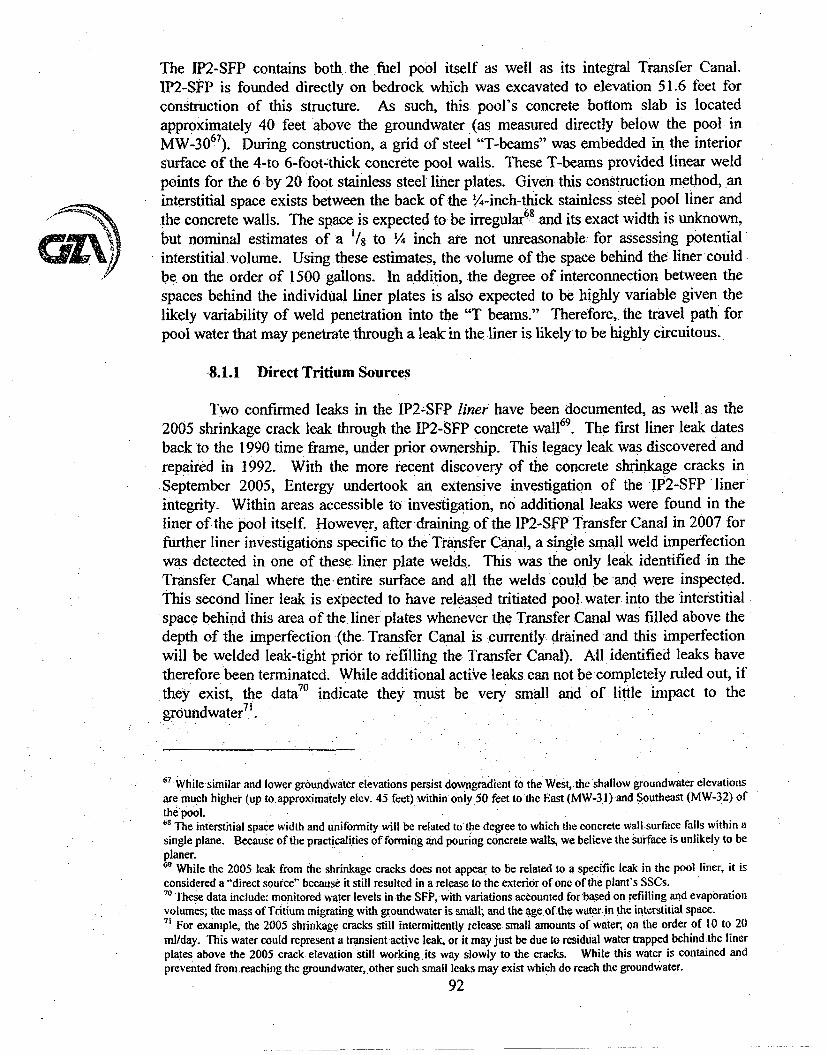
2
The IP2-SFP contains both-the fuel pool itself as well as its integral Transfer Canal.IP2-SFP is founded directly on bedrock which was excavated to elevation 51.6 feet forconstruction of this structure. As such, this pool's concrete bottom slab is locatedapproximately 40 feet above the groundwater (as measured directly below the pool inMW-3067). During construction, a grid of steel "T-beams" was embedded in the interiorsurface of the 4-to 6-foot-thick concrete pool walls. These T-beams provided linear weldpoints for the 6 by 20 foot stainless steel liner plates. Given this construction method, aninterstitial space exists between the back of the 'A-inch-thick stainless steel pool liner andthe concrete walls. The space is expected to be irregular6 8 and its exact width is unknown,but nominal estimates of a 1/8 to ¼ inch are not unreasonable: for assessing potentialinterstitial volume. Using these estimates, the volume of the space behind the liner couldbe on the order of 1500 gallons. In addition, the degree of interconnection between thespaces behind the individual liner plates is also expected to be highly variable given thelikely variability of weld penetration into the "T beams." Therefore, the travel path forpool water that may penetrate through a leak in the liner is likely to be highly circuitous.
8.1.1 Direct Tritium Sources
Two confirmed leaks in the IP2-SFP liner have been documented, as well, as the.2005 shrinkage crack leak through the IP2-SFP concrete wall 69. The first liner leak datesback to the 1990 time frame, under prior ownership. This legacy leak was discovered andrepaired in 1992. With the more recent discovery of the concrete shrinkage cracks inSeptember 2005, Entergy undertook an extensive investigation of the IP2-SFP linerintegrity. Within areas accessible to investigation, no additional leaks were found in theliner of the pool itself. However, after draining of the IP2-SFP Transfer Canal in 2007 forfurther liner investigations specific to the Transfer Canal, a single small weld imperfectionwas detected in one of these liner plate welds. This was the only leak identified in theTransfer Canal where the. entire surface and all the welds could be and were inspected.This second liner leak is expected to have released tritiated pool water into the interstitialspace behind this area of the liner plates whenever the Transfer Canal was filled above thedepth of the imperfection (the Transfer Canal is currently drained and this imperfectionwill be welded leak-tight prior to refilling the Transfer Canal). All identified leaks havetherefore been terminated. While additional active leaks can not be completely ruled out, ifthey exist, the data7° indicate they must be very small and of little impact to thegroundwater
7t.
67 ....
7 While similar and lower groundwater elevations persist downgradient to the West, the shallow groundwater elevations
are much higher (up to approximately elev. 45 feet) within only 50 feet to the East (MW-3.1)and Southeast (MW-32) ofthepool.68 The interstitial space width and uniformity will be related to thedegree to which the concrete wall surface falls within asingle plane. Because of the practicalitics of forming and pouring concrete walls, we believe thesurface is unlikely to beplaner.69 While the 2005 leak from the shrinkage cracks does not appear to be related to a specific leak in the pool liner, it isconsidered a "direct source" because it still resulted in a release to the exterior. of one of the plant's SSCs,70 Tlhese data include: monitored water levels in the SFP, with variations accounted for based on refilling and evaporationvolumes; the mass of Titium migrating with groundwater is small; and the age.of-the waterin the interstitial space.71 For example, the 2005 shrinkage cracks still intermittently release small amounts of water; on the order of 10 to 20rot/day. This water could representa transient active leak. or it may just be due to residual water trapped behind the linerplates above the 2005 crack elevation still working its way slowly to the cracks. While this water is contained andprevented from reaching the groundwater, other such small leaks may exist which do reach the groundwater.
92
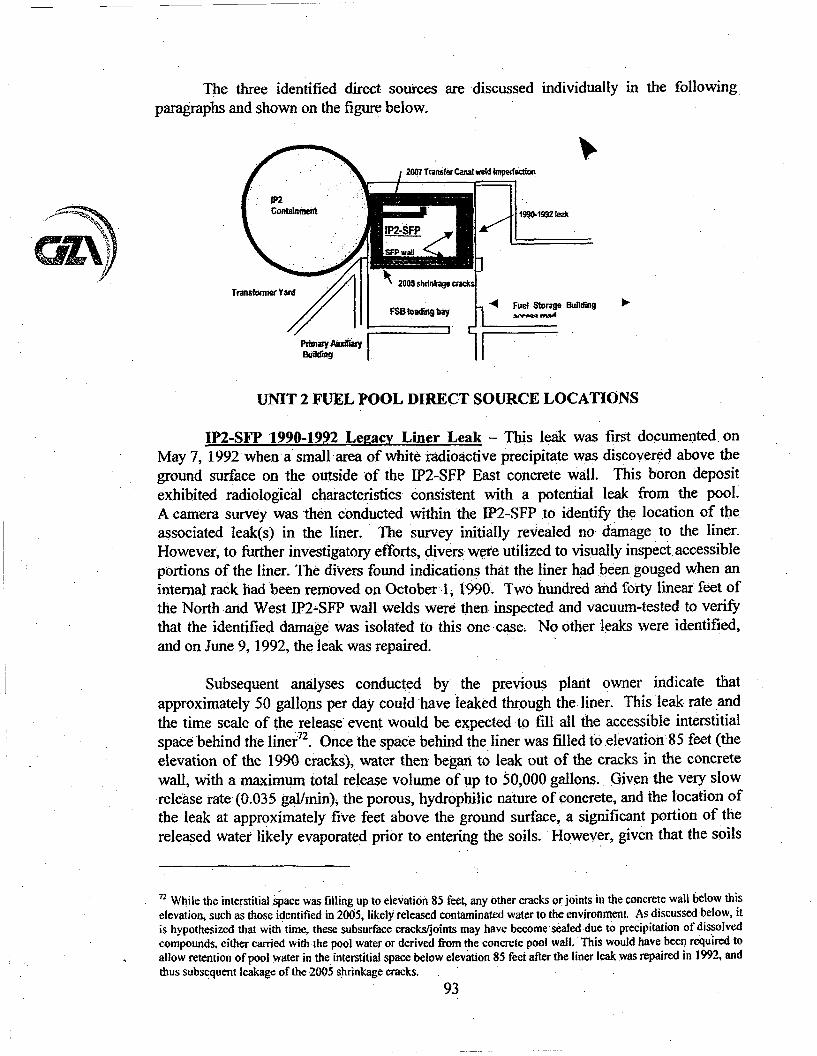
The three identified direct sources are discussed individually in the followingparagraphs and shown on the figure below.
UNIT 2 FUEL POOL DIRECT SOURCE LOCATIONS
IP2-SFP 1990-1992 Legacy Liner Leak - This leak was first documented on
May 7, 1992 when a small area of white radioactive precipitate was discovered above theground surface on the outside of the 1P2-SFP East concrete wall. This boron depositexhibited radiological characteristics consistent with a potential leak from the pool.A camera survey was then conducted within the IP2-SFP to identify the location of theassociated leak(s) in the liner. The survey initially reVealed no damage to the liner.However, to further investigatory efforts, divers were utilized to visually inspect• accessibleportions of the liner. The divers found indications that the liner had been gouged when an
internal rack had been removed on October 1, 1990. Two hundred and forty linear feet ofthe North and West IP2-SFP wall welds were then inspected and vacuum-tested to verifythat the identified damage was isolated to this one case. No other leaks were identified,and on June 9, 1992, the leak was repaired.
Subsequent analyses conducted by the previous plant owner indicate thatapproximately 50 gallo1ns per day could have leaked through the liner. This leak rate andthe time scale of the release event would be expected to fll all the accessible interstitialspace behind the liner72. Once the space behind the liner was filled to elevation85 feet (theelevation of the 1990t cracks), water thent began to leak out of the cracks in the concrete
wall, with a maximum total release volume of up to 50,000 gallons. Given the very slowrelease rate (0.035 gal/mi), the porous, hydrophilic nature of concrete, and the location of
the leak at approximately five feet above the ground surface, a significant portion of thereleased water likely evaporated prior to entering the soils. However, given that the soils
H2 Whieve the interstitial Space was filling up to elevation 85 feet, any Other eracks or joints in the concrete wall below thiselevation, such as those identified in 2005, likely released contaminated water to the environmen. As discussed below, itis hypothesized that with time, these subsurface cracks/joints may have become sealed due to precipitation of dissolvedcompounds, either carried with the pool water or derived from the concrete pool wail. This would have been retuired toallow retention of pool water in the interstitial space below elevation 85 feet after the liner leak was repaired in 1992, andthus subsequent leakage of the 2005 shrinkage cracks.
93
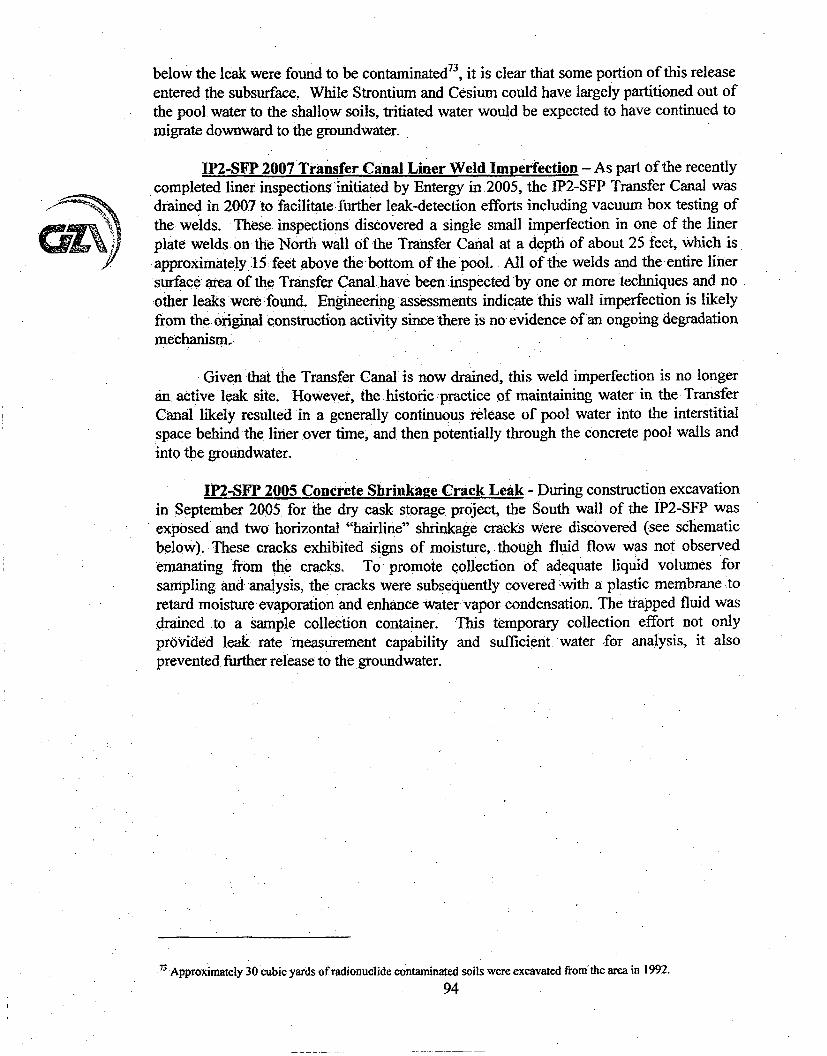
/
below the leak were found to be contaminated73 , it is clear that some portion of this releaseentered the subsurface, While Strontium and Cesium could have largely partitioned out ofthe pool water to the shallow soils, tritiated water would be expected to have continued tomigrate downward to the groundwater.
IP2-SFP 2007 Transfer Canal Liner Weld Imperfection - As part of the recentlycompleted liner inspections initiated by Entergy in 2005, the IP2-SFP Transfer Canal wasdrained in 2007 to facilitate further leak-detection efforts including vacuum box testing ofthe welds. These inspections discovered a single small imperfection in one of the linerplate welds on the North wall of the Transfer Canal at a depth of about 25 feet, which isapproximately 15 feet above the bottom of the pool. All of the welds and the entire linersurface area of the Transfer Canal have been inspected by one or more techniques and no.other leaks were !found. Engineering assessments indicate this wall imperfection is likely
from the original construction activity since there is no evidence of an ongoing degradationmechanism..
Given that the Transfer Canal is now drained, this weld imperfection is no longeran active leak site. However, the historic practice of maintaining water in the TransferCanal likely resulted in a generally continuous release of pool water into the interstitialspace behind the liner over time, and then potentially through the concrete pool walls andinto the groundwater.
IP2-SFP 2005 Concrete Shrinkage Crack Leak. - During construction excavationin September 2005. for the dry cask storage project, the South wall of the IP2-SFP wasexposed and two horizontal "hairline" shrinkage cracks were discovered (see schematicbelow). These cracks exhibited signs of moisture, though fluid flow was not observedemanating from the cracks. To promote collection. of adequate liquid volumes forsampling and analysis, the cracks were subsequently covered ýwith a plastic membrane toretard moisture evaporation and enhance water vapor condensation. The trapped fluid wasdrained to a sample collection container. This temporary collection effort not onlyprovided leak rate measurement capability and sufficient -water -for analysis, it alsoprevented. further release to the groundwater.
• Approximately 30 cubic yards of radionuclide contaminated soils were excavated from the area in 1992.
94
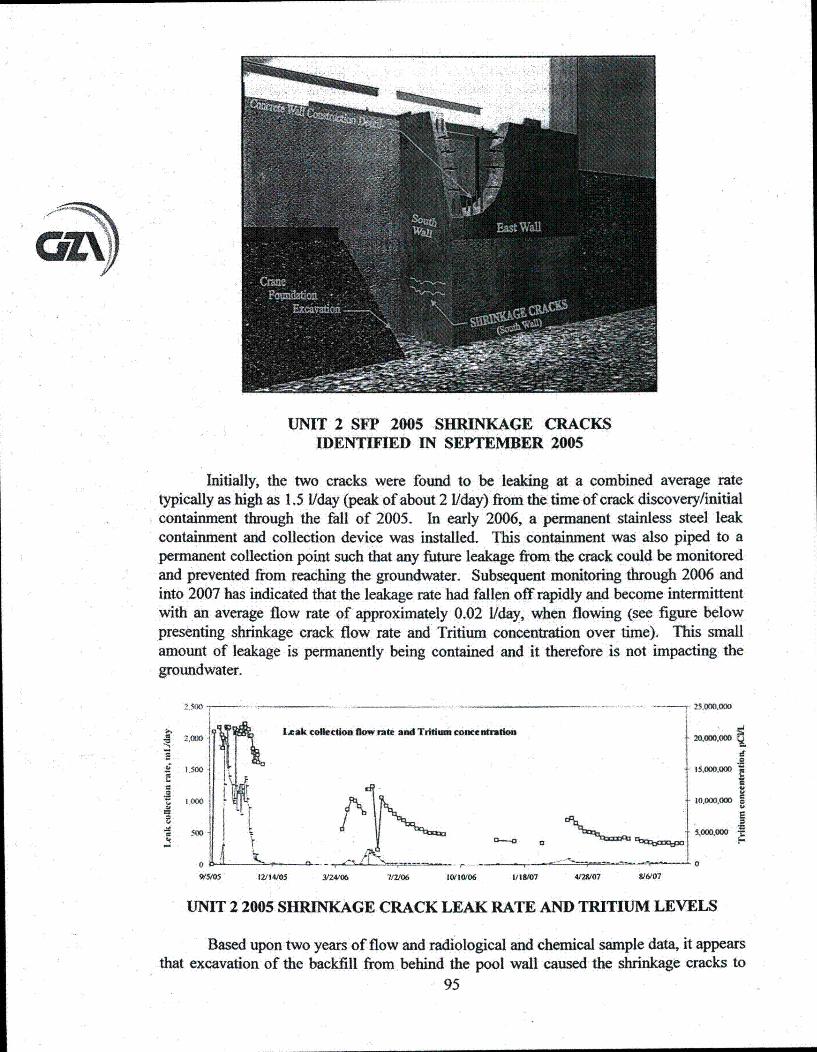
crA-I
UNIT 2 SFP 2005 SHRINKAGE CRACKSIDENTIFIED IN SEPTEMBER 2005
Initially, the two cracks were found to be leaking at a combined average ratetypically as high as 1.5 W/day (peak of about 2 I/day) from the time of crack discovery/initialcontainment through the fall of 2005. In early 2006, a permanent stainless steel leakcontainment and collection device was installed. This containment was also piped to apermanent collection point such that any furtre leakage from the crack could be monitoredand prevented from reaching the groundwater. Subsequent monitoring through 2006 andinto 2007 has indicated that the leakage rate had fallen off rapidly and become intermittentwith an average flow rate of approximately 0.02 W/day, when flowing (see figure belowpresenting shrinkage crack flow rate and Tritium concentration over time). This smallamount of leakage is permanently being contained and it therefore is not impacting thegroundwater.
25.000.000
k
aa
2,000 Leak coelctio flow rate and Ttdinn con
1ý000
9'/5M 12)14/05 V24106 7r2/06 10/10(06
Stemflon21%000000
15,000000D
1 0,000.000 i
E%Mb-cPD0 a
1/18M07 4/2107 0/6107
UNIT 2 2005 SHRINKAGE CRACK LEAK RATE AND TRITIUM LEVELS
Based upon two years of flow and radiological and chemical sample data, it appearsthat excavation of the backfill from. behind the pool wall caused the shrinkage cracks to
95
I
b..
begin releasing water trapped in the interstitial space dating back to 1992. This releasemechanism is hypothesized to have developed as follows:
* During the original construction, the fuel pool walls developed shrinkage cracks inthe concrete upon curing, as is not atypical for concrete.
* When the pool Walls were backfilled with soil, they flexed inward slightly inresponse to the soil pressures developed during backfill placement andcompaction74
* The pool was then filled with water which exerts an outward pressure against thewalls. However, little outward flexure would be expected given the stiffness of thecompacted soil backfill, which assists the concrete walls in resisting outwardbending motion due to the water pressure.The stainless steel pool liner was punctured in 1990 and began leaking. Over time,this leak filled the interstitial space between the liner and the concrete walls.tritiated pool water then likely first leaked out of the lower-most cracks/joints, suchas -those responsible for the 2005 leak (elevation 62 to 64 feet), and successivelyleaked out of higher imperfections until it reached the cracks at elevation 85 feet.At this point, leakage was detected and the leak was fixed in 1992.At some point during the leakage, the subsurface cracks apparently became pluggedwith precipitate which stopped the leakage. This allowed pool water to remaintrapped behind the liner at an elevation above the 2005 shrinkage cracks, potentiallyas high as elevation 85 feet. To the extent that the subsurface cracks/joints in theconcrete did not all become completely leak-tight, the interstitial space behind theliner was likely recharged by leakage from the Transfer Canal weld imperfection(up until Transfer Canal drainage in July 2007) and/or other small leak sites in theliner.
" With excavation of the soil backfill from behind the southern pool wall, thePressure exerted by the backfill material was sequentially removed from the top to
the base of the concrete wall. The elimination: of this inwardly focused backfillpressure allowed the outwardly directed water: pressure in the pool to flex the walloutward. It is hypothesized that this motion, while limited, was sufficient to initiateleakage from the 2005 shrinkage cracks at a rate of approximately 1.5 1/day duringthe fall/winter of 2005.
" The released water is believed to be primarily residual water derived from the 1990-1992 liner leak. However, laboratory results for water samples initially collectedfrom the crack in the September 2005 time frame yielded Cesium-137 toCesium-134 ratios indicating that the age of the water was approximately 4 to9 years old. This age does not directly correlate with the 1990-1992 releasetimeframe. Conversely, the water clearly had exited the pool many years ago.A potential explanation for this intermediate age water is the mixing of water froma then-current small leak in the liner with 1992 age water.
" Over time, the shrinkage crack leak reduced the elevation of the residual watertrapped behind the liner to the elevation of the cracks. Beginning in 2006 andthrough 2007, the leak rate was observed to have quickly become intermittent withtypical leak rates, when leaking, of only approximately 0.02 1/day. These
74 While the 4-to 6-foot-thick concrete walls are stiff, someflexure is required for the walls to develop bending stresses.
96
G72
subsequent water samples did not contain Cesium-134, indicating that this morerecent crack water could, in fact, be old enough to be from the 19904992 leak75.
• As a corollary to the above conceptual model, the intermediate-aged crack watermay be partially comprised of leakage from the Transfer Canal weld imperfection.This release pathway could potentially explain the measured intermittent andvariable leakage 'collected in the permanent containment system after 2005.The variations in water elevation and temperature in the Transfer Canal areconsistent with this hypothesis. While the Transfer Canal leak water would berecent, it is likely that it would take a substantial amount of time to flow from theNorth wall of the Transfer Canal to the South wall of the IP2-SFP6.This hypothesis is therefore consistent with the lack of short-lived isotopes (asassociated with SFP water) currently being found in the water from the shrinkagecrack. A more significant leak rate with shorter transit times (e.g., the magnitude ofthe 1990-92 leak) would be expected to, and did previously show, short-livedradionuclide signatures.
" Although several additional theories have also been. postulated and investigated, adefinitive explanation of the apparent discrepancy in Cesium age ratios could not bedefinitively determined. This discrepancy from the early sample data when thecrack location was first investigated was an important factor in Entergy's decisionto perform intensive pool and ongoing Transfer Canal liner inspections.
" It can also be concluded from the above data and analysis that any ongoing activeleak in the pool liner, if one exists, must be quite small. Otherwise, the limitedvolume of the interstitial space between the liner and the concrete wall wouldtransport a more substantial leak to the shrinkage cracks in a short time and thewater would thus show a young age77
8.1.2 Indirect Storage Sources of Tritium
The extensive testing of the IP2-SFP liners to date by Entergy provides evidence-that all direct sources (i.e., releases from SSCs) of Tritium have been identified and arecurrently no longer contributing radionuclides to the groundwater7 g. However, the Unit 2plume, while decreased in concentration relative to the samples taken just after
75 Cesium-i137 was present at sufficient concentrations that if the water was "young", Cesium-134 would have also been
present at concentrations above method detection limits, It is further noted that the two isotopes of Cesium shouldpartition to solids at the same ratios. Therefore, preferential removal of the Cesium-134 due to partitioning to theconcrete is not an explanation for the lack of this isotope in the more recent crack water samples.76 It: is noted that the seepage path(s) from the liner leak on the North wall of the Transfer Canal to the shrinkage .rackson the southern pool wall is likely to be particularly circuitous. The interstitial space between thesetwo liners can onlybe connected (if they are connected at all) at the gate from the Transfer Canal to the fuel pool and/or throughimperfections in the concrete wall/floor waterstops or in the concrete itself (given the five-foot-thick concrete wallseparating the Transfer Canal from the SFP itself).77 As a benchmark, pool water from a one-tenth of a gallon per minute leak would be expected to reach the shrinkagecrack in less than two weeks given the estimated volume of the interstitial space,'s However, some small amount of leakage could still be ongoing from other potential imperfections in the liner and/orconcrete pool wall; large ongoing leaks would result in conditions inconsistent with the measurements of both leak rateand water age collected from the 2005 shrinkage crack. A large leak would also be inconsistent with the reductionsobserved in the Tritium concentrations in the groundwater.
97
identification of the 2005 shrinkage crack leak 79, still exhibits elevated concentrations.If all of the releases to the groundwater were terminated, it would be expected that theUnit 2 plume would attenuate more quickly than observed8 0 . As such, a subsurfacemechanism appears to exist in the unsaturated zone under the IP2-FSP that can retainsubstantial volumes of pool water for substantial amounts of time. The existence of such a"retention mechanism" is also supported by both the results of the tracer test and the recentevaluation of contaminant concentration variability trends over short timeframes andprecipitation events.
The tracer test results, discussed more fully in Section 7.0, indicate that:
• Tracer injection directly to the top of bedrock below the IP2-SFP above MW-30 didnot result in arrivals at MW-30 in time frames expected for vertical transportthrough the fractured bedrock vadose (i.e., unsaturated) zone. In fact, the earliestarrivals and maximum tracer concentrations were detected in MW-31 and MW-32at distances of greater than 50 feet from the injection location;
• Tracer concentrations in MW-30 took longer than expected to reach peakconcentrations from the time of first arrival;
° The tracer concentration vs. time curves exhibit a "long• tail;" and° The tracer concentrations exhibit significant variation over short periods of time,
which may be related to precipitation events moving tracer out of storage.
It is, therefore, apparent that once tracer, and thus tritiated water, is released fromdirectly below the IP2-SFP, it does not flow directly down to the groundwater but can be"trapped" (held in storage) for substantial periods of time.
The Tritium concentrations in MW-30. were measured on a weekly basis betweenAugust 8 and August 30, 2007 (see Section 9.3.1). These data show significant variabilityin concentrations over these short timeframes. This variability appears to far exceed thatwhich can be attributed to variation inherent in groundwater sampling or radionuclideanalyses. Aliquots submitted for tracer concentration testing also showed similar trends.It appears that these variations may be the result of the displacement of water, as evidencedby both tracer and Tritium, from this storage mechanism by infiltration such as associatedwith precipitation events.
Based on the above summarized information, two indirect storage mechanisms arepostulated to. explain the persistence of -the Unit 2 plume. The first is the storage oftritiated water in dead-end fractures in the unsaturated zone. The second is the potential fortritiated water from the SFP to be trapped in the blast-rock backfill above the ,mud-mat8 '"
19 The earliest samples taken from directly below the SFP in MW-30 (open borehole and packer testing samples) yieldedTritium concentrations over 600,000 pCilL. More currently, maximum Concentrations detected have been below, one-half of those initial concentrations.so Rapid attenuation. of the Tritium plume would be expected based on 1) Tritium's lack of partitioning to solid materialsin the subsurface; and 2) the crystalline nature, low storativity and high groundwater gradients associated with thebedrock on the Site.8' Prior to constructing a structural base slab (typically 2 to 5 feet thick) for the fuel pool, a 6-to 8-inch-thick, leanconcrete "mud-mat" is typically constructed over blasted, bedrock to even out the irregular rock surface and provide a
98
TV)
which was placed prior to construction of the SFP structural base slab. A combination ofthese two indirect storage mechanisms, as discussed separately below, is a conceptualmodel that explains the observed Unit 2 plume behavior in the context of the terminationof the identified direct release mechanisms 82.
Dead-Ended Bedrock Fracture Storage - Naturally occurring bedrock fractures,as discussed in Section: 6.0, are seldom long, continuous linear features. Rather, they aremore typically networks of interconnected, discontinuous fractures. These networks oftencontain many dead-ended fractures. While dead-ended fractures are not subject toadvective groundwater flow, they still can contain high contaminant concentrations.Contaminants enter these fractures through osmotic pressures set up in the subsurface byconcentration gradients (initially high concentrations at the fracture "mouth" and lowconcentrations within the fracture). Over time, these concentrations equilibrate throughliquid-phase diffusion. Therefore, under conditions of high Tritium groundwaterconcentrations, such as likely occurred during the two year timeframe of the 1990-1992liner leak, the dead-ended fractures would be expected to end up containing high Tritiumconcentrations. Once the liner leak was repaired, the input of Tritium to the groundwaterwould subside and the concentrations in the advective fractures would start to decrease.However, the high Tritium concentrations within the dead-ended fractures would then startto diffuse back out of the dead-ended fractures into the groundwater flowing past them,thus maintaining higher than otherwise expected Tritium concentrations in thegroundwater.
Our computation of the volume of the naturally occurring dead-ended fractures inthe unsaturated zone below the IP2-SFP yields fracture volumes which are unlikely tosupport the observed Unit 2 plume for the required time frames (years). However, twoadditional considerations substantially increase the dead-ended fracture volume: 1) theobserved unsaturated flow to the East and Southeast (this migration pathway exposes manymore fractures to the Tritium due to the bigger area involved); and 2) construction blasting(which creates more fractures in the bedrock remaining below the structure).
As demonstrated vividly during the tracer test, contaminants released to the bedrockat the bottom of the SFP travel at least 50 to 75 feet to the East and Southeast as evidencedby the high. tracer concentrations quickly detected in the upgradient monitoring wells
hard, flat surface upon which to set the reinforcing rod "chairs" (these chairs elevate the lowest layer of rods to providesufficient concrete corrosion prevention cover).
It is noied that we originally believed that the groundwater in the Unit.2 Transformer Yard was uncontaminated with.Tritium prior, to February of 2000. If true, this finding would .be inconsistent with the storage mechanisms proposed.Our original conclusion was based on the sampling results at that time from MW-I 11: this well was sampled as part ofthe due diligence for property transfer to Entergy and was found not to contain Tritium above detection limits (900pCi/Il). However. interviews with facility personnel revealed that the sample was collected from the upper surface of thewater table with a bailer. There was no attempt to purge the well to obtain samples representative.of deeper aquifer waterbecause the samples were taken primarily to look for floating oil in the well. Because this sample was collected from theupper groundwater surface (which will be most subject to infiltration by rain water) without adequate well purging, it islikely that this sample result was biased low. As discussed in Section 9.0, this:well is subject to wide variations inTritium. concentrations due to rainfall events, Therefore, it is entirely plausible that no Tritium was detected abovelaboratory method detection limits even if Tritium were present at much higher concentrations deeper in the aquifer. Assuch, this February 2000 groundwater sample result should not be used to assess Tritium groundwater conditions at thattime. See supporting data in Section .9.3.1.
99
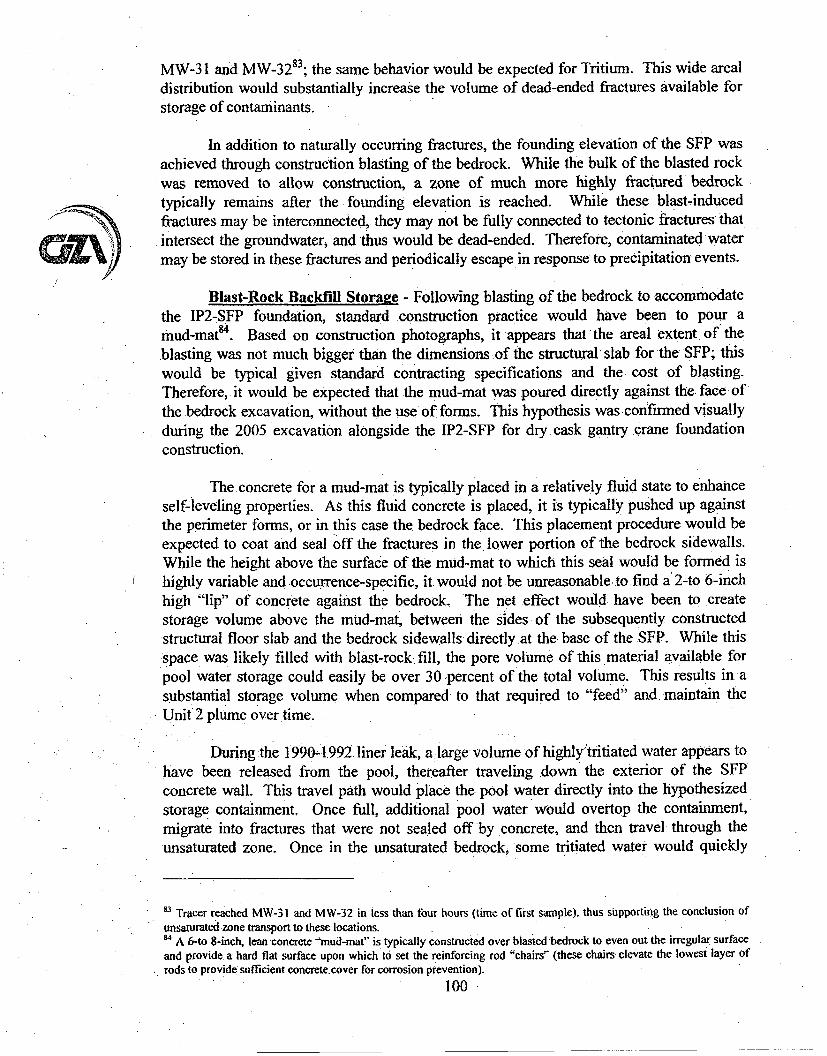
MW-31 and MW-32"3; the same behavior would be expected for Tritium. This wide arealdistribution would substantially increase the volume of dead-ended fractures available forstorage of contaminants.
In addition to naturally occurring fractures, the founding elevation of the SFP wasachieved through construction blasting of the bedrock. While the bulk of the blasted rockwas removed to allow construction, a zone of much more highly fractured bedrocktypically remains after the founding elevation is reached. While these blast-inducedfractures may be interconnected, they may not be fully connected to tectonic fractures thatintersect the groundwater, and thus would be dead-ended.- Therefore, contaminated watermay be stored in these fractures and periodically escape in response to precipitation events.
Blast-Rock Backfill Storage - Following blasting of the bedrock to accommodatethe IP2-SFP foundation, standard construction practice would have been to pour amud-mat4. Based on construction photographs, it appears that the areal extent of theblasting was not much bigger, than the dimensions of the structural slab for the SFP; thiswould be typical given standard contracting specifications and the cost of blasting.Therefore, it would be expected that the mud-mat was poured directly against the face ofthe bedrock excavation, without the use of forms. This hypothesis was confirmed visuallyduring the 2005 excavation alongside the IP2-SFP for dry cask gantry crane foundationconstruction.
The concrete for a mud-mat is typically placed in a relatively fluid state to enhanceself-leveling properties. As this fluid concrete is placed, it is typically pushed up againstthe perimeter forms, or in this case the bedrock face. This placement procedure would beexpected to coat and seal off the fractures in the lower portion of the bedrock sidewalls.While the height above the surface of the mud-mat to which this seal would be formed ishighly variable and occurrence-specific, it would not be unreasonable to find a' 2to 6-inchhigh "lip" of concrete against the bedrock. The net effect would have been to createstorage volume above the mud-mat, between the sides of the subsequently constructedstructural floor slab and the bedrock sidewalls directly at the- base of the SFP. While thisspace was likely filled with blast-rock. fill, the pore volume of this material available forpool water storage could easily be over 30 percent of the total volume. This results in asubstantial storage volume when compared to that required to "feed" and maintain theUnit 2 plume over time.
During the 1990-1992 liner leak, a large volume of highly'tritiated water appears tohave been released from the pool, thereafter traveling down the exterior of the SFPconcrete wall. This travel path would place the pool water directly into the hypothesizedstorage containment. Once full, additional pool water would overtop the containment,migrate into fractures that were not sealed off by concrete, and then. travel through theunsaturated zone. Once in the unsaturated bedrock, some tritiated water would quickly
s Tracer reached MW-31 and MW-32 in less than four hours (time of first sample), thus supporting the conclusion ofunsaturated zone transport to these locations.", A 6-to 8-inch, lean concrete "mud-mat" is typically constructed over blastedbedrock to even out the irregular surface
and provide. .a hard flat surface upon which to set the reinforcing rod "chairs" (these chairs clevate the lowest layer ofrods to provide sufficient concrete-cover for corrosion prevention).
100
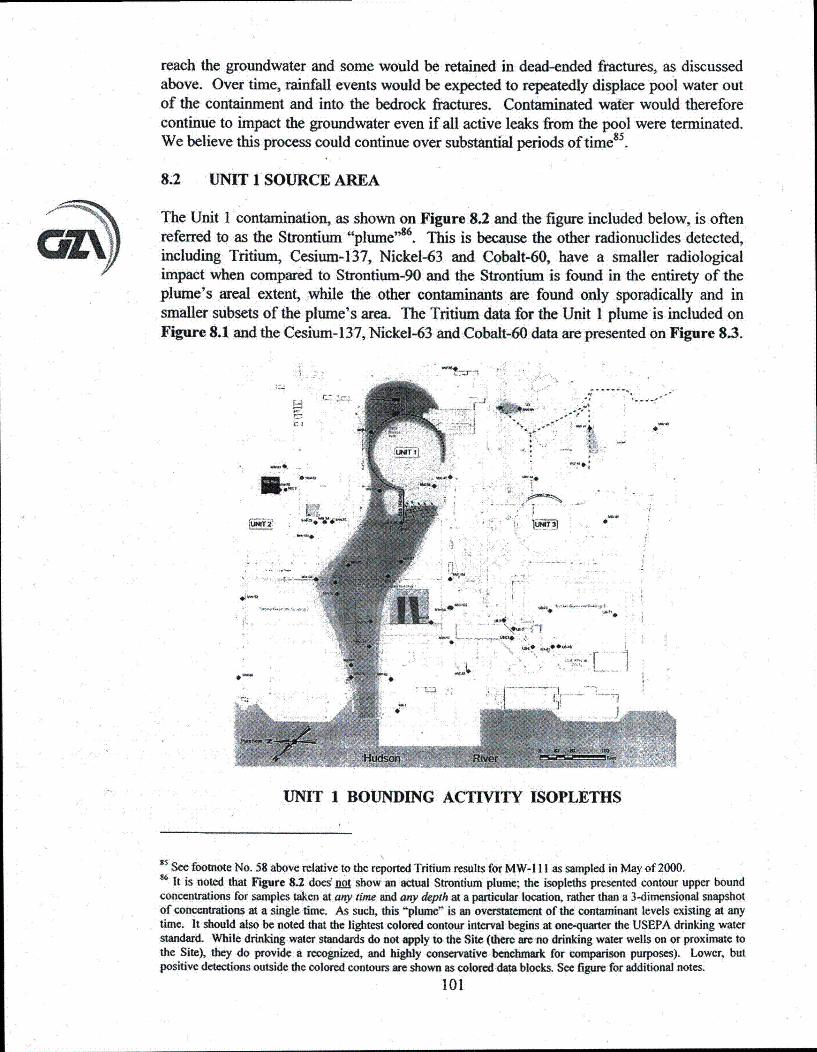
reach the groundwater and some would be retained in dead-ended fractures, as discussedabove. Over time, rainfall events would be expected to repeatedly displace pool water outof the containment and into the bedrock fractures. Contaminated water would thereforecontinue to impact the groundwater even if all active leaks from the pool were terminated.We believe this process could continue over substantial periods of time85 .
8.2 UNIT 1 SOURCE AREA
The Unit 1 contamination, as shown on Figure 8.2 and the figure included below, is oftenreferred to as the Strontium "plume"". This is because the other radionuclides detected,including Tritium, Cesium-137, Nickel-63 and Cobalt-60, have a smaller radiologicalimpact when compared to Strontium-90 and the Strontium is found in the entirety of theplume's areal extent, while the other contaminants are found only sporadically and insmaller subsets of the plume's area. The Tritium data for the Unit 1 plume is included onFigure 8.1 and the Cesium-137, Nickel-63 and Cobalt-60 data are presented on Figure 8.3.
oN
(7- -
ýwar I~
Or
I -4
... .... .
0 i
%~
UNIT 1 BOUNDING ACTIVITY ISOPLETHS
'sSee footnote No. 58 above relative to the reported Tritium results for MW-I l I as sampled in May of 2000.36 It is noted that Figure 8.2 does no show an actual Strontium plume; the isopleths presented contour upper boundconcentrations for samples taken at any time and any depth at a particular location, rather than a 3-dimensional snapshotof concentrations at a single time. As such, this Vplume" is an overstatnent of the contaminant levels existing at anytime. It should also be noted that the lightest colored contour interval begins at one-quarter the USEPA drinking waterstandard. While drinking water standards do not apply to the Site (there are no drinking water wells on or proximate tothe Site), they do provide a recognized, and highly conservative benchmark for comparison purposes). Lower, butpositive detections outside the colored contours are shown as colored data blocks. See figure for additional notes.
101
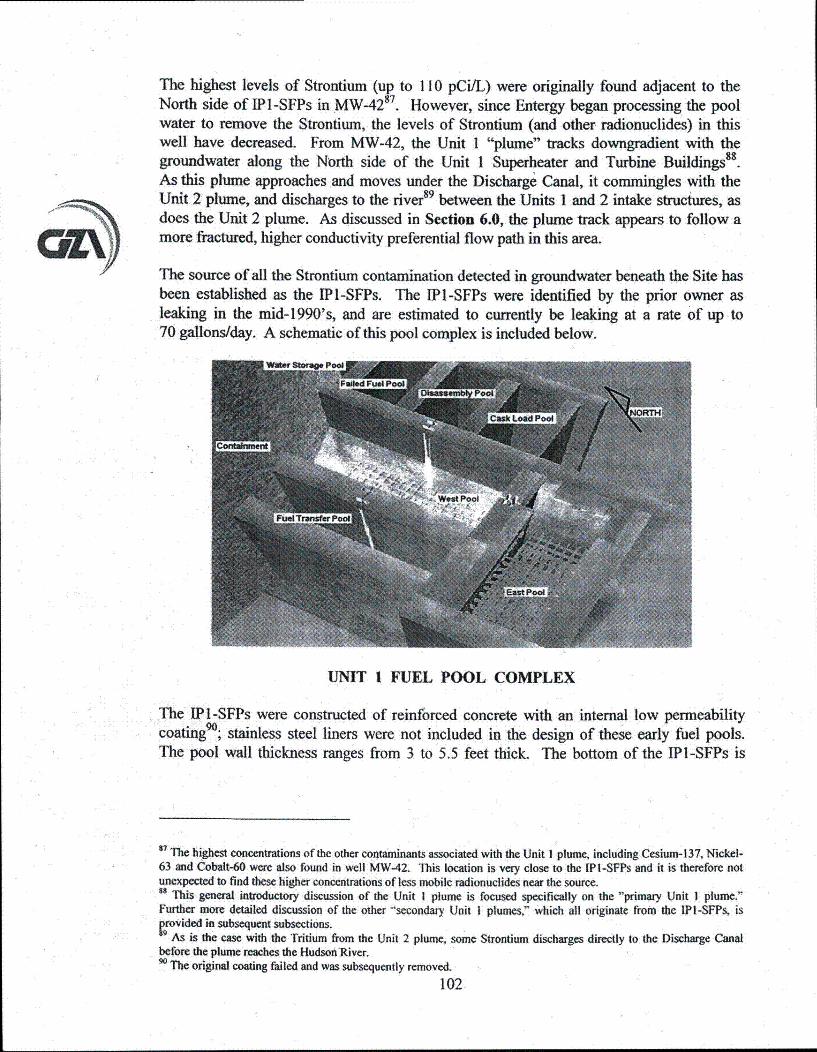
CL"X
The highest levels of Strontium (up to 110 pCi/L) were originally found adjacent to theNorth side of IP I-SFPs in MW-428 7. However, since Entergy began processing the poolwater to remove the Strontium, the levels of Strontium (and other radionuclides) in thiswell have decreased. From MW-42, the Unit 1 "plume" tracks downgradient with thegroundwater along the North side of the Unit 1 Superheater and Turbine Buildings88 .As this plume approaches and moves under the Discharge Canal, it commingles with theUnit 2 plume, and discharges to the river9 between the Units 1 and 2 intake structures, asdoes the Unit 2 plume. As discussed in Section 6.0, the plume track appears to follow amore fractured, higher conductivity preferential flow path in this area.
The source of all the Strontium contamination detected in groundwater beneath the Site hasbeen established as the IPI-SFPs. The IPI-SFPs were identified by the prior owner asleaking in the mid-1990's, and are estimated to currently be leaking at a rate of up to70 gallons/day. A schematic of this pool complex is included below.
UNIT I FUEL POOL COMPLEX
The IP I-SFPs were constructed of reinforced concrete with an internal low permeabilitycoating"; stainless steel liners were not included in the design of these early fuel pools.The pool wall thickness ranges from 3 to 5.5 feet thick. The bottom of the IP1-SFPs is
87 The highest concentrations of the other contaminants associated with the Unit I plume, including Cesiun-137, Nickel-63 and Cobalt-60 were also found in well MW-42. This location is very close to the IPI-SFPs and it is therefore notunexpected to find these higher concentrations of less mobile radionuclides near the source.s8 This general introductory discussion of the Unit I plume is focused specifically on the "primary Unit I plume."Further more detailed discussion of the other -secondary Unit I plumes,- which all originate from the IPI-SFPs, is•rovided in subsequent subsections.
As is the case with the Tritium from the Unit 2 plume, some Strontium discharges directly to the Discharge Canalbefore the plume reaches the Hudson River.90 The original coating failed and was subsequently removed.
102
founded directly on bedrock, generally at elevation 30 feet9?. As such, there is nosignificant unsaturated zone below the IP1-SFPs. While all of the pools have been drainedexcept the West Pool, the other pools have all contained radionuclide at various times in thepast. The West pool, which is approximately 15 feet by 40 feet in area, currently containsthe last 160 Unit I fuel assemblies remaining from prior plant operations. This plant wasretired from service in 1974.
The IP1-SFPs are contained within the IPI-FHB; The foundation system of the FHB and• • [IPI-CB complex contains three levels of subsurface footing drains (see figure included
below). The design objective of these drains, with the potential exception of the SphereFoundation Drain (SFD)92, appears to be permanent depression of groundwater elevationsto below the bottom of the structures93.
North and South Curtain Drains - The uppermost IPI-FHB drain encircles the Unit IFHB and IPI-CB. This footing drain, typically referred to as the Curtain Drain, is dividedinto two sections, the North Curtain Drain (NCD) and the South Curtain Drain (SCD).Each of these drains starts at a common high point (elevation of 44 feet) located along thecenter of the eastern wall of the FHB. These drains then run to the North and South,respectively, and wrap around the Unit I FHB and CB. The NCD then discharges to thespray annulus in the IPl-CB94 at an elevation of 33 feet. From the annulus, the water ispumped for treatment and then discharged. The NCD flows at a yearly average of about 5gpm carrying a Strontium concentration of50 to 200 pCi/L (concentrations measured priorto reductions in Unit I pool water radionuclides via accelerated demineralization).The SCD pipe remains as originally designed with discharge to the Discharge Canal;however, the SCD is typically dry95.
Chemical Systems Building Drain - The lowest level of the IP1-CSB (contained withinthe FHB) is also encompassed by a footing drain. The eastern portion of this drain beginsat a high point elevation of 22 feet at its northernmost extent, located proximate to theIP 1-CB, and then slopes to elevation• 11.5 feet at its low point on the southern side of theIPI-CSB. The western portion of this drain begins at a high point elevation of 12.5 feet atits northernmost extent, again located proximate to the IPI-CB, and then slopes to elevation11.5 feet at its low point on the southern side of the IP1-CSB. Both portions of the drainjoin at the southern side of the IPI-CSB where the common drain line runs below the floorslab and drains into the IP1-SFDS (bottom elevation of 6.5 feet). This drain typically flows
9 The bottom elevation of the individual pools range from a high elevation of 36 feet for the Water Storage Pool to a lowof 22 feet for the Transfer Pool.- The SFD is constructed at an elevation of 16.5 feet. It is above the bottom of the Sphere (elevation -II feet) and
completely encapsulated in either concrete or grout.9. The elimination of hydrostatic uplift pressures allows a "relieved design" to be used for the bottom concrete slabs ofthe structures. The alternative to a relieved slab design is a "boat slab designm" In this case, the slab is heavilyreinforced to resist hydrostatic uplift pressures.. Boat slabs are more expensive to construct than relieved slabs, and thusare typically only used when it is not feasible to relieve the hydrostatic uplift pressures.94 This design modification within the IPI-CB,. to allow storage of the footing drain water prior to treatment, wasimplemented by the former owner once the water was found to contain radionuclides. The initial Unit I designconnected the two .12-foot. perforated footing drain lines into a common 15-inch tee and drain pipe at the entrance to theNuclear Service Building. This 15-inch footing drain pipe was collocated in the bedrock trench containing the sprayannulus to CSS drain line.9' The lack of water in the SCD is consistent with the expected impact of the CSB drain given its proximity and lowerelevation.
103
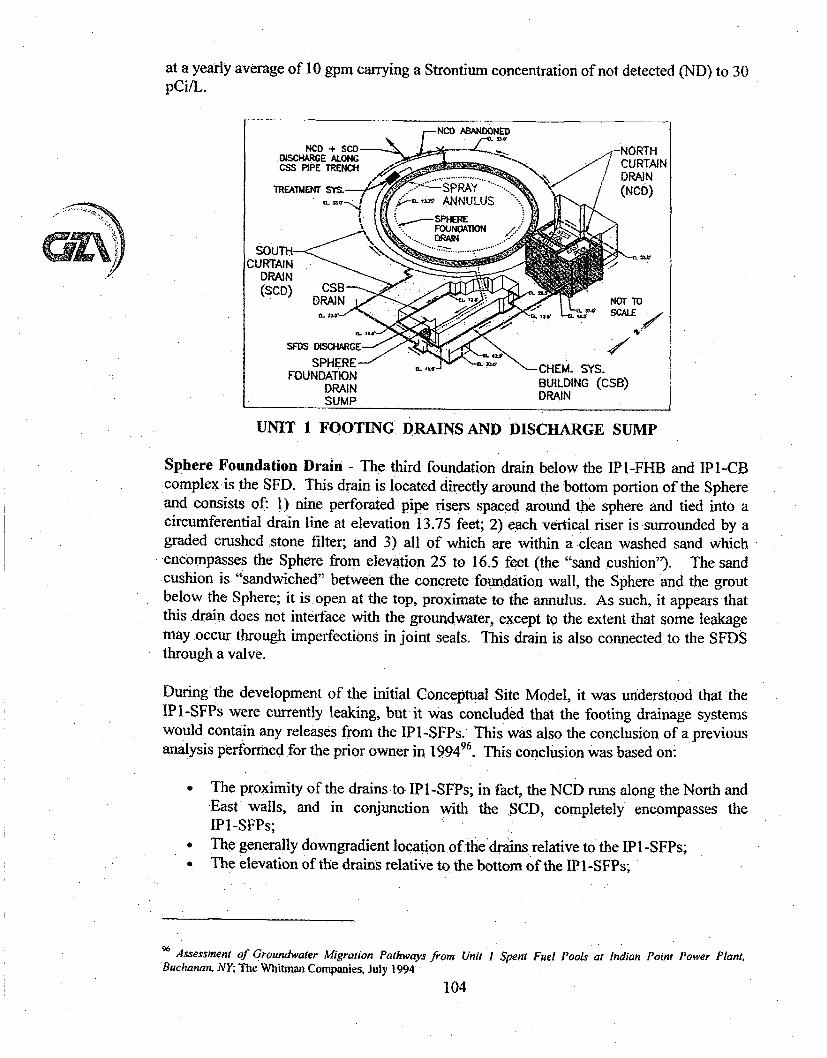
at a yearly average of 10 gpm carrying a Strontium concentration of not detected (ND) to 30pCi/L.
r-NCD ABANDOE
_r NOT TOSCALE
UNIT 1 FOOTING DRAINS AND DISCHARGE SUMP
Sphere Foundation Drain - The third foundation drain below the IPI-FHB and IPI-CBcomplex is the SFD. This drain is located directly around the bottom portion of the Sphereand consists of: 1) nine perforated pipe risers spaced around the sphere and tied into acircumferential drain line at elevation 13.75 feet; 2) each vertical riser is surrounded by agraded crushed stone filter; and 3) all of which are within a clean washed sand whichencompasses the Sphere from elevation 25 to 16.5 feet (the "sand cushion"). The sand.cushion is "sandwiched" between the concrete foundation wall, the Sphere and the groutbelow the Sphere; it is. open at the top, proximate to the annulus. As such, it appears thatthis drain does not interface with the groundwater, except to the extent that some leakagemay occur through imperfections in -joint seals. This drain is also connected to the SFDSthrough a valve.
During the development of the initial Conceptual Site Model, it was understood that theIPI-SFPs were currently leaking, but it was concluded that the footing drainage systemswould contain any releases from the IP1-SFPs. This was also the conclusion of a previousanalYsis performed for the prior owner in 199496. This conclusion was based on:
" The proximity of the drains to IP 1 -SFPs; in fact, the NCD runs along the North andEast walls, and in conjunction with the SCD, completely encompasses theIPI-SFPs;
* The generally downgradient location of thedrains relative to the IPI-SFPs;
• The elevation of the drains relative to the bottom of the IPI-SFPs;
96 Assessment of Groundwater Migration Pathways from Unit I Spent Fuel Pools at Indian Point Power Plant,
Buchanan, NY, The Whitman Companies, July 1994
104
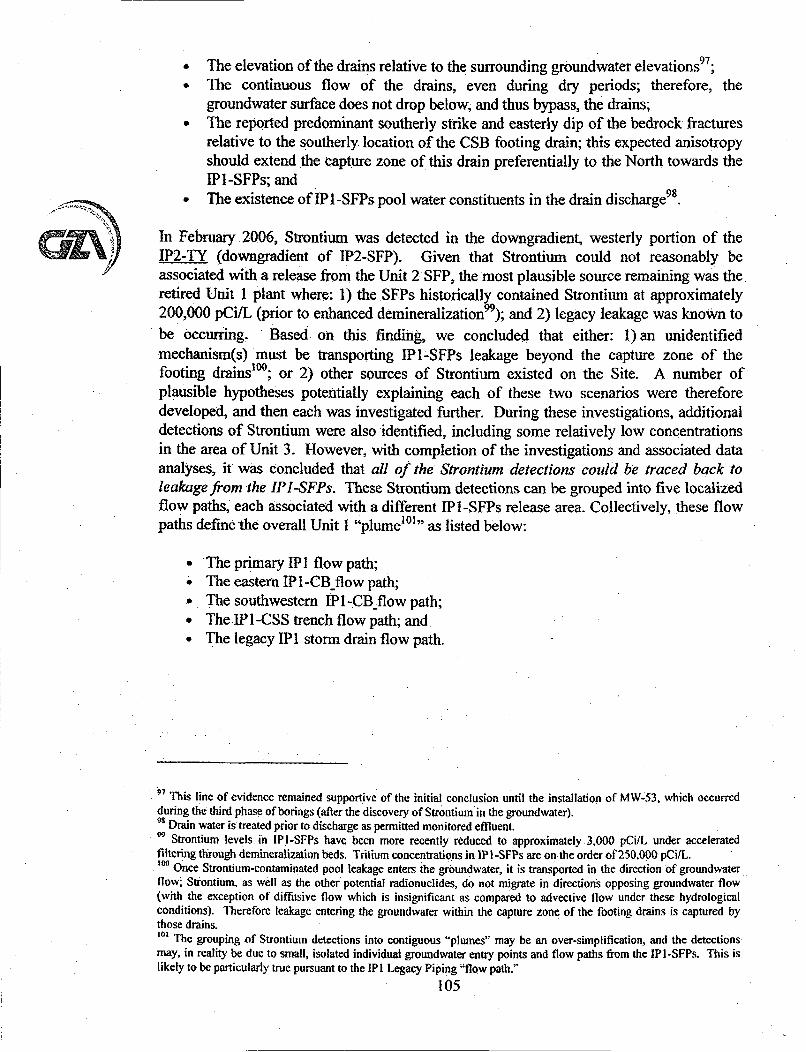
* The elevation of the drains relative to the surrounding groundwater elevations97;° The continuous flow of the drains, even during dry periods; therefore, the
groundwater surface does not drop below, and thus bypass, the drains;" The reported predominant southerly strike and easterly dip of the bedrock fractures
relative to the southerly location of the CSB footing drain; this expected anisotropyshould extend the capture zone of this drain preferentially to the North towards theIP1-SFPs; and
• The existence ofIP1-SFPs pool water constituents in the drain discharge98.
In February 2006, Strontium was detected in the downgradient, westerly portion of theIP2-TY (downgradient of IP2-SFP). Given that Strontium could not reasonably beassociated with a release from the Unit 2 SFP, the most plausible source remaining was theretired Unit 1 plant where: 1) the SFPs historically contained Strontium at approximately200,000 pCi/L (prior to enhanced demineralization9); and 2) legacy leakage was known tobe occurring. Based on this finding, we concluded that either: 1) an unidentifiedmechanism(s) must be transporting IPI-SFPs leakage beyond the capture zone of thefooting drainsloo; or 2) other sources of Strontium existed on the Site. A number ofplausible hypotheses potentially explaining each of these. two scenarios were thereforedeveloped, and then each was investigated further. During these investigations, additionaldetections of Strontium were also identified, including some relatively low concentrationsin the area of Unit 3. However, with completion of the investigations and associated dataanalyses, it was concluded that all of the Strontium detections could be traced back toleakage from the IPI-SFPs. These Strontium detections can be grouped into five localizedflow paths, each associated with a different IP I-SFPs release area. Collectively, these flowpaths define the overall Unit I "plume 011" as listed below:
* The primary [PI flow path;, The eastern IP 1-CB flow path;° The southwestern IIPI-CB flow path;• The IP1-CSS trench flow path; and• The legacy IPI storm drain flow path.
•97 This line of evidence remained supportive of the initial conclusion until the installation of MW-53, which occurredduring the third phase of borings (after the discovery of Strontiumin the groundwater).98 Drain water is treated prior to discharge as permitted monitored effluent.99 Strontium levels, in IPI-SFPs have been more recently reduced to approximately .3,000 pCi/L under acceleratedfiltering through demineralization beds. Tritium concentrations in IPN-SFPs are on the order of 250.000 pCi/L.100 Once Strontium-contaminated pool leakage enters the groundwater, it is transported in the direction of groundwaterflow-, Strontium, as well as the other potential radionuclides, do not migrate in directions opposing groundwater flow(with the exception of diffusive flow which is insignificant as compared to advective flow under these hydrologicalconditions). Therefore leakage entering the groundwater within the capture zone of the footing drains is captured bythose drains.101 The grouping of Strontium detections into contiguous "plumes" may be an over-simplification, and the detectionsmay, in reality be due to small, isolated individual groundwater entry points and flow paths from the IPI-SFPs. This islikely to be particularly true pursuant to the IPI Legacy Piping "flow path."
105
C-3
S
3(-
EASTERN-06 FLOW PATH LEAC------ RANLIAPT
'UNIT I PI-CB FLbW~PATH:
I-.-iSS TRENCH FLOW PAT'.' ... ,
"IL-
4 i:
INDIVIDUAL UNIT 1 STRONTIUM FLOW PATH LOCATIONS
The discussions below are focused on the discovery and characterization of these individualflow paths, and the final mechanisms that best explain their existence, Other initiallyplausible mechanisms were also investigated as part of the Observational Method approachemployed'02, but they did not remain plausible in light of the subsequently developed dataand analyses, and are therefore not discussed herein. In addition, portions of thediscussions below also relate to the concurrent investigation of other potential source areasacross the Site. During review of the following sections, it is important to recognize thatonly small quantities of leakage are required to result in the groundwater plumes observedon the Site.
Primary IP1 Flow Path - Monitoring well MW-42 was initially installed to investigate thepremise that contaminants may be leaking into the subsurface from the IP2-Reactor WaterStorage Tank (RWST). However, the sample analysis made it clear that IP 1 -SFPs waterwas present in the groundwater at MW-42; the radiological profile was consistent with
'02 As indicated above, multiple initially plausible hypotheses potentially explaining the genesis of these flow paths weredeveloped and investigated. These investigations proceeded in a step-wise, iterative manner consistent with theObservational Method, whereby various aspects of the Conceptual Site Model (CSM) were modified to develop anoverall CSM that better fit all of the data. Not all mechanisms investigated remained plausible in light of all the data andanalyses developed as part of this hypothesis-testing.
106
Unit I fuel pool water (low Tritium, high Strontium and Cesium). While IPI-SFPs leakagewas known to be ongoing, this conclusion was not consistent with the CSM at the timewhich was predicated, in part, on containment of IPI-SFPs leakage by the footing drains(North and South curtain Drains, and the Chem. Sys. Building Drain).
An additional monitoring well, MW-53, was subsequently installed downgradient ofMW-42 (on the Northwest side of the IPI-CB). Groundwater in this well was alsoapparently impacted by IP 1 -SFP water, thus resulting in the initial steps in the identificationof the Unit I primary Strontium flow path. The groundwater elevations measured inMW-53 proved even more enlightening than the radiological -profile. In the case of acontinuously flowing footing drain such as the NCD, groundwater would generally beexpected to be flowing into the drain over the entire length of the drain; the corollary to thisconclusion is that the groundwater elevation would be above the drain invert along itsentire extent. Otherwise, water flowing into the drain along its eastern, upgradient extentwould exfiltrate the drain along its western, downgradient extent and thus, water would nolonger discharge out of the end of the drain into the IPi-CB Spray Annulus; it wouldtherefore not typically be continuously flowing. However, the groundwater elevation inMW-53 was measured at approximately elevation 9 to 10 feet, substantially lower than thewater table elevation in MW-42 (35 feet) and the elevation of the NCD invert (33 feet).Therefore, it was found that only a portion of the groundwater which infiltrated the drain tothe East was observed as continuous flow at the Spray Annulus collection point.The remainder offthe water was exfiltrating along the drain further to the West103 , wheregroundwater elevations were below the drain invert and thus outside the capture zone of thedrain-
Therefore, leakage from the IPI-SFPs was initially being captured by the NCD, but thenduring transport to the Annulus for collection and treatment, a portion of this leakage wasdischarging to the groundwater outside the capture zone of the drain. This leakage thenmigrates downgradient to the West with the groundwater and establishes the Unit I primaryStrontium flow path.
Eastern IPI-CB Flow Path - A Strontium plume is shown on Figure 8.2 as existingbelow the entire IPI -SFPs. With the exception of MW-42, there are no monitoring wells inthis area to verify that this plume actually exists. However, it is known that the IPI-SFPshave and continue to leak, and the NCD and CSB footing drains have been shown tocontain radionuclides consistent with that expected from IP I-SFPs' leakage. The locationsof the specific release points are not known, but could be anywhere along the walls andbottom of the IPI-SFPs.
Once leakage from any of the above postulated points enters the groundwater, it willmigrate either to the NCD or the CSB drain, depending on where the specific release pointis located relative to these drains. Leakage located along the northeastern portions of theIPI-SFPs is likely to migrate to the NCD (elevation 33 feet), whereas leakage located moreto the South and West is more likely to migrate to the lower CSB drain (elevation 22 to
'os It is hypothesized that, in the past, the drain likely did not flow continuously. However, over time, the exfiltration
rate-has been reduced through siltation such that the drain can no. longer release water over its western extent as fast as itinfiltrates into the drain further to the East,
107
11.5 feet). These scenarios, when considered for multiple potential release points, shouldresult in Strontium flow paths that are all contained within the plume boundaries shown onthe figure.
Southwestern IP1-CB Flow Path - As part of the investigations to identify other potentialreleases to the groundwater across the Site, low levels of Strontium (less than 3 pCi/L) weredetected in monitoring wells MW-47 and MW-56. Groundwater contamination in this areawas inconsistent with the known sources and the groundwater flow paths induced by theIPI-CSB footing drains. A summary of the investigations and analyses undertaken toidentify the release mechanism responsible for this Strontium flow path follows.
Construction drawings indicate that the IPI-CB and the IPI-FHB were constructed with aninter-building seismic gap and stainless steel plate between the two structures.This construction detail creates a preferential flow path for any pool leakage through thewestern walls of the IP1-SFPs, as well as leakage from other locations which migrates tothe western side of the IP1-SFPs"°4. While this "plate/gap" separates the structures all theway down through the structural foundation slabs, it likely would not have penetrated themud-mat'0 5 . In addition, it would not be uncommon for the surface of the mud-mat to notbe completely cleaned prior to pouring of the structural slab. Even small. amounts of soil,mud, dust, etc. between the mud-mat and the structural slab above would result in apreferential flow path along the top of the mud-mat. Therefore, it is expected that poolleakage in this zone (between the structural slab and the mud-mat) could flow laterally andwould still be isolated from the fractured bedrock below. It would then, in turn, also beisolated from the influence of the footing drains (both the NCD and the [P1-CSB drain).To the extent that the above hypotheses are correct, this leakage could then build up andflow along the plate and above the top of the mud-mat. With sufficient input of leakagefrom the pool, the elevation of this flowing water could also rise above thetop of theIPI-CB footing'0 6.
With the above hypothesized conditions, pool leakage may migrate along the plate all theway around the IP1-CB to the South and West until it reaches the end of the plate (at theintersection of the perimeter of the IPI-CB with the IPI-FHB). At that location, the waterwould follow the top of the mud-mat (and/or top of footing) along the IPI -CB bottom slabfurther to the West10 7. This leakage flow path is highlighted on Figure 8.2. The leakagewater would not be constrained to flow into the SCD given that this footing drain is dry.Once past the end of the plate,, the pool leakage could enter the bedrock at multiple points,wherever it encounters bedrock fractures. Thereafter, the leakage would enter thegroundwater and thus be constrained to migrate in the direction of groundwater flow.
104 This hypothesis is further supported by the presence of weeps of contaminated water (SFP leakage) in the eastern wallof the. IPI-CB at the footing wall joint.10' While not shown on the constructions drawings reviewed .as required", construction photos show that a mud-matwas placed prior to rebar cage construction (also see discussion of rationale under Tritium source areas above). Giventhe consistent bottom elevations of both the VC and the SFPs structural concrete slabs, a single mud-mat was likelyconstructed.'06 Leakage flow above the top of the footing (elevation 33 feet) to the East and Southeast of the VC would not becaptured by the SCD given that this drain is dry.107 See discussion of likely mud-mat/bedrock excavation wall configuration and the impact of precipitation events in thesection above under•Tritium source areas.
108
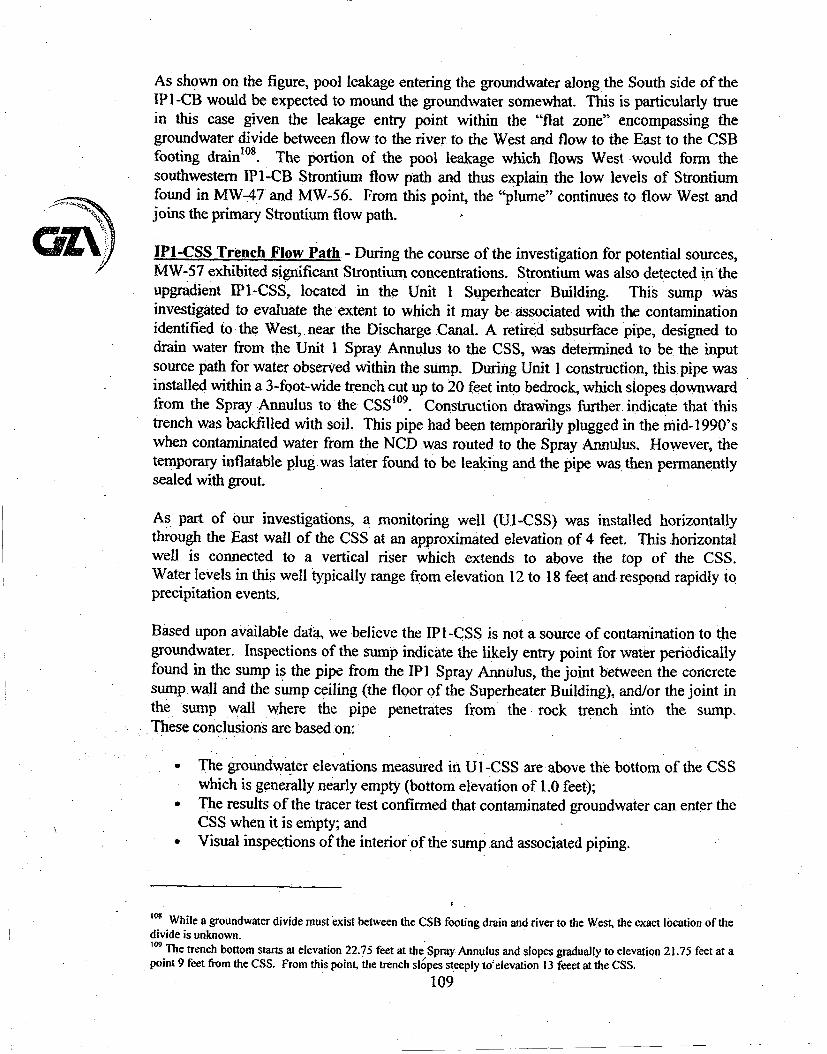
As shown on the figure, pool leakage entering the groundwater along, the South side of theIPI-CB would be expected to mound the groundwater somewhat. This is particularly truein this case given the leakage entry point within the "flat zone" encompassing thegroundwater divide between flow to the river, to the West and flow to the East to the CSBfooting drain'08 . The portion of the pool leakage which flows West would form thesouthwestern IPI-CB Strontium flow path and thus explain the low levels of Strontiumfound in MW-47 and MW-56. From this point, the "plume" continues to flow West andjoins the primary Strontium flow path.
IP1-CSS Trench Flow Path - During the course of the investigation for potential sources,MW-57 exhibited significant Strontium concentrations. Strontium was also detected in theupgradient IPI-CSS, located in the Unit I Superheater Building. This sump wasinvestigated to evaluate the extent to which it may be: associated with the contaminationidentified to the West, near the Discharge Canal. A retired subsurface pipe, designed todrain water from the Unit I Spray Annulus to the CSS, was determined to be the inputsource path for water observed within the sump. During Unit 1 construction, this pipe wasinstalled within a 3-foot-wide trench cut up to 20 feet into bedrock, which slopes downwardfrom the Spray Annulus to the CSS"' 9. Construction drawings further indicate that thistrench was backfilled with soil, This pipe had been temporarily plugged in the mid-] 990'swhen contaminated water from the NCD was routed to the Spray Annulus. However, thetemporary inflatable plug was later found to be leaking and the pipe was then permanentlysealed with grout.
As part of our investigations, a monitoring well (U1-CSS) was installed horizontallythrough the East wall of the CSS at an approximated elevation of 4 feet. This horizontalwell is connected to a vertical riser which extends to above the top of the CSS.Water levels in this well typically range from elevation 12 to 18 feet and respond rapidly toprecipitation events.
Based upon available data, we believe the IPI-CSS is not a source of contamination to thegroundwater. Inspections of the sump indicate the likely entry point for water periodicallyfound in the sump is the pipe from the IP1 Spray Annulus, the joint between the concretesump wall and the sump ceiling (the floor of the Superheater Building), and/or the joint inthe sump wall where the pipe penetrates from the rock trench into the sump,These conclusions are based on:
• The groundwater elevations measured in UI-CSS are above the bottom of the CSSwhich is generally nearly empty (bottom elevation of 1.0 feet);
* The results of the tracer test confirmed that contaminated groundwater can enter theCSS when it is empty; and
* Visual inspections of the interior of the sump and associated piping.
'0 While a groundwater divide must exist between the CSB footing drain and river to the West, the exact location of thedivide is unknown.'09 The trench bottom starts at elevation 22.75 feet at the Spray. Annulus and slopes gradually to elevation 21.75 feet at apoint 9 feet from the CS. From this point, the trench slopes steeply to&elevation 13 feee at the CSS.
109
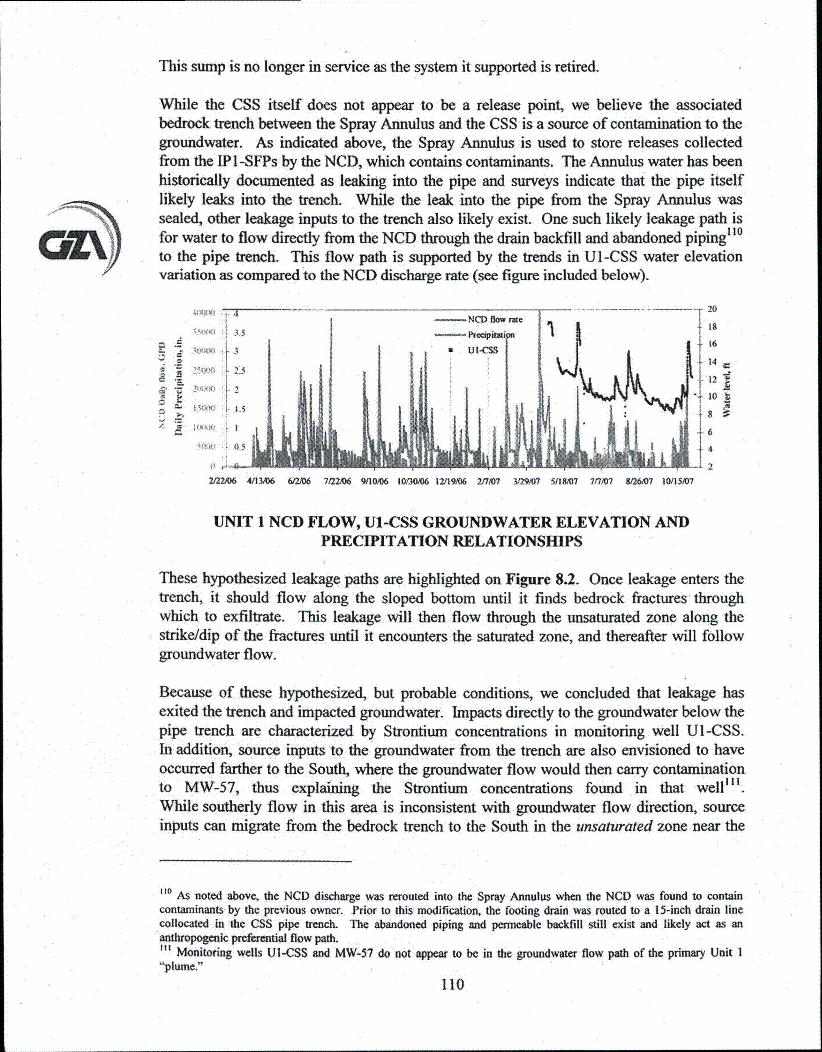
This sump is no longer in service as the system it supported is retired.
While the CSS itself does not appear to be a release point, we believe the associatedbedrock trench between the Spray Annulus and the CSS is a source of contamination to thegroundwater. As indicated above, the Spray Annulus is used to store releases collectedfrom the IP I-SFPs by the NCD, which contains contaminants. The Annulus water has beenhistorically documented as leaking into the pipe and surveys indicate that the pipe itselflikely leaks into the trench. While the leak into the pipe from the Spray Annulus wassealed, other leakage inputs to the trench also likely exist. One such likely leakage path isfor water to flow directly from the NCD through the drain backfill and abandoned pipingll0
to the pipe trench. This flow path is supported by the trends in U1-CSS water elevationvariation as compared to the NCD discharge rate (see figure included below).
oZ~
a
A
-NCD Bow mwe1-5xv - pr~icn I
owo Ul1M
0.5If I
2aMR3 4/1 3M6 &M2~ 7224VM 9/30.0 t0130A) 12/19106 217/07 3/2mA7 5/tn7 7flA) 8/6/0 10/15/0
20
18
16
14
12
10
8
6
4
2
-f
p
4
UNIT 1 NCD FLOW, U1-CSS GROUNDWATER ELEVATION ANDPRECIPITATION RELATIONSHIPS
These hypothesized leakage paths are highlighted on Figure 8.2. Once leakage enters thetrench, it should flow along the sloped bottom until it finds bedrock fractures throughwhich to exfiltrate. This leakage will then flow through the unsaturated zone along thestrike/dip of the fractures until it encounters the saturated zone, and thereafter will followgroundwater flow.
Because of these hypothesized, but probable conditions, we concluded that leakage hasexited the trench and impacted groundwater. Impacts directly to the groundwater below thepipe trench are characterized by Strontium concentrations in monitoring well Ul-CSS.In addition, source inputs to the groundwater from the trench are also envisioned to haveoccurred farther to the South, where the groundwater flow would then carry contaminationto MW-57, thus explaining the Strontium concentrations found in that well"I'.While southerly flow in this area is inconsistent with groundwater flow direction, sourceinputs can migrate from the bedrock trench to the South in the unsaturated zone near the
320 As noted above, the NCD discharge was rerouted into the Spray Annulus when the NCD was found to contain
contaminants by the previous owner. Prior to this modification, the footing drain was routed to a 15-inch drain linecollocated in the CSS pipe trench. The abandoned piping and permeable backfill still exist and likely act as ananthropogenic preferential flow path... Monitoring wells UI-CSS and MW-57 do not appear to be in the groundwater flow path of the primary Unit I'plume."
110
CSS, where the unsaturated zone is relatively deep" 2 . This hypothesized unsaturated zoneflow path is shown on Figure 8.2, as well as the schematic included below.
Its
LJN.SA-Tr F;r= LOW
IP1-CSS TRENCH UNSATURATED ZONE FLOW MECHANISM
In addition, the construction details of the Superheater East wall may also channel saturatedflow to the South, depending on variation in groundwater elevations. These less directleakage inputs then establish the southern portion of the source area for the CSS trenchflow path such that the groundwater flow carries the "plume" through monitoring wellMW-57, thus explaining the Strontium found in samples collected from this well" 3 .
Lewacv IP1 Storm Drain Flow Path - As summarized above, the CSB footing draincollects groundwater from the vicinity of the IPI -SFPs; this water has been documented tocontain radionuclides. The contaminated water is then conveyed to the SFDS, located atthe southern end of the CSB. In addition, historical events, including CSB sump tankoverflows in Unit 1, have impacted the SFDS.
Prior to construction of Unit 3, water collected in the SFDS was pumped up toWelevation 65feet and discharged to the stormwater system on the South side of the Unit 1 CSB.The discharge was conveyed by these drains to the South towards catch basin UI -CB-9(currently under the access ramp to Unit 3), and then West (U1 CB-10) under what is nowthe 1P3-VC toward the Discharge Canal. This pathway was re-routed during constructionof Unit 3 in the early 1970s to flow South from catch basin Ul-CB-9, then further Southtowards catch basin U3-CB-A4 and subsequently to the Discharge Canal through the
112 The hypothesized southerly flow of a portion of the trench leakage to the South through the unsaturated zone is
consistent with: I) the strike/dip direction of major joint sets found on Site: and 2) the groundwater flow path from theresulting unsaturated zone input to the wells which identified this Strontium flow path."13 This well appears to be located outside, and upgradient of, the primary Unit I Strontium flow path to the North.
111
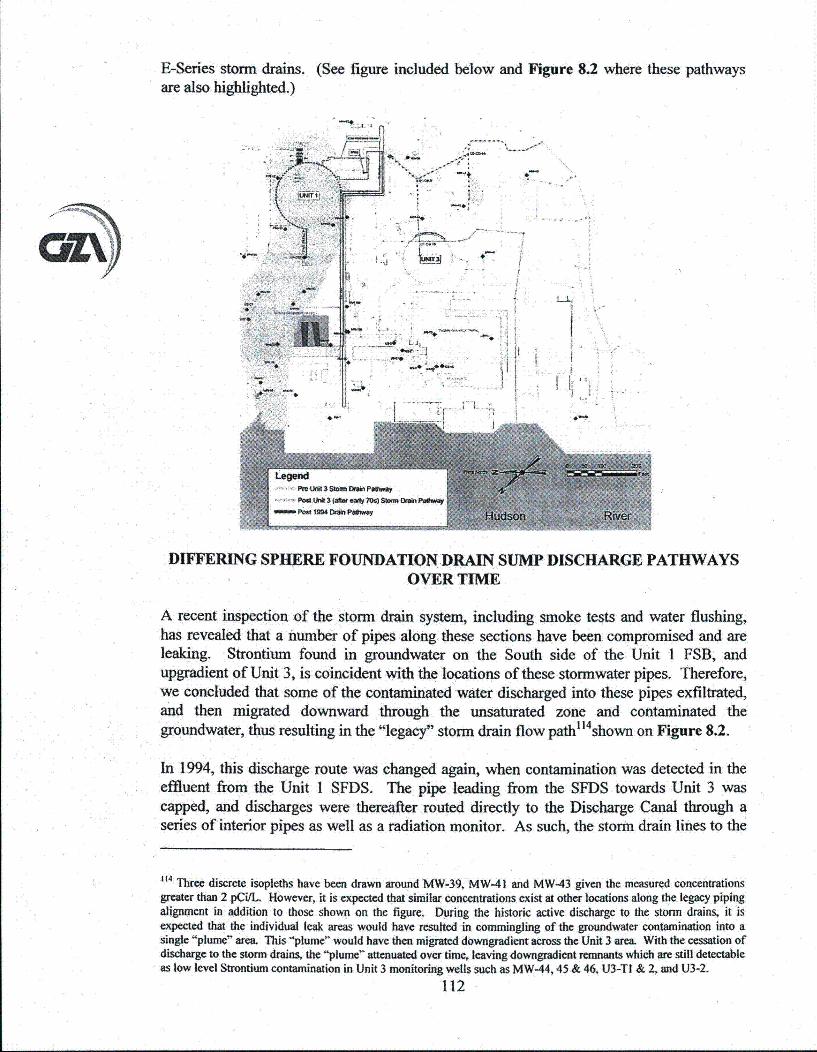
E-Series storm drains. (See figure included below and Figure 8.2 where these pathwaysare also highlighted.)
//
Legend
Pro. , %* 3m stn " Dr~lain Pat""..... 3• , ui (afte, sn o* } I s)lona Drin PWINh,
DIFFERING SPHERE FOUNDATION.DRAIN SUMP DISCHARGE PATHWAYSOVER TIMIE
A recent inspection of the storm drain system, including smoke tests and water flushing,has revealed that a number of pipes along these sections have been compromised and are,leaking. -Strontium found in groundwater on the South side of the Unit I FSB, andupgradient of Unit 3, is coincident with the locations of these stormwater pipes. Therefore,we concluded that some of the contaminated water discharged into these pipes exfiltrated,and then migrated downward through the unsaturated zone and contaminated thegroundwater, thus resulting in the "legacy" storm drain flow path'14 shown on Figure 8.2.
In 1994, this discharge route was changed again, when contamination was detected in theeffluent from the Unit I SFDS. The pipe leading from the SFDS towards Unit 3 wascapped, and discharges were thereafter routed directly to the Discharge Canal through aseries of interior pipes as well as a radiation monitor. As such, the storm drain lines to the
114 irhree discrete isopleths have been drawn around MW-39, MW-41 and MW-43 given the measured concentrationsgreater than 2 pCi!L However, it is expected that similar concentrations, exist at other locations along the legacy pipingalignment in addition to those shown on the figure. During the historic active discharge to the storm drains, it isexpected that the individual leak- areas would have resulted in commringling of the groundwater contamination into asingle "plum(:" area. This -plumfe would have then migrated downgradient across the Unit 3 area. With the cessation ofdischarge to the storm drains. the "pume" attenuated over time, leaving downgradient remnants which arc still detectableas low level Strontium contamination in Unit 3 monitoring wells suceh as MW-44, 45 & 46, U3-TI & 2, and U3-2-
112
South of Unit I no longer carry this contaminated water and they are therefore no longer anactive source of contamination to the groundwater.
However, from a contaminant plume perspective, these historic releases still represent anongoing legacy source of Strontium in the groundwater to the South side of Unit 1. This isbecause Strontium partitions from the water phase and adsorbs to solid materials, includingsubsurface soil and bedrock. The Strontium previously adsorbed to these subsurfacematerials then partitions back to, and continues to contaminate, the groundwater over time,even after the storm drain releases have been terminated.
As shown on Figure 8.2, low level residual evidence of this legacy pathway was identifiedin monitoring wells installed to South of Unit I during the course of the investigationsproximate to potential sources associated with Unit 3. Strontium, Cesium and Tritiumwere detected in these wells at levels below the EPA drinking water standard.Three monitoring wells to the South of Unit I show "Legacy Storm Drain flow paths"drawn around them. These wells have yielded samples at one time/depth with Strontiumconcentrations greater than 2 pCi/L, or one-quarter of the Strontium-90 drinking waterstandard. While the actual extent of these Strontium concentrations is not known giventhat each has been drawn around a single point, they appear to be limited in extent (basedon the data from the surrounding monitoring wells). It is also important to recognize thatthe specific locations of the historic releases from the storm drain lines are not known.In addition, once water has exfiltrated from the drain line, it moves generally downward inthe unsaturated zone as controlled by the strike/dip direction of the specific bedrockfractures encountered. Therefore, legacy groundwater contamination does not have to belocated immediately downgradient of the storm drain system (as exemplified by theStrontium found in MW-39 and tracer in MW-42). While three isopleths are shown onFigure 8.2, we believe it is possible that other areas in the general vicinity of this pipingmay exhibit similar groundwater concentrations. We have also concluded that the lowerconcentrations of Strontium detected in monitoring wells further downgradient, in theUnit 3 area, are also due to these historic, legacy storm drain releases.
113
9.0 GROUNDWATER CONTAMINATION FATE AND TRANSPORT
Strontium (the Unit 1 plume) and Tritium (the Unit 2 plume) are the radionuclides we usedto map the groundwater contamination. The investigation focused on these twocontaminants because they describe the relevant plume migration pathways, and the otherSite groundwater contaminants are encompassed within these-plumes.
While radionuclide contaminants have been detected at various locations on the Site, boththe on-Site and off-Site analytical testing, as well as the groundwater elevation data,demonstrate that groundwater contaminants are not flowing. off-Site and do not flow to theNorth, East or South. Groundwater flow and thus contaminant transport is West to theHudson River via: 1) groundwater discharge directlyto the river, 2) groundwater dischargeto the cooling water canal, and 3) groundwater infiltration into storm drains, and then to thecanal.
The primary source of groundwater Tritium contamination is the IP2-SFP. The resultingUnit 2 plume extends to the West, towards the river, as described in subsequent sections.
The source of the Strontium contamination is the IP1-SFPs. Previous conceptual models,based on information presented in prior reports, indicated that releases from the IP 1 -SFPswere likely captured through collection of groundwater from the Unit 1 foundation drainsystems. However, based upon groundwater sampling and tracer test data, we now knowthat the Unit I foundation drain system, particularly the NCD, is not hydraulicallycontaining all groundwater contamination in this area (see Section 8.0).
GZA's understanding of the Tritium source and Strontium source are discussed in moredetail in Section 8.0. The plumes described on the figures in the following subsections arebased on: 1) the isopleths bounding the maximum concentrations, as representative of"worst case conditions"'"15 (Figures 8.1 and 8.2); and 2) the most recent laboratory datacollected through August 2007, as representative of current -conditions (Figures 9.1, 9.2,9.3 and 9.4). While the figures showing upper -bound isopleth concentrations do not showactual conditions, we believe these graphics are useful in developing an understanding ofgroundwater and radionuclide migration pathways.
In reviewing this section please note the plumes show our current understanding of howanthropogenic features influence groundwater flow patterns, in particular the variousfooting drains and backfill types used during construction. Also note that flow in the
113 It is noted that these figures (Figures 8.1 and 8.2) do not show actual plbmes, the isopleths present contoured upperbound concentrations for samples taken at any time and any depth at a particular location, rather than a 3-dimensionalsnapshot of concentrations at a single time. As such, these "plumes" are an overstatement of the contaminant levelsexisting at any time. It should. also be noted that the lightest colored contour interval begins at one-quarter theUSEPAdrnking water standard. While drinking water standards do not apply to the Site (there are no drinking water wells on orproximate to the Site), they do provide a recognized, and highly conservative benchmark for comparison purposes);Lower, but positive, detections outside the colored contours are shown as colored data blocks. See figure for additionalnotes.
114
unsaturated zone plays an important role in both the timing of releases to the water tableand in the spreading of contaminants.
Based upon the results of GZA's geostructural analysis, the extent of contaminatedgroundwater, the 72 hour Pumping Test, the tracer test and tidal response tests, we believethat the bedrock underneath the Site is sufficiently fractured and interconnected to allowthe Site to be viewed as a non-homogenous and anisotropic porous media. Based on thisfinding, and because advection is the controlling transport mechanism, groundwater flow,and consequently contaminant migration in the saturated zone, is nearly perpendicular to
* •groundwater contours on the scale of the Site.
9.1 AREAL EXTENT OF GROUNDWATER CONTAMINATION
Based on measured tracer velocities (4 to 9 feet per day; see Section 7.4), the limiteddistances between release areas and the river (typically less than 400 feet), the age of theplumes (years), and recent interdictions, we believe contaminant plumes have reached theirmaximum size and are currently decreasing in size. Consequently, our reporting in thissection focuses on observed, "current" conditions (the summer of 2007). That is, we sawno need to mathematically predict future conditions.
9.2 DEPTH OF GROUNDWATER CONTAMINATION
Because of the location of Indian Point on the edge of the Hudson River, the width of theriver, and the nature of contaminants of potential concern, groundwater flow patterns (and,consequently, contaminant pathways) are relatively shallow. Furthermore, as discussed inSection 6.0, the upper portion of the aquifer (typically, the upper 40 feet of the bedrock)has a higher average hydraulic conductivity than the deeper portions of the bedrock.Consequently, the center of mass of the contaminated groundwater is shallow.
Figures 9.1 and 9.2 are cross sections which:show the approximate vertical distribution ofTritium and Strontium, near the center lines of the Unit I and Unit 2 plumes, in the summerof 2007 ("current conditions"). In reviewing these figures, note that Strontium was notfound below a depth of 105 feet in MW-67. We attribute the low concentrations of Tritiumbelow a depth of 200 feet at this location, at least in part, to the downward migration ofTritium during our investigations. For example, by necessity, well RW-l was an openwellbore for a period of time" 6 which allowed vertical groundwater migration, along anartificial preferred pathway, deeper than would occur along ambient flow paths.
9.3 UNIT 2 TRITIUM PLUME BEHAVIOR
As shown on Figures 8.1 and 9.3, the Unit 2 plume exhibits Tritium concentrationsoriginating at the IP2-SFP. The higher concentration isopleths are shown around the entire
116 RW-l is located immediately below the 2005 shrinkage crack leak (high Tritium concentrations in shallow
groundwater). This well had remained as an open wellbore for periods of time in preparation for and during: I) thedrilling of the wellbore; 2) the packer testing; 3) the geophysical logging; and, 4) the Pumping Test. During these times,vertically downward gradients likely moved some Tritium to levels deeper than it would otherwise exist. When possible,this wellbore has been sealed over its entire length using a Flute Liner System.
115
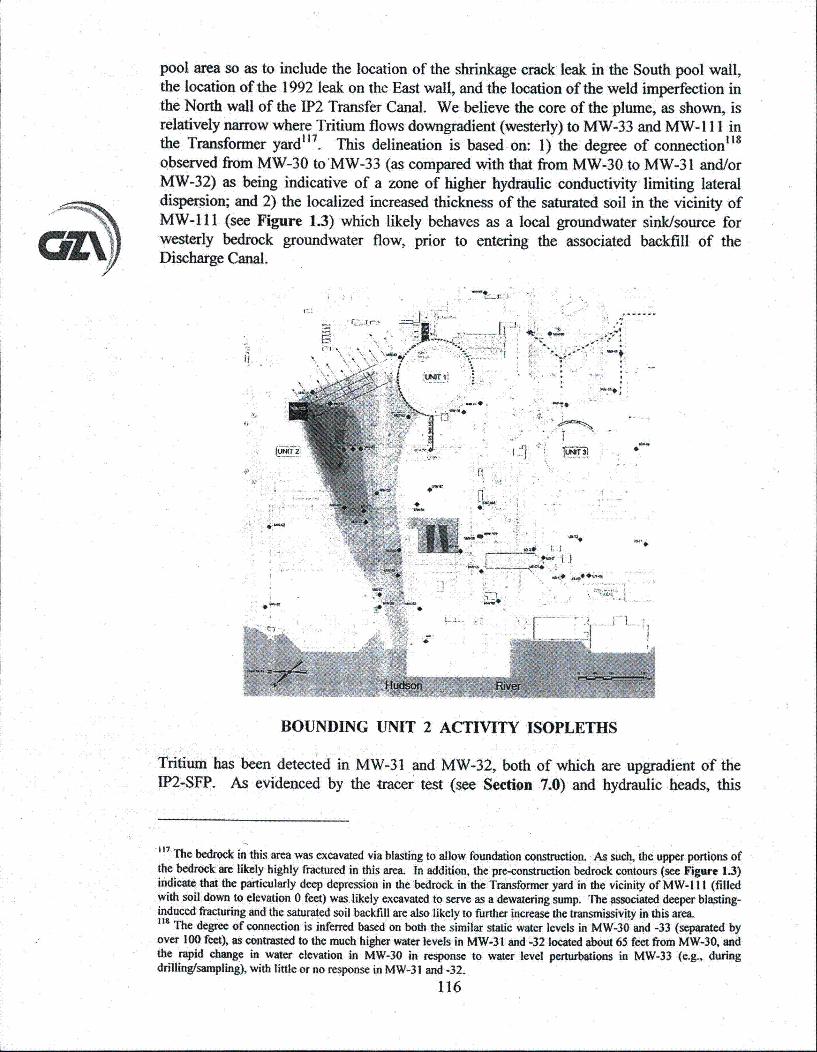
pool area so as to include the location of the shrinkage crack leak in the South pool wall,the location of the 1992 leak on the East wall, and the location of the weld imperfection inthe North wall of the IP2 Transfer Canal. We believe the core of the plume, as shown, isrelatively narrow where Tritium flows downgradient (westerly) to MW-33 and MW-I 11 inthe Transformer yard"'1. This delineation is based on: 1) the degree of connection 18
observed from MW-30 to'MW-33 (as compared with that from MW-30 to MW-31 and/orMW-32) as being indicative of a zone of higher hydraulic conductivity limiting lateraldispersion; and 2) the localized increased thickness of the saturated soil in the vicinity ofMW-I 11 (see Figure 1.3) which likely behaves as a local groundwater sink/source forwesterly bedrock groundwater flow, prior to entering the associated backfill of theDischarge Canal.ozv
U.:
*~ A,
U
IWtiT3
p.0-
a..
a..
.1
a...'--
zI-*O
L.. iEIIiiJ.;Jf i1
BOUNDING UNIT 2 ACTIVITY ISOPLETHS
Tritium has been detected in MW-31 and MW-32, both of which are upgradient of theIP2-SFP. As evidenced by the tracer test (see Section 7.0) and hydraulic heads, this
117 The bedrock in this area was excavated via blasting to allow foundation construction. As such, the upper portions ofthe bedrock are likely highly fractured in this area. In addition, the pre-construction bedrock contours (see Figure 1.3)indicate that the particularly deep depression in the bedrock in the Transformer yard in the vicinity of MW-I I I (filledwith soil down to elevation 0 feet) was. likely excavated to serve as a dewatering sump. The associated deeper blasting-induced fracturing and the saturated soil backfill are also likely to further increase the transmissivity in this area.11 The degree of connection is inferred based on both the similar static water levels in MW-30 and -33 (separated byover 100 feet), as contrasted to the much higher water levels in MW-31 and -32 located about 65 feet from MW-30, andthe rapid change in water elevation in MW-30 in response to water level perturaions in MW-33 (e.g., duringdrilling/sampling), with little or no response in MW-31 and -32.
116
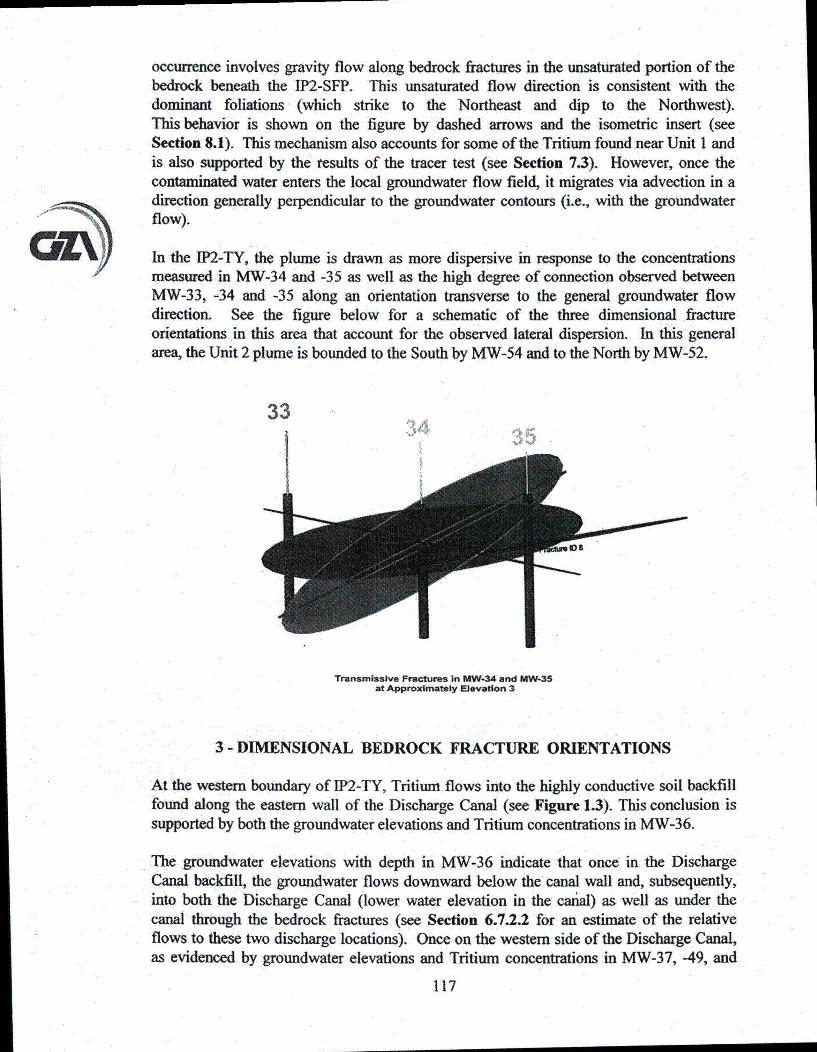
NXIL
occurrence involves gravity flow along bedrock fractures in the unsaturated portion of thebedrock beneath the IP2-SFP. This unsaturated flow direction is consistent with thedominant foliations (which strike to the Northeast and dip to the Northwest).This behavior is shown on the figure by dashed arrows and the isometric insert (seeSection 8.1). This mechanism also accounts for some of the Tritium found near Unit I andis also supported by the results of the tracer test (see Section 7.3). However, once thecontaminated water enters the local groundwater flow field, it migrates via advection in adirection generally perpendicular to the groundwater contours (i.e., with the groundwaterflow).
In the IP2-TY, the plume is drawn as more dispersive in response to the concentrationsmeasured in MW-34 and -35 as well as the high degree of connection observed betweenMW-33, -34 and -35 along an orientation transverse to the general groundwater flowdirection. See the figure below for a schematic of the three dimensional fractureorientations in this area that account for the observed lateral dispersion. In this generalarea, the Unit 2 plume is bounded to the South by MW-54 and to the North by MW-52.
Transmisslve Fractures in MW-34 and MW-35at Approximately Elevation 3
3- DIMENSIONAL BEDROCK FRACTURE ORIENTATIONS
At the western boundary of 1P2-TY, Tritium flows into the highly conductive soil backfillfound along the eastern wall of the Discharge Canal (see Figure 1.3). This conclusion issupported by both the groundwater elevations and Tritium concentrations in MW-36.
The groundwater elevations with depth in MW-36 indicate that once in the DischargeCanal backfill, the groundwater flows downward below the canal wall and, subsequently,into both the Discharge Canal (lower water elevation in the caial) as well as under thecanal through the bedrock fractures (see Section 6.7.2.2 for an estimate of the relativeflows to these two discharge locations). Once on the western side of the Discharge Canal,as evidenced by groundwater elevations and Tritium concentrations in MW-37, -49, and
117
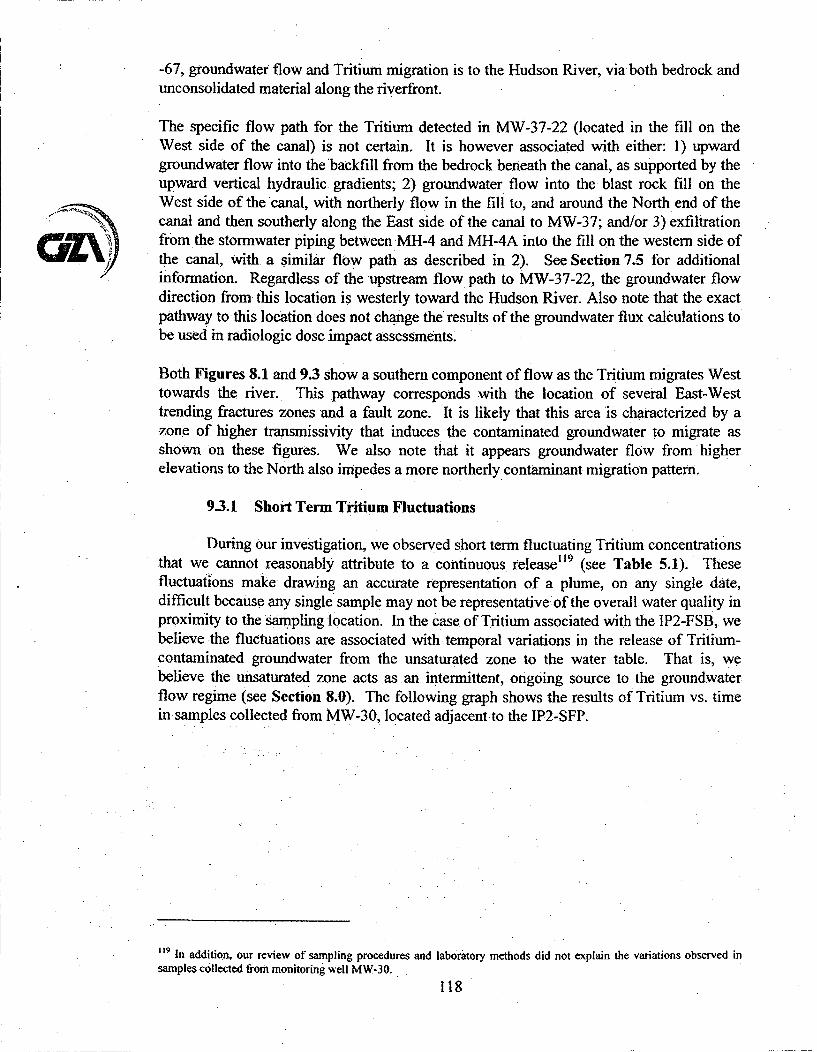
-67, groundwater flow and Tritium migration is to the Hudson River, via both bedrock andunconsolidated material along the riverfront.
The specific flow path for the Tritium detected in MW-37-22 (located in the fill on theWest side of the canal) is not certain. It is however associated with either: 1) upwardgroundwater flow into the backfill from the bedrock beneath the canal, as supported by theupward vertical hydraulic gradients; 2) groundwater flow into the blast rock fill on theWest side of the canal, with northerly flow in the fill to, and around the North end of thecanal and then southerly along the East side of the canal to MW-37; and/or 3) exfiltrationfrom the stormwater piping between MH-4 and MH-4A into the fill on the western side ofthe canal, with a similar flow path as described in 2). See Section 7.5 for additionalinformation. Regardless of the upstream flow path to MW-37-22, the groundwater flowdirection from this location is westerly toward the Hudson River. Also note that the exactpathway to this location does not change the results of the groundwater flux calculations tobe used in radiologic dose impact assessments.
Both Figures 8.1 and 9.3 show a southern component of flow as the Tritium migrates Westtowards the river. This pathway corresponds with the location of several East-Westtrending fractures zones and a fault zone. It is likely that this area is characterized by azone of higher transmissivity that induces the contaminated groundwater to migrate asshown on these figures. We also note that it appears groundwater flow from higherelevations to the North also impedes a more northerly contaminant migration pattern.
9.3.1 Short Term Tritium Fluctuations
During our investigation, we observed short term fluctuating Tritium concentrationsthat we cannot reasonably attribute to a continuous release"19 (see Table 5.1). Thesefluctuations make drawing an accurate representation of a plume, on any single date,difficult because any single sample may not be representative of the overall water quality inproximity to the sampling location. In the case of Tritium associated with the IP2-FSB, webelieve the fluctuations are associated with temporal variations in the release of Tritium-contaminated groundwater from the unsaturated zone to the water table. That is, webelieve the unsaturated zone acts as an intermittent, ongoing source to the groundwaterflow regime (see Section 8.0). The following graph shows the results of Tritium vs. timein samples collected from MW-30, located adjacent to the IP2-SFP.
"9 In addition, our review of sampling procedures and laboratory methods did not explain the variations observed insamples collected from monitoring well MW-30.
118
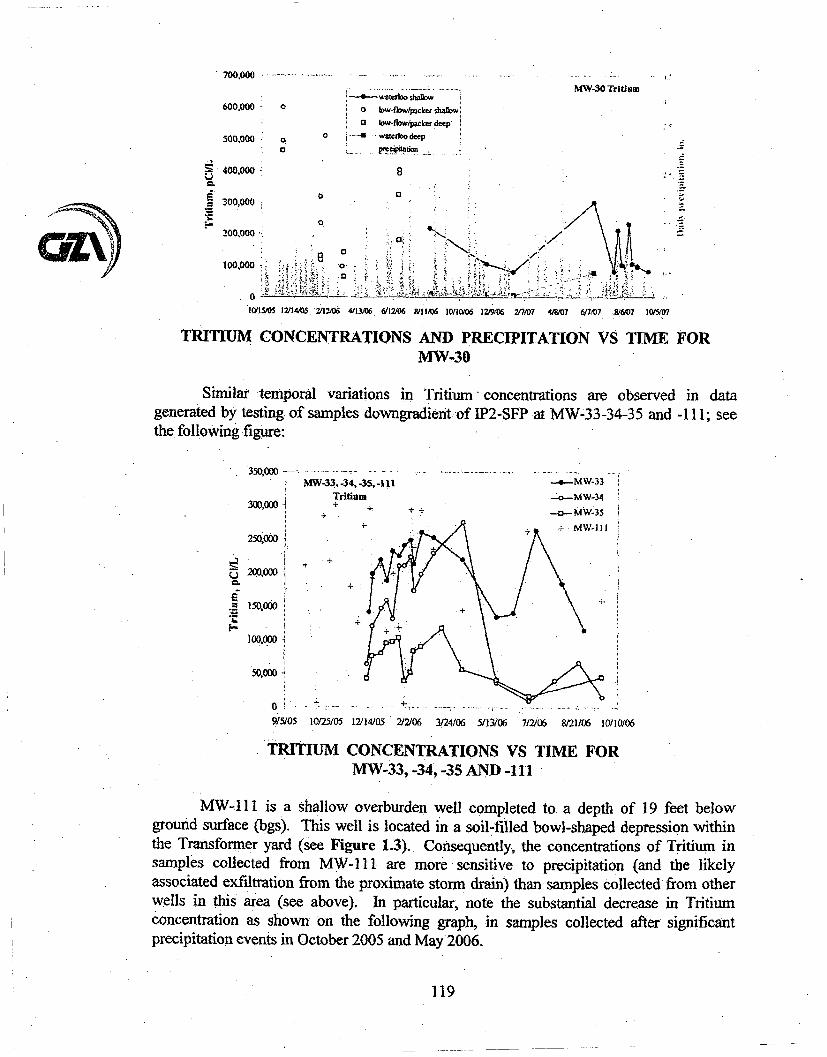
MW-30 Tritium-4--waeioo shia13•
600.000 . 0 bow-fbow/packer shal..
Ql low-fbwipacker deep
500,000 " o --- .. w-*doo deep
-400,000 8
300,O00- .
100,000~
0 L, - ________ ____
115/051W2/14/05. 2/12/e6 4/1306 6/012106 W I0610/10M06 12/e/06 2 47/07 4/7 .6/7/e1 ,6807 10/607
TRITIUM CONCENTRATIONS AND PRECIPITATION VS TIME FORMW-30
Similar :temporal variations in Tritium- concentrations are observed in datagenerated by testing of samples downgradient of IP2-.SFP at MW-33-34-35 and -I 11; seethe following figure:
M'WV-33, -34, -35,-1 !-MW-33
Tritiunn -o.-MW-34300,000 +*
-4a-- MW-35÷ -F :!MW- I I
~ 50,000
200.000
50D.000
0 ..-. .
9/5/05 10/25/05 12/14/05 X/2/06 3/24/06 5/13/06 .7/2/ .06 8/21106 10/10/06
TRITIUM CONCENTRATIONS VS TIMIE FORMW-33, -34, -35 AND -1
MW-i 11 is a. shallow overburden well completed to a depth of 19 feet belowground surface (bgs). This well is located in a soil-filled bowl-shaped depression withinthe Trantsformner -yard (see Figure 1.3). Consequently, the concent .rations of Tritium insamples collected from MW-I 11. are more sensitive to precipitation (and the likelyassociated exfiltration from the proximate storm drain) than samples collected from otherwells in this area (see above). In Particular, note the substantial decrease in Tritiumconcentration as shown on the following graph, in samples collected after significantPrecipitation events in October 2005 and May 2006.
119
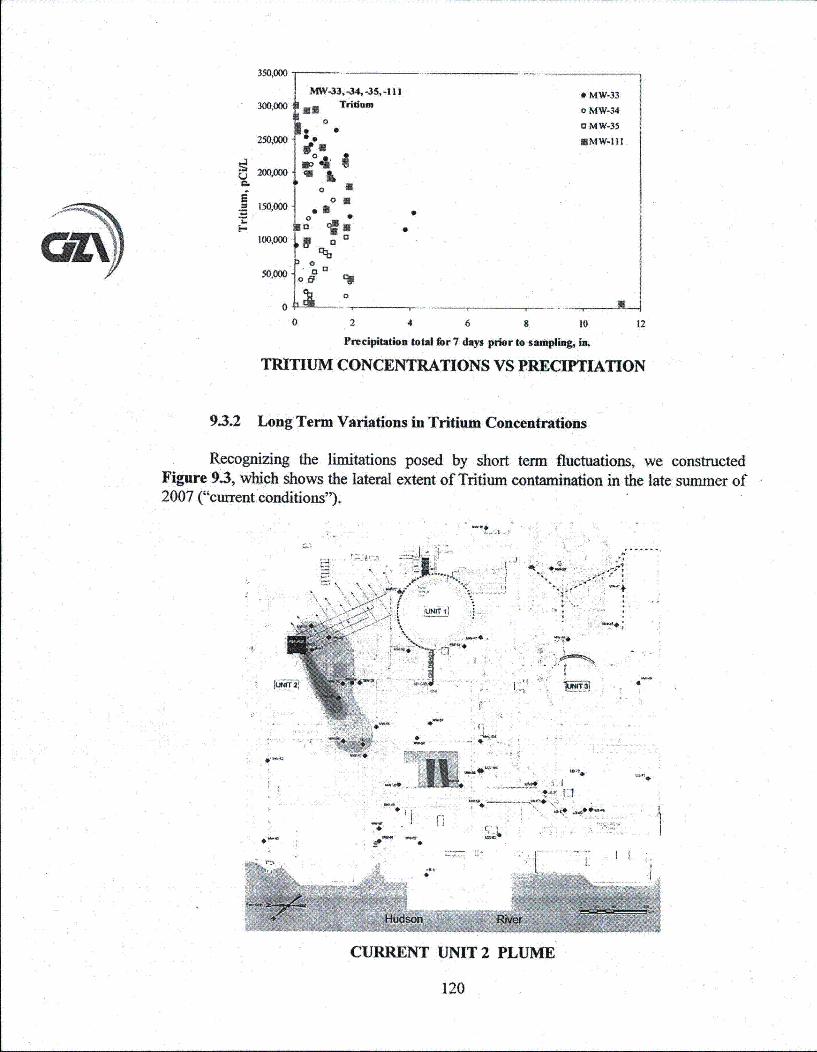
1~X%
W"
lrjzky
350,000MW-33,.-34,-3S,4-1 Io
MW-33
300,000 NN 0 MW-340 a Mw-35
250,000 No * MW-in.
P 4.
00U oo
150,000
loo,000 01
50,ooo0 oa
0 2 4 6 9. 10 12
Precipltation total for 7 days prior to sampling, in.
TRITIUM CONCENTRATIONS VS PRECIPTIATION
9.3.2 Long Term Variations in Tritium Concentrations
Recognizing the limitations posed by short term fluctuations, we constructedFigure 9.3, which shows the lateral extent of Tritium contamination in the late summer of2007 ("current conditions").
K . .. A•'.7.
I-
-Os-
* *- li-4~ LI
-..- -*~*V,~.. .*-
I11ii
CURRENT UNIT 2 PLUME
120
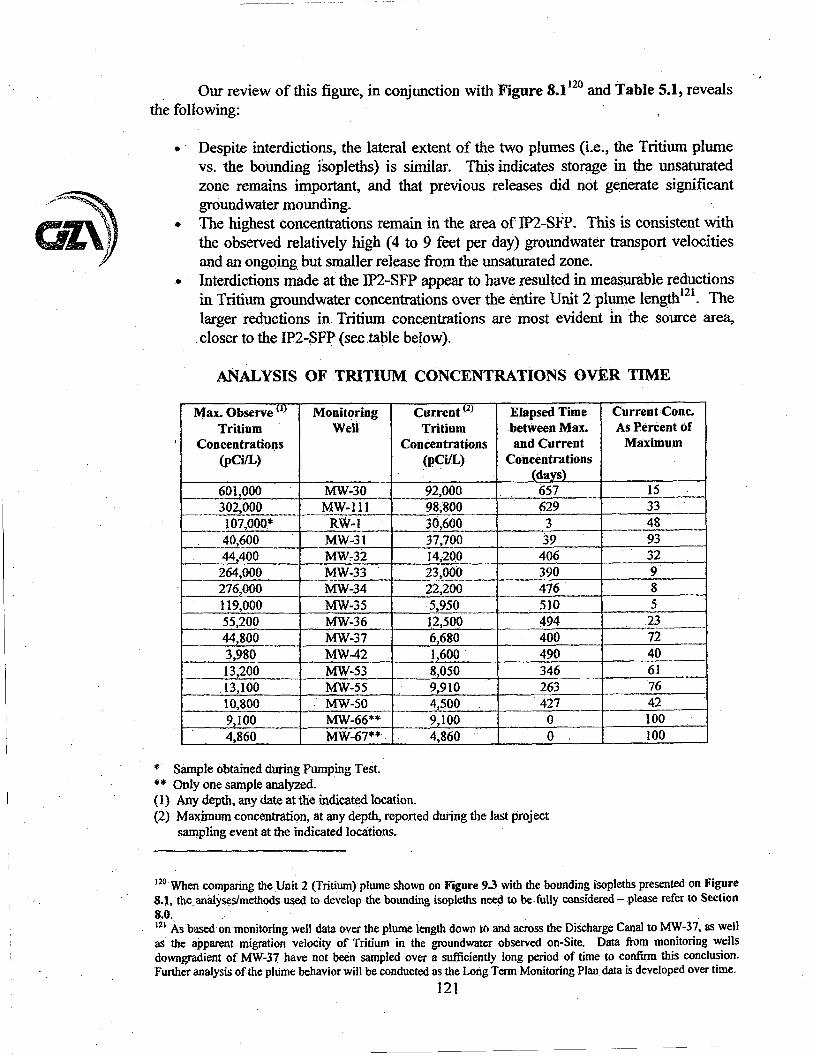
anlix
Our review of this figure, in conjunction with Figure 8.1120 and Table 5.1, revealsthe following:
" Despite interdictions, the lateral extent of the two plumes (i.e., the Tritium plumevs. the bounding isopleths) is similar. This indicates storage in the unsaturatedzone remains important, and that previous releases did not generate significantgroundwater mounding.
* The highest concentrations remain in the area of IP2-SFP. This is consistent withthe observed relatively high (4 to 9 feet per day) groundwater transport velocitiesand an ongoing but smaller release from the unsaturated zone.
• Interdictions made at the IP2-SFP appear to have resulted in measurable reductionsin Tritium groundwater concentrations over the entire Unit 2 plume length'21. Thelarger reductions in Tritium concentrations are most evident in the source area,• closer to the IP2-SFP (see table below).
ANALYSIS OF TRITIUM CONCENTRATIONS OVER TIME
Max. Observe o) Monitoring Current (2) Elapsed Time Current :Cone.Tritium Well Tritium between Max. As Percent of
Concentrations Concentrations and Current Maximum(pCi/L) (pCi/L) Concentrations
(days)601,000 MW-30 92,000 657 15302,000 MW-111 98,800 629 33
107,000* RW-1 30,600 3 4840,600 MW-31 37,700 39 9344,400 MW-32 14,200 406 32
264,000 MW-33 23,000 390 9276,000 MW-34 22,200 476 8119,000 MW-35 .5,950 510 555,200 MW-36 12,500 494 .2344,800 MW-37 6,680 400 723,980 MW-42 1,600 490 4013,200 MW-53 8,050 346 61
.13,100 MW-55 9,910 263 7610,800 MW-50 4,500 427 429,100 MW-66** 9,100 0 1004,860 MW-67* * 4,860 0 100
Sample obtained during Pumping Test.** Only one sample analyzed.(1)(2)
Any depth, any date at the indicated location.Maximum concentration, at any depth, reported during the last projectsampling event at the indicated locations.
120 When comparing the Unit 2 (Tritium) plume shown on Figure 9.3 with the bounding isopleths presented on Figure8.1, the analyses/methods used to develop the bounding isopleths need to be fully considered -please refer to Section
u. As based on-monitoring well data over the plume length down to and across the Discharge Canal to MW-37, as wellas the apparent migration velocity of Tritium in the groundwater observed on-Site. Data from monitoring wellsdowngradient of MW-37 have not been sampled over a sufficiently long period of time to confirm this conclusion.Further analysis of the plume behavior will be conducted as the Long Term Monitoring Plan data is developed over time.
121
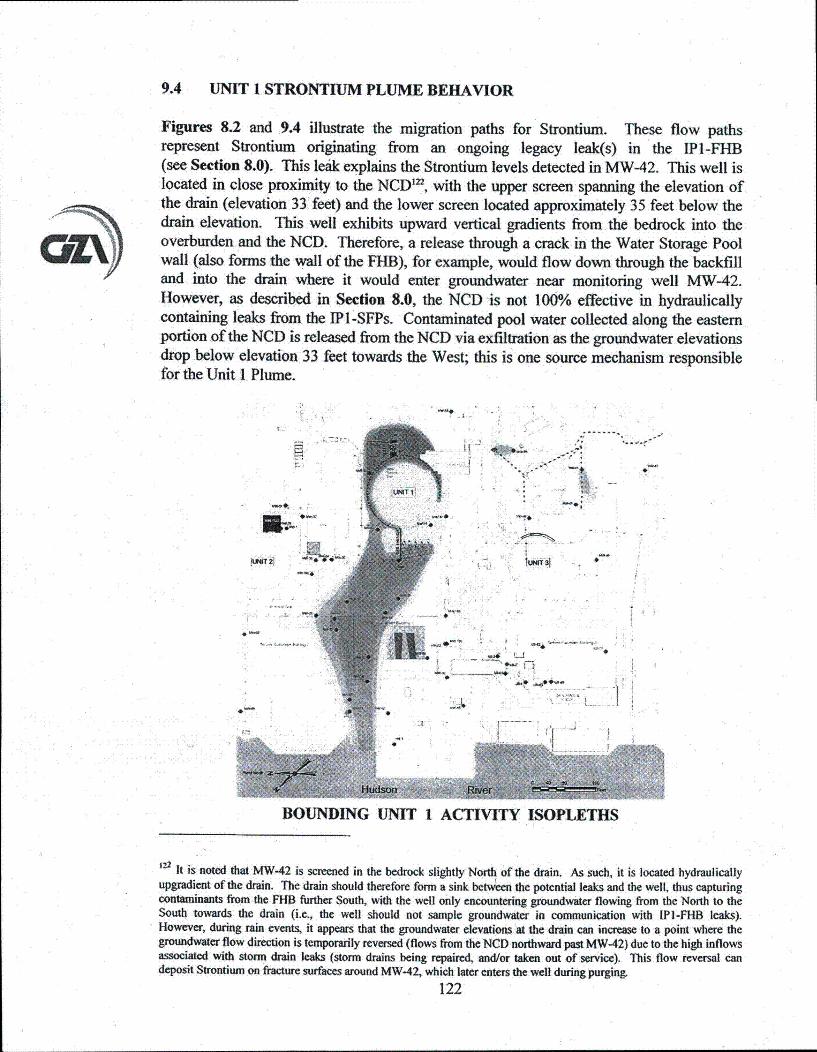
9.4 UNIT 1 STRONTIUM PLUME BEHAVIOR
Figures 8.2 and 9.4 illustrate the migration paths for Strontium. These flow pathsrepresent Strontium originating from an ongoing legacy leak(s) in the IPI-FHB(see Section 8.0). This leaik explains the Strontium levels detected in MW-42. This well islocated in close proximity to the NCD1", with the upper screen spanning the elevation ofthe drain (elevation 33 feet) and the lower screen located approximately 35 feet below thedrain elevation. This well exhibits upward vertical gradients from the bedrock into theoverburden and the NCD. Therefore, a release through a crack in the Water Storage Poolwall (also forms the wall of the FHB), for example, would flow down through the backfilland into the drain where it would enter groundwater near monitoring well MW-42.However, as described in Section 8.0, the NCD is not 100%o effective in hydraulicallycontaining leaks from the IP1-SFPs. Contaminated pool water collected along the easternportion of the NCD is released from the NCD via exfiltration as the groundwater elevationsdrop below elevation 33 feet towards the West; this is one source mechanism responsiblefor the Unit 1 Plume.
LN~T1~ j
OF*-T,,-
-lot
J
AI
•4•
HOUNDING UNIT I ACTIVITY ISOPLETHS
,22 It is noted that MW-42 is screened in the bedrock slightly North of the drain. As such, it is located hydraulicallyupgradient of the drain. The drain should therefore form a sink betwen the potential leaks and the well, thus capturingcontaminants from the FHB further South, with the well only encountering groundwater flowing from the North to theSouth towards the drain (i.e., the well should not sample groundwater in communication with IPI-FHB leaks).However, during rain events, it appears that the groundwater elevations at the drain can increase to a point where thegroundwater flow direction is temporarily reversed (flows from the NCD northward past MW-42) due to the high inflowsassociated with storm drain leaks (storm drains being repaired, and/or taken out of service). This flow reversal candeposit Strontium on fracture surfaces around MW-42, which later enters the well during purging,
122
The easternmost portion of the overall Unit 1 plume is shown to exist below the entireIP1-SFPs. GZA termed this the eastern Unit 1 CB Flow Path. Strontium-contaminatedgroundwater in this area will migrate either to the NCD or the CSB drain, depending onwhere the specific release point is located relative to these drains.
As discussed in Section 8.0, the overall Unit 1 plume also extends to the West towardsMW-47 and MW-56. GZA termed this the southwestern Unit I CB Flow Path. Once thecontaminated water enters the groundwater on the South side of Unit 1, it flows either Eastto the CSB footing drain or to the Northwest towards Hudson River, depending on thehydraulic gradient at the location where the release reaches the water table.
In addition, we believe the bedrock trench that contained the Unit I Annulus-to-CSS draincreates a preferential pathway (through the backfill within the bedrock trench), furtheraiding the transport of Strontium-contaminated groundwater to the West. GZA termed thisthe Unit I CSS Trench Flow Path. Once leakage enters the trench, it should flow along thesloped bottom until it finds bedrock fractures through which it will exfiltrate. This leakagewill then flow through the unsaturated zone along the strike/dip of the fractures until itencounters the saturated zone, and thereafter will follow groundwater flow. This pattern isillustrated on Figure 9.4 by dashed arrows to the West of Unit 1. It results in a spreadingof Strontium-contaminated groundwater, which then flows with groundwater to the HudsonRiver.
Figures 8.2 and 9.4 also show the Strontium contamination related to releases from legacypiping. These historic releases from the drain pipes are currently manifested as sporadic,low level detections of Strontium in groundwater wells (MW-39, -41 and -43) along thelegacy piping. Note, as shown, this spatial distribution of contamination is not a result ofgroundwater contaminant transport to, the South; rather it is a result of multiple releasepoints along the piping. In summary, this contamination represents residual contaminationwhich has attenuated and decayed over time, and will not result in further significantmigration.
Once outside the drain capture zone, the Strontium migrates West towards the lowergroundwater elevations measured in the IP2-TY and along the walls of the Discharge Canalalong the southern end of the IP2-TB (MW-36, -55, -37, -49, -50 and -67) (see Figures 8.2and 9.4). A more southerly track is not anticipated because: 1) the higher groundwaterelevations measured in MW-58 and -59 just to the South of the IPI TGB; and 2) the likelyexistence of low conductivity concrete backfill along the inside of the IP I-TB walls, itssubbasement, discharge piping and eastern Discharge Canal wall (as contrasted with themuch higher conductivity blast-rock backfill likely used in the IP2-TY and along theoutside of the IP I -TGB walls as well as adjacent to the upgradient IP 1 structures).
In addition, as discussed in Section 6.0 and shown on Figure 6.2, there are North-Southtrending faults in the vicinity of MW-49, MW-61, and MW-66, which are characterized by
123
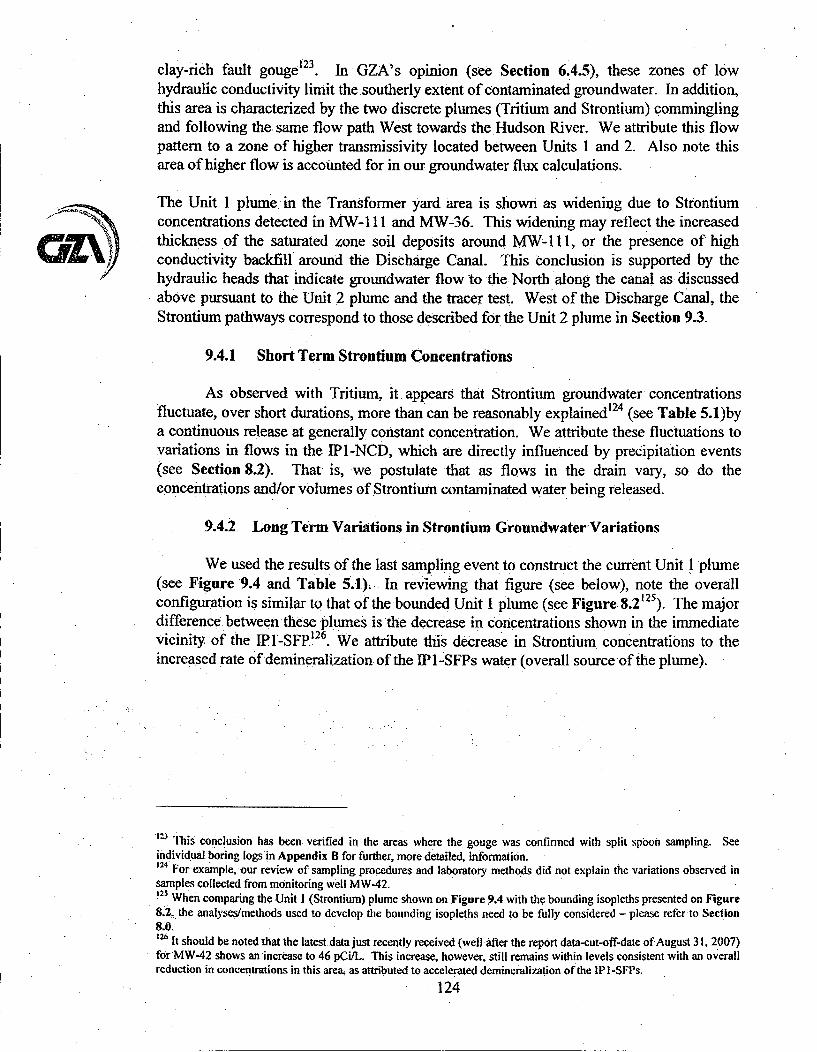
clay-rich fault gouge'23 . In GZA's opinion (see Section 6.4.5), these zones of lowhydraulic conductivity limit the southerly extent of contaminated groundwater. In addition,this area is characterized by the two discrete plumes (Tritium and Strontium) comminglingand following the same flow path West towards the Hudson River. We attribute this flowpattern to a zone of higher transmissivity located between Units 1 and 2. Also note thisarea of higher flow is accounted for in our groundwater flux calculations.
The Unit 1 plume in the Transformer yard area is shown as widening due to Strontiumconcentrations detected in MW- 111 and MW-36. This widening may reflect the increasedthickness of the saturated zone soil deposits around MW-11l, or the presence of highconductivity backfill around the Discharge Canal. This conclusion is supported by thehydraulic heads that indicate groundwater flow to the North along the canal as discussedabove pursuant to the Unit 2 plume and the tracer test. West of the Discharge Canal, theStrontium pathways correspond to those described for the Unit 2 plume in Section 9.3.
9.4.1 Short Term Strontium Concentrations
As observed with Tritium, it appears that Strontium groundwater concentrationsfluctuate, over short durations, more than can be reasonably explained124 (see Table 5.1)bya continuous release at generally constant concentration. We attribute these fluctuations tovariations in flows in the IP1-NCD, which are directly influenced by precipitation events(see Section 8.2). That is, we postulate that as flows in the drain vary, so do theconcentrations and/or volumes of Strontium contaminated water being released.
9.4.2 Long Term Variations in Strontium Groundwater Variations
We used the results of the last sampling event to construct the current Unit 1 plume(see Figure 9.4 and Table 5.1). In reviewing that figure (see below), note the overallconfiguration is similar to that of the bounded Unit 1 plume (see Figure 8.2121). The majordifference- between these plumes is the decrease in concentrations shown in the immediatevicinity of the IPI-SFP'2 6. We attribute this decrease in Strontium concentrations to theincreased rate of demineralization of the IPI-SFPs water (overall source of the plume).
[' This conclusion has been verified in the areas where the gouge was confirmed with split spoon sampling. Seeindividual, boring logs in Appendix B for further, more detailed, information.12 4 For example, our review of sampling procedures and laboratory methods did not explain the variations observed in
samples collected from monitoring well MW-42.!25 When comparing the Unit I (Strontium) plume shown on Figure.9.4 with the bounding isopleths presented on Figure8.2n the analyses/methods used to develop the bounding isopleths need to be fully considered - please refer to Section8,0.126 It should be noted that the latest data just recently received (well after the report data-cut-off-date of August 31, 2007)for MW-42 shows an increase to 46 pCi/L. This increase, however, still remains within levels consistent with an overallreduction in concentrations in this area, as attributed to accelerated demineralization of the IPI -SFPs.
124
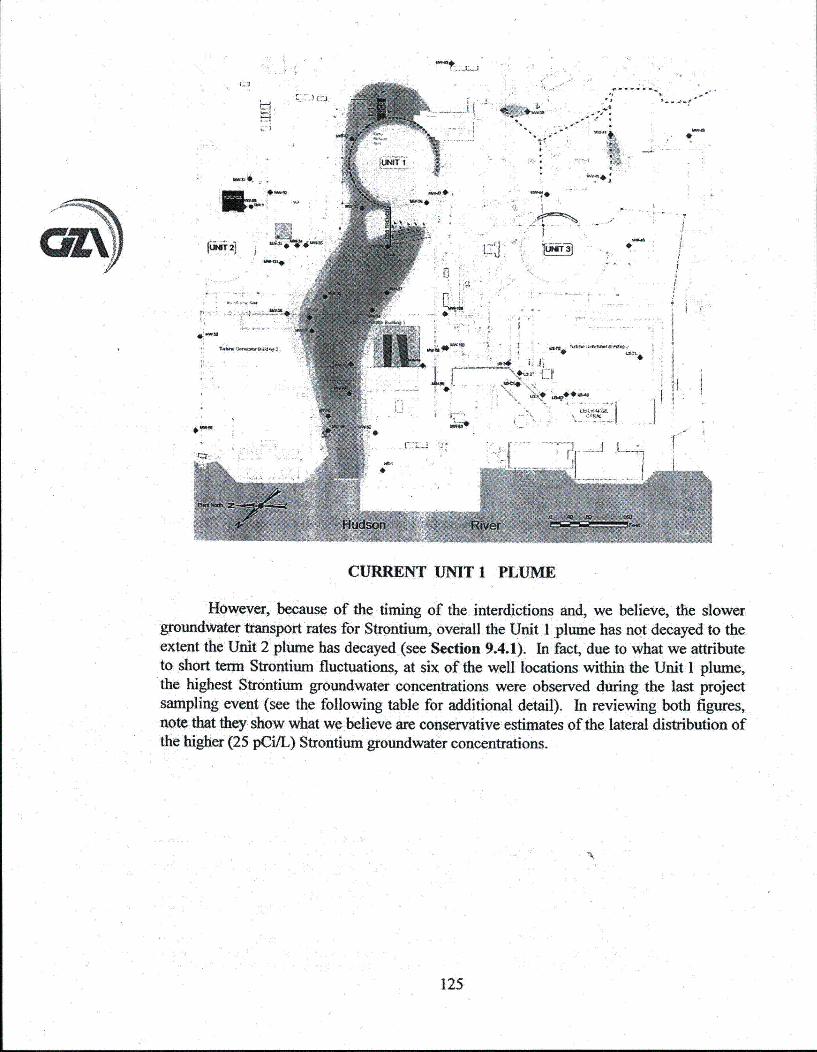
r.3
IrJzX)
7-1
ftWT 2
juNli I
-I
.4
I.-..
t
Lj -,
II*1 I I
I Ymtn afmfl½.m
~ UN ~
- -* ,~ I-ii-.
I
I I '-I'!-
CURRENT UNIT 1 PLUME
However, because of the timing of the interdictions and, we believe, the slowergroundwater transport rates for Strontium, overall the Unit I plume has not decayed to theextent the Unit 2 plume has decayed (see Section 9.4.1). In fact, due to what we attributeto short term Strontium fluctuations, at six of the well locations within the Unit I plume,the highest Strontium groundwater concentrations were observed during the last projectsampling event (see the following table for additional detail). In reviewing both figures,note that they show what we believe are conservative estimates of the lateral distribution ofthe higher (25 pCi/L) Strontium groundwater concentrations.
125
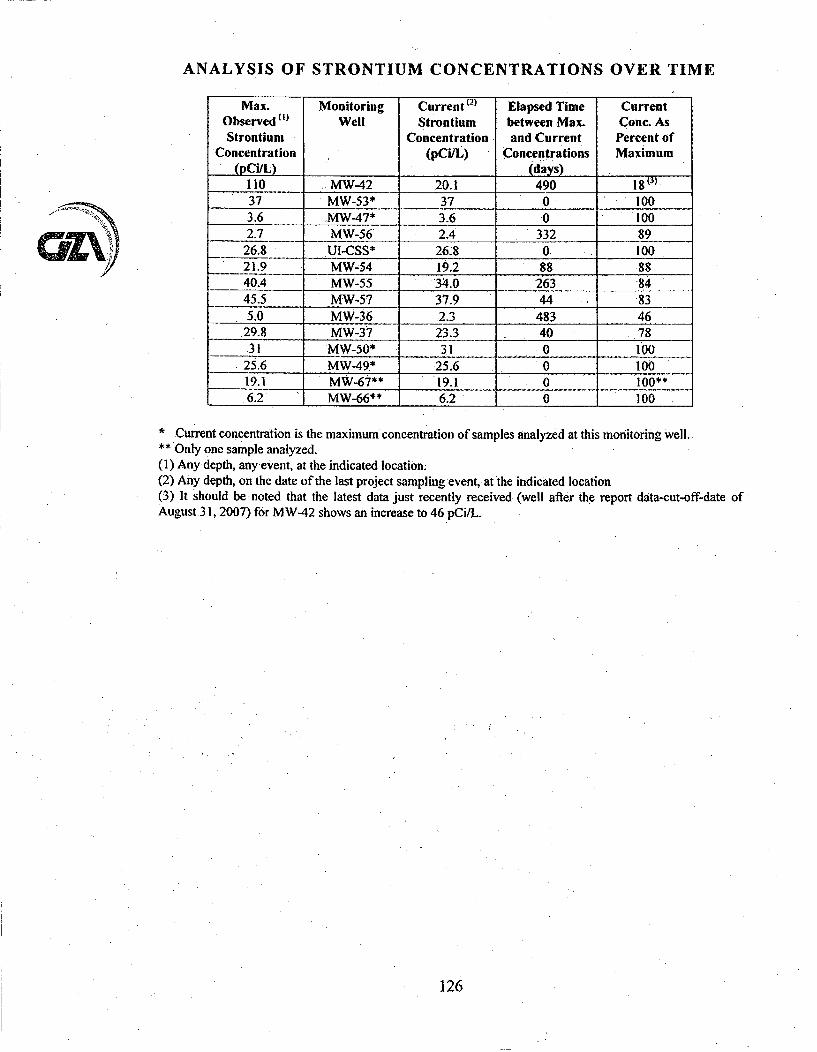
ANALYSIS OF STRONTIUM CONCENTRATIONS OVER TIME
Max. Monitoring Current (2) Elapsed Time CurrentObserved • Well Strontium between Max. Cone. AsStrontium Concentration and Current Percent of
Concentration (pCi/L) Concentrations Maximum(pCi/L) (days)
110 .. MW-42 20.1 490.37 MW-53* 37 0 1003.6 .MW-47* 3.6 .0 1002.7 MW-56 2.4 332 89
26.8 U1-CSS* 26.8 0 10021.9 MW-54 19.2 88 .8840.4 MW-55 34.0 263 8445.5 MW-57 37.9 44 . 835.0 MW-36 2.3 .04.83 .. 46
29.8 MW-37 23.3 .. 40 7831 MW-50* 31 0 100
25.6 MW-49* 25.6 0 10019.1 MW-67** 19.1 0 100**•6.2 MW-66** 6.2 0 100
• Current concentration is the maximum concentration of samples analyzed at this monitoring well..
•* Only one sample analyzed..(1) Any depth, anyevent, at the indicated location.(2) Any depth, on the date of the last project sampling event,. at the indicated location(3.) It should be noted that the latest data just recently received. (well after the report data-cut-off-date ofAugust.3 I, 2007) for MW-42 shows an increase to 46 pCi/L.
126
10.0 FINDINGS AND CONCLUSIONS
At no time have analyses of existing Site conditions yielded any indication of potentialadverse environmental or health risk, as assessed by Entergy as well as the principalregulatory authorities. In fact, radiological assessments have consistently shown that thereleases to the environment are a small percentage of regulatory limits, and no threat topublic health or safety. In this regard, it is also important to note that the groundwater isnot used as a source of drinking water on or near the Site.
Consistent with the purpose of the investigations, we have developed six major supportingconclusions which are described in the following subsections. Based on our findings andconclusions, we are recommending completion of source interdiction measures withMonitored Natural Attenuation as the preferred remedial measure. Refer to Section 11.0for more information, including our reasons for making this recommendation.
10.1 NATURE AND EXTENT OF CONTAMINANT MIGRATION
The primary groundwater radiological contaminants of interest are Tritium and Strontium.Other :contaminants (Cesium-137, Nickel-63 and Cobalt-60) have been detected, but arelimited to areas that have groundwater pathways dominated by Tritium and/or Strontium,and are accounted for in Entergy's dose calculations.
Groundwater contamination is limited to Indian Point's property and is not migratingoff-property to the North, East or South. The contamination migrates with the Site
.groundwater from areas of higher heads to areas of lower heads along paths of leastresistance, and ultimately discharges to the Hudson River to the West. This is supported bythe bedrock geology, multi-level groundwater elevation data and the radiological resultsfrom analytical testing. The nearest drinking water reservoirs are located at distances andelevations which preclude impacts from contaminated groundwater from the Site and thereis no nearby use of groundwater.
a. The Site is located over a portion of the aquifer basin where Site-wide ambientgroundwater flow patterns, both shallow and deep, have been defined. These flowsare towards the Site from higher elevations to the North, East and South.Groundwater flow on Site enters the Hudson River through: footing drains (whichdischarge to the Discharge Canal); the Discharge Canal; the storm drain system; ordirect discharge. The results of over two years of investigations demonstrate thatthe off-Site groundwater migration to the South, as originally hypothesized byothers prior to these investigations, is not occurring.
b. Surface water samples collected from the Algonquin Creek, the Trap Rock Quarryand from the drinking water reservoirs do not exhibit impacts from the Site.
c. The Hudson River is the regional groundwater sink for the area. We found no Sitedata, published information, or other reasons suggesting that groundwater wouldmigrate beneath the river. To the contrary, based on the area's hydrogeologic settingand all available information, we are confident that groundwater beneath the Sitedischarges to the river.
127
1/
d. Because of the hydraulic properties of the bedrock, the bedrock aquifer on-Site willnot support large yields, or accept input of large volumes of water.
e. There are no identified off-Site uses of groundwater (extraction or injection)proximate to the Site that influence groundwater flow patterns on the Site.Furthermore, we have no reason to believe that potable or irrigation wells will beinstalled on or near the Site in the reasonably foreseeable future, in part becausemunicipal water is available in the area.
f. Groundwater flow at the Site occurs in two distinct hydraulic regimes that arevertically connected, bedrock and overburden soils. Most of the groundwater flowand contaminants are found in the bedrock fractures. No evidence of large scalesolution features exist in the rock cores obtained from any of the bedrock boringsadvanced at the Site; i.e., no open voids such as tunnels, caverns, caves, etc.,sometimes referred to as "underground rivers," were found. Our on-Siteinvestigatory findings are consistent with that expected for the Inwood Marble.Therefore, this work eliminates from concern solution feature flow associated withkarst systems. The second regime is groundwater flow in the unconsolidated soildeposits. This includes groundwater found in native glacial and alluvial deposits,as well as groundwater flow in anthropogenic structures such as blast rock fill andutility trenches. These flow paths, while potentially complicating migrationpatterns, all terminate at the Hudson River.
g. While groundwater movement in the bedrock is controlled by fracture patterns, thehigh degree of fracturing allows groundwater flow to be effectively represented andmodeled on a Site-wide scale using the well developed techniques derived forporous media'27.
10.2 SOURCES OF CONTAMINATION
The investigations identified two sources of radiological contamination. The IPI -SFPs andthe IP2-SFP/Transfer Canal. The IPI-SFPs are the primary source of Strontiumgroundwater contamination, while the IP2-SFP is the primary source of Tritiumgroundwater contamination. No evidence of releases from Unit 3 have been identifiedduring this investigation.
During the course of GZA's and Entergy's investigations, we have identified the sources ofleakage associated with the IP2-SFP and Transfer Canal. These sources have beeneliminated and/or controlled by Entergy. Specifically, Entergy has: 1) confirmed that thedamage to the liner associated with the 1992 release was repaired by the prior owner and isno longer leaking; 2) installed a containment system (collection box) at the site of theleakage discovered in 2005, which precludes further release to the groundwater; and 3)identified a weld imperfection in the Transfer Canal liner that, once identified, wasprevented from leaking further by draining the Transfer Canal. This weld imperfection wasthen subsequently repaired by Entergy (completed in mid December 07). Therefore, allidentified leaks have been addressed. Water likely remains between the IP2-SFP stainless
127 While fracture-specific numerical models exist, they are less Well developed and less flexible than porous media-based
models. The use of a porous media representation requires some level of approximation, particularly on small scales oftens of feet. However, the fracture flow models also require substantial approximations based on fracture statistics andare thus, more problematic at this Site than a porous model.
128
steel liner and the concrete walls, and thus additional active leaks can not be completelyruled out. However, if they exist. at all, the data128 indicate they must be very small and oflittle impact to the groundwater.
Our investigations also identified the source of all the Strontium contamination detected ingroundwater beneath the Site as coming from the Unit I Fuel Pool Complex (IPl-SFPs).The IPI-SFPs were identified by the prior owner as leaking in the mid-1990's. All of thepools have been drained by Entergy except the West Pool, which currently contains the last160 Unit I fuel assemblies remaining from prior plant operations. This plant was retiredfrom service in 1974. Following detection of radionuclides associated with IP1-SFPs inthe groundwater, Entergy, as part of their already planned fuel rod removal and completepool drainage program, accelerated efforts to further reduce activity in the IPl-SFPsthrough demineralization..
The on-Site tracer test demonstrated that aqueous releases in the vicinity of lP2-SFP arestored above the water table in either: 1) unsaturated zone dead-end fractures; and/or2) anthropogenic foundation details such as blast-rock backfill over a mud-mat(see Section 8.1.2). Thisimpacted unsaturated zone water is then periodically released tothe groundwater over time as driven, for example, by infiltration of precipitation.Consequently, subsequent releases to the groundwater can continue for significantdurations after the initial leak has been terminated. In addition, the tracer studies furtherdemonstrate that the migration rates for the Tritium plume in the groundwater can beslowed down as compared to the groundwater itself. This reduction in Tritium plumemigration velocity occurs when impacted groundwater encounters, and becomes"entrapped" by dead-end fractures, both naturally occurring fractures and those created byexcavation blasting during Site construction 129.
The radionuclides identified in the Unit 3 area are related to historic legacy leakage fromIPI, and reflect what remains of the plume that has been naturally attenuating sinceapproximately 1994. The pathway to the Unit 3 area was via the IPl -SFDS and then to thestorm drain system which transverses along the southeastern portion of the Site; not viagroundwater flow to the South (see Section 8.2). Exfiltration from this storm drain systemhad, in turn, resulted in contamination of the groundwater along the storm drain piping.The Sphere Foundation Drain Sump no longer discharges to the storm drain system and.this legacy release pathway had therefore been terminated because the associated pipingwas capped in 1994.
128 These data include: monitored water levels in the SFP, with variations accounted for based on refilling and
evaporation volumes: the mass of Tritium migrating with groundwater is small: and the age of the water in the interstitialspace.12" Once contaminants enter dead-end fractures, they no longer migrate with the groundwater flow. However, this"entrapped contamination" does re-enter the flow regime over time due to turbulent flow.mixing at the fracture openingas well as diffusion.
129
10.3 GROUNDWATER CONTAMINANT TRANSPORT
fl t
Based on our assessment of the bedrock's hydraulic properties, the area's hydrogeologicsetting, the properties of the contaminants, the age of the releases, interdictions made toeliminate or reduce release rates, and the distances between the source areas and theHudson River, we believe the groundwater contaminant plumes have expanded to theirmaximum extent and are now decreasing in size. In this regard, the Unit 2 Tritium plumeis decreasing faster than the Unit I Strontium plume, as anticipated. These conclusions arebased on the data. available which, given the aggressiveness with which Entergyimplemented the investigations, is compressed in duration' .3 Therefore, ultimateconfirmation of these conclusions will require monitoring over a number of years to allowranges in seasonal variation to be adequately reflected in the monitoring data. During longterm monitoring, GZA further anticipates that contaminant concentrations in individualmonitoring wells will fluctuate over time (increasing at times as well as decreasing, aspotentially related to precipitation events), and that a future short term increase inconcentrations does not, in and of itself, indicate a new leak. In addition, it is alsoexpected that some areas within the plumes will exhibit faster decay rates than others.Both behaviors are commonly observed throughout the industry with groundwatercontamination sampling and analyses, and therefore, conclusions pursuant to plumebehavior must be evaluated in the context of all of the Site-wide monitoring data. Overall,however, GZA believes that the continuing monitoring will demonstrate decreasing longterm trends in groundwater contaminant concentrations over time given the sourceinterdictions completed by Entergy. It is also further emphasized. that. even the upperbound Tritium and Strontium groundwater concentration isopleths presented on Figures8.1 and 8.2 result in releases to the river which are only a small percentage of theregulatory limits, which are of no threat to public health.
a. The major groundwater transport mechanism is advection. Sorption retards themigration of radiological contaminants other than Tritium relative to groundwateradvection rates, while Tritium, within hydraulically interconnected fractures, canmigrate at rates that approach the groundwater seepage velocity.
b. The Unit 2 contaminant plume is characterized by Tritium in the groundwater.Over the last two years, the highest Tritium concentrations in the Unit 2 plume havedecreased (see Table 5.1 and Figures 8.1 and 9.3). However, the center of mass of-theUnit 2 plume isnot rapidly migrating downgradient, and remains in proximity
to the IP2-SFP. While a small active leak can not be ruled out completely, thisbehavior is also consistent with the identified role of unsaturated zone (above thewater table) storage of historic releases, with precipitation-induced infusion of thisentrapped water into the groundwater regime over time.
c. The Unit I contaminant plume is primarily characterized by Strontiumconcentrations in the groundwater, though near the physical pool area otherisotopes are present as expected due to proximity. Over the last two years, thehighest Strontium concentrations in the Unit I plume have decreased (Table 5.1).These decreases in concentration are consistent with a reduction in Strontium
130 It is noted that a number of key monitoring installations have only recently been completed. and monitoring roundsspanning multiple seasons are not yet available.
130
PINE
concentrations in the Unit 1 West Fuel Pool via pool water recirculation throughdemineralization beds. While the physical leak(s) in this fuel pool still exist, thesource term to the groundwater has been reduced through reduction in thecontaminant concentrations in the leak water. It is noted, however, the Unit 1Strontium decreases are more modest and are generally more limited to theimmediate source area than that observed for Tritium at Unit 2. The slower rate ofplume decay is not unanticipated give the adsorption properties of Strontium.Further planned interdictions include removal, of the fuel rods and draining of thepool water, which will permanently eliminate the West Fuel Pool as well as theentire IPI-SFP complex as a source of contamination to the groundwater. With.elimination of this source, natural attenuation will reduce Strontium concentrationsin the Unit I plume over time.
10.4 GROUNDWATER MASS FLUX CALCULATIONS
During the project (over the past two years), as testing progressed and more informationbecame available, we refined methods to calculate the groundwater flux and associatedradiological activity to the Hudson River. As described below, we have developed aprocedure which is scientifically sound, relatively straight-forward, and appropriatelyconservative. Groundwater flow rates are provided to Entergy, who computes theradiological dose impact.
a. Migration of radionuclides to the river is computed based on groundwater flowrates, in combination with contaminant concentrations within the flow regime,This information is then used in surface water models to compute radiologicalcontaminant concentrations in the river and thus potential dose to receptors.
b. To assess the validity of the precipitation mass balance method used to date forcomputing groundwater flux across the Site, GZA also performed groundwater fluxcomputations using an independent method based on Darcy's Law. Thus, theresults from two widely accepted groundwater flow calculation methods werecompared against each other. The first, the precipitation mass balance method, is a"top-down" procedure based on precipitation-driven water balance analyses. Thesecond, based on Darcy's Law, is a "bottom-up" method using hydraulicconductivity and flow gradient measurements. These two methods resulted inestimated groundwater flow values which were in agreement, providing a highdeqree of confidence in the 'values obtained relative to their impact on subsequentdose computations and risk analyses.
c. The original groundwater flux. computations were developed for two separate areasof the Site. The northernmost area included both the Unit 2 and Unit 1 plumes.The southernmost area encompassed Unit 3. This bifurcation of the Site. wasestablished given•: 1) the co-location of the Unit 2 plume and the Unit 1 plume nearthe western boundary of the Site just upgradient of the river; 2) the much lowercontaminant concentrations in the Unit 3 area; and 3) the amount of data availableat that time.. Current data, derived from a greater number of groundwater elevationand sampling points than reflected in earlier data, show the Site can be divided intosix separate areas. The computations were further separated into shallow and deepflow regimes given: 1) the generally higher hydraulic conductivity in the shallow
131
rzX)
portion of the bedrock, and 2) the generally more elevated contaminantconcentrations in the shallow flow regime.
d. The groundwater contaminant concentrations used for the radiological dosecomputations were obtained primarily from the analysis of samples taken from therecently completed multi-level wells specifically installed for this purpose.These wells are located downgradient of the Unit 2 and Unit ! infrastructure'31 andare positioned within the plumes and just upgradient of where the groundwaterdischarges to the river and Discharge Canal. The multi-level nature of these wellsallows the groundwater to be sampled over at least five separate elevations in thebedrock, in addition to the overburden layer above. Sampling zones specificallytargeted the most pervious depths within the bedrock boreholes. As such, thegroundwater samples encompass the full depth of the contaminant plume, from theupper soil zones to depths where the contaminant concentrations have fallen off toinsignificant levels. The high number of samples over the depth of the plumeprovides a higher degree of confidence that the significant flow zones are accountedfor. The high number of vertical sampling zones also provides a higher level ofredundancy relative to the longevity and efficacy of the monitoring network overtime.
10.5 GROUNDWATER MONITORING
The current groundwater well and footing drain monitoring network is consistent with theobjectives of the NEI Groundwater Protection Initiative 32 . Wells have been installed andare currently being monitored to both detect and characterize current and potential futuregroundwater contaminant migration to the river, as well as, in concert with specific footingdrain monitoring, provide earlier detection of potential future leaks associated with theexisting infrastructure.
a. The network of 59 monitoring well locations and over 140 samplingintervals/locations, has allowed us to identify groundwater flow patterns. A subsetof this network will provide an adequate long term monitoring system.
b. Existing and potential sources have been identified, and monitoring is in place toboth evaluate current conditions and identify future releases, should they occur.
c. The nature and extent of contamination is known and reporting requirements are inplace.
10.6 COMPLETENESS
Investigations at the Site have been broad, comprehensive, and rigorous.Major components, of the field studies include: detailed acquisition of geologicinformation; automated long duration collection of piezometric data; vigorous source area
'3 The multi.level sampling network is concentrated in the Unit 2 and Unit I areas given that this is where contaminantconcentrations are by far the highest. The individual monitoring wells located downgradient of Unit 3 are judgedsufficient for. computations in this area given the low contaminant concentrations measured, even in the typically morecontaminated shallow flow regime.132 NEI developed a set of procedures/goals for nuclear plants to assess the potential for releases of radionuclides topotentially migrate off-Site.
132
- ~
cz)p
identification; comprehensive aquifer property testing, including performance of a fuillscale Pumping Test; and large-scale confirmatory contaminant transport testing, in theform of an extensive tracer test. The results of this systematic testing program are inagreement with conditions anticipated by our Conceptual Site Model. Based on our reviewof findings, we have concluded that the field studies conducted at the Site have addressedthe study objectives.
a. There is no need to monitor groundwater at off-Site locations. The density andspacing of on-Site monitoring wells is adequate to: 1) demonstrate thatcontaminated groundwater is migrating to the Hudson River to the West, and notmigrating off of the property to the North, East or South; 2) monitor the anticipatedattenuation of contaminant, concentrations; 3) identify future releases, should theyoccur; and 4) provide the data required to compute radiological dose impact.
b. Hydraulic conductivity is the most important aquifer property. We have completedmore than 245 hydraulic conductivity tests, including a full-scale Pumping Test.Therefore, we believe no future aquifer testing is required. In addition, thecontaminant plumes havereached their maximum spatial extent. Therefore, there isno need for contaminant transport modeling.
c. The sources of releases to the groundwater have been identified. In addition tomonitoring, actions have been taken to reduce or eliminate these releases.Therefore, we believe no future source characterization is required.
d. All information indicates Monitored Natural Attenuation is the appropriateremedial response and is GZA's recommended approach (see Section 11.0).The existing monitoring network will serve this remedial approach. Therefore, nodesign phase studies are required.
133


