Embed Size (px)
Citation preview
11th ICID International Drainage Workshop on Agricultural Drainage Needs and Future Priorities C,
September 23 - 27, 2012, Cairo, Egypt
1 | P a g e
Hydraulic Conveyance & Performance of Circular Perforated Collectors
El-Gamal, M., H. El-Sayed & A. Wagdy
Irrigation and Hydraulics Department, Faculty of Engineering, Cairo University
Abstract: Field subsurface laterals are usually designed based on the ratio of area of perforations to total surface
area and Empirical formulae to determine the distance between laterals. Several controlling factors are usually
ignored including: pipe length, ratio of area of perforations to cross sectional area, hole diameter, optimal
perforation ratio. This research studied the effect of previously ignored governing parameters on drainage
performance and hydraulic conveyance for perforated subsurface drains. Physical Model is constructed at the
hydraulics laboratory of Irrigation & Hydraulic Department to investigate different flow regimes, actual flow
patterns, and the effects of previously identified parameters. The measured data is used to determine ;(i) the
optimum ratio of area of perforations that is recommended for the design ,(ii) hole capacity along the drain pipe
length,(iii) and Establish design curves that help in setting up the boundary conditions of the future numerical
models. The results indicated that The Normalized Holes Total Area (NHTAR) ratio is the most relevant design
parameter that governs the conveyance in the perforated pipe and the drainage performance. Moreover, traditional
design equations have to be adjusted to account for the effect of non-uniformity of inflow, to the full flowing drain,
along its longitudinal direction. The former effect is more pronounced for soils with high hydraulic conductivity.
Introduction
Clay and concrete drain pipes have been used for many years in subsurface drainage until smooth plastic drainage
pipes are used in 1960. Corrugated plastic drain pipes became available in 1963. Despite that corrugated pipes
successfully replaced concrete and clay pipes all over the world but these pipes are still used in some counties.
Un-perforated pipes could be generally considered as hydraulically smooth. To some external, similar roughness
behaviour exists for perforated pipes that are made of ceramic or cement and they are consider as “Technically
smooth”. On the contrary, corrugated pipes are characterized by its high roughness ratio and therefore they classified
as “hydraulically rough”.
The capacity of corrugated lateral is calculated by Manning formula and the resistance of the pipe is determine by
Boumans (1988). The resistance depends on the inner diameter of pipe and spacing between corrugations. On the
other hand the capacity of smooth lateral is calculated by Darcy-Weissbach eequation and the coefficient of friction
is calculated from Blasuis power equation or Nikuradse logarithmic formula.
The capacity of smooth pipe and corrugated pipe are calculated by other formula by Wesseling 1969 as a function
of pipe diameter and slope of hydraulic gradient as shown in equation 1, equation 2, and equation 3. The calculated
discharge from Wesseling formula is assumed that the drainage inflow is constant along the length of pipe.
11th ICID International Drainage Workshop on Agricultural Drainage Needs and Future Priorities C,
September 23 - 27, 2012, Cairo, Egypt
2 | P a g e
Q=89Dp2.714Se
0.571 (Smooth Pipe) (1)
Q=38Dp2.667Se
0.5 (Corrugated pipe, Dp<200mm) (2)
Q=27Dp2.667Se
0.5 (Corrugated pipe, Dp<200mm) (3)
Field subsurface laterals are usually designed based on the ratio of area of perforations to total pipe surface area.
Empirical formulas are applied to determine the distance between laterals. Several controlling factors are usually
considered including: pipe length, ratio of area of perforations to cross sectional area, and hole diameter. These
factors will be investigated to provide for reliable design. The objective of this study is to quantify the effects of
previously considered governing parameters on drainage performance and hydraulic conveyance for perforated
subsurface laterals (referred to in the title as collectors), Investigation of scale effect, and establish design curves that
help in setting up the boundary conditions of the future proposed numerical models. Two Physical Models are
constructed at the hydraulics lab of irrigation & hydraulic department for testing different collector pipe length,
different hole diameter, different perforation pattern, different static head, and different soil type.
Physical Models
Two Physical Models are constructed at the hydraulics lab of irrigation & hydraulic department for testing different
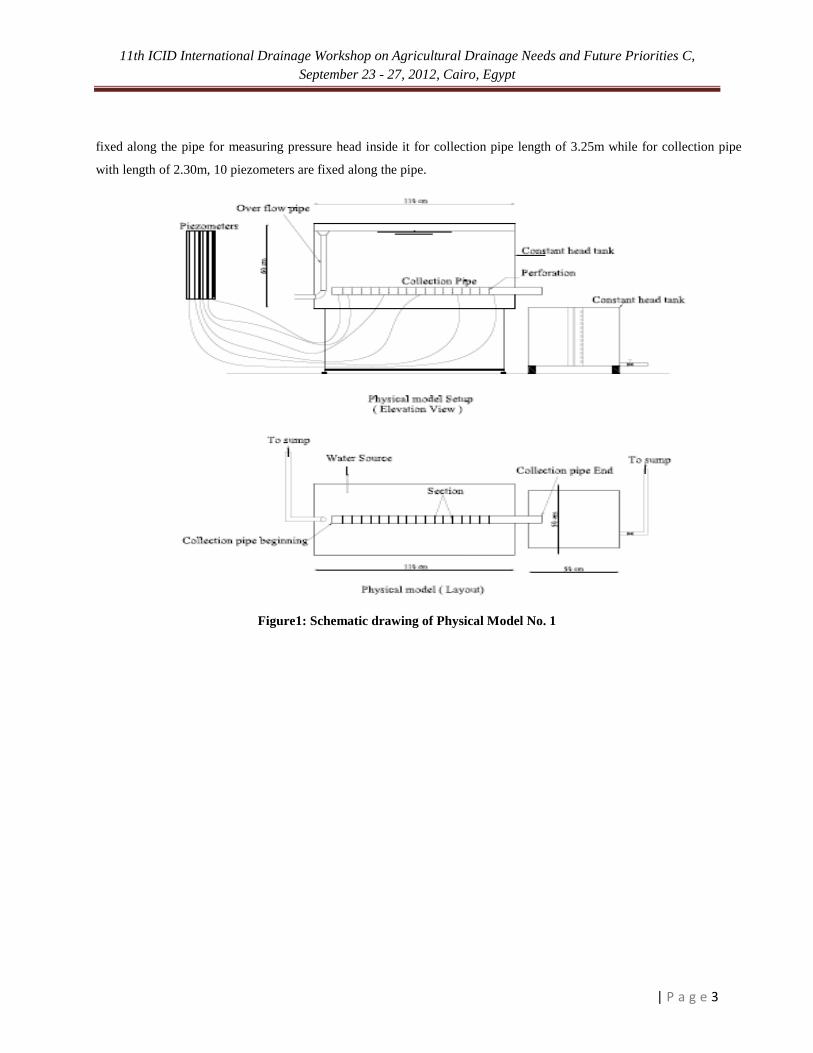
collector pipe length. The Physical Model No.1 is used to test the collector pipe with length 1.15m whereas the physical
Model No.2 is used to test collection pipe with length 3.25m and 2.30m. The main components of Physical Model No 1
are a constant head glass tank, a perforated pipe, and a collection tank for measuring the pipe discharge. The constant
head tank is 1.10 m in length and 0.60 m in height and 0.50 m in width with its bed is laid at 0.6 m above ground level.
Water is supplied to the tank through two pumps which are lifting water from a ground sump and feed the tank through
two different input pipes. The tank is equipped with a multi-level overflow pipe to allow for different constant head
settings. The collection pipe is simulated by a PVC pipe with inner diameter of 5 cm. The collection pipe has a full
length of 1.15 m with a cylinder ratio Lp/Dp of 23. The pipe has one closed end which is submerged under water in the
tank while its other end is a free outlet. Six Piezometer were fixed along the pipe for measuring pressure head inside it
refer to figure 1. In this setup, a group of test is carried out with water only while the other group is with soil into
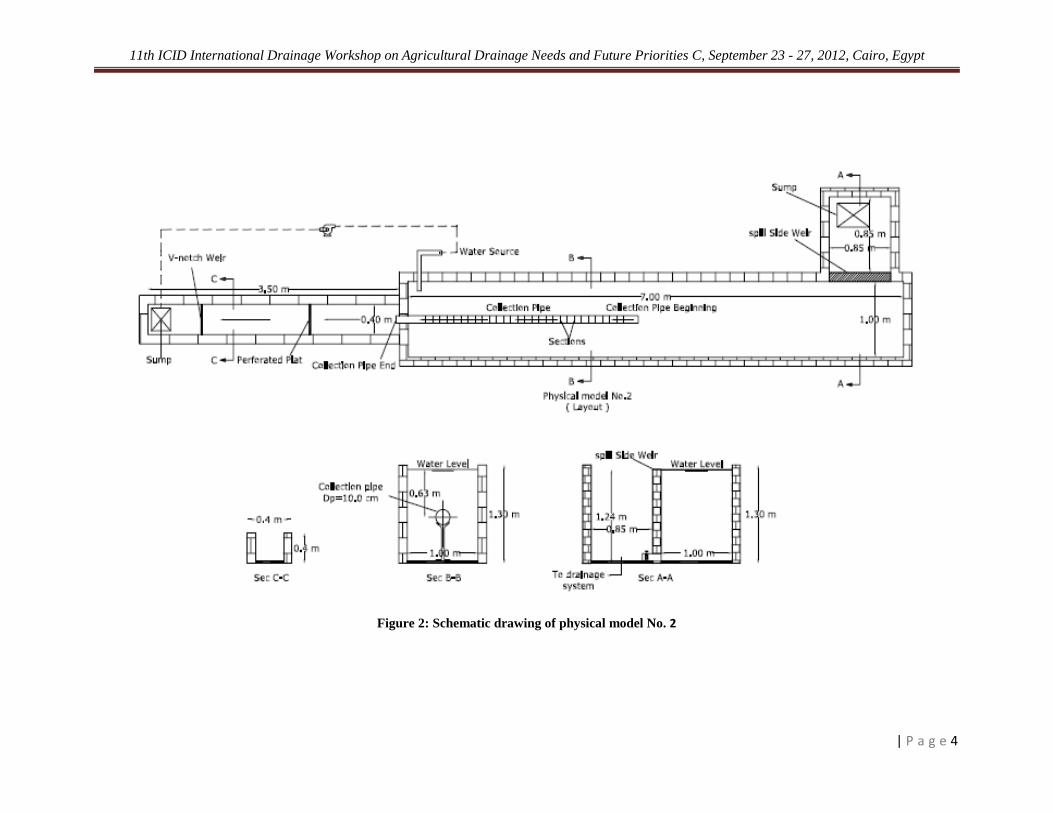
consideration. On the other hand, the main components of Physical Model No 2 are a constant head tank, a perforated
pipe, and V-Notch Weir. The constant head tank is 7.0m in length and 1.30m in height and 1.00m in width. Water is
also supplied to the tank through lifting pumps from a ground sump and feed the tank through two different input pipes
refer to, figure 2. The tank is equipped with side weir to keep a constant water level in the tank. Static head is constant
along the test and is equal to 63 cm. The collection pipe is simulated by a PVC pipe with inner diameter of 10 cm. Two
length of the collection pipe are tested. The first pipe length is 2.30m which has the same cylinder ratio of the collection
pipe which is tested in physical model No. 1 (Cylinder ratio LP/Dp is equal to 23). The second length is 3.25m. The pipe
has one closed end which is submerged under water in the tank while its other end is a free outlet. 16 piezometers are
11th ICID International Drainage Workshop on Agricultural Drainage Needs and Future Priorities C,
September 23 - 27, 2012, Cairo, Egypt
3 | P a g e
fixed along the pipe for measuring pressure head inside it for collection pipe length of 3.25m while for collection pipe
with length of 2.30m, 10 piezometers are fixed along the pipe.
Figure1: Schematic drawing of Physical Model No. 1
11th ICID International Drainage Workshop on Agricultural Drainage Needs and Future Priorities C, September 23 - 27, 2012, Cairo, Egypt
4 | P a g e
Figure 2: Schematic drawing of physical model No. 2
11th ICID International Drainage Workshop on Agricultural Drainage Needs and Future Priorities C, September 23 - 27,
2012, Cairo, Egypt
5 | P a g e
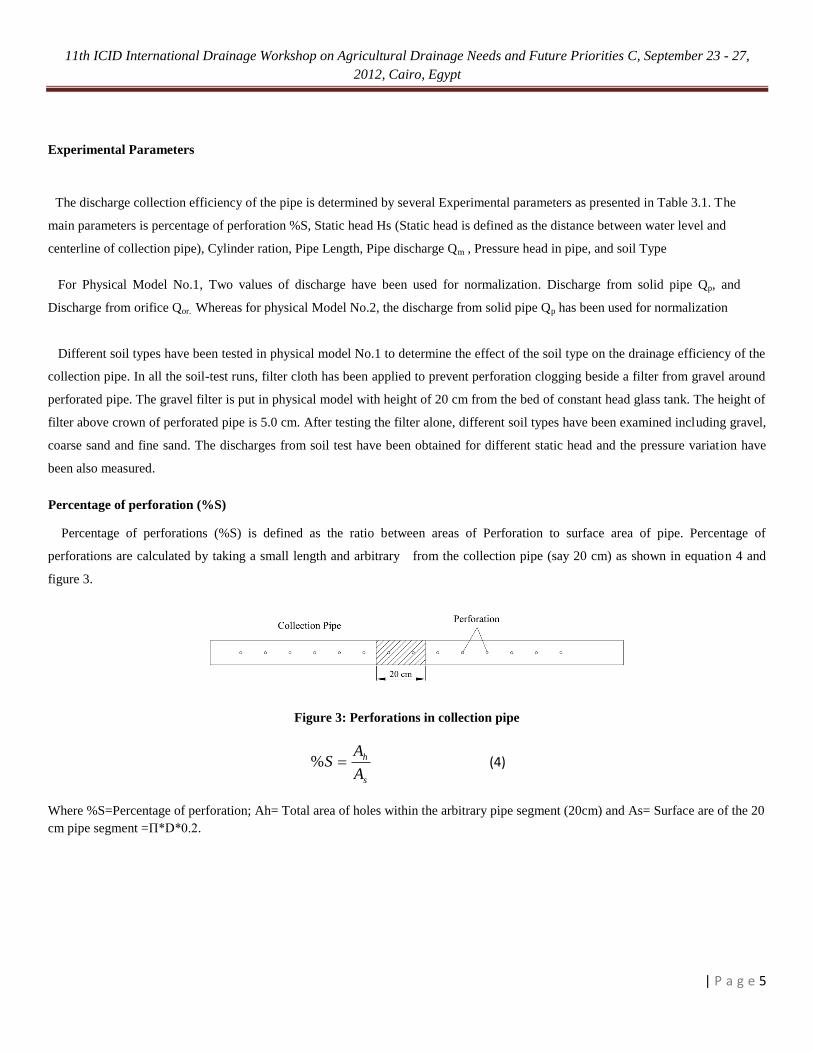
Experimental Parameters
The discharge collection efficiency of the pipe is determined by several Experimental parameters as presented in Table 3.1. The
main parameters is percentage of perforation %S, Static head Hs (Static head is defined as the distance between water level and
centerline of collection pipe), Cylinder ration, Pipe Length, Pipe discharge Qm , Pressure head in pipe, and soil Type
For Physical Model No.1, Two values of discharge have been used for normalization. Discharge from solid pipe Qp, and
Discharge from orifice Qor. Whereas for physical Model No.2, the discharge from solid pipe Qp has been used for normalization
Different soil types have been tested in physical model No.1 to determine the effect of the soil type on the drainage efficiency of the
collection pipe. In all the soil-test runs, filter cloth has been applied to prevent perforation clogging beside a filter from gravel around
perforated pipe. The gravel filter is put in physical model with height of 20 cm from the bed of constant head glass tank. The height of
filter above crown of perforated pipe is 5.0 cm. After testing the filter alone, different soil types have been examined including gravel,
coarse sand and fine sand. The discharges from soil test have been obtained for different static head and the pressure variation have
been also measured.
Percentage of perforation (%S)
Percentage of perforations (%S) is defined as the ratio between areas of Perforation to surface area of pipe. Percentage of
perforations are calculated by taking a small length and arbitrary from the collection pipe (say 20 cm) as shown in equation 4 and
figure 3.
Figure 3: Perforations in collection pipe
s
h
A
AS % (4)
Where %S=Percentage of perforation; Ah= Total area of holes within the arbitrary pipe segment (20cm) and As= Surface are of the 20
cm pipe segment =Π*D*0.2.
11th ICID International Drainage Workshop on Agricultural Drainage Needs and Future Priorities C, September 23 - 27, 2012, Cairo, Egypt
6 | P a g e
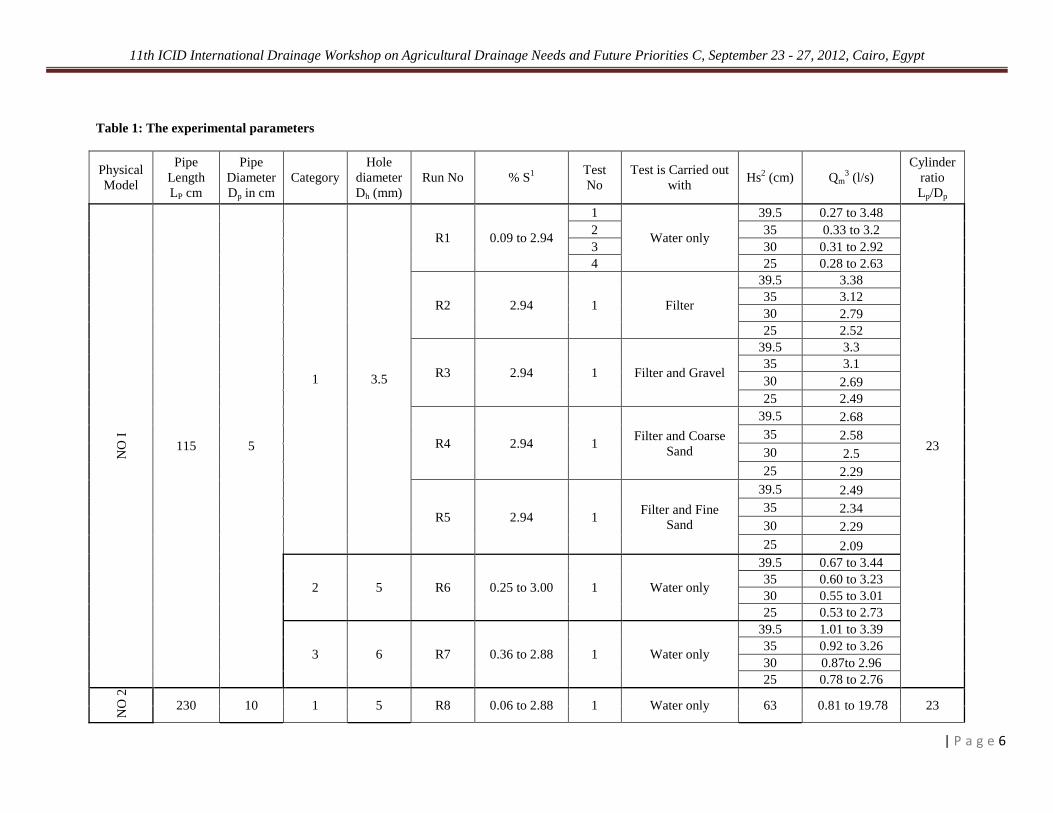
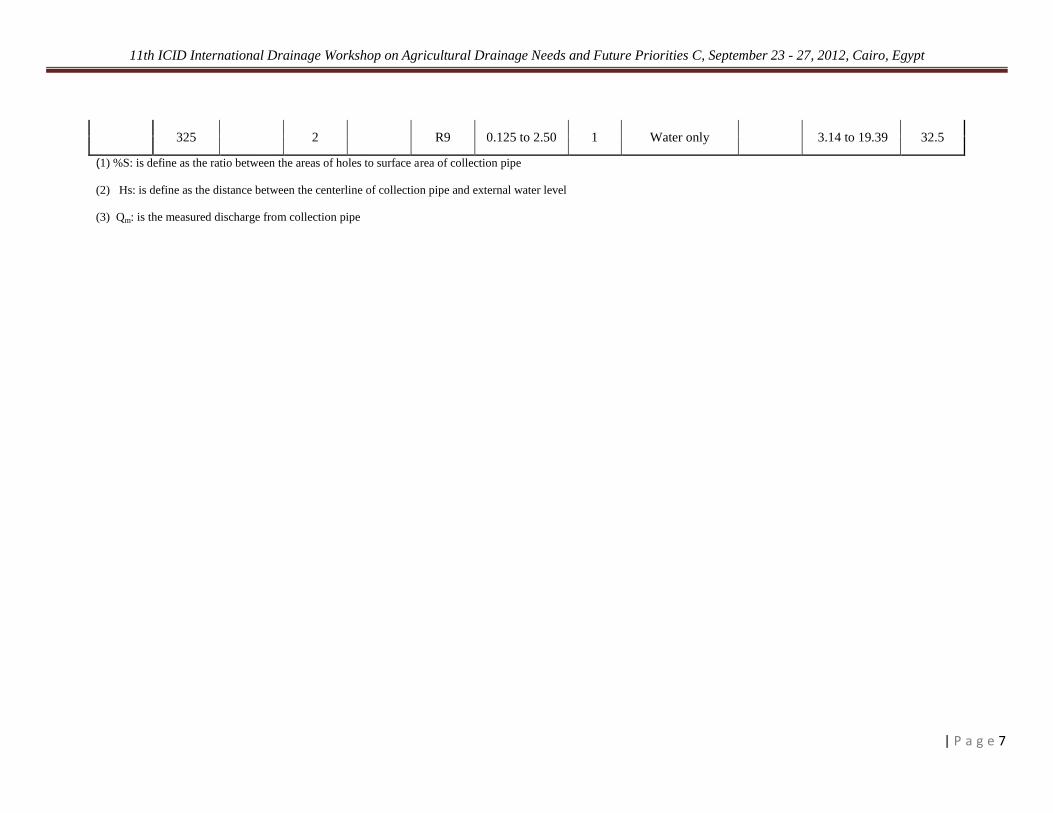
Table 1: The experimental parameters
Physical
Model
Pipe
Length
LP cm
Pipe
Diameter
Dp in cm
Category
Hole
diameter
Dh (mm)
Run No % S1 Test
No
Test is Carried out
with Hs
2 (cm) Qm
3 (l/s)
Cylinder
ratio
Lp/Dp
NO
I
115 5
1 3.5
R1 0.09 to 2.94
1
Water only
39.5 0.27 to 3.48
23
2 35 0.33 to 3.2
3 30 0.31 to 2.92
4 25 0.28 to 2.63
R2 2.94 1 Filter
39.5 3.38
35 3.12
30 2.79
25 2.52
R3 2.94 1 Filter and Gravel
39.5 3.3
35 3.1
30 2.69
25 2.49
R4 2.94 1 Filter and Coarse
Sand
39.5 2.68
35 2.58
30 2.5
25 2.29
R5 2.94 1 Filter and Fine
Sand
39.5 2.49
35 2.34
30 2.29
25 2.09
2 5 R6 0.25 to 3.00 1 Water only
39.5 0.67 to 3.44
35 0.60 to 3.23
30 0.55 to 3.01
25 0.53 to 2.73
3 6 R7 0.36 to 2.88 1 Water only
39.5 1.01 to 3.39
35 0.92 to 3.26
30 0.87to 2.96
25 0.78 to 2.76
NO
2
230 10 1 5 R8 0.06 to 2.88 1 Water only 63 0.81 to 19.78 23
11th ICID International Drainage Workshop on Agricultural Drainage Needs and Future Priorities C, September 23 - 27, 2012, Cairo, Egypt
7 | P a g e
325 2 R9 0.125 to 2.50 1 Water only 3.14 to 19.39 32.5
(1) %S: is define as the ratio between the areas of holes to surface area of collection pipe
(2) Hs: is define as the distance between the centerline of collection pipe and external water level
(3) Qm: is the measured discharge from collection pipe
11th ICID International Drainage Workshop on Agricultural Drainage Needs and Future Priorities C,
September 23 - 27, 2012, Cairo, Egypt
8 | P a g e
Results
Pressure Head Variations
In order to check the capacity of the perforated pipe it is essential to know whether the pipe is running partially
full or it is under pressure. Accordingly, the interior pressure heads along the length of perforated pipe have been
measured based on the experimental setup shown in figure1. It is interesting to note that there is a threshold value of
perforations (%Scr) below which the pipe turns to be partially full and the flow regime in this case is governed by the
gravitational forces. If the perforation percentage exceeds this threshold value, some parts of the pipe (generally near
its end) tend to be totally running full. If the threshold value is significantly exceeded, the full length of the pipe will
be running under pressure with no free surface and the pressure forces become the dominant governing forces.
Measurements have shown that the threshold value of the perforation percentage generally decrease as the applied
external static head increase. Table 2 presents the threshold values of perforation percentage for the case of
perforated pipe length of 1.15m. It should be mentioned that this study focuses mainly on the pressurized flow cases
no further emphasizes will be given to the partially full cases.
Table 2: The threshold values of perforation (%Scr) for different static heads for collection pipe length of
1.15m
Static Head (cm) 39.5 35.0 30.0 25.0
Threshold perforation (%Scr) 0.15 0.15 0.19 0.21
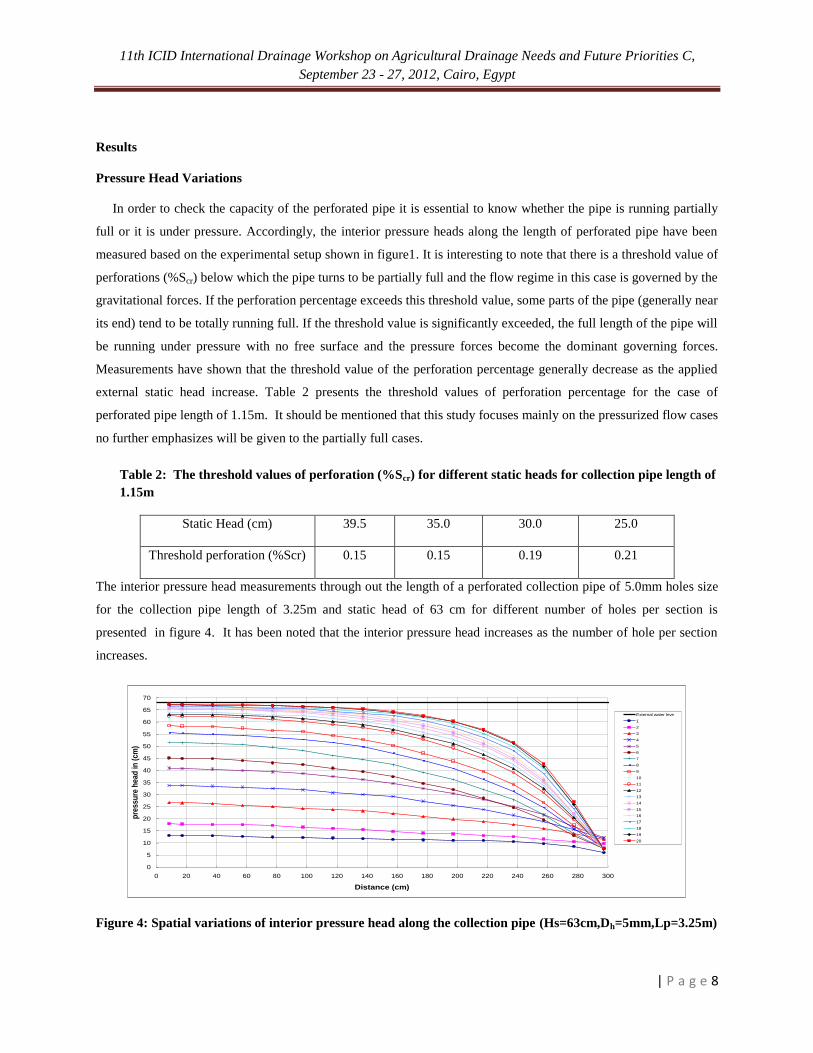
The interior pressure head measurements through out the length of a perforated collection pipe of 5.0mm holes size
for the collection pipe length of 3.25m and static head of 63 cm for different number of holes per section is
presented in figure 4. It has been noted that the interior pressure head increases as the number of hole per section
increases.
0
5
10
15
20
25
30
35
40
45
50
55
60
65
70
0 20 40 60 80 100 120 140 160 180 200 220 240 260 280 300
Distance (cm)
pre
ss
ure
he
ad
in (
cm
)
External water leve
1
2
3
4
5
6
7
8
9
10
11
12
13
14
15
16
17
18
19
20
Figure 4: Spatial variations of interior pressure head along the collection pipe (Hs=63cm,Dh=5mm,Lp=3.25m)
11th ICID International Drainage Workshop on Agricultural Drainage Needs and Future Priorities C,
September 23 - 27, 2012, Cairo, Egypt
9 | P a g e
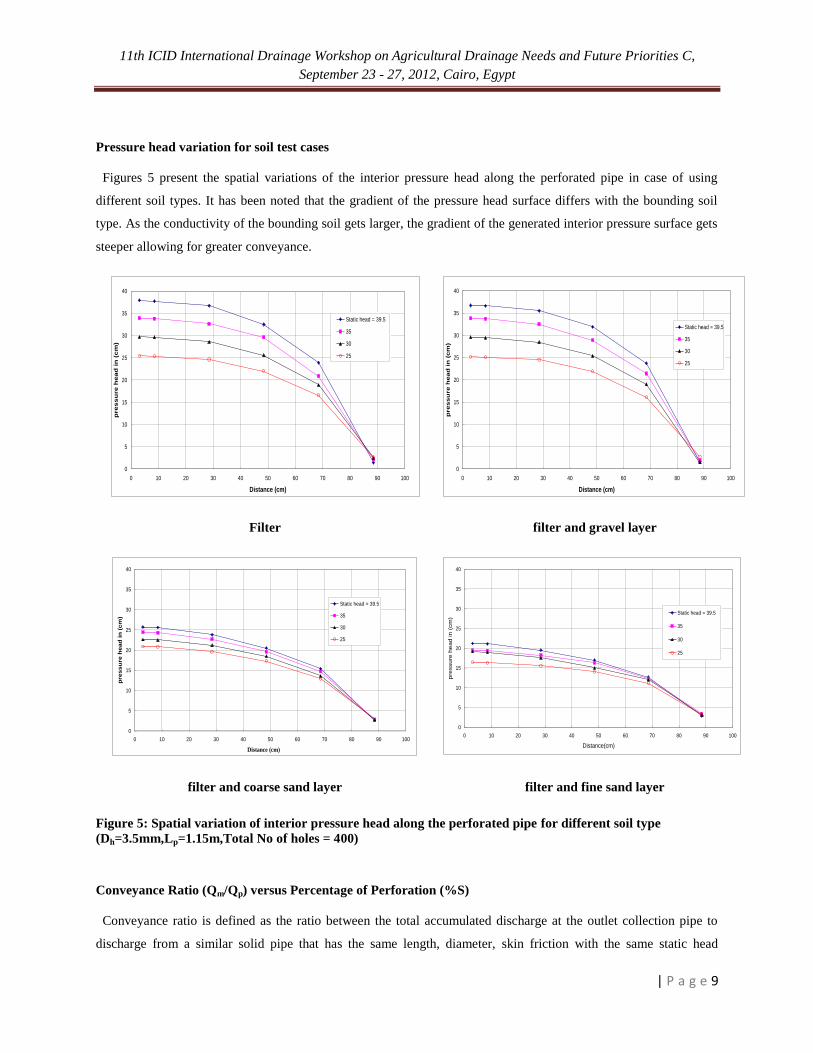
Pressure head variation for soil test cases
Figures 5 present the spatial variations of the interior pressure head along the perforated pipe in case of using
different soil types. It has been noted that the gradient of the pressure head surface differs with the bounding soil
type. As the conductivity of the bounding soil gets larger, the gradient of the generated interior pressure surface gets
steeper allowing for greater conveyance.
0
5
10
15
20
25
30
35
40
0 10 20 30 40 50 60 70 80 90 100
Distance (cm)
pre
ss
ure
hea
d in
(c
m)
Static head = 39.5
35
30
25
0
5
10
15
20
25
30
35
40
0 10 20 30 40 50 60 70 80 90 100
Distance (cm)
pressu
re h
ead
in
(cm
)
Static head = 39.5
35
30
25
Filter filter and gravel layer
0
5
10
15
20
25
30
35
40
0 10 20 30 40 50 60 70 80 90 100
Distance (cm)
pre
ssu
re h
ead
in
(cm
)
Static head = 39.5
35
30
25
0
5
10
15
20
25
30
35
40
0 10 20 30 40 50 60 70 80 90 100
Distance(cm)
pre
ssure
head in (
cm
)
Static head = 39.5
35
30
25
filter and coarse sand layer filter and fine sand layer
Figure 5: Spatial variation of interior pressure head along the perforated pipe for different soil type
(Dh=3.5mm,Lp=1.15m,Total No of holes = 400)
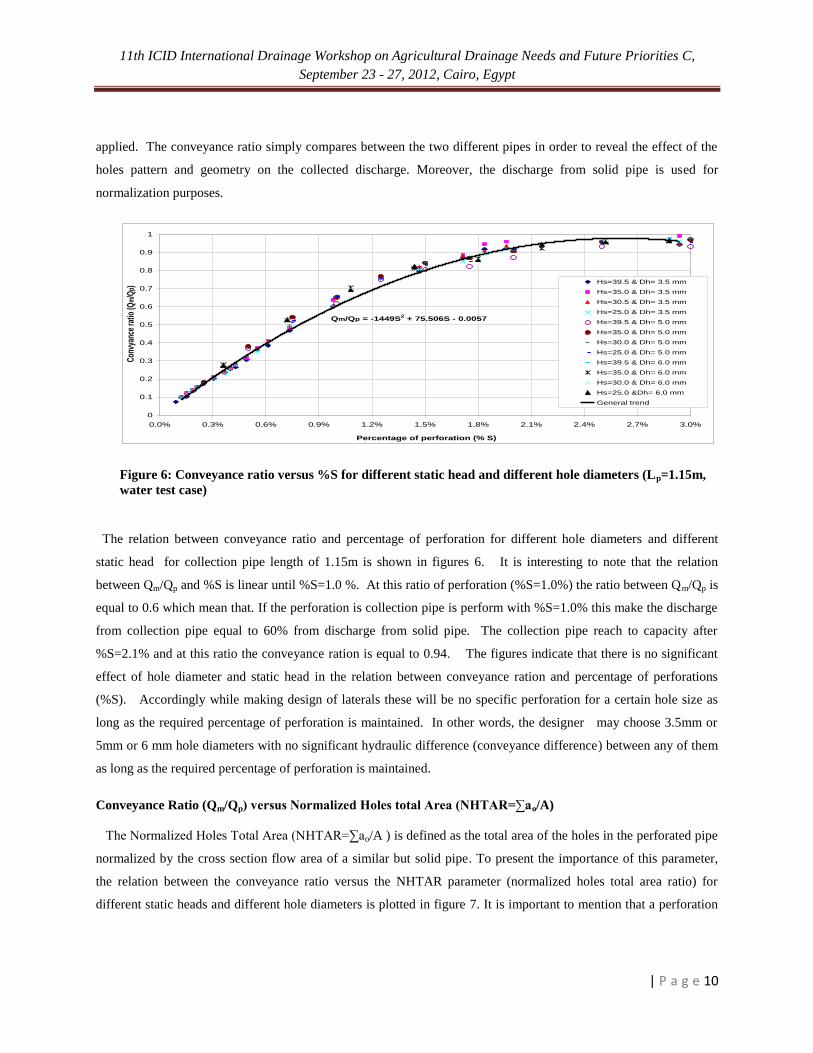
Conveyance Ratio (Qm/Qp) versus Percentage of Perforation (%S)
Conveyance ratio is defined as the ratio between the total accumulated discharge at the outlet collection pipe to
discharge from a similar solid pipe that has the same length, diameter, skin friction with the same static head
11th ICID International Drainage Workshop on Agricultural Drainage Needs and Future Priorities C,
September 23 - 27, 2012, Cairo, Egypt
11 | P a g e
applied. The conveyance ratio simply compares between the two different pipes in order to reveal the effect of the
holes pattern and geometry on the collected discharge. Moreover, the discharge from solid pipe is used for
normalization purposes.
Qm/Qp = -1449S2 + 75.506S - 0.0057
0
0.1
0.2
0.3
0.4
0.5
0.6
0.7
0.8
0.9
1
0.0% 0.3% 0.6% 0.9% 1.2% 1.5% 1.8% 2.1% 2.4% 2.7% 3.0%
Percentage of perforation (% S)
Con
vyan
ce ra
tio (Q
m/Q
p)
Hs=39.5 & Dh= 3.5 mm
Hs=35.0 & Dh= 3.5 mm
Hs=30.5 & Dh= 3.5 mm
Hs=25.0 & Dh= 3.5 mm
Hs=39.5 & Dh= 5.0 mm
Hs=35.0 & Dh= 5.0 mm
Hs=30.0 & Dh= 5.0 mm
Hs=25.0 & Dh= 5.0 mm
Hs=39.5 & Dh= 6.0 mm
Hs=35.0 & Dh= 6.0 mm
Hs=30.0 & Dh= 6.0 mm
Hs=25.0 &Dh= 6.0 mm
General trend
Figure 6: Conveyance ratio versus %S for different static head and different hole diameters (Lp=1.15m,
water test case)
The relation between conveyance ratio and percentage of perforation for different hole diameters and different
static head for collection pipe length of 1.15m is shown in figures 6. It is interesting to note that the relation
between Qm/Qp and %S is linear until %S=1.0 %. At this ratio of perforation (%S=1.0%) the ratio between Qm/Qp is
equal to 0.6 which mean that. If the perforation is collection pipe is perform with %S=1.0% this make the discharge
from collection pipe equal to 60% from discharge from solid pipe. The collection pipe reach to capacity after
%S=2.1% and at this ratio the conveyance ration is equal to 0.94. The figures indicate that there is no significant
effect of hole diameter and static head in the relation between conveyance ration and percentage of perforations
(%S). Accordingly while making design of laterals these will be no specific perforation for a certain hole size as
long as the required percentage of perforation is maintained. In other words, the designer may choose 3.5mm or
5mm or 6 mm hole diameters with no significant hydraulic difference (conveyance difference) between any of them
as long as the required percentage of perforation is maintained.
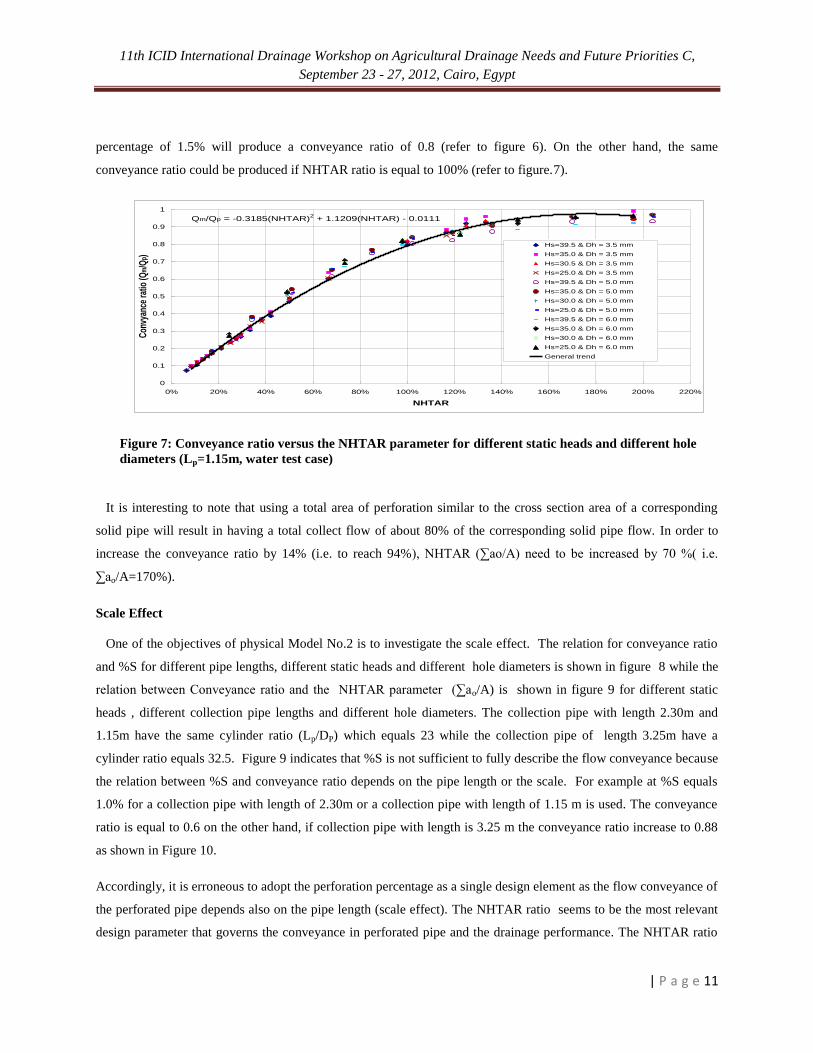
Conveyance Ratio (Qm/Qp) versus Normalized Holes total Area (NHTAR=∑ao/A)
The Normalized Holes Total Area (NHTAR=∑ao/A ) is defined as the total area of the holes in the perforated pipe
normalized by the cross section flow area of a similar but solid pipe. To present the importance of this parameter,
the relation between the conveyance ratio versus the NHTAR parameter (normalized holes total area ratio) for
different static heads and different hole diameters is plotted in figure 7. It is important to mention that a perforation
11th ICID International Drainage Workshop on Agricultural Drainage Needs and Future Priorities C,
September 23 - 27, 2012, Cairo, Egypt
11 | P a g e
percentage of 1.5% will produce a conveyance ratio of 0.8 (refer to figure 6). On the other hand, the same
conveyance ratio could be produced if NHTAR ratio is equal to 100% (refer to figure.7).
Qm/Qp = -0.3185(NHTAR)2 + 1.1209(NHTAR) - 0.0111
0
0.1
0.2
0.3
0.4
0.5
0.6
0.7
0.8
0.9
1
0% 20% 40% 60% 80% 100% 120% 140% 160% 180% 200% 220%
NHTAR
Con
vyan
ce ra
tio (Q
m/Q
p)
Hs=39.5 & Dh = 3.5 mm
Hs=35.0 & Dh = 3.5 mm
Hs=30.5 & Dh = 3.5 mm
Hs=25.0 & Dh = 3.5 mm
Hs=39.5 & Dh = 5.0 mm
Hs=35.0 & Dh = 5.0 mm
Hs=30.0 & Dh = 5.0 mm
Hs=25.0 & Dh = 5.0 mm
Hs=39.5 & Dh = 6.0 mm
Hs=35.0 & Dh = 6.0 mm
Hs=30.0 & Dh = 6.0 mm
Hs=25.0 & Dh = 6.0 mm
General trend
Figure 7: Conveyance ratio versus the NHTAR parameter for different static heads and different hole
diameters (Lp=1.15m, water test case)
It is interesting to note that using a total area of perforation similar to the cross section area of a corresponding
solid pipe will result in having a total collect flow of about 80% of the corresponding solid pipe flow. In order to
increase the conveyance ratio by 14% (i.e. to reach 94%), NHTAR (∑ao/A) need to be increased by 70 %( i.e.
∑ao/A=170%).
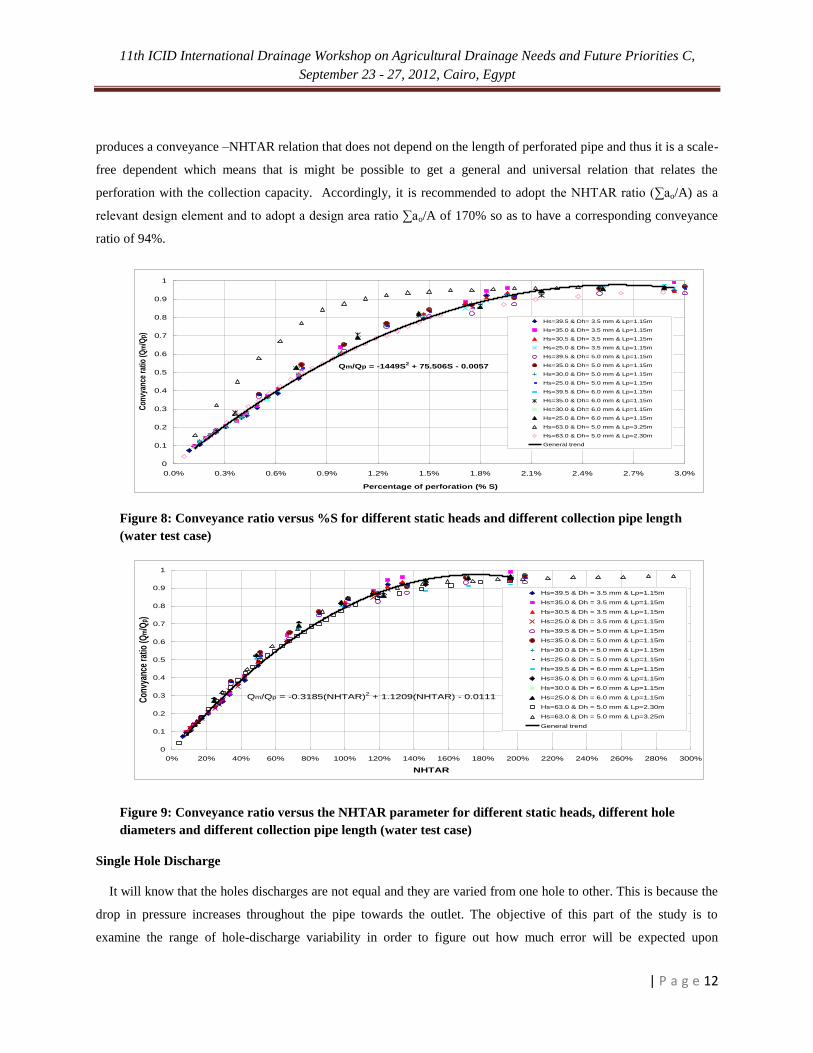
Scale Effect
One of the objectives of physical Model No.2 is to investigate the scale effect. The relation for conveyance ratio
and %S for different pipe lengths, different static heads and different hole diameters is shown in figure 8 while the
relation between Conveyance ratio and the NHTAR parameter (∑ao/A) is shown in figure 9 for different static
heads , different collection pipe lengths and different hole diameters. The collection pipe with length 2.30m and
1.15m have the same cylinder ratio (Lp/DP) which equals 23 while the collection pipe of length 3.25m have a
cylinder ratio equals 32.5. Figure 9 indicates that %S is not sufficient to fully describe the flow conveyance because
the relation between %S and conveyance ratio depends on the pipe length or the scale. For example at %S equals
1.0% for a collection pipe with length of 2.30m or a collection pipe with length of 1.15 m is used. The conveyance
ratio is equal to 0.6 on the other hand, if collection pipe with length is 3.25 m the conveyance ratio increase to 0.88
as shown in Figure 10.
Accordingly, it is erroneous to adopt the perforation percentage as a single design element as the flow conveyance of
the perforated pipe depends also on the pipe length (scale effect). The NHTAR ratio seems to be the most relevant
design parameter that governs the conveyance in perforated pipe and the drainage performance. The NHTAR ratio
11th ICID International Drainage Workshop on Agricultural Drainage Needs and Future Priorities C,
September 23 - 27, 2012, Cairo, Egypt
12 | P a g e
produces a conveyance –NHTAR relation that does not depend on the length of perforated pipe and thus it is a scale-
free dependent which means that is might be possible to get a general and universal relation that relates the
perforation with the collection capacity. Accordingly, it is recommended to adopt the NHTAR ratio (∑ao/A) as a
relevant design element and to adopt a design area ratio ∑ao/A of 170% so as to have a corresponding conveyance
ratio of 94%.
Qm/Qp = -1449S2 + 75.506S - 0.0057
0
0.1
0.2
0.3
0.4
0.5
0.6
0.7
0.8
0.9
1
0.0% 0.3% 0.6% 0.9% 1.2% 1.5% 1.8% 2.1% 2.4% 2.7% 3.0%
Percentage of perforation (% S)
Con
vyan
ce r
atio
(Qm
/Qp)
Hs=39.5 & Dh= 3.5 mm & Lp=1.15m
Hs=35.0 & Dh= 3.5 mm & Lp=1.15m
Hs=30.5 & Dh= 3.5 mm & Lp=1.15m
Hs=25.0 & Dh= 3.5 mm & Lp=1.15m
Hs=39.5 & Dh= 5.0 mm & Lp=1.15m
Hs=35.0 & Dh= 5.0 mm & Lp=1.15m
Hs=30.0 & Dh= 5.0 mm & Lp=1.15m
Hs=25.0 & Dh= 5.0 mm & Lp=1.15m
Hs=39.5 & Dh= 6.0 mm & Lp=1.15m
Hs=35.0 & Dh= 6.0 mm & Lp=1.15m
Hs=30.0 & Dh= 6.0 mm & Lp=1.15m
Hs=25.0 & Dh= 6.0 mm & Lp=1.15m
Hs=63.0 & Dh= 5.0 mm & Lp=3.25m
Hs=63.0 & Dh= 5.0 mm & Lp=2.30m
General trend
Figure 8: Conveyance ratio versus %S for different static heads and different collection pipe length
(water test case)
Qm/Qp = -0.3185(NHTAR)2 + 1.1209(NHTAR) - 0.0111
0
0.1
0.2
0.3
0.4
0.5
0.6
0.7
0.8
0.9
1
0% 20% 40% 60% 80% 100% 120% 140% 160% 180% 200% 220% 240% 260% 280% 300%
NHTAR
Con
vyan
ce r
atio
(Qm
/Qp)
Hs=39.5 & Dh = 3.5 mm & Lp=1.15m
Hs=35.0 & Dh = 3.5 mm & Lp=1.15m
Hs=30.5 & Dh = 3.5 mm & Lp=1.15m
Hs=25.0 & Dh = 3.5 mm & Lp=1.15m
Hs=39.5 & Dh = 5.0 mm & Lp=1.15m
Hs=35.0 & Dh = 5.0 mm & Lp=1.15m
Hs=30.0 & Dh = 5.0 mm & Lp=1.15m
Hs=25.0 & Dh = 5.0 mm & Lp=1.15m
Hs=39.5 & Dh = 6.0 mm & Lp=1.15m
Hs=35.0 & Dh = 6.0 mm & Lp=1.15m
Hs=30.0 & Dh = 6.0 mm & Lp=1.15m
Hs=25.0 & Dh = 6.0 mm & Lp=1.15m
Hs=63.0 & Dh = 5.0 mm & Lp=2.30m
Hs=63.0 & Dh = 5.0 mm & Lp=3.25m
General trend
Figure 9: Conveyance ratio versus the NHTAR parameter for different static heads, different hole
diameters and different collection pipe length (water test case)
Single Hole Discharge
It will know that the holes discharges are not equal and they are varied from one hole to other. This is because the
drop in pressure increases throughout the pipe towards the outlet. The objective of this part of the study is to
examine the range of hole-discharge variability in order to figure out how much error will be expected upon
11th ICID International Drainage Workshop on Agricultural Drainage Needs and Future Priorities C,
September 23 - 27, 2012, Cairo, Egypt
13 | P a g e
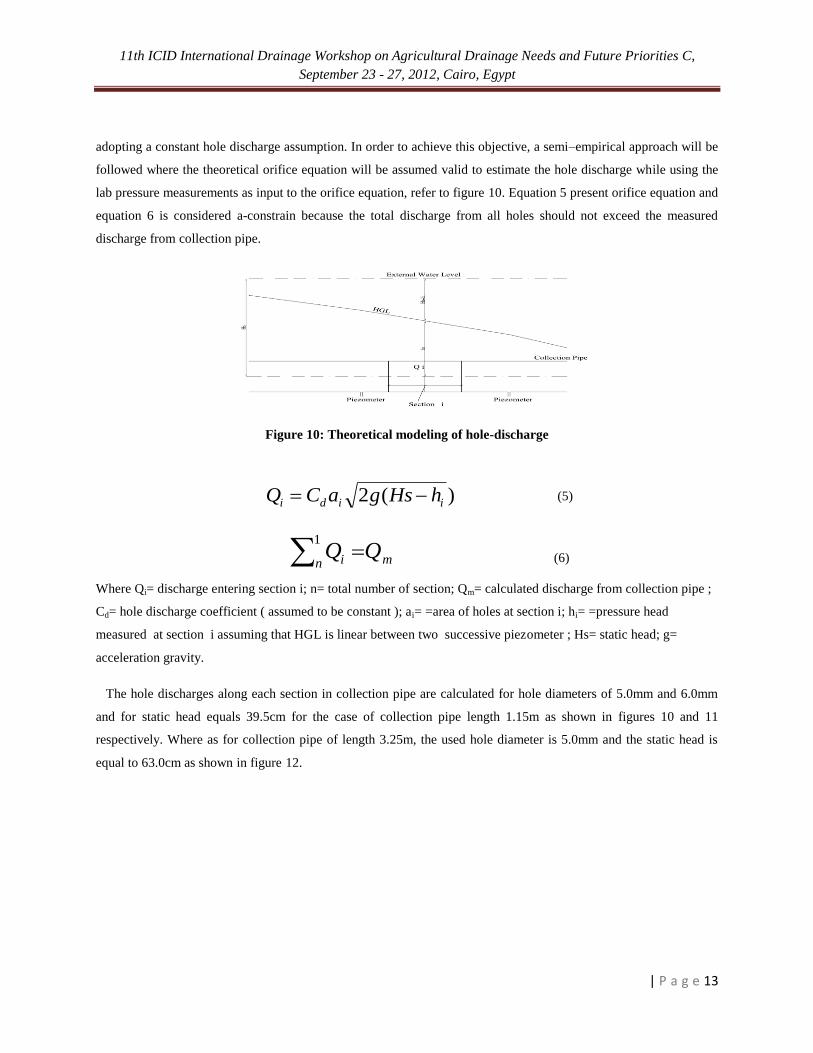
adopting a constant hole discharge assumption. In order to achieve this objective, a semi–empirical approach will be
followed where the theoretical orifice equation will be assumed valid to estimate the hole discharge while using the
lab pressure measurements as input to the orifice equation, refer to figure 10. Equation 5 present orifice equation and
equation 6 is considered a-constrain because the total discharge from all holes should not exceed the measured
discharge from collection pipe.
Figure 10: Theoretical modeling of hole-discharge
(5)
(6)
Where Qi= discharge entering section i; n= total number of section; Qm= calculated discharge from collection pipe ;
Cd= hole discharge coefficient ( assumed to be constant ); ai= =area of holes at section i; hi= =pressure head
measured at section i assuming that HGL is linear between two successive piezometer ; Hs= static head; g=
acceleration gravity.
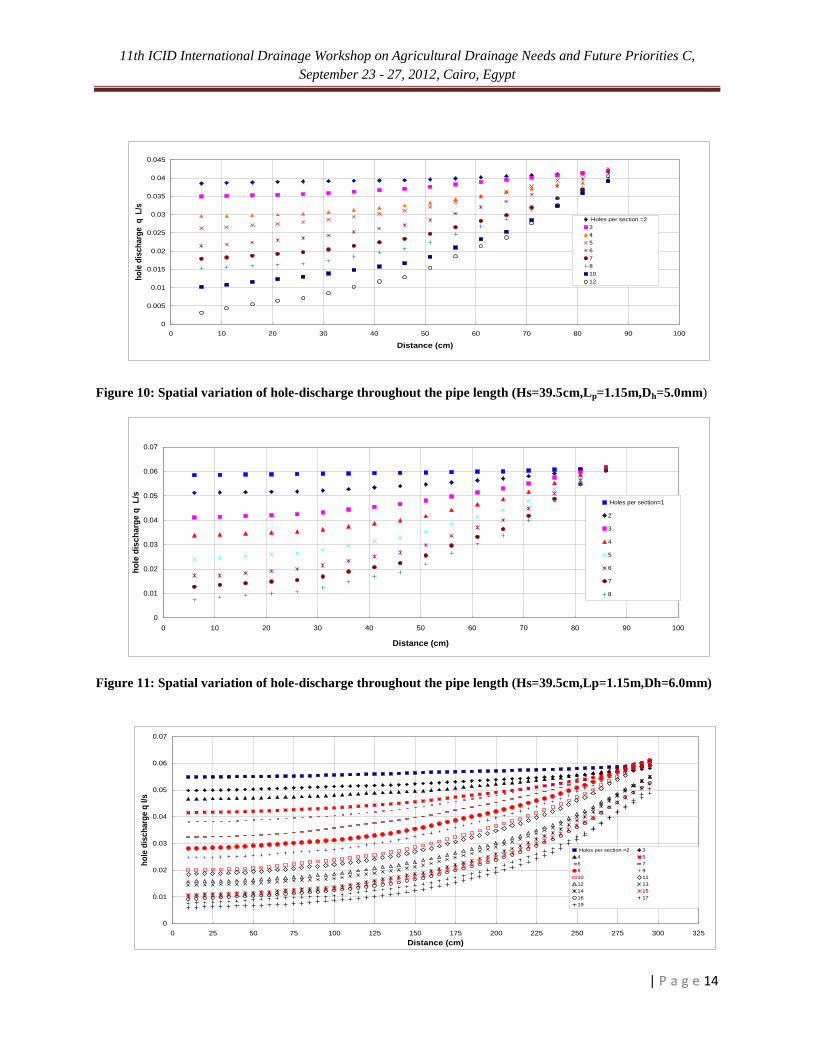
The hole discharges along each section in collection pipe are calculated for hole diameters of 5.0mm and 6.0mm
and for static head equals 39.5cm for the case of collection pipe length 1.15m as shown in figures 10 and 11
respectively. Where as for collection pipe of length 3.25m, the used hole diameter is 5.0mm and the static head is
equal to 63.0cm as shown in figure 12.
)(2 iidi hHsgaCQ
mn i QQ 1
11th ICID International Drainage Workshop on Agricultural Drainage Needs and Future Priorities C,
September 23 - 27, 2012, Cairo, Egypt
14 | P a g e
0
0.005
0.01
0.015
0.02
0.025
0.03
0.035
0.04
0.045
0 10 20 30 40 50 60 70 80 90 100
Distance (cm)
ho
le d
isc
ha
rge
q
L
/s
Holes per section =2
3
4
5
6
7
8
10
12
Figure 10: Spatial variation of hole-discharge throughout the pipe length (Hs=39.5cm,Lp=1.15m,Dh=5.0mm)
0
0.01
0.02
0.03
0.04
0.05
0.06
0.07
0 10 20 30 40 50 60 70 80 90 100
Distance (cm)
ho
le d
isc
harg
e q
L
/s
Holes per section=1
2
3
4
5
6
7
8
Figure 11: Spatial variation of hole-discharge throughout the pipe length (Hs=39.5cm,Lp=1.15m,Dh=6.0mm)
0
0.01
0.02
0.03
0.04
0.05
0.06
0.07
0 25 50 75 100 125 150 175 200 225 250 275 300 325
Distance (cm)
ho
le d
isc
harg
e q
l/s
Holes per section =2 3
4 5
6 7
8 9
10 11
12 13
14 15
16 17
19
11th ICID International Drainage Workshop on Agricultural Drainage Needs and Future Priorities C,
September 23 - 27, 2012, Cairo, Egypt
15 | P a g e
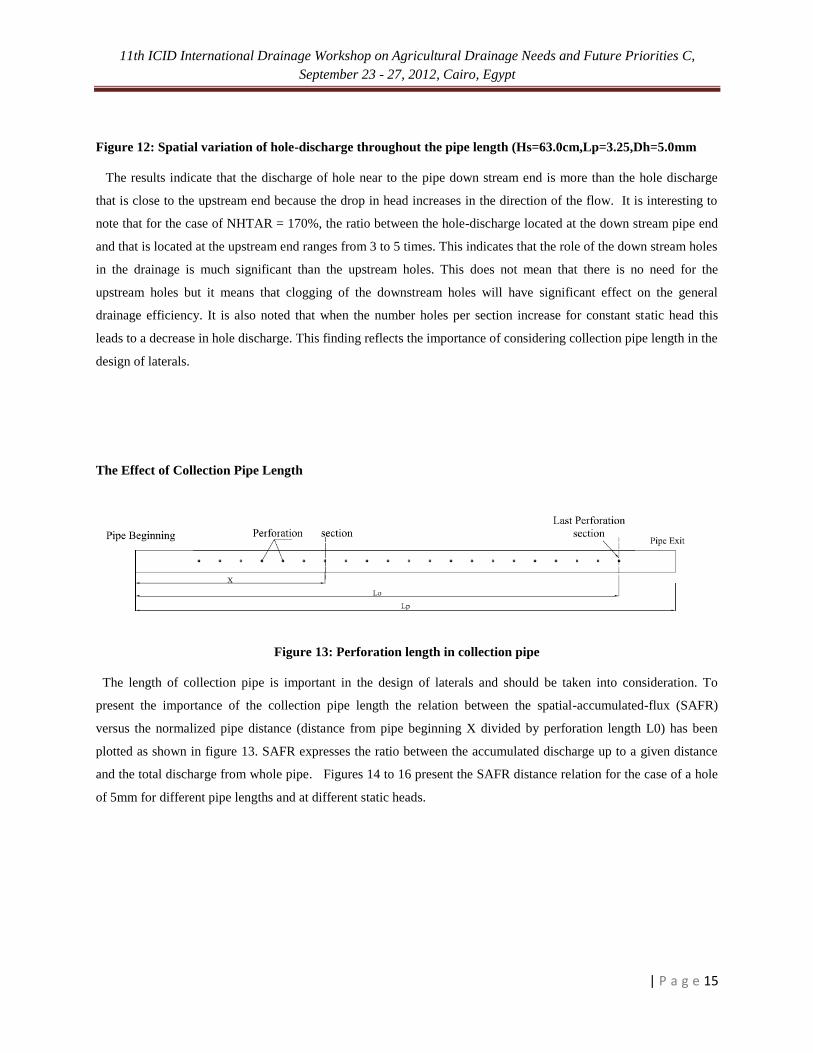
Figure 12: Spatial variation of hole-discharge throughout the pipe length (Hs=63.0cm,Lp=3.25,Dh=5.0mm
The results indicate that the discharge of hole near to the pipe down stream end is more than the hole discharge
that is close to the upstream end because the drop in head increases in the direction of the flow. It is interesting to
note that for the case of NHTAR = 170%, the ratio between the hole-discharge located at the down stream pipe end
and that is located at the upstream end ranges from 3 to 5 times. This indicates that the role of the down stream holes
in the drainage is much significant than the upstream holes. This does not mean that there is no need for the
upstream holes but it means that clogging of the downstream holes will have significant effect on the general
drainage efficiency. It is also noted that when the number holes per section increase for constant static head this
leads to a decrease in hole discharge. This finding reflects the importance of considering collection pipe length in the
design of laterals.
The Effect of Collection Pipe Length
Figure 13: Perforation length in collection pipe
The length of collection pipe is important in the design of laterals and should be taken into consideration. To
present the importance of the collection pipe length the relation between the spatial-accumulated-flux (SAFR)
versus the normalized pipe distance (distance from pipe beginning X divided by perforation length L0) has been
plotted as shown in figure 13. SAFR expresses the ratio between the accumulated discharge up to a given distance
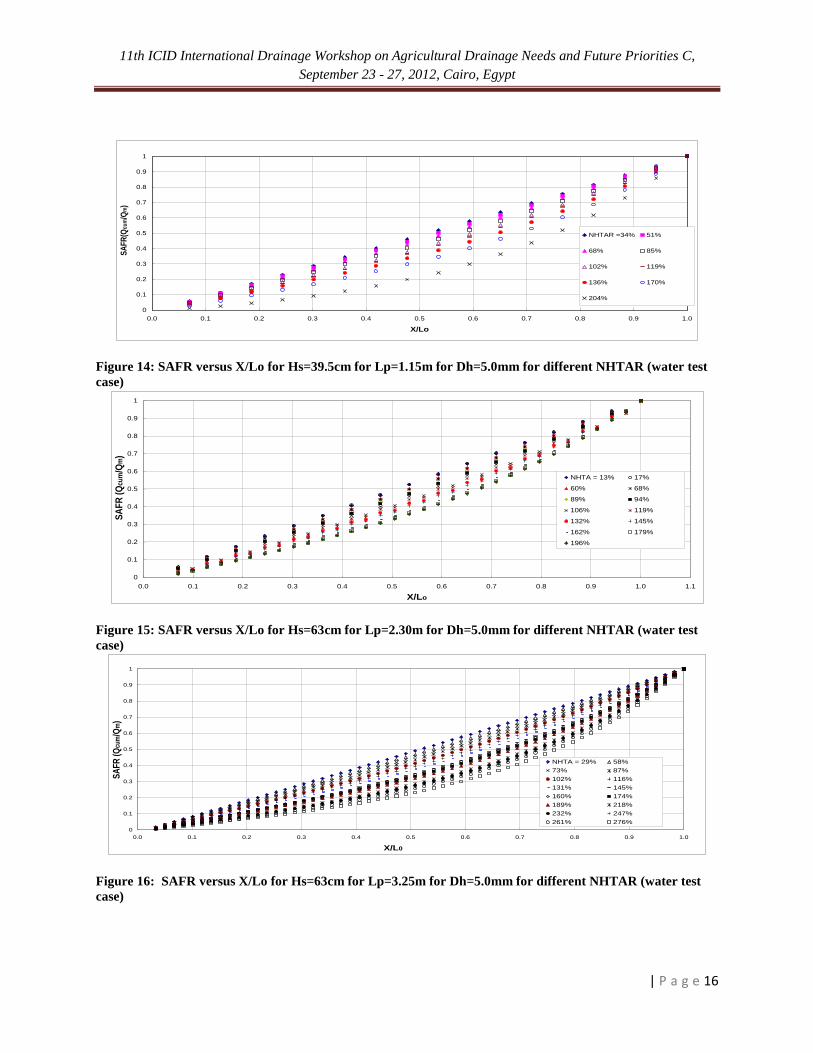
and the total discharge from whole pipe. Figures 14 to 16 present the SAFR distance relation for the case of a hole
of 5mm for different pipe lengths and at different static heads.
11th ICID International Drainage Workshop on Agricultural Drainage Needs and Future Priorities C,
September 23 - 27, 2012, Cairo, Egypt
16 | P a g e
0
0.1
0.2
0.3
0.4
0.5
0.6
0.7
0.8
0.9
1
0.0 0.1 0.2 0.3 0.4 0.5 0.6 0.7 0.8 0.9 1.0
X/Lo
SA
FR
(Qcu
m/Q
m)
NHTAR =34% 51%
68% 85%
102% 119%
136% 170%
204%
Figure 14: SAFR versus X/Lo for Hs=39.5cm for Lp=1.15m for Dh=5.0mm for different NHTAR (water test
case)
0
0.1
0.2
0.3
0.4
0.5
0.6
0.7
0.8
0.9
1
0.0 0.1 0.2 0.3 0.4 0.5 0.6 0.7 0.8 0.9 1.0 1.1
X/Lo
SA
FR
(Q
cum
/Qm
)
NHTA = 13% 17%
60% 68%
89% 94%
106% 119%
132% 145%
162% 179%
196%
Figure 15: SAFR versus X/Lo for Hs=63cm for Lp=2.30m for Dh=5.0mm for different NHTAR (water test
case)
0
0.1
0.2
0.3
0.4
0.5
0.6
0.7
0.8
0.9
1
0.0 0.1 0.2 0.3 0.4 0.5 0.6 0.7 0.8 0.9 1.0
X/L0
SA
FR
(Q
cum
/Qm
)
NHTA = 29% 58%
73% 87%
102% 116%
131% 145%
160% 174%
189% 218%
232% 247%
261% 276%
Figure 16: SAFR versus X/Lo for Hs=63cm for Lp=3.25m for Dh=5.0mm for different NHTAR (water test
case)
11th ICID International Drainage Workshop on Agricultural Drainage Needs and Future Priorities C,
September 23 - 27, 2012, Cairo, Egypt
17 | P a g e
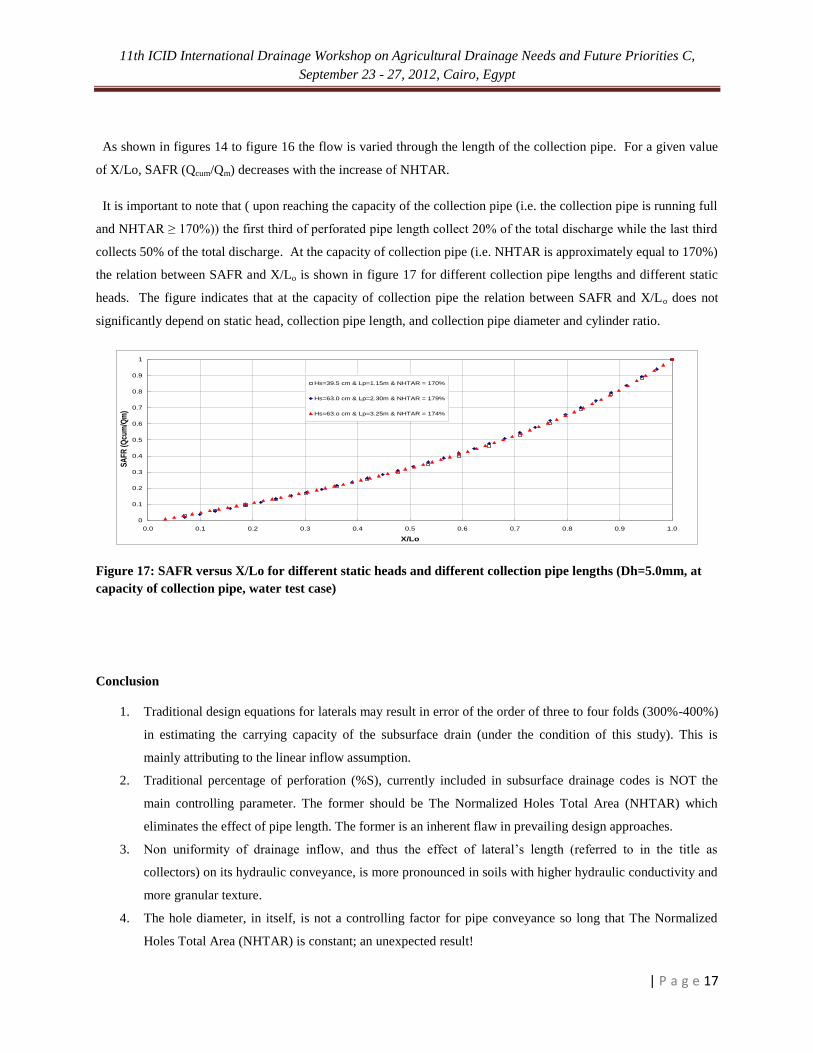
As shown in figures 14 to figure 16 the flow is varied through the length of the collection pipe. For a given value
of X/Lo, SAFR (Qcum/Qm) decreases with the increase of NHTAR.
It is important to note that ( upon reaching the capacity of the collection pipe (i.e. the collection pipe is running full
and NHTAR ≥ 170%)) the first third of perforated pipe length collect 20% of the total discharge while the last third
collects 50% of the total discharge. At the capacity of collection pipe (i.e. NHTAR is approximately equal to 170%)
the relation between SAFR and X/Lo is shown in figure 17 for different collection pipe lengths and different static
heads. The figure indicates that at the capacity of collection pipe the relation between SAFR and X/Lo does not
significantly depend on static head, collection pipe length, and collection pipe diameter and cylinder ratio.
0
0.1
0.2
0.3
0.4
0.5
0.6
0.7
0.8
0.9
1
0.0 0.1 0.2 0.3 0.4 0.5 0.6 0.7 0.8 0.9 1.0
X/Lo
SA
FR
(Q
cum
/Qm
)
Hs=39.5 cm & Lp=1.15m & NHTAR = 170%
Hs=63.0 cm & Lp=2.30m & NHTAR = 179%
Hs=63.o cm & Lp=3.25m & NHTAR = 174%
Figure 17: SAFR versus X/Lo for different static heads and different collection pipe lengths (Dh=5.0mm, at
capacity of collection pipe, water test case)
Conclusion
1. Traditional design equations for laterals may result in error of the order of three to four folds (300%-400%)
in estimating the carrying capacity of the subsurface drain (under the condition of this study). This is
mainly attributing to the linear inflow assumption.
2. Traditional percentage of perforation (%S), currently included in subsurface drainage codes is NOT the
main controlling parameter. The former should be The Normalized Holes Total Area (NHTAR) which
eliminates the effect of pipe length. The former is an inherent flaw in prevailing design approaches.
3. Non uniformity of drainage inflow, and thus the effect of lateral’s length (referred to in the title as
collectors) on its hydraulic conveyance, is more pronounced in soils with higher hydraulic conductivity and
more granular texture.
4. The hole diameter, in itself, is not a controlling factor for pipe conveyance so long that The Normalized
Holes Total Area (NHTAR) is constant; an unexpected result!

11th ICID International Drainage Workshop on Agricultural Drainage Needs and Future Priorities C,
September 23 - 27, 2012, Cairo, Egypt
18 | P a g e
5. The threshold value of the perforation percentage (%Scr), which defines the transition from free flow to
pressurized flow, generally decreases as the external static head increases.
6. The relation between conveyance ratio (Qm/Qp) and percentage of perforation (%S) is linear for %S ≤ 1.0 .
At this ratio of perforation (%S=1.0%) the Qm/Qp value is equal to 0.6. The collection pipe reaches its
maximum capacity for %S ≥ 2.1 and at this ratio the conveyance ratio reaches 0.95.
7. The relations between conveyance ratio and percentage of perforation for different static heads and
collection pipe with diameter of 5.0cm indicate that there is a constant trend between the conveyance ratio
and percentage of perforation. It is also noted that there are three distinct zones. The first zone (%S ≤ 1)
represents the under perforation percentage, where the conveyance ratio linearly increases with the increase
of %S to a maximum of 0.6. The third zone (%S ≥ 2.1) represents the over perforation percentage, where
the conveyance ratio is almost constant at a value of 0.95. The second zone is transitional between zones
one and three. The former trend is almost independent of the static head (within the tested range).
8. It is recommended to adopt the NHTAR ratio as a relevant design element and to adopt a design area ratio
of 170% so as to have a corresponding conveyance ratio of 95%.
Recommendations
The following suggestions are foreseen as necessary for future investigations:
1. Developing a numerical scheme to simulate current work while taking into consideration the study
achieved
2. Investigating the salt reduction potential in soils in view of the newly derived parameters
3. Considering the results into the design code
References
1. Abdel-Dayem, M.S. and Ritzema, H.P.(1990) : Verification of drainage design criteria in the Nile Delta,
Irrigation and drainage 4: 117-131,Egypt.
2. Amer, M.H., and Ridder, N.A (1989) : Land Drainage in Egyp, Cairo, Egypt, pp. 74-93.
3. Christen, E.W (2001) : Design and Management of Subsurface Horizontal Drainage to Reduce Salt Loads,
Journal of Irrigation and Drainage Engineering 127(3).
4. Christen, E.W., Ayars, J.E. and Hornbuckle, J.W. (2001) : Subsurface Drainage Design and Management
in Irrigated Areas of Australia,. Irrigation Science 21: 35–43.
5. Dielman, P.J (1980) : Expert conclusion on Drainage Design Factors, FAO, Irrigation and Drainage paper
no. 38, Rome Italy
6. Gehan A. H. Sallam (2003) : Quality Control and Quality Assurance of Subsurface Drainage Projects in
Egypt, Drainage Research Institute,National Water Resource Center,P.O.Box13621/5,Elkanater,Egypt
7. H.Elatfy,H.Elgamaal and E.Van Mourik(1991) : Discharge rates, Salinities, and The Performance of
Subsurface Collector drains in Egypt, Irrigation and Drainage Systems 5: 325-338, The Netherlands .
11th ICID International Drainage Workshop on Agricultural Drainage Needs and Future Priorities C,
September 23 - 27, 2012, Cairo, Egypt
19 | P a g e
8. H.P. Ritzema (1994) : Drainage Principles and Applications, International Institute for Land Reclamation
and Improvement, P.O. Box 45,6700AA Wageningen, The Netherlands.
9. Irwin, R.W (1984) : Corrugated Pipe Flow Rate from Pipe Geometry. J. Irr. Dr. Eng., 237–241.
10. J.Vos ( 1986) : Twenty-Five Years of Drainage Experience, International Institute for Land Reclamation
and Improvement, International Agricultural Center, The Netherlands.
11. L.C.P.M. Stuyt, W. Diericks and J. Martínez Beltrán (2005) : Materials for subsurface land drainage
systems, FAO Irrigation and Drainage Paper No. 60 Rev. 1. Rome. 183 pp.
12. Magdy Rashad Nasralla (2007) : Recommendation Suppotive tool for The design of The subsurface
Drainage System in Egypt, Eleventh International Water Technology Conference, IWTC11 2007 Sharm El-
Sheikh, Egypt.
13. Marinus G. (2001) : Selecting The drainage method for Agricultural Land, International Institute for Land
Reclamation and Improvement, P.O. Box 45,6700AA Wageningen, The Netherlands.
14. Nasralla (2001): Development of Hydrophysical Parameters for Design of Drainage System in Egypt.
Ph.D. thesis, Ain Shams University, Cairo, Egypt.
15. Ritzema H.P (1990) : Subsurface Flow to Drains. Drainage Principals and Applications. ILRI Publication
16. Second Edition, pp. 263-304.
16. Vonder Beken, A.Detroch, F.Desomer,and M.Zuidema(1972) : The Lateral Inflow into Submerged Drains,
Bull.int.Ass.Hydro.Sci.,17: 273-289.
17. W.F.J.Van BEERS(1979) : Some Nomographs for The Calculation of Drain Spacings, International
Institute for Land Reclamation and Improvement, P.O. Box 45,6700AA Wageningen, The Netherlands .
18. Willem F.Voltman, Lyman S.Willardson and Willy Diericksx (19973): Envelope Design for Subsurface
Drains, International Institute for Land Reclamation and Improvement, P.O. Box 45,6700AA Wageningen,
The Netherlands.
19. Willy Dierickx (1993) : Research and Developments in Selecting Subsurface Drainage Materials, Irrigation
and Drainage Systems 6: 291-310, The Netherlands.
20. W.H. van der Molen, J. Martínez Beltrán, W.J. Ochs (2007): Guidelines and compute programs for the
planning and design of land drainage systems, Food and Agriculture Organization of The United Nations,
paper 62, Rome


