Embed Size (px)
Citation preview

Environment International 37 (2011) 1068–1077
Contents lists available at ScienceDirect
Environment International
j ourna l homepage: www.e lsev ie r.com/ locate /env int
How to assess exposure of aquatic organisms to manufactured nanoparticles?
Joris T.K. Quik a,b,⁎, Jan Arie Vonk a,b, Steffen Foss Hansen c, Anders Baun c, Dik Van De Meent a,b
a Radboud University Nijmegen, Institute for Wetland and Water Research, Department of Environmental Science, P.O. Box 9010, 6500 GL Nijmegen, The Netherlandsb Laboratory for Ecological Risk Assessment, National Institute for Public Health and the Environment (RIVM), P.O. Box 1, 3720 BA Bilthoven, The Netherlandsc DTU Environment, Technical University of Denmark, Building 115, 2800 Kgs. Lyngby, Denmark
⁎ Corresponding author at: Radboud University NijmeWater Research, Department of Environmental ScienNijmegen, The Netherlands. Tel.: +31 30 27 43 179; fax
E-mail address: [email protected] (J.T.K. Quik).
0160-4120/$ – see front matter © 2011 Elsevier Ltd. Aldoi:10.1016/j.envint.2011.01.015
a b s t r a c t
a r t i c l e i n f oAvailable online 15 March 2011
Keywords:NanomaterialsSedimentationDissolutionExposure assessmentAquatic environment
Ecological risk of chemicals is measured by the quotient of predicted no-effect concentrations and predictedexposure concentrations, which are hard to assess for manufactured nanomaterials (NMs). This paperproposes modifications to currently used models, in order to make them suitable for estimating exposureconcentrations of NMs in the aquatic environment. We have evaluated the adequacy of the current guidancedocuments for use with NMs and conclude that nano-specific fate processes, such as sedimentation anddissolution need to be incorporated. We have reviewed the literature on sedimentation and dissolution ofNMs in environmentally relevant systems.We deduce that the overall kinetics of water–sediment transport ofNMs should be close to first order. The lack of data on dissolution of NMs under environmentally realisticconditions calls for a pragmatic decision on which rates to be used in modeling. We find that first orderremoval kinetics for dissolution seems adequate. Based on limited data from literature, probable removalrates range from 0 to 10−4 s−1 for sedimentation, and from 0 to 10−5 s−1 for dissolution. Furtherexperimental data at environmentally relevant conditions for sedimentation and dissolution of NMs isneeded.
gen, Institute for Wetland andce, P.O. Box 9010, 6500 GL: +31 30 27 44 413.
l rights reserved.
© 2011 Elsevier Ltd. All rights reserved.
1. Introduction
The recent large increase in production, species, and utilization ofmanufactured nanomaterials (NMs) has raised concerns that therelease of these materials into the environment may pose a seriousthreat, and consequently calls for environmental risk assessment ofNMs (Handy et al., 2008; Klaine et al., 2008; Moore, 2006; Nowackand Bucheli, 2007). The current approach to environmental riskcharacterization for chemicals in the EU is based on the quotient of apredicted environmental concentration (PEC) and a predicted no-effect concentration (PNEC), and is elaborated into the guidance oninformation requirements and chemical safety assessment (ECHA,2008) and formalized in the European Union System forthe Evaluation of Substances (EUSES)(EU, 2008). In principle, thePEC/PNEC ratio should characterize the environmental risk ofnanomaterials just as well as it does for conventional chemicals.However, assessment of PEC and PNEC for nanomaterials is notstraightforward. As NMs tend to aggregate, NMs are often present in arange of sizes. So that assessment of the PNEC in terms ofconcentration of nanoparticles is not trivial. Experimental measure-ment of exposure concentrations (PEC)—in the laboratory, let alone inthe field—is challenging, to say the least. When measurement is no
option, prediction of exposure concentrations, based on a knownemission, is often the only alternative, but suffers from even greaterdifficulty. Question is how to account for NM-specific environmentalbehavior in assessing PEC, which is not addressed nor worked out inthe European Chemicals Agency guidance (ECHA, 2008) and EUSES(SCENIHR, 2007, 2009).
In this paper, we address this question.We discuss the adequacy ofthe currently used exposure assessment modeling framework for usewith NMs and identify its weakness in describing colloidal processes.We have reviewed the literature to gather quantitative informationsupporting the exposure assessment modeling of NMs focusing ontwo main nano-specific removal processes, sedimentation anddissolution. In the last part of this paper, we provide a brief overviewof the different approaches already used to model exposureconcentrations of NMs including the physical and chemical lawswhich form the basis for an exposure assessment model of NMs.Finally we propose a possible way forward in further adaptation ofcurrent models to make them fit for use with NMs. In which weindicate both the feasibility of using first order removal rates for thispurpose and the limitation of currently available experimental data.
1.1. Current guidance on exposure assessment and nanomaterials
Under EU regulation, exposure estimation for the purpose ofenvironmental risk assessment of nanomaterials is considered to becovered satisfactorily by guidance on Registration, Evaluation,Authorization and Restriction of Chemicals (REACH). REACH guidance

1069J.T.K. Quik et al. / Environment International 37 (2011) 1068–1077
R.16 prescribes model algorithms to estimate concentrations ofchemical substances in water, starting from known or estimatedemission rates (ECHA, 2008).
The concentration of a chemical substance in water is thought torepresent the balance of an emission E (kg s-1) into a water body ofvolume V (m3) and a number of removal processes, each character-ized by first order removal rate constants ki (s−1). The fate processaccounted for in the REACH guidance (Fig. 1a), are (i) advection out ofthe system (kadv), (ii) volatilization to air (kvol), (iii) degradation(i.e. transformation into other chemicals or complete mineralization,kdeg), and (iv) sorption to suspended particles according to anequilibrium constant Kp (L kg−1), and subsequent deposition tosediment (ksed). From these processes, of which the rate constantsmust be measured or estimated via established theoretical orempirical relationships, the model algorithms deduce a steady-stateconcentration Cw (kg m−3) of the substance dissolved in water, seeEq. (1).
Cw =E
kadv + kvol + k deg + ksed� �
⋅Vð1Þ
We can ask ourselves several questions regarding the exposureassessment of NMs: Do NMs behave in the same way as conventionalchemical substances? Can the concentration of nanoparticles, sus-pended in water, be derived from the emission to water the same wayas for conventional chemical substances? Do we have measured rateconstants for removal of nanoparticles from water? Can we estimateremoval rate constants for nanoparticles from theory? Are therenano-specific processes that cannot be accommodated in the currentguidance?
First, there are processes in the guidance that are irrelevant fornanoparticles. For example, volatilization from water is an importantprocess for many conventional chemicals, but is likely negligible for
Fig. 1. Schematic indication of the environmental fate processes for conventionalchemicals (a) and nanomaterials (b).
NMs. This can be dealt with easily by assigning the value of zero to thevolatilization rate constant. Then a major question is whether/howremoval of nanoparticles fromwater by deposition to sediment can bedescribed using the current guidance, which assumes equilibriumpartitioning between dissolved and sorbed chemical, followed by(partial) sedimentation of the suspended matter. It is well knownfrom colloid science that, small particles in water tend to progres-sively form aggregates and agglomerates that, when grown bigenough, deposit, eventually leading to near-complete removal of theaggregated material to the sediment (Fig. 1b). Another issue isdissolution. REACH regulation focuses on (bioavailable) chemicalsubstances in the dissolved state; it is assumed that, immediatelyupon release to water, chemicals are entirely in the dissolved state.This is obviously different for nanoparticles, where (i) focus is on thepresence of solid particles, suspended in water, and (ii) it could beassumed that, immediately following release to water, the material isentirely in the suspended state. In order to estimate the concentrationof nanoparticles in water, it is essential that the process of dissolutionis taken into account (Fig. 1b). Based on these differences betweenconventional and NMs it is thought that at least some amendments tothe current guidance are necessary in order to make the currentREACH guidance suitable for predicting concentrations of nanoparti-cles in water.
1.2. Background on sedimentation and dissolution
The commonly used two-stage description of water–sedimenttransport of chemical substances (i.e. rapid equilibrium partitioning ofdissolved chemical onto suspended particulate matter, followed bytransport with settling suspended particles to sediment) is clearly notsuitable to model the behavior of NMs. In a recent review, Petosa et al.(2010) showed that the aggregation and deposition behavior underlaboratory conditions can generally be semi-quantitatively describedvia the Derjaguin and Landau, Verwey and Overbeek (DLVO) theory,which describes the forces between charged surfaces interactingthrough a liquid medium. However, Petosa et al. (2010) also indicatesthe non-DLVO behavior that is generally found in the more complexnatural systems where surface coatings result in steric hindering orwhere unusual shapes of nanoparticles give rise to unpredictedbehavior. Aggregation is dependent on the collision frequency and theattachment efficiency of the particles. It has been shown that theattachment efficiency is largely affected by the ionic strength andnatural organic matter (NOM) content of natural waters (Arvidssonet al., 2011; Keller et al., 2010). The ultimate consequence ofaggregation is sedimentation of these nanoparticle aggregates to thesediment. In addition to aggregation, nanoparticles will deposit onother surfaces, like natural colloids (Arvidsson et al., 2011; Kiser et al.,2010; Petosa et al., 2010). This tendency of NMs to attach to othersolids has been poorly studied although there have been some studiesof interactions with wastewater treatment solids (Kiser et al., 2010;Limbach et al., 2008). Most studies look at the underlying processes ofaggregation, studying the effect of the physicochemical properties ofthe aquatic matrix and NM themselves. The link between aggregationand sedimentation seems clear, but a quantitative description is farfrom trivial (Arvidsson et al., 2011). However, recently several studieshave described the sedimentation behavior of NMs in increasinglycomplex environmental matrices, ranging from artificial media withadded NOM to natural river water and sea water, (e.g., (Keller et al.,2010; Quik et al., 2010; Von der Kammer et al., 2010)).
Dissolution of NMs is in essence the transformation of thenanoparticulate form of a chemical compound to the dissolved ionicform or other species of a compound depending on environmentalconditions. According to the ECHA Guidance document on Environ-mental Risk Assessment for metals and metal compounds, theprediction of the environmental exposure concentration should bebased on the relevant soluble metal ion or other metal species that is

1070 J.T.K. Quik et al. / Environment International 37 (2011) 1068–1077
bioavailable or may become available through transformationprocesses (ECHA, 2008). However the extent or rate of dissolutionof chemicals, in this case NMs, is not taken into account by the currentEUSES models. The dissolution kinetics for NMs has been described inseveral studies, but these are often determined under extremeoxidative, acidic, or alkaline conditions (Elzey and Grassian, 2010;Gerischer and Sorg, 1992; Jakab et al., 2009; Roelofs and Vogelsberger,2006; Schmidt and Vogelsberger, 2009; Vogelsberger et al., 2008). Onthe other hand, several biologically relevant studies on particledissolution were done as part of assessing the biological effect ofairborne exposure to particles (Guldberg et al., 1998; Lundborg et al.,1985; Zhou et al., 2010). Additionally, a few studies have looked at thedissolution of mineral particles, e.g. clays (Johnson et al., 2005;Lerman et al., 1975). Only recently is the dissolution of NMsconsidered in studies on environmental fate and effects of NMs(Blinova et al., 2010; Fabrega et al., 2009; Franklin et al., 2007; Liuet al., 2009; Wong et al., 2010; Xia et al., 2008). A few studies havespecifically measured Ag nanoparticle dissolution under environmen-tally and biologically relevant conditions (Elzey and Grassian, 2010;Ho et al., 2010; Liu and Hurt, 2010; Stebounova et al., 2011).
2. Sedimentation
The relationship between sedimentation of NMs and differentenvironmental conditions is discussed. In 2.1, we focus on thechemical composition of the aquatic matrix, looking at parameterslike pH, ionic strength and NOM content and in 2.2 we focus on theeffect of natural colloids and organisms on the fate of NMs in surfacewaters. The complexity of the studies discussed ranges from definedsalt solutions to complex natural water samples. An elaborateoverview of the studies on sedimentation of metals (Ag, Au, andFe), metal oxides (CeO2, Fe2O3, TiO2, and ZnO), and carbon NMs(carbon nano-tubes (CNT) and nC60) is presented in Table 1.
2.1. Composition of aquatic matrix
NOM is found to have a stabilizing effect on various types of NMs inaqueous suspension, thus counteracting sedimentation (Hyung et al.,2007; Kennedy et al., 2008; Quik et al., 2010; Von der Kammer et al.,2010). Several factors seem to influence sedimentation of CNT, such asaddition of NOM, prolonged stirring, and functionalized CNT, which allshow less sedimentation than pristine CNT added to syntheticfreshwater, see Fig. 2 (Hyung et al., 2007; Kennedy et al., 2008).Hyung et al. (2007) showed that upon addition of relatively highconcentrations of CNT to NOM rich water, up to 3.5% remained insuspension after 4 days of settling. Kennedy et al. (2008) tested thesedimentation behavior of CNT in time. Within 40 min, the concen-tration stabilized and only a slow sedimentation rate was observedafterwards. The sedimentation behavior of CeO2 nanoparticles inartificial fresh water also showed fast sedimentation during the firstday (Quik et al., 2010). After 12 days of sedimentation withoutaddition of NOM almost no CeO2 nanoparticles remained suspended,but with addition of 0.5–40 mg L−1 NOM, 5–40% of the initially addednanoparticles remained suspended. In an elaborate multi-dimension-al parameter testing study by Von der Kammer et al. (2010), about70–90% of initially added TiO2 nanoparticles remained suspendedafter 15 h of settling in presence of NOM. In the same study increasingconcentrations of NaCl, CaCl2, and Na2SO4 resulted in a significantincrease in sedimentation compared to the addition of NOM.However, the degree of sedimentation showed large variabilitydepending on pH and salt concentration.
In addition to NOM, different kinds of polymers and otherstabilizing agents are often added to stabilize NMs against aggregationand this logically also decreases sedimentation rates. This was seen ina study by Limbach et al. (2008), who tested the stability of CeO2
nanoparticles at different NaCl concentrations. CeO2 nanoparticles
dispersed with acryl polymer and benzyl sulfonic acid did not showsignificant sedimentation up to 0.1 M and 0.01 M NaCl, respectively,after 4 days of settling. Bare CeO2 nanoparticles only remainedrelatively stable at 0.001 M NaCl. Similarly Phenrat et al. (2009)concluded that the sedimentation rate is lower for Fe0 nanoparticleswhose surface has been modified by polymers. During the 24-hoursedimentation study of Fe0 nanoparticles, about 60% of the surfacemodified particles and 10% of nanoparticles aged for 11 monthsremained suspended compared to less than 1% for fresh or bare Fe0
nanoparticles.Almost all of the above mentioned studies use artificial suspension
media and only a few studies have used natural aquatic matrices totest the behavior of NMs. Lin et al. (2010) studied the stability of CNTin surfacewater samples. CNT only remained suspended in freshwatercontaining anionic and nonionic surfactants or at the highest NOMconcentration (28 mg L−1). CNT also remained suspended in fresh-waters containing anionic and nonionic surfactants as well. Kelleret al. (2010) studied the aggregation and sedimentation in time ofTiO2, ZnO, and CeO2 nanoparticles in 10 different types of environ-mental watermatrices, ranging from freshwater to seawater. Between10 and 90% of nanoparticles remained suspended after 6 h ofsedimentation, with NOM content and ionic strength explainingmost of the variation. NOM generally stabilized against aggregationand consequently sedimentation, whereas water samples with highionic strength showed faster sedimentation due to increasedaggregation. Keller et al. (2010) reported initial sedimentation ratesfor 10 mg L−1 particle suspensions ranging from 10−7 to 10−4 s–1
depending on NOM content and ionic strength.
2.2. Natural colloids and organisms
Natural colloids and organisms are also present in natural aquaticmatrices in addition to NOM and salts, but no studies present data onthe effects of natural colloids on sedimentation of NMs. From theorywe can derive that an increase in particle concentration increases thecollision frequency and thus aggregation and sedimentation rates(Keller et al., 2010; Phenrat et al., 2007). The presence of naturalcolloids could increase the surface area for potential deposition andsedimentation.
Although this interaction has not been studied experimentallywith natural colloids, the effect of bacteria on the removal of NMsfrom the water phase has been studied as interaction with suspendedbiomass and biofilm. Kiser et al. (2010) found that the presence ofwastewater biomass resulted in a greatly increased settling of C60 andAg nanoparticles. The presence of biofilms also affects the depletion ofnanoparticles from free suspension in the aquatic environment. Battinet al. (2009) used a unique flow through flume system to measure thetransport of TiO2 nanoparticles in the aquatic environment. Theyfound increased removal of nanoparticles from the water with amicrobial biofilm present. Without biofilm about 90% of the initiallyadded nanoparticles are removed after 6.5 h, compared to nearly 99%after only 3 h with biofilm present. Additionally in a different study byFerry et al. (2009) the partitioning of Au nano-rods was studied in aestuarine mesocosm study containing biofilms, sediments, plants,animals, and sea water. The largest fraction of Au was found in thebiofilm (61.0%), followed by the sediment (24.5%), sea water (8.61%),and animals (6.18%). In addition to partitioning of nanoparticles to thebiofilm or wastewater biomass, there are other organisms to whichnanoparticles can adsorb. It was reported by Van Hoecke et al. (2009)that CeO2 nanoparticles cluster together with algal cells to formclumps exceeding 1 mm and adhere to the chorion of fish embryos.
Some aquatic organisms, like filter feeders can possibly have aneffect on particle coating and aggregation. Filella et al. (2008)showed that in presence of Daphnia hyaline, which feed on particlesof about 600 nm, the particle size distribution showedmore particleswith a diameter below 500 nm present. A change towards smaller
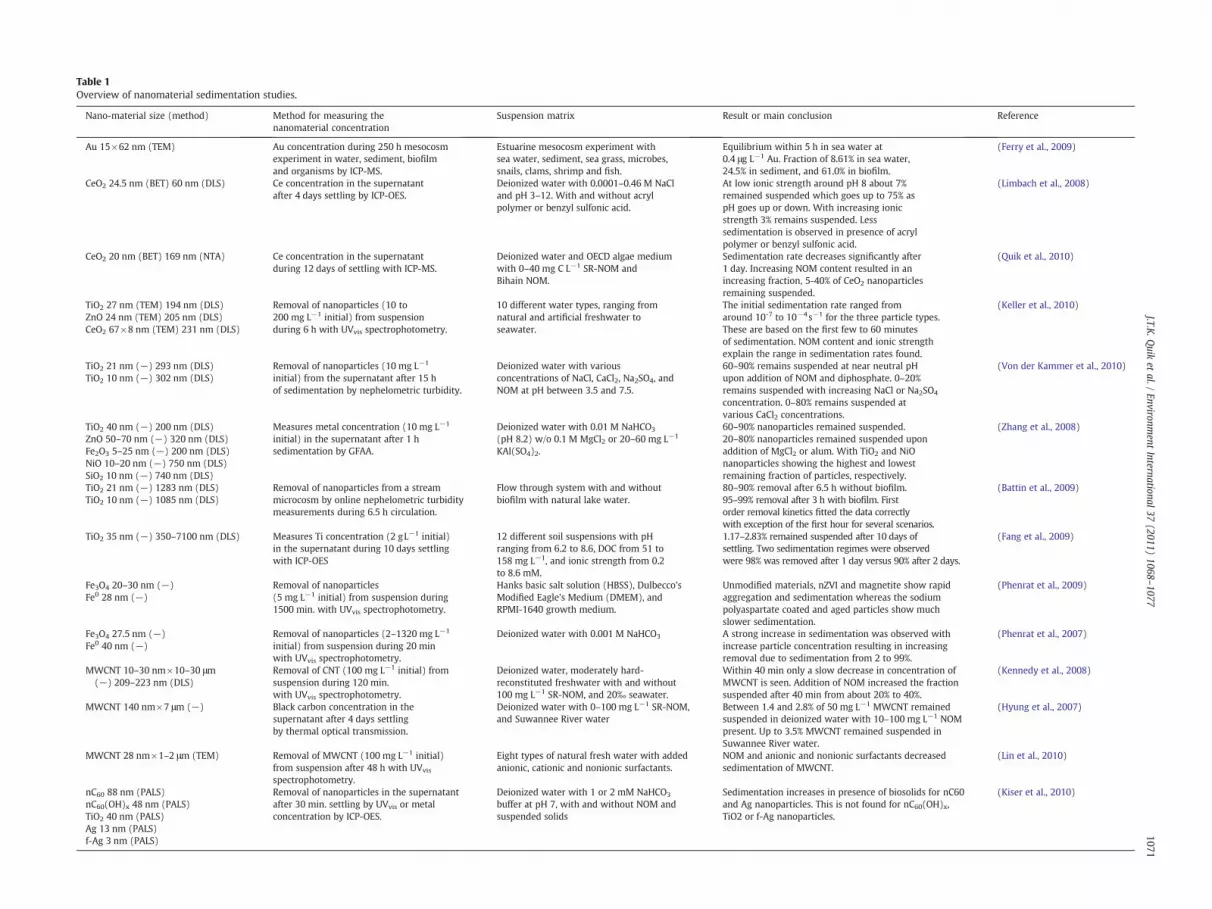
Table 1Overview of nanomaterial sedimentation studies.
Nano-material size (method) Method for measuring thenanomaterial concentration
Suspension matrix Result or main conclusion Reference
Au 15×62 nm (TEM) Au concentration during 250 h mesocosmexperiment in water, sediment, biofilmand organisms by ICP-MS.
Estuarine mesocosm experiment withsea water, sediment, sea grass, microbes,snails, clams, shrimp and fish.
Equilibrium within 5 h in sea water at0.4 μg L−1 Au. Fraction of 8.61% in sea water,24.5% in sediment, and 61.0% in biofilm.
(Ferry et al., 2009)
CeO2 24.5 nm (BET) 60 nm (DLS) Ce concentration in the supernatantafter 4 days settling by ICP-OES.
Deionized water with 0.0001–0.46 M NaCland pH 3–12. With and without acrylpolymer or benzyl sulfonic acid.
At low ionic strength around pH 8 about 7%remained suspended which goes up to 75% aspH goes up or down. With increasing ionicstrength 3% remains suspended. Lesssedimentation is observed in presence of acrylpolymer or benzyl sulfonic acid.
(Limbach et al., 2008)
CeO2 20 nm (BET) 169 nm (NTA) Ce concentration in the supernatantduring 12 days of settling with ICP-MS.
Deionized water and OECD algae mediumwith 0–40 mg C L−1 SR-NOM andBihain NOM.
Sedimentation rate decreases significantly after1 day. Increasing NOM content resulted in anincreasing fraction, 5-40% of CeO2 nanoparticlesremaining suspended.
(Quik et al., 2010)
TiO2 27 nm (TEM) 194 nm (DLS) Removal of nanoparticles (10 to200 mg L−1 initial) from suspensionduring 6 h with UVvis spectrophotometry.
10 different water types, ranging fromnatural and artificial freshwater toseawater.
The initial sedimentation rate ranged fromaround 10-7 to 10−4s−1 for the three particle types.These are based on the first few to 60 minutesof sedimentation. NOM content and ionic strengthexplain the range in sedimentation rates found.
(Keller et al., 2010)ZnO 24 nm (TEM) 205 nm (DLS)CeO2 67×8 nm (TEM) 231 nm (DLS)
TiO2 21 nm (−) 293 nm (DLS) Removal of nanoparticles (10 mg L−1
initial) from the supernatant after 15 hof sedimentation by nephelometric turbidity.
Deionized water with variousconcentrations of NaCl, CaCl2, Na2SO4, andNOM at pH between 3.5 and 7.5.
60–90% remains suspended at near neutral pHupon addition of NOM and diphosphate. 0–20%remains suspended with increasing NaCl or Na2SO4
concentration. 0–80% remains suspended atvarious CaCl2 concentrations.
(Von der Kammer et al., 2010)TiO2 10 nm (−) 302 nm (DLS)
TiO2 40 nm (−) 200 nm (DLS) Measures metal concentration (10 mg L−1
initial) in the supernatant after 1 hsedimentation by GFAA.
Deionized water with 0.01 M NaHCO3
(pH 8.2) w/o 0.1 M MgCl2 or 20–60 mg L−1
KAl(SO4)2.
60–90% nanoparticles remained suspended.20–80% nanoparticles remained suspended uponaddition of MgCl2 or alum. With TiO2 and NiOnanoparticles showing the highest and lowestremaining fraction of particles, respectively.
(Zhang et al., 2008)ZnO 50–70 nm (−) 320 nm (DLS)Fe2O3 5–25 nm (−) 200 nm (DLS)NiO 10–20 nm (−) 750 nm (DLS)SiO2 10 nm (−) 740 nm (DLS)TiO2 21 nm (−) 1283 nm (DLS) Removal of nanoparticles from a stream
microcosm by online nephelometric turbiditymeasurements during 6.5 h circulation.
Flow through system with and withoutbiofilm with natural lake water.
80–90% removal after 6.5 h without biofilm.95–99% removal after 3 h with biofilm. Firstorder removal kinetics fitted the data correctlywith exception of the first hour for several scenarios.
(Battin et al., 2009)TiO2 10 nm (−) 1085 nm (DLS)
TiO2 35 nm (−) 350–7100 nm (DLS) Measures Ti concentration (2 gL−1 initial)in the supernatant during 10 days settlingwith ICP-OES
12 different soil suspensions with pHranging from 6.2 to 8.6, DOC from 51 to158 mg L−1, and ionic strength from 0.2to 8.6 mM.
1.17–2.83% remained suspended after 10 days ofsettling. Two sedimentation regimes were observedwere 98% was removed after 1 day versus 90% after 2 days.
(Fang et al., 2009)
Fe3O4 20–30 nm (−) Removal of nanoparticles(5 mg L−1 initial) from suspension during1500 min. with UVvis spectrophotometry.
Hanks basic salt solution (HBSS), Dulbecco'sModified Eagle's Medium (DMEM), andRPMI-1640 growth medium.
Unmodified materials, nZVI and magnetite show rapidaggregation and sedimentation whereas the sodiumpolyaspartate coated and aged particles show muchslower sedimentation.
(Phenrat et al., 2009)Fe0 28 nm (−)
Fe3O4 27.5 nm (−) Removal of nanoparticles (2–1320 mg L−1
initial) from suspension during 20 minwith UVvis spectrophotometry.
Deionized water with 0.001 M NaHCO3 A strong increase in sedimentation was observed withincrease particle concentration resulting in increasingremoval due to sedimentation from 2 to 99%.
(Phenrat et al., 2007)Fe0 40 nm (−)
MWCNT 10–30 nm×10–30 μm(−) 209–223 nm (DLS)
Removal of CNT (100 mg L−1 initial) fromsuspension during 120 min.with UVvis spectrophotometry.
Deionized water, moderately hard-reconstituted freshwater with and without100 mg L−1 SR-NOM, and 20‰ seawater.
Within 40 min only a slow decrease in concentration ofMWCNT is seen. Addition of NOM increased the fractionsuspended after 40 min from about 20% to 40%.
(Kennedy et al., 2008)
MWCNT 140 nm×7 μm (−) Black carbon concentration in thesupernatant after 4 days settlingby thermal optical transmission.
Deionized water with 0–100 mg L−1 SR-NOM,and Suwannee River water
Between 1.4 and 2.8% of 50 mg L−1 MWCNT remainedsuspended in deionized water with 10–100 mg L−1 NOMpresent. Up to 3.5% MWCNT remained suspended inSuwannee River water.
(Hyung et al., 2007)
MWCNT 28 nm×1–2 μm (TEM) Removal of MWCNT (100 mg L−1 initial)from suspension after 48 h with UVvis
spectrophotometry.
Eight types of natural fresh water with addedanionic, cationic and nonionic surfactants.
NOM and anionic and nonionic surfactants decreasedsedimentation of MWCNT.
(Lin et al., 2010)
nC60 88 nm (PALS) Removal of nanoparticles in the supernatantafter 30 min. settling by UVvis or metalconcentration by ICP-OES.
Deionized water with 1 or 2 mM NaHCO3
buffer at pH 7, with and without NOM andsuspended solids
Sedimentation increases in presence of biosolids for nC60and Ag nanoparticles. This is not found for nC60(OH)x,TiO2 or f-Ag nanoparticles.
(Kiser et al., 2010)nC60(OH)x 48 nm (PALS)TiO2 40 nm (PALS)Ag 13 nm (PALS)f-Ag 3 nm (PALS)
1071J.T.K
.Quik
etal./
Environment
International37
(2011)1068
–1077

1072 J.T.K. Quik et al. / Environment International 37 (2011) 1068–1077
particle aggregates upon excretion from Daphnia magna has alsobeen described for C60 (Baun et al., 2008). In another study with CNTand D. magna, Roberts et al. (2007) showed a biological modificationof a water-soluble, lysophosphatidylcholine-coated single walledCNT upon ingestion by D. magna. The organisms decreased theconcentration of single walled CNT remaining in suspension after48 h by 50% by stripping of the lysophosphatidylcholie from theparticle surface.
Sedimentation seems to be largely dependent on environmentalcharacteristics, such as the presence of NOM or other stabilizing agentsand the ionic strength or presence of different electrolytes. Additionallysedimentation is affectedby the chemical composition of NMs, butmoreimportantly the presence of surface functionalization. The presence ofNOM, or surface modifications by functionalization, or capping by astabilizingagentdecreases the sedimentation rate, indicatedby the solidsymbols in Fig. 2. Non-functionalized carbon NMs show the fastestsedimentation followed by metal and metaloxide nanoparticles,indicated by open symbols in Fig. 2. This figure shows a selection ofsedimentation data of several types of NMs where the fractionremaining in suspension (Cw/C0) is given as function of sedimentationtime. Fig. 2, aswell as Fig. 3, was constructed by obtaining data from therespective publication or directly from the author. This data and theirrespective sources are given in Table A.1 in Appendix A.
3. Dissolution
An elaborate overview of studies on dissolution of NMs is providedin Table 2 and based on this the following discussion is focused at (i)particle properties like chemical composition and size, and on (ii) theeffect of the suspension matrix, like pH and NOM content.
3.1. Particle properties
Thechemical compositionofNMs, specifically at the interfacebetweenthe solid and liquid phase, is the basis for dissolution behavior. CarbonNMs are generally considered to be insoluble in water. However, in somecases the individual carbon particles in thewater phase can be consideredas dissolved, e.g. derivatized C60 or nanocrystals of C60 in water (termednC60).On theotherhand,metal oxideNMsshowagreat range indegreeofsolubility;metal oxide nanoparticles like TiO2 (Schmidt andVogelsberger,2009; Simon-Deckers et al., 2009) and CeO2 (Van Hoecke et al., 2009) arefound to be practically insoluble, whereas ZnO (Blinova et al., 2010;Franklin et al., 2007;Gerischer andSorg, 1992;Wonget al., 2010;Xia et al.,2008), CuO (Blinova et al., 2010), and Al2O3 (Johnson et al., 2005; Roelofsand Vogelsberger, 2006; Simon-Deckers et al., 2009; Vogelsberger et al.,2008) candissolveundernatural conditions. Althoughnotmuch is knownabout the dissolution kinetics of metal nanoparticles, several metals areknown to dissolve to some extent, e.g. Ag nanoparticles (Elzey andGrassian, 2010; Ho et al., 2010; Liu and Hurt, 2010; Stebounova et al.,2010).
One of the reasons for focusing on NM dissolution is the assumptionthat the greater surface to volume ratio would lead to increaseddissolution. For several types of NMs increased dissolution of thenanoparticulate form has been reported. Nanoparticulate CuO showed ahigher availability of Cu ions thanbulkCuOparticles, but lower availabilitythan CuSO4 salt, as measured by recombinant Escherichia coli Cu-sensor(Blinovaet al., 2010). Elzey andGrassian (2010)measured less dissolutionof bulkAgparticles (10 μm) compared toAgnanoparticles (10 nm)underthe same solution conditions. Ho et al. (2010)measured a size dependentdecrease in dissolution rate with increasing particle diameter for Agnanoparticles ranging from 5 to 20 nm. The dissolution rate of PbSnanoparticles varied by at least 1 order of magnitude as a function ofparticles size, and also due to the aggregation state of the particles (Liuet al., 2009). The increased dissolution for NMs is not always clear, in astudy by Franklin et al. (2007), no difference was found betweendissolution of the bulk andnanoformof ZnO. Additionally nanoparticulate
ZnO showed similar bioavailability of Zn ions as bulk and ZnSO4 salts in 6types of river water, as reported by Blinova et al. (2010) who measuredthebioavailability of Zn ions by recombinant E. coliZn-sensor.However, inanother study with 26 nm and 216 nm sized ZnO particles, Wong et al.(2010) found that the ZnO nanoparticles showed greater dissolution inseawater than the larger ZnO particles, reaching equilibrium concentra-tions of 3.7 mg L−1 and 1.6 mg L−1 Zn respectively, within 72 h. Althoughthis is whatwould be expected because of the higher surface area of NMs,there is a possibility that the higher dissolution found by Wong et al.(2010) is due to fractionation error between the particulate and dissolvedby 0.1 μm filtration, leaving the possibility of 26 nm particles to pass thefilter. Although the effect of increased dissolution of NMs compared totheir counterpart is not found for ZnO, otherNMs, likeCuO,Ag andPbSdidshow this effect,making it likely that indeed the large surface area of NMscompared to that of bulkmaterials causes an increase in dissolution rates.
3.2. Aquatic matrix
Mostmetal andmetal oxideNMs(Ag, TiO2, and ZnO) show increaseddissolution at extreme pH values (Elzey and Grassian, 2010; Gerischerand Sorg, 1992; Ho et al., 2010; Schmidt and Vogelsberger, 2009).Dissolution of Ag NMs is primarily due to oxidation of surface Ag0 toionic Ag+ (Ho et al., 2010; Liu and Hurt, 2010). Liu and Hurt (2010)found that in 2 mg L−1 Ag at pH 4 less than 0.05 mg L−1 Ag dissolvedunder anoxic conditions compared to 0.6 mg L−1 Ag in an air saturatedsolution. With increasing pH from 4 to 9, the dissolution of Agnanoparticles decreased in deionized water, as measured after 1 dayequilibrating. Elzey and Grassian (2010)measured a similar decrease inAg dissolutionwith increasing pH from 0.5 to 6.5. Ho et al. (2010) founda strong relationship between the concentration of H2O2 with thedissolution rate of Ag nanoparticles. In presence of H2O2, an increase indissolution rate with increasing pH from pH 6 to 8.5 is seen (Ho et al.,2010). This is likely due to the increased H+ concentration counteractstheoxidizing effect ofH2O2. On theother hand, Fabrega et al. (2009) alsofound an increase in dissolved Ag with increasing pH from 6 to 9 inbacteria growth medium, in absence of H2O2.
Several studies have shown the importance of NOM in particledissolution (Blinova et al., 2010; Ho et al., 2010; Johnson et al., 2005; Liuand Hurt, 2010). For Ag nanoparticles, the addition of Poly-vinylpyrro-lidone (PVP) or NOM decreased the dissolution of Ag nanoparticles(Blinova et al., 2010;Gaoet al., 2009;Hoet al., 2010; Liu andHurt, 2010).Also forAlOH2particles suspensions atpH3, the addition of fulvic acid asa type of NOM decreased dissolution (Johnson et al., 2005). Most likelythis decrease is due to ions adsorbed to NOM not passing theultrafiltration membranes used. Metal ions form complexes with NOMwhich reduces their bioavailability, as shown forCu andZn ions (Blinovaet al., 2010). Furthermore, the presence of Halide ions Cl− and Br−
caused a large decrease in oxidative dissolution of Ag nanoparticles (Hoet al., 2010). The formation of AgCl or AgBr on the surface of the Agparticles or the precipitation of AgCl or AgBr could explain the lowerdissolved Ag measured. The difference in methods used to distinguishbetween dissolved and particulate chemicals can be seen in Table 2.Unfortunately most studies do not test the purity of used NMs forpresence of precursor materials containing the dissolved metals.Moreover the exclusion of particulate NMs from solution needs to betested to validate the measurement method. This beckons thedevelopment of standard measurement methods for dissolved partic-ulate matter.
Although thedissolutionbehavior ofNMs is not fully understoodandneeds further investigation, it is clear that environmental conditions,like pH, presence of oxidizing agents or certain electrolytes as well asparticle properties like size and surface chemistry can change the degreeof dissolution. A selection of dissolution data for several types of NMs ispresented in Fig. 3 (see Table A.2 in Appendix A for data and sources). Along term study monitoring the dissolution of clay minerals, zeolites,and quartz in seawater indicated that the dissolution can be described

0
0.2
0.4
0.6
0.8
1
1E+2 1E+3 1E+4 1E+5 1E+6 1E+7
Cw
/C0
Time (s)
MWCNT (a, Kennedy 2008) MWNT (Hyung 2007) MWCNT (b, Kennedy 2008)CeO2 (Keller 2010) CeO2 (a, Quik 2010) CeO2 (b, Quik 2010)CeO2 (c, Quik 2010) Fe0 (a, Phenrat 2009) Fe0 (b, Phenrat 2009)Fe0 (c Phenrat 2009) TiO2 (Battin 2009) TiO2 (Keller 2010)ZnO (Keller 2010)
Fig. 2. Fraction of nanomaterial, Cw/C0, remaining in suspension as a function ofsedimentation time. A distinction is made between nanomaterials with (filled) andwithout (open)NOMor surfacemodification. The linespresent afirst order removalmodel(Cw/C0=exp(−ksed t)) with ksed values ranging from 2×10⁻⁶ to 10−3s−1.
0
0.2
0.4
0.6
0.8
1
1E+4 1E+5 1E+6 1E+7Time (s)
TiO2 (Schmidt 2009) Al2O3 (Roelofs 2006) ZnO (a, Franklin 2007)ZnO (b, Franklin 2007) ZnO (a, Wong 2010) ZnO (b, Wong 2010)Ag (a, Liu 2010) Ag (b, Liu 2010) Ag (c, Liu 2010)Ag (Fabrega 2009)
Cw
/C0
Fig. 3. Fraction of nanomaterial (open) and bulk material (filled), Cw/C0, remaining insuspension as function of dissolution time. The lines present a first order removalmodel (Cw/C0=exp(−kdis t)) with kdis values ranging from 10−5 to 10−8s−1.
1073J.T.K. Quik et al. / Environment International 37 (2011) 1068–1077
by a first order reaction (Lerman et al., 1975). Characteristic rateconstants were found to be in the order of 10−7 s−1. The data presentedin Fig. 3 suggests that first order removal rates up to about 10−5 s−1 areto be expected for manufactured NMs. It should be noted that thedissolution of NMs only changes the chemical form in which thischemical is present in the water phase. Similarly, sedimentationremoves the particles from the water phase, but increases theirconcentration in the sediment, although in an aggregated form.
4. Possibilities for modeling behavior of nanomaterials in water
In the last couple of years, models and frameworks to describe thefate and distribution of NMs have been developed, some of whichincorporate classical knowledge of colloid science (Arvidsson et al.,2011; Burguera et al., 2008; Kim et al., 2007; SCENIHR, 2009; Seijo et al.,2009; Taboada-Serrano et al., 2005) and others which apply principlesused for chemical fatemodeling andmaterialflow analysis (Blaser et al.,2008; Boxall et al., 2007; Gottschalk et al., 2010a,b; Koelmans et al.,2009; Mueller and Nowack, 2008). Gottschalk et al. (2010a,b) provide amodel approach that may prove very valuable once more data becomeavailable to populate the probabilistic sub-models included. The modeldevelopedbyKoelmanset al. (2009), inwhich they coupled thematerialflowmodel ofMueller andNowack (2008)with sedimentation, is one ofthe first attempts to incorporate a NM relevant fate process in themodeling of environmental exposure. As described in the presentreview, a number of particle-specific fate equations will however needto be included in order obtain “nano relevance”. Among these aresedimentation, agglomeration, and dissolution, which all are dynamic,non-equilibrium processes. Future models must therefore focus inkinetics of fate processes. Arvidsson et al. (2011) have developed such akinetic model for the aquatic environment based on colloid chemistryprinciples. A sensitivity analysis of the model using 21 nm TiO2
nanoparticles showed that the model output was mostly influencedby changes in inflowof nanoparticles to thewater compartment and thecollision efficiency.
The main challenge is to use the quantitative knowledge of theseprocesses to turn current models “fit for nano”. Can current waterquality models be “simply upgraded” with nano-specific processdescriptions? Conceptually, if transport of NMs to and from the watercolumn can be described sufficiently well by first order kinetics, thisshould not be difficult, and themain challenge ofmodeling the behaviorof NMs inwaterwould be to quantify thefirst order rate constants of thenano-specific processes. Below, we will discuss possibilities and
limitations on the implementation of these first order rate constantsfor the important processes sedimentation and dissolution of NMs.
4.1. Sedimentation
Interactions between water and (suspended) sediments havetraditionally been described as equilibriumpartitioning. At equilibrium,the ratio of concentrations of substance associated with the solid phaseρsCs and the concentration in the water phase Cw is given by adistribution constant Kd, the value of which follows from the differencein Gibbs free energy ΔG between the dissolved and adsorbed states:
ρsCs = Kd⋅Cw with Kd = e−ΔG=RT: ð2Þ
This equilibriumpartitioning concept has been used for NMs aswell.Koelmans et al. (2009) have applied Kd-values of 103–105 Lkg−1 asreported by Ferguson et al. (2008) to calculate sedimentation fluxes ofCNT. Cornelis et al. (2010) compared theextent of partitioningof solubleand nanoparticulate Ag and CeO2 to soil particles by measuring Ag andCe in filtrates of spiked soil suspensions, reporting the ratio ofmeasuredconcentrations as a partition coefficients. This is remarkable from acolloid science perspective, where distribution between aggregated anddispersed states is believed to reflect a kinetic limitation, rather than athermodynamic equilibrium. Colloidal systems are considered thermo-dynamically unstable in the sense that ΔG between aggregated anddispersed states are generally great, favoring near-complete associationof NMs with the solid surface present in natural water. According tocolloid science, observed solid–water concentration ratios of NMs havelittle predictive power indescribingbehavior ofNMs inwater–sedimentsystems.
As discussed in a recent review by Petosa et al. (2010), DLVO theoryprovides the concepts necessary tomodel aggregation anddeposition ofNMs. The rate of aggregation between two primary nanoparticles atnumber concentration N (m−3) is described by:
dNdt
= −kN2; ð3Þ
of which the solution is:
N = N01
1 + kN0t; ð4Þ

1074 J.T.K. Quik et al. / Environment International 37 (2011) 1068–1077
and inwhich k (m3s−1) represents the (second-order) aggregation rateconstant, N0 (m−3) the initial number concentration, and t (s−1) theaggregation time . When there is no repulsive (activation) energy toovercome, fast aggregation, limited only by thermal (Brownian)motionof the particles, occurs with the so-called Von Smoluchowski aggrega-tion rate constant. In presence of an energy barrier, only particles with athermal energy great enough to pass the activated transition state canapproach each other close enough for aggregation to occur. UsingBoltzmann's law to describe the fraction of particles with sufficientthermal energy, an expression for the aggregation rate (k) is derived:
k =4kT3η
αa≈4kT3η
2κap e−Vmax =kBT ; ð5Þ
in whichαa (dimensionless) is the attachment efficiency, κ (m−1) is theinverseDebeye length (characteristic electric double layer thickness), ap(m) the particle radius, Vmax (J) is the energy of inter particle repulsion,kB (J K−1) is the Boltzmann constant, T (K) is the temperature, and η(N sm−2) is the viscosity of the liquid phase.
As aggregation proceeds, particle aggregates grow in size andbecome more prone to settling by gravity, the settling rate vs (m s−1)which follows from Stokes’ law and can be derived as:
vs =2a2
p ρp−ρw� �
g
9η; ð6Þ
where ap (m) is the particle radius, ρ represents density (kg m−3) ofparticles and water respectively, g (m s−2) is the gravitation constant,and η (N sm−2) is the viscosity of water. The net result is thataggregation leads to removal of nanoparticles from water. Depositionof primary nanoparticles onto the larger solid particles plentifullypresent in all natural waters, of which the majority will tend to settleas well, will similarly result in removal of the NM from water.Unfortunately, colloid science, in spite of its maturity, cannottheoretically predict the removal rates that should be expected fornanoparticles. As pointed out by Arvidsson et al. (2011), the mainreason is that numerical values for Vmax cannot be determined easilyfrom classical DLVO theory alone, so that for specific systemsattachment efficiencies need to be measured experimentally.
Theory does explain, however, which kinetics are to be expected forthe removal of nanoparticles from water. Inter particle collision (andthus aggregation) is second-order in nature. However, as the “amount”of collision capacity (sum of nanoparticles and sum of natural solidsurfaces) in natural waters is expected to remain approximatelyconstant throughout the removal process, the second-order naturewill tend to reduce to pseudo first order. Moreover, removal of solidsfrom water by sedimentation is entirely first order in relation to theconcentration of suspended solids. Therefore, the overall kinetics ofwater-sediment transport of nanoparticles should be close to first order,which is not necessarily inconsistent with the empirically observedkinetics shown in Fig. 2. Current exposure models of the behavior ofconventional chemicals can thus be upgraded to become "fit for nano"by simply adding a first order rate constant for transport from water tosediment. Kinetic theory of particle–particle and particle–surfaceinteractions may not be sufficient to quantitatively predict first orderconstants, but certainly helps making order-of-magnitude estimates.
4.2. Dissolution
In spite of its obvious importance for exposure assessment, little isknown about solubility and rates of dissolution of NMs in water. Inabsence of such knowledge, modeling dissolution remains highlyspeculative. As NMs are engineered to survive in the (often water-
rich) environments where they are used, it should not come as asurprise that the chemical substances of which the NMs are made(oxides, sulfides, metals, and carbon) are generally poorly soluble inwater. However, the large volumes ofwater in the environment can andwill dissolve relatively small amounts of poorly soluble solidseventually. Removal of NMs fromwater is to bemodeled by quantifyingthe rate at which dissolution proceeds.
Dissolution can, at least in principle, be described as a surface-controlled process:
dMdt
= −kSA: ð7Þ
The amount M (kg) of NM that dissolves in water per unit timet (s) is expected to be proportional to the area A (m2) of thenanoparticles' surface and to the concentration of dissolved materialnear the particle's surface, which should be close to the chemical'swater solubility S (kg m−3). The dissolution rate constant k (m s−1)reflects the local hydrodynamic conditions near the nanoparticle–water interface, of which little which is known. As the rate ofdissolution is proportional to the particles' surface area, rather than tothe particles' mass, first order kinetics of dissolution should beexpected only when area and mass are proportional. This should notbe expected, because the specific surface area (area per unit mass) ofparticles is expected to increase with the decrease in particle size,resulting from dissolution itself. However, the limited data presentedin Fig. 3 does not positively indicate first order kinetics, mainlybecause there are no data points below 50% removal. On the otherhand the data does not contradict this either. In absence of moreadequate data we find that using first order kinetics for dissolution ofNMs is acceptable. This does indicate the large knowledge gap thatremains to be filled before dissolution can be modeled adequately.We suggest to model removal of nanoparticles from water by addinganother first order removal rate constant, the magnitude of whichneeds to be measured experimentally.
4.3. Proposed model for exposure assessment of aquatic organisms tonanomaterials
The water model for chemical substances of Fig. 1 could be writtenas:
dCdt
= E−Σk C with Σk = kadv + kvol + kdeg + ksed + kdiss; ð8Þ
where
C =mass concentrationof freenanoparticles inwater (kg m−3)E =volume-specific release rate of NM to water (kg m−3 s−1)kadv =first order rate constant for removal via advection (s−1)kvol =first order rate constant for removal via volatilization (s−1)kdeg =first order rate constant removal via (chemical)
degradation (s−1)ksed =first order rate constant for removal via aggregation/
deposition and sedimentation (s−1)kdiss =first order rate constant for removal via dissolution (s−1)
Formulated this way, the challenge of modeling is placed entirely inassigning values to the various rate constants, which can be seen asstrength andweakness at the same time. The obviousweakness is that anew removal rate needs to be measured for each individual NM.The advantage is that it provides one single approach to modeling ofconventional chemical substances and NMs. This allows quantitativeevaluation of the relative importance of the various removalmechanisms, as they act on substances with different properties

Table 2Overview of nanomaterial dissolution studies.
Particle size (method) Method of measuringdissolved nanomaterials
Suspension matrix Result or main conclusion Reference
Ag 1.9 nm (DLS) 4.8 nm (TEM) Ultrafiltration (1–2 nm pore size)followed by GFAA.
Deionized water with varyingtemperature, pH, NOM, andionic strength in oxic andanoxic conditions
Almost 100% dissolution of 2 mg L−1 after 125 daysequilibrating. Dissolution increases with temperature,up to 37 °C. Dissolution decreases with increasing pHand with increasing NOM content.
(Liu and Hurt, 2010)
Ag 10 nm (−) 2–30 nm (TEM) Filtration (0.2 μm) and centrifugation(14,000 rpm for 30 min) followedby ICP-OES.
Deionized water at pH 6.5, andvarying pH 0.5–3.50 with HNO3
0.5% dissolution in deionized water at pH 6.5.Dissolution increases with increasing pH. Lowerdissolution of bulk compared to nanoparticles.
(Elzey and Grassian, 2010)Ag 10 μm (−)
Ag 65 nm (TEM) 100 nm (XRD) Ultrafiltration (1 kDa) followed byICP-MS analysis
Minimal davies bacteria growthmedium at pH 6, 7.5 and 9.
Less than 2% dissolution for 2 to 2000 μg L−1 Agnanoparticle suspensions.
(Fabrega et al., 2009)
Ag 6.5–11.7 nm (DLS) Filtration (0.2 um) and centrifugation(14,000 rpm for 30 min) followedby ICP-OES.
Artificial interstitial fluid andartificial lysosomal fluid as at38 °C.
0.03–0.07% dissolution of 0.2–2 gL−1 Ag nanoparticlesuspensions after 96 h.
(Stebounova et al., 2010)
Ag 3–20 nm (TEM) Ultrafiltration (3 kDa) followed byspectrophotometric or ICP-MS analysis
Buffer solutions of Tris–acetic acid,Tris–trifluoroacetic acid andNaOAc-HOAc, with varyingconcentrations H2O2 and pH.
Oxidative dissolution follows first order kinetics (fornanoparticles 5–20 nm in size). Dissolution rateincreases with decreasing size, and with increasing[H2O2], chloride or bromide ions reduced dissolution.
(Ho et al., 2010)
Ag 20–30 nm (−) Measures the MetPLATE response whichis thought to respond only to metal ions.
Deionized water and three typesof Suwannee river water.
Cu showed an increased response in river water withincreasing ionic strength. Ag only showed a responsein river water with highest ionic strength and lowestNOM concentration.
(Gao et al., 2009)Cu 15–45 nm (−)
Al2O3 10.1 nm (BET) Al3+ by complexation withEriochromcyanine R and subsequentanalysis by spectrophotometry (535 nm).
Deionized water at pH 3 to 11,set with HCl and KOH.
Higher dissolution at pH extremes, high and low. Higherdissolution measured during the first 48 hours ofequilibrating followed by a lower stabilized Al3+
concentration.
(Roelofs and Vogelsberger, 2006)
Al2O3 11 nm (TEM) Centrifugation (8000 g for 1 h) andfiltration (0.022 μm) followed byICP-MS analysis.
Unclear, either water or exposuremedium.
No TiO2 dissolution, 0.3% Al2O3 dissolution. (Simon-Deckers et al., 2009)TiO2 12–707 nm (TEM)
Al2O3 300 nm (−) Filtration (0.02 um) followed by ICP-MSanalysis.
Deionized water at pH 2 to 10with 0.01 M NaCl and fulvic acid.
0.001% dissolution between pH 5 and 9 with initialconcentration of 50 gL−1 Al2O3 nanoparticles incubatedfor 72 h. Dissolution decreased with fulvic acid.
(Johnson et al., 2005)
CeO2 14–29 nm (BET) Measures dissolved Ce by ultrafiltration(10 kDa) followed by ICP-MS.
Algal growth medium at pH 7.4. No dissolved Ce could be measured in suspensions ofCeO2 nanoparticles in algae growth medium.
(Van Hoecke et al., 2009).
Fe2O3 10 nm (DLS) Ultrafiltration (pore size not reported)followed by UV–vis spectrophotometry.
Deionized water at pH 2–5 10–35% dissolution at low pH. (Baalousha et al., 2008)
PbS 14.4 nm (TEM) Filtration (0.45 um for 3.1 um particlesand 100 nm and 6 nm for 14.4 nmparticles) followed by ICP-AES analysis.
Deionized water at pH 3 underanoxic conditions
Dissolution rates measured are 4.4×10⁻⁹ mol m−2s−1
for dispersed 14 nm nanocrystals; 7.7×10⁻¹⁰ mol m−2s−1
for dispersed 3.1 μm microcrystals; and 4.7×10⁻¹⁰
mol m−2s−1 for aggregated 14 nm nanocrystals.
(Liu et al., 2009)PbS 3.1 μm (TEM)
SiO2 3.35 nm (BET) A spectrophotometric method withmolybdic acid
TRIS buffer at pH 7.4–7.8 at 25 °Cwith 0.11 M NaCl.
Equilibrium concentration of about 100 mg L−1 SiO2
reached within about 50 h of equilibrating. It was notreported if molybdic acid forms complexes at the SiO2
nanoparticles interface.
(Vogelsberger et al., 2008)
TiO2 4.7–28.3 nm (BET) Centrifugation (4100 rpm for 10 min)and filtration (0.2 μm) followed byAdsorptive Stripping Voltammetry (AdSV)
Deionized water with 0.1 M NaCl Measured the lowest dissolution at pH 4–10 of about0.05 μg L−1 Ti. Higher dissolution was measured atpH 1 and pH 13, up to about 500 μg L−1.
(Schmidt and Vogelsberger, 2009)
CuO 30 nm (−) Response of the recombinantbioluminescent Zn-sensor and Cu-sensorbacteria E. coli.
Artificial freshwater (AFW) and6 different types of River water
12% of CuO (nanoparticles) and 100% ZnO (bulk andnanoparticles) dissolved in AFW, less in river water. 0.3%of bulk CuO dissolved in AFW.
(Blinova et al., 2010)ZnO 70 nm (−)
ZnO 26 nm (TEM) Filtration (0.1 um) followed by ICP-OESanalysis.
Filtered artificial seawater(salinity: 30‰), pH 8.0.
4.6% nano ZnO and 2% bulk ZnO dissolved after 150 hequilibration.
(Wong et al., 2010)ZnO 216 nm (TEM)ZnO 30 nm (−) Dialysis (1 kDa membrane) followed by
ICP-AESDeionized water with 0.01 MCa(NO3)2 buffered to pH 7.6 with 2 mMpiperazine-N,N′-bis(ethanesulfonic acid)
19% dissolution of bulk and nano ZnO after 72 h equilibrating.Slightly higher fraction of the nano ZnO is dissolved whenfiltered 0.1 μm instead of dialysed 1 kDa, 0.4 mg L−1 difference.
(Franklin et al., 2007)ZnO bulk, unknown size
ZnO 13 nm (BET) Centrifugation (20,000 g for 5 min.)followed by ICP-MS analysis
Deionized water, bronchial epithelialgrowth medium, with 10% fetal calfserum at near neutral pH.
Up to 7 mg L−1 Zn dissolved, but possibly the centrifugalmethod does not separate all nanoparticles from dissolved Zn.
(Xia et al., 2008)
ZnO (Electrode coating) Used electrodes and related conductivity. Deionized water with 0.5 M KCl at pH 1 to 6 Reported dissolution rates ranging from about10−7 mol cm−2h−1 for pH 6 to 10−4 mol cm−2h−1 for pH 1.
(Gerischer and Sorg, 1992) 1075J.T.K
.Quik
etal./
Environment
International37
(2011)1068
–1077

Table 3Comparison of characteristic and [range] of rate constants (s−1) for removal ofnanoparticles from water by dissolution and aggregation/sedimentation with otherrelevant removal processes.
Conventional chemicals Nanomaterials
Advection 10−6 [0–10−5] 10−6 [0–10−5]Volatilization 4×10⁻⁹ [0–10−6] –
Degradation 10−7 [10−8–10−5] –
Transport to sediment 8×10⁻¹⁰ [0–10−6] ? [0–10−4]Dissolution – ? [0–10−5]
1076 J.T.K. Quik et al. / Environment International 37 (2011) 1068–1077
(e.g. conventional vs. nano-chemicals) in different aquatic environ-ments (e.g. rivers vs. lakes). NMs do not volatilize, whereas forconventional chemicals dissolution is irrelevant. Removal as a result oftransport to sediment is modeled by assigning first order rate constantsto both conventional chemicals and NMs, albeit on very differentmechanistic grounds. Removal by advection follows entirely from thehydrodynamics of the water body; its influence on the concentration inwater is independent of the nature of the chemical considered.
Table 3 lists some typical values of removal rate constants for bothconventional chemicals and NMs in water systems and shows theuncertainty estimations for these rate constants. Rate constants forremoval of NMs by transport to sediment and dissolution wereestimated from the material presented in this paper, scaled from thelengths and volumes typical of laboratory experiments to the muchgreater scales of real water systems. Rate constants for other removalprocesses were obtained by calculations with the spreadsheet modelSimpleBox (Hollander et al., 2004)—the EUSESmodel prescribed for usein REACH (REACH R.16) was derived from this model—applied to the3000+ organic substances in the USEtox database (Hauschild et al.,2008; Rosenbaum et al., 2008). In the typical waters considered inenvironmental risk assessments under REACH, degradation, volatiliza-tion, and transport to sediment play important roles in removal only forconventional chemicals with rather extreme properties. In contrast,transport of NMs from water to sediment (and dissolution of NMsas well) seem to be generally more rapid than volatilization,degradation, and sedimentation of conventional chemicals. Removalof NMs fromwater through sedimentation and dissolution seems to beof similar or even greater relative importance than loss by advection.
In conclusion current exposure assessment models cannot be usedfor nanomaterials without making adjustments to account for nano-specific processes. The most important of these, sedimentation anddissolution can be incorporated into current exposure assessmentmethods by adding first order removal rates. However, theoreticaldescription of the colloidal behavior of nanoparticles is currentlyinsufficient to generically calculate rate constants. In absence of that,rate constants forNMsneed tobemeasured experimentally for differenttypes and in different environments. Although this is difficult, timeconsuming and costly, current literature suggests that useful informa-tion to this end can be generated. Observations on real environmentalsystems are required for this purpose. Such information is also requiredfor validation of the predicted exposure concentrations. Obviously,further development of measurement and modeling methods ofexposure concentrations of NMs is beneficial. Specifically experimentaldata on dissolution of NMs and the interaction of natural colloids withNMs and its effect on sedimentation in natural waters are needed.
Supplementarymaterials related to this article can be found onlineat doi:10.1016/j.envint.2011.01.015.
Acknowledgements
This work was funded by the European Union Sixth FrameworkProgrammeNanoInteract NMP4-CT-2006-033231 and the RIVM strategic
research programme SOR-S340030. We thank Martien Cohen Stuart forhis suggestions.
References
Arvidsson R, Molander S, Sandén BA, Hassellov M. Challenges in exposure modeling ofnanoparticles in aquatic environments. Hum Ecol Risk Assess 2011;17.
Baalousha M, Manciulea A, Cumberland S, Kendall K, Lead JR. Aggregation and surfaceproperties of iron oxide nanoparticles: influence of ph and natural organic matter.Environ Toxicol Chem 2008;27:1875–82.
Battin TJ, Kammer FVD, Weilhartner A, Ottofuelling S, Hofmann T. Nanostructured tio2:transport behavior and effects on aquatic microbial communities under environmen-tal conditions. Environ Sci Technol 2009;43:8098–104.
BaunA, Sørensen SN, Rasmussen RF,HartmannNB, KochCB. Toxicity and bioaccumulationof xenobiotic organic compounds in the presence of aqueous suspensions ofaggregates of nano-c60. Aquat Toxicol 2008;86:379–87.
Blaser SA, Scheringer M, MacLeod M, Hungerbühler K. Estimation of cumulative aquaticexposure and risk due to silver: contribution of nano-functionalized plastics andtextiles. Sci Total Environ 2008;390:396–409.
Blinova I, Ivask A, Heinlaan M, Mortimer M, Kahru A. Ecotoxicity of nanoparticles of cuoand zno in natural water. Environ Pollut 2010;158:41–7.
Boxall AB, Tiede K, ChaudhryQ. Engineered nanomaterials in soils andwater: how do theybehave and could they pose a risk to human health? Nanomedicine 2007;2:919–27.
BurgueraEF, LoveBJ, Sahul R,NgatuG,WereleyNM.Aphysicalbasis for stability inbimodaldispersions including micrometer-sized particles and nanoparticles using both linearand non-linear models to describe yield. J Intell Mater Syst Struct 2008;19:1361–7.
Cornelis G, Kirby JK, Beak D, Chittleborough D, McLaughlin MJ. A method fordetermination of retention of silver and cerium oxide manufactured nanoparticlesin soils. Environ Chem 2010;7:298–308.
ECHA. Guidance on information requirements and chemical safety assessment. Version 1.1.European Chemical Agency. Available at http://echa.europa.eu/reach_en.asp 2008.
Elzey S, Grassian V. Agglomeration, isolation and dissolution of commerciallymanufactured silver nanoparticles in aqueous environments. J Nanopart Res2010;12:1945–58.
EU. European Union system for the evaluation of substances (euses). Version 2.1.Institute for Health and Consumer Protection ECB, European Union; 2008.
Fabrega J, Fawcett SR, Renshaw JC, Lead JR. Silver nanoparticle impact on bacterial growth:effect of ph, concentration, and organicmatter. Environ Sci Technol 2009;43:7285–90.
Fang J, Shan X-Q, Wen B, Lin J-M, Owens G. Stability of titania nanoparticles in soilsuspensions and transport in saturated homogeneous soil columns. Environ Pollut2009;157:1101–9.
Ferguson PL, Chandler GT, Templeton RC, Demarco A, Scrivens WA, Englehart BA.Influence of sediment-amendment with single-walled carbon nanotubes and dieselsoot on bioaccumulation of hydrophobic organic contaminants by benthicinvertebrates. Environ Sci Technol 2008;42:3879–85.
Ferry JL, Craig P, Hexel C, Sisco P, Frey R, Pennington PL, et al. Transfer of gold nanoparticlesfrom the water column to the estuarine food web. Nat Nano 2009;4:441–4.
FilellaM, Rellstab C, Chanudet V, Spaak P. Effect of the filter feeder daphnia on the particlesize distribution of inorganic colloids in freshwaters. Water Res 2008;42:1919–24.
Franklin NM, Rogers NJ, Apte SC, Batley GE, Gadd GE, Casey PS. Comparative toxicity ofnanoparticulate zno, bulk zno, and zncl2 to a freshwater microalga (pseudokirchner-iella subcapitata): the importance of particle solubility. Environ Sci Technol 2007;41:8484–90.
Gao J, Youn S, Hovsepyan A, Llaneza VNL,Wang Y, Bitton G, et al. Dispersion and toxicityof selected manufactured nanomaterials in natural river water samples: effects ofwater chemical composition. Environ Sci Technol 2009;43:3322–8.
Gerischer H, Sorg N. Chemical dissolution of zinc oxide crystals in aqueous electrolytes—an analysis of the kinetics. Electrochim Acta 1992;37:827–35.
Gottschalk F, Scholz RW, Nowack B. Probabilistic material flow modeling for assessingthe environmental exposure to compounds: methodology and an application toengineered nano-tio2 particles. Environ Modell Softw 2010a;25:320–32.
Gottschalk F, Sonderer T, Scholz RW, Nowack B. Possibilities and limitations ofmodeling environmental exposure to engineered nanomaterials by probabilisticmaterial flow analysis. Environ Toxicol Chem 2010b;29:1036–48.
Guldberg M, Christensen VR, Perander M, Zoitos B, Koenig AR, Sebastian K. Measurementof in-vitro fibre dissolution rate at acidic ph. Ann Occup Hyg 1998;42:233–43.
Handy R, von der Kammer F, Lead J, Hassellöv M, Owen R, Crane M. The ecotoxicologyand chemistry of manufactured nanoparticles. Ecotoxicology 2008;17:287–314.
HauschildMZ,HuijbregtsM, Jolliet O,MacleodM,MargniM, vandeMeentD, et al. Buildinga model based on scientific consensus for life cycle impact assessment of chemicals:the search for harmony and parsimony. Environ Sci Technol 2008;42:7032–7.
Ho CM, Yau SKW, Lok CN, SoMH, Che CM. Oxidative dissolution of silver nanoparticles bybiologically relevant oxidants: a kinetic and mechanistic study. Chem Asian J 2010;5:285–93.
Hollander DHA, Eijkeren VJCH, Meent VDD. Simplebox 3.0: multimedia mass balancemodel for evaluating the fate of chemical in the environment. National Institute ofPublic Health and the Environment; 2004. Available at.
Hyung H, Fortner JD, Hughes JB, Kim JH. Natural organic matter stabilizes carbonnanotubes in the aqueous phase. Environ Sci Technol 2007;41:179–84.
Jakab S, Picart SB, Tribollet B, Rousseau P, Perrot H, Gabrielli C. Study of the dissolution ofthin films of ceriumoxide by using a gapo4 crystalmicrobalance. Anal Chem2009;81:5139–45.
Johnson SB, Yoon TH, BrownGE. Adsorption of organicmatter atmineral/water interfaces:5. Effects of adsorbed natural organic matter analogues on mineral dissolution.Langmuir 2005;21:2811–21.
1077J.T.K. Quik et al. / Environment International 37 (2011) 1068–1077
Keller AA, Wang H, Zhou D, Lenihan HS, Cherr G, Cardinale BJ, et al. Stability andaggregation of metal oxide nanoparticles in natural aqueous matrices. Environ SciTechnol 2010;44:1962–7.
Kennedy AJ, Hull MS, Steevens JA, Dontsova KM, Chappell MA, Gunter JC, et al. Factorsinfluencing the partitioning and toxicity of nanotubes in the aquatic environment.Environ Toxicol Chem 2008;27:1932–41.
Kim C, Liu Y, Kühnle A, Hess S, Viereck S, Danner T, et al. Gravitational stability ofsuspensions of attractive colloidal particles. Phys Rev Lett 2007;99:028303.
Kiser MA, Ryu H, Jang H, Hristovski K, Westerhoff P. Biosorption of nanoparticles toheterotrophic wastewater biomass. Water Res 2010;44:4105–14.
Klaine SJ, Alvarez PJJ, Batley GE, Fernandes TF, Handy RD, Lyon DY, et al. Nanomaterials inthe environment: behavior, fate, bioavailability, and effects. Environ Toxicol Chem2008;27:1825–51.
Koelmans AA, Nowack B, Wiesner MR. Comparison of manufactured and black carbonnanoparticle concentrations in aquatic sediments. Environ Pollut 2009;157:1110–6.
Lerman A, Mackenzie FT, Bricker OP. Rates of dissolution of aluminosilicates inseawater. Earth Planet Sci Lett 1975;25:82–8.
Limbach LK, Bereiter R, Mueller E, Krebs R, Gaelli R, Stark WJ. Removal of oxidenanoparticles in a model wastewater treatment plant: influence of agglomerationand surfactants on clearing efficiency. Environ Sci Technol 2008;42:5828–33.
Lin D, Liu N, Yang K, Xing B, Wu F. Different stabilities of multiwalled carbon nanotubesin fresh surface water samples. Environ Pollut 2010;158:1270–4.
Liu J, Hurt RH. Ion release kinetics and particle persistence in aqueous nano-silvercolloids. Environ Sci Technol 2010;44:2169–75.
Liu J, Aruguete DM, MurayamaM, Hochella MF. Influence of size and aggregation on thereactivity of an environmentally and industrially relevant nanomaterial (pbs).Environ Sci Technol 2009;43:8178–83.
Lundborg M, Eklund A, Lind B, Camner P. Dissolution of metals by human and rabbitalveolar macrophages. Br J Ind Med 1985;42:642–5.
Moore MN. Do nanoparticles present ecotoxicological risks for the health of the aquaticenvironment? Environ Int 2006;32:967–76.
Mueller NC, Nowack B. Exposure modeling of engineered nanoparticles in theenvironment. Environ Sci Technol 2008;42:4447–53.
Nowack B, Bucheli TD. Occurrence, behavior and effects of nanoparticles in theenvironment. Environ Pollut 2007;150:5-22.
Petosa AR, Jaisi DP, Quevedo IR, Elimelech M, Tufenkji N. Aggregation and deposition ofengineered nanomaterials in aquatic environments: role of physicochemicalinteractions. Environ Sci Technol 2010;44(17):6532–49.
Phenrat T, SalehN, Sirk K, Tilton RD, Lowry GV. Aggregation and sedimentation of aqueousnanoscale zerovalent iron dispersions. Environ Sci Technol 2007;41:284–90.
Phenrat T, Long TC, Lowry GV, Veronesi B. Partial oxidation (“aging”) and surfacemodification decrease the toxicity of nanosized zerovalent iron. Environ Sci Technol2009;43:195–200.
Quik JTK, Lynch I, Van Hoecke K, Miermans CJH, De Schamphelaere KAC, Janssen CR,et al. Effect of natural organic matter on cerium dioxide nanoparticles settling inmodel fresh water. Chemosphere 2010;81:711–5.
Roberts AP,MountAS, SedaB, Souther J, QiaoR, Lin SJ, et al. In vivobiomodification of lipid-coated carbon nanotubes by daphnia magna. Environ Sci Technol 2007;41:3025–9.
Roelofs F, Vogelsberger W. Dissolution kinetics of nanodispersed [gamma]-alumina inaqueous solution at different ph: unusual kinetic size effect and formation of a newphase. J Colloid Interface Sci 2006;303:450–9.
Rosenbaum R, Bachmann T, Gold L, Huijbregts M, Jolliet O, Juraske R, et al. Usetox—theunep-setac toxicity model: recommended characterisation factors for humantoxicity and freshwater ecotoxicity in life cycle impact assessment. Int J Life CycleAssess 2008;13:532–46.
SCENIHR. Opinion on the appropriateness of the risk assessment methodology inaccordance with the technical guidance documents for new and existingsubstances for assessing the risk of nanomaterials. Scientific Committee onEmerging and Newly Identified Health Risks. Available at http://ec.europa.eu/health/ph_risk/committees/04_scenihr/docs/scenihr_o_012.pdf 2007.
SCENIHR. Risk assessment of products of nanotechnologies. Scientific Committee onEmerging and Newly Identified Health Risks. Available at http://ec.europa.eu/health/ph_risk/committees/04_scenihr/docs/scenihr_o_023.pdf 2009.
Schmidt J, Vogelsberger W. Aqueous long-term solubility of titania nanoparticles andtitanium(iv) hydrolysis in a sodium chloride system studied by adsorptivestripping voltammetry. J Solution Chem 2009;38:1267–82.
Seijo M, Ulrich S, Filella M, Buffle J, Stoll S. Modeling the adsorption and coagulation offulvic acids on colloids by brownian dynamics simulations. Environ Sci Technol2009;43:7265–9.
Simon-Deckers Al, Loo S, Mayne-L'hermite M, Herlin-Boime N, Menguy N, Reynaud CC,et al. Size-, composition- and shape-dependent toxicological impact of metal oxidenanoparticles and carbon nanotubes toward bacteria. Environ Sci Technol 2009;43:8423–9.
Stebounova L, Guio E, Grassian V. Silver nanoparticles in simulated biological media: astudy of aggregation, sedimentation, and dissolution. J Nanopart Res 2011;13(1):233–44.
Taboada-Serrano P, Chin CJ, Yiacoumi S, Tsouris C. Modeling aggregation of colloidalparticles. Curr Opin Colloid Interface Sci 2005;10:123–32.
Van Hoecke K, Quik JTK, Mankiewicz-Boczek J, De Schamphelaere KAC, Elsaesser A, Vander Meeren P, et al. Fate and effects of ceo2 nanoparticles in aquatic ecotoxicitytests. Environ Sci Technol 2009;43:4537–46.
Vogelsberger W, Schmidt J, Roelofs F. Dissolution kinetics of oxidic nanoparticles: theobservation of an unusual behaviour. Colloids Surf A 2008;324:51–7.
Von der Kammer F, Ottofuelling S, Hofmann T. Assessment of the physico-chemicalbehavior of titanium dioxide nanoparticles in aquatic environments using multi-dimensional parameter testing. Environ Pollut 2010;158(12):3472–81.
Wong S, Leung P, Djurišić A, Leung K. Toxicities of nano zinc oxide to five marineorganisms: influences of aggregate size and ion solubility. Anal Bioanal Chem2010;396:609–18.
Xia T, Kovochich M, Liong M, Mädler L, Gilbert B, Shi H, et al. Comparison of themechanism of toxicity of zinc oxide and cerium oxide nanoparticles based ondissolution and oxidative stress properties. ACS Nano 2008;2:2121–34.
Zhang Y, Chen Y, Westerhoff P, Hristovski K, Crittenden JC. Stability of commercialmetal oxide nanoparticles in water. Water Res 2008;42:2204–12.
Zhou Y, Cheng YS, Wang Y. Dissolution rate and biokinetic model of zirconium tritideparticles in rat lungs. Health Phys 2010;98:672–82.


