Embed Size (px)
Citation preview

AMNON LEVY AVIA SPIVAK
Ben-Gurion University of the Negev Beer-Sheua, lsrael
How Does the Public Perceive an Unprecedented Rise in Inflation: The Case of Inflationary Expectations in Israel
Inflation in Israel has passed through distinct phases of constant trends. Inilationary expectation’s survey for a period containing a large shift in actual inflation from one phase to another reveals that the shift had not been perceived immediately by the survey’s participants, but that the average expected inflation rate converges grad- ually to the new long-run level according to an S-shaped learning curve.
1. Introduaion In October 1978, the inflation rate in Israel rose sharply from
a long-term monthly average of 2.1% to 4.7%. This was an out- standing turning point which led the Israeli economy to three-digit annual inflation rates in the following six years. The October 1978 shift in the monthly rate of inflation occurred a year after the newly elected government had launched a liberal economic plan of which its main guidelines were an initially large depreciation of the Israeli pound followed by a dirty floating of the exchange rate and granting license to Israeli citizens to take loans in foreign credit markets.
Data on industrialists’ expectations during the nine-month pe- riod, July 1978 to March 1979, which encompasses the sharp in- crease in inflation in October 1978, reveal that this event was un- anticipated. The industrialists’ inflationary expectations were excessively downward biased and the learning process of the new long-term monthly rate of inflation was gradual. This expectation bias can be explained, as suggested by Cukierman (1986), by a per- manent-transitory confusion in the presence of a large permanent shock. The convergence of the expectations to the new stationary monthly inflation rate indicates, however, a systematic use of new information.
In view of the literature on price expectations, the short-run expectations bias is consistent with Visco’s (1984) findings with sur-
Journal of Macroeconomics, Spring 1988, Vol. 10, No. 2, pp. 273-282 273 Copyright 8 1988 by Louisiana State University Press l-llC.4 n-?n* 100 /,I Cn

Amnon Levy and Avia Spivak
vey expectations in Italy during the period following the first oil shock. Our findings do not conform to the long-run bias proposition implied by the studies of de Leeuw and McKelvey (1981) and Gramlich (1983). Similar to the findings of de Leeuw and McKelvey (1984) with grouped data on firm managers’ sale prices and capital good prices expectations, our findings indicate the existence of an expectation formation process that acts to reduce bias in the long run.
Since, in most cases, available data on inflationary expecta- tions are for periods in which inflation followed a relatively smooth and flat path, these Israeli data and the shift phenomenon provide a rare opportunity to learn about the behavior of inflationary ex- pectations and their formation.
The rest of the paper continues as follows. Section 2 provides a short background description of the inflationary process in Israel during the two-year period encompassing the October 1978 shift. Section 3 tests whether the survey expectations immediately after the October 1978 shift were bias. Section 4 checks whether the expectation bias diminished in the long-run, and Section 5 con- cludes the paper with a brief summary.
2. The Inflationary Process in Israel Before and After October 1978
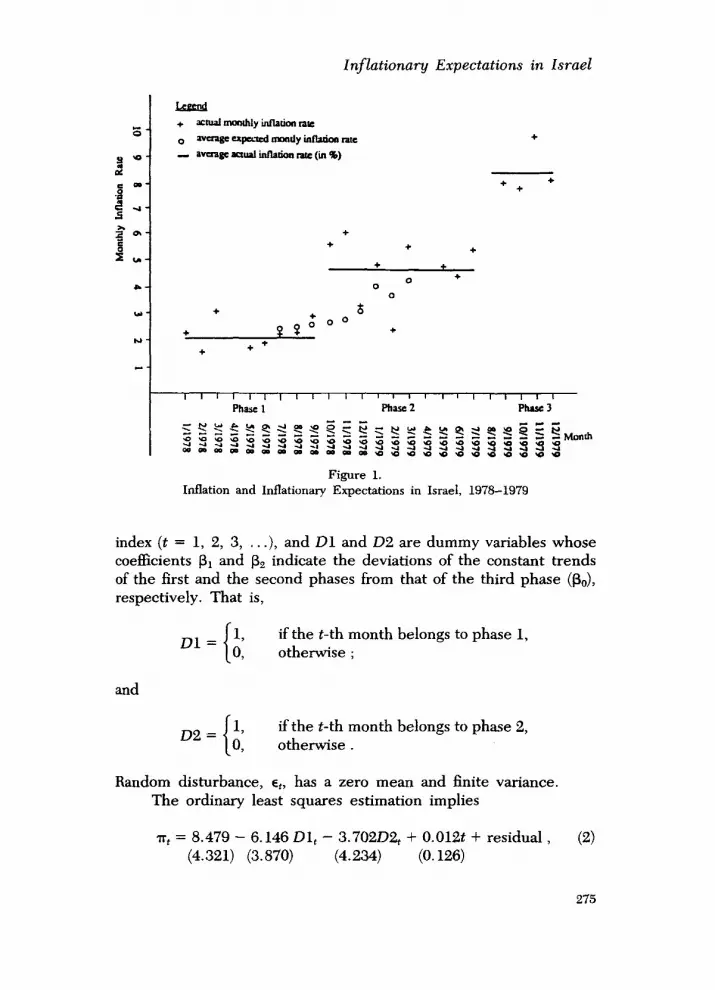
Figure 1 describes the inflation in Israel between January 1978 and December 1979 as consisting of three distinct phases. It sug- gests further that the October 1978 shift was not unique, a similar phenomenon was repeated in August 1979 and the inflation during these years roughly conformed to an increasing step diagram. This pattern continued until July 1985-the first month of the Israeli stabilization program. ’
This hypothesized three-phase pattern of the inflationary pro- cess during the years 1978 to 1979 can be tested against the alter- native hypothesis of a gradually increasing trend by estimating the parameters of the regression equation:
where rrt is the actual monthly rate of inflation, t is a discrete time
‘See Cukierman (1987) for a meticulous description and analysis of the inflation in Israel and the July 1985 stabilization program.
274
Inflationary Expectations in lsrael
+ + + +
0 + 0
0
+ 6 9 2
go0 + +
+ ++
Figure 1. Inflation and Inflationary Expectations in Israel, 1978-1979
index (t = 1, 2, 3, . . .), and Dl and 02 are dummy variables whose coefficients RI and RZ indicate the deviations of the constant trends of the first and the second phases from that of the third phase (&J, respectively. That is,
if the t-th month belongs to phase 1, otherwise ;
and
02 = ;’ if the t-th month belongs to phase 2, > otherwise.
Random disturbance, et, has a zero mean and finite variance. The ordinary least squares estimation implies
nTT, = 8.479 - 6.146 Dl, - 3.70202, + 0.012t + residual , (4.321) (3.870) (4.234) (0.126)
(2)
275

Amnon Levy and Avia Spivak
where the t-ratios are indicated by the parentheses below the es- timates; the R’ is 0.87, the F-test statistic is 40.30, and the Durbin- Watson statistic is 2.56. Since the coefficient associated with t is insignificantly different from zero while those associated with Dl and 02 are negative, of the proper size, and statistically significant, we reject the hypothesis of a gradually increasing trend against a three-phase pattern of inflation during the period January 1978 to December 1979.
Based on the evidence, we describe the deviation of the actual monthly rate of inflation, a,, from the stationary rate, +r, within any phase as a white noise, E,. That is,
?r, = ,it + Et . (3)
3. Short-Run Expectation Bias Our source of inflationary expectations is the Industrialists’
Expectations Survey conducted by the Israeli Industrialists’ Union for the period of July 1978 to March 1979. The average expected monthly rates of inflation for this period are depicted by Figure 1. The participants in this survey were well-informed firm managers. Their failure to anticipate the shift in the inflation indicates a sim- ilar failure by a major part of the public.
Following Muth (1961), we hypothesize that within any phase of inflation the public expectations about the following months in- flation rate, nt, were rational, which by virtue of Equation (3) im- plies
e- - IT* -T. (4)
Thus, the difference between the actual and expected rate of infla- tion within any phase of inflation should be nothing but a white noise:
7F, - n: = E, . (5)
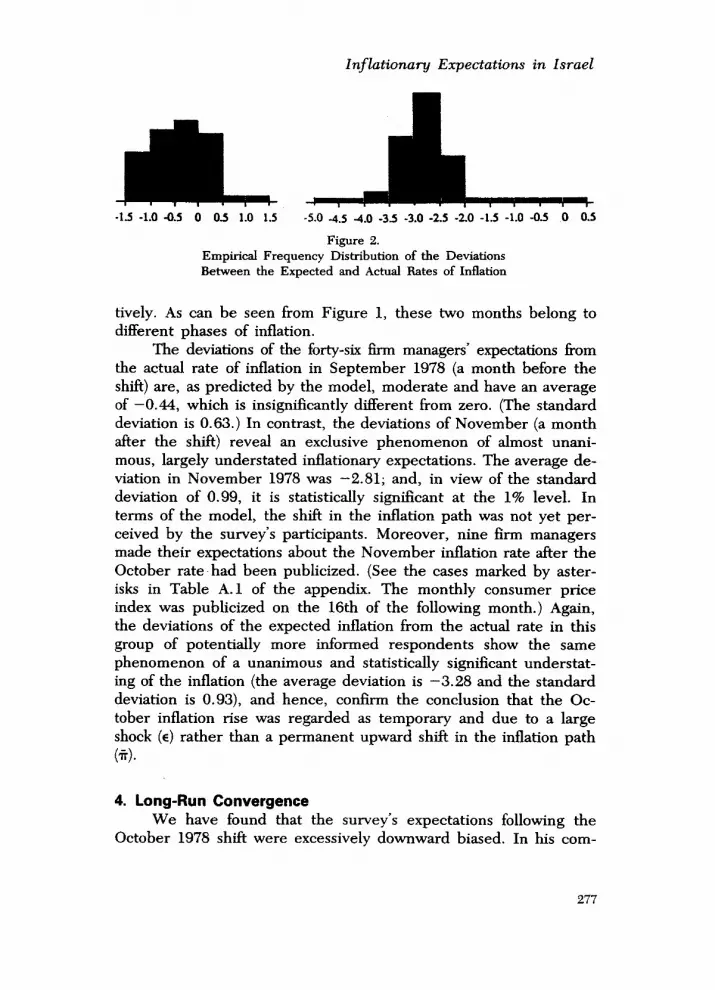
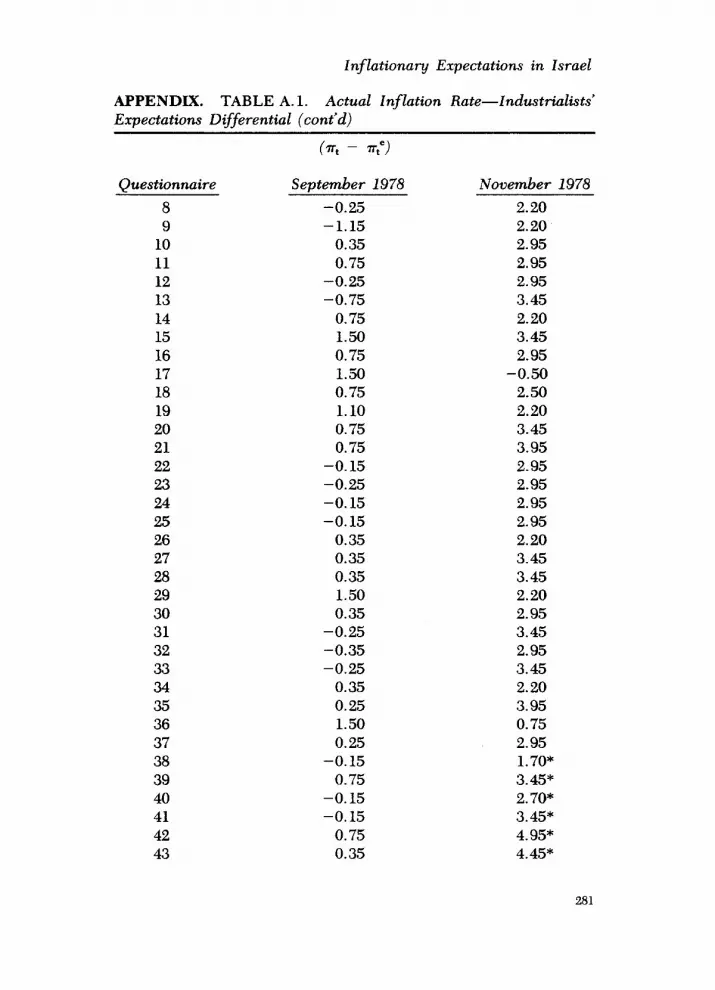
Table A.1 in the appendix and the histograms in Figures 2a and 2b describe the deviations of the actual monthly rates of inflation in September and November 1978 from those expected by forty-six firm managers who had participated in both months’ surveys that were conducted before and after the October 1978 shift, respec-
276
Inflationary Expectations in Israel
II, JbL,~ -1.5 -1.0 4.s 0 0.5 1.0 1.5 -5.0 -4.5 4.0 -3.5 -3.0 -2.5 -2.0 -1.5 -1.0 -0.5 0 0.5
Figure 2. Empirical Frequency Distribution of the Deviations Between the Expected and Actual Bates of Inflation
tively. As can be seen from Figure 1, these two months belong to different phases of inflation.
The deviations of the forty-six hrm managers’ expectations horn the actual rate of inflation in September 1978 (a month before the shift) are, as predicted by the model, moderate and have an average of -0.44, which is insignificantly different from zero. (The standard deviation is 0.63.) In contrast, the deviations of November (a month after the shift) reveal an exclusive phenomenon of almost unani- mous, largely understated inflationary expectations. The average de- viation in November 1978 was -2.81; and, in view of the standard deviation of 0.99, it is statistically significant at the 1% level. In terms of the model, the shift in the inflation path was not yet per- ceived by the survey’s participants. Moreover, nine firm managers made their expectations about the November inflation rate after the October rate-had been publicized. (See the cases marked by aster- isks in Table A.1 of the appendix. The monthly consumer price index was publicized on the 16th of the following month.) Again, the deviations of the expected inflation from the actual rate in this group of potentially more informed respondents show the same phenomenon of a unanimous and statistically significant understat- ing of the inflation (the average deviation is -3.28 and the standard deviation is O.93), and hence, confum the conclusion that the Oc- tober inflation rise was regarded as temporary and due to a large shock (E) rather than a permanent upward shift in the inflation path (3.
4. Long-Run Convergence We have found that the survey’s expectations following the
October 1978 shift were excessively downward biased. In his com-
277

Amnon Levy and Avia Spivak
ment on Visco’s (1984) findings that survey expectations in Italy failed to pass most of the tests of rationality in the period following the first oil shock, Cukierman (1986) argues that expectation bias in the short run can be explained by the individuals inability to distin- guish between permanent and transitory changes as soon as they occur. In other words, the bias does not indicate an inefficient use of information, but rather the difficulty on behalf of the individuals to determine the exact timing of the shift to a higher phase of in- flation.
To understand the individuals problem, we first note that since the inflation in each phase is given by Equation (3), the best linear unbiased estimator of the stationary level of inflation, 5, is the arithmetic average:
1 J &- c
I j=l Pt-j T (6)
where / is the phase length in months. Ex ante, of course, there is the problem of determining the optimal number of past obser- vations, J, to be considered; or equivalently, the exact timing of the phase shift.
When we look at the October 1978 shift, it is clear that most respondents interpreted the large increase of the inflation in this month as a rare, high value of the random variable E,. Only when more observations of higher rates of inflation accumulated did the respondents accept that the inflation entered a new higher phase, 1, months ago. This J was then used to construct the new estimates of inflation. The period of accepting the permanent rise of inflation varies among individuals. In the transition period, some individuals are slower to accept the new reality.2 These individualistic differ- ences give rise to a gradual increase in the average expected infla- tion rate, but also to an increase in the variability of the inflationary expectations as reported in Table A.l.
Indeed, an inspection of Figure 1 reveals that the average ex- pected monthly rate of inflation during the nine-month period from July 1978 to March 1979 converges gradually to the new stationary
‘The individual could be viewed as carrying out a statistical test to determine whether the increase in the inflation was random. The slow learners were probably more risk averse and required a lower level of significance (that is, more evidence about the inflation rate) to reject the random hypothesis against the permanent shift hypothesis.
278
lnf lationaq Expectations in Israel
level. Moreover, the survey average expected rates of inflation form an S-shaped curve bounded from below by the stationary rate of the first phase (2.1%) and from above by that of the second phase (4.7%).3 This curve can be approximated by a logistic learning model:
4.7 e- nt - 1 + ce-* .
The estimation of the unknown parameters, c and r (the intrinsic learning rate), uses the equivalent linear equation:
In 4.7 - 7rt” ( 1 = -In c - rt + error . e Tt
(8)
The ordinary least squares estimation results are summarized by the following equation:
In = 0.434 - 0.239t + residual , (2.969) (28.434)
(9)
where the t-ratios are indicated by the parentheses and the R2 is equal to 0.80.
The statistically significant estimates of the logistic learning model’s parameters, r and c, indicate the existence of an expecta- tions updating process that systematically utilizes the new infor- mation about the actual intlation rate accumulated after October 1978 to reduce the average expectation bias in the long run.
5. Conclusion In October 1978, the inflation in Israel rose sharply from a
long-term monthly average of 2.1% to 4.7%. The Industrialists’ Ex- pectations Survey conducted at that time revealed that the partic- ipants’ expectations about the rate of inflation in November 1978 were excessively and almost unanimously downward biased. Our analysis of the bias suggests that the survey’s participants did not distinguish immediately between permanent and transitory changes
Vhese values are ex post estimates of the stationary monthly rate of inflation in the respective phases obtained with the arithmetic average estimator indicated in (6).
279

dmnon Levy and Avia Spivak
in the inflation path. Furthermore, it was found that the new in- formation accumulated in the following months about the inflation rate was systematically processed and the participants’ expectations bias was gradually reduced as time progressed.
Received: June 1987 Final version: October 1987
References Cukierman, A. “Measuring Inflationary Expectations: A Review Es-
say.” Journal of Monetary Economics 17 (1986): 315-24. -. “The End of the Israeli Hyperinflation: An Experiment in
Heterodox Stabilization.” The Forder Institute for Economic Re- search, Working Paper No. 7-87, Tel Aviv University, April 1987.
de Leeuw, F., and M. J. McKelvey. “Price Expectations of Business Firms.” Brookings Papers on Economic Activity (1981): 299-314.
-. “Price Expectations of Business Firms: Bias in the Short and Long Run.” The American Economic Review 74 (March 1984): 99-100.
Gramhch, E. “Models of Inflation Expectations Formation: A Com- parison of Household and Economist Forecasts.” Journal of Money, Credit, and Banking (May 1983): 155-73.
Muth, J.F. “Rational Expectations and the Theory of Price Move- ments. ” Econometrica 29 (1961): 315-35.
Visco, I. Price Expectations in Rising Inflation. Amsterdam: North- Holland, 1984.
APPENDIX. TABLE A. 1. Actual Inflation Rate-Industrialists Expectations Differential
CT - r:)
Questionnaire September 1978
1 -0.15 2 0.75 3 1.50 4 0.75 5 0.35 6 0.75 7 1.50
November 1978
3.45 2.95 2.95 1.20 0.25 2.95 2.95
In.. lationaq Expectations in Israel
APPENDIX. TABLE A. 1. Actual Znflation Rate-Industrialists’ Expectations Differential (cont’d)
Questionnaire September 1978 November 1978
8 -0.25 2.20 9 -1.15 2.20
10 0.35 2.95 11 0.75 2.95 12 -0.25 2.95 13 -0.75 3.45 14 0.75 2.20 15 1.50 3.45 16 0.75 2.95 17 1.50 -0.50 18 0.75 2.50 19 1.10 2.20 20 0.75 3.45 21 0.75 3.95 22 -0.15 2.95 23 -0.25 2.95 24 -0.15 2.95 25 -0.15 2.95 26 0.35 2.20 27 0.35 3.45 28 0.35 3.45 29 1.50 2.20 30 0.35 2.95 31 -0.25 3.45 32 -0.35 2.95 33 -0.25 3.45 34 0.35 2.20 35 0.25 3.95 36 1.50 0.75 37 0.25 2.95 38 -0.15 1.70* 39 0.75 3.45* 40 -0.15 2.70* 41 -0.15 3.45* 42 0.75 4.95* 43 0.35 4.45*
281

Amnon Levy and Avia Spivak
APPENDM. TABLE A. 1. Actual In. lation Rate-Industrialists’ Expectations Dgferential (cont’d)
Questionnaire September 1978 November 1978
44 0.75 2.70* 4s 1.50 2.70* 46 0.25 3.45*
Average 0.44 2.81
Standard Deviation 0.63 0.99
*The October 1978 consumer price index was known at the time 7~~’ was made. (Source: Industrialists’ Expectations Survey conducted by the Israeli Industrialists’ Union in 1978 and 1979.)
282


