Embed Size (px)
Citation preview

University of New OrleansScholarWorks@UNOCollege of Urban and Public Affairs (CUPA)Working Papers, 1991-2000 Department of Planning and Urban Studies
1-1-1998
Housing foreclosure and racial transition in NewOrleansMickey LauriaUniversity of New Orleans
Vern K. BaxterUniversity of New Orleans
Follow this and additional works at: http://scholarworks.uno.edu/cupa_wp
This Working Paper is brought to you for free and open access by the Department of Planning and Urban Studies at ScholarWorks@UNO. It has beenaccepted for inclusion in College of Urban and Public Affairs (CUPA) Working Papers, 1991-2000 by an authorized administrator ofScholarWorks@UNO. For more information, please contact [email protected].
Recommended CitationLauria, Mickey and Baxter, Vern K., "Housing foreclosure and racial transition in New Orleans" (1998). College of Urban and PublicAffairs (CUPA) Working Papers, 1991-2000. Paper 18.http://scholarworks.uno.edu/cupa_wp/18
HOUSING FORECLOSURE AND RACIAL TRANSITION IN
NEW ORLEANS *
Mickey LauriaCollege of Urban and Public Affairs
University of New OrleansNew Orleans, LA 70148.
E-MAIL: [email protected].
and
Vern BaxterDepartment of Sociology
University of New OrleansNew Orleans, LA 70148
E-MAIL: [email protected]
* This project was funded by the Geography and Regional Science Program of the NationalScience Foundation, SBR-9422580. Support was also received from the U.S. Department ofHousing and Urban Development and the Fannie Mae Foundation. We would like toacknowledge the assistance and cooperation of the Orleans Parish Civil Sheriff’s office,particularly Civil Sheriff Paul Valteau and Deputy Sheriff Todd Thedy. We would also like tothank Ray Burby, Victoria Basolo, David James, Mary Dovie, David Chipman, Zachary Klaas,Donhang Zhang, Mark Goldstein, and Christine Cook for their assistance at various stages of theproject. Any opinions, findings and conclusions or recommendations expressed in this materialare those of the authors and do not necessarily reflect the views of the National ScienceFoundation, the U.S. Government, or the Fannie Mae Foundation.

Housing Foreclosure and Racial Transition in New Orleans
Abstract
We explore housing foreclosure as a mechanism that links economic shocks and
neighborhood change, particularly the process of racial transition. A panel data set of the 1980
and 1990 New Orleans, Louisiana Census of Population and Housing was merged with mortgage
foreclosure data aggregated to the block group level. The analysis indicates that housing
foreclosures added momentum to the process of racial transition and neighborhood change, net
of the effects of exogenous economic shocks and other variables like median income of
residents, change in the value of owner-occupied housing, or the existing racial distribution of
population in the neighborhood. Foreclosure appears to have the strongest effect on racial
transition in block groups where resident incomes are above the lowest levels, and there is a pre-
existing and increasing black population.
1
HOUSING FORECLOSURE AND RACIAL TRANSITION IN
NEW ORLEANS
Recent changes in the global division of labor and the social structure of accumulation
are associated with changes in both the spatial and opportunity structures of U.S. cities. The
suburban relocation and decline of high wage manufacturing jobs are well documented. So are
increases in lower paid service sector employment and the concentration of poverty and social
problems among the lower-income, largely minority residents who remain in many large cities
(Galster, Mincy, and Tobin 1997; Massey and Denton 1993; Morenoff and Tienda 1997; Squires
1994). Debates about the uneven effects of deindustrialization and the role of racial segregation
and out-migration on spatial reorganization and poverty have been further complicated by the
effects of changes in housing finance on the process of neighborhood change. Previously
sheltered housing markets dominated by savings and loan institutions that issue fixed rate
mortgages have been integrated into the larger financial system. This has increased the
importance for housing finance of adjustable rate mortgages, secondary mortgage markets, and
mortgage-backed securities (Florida 1986; Meyerson 1986; Shenker and Colletta 1992). Multiple
economic shocks provide a context for the interplay of demographic and racial processes
traditionally associated with change in neighborhood income levels and racial composition
(Grigsby et al. 1987; Squires 1994, 3; Temkin and Rohe 1996).
We use New Orleans, Louisiana as a case-study to explore the potential of housing
foreclosure as a mechanism that links economic shocks to neighborhood change, particularly the
process of racial transition. The paper investigates housing foreclosure, the legal process

2
whereby a lender separates a delinquent borrower from a vested interest in mortgaged property.
Economic shocks that reduce population and real incomes can be expected to decrease housing
prices and the ratio of the market value of mortgages to the market value of houses, all of which
are likely to increase mortgage default and foreclosure (Case and Shiller 1996; Cunningham and
Capone 1990). New Orleans is an ideal setting for the study because it experienced a severe
economic shock caused by falling oil prices, and because of its location as a Southern city
outside the range of sites typically chosen to study racial transition (see Wood and Lee 1991).
The question investigated here is whether housing foreclosures added momentum to the process
of racial transition and neighborhood change in New Orleans, net of the effects of exogenous
economic shocks, median income of residents, changes in the value of owner occupied housing,
and the existing racial distribution of population.
We proceed with an elaboration of theories of neighborhood change and racial transition,
an overview of recent changes in the economy of the New Orleans Metropolitan Statistical Area
(MSA), changes in key economic and neighborhood indicators in the city itself. We conclude
with a multivariate analysis of changes from 1980 to 1990 in the proportion of blacks who reside
in census tract block groups within the city.
UNDERSTANDING NEIGHBORHOOD CHANGE AND RACIAL TRANSITION
Untangling how the interactions of race and class contribute to differences in urban
neighborhoods is an extremely knotty problem. Various scholars argue about the extent to which
neighborhood succession processes are determined by natural selection based on market

3
assumptions, institutional mechanisms related to capital accumulation or racial discrimination, or
the aggregated preferences of competing individuals of diverse cultural heritage. William
Grigsby and his colleagues state quite clearly that the geographic separation of households
according to real income levels is at the core of the neighborhood succession process (Grigsby et
al. 1987, 10). William J. Wilson (1987) agrees that changes in the structure of economic
opportunity primarily explain the spatial distribution of poverty. He explains how economic
restructuring shifted employment from the central city to the suburbs and from higher paying
manufacturing jobs to lower paying service jobs, which interacted with black migration patterns
to exacerbate the spatial distribution of urban poverty. Paul Jargowsky (1997, 144) similarly
argues that structural change in the economy disadvantaged those with lower skill levels, and
interacted with the suburbanization of employment to induce more affluent residents to flee
cities, increasing the proportion of black ghetto dwellers who remained.
Douglas Massey and his colleagues counter that racial segregation itself is an
institutional process that concentrates poverty, especially during economic downturns, and that
race is more important than class to predict segregation (Eggers and Massey 1992; Massey and
Denton 1993, 85). Other institutional arguments stress how neighborhood redlining by lenders,
block busting by real estate agents, and restructuring of housing finance have increased racial
segregation and neighborhood change (Galster 1992; Squires 1994).
Much of the neighborhood decline and urban revitalization literature is based on
refinements by economists of research that originated with the Chicago School of human
ecology (Bradbury, Downs, and Small 1982; Downs 1981; Faris 1967; Vernon 1960). The
central contribution of this literature is the stage model of residential succession and decline.
4
According to the model, vigorous competition exists for city land which is prized for its
accessibility to all parts of the metropolis. Business and industry often are able to outbid others
for the most central locations. City growth increases competition for residential space, which
intensifies development of land nearest the central business district (CBD). Resulting congestion
and high density around the CBD drives out those with higher incomes who seek cheaper land
and better housing on the urban fringe, provided the commute time to work is not too long (Muth
1969). Central city housing is converted into smaller units, and landlords invest decreasing
amounts of money in maintenance and renovation of the aging housing stock. Less affluent
(often minority) residents move in and eventually dominate the neighborhood as the
deteriorating housing stock filters down the status hierarchy. The end result is families with
similar socio-economic status and ethnic identity living together in different parts of the city.
Hypothesis 1:
Exogenous economic shocks that decrease median block group incomes catalyze neighborhood
succession, as represented by population decline, lower median housing costs, and a larger
percent black population.
Ecological and neo-classical economic models propose that the relative cost of housing
and mean commute time to work allows individuals with sufficient income to choose a housing
sub-market that suits their preferences. This not only helps construct middle and upper income
housing sub-markets, it also constricts, via the filtering process, the location of lower-income
sub-markets. An increase in the number of households causes a rearrangement of neighborhood
5
occupancy by income group, and population decline is likely to cause neighborhood succession
because of the decrease in housing prices and rents. The essentials of filtering, and hence racial
transition, can be boiled down to the depreciation or appreciation of housing prices and rents to
reflect changes in the income profile of neighborhoods (Grigsby et al. 1987, 27, 37).
The neo-Marxian approach to neighborhood change links the combination of global
shifts in capital accumulation and local contradictions between use value and exchange value to
changes in income, rents, and housing prices. Post World War II economic development
featured, among others things, state subsidies of suburban housing development to support
expanded automobile production and increased demand for housing, consumer goods, and
petroleum products (Aglietta 1978; Gordon, Edwards, and Reich 1982). David Harvey (1973)
argues that increased investment in suburban development during this period sucked capital out
of the central city, which triggered disinvestment and abandonment of aging housing stock in the
CBD. Deterioration of central city neighborhoods created racial transition and a “rent gap”
between existing rents and rents that could be charged under more profitable uses (Logan and
Molotch 1987; Smith 1979). Pressures for urban renewal and neighborhood revitalization can
also be understood in this context.
The uneven revitalization and decay of urban neighborhoods since the 1970 can be
linked to the effects of shifts in the institutional basis of capital accumulation on local housing
conditions. Among the factors to consider are the ways the saturation of demand for suburban
housing and an overall restructuring of housing finance affected the flow of capital to finance
inner city renewal. Competition from foreign automobile and steel producers, global shifts in
control of petroleum resources, and reduced state subsidies of urban development represent other

6
important changes in long standing institutional supports of capital accumulation. Consequently,
real income levels and the condition and value of housing stock deteriorated in many urban
locations, including northern industrial cities that lost manufacturing jobs, and domestic
petroleum centers like New Orleans that lost jobs in the oil industry (Baxter 1997; Grant 1995;
Harrison and Bluestone 1988).
Changes in social and economic variables operate through the system of housing
suppliers and market intermediaries to affect decisions that change a neighborhood. Many
scholars have argued that racial discrimination is institutionalized in housing markets (Cook
1988; Galster 1990; Galster and Hill 1992; Squires 1994). Under discriminatory conditions,
rapid change in the racial composition of neighborhoods can transcend income change as a cause
of neighborhood decline. Financial intermediaries may restrict lending, which drives down
housing prices before poorer in-migrants drive down incomes. The early stages of neighborhood
decline may cause panic among investors and homeowners who sell out at low prices to block
busting real estate agents, thus accelerating the process of succession (Megbolugbe, Hoek-Smit,
and Linneman 1996). At some point in the transition, a “tipping point” may be reached where
greater than expected out-migration occurs because in-mover minorities are perceived to be
undesirable neighbors. Border models of neighborhood succession propose that housing values
may decline in neighborhoods adjacent to those undergoing racial transition due to perceptions
that residence in integrated areas is undesirable (Denton and Massey 1991; Galster 1991). The
bottom line is that most blacks live in highly segregated neighborhoods with high levels of
poverty concentration, so any exogenous factors that increase poverty will geographically
increase the concentration of poverty among blacks living in segregated neighborhoods (Massey

7
and Denton 1993, 122-26). This line of reasoning suggests a second hypothesis.
Hypothesis 2:
Prior racial composition of block groups has a significant effect on subsequent patterns of racial
composition, net of the effects of economic variables.
Alternatives to the determinism of ecological and institutional theories stress social
choice in residential location and neighborhood change. Social choice theories argue that, in
addition to economic considerations, family lifestyles, values, and social status motivate
residential location. The choice of a home often rests on preferences for a homogeneous social or
cultural environment. Many scholars have found that a majority of blacks prefer to live in fully
integrated neighborhoods, while most whites prefer to live in neighborhoods in which their race
is numerically dominant (Clark 1991; Farley et al. 1978). Recent work by Reynolds Farley and
his colleagues (1994) on racial segregation in Detroit, Michigan supports both George Galster’s
(1990) and Massey and Denton’s (1993) speculation that whites who endorse negative racial
stereotypes about blacks are more uncomfortable with black neighbors and are more likely to
move away from mixed neighborhoods. Farley et al. (1994) go on to argue that these negative
stereotypes are shared by many white financial professionals, home buyers and sellers, and
therefore provide a link between institutional and social choice explanations of segregation and
racial transition.

8
The Relationship of Housing Foreclosure and Neighborhood Change
Literature is scarce on the effects of housing foreclosure on the socio-economic
characteristics of neighborhoods and the spatial structure of the city. Some research in
economics has identified higher mortgage default risk and higher default rates when substantial
economic boom is followed by a sharp downturn. Resultant declines in housing prices can create
situations where borrowers, suddenly thrown out of work, owe more money on their homes than
the home is worth on the open market. Case and Shiller (1996) report that uneven patterns of
decline in housing prices in Boston and Los Angeles counties in the late 1980s were associated
with higher mortgage default rates among certain clusters of properties. Lawrence Jones (1993)
argues that higher default rates will cluster among properties occupied by more affluent people
because they will abandon property with negative equity to foreclosure quicker than will poorer
people.
Institutional theories of neighborhood succession suggest that a significant relationship
exists between racial discrimination, mortgage default, and neighborhood change. Massey and
Denton (1993, 131) argue that if housing prices decline because of investor panic or
discrimination related to recent increases in black population, mortgage default and
abandonment are likely to increase. They believe that a very small number of abandoned homes
signal great decay in a neighborhood, and the same may be true of foreclosures in neighborhoods
already experiencing racial transition.

9
Hypothesis 3:
Block groups with a higher proportion of units foreclosed will have both a significantly larger
proportion of Blacks and a significantly larger increase in Black population from 1980 to 1990
than block groups with a lower proportion of units foreclosed.
Research indicates that lenders are most apprehensive about neighborhood instability,
and recently integrated neighborhoods tend to receive the least credit (Massey and Denton 1993,
107). Any economic downturn or increase in vacancies increases fear of mortgage default, which
may restrict loan terms and force buyers into new areas, thus increasing the proportion of renters
and further weakening neighborhood stability (Grigsby et al, 51-52). High foreclosure rates will
hasten the process of racial transition in these neighborhoods.
Given the socio-spatial segregation pattern of U.S. cities, it is also reasonable to
speculate that if a city experiences a specific economic stimulus that increases foreclosures,
affected mortgagors will have particular socio-economic characteristics, and foreclosures will
cluster in particular neighborhoods.
Hypothesis 4:
The sectoral nature of economic change in New Orleans means that the initial impact of housing
foreclosure is to hasten the racial transition of middle to upper income block groups more than
lower income ones.
10
The logic here is that declines in oil and gas and manufacturing employment in New Orleans in
the 1980s increased unemployment and decreased owner-occupied housing prices in middle
class neighborhoods occupied primarily by whites employed in these relatively high paying jobs.
DATA, VARIABLES, AND METHODS
Data and Variables
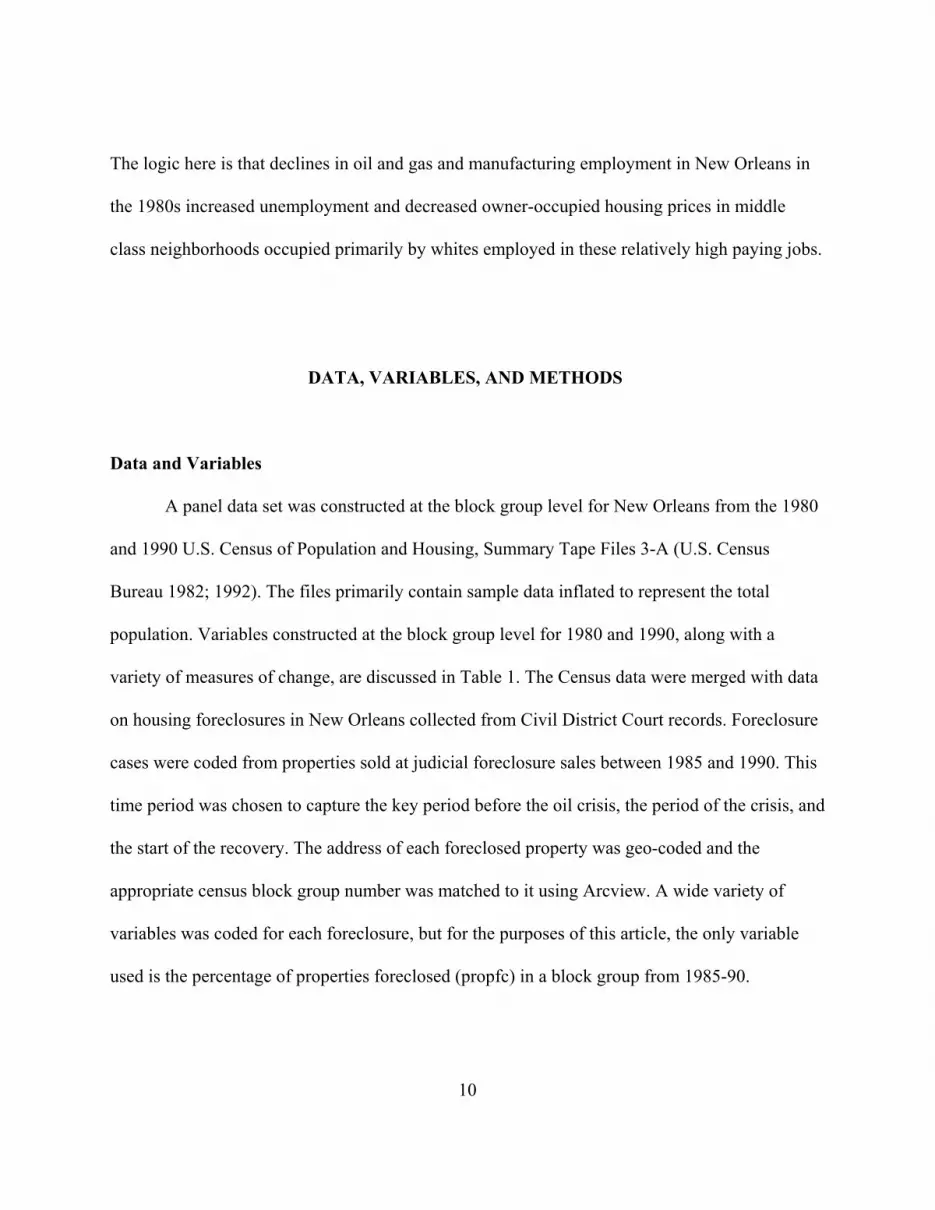
A panel data set was constructed at the block group level for New Orleans from the 1980
and 1990 U.S. Census of Population and Housing, Summary Tape Files 3-A (U.S. Census
Bureau 1982; 1992). The files primarily contain sample data inflated to represent the total
population. Variables constructed at the block group level for 1980 and 1990, along with a
variety of measures of change, are discussed in Table 1. The Census data were merged with data
on housing foreclosures in New Orleans collected from Civil District Court records. Foreclosure
cases were coded from properties sold at judicial foreclosure sales between 1985 and 1990. This
time period was chosen to capture the key period before the oil crisis, the period of the crisis, and
the start of the recovery. The address of each foreclosed property was geo-coded and the
appropriate census block group number was matched to it using Arcview. A wide variety of
variables was coded for each foreclosure, but for the purposes of this article, the only variable
used is the percentage of properties foreclosed (propfc) in a block group from 1985-90.

11
TABLE 1
Variables and their Measurement
___________________________________________________________
Acronym Variable description Measurement____________________________________________________________________________
hsinc80 median household income in 1980 constant dollars
hsinc90 median household income in 1990 constant dollars
pubinc80 proportion of income from public public assistance income/totalincome
assistance, 1980 in block group
pubinc90 proportion of income from public public assistance income/totalincome assistance, 1990 in block group
meanva80 mean value of owner occupied housing constant dollarsin 1980
meanva90 mean value of owner occupied housing constant dollarsin 1990
propbl80 proportion black in block group in 1980 black population/total population inblock group
propbl90 proportion black in block group in 1990 black population/total population inblock group
ageunit median age of structure 1997 - median date unit constructed
mencom80 mean commute time for employed people mid-point of each category of who work away from home in 1980 commute time X number of people
in the category; then summedcategory
totals and divided by total number of employed people
numhsld80 number of households in block group, 1980
12
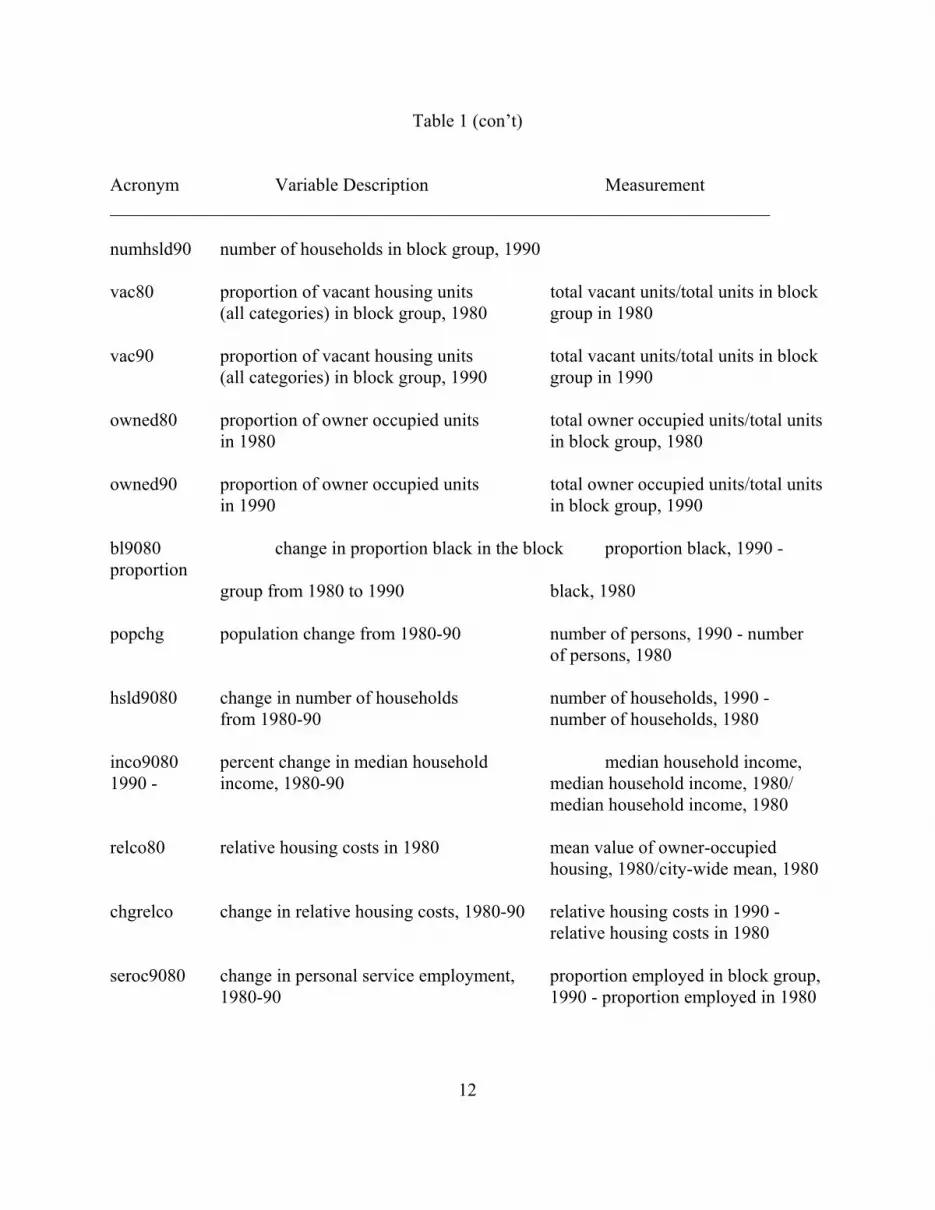
Table 1 (con’t)
Acronym Variable Description Measurement________________________________________________________________________
numhsld90 number of households in block group, 1990
vac80 proportion of vacant housing units total vacant units/total units in block(all categories) in block group, 1980 group in 1980
vac90 proportion of vacant housing units total vacant units/total units in block(all categories) in block group, 1990 group in 1990
owned80 proportion of owner occupied units total owner occupied units/total unitsin 1980 in block group, 1980
owned90 proportion of owner occupied units total owner occupied units/total unitsin 1990 in block group, 1990
bl9080 change in proportion black in the block proportion black, 1990 -proportion
group from 1980 to 1990 black, 1980
popchg population change from 1980-90 number of persons, 1990 - number of persons, 1980
hsld9080 change in number of households number of households, 1990 - from 1980-90 number of households, 1980
inco9080 percent change in median household median household income,1990 - income, 1980-90 median household income, 1980/
median household income, 1980
relco80 relative housing costs in 1980 mean value of owner-occupied housing, 1980/city-wide mean, 1980
chgrelco change in relative housing costs, 1980-90 relative housing costs in 1990 -relative housing costs in 1980
seroc9080 change in personal service employment, proportion employed in block group, 1980-90 1990 - proportion employed in 1980

13
Table 1 (con’t)
Acronym Variable Description Measurement__________________________________________________________________________
agmi9080 change in agriculture + mining Proportion employed in block employment, group, 1980-90 1990 - proportion employed in 1980
pro9080 change in professional employment, proportion employed in block group,1980-90 1990 - proportion employed in 1980
propfc proportion of units in block group total foreclosures, 1985-90/totalforeclosed, 1985-90 units in block group, 1990
____________________________________________________________________________
A total of 4,320 properties were sold at foreclosure between 1985 and 1990: 27 in 1985;
46 in 1986; 247 in 1987; 1,255 in 1988; 1,506 in 1989; and 1,240 in 1990. An additional 707
foreclosure cases were dismissed (did not go to sale) during this period. Fifty-six of the 4,320
cases (1 percent) had insufficient address information, and another 91 (2 percent) had addresses
that we could not geo-code. The final data set contains 4,173 housing foreclosures.[1]
Methods
We take a quantitative approach to neighborhood change. Neighborhoods are considered
coterminous with census block groups, so shared demographic and spatial attributes
operationally define a neighborhood. Neighborhood change is modeled with a panel design
where information is

14
gathered on the same units at several points in time. A panel design is preferable to a cross
sectional design because the explicit focus on change facilitates the analysis of causal
relationships among variables (Finkel 1995, 1). For example, we raise questions about the causal
priority of economic change and the prior racial distribution of population to explain subsequent
racial distribution of population. Panel data make possible tests of the causal priority of these
variables. [2]
The choice of an appropriate strategy to model change is among the problems associated
with panel data analysis. The analysis reported below uses a conditional change model which
includes lagged values of the dependent variable. This means that Y(t) (% black in block group,
1990) is predicted from an earlier value Y(t-1) (% black in block group, 1980), along with
several independent variables.[3] The conditional change model was chosen instead of an
unconditional change, or first differenced model, because it was hypothesized that prior values
of the dependent variable were causally related to the dependent variable (Allison 1990; Beck
and Katz 1996; Finkel 1995, 6; Markus 1979, 48). In some models reported below, the
dependent variable is change in percent black population, 1980-90. In those cases, the lag
variable is also included on the right hand side of the regression equation.
The inclusion of a lagged value of the dependent variable increases the likelihood of
autocorrelated errors in regression analysis. Errors are autocorrelated when there is a significant
correlation between the error of a variable measured at time (t) and the error of the same variable
measured at time (t-1) (Greene 1990, 431). The presence of autocorrelation in panel models with
a lagged dependent variable tends to produce biased and inconsistent parameter estimates with
Ordinary Least Squares (OLS) estimation (Greene 1990, 435; Hanushek and Jackson 1977, 172).
15
Autocorrelation in the models reported below was corrected with an Estimated Generalized
Least Squares (EGLS) procedure that calculates a matrix weighted average of OLS residuals
before estimating the final parameters of the equation.[4]
ECONOMIC CHANGE AND RACIAL TRANSITION IN NEW ORLEANS
Changes in the Metro New Orleans Economy
The New Orleans MSA is ideal for the study of economic restructuring caused by the
impact of global changes on a region dominated by oil and gas extraction. Mining accounted for
3.8 percent and manufacturing only 8.8 percent of total New Orleans MSA wage and salary
employment in 1985, compared to 1 percent employed in mining and 19.9 percent employed in
manufacturing nationwide (Ryan 1985). Global petroleum politics and fluctuations in oil and gas
prices generated boom (1973-81), bust (1985-87), and recovery (1993-present) cycles that
rippled through the local economy. Major oil companies closed regional offices in New Orleans
during the 1980s and laid off thousands of employees (see Table 2). Consequently, previous
centers of high wage employment in mining, manufacturing, and construction all declined
significantly. A net out-migration of 65,000 people reduced New Orleans MSA population from
1.35 million in 1985 to 1.28 million in 1990. MSA population increased to 1.32 million in 1995,
while the population of the city of New Orleans declined by 15 percent from 568,000 in 1980 to
482,290 in 1995 (Maruggi 1997).

16
TABLE 2
Shifts in New Orleans Area Employment Indicators, 1976-1995
Sector 1976 1980 1985 1990 1995 % Change1980-90
Mining 17,900 22,800 23,400 17,700 13,800 -22
Construction 34,000 31,500 43,900 25,300 27,500 -20
Manufacturing 63,000 66,600 50,600 49,000 47,400 -26
Trans, Comm, Utilities 47,900 58,500 48,500 46,700 42,300 -20
Trade 119,500 134,200 142,800 136,300 148,300 2
Finance, Ins, Real Estate 27,300 31,100 33,600 32,200 30,200 4
Services 94,800 117,100 135,200 154,500 186,600 32
Government 74,100 89,000 94,900 94,500 103,600 6
Total Non-AgEmployment
478,500 563,200 560,500 556,200 599,700 1
Source: Maruggi 1997.
17
Construction and expansion of a world class Convention Center and Aquarium helped
alleviate the economic crisis, and the city has experienced a more diversified recovery since
1990. The key sectors of employment diversification are health and tourism (see Table 2). New
Orleans MSA unemployment fell from over eleven percent in 1985 to 6.5 percent in 1995 as
large numbers of lower paying jobs in tourism and retail trade replaced lost employment related
to oil and gas extraction, and as workers left the area or dropped out of the labor force.
Changes in Income and Racial Composition In New Orleans
Economic restructuring decreased mining and manufacturing employment of New
Orleans residents and increased employment in the service sector, much like the pattern reported
for the entire MSA. While growth of health and professional services brought many high wage
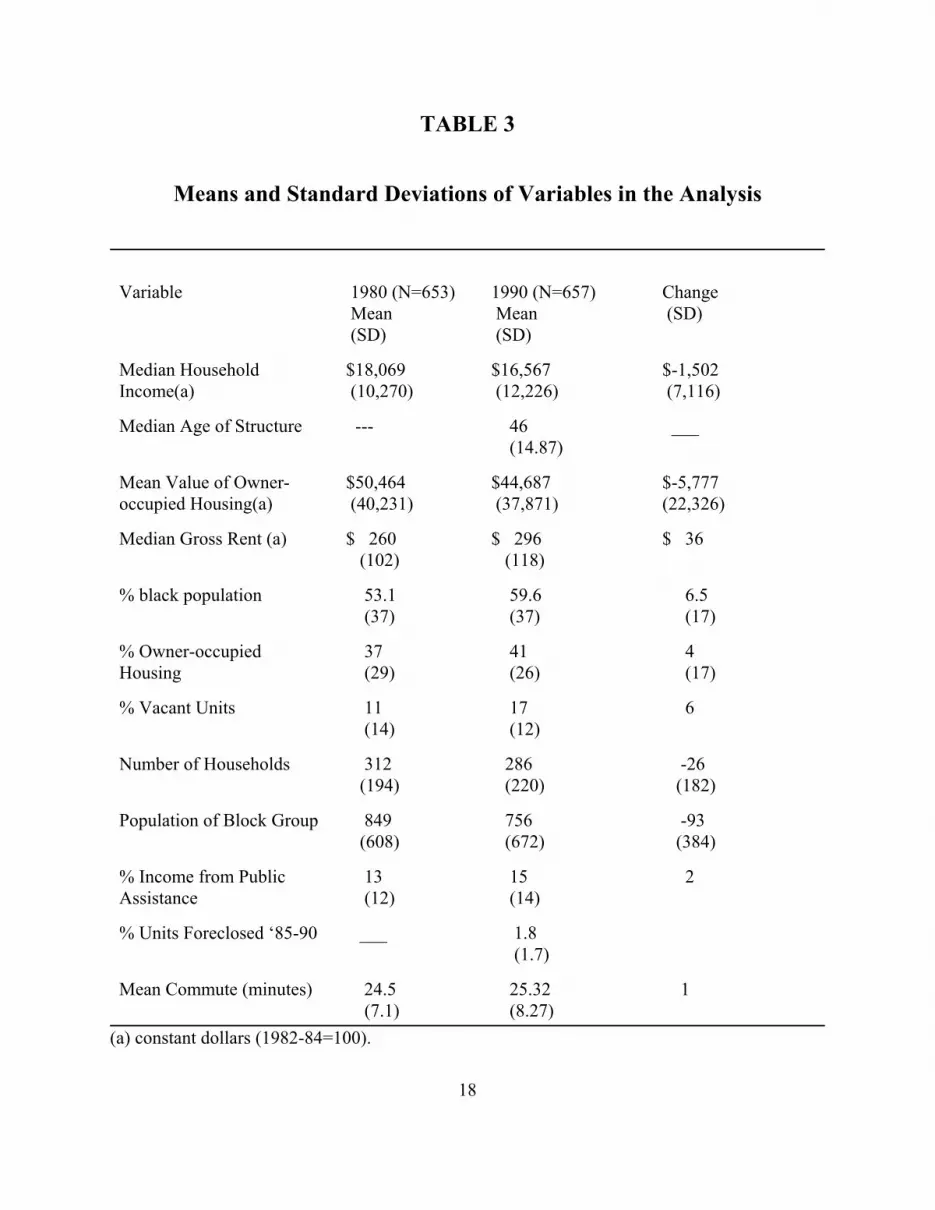
jobs to the city, the net effect of economic restructuring in the 1980s was a $1,502 (8.3 percent)
decrease in real median household income, and an increase from 13 percent to 15 percent of
aggregate household income derived from public assistance (See Table 3). Recessionary
economic conditions were also associated with a real decrease of $5,777 (11.4 percent) in the
mean value of owner occupied housing in the city, and an increase from 11 percent to 17 percent
of all types of housing units left vacant. Add in the failure of a half dozen local savings and loan
institutions, a crack cocaine epidemic with attendant increases in homicide, and the economic
shocks of the 1980s clearly brought the conditions for high rates of housing foreclosure,
increased concentration of poverty, and significant decline in many New Orleans neighborhoods.
18
TABLE 3
Means and Standard Deviations of Variables in the Analysis
Variable 1980 (N=653) Mean (SD)
1990 (N=657) Mean (SD)
Change (SD)
Median HouseholdIncome(a)
$18,069 (10,270)
$16,567 (12,226)
$-1,502 (7,116)
Median Age of Structure --- 46 (14.87)
___
Mean Value of Owner-occupied Housing(a)
$50,464 (40,231)
$44,687 (37,871)
$-5,777 (22,326)
Median Gross Rent (a) $ 260 (102)
$ 296 (118)
$ 36
% black population 53.1 (37)
59.6 (37)
6.5 (17)
% Owner-occupiedHousing
37 (29)
41 (26)
4 (17)
% Vacant Units 11 (14)
17 (12)
6
Number of Households 312 (194)
286 (220)
-26 (182)
Population of Block Group 849 (608)
756 (672)
-93 (384)
% Income from PublicAssistance
13 (12)
15 (14)
2
% Units Foreclosed ‘85-90 ___ 1.8 (1.7)
Mean Commute (minutes) 24.5 (7.1)
25.32 (8.27)
1
(a) constant dollars (1982-84=100).
19
The choice of 1980 to 1990 as the period to examine change in the racial composition of
New Orleans neighborhoods may truncate the analysis and obscure the effects of an ongoing
process of change. The black population of New Orleans increased from 37 percent in 1960 to 45
percent in 1970, before reaching 53 percent in 1980 and 60 percent in 1990 (U. S. Bureau of
Census 1972; see Table 3). A net out-migration of over 60,000 whites combined with a nearly
stable black population accounts for the increase in the proportion of blacks in New Orleans
between 1980 and 1990. This suggests that, contrary to the claims of Ottensmann (1995) and
other critics of the “racial tipping” hypothesis, changes in the racial composition of block groups
in New Orleans were not related to the in-migration of blacks, but to the migration of whites out
of the city. This is consistent with the prediction of Spain (1979) that in the 1970s New Orleans
began a rapid process of racial succession that replaced two centuries of racial residential
proximity with a pattern of racial segregation more typical of other large cities in the country.
The steady (.8 percent per year) increase in black percentage of the population over a
thirty year period raises the question of whether ongoing racial transition preceded changes in
real income reported for New Orleans block groups between 1980 and 1990. A cross-lagged
EGLS regression analysis was performed to untangle the causal priority of race and median
household income in the process of neighborhood change (see Table 4). Results indicate that
change in percent black in a block group from 1980 to 1990 was prior to changes in median
household income during the same period. Percent black in the block group in 1980 has a
significant negative effect on median household income in 1990, with the effect of median
household income in 1980 statistically controlled. The larger the percent black population in a
block group in 1980, the smaller the median household income in that block group in 1990.

20
TABLE 4
CROSS-LAGGED EGLS REGRESSION OF MEAN INCOME AND RACIAL
COMPOSITION OF NEW ORLEANS BLOCK GROUPS, 1980-90
Dep. Variable % Black, 1990
Dep. Variable Income, 1990
IndependentVar.
b (t-ratio)
b (t-ratio)
Intercept .167** (6.52)
6158.2** (5.81)
%Black 80 .842**(36.46)
-7010.3** (-7.40)
Income 80 -.000001 (-1.16)
.79** (22.84)
R 2 .841 .686
N 635 635
See table 1 for description of variables. ** p<.01
Household income in 1980, however, is not a significant predictor of percent black in a block
group in 1990, with percent black in 1980 controlled. It appears that the size of the prior black
population, rather than income levels, best predicts the subsequent proportion of blacks in a
block group. What happened was that whites migrated out of integrated neighborhoods and were

21
replaced by poorer blacks. This is consistent with the conclusion that whites will move out of
neighborhoods if they fear being outnumbered by blacks (Clark 1991; Denton and Massey
1991).
Consistent with the above findings, change in percent black in a block group is
significantly and positively correlated with median household income in 1980 (r=.16, p<.01, see
Appendix I), while the correlation of change in percent black in a block group with median
income in 1990 is essentially zero (r=-.002). Change in black population during the 1980s
occurred in block groups that declined in median income between 1980 and 1990. This is
consistent with predictions of both ecological and institutional theories that the continued influx
of poorer black residents drives down median income in affected block groups (Grigsby et al.
1987; Massey and Denton 1993). These results point toward an ongoing process of white flight
from the city as a primary impetus for the increased concentration of poverty among poorer
black residents who remained.
CORRELATIONAL ANALYSIS OF NEIGHBORHOOD CHANGE IN NEW ORLEANS
Vacancy rates are important indicators of abandonment and out-migration from a
neighborhood. Significant changes in the spatial pattern of vacancy in New Orleans block groups
are revealed by the low correlation (r=.10) between vacancy rates in 1980 and 1990. Further
examination of changes in vacancy rates is revealing. The vacancy rate in 1980 is negatively
correlated with percent black in the block group in both 1980 (r=-.12) and 1990 (r=-.12), which

22
suggests that vacancies were slightly more prevalent in block groups with a lower proportion of
black residents. However, the vacancy rate in 1990 is significantly and positively correlated with
percent black in the block group in both 1980 (r=.34) and 1990 (r=.32), which suggests that
vacancy rates not only increased in 1990, but that they had also shifted to predominantly black
neighborhoods. Higher vacancy rates in both 1980 and 1990 are also associated with less
affluent block groups, but the correlations are larger for 1990 than 1980. To summarize, vacancy
rates increased in lower income, predominantly black block groups that experienced an out-
migration of whites between 1980 and 1990. This provides additional support for the proposition
that white flight was a major cause of neighborhood instability.
The change from a negative and insignificant correlation of foreclosure and vacancy rate
in 1980 (r=-.07), to a significant and positive correlation in 1990 (r=.17, p< .01) associates
foreclosures with higher vacancy rates in predominantly black neighborhoods. This is consistent
with the specification of Massey and Denton’s (1993, 130-31) scenario in hypothesis three that
abandonment and out-migration combine with housing foreclosure to intensify racial transition
and neighborhood decline.
Significantly higher foreclosure rates are associated with block groups with a larger
percentage of blacks in the block group (r80 = .30, p < .01; r90 = .36, p < .01, see Appendix I). The
association of foreclosures with lower income black block groups contradicts the prediction in
hypothesis four that foreclosures were concentrated in middle to upper income block groups
inhabited by whites who fled the city during the oil crisis. While these results point to the
existence of an ongoing process of racial transition in New Orleans, the fact that the petroleum
industry either laid off or transferred to Houston thousands of white geologists and middle
23
managers clearly accelerated racial transition. A clearer picture of the process awaits the
multivariate analysis of housing foreclosure and racial transition.
MULTIVARIATE ANALYSIS OF FORECLOSURE AND RACIAL TRANSITION
A baseline EGLS regression model was estimated for racial composition of New Orleans
block groups. Consistent with the correlational analysis, percent black in the block group in 1980
is the strongest predictor of percent black in 1990 (see Table 5, model 1). Block groups with a
larger percentage of black residents in 1980 have a significantly larger black population in 1990.
Median household income in 1980 is not a significant predictor of percent black population in
1990.[5] However, block groups with larger increases in median income have significantly
smaller changes in percent black population than block groups with smaller changes in income,
and vice-versa. This suggests that more affluent block groups did not increase their black
population from 1980 to 1990 while less affluent ones did. This finding reinforces the argument
that the economic shocks of the mid-1980s intensified pre-existing patterns of racial transition,
possibly through their effects on housing prices and foreclosure rates.
Housing foreclosure has a significant and positive effect on the proportion of black
residents in New Orleans block groups, net of the effects of other variables in the model. The
higher the percentage of units foreclosed in the block group, the larger the percent black
population in 1990. More specifically, a 1.0 percent increase in foreclosures in a block group is
associated with a 1.3 percent larger black population in 1990.

TABLE 5
EGLS REGRESSION OF RACIAL COMPOSITION OF NEW ORLEANS BLOCK GROUPS ON PREDICTORS OF NEIGHBORHOOD CHANGE (a)
Model 1 Model 2
Variable b b
(t-ratio) (t-ratio)
Constant .160**(3.41)
.146**(3.17)
Proportion Black, 1980 .750**(33.55)
.795**(31.02)
Median Age of Unit, 1980 -.002**(-3.06)
-.001**(-2.87)
Median Household Income,1980
-9.05E-7(-.970)
-7.45E-7(-.836)
Change in Median HouseholdIncome, 1980-1990
-.074**(-5.65)
-.055**(-4.31)
Relative Cost of Owner-occupied Housing, 1980
-.032**(-2.95)
-.031**(-2.94)
Change in Number ofHouseholds, 1980-1990
.00008(1.88)
.00008(1.92)
Proportion of Foreclosures 1.274**(3.66)
2.777**(4.24)
Mean Commute Time, 1980 .006**(5.03)
.005**(4.76)
Proportion Black, 1980 XProportion Foreclosed
-2.72**(-3.14)
Change in ProfessionalEmployment, 1980-90
-.268**(-5.34)
Change in Personal ServiceEmployment, 1980-90
.162**(3.73)
Change in Agriculture andMining Employment, 1980-90
-.257*(-2.21)
R 2 .864 .876
N 636 636(a) See text for data sources, table 1 for description of variables.* p<.05; ** p<.01

25
As predicted by hypothesis one and most research on poverty, lower relative housing
costs in a block group are associated with a significantly larger black population. Mean commute
time is also a significant predictor of a larger black population. The longer the mean commute
time for people who work outside the home, the larger the percent black population in the block
group. This is probably a consequence of the slower commute time of blacks, more of whom ride
public transportation to work. The direction of the relationship between mean age of housing
stock and percent black in the block group contradicts predictions of neighborhood succession
theories summarized in hypothesis one. The older the average unit the smaller the percent black
in the block group[6]. This may be due to a strong movement for historic preservation in many
older neighborhoods, and to the large concentration of blacks and the significant racial transition
in Eastern New Orleans, which was developed after World War II and grew in the 1960s and
1970s as an integrated middle class suburb. Much of the decline in white population during the
1980s was from block groups in New Orleans East (Spain 1979). At the same time, change in the
number of households is not a significant predictor of black population in 1990. This suggests
that the increase in the concentration of blacks was not only due to an out-migration of whites,
but also a concomitant intra-urban migration of blacks into block groups abandoned by whites.
In an effort to specify the effects of economic shocks on racial transition, the baseline
model was elaborated with the addition of variables that measure change from 1980 to 1990 in
the percent of total block group employment in agriculture and mining, management and
professions, and personal services. The statistical interaction was also investigated between
percent black in a block group in 1980 and percent of housing units foreclosed from 1985 to
1990, as it affects black population in 1990.[7] Results in the baseline model did not change
much with the addition of these variables. The same determinants of neighborhood change

26
remain significant, with a slightly stronger positive effect of housing foreclosure on percent
black in the block group.
Changes in block group employment have effects on black population similar to those
predicted by many scholars (e.g., Wilson 1987). Larger changes in professional and managerial
employment are associated with a significantly smaller percentage of blacks in a block group.
This is because most managerial and professional employees are white and live in predominantly
white neighborhoods. The same is true of changes in agricultural and mining employment.
Declines in employment in these sectors were concentrated in upper income white
neighborhoods, so change in the percent employed in mining is associated with block groups
with smaller black populations. Also as expected, larger changes in personal service employment
have a significant positive effect on the percent black in a block group in 1990. This is related to
the high concentration of blacks in lower paid personal service jobs like maid and gardener.
The interaction of housing foreclosure and percent black in the block group in 1980 has a
significant negative effect on percent black in the block group in 1990. This indicates a nonlinear
relationship where housing foreclosures have a different effect on the percent black population in
1990 in block groups with a smaller black population in 1980 than in block groups with a larger
black population in 1980. A possible scenario to account for this finding is that the negative
effects of economic recession on housing prices were compounded in integrated neighborhoods
by a fear of racial transition that increased foreclosure rates when some whites who were laid off
or transferred by oil companies abandoned their mortgages and left the city.
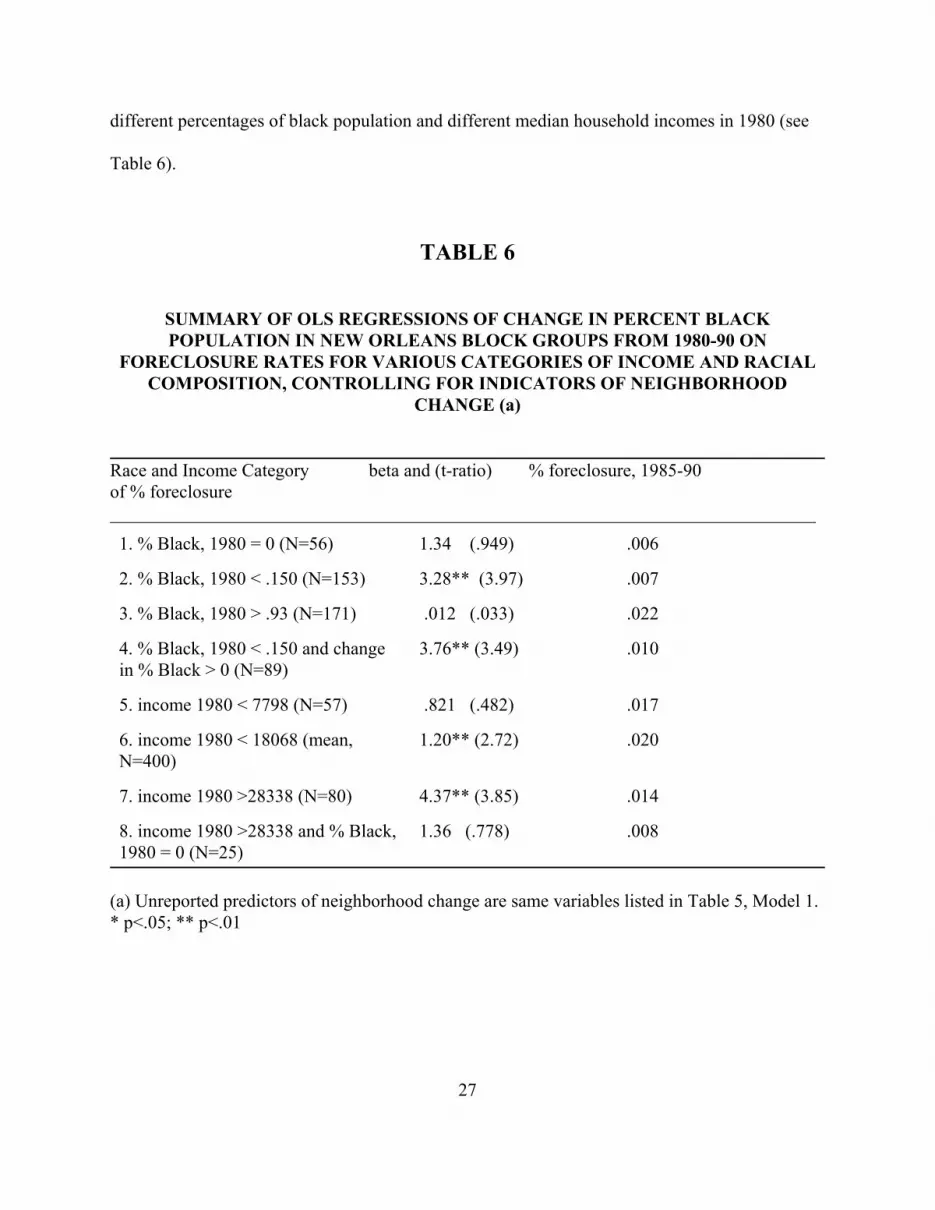
The nonlinear relationship between housing foreclosure and racial transition was
investigated further with the estimation of OLS regression models for block groups with
27
different percentages of black population and different median household incomes in 1980 (see
Table 6).
TABLE 6
SUMMARY OF OLS REGRESSIONS OF CHANGE IN PERCENT BLACKPOPULATION IN NEW ORLEANS BLOCK GROUPS FROM 1980-90 ON
FORECLOSURE RATES FOR VARIOUS CATEGORIES OF INCOME AND RACIALCOMPOSITION, CONTROLLING FOR INDICATORS OF NEIGHBORHOOD
CHANGE (a)
Race and Income Category beta and (t-ratio) % foreclosure, 1985-90of % foreclosure_____________________________________________________________________________
1. % Black, 1980 = 0 (N=56) 1.34 (.949) .006
2. % Black, 1980 < .150 (N=153) 3.28** (3.97) .007
3. % Black, 1980 > .93 (N=171) .012 (.033) .022
4. % Black, 1980 < .150 and changein % Black > 0 (N=89)
3.76** (3.49) .010
5. income 1980 < 7798 (N=57) .821 (.482) .017
6. income 1980 < 18068 (mean,N=400)
1.20** (2.72) .020
7. income 1980 >28338 (N=80) 4.37** (3.85) .014
8. income 1980 >28338 and % Black,1980 = 0 (N=25)
1.36 (.778) .008
(a) Unreported predictors of neighborhood change are same variables listed in Table 5, Model 1.* p<.05; ** p<.01

28
The idea here is to figure out how foreclosure affected block groups that were already
experiencing racial transition when hit by the economic shock of lower oil prices. Percent black
in the block group in 1980 was divided into three non-discrete categories: (1) zero percent black
(n=56); (2) more than one standard deviation below the mean percent black for the city (<.15
black, n=153); and (3) more than one standard deviation above the mean percent black for the
city (>.93 black, n=171). The dependent variable is change in percent black in the block group,
which is regressed on all the predictor variables in Table 5, Model 1. For clarity of exposition,
percent of housing units foreclosed and the regression coefficients for foreclosure rate are the
only statistics presented in Table 6.
Results of these regressions reinforce the conclusion that a nonlinear relationship exists
between housing foreclosure and racial transition. Percent foreclosure is not a significant
predictor of percent black population in 1990 in block groups that either had no blacks in 1980
(Model 1, p=.949), or where the block group was more than 93 percent black in 1980 (Model 3,
p=-.033). Foreclosure rates were low (.006), and income was high ($12,000 above the city-wide
mean) and increasing in the all white block groups, hardly the conditions for either foreclosure or
racial transition.
Foreclosure rate is a significant predictor of black population in a block group in 1990
when the black population in 1980 was low, and especially when it was low but increasing (see
Table 6, Models 2 and 4). It appears that housing foreclosure increased the percent black
population in neighborhoods that were already beginning to experience racial transition. Higher
income whites who departed these neighborhoods were replaced by lower income blacks, and
housing foreclosure played a significant role in the process. Let us now briefly turn to the effects
of foreclosure on racial transition in more and less affluent neighborhoods.

29
Foreclosure is not a significant predictor of change in the black population of the poorest
block groups in the city (see Table 6, Model 5, p=.482), or in upper income block groups without
any black population in 1980 (see Table 6, Model 8, p=.778). Foreclosure is an important
predictor of racial transition in block groups above the lowest income level where there was a
pre-existing black population. The substantive interpretation of this finding is that significant
numbers of working and middle class whites living in integrated neighborhoods, particularly in
Eastern New Orleans, abandoned to foreclosure homes with lower market values than mortgage
balances when their jobs were affected by the oil crisis. They were replaced in these
neighborhoods by poorer black residents.
DISCUSSION AND CONCLUSION
Massey and Denton (1993, 220) maintain that the main issue in the study of urban
poverty is not whether race or class perpetuates the existence of poverty, but how they interact to
produce neighborhood outcomes in particular locations. We investigated whether housing
foreclosure is one mechanism that may help untangle the interaction of race and class in the
process of neighborhood change. Empirical results are consistent with the argument that housing
foreclosure intensified an ongoing white exodus from neighborhoods with relatively small black
populations when a severe economic downturn negatively affected housing prices. It is plausible
to argue that economic downturn catalyzed latent preferences of some whites to leave a
neighborhood that was already in transition.

30
Housing foreclosure and various forms of vacancy were significant components of
population decline, racial transition, and neighborhood change in New Orleans during the 1980s.
Economic shocks reduced home values and that may well have interacted with negative racial
stereotypes about the perceived effects of further integration on home values to catalyze the re-
location decisions of some white residents. Recession in the core of the local economy reduced
housing prices and opened up declining middle class suburbs (Eastern New Orleans) to poorer
people who, in New Orleans, were also black. Negative racial stereotypes were incited and a
segregated housing market existed to intensify racial transition and the concentration of poverty
(Massey and Denton 1993, 220). The process of racial transition in New Orleans was ongoing,
what we show is that when a severe economic downturn accelerated oil industry restructuring,
employment and housing prices dropped and housing foreclosure became a significant
independent accelerator to the process. This argument is tentative, for it remains unclear the
extent to which a foreclosure strategy developed among lenders or distressed white home
owners, and whether such a strategy hastened “racial tipping” of certain neighborhoods.
However, it is clear that housing foreclosures did contribute to the process of racial transition in
the city.
The argument developed here is complicated by difficulties in the analysis of change, and
the complex interactions of race, income, housing costs, and foreclosure rates. Strategies for
future research should include structural equation modeling of the causal processes investigated
in this article. How do exogenous economic shocks affect housing prices, income, and
foreclosure rates as they all influence racial transition? It also remains to be investigated whether
foreclosures primarily affected vacancy rates of rental property or among resident homeowners

31
hurt by the economic downturn. Another future research strategy is to extend the study of
housing foreclosure and neighborhood change to additional cities. It is very likely that
foreclosure has different effects on neighborhood transition in cities with different types of
economic stimulus, different local housing markets, and different racial attitudes and racial
distributions of population. A comparison of New Orleans with a northern industrial city that
experienced economic decline and a southern city that prospered in the 1980s would further
clarify the role of housing foreclosure in the process of neighborhood change.
The theoretical contribution of this study can also be expanded. Foreclosure and
abandonment may well be central mechanisms that link changes in the macro economy, housing
finance, and racial stereotypes with the neighborhood succession process. However, micro level
analysis of lender, homeowner, and landlord decision making are also required to cement the
links between macro economics, housing foreclosure, and neighborhood change. It is our hope
that this article will stimulate future research on these very important questions.

32
NOTES
[1] The 147 missing foreclosure cases are not statistically different (Student’s t-test, p<.01, two-
tailed) from the spatially matched cases on five important attributes (loan amount, interest rate,
monthly payment, outstanding balance, and appraised value). Since some cases could not be
spatially matched, there is no way to definitively evaluate the extent of spatial bias. For the
purposes of this analysis, we assume no systematic spatial bias in these data.
[2] The analysis reported below includes a Granger test of causal order, which is a cross lagged
regression of two or more variables measured at two or more points in time. A variable is said to
“Granger cause” another if any value of the first variable measured at times (t-1), (t-2), etc. has a
significant effect on the second variable measured at time (t), controlling for all prior values of
the second variable (Finkel 1995, 25-6; Markus 1979).
[3] The conditional change model can be expressed as follows:
Yt = Bo + B1 X(t) + B2 Y(t-1 ) + e ; (1)
The unconditional change model with a lag value of the dependent variable can be expressed as
follows:
Change Y = Bo + B1 X(t-1 ) + (B2-1 )Y(t-1 ) + e . (2)
In equation (2), the effect of Y(t-1) on Change in Y can be viewed as the stability effect of Y(t-1)
on Yt in equation (1), minus one (Finkel 1995, 7).

33
[4] The generalized least squares procedure used in this analysis uses OLS residuals to estimate
the covariances of errors across observations. The first observation is used to find a constant or
starting value for the weighting process. This technique is widely used to correct for a first order
autocorrelation process (Greene 1990, 440; Judge et al. 1985; SAS 1993, 217).
[5] The high correlation between household income and relative housing costs in a block group
in 1980 (r=.70) creates a collinearity problem that confounds the analysis of household income
and percent black, 1990, when relative housing costs is included in the model. Much
neighborhood succession literature suggests that income filters households into housing sub-
markets, so it was decided that relative housing costs and changes in income were the most
relevant processes modeled, and the collinearity of income and relative housing costs must be
tolerated.
[6] Mean age of occupied housing unit can be a misleading variable in the analysis of
neighborhood change in an older city like New Orleans. The oldest house coded in the Census of
Population and Housing was constructed in 1939, a relatively new house by New Orleans
standards.
[7] Examination of scatterplots from the regression of percent black population on housing
foreclosures in a block group revealed an abnormal distribution of errors, which suggested the
possibility of a nonlinear relationship. Tests for interaction effects were then performed.

34
APPENDIX I
CORRELATIONS OF VARIABLES IN THE ANALYSIS
Variable (a) 1 2 3 4 5 6 7 8 9 10
1. Propbl90
2. Propbl80 .898
3. Bl9080 .178 -.273
4. Hsinc80 -.549 -.600 .159
5. Hsinc90 -.546 -.533 -.002 .808
6. Inco9080 -.280 -.198 -.171 -.024 .466
7. Propfc .356 .299 .109 -.131 -.096 -.005
8. Ageunit .094 .164 -.161 -.269 -.011 .017 .005
9. Hsld9080 -.068 -.141 .167 .304 .158 -.036 .128 -.279
10.Mencom80 .491 .502 .043 -.310 -.166 -.179 .230 .207 -.078
11. Pro9080 -.238 -.140 -.206 .089 .161 .142 -.141 .025 .036 -.107
12. Seroc9080 .095 -.003 .214 -.034 -.092 -.167 .046 .023 -.004 .009
13. Agmi9080 -.022 .025 -.105 -.117 -.059 .075 -.049 .091 -.059 -.038
14. Relco80 -.519 -.509 .006 .705 .747 .168 -.186 .081 .163 -.149
15. Chgrelco .067 .065 .001 -.115 -.086 .004 .019 .086 -.059 -.015
16. Vac90 .318 .341 -.067 -.474 -.305 .066 .174 .309 -.188 .188
17. Vac80 -.116 -.118 .010 -.295 -.210 .129 -.072 -.266 .054 -.401
18. Meanva90 -.465 -.442 -.028 .653 .763 .237 -173 .125 .101 -.135
19. Meanva80 -.519 -.509 .006 .705 .747 .168 -.186 .081 .163 -.149
(a) See Table 1 for a description of variables.

35
APPENDIX I (Con’t)
CORRELATION MATRIX OF VARIABLES IN THE ANALYSIS
11 12 13 14 15 16 17 18
1.
2.
3.
4.
5.
6.
7.
8.
9.
10.
11.
12. -.131
13. .022 -.002
14. .108 -.055 -.083
15. -.040 .015 .025 -.182
16. -.128 .013 .060 -.298 .224
17. -.006 .019 .073 -.240 .089 -.626
18. .118 -.045 -.050 .838 -.013 -.244 -221
19. .108 -.055 -.083 1.00 -.182 -.298 -.240 .838

36
REFERENCES
Aglietta, M. 1978. A theory of capitalist regulation: The U.S. experience. London: Verso.
Allison, P. 1990. Change scores as dependent variables in regression analysis.Sociological Methodology 20: 93-114.
Baxter, V. 1997. The effects of industry governance on offshore oil development in the Gulf ofMexico. International Journal of Urban and Regional Research 21 (2): 238-258.
Beck, N., and J. N. Katz. 1996. Nuisance vs. substance: specifying and estimatingtime-series-cross-section models. Political Analysis 6: 1-37.
Bradbury, K., A. Downs, and K. Small. 1982. Urban decline and the future of American cities.Washington, D.C.: The Brookings Institution.
Case, K. E., and R. J. Shiller. 1996. Mortgage default risk and real estate prices: The uses ofindex-based futures and options in real estate. Journal of Housing Research 7 (2): 243-58.
Clark, W.A.V. 1991. Residential preferences and neighborhood racial segregation: A testof the Schelling segregation model. Demography 28 (1): 1-19.
Cook, C. C. 1988. Components of neighborhood satisfaction: Responses from urban andsuburban low-income, single-parent women. Environment and Behavior 20 (2): 115-149.
Cunningham, D. F., and C. A. Capone. 1990. The relative termination experiences of adjustableto fixed-rate mortgages. Journal of Finance 55 (5): 1687-1705.
Denton, N.A., and D.S. Massey. 1991. Patterns of neighborhood transition in a multiethnicworld: U.S. metropolitan areas, 1970-80. Demography 28 (1): 41-63.
Downs, A. 1981. Neighborhoods and Urban Development. Washington, D.C.: The BrookingsInstitution.
Eggers, M., and D. S. Massey. 1992. A longitudinal analysis of urban poverty: Blacks In U.S.Metropolitan areas between 1970 and 1980. Social Science Research 21 (2): 175-203.
Faris, R. E. L. 1967. Chicago Sociology, 1920-32. Chicago: University of Chicago Press.

37
Farley, R.C., H. Schuman, C. Steeh, S, Bianchi, D. Colasanto, and S. Hatchett. 1978.Chocolate city, vanilla suburbs: Will the trend toward racially separate communitiescontinue? Social Science Research 7: 319-44.
Farley, R., C. Steeh, M. Krysan, T. Jackson, and K. Reeves. 1994. Stereotypes and segregation:Neighborhoods in the Detroit area. American Journal of Sociology 100 (3): 750-80.
Finkel, S. E. 1995. Causal analysis with panel data. Beverly Hills, CA: Sage.
Florida, R. 1986. The political economy of financial deregulation and the reorganization ofhousing finance in the U.S. International Journal of Urban and Regional Research 10 (2):207-31.
Gale, D. E. 1979. Middle class resettlement in older urban neighborhoods: the evidence andimplications. Journal of the American Planning Association 45: 293-304.
Galster, G.C. 1990. White flight from racially integrated neighborhoods in the 1970s:The Cleveland experience. Urban Studies 27 (3): 385-399.
------. 1991. Federal fair housing policy: The great misapprehension. In BuildingFoundations: Housing and Federal Policy, edited by D. DiPasquale and L. Keyes.Philadelphia: University of Pennsylvania.
Galster, G.C., and E. Hill. 1992. The metropolis in black and white. New Brunswick, NJ:Center For Urban Policy Research.
Galster, G.C., and R. B. Mincy. 1993. Understanding the changing fortunes of metropolitanneighborhoods: 1980-1990. Housing Policy Debate 4 (3): 303-354.
Galster, G.C., R.B. Mincy, and M. Tobin. 1997. The disparate racial neighborhood impactsof metropolitan economic restructuring. Urban Affairs Review 32 (6): 797-824.
Gordon, D., R. Edwards, and M. Reich. 1982. Segmented work: Divided workers.Cambridge, England: Cambridge University Press.
Grant, D. S. 1995. The political economy of business failures across the American states.American Sociological Review 60 (6): 851-73.
Greene, W. H. 1990. Econometric Analysis. New York: MacMillan.
Grigsby, W. G., M. Baratz, G. Galster, and D. Maclennan. 1987. The dynamics of neighborhoodchange and decline. Progress in Planning 28: 1-76.
Hanushek, E.A., and J.E. Jackson. 1977. Statistical methods for social scientists. New York:

38
Academic Press.
Harrison, B., and B. Bluestone. 1988. The great u-turn. New York: Basic.
Harvey, D. 1973. Social justice and the city. Oxford, England: Blackwell.
Hoover, E. M., and R. Vernon. 1962. Anatomy of a metropolis. N.Y.: Doubleday.
Jargowsky, P. 1997. Poverty and place. New York: Russell Sage.
Judge, G. G., W. E. Griffiths, R. C. Hill, H. Lutkepohl, and T. C. Lee. 1985. The theory andpractice of econometrics. New York: Wiley.
Jones, L.D. 1993. Deficiency judgments and the exercise of the default option in homemortgage loans. Journal of Law and Economics 36 (1): 115-138.
Lauria, M. 1998. Racial transition and neighborhood change: White flight or foreclosure andaffordability. Housing Policy Debate 9 (2) (forthcoming).
Logan, J., and H. Molotch. 1987. Urban fortunes: The political economy of place. Berkeley,CA: University of California.
Markus, G.B. 1979. Analyzing panel data. Beverly Hills, CA: Sage.
Maruggi, V. 1997. The metropolitan New Orleans economy, 1976-1995. Draft report. NewOrleans: University of New Orleans Division of Business and Economic Research.
Massey, D. S., and N. A. Denton. 1993. American apartheid: Segregation and the making of theunderclass. Cambridge, MA: Harvard University Press.
Megbolugbe, I. F., M. C. Hoek-Smit, and P. D. Linneman. 1996. Understanding neighborhooddynamics: A review of the contributions of William G. Grigsby. Urban Studies 33 (10):1779-1795.
Meyerson, A. 1986. The changing structure of housing finance in the U. S. International Journalof Urban and Regional Research 10 (4): 465-97.
Morenoff, J. M., and M. Tienda. 1997. Underclass neighborhoods in temporal and ecologicalperspective. Annals of the American Association of Political and Social Sciences 551:59-72.
Muth, R. 1969. Cities and housing. Chicago: University of Chicago Press.Ottensmann, J.R. 1995. Requiem for the tipping point hypothesis. Journal of Planning Literature
10 (2): 131-141.

39
Ryan, T. 1985. The New Orleans economy - What makes it tick? LA Business Survey 16 (2): 3-12. New Orleans: Univ. of New Orleans, Division of Business and Economic Research.
SAS Institute. 1993. SAS/ETS user’s guide, version 6, 2nd edition. Cary, NC: SAS Institute.
Shenker, J. C., and A. J. Colletta. 1992. Asset securitization: Evolution, current issues and newfrontiers. In Legal and Business Aspects of the Depressed Real Estate Market, edited byJ. P. Rosen and J. C. Shenker, pp. 32-92. Englewood Cliffs, NJ: Prentice Hall Law andBusiness.
Smith, N. 1979. Gentrification and capital.: Theory, practice, and ideology in Society Hill.Antipode 11: 24-35.
Spain, D. 1979. Race relations and residential segregation in New Orleans: Two centuriesof paradox. Annals of the American Academy of Political and Social Science 441: 82-96.
Squires, G. D. 1994. Capital and communities in black and white. Albany, NY: State Universityof New York Press.
Temkin, K., and W. Rohe. 1996. Neighborhood change and urban policy. Journal of PlanningEducation and Research 15 (3): 159-170.
U.S. Bureau of Census. 1972. Louisiana census. Washington, D.C.: U.S. Census Bureau.
U. S. Bureau of Census. 1982. U.S. census of population. and housing (STF3A). Washington,D.C.: U.S. Census Bureau.
U. S. Bureau of Census. 1992. U.S. census of population and housing (STF3A). Washington,D.C.: U.S. Census Bureau.
Vernon, R. 1960. Metropolis 1985. N.Y.: Doubleday.
Wilson, W. J. 1987. The truly disadvantaged. Chicago: University of Chicago Press.
Wood, P.B., and B.A. Lee. 1991. Is neighborhood racial succession inevitable? Forty yearsof evidence. Urban Affairs Quarterly 26 (4): 610-20.

40


