Embed Size (px)
Citation preview
House dust exposure mediates gut microbiomeLactobacillus enrichment and airway immune defenseagainst allergens and virus infectionKei E. Fujimuraa,1, Tine Demoorb,1, Marcus Raucha, Ali A. Faruqia, Sihyug Jangb, Christine C. Johnsonc,Homer A. Bousheyd, Edward Zorattie, Dennis Ownbyf, Nicholas W. Lukacsb,2, and Susan V. Lyncha,2
Divisions of aGastroenterology and dPulmonary and Critical Care Medicine, University of California, San Francisco, CA 94143; bDepartment of Pathology,University of Michigan, Ann Arbor, MI 48109; cDepartment of Public Health Sciences and eDivision of Allergy and Clinical Immunology, Henry Ford HealthSystem, Detroit, MI 48202; and fDepartment of Pediatrics, Georgia Regents University, Augusta, GA 30912
Edited by Ralph R. Isberg, Howard Hughes Medical Institute/Tufts University School of Medicine, Boston, MA, and approved November 19, 2013 (received forreview June 6, 2013)
Exposure to dogs in early infancy has been shown to reduce therisk of childhood allergic disease development, and dog ownershipis associated with a distinct house dust microbial exposure. Here,we demonstrate, using murine models, that exposure of mice todog-associated house dust protects against ovalbumin or cock-roach allergen-mediated airway pathology. Protected animalsexhibited significant reduction in the total number of airway Tcells, down-regulation of Th2-related airway responses, as well asmucin secretion. Following dog-associated dust exposure, the cecalmicrobiome of protected animals was extensively restructured withsignificant enrichment of, amongst others, Lactobacillus johnsonii.Supplementation of wild-type animals with L. johnsonii protectedthem against both airway allergen challenge or infection with re-spiratory syncytial virus. L. johnsonii-mediated protection was asso-ciated with significant reductions in the total number and propor-tion of activated CD11c+/CD11b+ and CD11c+/CD8+ cells, as well assignificantly reduced airway Th2 cytokine expression. Our resultsreveal that exposure to dog-associated household dust results inprotection against airway allergen challenge and a distinct gastro-intestinal microbiome composition. Moreover, the study identifiesL. johnsonii as a pivotal species within the gastrointestinal tract capa-ble of influencing adaptive immunity at remote mucosal surfaces ina manner that is protective against a variety of respiratory insults.
house environment | airway adaptive immunity |gastrointestinal bacterial community | Lactobacilliaceae
The emerging field of human microbiome research has dem-onstrated the key role microbial communities play in a vari-
ety of critical mammalian processes including ancillary mucosalbarrier function (1) and metabolism (2, 3), as well as develop-ment and modulation of host immune responses (4, 5). This isparticularly evident in the gastrointestinal (GI) tract where thecomposition of the microbiome in this niche and, specifically, thepresence of particular bacterial species such as segmented fila-mentous bacteria and those belonging to Clostridium clades IVand XIV, have been shown to induce specific T-cell repertoires,i.e., Th17 and CD4+ FoxP3+ T-regulatory cells, respectively (4,6). These studies demonstrate that despite the complexity of theGI microbiome, the presence or absence of specific bacterialspecies can dramatically alter the adaptive immune environment.Human studies appear to support this concept. A large
European birth cohort study demonstrated that a significantincrease in the number of Escherichia coli or Clostridium difficilein fecal samples from 3-wk-old infants was associated with agreater risk of developing a spectrum of childhood allergic dis-eases (7), commonly characterized by overactive Th2 adaptiveimmune response. Early-life exposures, including those known toimpact GI microbiome composition, e.g., antibiotic administrationand caesarian section delivery, have also been associated withincreased risk for childhood asthma (8, 9). Conversely, exposure
to livestock or pets, particularly dogs during this early-life period,significantly decreases the risk for disease development (10, 11).Conceivably, the mechanism by which animal exposures mediatetheir protective effect is through their impact on local environ-mental microbial exposures, which in turn influence microbiomemembership and the immune response of the human host. Be-cause GI microbiome composition clearly impacts immune func-tion, and early GI colonization patterns are linked to allergicdisease development, it is necessary to understand whether andhow distinct environmental microbial exposures associated withallergy-protective factors influence GI microbiome compositionand airway disease outcomes.
ResultsHouse Dust Exposure Affords Airway Protection. House dust wascollected from two residences: one possessed an indoor/outdoordog (D), and the other had no pet (NP) present. The total weightof dust collected from the D house was approximately fourfoldgreater than that of the NP house. DNA extraction of 0.1 g of
Significance
Early-life exposure to dogs is protective against allergic diseasedevelopment, and dog ownership is associated with a distinctmilieu of house dust microbial exposures. Here, we show thatmice exposed to dog-associated house dust are protectedagainst airway allergen challenge. These animals exhibit re-duced Th2 cytokine production, fewer activated T cells, anda distinct gut microbiome composition, highly enriched forLactobacillus johnsonii, which itself can confer airway pro-tection when orally supplemented as a single species. Thisstudy supports the possibility that host–environment inter-actions that govern allergic or infectious airway disease may bemediated, at least in part, by the impact of environmentalexposures on the gastrointestinal microbiome compositionand, by extension, its impact on the host immune response.
Author contributions: T.D., C.C.J., H.A.B., E.Z., D.O., N.W.L., and S.V.L. designed research;K.E.F., T.D., M.R., and S.J. performed research; K.E.F., A.A.F., and C.C.J. contributed newreagents/analytic tools; K.E.F., T.D., M.R., A.A.F., S.J., N.W.L., and S.V.L. analyzeddata; and K.E.F., T.D., M.R., N.W.L., and S.V.L. wrote the paper.
The authors declare no conflict of interest.
This article is a PNAS Direct Submission.
Freely available online through the PNAS open access option.
Data deposition: The microbiome data reported in this paper have been deposited in theGene Expression Omnibus (GEO) database, www.ncbi.nlm.nih.gov/geo (accession no.GSE52909).1K.E.F. and T.D. contributed equally to this work.2To whom correspondence may be addressed. E-mail: [email protected] or [email protected].
This article contains supporting information online at www.pnas.org/lookup/suppl/doi:10.1073/pnas.1310750111/-/DCSupplemental.
www.pnas.org/cgi/doi/10.1073/pnas.1310750111 PNAS Early Edition | 1 of 6
MICRO
BIOLO
GY
each dust and 16S rRNA amplification under identical con-ditions resulted in no detectable PCR product from the NPsample, whereas the D sample produced >250 ng of amplicon.This is consistent with our previous study in which NP dustsamples exhibited low bacterial burden, with 40% of samplesfailing to produce a 16S rRNA PCR product (12). Nonmetricmultidimensional scaling (NMDS) analysis based on a Canberradistance matrix confirmed that the microbial composition of theD dust used for these experiments was more similar to indoor/outdoor dog-associated dust samples than to any other type ofhouse dust (cat-owning or no-pet homes) examined in our pre-vious study (12) (Fig. S1A). Canberra distances between thissample and various distinct dust sample types previously ana-lyzed confirmed this observation (Fig. S1B).House dust bacterial burden and diversity likely play a signifi-
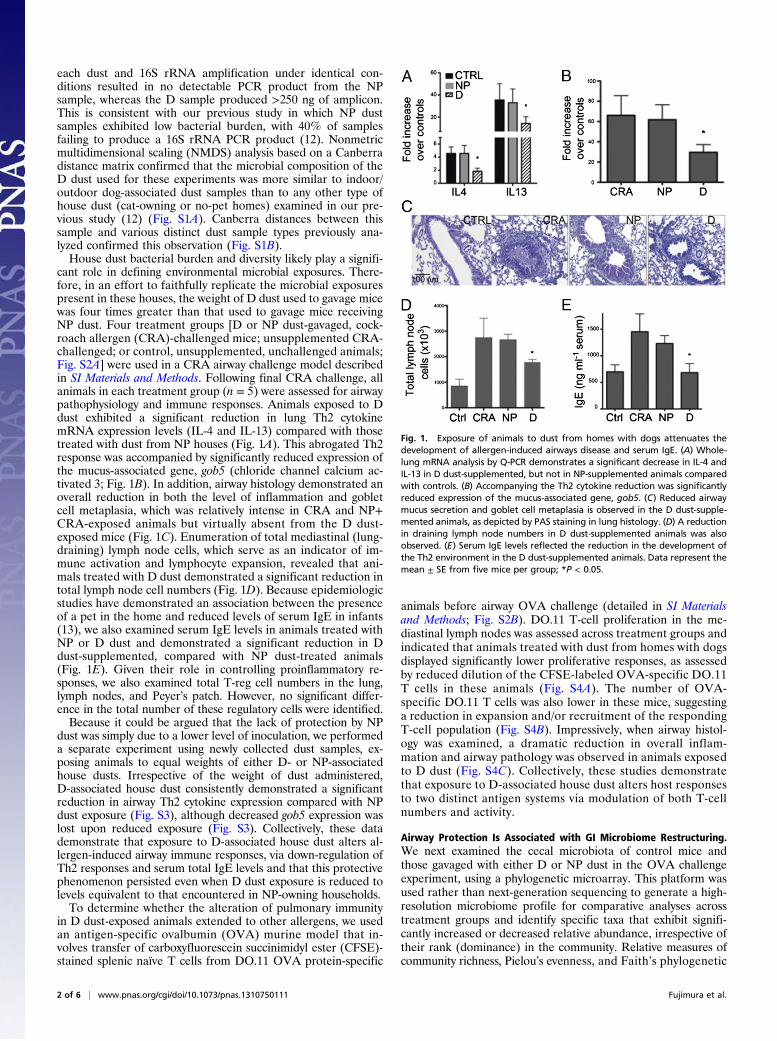
cant role in defining environmental microbial exposures. There-fore, in an effort to faithfully replicate the microbial exposurespresent in these houses, the weight of D dust used to gavage micewas four times greater than that used to gavage mice receivingNP dust. Four treatment groups [D or NP dust-gavaged, cock-roach allergen (CRA)-challenged mice; unsupplemented CRA-challenged; or control, unsupplemented, unchallenged animals;Fig. S2A] were used in a CRA airway challenge model describedin SI Materials and Methods. Following final CRA challenge, allanimals in each treatment group (n = 5) were assessed for airwaypathophysiology and immune responses. Animals exposed to Ddust exhibited a significant reduction in lung Th2 cytokinemRNA expression levels (IL-4 and IL-13) compared with thosetreated with dust from NP houses (Fig. 1A). This abrogated Th2response was accompanied by significantly reduced expression ofthe mucus-associated gene, gob5 (chloride channel calcium ac-tivated 3; Fig. 1B). In addition, airway histology demonstrated anoverall reduction in both the level of inflammation and gobletcell metaplasia, which was relatively intense in CRA and NP+CRA-exposed animals but virtually absent from the D dust-exposed mice (Fig. 1C). Enumeration of total mediastinal (lung-draining) lymph node cells, which serve as an indicator of im-mune activation and lymphocyte expansion, revealed that ani-mals treated with D dust demonstrated a significant reduction intotal lymph node cell numbers (Fig. 1D). Because epidemiologicstudies have demonstrated an association between the presenceof a pet in the home and reduced levels of serum IgE in infants(13), we also examined serum IgE levels in animals treated withNP or D dust and demonstrated a significant reduction in Ddust-supplemented, compared with NP dust-treated animals(Fig. 1E). Given their role in controlling proinflammatory re-sponses, we also examined total T-reg cell numbers in the lung,lymph nodes, and Peyer’s patch. However, no significant differ-ence in the total number of these regulatory cells were identified.Because it could be argued that the lack of protection by NP
dust was simply due to a lower level of inoculation, we performeda separate experiment using newly collected dust samples, ex-posing animals to equal weights of either D- or NP-associatedhouse dusts. Irrespective of the weight of dust administered,D-associated house dust consistently demonstrated a significantreduction in airway Th2 cytokine expression compared with NPdust exposure (Fig. S3), although decreased gob5 expression waslost upon reduced exposure (Fig. S3). Collectively, these datademonstrate that exposure to D-associated house dust alters al-lergen-induced airway immune responses, via down-regulation ofTh2 responses and serum total IgE levels and that this protectivephenomenon persisted even when D dust exposure is reduced tolevels equivalent to that encountered in NP-owning households.To determine whether the alteration of pulmonary immunity
in D dust-exposed animals extended to other allergens, we usedan antigen-specific ovalbumin (OVA) murine model that in-volves transfer of carboxyfluorescein succinimidyl ester (CFSE)-stained splenic naïve T cells from DO.11 OVA protein-specific
animals before airway OVA challenge (detailed in SI Materialsand Methods; Fig. S2B). DO.11 T-cell proliferation in the me-diastinal lymph nodes was assessed across treatment groups andindicated that animals treated with dust from homes with dogsdisplayed significantly lower proliferative responses, as assessedby reduced dilution of the CFSE-labeled OVA-specific DO.11T cells in these animals (Fig. S4A). The number of OVA-specific DO.11 T cells was also lower in these mice, suggestinga reduction in expansion and/or recruitment of the respondingT-cell population (Fig. S4B). Impressively, when airway histol-ogy was examined, a dramatic reduction in overall inflam-mation and airway pathology was observed in animals exposedto D dust (Fig. S4C). Collectively, these studies demonstratethat exposure to D-associated house dust alters host responsesto two distinct antigen systems via modulation of both T-cellnumbers and activity.
Airway Protection Is Associated with GI Microbiome Restructuring.We next examined the cecal microbiota of control mice andthose gavaged with either D or NP dust in the OVA challengeexperiment, using a phylogenetic microarray. This platform wasused rather than next-generation sequencing to generate a high-resolution microbiome profile for comparative analyses acrosstreatment groups and identify specific taxa that exhibit signifi-cantly increased or decreased relative abundance, irrespective oftheir rank (dominance) in the community. Relative measures ofcommunity richness, Pielou’s evenness, and Faith’s phylogenetic
Fig. 1. Exposure of animals to dust from homes with dogs attenuates thedevelopment of allergen-induced airways disease and serum IgE. (A) Whole-lung mRNA analysis by Q-PCR demonstrates a significant decrease in IL-4 andIL-13 in D dust-supplemented, but not in NP-supplemented animals comparedwith controls. (B) Accompanying the Th2 cytokine reduction was significantlyreduced expression of the mucus-associated gene, gob5. (C) Reduced airwaymucus secretion and goblet cell metaplasia is observed in the D dust-supple-mented animals, as depicted by PAS staining in lung histology. (D) A reductionin draining lymph node numbers in D dust-supplemented animals was alsoobserved. (E) Serum IgE levels reflected the reduction in the development ofthe Th2 environment in the D dust-supplemented animals. Data represent themean ± SE from five mice per group; *P < 0.05.
2 of 6 | www.pnas.org/cgi/doi/10.1073/pnas.1310750111 Fujimura et al.
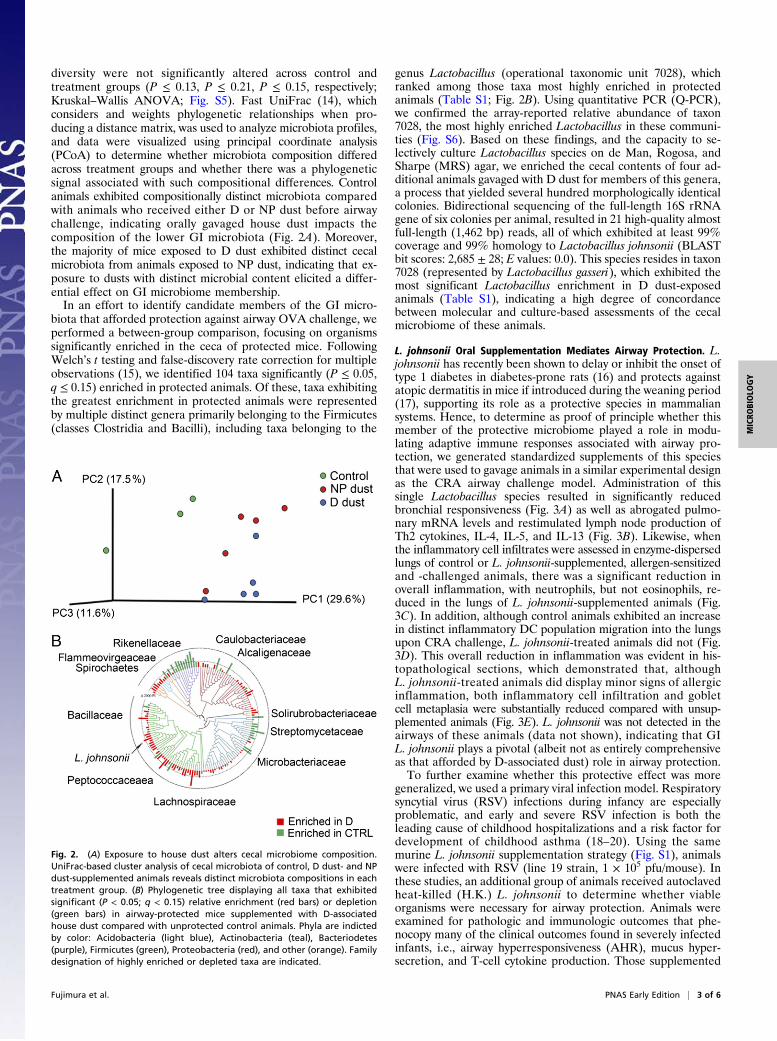
diversity were not significantly altered across control andtreatment groups (P ≤ 0.13, P ≤ 0.21, P ≤ 0.15, respectively;Kruskal–Wallis ANOVA; Fig. S5). Fast UniFrac (14), whichconsiders and weights phylogenetic relationships when pro-ducing a distance matrix, was used to analyze microbiota profiles,and data were visualized using principal coordinate analysis(PCoA) to determine whether microbiota composition differedacross treatment groups and whether there was a phylogeneticsignal associated with such compositional differences. Controlanimals exhibited compositionally distinct microbiota comparedwith animals who received either D or NP dust before airwaychallenge, indicating orally gavaged house dust impacts thecomposition of the lower GI microbiota (Fig. 2A). Moreover,the majority of mice exposed to D dust exhibited distinct cecalmicrobiota from animals exposed to NP dust, indicating that ex-posure to dusts with distinct microbial content elicited a differ-ential effect on GI microbiome membership.In an effort to identify candidate members of the GI micro-
biota that afforded protection against airway OVA challenge, weperformed a between-group comparison, focusing on organismssignificantly enriched in the ceca of protected mice. FollowingWelch’s t testing and false-discovery rate correction for multipleobservations (15), we identified 104 taxa significantly (P ≤ 0.05,q ≤ 0.15) enriched in protected animals. Of these, taxa exhibitingthe greatest enrichment in protected animals were representedby multiple distinct genera primarily belonging to the Firmicutes(classes Clostridia and Bacilli), including taxa belonging to the
genus Lactobacillus (operational taxonomic unit 7028), whichranked among those taxa most highly enriched in protectedanimals (Table S1; Fig. 2B). Using quantitative PCR (Q-PCR),we confirmed the array-reported relative abundance of taxon7028, the most highly enriched Lactobacillus in these communi-ties (Fig. S6). Based on these findings, and the capacity to se-lectively culture Lactobacillus species on de Man, Rogosa, andSharpe (MRS) agar, we enriched the cecal contents of four ad-ditional animals gavaged with D dust for members of this genera,a process that yielded several hundred morphologically identicalcolonies. Bidirectional sequencing of the full-length 16S rRNAgene of six colonies per animal, resulted in 21 high-quality almostfull-length (1,462 bp) reads, all of which exhibited at least 99%coverage and 99% homology to Lactobacillus johnsonii (BLASTbit scores: 2,685 ± 28; E values: 0.0). This species resides in taxon7028 (represented by Lactobacillus gasseri), which exhibited themost significant Lactobacillus enrichment in D dust-exposedanimals (Table S1), indicating a high degree of concordancebetween molecular and culture-based assessments of the cecalmicrobiome of these animals.
L. johnsonii Oral Supplementation Mediates Airway Protection. L.johnsonii has recently been shown to delay or inhibit the onset oftype 1 diabetes in diabetes-prone rats (16) and protects againstatopic dermatitis in mice if introduced during the weaning period(17), supporting its role as a protective species in mammaliansystems. Hence, to determine as proof of principle whether thismember of the protective microbiome played a role in modu-lating adaptive immune responses associated with airway pro-tection, we generated standardized supplements of this speciesthat were used to gavage animals in a similar experimental designas the CRA airway challenge model. Administration of thissingle Lactobacillus species resulted in significantly reducedbronchial responsiveness (Fig. 3A) as well as abrogated pulmo-nary mRNA levels and restimulated lymph node production ofTh2 cytokines, IL-4, IL-5, and IL-13 (Fig. 3B). Likewise, whenthe inflammatory cell infiltrates were assessed in enzyme-dispersedlungs of control or L. johnsonii-supplemented, allergen-sensitizedand -challenged animals, there was a significant reduction inoverall inflammation, with neutrophils, but not eosinophils, re-duced in the lungs of L. johnsonii-supplemented animals (Fig.3C). In addition, although control animals exhibited an increasein distinct inflammatory DC population migration into the lungsupon CRA challenge, L. johnsonii-treated animals did not (Fig.3D). This overall reduction in inflammation was evident in his-topathological sections, which demonstrated that, althoughL. johnsonii-treated animals did display minor signs of allergicinflammation, both inflammatory cell infiltration and gobletcell metaplasia were substantially reduced compared with unsup-plemented animals (Fig. 3E). L. johnsonii was not detected in theairways of these animals (data not shown), indicating that GIL. johnsonii plays a pivotal (albeit not as entirely comprehensiveas that afforded by D-associated dust) role in airway protection.To further examine whether this protective effect was more
generalized, we used a primary viral infection model. Respiratorysyncytial virus (RSV) infections during infancy are especiallyproblematic, and early and severe RSV infection is both theleading cause of childhood hospitalizations and a risk factor fordevelopment of childhood asthma (18–20). Using the samemurine L. johnsonii supplementation strategy (Fig. S1), animalswere infected with RSV (line 19 strain, 1 × 10⁵ pfu/mouse). Inthese studies, an additional group of animals received autoclavedheat-killed (H.K.) L. johnsonii to determine whether viableorganisms were necessary for airway protection. Animals wereexamined for pathologic and immunologic outcomes that phe-nocopy many of the clinical outcomes found in severely infectedinfants, i.e., airway hyperresponsiveness (AHR), mucus hyper-secretion, and T-cell cytokine production. Those supplemented
Fig. 2. (A) Exposure to house dust alters cecal microbiome composition.UniFrac-based cluster analysis of cecal microbiota of control, D dust- and NPdust-supplemented animals reveals distinct microbiota compositions in eachtreatment group. (B) Phylogenetic tree displaying all taxa that exhibitedsignificant (P < 0.05; q < 0.15) relative enrichment (red bars) or depletion(green bars) in airway-protected mice supplemented with D-associatedhouse dust compared with unprotected control animals. Phyla are indictedby color: Acidobacteria (light blue), Actinobacteria (teal), Bacteriodetes(purple), Firmicutes (green), Proteobacteria (red), and other (orange). Familydesignation of highly enriched or depleted taxa are indicated.
Fujimura et al. PNAS Early Edition | 3 of 6
MICRO
BIOLO
GY
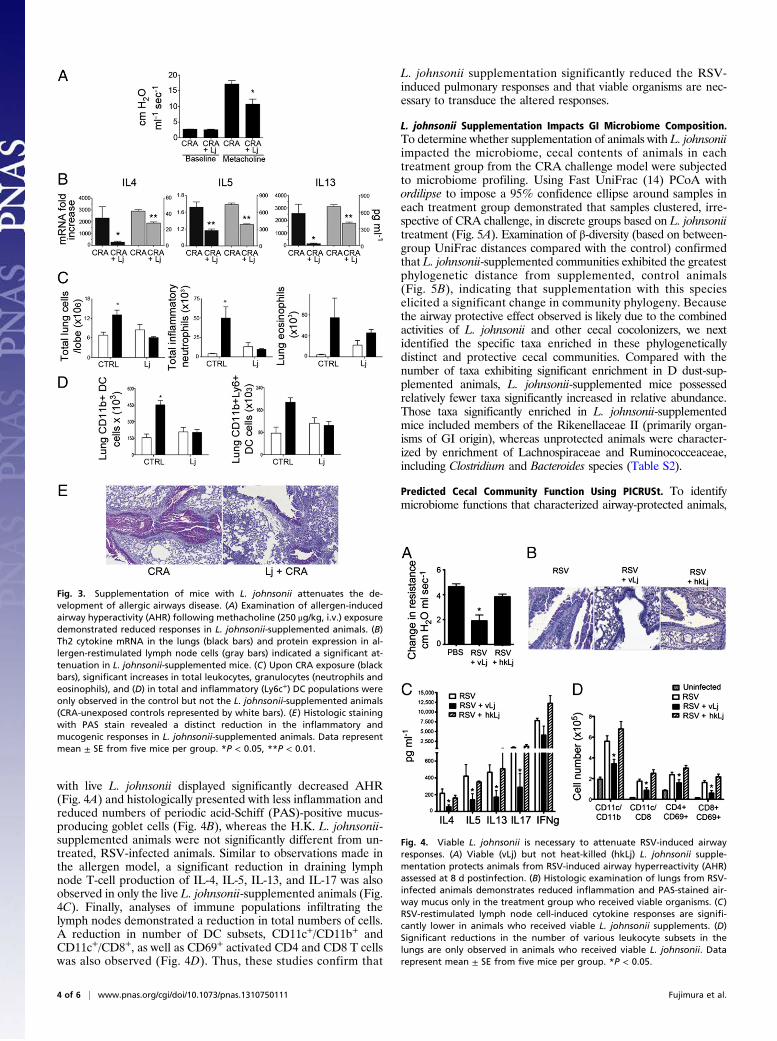
with live L. johnsonii displayed significantly decreased AHR(Fig. 4A) and histologically presented with less inflammation andreduced numbers of periodic acid-Schiff (PAS)-positive mucus-producing goblet cells (Fig. 4B), whereas the H.K. L. johnsonii-supplemented animals were not significantly different from un-treated, RSV-infected animals. Similar to observations made inthe allergen model, a significant reduction in draining lymphnode T-cell production of IL-4, IL-5, IL-13, and IL-17 was alsoobserved in only the live L. johnsonii-supplemented animals (Fig.4C). Finally, analyses of immune populations infiltrating thelymph nodes demonstrated a reduction in total numbers of cells.A reduction in number of DC subsets, CD11c+/CD11b+ andCD11c+/CD8+, as well as CD69+ activated CD4 and CD8 T cellswas also observed (Fig. 4D). Thus, these studies confirm that
L. johnsonii supplementation significantly reduced the RSV-induced pulmonary responses and that viable organisms are nec-essary to transduce the altered responses.
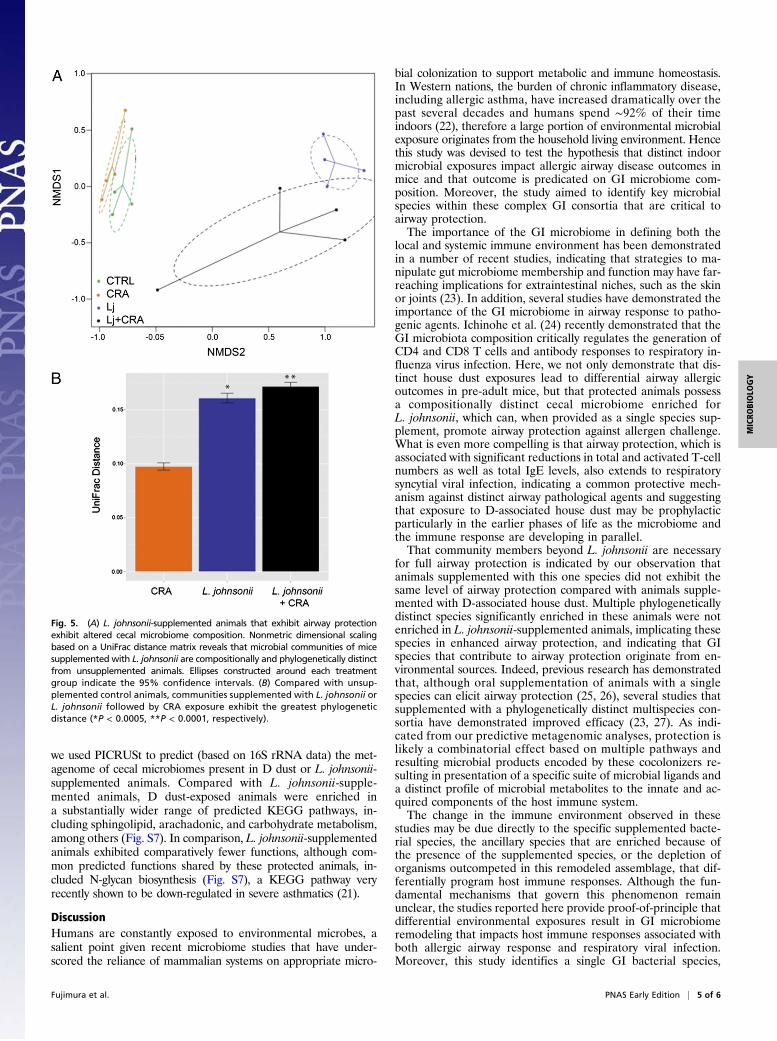
L. johnsonii Supplementation Impacts GI Microbiome Composition.To determine whether supplementation of animals with L. johnsoniiimpacted the microbiome, cecal contents of animals in eachtreatment group from the CRA challenge model were subjectedto microbiome profiling. Using Fast UniFrac (14) PCoA withordilipse to impose a 95% confidence ellipse around samples ineach treatment group demonstrated that samples clustered, irre-spective of CRA challenge, in discrete groups based on L. johnsoniitreatment (Fig. 5A). Examination of β-diversity (based on between-group UniFrac distances compared with the control) confirmedthat L. johnsonii-supplemented communities exhibited the greatestphylogenetic distance from supplemented, control animals(Fig. 5B), indicating that supplementation with this specieselicited a significant change in community phylogeny. Becausethe airway protective effect observed is likely due to the combinedactivities of L. johnsonii and other cecal cocolonizers, we nextidentified the specific taxa enriched in these phylogeneticallydistinct and protective cecal communities. Compared with thenumber of taxa exhibiting significant enrichment in D dust-sup-plemented animals, L. johnsonii-supplemented mice possessedrelatively fewer taxa significantly increased in relative abundance.Those taxa significantly enriched in L. johnsonii-supplementedmice included members of the Rikenellaceae II (primarily organ-isms of GI origin), whereas unprotected animals were character-ized by enrichment of Lachnospiraceae and Ruminococceaceae,including Clostridium and Bacteroides species (Table S2).
Predicted Cecal Community Function Using PICRUSt. To identifymicrobiome functions that characterized airway-protected animals,
Fig. 3. Supplementation of mice with L. johnsonii attenuates the de-velopment of allergic airways disease. (A) Examination of allergen-inducedairway hyperactivity (AHR) following methacholine (250 μg/kg, i.v.) exposuredemonstrated reduced responses in L. johnsonii-supplemented animals. (B)Th2 cytokine mRNA in the lungs (black bars) and protein expression in al-lergen-restimulated lymph node cells (gray bars) indicated a significant at-tenuation in L. johnsonii-supplemented mice. (C) Upon CRA exposure (blackbars), significant increases in total leukocytes, granulocytes (neutrophils andeosinophils), and (D) in total and inflammatory (Ly6c+) DC populations wereonly observed in the control but not the L. johnsonii-supplemented animals(CRA-unexposed controls represented by white bars). (E) Histologic stainingwith PAS stain revealed a distinct reduction in the inflammatory andmucogenic responses in L. johnsonii-supplemented animals. Data representmean ± SE from five mice per group. *P < 0.05, **P < 0.01.
Fig. 4. Viable L. johnsonii is necessary to attenuate RSV-induced airwayresponses. (A) Viable (vLj) but not heat-killed (hkLj) L. johnsonii supple-mentation protects animals from RSV-induced airway hyperreactivity (AHR)assessed at 8 d postinfection. (B) Histologic examination of lungs from RSV-infected animals demonstrates reduced inflammation and PAS-stained air-way mucus only in the treatment group who received viable organisms. (C)RSV-restimulated lymph node cell-induced cytokine responses are signifi-cantly lower in animals who received viable L. johnsonii supplements. (D)Significant reductions in the number of various leukocyte subsets in thelungs are only observed in animals who received viable L. johnsonii. Datarepresent mean ± SE from five mice per group. *P < 0.05.
4 of 6 | www.pnas.org/cgi/doi/10.1073/pnas.1310750111 Fujimura et al.
we used PICRUSt to predict (based on 16S rRNA data) the met-agenome of cecal microbiomes present in D dust or L. johnsonii-supplemented animals. Compared with L. johnsonii-supple-mented animals, D dust-exposed animals were enriched ina substantially wider range of predicted KEGG pathways, in-cluding sphingolipid, arachadonic, and carbohydrate metabolism,among others (Fig. S7). In comparison, L. johnsonii-supplementedanimals exhibited comparatively fewer functions, although com-mon predicted functions shared by these protected animals, in-cluded N-glycan biosynthesis (Fig. S7), a KEGG pathway veryrecently shown to be down-regulated in severe asthmatics (21).
DiscussionHumans are constantly exposed to environmental microbes, asalient point given recent microbiome studies that have under-scored the reliance of mammalian systems on appropriate micro-
bial colonization to support metabolic and immune homeostasis.In Western nations, the burden of chronic inflammatory disease,including allergic asthma, have increased dramatically over thepast several decades and humans spend ∼92% of their timeindoors (22), therefore a large portion of environmental microbialexposure originates from the household living environment. Hencethis study was devised to test the hypothesis that distinct indoormicrobial exposures impact allergic airway disease outcomes inmice and that outcome is predicated on GI microbiome com-position. Moreover, the study aimed to identify key microbialspecies within these complex GI consortia that are critical toairway protection.The importance of the GI microbiome in defining both the
local and systemic immune environment has been demonstratedin a number of recent studies, indicating that strategies to ma-nipulate gut microbiome membership and function may have far-reaching implications for extraintestinal niches, such as the skinor joints (23). In addition, several studies have demonstrated theimportance of the GI microbiome in airway response to patho-genic agents. Ichinohe et al. (24) recently demonstrated that theGI microbiota composition critically regulates the generation ofCD4 and CD8 T cells and antibody responses to respiratory in-fluenza virus infection. Here, we not only demonstrate that dis-tinct house dust exposures lead to differential airway allergicoutcomes in pre-adult mice, but that protected animals possessa compositionally distinct cecal microbiome enriched forL. johnsonii, which can, when provided as a single species sup-plement, promote airway protection against allergen challenge.What is even more compelling is that airway protection, which isassociated with significant reductions in total and activated T-cellnumbers as well as total IgE levels, also extends to respiratorysyncytial viral infection, indicating a common protective mech-anism against distinct airway pathological agents and suggestingthat exposure to D-associated house dust may be prophylacticparticularly in the earlier phases of life as the microbiome andthe immune response are developing in parallel.That community members beyond L. johnsonii are necessary
for full airway protection is indicated by our observation thatanimals supplemented with this one species did not exhibit thesame level of airway protection compared with animals supple-mented with D-associated house dust. Multiple phylogeneticallydistinct species significantly enriched in these animals were notenriched in L. johnsonii-supplemented animals, implicating thesespecies in enhanced airway protection, and indicating that GIspecies that contribute to airway protection originate from en-vironmental sources. Indeed, previous research has demonstratedthat, although oral supplementation of animals with a singlespecies can elicit airway protection (25, 26), several studies thatsupplemented with a phylogenetically distinct multispecies con-sortia have demonstrated improved efficacy (23, 27). As indi-cated from our predictive metagenomic analyses, protection islikely a combinatorial effect based on multiple pathways andresulting microbial products encoded by these cocolonizers re-sulting in presentation of a specific suite of microbial ligands anda distinct profile of microbial metabolites to the innate and ac-quired components of the host immune system.The change in the immune environment observed in these
studies may be due directly to the specific supplemented bacte-rial species, the ancillary species that are enriched because ofthe presence of the supplemented species, or the depletion oforganisms outcompeted in this remodeled assemblage, that dif-ferentially program host immune responses. Although the fun-damental mechanisms that govern this phenomenon remainunclear, the studies reported here provide proof-of-principle thatdifferential environmental exposures result in GI microbiomeremodeling that impacts host immune responses associated withboth allergic airway response and respiratory viral infection.Moreover, this study identifies a single GI bacterial species,
Fig. 5. (A) L. johnsonii-supplemented animals that exhibit airway protectionexhibit altered cecal microbiome composition. Nonmetric dimensional scalingbased on a UniFrac distance matrix reveals that microbial communities of micesupplemented with L. johnsonii are compositionally and phylogenetically distinctfrom unsupplemented animals. Ellipses constructed around each treatmentgroup indicate the 95% confidence intervals. (B) Compared with unsup-plemented control animals, communities supplemented with L. johnsonii orL. johnsonii followed by CRA exposure exhibit the greatest phylogeneticdistance (*P < 0.0005, **P < 0.0001, respectively).
Fujimura et al. PNAS Early Edition | 5 of 6
MICRO
BIOLO
GY
L. johnsonii, that is pivotal to airway protection, and identifiesfunctional gene pathways in protective microbiota that may beresponsible for airway protection. These studies suggest that GImicrobiome manipulation represents a promising and efficacioustherapeutic strategy to protect individuals against both pulmo-nary infection and allergic airway disease.
Materials and MethodsHouse Dust Collection. Dust from homes with or without dogs was collectedusing a sterile fabric filter sock inserted into a sterile vacuum nozzle im-mediately before vacuuming a 3′ × 3′ area for 3 min. Further details areprovided in SI Materials and Methods.
Murine Models. BALB/c mice were used for airway allergen challenge and RSVstudies; a detailed procedure is provided in SI Materials and Methods. Allmouse studies were reviewed and approved by the University of Michigan’sUniversity Committee on Use and Care of Animals (UCUCA).
Lung Histology, mRNA Extraction, Reverse Transcription, and RT-PCR. The leftlung was perfused with 4% (vol/vol) formaldehyde for fixation and em-bedded in paraffin. Further details are provided in SI Materials and Methods.mRNA was isolated from ground lung tissue using TRIzol reagent (Invi-trogen) or the RNeasy Mini kit (Qiagen) according to manufacturer’sinstructions. Further details are provided in SI Materials and Methods.
Culture and Stimulation of Lymph Node Cells and Flow Cytometry. Mediastinallymph nodes were digested mechanically, using 18-gauge needles, and en-zymatically, via incubation with 1 mg/mL Collagenase A (Roche) and DNase I(Sigma-Aldrich) in RPMI 1640 with 10% FCS. Further details are provided in SIMaterials and Methods. Following FcR blocking, single-cell suspensions ofbronchoalveolar lavage, lung, and lymph node cells were stained with anti-CD11c (N418), anti-Ly6C (HK1.4), anti-Ly6G (1A8; Biolegend), anti-CD11b(M1/70), anti-CD103 (2E7) (eBioscience), and anti-MHC-II/IAb (AF6-120.1; BDBiosciences). Inflammatory neutrophils were gated as low autofluorescent,
CD11cloCD11bhiLy6C+Ly6G+ with low forward scatter. Inflammatory mono-cytes were analyzed as low autofluorescent, CD11cloCD11bhiLy6C+Ly6G−
cells with low forward scatter. Further details are provided in SI Materialsand Methods.
Cecal Microbiome Profiling. Dust samples were extracted using a cetyl-trimethylammonium bromide (CTAB)-PEG protocol as previously described(28). Briefly, 0.5 mL of modified CTAB extraction buffer [1:1 10% CTAB in1 M NaCl to 0.5 M phosphate buffer (pH 7.5–8) in 1 M NaCl] were added to0.2 g of dust (when available) in Lysing Matrix E tubes (MP Biomedicals),followed by 500 μL of phenol:cholorform:isoamyl alcohol (25:24:1). Sampleswere bead-beaten using MPBio FastPrep-24 at 5.5 m/s for 30 s before cen-trifugation for 5 min at 16,000 × g at 4 °C. Further details of this procedureare provided in SI Materials and Methods.
L. johnsonii Quantification, Isolation, Identification, and Supplement Generation.Q-PCR was used to validate L. johnsonii relative abundance reported by thearray using the QuantiTect SYBR Green PCR kit per the manufacturer’sinstructions (Qiagen) and the L. johnsonii-specific primer pair Lj1 and La2(29). Further details are provided in SI Materials and Methods. Details ofL. johnsonii isolation and identification as well as how the strain was preparedfor oral supplementation studies are provided in SI Materials and Methods.
Statistical Analyses. As an exploratory tool to examine community compo-sition dissimilarity, NMDS or PCoA was performed, based on Canberra (30) orUniFrac (14) distance matrices, respectively. PhyloChip fluorescence inten-sities, normalized to quantitative standards, were log2 × 1,000 transformedbefore analyses. Further details of ecological and traditional statistical ap-proaches used to analyze the datasets reported in this study are provided inSI Materials and Methods.
ACKNOWLEDGMENTS. This study was supported by the National Institutes ofHealth, National Institute of Allergy and Infectious Diseases P01AI089473-01A1.
1. Abreu NA, et al. (2012) Sinus microbiome diversity depletion and Corynebacteriumtuberculostearicum enrichment mediates rhinosinusitis. Science Transl Med 4(151):151ra124.
2. Nistal E, et al. (2012) Differences in faecal bacteria populations and faecal bacteriametabolism in healthy adults and celiac disease patients. Biochimie 94(8):1724–1729.
3. Tremaroli V, Bäckhed F (2012) Functional interactions between the gut microbiotaand host metabolism. Nature 489(7415):242–249.
4. Atarashi K, et al. (2011) Induction of colonic regulatory T cells by indigenous Clos-tridium species. Science 331(6015):337–341.
5. Hansen CH, et al. (2012) Patterns of early gut colonization shape future immune re-sponses of the host. PLoS One 7(3):e34043.
6. Ivanov II, et al. (2009) Induction of intestinal Th17 cells by segmented filamentousbacteria. Cell 139(3):485–498.
7. Penders J, et al. (2007) Gut microbiota composition and development of atopicmanifestations in infancy: The KOALA Birth Cohort Study. Gut 56(5):661–667.
8. Joffe TH, Simpson NA (2009) Cesarean section and risk of asthma. The role of intra-partum antibiotics: A missing piece? J Pediatr 154(1):154.
9. Johnson CC, et al. (2005) Antibiotic exposure in early infancy and risk for childhoodatopy. J Allergy Clin Immunol 115(6):1218–1224.
10. Ownby DR, Johnson CC, Peterson EL (2002) Exposure to dogs and cats in the first yearof life and risk of allergic sensitization at 6 to 7 years of age. JAMA 288(8):963–972.
11. von Mutius E, Vercelli D (2010) Farm living: Effects on childhood asthma and allergy.Nat Rev Immunol 10(12):861–868.
12. Fujimura KE, et al. (2010) Man’s best friend? The effect of pet ownership on housedust microbial communities. J Allergy Clin Immunol 126(2), 410–412, 412.e1–3.
13. Havstad S, et al. (2011) Effect of prenatal indoor pet exposure on the trajectory oftotal IgE levels in early childhood. J Allergy Clin Immunol 128(4):880–885.e4.
14. Hamady M, Lozupone C, Knight R (2010) Fast UniFrac: Facilitating high-throughputphylogenetic analyses of microbial communities including analysis of pyrosequencingand PhyloChip data. ISME J 4(1):17–27.
15. Storey JD, Tibshirani R (2003) Statistical significance for genomewide studies. ProcNatl Acad Sci USA 100(16):9440–9445.
16. Valladares R, et al. (2010) Lactobacillus johnsonii N6.2 mitigates the development oftype 1 diabetes in BB-DP rats. PLoS One 5(5):e10507.
17. Inoue R, Otsuka M, Nishio A, Ushida K (2007) Primary administration of Lactobacillusjohnsonii NCC533 in weaning period suppresses the elevation of proinflammatory
cytokines and CD86 gene expressions in skin lesions in NC/Nga mice. FEMS ImmunolMed Microbiol 50(1):67–76.
18. Régnier SA, Huels J (2013) Association between respiratory syncytial virus hospital-izations in infants and respiratory sequelae: Systematic review and meta-analysis.Pediatr Infect Dis J 32(8):820–826.
19. Szabo SM, et al. (2013) Elevated risk of asthma after hospitalization for respiratorysyncytial virus infection in infancy. Paediatr Respir Rev 13(Suppl 2):S9–S15.
20. Tregoning JS, Schwarze J (2010) Respiratory viral infections in infants: Causes, clinicalsymptoms, virology, and immunology. Clin Microbiol Rev 23(1):74–98.
21. Orsmark-Pietras C, et al. (2013) Transcriptome analysis reveals upregulation of bittertaste receptors in severe asthmatics. Eur Respir J 42(1):65–78.
22. Ott WR (1989) Human activity patterns: A review of the literature for estimating timespend indoors, outdoors and in transit. Proceedings of the Research Planning Con-ference on Human Activity Patterns, EPA/600/4-89/004 (EPA National Exposure Re-search Laboratory, Las Vegas), 3.
23. Kwon HK, et al. (2010) Generation of regulatory dendritic cells and CD4+Foxp3+ Tcells by probiotics administration suppresses immune disorders. Proc Natl Acad SciUSA 107(5):2159–2164.
24. Ichinohe T, et al. (2011) Microbiota regulates immune defense against respiratorytract influenza A virus infection. Proc Natl Acad Sci USA 108(13):5354–5359.
25. Forsythe P, Inman MD, Bienenstock J (2007) Oral treatment with live Lactobacillusreuteri inhibits the allergic airway response in mice. Am J Respir Crit Care Med 175(6):561–569.
26. Adams VC, et al. (2004) Mycobacterium vaccae induces a population of pulmonaryCD11c+ cells with regulatory potential in allergic mice. Eur J Immunol 34(3):631–638.
27. de Vrese M, et al. (2005) Effect of Lactobacillus gasseri PA 16/8, Bifidobacteriumlongum SP 07/3, B. bifidum MF 20/5 on common cold episodes: A double blind, ran-domized, controlled trial. Clin Nutr 24(4):481–491.
28. DeAngelis KM, et al. (2009) Selective progressive response of soil microbial commu-nity to wild oat roots. ISME J 3(2):168–178.
29. Furet JP, Quénée P, Tailliez P (2004) Molecular quantification of lactic acid bacteria infermented milk products using real-time quantitative PCR. Int J Food Microbiol 97(2):197–207.
30. Lance GN, Williams WT (1967) Mixed-data classificatory programs, I.) Agglomerativesystems. Aust Comput J 1(1):15–20.
6 of 6 | www.pnas.org/cgi/doi/10.1073/pnas.1310750111 Fujimura et al.
Supporting InformationFujimura et al. 10.1073/pnas.1310750111SI Materials and MethodsHouse Dust Collection. Dust from homes with or without dogs wascollected using a sterile fabric filter sock inserted into a sterilevacuum nozzle immediately before vacuuming a 3′ × 3′ area for3 min. The sock was removed from the vacuum, the collecteddust weighed and sieved through a 300-μm sieve to remove largedebris from the sample. Comparable sieved samples have pre-viously been used successfully to profile microbial communitiespresent in house dust (1, 2). Dust samples were subsequentlydivided into 25- or 6.25-mg fractions for dog (D)- or no-pet(NP)-associated houses, respectively, each stored in a sterile5-mL tube at −20 °C until used for murine supplementation.
Murine Models. Cockroach allergen model. BALB/c were purchasedfrom The Jackson Laboratory. On the day of use, a single tube ofdust was resuspended in sterile saline (1 mL) and immediatelyadministered by oral gavage to animals (100-μL supplementationper mouse); one group of control animals received sterile saline,the other, no supplement. This procedure ensured that animalsreceived standardized (by weight) quantities of dust throughoutthe duration of the study and that dust samples were not im-pacted by recurrent freeze–thaw cycles. Supplementation wasperformed daily for 7 d before initial cockroach allergen extract(CRA) sensitization, and twice per week for the following 2 wk.CRA (Hollister-Stier) sensitization was performed as previouslydescribed (3). Briefly, 6- to 8-wk-old female mice were sensitizedto CRA by three consecutive intratracheal instillations (5 μg in50 μL) on days 0, 1, and 2. On days 14, 20, and 22, mice werelocally challenged with CRA by intratracheal route, and micewere euthanized at day 23 (Fig. S1A).For experiments examining whether inoculum level impacted
airway immune responses, animals were supplemented witheither 25 mg of D or NP dust [high dust exposure (HD)] or to6.25 mg of D or NP dust [low dust exposure (LD)] daily as de-scribed above.OVA allergen model. In this model, we again exposed BALB/c miceto dust from D- or NP-containing homes (or Lactobacillusjohnsonii, see below) by oral gavage as described above. CD4splenic T cells from DO.11 ovalbumin TCR-specific mice werepurified by negative selection using CD4 T-Cell Isolation Kit(Miltenyi Biotec) according to the manufacturer’s instructions.On day 14, naïve carboxyfluorescein succinimidyl ester (CFSE)-labeled splenic CD4+ T cells isolated from DO.11 OVA peptide-specific T-cell receptor transgenic mice (1 × 10⁶ cells·mouse−1;obtained from The Jackson Laboratory) were transferred via tailvein injection. One day after T-cell transfer, animals were chal-lenged with whole ovalbumin protein (350 μg) into the airway.Three days later, mice were killed, and lungs and lymph nodeswere harvested (Fig. S1B).Respiratory syncytial virus infection. Our laboratory uses antigenicsubgroup A, line 19 respiratory syncytial virus (RSV), originallyobtained from a sick infant at the University of Michigan. In-fection with this RSV isolate for 8 d recapitulates several aspectsof human infection including inflammatory responses, T-cell–mediated pathology, and airway mucus production upon intra-tracheal infection with 1 × 10⁵ pfu/mouse (4).
Lung Histology. The left lung was perfused with 4% (vol/vol)formaldehyde for fixation and embedded in paraffin. Five-mi-crometer lung sections were stained with periodic acid-Schiff andH&E to detect mucus production and inflammatory infiltrates,
respectively. Photomicrographs were captured using a Zeiss AxioImager Z1 and AxioVision 4.8 software (Zeiss).
mRNA Extraction, Reverse Transcription, and RT-PCR. mRNA wasisolated from ground lung tissue using TRIzol reagent (Invi-trogen) or the RNeasy Mini kit (Qiagen) according to manu-facturer’s instructions. A total of 5 μg of RNA per sample wasreverse transcribed using murine leukemia virus RTase (AppliedBiosystems). Expression of relevant genes was analyzed withTaqMan gene expression assays (Applied Biosystems) using anABI Prism 7500 Sequence Detection System (Applied Bio-systems). Gene expression was normalized to GAPDH and ex-pressed as fold change over expression in control mice.
Culture and Stimulation of Lymph Node Cells. Mediastinal lymphnodes were digested mechanically, using 18-gauge needles, andenzymatically, via incubation with 1mg/mLCollagenaseA (Roche)and DNase I (Sigma-Aldrich) in RPMI 1640 with 10% FCS.Following red blood cell lysis, cells were passed through a 40-μmstrainer and counted with a Z2 Beckman Coulter particlecounter. Suspensions of total lymph node cells were cultured incomplete medium and restimulated with CRA for 48 h or withOVA (100 μg·ml−1) for 96 h. Levels of T-helper cytokines, IL-4,IL-5, IL-13, IFNγ, and IL-17 were determined in culture su-pernatants using a Bio-Plex assay (Bio-Rad). The remainder ofthe lymph node cells was analyzed using flow cytometry.
Flow Cytometry. Following FcR blocking, single-cell suspensionsof BAL, lung, and lymph node cells were stained with anti-CD11c(N418), anti-Ly6C (HK1.4), anti-Ly6G (1A8; Biolegend), anti-CD11b (M1/70), anti-CD103 (2E7) (eBioscience), and anti-MHC-II/IAb (AF6-120.1; BD Biosciences). Inflammatory neu-trophils were gated as low autofluorescent, CD11cloCD11bhi
Ly6C+Ly6G+ with low forward scatter. Inflammatory monocyteswere analyzed as low autofluorescent, CD11cloCD11bhiLy6C+
Ly6G− cells with low forward scatter. CD11b+ dendritic cells weredefined as low autofluorescent, CD11chiMHCII+CD11bhiCD103−
cells; within this population, Ly6C+ cells were considered to beinflammatory CD11b+ DCs. CD103+ dendritic cells were definedas low autofluorescent, CD11chiMHCII+CD11bloCD103+ cells.Upon staining for surface markers with anti-CD3 (17A2), anti-CD4 (RM4-5), anti-CD8 Abs (16-10A1; Biolegend), and anti-CD69 Ab (H1.2F3; eBioscience), T cells were defined as CD3-positive cells with low forward and side scatter, and subdividedinto CD4 or CD8 single-positive subpopulations, using CD69expression as a marker of early activation.
Cecal Microbiome Profiling. Dust samples were extracted using acetyltrimethylammonium bromide (CTAB)–polyethylene glycol(PEG) protocol as previously described (5). Briefly, 0.5 mL ofmodified CTAB extraction buffer [1:1 10% CTAB in 1 M NaClto 0.5 M phosphate buffer (pH 7.5–8) in 1 M NaCl] were addedto 0.2 g of dust (when available) in Lysing Matrix E tubes (MPBiomedicals), followed by 500 μL of phenol:cholorform:isoamylalcohol (25:24:1). Samples were bead-beaten using MPBioFastPrep-24 at 5.5 m/s for 30 s before centrifugation for 5 min at16,000 × g at 4 °C. The supernatant was then transferred to heavyphase-lock gel 1.5-mL tubes (5Prime). One volume of chloro-form was added to each sample and centrifuged for 5 min at12,000 × g at 4 °C. An additional 0.5 mL of CTAB-modifiedextraction buffer was added to each lysing matrix tube to in-crease recovery of nucleic acid from each sample. One microliterof linear acrylamide was added to the extracted supernatant
Fujimura et al. www.pnas.org/cgi/content/short/1310750111 1 of 11
followed by 2 vol of PEG. Following a 2-h incubation at roomtemperature, samples were washed with ice-cold 70% ethanoland resuspended in 30 μL of molecular-grade H2O. Extractedmaterial was pooled for each sample before application to theDNA column of the Qiagen AllPrep DNA/RNA extractionkit, and DNA was extracted according to the manufacturer’sinstructions.Cecal samples were harvested immediately after the animals
were sacked, placed in RNAlater (Life Technologies), and storedfor 24 h at 4 °C, before storage at −80 °C until processed formicrobiome profiling. Frozen cecal samples were thawed on iceand transferred into individual Lysing Matrix E tubes (MP Bi-omedicals) containing 600 μL of RLT+ buffer (Qiagen). Sampleswere bead-beaten for 30 s at 5.5 m/s using MPBio FastPrep-24 (MPBiomedicals), centrifuged for 1 min at 2,000 rpm (Eppendorf5424R microcentrifuge), and transferred to the AllPrep Kit (Qia-gen) for DNA extraction following the manufacturer’s protocol.PCR reactions for PhyloChip analysis were performed in 25-μL
reactions using 0.02 U of Takara ExTaq (Takara Mirus Bio), 1×Takara buffer with MgCl2, 0.3 pmol·μL−1 of 27F and 1492Rprimer (Lane 1991), 0.8 mM dNTPs, 0.8 mg·mL−1 BSA (RocheApplied Science), and 30 ng of DNA template. A total of 12reactions per sample were performed in an Eppendorf Master-cycler gradient thermocycler across a gradient (48–58.4 °C) ofannealing temperatures to maximize diversity recovered. Re-action conditions were as follows: initial denaturation (95 °C for3 min) followed by 25 cycles of 95 °C (30 s), annealing (30 s), andextension at 72 °C (2 min), and a final extension of 72 °C (10 min).PCR amplification was verified using a 1% TBE agarose gel.
PhyloChip Profiling. Amplified 16S rRNA product was purifiedusing the QIAquick Gel Extraction Kit (Qiagen) before beingpooled, fragmented, and biotinylated. A total of 250 ng of labeledamplicon per sample containing quantitative standards (consist-ing of 14 non-16S rRNA genes that permit data normalization)was applied to each G2 PhyloChip (Affymetrix). Arrays wereprocessed as previously described (2).
L. johnsonii Isolation and Identification. Ceca from four mice gav-aged with D-associated house dust were extracted asepticallyfrom animals. Cecal contents were removed under aseptic con-ditions, transferred into 500 μL of sterile PBS, and vortexedvigorously for 1 min to resuspend. Suspensions were serially di-luted 10-fold in sterile PBS, and 10−2 to 10−5 dilutions wereplated on Lactobacillus selective de Man, Rogosa and Sharpe(MRS) agar (BD Biosciences). For each of the four cecal sam-ples, six colonies were selected for further analysis from thelowest serial dilution that yielded individual colonies. Identitywas determined by full-length bidirectional Sanger sequencing(University of California, San Francisco, Genomics Core Facil-ity) of the 16S rRNA gene. Overlapping contigs for each clonewere assembled in Codon Code Aligner (CodonCode Corpora-tion), and the resulting 21 high-quality consensus sequences wereinterrogated using both BLAST (National Center for Biotech-nology Information; http://blast.ncbi.nlm.nih.gov/Blast.cgi) andthe 16S rRNA Greengenes database (6).
Generation of L. johnsonii Supplements for Murine Studies. To gen-erate supplements with 5 × 10⁷ CFU per 100 μL, 100 mL of MRSbroth was inoculated with L. johnsonii from a glycerol stockbefore static overnight culture at 37 °C. Stationary-phase cells(OD600 = 0.89) were centrifuged at 4,000 rpm (Eppendorf5424R microcentrifuge) for 15 min at 4 °C and resuspended in 60mL of a 50:50 (vol/vol) solution of MRS broth/50% glycerol.Cells were aliquoted into batches of 500 μL, snap frozen in liquidnitrogen, and stored at −80 °C until they were used in murinestudies. Viable cell count of the glycerol stock was determined tobe 2.7 × 10⁸ CFU per vial. For murine supplementation studies,
tubes were defrosted on ice, centrifuged at 14,000 rpm (Ep-pendorf 5424R microcentrifuge) for 30 s at 4 °C, and washedtwice in sterile saline to remove excess glycerol. The cells werethen resuspended in 700 μL of sterile saline. Each mouse re-ceived 100 μL (equivalent to 3.9 × 10⁷ CFU) of resuspended L.johnsonii. The remaining suspension was plated on MRS mediato confirm that viable L. johnsonii cell counts remained high andstable throughout the duration of the study.
Validation of L. johnsonii Presence by Q-PCR. Quantitative PCR(Q-PCR) was used to validate L. johnsonii relative abundancereported by the by the array using the QuantiTect SYBR GreenPCR kit per the manufacturer’s instructions (Qiagen) and theL. johnsonii-specific primer pair Lj1 and La2 (7). A total of 10 ngof DNA extracted from cecal samples per reaction was used intriplicate, 25-μL Q-PCR reactions at an annealing temperatureof 60 °C. Inverse cycle threshold values were plotted againstarray fluorescence intensity. Correlation using cor.test in R(www.R-project.org) was calculated to assess concordance be-tween the two independent molecular methods.
Statistical Analyses.As an exploratory tool to examine communitycomposition dissimilarity, nonmetric multidimensional scaling(NMDS) or principal coordinate analysis (PCoA) was performed,based on Canberra (8) or UniFrac (9) distance matrices, re-spectively. PhyloChip fluorescence intensities, normalized toquantitative standards were log2 × 1,000 transformed beforeanalyses. Canberra distance matrix was generated in R (www.R-project.org). The stepacross dissimilarity between shared spe-cies (noshare) was set at 0.1, and the maximum number of randomstarts was set at 30 in the vegan package. NMDS was conductedusing the default settings for metaMDS. PCoA was performedusing a UniFrac distance matrix and cmdscale in stats and con-structed using the ade4 package (10). The percentage of vari-ability explained by the two axes was calculated by dividing theeigenvalue for each axis by the sum of all positive eigenvalues.Community richness was determined in a two-stage process
where probe sets were scored (r) by the potential of the probe pairto respond to the target and not to the background; for each rscore, a minimum of 18 probe pairs were considered (11). For anoperational taxonomic unit (OTU) to be considered present, ther score was required to pass the following three thresholds: rQ1 ≥0.379, rQ2 ≥ 0.565, and rQ3 ≥ 0.82. OTUs that passed this firststage of data filtration were then considered for stage 2, wherersubx ≥ 0.5 (11). Pielou’s evenness was calculated using the veganpackage, and Faith’s phylogenetic diversity was determined usingthe picante package. Kruskal–Wallis, nonparametric ANOVA, instats was used to test whether significant differences existed be-tween treatment groups. Student’s, Wilcoxon, or Welch’s t testwas used to determine significant differences between pairs oftreatment groups as appropriate. Q-value false-discovery rateswere calculated as previously described (12) when multiplecomparisons were made. Values of P and q > 0.05 and 0.15,respectively, were considered significant. Phylogenetic trees wereconstructed in iTOL (13, 14).
In Silico Metagenome Prediction. PICRUSt (Phylogenetics Inves-tigation of Communities by Reconstruction of Unobserved States),a bioinformatics software used to predict functional metagenomesfrom amarker gene survey (such as 16S rRNAgene) (http://picrust.github.com/picrust/), was used to generate in silico metagenomesfor data generated in this study. First, 16S rRNA sequences wereobtained for OTUs significantly enriched in the cecal microbiotaof D-associated house dust- and L. johnsonii-supplementedanimals (compared with respective control animals) by Phy-loChip from the GreenGenes database (http://greengenes.secondgenome.com/downloads/database/13_5) using a customscript written in Python. Retrieved 16S rRNA sequences were
Fujimura et al. www.pnas.org/cgi/content/short/1310750111 2 of 11
imported into QIIME to generate an OTU table, through aclosed-referenced OTU-picking protocol. This OTU table wasthen subjected to PICRUSt analysis and grouped into corre-sponding KEGG pathways using the KEGG database (www.genome.jp/kegg/pathway.html). Comparisons between D dust-or L. johnsonii-supplemented animals and their relative con-
trols were visualized using a heat map constructed using acustom script written in R, to indicate, based on presence–absence data, the KEGG pathways enriched in each respectivegroup. The custom pipeline developed to analyze and visualizethis data are open source and available at GitHub (https://github.com/alifar76/PHoP).
1. Fujimura KE, et al. (2012) Development of a standardized approach for environmentalmicrobiota investigations related to asthma development in children. J MicrobiolMethods 91(2):231–239.
2. Fujimura KE, et al. (2010) Man’s best friend? The effect of pet ownership on housedust microbial communities. J Allergy Clin Immunol 126(2), 410–412, 412.e1–3.
3. Berlin AA, Hogaboam CM, Lukacs NW (2006) Inhibition of SCF attenuates peribronchialremodeling in chronic cockroach allergen-induced asthma. Lab Invest 86(6):557–565.
4. Demoor T, et al. (2012) IPS-1 signaling has a nonredundant role in mediating antiviralresponses and the clearance of respiratory syncytial virus. J Immunol 189(12):5942–5953.
5. DeAngelis KM, et al. (2009) Selective progressive response of soil microbialcommunity to wild oat roots. ISME J 3(2):168–178.
6. DeSantis TZ, et al. (2006) Greengenes, a chimera-checked 16S rRNA gene databaseand workbench compatible with ARB. Appl Environ Microbiol 72(7):5069–5072.
7. Furet JP, Quénée P, Tailliez P (2004) Molecular quantification of lactic acid bacteria infermented milk products using real-time quantitative PCR. Int J Food Microbiol 97(2):197–207.
8. Lance GN, Williams WT (1967) Mixed-data classificatory programs, I.) Agglomerativesystems. Aust Comput J 1(1):15–20.
9. Hamady M, Lozupone C, Knight R (2010) Fast UniFrac: Facilitating high-throughputphylogenetic analyses of microbial communities including analysis of pyrosequencingand PhyloChip data. ISME J 4(1):17–27.
10. Dray S, Dufour AB (2007) The ade4 package: Implementing the duality diagram forecologists. J Stat Softw 22(4):1–20.
11. Hazen TC, et al. (2010) Deep-sea oil plume enriches indigenous oil-degradingbacteria. Science 330(6001):204–208.
12. Storey JD, Tibshirani R (2003) Statistical significance for genomewide studies. ProcNatl Acad Sci USA 100(16):9440–9445.
13. Letunic I, Bork P (2007) Interactive Tree Of Life (iTOL): An online tool for phylogenetictree display and annotation. Bioinformatics 23(1):127–128.
14. Letunic I, Bork P (2011) Interactive Tree Of Life v2: Online annotation and display ofphylogenetic trees made easy. Nucleic Acids Res 39(Web Server issue):W475–W478.
Fujimura et al. www.pnas.org/cgi/content/short/1310750111 3 of 11
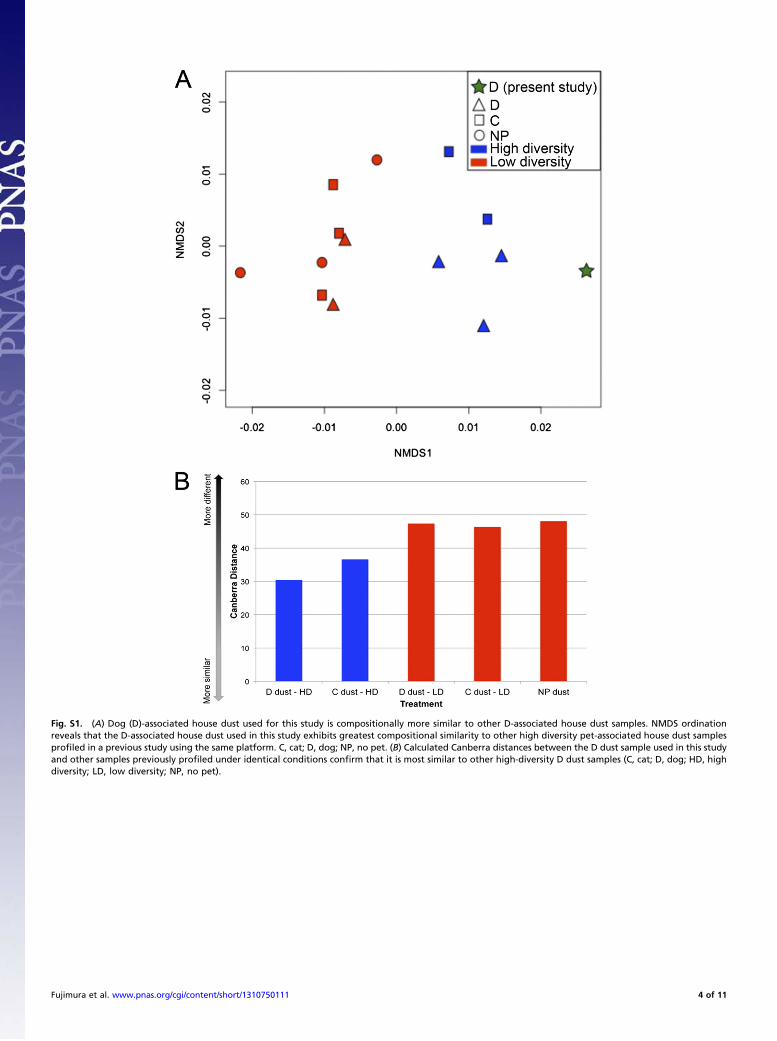
Fig. S1. (A) Dog (D)-associated house dust used for this study is compositionally more similar to other D-associated house dust samples. NMDS ordinationreveals that the D-associated house dust used in this study exhibits greatest compositional similarity to other high diversity pet-associated house dust samplesprofiled in a previous study using the same platform. C, cat; D, dog; NP, no pet. (B) Calculated Canberra distances between the D dust sample used in this studyand other samples previously profiled under identical conditions confirm that it is most similar to other high-diversity D dust samples (C, cat; D, dog; HD, highdiversity; LD, low diversity; NP, no pet).
Fujimura et al. www.pnas.org/cgi/content/short/1310750111 4 of 11
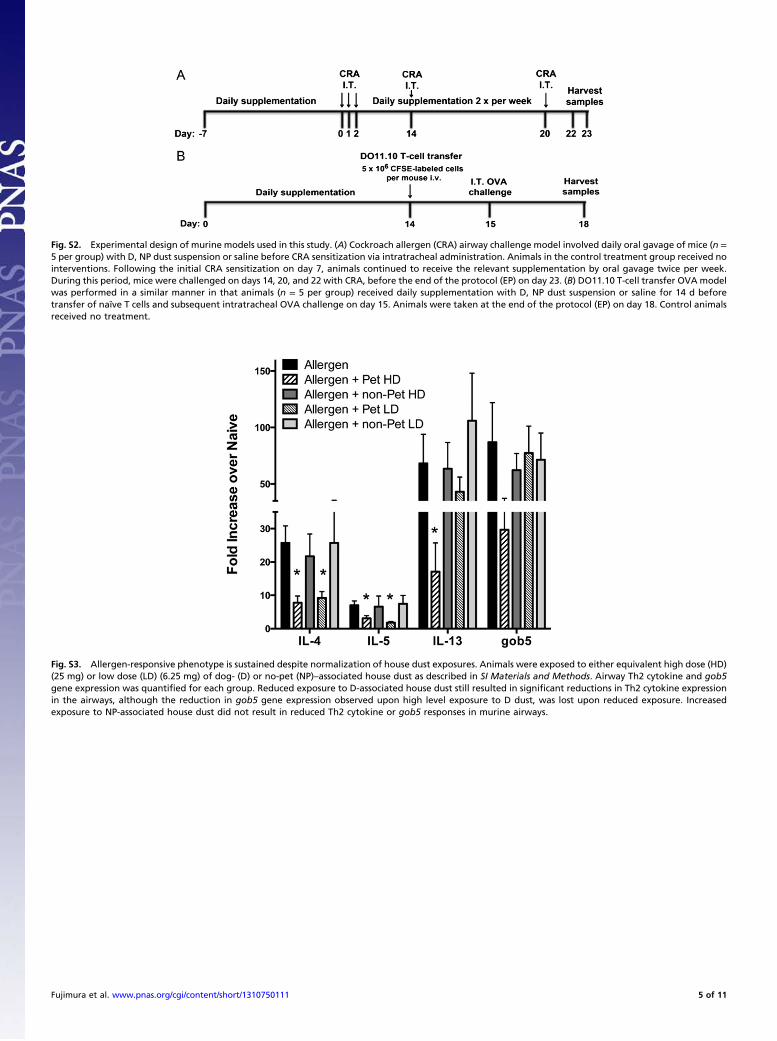
Fig. S2. Experimental design of murine models used in this study. (A) Cockroach allergen (CRA) airway challenge model involved daily oral gavage of mice (n =5 per group) with D, NP dust suspension or saline before CRA sensitization via intratracheal administration. Animals in the control treatment group received nointerventions. Following the initial CRA sensitization on day 7, animals continued to receive the relevant supplementation by oral gavage twice per week.During this period, mice were challenged on days 14, 20, and 22 with CRA, before the end of the protocol (EP) on day 23. (B) DO11.10 T-cell transfer OVA modelwas performed in a similar manner in that animals (n = 5 per group) received daily supplementation with D, NP dust suspension or saline for 14 d beforetransfer of naïve T cells and subsequent intratracheal OVA challenge on day 15. Animals were taken at the end of the protocol (EP) on day 18. Control animalsreceived no treatment.
Fig. S3. Allergen-responsive phenotype is sustained despite normalization of house dust exposures. Animals were exposed to either equivalent high dose (HD)(25 mg) or low dose (LD) (6.25 mg) of dog- (D) or no-pet (NP)–associated house dust as described in SI Materials and Methods. Airway Th2 cytokine and gob5gene expression was quantified for each group. Reduced exposure to D-associated house dust still resulted in significant reductions in Th2 cytokine expressionin the airways, although the reduction in gob5 gene expression observed upon high level exposure to D dust, was lost upon reduced exposure. Increasedexposure to NP-associated house dust did not result in reduced Th2 cytokine or gob5 responses in murine airways.
Fujimura et al. www.pnas.org/cgi/content/short/1310750111 5 of 11
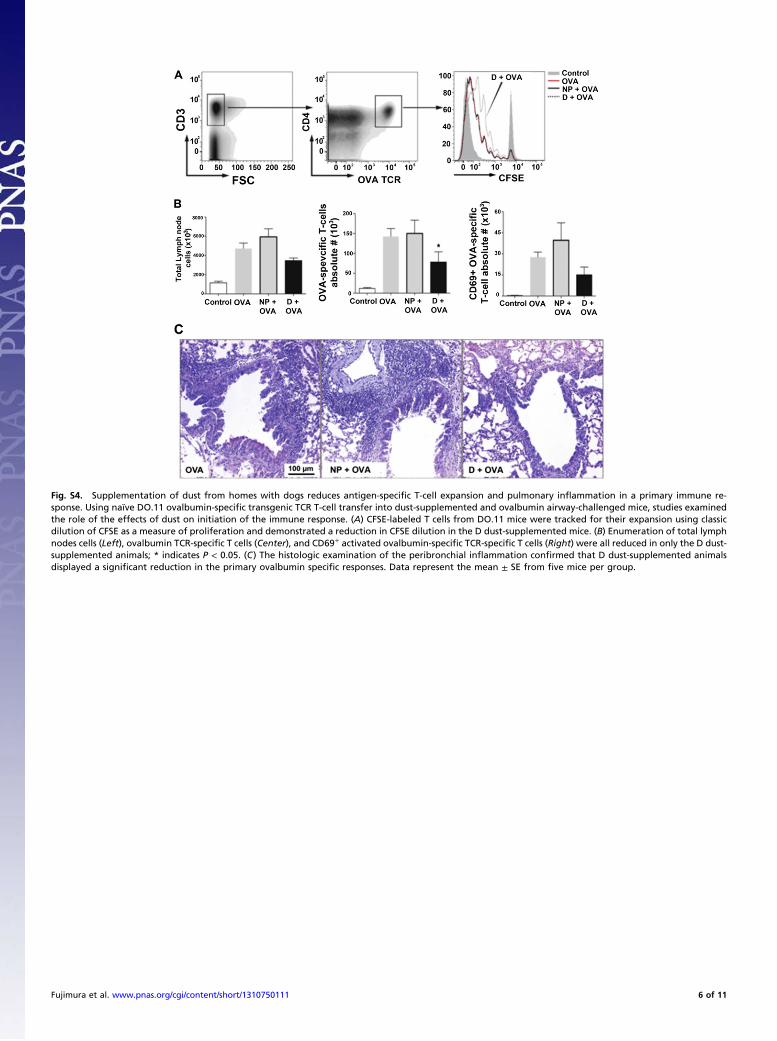
Fig. S4. Supplementation of dust from homes with dogs reduces antigen-specific T-cell expansion and pulmonary inflammation in a primary immune re-sponse. Using naïve DO.11 ovalbumin-specific transgenic TCR T-cell transfer into dust-supplemented and ovalbumin airway-challenged mice, studies examinedthe role of the effects of dust on initiation of the immune response. (A) CFSE-labeled T cells from DO.11 mice were tracked for their expansion using classicdilution of CFSE as a measure of proliferation and demonstrated a reduction in CFSE dilution in the D dust-supplemented mice. (B) Enumeration of total lymphnodes cells (Left), ovalbumin TCR-specific T cells (Center), and CD69+ activated ovalbumin-specific TCR-specific T cells (Right) were all reduced in only the D dust-supplemented animals; * indicates P < 0.05. (C) The histologic examination of the peribronchial inflammation confirmed that D dust-supplemented animalsdisplayed a significant reduction in the primary ovalbumin specific responses. Data represent the mean ± SE from five mice per group.
Fujimura et al. www.pnas.org/cgi/content/short/1310750111 6 of 11
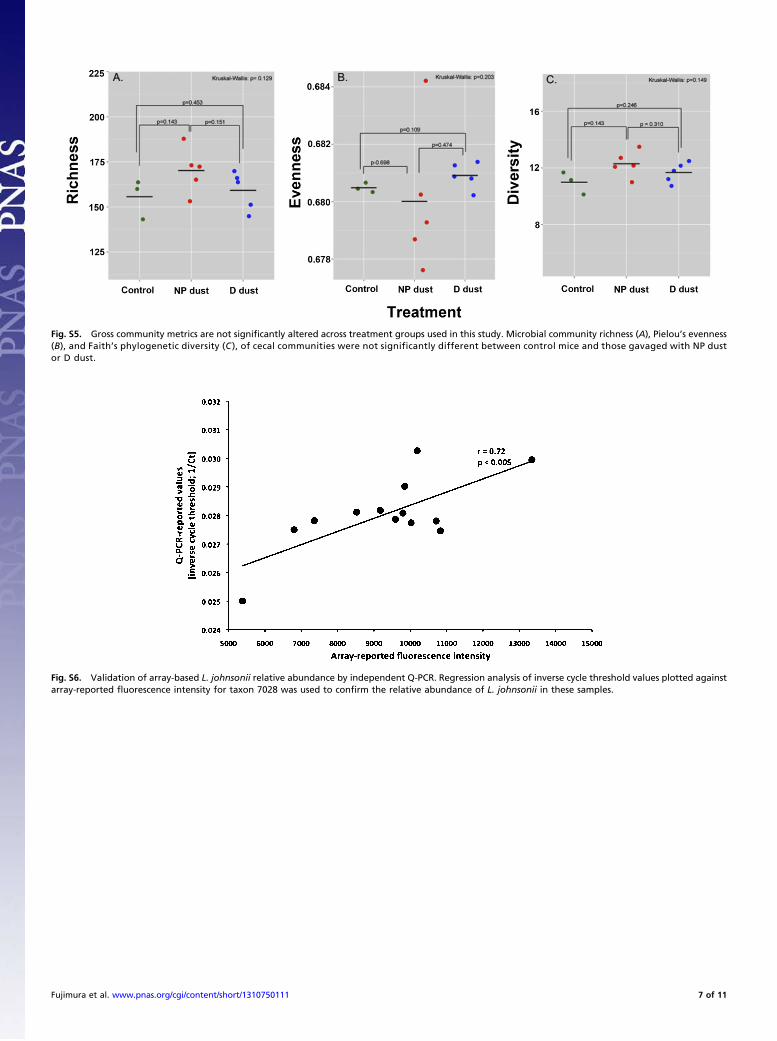
Fig. S5. Gross community metrics are not significantly altered across treatment groups used in this study. Microbial community richness (A), Pielou’s evenness(B), and Faith’s phylogenetic diversity (C ), of cecal communities were not significantly different between control mice and those gavaged with NP dustor D dust.
Fig. S6. Validation of array-based L. johnsonii relative abundance by independent Q-PCR. Regression analysis of inverse cycle threshold values plotted againstarray-reported fluorescence intensity for taxon 7028 was used to confirm the relative abundance of L. johnsonii in these samples.
Fujimura et al. www.pnas.org/cgi/content/short/1310750111 7 of 11
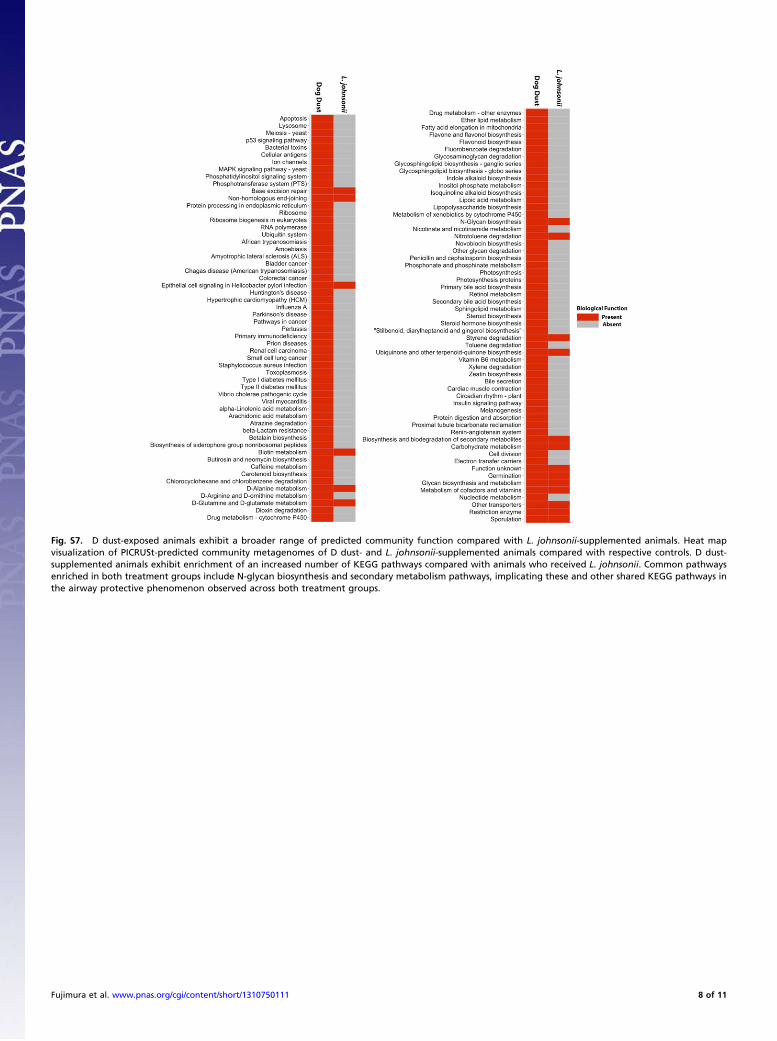
Fig. S7. D dust-exposed animals exhibit a broader range of predicted community function compared with L. johnsonii-supplemented animals. Heat mapvisualization of PICRUSt-predicted community metagenomes of D dust- and L. johnsonii-supplemented animals compared with respective controls. D dust-supplemented animals exhibit enrichment of an increased number of KEGG pathways compared with animals who received L. johnsonii. Common pathwaysenriched in both treatment groups include N-glycan biosynthesis and secondary metabolism pathways, implicating these and other shared KEGG pathways inthe airway protective phenomenon observed across both treatment groups.
Fujimura et al. www.pnas.org/cgi/content/short/1310750111 8 of 11
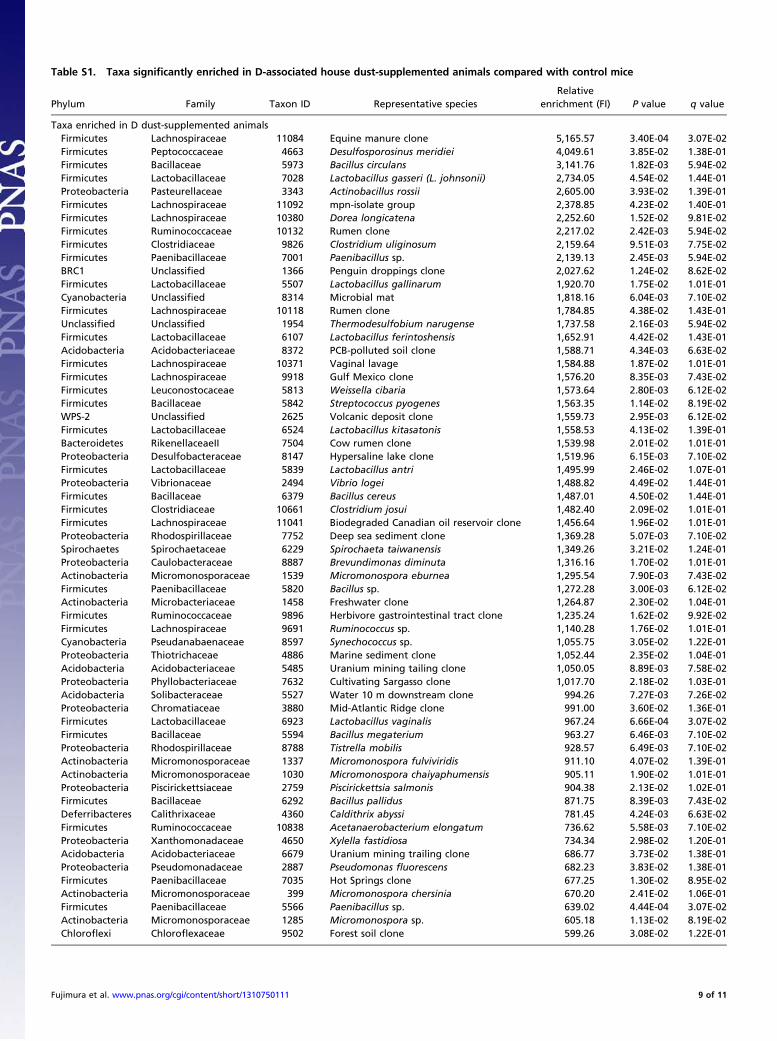
Table S1. Taxa significantly enriched in D-associated house dust-supplemented animals compared with control mice
Phylum Family Taxon ID Representative speciesRelative
enrichment (FI) P value q value
Taxa enriched in D dust-supplemented animalsFirmicutes Lachnospiraceae 11084 Equine manure clone 5,165.57 3.40E-04 3.07E-02Firmicutes Peptococcaceae 4663 Desulfosporosinus meridiei 4,049.61 3.85E-02 1.38E-01Firmicutes Bacillaceae 5973 Bacillus circulans 3,141.76 1.82E-03 5.94E-02Firmicutes Lactobacillaceae 7028 Lactobacillus gasseri (L. johnsonii) 2,734.05 4.54E-02 1.44E-01Proteobacteria Pasteurellaceae 3343 Actinobacillus rossii 2,605.00 3.93E-02 1.39E-01Firmicutes Lachnospiraceae 11092 mpn-isolate group 2,378.85 4.23E-02 1.40E-01Firmicutes Lachnospiraceae 10380 Dorea longicatena 2,252.60 1.52E-02 9.81E-02Firmicutes Ruminococcaceae 10132 Rumen clone 2,217.02 2.42E-03 5.94E-02Firmicutes Clostridiaceae 9826 Clostridium uliginosum 2,159.64 9.51E-03 7.75E-02Firmicutes Paenibacillaceae 7001 Paenibacillus sp. 2,139.13 2.45E-03 5.94E-02BRC1 Unclassified 1366 Penguin droppings clone 2,027.62 1.24E-02 8.62E-02Firmicutes Lactobacillaceae 5507 Lactobacillus gallinarum 1,920.70 1.75E-02 1.01E-01Cyanobacteria Unclassified 8314 Microbial mat 1,818.16 6.04E-03 7.10E-02Firmicutes Lachnospiraceae 10118 Rumen clone 1,784.85 4.38E-02 1.43E-01Unclassified Unclassified 1954 Thermodesulfobium narugense 1,737.58 2.16E-03 5.94E-02Firmicutes Lactobacillaceae 6107 Lactobacillus ferintoshensis 1,652.91 4.42E-02 1.43E-01Acidobacteria Acidobacteriaceae 8372 PCB-polluted soil clone 1,588.71 4.34E-03 6.63E-02Firmicutes Lachnospiraceae 10371 Vaginal lavage 1,584.88 1.87E-02 1.01E-01Firmicutes Lachnospiraceae 9918 Gulf Mexico clone 1,576.20 8.35E-03 7.43E-02Firmicutes Leuconostocaceae 5813 Weissella cibaria 1,573.64 2.80E-03 6.12E-02Firmicutes Bacillaceae 5842 Streptococcus pyogenes 1,563.35 1.14E-02 8.19E-02WPS-2 Unclassified 2625 Volcanic deposit clone 1,559.73 2.95E-03 6.12E-02Firmicutes Lactobacillaceae 6524 Lactobacillus kitasatonis 1,558.53 4.13E-02 1.39E-01Bacteroidetes RikenellaceaeII 7504 Cow rumen clone 1,539.98 2.01E-02 1.01E-01Proteobacteria Desulfobacteraceae 8147 Hypersaline lake clone 1,519.96 6.15E-03 7.10E-02Firmicutes Lactobacillaceae 5839 Lactobacillus antri 1,495.99 2.46E-02 1.07E-01Proteobacteria Vibrionaceae 2494 Vibrio logei 1,488.82 4.49E-02 1.44E-01Firmicutes Bacillaceae 6379 Bacillus cereus 1,487.01 4.50E-02 1.44E-01Firmicutes Clostridiaceae 10661 Clostridium josui 1,482.40 2.09E-02 1.01E-01Firmicutes Lachnospiraceae 11041 Biodegraded Canadian oil reservoir clone 1,456.64 1.96E-02 1.01E-01Proteobacteria Rhodospirillaceae 7752 Deep sea sediment clone 1,369.28 5.07E-03 7.10E-02Spirochaetes Spirochaetaceae 6229 Spirochaeta taiwanensis 1,349.26 3.21E-02 1.24E-01Proteobacteria Caulobacteraceae 8887 Brevundimonas diminuta 1,316.16 1.70E-02 1.01E-01Actinobacteria Micromonosporaceae 1539 Micromonospora eburnea 1,295.54 7.90E-03 7.43E-02Firmicutes Paenibacillaceae 5820 Bacillus sp. 1,272.28 3.00E-03 6.12E-02Actinobacteria Microbacteriaceae 1458 Freshwater clone 1,264.87 2.30E-02 1.04E-01Firmicutes Ruminococcaceae 9896 Herbivore gastrointestinal tract clone 1,235.24 1.62E-02 9.92E-02Firmicutes Lachnospiraceae 9691 Ruminococcus sp. 1,140.28 1.76E-02 1.01E-01Cyanobacteria Pseudanabaenaceae 8597 Synechococcus sp. 1,055.75 3.05E-02 1.22E-01Proteobacteria Thiotrichaceae 4886 Marine sediment clone 1,052.44 2.35E-02 1.04E-01Acidobacteria Acidobacteriaceae 5485 Uranium mining tailing clone 1,050.05 8.89E-03 7.58E-02Proteobacteria Phyllobacteriaceae 7632 Cultivating Sargasso clone 1,017.70 2.18E-02 1.03E-01Acidobacteria Solibacteraceae 5527 Water 10 m downstream clone 994.26 7.27E-03 7.26E-02Proteobacteria Chromatiaceae 3880 Mid-Atlantic Ridge clone 991.00 3.60E-02 1.36E-01Firmicutes Lactobacillaceae 6923 Lactobacillus vaginalis 967.24 6.66E-04 3.07E-02Firmicutes Bacillaceae 5594 Bacillus megaterium 963.27 6.46E-03 7.10E-02Proteobacteria Rhodospirillaceae 8788 Tistrella mobilis 928.57 6.49E-03 7.10E-02Actinobacteria Micromonosporaceae 1337 Micromonospora fulviviridis 911.10 4.07E-02 1.39E-01Actinobacteria Micromonosporaceae 1030 Micromonospora chaiyaphumensis 905.11 1.90E-02 1.01E-01Proteobacteria Piscirickettsiaceae 2759 Piscirickettsia salmonis 904.38 2.13E-02 1.02E-01Firmicutes Bacillaceae 6292 Bacillus pallidus 871.75 8.39E-03 7.43E-02Deferribacteres Calithrixaceae 4360 Caldithrix abyssi 781.45 4.24E-03 6.63E-02Firmicutes Ruminococcaceae 10838 Acetanaerobacterium elongatum 736.62 5.58E-03 7.10E-02Proteobacteria Xanthomonadaceae 4650 Xylella fastidiosa 734.34 2.98E-02 1.20E-01Acidobacteria Acidobacteriaceae 6679 Uranium mining trailing clone 686.77 3.73E-02 1.38E-01Proteobacteria Pseudomonadaceae 2887 Pseudomonas fluorescens 682.23 3.83E-02 1.38E-01Firmicutes Paenibacillaceae 7035 Hot Springs clone 677.25 1.30E-02 8.95E-02Actinobacteria Micromonosporaceae 399 Micromonospora chersinia 670.20 2.41E-02 1.06E-01Firmicutes Paenibacillaceae 5566 Paenibacillus sp. 639.02 4.44E-04 3.07E-02Actinobacteria Micromonosporaceae 1285 Micromonospora sp. 605.18 1.13E-02 8.19E-02Chloroflexi Chloroflexaceae 9502 Forest soil clone 599.26 3.08E-02 1.22E-01
Fujimura et al. www.pnas.org/cgi/content/short/1310750111 9 of 11
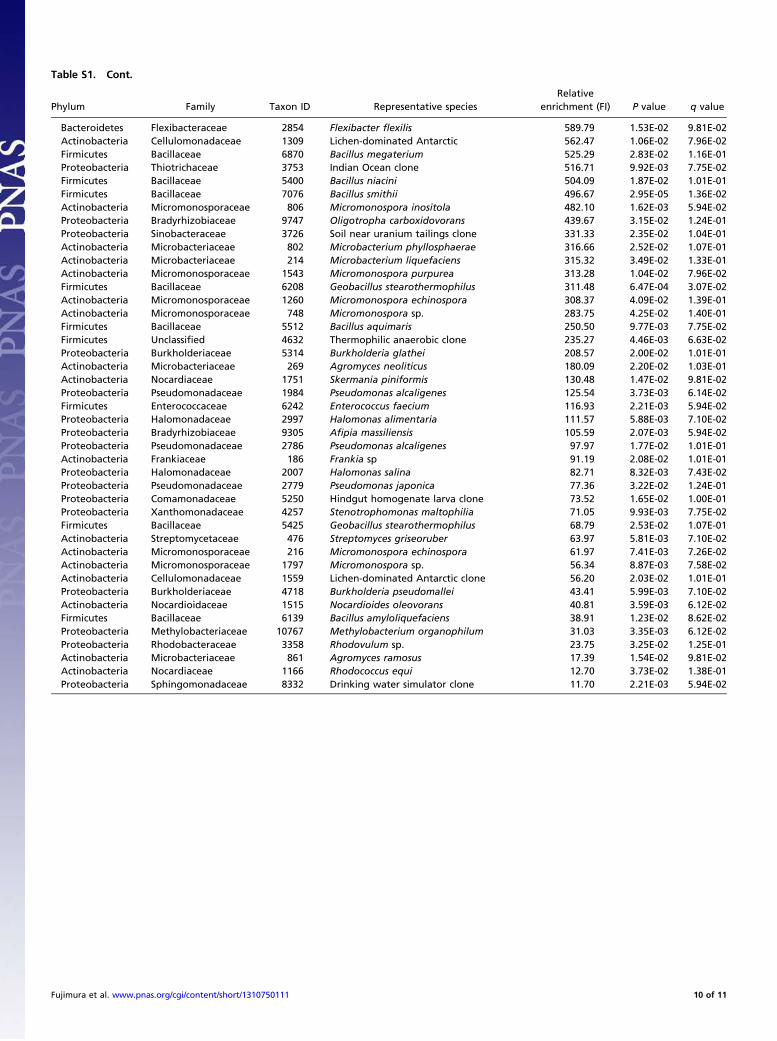
Table S1. Cont.
Phylum Family Taxon ID Representative speciesRelative
enrichment (FI) P value q value
Bacteroidetes Flexibacteraceae 2854 Flexibacter flexilis 589.79 1.53E-02 9.81E-02Actinobacteria Cellulomonadaceae 1309 Lichen-dominated Antarctic 562.47 1.06E-02 7.96E-02Firmicutes Bacillaceae 6870 Bacillus megaterium 525.29 2.83E-02 1.16E-01Proteobacteria Thiotrichaceae 3753 Indian Ocean clone 516.71 9.92E-03 7.75E-02Firmicutes Bacillaceae 5400 Bacillus niacini 504.09 1.87E-02 1.01E-01Firmicutes Bacillaceae 7076 Bacillus smithii 496.67 2.95E-05 1.36E-02Actinobacteria Micromonosporaceae 806 Micromonospora inositola 482.10 1.62E-03 5.94E-02Proteobacteria Bradyrhizobiaceae 9747 Oligotropha carboxidovorans 439.67 3.15E-02 1.24E-01Proteobacteria Sinobacteraceae 3726 Soil near uranium tailings clone 331.33 2.35E-02 1.04E-01Actinobacteria Microbacteriaceae 802 Microbacterium phyllosphaerae 316.66 2.52E-02 1.07E-01Actinobacteria Microbacteriaceae 214 Microbacterium liquefaciens 315.32 3.49E-02 1.33E-01Actinobacteria Micromonosporaceae 1543 Micromonospora purpurea 313.28 1.04E-02 7.96E-02Firmicutes Bacillaceae 6208 Geobacillus stearothermophilus 311.48 6.47E-04 3.07E-02Actinobacteria Micromonosporaceae 1260 Micromonospora echinospora 308.37 4.09E-02 1.39E-01Actinobacteria Micromonosporaceae 748 Micromonospora sp. 283.75 4.25E-02 1.40E-01Firmicutes Bacillaceae 5512 Bacillus aquimaris 250.50 9.77E-03 7.75E-02Firmicutes Unclassified 4632 Thermophilic anaerobic clone 235.27 4.46E-03 6.63E-02Proteobacteria Burkholderiaceae 5314 Burkholderia glathei 208.57 2.00E-02 1.01E-01Actinobacteria Microbacteriaceae 269 Agromyces neoliticus 180.09 2.20E-02 1.03E-01Actinobacteria Nocardiaceae 1751 Skermania piniformis 130.48 1.47E-02 9.81E-02Proteobacteria Pseudomonadaceae 1984 Pseudomonas alcaligenes 125.54 3.73E-03 6.14E-02Firmicutes Enterococcaceae 6242 Enterococcus faecium 116.93 2.21E-03 5.94E-02Proteobacteria Halomonadaceae 2997 Halomonas alimentaria 111.57 5.88E-03 7.10E-02Proteobacteria Bradyrhizobiaceae 9305 Afipia massiliensis 105.59 2.07E-03 5.94E-02Proteobacteria Pseudomonadaceae 2786 Pseudomonas alcaligenes 97.97 1.77E-02 1.01E-01Actinobacteria Frankiaceae 186 Frankia sp 91.19 2.08E-02 1.01E-01Proteobacteria Halomonadaceae 2007 Halomonas salina 82.71 8.32E-03 7.43E-02Proteobacteria Pseudomonadaceae 2779 Pseudomonas japonica 77.36 3.22E-02 1.24E-01Proteobacteria Comamonadaceae 5250 Hindgut homogenate larva clone 73.52 1.65E-02 1.00E-01Proteobacteria Xanthomonadaceae 4257 Stenotrophomonas maltophilia 71.05 9.93E-03 7.75E-02Firmicutes Bacillaceae 5425 Geobacillus stearothermophilus 68.79 2.53E-02 1.07E-01Actinobacteria Streptomycetaceae 476 Streptomyces griseoruber 63.97 5.81E-03 7.10E-02Actinobacteria Micromonosporaceae 216 Micromonospora echinospora 61.97 7.41E-03 7.26E-02Actinobacteria Micromonosporaceae 1797 Micromonospora sp. 56.34 8.87E-03 7.58E-02Actinobacteria Cellulomonadaceae 1559 Lichen-dominated Antarctic clone 56.20 2.03E-02 1.01E-01Proteobacteria Burkholderiaceae 4718 Burkholderia pseudomallei 43.41 5.99E-03 7.10E-02Actinobacteria Nocardioidaceae 1515 Nocardioides oleovorans 40.81 3.59E-03 6.12E-02Firmicutes Bacillaceae 6139 Bacillus amyloliquefaciens 38.91 1.23E-02 8.62E-02Proteobacteria Methylobacteriaceae 10767 Methylobacterium organophilum 31.03 3.35E-03 6.12E-02Proteobacteria Rhodobacteraceae 3358 Rhodovulum sp. 23.75 3.25E-02 1.25E-01Actinobacteria Microbacteriaceae 861 Agromyces ramosus 17.39 1.54E-02 9.81E-02Actinobacteria Nocardiaceae 1166 Rhodococcus equi 12.70 3.73E-02 1.38E-01Proteobacteria Sphingomonadaceae 8332 Drinking water simulator clone 11.70 2.21E-03 5.94E-02
Fujimura et al. www.pnas.org/cgi/content/short/1310750111 10 of 11
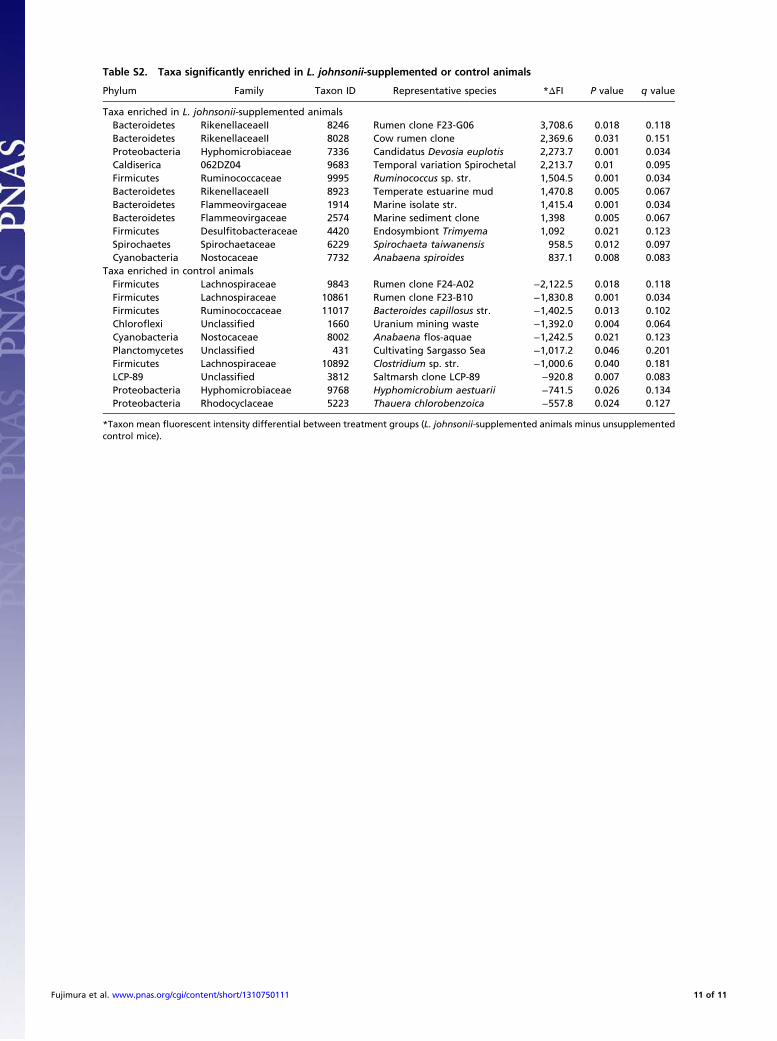
Table S2. Taxa significantly enriched in L. johnsonii-supplemented or control animals
Phylum Family Taxon ID Representative species *ΔFI P value q value
Taxa enriched in L. johnsonii-supplemented animalsBacteroidetes RikenellaceaeII 8246 Rumen clone F23-G06 3,708.6 0.018 0.118Bacteroidetes RikenellaceaeII 8028 Cow rumen clone 2,369.6 0.031 0.151Proteobacteria Hyphomicrobiaceae 7336 Candidatus Devosia euplotis 2,273.7 0.001 0.034Caldiserica 062DZ04 9683 Temporal variation Spirochetal 2,213.7 0.01 0.095Firmicutes Ruminococcaceae 9995 Ruminococcus sp. str. 1,504.5 0.001 0.034Bacteroidetes RikenellaceaeII 8923 Temperate estuarine mud 1,470.8 0.005 0.067Bacteroidetes Flammeovirgaceae 1914 Marine isolate str. 1,415.4 0.001 0.034Bacteroidetes Flammeovirgaceae 2574 Marine sediment clone 1,398 0.005 0.067Firmicutes Desulfitobacteraceae 4420 Endosymbiont Trimyema 1,092 0.021 0.123Spirochaetes Spirochaetaceae 6229 Spirochaeta taiwanensis 958.5 0.012 0.097Cyanobacteria Nostocaceae 7732 Anabaena spiroides 837.1 0.008 0.083
Taxa enriched in control animalsFirmicutes Lachnospiraceae 9843 Rumen clone F24-A02 −2,122.5 0.018 0.118Firmicutes Lachnospiraceae 10861 Rumen clone F23-B10 −1,830.8 0.001 0.034Firmicutes Ruminococcaceae 11017 Bacteroides capillosus str. −1,402.5 0.013 0.102Chloroflexi Unclassified 1660 Uranium mining waste −1,392.0 0.004 0.064Cyanobacteria Nostocaceae 8002 Anabaena flos-aquae −1,242.5 0.021 0.123Planctomycetes Unclassified 431 Cultivating Sargasso Sea −1,017.2 0.046 0.201Firmicutes Lachnospiraceae 10892 Clostridium sp. str. −1,000.6 0.040 0.181LCP-89 Unclassified 3812 Saltmarsh clone LCP-89 −920.8 0.007 0.083Proteobacteria Hyphomicrobiaceae 9768 Hyphomicrobium aestuarii −741.5 0.026 0.134Proteobacteria Rhodocyclaceae 5223 Thauera chlorobenzoica −557.8 0.024 0.127
*Taxon mean fluorescent intensity differential between treatment groups (L. johnsonii-supplemented animals minus unsupplementedcontrol mice).
Fujimura et al. www.pnas.org/cgi/content/short/1310750111 11 of 11


