Embed Size (px)
Citation preview
at SciVerse ScienceDirect
Estuarine, Coastal and Shelf Science 119 (2013) 7e16
Contents lists available
Estuarine, Coastal and Shelf Science
journal homepage: www.elsevier .com/locate/ecss
Historical reconstruction of mangrove expansion in the Gulf ofMexico: Linking climate change with carbon sequestration in coastalwetlands
Thomas S. Bianchi a,*, Mead A. Allison b, Jun Zhao a,1, Xinxin Li a, Rebecca S. Comeaux b,Rusty A. Feagin c, R. Wasantha Kulawardhana c
a Texas A&M University, Department of Oceanography, College Station, 403AB Eller O&M Building, 3146 TAMU, TX 77843-3146, USAb Institute for Geophysics, University of Texas at Austin, Austin, TX 78758-4445, USAcDepartment of Ecosystem Science & Management, Texas A&M University, College Station, TX 77845, USA
a r t i c l e i n f o
Article history:Received 13 October 2012Accepted 26 December 2012Available online 3 January 2013
Keywords:coastal wetlandsclimate changecarbon sequestrationbiomarkersGulf of Mexico
* Corresponding author.E-mail address: [email protected] (T.S. Bianchi).
1 Current address: Key Laboratory of Marine EcosSecond Institute of Oceanography, SOA, Hangzhou 31
0272-7714/$ e see front matter Published by Elsevierhttp://dx.doi.org/10.1016/j.ecss.2012.12.007
a b s t r a c t
There has been considerable interest in a recently recognized and important sink in the global carbonpool, commonly referred to as “blue carbon”. The major goal of this study was to determine the historicalreconstruction of mangrove expansion (Avicennia germinans) into salt marshes (Spartina alterniflora) andits effects on carbon sequestration and soil chemistry in wetland soils of the northwestern Gulf ofMexico. We used bulk stable isotopic, chemical biomarker analyses, and aerial imagery analysis toidentify changes in OC wetland sources, and radiotracers (137Cs and 210Pb) for chronology. Soil cores werecollected at two sites at Port Aransas, Texas (USA), Harbor Island and Mud Island.
Stable isotopic values of d13C and d15N of all soil samples ranged from �26.8 to �15.6& and 1.8e10.4&and showed a significant trend of increasing depletion for each isotope from bottom to surface soils. Themost depleted d13C values were in surface soils at the Mud Island (Mangrove 2) location. Carbonsequestration rates were greater in mangroves and for the Mud Island Mangrove 1 and the Marsh 1 sitesranged from 253 to 270 and 101e125 g C m�2 yr�1, respectively. Lignin storage rates were also greater formangrove sites and for the Mud Island Mangrove 1 and the Marsh 1 ranged from 19.5 to 20.1 and 16.5 to12.8 g lignin m�2 yr�1, respectively. The L8 and L6 values for all cores ranged from 0.5 to 21.5 and 0.4 to16.5, respectively, and showed a significant increase from bottom to surface sediments. If regionalchanges in the Gulf of Mexico are to persist and much of the marsh vegetation was to be replaced bymangroves, there could be significant increases on the overall storage and sequestration of carbon in thecoastal zone.
Published by Elsevier Ltd.
1. Introduction
There has been considerable interest in a recently recognizedand important sink in the global carbon pool, commonly referred toas “blue carbon”, or that which is associated with organic carbon(OC) burial in seagrass meadows and intertidal wetlands (man-groves and intertidal marshes) (Chmura et al., 2003; Duarte et al.,2005; McLeod et al., 2011; Hopkinson et al., 2012). In fact, thesecond largest release of carbon dioxide (CO2) to the atmosphere,
ystem and Biogeochemistry,0012, China.
Ltd.
after fossil fuel combustion, is from deforestation and land-usechange, which accounts for 8e20% of the total emissions (IPCC,2007; van der Werf et al., 2009). Consequently, Reduced Emis-sions from Deforestation and Degradation (REDDþ) has been pro-posed internationally as way to helpmitigate climate change effects(Donato et al., 2011). Therefore, the effects of current natural andhuman-induced alterations in the composition of wetland plantspecies, and their associated carbon sequestration capacity, needsfurther attention.
In coastal wetlands, a warming climate is expected to increasethe spatial extent of C3 carbon-rich woody mangroves at theexpense of C4 herbaceous salt marshes (Ross et al., 2000; Stevenset al., 2006; McKee and Rooth, 2008; Williamson et al., 2010). Theresponse of plant communities to global change is expected to bediscernible in such boundaries because of their rapid and extreme
T.S. Bianchi et al. / Estuarine, Coastal and Shelf Science 119 (2013) 7e168
responses under such physiologically stressful conditions (Allenand Breshears, 1998). Salt marsh-mangrove ecotones, whichoccur in many geographic locations, provide locations to examinechanges in carbon sequestration in such dynamic transitional re-gions (Lopez-Portillo and Ezcurra, 1989; Patterson andMendelssohn, 1991; Stevens et al., 2006). While the literature isreplete with studies suggesting that elevated CO2 levels will pro-mote the growth of C3 plant species, there are only few that haveexamined plant competition under elevated CO2 conditions inecotonal communities where C3 and C4 species converge (e.g.,McKee and Rooth, 2008).
Although previous work has focused on factors controllingzonation at the ecotone between Avicennia and Spartina spp. in theGulf of Mexico (Patterson and Mendelssohn, 1991; Stevens et al.,2006), only recently has there been examination of how spatialchanges in these taxa affect ecosystem properties (e.g., elevationalchanges and edaphic parameters) (Perry and Mendelssohn, 2009;Comeaux et al., 2012). The major goal of this study was to deter-mine the historical reconstruction of mangrove expansion (Avi-cennia germinans) into salt marshes (Spartina alterniflora) and itseffects on carbon sequestration and soil chemistry in wetland soilsof the northwestern Gulf of Mexico.
We used bulk stable isotopic, chemical biomarker analyses, andaerial imagery analysis to identify changes in OC wetland sources,and radiotracers (137Cs and 210Pb) for chronology. This work is inpart connected with a recent study by Comeaux et al. (2012), thatfocused more on the effects of mangrove transitions on resistanceto accelerating eustatic sea level rise (ESLR) and/or relative sea levelrise (RSL) rates, and wetland stability to wave attack in large storms(increased cyclonic storm frequency/intensity).
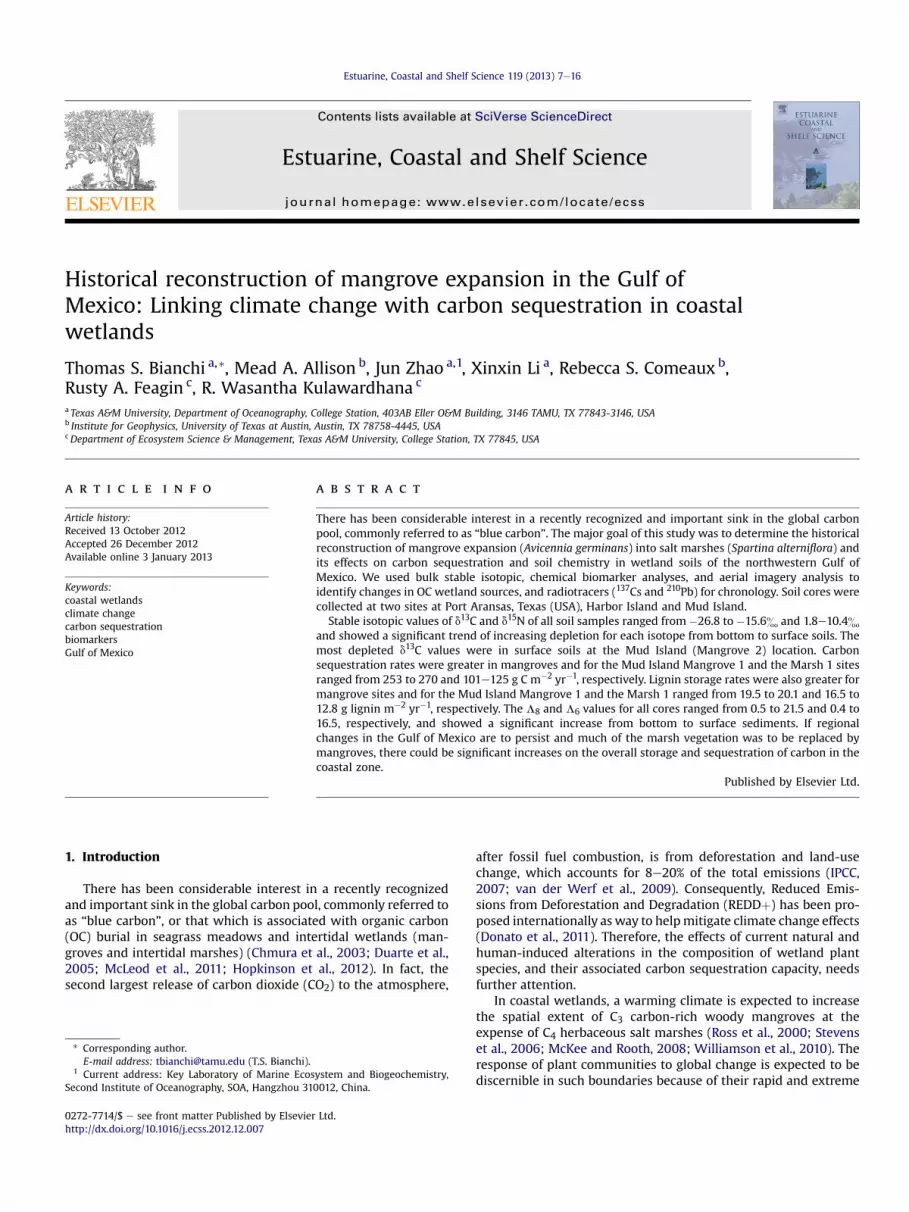
Fig. 1. Map of the two sites at Port Aransas, Texas (USA), at harbor island (27�51
2. Materials and methods
2.1. Site description
Populations of Avicennia germinans and Spartina alternifloragrowing in isolation of each and in overlapping locations (alongwith other salt tolerant plants, including in some cases Spartinapatens), in similar geomorphological settings were selected as fieldsites in a back-barrier region near Port Aransas, Texas. The two sitesat Port Aransas consisted of the Harbor Island (27�510 50.2500N,97�30 35.3600W) and Mud Island (27�560 32.2400N, 97�10 38.1400W)locations, both situated along the Lydia Ann Channel, north ofMustang Island (Fig. 1) (Comeaux et al., 2012). Two different coreswere taken at the Harbor Island Mangrove site (Mangrove 1 and 2),two cores at theMud IslandMangrove (Mangrove 1 and 2), and twocores at the Mud Island Marsh site (Marsh 1 and 2), for a total of 6cores. Harbor Island is a flood tidal delta (Sherrod and McMillan,1981), entirely mangrove-dominated at present, but having hadpast reversals in mangrove versus marsh vegetation - associatedwith freezes in the 1980’s. Sub-freezing conditions in December,1983 resulted in a mortality rate of approximately 80e85% ofmangrove populations in Texas (McMillan and Sherrod, 1986), withHarbor Island experiencing an 85% loss and Galveston a �95% loss(Sherrod and McMillan, 1985). Galveston populations wereimpacted to a greater extent and reduced to less than 5 percent ofthe original population after 1983 (Everitt and Judd, 1989; Everittet al., 1996). Other studies have examined the impact of a freezeevent in December 1989 on mangrove colony expansion (Everittet al., 1996; Buskey et al., 1997). In general, the Port Aransas man-grove colonies were thick and flourishing when we sampling
0 50.2500N, 97�30 35.3600W) and Mud island (27�560 32.2400N, 97�10 38.1400W).

T.S. Bianchi et al. / Estuarine, Coastal and Shelf Science 119 (2013) 7e16 9
occurred in this study e with tree sizes reaching 1e2 m in height(Comeaux et al., 2012).
2.2. Soil sampling and processing
Peat auger cores (minimal compaction) from marsh and man-grove areas were collected for sampling of total organic carbon(TOC), total nitrogen (TN), stable isotopes (d13C and d15N), lignin-phenols, porosity, 210Pb and 137Cs radiotracer geochronology.Cores were cut on site and sub-sampled the same day in a field labprior to freezing for analysis and storage.
2.3. Radionuclides and sediment accumulation
Total sediment accumulation in sediment cores from mangroveand marsh sites (mineral þ organic) were measured using the ra-diotracers 210Pb (half-life ¼ 22.2 years) and 137Cs (half-life ¼ 30.1years) to identify any difference in total accumulation rates thatmight result in differences in elevation, see Comeauxet al. (2012) formore details. Basically, radiotracers were measured by gammaspectrometry (planar and well geometry LEGE detectors) usingfreeze-dried sediment intervals from the cores. A best-fit linearregression of the natural log of excess 210Pb (210Pbxs) with depthbelow any surface mixed layer of homogenous activity was used todetermine the sediment accumulation for the past ca.100 years(Nittrouer and Sternberg, 1981). 137Cs is the product of fallout fromatmospheric testing of thermonuclear weapons that began in 1954.We used the depth of maximum 137Cs fallout in the northernhemisphere (1963 according toChmuraandKosters,1994) and 210Pbto estimate sedimentation rates for each site. 137Cs rates were cal-culatedbydividing thedepthof the1963peakoccurrence in the coreby the number of years passed; errorswere derived byextrapolatingacross the core interval represented by that particular year. Finalaccumulation rates were depth-corrected to a standard coreporosity (60%) to expand or contract interval depths (to allow forinter-comparison of sites in linear terms; see Allison et al., 2007),and were converted from linear accumulation rates (consolidation-corrected cm yr�1) to mass accumulation rates (g cm2 yr�1).
2.4. Bulk isotope and elemental analysis
Total organic carbon, total nitrogen, and stable carbon and ni-trogen isotopes were analyzed at the University of California, DavisStable Isotope Facility. Measurements were made using an ele-mental analyzer (Carlo Erba EA-1108; CE Elantech, Lakewood, NJ)interfaced with an isotope ratio mass spectrometer (Delta Plus,Thermo Electron, Waltham, MA) operating in continuous flowmode. Carbon isotope ratioswere calculated in dnotation as follows:
d ¼h�
Rsample � RSTD�.
RSTDi� 103 (1)
where, RSTD is the 13C/12C ratio of the V-PDB standard (Coplen,1996) and Rsample is the 13C/12C ratio of the sample. The precisionof duplicate measurements was �0.1&.
2.5. Lignin-phenols
Freeze-dried sediment containing 3e5 mg of OC were analyzedfor lignin-phenols using the CuOmethod ofHedges and Ertel (1982),asmodified byGoni andHedges (1992). Sedimentswere transferredto stainless-steel reaction vials and digested with 330 mg (�4 mg)CuO in 2NNaOH at 150 �C for 3 h. Reaction productswere allowed tocool and then extracted with three successive 3 mL aliquots ofdiethyl ether (peroxides removed), filtered through combusted
glass-fiber, dried under N2, and converted to trimethylsilyl de-rivatives using bis-(trimethylsilyl)-trifluoroacetamide (BSTFA).Lignin-phenol derivatives were analyzed with an Agilent 5890 GasChromatograph/5973 Mass Spectrometric Detector (GCeMS).
Quantification was based upon the internal ARS standard andethyl vanillin was added before extraction to account for extractionefficiency. New response factors were generated with each batch byusing a mixed standard of the target compounds. The averagestandard deviations, based upon two replicates (n ¼ 2), for the sumof lignin phenols is less than 9% while that for individual com-pounds ranged from 2 to 17%. Eleven lignin phenols, p-hydrox-ybenzaldehyde, p-hydroxyacetophenol, p-hydroxycoumaric acid,vanillin, acetovanillone, p-hydroxybenzoic acid, syringealdehyde,vanillic acid, acetosyringone, syringic acid and ferulic acid, werequantified and used as molecular indicators for source and dia-genetic state of vascular plant tissue. Lamda-6 (L6) is defined as thesum of vanillyl (vanillin, acetovanillone, vanillic acid) and syringyl(syringaldehyde, acetosyringone, syringic acid) phenols, andLamda-8 (L8) includes the cinnamyl (p-coumaric and ferulic acid)phenols, both were per 100 mg OC�1. Total cinnamyl/vanillyl andsyringyl/vanillyl phenols represent C/V and S/V ratios, respectively,and were used in part, to determine plant lignin sources. Ratios ofvanillic acid to vanillin (Ad/Al)v (Hedges et al., 1988), p-hydroxyl/(vanillyl þ syringyl phenols) [P/(V þ S)] (Dittmar et al., 2001) wereused as indices of lignin decay.
2.6. Carbon sequestration, lignin storage rate, and historical carbonand lignin pools
Mud Island Mangrove 1 and Marsh 1 sites were selected toexamine historical changes in carbon and lignin storage. The cal-culation of organic carbon (kg C m�2) and lignin (kg lignin m�2)pool was modified from Bernal and Mitsch (2008) as follows:
TOClayerðgÞ ¼ dry weightlayerðgÞ � TOCð%Þ � 0:01 (2)
TOC poollayer�kg OC m�2
�¼ 1000�TOClayerðgÞ=A
�m2
�(3)
where,
dry weightlayerðgÞ ¼ density�g cm�3
��A
�m2
��10000
�depthlayerðcmÞ (4)
density¼ 2.65 g cm�3; TOC is the percentage of the organic carbon;TOClayer is the mass of organic carbon in each layer; A, the area ofthe sample corer, was canceled out during the calculation. TOCsequestration (kg OC m�2) was integrated from the TOC pool layer(kg OC m�2) over a specific time period, based on the 210Pb-derivedsediment accumulation rate in Comeaux et al. (2012) to determinethe carbon sequestration rates for the Mud Island cores.
Similarly, the lignin storage rate (kg lignin m�2) was integratedfrom ligninpool layer (kg ligninm�2) over specific timeperiod basedon the 210Pb derived sediment accumulation rate in Comeaux et al.(2012) to determine the lignin sequestration rates for the Mud Is-land cores. The lignin pool layer (kg lignin m�2) was determined asfollows:
Lignin poollayer�kg lignin m�2
�
¼ density�g cm�3
�� DepthlayerðcmÞ � TOCð%Þ
� L8
�mg 100 mg�1 OC
�� 0:001 (5)
T.S. Bianchi et al. / Estuarine, Coastal and Shelf Science 119 (2013) 7e1610
2.7. Aerial imagery
The six core locations were located within a Geographic Infor-mation System (ArcGIS, ESRI, Redlands, California) according totheir GPS coordinates. From a larger set of imagery, aerial photosthen were acquired representing the years 1951, 1967, and 2008/2009. Analysis was limited to only those images where the twovegetation types, mangroves versus salt marshes, were clearlydiscernible. Subsequently, the percent cover of each vegetation orland cover type was found within a 10 m buffer around each pointby digitizing and calculating areal coverage. Land-cover types in thearea included Avicennia germinans-dominated mangrove, Spartinaalterniflora-dominated salt marsh, unvegetated salt flat, highmarsh, estuarine beach sands, and openwater. The percent cover ofland cover type was then plotted across time.
2.8. Statistical analyses
Origin 8.6 software was used to for statistical analyses. A Oneway-ANOVA was performed in examine for differences betweenvariables at different sites and different depths. Statistically signifi-cant differences are discussed within the 95% confidence interval.
3. Results
3.1. Sediment accumulation and carbon sequestration rates
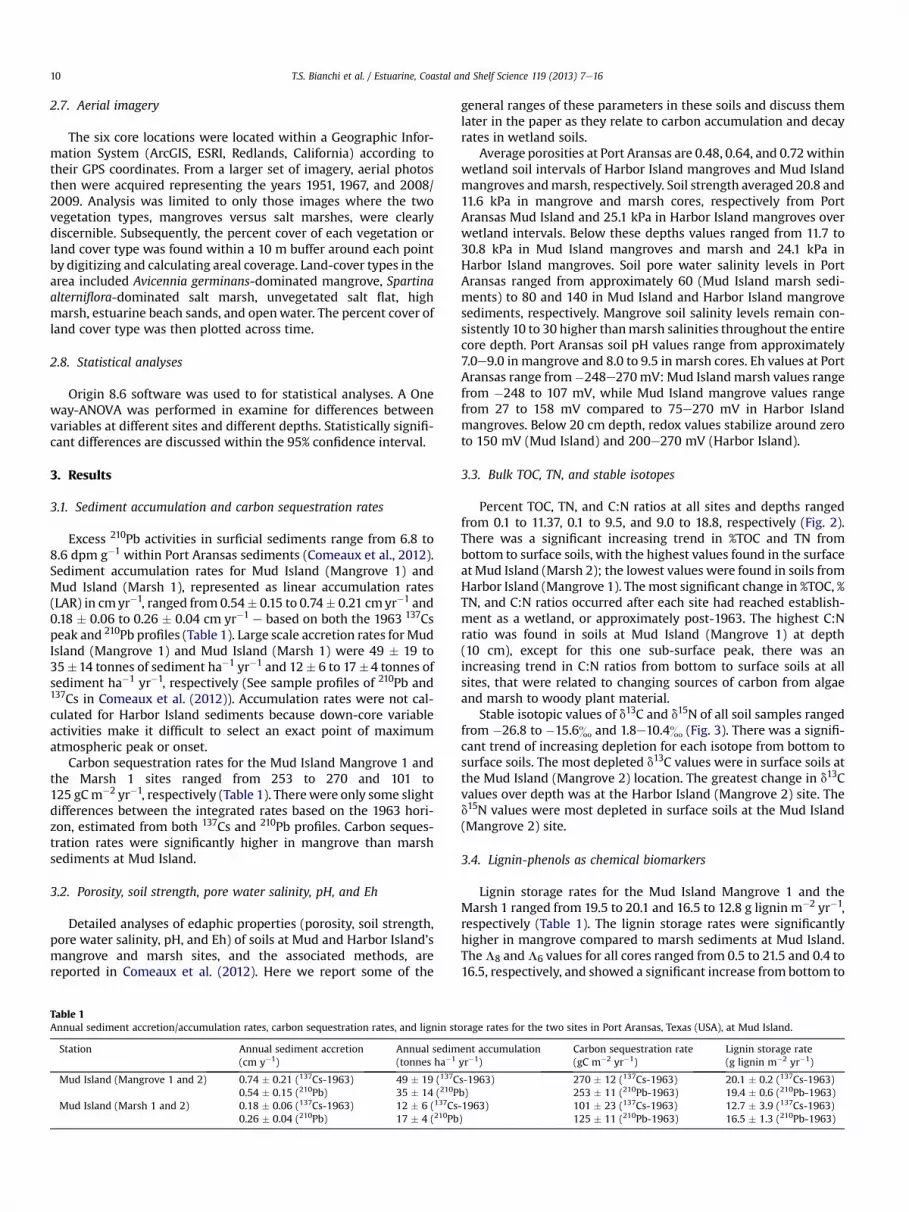
Excess 210Pb activities in surficial sediments range from 6.8 to8.6 dpm g�1 within Port Aransas sediments (Comeaux et al., 2012).Sediment accumulation rates for Mud Island (Mangrove 1) andMud Island (Marsh 1), represented as linear accumulation rates(LAR) in cmyr�1, ranged from 0.54� 0.15 to 0.74� 0.21 cmyr�1 and0.18 � 0.06 to 0.26 � 0.04 cm yr�1 e based on both the 1963 137Cspeak and 210Pb profiles (Table 1). Large scale accretion rates for MudIsland (Mangrove 1) and Mud Island (Marsh 1) were 49 � 19 to35�14 tonnes of sediment ha�1 yr�1 and 12� 6 to 17�4 tonnes ofsediment ha�1 yr�1, respectively (See sample profiles of 210Pb and137Cs in Comeaux et al. (2012)). Accumulation rates were not cal-culated for Harbor Island sediments because down-core variableactivities make it difficult to select an exact point of maximumatmospheric peak or onset.
Carbon sequestration rates for the Mud Island Mangrove 1 andthe Marsh 1 sites ranged from 253 to 270 and 101 to125 gCm�2 yr�1, respectively (Table 1). Therewere only some slightdifferences between the integrated rates based on the 1963 hori-zon, estimated from both 137Cs and 210Pb profiles. Carbon seques-tration rates were significantly higher in mangrove than marshsediments at Mud Island.
3.2. Porosity, soil strength, pore water salinity, pH, and Eh
Detailed analyses of edaphic properties (porosity, soil strength,pore water salinity, pH, and Eh) of soils at Mud and Harbor Island’smangrove and marsh sites, and the associated methods, arereported in Comeaux et al. (2012). Here we report some of the
Table 1Annual sediment accretion/accumulation rates, carbon sequestration rates, and lignin st
Station Annual sediment accretion(cm y�1)
Annual sedim(tonnes ha�1
Mud Island (Mangrove 1 and 2) 0.74 � 0.21 (137Cs-1963) 49 � 19 (137C0.54 � 0.15 (210Pb) 35 � 14 (210P
Mud Island (Marsh 1 and 2) 0.18 � 0.06 (137Cs-1963) 12 � 6 (137Cs0.26 � 0.04 (210Pb) 17 � 4 (210Pb
general ranges of these parameters in these soils and discuss themlater in the paper as they relate to carbon accumulation and decayrates in wetland soils.
Average porosities at Port Aransas are 0.48, 0.64, and 0.72withinwetland soil intervals of Harbor Island mangroves and Mud Islandmangroves andmarsh, respectively. Soil strength averaged 20.8 and11.6 kPa in mangrove and marsh cores, respectively from PortAransas Mud Island and 25.1 kPa in Harbor Island mangroves overwetland intervals. Below these depths values ranged from 11.7 to30.8 kPa in Mud Island mangroves and marsh and 24.1 kPa inHarbor Island mangroves. Soil pore water salinity levels in PortAransas ranged from approximately 60 (Mud Island marsh sedi-ments) to 80 and 140 in Mud Island and Harbor Island mangrovesediments, respectively. Mangrove soil salinity levels remain con-sistently 10 to 30 higher thanmarsh salinities throughout the entirecore depth. Port Aransas soil pH values range from approximately7.0e9.0 in mangrove and 8.0 to 9.5 in marsh cores. Eh values at PortAransas range from�248e270mV: Mud Islandmarsh values rangefrom �248 to 107 mV, while Mud Island mangrove values rangefrom 27 to 158 mV compared to 75e270 mV in Harbor Islandmangroves. Below 20 cm depth, redox values stabilize around zeroto 150 mV (Mud Island) and 200e270 mV (Harbor Island).
3.3. Bulk TOC, TN, and stable isotopes
Percent TOC, TN, and C:N ratios at all sites and depths rangedfrom 0.1 to 11.37, 0.1 to 9.5, and 9.0 to 18.8, respectively (Fig. 2).There was a significant increasing trend in %TOC and TN frombottom to surface soils, with the highest values found in the surfaceat Mud Island (Marsh 2); the lowest values were found in soils fromHarbor Island (Mangrove 1). The most significant change in %TOC, %TN, and C:N ratios occurred after each site had reached establish-ment as a wetland, or approximately post-1963. The highest C:Nratio was found in soils at Mud Island (Mangrove 1) at depth(10 cm), except for this one sub-surface peak, there was anincreasing trend in C:N ratios from bottom to surface soils at allsites, that were related to changing sources of carbon from algaeand marsh to woody plant material.
Stable isotopic values of d13C and d15N of all soil samples rangedfrom �26.8 to �15.6& and 1.8e10.4& (Fig. 3). There was a signifi-cant trend of increasing depletion for each isotope from bottom tosurface soils. The most depleted d13C values were in surface soils atthe Mud Island (Mangrove 2) location. The greatest change in d13Cvalues over depth was at the Harbor Island (Mangrove 2) site. Thed15N values were most depleted in surface soils at the Mud Island(Mangrove 2) site.
3.4. Lignin-phenols as chemical biomarkers
Lignin storage rates for the Mud Island Mangrove 1 and theMarsh 1 ranged from 19.5 to 20.1 and 16.5 to 12.8 g lignin m�2 yr�1,respectively (Table 1). The lignin storage rates were significantlyhigher in mangrove compared to marsh sediments at Mud Island.TheL8 andL6 values for all cores ranged from 0.5 to 21.5 and 0.4 to16.5, respectively, and showed a significant increase from bottom to
orage rates for the two sites in Port Aransas, Texas (USA), at Mud Island.
ent accumulationyr�1)
Carbon sequestration rate(gC m�2 yr�1)
Lignin storage rate(g lignin m�2 yr�1)
s-1963) 270 � 12 (137Cs-1963) 20.1 � 0.2 (137Cs-1963)b) 253 � 11 (210Pb-1963) 19.4 � 0.6 (210Pb-1963)-1963) 101 � 23 (137Cs-1963) 12.7 � 3.9 (137Cs-1963)) 125 � 11 (210Pb-1963) 16.5 � 1.3 (210Pb-1963)

Fig. 2. Percent TOC, TN, and C:N ratios at the two sites in Port Aransas, Texas (USA), at harbor island and Mud island.
T.S. Bianchi et al. / Estuarine, Coastal and Shelf Science 119 (2013) 7e16 11
surface sediments (Fig. 4). The lack of significant difference be-tween L8 and L6 values throughout the core depths suggests thatthe inputs of cinnamyl (p-coumaric and ferulic acid) phenols werenot a significant component of the total L8 in these soils. Similar tothe bulk TOC and TN values, the most significant depth change inL8 andL6 values, occurred post-1963. The highestL8 andL6 valueswere found in Mud Island (Marsh 1) soils at a depth of 10 cm; thelowest values were found at the Harbor Island (Mangrove 1)location.
Both indices of lignin decay [(Ad/Al)v, P/(V þ S)], showed sig-nificantly less variability than %TOC, %TN, d13C, d15N, L8, and L6,from the bottom to surface soils in all cores at the study sites(Fig. 5). The ranges of the (Ad/Al)v and P/(V þ S) indices were from0.1 to 0.6 and 0.1 to 0.5, respectively. The highest values of (Ad/Al)voccurred at 30 cm at the Harbor Island (Mangrove 1) site. Thehighest values of P/(V þ S) occurred at Harbor Island (Mangrove 1),Harbor Island (Mangrove 2) and Mud Island (Mangrove 1) withsubsurface peaks at 15, 40, and 70 cm, respectively. C/V and SVratios were relatively stable throughout all cores (Fig. 6). However,sub-surface peaks in C/V ratios may suggest that there was moreloss of cinnamyl phenols relative to vanillyl over time compared tosyringyl phenols. In fact, the most significant decrease in C/V ratioswas observed post-1963 at the Mud Island (Marsh 2) site (Fig. 6).Historical changes in carbon and lignin pools over the past 120years in Mud Island soils, showed that there has been a significantly
Fig. 3. Stable isotopic values of d13C and d15N of all soil samples at the tw
greater increase in both of these pools at the mangrove site com-pared to the marsh site (Fig. 7).
3.5. Aerial imagery
Both average mangrove and salt marsh vegetation coverincreased between 1951 and 1967, in the 10 m area surroundingeach core location (Fig. 8). Unvegetated cover types (open waterand salt flat) decreased in this time period, apparently due to large-scale geomorphic alteration in the back-barrier island environment.In the Mud Island area, the formerly aquatic substrate appeared toraise in elevation, possibly due to sediment overwash driven bya Category 4 hurricane at landfall, Hurricane Carla in 1961. In theHarbor Island area, the former salt flat appeared to have dropped inrelative elevation, allowing wetland migration onto the formersurface, following a common trend seen throughout the TexasCoastal Bend area during this time period (White et al., 2006).
However between 1967 and 2008, the mangrove and marshcore locations diverged. The Harbor Island Mangrove 1 and 2 lo-cations and the Mud Island Mangrove 1 and 2 locations sawexpansion of mangrove cover to 100% of the 10 m buffers. The MudIsland Marsh 1 and 2 saw marsh continue to expand, with littlemangroves in the 10 m buffers by 2008. On average across all of thestudy locations, mangrove cover continued to expand, while saltmarsh cover decreased (Fig. 8d).
o sites in Port Aransas, Texas (USA), at harbor island and Mud island.
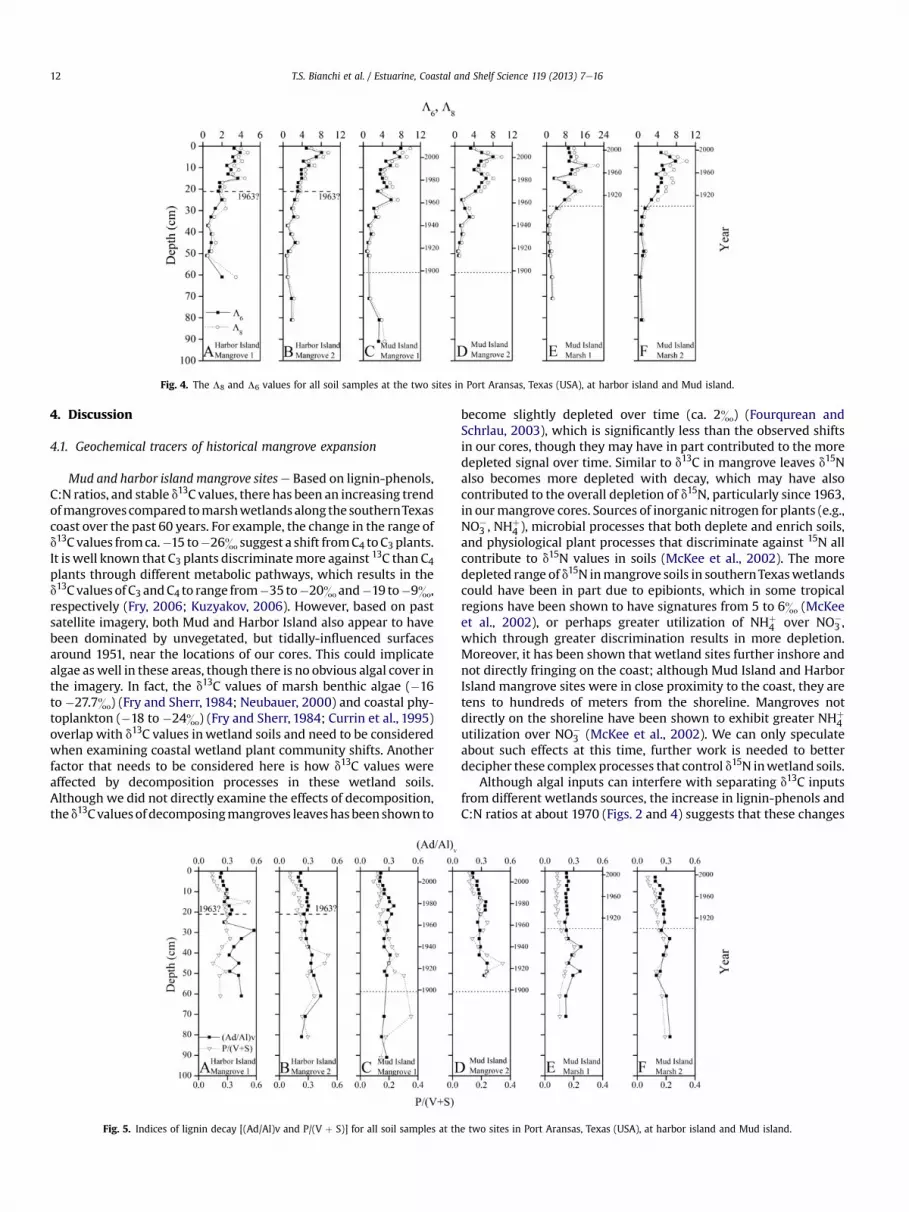
Fig. 4. The L8 and L6 values for all soil samples at the two sites in Port Aransas, Texas (USA), at harbor island and Mud island.
T.S. Bianchi et al. / Estuarine, Coastal and Shelf Science 119 (2013) 7e1612
4. Discussion
4.1. Geochemical tracers of historical mangrove expansion
Mud and harbor island mangrove sitese Based on lignin-phenols,C:N ratios, and stable d13C values, there has been an increasing trendofmangroves compared tomarshwetlandsalong the southernTexascoast over the past 60 years. For example, the change in the range ofd13C values fromca.�15 to�26& suggest a shift fromC4 toC3 plants.It is well known that C3 plants discriminatemore against 13C than C4plants through different metabolic pathways, which results in thed13C values of C3 andC4 to range from�35 to�20& and�19 to�9&,respectively (Fry, 2006; Kuzyakov, 2006). However, based on pastsatellite imagery, both Mud and Harbor Island also appear to havebeen dominated by unvegetated, but tidally-influenced surfacesaround 1951, near the locations of our cores. This could implicatealgae aswell in these areas, though there is no obvious algal cover inthe imagery. In fact, the d13C values of marsh benthic algae (�16to �27.7&) (Fry and Sherr, 1984; Neubauer, 2000) and coastal phy-toplankton (�18 to �24&) (Fry and Sherr, 1984; Currin et al., 1995)overlap with d13C values inwetland soils and need to be consideredwhen examining coastal wetland plant community shifts. Anotherfactor that needs to be considered here is how d13C values wereaffected by decomposition processes in these wetland soils.Although we did not directly examine the effects of decomposition,the d13Cvaluesof decomposingmangroves leaveshasbeen shownto
Fig. 5. Indices of lignin decay [(Ad/Al)v and P/(V þ S)] for all soil samples at th
become slightly depleted over time (ca. 2&) (Fourqurean andSchrlau, 2003), which is significantly less than the observed shiftsin our cores, though they may have in part contributed to the moredepleted signal over time. Similar to d13C in mangrove leaves d15Nalso becomes more depleted with decay, which may have alsocontributed to the overall depletion of d15N, particularly since 1963,in ourmangrove cores. Sources of inorganic nitrogen for plants (e.g.,NO�
3 , NHþ4 ), microbial processes that both deplete and enrich soils,
and physiological plant processes that discriminate against 15N allcontribute to d15N values in soils (McKee et al., 2002). The moredepleted range of d15N inmangrove soils in southernTexaswetlandscould have been in part due to epibionts, which in some tropicalregions have been shown to have signatures from 5 to 6& (McKeeet al., 2002), or perhaps greater utilization of NHþ
4 over NO�3 ,
which through greater discrimination results in more depletion.Moreover, it has been shown that wetland sites further inshore andnot directly fringing on the coast; although Mud Island and HarborIsland mangrove sites were in close proximity to the coast, they aretens to hundreds of meters from the shoreline. Mangroves notdirectly on the shoreline have been shown to exhibit greater NHþ
4utilization over NO�
3 (McKee et al., 2002). We can only speculateabout such effects at this time, further work is needed to betterdecipher these complex processes that control d15N inwetland soils.
Although algal inputs can interfere with separating d13C inputsfrom different wetlands sources, the increase in lignin-phenols andC:N ratios at about 1970 (Figs. 2 and 4) suggests that these changes
e two sites in Port Aransas, Texas (USA), at harbor island and Mud island.
Fig. 6. Cinnamyl/vanillyl (C/V) and syringyl/vanillyl (S/V) ratios for all soil samples at the two sites in Port Aransas, Texas (USA), at harbor island and Mud island.
T.S. Bianchi et al. / Estuarine, Coastal and Shelf Science 119 (2013) 7e16 13
in d13C values were due to vascular plant changes, as well aschanges from earlier unvegetated algal sources e as mentionedearlier. Moreover, the range of d13C in our surface soils are withinthe range expected for Avicennia germinans trees that are aroundwith 1e2 m in height; this is based on the strong positiverelationship (r ¼ 0.90, P < 0.01) between plant height and d13Cvalues in mangrove leaves (Lin and Sternberg, 1992). Themuch taller A. germinans (ca. 6 m) have d13C values that areapproximately �28&. However, the C:N ratios in soils from themangroves sites were significantly lower than the C:N ratio ofA. germinans leaf litter (53) (Dittmar et al., 2001). Nevertheless, weexpect an even more dramatic effect on carbon dynamics frommore mature forests, these trees have only colonized and reachedmaturity in the last 23e29 years, since the freezes in the 1980’skilled many of these Texas mangroves.
4.2. Carbon decay dynamics
The lower than expected C:N ratios in themangrove soils atMudand Harbor Islands was likely due to selective loss of carbon due toleaching/remineralization. The stabilization of C:N ratios in deeperhorizons of soils suggest that much of the loss of both carbon andnitrogen occurs in the early stages of digenesis in surface souls. Thissame pattern was shown for mangrove soils in Furo do Meio, CaeteEstuary, Brazil (Dittmar et al., 2001). Here, they suggested that tohave such low C:N ratios, it is necessary to have an estimated lossof w75% carbon from leaf litter due to leaching and/or
Fig. 7. Historical changes in carbon and lignin poo
remineralization in surface soils. Similar to what was found in theCaete Estuary, Brazil, the low C:N ratios also indicate that thecontribution of woody material to the overall biomarker and stableisotopic signatures was minimal. Other edaphic parameters (e.g.,Eh, pH, elevation, and salinity) measured at the Mud and HarborIsland mangroves sites were also shown to be conducive toenhanced remineralization of OC in these soils (Comeaux et al.,2012). The higher elevation, greater exchange of oxygen (viadrainage and pneumatophores), higher pH and redox suggest thatthe surface soils of mangroves could at times have greater carbonturnover than in marshes. Although mangroves are generally lowerin elevation than marshes (Rogers et al., 2005; Krauss et al., 2008)particularly in areas where they overlap, and that marshes aregenerally turning carbon over faster through a seasonal cycle themangrove sites did have higher carbon sequestration rates com-pared to marshes on Mud Island. This fits with new results thatshow mangroves as important global sites for carbon storage e
containing an estimated 1023 Mg C ha�1 (Donato et al., 2011).Relatively stable profiles of P/(V þ S) and (Ad/Al)v ratios in soils
at the mangrove sites indicated that lignin was primarily decom-posed via aromatic ring cleavage. Lignin decay usually occurs bypropyl side-chain oxidation and/or demethylation of methoxylgroups (Bianchi and Canuel, 2011, and references therein). How-ever, based on the stable profiles of P/(V þ S) (an indicator ofdemethylation) and (Ad/Al)v ratios it appears that aromatic ringcleavage was the primary means by which lignin was degraded inthese soils; this also agrees with what was found at Caete Estuary,
ls over the past 120 years in Mud island soils.
Fig. 8. Historical changes in vegetation percent cover at harbor island and Mud island in 1951, 1967, and 1981 based on satellite imagery.
T.S. Bianchi et al. / Estuarine, Coastal and Shelf Science 119 (2013) 7e1614
Brazil (Dittmar et al., 2001). The greater decreases in C/V relative toS/V ratios post-1963, also agrees with trends found in mangrovesoils at Caete Estuary, Brazil (Dittmar et al., 2001). This suggests thatthe more labile cinnamyl phenols, compared to syringyl and van-niyl phenols, resulted in selective loss of cinnamyl phenols. Cin-namyl phenols are more labile because of their ester-bound linkagein lignin and common association with carbohydrates (Hartley,1973; Kirk et al., 1980; Bianchi et al., 2002). The lack of a signifi-cant difference in the L8 and L6 profiles also supports that cin-namyl phenols did not contribute significantly to the total ligninpool. Therefore, as mentioned earlier, while there may have beensome leaching/remineralization of other carbon pools in thesessoils, lignin seemed to be relatively stable.
Mud Island marsh sites e The post-1970 mean d13C values inmarsh site soils were significantly more enriched than all othermangrove sites, except between Mud Island (Marsh 1) and HarborIsland (Mangrove 1). The more enriched signal in marsh soils isexpected considering that Spartina alterniflora litter typically hasa d13C of ca. �13.6 to �13.1& (Ember et al., 1987; Yang et al., 2010).The fact that the marsh sites do not have a more distinct biomarkerand stable isotopic signature is likely due to the proximity thatmangroves were growing in and around these sites. In fact, theMudIslandMarsh 1 and 2 sites arewithin 60m of the nearbyMud IslandMangrove 1 and 2 sites. Multiple mangrove trees were growingwithin the 10 m buffer of the Marsh 1 and 2 core locations in someyears that we inspected. This proximity of the two vegetation typesmay lead to a biomarker-averaging of the litter deposited onto thesoil surface in this aquatic environment. Moreover, it is also quitepossible that theseMarsh1 and 2 sites had already been occupied bymangroves at various times in the past; in fact, the aerial imageanalysis details that both of these 10mbuffers hadmoremangrovesin 1967 than they do today. Patterns in the lignin biomarker indiceswere also very similar between marsh and mangroves sites. Onceagain, this reflects relict inputs from mangroves material, however,similar decay dynamic of lignin [e.g., P/(V þ S) and (Ad/Al)v ratios]have shown similar patterns in S. alterniflora marshes that havenever been previously occupied by mangroves (Benner et al., 1991).
The highest soil OC content was found at the Mud Island Marsh2 site, which was not consistent with the Marsh 1 core. This Marsh2 location also had the highest percentage cover of marsh at the1951 and 1967 date of imagery analysis, and only recently showeda rapid drop in d13C after the 137Cs peak after 1963, indicating thatthis core location may have been the most marsh-like over thehistorical time period. The Marsh 1 location more closely tracks thevarious mangrove core locations in each of these parameters. Manywetland soils have considerable heterogeneity in soil properties, asreflected in these differences. While mangroves were shown to
actually sequester more carbon than marshes in this study (seenext section), some marshes have been shown to more effective instoring carbon through the association of macroaggregates (Zhanget al., 2010). This work showed that the highest carbon accumu-lation rate of 64.1 C kg�1 soil y�1 in a Spartina alternifloramarshwasassociatedwithmacroaggregates. It is important to also note that inmany cases there is more below-ground than above-ground bio-mass in salt marshes (Schubauer and Hopkinson, 1984). Althoughthis paper is focused on the expansion of mangroves over marshes,there are many coastal regions that have had S. alterniflora intro-duced to rapidly replace other native C3 species (e.g., Suaeda salsa),so S. alterniflora can also considered to be an invasive halophyte inother coastal regions (Zhang et al., 2010).
4.3. Carbon accumulation and sequestration rates
Significantly higher carbon sequestration inmangrove comparedto marsh sites onMud Island, are consistent with the recent reportsonblue carbon sinks,which showthatmangroves storemorecarbonthanmarshes onaglobal scale (Cai, 2011;Donato et al., 2011;Murrayet al., 2011;McLeodet al., 2011;Hopkinsonet al., 2012). Although thesoil carbonpools in these twowetlandhabitats canbe quite variable,however, the real difference in carbon sequestration between thesetwo habitats is found when factoring in the amount of living bio-mass. For example, the living biomass of estuarine mangrovessequester 237e563 tonnes CO2 e ha�1 compared to only 12e60 tonnes CO2 e ha�1for marshes (Murray et al., 2011). This is alsoconsistent with earlier work that showed the typical standing cropof biomass for marshes andmangroves are 500 to 200 g dry wt m�2
(Day et al., 1989) and 10,000 to 40,000 g dry wt m�2 (Twilley et al.,1992), respectively. The range of carbon sequestration ratesfor mangrove (253e270 g C m�2 yr�1) and marsh (101e125 g C m�2 yr�1) soils at Mud Island was within the mid-rangeobserved (25e504 g C m�2 yr�1) for a broad spectrum of isolateddepressional and/or forested freshwater wetlands reported byBernal and Mitsch (2012).
When examining the historical changes in carbon and ligninpools over the past 110 years in Mud Island soils, it is clear thatthere has been a significantly greater increase in both of these poolsat the mangrove site compared to the marsh site (Fig. 7). Whilesome of this up-core increase in the bulk carbon pool is related todiagenetic loss at the deeper depths, as mentioned earlier (e.g.,leaching/remineralization), the aforementioned discussion on lig-nin decay proxies indicate that much of the change is more likelydue to the buildeup of a changing source of lignin-containingmaterial (e.g., mangrove). If we accept that this greater increasein the Mud Island Mangrove core was due to mostly the changing

T.S. Bianchi et al. / Estuarine, Coastal and Shelf Science 119 (2013) 7e16 15
inputs of mangrove material over older marsh deposits, we see thelargest increase occurring post-1970 to present. This is also sup-ported by the most dramatic changes in d13C, L8, and L6, whichsupport a change in plant source inputs from a C3 to C4 over thistime period.
4.4. Implications of climate change and changing wetlands
Recent work (Comeaux et al., 2012) along with the results fromthis study, suggested that the mangroves which have replacedmarshes over the past ca. 100 years on portions of the lower Texascoast, have higher carbon sequestration rates and have increasedaccretion rates of coastal wetlands during this timeframe. Thehigher accretion rates in mangroves, may serve as more efficientbarrier to RSL and hurricane events along the Texas coast (Comeauxet al., 2012). If the conversion of marshes tomangroves continues toexpand further up the coast and into the central northern Gulfcoastline of Louisiana, where 40% of the nation’s coastal wetlandsreside, the consequences of greater carbon sequestration may bequite serious. Recent work has shown that there has been expan-sion Avicennia germinans over Spartina alterniflora in certain re-gions of coastal Louisiana since the 1980s (Perry and Mendelssohn,2009).
On the basis that visual and geochemical data support thatmangroves have replaced marshes in these regions (Fig. 8), we canmake some estimates on projected carbon storage changes forcoastal wetlands in the Gulf of Mexico. If we were to take all of thecoastal marshes (which would include Spartina alternifloramarshes) in the Gulf of Mexico, which comprise an area ofapproximately 2.5 million acres (EPA, 1992; USFWS, 2011), andreplace them with Avicennia germinans we could estimate thechange carbon sequestration rates that might occur over time. Ofcourse, this would assume that all A. germinans over S. alterniflorahave similar carbon sequestration rates that have been measuredhere, and that Spartina patens and Juncus spp. or other species arenot part of the equation. The result would be a net increase of1.29 � 0.32 Tg C yr�1 in current carbon sequestration. This repre-sents about 1% of all the carbon buried by all the “blue carbon” onthe planet (100 Tg C yr�1) (Hopkinson et al., 2012, and referencestherein). The additional accretion afforded by A. germinans, againassuming that our data is extrapolated to the entire Gulf, wouldfurther alter this summary change. The final result of such a sce-nario could be a net increase of 129 � 45 Tg C in 100 years. Con-sidering the loss of blue carbon habitats around the globe at ratesthat vary from 0.7 to 7% annually (Hopkinson et al., 2012, and ref-erences therein), such changes here in the Gulf and other possibleregions where such changes may occur, may prove to have anameliorating effect on regional atmospheric CO2 increases andemphasize the importance of preserving and restoring blue carbonenvironments.
5. Conclusions
1. Based on lignin-phenols, C:N ratios, and stable d13C values,there has been an increasing trend of mangroves compared tomarsh wetlands along the southern Texas coast over the past60 years. These trends have important implications for howcarbon is stored and sequestered in this region. It also impactsthe effectiveness of wetlands as buffer zones for protectionfrom storms because changing frommarshes to mangroves notonly changes the infrastructure to a woodland system but alsoraises the surface topography of the wetland which shouldenhance protection from storms.
2. While there may have been some leaching/remineralization ofother carbon pools in theses soils, lignin seemed to be relatively
stable during these vegetation changes over the observed timeperiod. The higher percentage of lignin associated with woodymaterials in a mangrove versus a marsh wetland should slowdown the overall decay dynamics on decadal to centennialscales. This is important in terms of the overall stability andresidence time of stored carbon in these soils.
3. Significantly higher carbon sequestration in mangrove com-pared to marsh sites on Mud Island, are consistent with therecent reports on blue carbon sinks, which show that man-groves store more carbon than marshes on a global scale.Higher carbon sequestration, greater lignin inventories, andhigher wetland surface topography will stabilize the rates oforganic carbon turnover in these coastal regions of the Gulf ofMexico. Future work on changes in the overall sequestration ofCO2 on a regional scale is needed to further verify that suchcoastal margin changes are impacting local CO2 fluxes.
4. If regional changes in the Gulf of Mexico are to persist andmuch of the marsh vegetation was to be replaced by man-groves, there would be a significant increase in the overallstorage and sequestration of carbon in the coastal zone. If suchchanges were shown to be impacting local CO2 fluxes in theGulf, this could provide evidence for further management oflocal wetlands that could result in new mangrove plantingprograms to increase the rate of mangrove tomarsh conversionand to change the value of the land in terms of carbon tradingunits.
Acknowledgments
This work was supported by the Department of Energy, NationalInstitute for Climatic Change Research (NICCR) on a grant to MAAand TSB. X. Li and J. Zhao would like to acknowledge the ChineseScholarship Council for the support. We thank Richard smith forassistance with laboratory analyses. R. Wasantha Kulawardhanaacknowledges support from the Tom Slick Fellowship, Texas A&MUniversity.
References
Allen, C.D., Breshears, D.D., 1998. Drought-induced shift of a forest/woodland eco-tone: rapid landscape response to climate variation. Proceedings of the NationalAcademy of Sciences 95, 14,839e14,842.
Allison, M.A., Bianchi, T.S., McKee, B.A., Sampere, T.P., 2007. Carbon burial on river-dominated continental shelves: impact of historical changes in sedimentloading adjacent to the Mississippi River. Geophysical Research Letters 34,L01606.
Benner, R., Fogel, M.L., Sprague, E.K., 1991. Diagenesis of belowground biomass ofSpartina alterniflora in salt-marsh sediments. Limnology and Oceanography 36,1358e1374.
Bernal, B., Mitsch, W.J., 2008. A comparison of soil carbon pools and profiles inwetlands in Costa Rica and Ohio. Ecological Engineering 34 (4), 311e323.
Bernal, B., Mitsch, W.J., 2012. Comparing carbon sequestration in temperate fresh-water wetland communities. Global Change Biology 18, 1636e1647.
Bianchi, T.S.,Mitra, S.,McKee, B.A., 2002. Sources of terrestrially-derived carbon in theLower Mississippi River and Louisiana shelf: Implications for differential sed-imentation and transport at the coastal margin. Marine Chemistry 77, 211e223.
Bianchi, T.S., Cannuel, E.A., 2011. Chemical Biomarkers in Aquatic Ecosystems.Princeton University Press, p. 396.
Buskey, E.J., Montagna, P.A., Amos, A.F., Whitledge, T.E., 1997. Disruption of grazerpopulations as a contributing factor to the initiation of the Texas brown tidealgal bloom. Limnology and Oceanography 42, 1215e1222.
Cai, W.J., 2011. Estuarine and coastal ocean carbon paradox: CO2 sinks or sites ofterrestrial carbon incineration? Annual Reviews of Marine Science 3, 123e145.
Chmura, G.L., Anisfeld, S.C., Cahoon, D.R., Lynch, J.C., 2003. Global carbon seques-tration in tidal, saline wetland soils. Global Biogeochemical Cycles 17, 1111.
Chmura, G.L., Kosters, E.C., 1994. Storm deposition and 137Cs accumulation in fine-grained marsh sediments of the Mississippi Delta Plain. Estuarine and CoastalShelf Science 39, 33e44.
Comeaux, R.S., Allison, M.A., Bianchi, T.S., 2012. Mangrove expansion in the Gulf ofMexico with climate change: implications for wetland health and resistance torising sea levels. Estuarine and Coastal Shelf Science 96, 81e95.
Coplen, T.B., 1996. More uncertainty than necessary. Paleoceanography 11, 369e370.
T.S. Bianchi et al. / Estuarine, Coastal and Shelf Science 119 (2013) 7e1616
Currin, C.A., Newell, S.Y., Paerl, H.W., 1995. The role of standing dead Spartinaalterniflora and benthic microalgae in salt marsh food webs: considerationsbased on multiple stable isotope analysis. Marine Ecology Progress Series 121,99e116.
Day, J., Hall, C.S., Kemp, W.M., Yanez-Arancibia, A., 1989. Estuarine Ecology. John-Wiley, New York.
Dittmar, T., Lara, R.J., Kattner, G., 2001. River or Mangrove? Tracing major organicmatter sources in tropical Brazilian coastal waters. Marine Chemistry 73,253e271.
Donato, D.C., Kauffman, J.B., Murdiyarso, D., Kurnianto, K., Stidham, M.,Kanninen, M., 2011. Mangroves among the most carbon-rich forests in thetropics. Nature Geoscience 4, 293e297.
Duarte, C.M., Middelburg, J.J., Caracao, N., 2005. Major role of marine vegetation onthe oceanic carbon cycle. Biogeosciences 2, 1e8.
EPA, 1992. Status and Trends of Emergent and Submerged Vegetated Habitats in theGulf of Mexico, USA. United States Environmental Protection Agency (EPA). EPA800-R-92e003.
Ember, L.M., Williams, D.F., Morris, J.T., 1987. Processes that influence carbon iso-topic variations in salt marsh sediments. Marine Ecology Progress Series 36,33e42.
Everitt, J.H., Judd, F.W., 1989. Using remote sensing techniques to distinguish andmonitor black mangrove (Avicennia germinans). Journal of Coastal Research 5,737e745.
Everitt, J.H., Judd, F.W., Escobar, D.E., Davis, M.R., 1996. Integration of remote sensingand spatial information technologies for mapping black mangroves on theTexas Gulf Coast. Journal of Coastal Research 12, 64e69.
Fourqurean, J.W., Schrlau, J., 2003. Changes in nutrient content and stable isotoperatios of C and N during decomposition of seagrasses and mangrove leavesalong a nutrient availability gradient in Florida Bay, USA. Chemistry and Ecology19, 373e390.
Fry, B., 2006. Stable Isotope Ecology, first ed. Springer, Germany.Fry, B., Sherr, E.B., 1984. d13C measurements as indicators of carbon flow in marine
and freshwater ecosystems. Contributions in Marine Science 27, 13e47.Goni, M.A., Hedges, J.I., 1992. Lignin dimers: structures, distribution and potential
geochemical applications. Geochimica et Cosmochimica Acta 56, 4025e4043.Hartley, R.D., 1973. Carbohydrate esters of ferulic acid as components of cell walls of
Lolium multiflorum. Phytochemistry 12, 661e667.Hedges, J.I., Clark, W.A., Cowie, G.L., 1988. Organic matter sources to the water
column and surficial sediments of a marine bay. Limnology and Oceanography33, 1116e1136.
Hedges, J.I., Ertel, J.R., 1982. Characterization of lignin by gas capillary chromatog-raphy of cupric oxide oxidation products. Analytical Chemistry 54, 174e178.
Hopkinson, C.S., Cai, W., Hu, A., 2012. Carbon sequestration in wetland dominatedcoastal systems - a global sink of rapidly diminishing magnitude. CurrentOpinions in Environmental Sustainability 4, 1e9.
IPCC Climate Change, 2007. In: Pachauri, R.K., Reisinger, A. (Eds.), Synthesis Report2007. Contribution of Working Groups I, II and III to the Fourth AssessmentReport of the Intergovernmental Panel on ClimatecChange. IPCC, Geneva,Switzerland, p. 104.
Kirk, T.K., Higuchi, T., Chang, H., 1980. Lignin biodegradation: summary and per-spectives. In: Lignin Biodegradation: Microbiology, Chemistry and PotentialApplications. CRC Press, Boca Raton, Florida, pp. 235e244.
Krauss, K.W., Lovelock, C.E., McKee, K.L., López-Hoffman, L., Ewe, S.M.L., Sousa, W.P.,2008. Environmental drivers in mangrove establishment and early develop-ment: a review. Aquatic Botany 89, 105e127.
Kuzyakov, Y., 2006. Sources of CO2 efflux from soil and review of partitioningmethods. Soil Biology and Biochemistry 38, 425e448.
Lin, G., Sternberg, L., 1992. Effect of growth form, salinity, nutrient and sulfide onphotosynthesis, carbon isotope discrimination and growth of red mangrove(Rhizophora mangle). Australian Journal of Plant Physiology 19, 509e517.
Lopez-Portillo, J., Ezcurra, E., 1989. Response of three mangroves to salinity in twoGeoforms. Functional Ecology 3, 355e361.
McKee, K.L., Feller, I.C., Popp, M., Wanek, W., 2002. Mangrove isotopic (d15N andd13C) fractionation across a nitrogen vs. phosphorus limitation gradient. Ecol-ogy 83, 1065e1075.
McKee, K.L., Rooth, J.E., 2008. Where temperate meets tropical: multifactorial ef-fects of elevated CO2, nitrogen enrichment and competition on a mangrove-saltmarsh community. Global Change Biology 14, 971e984.
McLeod, E., Chmura, G.L., Bouillon, S., Salm, R., Björk, M., Duarte, C.M., Lovelock, C.E.,Schlesinger, W.H., Silliman, B.R., 2011. A blueprint for blue carbon: toward animproved understanding of the role of vegetated coastal habitats in seques-tering CO2. Frontiers in Ecology and the Environment. http://dx.doi.org/10.1890/110004.
McMillan, C., Sherrod, C.L., 1986. The chilling tolerance of black mangrove, Avicenniagerminans, from the Gulf of Mexico coast of Texas, Louisiana and Florida.Contributions in Marine Science 29, 9e16.
Murray, B.C., Pendleton, L., Jenkins, W.A., Sifleet, S., 2011. Green Payments for BlueCarbon: Economic Incentives for Protecting Threatened Coastal Habitats. ReportNI R 11e04. Nicholas Institute for Environmental Policy Solutions, Duke Uni-versity, North Carolina, USA.
Neubauer, S.C., 2000. Carbon dynamics in a tidal freshwater marsh. Ph.D. dis-sertation, School of Marine Science, The College of William and Mary.
Nittrouer, C.A., Sternberg, R.W., 1981. The formation of sedimentary strata in anallochthonous shelf environment: the Washington Continental Shelf. MarineGeology 42, 201e232.
Patterson, C.S., Mendelssohn, I.A., 1991. A comparison of physicochemical variablesacross plant zones in a mangal/salt marsh community in Louisiana. Wetlands11, 139e161.
Perry, C.L., Mendelssohn, I.A., 2009. Ecosystem effects of expanding populations ofAvicennia germinans in a Louisiana salt marsh. Wetlands 29, 396e400.
Rogers, K., Saintilan, N., Heijnis, H., 2005. Mangrove encroachment of salt marsh inWestern Port Bay, Victoria: the role of sedimentation, subsidence, and sea levelrise. Estuaries 28, 551e559.
Ross, M.S., Meeder, J.F., Sah, J.P., Ruiz, P.L., Telesnicki, G.L., 2000. The Southeast SalineEverglades revisited: 50 years of coastal vegetation change. Journal of Vegeta-tion Science 11, 101e112.
Schubauer, J.P., Hopkinson, C.S., 1984. Above- and belowground production dy-namics of Spartina alterniflora and Spartina cynosuroides. Limnology and Oce-anography 29 (5), 1052e1065.
Sherrod, C.L., McMillan, C., 1981. Black mangrove, Avicennia germinans, in Texas:past and present distribution. Contributions in Marine Science 24, 115e131.
Sherrod, C.L., McMillan, C., 1985. The distributional history and ecology of mangrovevegetation along the northern Gulf of Mexico coastal region. Contributions inMarine Science 28, 129e140.
Stevens, P.W., Fox, S.L., Montague, C.L., 2006. The interplay between mangroves andsalt marshes at the transition between temperate and subtropical climate inFlorida. Wetlands Ecological Management 14, 435e444.
Twilley, R.R., Chen, R.H., Hargis, T., 1992. Carbon sinks in mangroves and their im-plications to carbon budget of tropical coastal ecosystems. Warer, Air and SoilPollution 64, 265e288.
US Fish and Wildlife Service (USFWS), 2011. Status and Trends of Wetlands in theConterminous United States 2004 to 2009. Report to Congress, September 2011.
van der Werf, G.R., Morton, D.C., DeFries, R.S., Olivier, J.G.J., Kasibhatla, P.S.,Jackson, R.B., Collatz, G.J., Randerson, J.T., 2009. CO2 emission from forest loss.Nature Geoscience 2, 737e738.
White, W.A., Tremblay, T.A., Waldinger, R.L., Calnan, T.R., 2006. Status and Trends ofWetlands and Aquatic Habitats on Texas Barrier Islands, Coastal Bend, Reportunder GLO contract 05e041 and NOAA Award NA04NOS4190058. Bureau ofEconomic Geology, University of Texas, Austin, Texas. http://www.cbbep.org/publications/virtuallibrary/BarrierWetlandsCoastalBend.pdf.
Williamson, G.J., Boggs, G.S., Bowman, D.M.J.S., 2010. Late 20th century mangroveencroachment in the coastal Australian monsoon tropics parallels the regionalincrease in woody biomass. Regional Environmental Change. http://dx.doi.org/10.1007/s10113-010-0109-5.
Yang, T., Khangaonkar, M., Calvi, K., Nelson, T., 2010. Evaluation of nonlinear cu-mulative effect of estuarine restoration projects using a three-dimensionalhydrodynamic model. Ecological Modeling 221, 969e977.
Zhang, Y., Ding, W., Luo, J., Donnison, T., 2010. Changes in soil organic carbon dy-namics in an Eastern Chinese coastal wetland following invasion by a C4 plantSpartina alterniflora. Soil Biology and Biochemistry 42, 1712e1720.


