Embed Size (px)
Citation preview

HIGHLIGHTS
KEY INDICATORSFOR ASIA AND THE PACIFIC
201142nd Edition

© 2011 Asian Development Bank
All rights reserved. Published in 2011.Printed in the Philippines.Publication Stock No. ARM113764
The views expressed in this publication do not necessarily reflect the views and policies of the Asian Development Bank (ADB) or its Board of Governors or the governments they represent.
By making any designation of or reference to a particular territory or geographic area, or by using the term “country” in this document, ADB does not intend to make any judgment as to the legal or other status of any territory or area.
ADB does not guarantee the accuracy of the data included in this publication and accepts no responsibility for any consequence of their use.
ADB encourages printing or copying information exclusively for personal and noncommercial use with proper acknowledgment of ADB. Users are restricted from reselling, redistributing, or creating derivative works for commercial purposes without the express, written consent of ADB.
Asian Development Bank6 ADB Avenue, Mandaluyong City1550 Metro Manila, PhilippinesTel +63 2 632 4444Fax +63 2 636 2444www.adb.org

1
Key Indicators for Asia and the Pacific 2011 HIGHLIGHTS
Highlights of Key Indicators for Asia and the Pacific 2011
The Key Indicators for Asia and the Pacific 2011 is the flagship annual statistical data book of the Asian Development Bank (ADB). It presents the latest available economic, financial, social, environmental, and Millennium Development Goals (MDG) indicators for regional members of ADB. Data are grouped under MDG and Regional Tables. Nontechnical explanations and brief analyses of the MDG achievements and economic, financial, social, and environmental developments are included. The regional tables are based largely on a comprehensive set of country tables. The country tables are not available in printed form but are available in CD-ROM and at ADB’s website. The special chapter in Key Indicators for Asia and the Pacific 2011 “Toward Higher Quality Employment in Asia” looks at the importance of growth of good quality (i.e., stable and well-paid) jobs. It identifies some of the major constraints and challenges that countries may face in improving and increasing the quality of employment and potential policies that can be used to resolve or mitigate some of these challenges.

2
Key Indicators for Asia and the Pacific 2011 HIGHLIGHTS
Part 1: Special Chapter
Toward Higher Quality Employment in Asia
The impressive economic growth experienced by developing Asia, which has been remarkably higher than in all other regions in recent decades, was accompanied by strong employment growth and poverty reduction. But behind this rosy picture is the daunting fact that the quality of jobs in Asia remains inadequate and that the region lags far behind more advanced economies in providing workers with higher quality employment. Middle-income economies that have successfully made the transition from traditional to modern economic sectors still pay low wages, while other economies have not yet completed, or in some cases even started, the transition. Uncertain incomes, poor environmental conditions, and mismatches between jobs and skills persist in the work place, creating inefficiencies that reduce social welfare and result in lower productivity. If left unremedied, these issues may ultimately impede economic growth as they can cause income inequality and lead to social tensions, thereby endangering the sustainability of growth. Improving the quality of employment is therefore a critical and necessary task for continuing progress toward sustainable and inclusive economic growth in Asia.
This special chapter emphasizes the crucial role of higher quality employment as the critical link between economic growth and poverty. The chapter details the importance of the quality of employment to social and economic outcomes, and examines patterns and trends in employment and the quality of employment in Asia. The chapter clarifies the current state of development and identifies which countries may face particular constraints or need further interventions to improve the quality of their employment. The chapter argues that active public intervention may be needed to enhance the quality of employment on a sustained basis. Such intervention may include opening the economy to trade and competition, facilitating migration of labor from rural to urban areas, developing skills and human capital through education and training, investing in innovation, strengthening the business climate with infrastructure and moderate regulation, and providing social protection.
Generating Higher Quality Employment in Asia Remains a Challenge
Asia’s remarkable 6.1% yearly growth in real gross domestic product per capita (in 2005 purchasing power parity terms) between 1990 and 2008 was led by the People’s Republic of China (9.1%), India (4.9%), and the Republic of Korea (4.6%). Structural transformation has led to a huge shift from employment in the lower productivity agriculture sector to the higher value-added industrial and services sectors (Figure 1).

3
Key Indicators for Asia and the Pacific 2011 HIGHLIGHTS
Special Chapter
However, the creation of higher quality employment, as proxied by the share of employers and salaried and wage workers in the number employed, remained stable and lackluster compared with that in other regions (Figure 2). While the share of informal work has decreased, it continues to comprise the majority of employment opportunities in many countries throughout developing Asia. This is a concern because, as shown in an examination of a select set of countries within Asia, informal workers are more vulnerable to poverty and have little or no social protection coverage compared with workers in the formal sector.
Policies for Generating Higher Quality Employment in Asia
Countries in Asia and the Pacific are at different stages of development and the structure of their labor markets, economic landscapes, and population growth are varied. Thus, they will each face a different set of constraints and challenges in generating higher
Figure 1 Distribution of Workers by Employment Status and by Geographical Region
OECD = Organisation for Economic Co-operation and Development.Sources: Staff estimates using interpolated data from ILO LABORSTA and ILO KILM, except
that NBS, CHIPS 1988, 1995, 2002 and Employment census 2004 and 2008 were used for the People's Republic of China and NSSO, NSS-EUS for India.
Figure 1 Distribution of Workers by Employment Status and by Geographical Region
68.9
17.2
30.2
13.9
67.0
12.1
33.4
8.3
0
20
40
60
80
Percentage of informal workers in total employment, by region,1990 and 2008
30.4
81.8
65.8
83.3
29.8
82.9
62.4
86.5
0
20
40
60
80
100
Percentage of salaried and wage workers in total employment,by region, 1990 and 2008
0.7 0.9
4.02.83.2
5.04.2
5.2
0
2
4
6
8
10
DevelopingAsia
DevelopingEurope
Latin Americaand the Caribbean
OECD
Percentage of employers in total employment, by region,1990 and 2008
1990 2008

4
Key Indicators for Asia and the Pacific 2011 HIGHLIGHTS
quality employment. Most policies and recommendations are intended to increase productivity, and hence, presumably, wages and working conditions, and there are various means by which these can be achieved. Because of the differences between countries, policies should be tailored to each one’s context.
Middle-income countries that have a sizable modern sector and are starting to face reduced surplus labor from the traditional sector may wish to consider the following:• They will need to continue to promote trade and foreign direct investment (FDI)
while devising ways to move up the value chain in the modern sector, focusing on more complex industrial products and services. This will create greater productivity growth so both wages and other employment benefits can rise.
• Moving up the value chain and into a more industrialized and service-oriented economy, however, will require a work force that has increasingly flexible skills and that brings innovative thinking to the table. Thus, building human capital through general and higher quality secondary and tertiary education will become crucial.
Figure 2 Distribution of Workers by Sector of Employment and by Geographical Region
OECD = Organisation for Economic Co-operation and Development.Sources: Staff estimates using interpolated data from ILO LABORSTA and ILO KILM, except
that NBS, CHIPS 1988, 1995, 2002 and employment census 2004 and 2008 were used for the People's Republic of China and NSSO, NSS-EUS for India.
Figure 2 Distribution of Workers by Sector of Employment and by Geographical Region
Percentage of agriculture employment in total employment, by region,1990 and 2008
Percentage of industry employment in total employment, by region,1990 and 2008
Percentage of services employment in total employment, by region,1990 and 2008
DevelopingAsia
DevelopingEurope
Latin Americaand the Caribbean
OECD
1990 2008
66.3
31.8
18.8
7.1
43.5
14.3 16.5
3.90
20
40
60
80
17.4
31.9
26.631.4
23.728.0
24.2 24.2
0
20
40
16.3
36.3
54.661.6
32.9
57.7 59.2
71.9
0
20
40
60
80
Perc
ent
Perc
ent
Perc
ent
Special Chapter

5
Key Indicators for Asia and the Pacific 2011 HIGHLIGHTS
• Rising incomes are often accompanied by highly unequal growth, therefore, the level and breadth of social protection coverage will have to be built up to ensure that worker’s conditions meet minimum standards and that social stability is maintained. This will require diversifying the types of social protection measures provided from basic health care into more varied products, such as pensions.
Low-income countries that have large traditional sectors, high rates of informal employment, and labor forces with low levels of education may need to consider the following:• By increasing trade and FDI in the modern sector, these economies can help
speed up the rate of structural transformation and create higher quality and more productive employment.
• By facilitating rural-to-urban migration, people from the rural sector may gain access to higher quality employment while the manufacturing sector can capitalize on lower labor cost.
• Productivity in rural areas needs to be improved, because the majority of workers will remain in the large traditional sector. This may be done by developing financial services, technological innovation, and infrastructure. Developing value-added manufacturing in the rural areas, using agricultural products as inputs, may be especially key to raising overall employment and income prospects for rural people.
• The large population that will remain informally employed could benefit from access to high quality technical and vocational education and training programs so they can develop specific skills and the human capital that will allow them to leverage their skills into higher incomes.
• Informal workers need to be provided with a basic level of social protection that is financially sustainable and can allow them to maintain a minimal level of welfare and protection against severe adverse shocks. Such social protection will enable workers to be more productive and resilient to unexpected downturns.
Generally, issues of demographics, labor legislation, and market competitiveness will need to be addressed.
Demographics will play a substantial challenge in moving toward higher quality employment.• Countries with an expanding labor force, and a large mass of youth reaching
working age, will need to increase the quantity of employment offered. Carefully targeting and training the youth so they have the skills and expectations that meet the labor market’s demands will be necessary to capitalize on this demographic dividend and to ensure that the youth immediately become productive members of the labor force.
• Countries with a contracting labor force—many people reaching retirement age and fewer youths entering the labor force—may need to reformulate the concept of what constitutes higher quality employment to entice the older population to
Special Chapter

6
Key Indicators for Asia and the Pacific 2011 HIGHLIGHTS
remain in the productive work force. This may require more flexible work hours and other nonpecuniary benefits.
• International migration, organized through regional cooperation, may offer a mechanism to balance the disequilibria between countries that have expanding labor forces and countries with increasing labor needs, often in specific skills areas.
Restrictive labor legislation can create disincentives for firms to enter the formal sector and may impede FDI and domestic investment. Relaxing and reforming such legislation so firms will enter the formal sector is crucial to their gaining greater access to capital so they can grow and take advantage of economies of scale, thus creating greater growth of employment in the modern sector.
Uncompetitive markets dominated by monopolists or oligopolists deter other firms from initiating or increasing production, reduce technological innovation, and lower productivity. Breaking monopolies and oligopolies and inducing competition into markets is especially crucial in countries with a highly skilled labor force and an excess supply of labor, which allows monopolists to fully capture gains from higher productivity while wages stagnate.
Many countries in developing Asia have made substantial progress in shifting their workers to higher quality employment. Much of the shift has been enabled by policies that have facilitated structural transformation without neglecting the welfare of the rural workers. With appropriate demand- and supply-side policies and some level of social protection, Asian countries can make substantial progress toward developing higher quality employment that will enable them to continue reducing poverty and achieving stable and inclusive economic growth.
Special Chapter

7
Key Indicators for Asia and the Pacific 2011 HIGHLIGHTS
Part II: Millennium Development Goals
A large majority of economies in Asia and the Pacific have made substantial progress in achieving most of the Millennium Development Goals (MDGs). This is an achievement in itself even though overall progress toward most of the targets continues to be mixed and uneven across countries, across goals, and within countries. Strong economic growth and rising household incomes in the region will allow most countries to meet the poverty target, with sharpest reductions in the People’s Republic of China. The region will contribute significantly to achieving the global poverty target. On the hunger target, while some progress has been made, most countries lag behind in achieving the target. Underweight prevalence in South Asia is highest in the world and almost twice as high as in Sub-Saharan Africa.
Substantial progress has also been made in achieving the targets for school enrollment, gender parity in education, and access to safe drinking water. International cooperation and sustained donor funding are halting and reversing the spread of HIV/AIDS, tuberculosis, and other diseases. But slow progress has been made in MDGs that require better quality of service delivery, such as keeping the children in school to complete a full course of primary education, reducing maternal and child mortality, and providing improved sanitation. Income disparities within countries may exacerbate the problems. For example, in South Asia, there has been no meaningful improvement among children in the poorest 20% of households while underweight prevalence has fallen by almost a third for children from the richest 20% of households. With 2015 approaching in less than 5 years, a lot needs to be done to promote inclusive growth, reduce disparities in income, and achieve health and hunger targets even in countries with high economic growth.
• MDG 1: Eradicate Extreme Poverty and HungerExtreme poverty declined substantially in the region and given current trends, 17 out of the 24 economies for which data are available are expected to achieve the poverty target by 2015. While this is a 70% success in terms of the number of countries, it is likely that both Bangladesh and India might miss the poverty target. Despite these gains, hunger is still widespread, with more than 40% of children in Bangladesh and India being underweight. Most economies are likely to miss the target of cutting the proportion of underweight children by half.
• MDG 2: Achieve Universal Primary EducationEnrollment ratios in primary schools are 95% or higher in 18 economies but in Nepal and Pakistan, the ratios are below 80%. Enrollment is only the first step to formal schooling and progress in completing a full course of primary school is slow in many economies. Only 13 are expected to meet the target—and Bangladesh, India, and Indonesia are among those making slow progress.

• MDG 3: Promote Gender Equality and Empower WomenMost economies have or are expected to reach the target of gender parity in both primary education (37 out of 43) and secondary education (33 out of 42). There is less success in tertiary education, nevertheless, 21 out of 35 economies have already achieved parity or are expected to do so by 2015. There are wide disparities in women’s and men’s access to wage employment outside agriculture, with particularly low rates in Afghanistan, Bangladesh, Bhutan, and India.
• MDG 4: Reduce Child MortalityGood progress has been achieved in reducing under-five child mortality rates, although in most economies, gains are not enough to meet the target of reducing the rates by two-thirds. Only 10 economies are likely to meet the target. Bangladesh has done best among the five most populous economies in reducing child mortality by 65%; the People’s Republic of China is next with a drop of 58%; followed by Indonesia, 55%; India, 45%; and Pakistan, 33%.
• MDG 5: Improve Maternal HealthProgress to reduce by three-quarters the maternal mortality ratio has seen some success but wide disparities remain. Only four economies, among them the People’s Republic of China, are expected to achieve the target. Twelve economies still have above 100 maternal deaths per 100,000 live births in contrast to often less than 10 per 100,000 live births in developed economies. The target to reduce by three-quarters the number of births not attended by a skilled health professional has been achieved by 11 economies, and five more are expected to do so. Others, including Bangladesh, India, and Pakistan are lagging.
• MDG 6: Combat HIV/AIDS, Malaria, and Other DiseasesHIV/AIDS is particularly a problem in Southeast Asia. There has been substantial improvement in providing access to antiretroviral treatment since 2004 but no economy has achieved universal access and only four economies had achieved 60% or better coverage by 2009. These included Thailand, which has the highest rate of HIV infection in the region, Cambodia, and the Lao People’s Democratic Republic.
• MDG 7: Ensure Environmental SustainabilityBetween 1990 and 2010, deforestation increased in several economies. On the other hand, percentages of land and marine areas protected to maintain biological diversity increased in almost all. Economies are having more success with providing improved drinking water than with improved sanitation. Improved sanitation is much less accessible in rural areas, and only 50% of the population in Asia and the Pacific uses improved sanitation facilities.
8
Key Indicators for Asia and the Pacific 2011 HIGHLIGHTS
Millennium Development Goals

• MDG 8: Develop a Global Partnership for DevelopmentIn most economies of the region, debt service as a percentage of exports of goods and services has fallen substantially. Fixed telephone line subscriptions have also grown along with enormous growth in cellular phone subscriptions. Internet use has grown considerably, but disparities between the rich and the poor economies are striking, with less than 10 users per 100 population in 17 economies, compared to 75 users per 100 population in Australia, Japan, New Zealand, and the Republic of Korea.
Part III: Region at a Glance
Throughout Asia and the Pacific, gross domestic product (GDP) growth in 2010 has recovered significantly after the economic downturn of 2008–2009. In current dollars, exports rebounded in 2010 after a sharp fall in 2009, migrants’ remittances have resumed their upward trend, the recent fall in foreign direct investment appears to have been halted, and international tourist arrivals have also risen sharply. There are fears that the recovery may stoke inflation as consumer prices generally edged up further in 2010 and food prices in many countries continued to rise faster than those of other items, increasing the vulnerability of the poor in these countries.
Although the recovery in 2010 demonstrates the resilience of Asia and the Pacific, the slow recovery in the industrial economies of North America and Europe may falter, affecting recovery in this region. Trade within the region is steadily growing but much of it is in parts and components: Europe and North America are still the main customers for the final output of factory Asia. Asia’s economic progress, however, comes at the cost of rising emissions of greenhouse gases and loss of forest cover in many countries, posing threats to environmentally sustainable growth.
• PeoplePopulation growth rates in most economies of Asia and the Pacific are declining, and the United Nations’ latest population projections indicate that the share of Asia and the Pacific in the global population will decline to 50% in 2050 from its present share of 56%. In most economies of the region, populations are still quite young with less than 15% aged 65 or over. But with the fall in birth rates, more than a fifth of the population could be 65 or over by 2050 in several economies. Measured by the Human Development Index, seven economies from the region including Australia, Japan, and New Zealand were among the “Very High Human Development” group, while another five were in the bottom group of “Low Human Development.”
9
Key Indicators for Asia and the Pacific 2011 HIGHLIGHTS

• Economy and Output Asia and the Pacific generated one-third of the global GDP (in purchasing power parity terms) in 2009, with the People’s Republic of China, Japan, and India, respectively the second, third, and fourth largest of the world’s economies. Since 2000, there has been considerable convergence of per capita GDP in Asia and the Pacific, although there are still some striking disparities across economies. In 2010, per capita GDP of Singapore—the richest country—was 45 times that of Nepal—the poorest. The year 2010 also saw a strong recovery in GDP growth throughout the region as developing Asian economies proved their resilience after the 2008–2009 crisis. In only four economies was growth of GDP slower in 2010 than in 2009. The unweighted average growth for 37 economies went up from 1.4% in 2009 to 5.9% in 2010.
• Money, Finance, and Prices Consumer prices edged up in 2010. In 2009, the simple average inflation rate for 43 economies was 4.1% and this rose to 4.8% in 2010. Overall, food prices continued to rise faster than those of other consumer items, affecting consumer purchasing power, especially that of the poor. Most Asian currencies appreciated sharply against the United States dollar in 2010, with an appreciation in excess of 5% in the currencies of more than 20 economies. This was in contrast to an equally sharp depreciation for most currencies in 2009.
• GlobalizationIntra-Asian exports accounted for nearly 54% of total exports of Asia and the Pacific in 2010. The 18% fall in the dollar value of all exports in 2009 was replaced by 30% growth in 2010 and all major exporters benefitted. Migrant workers’ remittances recovered in countries where they were affected by the economic crisis in 2009 and international tourist arrivals and tourism receipts have also rebounded.
• Transport, Electricity, and CommunicationsVehicle ownership is growing rapidly together with expansion of road networks in the region. Higher vehicle use comes with a cost and road accident deaths are rising in many economies, calling for action to make roads safer. Increasing industrialization and household electrification rates are leading to large increases in per capita electricity consumption, though wide disparities exist in per capita consumption between the rich and poor economies in the region.
10
Key Indicators for Asia and the Pacific 2011 HIGHLIGHTS
Region at a Glance
• Energy and Environment With one-third share in global GDP, Asia and the Pacific also uses over one-third of the world’s energy. In 2008, the People’s Republic of China consumed nearly half of Asia’s energy. Energy productivity continues to rise, and by 2008, most economies in the region were generating more GDP from a given input of energy than in 2000. Asia’s economic progress brings rising emissions of greenhouse gases. Since 2000, per capita emissions have risen in 16 of the 20 economies for which data are available.
• Government and Governance Fiscal balances improved in 2010 as economies throughout the region recovered from the financial crisis. Government spending on social security and welfare as a ratio to GDP has been rising in many economies, although in these economies, the ratios are still mostly below 3% and well short of the 8%–14% ratios in the developed economies of Australia, Japan, and New Zealand. The days needed to register a new business vary enormously within the region—from 1 day to more than 100 days. But in the last 5 years, most economies have managed to improve their business environment by shortening the registration process.
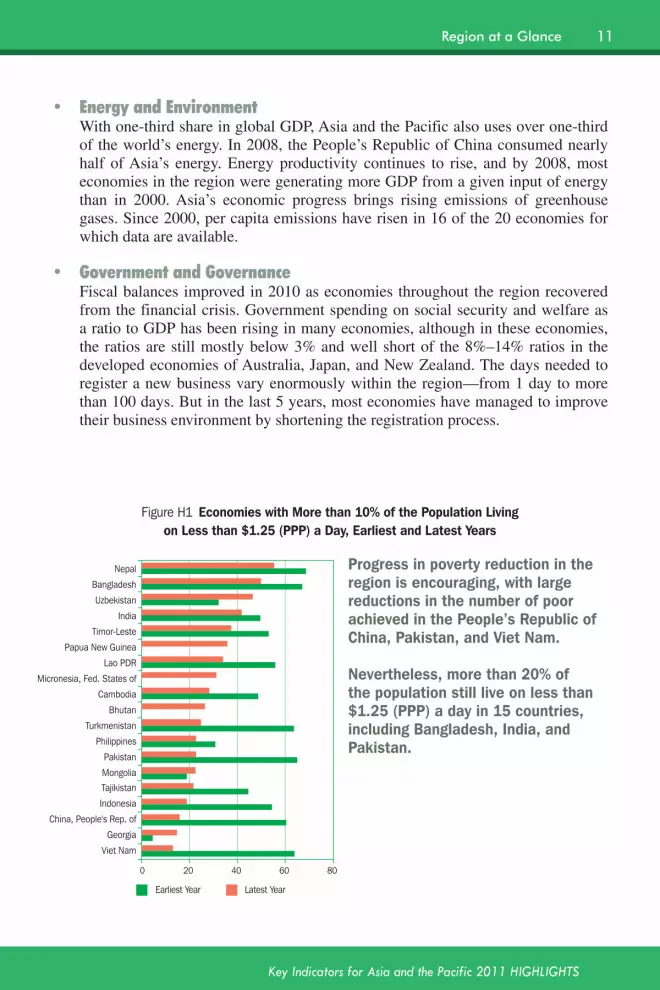
Figure H1 Economies with More than 10% of the Population Living on Less than $1.25 (PPP) a Day, Earliest and Latest Years
0 20 40 60 80
Viet Nam
Georgia
China, People's Rep. of
Indonesia
Tajikistan
Mongolia
Pakistan
Philippines
Turkmenistan
Bhutan
Cambodia
Micronesia, Fed. States of
Lao PDR
Papua New Guinea
Timor-Leste
India
Uzbekistan
Bangladesh
Nepal
Latest Year Earliest Year
Progress in poverty reduction in the region is encouraging, with large reductions in the number of poor achieved in the People’s Republic of China, Pakistan, and Viet Nam.
Nevertheless, more than 20% of the population still live on less than $1.25 (PPP) a day in 15 countries, including Bangladesh, India, and Pakistan.
11
Key Indicators for Asia and the Pacific 2011 HIGHLIGHTS
Region at a Glance
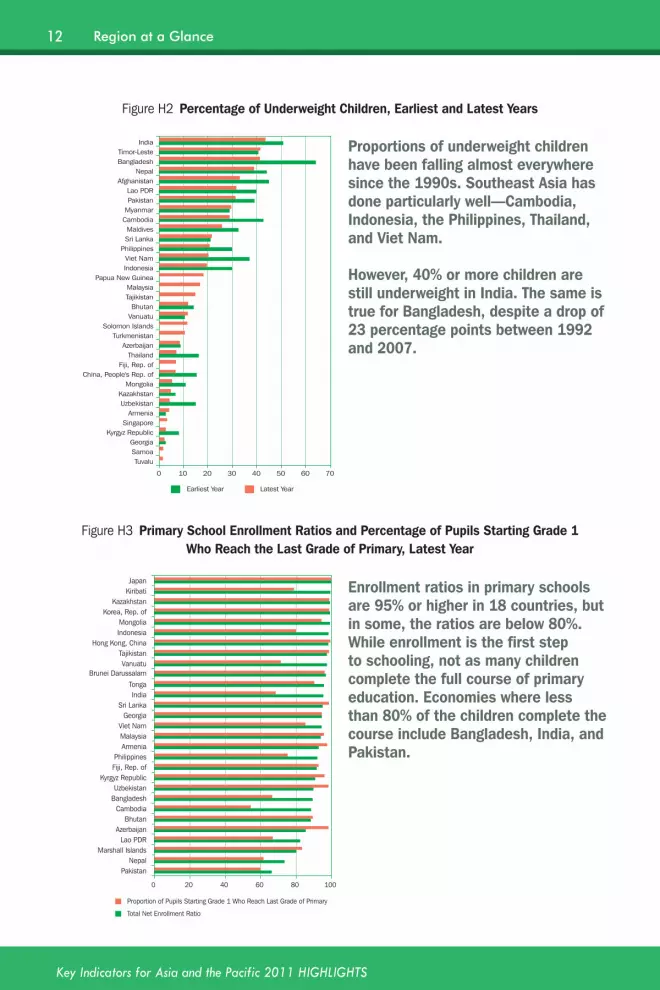
Figure H2 Percentage of Underweight Children, Earliest and Latest Years
0 10 20 30 40 50 60 70
Tuvalu Samoa Georgia
Kyrgyz Republic Singapore
Armenia Uzbekistan Kazakhstan
Mongolia China, People's Rep. of
Fiji, Rep. of Thailand
Azerbaijan Turkmenistan
Solomon Islands Vanuatu Bhutan
Tajikistan Malaysia
Papua New Guinea Indonesia Viet Nam
Philippines Sri Lanka Maldives
Cambodia Myanmar Pakistan Lao PDR
Afghanistan Nepal
Bangladesh Timor-Leste
India
Latest Year Earliest Year
Proportions of underweight children have been falling almost everywhere since the 1990s. Southeast Asia has done particularly well—Cambodia, Indonesia, the Philippines, Thailand, and Viet Nam.
However, 40% or more children are still underweight in India. The same is true for Bangladesh, despite a drop of 23 percentage points between 1992 and 2007.
Figure H3 Primary School Enrollment Ratios and Percentage of Pupils Starting Grade 1 Who Reach the Last Grade of Primary, Latest Year
0 20 40 60 80 100
Pakistan Nepal
Marshall Islands Lao PDR
Azerbaijan Bhutan
Cambodia Bangladesh Uzbekistan
Kyrgyz Republic Fiji, Rep. of Philippines
Armenia Malaysia Viet Nam
Georgia Sri Lanka
India Tonga
Brunei Darussalam Vanuatu
Tajikistan Hong Kong, China
Indonesia Mongolia
Korea, Rep. of Kazakhstan
Kiribati Japan
Proportion of Pupils Starting Grade 1 Who Reach Last Grade of Primary
Total Net Enrollment Ratio
Enrollment ratios in primary schools are 95% or higher in 18 countries, but in some, the ratios are below 80%. While enrollment is the first step to schooling, not as many children complete the full course of primary education. Economies where less than 80% of the children complete the course include Bangladesh, India, and Pakistan.
12
Key Indicators for Asia and the Pacific 2011 HIGHLIGHTS
Region at a Glance
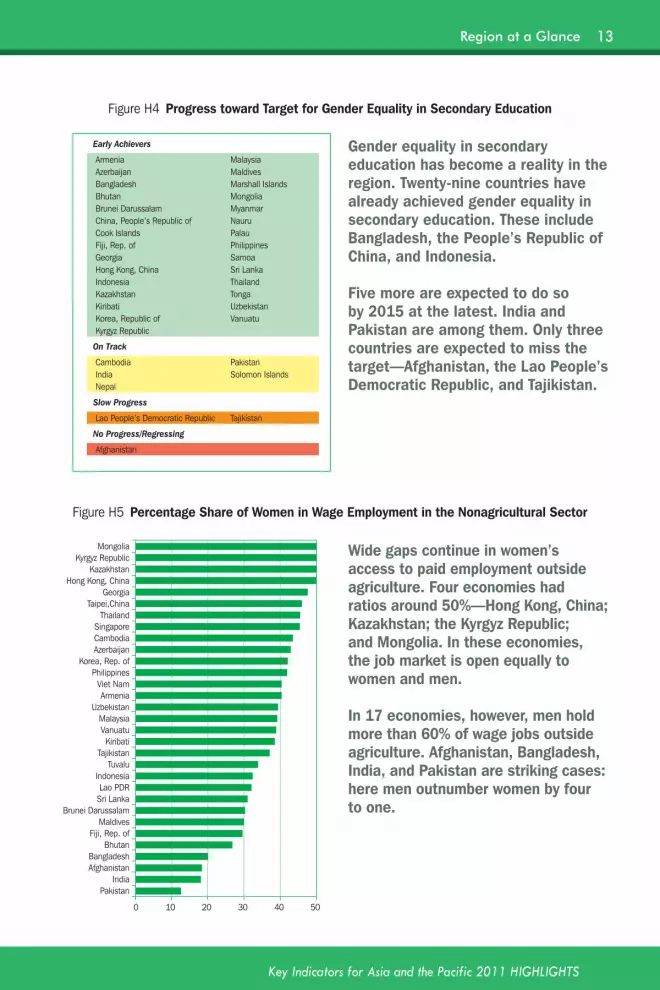
Figure H4 Progress toward Target for Gender Equality in Secondary Education
Gender equality in secondary education has become a reality in the region. Twenty-nine countries have already achieved gender equality in secondary education. These include Bangladesh, the People’s Republic of China, and Indonesia.
Five more are expected to do so by 2015 at the latest. India and Pakistan are among them. Only three countries are expected to miss the target—Afghanistan, the Lao People’s Democratic Republic, and Tajikistan.
Figure H5 Percentage Share of Women in Wage Employment in the Nonagricultural Sector
0 10 20 30 40 50
Pakistan India
Afghanistan Bangladesh
Bhutan Fiji, Rep. of
Maldives Brunei Darussalam
Sri Lanka Lao PDR
Indonesia Tuvalu
Tajikistan Kiribati
Vanuatu Malaysia
Uzbekistan Armenia
Viet Nam Philippines
Korea, Rep. of Azerbaijan Cambodia Singapore
Thailand Taipei,China
Georgia Hong Kong, China
Kazakhstan Kyrgyz Republic
Mongolia Wide gaps continue in women’s access to paid employment outside agriculture. Four economies had ratios around 50%—Hong Kong, China; Kazakhstan; the Kyrgyz Republic; and Mongolia. In these economies, the job market is open equally to women and men.
In 17 economies, however, men hold more than 60% of wage jobs outside agriculture. Afghanistan, Bangladesh, India, and Pakistan are striking cases: here men outnumber women by four to one.
Early Achievers
Armenia Malaysia Azerbaijan Maldives Bangladesh Marshall Islands Bhutan Mongolia Brunei Darussalam Myanmar China, People’s Republic of Nauru Cook Islands Palau Fiji, Rep. of Philippines Georgia Samoa Hong Kong, China Sri Lanka Indonesia Thailand Kazakhstan Tonga Kiribati Uzbekistan Korea, Republic of Vanuatu Kyrgyz Republic
On Track
Cambodia Pakistan India Solomon Islands Nepal
Slow Progress
Lao People’s Democratic Republic Tajikistan
No Progress/Regressing
Afghanistan
13
Key Indicators for Asia and the Pacific 2011 HIGHLIGHTS
Region at a Glance

Figure H6 Infant Mortality Rates, Highest and Lowest Wealth Quintiles
0 20 40 60 80 100 120
Maldives
Viet Nam
Philippines
Armenia
Azerbaijan
Uzbekistan
Indonesia
Timor-Leste
Bangladesh
Kazakhstan
Nepal
India
Kyrgyz Republic
Turkmenistan
Pakistan
Cambodia
Highest Quintile Lowest Quintile
In most developing economies, an infant’s chance of survival depends on the parents’ income. Only in the Maldives does family income seem not to matter greatly. Elsewhere, the risk of death is much higher for infants in poor families especially in Armenia, Cambodia, India, Indonesia, the Philippines, and Viet Nam, where they are more than twice as high.
Overall, the progress made so far means that nearly 6,000 fewer infants in the region are dying each day now compared with 1990.
Figure H7 Maternal Mortality Ratio, 1990 and 2008(deaths per 100,000 live births)
2008 1990
Hong Kong, China Taipei,China
Singapore Korea, Rep. of
Brunei Darussalam Fiji, Rep. of
Armenia Uzbekistan
Malaysia Maldives
Azerbaijan China, People's Rep. of
Sri Lanka Kazakhstan
Georgia Thailand
Viet Nam Tajikistan Mongolia
Turkmenistan Kyrgyz Republic
Philippines Solomon Islands
Bhutan India
Indonesia Myanmar
Papua New Guinea Pakistan
Cambodia Bangladesh Timor-Leste
Nepal Lao PDR
0 200 400 600 800 1,000 1,200
Maternal mortality ratios have declined substantially but are still unacceptably high in many economies. Afghanistan (not in the graph) and the Lao People’s Democratic Republic had ratios of 1,400 and 580, respectively. Ten others have rates between 100 and 580 in contrast to often less than 10 in developed economies.
14
Key Indicators for Asia and the Pacific 2011 HIGHLIGHTS
Region at a Glance
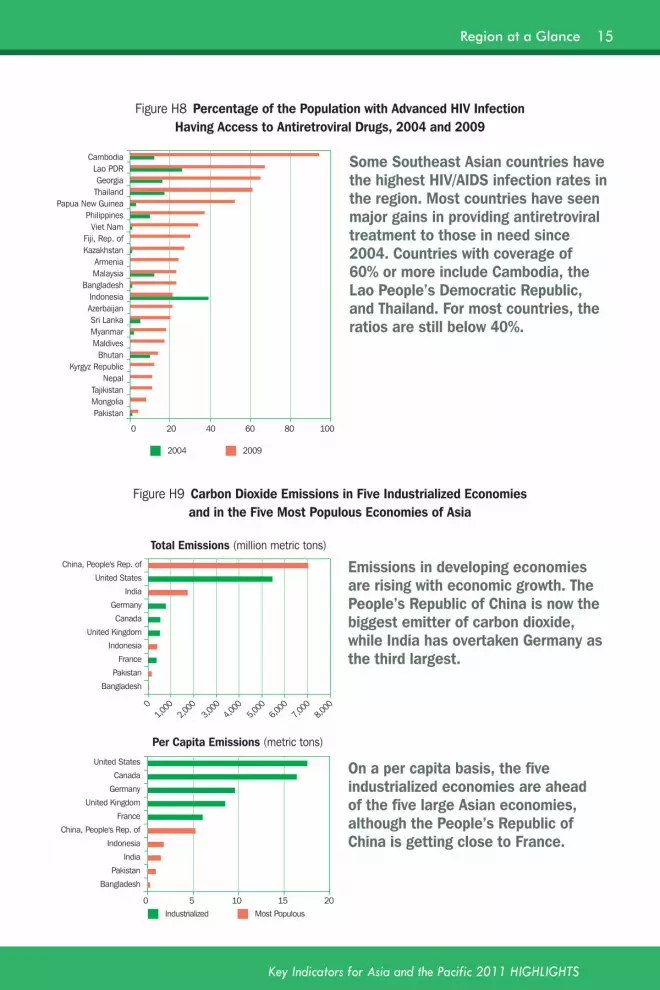
Figure H8 Percentage of the Population with Advanced HIV Infection Having Access to Antiretroviral Drugs, 2004 and 2009
0 20 40 60 80 100
Pakistan Mongolia Tajikistan
Nepal Kyrgyz Republic
Bhutan Maldives Myanmar Sri Lanka
Azerbaijan Indonesia
Bangladesh Malaysia Armenia
Kazakhstan Fiji, Rep. of
Viet Nam Philippines
Papua New Guinea Thailand Georgia
Lao PDR Cambodia
2009 2004
Some Southeast Asian countries have the highest HIV/AIDS infection rates in the region. Most countries have seen major gains in providing antiretroviral treatment to those in need since 2004. Countries with coverage of 60% or more include Cambodia, the Lao People’s Democratic Republic, and Thailand. For most countries, the ratios are still below 40%.
0 5 10 15 20
Bangladesh
Pakistan
India
Indonesia
China, People's Rep. of
France
United Kingdom
Germany
Canada
United States
0
1,000
2,000
3,000
4,000
5,000
7,000
8,000
6,000
Bangladesh
Pakistan
France
Indonesia
United Kingdom
Canada
Germany
India
United States
China, People's Rep. of
Most Populous Industrialized
Figure H9 Carbon Dioxide Emissions in Five Industrialized Economies and in the Five Most Populous Economies of Asia
Total Emissions (million metric tons)
Per Capita Emissions (metric tons)
Emissions in developing economies are rising with economic growth. The People’s Republic of China is now the biggest emitter of carbon dioxide, while India has overtaken Germany as the third largest.
On a per capita basis, the five industrialized economies are ahead of the five large Asian economies, although the People’s Republic of China is getting close to France.
15
Key Indicators for Asia and the Pacific 2011 HIGHLIGHTS
Region at a Glance

Figure H10 Urban/Rural Ratio of the Proportion of Population Using an Improved Sanitation Facility, 2008
0 2 4 6
Sri Lanka Thailand
Kazakhstan Australia
Cook Islands Japan
Korea, Rep. of Samoa
Uzbekistan Malaysia Tajikistan
Kyrgyz Republic Turkmenistan
Tonga Georgia
Maldives Bangladesh
Tuvalu Myanmar
China, People's Rep. of Philippines
Armenia Vanuatu
Viet Nam Marshall Islands
Bhutan Papua New Guinea
Palau Indonesia
Nepal Timor-Leste Afghanistan
Mongolia Azerbaijan
Kiribati Lao PDR Pakistan
India Cambodia
Micronesia, Fed. States of Solomon Islands Improved sanitation is considerably
less accessible to rural areas. In the Asia and Pacific region, only 50% of the population have improved sanitation facilities and 23% still defecate in open areas.
16
Key Indicators for Asia and the Pacific 2011 HIGHLIGHTS
Region at a Glance

Asia and the Pacific contains some very high-fertility and some very low-fertility economies. Net reproduction rates range from 0.5 in Taipei,China to 2.5 daughters per woman in Timor-Leste.
The high-fertility economies include seven Pacific island economies and Afghanistan, Pakistan, the Philippines, and Tajikistan.
The People’s Republic of China is in the low-fertility group while the other three most populous economies—Bangladesh, India, and Indonesia—are in the medium-fertility band.
Figure H11 Net Reproduction Rate: Expected Numbers of Daughters per Woman
0.0 0.5 1.0 1.5 2.0 2.5 3.0
Taipei,China Hong Kong, China
Singapore Korea, Rep. of
Japan China, People’s Rep. of
Georgia Thailand Armenia Maldives Viet Nam Myanmar Australia
Azerbaijan Brunei Darussalam
Indonesia Bangladesh
Bhutan New Zealand
Uzbekistan Turkmenistan
Cambodia Sri Lanka
India Mongolia
Kazakhstan Lao PDR
Nepal Kyrgyz Republic
Fiji, Rep. of Malaysia Pakistan Tajikistan
Philippines Micronesia, Fed. States of
Papua New Guinea Vanuatu Samoa Tonga
Solomon Islands Afghanistan Timor-Leste
High Fertility (more than 1.30)
Intermediate Fertility (0.95–1.30)
Low Fertility (0.5–0.95)
17
Key Indicators for Asia and the Pacific 2011 HIGHLIGHTS
Region at a Glance
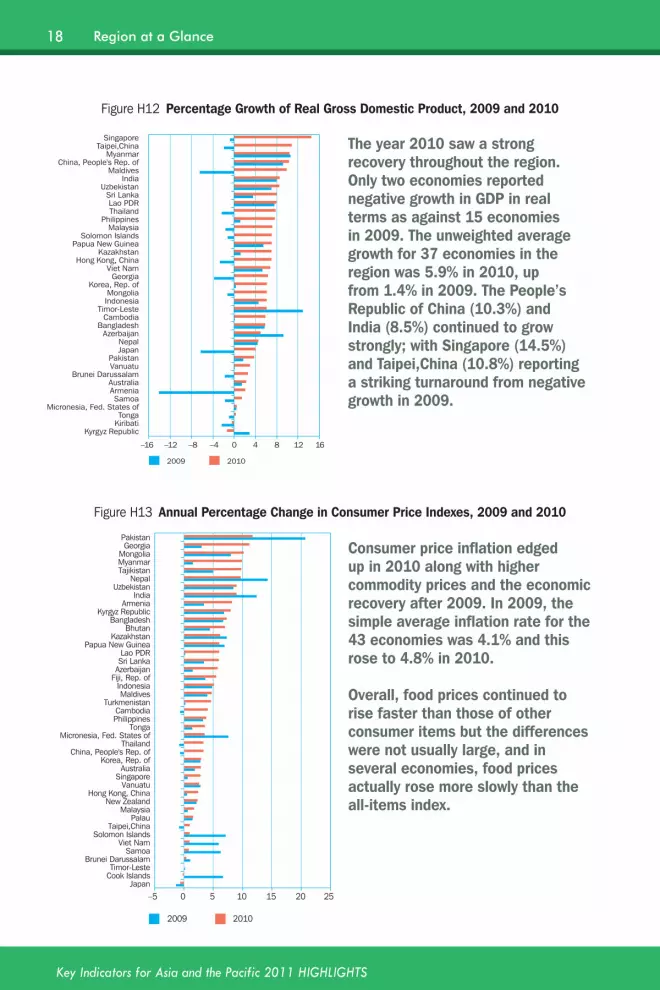
The year 2010 saw a strong recovery throughout the region. Only two economies reported negative growth in GDP in real terms as against 15 economies in 2009. The unweighted average growth for 37 economies in the region was 5.9% in 2010, up from 1.4% in 2009. The People’s Republic of China (10.3%) and India (8.5%) continued to grow strongly; with Singapore (14.5%) and Taipei,China (10.8%) reporting a striking turnaround from negative growth in 2009.
Figure H12 Percentage Growth of Real Gross Domestic Product, 2009 and 2010
2009 2010
–16 –12 –8 –4 0 4 8 12 16
Kyrgyz Republic Kiribati Tonga
Micronesia, Fed. States of Samoa
Armenia Australia
Brunei Darussalam Vanuatu Pakistan
Japan Nepal
Azerbaijan Bangladesh
Cambodia Timor-Leste
Indonesia Mongolia
Korea, Rep. of Georgia
Viet Nam Hong Kong, China
Kazakhstan Papua New Guinea
Solomon Islands Malaysia
Philippines Thailand Lao PDR
Sri Lanka Uzbekistan
India Maldives
China, People's Rep. of Myanmar
Taipei,China Singapore
Figure H13 Annual Percentage Change in Consumer Price Indexes, 2009 and 2010
–5 0 5 10 15 20 25
2010 2009
Japan Cook Islands Timor-Leste
Brunei Darussalam Samoa
Viet Nam Solomon Islands
Taipei,China Palau
Malaysia New Zealand
Hong Kong, China Vanuatu
Singapore Australia
Korea, Rep. of China, People's Rep. of
Thailand Micronesia, Fed. States of
Tonga Philippines Cambodia
Turkmenistan Maldives
Indonesia Fiji, Rep. of Azerbaijan Sri Lanka Lao PDR
Papua New Guinea Kazakhstan
Bhutan Bangladesh
Kyrgyz Republic Armenia
India Uzbekistan
Nepal Tajikistan Myanmar Mongolia
Georgia Pakistan
Consumer price inflation edged up in 2010 along with higher commodity prices and the economic recovery after 2009. In 2009, the simple average inflation rate for the 43 economies was 4.1% and this rose to 4.8% in 2010.
Overall, food prices continued to rise faster than those of other consumer items but the differences were not usually large, and in several economies, food prices actually rose more slowly than the all-items index.
18
Key Indicators for Asia and the Pacific 2011 HIGHLIGHTS
Region at a Glance

Figure H14 Percentage Growth of Merchandise Exports, 2009 and 2010
–60 –40 –20 0 20 40 60 80
Tonga Samoa
Palau Timor-Leste
Vanuatu Maldives
Solomon Islands Bhutan
Fiji, Rep. of Nepal
Armenia Tajikistan
Georgia Lao PDR
Kyrgyz Republic Mongolia
Cambodia Papua New Guinea
Sri Lanka Myanmar
Brunei Darussalam Uzbekistan
Bangladesh Pakistan
Azerbaijan New Zealand
Philippines Kazakhstan
Viet Nam Indonesia Thailand Malaysia Australia
India Taipei,China
Singapore Hong Kong, China
Korea, Rep. of Japan
China, People's Rep. of Asia and Pacific Region
2009 2010
The year 2010 saw a dramatic turnaround in Asia’s exports. The sharp fall in merchandise exports in 2009 became strong growth in 2010.
For Asia and the Pacific as a whole, the 18% fall in the dollar value of exports in 2009 was replaced by 30% growth in 2010. India recorded a growth of 40%; Australia, 38%; Indonesia, 35%; Japan, 33%; and the People’s Republic of China, 31%. Most of these countries had seen their merchandise exports contract by 15% or more a year before.
Figure H15 International Tourist Arrivals, 2000–2010(thousands)
2000
20
01
2002
20
03
2004
20
05
2006
20
07
2008
20
09
2010
0
10,000
20,000
30,000
40,000
50,000
60,000
China, People's Rep. of
Malaysia
Hong Kong, China
ThailandSingapore
Korea, Rep. ofIndonesia
India
International tourist arrivals in the eight most popular destinations of Asia and the Pacific were up by 11% in 2010 after falling by 1% in 2009. Arrivals registered growth of more than 8% in each of the major destinations except for Malaysia (4%), with particularly large percentage growth in Singapore (22%); Hong Kong, China (19%); and the Republic of Korea (13%).
19
Key Indicators for Asia and the Pacific 2011 HIGHLIGHTS
Region at a Glance

Figure H16 Road Accident Deaths, 2000 and 2008 (deaths per 100,000 population)
0 5 10 15 20 25 30Philippines
Micronesia, Fed. States of Bangladesh
Hong Kong, China Maldives Pakistan
Myanmar Nepal
Vanuatu Papua New Guinea
Solomon Islands Japan
Singapore China, People's Rep. of
Afghanistan Tajikistan
Kiribati Australia
Uzbekistan Tonga
Fiji, Rep. of New Zealand
Indonesia Taipei,China
Lao PDR India
Cambodia Samoa
Sri Lanka Korea, Rep. of
Azerbaijan Armenia
Turkmenistan Viet Nam
Brunei Darussalam Bhutan
Thailand Georgia
Kazakhstan Mongolia
Kyrgyz Republic Malaysia
2008 2000
Vehicle ownership is rising throughout Asia, but it comes with a cost. Five economies had 20 or more fatalities per 100,000 population. By comparison, the four largest countries in Western Europe, all with high vehicle ownership, had fatality rates of less than 8 per 100,000.
Eleven economies reduced their death rates over the period. Among the economies with high vehicle ownership, Japan; the Republic of Korea; and Taipei,China achieved reductions of 30% or more while Malaysia, with the highest rate in the region, only reduced road accident deaths by 6%.
20
Key Indicators for Asia and the Pacific 2011 HIGHLIGHTS
Region at a Glance

Figure H17 Average Annual Percentage Growth in Energy Use, 2000–2008
–2 0 2 4 6 8 10 12 14 16
Japan Uzbekistan Philippines
New Zealand Singapore
Georgia Hong Kong, China
Sri Lanka Tajikistan
Azerbaijan Kyrgyz Republic
Australia Nepal
Korea, Rep. of Myanmar Indonesia
Turkmenistan Taipei,China
Pakistan Cambodia Mongolia
India Brunei Darussalam
Thailand Armenia
Bangladesh Malaysia Viet Nam
Kazakhstan China, People's Rep. of Asia consumed over one-third of the
world’s energy in 2008. Energy use grew in most economies between 2000 and 2008, at more than 2% annually, with the highest growth of above 8% recorded by the People’s Republic of China.
In general, the increase in energy use is related to the increase in GDP. If the economies of Asia and the Pacific continue to grow as they have in the past decade, the region will soon become the dominant consumer in world energy markets.
21
Key Indicators for Asia and the Pacific 2011 HIGHLIGHTS
Region at a Glance

Figure H18 Number of Days for New Business Registration, 2006 and 2010
2010 2006
0 20 40 60 80 100 120
New ZealandAustralia
SingaporeGeorgia
Hong Kong, ChinaAfghanistan
AzerbaijanSamoa
MaldivesKyrgyz Republic
MongoliaKorea, Rep. of
UzbekistanTaipei,China
ArmeniaMicronesia, Fed. States of
Marshall IslandsMalaysia
KazakhstanBangladesh
PakistanKiribatiJapanTonga
TajikistanPalauIndia
NepalThailand
Sri LankaPhilippines
China, People's Rep. ofVanuatu
Viet NamFiji, Rep. of
BhutanIndonesia
Papua New GuineaSolomon Islands
Timor-LesteCambodia
Lao PDRBrunei Darussalam The number of days needed to
register a new business is one test of being “business–friendly.” The time taken to register a new business varies enormously within the region, from 1 day in New Zealand, to 105 days in Brunei Darussalam. Between 2006 and 2010, most economies in the region managed to improve their business environment by shortening their registration procedures.
22
Key Indicators for Asia and the Pacific 2011 HIGHLIGHTS
Region at a Glance


