Embed Size (px)
Citation preview
1 23
Asia Pacific Education Review ISSN 1598-1037Volume 13Number 4 Asia Pacific Educ. Rev. (2012) 13:713-726DOI 10.1007/s12564-012-9231-z
School mapping restructure in rural China:achievements, problems and implications
Dan Zhao & Bruno Parolin
1 23
Your article is protected by copyright and
all rights are held exclusively by Education
Research Institute, Seoul National University,
Seoul, Korea. This e-offprint is for personal
use only and shall not be self-archived in
electronic repositories. If you wish to self-
archive your work, please use the accepted
author’s version for posting to your own
website or your institution’s repository. You
may further deposit the accepted author’s
version on a funder’s repository at a funder’s
request, provided it is not made publicly
available until 12 months after publication.
School mapping restructure in rural China: achievements,problems and implications
Dan Zhao • Bruno Parolin
Received: 13 February 2012 / Revised: 5 August 2012 / Accepted: 4 September 2012 / Published online: 18 September 2012
� Education Research Institute, Seoul National University, Seoul, Korea 2012
Abstract This study considers the experience of school
mapping restructure (SMR) in areas of rural China. It aims
to understand what happened after SMR implementation.
Through a combination of instruments such as question-
naires, interviews and document analysis, the study finds
that SMR has impacted positively on the development of
education in terms of generating scaling benefits, improved
school conditions and educational quality, and more equi-
table distribution of educational resources. However, there
remain several associated problems including longer
schooling commute, household financial restrictions and
student pressures, and increased teacher work-loads. The
study recommends that more structured plans should be
developed. Increased stakeholder participation should be
enabled, and by providing increased teaching resources to
rural schools, implementation should be improved.
Keywords School mapping restructure � Educational
policy � Rural China � Achievements � Problems and
implications
Introduction
School mapping restructure (SMR) is a term used to
describe the process of combining schools or districts in an
effort to generate administrative efficiencies and improved
academic and social experiences for students in sparsely
populated areas. It is also used to describe ‘‘school con-
solidation’’: the merging of two or more attendance areas to
form a larger school attendance pool (Fitzwater 1953;
Rural School and Community Trust 2000; McHenry-Sor-
ber 2009; Cooley 2012). This term is applied to the
investigations of efficient and equitable distribution of
resources within and between school systems when large-
scale reform or significant expansion of an educational
system takes place (Caillods 1983). Others use the term
‘‘school reorganization’’ (e.g. Peshkin 1982; Howard et al.
2010) or ‘‘school merger’’ (Mo et al. 2012) to describe the
combination of two or more previously independent school
districts in one new and larger school system. What these
terms have in common is that they refer to the merging
together of small schools in relatively poor condition to
create larger and better resourced schools.
A number of issues are taken into account when policy-
makers consider the implementation of SMR. First, larger
schools are seen as more cost-effective than smaller
schools. Thus, SMR is considered an effective way to
achieve ‘‘economy of scale’’ (Fanning 1995; Laplante2005;
Standard and Poor’s 2007; De Haan et al. 2011). Second,
rural schools are losing students due to a combination of
urbanization and lower birth rates (Shavers 2003; Shakrani
2010). Third, larger schools employ a standardized school
model which can improve the quality of education and
expand accessibility to education (Kay et al. 1982; De-
Young and Howley 1990; Alvarez et al. 2010). Some
policy-makers have advocated the concept of ‘‘bigger is
better’’ (Theobald and Nachtigal 1995; Berry 2004). They
believe that resources should be centralized in larger
schools in order to provide better education services.
School mapping restructure implementation may, as a
by-product, lead to the emergence of new problems. For
D. Zhao (&)
College of Humanities, Northwest A&F University, Yangling,
Shaanxi 712100, China
e-mail: [email protected]
B. Parolin
Faculty of the Built Environment, University of New South
Wales, Sydney, NSW 2052, Australia
123
Asia Pacific Educ. Rev. (2012) 13:713–726
DOI 10.1007/s12564-012-9231-z
Author's personal copy
example, the closure of remote schools may place greater
financial pressure on some students and their families
because of the increased travel or living expenses needed to
attend the new schools (Rural School and Community
Trust 2002; Murry and Groen 2004; Laplante 2005; Nitta
et al. 2010). Longer commutes to school may be to the
detriment of students, limiting their after-school free time
and presenting a barrier to participation in extracurricular
activities. In addition, the closure of schools may lead
to the loss of function and stability of the community
(Voth and Danforth 1981; Fitchen 1991; Johnson 2004;
Purcell and Shackelford 2005; Blauwkamp et al. 2011).
Finally, SMR seems not to guarantee the improvement of
student performance in step with the expansion of schools
(Walberg and Fowler 1987; University of Arkansas, Office
for Education Policy 2005; Lu and Du 2010; Cato 2011).
Solutions for improving SMR performance have been
discussed in several papers. Some argue that factors such as
student enrollment, financial impact, transportation (dis-
tance, terrain, time and cost) and impact on community
should be synthetically considered in order to minimize
negative impact (Kennedy and MacDougall 2007; Spradlin
et al. 2010). McHenry-Sorber (2009) stresses that SMR
should provide local community with the opportunity to
express their concerns regarding the local context (p. 14).
Some researchers suggest that special aid should cover all
small poor schools which, they believe, should be sup-
ported in the long run (Hargreaves et al. 2001; Jimerson
2007; Blauwkamp et al. 2011). McHenry-Sorber (2009)
encourages cost- and service-sharing programs between
neighboring schools or districts; this is also argued by
Plucker et al. (2007).
Very few studies have looked specifically at the
implementation of SMR in China. Fan (2006), Pang
(2006) and Xiong (2007) argue that SMR has a number of
negative impacts on poor children in remote villages, such
as longer travel distances, safety associated with the trip
to school and increased financial burdens. Fan (2009)
conducted a survey to investigate the implementation
process of SMR in rural regions. Chan and Harrell (2009)
took Yanyuan County in Sichuan Province as a case study
to examine some of the difficulties entailed in SMR. Yang
(2010) produced a review of SMR issues including poli-
cies and problems, suggesting the retention or reopening
of small rural schools. Mo et al. (2012) examine the
impact of the SMR on the academic performance of
students in a poor county of Shaanxi Province and find
that students who transfer to the county school benefit
from the transfer. A similar study is conducted by Liu
et al. (2010). Zhao and Parolin (2011, 2012) applies GIS
to assess the effect of SMR, showing that children in
sparsely populated areas suffer longer commutes follow-
ing the sharp decrease in the number of small rural
schools, and proposes that SMR decision making should
employ scientific tools.
To some extent, international studies, based on the
experiences of other countries, consider issues such as
background, reasons, difficulties, impacts and policy sug-
gestions, when discussing the issue of SMR. These con-
cerns are also applicable to this study. Regarding Chinese
research, however, despite the broad implementation of
SMR in rural China, relatively little has been learned about
how SMR has affected rural schools, and the attitudes of
the groups involved, such as administrators, educators,
students and parents. The current studies typically focus on
township and county level, thus neglecting to come to any
overall national level assessment of SMR performance.
Additionally, there has been no attempt to propose policy
directions based on overseas experience, which would put
SMR into the broader international context.
To help fill this gap, this study aims to provide an
overall assessment of experiences of SMR in rural China
and to recommend strategies from a broader international
perspective. The approach here to the achievements,
problems and strategies of SMR differs from that of pre-
vious studies. The real conditions and processes of SMR
implementation are presented in depth, based on evidence
provided by a large-scale survey conducted in the central
and western provinces of China in 2008. The authors
limited this study to those subjects most directly affected
by SMR: school administrators, teachers, students and
parents, and focused on the following concerns: what are
the effects of SMR implementation in rural China? Are
there any achievements or problems generated by SMR?
What are the policy implications for SMR improvement?
In detail, the evidence shows that SMR has achieved
scale improvements, enhancement of school conditions and
educational quality and equilibrium of educational devel-
opment, among other benefits. The problems faced by SMR
involve longer school commutes, household financial bur-
dens, study pressure and increased teacher workloads. It is
argued here that a better plan, via the application of GIS
(Geography Information System), participation of multiple
groups, and increased provision of teachers to rural
schools, should be developed. Such strategies may improve
SMR performance and promote the future development of
Chinese rural education.
This paper proceeds in six stages. First, related issues of
SMR are reviewed from an overseas perspective, including
definitions, reasons, problems and solutions. Studies con-
ducted by Chinese researchers are also introduced. Second,
the context of SMR in rural China is introduced. Third, the
authors present the methodology used in the large-scale
questionnaire-based survey. Fourth, achievements and
problems of SMR are presented by applying data derived
from the survey. The fifth stage makes conclusions and
714 D. Zhao, B. Parolin
123
Author's personal copy
recommends implications for policy-makers. Lastly, sev-
eral issues associated with SMR which require additional
study are raised, regarding the course of further develop-
ment of rural education.
Context of SMR in rural China
Accompanied by industrialization and urbanization, China
can be geographically classed according to three catego-
ries, namely rural, county and urban areas. Rural areas are
administrative divisions mainly based on agriculture, and
consisting of independent villages as autonomous units of
rural residency. County areas rest between rural and urban
areas and form a network of villages and towns in terms of
politics, economics and culture. Urban areas consist of
concentrated non-agricultural populations and well-devel-
oped industry and commerce, making them the centers of
their surrounding regions (Li 2000). Based on this defini-
tion of rural, county and urban areas, it can be concluded
that rural areas are the lowest level administrative divisions
in China, characterized by agricultural production and a
rural population. Thus, rural schools in this study are taken
to refer to schools located in rural areas, as classified by the
Education Statistical Yearbook in China.
For a long time, Chinese primary and middle schools
have faced problems such as irrational distribution of
schools; a large number of small rural schools are located
in neighboring villages despite class sizes of around ten
pupils each, while some larger schools are short of class-
room space and facilities, inhibiting educational quality.
These persistent problems have yet to be successfully
resolved. In the implementation of universal 9-year com-
pulsory education starting in 1986, local governments have
conducted measures to achieve the goal of ‘‘every village
establishing a primary school and a middle school’’ (Fan
2006), which was part of a larger effort to expand access to
education. However, this policy has had a negative impact
on rural school mapping. For example, many villages have
their own school despite low birthrates, inadequate physi-
cal facilities, and insufficiently trained or unmotivated
teachers. On this basis, local governments commenced a
program of SMR in the early 2000s, as part of the National
Basic Education Plan (State Council of the People’s
Republic of China 2001). Since 2001, the SMR policy was
applied across China, especially in rural areas. This was
driven by existing school mapping and the rapid decline of
school-age populations in rural China. In 2009, compared
to the number of enrolled students in rural primary schools
in 1998, there had been a 37.61 % decline from 15,100,116
students to 9,420,829 (a reduction of 5,679,287). The
number of rural secondary students had declined by
44.86 %, from 11,445,048 in 1998 to 6,310,685 in 2009 (a
reduction of 5,134,363; Ministry of Education of the Peo-
ple’s Republic of China 1998, 2009; See Table 1). Factors
that have influenced SMR include rural tax reform,
urbanization and the changing geography of the adminis-
trative structure of China (Fan 2006).
The main objectives of SMR in China include equitable
distribution of educational resources, greater economy of
scale, urban–rural balanced development of education,
improved management capacity and enhanced education
quality, especially in poorer rural areas (State Council of
the People’s Republic of China 2001). The objectives are
also the standards which can be used to assess the results of
SMR implementation. One of the key methods of SMR has
been the closure of schools in remote isolated areas and the
transfer of students, teachers and other resources to central
schools located further away. The scale of school closures
in China has been dramatic, as evidenced by primary
schools and small rural schools. Statistics from the Min-
istry of Education of China reveal that over a 12-year
period between 1998 and 2009, the number of rural pri-
mary schools has declined from 493,152 to 234,157 (a
reduction of 52.52 %), while the number of small rural
schools has declined from 178,952 to 70,954 (a reduction
of 60.35 %; Ministry of Education of the People’s
Republic of China 1998, 2009).
Methodology
A large-scale survey of six provinces was conducted in
2008 with funding from the World Bank and the Chinese
Ministry of Education. In total, 52 researchers were
involved. They were divided into six groups, and each was
made responsible for one provincial investigation.
Survey area and target group
Multistage sampling and stratified sampling were used to
select the surveyed areas. Provinces were selected on the
basis of various factors including developmental disparity,
cultural diversity, demographics and geographical factors.
Table 1 Number of primary and secondary schools in China (1998
and 2009)
Total Rural area County area Urban area
Primary school
1998 22,013,814 15,100,116 4,148,464 2,765,234
2009 16,377,978 9,420,829 4,127,154 2,829,995
Secondary school
1998 19,613,640 11,445,048 5,087,299 3,081,293
2009 17,863,912 6,310,685 8,075,391 3,477,836
School mapping restructure in rural China 715
123
Author's personal copy
The samples were then further broken down to city and
county, town and school levels. Finally, respondents (par-
ents, students, teachers, school administrators) associated
with the schools were selected. In total, six provinces,
namely Shaanxi, Henan, Hubei, Yunnan, Guangxi and
Inner Mongolia, including 38 counties and 178 towns, were
selected for the survey. All situated in central and western
China, these schools may be characterized by compara-
tively low levels of economic development and strong
agricultural or animal raising contexts. They are located on
varying terrain, with some in highly mountainous areas.
In total, 986 rural primary and secondary schools were
investigated, of which 764 were primary schools (including
small rural schools), 140 were junior secondary schools, 45
were 9-year compulsory education schools and 37 were
senior secondary schools. The schools were situated in
mountainous, hilly, plain land, pastoral, mining and lake-
side areas. The percentage of schools in mountainous areas
was 66.7 %, those in hilly areas accounted for 12.0 %, and
those on the plains accounted for 18.7 % (see Table 2).
The sample schools include boarding schools, day schools
and mixed boarding and day schools.
Survey target groups comprised of education adminis-
trators, headmasters/teachers, students and parents/custo-
dians. Within these target groups, teachers and students
were selected using random sampling and cluster sampling
methods, respectively. As for the teachers, with an average
number of teachers in each school of between 30 and 40, a
sampling probability of 0.5 was used, according to the list
of teachers in each school, so as to improve the represen-
tativeness of the teacher’s sample. For students, due to the
fact that the number of students was large, and the students
in each type of school were homogeneous; cluster sampling
(a class as one unit) was applied in most of consolidated
schools, according to the list of class in schools. Different
sampling method made the teacher sample a little bit
higher than the student sample. Additionally, given that
schools were not evenly distributed between the six prov-
inces, respondents in different provinces were accorded
different weights, so that the results have been adjusted and
weights calculated. Moreover, it proved to be more difficult
to select parent groups because so many had migrated to
the cities seeking jobs, leaving their children in the village
with custodians. For this reason, the parent group com-
prises of both parents and custodians.
Data collection
Four instruments were used for collecting data: (a) SMR
planning form to collect information on enrollment, service
population, physical accessibility, number of teachers and
finance; (b) Interviews with groups and individuals, con-
sisted of open–ended questions; (c) Questionnaire surveys
for administrators, teachers, students and parents (see
Table 3).
Based on the objective of this study, the investigation
included: basic respondent information; district back-
ground variables; objective and motivations of SMR;
viewpoints of different groups (education administrative
official, head teacher, school administrative staff, teacher
and teaching auxiliary) toward SMR; successes and con-
straints of SMR; issues (e.g. distance, expense, life diffi-
culties) of concern to students and parents; major
challenges and recourses of different groups regarding
better implementation of SMR.
The SMR questionnaires used in this study were tested
for content validity and reliability. Validity evidence
Table 2 Number of surveyed
schools in six provinces by
different categories
By province By location
Schools Number Proportion (%) Schools Number Proportion (%)
Shaanxi 221 22.4 Mountainous area 657 66.7
Guangxi 369 37.4 Hills 118 12.0
Hubei 97 9.8 Plains 184 18.7
Yunnan 141 14.3 Pastureland 5 0.5
Henan 135 13.7 Mining area 1 0.1
Inner Mongolia 23 2.4 Lakeland area 1 0.1
Not supplied 20 1.9
Total 986 100 Total 986 100
Table 3 Questionnaire statistics
Questionnaire
type
Sent
out
Returned Return
rate (%)
Valid
surveys
Validity
rate (%)
Officials/
administrators
210 194 92.3 181 86.2
Headmasters/
teachers
15,000 12,490 83.3 11,463 76.4
Parents 12,000 7,995 66.6 7,421 62.0
Students 12,000 11,997 99.9 11,990 99.9
Total 39,210 32,476 83.0 31,055 79.2
716 D. Zhao, B. Parolin
123
Author's personal copy
suggests that, by using a two-rater agreement procedure,
the calculation of the Content Validity Index (CVI) gen-
erated 0.84, 0.76, 0.79 and 0.81, consistent with the ques-
tionnaire for administrators, teachers, parents and students.
Reliability evidence was established by applying Kuder-
Richardson Formula 20 (KR-20), the result for each cate-
gory of questionnaire—in the same order as above—being
0.78, 0.80, 0.82 and 0.77. Both sets of evidence of validity
and reliability were thus found to be at acceptable levels.
Research findings
The following sections present evidence from the ques-
tionnaires and interviews regarding the experience of SMR
implementation, showing both achievements and problems.
Effects of SMR
Economy of scale improvements
From the survey, the school size of all the three types of
schools—primary school, junior secondary school and
senior secondary school—increased once SMR had been
undertaken. In detail, the average primary school size, in
the six provinces investigated, rose from 228 to 295 stu-
dents (a 29.5 % increase), the average junior secondary
school size rose from 874 to 1,020 students, and the
average senior secondary school rose from 773 to 2,025
students. Along with an increase in school size, the average
cost per student at all three types of school decreased. As
this survey showed, after SMR, a student’s average cost at
primary school, junior secondary school and senior sec-
ondary school was, respectively, 2,998 RMB (a decrease of
15.8 %), 4,561 RMB (a decrease of 4.6 %) and 4,012 RMB
(a decrease of 20.05 %; see Table 4). Nationally, the
average scale of rural primary schools increased from 191
to 242 students, while the average cost per student
decreased from 4,087 to 3,620 RMB (Ministry of Educa-
tion of the People’s Republic of China 1998, 2009). These
changes demonstrate that SMR has increased economies of
scale in schools.
Additionally, from the perspective of the stakeholder
groups interviewed, 71.2 % of education administrative
officials, 59.7 % of head teachers, 58.1 % of school
administrative staff and 52.6 % of teachers felt that SMR
had improved economies of scale in rural schools (see
Table 5).
Overall enhancement of school conditions and educational
quality
Three of the indicators, namely the percentage of qualified
teachers, assets value of teaching instrument and equip-
ment, and books in school library, were applied to examine
the change in school conditions following SMR imple-
mentation. As this study shows, the percentage of qualified
teachers per school in our investigated areas increased from
92.73 to 97.21 %, the average assets value increased from
42,600 to 62,800 RMB and the average number of library
books increased from 4,110 to 6,014. Therefore, numerical
increases in terms of those three indicators can demonstrate
that educational operating conditions after SMR had been
improved (see Table 6). This could also help to show that,
from the perspective of ‘‘school conditions,’’ the educa-
tional quality increased during SMR implementation.
The statistical data also shows that 74.6 % of education
officials, 65.5 % of head teachers, 55.3 % of school
administrators and 45.8 % of teachers agree that educa-
tional quality improved with SMR. In addition, 73.2 % of
parents consider that teachers are more responsible than
before SMR, and 65.1 % of students agree that teachers
spend more time instructing them than before SMR. A total
of 52.3 % of parents think that the grades of their children
improved, and 50.5 % of students think that their grades
improved (see Table 7). In summary, as aspects including
‘‘responsibility of teachers,’’ ‘‘grades,’’ ‘‘period of
instruction by teachers,’’ ‘‘drop-out rate’’ and ‘‘attendance
rate’’ are all related to educational quality, these evalua-
tions could demonstrate that, overall, SMR has somewhat
generated a positive impact on educational quality.
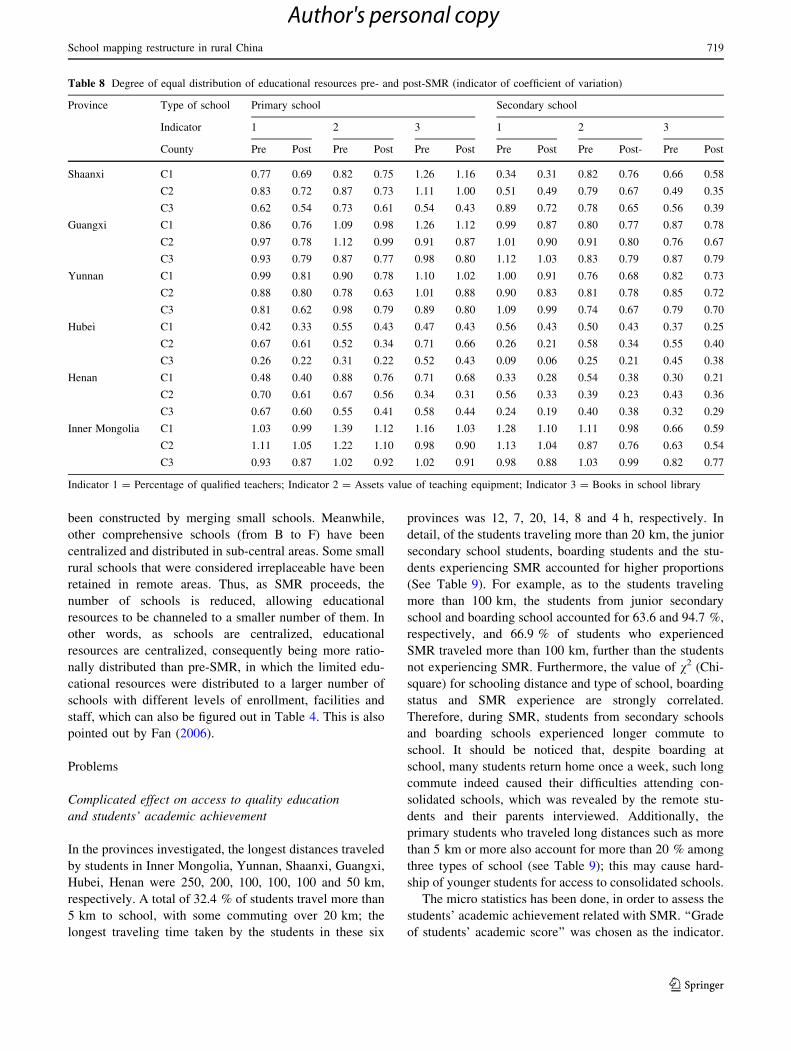
More equitable distribution of educational resources
As an indicator for assessing the degree of dispersion of data,
coefficient of variation (CV) was applied in order to measure
the degree of equal distribution of educational resources
among schools during the process of SMR. Coefficient of
variation was calculated by standard deviation (and can also
Table 4 Average cost of studying in rural primary and secondary
schools before and after SMR (in the six provinces investigated)
Types Pre-
SMR
Post-
SMR
Changed
proportion (%)
PS 228 295 29.5
Student’s average cost
(RMB)
3,561 2,998 15.8
JSS 874 1,020 16.6
Student’s average cost
(RMB)
4,780 4,561 4.6
SSS 773 2,025 162.0
Student’s average cost
(RMB)
4,991 4,012 20.0
PS primary schools, JSS junior secondary schools, SSS senior sec-
ondary schools
School mapping restructure in rural China 717
123
Author's personal copy
therefore be called the coefficient of standard deviation). Its
formula is expressed as follows:
CV ¼ S�X
� �� 100 % thereinto; S
¼ffiffiffiffiffiffiffiffiffiffiffiffiffiffiffiffiffiffiffiffiffiffiffiffiffiffiffiffiffiffiffiffiffiffiffiffiffiffiffiffiffiffiffiffiffiXn
jðXj � XÞ=ðN � 1Þ
r;
Xj is observation, X is the mean value of sampling obser-
vations, S is the standard deviation of sampling observations.
According to the principle of CV, the higher the CV
value, the higher the degree of dispersion. In this study,
higher CV value would also indicate a higher degree of
equal distribution of educational resources. From the sur-
vey statistics, the three indicators in Table 5 were chosen
to represent educational resources. The value of CV within
each county of the six provinces was calculated, showing
the degree of equal distribution of educational resources
between schools within county. As presented in Table 6,
for all three indicators, the value of CV of each county
decreased after SMR was undertaken. These changes
affected both primary and secondary schools after SMR.
For example, for primary schools in county 1 (C1) in
Shaanxi Province, the value of CV for indicator 1, Per-
centage of Qualified Teachers, decreased from 0.77 pre-
SMR to 0.69 post-SMR; thus, the allocation of resource of
qualified teachers turned to be more equal after SMR. The
other counties in the other provinces the same effect is
recorded (see Table 8). Hence, SMR has been shown to
have played a positive role in eliminating the educational
resource gap between different categories of schools and
between different areas.
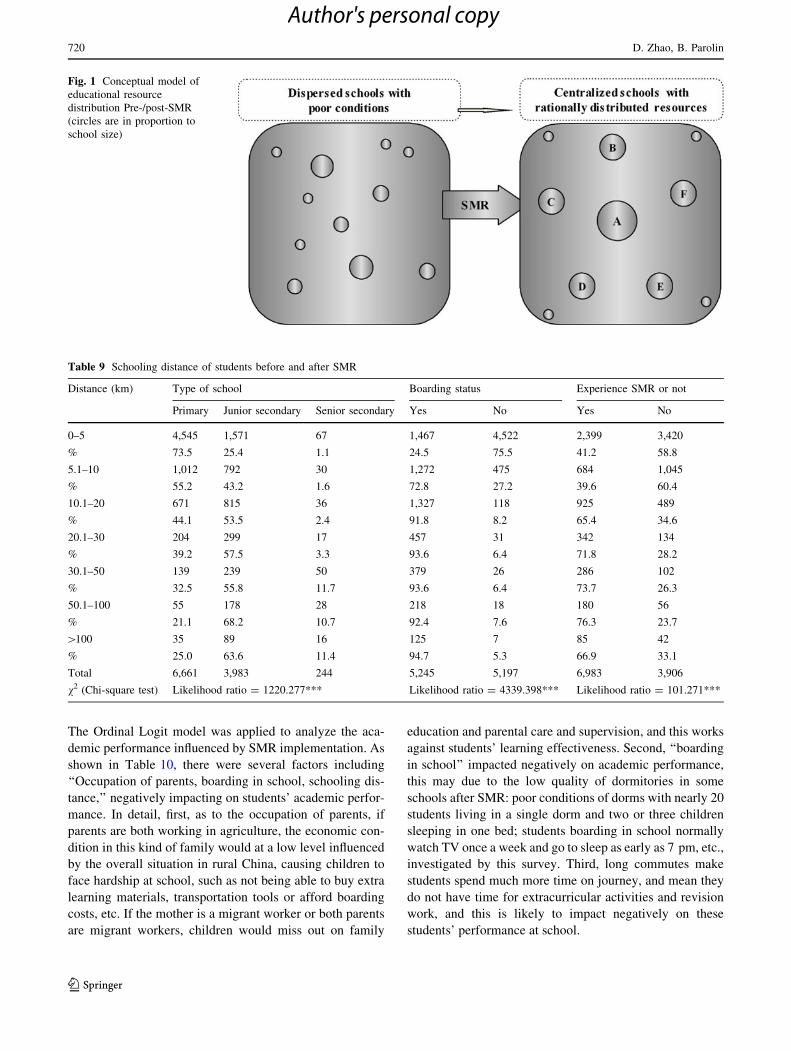
Conceptually, changes in educational resource distribu-
tion can be explained by way of the logical model in Fig. 1.
Before SMR, schools were dispersed in the villages (see
the left frame), had low enrollment rates, and lacked basic
facilities. After SMR, however, a central school (A) has
Table 5 Achievements of SMR from the perspective of each group
Groups Valid
samples
Improvement of
school scale
economies (%)
Improvement of
education quality
(%)
Equilibrium of
educational
development (%)
More reasonable
distribution of
educational
resources (%)
Others (%)
Administrative officials 178 71.2 74.6 72.2 93.8 2.2
Head teachers 893 59.7 65.5 57.3 78.2 2.9
School administrators 736 58.1 55.3 52.9 75.8 3.2
Teachers 8,884 52.6 45.8 54.2 70.2 3.7
Table 6 Changes in school
conditions in terms of three
indicators (average per school in
the six provinces surveyed)
Pre-SMR Post-SMR
Percentage of qualified teachers (%) 92.73 97.21
Assets value of teaching equipment (RMB) 42,600 62,800
Books in the school library 4,110 6,014
Table 7 Changes in educational quality since SMR
Groups Valid samples Contents Increase (%) Not clear/About
the same (%)
Decrease (%)
Parents 7,306 Teachers’ responsibility 73.2 20.1 6.7
7,235 Grades 52.3 16.5 31.2
Students 11,226 Period of instruction by teachers 65.1 20.7 14.2
11,610 Number of class drop-outs 13.1 9.9 77.0
11,737 Grades 50.5 27.1 22.4
Teachers 10,549 School attendance rate 36.1 46.7 17.2
9,977 Drop-out rate 21.0 37.8 41.2
Administrative officials 176 School attendance rate 26.1 67.6 6.3
159 Drop-out rate 12.6 61.6 25.8
718 D. Zhao, B. Parolin
123
Author's personal copy
been constructed by merging small schools. Meanwhile,
other comprehensive schools (from B to F) have been
centralized and distributed in sub-central areas. Some small
rural schools that were considered irreplaceable have been
retained in remote areas. Thus, as SMR proceeds, the
number of schools is reduced, allowing educational
resources to be channeled to a smaller number of them. In
other words, as schools are centralized, educational
resources are centralized, consequently being more ratio-
nally distributed than pre-SMR, in which the limited edu-
cational resources were distributed to a larger number of
schools with different levels of enrollment, facilities and
staff, which can also be figured out in Table 4. This is also
pointed out by Fan (2006).
Problems
Complicated effect on access to quality education
and students’ academic achievement
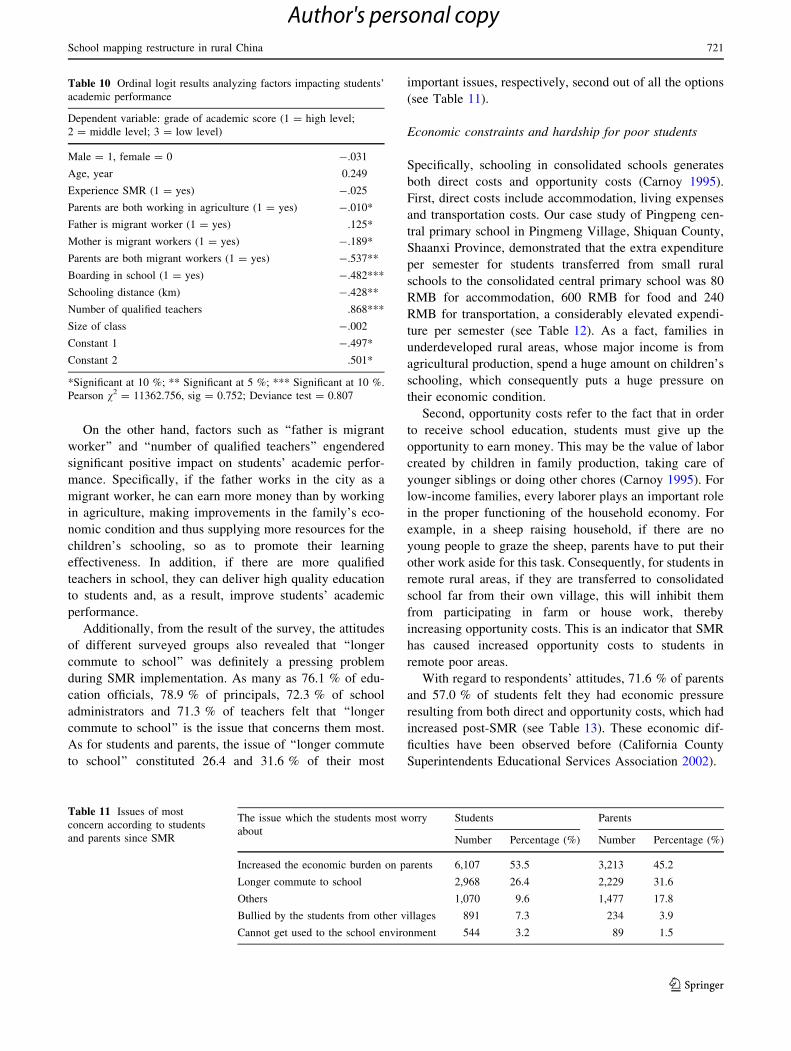
In the provinces investigated, the longest distances traveled
by students in Inner Mongolia, Yunnan, Shaanxi, Guangxi,
Hubei, Henan were 250, 200, 100, 100, 100 and 50 km,
respectively. A total of 32.4 % of students travel more than
5 km to school, with some commuting over 20 km; the
longest traveling time taken by the students in these six
provinces was 12, 7, 20, 14, 8 and 4 h, respectively. In
detail, of the students traveling more than 20 km, the junior
secondary school students, boarding students and the stu-
dents experiencing SMR accounted for higher proportions
(See Table 9). For example, as to the students traveling
more than 100 km, the students from junior secondary
school and boarding school accounted for 63.6 and 94.7 %,
respectively, and 66.9 % of students who experienced
SMR traveled more than 100 km, further than the students
not experiencing SMR. Furthermore, the value of v2 (Chi-
square) for schooling distance and type of school, boarding
status and SMR experience are strongly correlated.
Therefore, during SMR, students from secondary schools
and boarding schools experienced longer commute to
school. It should be noticed that, despite boarding at
school, many students return home once a week, such long
commute indeed caused their difficulties attending con-
solidated schools, which was revealed by the remote stu-
dents and their parents interviewed. Additionally, the
primary students who traveled long distances such as more
than 5 km or more also account for more than 20 % among
three types of school (see Table 9); this may cause hard-
ship of younger students for access to consolidated schools.
The micro statistics has been done, in order to assess the
students’ academic achievement related with SMR. ‘‘Grade
of students’ academic score’’ was chosen as the indicator.
Table 8 Degree of equal distribution of educational resources pre- and post-SMR (indicator of coefficient of variation)
Province Type of school Primary school Secondary school
Indicator 1 2 3 1 2 3
County Pre Post Pre Post Pre Post Pre Post Pre Post- Pre Post
Shaanxi C1 0.77 0.69 0.82 0.75 1.26 1.16 0.34 0.31 0.82 0.76 0.66 0.58
C2 0.83 0.72 0.87 0.73 1.11 1.00 0.51 0.49 0.79 0.67 0.49 0.35
C3 0.62 0.54 0.73 0.61 0.54 0.43 0.89 0.72 0.78 0.65 0.56 0.39
Guangxi C1 0.86 0.76 1.09 0.98 1.26 1.12 0.99 0.87 0.80 0.77 0.87 0.78
C2 0.97 0.78 1.12 0.99 0.91 0.87 1.01 0.90 0.91 0.80 0.76 0.67
C3 0.93 0.79 0.87 0.77 0.98 0.80 1.12 1.03 0.83 0.79 0.87 0.79
Yunnan C1 0.99 0.81 0.90 0.78 1.10 1.02 1.00 0.91 0.76 0.68 0.82 0.73
C2 0.88 0.80 0.78 0.63 1.01 0.88 0.90 0.83 0.81 0.78 0.85 0.72
C3 0.81 0.62 0.98 0.79 0.89 0.80 1.09 0.99 0.74 0.67 0.79 0.70
Hubei C1 0.42 0.33 0.55 0.43 0.47 0.43 0.56 0.43 0.50 0.43 0.37 0.25
C2 0.67 0.61 0.52 0.34 0.71 0.66 0.26 0.21 0.58 0.34 0.55 0.40
C3 0.26 0.22 0.31 0.22 0.52 0.43 0.09 0.06 0.25 0.21 0.45 0.38
Henan C1 0.48 0.40 0.88 0.76 0.71 0.68 0.33 0.28 0.54 0.38 0.30 0.21
C2 0.70 0.61 0.67 0.56 0.34 0.31 0.56 0.33 0.39 0.23 0.43 0.36
C3 0.67 0.60 0.55 0.41 0.58 0.44 0.24 0.19 0.40 0.38 0.32 0.29
Inner Mongolia C1 1.03 0.99 1.39 1.12 1.16 1.03 1.28 1.10 1.11 0.98 0.66 0.59
C2 1.11 1.05 1.22 1.10 0.98 0.90 1.13 1.04 0.87 0.76 0.63 0.54
C3 0.93 0.87 1.02 0.92 1.02 0.91 0.98 0.88 1.03 0.99 0.82 0.77
Indicator 1 = Percentage of qualified teachers; Indicator 2 = Assets value of teaching equipment; Indicator 3 = Books in school library
School mapping restructure in rural China 719
123
Author's personal copy
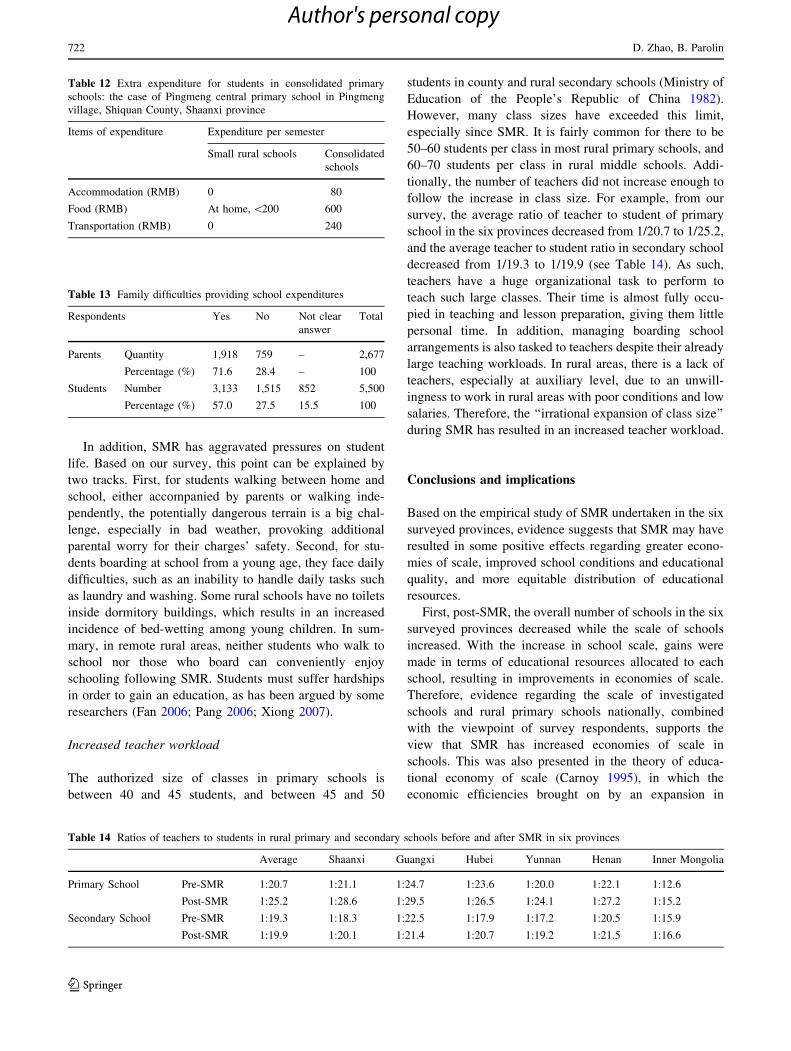
The Ordinal Logit model was applied to analyze the aca-
demic performance influenced by SMR implementation. As
shown in Table 10, there were several factors including
‘‘Occupation of parents, boarding in school, schooling dis-
tance,’’ negatively impacting on students’ academic perfor-
mance. In detail, first, as to the occupation of parents, if
parents are both working in agriculture, the economic con-
dition in this kind of family would at a low level influenced
by the overall situation in rural China, causing children to
face hardship at school, such as not being able to buy extra
learning materials, transportation tools or afford boarding
costs, etc. If the mother is a migrant worker or both parents
are migrant workers, children would miss out on family
education and parental care and supervision, and this works
against students’ learning effectiveness. Second, ‘‘boarding
in school’’ impacted negatively on academic performance,
this may due to the low quality of dormitories in some
schools after SMR: poor conditions of dorms with nearly 20
students living in a single dorm and two or three children
sleeping in one bed; students boarding in school normally
watch TV once a week and go to sleep as early as 7 pm, etc.,
investigated by this survey. Third, long commutes make
students spend much more time on journey, and mean they
do not have time for extracurricular activities and revision
work, and this is likely to impact negatively on these
students’ performance at school.
Fig. 1 Conceptual model of
educational resource
distribution Pre-/post-SMR
(circles are in proportion to
school size)
Table 9 Schooling distance of students before and after SMR
Distance (km) Type of school Boarding status Experience SMR or not
Primary Junior secondary Senior secondary Yes No Yes No
0–5 4,545 1,571 67 1,467 4,522 2,399 3,420
% 73.5 25.4 1.1 24.5 75.5 41.2 58.8
5.1–10 1,012 792 30 1,272 475 684 1,045
% 55.2 43.2 1.6 72.8 27.2 39.6 60.4
10.1–20 671 815 36 1,327 118 925 489
% 44.1 53.5 2.4 91.8 8.2 65.4 34.6
20.1–30 204 299 17 457 31 342 134
% 39.2 57.5 3.3 93.6 6.4 71.8 28.2
30.1–50 139 239 50 379 26 286 102
% 32.5 55.8 11.7 93.6 6.4 73.7 26.3
50.1–100 55 178 28 218 18 180 56
% 21.1 68.2 10.7 92.4 7.6 76.3 23.7
[100 35 89 16 125 7 85 42
% 25.0 63.6 11.4 94.7 5.3 66.9 33.1
Total 6,661 3,983 244 5,245 5,197 6,983 3,906
v2 (Chi-square test) Likelihood ratio = 1220.277*** Likelihood ratio = 4339.398*** Likelihood ratio = 101.271***
720 D. Zhao, B. Parolin
123
Author's personal copy
On the other hand, factors such as ‘‘father is migrant
worker’’ and ‘‘number of qualified teachers’’ engendered
significant positive impact on students’ academic perfor-
mance. Specifically, if the father works in the city as a
migrant worker, he can earn more money than by working
in agriculture, making improvements in the family’s eco-
nomic condition and thus supplying more resources for the
children’s schooling, so as to promote their learning
effectiveness. In addition, if there are more qualified
teachers in school, they can deliver high quality education
to students and, as a result, improve students’ academic
performance.
Additionally, from the result of the survey, the attitudes
of different surveyed groups also revealed that ‘‘longer
commute to school’’ was definitely a pressing problem
during SMR implementation. As many as 76.1 % of edu-
cation officials, 78.9 % of principals, 72.3 % of school
administrators and 71.3 % of teachers felt that ‘‘longer
commute to school’’ is the issue that concerns them most.
As for students and parents, the issue of ‘‘longer commute
to school’’ constituted 26.4 and 31.6 % of their most
important issues, respectively, second out of all the options
(see Table 11).
Economic constraints and hardship for poor students
Specifically, schooling in consolidated schools generates
both direct costs and opportunity costs (Carnoy 1995).
First, direct costs include accommodation, living expenses
and transportation costs. Our case study of Pingpeng cen-
tral primary school in Pingmeng Village, Shiquan County,
Shaanxi Province, demonstrated that the extra expenditure
per semester for students transferred from small rural
schools to the consolidated central primary school was 80
RMB for accommodation, 600 RMB for food and 240
RMB for transportation, a considerably elevated expendi-
ture per semester (see Table 12). As a fact, families in
underdeveloped rural areas, whose major income is from
agricultural production, spend a huge amount on children’s
schooling, which consequently puts a huge pressure on
their economic condition.
Second, opportunity costs refer to the fact that in order
to receive school education, students must give up the
opportunity to earn money. This may be the value of labor
created by children in family production, taking care of
younger siblings or doing other chores (Carnoy 1995). For
low-income families, every laborer plays an important role
in the proper functioning of the household economy. For
example, in a sheep raising household, if there are no
young people to graze the sheep, parents have to put their
other work aside for this task. Consequently, for students in
remote rural areas, if they are transferred to consolidated
school far from their own village, this will inhibit them
from participating in farm or house work, thereby
increasing opportunity costs. This is an indicator that SMR
has caused increased opportunity costs to students in
remote poor areas.
With regard to respondents’ attitudes, 71.6 % of parents
and 57.0 % of students felt they had economic pressure
resulting from both direct and opportunity costs, which had
increased post-SMR (see Table 13). These economic dif-
ficulties have been observed before (California County
Superintendents Educational Services Association 2002).
Table 10 Ordinal logit results analyzing factors impacting students’
academic performance
Dependent variable: grade of academic score (1 = high level;
2 = middle level; 3 = low level)
Male = 1, female = 0 -.031
Age, year 0.249
Experience SMR (1 = yes) -.025
Parents are both working in agriculture (1 = yes) -.010*
Father is migrant worker (1 = yes) .125*
Mother is migrant workers (1 = yes) -.189*
Parents are both migrant workers (1 = yes) -.537**
Boarding in school (1 = yes) -.482***
Schooling distance (km) -.428**
Number of qualified teachers .868***
Size of class -.002
Constant 1 -.497*
Constant 2 .501*
*Significant at 10 %; ** Significant at 5 %; *** Significant at 10 %.
Pearson v2 = 11362.756, sig = 0.752; Deviance test = 0.807
Table 11 Issues of most
concern according to students
and parents since SMR
The issue which the students most worry
about
Students Parents
Number Percentage (%) Number Percentage (%)
Increased the economic burden on parents 6,107 53.5 3,213 45.2
Longer commute to school 2,968 26.4 2,229 31.6
Others 1,070 9.6 1,477 17.8
Bullied by the students from other villages 891 7.3 234 3.9
Cannot get used to the school environment 544 3.2 89 1.5
School mapping restructure in rural China 721
123
Author's personal copy
In addition, SMR has aggravated pressures on student
life. Based on our survey, this point can be explained by
two tracks. First, for students walking between home and
school, either accompanied by parents or walking inde-
pendently, the potentially dangerous terrain is a big chal-
lenge, especially in bad weather, provoking additional
parental worry for their charges’ safety. Second, for stu-
dents boarding at school from a young age, they face daily
difficulties, such as an inability to handle daily tasks such
as laundry and washing. Some rural schools have no toilets
inside dormitory buildings, which results in an increased
incidence of bed-wetting among young children. In sum-
mary, in remote rural areas, neither students who walk to
school nor those who board can conveniently enjoy
schooling following SMR. Students must suffer hardships
in order to gain an education, as has been argued by some
researchers (Fan 2006; Pang 2006; Xiong 2007).
Increased teacher workload
The authorized size of classes in primary schools is
between 40 and 45 students, and between 45 and 50
students in county and rural secondary schools (Ministry of
Education of the People’s Republic of China 1982).
However, many class sizes have exceeded this limit,
especially since SMR. It is fairly common for there to be
50–60 students per class in most rural primary schools, and
60–70 students per class in rural middle schools. Addi-
tionally, the number of teachers did not increase enough to
follow the increase in class size. For example, from our
survey, the average ratio of teacher to student of primary
school in the six provinces decreased from 1/20.7 to 1/25.2,
and the average teacher to student ratio in secondary school
decreased from 1/19.3 to 1/19.9 (see Table 14). As such,
teachers have a huge organizational task to perform to
teach such large classes. Their time is almost fully occu-
pied in teaching and lesson preparation, giving them little
personal time. In addition, managing boarding school
arrangements is also tasked to teachers despite their already
large teaching workloads. In rural areas, there is a lack of
teachers, especially at auxiliary level, due to an unwill-
ingness to work in rural areas with poor conditions and low
salaries. Therefore, the ‘‘irrational expansion of class size’’
during SMR has resulted in an increased teacher workload.
Conclusions and implications
Based on the empirical study of SMR undertaken in the six
surveyed provinces, evidence suggests that SMR may have
resulted in some positive effects regarding greater econo-
mies of scale, improved school conditions and educational
quality, and more equitable distribution of educational
resources.
First, post-SMR, the overall number of schools in the six
surveyed provinces decreased while the scale of schools
increased. With the increase in school scale, gains were
made in terms of educational resources allocated to each
school, resulting in improvements in economies of scale.
Therefore, evidence regarding the scale of investigated
schools and rural primary schools nationally, combined
with the viewpoint of survey respondents, supports the
view that SMR has increased economies of scale in
schools. This was also presented in the theory of educa-
tional economy of scale (Carnoy 1995), in which the
economic efficiencies brought on by an expansion in
Table 12 Extra expenditure for students in consolidated primary
schools: the case of Pingmeng central primary school in Pingmeng
village, Shiquan County, Shaanxi province
Items of expenditure Expenditure per semester
Small rural schools Consolidated
schools
Accommodation (RMB) 0 80
Food (RMB) At home, \200 600
Transportation (RMB) 0 240
Table 13 Family difficulties providing school expenditures
Respondents Yes No Not clear
answer
Total
Parents Quantity 1,918 759 – 2,677
Percentage (%) 71.6 28.4 – 100
Students Number 3,133 1,515 852 5,500
Percentage (%) 57.0 27.5 15.5 100
Table 14 Ratios of teachers to students in rural primary and secondary schools before and after SMR in six provinces
Average Shaanxi Guangxi Hubei Yunnan Henan Inner Mongolia
Primary School Pre-SMR 1:20.7 1:21.1 1:24.7 1:23.6 1:20.0 1:22.1 1:12.6
Post-SMR 1:25.2 1:28.6 1:29.5 1:26.5 1:24.1 1:27.2 1:15.2
Secondary School Pre-SMR 1:19.3 1:18.3 1:22.5 1:17.9 1:17.2 1:20.5 1:15.9
Post-SMR 1:19.9 1:20.1 1:21.4 1:20.7 1:19.2 1:21.5 1:16.6
722 D. Zhao, B. Parolin
123
Author's personal copy
school scale were discussed. This paper suggests that these
theoretical considerations were borne out by SMR.
Second, SMR has improved educational quality by
providing better educational resources, including better
teachers and better facilities. After SMR, a large number of
rural school-age children were transferred from small rural
schools to larger central schools and thus could enjoy
higher quality education; the outcome of which was felt by
students and parents alike. Illustrated by evaluations made
by each group, it may be concluded that SMR has gener-
ated a positive impact on educational quality. This also
chimes with the findings of Zhuo (2006), suggesting that
SMR enhances equity by providing poorer children with
access to schools that are supported with better educational
resources.
Third, SMR has promoted a reasonable and balanced
distribution of educational resources, evidenced by the CV
value of educational resource distribution in each sampling
county. This was also consistent with the orientation of the
Chinese government. As issued by the national government
in 2005 and 2010 (Ministry of Education of the People’s
Republic of China 2005, 2010), ‘‘equilibrium of educa-
tional development’’ has been an important policy in recent
years, aiming at equalizing educational resources across
schools. In other words, educational resources should be
distributed evenly among schools and areas. In this context,
SMR was considered a powerful instrument for achieving
this goal, and as intended, SMR has indeed promoted the
balanced development of education.
Despite significant progress associated with SMR in
Chinese rural schools in recent years, the emergence of
new problems has posed a challenge to SMR. These
problems have been compounded by the disparity of eco-
nomical and geographical conditions of the rural regions
concerned. Based on this investigation, the main problems
associated with SMR can be summarized into four aspects:
time taken to commute to school, hardships for access to
quality education faced by poor students, family financial
constrains and increased teacher workload.
First, SMR has engendered longer commutes for some
children, especially those living in remote poor areas.
Despite increasing numbers of rapidly growing urban areas
in China today, some people continue to live in small,
isolated villages or dispersed settlements. Thus, in isolated
mountainous areas with high peaks and low-quality road
infrastructure, students from poor families have no viable
transport options except to walk, making it hard to attend
school. From an international perspective, the longest
traveling distances and times are significantly beyond the
normal catchment radius of 1 km and 0.5 h recommended
by the IIEP (Lehman 2003). Learnt from this study, com-
paring to the international standard, there are still a number
of hard-to-reach children in China who carry considerable
travel burdens in order to attend school, a situation which is
at odds with international standards.
Second, such long commutes are likely to impact neg-
atively on these students’ performance at school. Although
a number of people in each group saying that SMR posi-
tively impacting educational quality in consolidated
schools, the micro statistics of this survey revealed that,
when facts including parents’ occupation, schooling dis-
tance, etc., taken together, the impact of SMR on students’
academic performances became much more complicated.
In other words, SMR did not have significant positive
impacts on students’ academic performance, while the
other factors such as parents’ working in agriculture,
boarding at school, longer commute to school, etc., sig-
nificantly and negatively impacted on students’ academic
performance. Thus, it can be concluded that, in the process
of SMR implementation, there are many hidden issues that
need additional focus, so as to improve SMR performance.
Third, the survey results also suggest that students in
consolidated schools had elevated costs, which caused
economic constraints to most families in remote areas.
Furthermore, some parents expressed concern that students
from low-income families might even drop out due to the
high costs of attending consolidated schools. Increased
expenditure caused by SMR therefore has indeed con-
strained family economies, negatively impacting on chil-
dren’s likelihood of completing compulsory education.
Research on educational economics also shows that an
increase or decrease in the private cost of education can
significantly influence the rate of universalization of edu-
cation (Sheehan 1973).
Fourth, increased numbers of students in classes made it
harder for teachers to handle class organization and man-
agement. Our survey has showed that, during SMR, along
with the number of small rural schools centralized into
larger consolidated schools, the size of schools and some-
times the size of classes increased. However, the number of
teachers appeared not to match this development. There-
fore, limited numbers of teachers have to teach ever more
students and be responsible for their discipline manage-
ment, as well as other issues resulting from the larger class
sizes. This increases the work burden of the teachers.
Due to problems involving longer commutes and eco-
nomic constraints for the students and their families, plus
the work burden on teachers, it is quite clear that there is
little scientific plan and verification for SMR implemen-
tation in rural China. In fact, as the key actors for SMR
implementation, governments at county level generally
rely on their direct experience to make decisions as to
which school should be closed or retained, rather than
adopt scientific approaches. Largely, as a consequence of
this, negative impacts on the students and their families
have emerged following SMR.
School mapping restructure in rural China 723
123
Author's personal copy
Thus, the key strategy should be to apply a scientific
approach to SMR implementation. From the international
perspective, as popularized in many countries, GIS should
be employed when designing scientific plans for SMR
implementation in rural China, as advocated by IIEP (e.g.
Caillods 1983; Attfield et al. 2002; Hite and Hite 2004).
Through GIS, all related data such as terrains, elevations,
roads, locations of schools, villages, any other institutions,
etc., can be gathered so as to generate visualized maps.
More importantly, with all the data imported, GIS can do
the analysis explaining how to make micro-plans for
mapping new schools, consolidating schools, solving real
difficulties faced by students during SMR, etc. In summary,
there is no doubting the role of GIS in the monitoring,
evaluation and impact assessment of SMR in China or its
role in the whole educational planning and management
environment.
On the other hand, multiple groups of participants
should be involved in the SMR process. As an educational
policy which focuses on rationalizing physical locations of
schools based on the demands of populations within special
catchment areas, SMR mainly involves the interests of four
groups: educational administrators, teachers, students and
parents. Thus, participation by the respondents is very
significant. This suggests that active participation, such as
meeting with respondents involving teachers, students and
parents, should be practiced to gather the information of
educational situations in different localities. The process,
as presented above, also indicates that multiple groups
should work together to form partnerships, examine all
possible variables, and make well-informed decisions when
implementing SMR.
The other major recommendation would be for efforts
to be made to increase the supply of qualified teachers to
rural schools. Several strategies associated with the
remuneration policy should be applied. First, more qual-
ified teachers should be increased in the consolidated
schools, according to the national standard of the ‘‘Ratio
of teacher to student.’’ Second, living allowances for
teachers in small rural schools should be increased, by
establishing job-specific subsidies and improving housing
conditions. Third, teachers of special subjects such as fine
arts, English and information technology should be
allowed to move between neighboring rural schools,
reducing teacher shortages in these subjects. Fourth, a
rotation plan for rural teachers should be implemented.
For some remote small rural schools, the problem of
teacher shortages is much more serious than at other
schools. Thus, a certain number of qualified teachers
could be sent to small rural schools to work for a period
of three to 5 years, with a new group of teachers sent to
replace them on their return.
Limitations and further research
This research has found that SMR has contributed to a
greater economy of scale in education, enhanced educa-
tional conditions and more balanced development of edu-
cation. However, it is also found that SMR has created
problems, such as longer traveling distance, economic
constraints on families and increased teacher workloads. It
appears that there is still a fundamental lack of structured
plan and groups’ participation. To deal with these issues,
the authors have proposed that policy-makers should make
scientific plans using GIS technology as is done in the other
countries, let multiple groups participate in the SMR pro-
cess, and enable governments at national and provincial
level to take responsibility of funding rural schools. In
summary, the implementation of SMR must be a two-step
process. If adjustments can be made to SMR implemen-
tation in the future, better performance is a likely outcome.
This study has suffered from a number of limitations,
namely a lack of information to justify conclusive state-
ments on indicators for economy of scale and equilibrium
in educational development. Some explanations rely on the
views of respondents involved in SMR, theoretical
approaches and data derived from the Ministry of Educa-
tion. To gain better results, a more detailed set of data must
be acquired. Improving data collection and administrator
training are necessary.
In future studies, room for research exists regarding
issues of transportation of remote rural students. How to
design school bus routes based on physical distance and
topographical conditions while taking economic efficien-
cies into consideration is a topic likely to attract attention
from researchers and policy-makers.
• The construction of boarding schools is another related
question of merit. Based on difficulties faced by
boarding students after SMR, a thorough investigation
of boarding schools in terms of financing the construc-
tion, assessing academic performance and psycholog-
ical changes of boarding students is worthy of further
study.
• As found in this survey, the closure of large number of
small rural schools in remote areas has inevitably
resulted in longer commute for students attending
school, as well as other negatives for their families.
Thus, issues associated with small rural schools such as
educational quality should be of major concern to
researchers.
• The relationship between school size, class size and
academic performance is another key question to
consider. Alongside SMR, school size and class scale
have increased significantly. One of the goals of SMR
724 D. Zhao, B. Parolin
123
Author's personal copy
was to improve educational quality as it has close
relationship with academic performance. A fundamen-
tal questions remain therefore: Have SMR-related
increases in school size and class scale had an impact
on student achievement? Is there a perfect school and
class size which will maximize student academic
performance?
Acknowledgments The project (The Progress of the Project on
Rational School Mapping Structure of the Rural Primary and Sec-
ondary Schools in central and western China (RSMS)) was funded by
a Sino-UK bilateral grant-in-aid ‘‘Basic Education in Western Areas
Project,’’ DFID, World Bank and Finance Bureau of MOE of China.
We are very grateful to DFID and the World Bank for their long-term
support of and contribution to rural basic education, especially in
central and western China. This paper is also one of the research
results of the Project ‘‘SMR in western rural China: Issues of small
rural schools—Empirical study by GIS application,’’ funded by
Chinese Ministry of Education (Project Number: 12YJC880157).
References
Alvarez, J. A., Loucagos, D., & Rashid, S. (2010). A cost-benefitanalysis of school regionalization in Massachusetts. Paperprepared for interactive qualifying project. Worcester: Worces-
ter Polytechnic Institute.
Attfield, I., Tamiru, M., Parolin, B., & DeGrauwe, A. (2002).
Improving micro-planning in education through a geographicalinformation system: Studies on Ethiopia and Palestine. Paris:
IIEP/UNESCO.
Berry, C. (2004). School inflation: Did the twentieth-century growth
in school size improve education? Education Next, 4(4), 56–62.
Blauwkamp, J., Longo, P., & Anderson, J. (2011). School consoli-
dation in Nebraska: Economic efficiency versus rural community
life. Online Journal of Rural Research and Policy, 6(1), 1–20.
Caillods, F. (1983). Module I: School mapping and micro-planning
concepts and processes. In F. Caillods, J. Casselli, T. N. Chau, &
G. Porte (Eds.), Training materials in educational planning,administration and facilities: School mapping and micro-plan-ning in education. Paris: IIEP/UNESCO.
California County Superintendents Educational Services Association
(2002). Declining enrollment in California. Retrieved from July
14, 2011. http://wwwstatic.kern.org/gems/ccsesaAtWork/Declining
Enrollmentpaper3.pdf.
Carnoy, M. (1995). International encyclopedia of economics ofeducation (2nd ed.). Oxford: Elsevier Science Press.
Cato, H. B. (2011) The effects of school enrollment size on student
achievement. A Thesis submitted to the faculty of the graduate
school of arts and sciences of Georgetown University. Wash-
ington, DC. April 15.
Chan, C. Y., & Harrell, S. (2009). School consolidation in rural
Sichuan: Quality versus equality. In M. L. Zhou & A. M. Hill
(Eds.), Affirmative action in China and the US: A dialogue oninequality and minority education (pp. 143–166). New York:
Palgrave Macmillan.
Cooley, D. A. (2012). Small school district consolidation in Texas: Ananalysis of its impact on costs and student achievement(Unpublished doctoral dissertation). Stephenville, TX: Tarleton
State University.
De Haan, M., Leuven, E., & Oosterbeek, H. (2011). Scale economies
can offset the benefits of competition: Evidence from a school
consolidation reform in a universal voucher system. (IZA DP
No. 5528).
DeYoung, A. J., & Howley, C. (1990). The political economy of
school consolidation. Peabody Journal of Education, 4(67),
63–89.
Fan, X. Z. (2006). Studies on the reason, motivation and pattern
selection of adjusting primary and secondary school distribution
in rural areas. Education and Economy, 82(1), 26–29. (in
Chinese).
Fan, X. Z. (2009). Rational structure of primary and secondaryschools in rural mid-western China. Chinese social science
press. (in Chinese).
Fanning, J. (1995). Rural school consolidation and student learning.
Retrieved from ERIC database. (ED384484).
Fitchen, J. M. (1991). Endangered spaces, enduring places, change,identity and survival in rural America. Boulder: Westview Press.
Fitzwater, C. O. (1953). Educational change in reorganized schooldistricts. Washington: US Government Printing Office.
Hargreaves, E., Montero, C., Chau, N., Sibli, M., & Thanh, T. (2001).
Multigrade teaching in Peru, Sri Lanka and Vietnam: An
overview. International Journal of Educational Development,21, 499–520.
Hite, S. J., & Hite, J. M. (2004). Geographical information systems ineducation planning and management: A training module createdfor the IIEP/UNESCO. Paris: IIEP/UNESCO.
Howard, J. Y., Wrobel, S. L., & Nitta, K. A. (2010). Implementing
change in an urban school district: A case study of the
reorganization of the little rock school district. Public Admin-istration Review, 70(6), 934–941. doi:10.1111/j.1540-6210.
2010.02229.x.
Jimerson, L. (2007). Slow motion: Traveling by bus in consolidated
districts in West Virginia. Rural school and community trust.(ERIC Document Reproduction Service No. ED499440).
Johnson, J. (2004). Small works in Nebraska: How poverty and thesize of school systems affect school performance in Nebraska.
Arlington, VA: Rural School and Community Trust. Retrieved
from August 10, 2009. www.files.ruraledu.org/docs/nebraska/
Small_Works_In_Nebraska_FINAL_01-04.pdf.
Kay, S., Hargood, N., & Russell, R. K. (1982). The effect ofconsolidation on fidelity to traditional value systems. Frankfort:
Kentucky State University Community Research Service.
Kennedy, N., & MacDougall, M. (2007). School closure processreview: Review committee report and recommendations.
Retrieved from September 30, 2011. www.pomquet.ednet.ns.ca/
School_Closure_Review_Final_Report.pdf.
LaPlante, R. J. (2005). School consolidation: An ineffective way of
improving education. Flint Hills Center for Public Policy, 2(9),
1–2.
Lehman, D. (2003). Bringing the school to the children: Shorteningthe path to EFA. Retrieved from September 30, 2011. www.
siteresources.worldbank.org/EDUCATION/Resources/Education-
Notes/EdNotesRuralAccessInitiative.pdf.
Li, S. Y. (2000). Theory of rural education. Nanjing, China: Jiangsu
Education Publishing House. (in Chinese).
Liu, C. F., Zhang, L. X., Luo, R. F., Rozelle, S., & Loyalka, P. (2010).
The effect of primary school mergers on academic performance
of students in rural China. International Journal of EducationalDevelopment, 30, 570–585.
Lu, K., & Du, Y. H. (2010). Effects of school consolidation on
students’ academic performance. Tsinghua Journal of Educa-tion, 31(6), 64–73.
McHenry-Sorber, E. (2009). School consolidation in Pennsylvania:
An analysis of Governor Rendell’s policy proposal. The Beacon:A Publication of the Pennsylvania School Study Council, 5(4),
1–17.
School mapping restructure in rural China 725
123
Author's personal copy
Ministry of Education of the People’s Republic of China (1982).
Planning for elementary and primary school buildings’ area quotas
(on trail). Retrieved from September 30, 2011. www.
people.com.cn/item/flfgk/gwyfg/1982/206013198201.html.
Ministry of Education of the People’s Republic of China. (1998).
Education statistical year book. Beijing: People’s Education
Press.
Ministry of Education of the People’s Republic of China. (2005).
Notice of advancing balanced development of compulsoryeducation. Retrieved from May 04, 2010. http://www.moe.gov.
cn/publicfiles/business/htmlfiles/moe/s3321/201001/xxgk_81809.
html.
Ministry of Education of the People’s Republic of China. (2009).
Education statistical year book. Beijing: People’s Education
Press.
Ministry of Education of the People’s Republic of China. (2010).
National program for medium- and long-term educational reform
and development. http://www.moe.gov.cn/publicfiles/business/
htmlfiles/moe/moe_177/201008/93785.html.
Mo, D., Yi, H. M., Zhang, L. X., Shi, Y. J., Rozelle, S., & Medina, A.
(2012). Transfer paths and academic performance: The primary
school merger program in China. International Journal ofEducational Development, 32(3), 423–431.
Murry, V., & Groen, R. (2004). Competition or consolidation? Theschool district consolidation debate revisited (Report No. 189).
Phoenix, AZ: Goldwater Institute. Retrieved from January 12,
2011. www.goldwaterinstitute.org/article/1223.
Nitta, K., Holley, M., & Wrobel, S. (2010). A phenomenological
study of rural school consolidation. Journal of Research in RuralEducation, 25(2), 1–19.
Pang, L. J. (2006). School mapping restructure in rural China:
Problems, reasons and solutions. Exploring Educational Devel-opment, 4, 1–6. (in Chinese).
Peshkin, A. (1982). The imperfect union: School consolidation andcommunity conflict. Chicago: University of Chicago Press.
Plucker, A. J., Spradlin, E. T., Magaro, M. M., Chien, W. R., Zapf, S.
J. (2007). Assessing the policy environment for school corpora-tion collaboration, cooperation, and consolidation in Indiana(Policy Brief No. 5). Retrieved from September 30, 2011.
http://ceep.indiana.edu/projects/PDF/PB_V5N5.pdf.
Purcell, D., & Shackelford, R. (2005). An evaluation of the impact of
rural school consolidation: What challenges may a new round of
rural school consolidations have on the ‘‘safety,’’ ‘‘educational
performance’’ and ‘‘social environment’’ of rural communities?
Paper presented at National Rural Education Association, Fort
Collins, CO.
Rural School and Community Trust. (2000). School consolidation andtransportation policy: An empirical and institutional analysis.
Arlington, VA: K. Killeen & J. Sipple.
Rural School and Community Trust. (2002). Closing costs: A
summary of an award winning look at school consolidation in
West Virginia, a state where it has been tried aggressively.
Retrieved from September 30, 2011 Hhttp://www.ruraledu.
org/articles.php?id=2043H.
Shakrani, S. M. (2010). School district consolidation study in 10Michigan counties: Is district consolidation cost effective? Whatis the alternative to consolidation? (Working Paper No. 15). East
Lansing, MI: Education Policy Center at Michigan State
University.
Shavers, A. W. (2003). Rethinking the equity versus adequacy debate:
Implications for rural school finance reform litigation. Universityof Nebraska Law Review, 82, 133–189.
Sheehan, J. (1973). The economics of education. London: George
Allen and Unwin Press.
Spradlin, T. E., Carson, F. R., Hess, S. E., & Plucker, J. E. (2010).
Revisiting school district consolidation issues. Education PolicyBrief, 8(3), 1–20.
Standard & Poor’s. (2007). Study of the cost-effectiveness ofconsolidating Pennsylvania districts: Profiles of paired districts.
New York: Standard & Poor’s School Evaluation Services.
State Council of the People’s Republic of China. (2001). The decision
to reform and develop basic education. Retrieved from Septem-
ber 30, 2011. www.edu.cn/20010907/3000665.shtml.
Theobald, P., & Nachtigal, P. (1995). Culture, community and the
promise of rural education. Phi Delta Kappan, 2(77), 132–135.
University of Arkansas, Office for Education Policy (2005). A firstlook at the impacts of district and school consolidation (PolicyBrief No. 20). Fayetteville, AR: Author.
Voth, D. E., & Danforth, D. M. (1981). Effect of schools upon small
community growth and decline. The Rural Sociologist, 1(6),
364–369.
Walberg, H., & Fowler, W. (1987). Expenditure and size efficiencies
of public school districts. Educational Researcher, 16(7), 5–13.
Xiong, X. M. (2007). Reflection on the present adjustment of primary
and secondary school distribution in rural areas. Education andEconomy, 84(2), 50–53. (in Chinese).
Yang, L. (2010). Reviews and reflections upon the policy of school
mapping restructure. Blue book of education: Annual report onChina’s education 2010 (pp. 73–85). Beijing, China: Social
Sciences Academic Press. (in Chinese).
Zhao, D., & Parolin, B. (2011). School mapping restructure in China:
What role for the small rural school? Frontiers of Education inChina, 6(2), 248–278.
Zhao, D., & Parolin, B. (2012). GIS analysis of school consolidation
in rural China: Process, problems and conclusion. Education andEconomy, 1, 13–18.
Zhuo, M. (2006). Primary school consolidation in rural China:
advantages, disadvantages and solutions. Education Forum, The
Education Department of Fujian Province. Retrieved February 9,
2011. from http:/218.85.72.34/newsInfo.aspx?pkld=10103. (in
Chinese).
726 D. Zhao, B. Parolin
123
Author's personal copy


