Embed Size (px)
Citation preview

HIGHER INFANT BLOOD LEAD LEVELS WITH LONGERDURATION OF BREASTFEEDING
Betsy Lozoff, MD1, Elias Jimenez, MD2, Abraham W. Wolf, PhD3, Mary Lu Angelilli, MD4,Jigna Zatakia, BA4, Sandra W. Jacobson, PhD5, Niko Kaciroti, PhD6, Katy M. Clark, MA6,Min Tao, MD, PhD6, Marcela Castillo, PhD7, Tomas Walter, MD8, and Paulina Pino, PhD9
1 Center for Human Growth and Development and Department of Pediatrics and CommunicableDiseases, University of Michigan, Ann Arbor, Michigan, USA2 Hospital Nacional de Niños, San Jose, Costa Rica3 Department of Psychiatry, MetroHealth Medical Center, Case Western Reserve UniversitySchool of Medicine, USA4 Department of Pediatrics, Wayne State University School of Medicine, Detroit, Michigan, USA5 Department of Psychiatry and Behavioral Neurosciences, Wayne State University School ofMedicine, Detroit, Michigan, USA6 Center for Human Growth and Development, University of Michigan, Ann Arbor, Michigan, USA7 Psychology Unit, Institute of Nutrition and Food Technology, University of Chile, Santiago, Chile8 Hematology Unit, Institute of Nutrition and Food Technology, University of Chile, Santiago, Chile9 Division of Epidemiology, School of Public Health, Faculty of Medicine, University of Chile,Santiago, Chile
AbstractObjective—To determine if longer breastfeeding is associated with higher infant leadconcentrations.
Study design—Data were analyzed from 3 studies of developmental effects of iron deficiencyin infancy: Costa Rica (1981–1984), Chile (1991–1996), and Detroit (2002–2003). Pearsonproduct-moment or partial correlation coefficients assessed the relation between duration ofbreastfeeding and lead levels.
Results—Over 93% of Costa Rica and Chile samples was breastfed, n = 179 and 323 breastfedinfants, respectively (mean weaning age, 8–10 months), as was 35.6% of the Detroit sample, n =53 breastfed infants (mean weaning age, 4.5 months). Lead concentrations averaged 10.8 μg/dL(Costa Rica, 12–23 months), 7.8 μg/dL (Chile, 12 months), and 2.5 μg/dL (Detroit, 9–10 months).Duration of breastfeeding as sole milk source and total breastfeeding correlated with leadconcentration in all samples (r values = .14 to .57, p values = .06 to <.0001).
Conclusions—Longer breastfeeding was associated with higher infant lead concentration in 3countries, in 3 different decades, in settings differing in breastfeeding patterns, environmental leadsources, and infant lead levels. The results suggest that monitoring lead concentrations in breastfedinfants be considered.
Corresponding author: Betsy Lozoff, M.D., Center for Human Growth and Development, 300 N Ingalls, University of Michigan, AnnArbor, MI 48109-5406. No reprints. Tel: 734-764-2443; Fax: 734-936-9288; [email protected] of interest statement: No author had a conflict of interest.
NIH Public AccessAuthor ManuscriptJ Pediatr. Author manuscript; available in PMC 2011 June 20.
Published in final edited form as:J Pediatr. 2009 November ; 155(5): 663–667. doi:10.1016/j.jpeds.2009.04.032.
NIH
-PA Author Manuscript
NIH
-PA Author Manuscript
NIH
-PA Author Manuscript

Keywordshuman; lactation; feeding; metals
INTRODUCTIONThe marked mobilization of maternal bone lead stores during lactation(1;2) raises the issueof lead transfer to the infant via breast milk.(3–6) In 1994 we made the incidentalobservation that blood lead concentration was higher with longer breastfeeding in a sampleof healthy full-term Costa Rican infants.(7) Here we pursued the finding in two othersamples and analyzed the Costa Rica data in more detail. These samples in 3 differentcountries were used to test the hypothesis that infants breastfed longer are at risk for higherlead concentrations.
METHODSSettings and subjects
Data on lead concentration and breastfeeding were obtained in the course of research on thebehavioral and developmental effects of iron deficiency in infancy. The settings of all 3studies – in Costa Rica, Chile, and the US – were urban or peri-urban. The study in CostaRica was conducted between 1981 and 1984.(7) Lead-based paints were not in use butgasoline was leaded. As established by the US Centers for Disease Control (CDC), the leadlevel of concern at that time was 25 μg/dL. The study in Chile was conducted between 1991and 1996 as Chile made the conversion to unleaded gasoline.(8) Housing was of recentconstruction and generally unpainted. The study in Detroit was conducted in 2002–2003 inan inner-city population. Leaded paint and gasoline had been legally banned for severaldecades.(9) The CDC’s cutoff for concern was 10 μg/dL during the time of the Chile andDetroit studies.
Subject enrollment was restricted to full-term healthy infants in the Costa Rica and Chilestudies. The Costa Rica sample consisted of 12- to 23-month-old infants enrolled throughcommunity-based door-to-door screening (n = 191).(10) The sample in Chile was enrolled incommunity clinics at well child care visits at 4 to 6 months. Lead concentrations wereavailable for 331 infants.(11) In the US, a sample of African-American infants was enrolledat 9-month health maintenance visits at an inner-city hospital. All such infants were invitedto participate over a one-year period; lead concentrations were available for 167 of 198infants.(9) For Costa Rica and Detroit, lead concentrations were determined on enrollment;for Chile, they were determined when infants were 12 months old.
Signed informed consent was obtained from parents in each study. Study protocols wereapproved by the Institutional Review Boards (IRB) of Case Western Reserve University forthe Costa Rica study and the University of Michigan for the Chile and Detroit studies. IRBsof the Hospital Nacional de Niños, the University of Chile, and Wayne State University alsoapproved protocols for Costa Rica, Chile, and Detroit, respectively. Details of the studieshave been previously reported.(9–11)
ProceduresTwo variables reflected the duration of breastfeeding: weeks of breastfeeding as the solesource of milk and weeks of total breastfeeding (calculated from the age at completeweaning from the breast). In each sample, project personnel obtained information on infantfeeding from the infant’s mother. For the Detroit sample, the duration of breastfeeding as the
Lozoff et al. Page 2
J Pediatr. Author manuscript; available in PMC 2011 June 20.
NIH
-PA Author Manuscript
NIH
-PA Author Manuscript
NIH
-PA Author Manuscript

sole source of milk was also determined from chart review of health care visits; pediatriciansrecorded feeding data from birth on. Some data from mothers entailed recall, especially inthe Costa Rica sample in which infants were enrolled at 12–23 months of age. For Chile,contact with infants started at about 4 months, and feeding information was obtainedprospectively thereafter during weekly home visits. Because of the strength of this datacollection, that is, weekly and in-person, we will emphasize results from this sample. Dataon age at starting juice and solids were not sufficiently complete across studies to beanalyzed.
Infant lead concentrations were determined in venous blood, which was anticoagulated withEDTA and stored frozen at −20°C in lead-free vials if not assayed immediately. Laboratoryprocedures for lead assays in the Costa Rica and Chile samples were under direct CDCquality control specifications. All laboratories maintained strict quality control using internaland external standards. For the Costa Rica sample, lead levels were determined by a graphitefurnace method using a matrix modification procedure.(12) For the Chile sample, leadconcentration was determined by electrothermal atomization (graphite furnace HGA700)atomic absorption spectrophotometry (Perkin Elmer 1100B, Boston MA).(13) For theDetroit sample, the Detroit Medical Center University Laboratories performed lead assaysby atomic absorption using a graphite furnace.(14) Previous analyses showed that measuresof iron status did not relate to lead concentrations in these samples.(7–9)
StatisticsInformation on feeding and lead levels has been previously published as part of sampledescriptions for the iron deficiency studies.(8–10) In these secondary analyses, we focus onnormal birth weight breastfed infants in each sample for whom lead concentrations wereavailable. Three breastfed infants in the Detroit sample had birth weight < 2500 g and wereexcluded from analysis. The associations between lead concentration and the duration ofbreastfeeding as the sole source of milk and total breastfeeding in weeks was analyzed usingSAS 9.1.(15) For infants who were still being breastfed when the lead concentration wasobtained, their current age was used as the duration of total breastfeeding. A single unifiedanalysis was not possible, since the samples did not overlap sufficiently in age, duration ofbreastfeeding at the longer end, or lead levels > 5 μg/dl. Therefore, the association had to bedetermined within sample.
Pearson product-moment correlations were calculated when background factors were notassociated with lead concentration and breastfeeding duration in a given sample. Multiplelinear regression was used to calculate partial correlation coefficients when a backgroundfactor might be a confounder, that is, even weakly correlated (p < .10) with both thesevariables. In addition, we considered as a covariate any background variable that wascorrelated with lead concentration (p < .10). The following background variables wereconsidered: gender, age at testing, birth weight, gestational age, birth order, weight-for-agez-score or WAZ, weight-for-length z-score or WHZ, maternal age, maternal education, andfamily socioeconomic status (SES). We derived the most parsimonious models that includedall background factors independently contributing to the models.
RESULTSBreastfeeding was near universal in the Latin American samples (93.7% and 97.6% in CostaRica and Chile samples, respectively), whereas 35.6% of infants in the Detroit sample werebreastfed. Table 1 shows the characteristics of breastfed infants in each sample (Costa Rica,n = 179; Chile, n = 323; Detroit, n = 53). Regarding family characteristics, mothers in CostaRica and Chile averaged 9.5 years of education, and 62–76% were married. Families wereworking- to middle-class. In the Detroit sample, maternal education averaged 12.8 years.
Lozoff et al. Page 3
J Pediatr. Author manuscript; available in PMC 2011 June 20.
NIH
-PA Author Manuscript
NIH
-PA Author Manuscript
NIH
-PA Author Manuscript

Only 14.7% were married, and 85% of families had Medicaid insurance, indicatingconsiderable economic stress.
The patterns of breastfeeding differed markedly across samples (Table 1). The meanduration of breastfeeding as the sole source of milk was 4–5 months in the Latin Americansamples, in contrast to less than 2 months in the Detroit sample. Complete weaning from thebreast (duration of total breastfeeding) occurred on average at about 8 –10 months in CostaRica and Chile samples and 4.5 months in Detroit. In Costa Rica, 9.5% of the infants werestill nursing when enrolled at 12 to 23 months;(10) 29.8% of the Chilean infants were stillnursing when they completed the study at 12 months.(11) In the Detroit sample, < 8%infants were nursing when enrolled at 9–10 months.
The mean lead concentrations were also distinctly different across studies (Table 1). Themean in the Costa Rica sample was close to 11 μg/dL, and 53% of infants hadconcentrations of 10 μg/dL or higher. The mean in the Chile sample was close to 8 μg/dL,and 26% were above the cutoff. The highest concentrations in both Latin American sampleswere 21–22 μg/dL. In contrast, the mean lead concentration in the Detroit sample was < 3μg/dL; the highest concentration was 8.0 μg/dL, and only 7.8% of values were above 5 μg/dL.
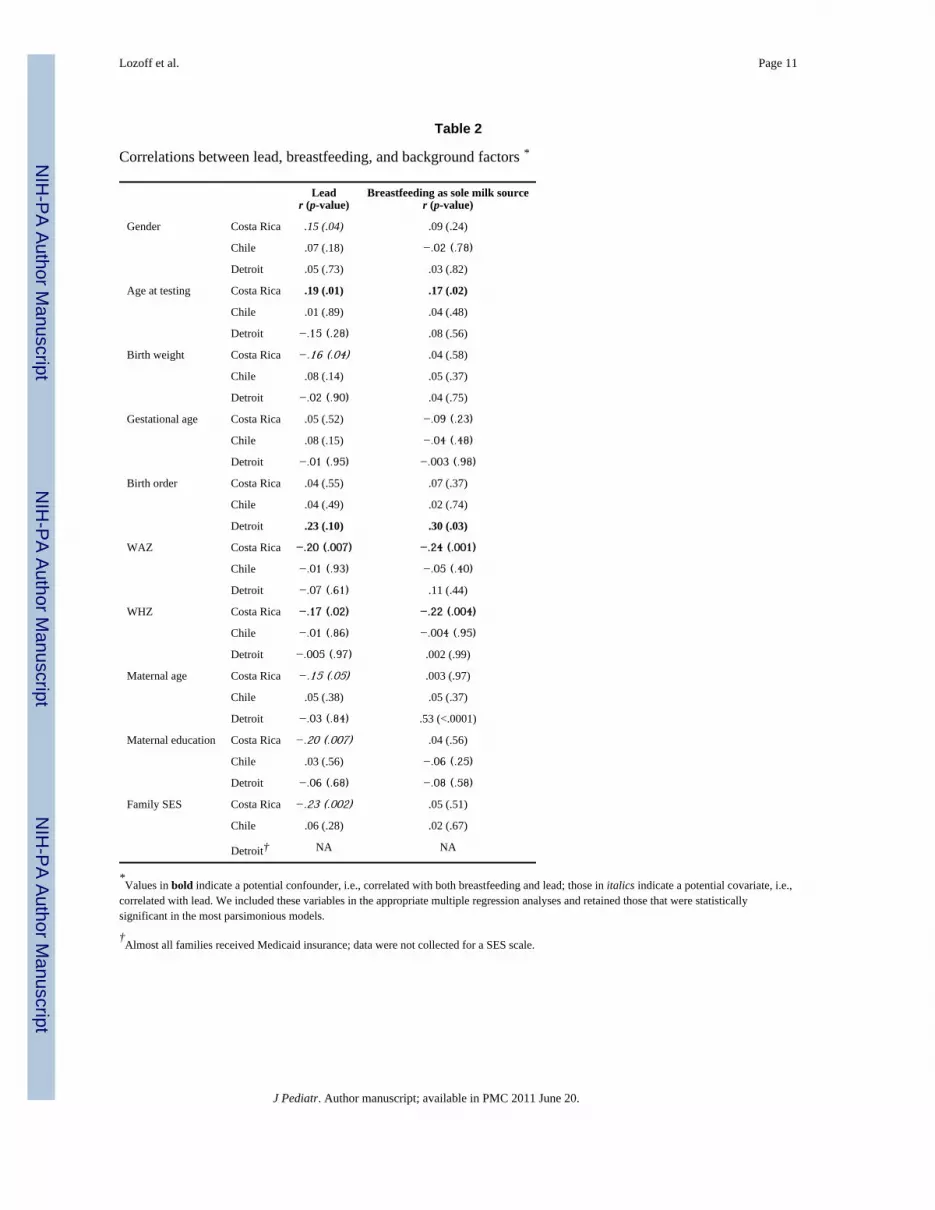
Table 2 shows background factors and their correlations with lead concentration and theduration of breastfeeding as the sole milk source in each sample (correlations with durationof total breastfeeding available on request). For the Costa Rica sample, the mostparsimonious model included infant age (potential confounder), birth weight, and SES. ForDetroit, birth order was a potential confounder; there were no other covariates. For Chile, nobackground variable related to either breastfeeding or lead concentration.
As reported previously as an incidental finding,(7) there was a positive correlation betweenthe total duration of breastfeeding and infant lead levels in the Costa Rica sample. Thepartial correlations between lead and the duration of breastfeeding as the sole milk sourceand total breastfeeding were .19 and .16, respectively, controlling for infant age, birthweight, and SES. Even stronger correlations were observed in the Chile and Detroit samplesfor the duration of breastfeeding as the sole source of milk, r values = .23 and .56,respectively (controlling for birth order in the Detroit sample). The corresponding r valuesfor total breastfeeding were .17 and .31. All data points and the regression lines in the 3samples are shown for the associations between lead and duration of breastfeeding as thesole source of milk (Figure 1) and total breastfeeding (Figure 2), controlling for backgroundfactors as indicated.
DISCUSSIONLonger breastfeeding was associated with higher infant lead concentrations in 3 differentcountries, in 3 different decades, in settings that differed in the prevalence and duration ofbreastfeeding, the use of unleaded gasoline, and mean infant lead levels. The findings in theChile and Detroit samples confirm our earlier observation in the sample from Costa Rica.
The association between lead concentration and duration of breastfeeding as the sole milksource was weakest in Costa Rica, perhaps because the infants were considerably older thanin Detroit and Chile samples. This difference is plausible because breast milk is likely tocontribute less to infants’ lead burden as they get older and have longer periods ofenvironmental exposure and normal developmental behaviors, such as mouthing andindependent locomotion. The Costa Rica sample was also the only one with a wide agerange, compared to the other studies, and largely retrospective data on breastfeeding, whichcould introduce inaccuracy and potential bias. We also emphasize that the Detroit sample, in
Lozoff et al. Page 4
J Pediatr. Author manuscript; available in PMC 2011 June 20.
NIH
-PA Author Manuscript
NIH
-PA Author Manuscript
NIH
-PA Author Manuscript

particular, was small, and breastfeeding was shorter and less intense than the other samples.Thus, we have the most confidence in the associations observed in the Chile sample. It wasnot only the largest but also the one with the best data on breastfeeding, i.e., obtainedprospectively beginning at 4–6 months during weekly home visits.
Some investigators have reported low lead levels in breast milk or noted that formulacontributes similar, if not more, lead to the infant’s diet(3;4) and concluded that increasedlead levels in breastfed babies are not a significant public health concern. However, thephysiologic rationale for concern is strong. Even with no current environmental exposure,lead accumulates in maternal bones from past exposure. During lactation, a period ofheightened bone turnover, maternal bone lead redistributes from bone into plasma and intobreast milk.(1;2) Our results are consistent with this physiology mechanism. With a longerduration of breastfeeding, the infant would have an opportunity to accumulate more lead asmaternal blood lead is redistributed into breast milk. Our findings support the conclusion ofEttinger et al.(5) that “[t]his phenomenon constitutes a potential public health problem inareas where environmental lead exposure is continuing as well as in areas whereenvironmental lead exposure has recently declined.”(p. 926) Our observations should beconfirmed and extended in future studies. Longitudinal intergenerational studies are neededto understand how maternal lead burden in infancy and childhood affects lead in breast milkand infant lead levels. Interactions between minerals, such as calcium and lead, also warrantfurther investigation.
Our study has important limitations. As the figures show, there was insufficient overlapbetween samples in lead concentrations or breastfeeding duration to support a unifiedanalysis. Rather, each sample had to be analyzed separately. Furthermore, we could notanalyze cumulative lead burden, because lead was measured at a single time point in theChile and Detroit samples and only over a 3-month period for the Costa Rica sample. TheCosta Rica data were collected at what is typically the age period for peak lead levels, butinfants in the Chile and Detroit samples were younger, and we have no data on their leadlevels in the second year of life. We also had no data on maternal lead levels in bone orblood. Thus, we could not directly test the hypothesized mechanism or address fundamentalquestions about the relations between lead in maternal bone, maternal blood, breast milk,and infant blood. Our results point to a need for further research on these relations and themechanisms that account for them. We also could not determine if maternal blood leadconcentrations during pregnancy could be used in a selective screening process, i.e., toidentify infants at particular risk for higher lead concentrations with longer breastfeeding.
Our findings do not detract from the many known benefits of breastfeeding. Rather, theysuggest that monitoring lead concentrations in breastfed infants should be considered. Thereis increasing concern about adverse developmental effects of lead at even very low levels,(16;17) which has contributed to updated policy statements. Some recommend lowering theblood lead action level.(18) The American Academy of Pediatrics recommends thatpediatric health care providers consider universal screening if there are no state guidelinesother than for infants participating in Medicaid or WIC.(19) However, state guidelines vary,and many breastfed infants do not meet state criteria for screening. If our results are born outin other samples, additional monitoring of breastfed infants may be indicated until there aregenerations of mothers who grow up with little lead exposure and infants with littleenvironmental exposure themselves.
AcknowledgmentsThe content is solely the responsibility of the authors and does not necessarily represent the official views of theNational Institute of Child Health and Human Development or the National Institutes of Health in the US orFONDECYT in Chile. We are grateful to Yuezhou Jing, MA, for assistance in preliminary data analyses, to the
Lozoff et al. Page 5
J Pediatr. Author manuscript; available in PMC 2011 June 20.
NIH
-PA Author Manuscript
NIH
-PA Author Manuscript
NIH
-PA Author Manuscript

laboratories that performed the lead assays, to project staff members in each country who so carefully collected thedata, and to study families for their generous participation.
Support: Grant numbers R01 HD14122, R37 HD31606, R01 HD33487, and P01 HD039386, B. Lozoff, principalinvestigator, from the US National Institute of Child Health and Human Development and 195-0772, P. Pino,principal investigator, from the Chilean Fondo Nacional de Desarrollo Cientifico y Technológico (FONDECYT).
Role of the study sponsors: The study sponsors had no role in the study design, collection, analysis, andinterpretation of data, writing of the report, or decision to submit for publication.
References1. Manton W, Angle C, Stanek K, Kuntzelman D, Reese Y, Kuehnemann T. Release of lead from bone
in pregnancy and lactation. Environ Res. 2003; 92:139–51. [PubMed: 12854694]2. Gulson B, Mizon K, Korsch M, Palmer J, Donnelly J. Mobilization of lead from human bone tissue
during pregnancy and lactation--a summary of long-term research. Sci Total Environ. 2003;303:79–104. [PubMed: 12568766]
3. Rabinowitz M, Leviton A, Needleman H. Lead in milk and infant blood: a dose-response model.Arch Environ Health. 1985; 40(5):283–6. [PubMed: 4062363]
4. Gundacker C, Pietschnig B, Wittmann KJ, Lischka A, Salzer H, Hohenauer L, et al. Lead andmercury in breast milk. Pediatrics. 2002; 110(5):873–8. [PubMed: 12415023]
5. Ettinger AS, Tellez-Rojo MM, Amarasiriwardena C, Bellinger D, Peterson K, Schwartz J, et al.Effect of breast milk lead on infant blood lead levels at 1 month of age. Environ Health Perspect.2004; 112(14):1381–5. [PubMed: 15471729]
6. Counter SA, Buchanan LH, Ortega F. Lead concentrations in maternal blood and breast milk andpediatric blood of Andean villagers: 2006 follow-up investigation. J Occup Environ Med. 2007;49(3):302–9. [PubMed: 17351516]
7. Wolf AW, Jimenez E, Lozoff B. No evidence of developmental ill effects of low-level leadexposure in a developing country. J Dev Behav Pediatr. 1994; 15:224–31. [PubMed: 7528225]
8. Pino P, Walter T, Oyarzun M, Lozoff B. Rapid drop in infant blood lead levels during the transitionto unleaded gasoline use in Santiago, Chile. Arch Environ Health. 2004; 59(4):182–7. [PubMed:16189990]
9. Lozoff B, Angelilli ML, Zatakia J, Jacobson SW, Calatroni A, Beard JL. Iron status of inner-cityAfrican-American infants. Am J Hematol. 2007; 82:112–21. [PubMed: 17019689]
10. Lozoff B, Brittenham GM, Wolf AW, McClish DK, Kuhnert PM, Jimenez E, et al. Iron deficiencyanemia and iron therapy: effects on infant developmental test performance. Pediatrics. 1987;79:981–95. [PubMed: 2438638]
11. Lozoff B, De Andraca I, Castillo M, Smith J, Walter T, Pino P. Behavioral and developmentaleffects of preventing iron-deficiency anemia in healthy full-term infants. Pediatrics. 2003;112:846–54. [PubMed: 14523176]
12. Fernandez FJ, Hillegos D. An improved graphite furnace method for the determination of lead inblood using matrix modification and the L’vov platform. Atomic Spectroscopy. 1982; 3:1300–11.
13. Ballew C, Khan LK, Kaufmann R, Mokdad A, Miller DT, Gunter EW. Blood lead concentrationand children’s anthropometric dimensions in the Third National Health and Nutrition ExaminationSurvey (NHANES III), 1988–1994. J Pediatr. 1999; 134(5):623–30. [PubMed: 10228299]
14. Slavin W. Graphite furnace AAS for biological materials. Sci Total Environ. 1988; 71:17–35.15. SAS 9.1. Cary, NC: SAS Institute Inc; 2003.16. Lanphear BP, Hornung R, Khoury J, Yolton K, Baghurst P, Bellinger DC, et al. Low-level
environmental lead exposure and children’s intellectual function: an international pooled analysis.Environ Health Perspect. 2005; 113(7):894–9. [PubMed: 16002379]
17. Canfield RL, Henderson CR Jr, Cory-Slechta DA, Cox C, Jusko TA, Lanphear BP. Intellectualimpairment in children with blood lead concentrations below 10 microg per deciliter. New Eng JMed. 2003; 348:1517–26. [PubMed: 12700371]
18. Gilbert SG, Weiss B. A rationale for lowering the blood lead action level from 10 to 2 microg/dL.Neuro Toxicology. 2006; 27(5):693–701.
Lozoff et al. Page 6
J Pediatr. Author manuscript; available in PMC 2011 June 20.
NIH
-PA Author Manuscript
NIH
-PA Author Manuscript
NIH
-PA Author Manuscript
19. American Academy of Pediatrics Committee on Environmental Health. Lead exposure in children:prevention, detection, and management. Pediatrics. 2005; 116(4):1036–46. [PubMed: 16199720]
Lozoff et al. Page 7
J Pediatr. Author manuscript; available in PMC 2011 June 20.
NIH
-PA Author Manuscript
NIH
-PA Author Manuscript
NIH
-PA Author Manuscript

Figure 1.Relation between lead concentration and duration of breastfeeding as the sole source ofmilk. All data points are shown: Costa Rica □, Chile △, Detroit ○. Regression lines areshown for each sample (Costa Rica , Chile , Detroit ) along with thePearson correlation coefficient for Chile and partial correlation coefficients for Costa Ricaand Detroit. ** p < .01, *** p < .001
Lozoff et al. Page 8
J Pediatr. Author manuscript; available in PMC 2011 June 20.
NIH
-PA Author Manuscript
NIH
-PA Author Manuscript
NIH
-PA Author Manuscript
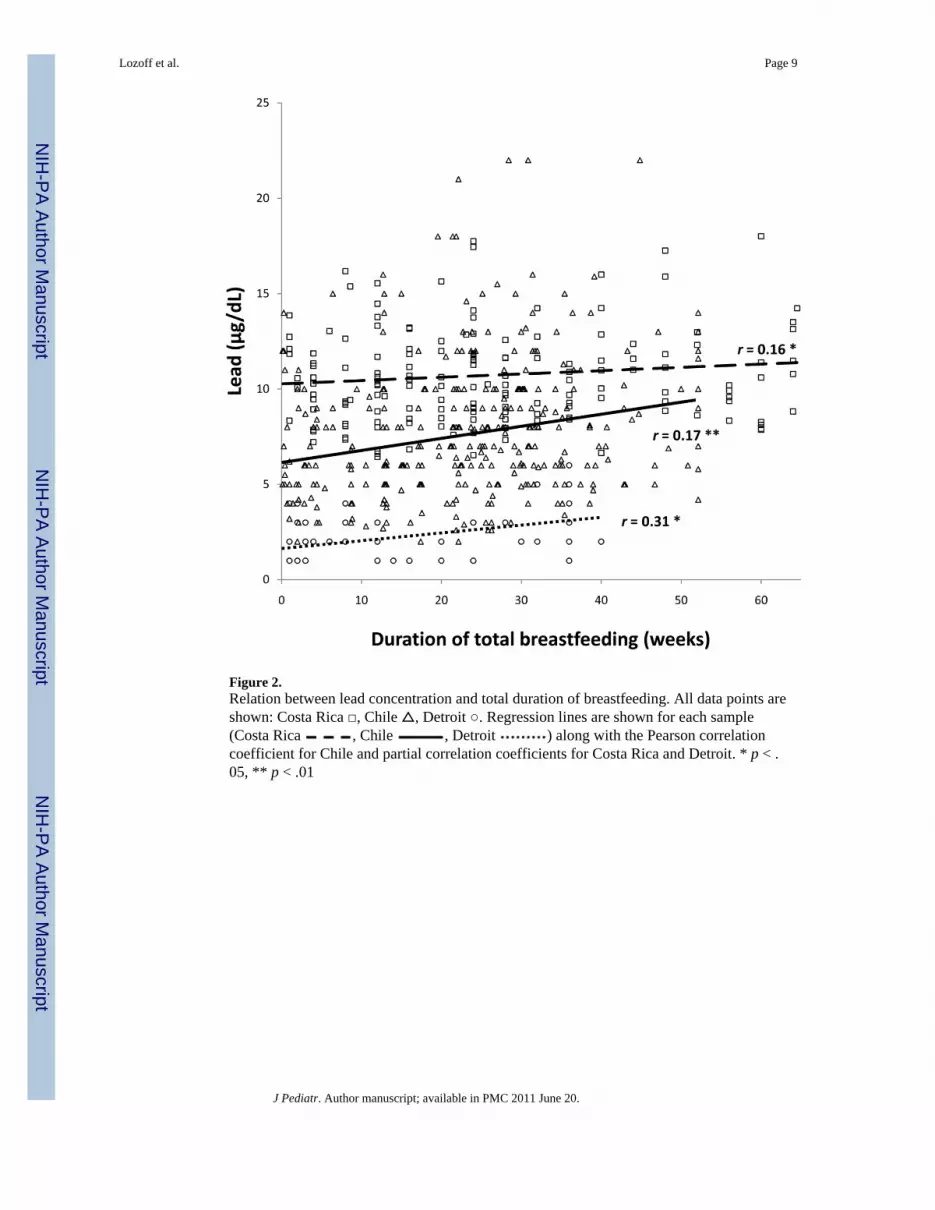
Figure 2.Relation between lead concentration and total duration of breastfeeding. All data points areshown: Costa Rica □, Chile △, Detroit ○. Regression lines are shown for each sample(Costa Rica , Chile , Detroit ) along with the Pearson correlationcoefficient for Chile and partial correlation coefficients for Costa Rica and Detroit. * p < .05, ** p < .01
Lozoff et al. Page 9
J Pediatr. Author manuscript; available in PMC 2011 June 20.
NIH
-PA Author Manuscript
NIH
-PA Author Manuscript
NIH
-PA Author Manuscript

NIH
-PA Author Manuscript
NIH
-PA Author Manuscript
NIH
-PA Author Manuscript
Lozoff et al. Page 10
Table 1
Characteristics of breastfed infants*
N
Costa Rica Chile Detroit
179 323 53
Gender, % male (n) 55.3 (99) 52.6 (170) 45.3 (24)
Age at testing†, months 17.4 (3.2) 12.4 (0.2) 9.1 (0.5)
Birth weight, kg 3.26 (0.41) 3.61 (0.38) 3.55 (0.57)
Gestational age, weeks 39.4 (1.4) 39.6 (1.1) 39.5 (1.0)
Birth order 2.5 (1.6) 2.2 (1.2) 1.8 (1.0)
Breastfeeding as sole milk source, weeks 17.5 (18.1) 22.8 (13.0) 7.3 (11.8)
Total breastfeeding, weeks 32.0 (24.1) 41.5 (15.1) 18.7 (13.2)
Lead concentration, μg/dL whole blood 10.8 (2.6) 7.8 (3.6) 2.5 (1.5)
Weight-for-age z-score (WAZ) −.24 (1.01) −0.03 (1.02) 0.12 (1.13)
Weight-for-length z-score (WHZ) 0.09 (1.03) 0.48 (1.00) 0.56 (1.01)
*Values are mean (SD) for continuous variables and % for categorical variables.
†For Costa Rica and Detroit, age of enrollment and age at testing for lead, WAZ, and WHZ were the same. For Chile, infants were enrolled at 4–6
months in a clinical trial of preventing iron deficiency anemia; blood lead levels were determined at the conclusion of the trial at 12 months; WAZand WHZ at that age are shown.
J Pediatr. Author manuscript; available in PMC 2011 June 20.
NIH
-PA Author Manuscript
NIH
-PA Author Manuscript
NIH
-PA Author Manuscript
Lozoff et al. Page 11
Table 2
Correlations between lead, breastfeeding, and background factors *
Leadr (p-value)
Breastfeeding as sole milk sourcer (p-value)
Gender Costa Rica .15 (.04) .09 (.24)
Chile .07 (.18) −.02 (.78)
Detroit .05 (.73) .03 (.82)
Age at testing Costa Rica .19 (.01) .17 (.02)
Chile .01 (.89) .04 (.48)
Detroit −.15 (.28) .08 (.56)
Birth weight Costa Rica −.16 (.04) .04 (.58)
Chile .08 (.14) .05 (.37)
Detroit −.02 (.90) .04 (.75)
Gestational age Costa Rica .05 (.52) −.09 (.23)
Chile .08 (.15) −.04 (.48)
Detroit −.01 (.95) −.003 (.98)
Birth order Costa Rica .04 (.55) .07 (.37)
Chile .04 (.49) .02 (.74)
Detroit .23 (.10) .30 (.03)
WAZ Costa Rica −.20 (.007) −.24 (.001)
Chile −.01 (.93) −.05 (.40)
Detroit −.07 (.61) .11 (.44)
WHZ Costa Rica −.17 (.02) −.22 (.004)
Chile −.01 (.86) −.004 (.95)
Detroit −.005 (.97) .002 (.99)
Maternal age Costa Rica −.15 (.05) .003 (.97)
Chile .05 (.38) .05 (.37)
Detroit −.03 (.84) .53 (<.0001)
Maternal education Costa Rica −.20 (.007) .04 (.56)
Chile .03 (.56) −.06 (.25)
Detroit −.06 (.68) −.08 (.58)
Family SES Costa Rica −.23 (.002) .05 (.51)
Chile .06 (.28) .02 (.67)
Detroit† NA NA
*Values in bold indicate a potential confounder, i.e., correlated with both breastfeeding and lead; those in italics indicate a potential covariate, i.e.,
correlated with lead. We included these variables in the appropriate multiple regression analyses and retained those that were statisticallysignificant in the most parsimonious models.
†Almost all families received Medicaid insurance; data were not collected for a SES scale.
J Pediatr. Author manuscript; available in PMC 2011 June 20.


