Embed Size (px)
Citation preview
Materials Science and Engineering A 529 (2011) 275– 281
Contents lists available at SciVerse ScienceDirect
Materials Science and Engineering A
jo ur n al hom epage: www.elsev ier .com/ locate /msea
High-strength, lead-free machinable �–� duplex phase brass
Cu–40Zn–Cr–Fe–Sn–Bi alloys
Haruhiko Atsumia,∗, Hisashi Imaib, Shufeng Lib, Katsuyoshi Kondohb,Yoshiharu Kousakac, Akimichi Kojimac
a Graduate School of Engineering, Osaka University, 565-0871, 2-1, Yamadaoka, Suita, Osaka, Japanb Joining and Welding Research Institute, Osaka University, 567-0047, 11-1, Mihogaoka, Ibaraki, Osaka, Japanc San-etsu Metals Co. Ltd., 939-1315, 1892, Ohta, Tonami, Osaka, Japan
a r t i c l e i n f o
Article history:
Received 8 February 2011
Received in revised form 7 September 2011
Accepted 9 September 2011
Available online 22 September 2011
Keywords:
Brass
Lead-free
Bismuth
Machinability
Mechanical properties
High-strength
a b s t r a c t
High-strength, lead-free machinable �–� duplex phase brass (Cu–40Zn) with 0.3 mass% chromium,
0.2 mass% iron, 0.6 mass% tin, and 1–3 mass% bismuth (Cu–40Zn–Cr–Fe–Sn–Bi) were prepared using a
casting process, and their microstructures, mechanical properties, and machinability were investigated.
Cast Cu–40Zn–Cr–Fe–Sn–Bi exhibited �–� duplex phase structures dispersed with Cr–Fe intermetal-
lic compounds (IMCs) and spherical Bi particles that existed in the �-phase. The Bi particle size in this
phase was smaller than that of irregularly shaped Bi particles in or around the �-phase; thus, cast spec-
imens with large area fractions of the �-phase had more finely dispersed Bi particles. Furthermore, the
additional Bi did not react with the added solid solution strengthening elements of Cr, Fe, and Sn. Con-
versely, the extruded Cu–40Zn–Cr–Fe–Sn–Bi consisted of fine, uniform �–� duplex phases dispersed with
fine, discrete Cr–Fe IMCs, and the Bi particles were also slightly elongated along the extrusion direction.
Analysis of back-scattered SEM images determined that the number of Bi particles in the wrought alloy
matrix was 1500–3000/mm2 in the transverse cross-section of the extrusion direction. The average yield
strength (YS) and average ultimate tensile strength (UTS) of the extruded Cu–40Zn–Cr–Fe–Sn–Bi alloy
were 288 MPa and 601 MPa, respectively. Based on the similar tensile properties of this alloy to those
of Cu–40Zn–Cr–Fe–Sn, the main strengthening mechanism in the former alloy was due to solid solution
strengthening with elemental additives and the increased area present as the hard �-phase. Furthermore,
this extruded alloy exhibited an increase of 29% YS and 40% UTS compared to traditional machinable brass
Cu-40Zn with 3.2 mass% lead (Cu–40Zn–Pb). The machinability of the extruded Cu–40Zn–Cr–Fe–Sn–Bi
was also 25% lower than that of the Cu–40Zn–Pb alloy.
© 2011 Elsevier B.V. All rights reserved.
1. Introduction
Brass alloys are used for pipes, valves, and fittings in systems that
transport water and other aqueous fluids because of their excel-
lent corrosion resistance. Pb at levels of 2–5 mass% is also added
to traditional brasses to improve their machinability [1–5]. How-
ever, the addition of Pb to these materials is a significant, severe
hazard to the environment and human health [6,7]. Thus, mate-
rial designs must consider safety according to the regulations of
the Restriction of Hazardous Substance (RoHS) and Waste Electrical
and Electronic Equipment (WEEE) Directives [8–10]. As alternatives
to Pb, Bi, silicon (Si), and graphite (C) particles have been consid-
ered to improve the machinability of brass [11–15]. Bi has similar
properties to Pb, including its melting point, solid solubility in
∗ Corresponding author. Fax: +81 6879 8669.
E-mail address: [email protected] (H. Atsumi).
copper, and density. Furthermore, Bi does not pose a danger to the
environment or human health.
Methods for solid solution strengthening and increasing the area
fractions of the �-phase have been applied to brass materials to
improve their mechanical properties. Analysis of a Cu–Zn binary
phase diagram suggests that brass with 35–48 mass% Zn has suf-
ficient �–� duplex phase structures to yield suitable strength and
hot forginability. For example, commercial high-strength brass has
been used for marine propellers and bridge bearings due to its supe-
rior mechanical properties and corrosion resistance. This material
is alloyed with aluminum (Al), manganese (Mn), and Fe for solid
solution strengthening. Moreover, its matrix is strengthened by
an increase in the area fraction of the hard �-phase [16,17]. How-
ever, when larger amounts of elemental materials are added to the
alloy for strengthening, coarser and more brittle IMCs are produced
in the matrix. In particular, these IMCs drastically decrease the
machinability of brass materials. A trade-off in the balance between
hardness and machinability of these alloys has been reported in
0921-5093/$ – see front matter © 2011 Elsevier B.V. All rights reserved.doi:10.1016/j.msea.2011.09.029
276 H. Atsumi et al. / Materials Science and Engineering A 529 (2011) 275– 281
Table 1Chemical compositions of brass cast ingots used in this study (mass%).
Alloys Sn Pb Zn Ni Fe Al Cr Bi Cu
CAST1 0.59 −0.005 40.86 −0.004 0.22 −0.005 0.34 – Bal.
CAST2 0.595 −0.005 40.81 −0.004 0.229 −0.005 0.256 0.994 Bal.
CAST3 0.6 −0.005 40.64 −0.004 0.23 −0.005 0.26 2.02 Bal.
CAST4 0.578 −0.005 40.83 −0.004 0.219 −0.005 0.22 2.85 Bal.
the literature [18,19]. In the present study, new high-strength, Pb-
free machinable �–� duplex brass alloys with dispersed Bi particles
were produced using a casting and extrusion process. The effects
of Bi dispersoids on the mechanical properties and machinability
of the extruded specimens were investigated.
2. Materials and methods
Brass alloys were prepared using a casting process. Cu–40Zn
with additions of 0.3 mass% Cr, 0.2 mass% Fe, and 0.6 mass%
Sn (Cu–40Zn–Cr–Fe–Sn, CAST1) was prepared as a refer-
ence material, and Cu–40Zn–Cr–Fe–Sn with 1–3 mass% Bi
(Cu–40Zn–Cr–Fe–Sn–Bi, CAST2–4) were alloyed. Cu–Cr and Cu–Fe
alloys were melted at over 1673 K, and pure Zn, Sn, and Bi were
added to the molten alloys at 1273 K, followed by casting of the
alloys. The chemical compositions of the cast ingots are shown in
Table 1. The addition of small amounts of elemental Cr, Fe, and Sn
strengthened the �–� phase brass as described in previous reports
[20,21]. The cast ingots (60 mm in diameter) were machined into
billets with a diameter of 41 mm. The billets were extruded using a
hydraulic direct press machine (SHP-200-450, Shibayamakikai Co.)
with a press capacity of 2000 kN. The extrusion speed was 3 mm/s.
Before extrusion, the billets were preheated at 923 K for 180 s in an
atmosphere of Ar gas in a muffle furnace (KDF S-70, Denken Co.).
The final diameter of the ingots after hot extrusion was 7 mm. The
extruded CAST1–4 specimens are denoted as EXT1–4 in this study.
Microstructural observations and analyses of the cast and
extruded cast specimens were conducted using an optical
microscope (OM, BX-51P, Olympus), and scanning electron
microscope–electron dispersive spectroscopy (SEM–EDS, JSM-
6500F, Jeol; EX-64175JMU, Jeol), and the phase compositions
were identified using X-ray diffraction (XRD, XRD-6100, Shi-
madzu). Back-scattered electron images (BSIs) acquired with SEM
were used to evaluate the morphologies of Bi particles dis-
persed in the extruded specimens. The number of Bi particles was
measured using image analyses of the BSIs. For electron back-
scattered diffraction (EBSD) analyses, specimens with dimensions
of 10 mm × 7 mm × 3 mm were cut parallel to the extrusion direc-
tion from the extruded specimens. The specimens were ground
with #1000 and #4000 SiC abrasive papers and polished with
a 0.05 �m Al2O3 polishing suspension. They were then electro-
chemically polished in 30% HNO3 in methanol at 243 K and 30 V
for 3 s. EBSD texture measurements were conducted with an SEM
5mm Extruded brass alloy
Rotating speed900 rpm
Applied force
Drill
98 N
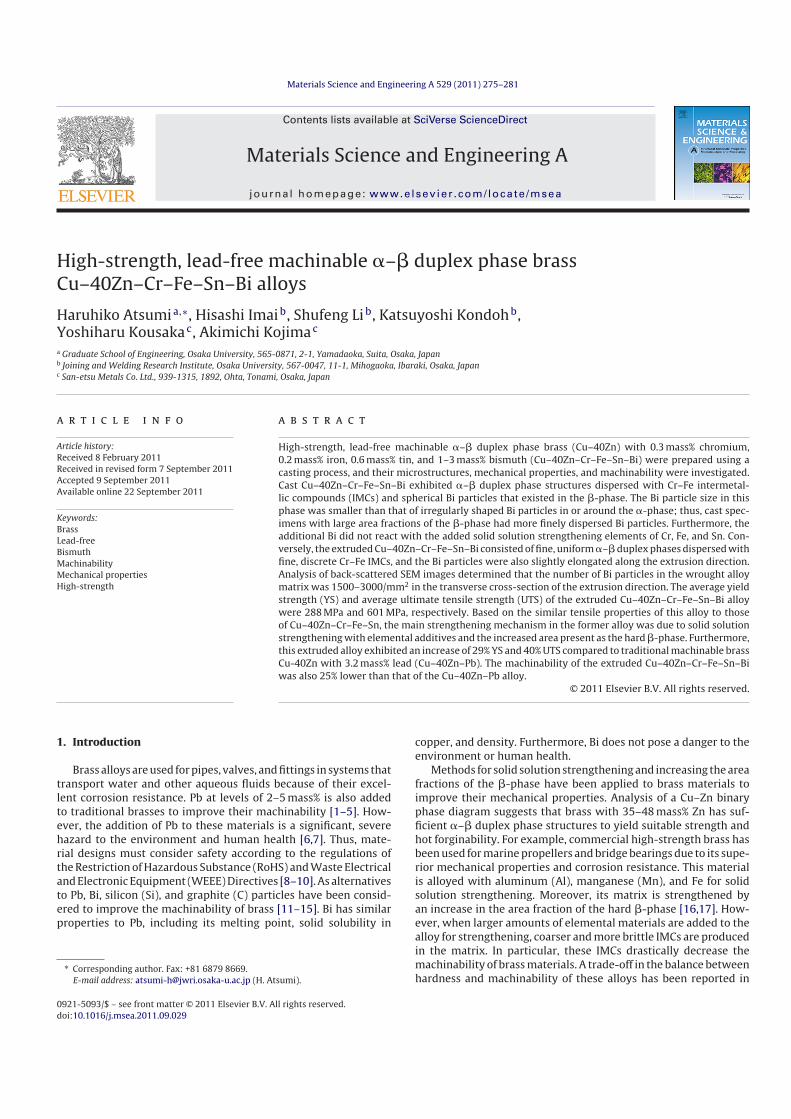
Fig. 1. Schematic illustration of experimental set-up of drilling test in this study.
equipped with a DigiView IV Detector (EDAX-TSL) and OIM Data
Collection 5.31 software (TSL Solutions K.K.).
For evaluations of machinability, drilling tests were performed
under dry conditions using a TiN-coated high-speed steel drill tool
(EX-SUS-GDS, OSG) with a 4.5 mm diameter. During drilling, the
drill rotation speed was 900 rpm, and the applied load was 98 N. The
experimental set-up is shown in Fig. 1. The drilling time to make a
hole with a 5 mm depth was measured; after repeating this drilling
test 10 times, the average drilling speed was used as a machinabil-
ity parameter for the extruded specimens. Mechanical properties
of the specimens were evaluated using tensile and hardness tests.
The extruded specimens were machined into tensile test specimens
with a 3 mm diameter in accordance with ICS 59.100.01. Tensile
tests were performed on a universal testing machine (Autograph
AG-X 50 kN, Shimadzu) with a strain rate of 5 × 10⁻⁴/s. Hardness
tests were performed using a Vickers microhardness tester (HMV-
2T, Shimadzu) with a testing load of 245.2 mN (0.025 kgf) for 15 s
at room temperature.
3. Results and discussion
3.1. Microstructure of cast ingots
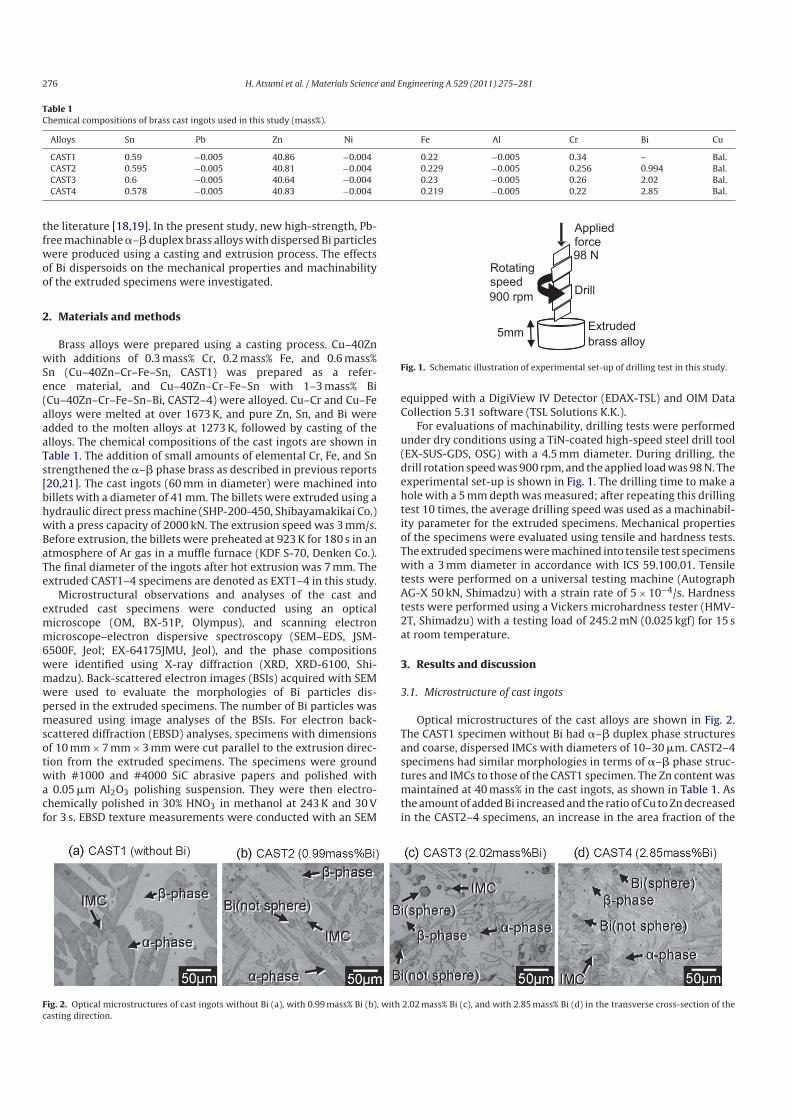
Optical microstructures of the cast alloys are shown in Fig. 2.
The CAST1 specimen without Bi had �–� duplex phase structures
and coarse, dispersed IMCs with diameters of 10–30 �m. CAST2–4
specimens had similar morphologies in terms of �–� phase struc-
tures and IMCs to those of the CAST1 specimen. The Zn content was
maintained at 40 mass% in the cast ingots, as shown in Table 1. As
the amount of added Bi increased and the ratio of Cu to Zn decreased
in the CAST2–4 specimens, an increase in the area fraction of the
Fig. 2. Optical microstructures of cast ingots without Bi (a), with 0.99 mass% Bi (b), with 2.02 mass% Bi (c), and with 2.85 mass% Bi (d) in the transverse cross-section of the
casting direction.
H. Atsumi et al. / Materials Science and Engineering A 529 (2011) 275– 281 277
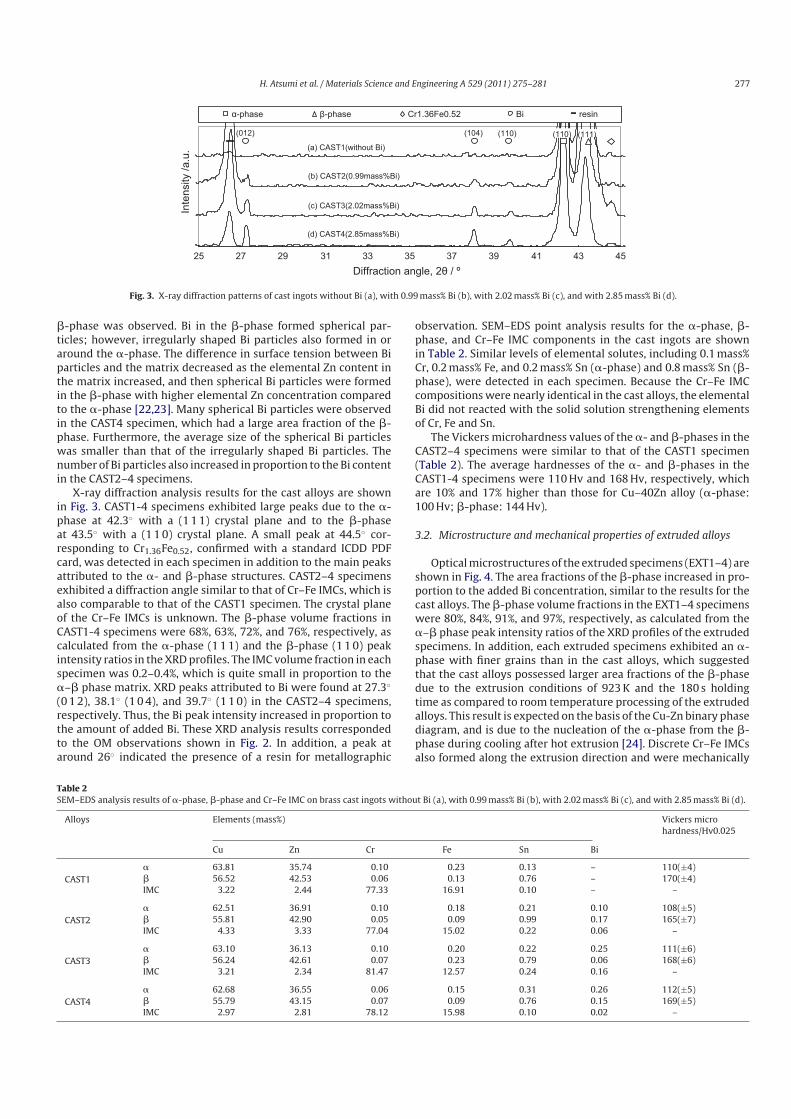
25 27 29 31 33 35 37 39 41 43 45
α-phase β-phase Cr1.36Fe0.52 Bi resin
Inte
nsity
/a.u
.
Diffraction angle, 2θ / º
(b) CAST2(0.99mass%Bi)
(c) CAST3(2.02mass%Bi)
(d) CAST4(2.85mass%Bi)
(a) CAST1(without Bi)
(012) (104) (110) (110) (111)
Fig. 3. X-ray diffraction patterns of cast ingots without Bi (a), with 0.99 mass% Bi (b), with 2.02 mass% Bi (c), and with 2.85 mass% Bi (d).
�-phase was observed. Bi in the �-phase formed spherical par-
ticles; however, irregularly shaped Bi particles also formed in or
around the �-phase. The difference in surface tension between Bi
particles and the matrix decreased as the elemental Zn content in
the matrix increased, and then spherical Bi particles were formed
in the �-phase with higher elemental Zn concentration compared
to the �-phase [22,23]. Many spherical Bi particles were observed
in the CAST4 specimen, which had a large area fraction of the �-
phase. Furthermore, the average size of the spherical Bi particles
was smaller than that of the irregularly shaped Bi particles. The
number of Bi particles also increased in proportion to the Bi content
in the CAST2–4 specimens.
X-ray diffraction analysis results for the cast alloys are shown
in Fig. 3. CAST1-4 specimens exhibited large peaks due to the �-
phase at 42.3◦ with a (1 1 1) crystal plane and to the �-phase
at 43.5◦ with a (1 1 0) crystal plane. A small peak at 44.5◦ cor-
responding to Cr1.36Fe0.52, confirmed with a standard ICDD PDF
card, was detected in each specimen in addition to the main peaks
attributed to the �- and �-phase structures. CAST2–4 specimens
exhibited a diffraction angle similar to that of Cr–Fe IMCs, which is
also comparable to that of the CAST1 specimen. The crystal plane
of the Cr–Fe IMCs is unknown. The �-phase volume fractions in
CAST1-4 specimens were 68%, 63%, 72%, and 76%, respectively, as
calculated from the �-phase (1 1 1) and the �-phase (1 1 0) peak
intensity ratios in the XRD profiles. The IMC volume fraction in each
specimen was 0.2–0.4%, which is quite small in proportion to the
�–� phase matrix. XRD peaks attributed to Bi were found at 27.3◦
(0 1 2), 38.1◦ (1 0 4), and 39.7◦ (1 1 0) in the CAST2–4 specimens,
respectively. Thus, the Bi peak intensity increased in proportion to
the amount of added Bi. These XRD analysis results corresponded
to the OM observations shown in Fig. 2. In addition, a peak at
around 26◦ indicated the presence of a resin for metallographic
observation. SEM–EDS point analysis results for the �-phase, �-
phase, and Cr–Fe IMC components in the cast ingots are shown
in Table 2. Similar levels of elemental solutes, including 0.1 mass%
Cr, 0.2 mass% Fe, and 0.2 mass% Sn (�-phase) and 0.8 mass% Sn (�-
phase), were detected in each specimen. Because the Cr–Fe IMC
compositions were nearly identical in the cast alloys, the elemental
Bi did not reacted with the solid solution strengthening elements
of Cr, Fe and Sn.
The Vickers microhardness values of the �- and �-phases in the
CAST2–4 specimens were similar to that of the CAST1 specimen
(Table 2). The average hardnesses of the �- and �-phases in the
CAST1-4 specimens were 110 Hv and 168 Hv, respectively, which
are 10% and 17% higher than those for Cu–40Zn alloy (�-phase:
100 Hv; �-phase: 144 Hv).
3.2. Microstructure and mechanical properties of extruded alloys
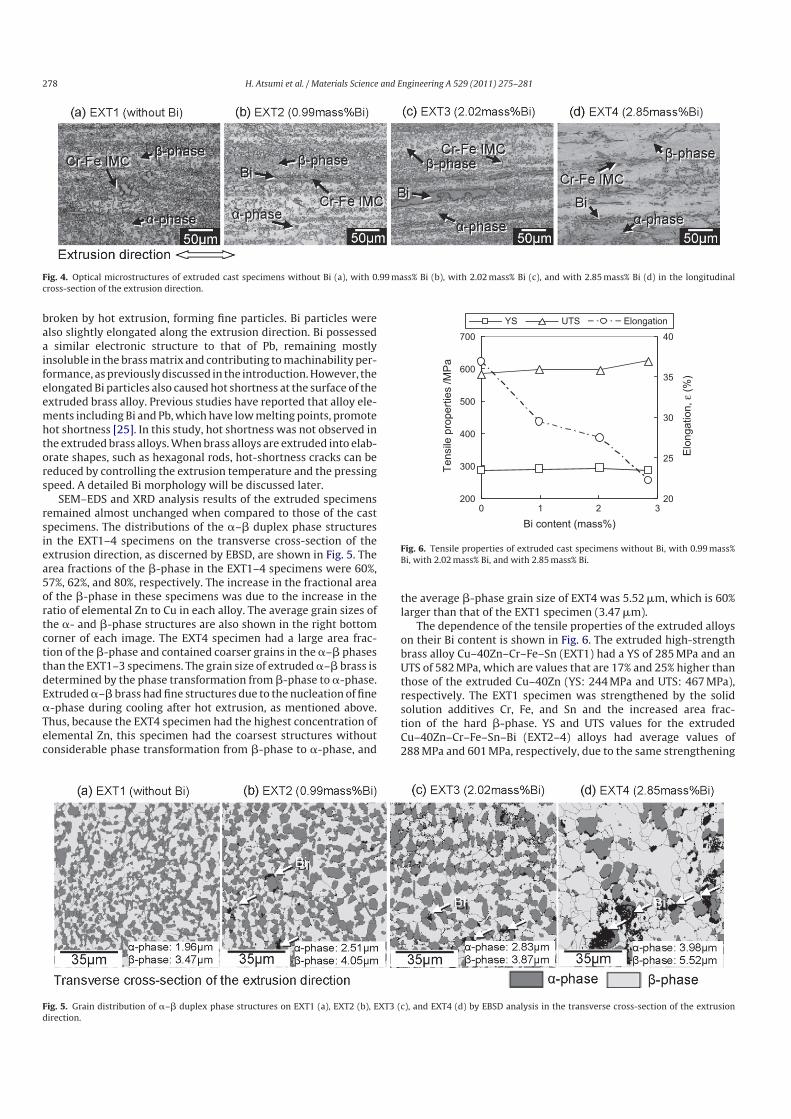
Optical microstructures of the extruded specimens (EXT1–4) are
shown in Fig. 4. The area fractions of the �-phase increased in pro-
portion to the added Bi concentration, similar to the results for the
cast alloys. The �-phase volume fractions in the EXT1–4 specimens
were 80%, 84%, 91%, and 97%, respectively, as calculated from the
�–� phase peak intensity ratios of the XRD profiles of the extruded
specimens. In addition, each extruded specimens exhibited an �-
phase with finer grains than in the cast alloys, which suggested
that the cast alloys possessed larger area fractions of the �-phase
due to the extrusion conditions of 923 K and the 180 s holding
time as compared to room temperature processing of the extruded
alloys. This result is expected on the basis of the Cu-Zn binary phase
diagram, and is due to the nucleation of the �-phase from the �-
phase during cooling after hot extrusion [24]. Discrete Cr–Fe IMCs
also formed along the extrusion direction and were mechanically
Table 2SEM–EDS analysis results of �-phase, �-phase and Cr–Fe IMC on brass cast ingots without Bi (a), with 0.99 mass% Bi (b), with 2.02 mass% Bi (c), and with 2.85 mass% Bi (d).
Alloys Elements (mass%) Vickers micro
hardness/Hv0.025
Cu Zn Cr Fe Sn Bi
CAST1
� 63.81 35.74 0.10 0.23 0.13 – 110(±4)
� 56.52 42.53 0.06 0.13 0.76 – 170(±4)
IMC 3.22 2.44 77.33 16.91 0.10 – –
CAST2
� 62.51 36.91 0.10 0.18 0.21 0.10 108(±5)
� 55.81 42.90 0.05 0.09 0.99 0.17 165(±7)
IMC 4.33 3.33 77.04 15.02 0.22 0.06 –
CAST3
� 63.10 36.13 0.10 0.20 0.22 0.25 111(±6)
� 56.24 42.61 0.07 0.23 0.79 0.06 168(±6)
IMC 3.21 2.34 81.47 12.57 0.24 0.16 –
CAST4
� 62.68 36.55 0.06 0.15 0.31 0.26 112(±5)
� 55.79 43.15 0.07 0.09 0.76 0.15 169(±5)
IMC 2.97 2.81 78.12 15.98 0.10 0.02 –
278 H. Atsumi et al. / Materials Science and Engineering A 529 (2011) 275– 281
Fig. 4. Optical microstructures of extruded cast specimens without Bi (a), with 0.99 mass% Bi (b), with 2.02 mass% Bi (c), and with 2.85 mass% Bi (d) in the longitudinal
cross-section of the extrusion direction.
broken by hot extrusion, forming fine particles. Bi particles were
also slightly elongated along the extrusion direction. Bi possessed
a similar electronic structure to that of Pb, remaining mostly
insoluble in the brass matrix and contributing to machinability per-
formance, as previously discussed in the introduction. However, the
elongated Bi particles also caused hot shortness at the surface of the
extruded brass alloy. Previous studies have reported that alloy ele-
ments including Bi and Pb, which have low melting points, promote
hot shortness [25]. In this study, hot shortness was not observed in
the extruded brass alloys. When brass alloys are extruded into elab-
orate shapes, such as hexagonal rods, hot-shortness cracks can be
reduced by controlling the extrusion temperature and the pressing
speed. A detailed Bi morphology will be discussed later.
SEM–EDS and XRD analysis results of the extruded specimens
remained almost unchanged when compared to those of the cast
specimens. The distributions of the �–� duplex phase structures
in the EXT1–4 specimens on the transverse cross-section of the
extrusion direction, as discerned by EBSD, are shown in Fig. 5. The
area fractions of the �-phase in the EXT1–4 specimens were 60%,
57%, 62%, and 80%, respectively. The increase in the fractional area
of the �-phase in these specimens was due to the increase in the
ratio of elemental Zn to Cu in each alloy. The average grain sizes of
the �- and �-phase structures are also shown in the right bottom
corner of each image. The EXT4 specimen had a large area frac-
tion of the �-phase and contained coarser grains in the �–� phases
than the EXT1–3 specimens. The grain size of extruded �–� brass is
determined by the phase transformation from �-phase to �-phase.
Extruded �–� brass had fine structures due to the nucleation of fine
�-phase during cooling after hot extrusion, as mentioned above.
Thus, because the EXT4 specimen had the highest concentration of
elemental Zn, this specimen had the coarsest structures without
considerable phase transformation from �-phase to �-phase, and
200
300
400
500
600
700
0 1 2 320
25
30
35
40
YS UTS Elongation
Elo
ngat
ion,
ε (%
)
Tens
ile p
rope
rties
/MPa
Bi content (mass%)
Fig. 6. Tensile properties of extruded cast specimens without Bi, with 0.99 mass%
Bi, with 2.02 mass% Bi, and with 2.85 mass% Bi.
the average �-phase grain size of EXT4 was 5.52 �m, which is 60%
larger than that of the EXT1 specimen (3.47 �m).
The dependence of the tensile properties of the extruded alloys
on their Bi content is shown in Fig. 6. The extruded high-strength
brass alloy Cu–40Zn–Cr–Fe–Sn (EXT1) had a YS of 285 MPa and an
UTS of 582 MPa, which are values that are 17% and 25% higher than
those of the extruded Cu–40Zn (YS: 244 MPa and UTS: 467 MPa),
respectively. The EXT1 specimen was strengthened by the solid
solution additives Cr, Fe, and Sn and the increased area frac-
tion of the hard �-phase. YS and UTS values for the extruded
Cu–40Zn–Cr–Fe–Sn–Bi (EXT2–4) alloys had average values of
288 MPa and 601 MPa, respectively, due to the same strengthening
Fig. 5. Grain distribution of �–� duplex phase structures on EXT1 (a), EXT2 (b), EXT3 (c), and EXT4 (d) by EBSD analysis in the transverse cross-section of the extrusion
direction.
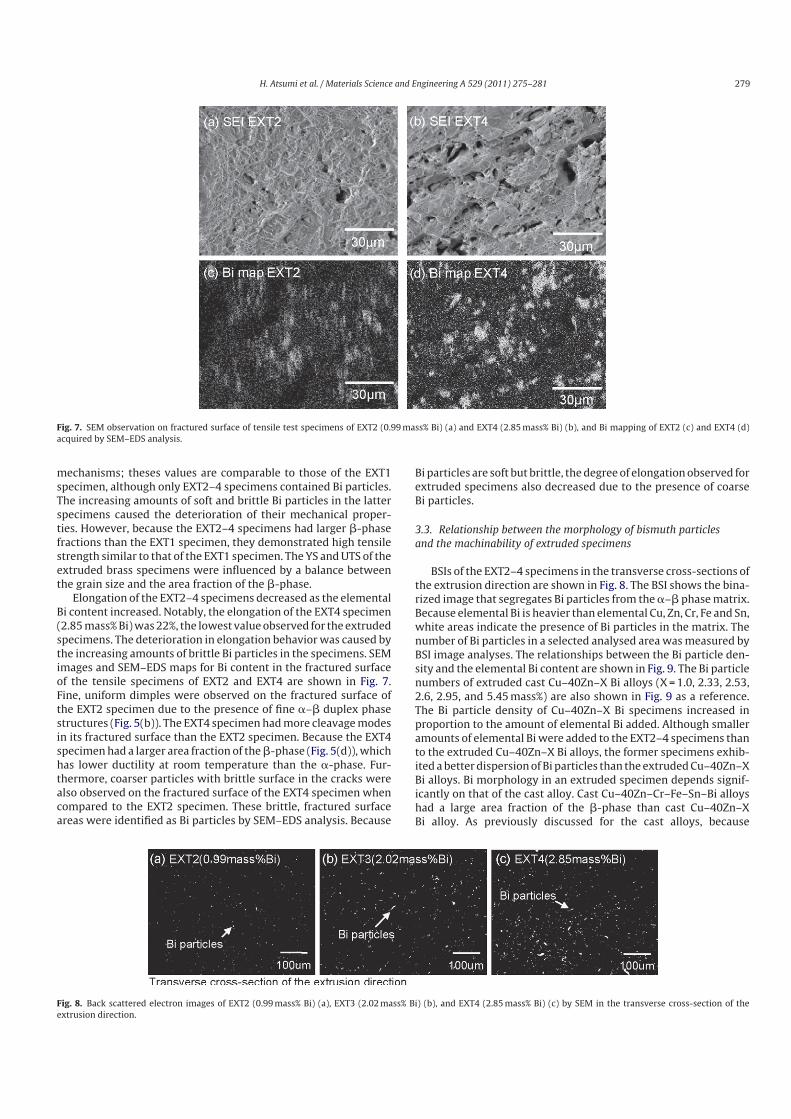
H. Atsumi et al. / Materials Science and Engineering A 529 (2011) 275– 281 279
Fig. 7. SEM observation on fractured surface of tensile test specimens of EXT2 (0.99 mass% Bi) (a) and EXT4 (2.85 mass% Bi) (b), and Bi mapping of EXT2 (c) and EXT4 (d)
acquired by SEM–EDS analysis.
mechanisms; theses values are comparable to those of the EXT1
specimen, although only EXT2–4 specimens contained Bi particles.
The increasing amounts of soft and brittle Bi particles in the latter
specimens caused the deterioration of their mechanical proper-
ties. However, because the EXT2–4 specimens had larger �-phase
fractions than the EXT1 specimen, they demonstrated high tensile
strength similar to that of the EXT1 specimen. The YS and UTS of the
extruded brass specimens were influenced by a balance between
the grain size and the area fraction of the �-phase.
Elongation of the EXT2–4 specimens decreased as the elemental
Bi content increased. Notably, the elongation of the EXT4 specimen
(2.85 mass% Bi) was 22%, the lowest value observed for the extruded
specimens. The deterioration in elongation behavior was caused by
the increasing amounts of brittle Bi particles in the specimens. SEM
images and SEM–EDS maps for Bi content in the fractured surface
of the tensile specimens of EXT2 and EXT4 are shown in Fig. 7.
Fine, uniform dimples were observed on the fractured surface of
the EXT2 specimen due to the presence of fine �–� duplex phase
structures (Fig. 5(b)). The EXT4 specimen had more cleavage modes
in its fractured surface than the EXT2 specimen. Because the EXT4
specimen had a larger area fraction of the �-phase (Fig. 5(d)), which
has lower ductility at room temperature than the �-phase. Fur-
thermore, coarser particles with brittle surface in the cracks were
also observed on the fractured surface of the EXT4 specimen when
compared to the EXT2 specimen. These brittle, fractured surface
areas were identified as Bi particles by SEM–EDS analysis. Because
Bi particles are soft but brittle, the degree of elongation observed for
extruded specimens also decreased due to the presence of coarse
Bi particles.
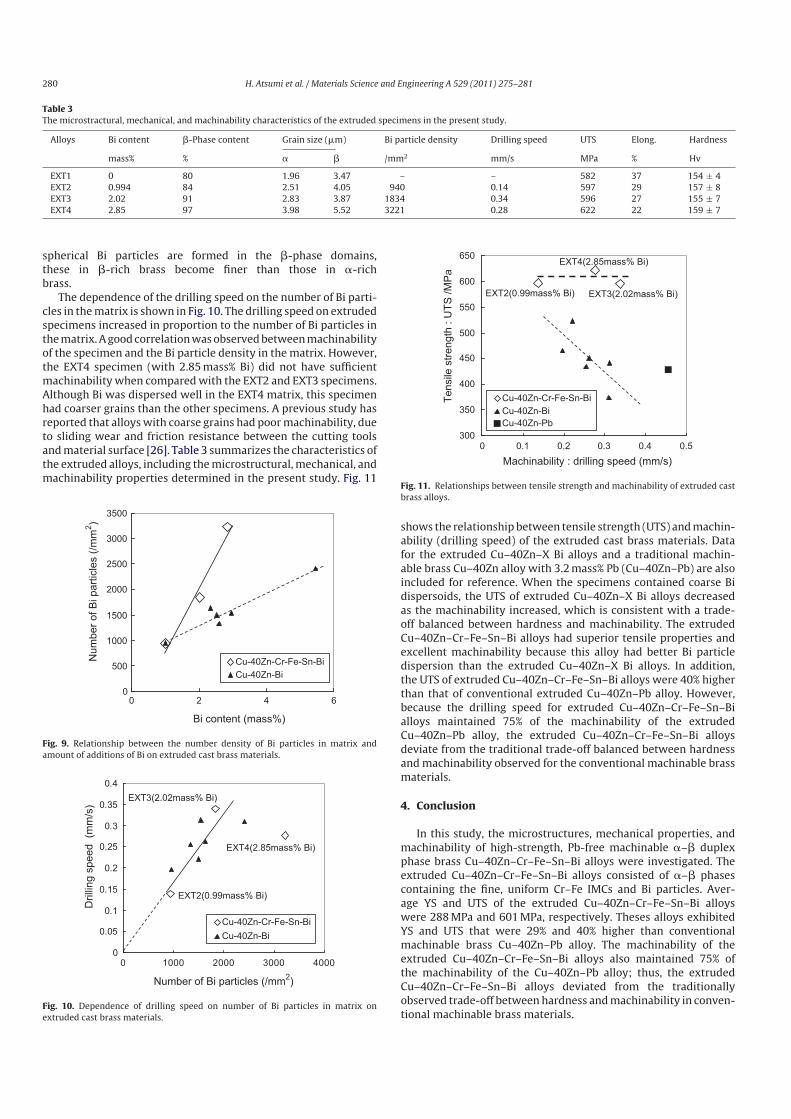
3.3. Relationship between the morphology of bismuth particles
and the machinability of extruded specimens
BSIs of the EXT2–4 specimens in the transverse cross-sections of
the extrusion direction are shown in Fig. 8. The BSI shows the bina-
rized image that segregates Bi particles from the �–� phase matrix.
Because elemental Bi is heavier than elemental Cu, Zn, Cr, Fe and Sn,
white areas indicate the presence of Bi particles in the matrix. The
number of Bi particles in a selected analysed area was measured by
BSI image analyses. The relationships between the Bi particle den-
sity and the elemental Bi content are shown in Fig. 9. The Bi particle
numbers of extruded cast Cu–40Zn–X Bi alloys (X = 1.0, 2.33, 2.53,
2.6, 2.95, and 5.45 mass%) are also shown in Fig. 9 as a reference.
The Bi particle density of Cu–40Zn–X Bi specimens increased in
proportion to the amount of elemental Bi added. Although smaller
amounts of elemental Bi were added to the EXT2–4 specimens than
to the extruded Cu–40Zn–X Bi alloys, the former specimens exhib-
ited a better dispersion of Bi particles than the extruded Cu–40Zn–X
Bi alloys. Bi morphology in an extruded specimen depends signif-
icantly on that of the cast alloy. Cast Cu–40Zn–Cr–Fe–Sn–Bi alloys
had a large area fraction of the �-phase than cast Cu–40Zn–X
Bi alloy. As previously discussed for the cast alloys, because
Fig. 8. Back scattered electron images of EXT2 (0.99 mass% Bi) (a), EXT3 (2.02 mass% Bi) (b), and EXT4 (2.85 mass% Bi) (c) by SEM in the transverse cross-section of the
extrusion direction.
280 H. Atsumi et al. / Materials Science and Engineering A 529 (2011) 275– 281
Table 3The microstractural, mechanical, and machinability characteristics of the extruded specimens in the present study.
Alloys Bi content �-Phase content Grain size (�m) Bi particle density Drilling speed UTS Elong. Hardness
mass% % � � /mm2 mm/s MPa % Hv
EXT1 0 80 1.96 3.47 – – 582 37 154 ± 4
EXT2 0.994 84 2.51 4.05 940 0.14 597 29 157 ± 8
EXT3 2.02 91 2.83 3.87 1834 0.34 596 27 155 ± 7
EXT4 2.85 97 3.98 5.52 3221 0.28 622 22 159 ± 7
spherical Bi particles are formed in the �-phase domains,
these in �-rich brass become finer than those in �-rich
brass.
The dependence of the drilling speed on the number of Bi parti-
cles in the matrix is shown in Fig. 10. The drilling speed on extruded
specimens increased in proportion to the number of Bi particles in
the matrix. A good correlation was observed between machinability
of the specimen and the Bi particle density in the matrix. However,
the EXT4 specimen (with 2.85 mass% Bi) did not have sufficient
machinability when compared with the EXT2 and EXT3 specimens.
Although Bi was dispersed well in the EXT4 matrix, this specimen
had coarser grains than the other specimens. A previous study has
reported that alloys with coarse grains had poor machinability, due
to sliding wear and friction resistance between the cutting tools
and material surface [26]. Table 3 summarizes the characteristics of
the extruded alloys, including the microstructural, mechanical, and
machinability properties determined in the present study. Fig. 11
0
500
1000
1500
2000
2500
3000
3500
0 2 4 6
Cu-40Zn-Cr-Fe-Sn-BiCu-40Zn-Bi
Bi content (mass%)
Num
ber o
f Bi p
artic
les
(/mm
2 )
Fig. 9. Relationship between the number density of Bi particles in matrix and
amount of additions of Bi on extruded cast brass materials.
0
0.05
0.1
0.15
0.2
0.25
0.3
0.35
0.4
0 1000 2000 3000 4000
Cu-40Zn-Cr-Fe-Sn-BiCu-40Zn-Bi
Number of Bi particles (/mm2)
Dril
ling
spee
d (m
m/s
)
EXT2(0.99mass% Bi)
EXT3(2.02mass% Bi)
EXT4(2.85mass% Bi)
Fig. 10. Dependence of drilling speed on number of Bi particles in matrix on
extruded cast brass materials.
300
350
400
450
500
550
600
650
0 0.1 0.2 0.3 0.4 0.5
Cu-40Zn-Cr-Fe-Sn-BiCu-40Zn-BiCu-40Zn-Pb
Tens
ile s
treng
th :
UTS
/MP
aMachinability : drilling speed (mm/s)
EXT2(0.99mass% Bi) EXT3(2.02mass% Bi)
EXT4(2.85mass% Bi)
Fig. 11. Relationships between tensile strength and machinability of extruded cast
brass alloys.
shows the relationship between tensile strength (UTS) and machin-
ability (drilling speed) of the extruded cast brass materials. Data
for the extruded Cu–40Zn–X Bi alloys and a traditional machin-
able brass Cu–40Zn alloy with 3.2 mass% Pb (Cu–40Zn–Pb) are also
included for reference. When the specimens contained coarse Bi
dispersoids, the UTS of extruded Cu–40Zn–X Bi alloys decreased
as the machinability increased, which is consistent with a trade-
off balanced between hardness and machinability. The extruded
Cu–40Zn–Cr–Fe–Sn–Bi alloys had superior tensile properties and
excellent machinability because this alloy had better Bi particle
dispersion than the extruded Cu–40Zn–X Bi alloys. In addition,
the UTS of extruded Cu–40Zn–Cr–Fe–Sn–Bi alloys were 40% higher
than that of conventional extruded Cu–40Zn–Pb alloy. However,
because the drilling speed for extruded Cu–40Zn–Cr–Fe–Sn–Bi
alloys maintained 75% of the machinability of the extruded
Cu–40Zn–Pb alloy, the extruded Cu–40Zn–Cr–Fe–Sn–Bi alloys
deviate from the traditional trade-off balanced between hardness
and machinability observed for the conventional machinable brass
materials.
4. Conclusion
In this study, the microstructures, mechanical properties, and
machinability of high-strength, Pb-free machinable �–� duplex
phase brass Cu–40Zn–Cr–Fe–Sn–Bi alloys were investigated. The
extruded Cu–40Zn–Cr–Fe–Sn–Bi alloys consisted of �–� phases
containing the fine, uniform Cr–Fe IMCs and Bi particles. Aver-
age YS and UTS of the extruded Cu–40Zn–Cr–Fe–Sn–Bi alloys
were 288 MPa and 601 MPa, respectively. Theses alloys exhibited
YS and UTS that were 29% and 40% higher than conventional
machinable brass Cu–40Zn–Pb alloy. The machinability of the
extruded Cu–40Zn–Cr–Fe–Sn–Bi alloys also maintained 75% of
the machinability of the Cu–40Zn–Pb alloy; thus, the extruded
Cu–40Zn–Cr–Fe–Sn–Bi alloys deviated from the traditionally
observed trade-off between hardness and machinability in conven-
tional machinable brass materials.
H. Atsumi et al. / Materials Science and Engineering A 529 (2011) 275– 281 281
Acknowledgement
Nippon Atomized Metal Powders Corporation is acknowledged
for their help in preparing the brass alloy cast ingots.
References
[1] G. Pantazopoulos, J. Mater. Eng. Perform. 11 (2002) 402–407.[2] Japan Capper and Brass Association, Base and Industrial Technology of Copper
and Copper Alloys, 1994 (in Japanese).[3] P. García, S. Rivera, M. Palacios, J. Belzunce, Eng. Fail. Anal. 17 (2010) 771–776.[4] E.W. Thiele Jr, K.J.A. Kundig, D.W. Murphy, G. Soloway, B. Duffin, CDA’s Univer-
sal Machinability Index. SAE Technical Paper Series, No. 900365, InternationalCongress and Exposition, Detroit, MI, 1990.
[5] J.X. Wu, M.R. Ji, M. Galeotti, A.M. Giusti, G. Rovida, Surf. Interface Anal. 22 (1994)323–326.
[6] X. Chen, A. Hu, M. Li, D. Mao, J. Alloys Compd. 460 (2008) 478–484.[7] S. Kuyucak, M. Sahoo, Can. Metall. Q. 35 (1) (1996) 1–15.[8] B.D. Mellow, D.J. Thomas, M.J. Joyce, P. Kolkowski, N.J. Roberts, S.D. Monk, Nucl.
Instrum. Methods Phys. Res. A 577 (3) (2007) 690–695.[9] GE plastics, RoHS and WEEE compliant flame retardants developed for electrical
connectors, Reinf. Plastics 51 (8) (2007) 12.
[10] C. Mans, S. Hanning, C. Simons, A. Wegner, M. Jan�en, M. Kreyenschmidt, Spec-trochim. Acta Part B 62 (2007) 116–122.
[11] L.V. Whiting, P.D. Newcombe, M. Sahoo, Trans. Am. Foundrymen’s Soc. 103(1995) 683–691.
[12] A.L. Fontaine, V.J. Keast, Mater. Charact. 57 (2006) 424–429.[13] V. Vazquez, A.J. Hernandez, A. Mascarenas, P. Zambrano, M.A.L.H. Rodriguez,
Eng. Fail. Anal. 17 (2010) 1285–1289.[14] T. Andoh, T. Atsumi, Y. Yoshikawa, J. JCBRA 40 (2001) 253–256.[15] H. Imai, Y. Kosaka, A. Kojima, S. Li, K. Kondoh, J. Umeda, H. Atsumi, Mater. Trans.
51 (2010) 855–859.[16] H. Mindivan, H. C imenoglu, E.S. Kayali, Wear 254 (2003) 532–537.[17] M. Sundberg, R. Sundberg, S. Hogmark, R. Otterbergc, B. Lehtinenc, S.E. Hgrn-
strgm, S.E. Karlsson, Wear 115 (1987) 151–165.[18] C. Vilarinho, J.P. Davim, D. Soares, F. Castro, J. Barbosa, J. Mater. Process. Technol.
170 (2005) 441–447.[19] L. Jin, R. Sandström, Mater. Des. 15 (1994) 339–346.[20] H. Atsumi, H. Imai, S. Li, Y. Kousaka, A. Kojima, K. Kondoh, Mater. Sci. Forum
654–656 (2010) 2552–2555.[21] S. Li, H. Imai, H. Atsumi, K. Kondoh, J. Alloys Compd. 493 (2010) 128–133.[22] T. Andoh, T. Atsumi, Y. Yoshikawa, J. JRICu 42 (2003) 17–20.[23] J.T. Plewes, D.N. Loiacono, Adv. Mater. Processes (USA) 140 (1991) 23–27.[24] C. Mapelli, R. Venturini, Scr. Mater. 54 (2006) 1169–1173.[25] G. Pantazopoulos, Practical Fail. Anal. 3 (4) (2003) 14–22.[26] T.E. Raghy, P. Blau, M.W. Barsoum, Wear 238 (2000) 125–130.


