Embed Size (px)
Citation preview

1992, The British Journal of Radiology, 65, 361-369
VOLUME 65 NUMBER 773 MAY 1 992
The British Journal of Radiology
High-intensity zone: a diagnostic sign of painful lumbar discon magnetic resonance imagingBy C. Aprill, MD and *N. Bogduk, MBBS, PhD
Diagnostic Conservative Management, 3715 Prytania Street, New Orleans, and *Faculty of Medicine,University of Newcastle, Newcastle 2308, Australia
(Received 12 August 1991 and accepted 22 October 1991)
Keywords: Lumbar spine, Back pain, MRI
Abstract. The prevalence, validity and reliability of high-intensity zones in the annulus fibrosus seen on r2-weighted magneticresonance images of patients with intractable low-back pain were determined. This sign was readily recognized by two independentobservers. It occurred in 28% of 500 patients undergoing magnetic resonance imaging for back pain. The presence of a high-intensity zone correlated significantly with the presence of Grade 4 annular disruption and with reproduction of the patient's pain.Its sensitivity as a sign of either annular disruption or pain was modest but its specificity was high, and its positive predictive valuefor a severely disrupted, symptomatic disc was 86%. This sign is diagnostic of painful internal disc disruption.
Magnetic resonance imaging (MRI) provides high-quality images of the central nervous system andsurrounding tissues. Understandably, therefore, whenMRI has been employed in the study of lumbardisorders it has largely been in the pursuit of lesionsaffecting the lumbar nerve roots, such as disc hernia-tions, lateral canal stenosis and post-operative rootfibrosis (Breger et al, 1989; Bundschuh et al, 1988;Burnett & Levine, 1986; Chafetz et al, 1983; Crawshawet al, 1984; Djukic et al, 1990; Edelman et al, 1985;Frocrain et al, 1989; Hochhauser et al, 1988; Hueftle etal, 1988; Hyman & Gorey, 1988; Kent & Larsen, 1988;Kricun et al, 1990; Lee et al, 1988; Maravilla et al, 1985;Masaryk et al, 1988; Modic & Weinstein, 1984; Modicet al, 1984, 1986a,b; Murayama et al, 1990; Ross et al,1987, 1989a,b; Sotiropoulos et al, 1989; Weisz &Kitchener, 1987; Weisz et al, 1988). This emphasis,however, contrasts with the epidemiology of low-backdisorders.
Clinical studies have shown that fewer than 30% andas few as 5% of low-back problems can be legitimatelyascribed to nerve root compression (Friberg, 1954;Horal, 1969), and contemporary authorities place thisfigure perhaps as low as 1% (Mooney, 1987). Themajority of low-back disorders present with back pain,with or without referred pain, but not with sciatica andobjective neurological signs. Such presentations deny aneurogenic basis for the pain, and suggest a somaticorigin within the musculoskeletal tissues of the lumbarspine.
Prominent amongst putative, somatic sources of backpain are intrinsic disorders of the lumbar intervertebral
discs. One condition, described by Crock (1970, 1986), isthat of internal disc disruption. This condition ischaracterized by disruption of the internal architectureof the disc, which becomes painful, but its externalshape remains essentially normal, and nerve rootcompression is not involved. Consequently, myelogramsand computed tomographic (CT) scans are normal(Crock, 1986).
The pathology of internal disc disruption involvesdisruption of the inner annulus fibrosus in the form ofradial fissures. Its pathogenesis is believed to be aninflammatory, biochemical degradation of the discmatrix following compression injury of a vertebral end-plate (Bogduk & Twomey, 1991). The disc becomespainful as a result of chemical irritation of the nerveendings in the outer fibres of the annulus fibrosus, or asa result of excessive strains being incurred by thesefibres in the course of normal activities of daily living(Antti-Poika et al, 1990; Bogduk, 1988; Bogduk &Twomey, 1991).
The studies of Vanharanta et al (1987, 1988) haveshown that the morphological features of internal discdisruption can be demonstrated by CT-discography,and strong correlations occur between the extent ofannular diusruption and the reproduction of thepatient's pain by provocation discography. Fissuresrestricted to the inner third of the annulus fibrosus arerarely associated with pain, but over 70% of fissuresreaching the outer third of the annulus are associatedwith pain reproduction, and, reciprocally, over 70% ofpainful discs exhibit third-degree fissures as defined bythe Dallas discogram scale (Sachs et al, 1987;
Vol. 65, No. 773 361
C. Aprill and N. Bogduk
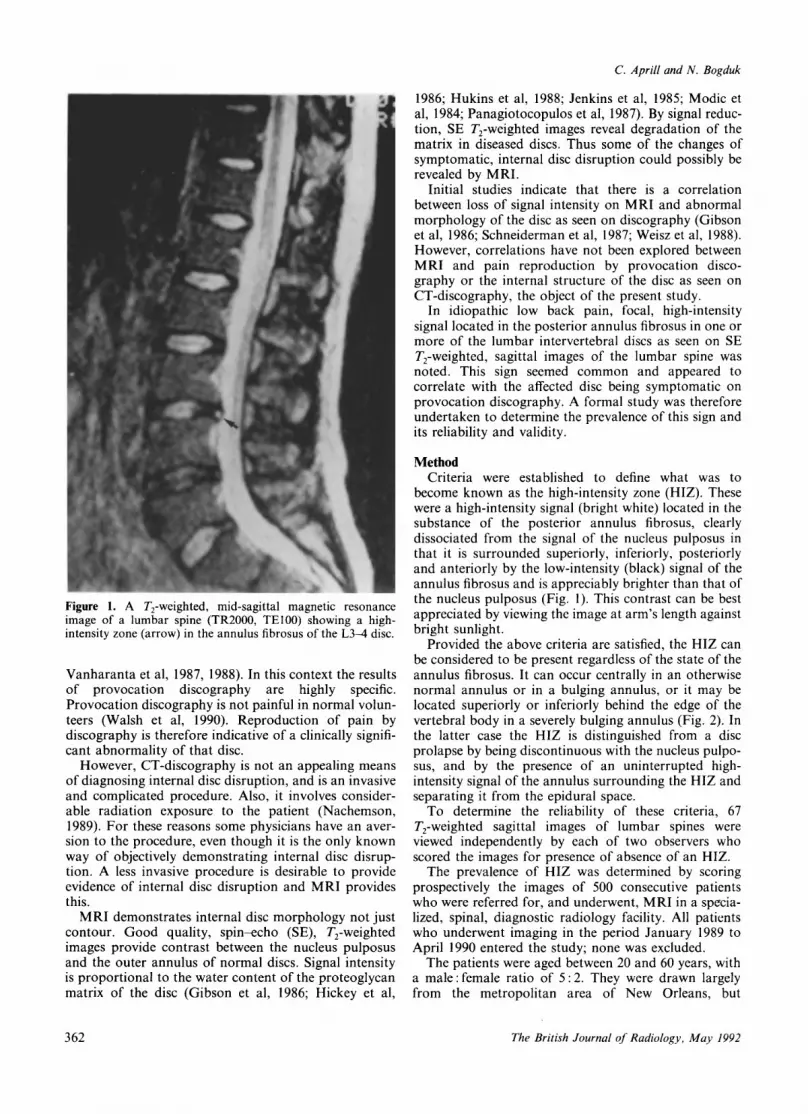
Figure 1. A ^-weighted, mid-sagittal magnetic resonanceimage of a lumbar spine (TR2000, TE100) showing a high-intensity zone (arrow) in the annulus fibrosus of the L3-4 disc.
Vanharanta et al, 1987, 1988). In this context the resultsof provocation discography are highly specific.Provocation discography is not painful in normal volun-teers (Walsh et al, 1990). Reproduction of pain bydiscography is therefore indicative of a clinically signifi-cant abnormality of that disc.
However, CT-discography is not an appealing meansof diagnosing internal disc disruption, and is an invasiveand complicated procedure. Also, it involves consider-able radiation exposure to the patient (Nachemson,1989). For these reasons some physicians have an aver-sion to the procedure, even though it is the only knownway of objectively demonstrating internal disc disrup-tion. A less invasive procedure is desirable to provideevidence of internal disc disruption and MRI providesthis.
MRI demonstrates internal disc morphology not justcontour. Good quality, spin-echo (SE), rrweightedimages provide contrast between the nucleus pulposusand the outer annulus of normal discs. Signal intensityis proportional to the water content of the proteoglycanmatrix of the disc (Gibson et al, 1986; Hickey et al,
1986; Hukins et al, 1988; Jenkins et al, 1985; Modic etal, 1984; Panagiotocopulos et al, 1987). By signal reduc-tion, SE T^-weighted images reveal degradation of thematrix in diseased discs. Thus some of the changes ofsymptomatic, internal disc disruption could possibly berevealed by MRI.
Initial studies indicate that there is a correlationbetween loss of signal intensity on MRI and abnormalmorphology of the disc as seen on discography (Gibsonet al, 1986; Schneiderman et al, 1987; Weisz et al, 1988).However, correlations have not been explored betweenMRI and pain reproduction by provocation disco-graphy or the internal structure of the disc as seen onCT-discography, the object of the present study.
In idiopathic low back pain, focal, high-intensitysignal located in the posterior annulus fibrosus in one ormore of the lumbar intervertebral discs as seen on SEr2-weighted, sagittal images of the lumbar spine wasnoted. This sign seemed common and appeared tocorrelate with the affected disc being symptomatic onprovocation discography. A formal study was thereforeundertaken to determine the prevalence of this sign andits reliability and validity.
MethodCriteria were established to define what was to
become known as the high-intensity zone (HIZ). Thesewere a high-intensity signal (bright white) located in thesubstance of the posterior annulus fibrosus, clearlydissociated from the signal of the nucleus pulposus inthat it is surrounded superiorly, inferiorly, posteriorlyand anteriorly by the low-intensity (black) signal of theannulus fibrosus and is appreciably brighter than that ofthe nucleus pulposus (Fig. 1). This contrast can be bestappreciated by viewing the image at arm's length againstbright sunlight.
Provided the above criteria are satisfied, the HIZ canbe considered to be present regardless of the state of theannulus fibrosus. It can occur centrally in an otherwisenormal annulus or in a bulging annulus, or it may belocated superiorly or inferiorly behind the edge of thevertebral body in a severely bulging annulus (Fig. 2). Inthe latter case the HIZ is distinguished from a discprolapse by being discontinuous with the nucleus pulpo-sus, and by the presence of an uninterrupted high-intensity signal of the annulus surrounding the HIZ andseparating it from the epidural space.
To determine the reliability of these criteria, 67^-weighted sagittal images of lumbar spines wereviewed independently by each of two observers whoscored the images for presence of absence of an HIZ.
The prevalence of HIZ was determined by scoringprospectively the images of 500 consecutive patientswho were referred for, and underwent, MRI in a specia-lized, spinal, diagnostic radiology facility. All patientswho underwent imaging in the period January 1989 toApril 1990 entered the study; none was excluded.
The patients were aged between 20 and 60 years, witha male: female ratio of 5:2. They were drawn largelyfrom the metropolitan area of New Orleans, but
362 The British Journal of Radiology, May 1992

High-intensity zone: a diagnostic sign of disc pain on MRI
Figure 2. A rrweighted, sagittal magnetic resonance image of alumbar spine (TR2000, TE100) showing a high-intensity zone(arrow) located inferiorly behind the L5 vertebral body butwithin the L4-5 annulus fibrosus.
included some interurban and interstate referrals. Allhad low back pain with or without referred pain orradicular pain in the lower limb, which had been presentfor at least 3 months. The pain was sufficiently disablingfor them to have sought specialist attention from anorthopaedic surgeon, neurosurgeon or specialist inphysical medicine. The referring physician had not beenable to formulate a definitive diagnosis on the basis ofconventional clinical examination, plain radiography orCT scan, and, consequently, referred the patient forMRI.
All MRI scans were acquired on a Technicare system(Technicare, Teslacon-Solon, Ohio, USA) operating at0.6 T. A 7.5 in surface coil was employed. Each studyincluded images in the coronal, axial and sagittal planes.Section thickness varied from 4.0 mm to 5.0 mm with1.0 mm interspace gaps. SE and gradient pulsesequences were employed. ^-weighted images wereobtained with long repetition times (TR 1800-2200 ms)and long echo times (TE 80-120 ms). Additional para-meters included two to four excitations and acquisition
with 196x256 or 256x256 matrix, and display at256 x 256. Occasionally cardiac gating was employed formotion suppression.
The morphology of the HIZ and its relationship tosymptoms was studied in a subset of 41 patients inwhom discography and post-discography CT scanningcould be performed. These patients had been referredfor both MRI and later discography as part of a staged,spinal investigation. The patients were aged 36 + 8 years(mean + SD); all had low back pain, but none hadneurological signs or other features of nerve rootcompression. For ethical reasons, discography could notbe performed in those patients who had been referredsolely for MRI.
Discography was performed using a standard,postero-lateral, extrapedicular approach using a single22 g or 25 g spinal needle at L4^5 and above, and adouble needle technique (25 g/20 g) at the L5 level. Atleast two discs were studied in each patient, includingthe one exhibiting the HIZ. Under image intensifierguidance, the needle was directed towards the centre ofthe disc. Once accurate placement had been achieved,1.5-3.0 ml of non-ionic contrast medium (Iohexol) wasslowly instilled into the nucleus using a 3 ml syringe.Intermittent screening during injection verified nuclearopacification. Contrast medium installation wasstopped if pain was induced or if firm resistance wasencountered.
A disc was classified as symptomatic if, on injection,the patient's accustomed pain was reproduced, providedthat injection of at least one adjacent disc did notreproduce symptoms. No positive diagnosis was enteredunless one adjacent disc was found to be asymptomatic.A diagnosis of multiple symptomatic discs was enteredif stimulation of more than one disc reproduced symp-toms, but provided that at least one adjacent disc wasdiscerned as asymptomatic.
CT scanning was performed between 1 and 3 h afterdiscography. Scans were obtained using aTECH 2020 HR scanner. Cuts of 5 mm x 3 mm or con-tinuous 2 mm cuts were obtained using windows andcentre settings optimal for defining contrast mediumand bone.
The morphology of the CT discograms was classifiedaccording to the Dallas discogram scale for annulardisruption (Sachs et al, 1987), which recognizes fourgrades of annular disruption: "0" if the contrastmedium is restricted to the annulus fibrosus; " 1 " if itextends radially along a fissure into the inner third ofthe annulus; "2" if it extends into the middle third; and"3" if it extends into the outer third (Fig. 3). For thepresent study, this scale was extended to record aGrade 3 disruption in which the contrast medium alsospread circumferentially through the annulus fibrosus.This was defined as a Grade 4 disruption. A Grade 4disruption was distinguished from Grade 3 if thecontrast medium spread circumferentially within thesubstance of the annulus fibrosus and subtended an arcgreater than 30° at the centre of the disc.
Once data has been collected on the presence of an
Vol. 65, No. 773 363
C. Aprill and N. Bogduk
V
V
L3-4
L4-5
L5-S1
notrecorded
ba
3
c b
mm
c a
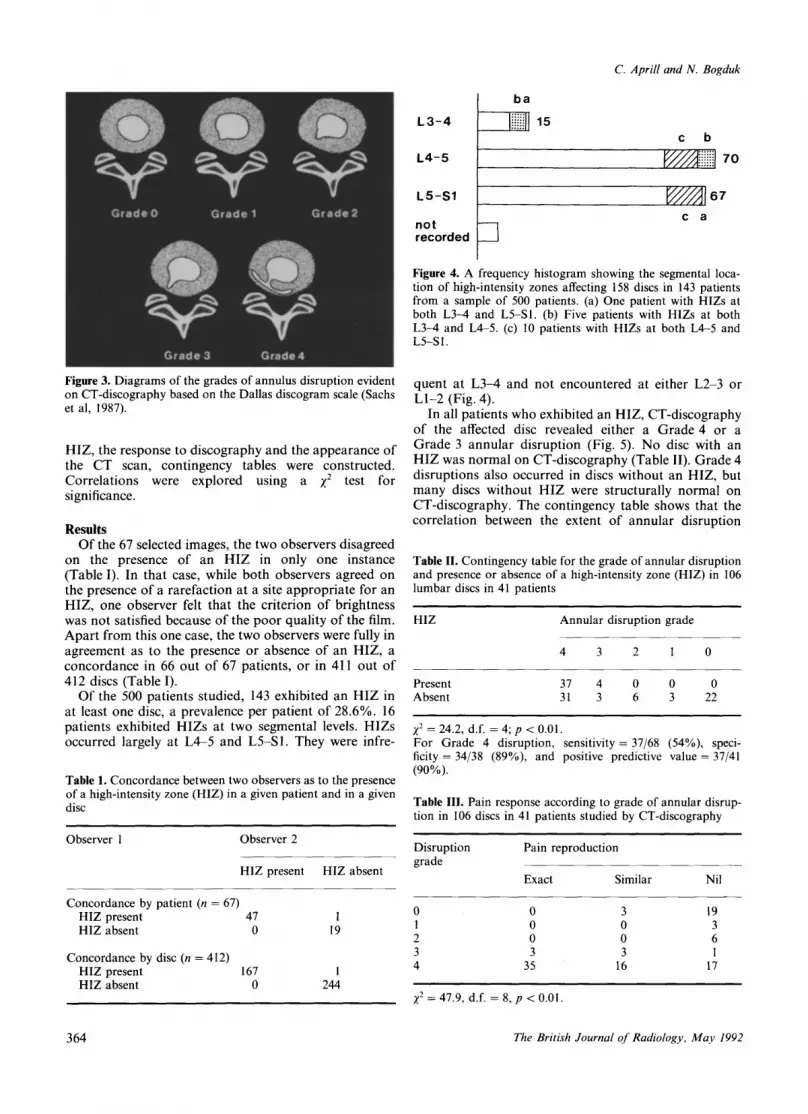
Figure 4. A frequency histogram showing the segmental loca-tion of high-intensity zones affecting 158 discs in 143 patientsfrom a sample of 500 patients, (a) One patient with HIZs atboth L3-4 and L5-S1. (b) Five patients with HIZs at bothL3-4 and L4-5. (c) 10 patients with HIZs at both L4-5 andL5-S1.
Figure 3. Diagrams of the grades of annulus disruption evidenton CT-discography based on the Dallas discogram scale (Sachset al, 1987).
HIZ, the response to discography and the appearance ofthe CT scan, contingency tables were constructed.Correlationssignificance.
were explored using a x2 test for
ResultsOf the 67 selected images, the two observers disagreed
on the presence of an HIZ in only one instance(Table I). In that case, while both observers agreed onthe presence of a rarefaction at a site appropriate for anHIZ, one observer felt that the criterion of brightnesswas not satisfied because of the poor quality of the film.Apart from this one case, the two observers were fully inagreement as to the presence or absence of an HIZ, aconcordance in 66 out of 67 patients, or in 411 out of412 discs (Table I).
Of the 500 patients studied, 143 exhibited an HIZ inat least one disc, a prevalence per patient of 28.6%. 16patients exhibited HIZs at two segmental levels. HIZsoccurred largely at L4-5 and L5-S1. They were infre-
Table 1. Concordance between two observers as to the presenceof a high-intensity zone (HIZ) in a given patient and in a givendisc
Observer 1 Observer 2
HIZ present HIZ absent
Concordance by patient (« = 67)HIZ present 47HIZ absent 0
Concordance by disc (n = 412)HIZ present 167HIZ absent 0
119
1244
quent at L3-4 and not encountered at either L2-3 orLl-2(Fig.4).
In all patients who exhibited an HIZ, CT-discographyof the affected disc revealed either a Grade 4 or aGrade 3 annular disruption (Fig. 5). No disc with anHIZ was normal on CT-discography (Table II). Grade 4disruptions also occurred in discs without an HIZ, butmany discs without HIZ were structurally normal onCT-discography. The contingency table shows that thecorrelation between the extent of annular disruption
Table II. Contingency table for the grade of annular disruptionand presence or absence of a high-intensity zone (HIZ) in 106lumbar discs in 41 patients
HIZ
PresentAbsent
Annular disruption grade
4
3731
3
43
2
06
1
03
0
022
*2 = 24.2, d.f. = 4 ; / » < 0 . 0 1 .For Grade 4 disruption, sensitivity = 37/68 (54%), speci-ficity = 34/38 (89%), and positive predictive value = 37/41(90%).
Table III. Pain response according to grade of annular disrup-tion in 106 discs in 41 patients studied by CT-discography
Disruptiongrade
Pain reproduction
Exact
0003
35
Similar
3003
16
Nil
19361
17
= 47.9, d.f. = 8,/7<O.Ol.
364 The British Journal of Radiology, May 1992

High-intensity zone: a diagnostic sign of disc pain on MRI
(b) (d)
Figure 5. (a) A T2-weighted magnetic resonance image (TR2000, TEIOO) showing an HIZ in the L5-S1 disc (arrow) and (b) the CTdiscogram of the same disc showing severe, Grade 4 annular disruption, (c) A r2-weighted magnetic resonance image (TR2200,TEIOO) showing an HIZ in the L4-5 disc (arrow) and (d) the CT discogram of the same disc showing Grade 4 annular disruption.
Vol. 65, No. 773 365

C. Aprill and N. Bogduk
Table IV. Contingency table for pain reproduction and thepresence or absence of a high-intensity zone (HIZ) in 118 discsin 41 patients studied by provocation discography
HIZ
PresentAbsent
Pain reproduction
Exact Similar
31 77 15
Nil
256
X2 = 63, d.f. = 2, p<0.0l.For exact pain reproduction, sensitivity = 31/38 (82%) andspecificity = 71/80 (89%).For exact or similar pain reproduction, sensitivity = 38/60(63%), specificity = 56/58 (97%), and positive predictivevalue = 38/40 (95%).
and the presence or absence of an HIZ is significant at/? < 0.01 (Table II). The sensitivity of an HIZ indetecting a Grade 4 disruption was low (54%), but itsspecificity was high (89%), as was its positive predictivevalue (90%).
In the patients studied by CT-discography, most ofthe Grade 4 and Grade 3 disruptions were symptomatic(Table III). Reproduction of symptoms was significantlyrelated to increasing grade of disruption (p < 0.01).
The presence of an HIZ was strongly related toreproduction of pain (Table IV). The sensitivity of anHIZ in detecting exact pain reproduction was 82%; itsspecificity was 89%. In detecting exact or similar painreproduction its sensitivity was 63% but its specificitywas 97%. The reduction in sensitivity results from therelatively greater number of discs without an HIZ thatexhibited similar but not exact reproduction of pain.Strikingly, the positive predictive value of an HIZ forreproduction of exact or similar pain was 95%(Table IV).
For the composite condition of Grade 4 disruptiontogether with exact or similar reproduction of pain, theHIZ exhibited a highly significant correlation (Table V).The sensitivity of an HIZ for a painful, Grade 4 disrup-tion was 71%; its specificity was 89%, and its positivepredictive value was 86% (Table V).
DiscussionThe present study found that an HIZ could be readily
detected independently by two observers and that itoccurs in 28% of patients with back pain attending aspinal radiology practice. To the question why thiscommon sign has not been recognized previously, threeanswers are suggested.
First, the HIZ is evident only on good quality MRIscans. Patient motion artefacts or poorly photographedimages render the sign indistinct, for recognition of theHIZ relies critically on the brightness of the signal(Fig. 6). Section thickness is of critical importance.Thicker sections render the small area of bright signalless conspicuous. Consequently, an HIZ is unlikely to be
Table V. Contingency table correlating the presence or absenceof a high-intensity zone (HIZ) against Grade 4 annular disrup-tion with exact or similar pain reproduction and all othergrades of disruption and pain responses in 105 discs in 41patients studied by CT-discography and MRI
HIZ Grade 4disruptionwith exactor similarpain repro-duction
Grade 4disruptionwithno pain
All othergradeswith pain
All othergradeswithno pain
PresentAbsent
3615 16
128
*2 = 44.6, d.f. = 3,/><0.01.For a painful Grade 4 disruption, sensitivity = 36/51 (71%),specificity = 48/54 (89%) and positive predictive value = 36/42(86%).
apparent in 6.0 mm, 8.0 mm and 10.0 mm sections,which are occasionally employed with SE T2 imaging toreduce scanning time.
On truly 7"2-weighted images, the nuclear region ofnormal discs is quite bright with an intensityapproaching that of the almost white cerebrospinal fluid(CSF). On such images, an HIZ will approach thebrightness of the adjacent CSF. HIZs are not detectableon SE T}-weighted images.
Gradient echo sequences are becoming popularbecause they require less acquisition time. The spatialresolution of these images is good, and the resulting T2*image contrast results in a myelogram effect, but theimage contrast of the disc is not a measure of its true T2
characteristics. Gradient echo sequences are not reliablein detecting the HIZs described in this study. True SET2-weighted images of no more than 5.0 mm thicknessare required to study internal disc disruptionadequately.
The second reason why the HIZ has been overlookedpossibly relates to the inclination of neuroradiologistswho use MRI to focus on disorders of the lumbar nerveroots rather than on the disc itself. The patients in thepresent study (in the MR/CT-discography comparisongroup) did not exhibit convincing evidence of nerve rootcompression, either clinically or on imaging. This mightinvite attribution of any abnormalities seen in the discsto non-specific degenerative changes. However, all thepatients in the present study had back pain and mosthad a symptomatic, Grade 4 annular disruption. TheHIZ, although readily overlooked as insignificant, wasnonetheless strongly diagnostic of a disrupted andpainful disc.
Thirdly, the HIZ is evident typically and essentiallyexclusively in mid-sagittal images. Its absence in otherimages and its absence in Tx -weighted images renders itmore likely to be overlooked or dismissed as an inci-dental, insignificant finding. Yet, this is far from thecase.
366 The British Journal of Radiology, May 1992

High-intensity zone: a diagnostic sign of disc pain on MR1
(a) (b)
Figure 6. Two magnetic resonance images of contrasting quality, (a) One in which a high-intensity zone (arrow) is clearly evident,and (b) one in which a possible HIZ (arrow) is masked by the overall lack of brightness in the scan.
Because of the inherent bias of the sample of patientsstudied, the observed prevalence of HIZ may not neces-sarily reflect its prevalence in patients with low-backpain at large. Rather, the prevalence more likely appliesto those patients, like the present sample, who had backpain without radiculopathy serious enough to warrantorthopaedic consultation and expensive, radiologicalinvestigation.
The prevalence of HIZ in an asymptomatic popula-tion is not known. However, in those studies describingasymptomatic lumbar spines on MRI, no mention ismade of an HIZ (Powell et al, 1986; Weinreb et al,1989). Either this sign has been overlooked because of
technical reasons like those mentioned above, or it doesnot occur in asymptomatic subjects. The latter would beconcordant with the present study, in that HIZs werenever encountered in structurally normal discs(Table II). Nevertheless, given the significance of theHIZ revealed in the present study, it is clearly criticalthat the prevalence of HIZs using contemporary tech-nology capable of producing good quality SEr2-weighted images should be established in normals.
The present study complements clinically the patho-anatomical studies initiated by Yu and associates (Yu etal, 1988). These investigators showed that variousfissures evident in the annulus fibrosus of cadavers could
Vol. 65, No. 773 367

C. Aprill and N. Bogduk
be demonstrated on MRI. They identified three types offissure. Type I were crescentic fissures unconnected withthe nucleus pulposus. Type II fissures were radialfissures extending from a nucleus pulposus to the outerannulus. Type III fissures were transverse tears of theannulus near its attachment sites. Type I fissures weredifficult to demonstrate on MRI, but Type II andType III fissures were evident on MRIs of cadavericlumbar spines (Yu et al, 1988).
The HIZ appears to be a sign of a severe form ofType II fissure: one in which a radial fissure extendscircumferentially by more than 30° to become a Grade 4fissure as defined in the present study. The HIZ is notthe centre of a prolapse for the signal is containedwholly within the annulus fibrosus, and on MRI itexhibits no connection with the nucleus pulposus.CT-discography demonstrates that the circumferentialfissure is contained within the annulus and is connectedonly circuitously to the nucleus pulposus through aradial fissure.
The results of the present study suggest that onlyGrade 4 fissures manifest themselves as an HIZ.However, because very few Grade 3 disruptions wereencountered in the present study, it is not possible toexclude the possibility that in other patients, Grade 3disruptions might also manifest as an HIZ.
The signal of an HIZ is similar to that of the nucleuspulposus. This, together with the CT data, suggest thatthe circumferential fissure contains fluid of nuclearorigin. However, the HIZ is noticeably brighter than thenuclear signal, which suggests there is more to it. Wepostulate that the HIZ constitutes nuclear materialtrapped between the lamellae of the annulus fibrosus,which has become inflamed, and that this inflammationaccounts for the brighter signal. We suggest that theHIZ is analogous to the Type II fissures described byRoss, Modic and Masaryk (Ross et al, 1989c), whichenhanced on injection of gadolinium-DPTA, a beha-viour taken to indicate inflammation, neovasculariza-tion or invasion by granulation tissue (Ross et al,1989c), and which has been shown experimentally tocorrespond to granulation tissue in traumatized disc(Nguyen et al, 1989).
However, it was not the purpose of the present studyto explore the histopathology of the HIZ. The study wasdesigned only to explore the reliability and validity ofthis sign. It is quite clear from the clinical data obtainedthat the HIZ is a frequent sign on MRI of patients withback pain, and that it is highly specific and stronglypredictive of a symptomatic disc with severe annulardisruption. It is not necessarily the only sign of asymptomatic disc, and it is not present in all painfuldiscs. However, it is a sign that is readily recognized andshould draw attention away from the disc-nerve rootinterface and towards significant, and hithertoneglected, changes within the disc itself.
The data on sensitivity, specificity and positive predic-tive value of HIZ are sufficient to warrant that the HIZ,when present, is pathognomonic of an internallydisrupted and symptomatic intervertebral disc. As such,
the HIZ is the first sign evident on MRI that has beenshown to be diagnostic for low-back pain.
ReferencesANTTI-POIKA, I., SOINI, J., TALLROTH, K., YRJONEN, T. &
KONNTINEN, Y. T., 1990. Clinical relevance of discographycombined with CT scanning. Journal of Bone & JointSurgery, 72B, 480-485.
BOGDUK, N., 1988. The innervation of intervertebral discs. InThe Biology of the Intervertebral Disc, Vol. 1, ed. byP. Ghosh (CRC Press, Boca, Raton), pp. 135-149.
BOGDUK, N. & TWOMEY, L. T., 1991. Clinical Anatomy of theLumbar Spine, 2nd edn (Churchill Livingstone, Melbourne),pp. 161-173.
BREGER, R. K., WILLIAMS, A. L., DANIELS, D. L., CZERVIONKE,L. F., MARK, L. P., HAUGHTON, V. M., PAPKE, R. A. &COFFER, M., 1989. Contrast enhancement in spinal MRimaging. American Journal of Neuroradiology, 10, 633-637.
BUNDSCHUH, C. V., MODIC, M. T., ROSS, J. S., MASARYK, T. J.& BOHLMAN, H., 1988. Epidural fibrosis and recurrent diskherniation in the lumbar spine: MR imaging assessment.American Journal of Roentgenology, 150, 923-932.
BURNETT, K. R. & LEVINE, J. B., 1986. MR of lumbar diskdisease. Applied Radiology, 15, 133-141.
CHAFETZ, N. I., GENANT, H. K., MOON, K. L., HELMS, C. A. &MORRIS, J. M., 1983. Recognition of lumbar disk herniationwith NMR. American Journal of Roentgenology, 141,1153-1156.
CRAWSHAW, C , KEAN, D. M., MULHOLLAND, R. C ,WORTHINGTON, B. S., FlNLAY, D. , HAWKES, R. C , GYNGELL,M. & MOORE, W. S., 1984. The use of nuclear magneticresonance in the diagnosis of lateral canal entrapment.Journal of Bone & Joint Surgery, 66B, 711-715.
CROCK, H. V., 1970. A reappraisal of intervertebral disclesions. Medical Journal of Australia, 1, 983-989.
CROCK, H. V., 1986. Internal disc disruption: a challenge todisc prolapse 50 years on. Spine, 11, 650-653.
DJUKIC, S., GENANT, H. K., HELMS, C. A. & HOLT, R. G., 1990.Magnetic resonance imaging of the postoperative lumbarspine. Radiologic Clinics of North America, 28, 341-360.
EDELMAN, R. R., SHOULIMAS, G. M., STARK, D. D., DAVIS,K. R., NEW, P. F. J., SAINI, S., ROSENTHAL, D. I., WISMER,G. L. & BRADY, T. J., 1985. High resolution surface coilimaging of lumbar disk disease. American Journal ofRoentgenology, 144, 1123-1129.
FRIBERG, S., 1954. Lumbar disc herniation in the problem oflumbago sciatica. Bulletin of the Hospital for Joint Diseases,15, 1-20.
FROCRAIN, L., DUVAUFERRIER, R., HUSSON, J. L., NOEL, J.,RAMEE, A. & PAWLOTSKY, Y., 1989. Recurrent postoperativesciatica: evaluation with MR imaging and enhanced CT.Radiology, 170, 531-533.
GIBSON, M. J., BUCKLEY, J., MAWHINNEY, R., MULHOLLAND,R. C. & WORTHINGTON, B. S., 1986. Magnetic resonanceimaging and discography in the diagnosis of discdegeneration. Journal of Bone & Joint Surgery, 58B,369-373.
HICKEY, D. S., ASPDEN, R. M., HUKINS, D. W. L., JENKINS,J. P. R. & ISHERWOOD, I., 1986. Analysis of magneticresonance images from normal and degenerate lumbarintervertebral discs. Spine, 11, 702-708.
HOCHHAUSER, L., KlEFFER, S. A., CACAYORIN, E. D. , PETRO,G. R. & TELLER, W. F., 1988. Recurrent postdiskectomy lowback pain: MR-surgical correlation. American Journal ofRoentgenology, 151, 755-760.
368 The British Journal of Radiology, May 1992

High-intensity zone: a diagnostic sign of disc pain on MRI
HORAL, J., 1969. The clinical appearance of low back disordersin the city of Gothenburg, Sweden. Ada OrthopaedicaScandinavica, Supplementum 118, 1-108.
HUEFTLE, M. G., MODIC, M. T., Ross, J. S., MASARYK, T. J.,
CARTER, J. R., WILBER, R. G., BOHLMAN, H. H., STEINBERG,P. M. & DELMARTER, R. B., 1988. Lumbar spine: postoperative MR imaging with Gd-DTPA. Radiology, 167,817-824.
HUKINS, D. W. L., ASPDEN, R. M. & HICKEY, D. S., 1988.Potential of magnetic resonance imaging for theinvestigation of disc pathology. In The Biology of theIntervertebral Disc, Vol. 2, ed. by P. Ghosh (CRC Press,Boca Raton), pp. 161-197.
HYMAN, R. A. & GOREY, M. T., 1988. Imaging strategies forMR of the spine. Radiologic Clinics of North America, 26,505-533.
JENKINS, J. P. R., HICKEY, D. S., ZHU, X. P., MACHIN, M. &ISHERWOOD, I., 1985. MR Imaging of the intervertebral disc:a quantitative study. British Journal of Radiology, 58,705-709.
KENT, D. L. & LARSEN, E. B., 1988. Magnetic resonanceimaging of the brain and spine. Annals of Internal Medicine,108, 402^24.
KRICUN, R., KRICUN, M. E. & DALINKA, M. K., 1990.Advances in spinal imaging. Radiologic Clinics of NorthAmerica, 28, 321-339.
LEE, S. H., COLEMAN, P. E. & HAHN, F. J., 1988. Magnetic
resonance imaging of degenerative disk disease of the spine.Radiologic Clinics of North America, 26, 949—964.
MARAVILLA, K. R., LESH, P., WEINREB, J. C , SELBY, D. K. &MOONEY, V., 1985. Magnetic resonance imaging of thelumbar spine with CT correlation. American Journal ofNeuroradiology, 6, 237-245.
MASARYK, T. J., Ross, J. S., MODIC, M. T., BOUMPHREY, F.,BOHLMAN, H. & WILBER, G., 1988. High resolution MRimaging of sequestered lumbar intervertebral disks. AmericanJournal of Neuroradiology, 9, 351-358.
MODIC, M. T., MASARYK, T. J., BOUMPHREY, F., GOURMASTIC,M. & BELL, G., 1986a. Lumbar herniated disc disease andcanal stenosis. Prospective evaluation by surface coil MR,CT and myelography. American Journal of Neuroradiology,7, 709-711.
MODIC, M. T., MASARYK, T. J. & PAUSHTER, D. M., 1986b.Magnetic resonance imaging of the spine. Radiologic Clinicsof North America, 24, 229-245.
MODIC, M. T., PAVLICEK, W., WEINSTEIN, M. A., BOUMPHREY,F., NGO, F., HARDY, R. & DUCHESNEAU, P. M., 1984.Magnetic resonance imaging of intervertebral disk disease.Radiology, 152, 103-111.
MODIC, M. T. & WEINSTEIN, M. A., 1984. Nuclear magneticresonance of the spine. British Medical Bulletin, 40, 183-186.
MOONEY, V., 1987. Where is the pain coming from? Spine, 8,754-759.
MURAYAMA, S., NUMAGUCHI, Y. & ROBINSON, A. E., 1990. Thediagnosis of herniated intervertebral disks with MR imaging:a comparison of gradient refocused-echo and spin-echo pulsesequences. American Journal of Neuroradiology, 11, 17-22.
NACHEMSON, A., 1989. Editorial comment. Lumbardiscography—where are we today? Spine, 14, 555-557.
NGUYEN, C. M., HO, K-C, YU, S., HAUGHTON, V. M. &STRANDT, J. A., 1989. An experimental model to studycontrast enhancement in MR imaging of the intervertebraldisk. American Journal of Neuroradiology, 10, 811-814.
PANAGIOTOCOPULOS, N. D., POPE, M. H., KRAG, M. K. &BLOCK, R., 1987. Water content in human intervertebraldiscs part I: measurement by magnetic resonance imaging.Spine, 12, 912-917.
POWELL, M. C , WILSON, M., SZYPRYT, P., SYMONDS, E. M. &WORTHINGTON, B. S., 1986. Prevalence of lumbar discdegeneration observed by magnetic resonance insymptomless women. Lancet, ii, 1366-1367.
Ross, J. S., MASARYK, T. J., MODIC, M. T., BOHLMAN, H.,DELAMARTER, R. & WILBER, G., 1987. Lumbar spine:postoperative assessment with surface coil MR imaging.Radiology, 164, 851-860.
Ross, J. S., DELAMARTER, R., HEUFTLE, M. G., MASARYK, T. J.,AIKAWA, M., CARTER, J., VANDYKE, C. & MODIC, M. T.,1989a. Gadolinium-DPTA-enhanced MR imaging ofpostoperative lumbar spine: time course and mechanism ofenhancement. American Journal of Neuroradiology, 10, 37-46.
Ross, J. S., MODIC, M. T., MASARYK, T. J., CARTER, J.,MARCUS, R. E. & BOHLMAN, H., 1989b. Assessment ofextradural degenerative disease with Gd-DTPA-enhancedMR imaging: correlation with surgical and pathologicfindings. American Journal of Neuroradiology, 10, 1243-1249.
Ross, J. S., MODIC, M. T. & MASARYK, T. J., 1989c. Tears ofthe anulus fibrosus assessment with Gd-DTPA-enhancedMR imaging. American Journal of Neuroradiology, 10,1251-1254.
SACHS, B. L., VANHARANTA, H., SPIVEY, M. A., GUYER, R. D.,VIDEMAN, T., RASHBAUM, R. F., JOHNSON, R. G.,HOCHSCHULER, S. H. & MOONEY, V., 1987. Dallas discogramdescription. A new classification of CT/discography in low-back disorders. Spine, 12, 287-294.
SCHNEIDERMAN, G., FLANNIGAN, B., KlNGSTONS, S., THOMAS,J., DILLIN, W. H. & WATKINS, R. G., 1987. Magneticresonance imaging in the diagnosis of disc degeneration:correlation with discography. Spine, 12, 276-281.
SOTIROPOULOS, S., CHAFETZ, N. I., LANG, P., WINKLER, M.,MORRIS, J. M., WEINSTEIN, P. R. & GENANT, H. K., 1989.Differentiation between postoperative scar and recurrentdisk herniation: prospective comparison of MR, CT andcontrast-enhanced CT. American Journal of Neuroradiology,10, 639-643.
VANHARANTA, H., GUYER, R. D., OHNMEISS, D. D., STITH,W. J., SACHS, B. L., APRILL, C , SPIVEY, M., RASHBAUM, R.F., HOCHSCHULER, S. H., VIDEMAN, T., SELBY, D. K.,TERRY, A. & MOONEY, V., 1988. Disc deterioration in low-back syndrome. A prospective, multi-center CT/discographystudy. Spine, 13, 1349-1351.
VANHARANTA, H., SACHS, B. L., SPIVEY, M. A., GUYER, R. D.,HOCHSCHULER, S. H., RASHBAUM, R. F., JOHNSON, R. G.,OHNMEISS, D. & MOONEY, V., 1987. The relationship of painprovocation to lumbar disc deterioration as seen byCT/discography. Spine, 12, 295-298.
WALSH, T. R., WEINSTEIN, J. N., SPRATT, K. F., LEHMANN,T. R., APRILL, C. & SAYRE, N., 1990. Lumbar discography innormal subjects. Journal of Bone and Joint Surgery, 72A,1081-1088.
WEINREB, J. C , WOLBARSHT, L. B., COHEN, J. M., BROWN,C. E. L. & MARAVILLA, K. R., 1989. Prevalence oflumbosacral intervertebral disk abnormalities on MR imagesin pregnant and asymptomatic nonpregnant women.Radiology, 170, 125-128.
WEISZ, G. M. & KITCHENER, P. N., 1987. The use of magneticresonance imaging in the diagnosis of postoperative lumbarconditions. Medical Journal of Australia, 146, 99-101.
WEISZ, G. M., LAMOND, S. T. & KITCHENER, P. N., 1988.Magnetic resonance imaging in spinal disorders.International Orthopaedics, 12, 331-334.
Yu, S., SETHER, L. A., HO, P. S. P., WAGNER, M. & HAUGHTON,V. M., 1988. Tears of the anulus fibrosus: correlationsbetween MR and pathologic findings in cadavers. AmericanJournal of Neuroradiology, 9, 367—370.
Vol. 65, No. 773 369


![Wpmen]^ - Flying Disc Museum](https://img.dokumen.tips/doc/110x75/633c817562e54755e7023f2c/wpmen-flying-disc-museum.jpg)


