Embed Size (px)
Citation preview

1670
INTRODUCTIONColour vision discriminates variation in the spectrum of light fromchanges in brightness, and requires the neural circuitry to comparethe signals from at least two spectrally distinct cone photoreceptorclasses (Jacobs, 1981). Moreover, colour vision systems seek todiscriminate between objects that differ in reflectance, regardlessof the lighting conditions. This is achieved by decomposing thecolour signal (spectral radiance) arriving at the eye from an objectinto the spectral reflectance of the object and the spectral irradiancein the environment. Considering the broad absorbance spectra ofcone photoreceptors and the limitations they impose on spectralresolution, it was suggested that more than three cone classes maynot add enough spectral resolution to outweigh the costs ofadditional cone classes (Barlow, 1982; Bowmaker, 1983; Maloney,1986; Chiao et al., 2000b). Why, then, do many reptiles, birds andshallow-water fish use four cone classes (Goldsmith et al., 1981;Goldsmith, 1990; Hawryshyn and Hárosi, 1991; Neumeyer, 1992;Hawryshyn and Hárosi, 1994; Hawryshyn et al., 2003; Sabbah etal., 2010)? Birds and diurnal reptiles often possess coloured oildroplets in their eyes. These screening pigments narrow thespectrum of photoreceptors, and thus render visual systems withfour cone classes more efficient (Goldsmith, 1990; Vorobyev,2003). To date, however, the question of high-dimensional colourvision in shallow-water fish, which lack coloured oil droplets, isstill unsolved.
The numerous available cone opsin genes in teleost fish, whichhave resulted from multiple opsin gene duplications (Matsumoto etal., 2006; Spady et al., 2006; Ward et al., 2008), facilitate theexpression of diverse complements of two to seven cone pigments.For example, zebrafish (Danio rerio) display seven cone pigments(Vihtelic et al., 1999; Chinen et al., 2003); guppies (Poeciliareticulata) (Archer and Lythgoe, 1990) and killifish (Lucaniagoodei) (Fuller et al., 2003) display five cone pigments; salmonids(Salmonidae) (Hawryshyn and Hárosi, 1994; Temple et al., 2008)display four to six cone pigments; black bream (Acanthopagrusbutcheri) (Shand et al., 2008), goldfish (Carassius auratus)(Hawryshyn and McFarland, 1987; Neumeyer, 1992) and three-spinestickleback (Gasterosteus aculeatus) (Rowe et al., 2004) displayfour cone pigments; coral reef fish display two to four conepigments (Hawryshyn et al., 2003; Losey et al., 2003); and Africancichlids typically display three cone pigments (Jordan et al., 2006;Carleton et al., 2008), although several species were shown to displayup to seven pigments (Parry et al., 2005). However, the presenceof a large number of cone pigments in the retina may not necessarilysuggest the possession of high-dimensional colour vision. First, conepigments and the expression of cone opsin genes were shown to bedistributed differently across the retina of many fishes (Denton etal., 1971; Levine et al., 1979; Allison et al., 2003; Takechi andKawamura, 2005; Allison et al., 2006; Temple et al., 2010). Second,multiple spectral cone classes, subserved by multiple cone pigments,
SUMMARYHumans use three cone photoreceptor classes for colour vision, yet many birds, reptiles and shallow-water fish aretetrachromatic and use four cone classes. Screening pigments, which narrow the spectrum of photoreceptors in birds and diurnalreptiles, render visual systems with four cone classes more efficient. To date, however, the question of tetrachromacy in shallow-water fish that, like humans, lack screening pigments, is still unsolved. We raise the possibility that tetrachromacy in fish hasevolved in response to higher spectral complexity of underwater light. We compared the dimensionality of colour vision inhumans and fish by examining the spectral complexity of the colour signal reflected from objects into their eyes. We show thatfish require four to six cone classes to reconstruct the colour signal of aquatic objects at the accuracy level achieved by humansviewing terrestrial objects. This is because environmental light, which alters the colour signals, is more complex and containsmore spectral fluctuations underwater than on land. We further show that fish cones are better suited than human cones to detectthese spectral fluctuations, suggesting that the capability of fish cones to detect high-frequency fluctuations in the colour signalconfers an advantage. Taken together, we propose that tetrachromacy in fish has evolved to enhance the reconstruction ofcomplex colour signals in shallow aquatic environments. Of course, shallow-water fish might possess fewer than four coneclasses; however, this would come with the inevitable loss in accuracy of signal reconstruction.
Supplementary material available online at http://jeb.biologists.org/cgi/content/full/216/9/1670/DC1
Key words: vertebrates, sensory systems, spectral reflectance, cone photoreceptor, opsin gene, underwater environment, tetrachromacy.
Received 27 August 2012; Accepted 14 January 2013
The Journal of Experimental Biology 216, 1670-1682© 2013. Published by The Company of Biologists Ltddoi:10.1242/jeb.079558
RESEARCH ARTICLE
High complexity of aquatic irradiance may have driven the evolution of four-dimensional colour vision in shallow-water fish
Shai Sabbah1,*, Nikolaus F. Troje1,2,3, Suzanne M. Gray4 and Craig W. Hawryshyn1,3
1Department of Biology, Queenʼs University, Kingston, ON, Canada, K7L 3N6, 2Department of Psychology, Queenʼs University,Kingston, ON, Canada, K7L 3N6, 3Centre for Neuroscience Studies, Queenʼs University, Kingston, ON, Canada, K7L 3N6 and
4Department of Biology, McGill University, Montreal, QC, Canada, H3A 1B1*Author for correspondence ([email protected])
THE JOURNAL OF EXPERIMENTAL BIOLOGY

1671Evolution of tetrachromacy in fish
may be used for tasks other than colour vision. For example,opponent interaction of the signals of two spectral classes ofphotoreceptors was suggested to allow elimination of the flickergenerated by surface waves from the retinal image, thereby aidingin the detection of moving prey and predators (Maximov, 2000). Insuch cases, the dimensionality of colour vision might be lower thanit appears based solely on the number of spectral cone classespresent. Nonetheless, many of the species mentioned above weredemonstrated to possess four cone classes that interact with oneanother and serve in colour vision, suggesting tetrachromatic colourvision in these species (Hawryshyn and Hárosi, 1991; Neumeyer,1992; Hawryshyn and Hárosi, 1994; Parkyn and Hawryshyn, 2000;Hawryshyn et al., 2003; Anderson et al., 2010; Sabbah et al., 2010).
We raised the possibility that high complexity of the colour signalof aquatic objects has contributed to the emergence of four-dimensional colour vision in shallow-water fish. Such complexityaccounts for variation between colour signals as well as the variationin each colour signal across wavelengths. This complexity of thecolour signal, and thus the number of photoreceptors required toreconstruct it, depends on the complexity of the environmentalirradiance and the reflectance of objects. The absolute number of coneclasses required for reconstruction of colour signals is almostimpossible to obtain. This is mostly because it is unknown howaccurately animals can reconstruct colour-signal spectra, and whatproportion of spectra in the environment it is biologically necessaryto reconstruct. Thus, to gain insight into the dimensionality of colourvision in fish, one needs to compare the ability of fish in reconstructingcolour signals with that exhibited by another animal, ideally one forwhich the characteristics of the visual system are largely known.Therefore, to facilitate such a comparison, in this study, we evaluatedthe dimensionality of colour vision of fish in comparison to that ofhumans and old-world primates, by examining the complexity of thecolour signals of aquatic and terrestrial objects. We found that fishrequire four to six cone classes to reconstruct aquatic colour signalsto the degree that humans reconstruct terrestrial colour signals withthree cone classes. This, we show, is partly because environmentalirradiance, which alters the colour signals, is more complex underwaterthan on land. Moreover, we found that fish cones could detect high-frequency fluctuations across wavelengths better than human cones,and that aquatic colour signals exhibit a greater proportion of thesespectral fluctuations than terrestrial colour signals, suggesting thatthe capability of fish cones to detect high-frequency fluctuations inthe colour signal confers an advantage.
MATERIALS AND METHODSIrradiance, reflectance and colour-signal data sets
Aquatic and celestial spectral irradiance as well as spectralreflectance of aquatic and terrestrial objects were measured oradopted from previous studies (see Appendix 1 and supplementarymaterial Fig.S1 for irradiance and reflectance spectra used). Tocalculate colour signals, spectral reflectance of each terrestrial objectwas multiplied by every single celestial irradiance spectrum, andspectral reflectance of each aquatic object was multiplied by everysingle aquatic irradiance spectrum. Objects were assumed to beviewed from a short distance; thus, light attenuation through air orwater was neglected. All experimental and animal care procedureswere approved by Queen’s University Animal Care Committeeunder the auspices of the Canadian Council for Animal Care.
The visual system of fishAbsorbance spectra (Govardovskii et al., 2000) for cone pigmentsin fish were constructed based on the seven cone pigments
reported in cichlid fish (λmax of A1-reconstituted visual pigmentsis given in parentheses): SWS1 (368nm), SWS2b (423nm),SWS2a (456nm), Rh2b (484nm), Rh2aα (519nm), Rh2aβ(528nm) and LWS (560nm) (Parry et al., 2005; Spady et al., 2006).The spectral range spanned by these pigments is common to manyfreshwater and marine fish families (Losey et al., 2003; Bowmaker,2008). Absorbance spectra were generated for cone pigments witheither A1 (retinal) or A2 (3,4-dehydroretinal) chromophores, wherethe λmax shift associated with changes in chromophore compositionwas accounted for. As the spectral limits of wavelengthdiscrimination in fish are variable and largely unknown, the visiblespectrum of fish was calculated as the range enclosed between thewavelengths at which the absorbance of the shortest wavelengthcone (SWS1) and the longest wavelength cone (LWS) were at 1%of maximum absorbance. The visible spectrum of fish shifted andvaried in width with varying chromophore composition and lenstransmission. The visible spectrum (VS) was calculated for fourkey combinations of chromophore and lens transmission: (i) A1retina and a UV-transmissive lens, VS 323–685nm, (ii) A1 retinaand a non-UV-transmissive lens, VS 357–685nm, (iii) A2 retinaand a UV-transmissive lens, VS 323–767nm and (iv) A2 retinaand a non-UV-transmissive lens, VS 357–767nm. Thus, the widthof the visible spectrum of fish might range between 362 and444nm. To correct the absorbance spectra of cone pigments fora UV-transmissive lens, we used the lens transmission of a LakeMalawi cichlid, Metriaclima zebra, whose wavelength at half-maximum lens transmission (T50) was 350nm (Sabbah et al., 2010).To correct the absorbance spectra of cone pigments for a non-UV-transmissive lens (T50=400nm), we used the lens transmission ofanother Lake Malawi cichlid, Melanochromis auratus (Hofmannet al., 2010). These T50 values are commonly found in manyfreshwater and marine fishes (Siebeck and Marshall, 2007;Hofmann et al., 2010). For all analyses presented, unless specifieddifferently, the visible spectrum and spectra of cone photoreceptorsin fish were calculated while accounting for a UV-transmissivelens and photoreceptors of A1 chromophore (case i), which arecommonly found in many freshwater and marine fishes (Siebeckand Marshall, 2007; Toyama et al., 2008). The shallow-wateraquatic irradiance analysed in this study attained values between1010 and 1013 photonscm−2s−1nm−1 across the visible spectrum offish exhibiting A1 retina. These values are well within the photopicrange of many fish (DeMarco and Powers, 1991; Hawryshyn etal., 2010; Sabbah et al., 2010), and are not expected to limit thevisible spectrum or the function of any of the cones reported infish.
The visual system of humansAbsorbance spectra (Govardovskii et al., 2000) for the S-, M- andL-cone photoreceptors in humans were constructed based onabsorbance templates for the A1 chromophore using λmax valuesof 420, 530 and 558nm, respectively (Dartnall et al., 1983;Stockman and Sharpe, 2000). Absorbance spectra were correctedfor lens (Stockman et al., 1999) and macula (Bone et al., 1992)transmission. The visible spectrum of humans was calculated asthe range enclosed between the wavelengths at which theabsorbance of the S-cone and the L-cone was at 1% of maximumabsorbance, and ranged between 390 and 685nm. For consistency,construction of cone absorbance spectra and estimation of thevisible spectrum were performed similarly in both fish andhumans; cone absorbance spectra generated for humans werequantitatively similar to the commonly used sensitivity spectra(supplementary material Fig.S2).
THE JOURNAL OF EXPERIMENTAL BIOLOGY

1672
Characterizing spectra as linear modelsTo evaluate the number of independent parameters that are requiredfor reconstructing the irradiance, reflectance and colour-signalspectra, a principal component analysis (PCA) was employed(Maloney, 1986; Chittka et al., 1994; Chiao et al., 2000b). Numerousstudies have looked at the ability of animals to distinguish betweendifferent visual stimuli (Vorobyev et al., 1998; Marshall, 2000;Kelber et al., 2003; Endler et al., 2005). This was typically achievedby calculating Euclidian distances between different visual stimuliin the colour space of the animal concerned. In this study, however,we were interested primarily in investigating the complexity ofcolour signals rather than in assessing the ability of fish to distinguishbetween different stimuli; for such a task, PCA is an optimal method.
Prior to performing PCA, all spectra were normalized to be oflength 1 (by normalizing each spectrum by its norm) to avoiddifferential weighting of different spectra in determining the choiceof principal components (Maloney, 1986). To eliminate the needfor subtracting the mean value (across spectra) prior to performingPCA, analysis was performed on an augmented data set that hadmean zero (Maloney, 1986). This data set was generated byappending to the set of empirical spectra S1(λ),…,Sn(λ) the negationsof these spectra: –S1(λ),…,–Sn(λ).
Spectra were expressed as the weighted sum of d fixed principalcomponents (PCs):
where Pi(λ) denotes PC i at wavelength λ (nm) and σi denotes theweight of each PC and determines the spectrum of concern, denotedS(λ). To fit a given empirical spectrum Sj(λ) to a given d-dimensionallinear model, we used a least-squares fitting procedure, whichreturned the multiple correlation coefficient (R2) as a measure ofgoodness of fit.
We focused on the colour signals of objects that are crucialfor the survival of fish or humans – objects that are important forvisual foraging and communication. For fish vision, we analysedthe colour signals of algae (macroalgae covering rocks in LakeMalawi) that many fish feed in and upon, and the colour signalsof the body pattern of fish (Lake Malawi cichlid fish). For humanand primate vision, we analysed the colour signals of fruits andthe colour signals of skin and fur of old-world primates. Thecolour signals of fruit are of particular interest as it was arguedthat humans and primates evolved trichromatic colour vision toprovide acute discrimination between fruits of different degreesof ripeness and to allow for enhanced detection of fruits againstthe background of leaves (Osorio and Vorobyev, 1996; Regan etal., 1998; Smith et al., 2003). Celestial irradiance, and thereflectance and colour signal of terrestrial objects were analysedwhile accounting for the visible spectrum of humans(390–685nm). In contrast, aquatic irradiance, and the reflectanceand colour signal of aquatic objects, were analysed whileaccounting for the visible spectrum of fish (323–685nm).
Characterizing spectra as band-limited functionsTo identify component frequencies in spectra, the discrete Fouriertransform (DFT) was applied using the fast Fourier transform (FFT)algorithm (Matlab R2009a, The Mathworks, Natick, MA, USA).DFT was calculated for each of the cone absorbance, irradiance,reflectance and colour-signal spectra examined. Many spectra hadconsiderable levels of energy at both ends of the light spectrum.Any value difference between the two ends of a spectrum mayintroduce spurious, high-frequency components into the Fourier
∑λ = σ λ=
S P( ) ( ) , (1)i ii
d
1
The Journal of Experimental Biology 216 (9)
power spectrum. A Hanning window was used to attenuate theseartifacts (Maloney, 1986). In order to increase the Fourier frequencyresolution to 0.2cyclesμm–1, cone absorbance, irradiance,reflectance and colour-signal spectra were zero-padded (Bonnardeland Maloney, 2000) (see Appendix 2 for comparison between PCAand DFT and validation of calculations).
Statistical analysisBand-limit values for each collection of empirical spectra did notfollow normal distribution (Kolmogorov–Smirnov test) and theirvariance differed across collections (Leven’s test). Additionally,reflectance and colour-signal spectra within each collection werenot independent. Therefore, to compare the mean band limit of twocollections of empirical spectra, we used a randomization test, withthe difference between the means of the two collections as a teststatistic. The observed test statistic was compared with the nulldistribution estimated from 10,000 replicates, as band limits wererandomly permutated while maintaining the original sample sizes(Edgington, 1995). Non-parametric percentile-based bootstrapping(10,000 replicates) was used to estimate the 95% confidenceintervals around the mean band limit for each spectra collection(Efron and Tibshirani, 1994). Statistical analyses were performedusing R 2.13.0 (The R Foundation for Statistical Computing,http://www.r-project.org/).
RESULTSComplexity derived from variation between spectra
To evaluate the number of independent parameters that are requiredfor reconstructing each collection of empirical spectra, we computedthe linear model that best fits the collection using PCA. Then, wefitted each spectrum in the collection with a linear model of 1–10principal components (PCs) to determine the goodness of fit (R2)for each of the spectra included in the collection (see Materials andmethods and supplementary material Fig.S3). It is unknown howaccurately animals reconstruct spectra. Thus, the number of PCsrequired for signal reconstruction was defined as the number of PCsrequired to exceed a variance criterion of R2=0.99. Additionally,the proportion of spectra in a collection that it is biologicallynecessary to reconstruct is unknown. Therefore, we calculated thenumber of PCs required for reconstructing, at the above criterion,50% (median) and 95% (5th percentile) of the spectra in a collection.Note that the visual system does not seek to reconstruct spectra –it only seeks to discriminate between objects with differentreflectance. However, to facilitate comparison between thedimensionality of different spectra collections, in this study, wecalculated the number of PCs that are required to reconstruct spectraat a predefined variance criterion.
The exact number of PCs required for signal reconstructiondepends on the variance criterion used (the acceptable reconstructionerror) and the proportion of spectra in a collection that can bereconstructed. However, it is the difference in the number of PCsbetween fish and humans that is important. An additional PC wasrequired for reconstructing the aquatic irradiance (N=80) versuscelestial irradiance (N=400) (Fig.1A; see supplementary materialFig.S4 for the first 10 PCs for celestial and aquatic irradiance). Oneto two additional PCs (dependent on the proportion of spectrareaching the variance criterion) were required for reconstructing thereflectance of aquatic objects (N=351) versus the reflectance ofterrestrial objects (N=676) (Fig.1B). Finally, one to three additionalPCs were required for reconstructing the colour signal of aquaticobjects (N=28,080) versus the colour signal of terrestrial objects(N=270,400) (Fig.1C).
THE JOURNAL OF EXPERIMENTAL BIOLOGY

1673Evolution of tetrachromacy in fish
To test whether the difference in the number of PCs between fishand humans depends on the visible spectrum used, aquatic irradianceand the reflectance and colour signal of aquatic objects were re-analysed while accounting for the visible spectrum of humans. Thedifference in the number of PCs required for reconstructing theaquatic irradiance versus the celestial irradiance did not change(Table1A). However, the difference in the number of PCs requiredfor reconstructing the reflectance and colour signal of aquatic objectsversus terrestrial objects decreased to zero to one PC for reflectance(Table1B) and to one to two PCs for the colour signal (Table1C).Thus, the greater number of PCs required for reconstructing aquaticcolour signals arose partly from extending the visible spectrum intothe UV, but also from characteristic differences between aquaticand celestial irradiance.
The aquatic irradiance data analysed above were collected fromLake Malawi, a clear, oligotrophic lake. To test whether thereported findings hold for diverse water types, the analysis wasrepeated on irradiance taken from diverse ecosystems (Fig.1D). Anadditional PC was required for reconstructing the aquatic irradiancein comparison to celestial irradiance, regardless of whether aquaticirradiance was collected from freshwater eutrophic (N=240),freshwater oligotrophic (N=80) or marine eutrophic (N=131)systems. Thus, the larger number of PCs required for reconstructingthe colour signal of aquatic objects (higher complexity) is probablya characteristic of the aquatic environment.
Complexity derived from variation in spectra acrosswavelengths
Knowledge of the complexity of the colour signal arriving at the eyeis indispensable; however, it is important to consider what are theconstraints of the visual system that determine how the colour signalis being sampled. In fact, the broad spectra of cone photoreceptorsare band-limited functions that pass little energy at frequencies beyonda given band limit or frequency (Barlow, 1982). That is, thephotoreceptors cannot sample high-frequency fluctuations betweenwavelengths; they smooth the signal and, therefore, lose information.To study the frequency characteristics of cone photoreceptors in fishand humans, cone absorbance spectra were decomposed into theirdiscrete Fourier components, each having a frequency expressed ascycles per wavelength [this frequency refers to the abscissa of theFourier transform of the spectrum rather than to the frequency of light,sometimes called the comb frequency (Barlow, 1982)] (Fig.2A–D).The band limit of a spectrum was defined as the frequency abovewhich only 1% of the cumulative energy was found.
The band limit of cone photoreceptors decreased when movingfrom short (narrow bandwidth) to long (broader bandwidth)wavelength-sensitive cones. The band limits of fish cones spanneda wider range of frequencies, and the band limits of the three short-wavelength cones in fish were higher than those in humans (fish7.23–16.02cyclesμm–1, humans 8.39–14.45cyclesμm–1) (Fig.2E,F;supplementary material TableS1). Therefore, these fish cones
Irradiance – no. of PCs0 2 4 6 8 10
R2
0.970
0.975
0.980
0.985
0.990
0.995
1.000 A B
C D
Irradiance – no. of PCs0 2 4 6 8 10
0.950
0.960
0.970
0.980
0.990
1.000
Freshwater eutrophic
Freshwater oligotrophic
Marine eutrophic
Celestial
Reflectance – no. of PCs0 2 4 6 8 10
0.900
0.920
0.940
0.960
0.980
1.000
0 2 4 6 8 100.90
0.92
0.94
0.96
0.98
1.00
CelestialAquatic
Colour signal – no. of PCs0 2 4 6 8 10
R2
0.840
0.880
0.920
0.960
1.000
0 2 4 6 8 100.90
0.92
0.94
0.96
0.98
1.00
Terrestrial Aquatic
Terrestrial Aquatic
0 2 4 6 8 100.90
0.92
0.94
0.96
0.98
1.00
Fig.1. Reconstruction of aquatic colour signals requires more principal components (PCs) than terrestrial colour signals. The goodness of fit, R2, for linearmodels of 1–10 PCs, for irradiance, reflectance and colour-signal spectra is presented. The number of PCs required for signal reconstruction was defined asthe number of PCs required to exceed a variance criterion of R2=0.99 (horizontal dotted line). We calculated the number of PCs required for reconstructing50% (larger plots) and 95% (insets) of the spectra in a collection. (A)Irradiance: reconstruction of 50% of spectra required one PC for celestial irradiance buttwo PCs for aquatic irradiance. Inset, reconstruction of 95% of spectra required two PCs for celestial irradiance but three PCs for aquatic irradiance. Thenumber of PCs required for reconstructing the downwelling and sidewelling irradiance was similar, with two and three PCs required for reconstructing 50%and 95% of spectra in each collection, respectively (not presented). (B)Reflectance: reconstruction of 50% of spectra required three PCs for terrestrialobjects but four PCs for aquatic objects. Inset, reconstruction of 95% of spectra required four PCs for terrestrial objects but six PCs for aquatic objects.(C)Colour signal: reconstruction of 50% of spectra required three PCs for terrestrial objects but four PCs for aquatic objects. Inset, reconstruction of 95% ofspectra required five PCs for terrestrial objects but eight PCs for aquatic objects. (D)Aquatic irradiance for diverse water types: reconstruction of 50% ofspectra required two PCs for freshwater eutrophic, freshwater oligotrophic and marine eutrophic aquatic irradiance.
THE JOURNAL OF EXPERIMENTAL BIOLOGY

1674
(compared with all human cones) could better sample high-frequency fluctuations between wavelengths, and lost lessinformation from the incident signal. This result is linked directlyto the observation that fish typically possess a larger number ofshort-wavelength-sensitive cones, which can, in contrast to humancones, extend into the UV spectral range. The Nyquist samplingtheorem determines the number of samples (e.g. conephotoreceptors) required to reconstruct a signal up to a certainfrequency. The relationship between the band limit of a signal f(cyclesμm–1) and the number of significant independent samples nrequired to reconstruct the signal is: n=2Wf where W stands for thewidth of the visible spectrum (μm) (Slepian and Pollak, 1961). Thus,
The Journal of Experimental Biology 216 (9)
the band limit of photoreceptors is related directly to the minimalnumber of photoreceptors required for reconstructing the signal upto the band limit. The number of samples required to reconstructthe band-limited colour signal that is passed by cones in fish(5.23–11.60) was higher by up to three samples (dependent on coneclass) than in humans (4.96–8.53); the results for humans areconsistent with past studies (Barlow, 1982; Maloney, 1986). Thus,fish would require four to six cone classes (an additional one tothree cone classes in comparison to humans) to reconstruct the band-limited colour signal sampled by cones.
As shown above, given the filter properties of theirphotoreceptors, fish could recover higher frequencies from the
Table1. R2 coefficients for linear models of 1–10 principal components (PCs), for irradiance, reflectance and colour-signal spectra
A. IrradianceMedian 5th percentile
Celestial Aquatic Aquatic Celestial Aquatic AquaticPC (human VS) (fish VS) (human VS) (human VS) (fish VS) (human VS)
1 0.9956 0.9833 0.9835 0.9304 0.9262 0.92682 0.9996 0.9965 0.9966 0.9938 0.9759 0.97613 0.9998 0.9994 0.9995 0.9988 0.9948 0.99544 0.9999 0.9998 0.9999 0.9994 0.9984 0.99915 0.9999 0.9999 0.9999 0.9998 0.9995 0.99966 1.0000 0.9999 1.0000 0.9999 0.9997 0.99987 1.0000 1.0000 1.0000 0.9999 0.9999 0.99998 1.0000 1.0000 1.0000 1.0000 0.9999 1.00009 1.0000 1.0000 1.0000 1.0000 1.0000 1.000010 1.0000 1.0000 1.0000 1.0000 1.0000 1.0000
B. Reflectance of objectsMedian 5th percentile
Terrestrial Aquatic Aquatic Terrestrial Aquatic AquaticPC (human VS) (fish VS) (human VS) (human VS) (fish VS) (human VS)
1 0.9223 0.9078 0.9312 0.7120 0.7241 0.74832 0.9845 0.9713 0.9855 0.8773 0.8686 0.92443 0.9959 0.9862 0.9955 0.9778 0.9363 0.95854 0.9984 0.9939 0.9985 0.9922 0.9642 0.98625 0.9992 0.9971 0.9992 0.9962 0.9804 0.99426 0.9997 0.9986 0.9995 0.9982 0.9901 0.99477 0.9998 0.9990 0.9997 0.9988 0.9935 0.99748 0.9999 0.9993 0.9998 0.9992 0.9955 0.99849 0.9999 0.9995 0.9998 0.9995 0.9968 0.998510 1.0000 0.9996 0.9999 0.9997 0.9977 0.9990
C. Colour signal of objects Median 5th percentile
Terrestrial Aquatic Aquatic Terrestrial Aquatic AquaticPC (human VS) (fish VS) (human VS) (human VS) (fish VS) (human VS)
1 0.9126 0.8438 0.8457 0.6372 0.4472 0.45362 0.9776 0.9568 0.9587 0.8487 0.6987 0.70853 0.9948 0.9855 0.9865 0.9678 0.9040 0.90884 0.9979 0.9943 0.9952 0.9896 0.9606 0.96355 0.9990 0.9963 0.9970 0.9940 0.9777 0.98186 0.9995 0.9976 0.9982 0.9969 0.9841 0.98717 0.9996 0.9983 0.9989 0.9979 0.9886 0.99228 0.9997 0.9990 0.9991 0.9985 0.9921 0.99439 0.9998 0.9992 0.9994 0.9991 0.9944 0.995810 0.9999 0.9994 0.9995 0.9993 0.9956 0.9969
The median R2 indicates the value above which the R2 values corresponding to 50% of spectra in a collection were formed. The 5th percentile of R2 indicatesthe value above which the R2 values corresponding to 95% of spectra in a collection were formed. The median and 5th percentile of the R2 coefficient aregiven for (A) celestial (N=400) and aquatic (N=80) irradiance, (B) reflectance of terrestrial (N=676) and aquatic (N=351) objects, and (C) colour signal ofterrestrial (N=270,400) and aquatic (N=28,080) objects. For aquatic irradiance, and the reflectance and colour signal of aquatic objects, spectra were fitted tolinear models while accounting for the visible spectrum of fish (fish VS), and again while accounting for the visible spectrum of humans (human VS). R2
values just exceeding the R2=0.99 criterion are marked in bold.
THE JOURNAL OF EXPERIMENTAL BIOLOGY

1675Evolution of tetrachromacy in fish
signal received (higher band limits). However, this would beadvantageous only if the band limit of aquatic colour signals wasequal to or higher than those of fish cones. To investigate whetherthis is the case, irradiance, reflectance and colour-signal spectrawere expressed as band-limited functions (supplementary materialFig.S5) and their cumulative energy as a function of frequencywas calculated (Fig.3). The band limit of aquatic colour signalswas significantly higher than that of terrestrial colour signals(Fig.4A,B, left axes), indicating a correspondence between theband limits of cones and those of the colour signals. That is, theenhanced ability of fish cones to recover high-frequencyfluctuations coincided with the higher proportion of high-frequencyfluctuations in the colour signal of aquatic objects. Interestingly,the greater proportion of high frequencies in aquatic colour signalsarose from a greater proportion of high frequencies in the aquaticirradiance (Fig.4C) rather than in the reflectance of aquaticobjects (Fig.4D). Additionally, apart from the short-wavelengthphotoreceptors (S-cone in humans and SWS1 in fish), whichadequately sampled the colour signal of most aquatic objects (forfish) and terrestrial objects (for humans), photoreceptorsundersampled the colour signal of approximately half the relevantobjects (Fig.4A,B; left axes). That is, the band limits ofphotoreceptors were lower than those of the colour signals; thecolour signals contain frequencies that are higher than those thatcan be recovered by photoreceptors, for both fish and humans. In
conclusion, the capability of fish cone photoreceptors to recoverhigh frequencies from the colour signal confers an advantage andallows enhanced reconstruction of the colour signal.
DISCUSSIONComplexity of aquatic and celestial irradiance
We found that the spectrum of aquatic irradiance in diverse freshwaterand marine ecosystems is more complex than the spectrum ofcelestial irradiance. The greater complexity of aquatic irradiancespectra was derived from greater variation between irradiance spectra,as determined using PCA (Fig.1D), as well as from greater variationin individual irradiance spectra across wavelengths as determinedusing DFT, for a freshwater oligotrophic (Lake Malawi) system(Fig.4C), and for freshwater eutrophic [randomization test (RT),P<0.001, CIfreshwater=9.036–9.918, CIcelestial=5.001–5.091,Nfreshwater=240, Ncelestial=400] and marine eutrophic (RT, P<0.001,CImarine=9.192–10.055, CIcelestial=5.001–5.091, Nmarine=131,Ncelestial=400) systems. The greater variation between aquaticirradiance spectra is linked directly to the stronger light attenuationin water, which results in strong dependence of the irradiancespectrum on the viewing orientation and water depth. Thus, aquaticirradiance, which is incident on objects that only slightly differ indepth or in the orientation in which they are being viewed, would besubstantially different, leading to the greater complexity of aquaticirradiance. In fact, the complexity of aquatic irradiance across narrow
LWS Rh2aβRh2aαRh2b
SWS1 SWS2b SWS2a
14.459.578.39
16.0210.358.988.207.627.427.23
Wavelength (nm)300 400 500 600 700 800
Abs
orba
nce
0
0.2
0.4
0.6
0.8
1.0
300 400 500 600 700 8000
0.2
0.4
0.6
0.8
1.0S M L
PigmentPigment
5 10 15 200
0.2
0.4
0.6
0.8
1.0
Band limit
5 10 15 20
Ene
rgy
0
0.2
0.4
0.6
0.8
1.0
0 5 10 15 200.90
0.92
0.94
0.96
0.98
1.00
Frequency (cycles μm–1)0 5 10 15 20
Cum
ulat
ive
ener
gy
0.90
0.92
0.94
0.96
0.98
1.00
Band limit
BA
DC
FE
FishHumans Fig.2. Compared with human cones, fish cones recoverhigher frequencies from the colour signal received.(A,B)Absorbance spectra of cone photoreceptors in humansand fish. (C,D)Absorbance spectra of cone photoreceptorsexpressed as band-limited functions. The discrete Fouriertransform (DFT) was calculated while accounting for thevisible spectrum of humans and fish. (E,F)Cumulativeenergy of absorbance increased quickly with frequency.Band limits of the S-, M- and L-cone photoreceptors inhumans equalled 14.45, 9.57 and 8.39cyclesμm–1,respectively. Band limits of the SWS1 to LWS conephotoreceptors in fish ranged from 16.02 to7.23cyclesμm–1. The band limit of spectra was defined asthe frequency above which only 1% of the cumulativeenergy was found (dotted line).
THE JOURNAL OF EXPERIMENTAL BIOLOGY
1676
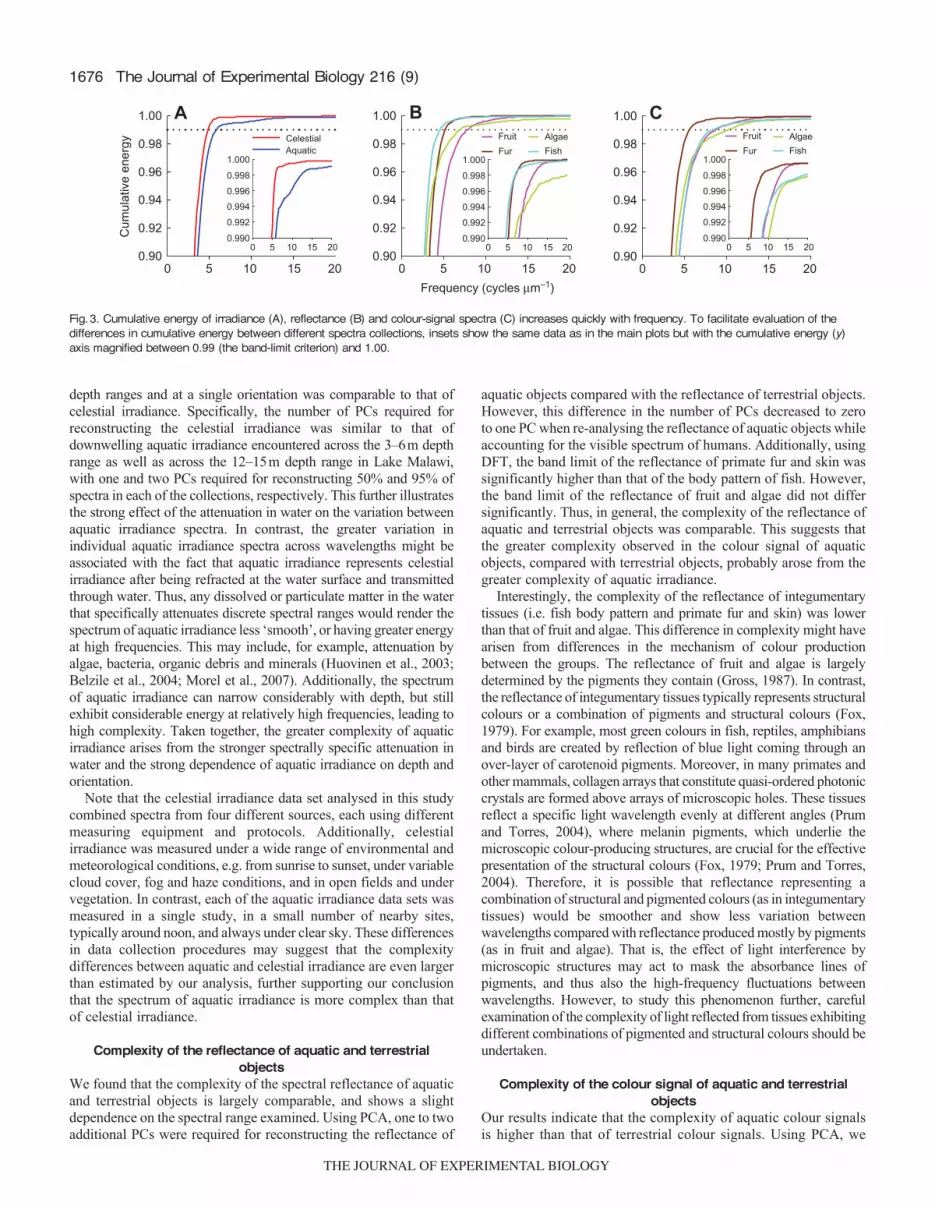
depth ranges and at a single orientation was comparable to that ofcelestial irradiance. Specifically, the number of PCs required forreconstructing the celestial irradiance was similar to that ofdownwelling aquatic irradiance encountered across the 3–6m depthrange as well as across the 12–15m depth range in Lake Malawi,with one and two PCs required for reconstructing 50% and 95% ofspectra in each of the collections, respectively. This further illustratesthe strong effect of the attenuation in water on the variation betweenaquatic irradiance spectra. In contrast, the greater variation inindividual aquatic irradiance spectra across wavelengths might beassociated with the fact that aquatic irradiance represents celestialirradiance after being refracted at the water surface and transmittedthrough water. Thus, any dissolved or particulate matter in the waterthat specifically attenuates discrete spectral ranges would render thespectrum of aquatic irradiance less ‘smooth’, or having greater energyat high frequencies. This may include, for example, attenuation byalgae, bacteria, organic debris and minerals (Huovinen et al., 2003;Belzile et al., 2004; Morel et al., 2007). Additionally, the spectrumof aquatic irradiance can narrow considerably with depth, but stillexhibit considerable energy at relatively high frequencies, leading tohigh complexity. Taken together, the greater complexity of aquaticirradiance arises from the stronger spectrally specific attenuation inwater and the strong dependence of aquatic irradiance on depth andorientation.
Note that the celestial irradiance data set analysed in this studycombined spectra from four different sources, each using differentmeasuring equipment and protocols. Additionally, celestialirradiance was measured under a wide range of environmental andmeteorological conditions, e.g. from sunrise to sunset, under variablecloud cover, fog and haze conditions, and in open fields and undervegetation. In contrast, each of the aquatic irradiance data sets wasmeasured in a single study, in a small number of nearby sites,typically around noon, and always under clear sky. These differencesin data collection procedures may suggest that the complexitydifferences between aquatic and celestial irradiance are even largerthan estimated by our analysis, further supporting our conclusionthat the spectrum of aquatic irradiance is more complex than thatof celestial irradiance.
Complexity of the reflectance of aquatic and terrestrialobjects
We found that the complexity of the spectral reflectance of aquaticand terrestrial objects is largely comparable, and shows a slightdependence on the spectral range examined. Using PCA, one to twoadditional PCs were required for reconstructing the reflectance of
The Journal of Experimental Biology 216 (9)
aquatic objects compared with the reflectance of terrestrial objects.However, this difference in the number of PCs decreased to zeroto one PC when re-analysing the reflectance of aquatic objects whileaccounting for the visible spectrum of humans. Additionally, usingDFT, the band limit of the reflectance of primate fur and skin wassignificantly higher than that of the body pattern of fish. However,the band limit of the reflectance of fruit and algae did not differsignificantly. Thus, in general, the complexity of the reflectance ofaquatic and terrestrial objects was comparable. This suggests thatthe greater complexity observed in the colour signal of aquaticobjects, compared with terrestrial objects, probably arose from thegreater complexity of aquatic irradiance.
Interestingly, the complexity of the reflectance of integumentarytissues (i.e. fish body pattern and primate fur and skin) was lowerthan that of fruit and algae. This difference in complexity might havearisen from differences in the mechanism of colour productionbetween the groups. The reflectance of fruit and algae is largelydetermined by the pigments they contain (Gross, 1987). In contrast,the reflectance of integumentary tissues typically represents structuralcolours or a combination of pigments and structural colours (Fox,1979). For example, most green colours in fish, reptiles, amphibiansand birds are created by reflection of blue light coming through anover-layer of carotenoid pigments. Moreover, in many primates andother mammals, collagen arrays that constitute quasi-ordered photoniccrystals are formed above arrays of microscopic holes. These tissuesreflect a specific light wavelength evenly at different angles (Prumand Torres, 2004), where melanin pigments, which underlie themicroscopic colour-producing structures, are crucial for the effectivepresentation of the structural colours (Fox, 1979; Prum and Torres,2004). Therefore, it is possible that reflectance representing acombination of structural and pigmented colours (as in integumentarytissues) would be smoother and show less variation betweenwavelengths compared with reflectance produced mostly by pigments(as in fruit and algae). That is, the effect of light interference bymicroscopic structures may act to mask the absorbance lines ofpigments, and thus also the high-frequency fluctuations betweenwavelengths. However, to study this phenomenon further, carefulexamination of the complexity of light reflected from tissues exhibitingdifferent combinations of pigmented and structural colours should beundertaken.
Complexity of the colour signal of aquatic and terrestrialobjects
Our results indicate that the complexity of aquatic colour signalsis higher than that of terrestrial colour signals. Using PCA, we
Algae Fish Fur
Fruit
0 5 10 15 20
Cum
ulat
ive
ener
gy
0.90
0.92
0.94
0.96
0.98
1.00 A B
0 5 10 15 200.990
0.992
0.994
0.996
0.998
1.000
0 5 10 15 200.990
0.992
0.994
0.996
0.998
1.000
Celestial Aquatic
Frequency (cycles μm–1)0 5 10 15 20
0.90
0.92
0.94
0.96
0.98
1.00Algae Fish Fur
Fruit
0 5 10 15 200.990
0.992
0.994
0.996
0.998
1.000
C
0 5 10 15 200.90
0.92
0.94
0.96
0.98
1.00
Fig.3. Cumulative energy of irradiance (A), reflectance (B) and colour-signal spectra (C) increases quickly with frequency. To facilitate evaluation of thedifferences in cumulative energy between different spectra collections, insets show the same data as in the main plots but with the cumulative energy (y)axis magnified between 0.99 (the band-limit criterion) and 1.00.
THE JOURNAL OF EXPERIMENTAL BIOLOGY

1677Evolution of tetrachromacy in fish
examined the complexity derived from variation between colour-signal spectra. We found that one to three additional PCs wererequired for reconstructing aquatic colour signals versus terrestrialcolour signals. While the various PCs are orthogonal, theabsorbance spectra of cone photoreceptors are not. Therefore, thenumber of cone photoreceptors required to reconstruct any givenspectrum will be, by definition, equal to or larger than the numberof PCs required to reconstruct the spectrum. Consequently, fishwould require at least four to six cone classes to reconstruct aquaticcolour signals to the degree that humans reconstruct terrestrialcolour signals with three cone classes. Using DFT, we examinedthe complexity derived from variation between wavelengths acrossindividual spectra. Aquatic colour signals included greater energyat high frequencies (higher band limits) than terrestrial coloursignals. Moreover, following the Nyquist sampling theorem, we
found that the number of samples required to reconstruct the band-limited colour signal that is passed by cones in fish was higherby up to three samples than in humans. Thus, also based on thisapproach, fish would require four to six cone classes (additionalone to three cone classes in comparison to humans) to reconstructthe band-limited colour signal sampled by cones. Furthermore, wefound that the shortest wavelength photoreceptors in humans andfish adequately sampled most aquatic (for fish) and terrestrial (forhumans) colour signals. However, the rest of the photoreceptorsundersampled approximately half of the relevant colour signals,i.e. the band limits of photoreceptors were lower than those ofcolour signals. This suggests that colour signals contain high-frequency fluctuations that cannot be recovered by thephotoreceptors. Thus, the capability of fish cones to sample high-frequency fluctuations between wavelengths from the colour
Colour signalAlgae Fish
Ban
d lim
it (c
ycle
s μm
–1)
6
10
14
18
22
No.
of s
ampl
es
6
8
10
12
4
14
Fruit Fur
Ban
d lim
it (c
ycle
s μm
–1)
6
10
14
18
22
No.
of s
ampl
es
6
8
10
12
4
A B
S
ML
SWS1
SWS2bSWS2a
Rh2bRh2aαLWS Rh2aβ
IrradianceCelestial Aquatic
Ban
d lim
it (c
ycle
s μm
–1)
4
5
6
7
8
9
10
ReflectanceFruit Fur Algae Fish
2
4
6
8
10
12
14
16 DC
Colour signal
Fig.4. Aquatic colour signals contain more high-frequency energy and require more samples to reconstruct than terrestrial colour signals. (A,B)Left axesshow that the band limit of the colour signal of aquatic objects was significantly higher than that of terrestrial objects [fish–fur, randomization test (RT),P<0.001, confidence interval 2.5–97.5%, CIfish=9.518–10.968, CIfur=6.236–6.762, Nfish=24,320, Nfur=77,600; algae–fruit, RT, P<0.001, CIalgae=9.405–10.483,CIfruit=8.768–9.146, Nalgae=3760, Nfruit=192,800]. Photoreceptors undersampled the colour signal of objects. Humans: band limit of M- and L-cones exceededthat of the colour signal of less than 75% and 50% of fruit tissues, respectively. Fish: band limits of SWS2a to LWS exceeded that of the colour signal ofless than ~50% of algae and fish tissues. Right axes show the number of samples required to reconstruct the colour signal of aquatic objects was largerthan that of terrestrial objects. (C)The band limit of aquatic irradiance was significantly higher than that of celestial irradiance (RT, P<0.001,CIaquatic=5.833–6.187, CIcelestial=5.001–5.091, Naquatic=80, Ncelestial=400). Band limits of downwelling and sidewelling irradiance did not differ significantly (RT,P=0.067, CIdownwelling=5.556–6.104, CIsidewelling=5.939–6.401, Ndownwelling=36, Nsidewelling=44) (not presented). (D)The band limits of reflectance of fruit andalgae were significantly higher than those of primate fur and fish pattern (fruit–fur: RT, P<0.001, CIfruit=7.885–8.178, CIfur=5.711–6.236, Nfruit=482, Nfur=194;algae–fish pattern: RT, P<0.001, CIalgae=7.239–9.196, CIfish=4.892–5.265, Nalgae=47, Nfish=304); thus, the reflectance of integumentary tissues is constraineddifferently from that of plant and algae tissues. The band limit of reflectance of terrestrial objects was significantly higher (RT, P<0.001, CIfur=5.703–6.239,CIfish=4.891–5.266, Nfur=194, Nfish=304) than, or did not differ from (RT, P=0.574, CIfruit=7.881–8.174, CIalgae=7.256–9.171, Nfruit=482, Nalgae=47), that ofaquatic objects; thus, the greater proportion of high frequencies in the colour signal of aquatic objects arises from the greater proportion of high frequenciesin the aquatic irradiance. In A–D, the visible spectrum of fish (humans) was taken into account for the analysis of aquatic (celestial) irradiance, and thereflectance and colour signal of aquatic (terrestrial) objects. Re-analysis of aquatic irradiance, reflectance and colour-signal data with the visible spectrum ofhumans yielded similar results (not presented). Box: mean (dashed line), median (solid line), 25th and 75th percentiles; whiskers: 10th and 90th percentiles;points: 5th and 95th percentiles.
THE JOURNAL OF EXPERIMENTAL BIOLOGY

1678
signal might indicate an adaptation that allows enhancedreconstruction of the colour signal.
The greater number of PCs required for reconstructing aquaticcolour signals as well as the greater energy of spectral fluctuationsin aquatic colour signals arose partly from extending the visiblespectrum into the ultraviolet, but also from characteristic differencesbetween aquatic and celestial irradiance. This suggests that the highcomplexity of colour signals, and the large number of cone classesrequired for colour signal reconstruction, is a characteristic of theaquatic environment.
Chiao and colleagues addressed the complexity differencesbetween the colour signals of aquatic and terrestrial objects (Chiaoet al., 2000b). These authors collected colour signal (radiance)spectra of natural scenes using a multispectral imager, but referredto the data collected as reflectance rather than radiance (the authorsdiscussed the considerable inaccuracies that might be produced bysuch an approximation, especially under water). Thus, to allow ameaningful comparison, we compared our colour signal results withthose of Chiao and colleagues (referred to as reflectance in theoriginal study). Linear models with four PCs were required toreconstruct (exceed the R2=0.99 variance criterion) colour signalsin forests, whereas linear models with at least five PCs were requiredto reconstruct aquatic colour signals. These results support ourfinding of the higher complexity of aquatic colour signals. Moreover,as (i) the previously reported colour signals were extracted from asmall number of multispectral images (10 for forests and seven forunderwater scenes) and (ii) the underwater images were onlyacquired at shallow depths (3–5m), these colour signals maymisrepresent the variation in the illuminant and underestimate thecomplexity of colour signals, especially under water.
Dimensionality of colour vision in fishFour cone classes are found in the most basal vertebrate lineage,the lamprey (Hyperoartia) (Collin et al., 2003). All four cone opsinclasses were retained by many bony fishes (Osteichthyes) thatinclude both ray-finned fish (Actinopterygii) and lobe-finned fish(Sarcopterygii). However, opsin gene duplications that occurredearly in the evolution of ray-finned fish (230 million years ago orlater, after their divergence from the lobe-finned fish) had increasedthe number of cone opsin genes (Parry et al., 2005; Matsumoto etal., 2006; Spady et al., 2006; Shand et al., 2008; Ward et al., 2008).Thus, lobe-finned fish (represented today by the lungfishes andcoelacanths), that later gave rise to the first tetrapods and to allterrestrial vertebrates (Brinkmann et al., 2004; Takezaki et al., 2004),have fewer cone opsin classes than do teleost fish, an infraclass ofray-finned fish. This suggests that the four to six cone classes, which,we found, are required for fish to reconstruct aquatic colour signalsat an accuracy level comparable to that at which humans reconstructterrestrial colour signals, are probably available in teleost fish.
Importantly, fish might possess a smaller number of cone classesbut with the inevitable loss in accuracy of signal reconstruction.This idea is best illustrated by inspecting the amount of varianceaccounted for by linear models with 1–10 PCs (Table1). Forexample, when attempting to reconstruct 95% of the colour signalsin a collection with linear models that include the first two PCs,fish and humans would be able to recover only 70% and 84.9% ofthe variance between colour signals, respectively, whereas, whenattempting to reconstruct the colour signals with linear models thatinclude the first three PCs, fish and humans would be able to recover90% and 96.8% of the variance between colour signals, respectively.Obviously, fish with three cone classes would do better than thosewith two, but humans would still be able to reconstruct the colour
The Journal of Experimental Biology 216 (9)
signals better. Many coral reef fish were suggested to display twocone classes (Losey et al., 2003) while many African cichlids weresuggested to typically display three cone classes (Jordan et al., 2006;Carleton et al., 2008). Our results indicate that using two or threecone classes in these fish would lead to a reduced accuracy of colour-signal reconstruction compared with that of humans. However,definitive answers regarding the accuracy of signal reconstructionmay only be derived from carefully designed behavioural studies.
Additionally, in this study, we have focused on the very firststage of colour vision, i.e. the sampling of colour signals by conephotoreceptors. This sampling stage is highly critical, as anyinformation that is not being sampled by the photoreceptors ispermanently lost, and cannot be used for later retinal processing(no matter whether it is retinal or cortical). Thus, the role of high-order processing in object discrimination under variableillumination conditions has not been addressed in the currentstudy. Moreover, the variation between colour signals in theimmediate surroundings of the animal and the visual tasks at handmay also shape the number of cone classes. For example, ahypothetical animal needs to discriminate between objects onlyat a specific depth, line of sight and time of day (small variationin incident irradiance). This animal would require a relativelysmall number of cone classes to allow discrimination betweenthe available objects, without any need to account for changes inincident irradiance. However, greater variation in the incidentirradiance would favour a visual system with a larger number ofcone classes to allow accurate recovery of object reflectance anddiscrimination between the available objects.
Furthermore, the requirement for four to six cone classes for thereconstruction of aquatic colour signals holds only for shallow waterthat is characterized by irradiance of high levels and a broadspectrum. However, the gradual decrease in irradiance andnarrowing of the irradiance spectrum with increasing water depthwould favour colour vision systems with a gradually decreasingnumber of cone classes. Eventually, the dim and almostmonochromatic irradiance encountered in deep water would favourone photoreceptor (either cone or rod) maximally sensitive aboutthe wavelength of maximum transmission of irradiance. Thisprediction is supported by previous studies, as shallow-water fishwere shown to possess a greater number of cone classes than deep-water fish (Loew and Lythgoe, 1978; Lythgoe and Partridge, 1989).The spectral location of cone pigments was also reported to varybetween shallow- and deep-water fish, with the latter having conepigments shifted toward short wavelengths, closer to the wavelengthof maximum irradiance transmission (Yokoyama et al., 1999). Ourprediction is also supported by the differences in the number ofcone classes between aquatic mammal groups. Whales and dolphins(Cetacea) as well as seals, sea-lions and walruses (Pinnipedia), whichfrequently forage in deep water, show monochromatic visualsystems (Peichl and Moutairou, 1998; Newman and Robinson,2005). However, manatees (Sirenia), which live in shallow coastallagoons, show dichromatic visual systems (Griebel and Schmid,1996; Newman and Robinson, 2005).
Lastly, it is worth mentioning the mantis shrimp (Stomatopoda,Crustacea), which represents an extreme case of high dimensionalitycolour vision. Stomatopods have 16 classes of photoreceptors, withat least eight of these classes involved in colour vision throughmultiple dichromatic comparisons (Cronin and Marshall, 1989a;Cronin and Marshall, 1989b; Marshall et al., 1996; Chiao et al.,2000a). Stomatopods have intrarhabdomal filters, which narrow thespectral absorbance of photoreceptors (Marshall, 1988; Cronin etal., 1994). This special configuration enhances the ability of
THE JOURNAL OF EXPERIMENTAL BIOLOGY

1679Evolution of tetrachromacy in fish
photoreceptors to recover high-frequency energy from the arrivingcolour signal (higher band limit), and necessitates the use of a largenumber of photoreceptor classes to allow colour-signalreconstruction (Osorio et al., 1997). We suggest that the requirementfor a large number of photoreceptor classes for signal reconstructiontogether with the relatively high complexity of aquatic irradiancemay render the eight-channel colour vision system in stomatopodscost effective, representing an adaptation that may allow exquisiteobject discrimination capabilities.
The current study significantly advances our understanding ofthe evolution of four-dimensional colour-vision systems in fish. Thenumber of cones required for reconstructing aquatic colour signalswas larger than that of terrestrial colour signals, regardless of whetherthe unfiltered or the band-limited (passed by the cones) colour signalwas considered. Therefore, our results, based on two independentapproaches, show that fish would require four to six cone classesfor reconstructing the colour signal of aquatic objects at the accuracylevel achieved by humans viewing terrestrial objects. The need fora larger number of cone classes for colour-signal reconstruction wasan attribute of the aquatic environment, and was true for diversemarine and freshwater ecosystems. This may suggest that the largediversity of cone opsin genes and four-dimensional colour visionin fish are of adaptive significance, and have probably evolved toenhance the reconstruction of the complex colour signals in aquaticenvironments.
APPENDIX 1Description of irradiance and surface reflectance data sets
Aquatic spectral irradianceAquatic irradiance (N=80) was measured in July 2008 at three near-shore sites in Lake Malawi, near Cape Maclear on the northwesternpart of the Nankumba Peninsula, Malawi (Otter Point –14°02′21.02″S, 34°49′20.33″E; Mawlamba – 14°01′05.92″S,34°48′59.91″E; and Mitande – 14°00′58.02″S, 34°48′33.29″E)(Sabbah et al., 2011). Lake Malawi is a clear, nutrient-low (e.g.1–2μgl−1 chlorophyll), oligotrophic lake (Guildford et al., 2007).To represent the irradiance encountered at different positions in agiven habitat, spectral irradiance was measured at two orientations(downwelling and sidewelling), between 1 and 15m depth, a depthrange that Lake Malawi cichlids typically occupy (Ribbink et al.,1983; Konings, 2001). Accurate irradiance measurements closer tothe wavy air–water interface could not be obtained. Irradiance wasmeasured at 1nm intervals using a thermoelectrically cooledspectroradiometer [effective spectral resolution 1.9nm full width athalf-maximum (FWHM) for 200–950nm; QE65000, Ocean Optics,Dunedin, FL, USA] connected to a 30m optical fibre (ZPK600-30-UV/VIS, Ocean Optics) that was fitted with a cosine corrector (CC-3-UV, Ocean Optics). Sampling time exceeded 2s to averageirradiance fluctuations induced by surface waves. Thespectroradiometer setup was calibrated for absolute irradiance usinga calibrated halogen–deuterium dual light source (200–1000nm,DH-2000-CAL, Ocean Optics). All measurements were made atapproximately noon under clear blue sky.
Two spectral irradiance data sets for eutrophic freshwater andmarine systems were adopted. The first data set (N=131) includedirradiance measurements taken at marine systems off the coast ofthe North Pacific during July–August 1991 (Saanich inlet – 48°37′N,123°29′W and Trevor Channel – 48°50′N, 125°10′W) (NovalesFlamarique and Hawryshyn, 1993). These sampling sites representhigh-nutrient (e.g. 2–19μgl−1 chlorophyll, depth dependent),eutrophic marine systems. The second data set (N=240) includedirradiance measurements taken at Lake Cowichan, Vancouver
Island, BC, Canada (48°49′N, 124°03′W) (Novales Flamarique etal., 1992). This sampling site represents a high-nutrient (e.g.1–13μgl−1 chlorophyll, depth dependent), eutrophic freshwatersystem. For both data sets, downwelling and sidewelling irradiancewere measured at 4nm intervals between 300 and 850nm and downto a depth of 15m.
Celestial spectral irradianceCelestial (zenith) irradiance (N=18) was measured just above thewater surface at each of the sampling sites in Lake Malawi usingthe same spectroradiometer configuration described above.Additionally, three data sets of celestial irradiance spectra wereadopted. The first data set (N=66) was obtained at the Nouraguesfield station in French Guiana (4°05′N, 52°40′W) (Regan et al., 1998;Regan et al., 2001). The second data set (N=64) was collected atthe Makerere University Biological Field Station (MUBFS) inKibale forest, Western Uganda (Sumner and Mollon, 2000).Irradiance spectra in these two data sets were measured at 4nmintervals from 380 to 780nm and under diverse meteorologicalconditions, and were obtained from the Cambridge database of natural spectra (http://vision.psychol.cam.ac.uk/spectra/spectra.html). The third data set (N=252) was collected in Granada,Spain (37°118′N, 3°358′W) under a full range of atmosphericconditions (Hernández-Andrés et al., 1998). Irradiance spectra inthis data set were measured from sunrise to sunset at 1h intervals,at 1nm intervals from 300 to 1100nm, and were obtained fromhttp://www.cns.nyu.edu/pub/ltm/Illuminants/Granada.
Choice of spectral irradiance data and biological relevanceTo reliably represent the irradiance incident on terrestrial objects,zenith celestial irradiance was analysed (sidewelling celestialirradiance is typically lacking in the literature, and challenging tomeasure because of the inclusion of obstacles in the light path).However, light attenuation is considerably greater in water than inair (Lythgoe, 1979), rendering the effect of the path length overwhich light is transmitted through the medium considerably largerin the aquatic than in the terrestrial environment. Therefore, toreliably represent the irradiance incident on aquatic objects,downwelling and sidewelling aquatic irradiance that was measuredat different depths was analysed.
Spectral reflectance of algaeSpectral reflectance of algae (N=47) was measured at three near-shore sites in Lake Malawi (see the ‘Aquatic spectral irradiance’section for description of the study sites). Algae reflectance wasmeasured using a custom-built probe that included a divingflashlight (mini Q40, Underwater Kinetics, Poway, CA, USA) anda fibre-coupled spectroradiometer (Jaz, Ocean Optics). The tip ofthe flashlight was fitted with an adaptor that held the optical fibre(QP600-2-UV-VIS, Ocean Optics) oriented at an angle of 45degto the examined surface. The far side of the adaptor included aring of black foam that sealed the reflectance probe against thesurface examined. A SCUBA diver held the reflectance probeagainst underwater substrates covered with algae while readingswere acquired and saved on a laptop computer in a boat. Theirradiance spectrum of the flashlight allowed reliable reflectancemeasurements between 370 and 800nm, and the spectroradiometerconfiguration resulted in an effective spectral resolution of 2.06nm(FWHM) across this range. A measurement of a Spectralondiffuse reflectance standard (WS-1-SL, Ocean Optics) was takenas 100% reflectance, and a dark measurement was taken as zeroreflectance.
THE JOURNAL OF EXPERIMENTAL BIOLOGY

1680
Spectral reflectance of the body pattern of fishSpectral reflectance of the body pattern of fish (N=304) wasmeasured at 1nm intervals using a spectroradiometer (effectivespectral resolution 2.06nm FWHM for 200–950nm; USB2000,Ocean Optics) connected to one arm of a 2m bifurcated optical fibre(BIF600-2-UV/VIS, Ocean Optics). The other arm of the fibre wasconnected to a high output light source (200–1000nm; DH-2000-BAL, Ocean Optics). The common end of the bifurcated fibre wasfitted with a flat black reflectance probe that showed a 3mm diametertip, cut at an angle of 45deg. A measurement of a Spectralon diffusereflectance standard was taken as 100% reflectance, and a darkmeasurement was taken as zero reflectance. Fish were immersed in500ml water containing 2ml of 1:10 clove oil:ethanol solutionimmediately after capture until the fish reached stage III anaesthesia(Jolly et al., 1972). Reflectance was measured at 16–23 differentpoints across the submerged fish body. Spectral reflectance datawere acquired from three individuals of each of five cichlid species:Melanochromis auratus (Boulenger 1897), Metriaclima zebra(Boulenger 1899), Metriaclima aurora (Burgess 1976), Metriaclimacallainos (Stauffer and Hert 1992) and Protomelas taeniolatus(Trewavas 1935).
Spectral reflectance of fruitsA data set of fruit reflectance was adopted. This data set (N=482from 51 plant species) was obtained from fruits collected at theMUBFS, Kibale Forest, Western Uganda. Data were also collectedat other sites within Kibale Forest (which also lie within the samereserve: 0°13′ to 0°41′N and 30°19′ to 30°32′E), at Budongo Forestand in Queen Elizabeth National Park (Sumner and Mollon, 2000).Fruit reflectance spectra were measured at 4nm intervals from 380to 780nm, and were obtained from the Cambridge database ofnatural spectra.
Spectral reflectance of integumentary tissues of primatesA data set of reflectance of fur, skin and pelts of old-world primates(Catarrhine) was adopted. This data set (N=194 from 13 species)was measured at zoos in Uganda and the UK and at the NaturalHistory Museum, London. Reflectance spectra of integumentarytissues were measured at 4nm intervals from 380 to 780nm, andwere obtained from the Cambridge database of natural spectra.
APPENDIX 2Comparison between PCA and DFT and validation of
calculationsBoth approaches, which express spectra as linear models (PCA) oras band-limited functions (DFT), estimate the degrees of freedomof the signal. However, while PCA examines the statistics(dimensionality) of a whole collection of spectra, DFT examinesthe distribution of energy across comb frequencies (Barlow, 1982)in each individual spectrum. DFT is advantageous because itaccounts for the filtering properties of photoreceptors, allowingestimation of the degrees of freedom of the filtered, band-limited,signal.
To verify our PCA calculations, PCA was performed on the fullspectra set of 462 Nickerson–Munsell chips. Variance accountedfor by the model, R2, was in agreement with previously reportedvalues for the 400–700nm range (Maloney, 1986), where 0.9756,0.9960, 0.9980, 0.9993 and 0.9996 of median variance wasrecovered with two to six PCs, respectively. To verify our DFTcalculations, the band limits of all spectra included in the Munselldata set were calculated. Band limits were in agreement withpreviously reported values for the 380–770nm range (Maloney,
The Journal of Experimental Biology 216 (9)
1986), where 0.9459, 0.9859, 0.9990 and 0.9998 of median energywas recovered at frequencies of 3.3, 5, 10 and 15cyclesμm–1,respectively.
Several of the analysed data sets included spectra measured ata resolution of 1nm, while others included spectra measured ata resolution of 4nm. For consistency, low-resolution spectra werespline interpolated to every 1nm prior to analysis. To test theeffect of spectral interpolation on our PCA calculations, thevariance accounted for by the model, R2, was calculated for aselected data set (Lake Malawi irradiance) measured at a spectralresolution of 1nm, and again after this data set was sampled every4nm and interpolated back to 1nm. The variance accounted forby the model did not differ between the original and interpolateddata sets, where 0.9833, 0.9965, 0.9994, 0.9998, 0.9999, 0.9999and 1.0000 of median variance was recovered with the first sevenPCs. Similarly, to test the effect of spectral interpolation on ourDFT calculations, the band limits of spectra included in theoriginal and interpolated data sets were calculated and were foundto be similar (randomization test, P=0.986, confidence interval2.5–97.5%, CIoriginal=5.833–6.187, CIinterpolated=5.832–6.186,N=80).
ACKNOWLEDGEMENTSWe thank Andrew Day, David Berson, Robert Montgomerie, William Nelson, RafiKent, Mark Hornsby and Michael Sutton for comments on the manuscript.
AUTHOR CONTRIBUTIONSS.S. and N.F.T. conceived and designed the analysis. S.S. and C.W.H. designedthe irradiance and reflectance measurement procedures. S.S., C.W.H. andS.M.G. performed the measurements. S.S. analyzed the data. S.S. wrote thepaper. N.F.T., C.W.H. and S.M.G. commented on the paper.
COMPETING INTERESTSNo competing interests declared.
FUNDINGThis work was supported by a Natural Sciences and Engineering ResearchCouncil of Canada (NSERC) Discovery Grant [106102-07 to C.W.H.], a NSERCResearch Tools and Instrumentation Grant [359714-2008 to C.W.H.] and theCanada Research Chair Program to C.W.H. and N.F.T. S.M.G. was supported bya NSERC Postdoctoral Fellowship. S.S. was supported by a Vanier CanadaGraduate Scholarship from NSERC.
REFERENCESAllison, W. T., Dann, S. G., Helvik, J. V., Bradley, C., Moyer, H. D. and Hawryshyn,
C. W. (2003). Ontogeny of ultraviolet-sensitive cones in the retina of rainbow trout(Oncorhynchus mykiss). J. Comp. Neurol. 461, 294-306.
Allison, W. T., Dann, S. G., Veldhoen, K. M. and Hawryshyn, C. W. (2006).Degeneration and regeneration of ultraviolet cone photoreceptors duringdevelopment in rainbow trout. J. Comp. Neurol. 499, 702-715.
Anderson, L. G., Sabbah, S. and Hawryshyn, C. W. (2010). Spectral sensitivity ofsingle cones in rainbow trout (Oncorhynchus mykiss): a whole-cell voltage clampstudy. Vision Res. 50, 2055-2061.
Archer, S. N. and Lythgoe, J. N. (1990). The visual pigment basis for conepolymorphism in the guppy, Poecilia reticulata. Vision Res. 30, 225-233.
Barlow, H. B. (1982). What causes trichromacy? A theoretical analysis using comb-filtered spectra. Vision Res. 22, 635-643.
Belzile, C., Vincent, W. F., Howard-Williams, C., Hawes, I., James, M. R., Kumagai,M. and Roesler, C. S. (2004). Relationships between spectral optical properties andoptically active substances in a clear oligotrophic lake. Water Resour. Res. 40,W12512.
Bone, R. A., Landrum, J. T. and Cains, A. (1992). Optical density spectra of themacular pigment in vivo and in vitro. Vision Res. 32, 105-110.
Bonnardel, V. and Maloney, L. T. (2000). Daylight, biochrome surfaces, and humanchromatic response in the Fourier domain. J. Opt. Soc. Am. A 17, 677-686.
Bowmaker, J. K. (1983). Trichromatic color vision – why only three receptorchannels? Trends Neurosci. 6, 41-43.
Bowmaker, J. K. (2008). Evolution of vertebrate visual pigments. Vision Res. 48,2022-2041.
Brinkmann, H., Venkatesh, B., Brenner, S. and Meyer, A. (2004). Nuclear protein-coding genes support lungfish and not the coelacanth as the closest living relativesof land vertebrates. Proc. Natl. Acad. Sci. USA 101, 4900-4905.
THE JOURNAL OF EXPERIMENTAL BIOLOGY

1681Evolution of tetrachromacy in fish
Carleton, K. L., Spady, T. C., Streelman, J. T., Kidd, M. R., McFarland, W. N. andLoew, E. R. (2008). Visual sensitivities tuned by heterochronic shifts in opsin geneexpression. BMC Biol. 6, 22.
Chiao, C. C., Cronin, T. W. and Marshall, N. J. (2000a). Eye design and colorsignaling in a stomatopod crustacean Gonodactylus smithii. Brain Behav. Evol. 56,107-122.
Chiao, C. C., Cronin, T. W. and Osorio, D. (2000b). Color signals in natural scenes:characteristics of reflectance spectra and effects of natural illuminants. J. Opt. Soc.Am. A 17, 218-224.
Chinen, A., Hamaoka, T., Yamada, Y. and Kawamura, S. (2003). Gene duplicationand spectral diversification of cone visual pigments of zebrafish. Genetics 163, 663-675.
Chittka, L., Shmida, A., Troje, N. and Menzel, R. (1994). Ultraviolet as a componentof flower reflections, and the colour perception of Hymenoptera. Vision Res. 34,1489-1508.
Collin, S. P., Knight, M. A., Davies, W. L., Potter, I. C., Hunt, D. M. and Trezise, A.E. O. (2003). Ancient colour vision: multiple opsin genes in the ancestral vertebrates.Curr. Biol. 13, R864-R865.
Cronin, T. W. and Marshall, N. J. (1989a). Multiple spectral classes of photoreceptorsin the retinas of gonodactyloid stomatopod crustaceans. J. Comp. Physiol. A 166,261-275.
Cronin, T. W. and Marshall, N. J. (1989b). A retina with at least 10 spectral types ofphotoreceptors in a mantis shrimp. Nature 339, 137-140.
Cronin, T. W., Marshall, N. J. and Caldwell, R. L. (1994). The intrarhabdomal filtersin the retinas of mantis shrimps. Vision Res. 34, 279-291.
Dartnall, H. J. A., Bowmaker, J. K. and Mollon, J. D. (1983). Human visualpigments: microspectrophotometric results from the eyes of seven persons. Proc. R.Soc. B 220, 115-130.
DeMarco, P. J., Jr and Powers, M. K. (1991). Spectral sensitivity of ON and OFFresponses from the optic nerve of goldfish. Vis. Neurosci. 6, 207-217.
Denton, E. J., Muntz, W. R. A. and Northmore, D. P. M. (1971). Distribution of visualpigment within retina in two teleosts. J. Mar. Biol. Assoc. UK 51, 905-915.
Edgington, E. S. (1995). Randomization Tests. New York, NY: Marcel-Dekker.Efron, B. and Tibshirani, R. J. (1994). An Introduction to the Bootstrap. New York,
NY: Chapman & Hall/CRC.Endler, J. A., Westcott, D. A., Madden, J. R. and Robson, T. (2005). Animal visual
systems and the evolution of color patterns: sensory processing illuminates signalevolution. Evolution 59, 1795-1818.
Fox, D. L. (1979). Biochromy: Natural Coloration of Living Things. Los Angeles, CA:University of California Press.
Fuller, R. C., Fleishman, L. J., Leal, M., Travis, J. and Loew, E. (2003). Intraspecificvariation in retinal cone distribution in the bluefin killifish, Lucania goodei. J. Comp.Physiol. A 189, 609-616.
Goldsmith, T. H. (1990). Optimization, constraint, and history in the evolution of eyes.Q. Rev. Biol. 65, 281-322.
Goldsmith, T. H., Collins, J. S. and Perlman, D. L. (1981). A wavelengthdiscrimination function for the hummingbird Archilochus alexandri. J. Comp. Physiol.A 143, 103-110.
Govardovskii, V. I., Fyhrquist, N., Reuter, T., Kuzmin, D. G. and Donner, K. (2000).In search of the visual pigment template. Vis. Neurosci. 17, 509-528.
Griebel, U. and Schmid, A. (1996). Color vision in the manatee (Trichechusmanatus). Vision Res. 36, 2747-2757.
Gross, J. (1987). Pigments in Fruits. London: Academic Press.Guildford, S. J., Bootsma, H. A., Taylor, W. D. and Hecky, R. E. (2007). High
variability of phytoplankton photosynthesis in response to environmental forcing inoligotrophic Lake Malawi/Nyasa. J. Great Lakes Res. 33, 170-185.
Hawryshyn, C. W. and Hárosi, F. I. (1991). Ultraviolet photoreception in carp:microspectrophotometry and behaviorally determined action spectra. Vision Res. 31,567-576.
Hawryshyn, C. W. and Hárosi, F. I. (1994). Spectral characteristics of visual pigmentsin rainbow trout (Oncorhynchus mykiss). Vision Res. 34, 1385-1392.
Hawryshyn, C. W. and McFarland, W. N. (1987). Cone photoreceptor mechanismsand the detection of polarized-light in fish. J. Comp. Physiol. A 160, 459-465.
Hawryshyn, C. W., Moyer, H. D., Allison, W. T., Haimberger, T. J. and McFarland,W. N. (2003). Multidimensional polarization sensitivity in damselfishes. J. Comp.Physiol. A 189, 213-220.
Hawryshyn, C. W., Ramsden, S. D., Betke, K. M. and Sabbah, S. (2010). Spectraland polarization sensitivity of juvenile Atlantic salmon (Salmo salar): phylogeneticconsiderations. J. Exp. Biol. 213, 3187-3197.
Hernández-Andrés, J., Romero, J., García-Beltrán, A. and Nieves, J. L. (1998).Testing linear models on spectral daylight measurements. Appl. Opt. 37, 971-977.
Hofmann, C. M., OʼQuin, K. E., Justin Marshall, N. and Carleton, K. L. (2010). Therelationship between lens transmission and opsin gene expression in cichlids fromLake Malawi. Vision Res. 50, 357-363.
Huovinen, P. S., Penttilä, H. and Soimasuo, M. R. (2003). Spectral attenuation ofsolar ultraviolet radiation in humic lakes in Central Finland. Chemosphere 51, 205-214.
Jacobs, G. H. (1981). Comparative Color Vision. New York, NY: Academic Press.Jolly, D. W., Mawdesley-Thomas, L. E. and Bucke, D. (1972). Anaesthesia of fish.
Vet. Rec. 91, 424-426.Jordan, R., Kellogg, K., Howe, D., Juanes, F., Stauffer, J. and Loew, E. (2006).
Photopigment spectral absorbance of Lake Malawi cichlids. J. Fish Biol. 68, 1291-1299.
Kelber, A., Vorobyev, M. and Osorio, D. (2003). Animal colour vision – behaviouraltests and physiological concepts. Biol. Rev. Camb. Philos. Soc. 78, 81-118.
Konings, A. (2001). Malawi Cichlids in Their Natural Habitat. El Paso, TX: CichlidPress.
Levine, J. S., MacNichol, E. F., Jr, Kraft, T. and Collins, B. A. (1979). Intraretinaldistribution of cone pigments in certain teleost fishes. Science 204, 523-526.
Loew, E. R. and Lythgoe, J. N. (1978). The ecology of cone pigments in teleostfishes. Vision Res. 18, 715-722.
Losey, G. S., McFarland, W. N., Loew, E. R., Zamzow, J. P., Nelson, P. A. andMarshall, N. J. (2003). Visual biology of Hawaiian coral reef fishes. I. Oculartransmission and visual pigments. Copeia 2003, 433-454.
Lythgoe, J. N. (1979). The Ecology Of Vision. Oxford: Oxford University Press.Lythgoe, J. N. and Partridge, J. C. (1989). Visual pigments and the acquisition of
visual information. J. Exp. Biol. 146, 1-20.Maloney, L. T. (1986). Evaluation of linear models of surface spectral reflectance with
small numbers of parameters. J. Opt. Soc. Am. A 3, 1673-1683.Marshall, N. J. (1988). A unique colour and polarization vision system in mantis
shrimps. Nature 333, 557-560.Marshall, N. J. (2000). Communication and camouflage with the same ʻbrightʼ colours
in reef fishes. Philos. Trans. R. Soc. B 355, 1243-1248.Marshall, N. J., Jones, J. P. and Cronin, T. W. (1996). Behavioural evidence for
colour vision in stomatopod crustaceans. J. Comp. Physiol. A 179, 473-481.Matsumoto, Y., Fukamachi, S., Mitani, H. and Kawamura, S. (2006). Functional
characterization of visual opsin repertoire in Medaka (Oryzias latipes). Gene 371,268-278.
Maximov, V. V. (2000). Environmental factors which may have led to the appearanceof colour vision. Philos. Trans. R. Soc. B 355, 1239-1242.
Morel, A., Claustre, H., Antoine, D. and Gentili, B. (2007). Natural variability of bio-optical properties in Case 1 waters: attenuation and reflectance within the visible andnear-UV spectral domains, as observed in South Pacific and Mediterranean waters.Biogeosciences 4, 913-925.
Neumeyer, C. (1992). Tetrachromatic color vision in goldfish – evidence from colormixture experiments. J. Comp. Physiol. A 171, 639-649.
Newman, L. A. and Robinson, P. R. (2005). Cone visual pigments of aquaticmammals. Vis. Neurosci. 22, 873-879.
Novales Flamarique, I. and Hawryshyn, C. W. (1993). Spectral characteristics ofsalmonid migratory routes from Southern Vancouver Island (British Columbia). Can.J. Fish. Aquat. Sci. 50, 1706-1716.
Novales Flamarique, I., Hendry, A. and Hawryshyn, C. W. (1992). The photicenvironment of a salmonid nursery lake. J. Exp. Biol. 169, 121-141.
Osorio, D. and Vorobyev, M. (1996). Colour vision as an adaptation to frugivory inprimates. Proc. Biol. Sci. 263, 593-599.
Osorio, D., Marshall, N. J. and Cronin, T. W. (1997). Stomatopod photoreceptorspectral tuning as an adaptation for colour constancy in water. Vision Res. 37, 3299-3309.
Parkyn, D. C. and Hawryshyn, C. W. (2000). Spectral and ultraviolet-polarisationsensitivity in juvenile salmonids: a comparative analysis using electrophysiology. J.Exp. Biol. 203, 1173-1191.
Parry, J. W. L., Carleton, K. L., Spady, T., Carboo, A., Hunt, D. M. and Bowmaker,J. K. (2005). Mix and match color vision: tuning spectral sensitivity by differentialopsin gene expression in Lake Malawi cichlids. Curr. Biol. 15, 1734-1739.
Peichl, L. and Moutairou, K. (1998). Absence of short-wavelength sensitive cones inthe retinae of seals (Carnivora) and African giant rats (Rodentia). Eur. J. Neurosci.10, 2586-2594.
Prum, R. O. and Torres, R. H. (2004). Structural colouration of mammalian skin:convergent evolution of coherently scattering dermal collagen arrays. J. Exp. Biol.207, 2157-2172.
Regan, B. C., Julliot, C., Simmen, B., Viénot, F., Charles-Dominique, P. andMollon, J. D. (1998). Frugivory and colour vision in Alouatta seniculus, atrichromatic platyrrhine monkey. Vision Res. 38, 3321-3327.
Regan, B. C., Julliot, C., Simmen, B., Viénot, F., Charles-Dominique, P. andMollon, J. D. (2001). Fruits, foliage and the evolution of primate colour vision.Philos. Trans. R. Soc. B 356, 229-283.
Ribbink, A. J., Marsh, B. A., Marsh, A. C., Ribbink, A. C. and Sharp, B. J. (1983).A preliminary survey of the cichlid fishes of rocky habitats in Lake Malawi. S. Afr. J.Zool. 18, 149-310.
Rowe, M. P., Baube, C. L., Loew, E. R. and Phillips, J. B. (2004). Optimalmechanisms for finding and selecting mates: how threespine stickleback(Gasterosteus aculeatus) should encode male throat colors. J. Comp. Physiol. A190, 241-256.
Sabbah, S., Laria, R. L., Gray, S. M. and Hawryshyn, C. W. (2010). Functionaldiversity in the color vision of cichlid fishes. BMC Biol. 8, 133.
Sabbah, S., Gray, S. M., Boss, E. S., Fraser, J. M., Zatha, R. and Hawryshyn, C.W. (2011). The underwater photic environment of Cape Maclear, Lake Malawi:comparison between rock- and sand-bottom habitats and implications for cichlid fishvision. J. Exp. Biol. 214, 487-500.
Shand, J., Davies, W. L., Thomas, N., Balmer, L., Cowing, J. A., Pointer, M.,Carvalho, L. S., Trezise, A. E. O., Collin, S. P., Beazley, L. D. et al. (2008). Theinfluence of ontogeny and light environment on the expression of visual pigmentopsins in the retina of the black bream, Acanthopagrus butcheri. J. Exp. Biol. 211,1495-1503.
Siebeck, U. E. and Marshall, N. J. (2007). Potential ultraviolet vision in pre-settlementlarvae and settled reef fish – a comparison across 23 families. Vision Res. 47, 2337-2352.
Slepian, D. and Pollak, H. O. (1961). Prolate spherical wave functions, Fourieranalysis and uncertainty. Bell Syst. Tech. J. 40, 43-63.
Smith, A. C., Buchanan-Smith, H. M., Surridge, A. K., Osorio, D. and Mundy, N. I.(2003). The effect of colour vision status on the detection and selection of fruits bytamarins (Saguinus spp.). J. Exp. Biol. 206, 3159-3165.
Spady, T. C., Parry, J. W. L., Robinson, P. R., Hunt, D. M., Bowmaker, J. K. andCarleton, K. L. (2006). Evolution of the cichlid visual palette through ontogeneticsubfunctionalization of the opsin gene arrays. Mol. Biol. Evol. 23, 1538-1547.
Stockman, A. and Sharpe, L. T. (2000). The spectral sensitivities of the middle- andlong-wavelength-sensitive cones derived from measurements in observers of knowngenotype. Vision Res. 40, 1711-1737.
THE JOURNAL OF EXPERIMENTAL BIOLOGY

1682 The Journal of Experimental Biology 216 (9)
Stockman, A., Sharpe, L. T. and Fach, C. (1999). The spectral sensitivity of thehuman short-wavelength sensitive cones derived from thresholds and color matches.Vision Res. 39, 2901-2927.
Sumner, P. and Mollon, J. D. (2000). Catarrhine photopigments are optimized fordetecting targets against a foliage background. J. Exp. Biol. 203, 1963-1986.
Takechi, M. and Kawamura, S. (2005). Temporal and spatial changes in theexpression pattern of multiple red and green subtype opsin genes during zebrafishdevelopment. J. Exp. Biol. 208, 1337-1345.
Takezaki, N., Figueroa, F., Zaleska-Rutczynska, Z., Takahata, N. and Klein, J.(2004). The phylogenetic relationship of tetrapod, coelacanth, and lungfish revealedby the sequences of forty-four nuclear genes. Mol. Biol. Evol. 21, 1512-1524.
Temple, S. E., Veldhoen, K. M., Phelan, J. T., Veldhoen, N. J. and Hawryshyn, C.W. (2008). Ontogenetic changes in photoreceptor opsin gene expression in cohosalmon (Oncorhynchus kisutch, Walbaum). J. Exp. Biol. 211, 3879-3888.
Temple, S., Hart, N. S., Marshall, N. J. and Collin, S. P. (2010). A spitting image:specializations in archerfish eyes for vision at the interface between air and water.Proc. Biol. Sci. 277, 2607-2615.
Toyama, M., Hironaka, M., Yamahama, Y., Horiguchi, H., Tsukada, O., Uto, N.,Ueno, Y., Tokunaga, F., Seno, K. and Hariyama, T. (2008). Presence of rhodopsin
and porphyropsin in the eyes of 164 fishes, representing marine, diadromous,coastal and freshwater species – a qualitative and comparative study. Photochem.Photobiol. 84, 996-1002.
Vihtelic, T. S., Doro, C. J. and Hyde, D. R. (1999). Cloning and characterization ofsix zebrafish photoreceptor opsin cDNAs and immunolocalization of theircorresponding proteins. Vis. Neurosci. 16, 571-585.
Vorobyev, M. (2003). Coloured oil droplets enhance colour discrimination. Proc. Biol.Sci. 270, 1255-1261.
Vorobyev, M., Osorio, D., Bennett, A. T. D., Marshall, N. J. and Cuthill, I. C.(1998). Tetrachromacy, oil droplets and bird plumage colours. J. Comp. Physiol. A183, 621-633.
Ward, M. N., Churcher, A. M., Dick, K. J., Laver, C. R. J., Owens, G. L., Polack, M.D., Ward, P. R., Breden, F. and Taylor, J. S. (2008). The molecular basis of colorvision in colorful fish: four long wave-sensitive (LWS) opsins in guppies (Poeciliareticulata) are defined by amino acid substitutions at key functional sites. BMC Evol.Biol. 8, 210.
Yokoyama, S., Zhang, H., Radlwimmer, F. B. and Blow, N. S. (1999). Adaptiveevolution of color vision of the Comoran coelacanth (Latimeria chalumnae). Proc.Natl. Acad. Sci. USA 96, 6279-6284.
THE JOURNAL OF EXPERIMENTAL BIOLOGY


