Embed Size (px)
Citation preview
RESPONSE TO REF COMMENTS MS: HESS-2017-37 (V2) Title: A regional scale ecological risk framework for environmental flow evaluations. Author(s): Gordon C. O'Brien et al. MS No.: hess-2017-37 MS Type: Research article Note that the way comments were incorporated into the revised manuscript is presented in blue. Anonymous Referee #1 - report 10 Sep 2017 RC1-P2,L4 Comment: rather 'allocate resources sustainably....'? Response: We’ve amended the sentence to read: “and contribute to the allocation of resources for
sustainable use.” And deleted “of resources and address protection requirements.” RC1-P4,L12 Comment: demonstrated Response: Changed RC1-P4,L25 Comment: including? Response: Changed RC1-P7,L7 Comment: delete space after word 'workshop' Response: Done. RC1-P8,L29 Comment: McCann? Response: Changed RC1-P9,L5 Comment: remove “a” and change: “can generally be easily validated” Response: Done. RC1-P9,L9 Comment: the revision provides a comprehensive supplementary file. Where this is
referred to in the text it would be useful to refer to specific examples, to aid the reader, so in this case calibration: refer to supplementary file page number(s) examples
Response: Specific reference to the supplementary data in the form of “refer to supplementary data Table 1.” Has been included into the MS at: P7,L25; P7,L30; P8,L18; P8,L23; P8,L32 and P11,L2. In addition consider reference made to “refer to BN models provided as supplementary data” in the MS: P8, L16 and P11,L7
RC1-P9,L24 Comment: based on statement usually within a legislative context, needs a bit of elaboration, how does this legislative context guide the social/ecological endpoints being established by the stakeholders (or are the stakeholders drawn themselves from different legislative contexts?)
Response: This section has been amended to include: ”…ecological endpoints are initially established for each risk region by stakeholders. This is usually takes place within a legislative context where regional legislation/policies/agreements are addressed, such as requirements to maintain ecosystem sustainability which affects trade-off developments.
RC1-P9,L34 Comment: average daily or month water flows Response: The end of the sentence refers to percentiles suggesting a range of flows and not just
average. We’ve added “duration” for clarity… “daily or monthly water (usually m3.s-1) and sediment (usually kg.s.m3-1) discharge duration percentiles
Additional Edits-P10,L11 We’ve edited this sentence to improve readability: “In the Lesotho case study the nine social endpoints and three ecological endpoints were used to represent the social-ecological endpoints of interest in the study.”
RC1-P10,L15 Comment: Re statement Generalised BN models for socio-ecological endpoints. ?? Response: Removed. It was an error. RC1-P11,L29 Comment: change to “endpoints, and; maintain....” Response: Amended as recommended. RC1-P12,L16 Comment: based on statement: Interestingly the outcomes included some
improvements or reductions in risk to social endpoints for scenarios 6 to 8 in particular for; wood for fuel in RR2 and grazing for livestock for RR1 and RR4. These outcomes suggest that, based on our current understanding of the socio-ecological systems of the study area, some spatial trade-offs between some ecosystem services are available for
stakeholders of the development to consider (Figure 8). These results describe the relative risk of altered flows to multiple endpoints in the context of exacerbating of non-flow variable 20 conditions. Comment: consider disaggregating this entire paragraph, it is quite lenghty and hard to follow. These last three sentences in particular need simplification.
Response: Amended as follows: These projections allow for trade-off considerations where the wellbeing of some social endpoints will decrease in some parts of the study area and increase in others. From our current understanding of the socio-ecological system represented in this study, from the results some additional sustainable development opportunities may be available for stakeholders to consider (Figure 8). These opportunities may improve the viability of the Phase 2 development and contribute to the establishment of a suitable balance between the use and protection of the ecosystem being evaluated. These relative risk projections to the multiple socio-ecological endpoints considered are based on flow alterations associated with development scenarios, in the context of exacerbating of non-flow variable determinants on regional scales.
RC1-P12,L33 Comment: based on statement: achieved with existing fish migration barriers that could not be mitigated with any of the alternative flow scenarios. Comment: this sentence also hard to follow, although I think I understand what is meant here - but perhaps rephrase to: 'alternative flow scenarios would not satisfactorily mitigate the effects of fish migration barriers, whihc themselves reduce ecosystem well-being'
Response: Amended as recommended to: “The risk outcomes of all future management options suggest that objectives of the stakeholders to maintain the existing wellbeing of the ecosystem could not be achieved as flow scenarios considered would not satisfactorily mitigate the effects of fish migration barriers, which themselves reduce ecosystem well-being. To address this, an additional, amended scenario (Scenario 7)…”
RC1-P13,L12 Comment: Re statement, “In this case study a bottom up approach of increasing flows in the socio-ecological system represented by the BNs until the criterial for E-flows was met was initially followed.” Comment: confusing sentence (also do you mean 'criteria'?) or alternative?
Response: We’ve amended the sentence as follows: “In this case study E-flows were established by initially evaluating the individual flow tolerance exceedance thresholds for numerous social and ecological indicators used in the BNs. This information resulted in the development of a hydrological scenario matching the shape of the natural hydrology that was evaluated in the BNs. Thereafter the BNs themselves were used to generate the hydrological statistic variable conditions required to achieve a suitable risk profile for each social and ecological endpoint that represents the E-flows for the study in the context of the vision for RRs in the study. With this information a range of alterative water resources use scenarios were generated and considered to explore risk trade-offs between social and ecological endpoints. “
RC1-P13,L29 Comment: hypothesises that sufficient… Add “that” Response: Changed as suggested RC1-P14,L25 Comment: change to demonstrates to both Probflo operators and stakeholders Response: Added “both” as suggested. RC1-P14,L27 Comment: remove sentence “and or adaptive management is advocated to test and
improve knowledge of the model indicators.” Reason: this is stated more succinctly at end of paragraph
Response: Done. RC1-P15,L3 Comment: Remove: to further reduce uncertainty associated with the application of the
PROBFLO assessments, the BN-RRM method proposes an adaptive management approach (Step 8) that allows improvements over time as new data is collected. Reason: is that really what is meant by adaptive management - don't you rather mean that, 'an
iterative process allows improvements over time that allow the method to be used in an adaptive management approach'? This is really what you state in the last sentence of the next paragraph, which is more succinct. I would suggest deleting this sentence.
Response: Agreed deleted. RC1-P16,L20 Comment: Remove: The communication phase for the case study included attendance
of the 2014 International Rivers Symposium 20 in Canberra where the project team and stakeholders attended the conference and presented the case study to the international scientific community (O’Brien et al., 2014). Reason: not sure that this sentence is necessary, the key aspect of the paragraph is to demonstrate the participatory stakeholder uptake/buy-in of the method (not the dissemination to scientific audiences).
Response: Agreed, deleted. RC1-P17.L4 Comment: change to “scales” Response: Done. RC1-P17,L8 Comment: sentence needs re-wording e.g in order to make a positive Response: Amended as follows: “We have established a Regional Scale Ecological Risk Assessment
method, incorporating the BN-RRM approach, to evaluate the socio-ecological consequences of altered flows and establish E-flows called PROBFLO. PROBFLO is a robust method for E-flow assessments that meets current best scientific practice that can make a positive contribution to the sustainable management of water resources.”
RC1-P17, L14 Comment: Change to between or to balance? Response: Amended sentence as follows: “From these outcomes stakeholders have in addition, been
able to consider sustainable social and ecological trade-offs in an attempt to balance the use and protection of water resources.”
RC1- P17, L16 Comment: delete “use”. Response: Done. RC1-P17,L18 Comment: Change to stakeholders were presented with evidence based... Response: Amended as recommended.
1
A regional scale ecological risk framework for environmental flow
evaluations.
Gordon C. O’Brien1*, Chris Dickens2, Eleanor Hines3, Victor Wepener4, Retha Stassen1, Leo Quayle5,
Kelly Fouchy6, James MacKenzie1, Mark Graham7 and Wayne G. Landis3.
1University of KwaZulu-Natal, College of Agriculture, Engineering and Science, School of Life Sciences, Private Bag X01, 5
Scottsville, South Africa.
2International Water Management Institute, Private Bag X813, Silverton, 0127, South Africa.
3Western Washington University, Institute of Environmental Toxicology, Bellingham, Washington, USA
4Water Research Group (Ecology), Unit for Environmental Sciences and Management, North-West University, Private Bag
x6001, Potchefstroom 2520, South Africa 10
5Institute of Natural Resources NPC, P O Box 100 396, Scottsville, 3209, South Africa
6IHE Delft Institute for Water Education, PO Box 3015, 2601 DA Delft, The Netherlands 7 University of KwaZulu-Natal, College of Agriculture, Engineering and Science, School of Hydrology, Centre for Water
Resources Research, Private Bag X01, Scottsville, South Africa.
15
Correspondence to: Gordon C. O’Brien ([email protected])
Abstract.
Environmental Flow (E-flow) frameworks advocate holistic, regional scale, probabilistic E-flow assessments that consider
flow and non-flow drivers of change in a socio-ecological context as best practice. Regional Scale ecological risk assessments
of multiple stressors to social and ecological endpoints, that address ecosystem dynamism, have been undertaken 20
internationally at different spatial scales using the relative-risk model since the mid 1990’s. With the recent incorporation of
Bayesian belief networks into the relative-risk model, a robust regional scale ecological risk assessment approach is available
that can contribute to achieving the best practice recommendations of E-flow frameworks. PROBFLO is a holistic E-flow
assessment method that incorporates the relative-risk model and Bayesian belief networks (BN-RRM) into a transparent
probabilistic modelling tool that addresses uncertainty explicitly. PROBFLO has been developed to evaluate the socio-25
ecological consequences of historical, current and future water resource use scenarios and generate E-flow requirements on
regional scales spatial scales. The approach has been implemented in two regional scale case studies in Africa where its
flexibility and functionality has been demonstrated. In both case studies the evidence based outcomes facilitated informed
environmental management decision making, with trade-off considerations in the context of social and ecological aspirations.
This paper presents the PROBFLO approach as applied to the Senqu River catchment in Lesotho and further developments 30
and application in the Mara River catchment in Kenya and Tanzania. The ten BN-RRM procedural steps incorporated in
PROBFLO are demonstrated with examples from both case studies. PROBFLO can contribute to the adaptive management of
water resources, and contribute to the allocation of resources for sustainable use of resources and address protection
requirements.
35
Keywords: PROBFLO, Environmental Flows, Regional Scale ecological risk assessments, E-flow requirements, socio-
ecological consequences, trade-offs, sustainable water resource management.
2
1 Introduction
The global use of water resources has altered the wellbeing of aquatic ecosystems and the benefits that people derive from
them (Acreman and Dunbar, 2004; Dudgeon et al., 2006; Growns, 2008; Vörösmarty, 2010; Isaak et al., 2012; Isaak et al.,
2012; Murray et al., 2012; Grafton et al., 2013; Dudgeon, 2014); Environmental flows (E-flows), according to the Brisbane
Declaration (2007) are defined as the ‘quantity, timing and quality of water flows required to sustain freshwater and estuarine 5
ecosystems and the human livelihoods and well-being that depend on these ecosystems’. In an effort to determine E-flows,
the international community has developed a plethora of E-flows assessment methods which have been applied on numerous
spatial scales in a wide range of ecosystem types across the globe (Tharme 2003; Acreman and Dunbar 2004; Pahl-Wostl et
al., 2013; Poff and Matthews 2013). These methods have evolved during three distinct periods according to Poff and Matthews
(2013) including; an emergence and synthesis period, consolidation and expansion period and the current globalisation period. 10
During this globalisation period a range of best practice E-flow management and assessment principles, and associated
frameworks to undertake E-flow on multiple spatial scales in multiple political and or legislative contexts have been developed
(Poff et al. 2010; Pahl-Wostl et al. 2013). These principles promote the use of holistic assessment tools that consider both
social and ecological features of ecosystems on regional spatial scales, are adaptive and incorporate risk evaluation and address
uncertainty (Poff et al. 2010; Acreman et al. 2014). 15
Ecological risk assessments have been undertaken internationally at different spatial scales using the relative-risk model
(RRM) established since the mid 1990’s (Hunsaker et al. 1990; Landis and Weigers 1997; 2007; Wiegers et al., 1998; Landis
2004; Landis, 2016). The RRM has been applied to evaluate a range of natural and anthropogenic stressors including water
pollution, diseases, alien species and a range of altered environmental states (Walker et al., 2001; Moraes et al., 2002; Hayes 20
and Landis, 2004; Colnar and Landis, 2007; Anderson and Landis, 2012; Ayre and Landis, 2012; Bartolo et al., 2012; O’Brien
et al., 2012.; Hines and Landis, 2014; Ayre et al., 2014). This tool can be used to carry out holistic, probabilistic assessments
of the risk to the availability and condition of ecosystem service and ecological endpoints, and facilitate socio-ecological trade-
offs. For more information on the application of the RRM consider Colnar and Landis (2007), Anderson and Landis (2012)
or O’Brien and Wepener (2012). Recent developments to the RRM incorporates the use of Bayesian Networks (BN) that have 25
been established as a powerful tool for ecological risk assessment, ecosystem management and E-flow assessment (Pollino et
al., 2007; Hart and Pollino, 2008; Shenton et al., 2011; Chan et al., 2012; Pang and Sun, 2014; Liu et al., 2016, McDonald et
al., 2016). In 2012 Ayre and Landis combined both approaches and incorporated BNs into RRMs which was then formalised
into a BN-RRM approach (Hines and Landis 2014; Herring et al., 2015; Landis et al., 2016).
30
Between 2013 and 2016 a BN-RRM based holistic E-flow assessment approach has been developed that adheres to the
principles of best E-flow management practice and can easily be incorporated into regional E-flow frameworks such as the
Ecological Limits of Hydrologic Alteration framework (Poff et al., 2010). This BN-RRM approach we have called PROBFLO,
is a transparent and adaptable, evidence based probabilistic modelling approach that can also incorporate expert solicitations
and explicitly address uncertainty. PROBFLO is a scenario based E-flow assessment tool that allows for the evaluation of the 35
socio-ecological consequences of altered flows with consideration of the synergistic effects of non-flow drivers of ecosystem
impairment. It adheres to the regional scale ecological risk assessment exposure and effects, or sources of multiple stressors,
habitats and ranked ecological impacts relationship (Wiegers et al., 1998). This paper presents the PROBFLO BN-RRM
approach that was used to establish E-flows for the Senqu River in Lesotho, and evaluate the socio-ecological effects of altered
flow and non-flow stressors, and developments made in a Mara River in Kenya and Tanzania case study. 40
3
2 Study area
The Lesotho Highlands Water Project (LHWP) is a US$ multi-billion water transfer and hydro-power project implemented by
the governments of Lesotho and South Africa (LHWP 1986; 2012). Phase I of the LHWP involved the application of the
Downstream Response to Imposed Flow Transformations (DRIFT) approach to establish the E-flows associated with the
construction of the Katse and Mohale Dams on the Malibamats'o and Senqunyane Rivers in Lesotho respectively (Arthington 5
et al., 2003; King et al., 2003). Phase II involves the augmentation of the LHWP by construction of the Polihali Dam to divert
water directly from the upper Senqu River to the existing Phase I infrastructure of the LHWP (Figure 1). For Phase II the
custodians of the project the Lesotho Highlands Development Authority (LHDA) required the service provider awarded with
the E-flow determination project to review and implement current best E-flow practice. This included the requirements to
implement a probabilistic, regional scale modelling approach that is transparent and holistic, addressing socio-ecological 10
components and endpoints, and one that considers uncertainty explicitly. The PROBFLO approach has, as a result been
selected for Senqu River in Lesotho as a part of Phase II of LHWP between the proposed Polihali Dam site (29.289593°S;
28.863890°E) and the border of South Africa (30.413231°S; 27.564090°E) (LHDA, 2016).
The entire Mara River in Kenya and Tanzania upstream of the mouth into Lake Victoria (1.518178°S; 33.943497°E) was 15
considered in this regional scale PROBFLO case study (NBI, 2016) (Figure 2). The Mara River and its tributaries are an
essential source of water for domestic needs, agriculture, pastoralism and wildlife including tourism, in Kenya and Tanzania
(Mati et al., 2008; Defersha and Melesse, 2012). Although extensive research has been undertaken into the management of the
terrestrial ecosystems of the Serengeti National Park and Maasai Mara National Reservenature reserves, there are limited
studies on the effects of land use threats to the wellbeing of the Mara River have been limited, with only low confidencesite-20
specific evaluations of the environmental flows of the river (Broten and Said, 1995; Gereta et al., 2002; Onjala, 2002; Karanja,
2003; Lamprey and Reid, 2004; Hoffman, 2007; Mati et al., 2008; Atisa, 2009; GLOWS-FIU 2012LVBC and WWF-ESARPO,
2010; Majule, 2010; Hoffman et al., 2011; Ogutu et al., 2011; Defersha and Melesse, 2012; Kiambi et al., 2012; Dessu et al.,
2014).
3 PROBFLO Framework for E-flows 25
The PROBFLO framework is based on the ten procedural RRM steps (Landis, 2004a), and incorporates BN development and
evaluation procedures (Marcot et al., 2006; Ayre and Landis, 2012), into a robust E-flow assessment method that gives
emphasis to adaptive management for holistic E-flow management (Figure 3). The PROBFLO approach has been implemented
in the Senqu and Mara River case studies to evaluate the socio-ecological consequences of altered flows and determine E-
flows which is demonstrated through application of the following 10 procedural steps. 30
Step 1: Vision exercise
The importance of having clear water resource management objectives cannot be over-emphasised. Numerous Integrated
Water Resource Management strategies, regional management plans and frameworks, national legislations, and established E-
flow assessment tools advocate the establishment of clear goals or visions to direct the use and protection of water resources
(Biswas 2004; Mitchell, 2005; Dudgeon et al., 2006; Richter et al., 2006; Poff et al., 2010; King and Pienaar 2011; NBI, 2016). 35
Although many vision development approaches are available, the initial application of PROBFLO involved the application of
the Resource Quality Objectives (RQO) determination procedure (DWA, 2011) to describe and document the water quality,
water quantity, habitat and biota objectives for the water resource being evaluated (NBI 2016; DWA, 2011). The RQO process
results in narrative and numerical descriptions of various ecosystem features required to achieve a balance between the use
4
and protection of water resources and hence to achieve a documented vision. As part of the initial development of the RRM
approach, multiple social and ecological endpoints were evaluated in a relative manner. Social endpoints were limited to the
availability and quality of ecosystem services and ecological endpoints including the requirements to maintain selected
ecological indicators in an acceptable integrity state or wellbeing. In addition, for these Environmental Flow Assessments
(EFA) case studies endpoints associated with socio-ecological impacts of the rivers resulting directly or indirectly with altered 5
flows were considered. Findings resulted in relative risks to endpoints that could be compared and used to consider cost-benefit
trade-offs between social and ecological endpoints by adjusting water resource use and protection scenarios.
The treaties for Phase I and Phase II of the LHWP entered into by the Kingdom of Lesotho and the Republic of South Africa
provided the requirements for the establishment of a vision for water resource use and protection for the Senqu River case 10
study (LHDA, 1986; LHDA, 2011). The Treaty gives emphasis to protection of the existing quality of the environment and,
in particular, requires maintenance of the wellbeing of persons and communities immediately affected by the project, including
those downstream of the dam. Accordingly, the vision states that there should be no change to the existing quality of the
downstream environment and that the net effect of the dam should not be negative to the people living downstream of the dam.
For the PROBFLO assessment, RQOs describing the desired quality and quantity of water, habitat and biota for the study area 15
were established. The endpoints selected to represent the social and ecological management objectives for the PROBFLO
assessment were based on the vision represented by the RQOs in this case study including the maintenance of the following
ecosystem services and ecological objectives affected by the river: (1) the supply of building sand from the Senqu River, (2)
water for domestic use, (3) recreation/spiritual use of the river, (4) fish stocks as food for people, (5) edible plants from the
riparian zone as food for people, (6) medicinal plants for people, (7) floodplain non-woody plants (for grazing), (8) woody 20
plants for fuel and construction , (9) reeds for construction and (10) maintain fish (12) aquatic marco-invertebrate and (12)
riparian ecosystem integrity or wellbeing.
The vision for the Mara River case study was based on existing regional trans-boundary Mara River management objectives
(WRMA, 2014). In 2014, a Catchment Management Strategy (CMS) for the Mara Basin in Kenya was developed to facilitate 25
the management of the water resources, environment and human behaviour in ways that achieve equitable, efficient and
sustainable use of water for the benefit of all users (WRMA, 2014). The aims of the Mara River Basin as part of the Strategic
Environmental Assessment (EAC, 2003) to maintain “the people living in harmony with nature while achieving human
wellbeing and sustainable economic development in perpetuity” were also considered. Also considered were the objectives for
the Mara River Basin as described by the Biodiversity, and Strategy Action Plan which describes “a region rich in biodiversity 30
which benefits the present and future generations and ecosystem functions” ( GLOWS-FIU 2012LVBC & WWF-ESARPO,
2010). The Kenyan Water Resources Management Authority (WRMA)These assessments established a high ecological
importance, high livelihoods value and low commercial value vision for the upper Mara River Basin (Nyangores and Amala
River) and a high ecological importance, moderate livelihoods value and moderate commercial value vision for the lower
mainstem Mara River Basin. In this context the endpoints selected for the study included: (1) to provide water for Basic Human 35
Needs according to the national legislation of Kenya and Tanzania, (2) to maintain the ecological integrity of the riverine
ecosystem (instream and riparian ecosystems), (3) to provide flows for the commercial production of crops, (4) the
maintenance of existing livestock industry, (5) the maintenance and viability of the Eco-tourism industry, and (6) maintain the
ecological integrity of the Mara Wetland in the lower reaches of the basin.
40
5
Step 2: Mapping and data analyses
The BN-RRM approach that forms the basis of PROBFLO includes the relative evaluation of multiple sources of stressors to
endpoints on a regional scale which should be spatially and temporally referenced for regional comparisons/evaluations in a
PROBFLO assessment (Landis 2004a; Landis & Wiegers 2007). For this the spatial extent of the study area must be defined
and described, and the locations of potential sources, habitats and impacts must be identified and spatially referenced. In 5
addition, source-stressor exposure and habitat/receptor to endpoint pathways/relationships should be spatially referenced
where possible (O’Brien & Wepener 2012; Landis et al. 2016). Available data describing the ecosystem needs to be reviewed
and spatially referenced and the uncertainties associated with the availability and quality of data used in the assessment must
be documented for evaluation in Step 7. O’Brien & Wepener (2012) provide an approach to delineate ecosystem types, the
topological features of importance, the catchment and ecoregion boundaries, the land or water resource use scenarios and the 10
pathways of stressors exposure. This approach is used to direct the selection of risk regions for assessment (Smit et al., 2016).
Best practice E-flow frameworks accentuate the importance of ecosystem type classification as part of E-flow assessments to
improve on our understanding of flow-ecosystem relationships (Poff et al., 2010, Arthington, 2012).
Step 3: Risk region selection 15
In this step combinations of the management objectives, source information, and habitat data are used to establish geographical
risk regions that can be assessed in a relative manner ( Landis 2004b; O’Brien and Wepener, 2012) . In the end, the outcomes
of the assessment will be available at the spatial scale established during this step for multiple temporal scenarios associated
with alternative management options. In this regard it is important to consider the spatial connectivity of multiple variables
including flows and other variables within the study area so that risk regions incorporate appropriate sources, stressors, habitats 20
and endpoints (Landis 2004b; O’Brien and Wepener 2012). The approach can address spatial and temporal relationships of
variables between risk regions, such as the downstream effect of a source on multiple risk regions, in the context of the
assimilative capacity of the ecosystem or the upstream connectivity requirements of a migratory fish between risk regions. To
demonstrate that PROBFLO can conform to the regional E-flow assessment frameworks such as ELOHA (Poff et al. 2010),
the selection of RRs should include explicit hydrological and geomorphological classification. The relative risk outcomes of 25
the assessment can later be directly related to the system classification as proposed by ELOHA. With additional E-flow
information for a range of hydrological and geomorphological ecosystem types, the outcomes can be used to establish regional
E-flows.
The selection of risk regions for the Senqu River E-flow assessment was based on the proposed location of the Polihali Dam 30
and catchment boundaries of the Senqu River and large tributaries (Malibamatso and Senqunyane Rivers) for this E-flow
assessment. Physical access to sampling sites within Lesotho to conduct bio-physical field surveys were extremely difficult
and this also contributed to risk region selection. Four broad risk regions were selected for the Senqu River PROBFLO study
(Figure 1).
35
In the Mara River case study a review of ecosystem typesland use and land cover (Mati et al., 2008; Atisa et al., 2014),
hydrology (Mango et al., 2011; McClain et al., 2014), the vision for the case study, current and future land and water resource
use options and socio-ecological importance ( Karanja, 2002; LVBC & WWF-ESARPO, 2010; Mango et al., 2011; Defersha
and Melesse, 2012; GLOWS-FIU 2012; Dessu et al., 2014; Dutton et al., 2013), were used to select risk regions during a
stakeholder workshop. Ten Risk Regions were selected for the Mara River Case study which conformed to catchment 40
boundaries, ecoregions, land use practices and the international boundary (Figure 2).
6
Step 4: Conceptual model
In this step conceptual models that describe hypothesised relationships between multiple sources, stressors, habitats and
impacts to endpoints selected for the study are generated (Wiegers et al., 1998) (Figure 4). This includes the holistic (consider
flow and non-flow related variables in spatial-temporal context), best practice characterisation of flow-ecosystem and flow-5
ecosystem service relationships in the context of a regional scale E-flows framework (Poff et al., 2010), with relevant non-
flow (water quality and habitat) relationships in the models. Conceptual models should be constructed by expert stakeholders
usually including hydrologists, geomorphologists, ecologists and ecosystem services, including social and resource economics
scientists. These experts should be familiar with socio-ecological system processes and be able to describe probable cause and
effect variables and relationships of sources to stressors to multiple receptors in relation to their impacts on the endpoints, 10
selected for the study. The conceptual models for the case studies presented addressed requirements of the ELOHA and the
Nile Basin regional scale E-flow frameworks to conform to these frameworks (Poff et al., 2010; NBI, 2016). The Nile Basin
regional scale E-flow framework expands on the ELOHA framework to include an initial situation assessment, data review
and alignment phase and a governance and Resource Quality Objectives setting phase. The PROBFLO conceptual model thus
conforms to the regional scale E-flow framework procedures in: (1) the selection of socio-ecological endpoints, to direct the 15
hydrologic foundations for the study including the selection of hydrological statistics required, (2) to classify ecosystem types
based on geomorphic, water quality, quantity and ecoregion considerations, and with this data, (3) to incorporate evidence
based flow-ecosystem relationships and flow-ecosystem service relationships, with relevant non-flow variable relationships
upon which the assessment is based. Initial conceptual model development considers all relevant sources, stressors, habitat,
effects and impact relationships with spatial and temporal considerations. 20
Step 5: Ranking scheme
Ranking schemes are used to represent the state of variables, with unique measures and units to be comparable as non-
dimensional ranks and combined in BN-RRMs (Landis, 2004a; Landis et al., 2016). Four states designated as zero, low,
moderate and high as traditionally used in RRMs ( Colnar & Landis, 2007; O'Brien and Wepener, 2012; Hines & Landis 2014;
Landis et al. 2016), have been incorporated into the PROBFLO process. The states represent the range of wellbeing conditions, 25
levels of impacts and management ideals as follows:
Zero: pristine state, no impact/risk, comparable to pre-anthropogenic source establishment, baseline or reference state,
Low: largely natural state/low impact/risk, ideal range for sustainable ecosystem use,
Moderate: moderate use or modified state, moderate impact/risk representing threshold of potential concern or alert
range, and 30
High: significantly altered or impaired state, unacceptably high impact/risk.
This ranking scheme selected for PROBFLO represents the full range of potential risk to the ecosystem and ecosystem services
with management options. Low risk states usually represent management targets with little impact and moderate risk states
represent partially suitable ecosystem conditions that usually warrant management/mitigation measures to avoid high risk
conditions. The incorporation of BN modelling into PROBFLO, allows the approach to incorporate the variability between 35
ranks for each model variable, represented as a percentage for each rank. Indicator flow and non-flow variables representing
the socio-ecological system being evaluated in a PROBFLO assessment are selected (linked to endpoints – step 1), and unique
measures and units of measurement are converted into, and represented by ranks for integration in BN assessments. For the
BN assessment ranks are assigned scores along a percentage continuum representing the state of the variables using natural
breaks of 0.25 (zero), 0.5 (low), 0.75 (moderate) and 1 (high) in the calculation. 40
7
Step 6: Calculate risks
From the general inclusive conceptual models (step 4), with the principle of requisite simplicity (Stirzaker et al., 2010), smaller
social and ecological endpoint specific models that represent the system being assessed are unpacked and converted into
Bayesian Network models (Figure 5 and 6) for analyses. These models can be analysed individually or integrated using a range 5
of BN modelling tools, using nodes representing variables that share the same indicators and measures. Bayesian Networks
are probabilistic modelling networks that graphically represent joint probability distributions over a set of statistical values
(Pollino et al., 2007; Korb and Nicholson, 2010). They include parent or input nodes and child or conditional nodes with links
that represent causal relationships between nodes combined by Conditional Probability Tables (CPTs) (McCann et al., 2006;
Landis et al. 2016;). Conditional Probability Tables describe conditional probabilities between the occurrence of states in the 10
parent nodes and the resulting probabilities of states in the child nodes (Landis et al., 2016). The two PROBFLO case studies
presented here made use of the NeticaTM BN software by Norsys Software (http://www.norsys.com/).
The BNs are initially used to evaluate the risk of anthropogenic/natural hazards to endpoints per risk region, in relative manner
for comparisons, for multiple temporal periods (high or low flow months and wet or drought phases etc.) which can also be 15
compared relative to each other. Bayesian Networks also make use of available data and expert solicitations as evidence to
represents risks to current or present scenarios. Present projections of risk to the endpoints can generally be easily validated
using available data, knowledge of existing relationships between variables and by carrying out directed field survey
campaigns to describe/test risk relationships. Present risk projections are then calibrated by evaluating benchmark or historical
scenario risk projections using the established models, which can often be validated with historical data (see supplementary 20
data). An example of how a BN can represent a component of the socio-ecological ecosystem being evaluated is presented in
Figures 5 and 6. Within Figure 5 we for example hypothesise that the ecological integrity of fish in the Senqu can be selected
as an indicator of the Senqu River ecosystem as a suitable ecological endpoint. In this example the ecological integrity of fish
is hypothesised to be a function of the condition of the Senqu River environment for fish, representing the exposure leg of the
risk assessment, and the potential for fish to occur within the reach of the river being considered as an effects component of 25
the study (refer to supplementary data Table 1). The condition of the Senqu River environment itself is hypothesised in this
study to be a function of the potential for communities to “disturbance wildlife”, the instream habitat condition and migration
access for fish as source-stressor relationships with local communities, multiple barriers and other source/stressors that affect
instream habitat wellbeing selected indicators with associated measures in the study. Water resource use scenarios were used
to describe the state of source/stressor and effect nodes as inputs into the model. These variables were integrated using CPTs 30
to represent other system variables which ultimately result in risk described to endpoints (refer to supplementary data Table
2). These models are then used to determine E-flow requirements according to acceptable trade-off of risk to endpoints selected
for the study, and the consequences of alternative water resource use, management and or climatic condition scenarios.
To determine E-flow requirements in PROBFLO, trade-offs of acceptable risk to social and ecological endpoints are initially 35
established for each risk region by stakeholders. This is usually takes place within a legislative context where regional
legislation/policies/agreements are addressed, such as requirements to maintain ecosystem sustainability which affects trade-
off developments. These trade-offs of acceptable risk are represented in the BNs as forced endpoint risk distributions or
profiles. These profiles usually range between low and moderate risk with usually no high risk probabilities. In relation to the
definitions of the ranks used in PROBFLO, trade-offs of acceptable risk for E-flow determination should only dominate the 40
“moderate” risk range when there is certainty that the E-flow requirements can be provided, such as in the case of E-flow
releases from a dam. In case studies where there is high uncertainty associated with the ability to provide E-flow requirements,
8
such as the management of multiple water resource users to cumulatively maintain E-flows, then a buffer should be provided
according to the definition of ranks and the “low” risk range should be selected. After the selection of trade-offs of acceptable
risk are established the calibrated BNs are forced to generate the state (rank distributions) of input flow variables used in the
assessments. These flow related variable state requirements that are spatially and temporally referenced are provided to a
hydrologist or geomorphologist for example to describe the E-flow requirements which can be presented in various formats, 5
such as daily or monthly water (usually m3.s-1) and sediment (usually kg.s.m^3-1) discharge duration percentiles. During E-flow
determination procedures the state of non-flow variable nodes, which contribute to the risk to endpoints, associated with flow
variables can either be maintained in their current state, and described as such or amended with available water resource use
information. This can include the increased requirement of water for Basic Human Needs, for increases in growths of human
populations depending on the resource for example. Following the establishment of E-flows, the socio-ecological 10
consequences of altered flows, associated with alternative water resource management options or climate change variability
for example, can be evaluated in a relative manner by generating and evaluating a range of future scenarios in PROBFLO.
Senqu River risk calculation
In the Lesotho case study the nine social endpoints and three ecological endpoints were used to represent the social-ecological 15
endpoints of interest in the study. The 12 BN models established for the study included cause and effect linkages used to
estimate risk (refer to BN models provided as supplementary data). These BNs were used to evaluate the risk of multiple
sources and stressors with flow related stressors for base winter (low), summer (high) and drought flows. Where appropriate
CPTs of the BNs for endpoints were adjusted between RRs to represent the subtle changes in ecosystem process dynamics
down the length of the Senqu River (refer to supplementary data Table 1 and Table 2). 20
Evidence used includes the historical understanding of flow-ecosystem and flow-ecosystem service relationships established
during Phase I of the LHWP, and data derived from a series of bio-physical surveys of the study area (refer to supplementary
data Table 1 and Table 2). The surveys included hydrology, hydraulic, water quality and geomorphology components grouped
as ecosystem driver components, and fish, macro-invertebrates and riparian vegetation grouped as ecosystem responder 25
components. Hydrological data used in the case study included recently updated basin-wide Integrated Water Resources
Management Plan outcomes (ORASECOM, 2014). This database was updated in the study with latest available rainfall
records, obtained from the Lesotho Meteorological Services, and regional evaporation information. Observed monthly flow
data with actual discharge measurements determined in the study were used to calibrate the monthly WRSM2000 model
against rainfall to obtain catchment specific rainfall-runoff parameters (Pitman et al., 2006). A range of hydrological statistics 30
were used in the RRM-BN model. Findings were used to identify a range of indicators to represent hypothesised causal
relationships of the socio-ecological system being evaluated, identify measures for indicators, with units of measurement and
node rank thresholds and relationships between variables in the form of CPTs (refer to supplementary data Table 2). NeticaTM
was used to carry out the assessment. (Ayre et al., 2014 for example). The tool is versatile and incorporates a range of features
used to optimise the assessment. This includes equation features to weight the relative importance of parent variables and 35
generate initial CPTs that were easily refined and applied to the daughter nodes for the assessment. The tool includes case file
generation options which allows the BNs to be linked to Microsoft® Excel where data can be rapidly analysed and used to
populate BNs for the analyses. Risk outcome distributions were also linked to Excel where scenarios and social and ecological
endpoints could be integrated using Monte Carlo randomisation approaches that are part of the Oracle Crystal Ball software
(Landis, 2004b). After establishing BN models for each RR, then input parameters were changed using RR specific data for a 40
range of scenarios including:
9
Scenario 1 represents the present day scenario based on present state hydrology, and associated source to endpoint
variable state relationships that represent observable conditions. This scenario is based on existing data and additional
data collected during the field surveys.
Scenario 2 represents a pre-anthropogenic water resource development scenario, considered to represent “natural”
hydrology which was modelled using historical and modelled hydrology and rainfall data, and hypothesised state 5
distributions for non-flow variables. This scenario was selected to calibrate the PROBFLO model for the study.
Scenario 3 includes the presence of the new proposed Polihali Dam with full modelled Inter-basin Transfer (IBT)
supply. Only large floods overtopping the dam have been considered to be available downstream of the dam with the
existing E-Flows from the downstream lateral tributaries bringing water from Katse and Mohale Dams available in
RR3 and 4. Non-flow source/stressor catchment conditions were based on the present day scenario. 10
Scenario 4 is based on scenario 3 but includes E-Flow releases established as 36% of the natural Mean Annual Runoff
(MAR), from the Polihali Dam, with suitable freshet and flood flows. The range of percentages of the MAR
considered in these scenarios were selected by stakeholders to evaluate different levels of water resource use for the
development.
Scenario 5 based on scenario 3 with only 25% of the natural MAR available to contribute towards E-flows with all 15
floods retained in the Polihali Dam for transfer into the IBT.
Scenario 6 is based on scenario 5 with one additional 40m3.s-1 freshet (small spring flood) released from the dam in
addition to the 25% of the natural MAR to contribute towards E-flows.
Scenario 7 based on scenario 3 with only 18% of the natural MAR available to contribute towards E-flows with one
single 40m3.s-1 freshet (small spring flood). 20
Scenario 8 is based on scenario 6 but with additional stress imposed by further reduction of available flows to 12%
of the natural MAR, released for maintenance but including the single 40m3.s-1 freshet (small spring flood).
In this assessment risk was calculated for 12 endpoints, for three temporal periods, for eight scenarios, thus representing 312
BN models that were relatively comparable. The results include the mean relative risk rank scores with associated standard 25
deviation for each endpoint including: maintain riparian vegetation, macro-invertebrates and fish wellbeing as ecological
endpoints, and: maintain wood for fuel, marginal vegetation for livestock grazing and fish for food as social endpoints (Figure
7 and Figure 8). These initial relative mean risk scores allow for the comparison of alternative spatial and temporal socio-
ecological risk projections to the endpoints used in the assessment. Initial risk to ecological endpoints compared between the
natural (SC2) and present (SC1) scenarios, demonstrate that the number of sources and stressors with associated risk to 30
endpoints has increased in the study area particularly in RR2 to RR4. These changes can largely be attributed to the
consequences of Phase I of the LHWP (Figure 7). These findings include the synergistic effect of non-flow stressors (such as
water quality and habitat condition) to the wellbeing of the Senqu River ecosystem in the study area. Effects of the altered
hydrology between natural and present day scenarios to the social endpoints were less obvious (Figure 8). Spatial trends in the
risk results associated with SC3 to SC8 generally include elevated risk to RR1, directly downstream of the proposed dam in 35
particular. These results demonstrate that the impact on socio-ecological endpoints considered will be highest directly below
the dam. Thereafter scenarios that exclude floods and freshets (SC3 and SC5) resulted in excessive risk demonstrating the
importance of flood and freshet flows to the socio-ecological endpoints. Outcomes for scenarios 6 to 7 for riparian vegetation
and invertebrates include consistent increases in risk spatially from the proposed new dam towards the lower reaches of the
study area, which is ascribed to accumulative effects of the existing Phase I dams on the lateral tributaries. The relative risk to 40
the fish community endpoint includes an opposite trend where a reduction in risk from RR1 to RR4 was observed for all
scenarios. These results are indicative of the increased relative resilience of the resident and seasonal migratory fish
communities to flow alterations in the Senqu River associated with dam developments, due to the increasing size of the river
10
and associated increases in habitat diversity towards the lower reaches of the study area. In addition, reductions in river
connectivity (barrier formation) associated with existing impacts from Phase I and the synergistic new stressors associated
with Phase II of the LHWP was also shown to contribute to the increase in risk from the lower reaches of the study area in
RR4 for fishes migrating upstream to RR1. Interestingly the outcomes included improvements to the condition of, or reductions
in risk to the wellbeing of social endpoints for scenarios 6 to 8. This included potential improvements in the availability of and 5
or condition of wood for fuel in RR2 and grazing for livestock for RR1 and RR4 in particular. These projections allow for
trade-off considerations where the wellbeing of some social endpoints will decrease in some parts of the study area and increase
in others. From our current understanding of the socio-ecological system represented in this study, from the results some
additional sustainable development opportunities may be available for stakeholders to consider (Figure 8). These opportunities
may improve the viability of the Phase 2 development and contribute to the establishment of a suitable balance between the 10
use and protection of the ecosystem being evaluated. These relative risk projections to the multiple socio-ecological endpoints
considered are based on flow alterations associated with development scenarios, in the context of exacerbating of non-flow
variable determinants on regional scales.
The cumulative risk of all ecological and social endpoints for each RR, for each temporal period, per scenario, were evaluated 15
using Monte Carlo simulations (5000 trials, Oracle Crystal Ball software, Oregon) (Ayre et al., 2014). The outcomes included
relative risk projections displayed as relative profiles to single endpoints from multiple RRs, and multiple social and ecological
or all endpoints per RR in the study for comparisons and evaluation. These profiles were generated for multiple scenarios to
evaluate the potential social and ecological consequences of alternative water resource development scenarios. This is
demonstrated by considering the cumulative risk projections to the fish wellbeing endpoint, which demonstrates that relative 20
to the “Natural” hydrology scenario (Scenario 2) where there is a 83% probability that risk to the fish endpoint occurred in a
zero to low risk range, for the Present scenario (Scenario 1), Phase II with the dam and no E-flows scenario (Scenario 3) and
Scenario 7 (Phase II with the dam, 18% release of natural MAR and 40m3.s-1 freshets), all range between the moderate and
high risk range (Figure 9). The risk outcomes of all future management options suggest that objectives of the stakeholders to
maintain the existing wellbeing of the ecosystem could not be achieved as flow scenarios considered would not satisfactorily 25
mitigate the effects of fish migration barriers, which themselves reduce ecosystem well-being. To address this, an additional,
amended scenario (Scenario 7) was then modelled which included successful mitigation measures for the existing man-made
barriers in the Senqu River as amendments. The outcomes included a reduction in risk in the low to moderate risk ranges,
demonstrating that scenarios that promote moderate to high use of the water resources, with barrier mitigation measures (such
as construction of fish-ways) could result in the achievement of the fish wellbeing endpoints in the study. This approach 30
established for this case study allows for the relative comparison of the integrated social and or ecological consequences of
altered flows in the context of non-flow variables for each scenario for each endpoint used to represent the use and protection
management objectives of the study as shown in Figure10. In Figure 10 the integrated risk probability profiles to all endpoints
for each RR which compares Scenario 2 (reference scenario) to the high use Scenario 3. These results include elevated risk
probabilities for RR1 (84% moderate and 15% high rank range) and RR2 (81% moderate) while existing E-flows from Phase 35
I dams reduce the risk posed for this scenario in RR3 and RR4. The relative risk results to endpoints and integrated risk profiles
were presented to stakeholders who used these outcomes to select E-flows and associated water resource use mitigation
measures (such as barrier mitigation measures) to be implemented for Phase II of the LHWP. In this case study E-flows were
established by initially evaluating the individual flow tolerance exceedance thresholds for numerous social and ecological
indicators used in the BNs. This information resulted in the development of a hydrological scenario matching the shape of the 40
natural hydrology that was evaluated in the BNs. Thereafter the BNs themselves were used to generate the hydrological statistic
variable conditions required to achieve a suitable risk profile for each social and ecological endpoint that represents the E-
11
flows for the study in the context of the vision for RRs in the study. With this information a range of alterative water resources
use scenarios were generated and considered to explore risk trade-offs between social and ecological endpoints.
Mara River risk calculation
In the Mara River case study the relative risk of stressors and the E-flows were established according to the four social and 5
two ecological endpoints considered in the assessment. The Mara River case study (refer to supplementary data Table 1), was
based on existing data from historical surveys (Mati et al., 2008; McCartney, 2010; Majule, 2010; LVBC and WWF-ESARPO,
2010; Mango et al., 2011; Kanga et al., 2011; Defersha and Melesse, 2012; Defersha et al., 2012; GLOWS-FIU 2012; Dutton
et al., 2013; Atisa et al., 2014; Gichana et al., 2014; Kilonzo et al., 2014; McClain et al., 2014) and a single site visit by the
author to refine the CPTs (NBI, 2016). During this survey seven sites were selected to represent the variability of the all of the 10
RRs in the study area. After establishing BN models for each RR (refer to BN models provided as supplementary data), input
parameters were changed using RR specific data for two scenarios including the present condition and alternately the E-flow
requirement to achieve the basic human needs and ecological wellbeing of the Mara River known as the Ecological Reserve
(United Republic of Tanzania, 2009; Government of Kenya, 2002).
15
In this case study relative risk results were used to generate E-flow requirements that would not pose excessive risk to the
wellbeing of ecological endpoints and social endpoints as described by the RQOs (LVBC and WWF-ESARPO, 2010). The
assessment hypothesises that sufficient flows currently exist to maintain the endpoints in an acceptable condition. In addition,
in the context of the precautionary principle, additional flows can be allocated before risk to the endpoints exceeds acceptable,
sustainable thresholds. Results further demonstrate that sustainable water allocations would reduce risk to selected social 20
endpoints selected in the study and meet the desired balance between the use and protection of the resource (Figure 11). The
approach highlighted the probable effect of non-flow related stressors that are affecting the ecological wellbeing of Mara River,
including water physio-chemical impacts and habitat alteration stressors associated with urban and rural communities,
livestock grazing and watering and the effect of the recent exponential increase in local Hippopotamus amphibius populations
in the tributaries of the Mara River in particular that are affecting water quality in the system (Kanga et al., 2011; Subalusky 25
et al. 2015). These results were used to demonstrate the relative risk of sources or water resource activities that affect flows
relative to other sources to the risk to ecosystem wellbeing (Figure 11). The approach successfully demonstrated how the BN-
RRM approach in PROBFLO can be used to generate acceptable risk profiles for endpoints to evaluate the socio-ecological
consequences of altered flows. And how these models can be used to determine E-flows and associated information for water
resource use. 30
Step 7: Uncertainty evaluation
Best ecological risk assessment practice requires the explicit evaluation of uncertainty, or confidence assessment, (O’Brien
and Wepener 2012; Landis, 2004b), which has been incorporated into the PROBFLO approach. Any and all aspects of
uncertainty associated with the entire BN-RRM process, including objectives and endpoint selection for the assessment, 35
availability and use of evidence, expert solicitations and model uncertainty for example, must be addressed. In an effort to
reduce uncertainty, the BN-RRM approach adopted by PROBFLO inherently considers uncertainty associated with cause and
effect relationships and the use of real data with expert solicitations (Uusitalo, 2006; Landis et al., 2016). The additional
incorporation of entropy reduction analysis in relative risk calculations using Monte Carlo simulations also contributes to
uncertainty reduction in PROBFLO. Additional analyses of the sensitivity of the BN-RRM should be addressed within the 40
uncertainty evaluation section (Pollino et al., 2007; Hines and Landis, 2014), where the relative influence of input nodes on
the endpoints can be evaluated as part of the PROBFLO assessment. The results of the uncertainty assessment are used to
12
provide context to the stakeholders of a PROBFLO assessment and contribute to the decision making process in E-flow
assessment studies.
For all of the BNs created in the PROBFLO assessments of the Senqu and Mara River case studies, the sensitivity of the input
variables were evaluated in Netica using the “Sensitivity to Findings” tool (Marcot, 2012). This approach allows for the relative 5
contribution of each variable to be evaluated. These assessments are used to evaluate model structure and interpret risk result
outcomes with the stakeholders of the assessment (Marcot, 2012; Landis et al., 2016). This test demonstrates to both
PROBFLO operators and stakeholders where models and associated assessments are sensitive to input data. Evidence to justify
these sensitive determinants are imperative to a robust assessment. Additional sources of uncertainty include the comparative
availability of evidence and expert knowledge pertaining to the socio-ecological systems considered in the assessments. The 10
Senqu River case study addressed the second phase of a water resource use development that already has two substantial flow
altering developments with more than 15 years of pre and post-development E-flow assessment (using holistic EFA methods,
(Arthington et al., 2003)) monitoring and evaluations. Additional field surveys to the study area were carried out to generate
additional information and test existing hypotheses for the assessment. The Mara River case study was based largely on
available historical information and existing EFA results for parts of the study area (McClain et al.& Kashaigili, 2013; Dessu 15
et al., 2014).
Step 8: Hypotheses establishment
In the hypotheses establishment step of PROBFLO, suitable hypotheses for field and laboratory experiments are established
to test flow-ecosystem and flow-ecosystem service relationships (Landis, 2004b; O’Brien and Wepener, 2012). In PROBFLO 20
the fundamental adaptive management approach to improving our understanding of socio-ecological risk relationships, while
revisiting outcomes and re-evaluating approaches is formalised in the hypotheses establishment and testing phase. This process
is based on a similar process in the RRM approach, established to reduce uncertainties and to confirm the risk rankings in risk
assessments (Landis, 2004b). In PROBFLO these adaptive management principles acknowledge that socio-ecological systems
are dynamic and that our limited understanding of these processes necessitates the incorporation of many assumptions. In 25
many case studies, uncertainties associated with the outcomes need to be mitigated before they can be used to inform decision
making. To reduce uncertainty, assumptions can be tested rigorously and early. The adaptive management processes should
be (1) informed by iterative learning about the flow-ecosystem and flow-ecosystem service relationships, (2) consider and
respond to earlier management successes and failures and (3) increase present day socio-ecological system resilience that can
improve the ability of E-flows management to respond to the threats of increasing resource use (Lee, 2004). 30
In the Senqu River case study, many hypotheses associated with the flow-ecosystem and flow-ecosystem service relationships,
largely established on data associated with Phase I of the LHWP, were established and tested during the field surveys. These
hypotheses included (1) woody vegetation communities sustainably harvested by local communities for fuel, respond to
reduced average flows by increasing in abundance due to reduced flow variability, reduced stream power and through the 35
colonisation of new lower marginal zones , (2) migratory cyprinid fishes respond to ecological cue flows that include increased
discharges associated with reduced salinity, that initiates fish migration and (3) grazing for livestock of local communities
depends on freshet flows lifting water onto the river banks and floodplains to stimulate vegetation growth. Data was collected
from the study area to address these hypotheses and improve on the understanding of the flow-ecosystem and flow-ecosystem
service relationships considered in the study. In the Mara River case study available flow-ecosystem and flow-ecosystem 40
service information was used in the PROBFLO assessment. A range of hypotheses associated with our understanding of the
relationships were generated to refine and improve on E-flow assessments of the study area.
13
Step 9: Test hypotheses
The two PROBFLO case studies included the design of long-term monitoring programmes to test the accuracy of risk
projections and improve the understanding of the flow-ecosystem and flow-ecosystem service relationships. In the Senqu River
case study a data management system (DMS) with automated data evaluation components was established. In the Mara River
case study a range of hypotheses were established and used to design a monitoring plan and associated research programme to 5
confirm the flow-ecosystem and flow-ecosystem service relationships considered in the study.
Step 10: Communicate outcomes
Regional scale ecological risk assessments of water resources are carried out on behalf of stakeholders of the use and or
protection of those resources. Stakeholders need information generated with robust, best scientific practice methodologies in 10
transparent, clear and concise format, to evaluate the socio-ecological consequences of water resource use options. The
PROBFLO approach highlights the importance of communicating the outcomes of assessments in the context of the uncertainty
identified in an assessment (Hayes and Landis, 2004). A variety of techniques and tools are available to assist in the
communication of the E-flow outcomes and associated socio-ecological consequences of altered flows and careful attention
must be paid to ensure that the relevant stakeholders of any case study are presented with information that can easily be 15
understood (O’Brien and Wepener, 2012). In the Senqu River case study, the LHDA with South African and Lesotho
governmental delegates participated in a project outcomes workshop in 2014. During this workshop the PROBFLO approach
adopted for the study, results and outcomes were discussed. Risk results of sources and stressors to social and ecological
endpoints were compared in a relative manner facilitating water resource use and protection trade-off considerations for the
LHWP Phase II. In the Mara River case study the PROBFLO assessment successfully formed a part of the Nile E-flows 20
framework development (NBI, 2016), and the ongoing Mau Mara Serengeti (MaMaSe) Sustainable Water Initiative
(http://mamase.org). The application of the PROBFLO and associated uncertainty assessment was used to establish a
monitoring plan that should be implemented with water resource use scenario selected from the case studies. These plans were
designed to validate the model by testing the response of the receiving environment to observed ecosystem driver conditions,
associated with implemented scenarios and to improve the understanding of the causal relationships hypothesised in the 25
original assessment with real data.
4. Conclusion
The Regional Scale Ecological Risk Assessment approach was established in 1997 in response to the need to apply ERAs that
consider multiple multiple sources, stressors and receptors in the context of spatial and temporal ecosystem dynamics, on
multiple spatial scales (Landis and Wiegers, 1997; 2007). The approach, which includes the RRM, has been widely 30
implemented, reviewed and proven to be a robust probabilistic modelling tool to contribute to the sustainable management of
ecological resources (Landis and Wiegers 2007). Recent developments in E-flow frameworks (Poff et al., 2010; NBI, 2016),
now also call for holistic, regional scale, probabilistic E-flow assessments that consider flow and non-flow drivers of change
in socio-ecological context. We have established a Regional Scale Ecological Risk Assessment method, incorporating the BN-
RRM approach, to evaluate the socio-ecological consequences of altered flows and establish E-flows called PROBFLO. 35
PROBFLO is a robust method for E-flow assessments that meets current best scientific practice that can make a positive
contribution to the sustainable management of water resources. The approach provides true transparency and adaptability
options for holistic E-flow management. PROBFLO has already been successfully implemented in two major case studies
where its flexibility and functionality has been demonstrated. In both case studies the evidence based outcomes facilitated
14
informed environmental management decision making, in the context of social and ecological aspirations. From these
outcomes stakeholders have in addition, been able to consider sustainable social and ecological trade-offs in an attempt to
balance the use and protection of water resources. The PROBFLO outcomes used to direct the sustainable use of water
resources in the case studies are probabilistic and need to be validated with monitoring data during implementation phases.
PROBFLO is an adaptable tool that allows for the incorporation of new information rapidly which will inform adaptive 5
management and reduce uncertainty associated with the accuracy of the projections. In the case studies stakeholders were
presented with evidence based probabilistic projections of PROBFLO and used the risk projections to consider water resource
use trade-off options. Both of these case studies are being used by stakeholders to make water resource use decisions that are
currently being undertaken. PROBFLO is a holistic, evidence based, probability modelling E-flow assessment tool that is
transparent and adaptable, and suitable for application on multiple spatial scales. PROBFLO has the potential to contribute to 10
the sustainable management of water resources for the benefit of social and ecological components of these systems.
Author contribution
The BN-RRM approach established for use in E-flow assessments was co-developed by G.C. O’Brien, C. Dickens and V.
Wepener. The approach was implemented by this team including Leo Quayle, Kelly Fouchy, James MacKenzie, Mark Graham
and R. Stassen. The paper was written by G.C. O’Brien and C. Dickens and edited by W.G Landis, V. Wepener, E. Hines and 15
R. Stassen.
Competing interests:
The authors declare that they have no conflict of interest.
Acknowledgements
The PROBFLO E-flow assessment approach was established through the Institute of Natural Resources NPC 20
(Pietermaritzburg, South Africa) as part of the LWHP Phase II study funded by LHDA. We acknowledge the contributions
made to the initial Senqu River case study by the extended team of ecological and social scientists and engineers who worked
on the project. Contributions were also made through the NBI Guidance Document on Environmental Flows study, Prepared
by HYDROC GmbH in collaboration with Mau Mara Serengeti Sustainable Water Initiative study on behalf of the Nile Basin
Initiative and Deutsche Gesellschaft für Internationale Zusammenarbeit (GIZ). In particular, the contributions made by 25
Michael McClain and John Conallin are acknowledged. The authors also acknowledge the advice provided by fellow E-flow
assessment scientists that have contributed to the development of PROBFLO including; Jacqueline King, Cate Brown, Rebecca
Tharme and Jay Jay O'Keeffe. Finally, we appreciate the comments on the manuscript provided during the discussion document
phase of the HESS publication process and the highly valuable comments and suggestions provided by the reviewers of the
manuscript. 30
References
Acreman, M., Arthington, A. H., Colloff, M. J., Couch, C., Crossman, N. D., Dyer, F., Overton, I., Pollino, C. A., Stewardson,
M. J. and Young, W.: Environmental flows for natural , hybrid , and novel riverine ecosystems in a changing world In a
nutshell :, , 466–473, doi:10.1890/130134, 2014.
Acreman, M. C. and Dunbar, M. J.: Defining environmental river flow requirements – a review, Hydrol. Earth Syst. Sci., 8(5), 35
15
861–876, doi:10.5194/hess-8-861-2004, 2004.
Anon: Transboundary Integrated Water Resources Management and Development Projects in The Mara (Kenya/Tanzania);
Sio-Malaba- Malakisi (Kenya/Uganda) and Kagera (Uganda, Rwanda, Burundi, Tanzania), 2014.
Anon: Author ’ s personal copy Catena Assessment of water resources availability and demand in the Mara River Basin, n.d.
Anon: Sediment Fingerprinting in the Mara River: Uncovering Relationships Between Wildlife, Tourism, and Non-Point 5
Source Pollution. - Google Scholar, [online] Available from:
https://scholar.google.co.za/scholar?q=Sediment+Fingerprinting+in+the+Mara+River%3A+Uncovering+Relationships+Bet
ween+Wildlife%2C+Tourism%2C+and+Non-Point+Source+Pollution.+&btnG=&hl=en&as_sdt=0%2C5, n.d.
Arthington, A., Rall, J. and Kennard, M.: Environmental flow requirements of fish in Lesotho Rivers using the DRIFT
methodology, River Res. [online] Available from: http://onlinelibrary.wiley.com/doi/10.1002/rra.728/abstract (Accessed 19 10
August 2016), 2003.
Arthington, A.H. “Environmental Flows: Saving Rivers in the Third Millennium”. University of California Press, Berkeley,
CA. 406pp. [Academic book on the science and management of e-flows. 2012.
Atisa, G., Bhat, M. and McClain, M.: Economic assessment of best management practices in the Mara River Basin: toward
implementing payment for watershed services, Water Resour. Manag. [online] Available from: 15
http://link.springer.com/article/10.1007/s11269-014-0585-3 (Accessed 6 September 2016), 2014.
Ayre, K. and Landis, W.: A Bayesian approach to landscape ecological risk assessment applied to the Upper Grande Ronde
Watershed, Oregon, Hum. Ecol. Risk Assess. An [online] Available from:
http://www.tandfonline.com/doi/abs/10.1080/10807039.2012.707925 (Accessed 18 August 2016), 2012.
Ayre, K., Caldwell, C., Stinson, J. and Landis, W.: Analysis of regional scale risk of whirling disease in populations of colorado 20
and rio grande cutthroat trout using a bayesian belief network model, Risk Anal. [online] Available from:
http://onlinelibrary.wiley.com/doi/10.1111/risa.12189/full (Accessed 18 August 2016), 2014.
Biswas, A.: Integrated water resources management: a reassessment: a water forum contribution, Water Int. [online] Available
from: http://www.tandfonline.com/doi/abs/10.1080/02508060408691775 (Accessed 29 August 2016), 2004.
Colnar, A. and Landis, W.: Conceptual model development for invasive species and a regional risk assessment case study: the 25
European green crab, Carcinus maenas, at Cherry Point, Hum. Ecol. Risk Assess. [online] Available from:
http://www.tandfonline.com/doi/abs/10.1080/10807030601105076 (Accessed 18 August 2016), 2007.
Defersha, M. and Melesse, A.: Field-scale investigation of the effect of land use on sediment yield and runoff using runoff plot
data and models in the Mara River basin, Kenya, Catena [online] Available from:
http://www.sciencedirect.com/science/article/pii/S0341816211001470 (Accessed 6 September 2016), 2012. 30
Defersha, M., Melesse, A. and McClain, M.: Watershed scale application of WEPP and EROSION 3D models for assessment
of potential sediment source areas and runoff flux in the Mara River Basin, Kenya, Catena [online] Available from:
http://www.sciencedirect.com/science/article/pii/S0341816212000598 (Accessed 6 September 2016), 2012.
Department of Water Affairs (DWA): Procedures to Develop and Implement Resource Quality Objectives., 2011.
Dessu, S., Melesse, A., Bhat, M. and McClain, M.: Assessment of water resources availability and demand in the Mara River 35
Basin, Catena [online] Available from: http://www.sciencedirect.com/science/article/pii/S0341816213002956 (Accessed 6
September 2016a), 2014.
Dessu, S., Melesse, A., Bhat, M. and McClain, M.: Assessment of water resources availability and demand in the Mara River
Basin, Catena [online] Available from: http://www.sciencedirect.com/science/article/pii/S0341816213002956 (Accessed 22
September 2016b), 2014. 40
Dudgeon, D., Arthington, A. H., Gessner, M. O., Kawabata, Z.-I., Knowler, D. J., Lévêque, C., Naiman, R. J., Prieur-Richard,
A.-H., Soto, D., Stiassny, M. L. J. and Sullivan, C. A.: Freshwater biodiversity: importance, threats, status and conservation
challenges, Biol. Rev. Camb. Philos. Soc., 81(2), 163–82, doi:10.1017/S1464793105006950, 2006.
16
Dutton, C., Anisfeld, S. and Ernstberger, H.: A novel sediment fingerprinting method using filtration: application to the Mara
River, East Africa, J. Soils Sediments [online] Available from: http://link.springer.com/article/10.1007/s11368-013-0725-z
(Accessed 6 September 2016), 2013.
EAC: Memorandum of Understanding (MoU) with the World Wide Fund for Nature Eastern Africa Regional Programme
Office (WWF EARPO) for WWF-EARPO to support the EAC in programmes contributing to the vision of the Lake Victoria 5
Development Programme and the establi., 2003.
Gichana, Z., Njiru, M., Raburu, P. and Masese, F.: Effects Of Human Activities On Microbial Water Quality In Nyangores
Stream, Mara River Basin, ijstr.org [online] Available from: http://www.ijstr.org/final-print/feb2014/Effects-Of-Human-
Activities-On-Microbial-Water-Quality-In-Nyangores-Stream-Mara-River-Basin.pdf (Accessed 6 September 2016), 2014.
GLOWS-FIU: Environmental Flow Recommendations for the Mara River, Kenya and Tanzania. Global Water for 10
Sustainability Program (GLOWS). Miami, FL, 2015.
Government of Kenya: Kenya Water Act No. 8 of 2002, Government of Kenya., 2002.
Growns, I.: The influence of changes to river hydrology on freshwater fish in regulated rivers of the Murray-Darling basin,
Hydrobiologia, 596(1), 203–211, doi:10.1007/s10750-007-9097-y, 2008.
Hayes, E. and Landis, W.: Regional ecological risk assessment of a near shore marine environment: Cherry Point, WA, Hum. 15
Ecol. Risk Assess. [online] Available from: http://www.tandfonline.com/doi/abs/10.1080/10807030490438256 (Accessed 18
August 2016), 2004.
Hines, E. and Landis, W.: Regional risk assessment of the Puyallup River Watershed and the evaluation of low impact
development in meeting management goals, Integr. Environ. Assess. [online] Available from:
http://onlinelibrary.wiley.com/doi/10.1002/ieam.1509/full (Accessed 18 August 2016), 2014. 20
Hunsaker, C., Graham, R. and II, G. S.: Assessing ecological risk on a regional scale, Environmental [online] Available from:
http://link.springer.com/article/10.1007/BF02394200 (Accessed 18 August 2016), 1990.
Isaak, D., Wollrab, S., Horan, D. and Chandler, G.: Climate change effects on stream and river temperatures across the
northwest US from 1980–2009 and implications for salmonid fishes, Clim. Change [online] Available from:
http://link.springer.com/article/10.1007/s10584-011-0326-z (Accessed 17 August 2016), 2012. 25
Kanga, E., Ogutu, J., Olff, H. and Santema, P.: Population trend and distribution of the Vulnerable common hippopotamus
Hippopotamus amphibius in the Mara Region of Kenya, Oryx [online] Available from:
http://journals.cambridge.org/abstract_S0030605310000931 (Accessed 6 September 2016), 2011.
Karanja, G.: Tourist Impacts in Masai Mara National Reserve, [online] Available from:
http://ethos.bl.uk/OrderDetails.do?uin=uk.bl.ethos.399605 (Accessed 6 September 2016), 2002. 30
Kilonzo, F., Masese, F. and Griensven, A. Van: Spatial–temporal variability in water quality and macro-invertebrate
assemblages in the Upper Mara River basin, Kenya, of the Earth, Parts A/B/C [online] Available from:
http://www.sciencedirect.com/science/article/pii/S147470651300154X (Accessed 6 September 2016), 2014.
King, J. and Pienaar, H.: Sustainable use of South Africa’s inland waters., 2011.
King, J., Brown, C., & Sabet, H. A scenario‐based holistic approach to environmental flow assessments for rivers. River 35
research and applications, 19(5‐6), 619-639, 2003.
Korb, K. and Nicholson, A.: Bayesian artificial intelligence. [online] Available from:
https://books.google.co.za/books?hl=en&lr=&id=LxXOBQAAQBAJ&oi=fnd&pg=PP1&dq=korb+nicholson+bayesian+artif
icial+intelligence&ots=Q1XC9ee_F1&sig=IgMnhmqlqeIl5tIny8dzwakpFrc (Accessed 20 September 2016), 2010.
Landis, W.: Regional scale ecological risk assessment: using the relative risk model. [online] Available from: 40
https://books.google.co.za/books?hl=en&lr=&id=-gdO-
NF1bb0C&oi=fnd&pg=PA1&dq=Landis+and+weigers+1997&ots=aUvWeGWe2r&sig=_IgC0f2tB0lJGX2QjJVcORQD8R
c (Accessed 18 August 2016a), 2004.
17
Landis, W.: Regional scale ecological risk assessment: using the relative risk model. [online] Available from:
https://books.google.co.za/books?hl=en&lr=&id=-gdO-
NF1bb0C&oi=fnd&pg=PA1&dq=Landis+2004+regional+scale+risk&ots=aUvXfHWlXl&sig=sKZfuMRUeXzYrZwjKwW
nmAHKvzM (Accessed 31 August 2016b), 2004.
Landis, W.: Comment on ET & C perspectives , November 2015-A holistic view : Comment on ET & C Perspectives, , 5
(August), doi:10.1002/etc.3378, 2016.
Landis, W. and Wiegers, J.: Design considerations and a suggested approach for regional and comparative ecological risk
assessment, Hum. Ecol. Risk Assess. [online] Available from:
http://www.tandfonline.com/doi/pdf/10.1080/10807039709383685 (Accessed 18 August 2016), 1997.
Landis, W. and Wiegers, J.: Ten years of the relative risk model and regional scale ecological risk assessment, Hum. Ecol. 10
Risk Assess. [online] Available from: http://www.tandfonline.com/doi/abs/10.1080/10807030601107536 (Accessed 18
August 2016), 2007.
Landis, W. G., Ayre, K. K., Johns, A. F., Summers, H. M., Stinson, J., Harris, M. J., Herring, C. E. and Markiewicz, A. J.: The
multiple stressor ecological risk assessment for the mercury contaminated South River and upper Shenandoah River using the
Bayesian Network-Relative Risk Model, Integr. Environ. Assess. Manag., 9999(9999), n/a-n/a, doi:10.1002/ieam.1758, 2016. 15
Lee, K. N.: Appraising Adaptive Management, , 3(2), 1–18, 2004.
Lesotho Highlands Water Project (LHWP). Treaty on the Lesotho highlands water project between the government of the
Kingdom of Lesotho and the government of the Republic of South Africa signed at Maseru, 24 October 1986.
Lesotho Highlands Water Project (LHWP). Agreement on Phase II of the Lesotho highlands water project between the
government of the Kingdom of Lesotho and the government of the Republic of South Africa signed at Maseru, 11 August 20
2011
Lesotho Highlands Water Project (LHWP). Specialist Consultants to Undertake Baseline Studies (Flow, Water Quality and
Geomorphology) and Instream Flow Requirement (IFR) Assessment for Phase 2: Instream Flow Requirements for the Senqu
River – Final report No 6001/2/e, Lesotho Highlands Development Authority, Maseru., 2016.
LVBC & WWF-ESARPO: Biodiversity Strategy and Action Plan for Sustainable Management of the Mara River Basin. 25
Nairobi and Kisumu, Kenya., 2010.
Majule, A.: Towards sustainable management of natural resources in the Mara river basin in Northeast Tanzania, J. Ecol. Nat.
Environ. [online] Available from: http://www.academicjournals.org/app/webroot/article/article1379602990_Majule.pdf
(Accessed 6 September 2016), 2010.
Mango, L. M., Melesse, A. M., Mcclain, M. E., Gann, D. and Setegn, S. G.: Land use and climate change impacts on the 30
hydrology of the upper Mara River Basin , Kenya : results of a modeling study to support better resource management, , 2245–
2258, doi:10.5194/hess-15-2245-2011, 2011.
Marcot, B.: Metrics for evaluating performance and uncertainty of Bayesian network models, Ecol. Modell. [online] Available
from: http://www.sciencedirect.com/science/article/pii/S0304380012000245 (Accessed 4 October 2016), 2012.
Marcot, B. G., Steventon, J. D., Sutherland, G. D. and Mccann, R. K.: Guidelines for developing and updating Bayesian belief 35
networks applied to ecological modeling and conservation1, 2006.
Mati, B., Mutie, S., Gadain, H. and Home, P.: Impacts of land‐use/cover changes on the hydrology of the transboundary Mara
River, Kenya/Tanzania, Lakes Reserv. [online] Available from: http://onlinelibrary.wiley.com/doi/10.1111/j.1440-
1770.2008.00367.x/full (Accessed 6 September 2016), 2008.
McCann, R. K., Marcot, B. G. and Ellis, R.: Bayesian belief networks : applications in ecology and natural resource, , 40
(Reckhow 1999), 2006.
McCartney, B.: Evaluation of Water Quality and Aquatic Ecosystem Health in the Mara River Basin East Africa, [online]
Available from: ftp://ftp.globalwaters.net/mara.globalwaters.net/EFA/Database/Theses/McCartney, 2010.pdf (Accessed 6
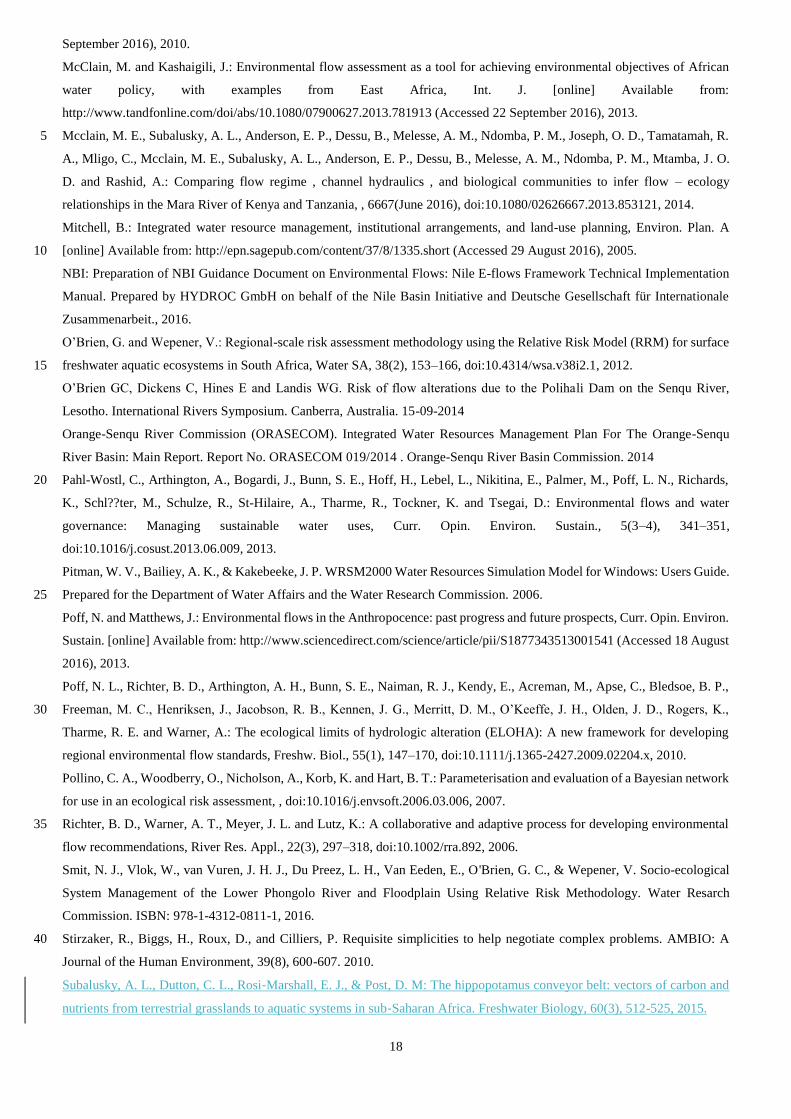
18
September 2016), 2010.
McClain, M. and Kashaigili, J.: Environmental flow assessment as a tool for achieving environmental objectives of African
water policy, with examples from East Africa, Int. J. [online] Available from:
http://www.tandfonline.com/doi/abs/10.1080/07900627.2013.781913 (Accessed 22 September 2016), 2013.
Mcclain, M. E., Subalusky, A. L., Anderson, E. P., Dessu, B., Melesse, A. M., Ndomba, P. M., Joseph, O. D., Tamatamah, R. 5
A., Mligo, C., Mcclain, M. E., Subalusky, A. L., Anderson, E. P., Dessu, B., Melesse, A. M., Ndomba, P. M., Mtamba, J. O.
D. and Rashid, A.: Comparing flow regime , channel hydraulics , and biological communities to infer flow – ecology
relationships in the Mara River of Kenya and Tanzania, , 6667(June 2016), doi:10.1080/02626667.2013.853121, 2014.
Mitchell, B.: Integrated water resource management, institutional arrangements, and land-use planning, Environ. Plan. A
[online] Available from: http://epn.sagepub.com/content/37/8/1335.short (Accessed 29 August 2016), 2005. 10
NBI: Preparation of NBI Guidance Document on Environmental Flows: Nile E-flows Framework Technical Implementation
Manual. Prepared by HYDROC GmbH on behalf of the Nile Basin Initiative and Deutsche Gesellschaft für Internationale
Zusammenarbeit., 2016.
O’Brien, G. and Wepener, V.: Regional-scale risk assessment methodology using the Relative Risk Model (RRM) for surface
freshwater aquatic ecosystems in South Africa, Water SA, 38(2), 153–166, doi:10.4314/wsa.v38i2.1, 2012. 15
O’Brien GC, Dickens C, Hines E and Landis WG. Risk of flow alterations due to the Polihali Dam on the Senqu River,
Lesotho. International Rivers Symposium. Canberra, Australia. 15-09-2014
Orange-Senqu River Commission (ORASECOM). Integrated Water Resources Management Plan For The Orange-Senqu
River Basin: Main Report. Report No. ORASECOM 019/2014 . Orange-Senqu River Basin Commission. 2014
Pahl-Wostl, C., Arthington, A., Bogardi, J., Bunn, S. E., Hoff, H., Lebel, L., Nikitina, E., Palmer, M., Poff, L. N., Richards, 20
K., Schl??ter, M., Schulze, R., St-Hilaire, A., Tharme, R., Tockner, K. and Tsegai, D.: Environmental flows and water
governance: Managing sustainable water uses, Curr. Opin. Environ. Sustain., 5(3–4), 341–351,
doi:10.1016/j.cosust.2013.06.009, 2013.
Pitman, W. V., Bailiey, A. K., & Kakebeeke, J. P. WRSM2000 Water Resources Simulation Model for Windows: Users Guide.
Prepared for the Department of Water Affairs and the Water Research Commission. 2006. 25
Poff, N. and Matthews, J.: Environmental flows in the Anthropocence: past progress and future prospects, Curr. Opin. Environ.
Sustain. [online] Available from: http://www.sciencedirect.com/science/article/pii/S1877343513001541 (Accessed 18 August
2016), 2013.
Poff, N. L., Richter, B. D., Arthington, A. H., Bunn, S. E., Naiman, R. J., Kendy, E., Acreman, M., Apse, C., Bledsoe, B. P.,
Freeman, M. C., Henriksen, J., Jacobson, R. B., Kennen, J. G., Merritt, D. M., O’Keeffe, J. H., Olden, J. D., Rogers, K., 30
Tharme, R. E. and Warner, A.: The ecological limits of hydrologic alteration (ELOHA): A new framework for developing
regional environmental flow standards, Freshw. Biol., 55(1), 147–170, doi:10.1111/j.1365-2427.2009.02204.x, 2010.
Pollino, C. A., Woodberry, O., Nicholson, A., Korb, K. and Hart, B. T.: Parameterisation and evaluation of a Bayesian network
for use in an ecological risk assessment, , doi:10.1016/j.envsoft.2006.03.006, 2007.
Richter, B. D., Warner, A. T., Meyer, J. L. and Lutz, K.: A collaborative and adaptive process for developing environmental 35
flow recommendations, River Res. Appl., 22(3), 297–318, doi:10.1002/rra.892, 2006.
Smit, N. J., Vlok, W., van Vuren, J. H. J., Du Preez, L. H., Van Eeden, E., O'Brien, G. C., & Wepener, V. Socio-ecological
System Management of the Lower Phongolo River and Floodplain Using Relative Risk Methodology. Water Resarch
Commission. ISBN: 978-1-4312-0811-1, 2016.
Stirzaker, R., Biggs, H., Roux, D., and Cilliers, P. Requisite simplicities to help negotiate complex problems. AMBIO: A 40
Journal of the Human Environment, 39(8), 600-607. 2010.
Subalusky, A. L., Dutton, C. L., Rosi‐Marshall, E. J., & Post, D. M: The hippopotamus conveyor belt: vectors of carbon and
nutrients from terrestrial grasslands to aquatic systems in sub‐Saharan Africa. Freshwater Biology, 60(3), 512-525, 2015.
19
Tharme, R.: A global perspective on environmental flow assessment: emerging trends in the development and application of
environmental flow methodologies for rivers, River Res. Appl. [online] Available from:
http://onlinelibrary.wiley.com/doi/10.1002/rra.736/abstract (Accessed 18 August 2016), 2003.
United Republic of Tanzania: Water Resources Management Act, , 73, 2009.
Uusitalo, L.: Advantages and challenges of Bayesian networks in environmental modelling, , 3, 312–318, 5
doi:10.1016/j.ecolmodel.2006.11.033, 2006.
Vörösmarty,C.J., et al: Global Threats to Human Water Security and River Biodiversity, Nature, 467, 555–561, 2010.
Wiegers, J., Feder, H. and Mortensen, L.: A regional multiple-stressor rank-based ecological risk assessment for the fjord of
Port Valdez, Alaska, Ecol. Risk … [online] Available from:
http://www.tandfonline.com/doi/abs/10.1080/10807039891285036 (Accessed 18 August 2016), 1998. 10
WRMA: Catchment Management Strategy: Lake Victoria South Catchment Area, Kenya., Water Resources Management
Authority of Kenya., 2014.
15
20
25
30
35
40
20
5
FIGURES
10
Figure 1: The upper Senqu River study area with Risk Regions established for the study including dams associated with Phase
I of the Lesotho Highlands Water Project and the location of the new Polihali Dam planned to be built in Phase II.
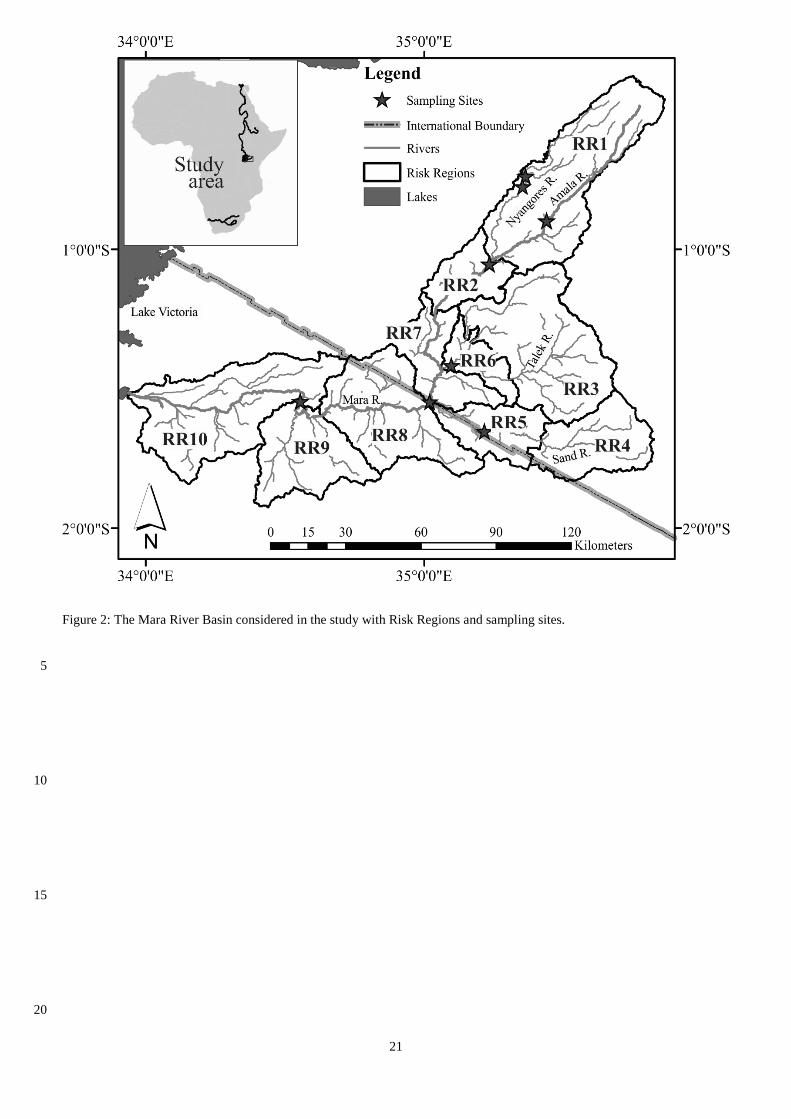
21
Figure 2: The Mara River Basin considered in the study with Risk Regions and sampling sites.
5
10
15
20
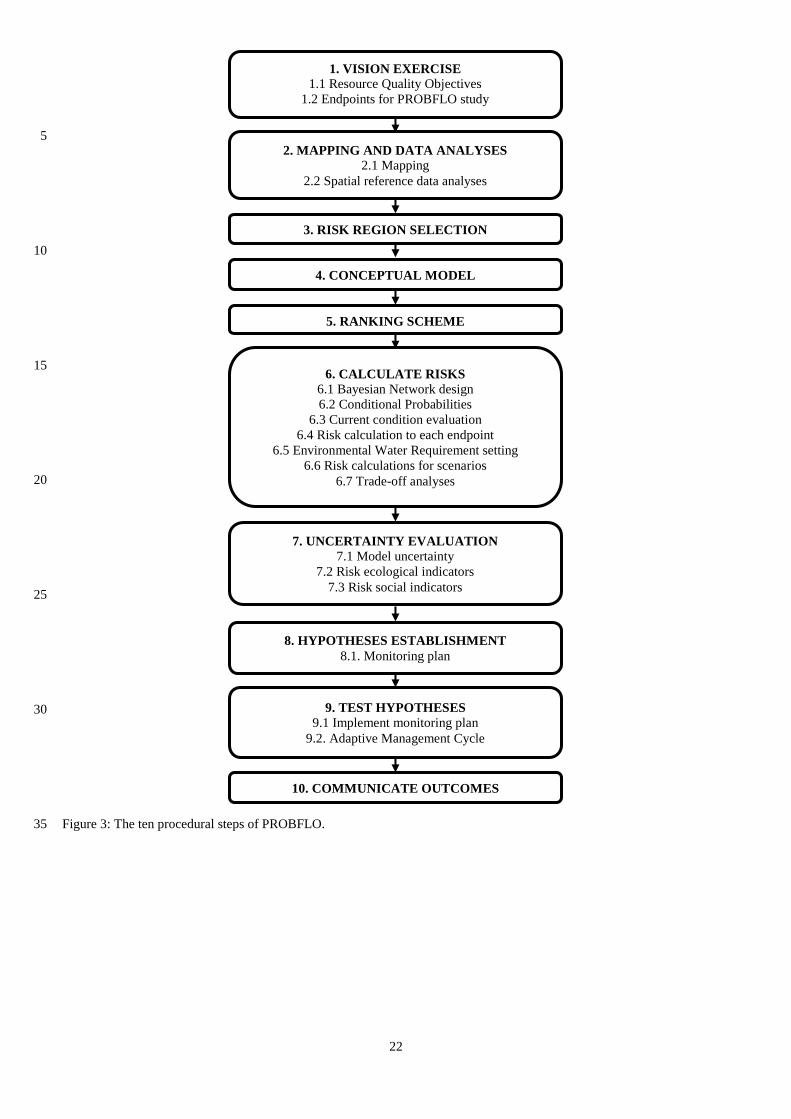
22
1. VISION EXERCISE
1.1 Resource Quality Objectives
1.2 Endpoints for PROBFLO study
3. RISK REGION SELECTION
4. CONCEPTUAL MODEL
5. RANKING SCHEME
2. MAPPING AND DATA ANALYSES
2.1 Mapping
2.2 Spatial reference data analyses
6. CALCULATE RISKS
6.1 Bayesian Network design
6.2 Conditional Probabilities
6.3 Current condition evaluation
6.4 Risk calculation to each endpoint
6.5 Environmental Water Requirement setting
6.6 Risk calculations for scenarios
6.7 Trade-off analyses
7. UNCERTAINTY EVALUATION
7.1 Model uncertainty
7.2 Risk ecological indicators
7.3 Risk social indicators
8. HYPOTHESES ESTABLISHMENT
8.1. Monitoring plan
9. TEST HYPOTHESES
9.1 Implement monitoring plan
9.2. Adaptive Management Cycle
10. COMMUNICATE OUTCOMES
5
10
15
20
25
30
Figure 3: The ten procedural steps of PROBFLO. 35
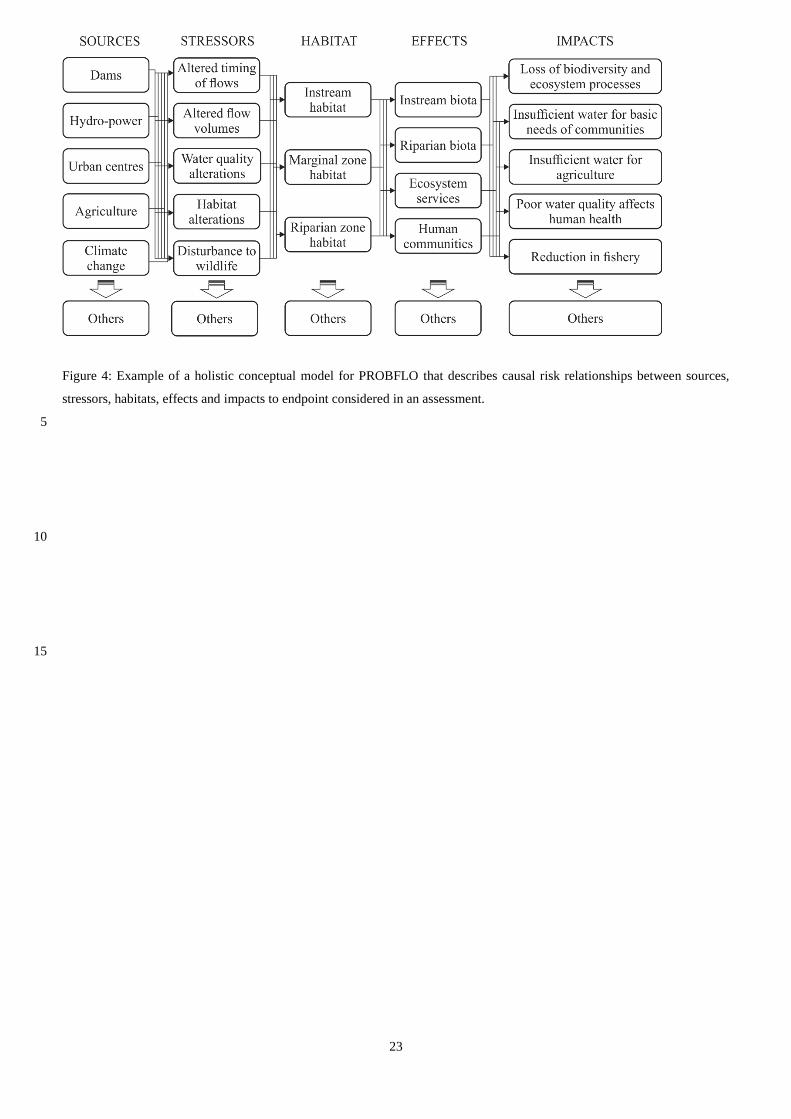
23
Figure 4: Example of a holistic conceptual model for PROBFLO that describes causal risk relationships between sources,
stressors, habitats, effects and impacts to endpoint considered in an assessment.
5
10
15
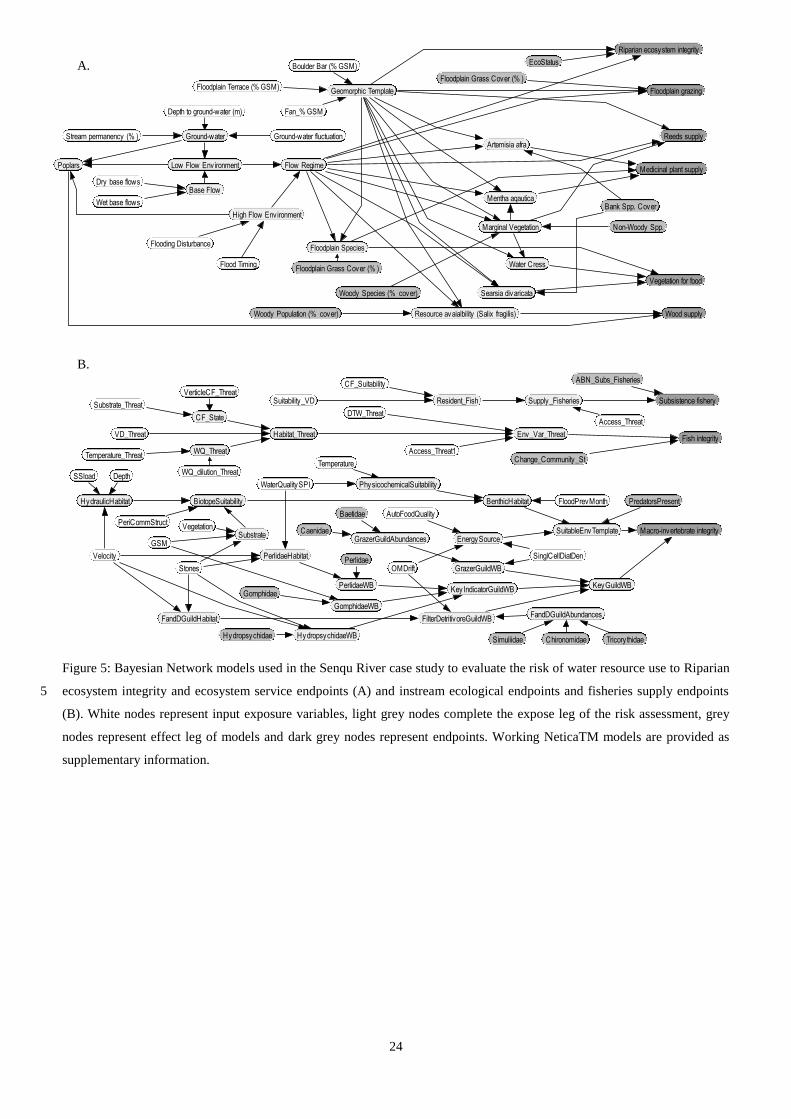
24
Figure 5: Bayesian Network models used in the Senqu River case study to evaluate the risk of water resource use to Riparian
ecosystem integrity and ecosystem service endpoints (A) and instream ecological endpoints and fisheries supply endpoints 5
(B). White nodes represent input exposure variables, light grey nodes complete the expose leg of the risk assessment, grey
nodes represent effect leg of models and dark grey nodes represent endpoints. Working NeticaTM models are provided as
supplementary information.
Searsia divaricata
Resource avaialbility (Salix fragilis)Woody Population (% cover)
Water Cress
Woody Species (% cover)
Non-Woody Spp.
Floodplain Grass Cover (% )
Bank Spp. Cover
Geomorphic Template
Flow Regime
High Flow Environment
Wet base flows
Dry base flows
Low Flow EnvironmentPoplars
Flooding Disturbance
Base Flow
Ground-waterStream permanency (% ) Ground-water fluctuation
Depth to ground-water (m)
Floodplain Terrace (% GSM)
Boulder Bar (% GSM)
Floodplain Grass Cover (% )
EcoStatus
Mentha aqautica
Floodplain Species
Flood Timing
Marginal Vegetation
Artemisia afra
Fan_% GSM
Floodplain grazing
Reeds supply
Riparian ecosystem integrity
Medicinal plant supply
Vegetation for food
Wood supply
WQ_dilution_Threat
EnergySource
PhysicochemicalSuitabilityWaterQualitySPI
BenthicHabitat FloodPrevMonthBiotopeSuitability PredatorsPresent
SuitableEnvTemplate
AutoFoodQuality
GrazerGuildAbundances
SinglCellDiatDen
GrazerGuildWB
KeyGuildWB
Caenidae
Baetidae
Substrate
PerlidaeHabitat
Gomphidae
Perlidae
GSM
Vegetation
PerlidaeWB
OMDrift
GomphidaeWB
FilterDetritivoreGuildWB
KeyIndicatorGuildWB
Stones
FandDGuildHabitatFandDGuildAbundances
TricorythidaeChironomidaeSimuliidaeHydropsychidaeWBHydropsychidae
Env_Var_Threat
Supply_FisheriesResident_FishSuitability_VD
CF_Suitability
DTW_Threat
Habitat_ThreatVD_Threat
WQ_Threat
CF_State
Substrate_Threat
VerticleCF_Threat
Access_Threat1
TemperatureChange_Community_St
Temperature_Threat
Velocity
HydraulicHabitat
PeriCommStruct
SSload Depth
Access_Threat
ABN_Subs_Fisheries
Macro-invertebrate integrity
Fish integrity
Subsistence fishery
A.
B.
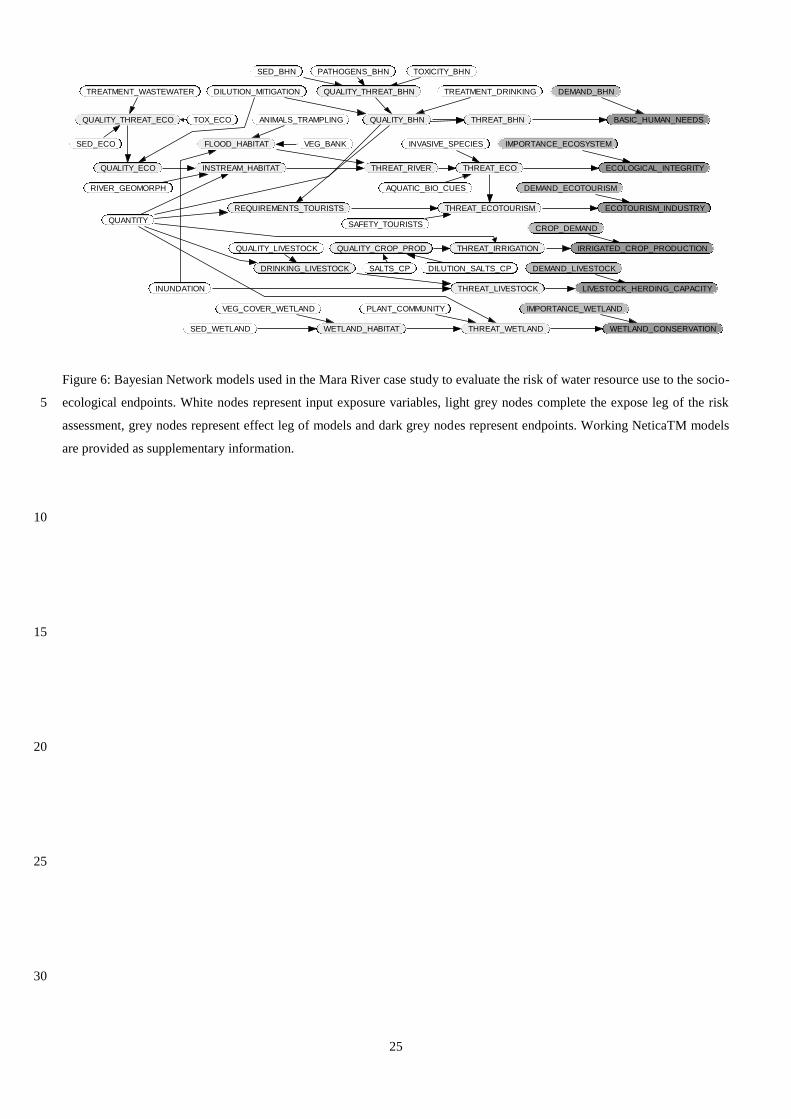
25
Figure 6: Bayesian Network models used in the Mara River case study to evaluate the risk of water resource use to the socio-
ecological endpoints. White nodes represent input exposure variables, light grey nodes complete the expose leg of the risk 5
assessment, grey nodes represent effect leg of models and dark grey nodes represent endpoints. Working NeticaTM models
are provided as supplementary information.
10
15
20
25
30
ECOLOGICAL_INTEGRITY
DEMAND_ECOTOURISM
THREAT_ECO
ECOTOURISM_INDUSTRYTHREAT_ECOTOURISM
INSTREAM_HABITAT
IRRIGATED_CROP_PRODUCTION
CROP_DEMANDQUANTITY
AQUATIC_BIO_CUES
ANIMALS_TRAMPLING
RIVER_GEOMORPH
REQUIREMENTS_TOURISTS
THREAT_RIVER
DEMAND_LIVESTOCKDRINKING_LIVESTOCK
THREAT_IRRIGATIONQUALITY_CROP_PROD
SAFETY_TOURISTS
DILUTION_SALTS_CPSALTS_CP
QUALITY_LIVESTOCK
THREAT_LIVESTOCK LIVESTOCK_HERDING_CAPACITYINUNDATION
WETLAND_CONSERVATIONTHREAT_WETLANDWETLAND_HABITATSED_WETLAND
PLANT_COMMUNITYVEG_COVER_WETLAND IMPORTANCE_WETLAND
FLOOD_HABITAT IMPORTANCE_ECOSYSTEMINVASIVE_SPECIES
BASIC_HUMAN_NEEDSQUALITY_BHN THREAT_BHN
DEMAND_BHNTREATMENT_DRINKINGQUALITY_THREAT_BHN
VEG_BANK
TOXICITY_BHN
QUALITY_ECO
PATHOGENS_BHNSED_BHN
DILUTION_MITIGATIONTREATMENT_WASTEWATER
QUALITY_THREAT_ECO TOX_ECO
SED_ECO
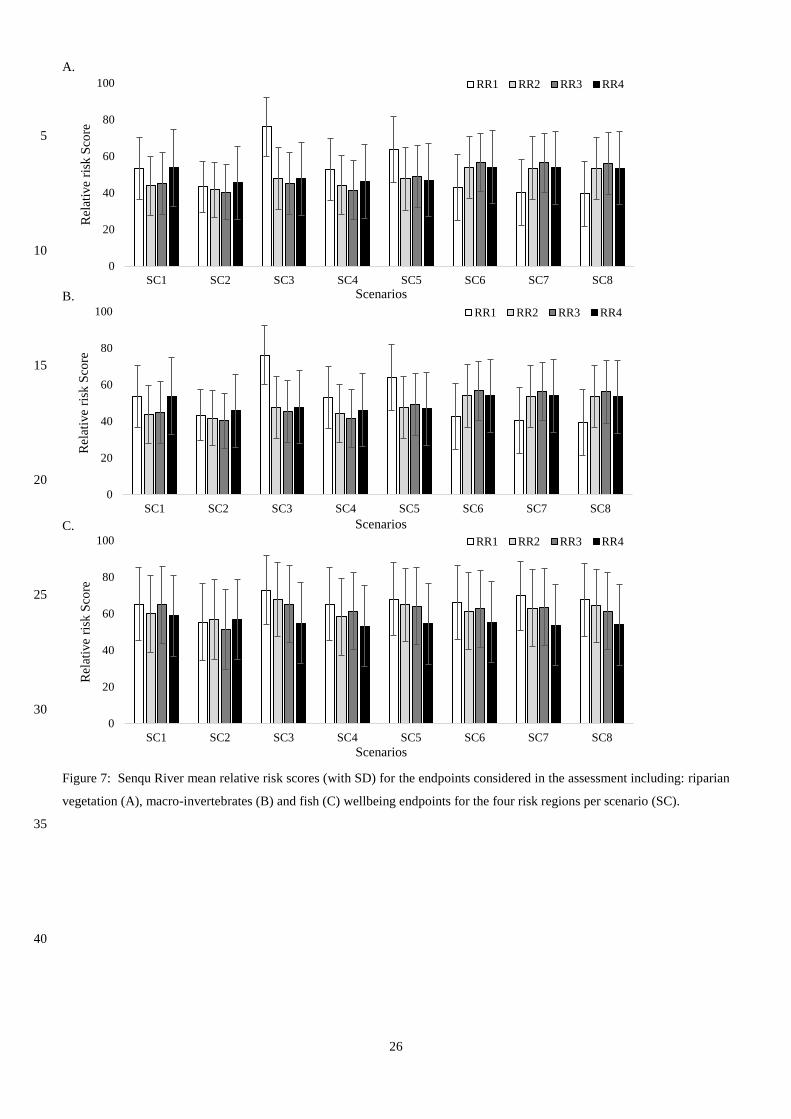
26
0
20
40
60
80
100
SC1 SC2 SC3 SC4 SC5 SC6 SC7 SC8
Rel
ativ
e ri
sk S
core
RR1 RR2 RR3 RR4
A.
5
10
B.
15
20
C.
25
30
Figure 7: Senqu River mean relative risk scores (with SD) for the endpoints considered in the assessment including: riparian
vegetation (A), macro-invertebrates (B) and fish (C) wellbeing endpoints for the four risk regions per scenario (SC).
35
40
Scenarios
Scenarios
Scenarios
0
20
40
60
80
100
SC1 SC2 SC3 SC4 SC5 SC6 SC7 SC8
Rel
ativ
e ri
sk S
core
RR1 RR2 RR3 RR4
0
20
40
60
80
100
SC1 SC2 SC3 SC4 SC5 SC6 SC7 SC8
Rel
ativ
e ri
sk S
core
RR1 RR2 RR3 RR4
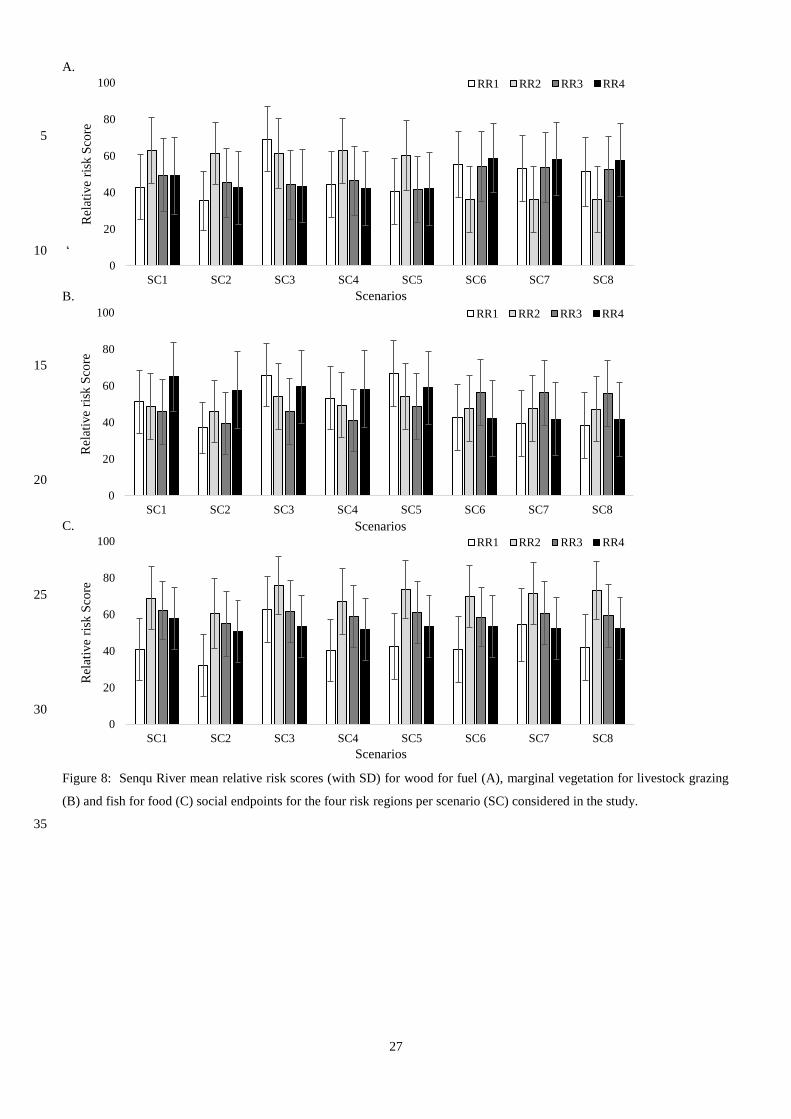
27
0
20
40
60
80
100
SC1 SC2 SC3 SC4 SC5 SC6 SC7 SC8
Rel
ativ
e ri
sk S
core
RR1 RR2 RR3 RR4
0
20
40
60
80
100
SC1 SC2 SC3 SC4 SC5 SC6 SC7 SC8
Rel
ativ
e ri
sk S
core
RR1 RR2 RR3 RR4
0
20
40
60
80
100
SC1 SC2 SC3 SC4 SC5 SC6 SC7 SC8
Rel
ativ
e ri
sk S
core
RR1 RR2 RR3 RR4
A.
5
‘ 10
B.
15
20
C.
25
30
Figure 8: Senqu River mean relative risk scores (with SD) for wood for fuel (A), marginal vegetation for livestock grazing
(B) and fish for food (C) social endpoints for the four risk regions per scenario (SC) considered in the study.
35
Scenarios
Scenarios
Scenarios
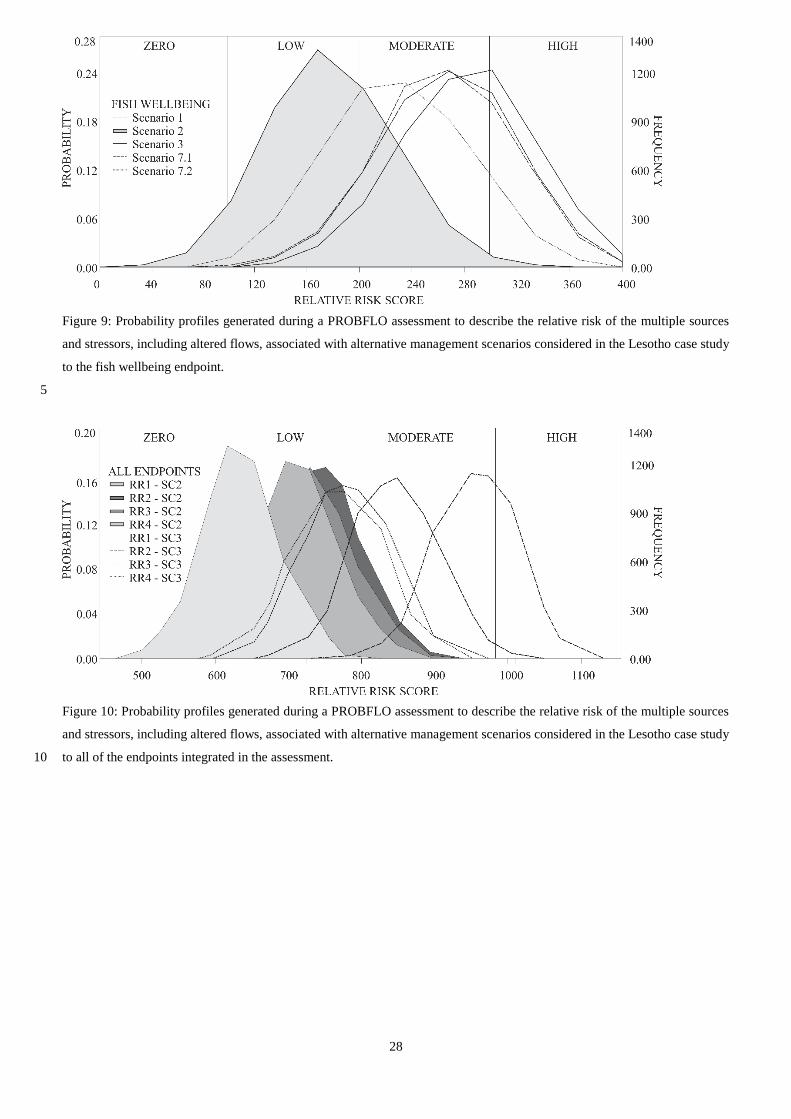
28
Figure 9: Probability profiles generated during a PROBFLO assessment to describe the relative risk of the multiple sources
and stressors, including altered flows, associated with alternative management scenarios considered in the Lesotho case study
to the fish wellbeing endpoint.
5
Figure 10: Probability profiles generated during a PROBFLO assessment to describe the relative risk of the multiple sources
and stressors, including altered flows, associated with alternative management scenarios considered in the Lesotho case study
to all of the endpoints integrated in the assessment. 10
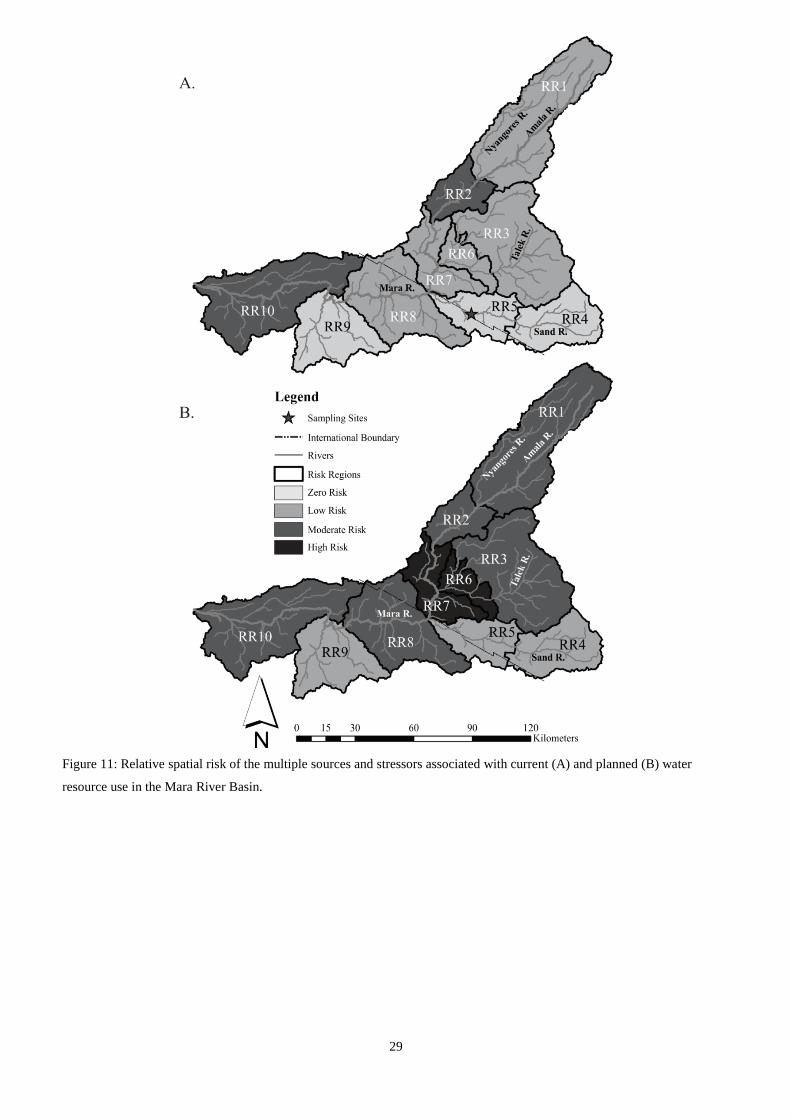
29
Figure 11: Relative spatial risk of the multiple sources and stressors associated with current (A) and planned (B) water
resource use in the Mara River Basin.


