Embed Size (px)
Citation preview


2021 Annual Report Eurotech _________________________________________________________________________________________________________________________________________________________________________________________________________________________
2
This document has been translated into English for the convenience of readers outside Italy. The original Italian document should be considered the authoritative version.
Date of issue: 15 March 2022 This report is available online in the “Investors” section of www.eurotech.com EUROTECH S.p.A. Registered offices: Via Fratelli Solari 3/A, Amaro (Udine), Italy Share capital: €8,878,946 fully paid in Tax code and Udine Company Register no. 01791330309

2021 Annual Report Eurotech _________________________________________________________________________________________________________________________________________________________________________________________________________________________
3
CONTENTS
Letter to shareholders ............................................................................................................... 5 Corporate information ............................................................................................................... 8 Information for shareholders ................................................................................................... 9 Management report .................................................................................................................. 10
Introduction .................................................................... Errore. Il segnalibro non è definito. The Eurotech Group ......................................................................................................................... 10 COVID-19 update ................................................................................................................................. 11 European Single Electronic Format (ESEF) requirements .................................................. 11 Operating performance ................................................................................................................... 12 Statement of financial position .................................................................................................... 23 Non-current assets ........................................................................................................................... 23 Current assets .................................................................................................................................... 24 Net working capital.......................................................................................................................... 24 Net financial position ....................................................................................................................... 25 Treasury shares of the Parent Company owned by the Parent Company or subsidiaries ......................................................................................................................................... 28 Investments and research and development ........................................................................ 28 Main risks and uncertainties to which the Group is exposed .......................................... 29 Disclosure on the environment and personnel ......................................................................33 Disclosure on sovereign exposure ..............................................................................................33 Process of simplifying the standards based on CONSOB resolution no. 18079/2012 ...................................................................................................................................33 Events after the reporting date .................................................................................................. 34 Report on corporate governance and ownership structure ............................................ 34 Off-statement of financial position agreements .................................................................. 34 Subsidiaries created and regulated according to the law of countries outside the European Union ......................................................................................................................... 34 Competitive scenario, outlook and future growth strategy .............................................35
Consolidated financial statements at 31 December 2021 prepared according to international accounting standards ................................................................................. 0
Consolidated statement of financial position ........................................................................... 0 Consolidated income statement .................................................................................................... 1 Consolidated statement of comprehensive income .............................................................. 2 Consolidated statement of changes in shareholders' equity ............................................. 3 Consolidated cash flow statement ............................................................................................... 4
Explanatory notes to financial statements .......................................................................... 5 A – Corporate information ............................................................................................................... 5 B – Reporting policies and IFRS compliance ............................................................................ 5 C – Discretionary evaluations and relevant accounting estimates .................................. 7 D – Scope of consolidation .............................................................................................................. 8 E – Accounting standards and policies ....................................................................................... 9 F – Segment information ............................................................................................................... 24 G - Composition of the principal asset entries ...................................................................... 26
1 – Intangible assets ................................................................................................................ 26 2 – Property, plant and equipment .................................................................................. 30 3 – Equity investments in affiliates and other companies ........................................ 31 4 – Other non-current assets ..............................................................................................33 5 – Inventories ...........................................................................................................................33 6 – Trade receivables ..............................................................................................................35 7 – Tax receivables and payables ..................................................................................... 36 8 – Other current assets ....................................................................................................... 36 9 – Cash and cash equivalents ............................................................................................ 37

2021 Annual Report Eurotech _________________________________________________________________________________________________________________________________________________________________________________________________________________________
4
10 – Other financial assets and liabilities ......................................................................... 37 11 – Net financial position ...................................................................................................... 37 12 – Shareholders’ equity ..................................................................................................... 39 13 – Basic and diluted earnings (losses) per share .................................................... 40 14 – Borrowings ........................................................................................................................ 41 15 – Employee benefits ......................................................................................................... 42 16 – Share-based payments ................................................................................................ 45 17 – Provisions for risks and charges ............................................................................... 47 18 – Trade payables ................................................................................................................ 50 19 – Other current liabilities ................................................................................................. 50 20 – Warranties ......................................................................................................................... 51
H – Breakdown of key income statement items .................................................................... 51 21 – Costs of raw and auxiliary materials and consumables ................................... 52 22 – Other operating costs ................................................................................................... 52 23 – Service costs .................................................................................................................... 52 24 – Payroll costs .....................................................................................................................53 25 – Other provisions and costs .........................................................................................53 26 – Other revenues............................................................................................................... 54 27 – Cost adjustments for internally generated non-current assets .................. 54 28 – Depreciation, amortisation and write-downs .................................................... 54 29 – Financial income and charges ...................................................................................55 30 – Valuation and management of equity investments .........................................55 31 – Income taxes for the year ........................................................................................... 56
I – Other information ....................................................................................................................... 58 32 – Related-party transactions ........................................................................................ 58 33 – Financial risk management: objectives and criteria ........................................ 60 34 – Financial Instruments .................................................................................................. 62 35 – Non-recurring costs and revenues ......................................................................... 64 36 – Potential liabilities ......................................................................................................... 65 37 – Information requested on the basis of Italian law no. 124/2017.................. 65 38 – Events after the reporting period ........................................................................... 65
Annex I – Information provided pursuant to Art. 149-duodecies of the CONSOB Issuers’ Regulation ................................................................................................ 67 Certification of the Consolidated Financial Statements pursuant to Art. 154-bis of Italian Legislative Decree of 24 February 1998, no. 58 ..................... 68 Independent Auditor’s report on the Consolidated Financial Statements ............. 69

2021 Annual Report Eurotech _________________________________________________________________________________________________________________________________________________________________________________________________________________________
5
Letter to shareholders
Dear Shareholders,
since I joined Eurotech as CEO in April 2021, I have been enormously impressed by the technical
excellence acquired in the first three decades of the company's life. It is this excellence that attracted me to this role and that will fuel the next chapter of our growth.
In my first months, I focused on building a repositioning strategy for the company, in order to make the most of the potential of those technical building blocks that were already present, in order to become a "relevant player in the IoT Edge". Our aim is to enable our customers to connect mission critical devices to the cloud easily and securely, and to make AI work directly in the field. Our ambition is to evolve the business mix towards having more than 70% of revenues from IoT in the next 4 years. We specialise in helping our customers solve problems in the most difficult and extreme environments, i.e. those with high reliability needs. Extreme temperatures, extreme vibrations, shocks, humidity, dust and high safety are types of applications in which our decades of experience enable us to stand out. I have learnt during my career that to be successful when you are limited by size "less is more" and that the most difficult step in creating a strategy is first of all "deciding what not to do". We therefore chose to focus primarily on the things we excel at: miniaturised and rugged applications characterised by high reliability, security and computing efficiency. There is a longer time to market in the context of mission critical applications, but the barriers to entry are higher, and therefore revenues are more protected over time. As a result, we have chosen to initially operate in five high-growth markets where Eurotech technology offers a significant competitive advantage. In these markets, new secular forces are driving the digitisation of assets and applications. They are: industrial automation, transport and off-road, medical, supply networks (gas, electricity and water) and communications. Here the IoT is finally starting to deliver the long-promised benefits of increased productivity, more efficient use of resources and new opportunities for customer services. Our products are differentiated and constantly recognised in the IoT landscape by industry analysts. Eurotech is one of the few companies able to provide fully-integrated edge hardware and edge software with top-notch cybersecurity. Last year, we were proud to be included for the third consecutive year in Gartner's Magic Quadrant for Industrial IoT platforms. It is simplicity, coupled with open architectures, that allows our customers to adopt our technology quickly and with minimal engineering effort. This sets us apart from many competitors. Our edge solutions have been recognised worldwide for their security certifications: 2021 saw Eurotech become one of the few companies in the world to obtain both product and process cybersecurity certifications IEC 62443-4-2 and IEC 62443-4-1 for our integrated edge hardware and software. Basically, we have started a process of greater standardisation of our offer, which will gradually result in more economies of scale. Additionally, the software is creating recurring revenue and growing by 50% year-on-year. From an organisational point of view, we have eliminated geographic barriers throughout the company, while creating synergies among teams, nurturing existing skills and introducing new skills and people to

2021 Annual Report Eurotech _________________________________________________________________________________________________________________________________________________________________________________________________________________________
6
the company. I am extremely proud of the passion and courage of the Eurotech team to embrace these changes, and to unite with a renewed purpose and drive. By changing our go-to-market strategy and building a more agile, flexible and resilient organisation, we are creating a strong pipeline of IoT business opportunities that will grow steadily, starting in late 2023 and throughout the 2024. Until then, our core business, along with the IoT design-win we have collected over the past years, will support us effectively. To recap 2021, we had a year with a robust order book, which unfortunately did not fully translate into revenue growth. This was due to the shortage of electronic components: if it had not been for this reason, we would have enjoyed a growth of 5-7% at constant exchange rates. As regards EBITDA, we recorded negative results due to the non-activation of the operating leverage, the one-off costs for organisational changes and the additional charge paid to compensate for the scarce availability of components. Looking forward to 2022, we expect a year of transition and return to growth. With the reorganisation progressing well, we now need to implement our new strategy. Our embedded business continues to support us, and we're also seeing the IoT projects we won two years ago starting to grow consistently. With a more robust go-to-market structure, we are now focused on creating and developing a strong pipeline of new business opportunities in markets where double-digit growth is expected over the next five years. With a very good backlog already after the first two months of 2022, our goal is to return to a profit by the end of the year. We also maintain a strong focus on our M&A target pipeline, which is aimed at bringing new sales channels and customers to the 5 vertical markets we have chosen, and complementary offerings to our portfolio in HW product families for edge computing we are focused on. Looking to the future, Eurotech is ready to be a relevant player in the Edge IoT sector. Combining IoT connectivity with artificial intelligence algorithm processing in the field is the most compelling opportunity to help our customers achieve their technical and commercial objectives. Cybersecurity remains a major concern for customers as operational technologies become increasingly connected to the outside world. At the same time, there is a growing awareness that moving all data to cloud-hosted applications is costly and inefficient. Processing as much data as possible at or near the source - edge computing - can offer significant benefits, including lower latency and lower operating costs. With our edge platform made of integrated hardware and software, we are uniquely positioned to help customers deploy AI applications close to their assets quickly, easily and securely. Our open source software platform allows high interoperability for the customer. It is also proving to be invaluable to many AI software providers and partners who can go to market, with us, as a “one stop shop” from a technical and commercial point of view for the end customer. I strongly believe that this is a natural evolution of existing IoT Edge markets, and despite the geopolitical turmoil we are witnessing, AI Edge markets will experience accelerated growth over the next three years. Of course, we cannot forget that we live in an increasingly volatile world. The COVID-19 pandemic, the shortage of electronic components and now the war in Ukraine are testing the resilience of many companies. Our fabless business model keeps us flexible and adaptable as we continue to monitor the new scenarios and events around us. We are not exposed to the Russian and Ukrainian markets and I am strongly believe that we will overcome the difficult months we are all witnessing. We hope that our 30th anniversary celebration this year coincides with a world returning to a certain normalcy, peace and harmony. Our hearts go out to all those people in Ukraine, and their loved ones, who have seen their lives ravaged by war.

2021 Annual Report Eurotech _________________________________________________________________________________________________________________________________________________________________________________________________________________________
7
I am optimistic on the path we have taken, thanks also to the team's renewed passion for bringing our strategy to the market. With your support as investors, we are together on an exciting journey to become a relevant player in the Edge IoT. 15 March 2022 signed Paul Chawla Executive Director

2021 Annual Report Eurotech _________________________________________________________________________________________________________________________________________________________________________________________________________________________
8
Corporate governance
Board of Directors Chairperson Patrizio Mapelli Deputy Chairperson Aldo Fumagalli 1 Director Paul Chawla
Director Marco Costaguta 1 Director Susanna Curti 1 5 Director Maria Grazia Filippini 1 2 3 4 5 Director Antongiulio Marti 1 3 Director Chiara Mio 1 2 3 4 Director Laura Rovizzi 1 2 4 5
The Board of Directors currently in office was appointed by shareholders at the Annual General Meeting of 28 April 2020 and was supplemented at the Annual General Meeting of 11 June 2021; it will remain in office until approval of the 2022 financial statements. Board of Statutory Auditors Chairperson Fabio Monti Statutory Auditor Pietro Biagio Monterisi Statutory Auditor Daniela Savi Substitute Auditor Luigina Zocco
The Board of Statutory Auditors currently in office, with the exception of Mr. Monterisi, who took over on 23 June 2021 from the auditor Mr. Rebecchini, who resigned, was appointed by shareholders at the Annual General Meeting of 28 April 2020, and will remain in office until approval of the 2022 financial statements. Independent Auditor PricewaterhouseCoopers S.p.A.
The independent auditor was appointed for the period 2014-2022 by shareholders at the Annual General Meeting of 24 April 2014. Corporate name and registered offices of the Parent Company Eurotech S.p.A.
Via Fratelli Solari 3/A 33020 Amaro (UD), Italy Udine Company Register number 01791330309
1 Non-executive Directors. 2 Independent Directors pursuant to the Corporate Governance Code issued by the Italian Corporate Governance
Committee for Listed Companies. 3 Member of the Control and Risks Committee 4 Member of the Committee for Transactions with Related Parties 5 Member of the Remuneration and Appointments Committee

Information for the shareholders Eurotech Group _________________________________________________________________________________________________________________________________________________________________________________________________________________________
9
Eurotech on the Italian Stock Exchange
The ordinary shares of Eurotech S.p.A., the Parent Company of the Eurotech Group, have been listed in the Euronext Star Milan segment of the Eurostar Milan market run by Borsa Italiana since 30 November 2005. Share capital of Eurotech S.p.A. at 31 December 2021 Share capital €8,878,946.00 Number of ordinary shares (without nominal unit value) 35,515,784 Number of savings shares - Number of Eurotech S.p.A. treasury shares 89,920 Stock market capitalisation (based on the share’s average price in Dec. 2021) €180 million Stock market capitalisation (based on the share’s relevant price at 31 Dec. 2021) €180 million Performance of Eurotech S.p.A. shares Relative performance EUROTECH S.p.A. 01.01.2021 – 31.12.2021
The line graph shows the share’s performance based on daily reference prices
The candle chart shows the share’s daily maximum and minimum prices

Management report at 31 December 2021 Eurotech _________________________________________________________________________________________________________________________________________________________________________________________________________________________
10
Management report
Preamble
The Eurotech Group’s business and financial results for FY2021 and comparative periods have been drawn up according to the International Accounting and Financial Reporting Standards (IASs/IFRSs) issued by the International Accounting Standards Board and endorsed by the European Union. Unless otherwise stated, data are expressed in thousands of euro.
Group structure
The Eurotech Group operates in the sector of research, development, production and marketing of miniaturised, high-performance and high-energy efficiency computers for special uses. The Group's product offering is modular with different levels of hardware and software integration, consisting of modules (embedded PCs) and miniaturised - to different extents - electronic systems (Edge gateways, Edge servers and Edge AI) that can have high processing capabilities and very high energy efficiency, as well as software platforms for the Internet of Things, currently intended for the industrial automation, transport & off-road, medical, energy-gas-water networks and telecommunications sectors. At 31 December 2021, the Eurotech Group consisted of the following companies:
Company name Business activity Share capital Group share
Parent company Eurotech S.p.A. Operates with a focus on the Edge Computer and
“IoT" technology market, predominantly in the Italian and EMEA markets. In terms of organisation, it performs the role of industrial holding coordinating all subsidiaries of the Eurotech Group.
Euro 8,878,946
Subsidiaries and companies consolidated on a line-by-line basis
Aurora S.r.l. Service company supporting the Parent Company
Euro 10,000 100.00%
E-Tech USA Inc. Holding company that controls 100% of Eurotech Inc.
USD 8,000,000 100.00%
EthLab S.r.l. Company that provides services and performs research and development on behalf of the Group
Euro 115,000 100.00%
Eurotech France S.A.S.
Operates in the French market, focusing on the IoT market in particular
Euro 795,522 100.00%
Eurotech Inc. Operates in the US market with a focus on the industrial, medical and transport sectors
USD 26,500,000 100.00%
Eurotech Ltd. Operates mainly in the United Kingdom and in Northern Europe
GBP 33,333 100.00%
I.P.S. Sistemi Programmabili S.r.l.
Operates in the Italian market under the IPS brand Euro 51,480 100.00%
Advanet Inc. Operates in the Japanese market with a focus on the industrial, medical and transport sectors
JPY 72,440,000 90.00% (1)
(1) For the purposes of consolidation 100% is taken into account, since the company holds the remaining 10% in the form of treasury shares.

Management report at 31 December 2021 Eurotech _________________________________________________________________________________________________________________________________________________________________________________________________________________________
11
COVID-19 update
During 2021, the international community placed great emphasis on limiting the spread of the COVID-19 pandemic. The adoption of vaccines slowed down the spread of the virus and despite the fact that there have been several more or less long "waves" of contagion during the year, the general situation has progressively improved, also in terms of freedom to travel abroad for business purposes. In all Group companies we continued to adopt the greatest hygiene precautions, protocols and measures necessary to preserve the health of employees and to manage biological risk in the workplace. This risk has been significantly reduced with the increase in the number of vaccinated personnel. The various Group companies have always supported and facilitated the vaccination of their staff, respecting the choices of those who were against it but strictly following, where required, national protocols for entry controls in workplaces. With reference to the costs that the Group had to incur to tackle the pandemic, these were mostly incurred in 2020 (quantified in an amount not exceeding €150 thousand, for example as regards sanitation costs, space adjustments in order to guarantee the safety of workers, and preventive health costs or supplies of PPE to employees according to local regulations) while in 2021 only minor measures were implemented as the costs did not exceed €100 thousand. The use of remote work continued throughout 2021, for the roles and activities for which it is materially possible, thus ensuring business continuity in all geographical areas. The use of videoconferencing systems, now regularly adopted in interactions both with customers or potential customers, and among colleagues between the various subsidiaries, made it possible to effectively mitigate movements and gatherings.
European Single Electronic Format (ESEF) requirements
Pursuant to Art. 4 of the Transparency Directive, starting from financial year 2021, the annual financial report is drawn up in XHTML format, in compliance with the European Single Electronic Format (ESEF). In addition, issuers preparing consolidated financial statements pursuant to IFRSs must mark them using the Inline XBRL. The Eurotech Group manages the ESEF using dedicated outsourced computer software that enables compliance with the new regulations.

Management report at 31 December 2021 Eurotech _________________________________________________________________________________________________________________________________________________________________________________________________________________________
12
Operating performance
(*) Gross profit margin is the difference between revenues from sales of goods and services and use of raw materials. (**) EBITDA, an intermediate figure, is earnings before amortisation, depreciation and write-downs of fixed assets, financial
income and expenses, the valuations of affiliates at equity and of income taxes for the period. This is a measure used by the Group to monitor and assess operating performance. Since the composition of EBITDA is not regulated by the reference accounting standards, the calculation criterion applied by the Group may not be consistent with that used by other companies and would therefore not be comparable.
(***) Result (EBIT) before valuation of equity investments in affiliates using the equity method, financial income and charges and income taxes for the year.
(****)ADJ. EBITDA is an intermediate figure, determined gross of non-recurring costs and revenues, before amortisation, depreciation and write-downs of fixed assets, financial income and expenses, valuations of affiliates at equity and income taxes for the period. This is a measure used by the Group to monitor and assess its operating performance, net of any non-recurring costs or revenues that therefore do not occur frequently in the ordinary course of business. Since the composition of EBITDA is not regulated by the reference accounting standards, the calculation criterion applied by the Group may not be consistent with that used by other companies and would therefore not be comparable.
Scenario At a global level, the year that has ended was characterised by various negative factors but also by some positive ones: the prolongation of the pandemic and the waves of contamination resulting in various more or less pronounced lock-downs; the pressure on the supply chain, with the limited availability of raw materials and components, which has generated lengthening of delivery times and increased purchase costs; tensions in international transactions and rising inflation; the economic recovery in some sectors, also due to the start of the effect of the post-COVID stimulus plans issued by various countries; increased attention to the issues of sustainability and the circular economy. Despite this volatile economic environment, we have not experienced any slowdowns in the emergence of new opportunities for IoT projects and in orders intake from our customer base. The core business has been a driving force, but the IoT POCs activated in previous years have also experienced an acceleration. In particular, during 2021, we recorded an increase in orders in the smart agriculture sector in the US, in the semiconductor machinery sector in Japan, and in the rail sector in Europe. In fact, in 2021, Eurotech's order book has increased sharply during the year, which, without the component shortage, would have allowed it to record a growth of 5-7% compared to the previous year.
(€'000)FY 2021 % FY 2020 % % change
OPERATING RESULTS
SALES REVENUES 63,148 100.0% 69,259 100.0% -8.8%
GROSS PROFIT MARGIN (*) 29,478 46.7% 36,518 52.7% -19.3%
EBITDA ADJ (****) (325) -0.5% 6,632 9.6% -104.9%
Non recurring costs (2,422) -3.8% 0 0.0% n/a
EBITDA (**) (2,747) -4.4% 6,632 9.6% -141.4%
EBIT (***) (7,587) -12.0% 2,439 3.5% n.s
PROFIT (LOSS) BEFORE TAXES (7,989) -12.7% 1,832 2.6% n.s
GROUP NET PROFIT (LOSS) FOR THE PERIOD (10,408) -16.5% 132 0.2% n.s

Management report at 31 December 2021 Eurotech _________________________________________________________________________________________________________________________________________________________________________________________________________________________
13
Undelivered orders due to unavailability of electronic components amounted to approximately €7 million. About half of these orders have been rescheduled for 2022, while the other half have been balanced by the forward rescheduling of subsequent orders and therefore will have a neutral impact on 2022. In general, the upturn in orders and the fact that the Eurotech Group has an order book at the beginning of the year for 2022 that is double the order book at the beginning of the year for 2021 bodes well for the growth expected in 2022. Revenues In the scenario of growing scarcity of electronic components, 2021 recorded a consolidated turnover of €63.15 million, compared to €69.26 million in 2020. At constant exchange rates, and therefore neutralising the effect of the different currency conversion ratio in the two periods, turnover in 2021 would amount to €65.41 million with a 5.5% decrease in turnover compared with 2020. With reference to the breakdown of turnover by operating activity areas, sales increased by 12.5% in the American area compared to the same period of the previous year; the Japanese area reported a decrease by 15.0% and finally in Europe the decrease was 28.7%. The US was the area where traditional embedded business grew, thanks to the increase in orders in the transport and off-road sector, also as a result of the Biden administration's stimulus plan. Due to the shortage of components, the Japanese area suffered a slowdown in the ramp-up of new supplies, which should have offset the cyclical drop in business with some historic customers. Order intake in the second half of the year was strong, but due to the long procurement times some of the orders received did not translate into turnover for the year. The customer base is historically made up of important local multinational companies that find in Advanet a highly specialised development centre for electronic subsystems. The Japanese market remains a strategic outlet both because of its development potential in relation to new IoT technologies and because of the importance of the companies established there and their relevance not only locally but also globally. The European area is the one that suffered the most from a contraction in business, mainly due to the failure to offset the business in level 5 driverless cars, terminated by the customer due to the abrupt strategic repositioning of investments towards electrification that took place in 2019. The cycle of activating new business, equivalent in size to that lost, typically takes at least 24 months, therefore 2021 still suffered the negative effects that had already begun in 2020. During 2021, however, we have seen some signs of a restart in the driverless car sector, with some projects resuming and some new orders coming in. Europe remains the area of the Group that has picked up, before the others, design-win Industrial IoT projects, which have not yet expressed their potential in 2021 and that will grow at double-digit rates from 2022 onwards. Gross Profit Margin The gross profit margin for the year amounted to €29.48 million, or 46.7% of turnover, down on the figure of 52.7% last year. The reduction in profit margin is the combined effect of two elements: higher costs incurred to purchase certain low-availability components in order to be able to deliver products to customers, and a different mix of products sold. Higher procurement costs were not always passed on in full to customers during the year, but measures were taken on selling prices to allow the typical profitability to recover in 2022. In terms of product mix, 2020 still benefited from the premium profit from High Performance Edge Computers (HPECs) orders for level 5 driverless cars, which did not instead contribute in 2021. In order to partially alleviate the problem of the shortage of electronic components, which is certain to continue into 2022, two initiatives have also been taken: 1) redesigning some systems to use alternative components that are more readily available and/or less expensive, and 2) reorganising the supply chain

Management report at 31 December 2021 Eurotech _________________________________________________________________________________________________________________________________________________________________________________________________________________________
14
on more standard and higher-volume products, giving forecasts and longer-range orders (12-24 months) to suppliers. Operating costs The operating costs relating to the Group's core business have been well monitored to keep them in line with 2020, despite the efforts to strengthen the go-to-market as provided for in the new strategy. Operating costs before adjustments for internal increases and net of non-recurring costs amounted to €33.69 million (53.4% of revenues), in line with the €33.75 million recorded in 2020 (48.7% of revenues). At constant exchange rates, the increase would have been 2.2%. The total of operating costs, including non-recurring costs, amounted to €36.11 million. With reference to non-recurring costs, they were generated by two main events: the first event occurred in March 2021 and concerned the exit of the Chief Executive Officer in office until then, which led to costs for €1.3 million; the second event was the reorganisation carried out in some companies of the Group, which generated non-recurring costs for €1.1 million. The total of non-recurring operating costs amounted to €2.42 million. The most significant item within operating costs is payroll costs, which amounted to €20.23 million (net of non-recurring costs) with an impact on revenues of 32.0% (29.0% impact on revenues in 2020), with an increase of €0.14 million in absolute value compared to the same period of the previous year. This increase is linked to the first actions to strengthen the go-to-market, which is the main do-different of the new strategy presented to the market in July 2021. As of summer 2021, a phase of changes in the organisation began to align it with the needs of implementing the new outlined strategy. New employees with different backgrounds and expertise have joined the teams in the different locations, particularly in Europe and the USA. In addition to strengthening managerial functions, new hires were made in the areas of research and development and technical sales support, bringing the number of employees at 31 December 2021 to 324 (it was 323 at 31 December 2020), with an average for the period of 322.1 (319.9 in the 2020 financial year). Moreover, a reorganisation was started, which involved all the companies of the Group and in particular the French company, whose activities are now managed directly by Eurotech Spa. As a result of the reorganisation, it was possible to create room to strengthen the go-to-market while minimising the impact on operating costs as outlined above. EBITDA Earnings before amortisation, depreciation, valuations of investments in associates, net financial charges and income tax net of non-recurring costs (Adjusted EBITDA) amounted to -€ 0.32 million (-0.5% of revenues) compared to €6.63 million in 2020. The cause of the change is to be found in two factors: on the one hand the decrease in the gross profit margin due to the mix of products sold and the lower volume of turnover, on the other hand the higher costs for the purchase of components that have not been completely passed on to customers during the year. EBITDA, including non-recurring costs, amounted to -€2.75 million. EBITDA in 2021 as a percentage of revenues was -4.4%, compared with an EBITDA ratio in 2020 of 9.6%. EBIT The operating result (EBIT) was also affected by the factors outlined above and amounted to -€7.59 million compared to €2.44 million in 2020, after having included amortisation/depreciation and write-downs of the property, plant and equipment and intangible assets of €4.84 million compared to amortisation/depreciation and write-downs of €4.19 million in 2020. EBIT as a percentage of revenues amounted to -12.0% in 2021, compared to 3.5% in 2020. The increase in amortisation/depreciation is mainly due to the new amortisation/depreciation of some development projects and the new ERP system.

Management report at 31 December 2021 Eurotech _________________________________________________________________________________________________________________________________________________________________________________________________________________________
15
Write-downs made in 2021 refer both to the write-down of the Goodwill on the Eurotech France Cash Generating Unit for €186 thousand, and to the write-down of properties and rights of use for €80 thousand. In 2020, write-downs referred both to the write-down of a property to bring its net residual value in line with an appraisal that was carried out, and to the write-down of product development costs that are not deemed to be marketed as originally expected. Net financial management in 2021 amounted to -€0.40 million (-€0.67 million in 2020), with €0.35 million relating to the net interest management (it amounted to €0.40 million in 2020) and the amount of the other financial charges. With regard to the net exchange rate difference, a profit of €0.08 million in 2021 was reported against a loss of €0.19 million in 2020. EBT Pre-tax loss for 2021 amounted to -€7.99 million (it was positive for €1.83 million in 2020). This performance was influenced by the factors outlined above. Net result The Group net result was -€10.41 million, compared to €0.13 million in 2020. This performance not only reflects the pre-tax loss, but is due to the influence of the tax effect on the individual Group companies, (see the explanatory note 31 for more details) and to the non-recognition during the year of deferred tax assets on tax losses generated in the period. Breakdown by geographical area The Group oversees a single line of business known as “Modules and Platforms”, which comprises a) embedded computing modules and subsystems for industrial, transport, medical, energy and defence uses; b) Edge computers featuring low power consumption and high performances, to be used both in Internet of Things (IoT) solutions and to create applications where Artificial Intelligence (AI) algorithms are used; c) software frameworks and platforms for IoT applications. The segment reporting is presented based on the geographic area in which the various Group companies operate and are currently monitored. This is defined by the location of goods and operations carried out by individual Group companies. The geographic areas identified within the Group are: North America, Europe and Asia. Changes in revenues and margins by individual geographic area and the relative changes in the periods under review are set out below.
North American revenues, including infra-sector revenues, increased by 13.8% from €26.17 million in 2020 to €29.79 million in 2021. This increase, supported by an order book that grew significantly in 2021, is mainly attributable to historical customers, particularly in the smart agriculture sector. Revenues in the American area were affected, also in 2021, by a high concentration of turnover on a small number of customers with consolidated business and who consider Eurotech to be a solid and reliable provider. The European business area slowed down, from €22.74 million in 2020 to €19.18 million in 2021, thus recording a decrease, including infra-sector revenues, of 15.7%. In this area, the decrease was mainly due to the failure to compensate the autonomous driving business, which was terminated by the customer
(€' 000)
FY 2021 FY 2020 % YoY Change
FY 2021 FY 2020 % YoY Change
FY 2021 FY 2020 % YoY Change
FY 2021 FY 2020 FY 2021 FY 2020
Third party Sales 28,638 25,451 14,121 19,807 20,389 24,001 0 0 63,148 69,259
Infra-sector Sales 1,149 720 5,055 2,931 35 483 ( 6,239) ( 4,134) 0 0
Total Sales revenues 29,787 26,171 13.8% 19,176 22,738 -15.7% 20,424 24,484 -16.6% ( 6,239) ( 4,134) 63,148 69,259
Gross profit 10,523 10,772 -2.3% 7,827 11,521 -32.1% 10,523 14,598 -27.9% 605 ( 373) 29,478 36,518
Gross profit margin - % 35.3% 41.2% 40.8% 50.7% 51.5% 59.6% 46.7% 52.7%
EBITDA ( 2,747) 6,632
EBITDA margin - % -4.4% 9.6%
EBIT ( 7,587) 2,439
EBIT margin - % -12.0% 3.5%
North America Europe Asia Correction, reversal and
elimination Total

Management report at 31 December 2021 Eurotech _________________________________________________________________________________________________________________________________________________________________________________________________________________________
16
due to the strategic repositioning of investments in electrification. In spite of this, medium-term trends remain positive thanks to the opportunities in the transport sector, products linked to Edge Computing technologies and the Industrial IoT paradigm, which may also experience an acceleration in the next quarters. Finally, the Asia business area, due to the shortage of part of the electronic components, which did not make it possible to complete the production requested by customers for 2021, shows a decrease of 16.6% compared to the previous year: from €24.48 million to €20.42 million (values including infra-sector revenues). The breakdown of revenues by type that, also in application of IFRS 15, provides information on the disaggregated revenues, shows increased revenue from services, both in absolute terms (with an increase of 70.5% compared to 2020) and as a percentage (18.2%) of industrial revenues.
The geographic breakdown of revenues by customer geographical area is shown below:
Based on the breakdown of turnover by customer geographical area, the US area is confirmed as the most important area of the Group. The USA area accounted for 43.3% of total annual turnover in 2021 compared to 35.9% in 2020. The Japan area registered a 15.1% decrease in turnover compared to 2020, becoming the second most important area with a 32.3% of consolidated turnover, slightly down compared to 34.7% in 2020. In the Europe area, again with reference to customer geographical area, the level of turnover decreased by 30.4%. The Europe area accounted for 17.9% of total turnover. With reference to the other geographical areas, the absolute value is almost similar, accounting for 6.5%, slightly up on the previous year.
(€' 000)FY 2021 % FY 2020 %
SALES BY TYPE
Industrial revenues 51,665 81.8% 62,524 90.3%
Services revenues 11,483 18.2% 6,735 9.7%
TOTALE SALES AND SERVICE REVENUES 63,148 100.0% 69,259 100.0%
(€' 000) FY 2021 % FY 2020 % % change
BREAKDOWN BY GEOGRAPHIC AREA
European Union 11,314 17.9% 16,263 23.5% -30.4%
United States 27,333 43.3% 24,840 35.9% 10.0%
Japan 20,368 32.3% 24,001 34.7% -15.1%
Other 4,133 6.5% 4,155 6.0% -0.5%
TOTAL SALES AND SERVICE REVENUES 63,148 100.0% 69,259 100.0% -8.8%

Management report at 31 December 2021 Eurotech _________________________________________________________________________________________________________________________________________________________________________________________________________________________
17
Consumption of raw and auxiliary materials and consumables – the components of which are shown in the table above – during the period showed an increase despite the reduction in turnover, from €32.74 million in 2020 to €33.67 million in 2021. In the period in question, there was a 2.8% increase in consumption, i.e. more than proportional to the 8.8% decrease in turnover. The non-proportional difference between the changes in consumption and turnover is the direct result of the mix of products sold and the type of services offered and the write-downs on inventory figures. Costs for raw and auxiliary materials and consumables as a percentage of revenues grew from 47.3% in 2020 to 53.3% in 2021. The operating costs of the company are shown in the following table gross of non-recurring costs and in the following table representing the same operating costs net of non-recurring costs that have been grouped into a single item:
(€'000)FY 2021
% of sales
FY 2020 % of sales % change
Purchases of raw materials, semi-finished and finished products 33,147 52.5% 32,748 47.3% 1.2%
Changes in inventories of raw materials ( 503) -0.8% 24 0.0% n.s.Change in inventories of semi-finished and finished products 1,026 1.6% ( 31) 0.0% n.s.
TOTAL COST OF MATERIALS 33,670 53.3% 32,741 47.3% 2.8%
(€'000) FY 2021
% of sales
FY 2020 % of sales % change
Service costs 13,623 21.6% 12,150 17.2% 17.5%
- of which non recurrent costs 1,357 2.1% -
Rent and leases 386 0.6% 404 0.6% 0.6%
Payroll 20,721 32.8% 20,095 29.5% 29.0%
- of which non recurrent costs 488 0.8% - 0.0% 0.0%
Accruals and other costs 1,384 2.2% 1,099 1.0% 1.6%
- of which non recurrent costs 577 0.9% - 0.0%Cost adjustments for in-house generation of non-current assets ( 3,305) -5.2% ( 3,483) -4.0% -5.0%
Operating costs net of cost adjustments 32,809 122.7% 30,265 44.4% 43.7%
(€'000) FY 2021
% of sales
FY 2020 % of sales % change
Service costs 12,266 19.4% 12,150 33.6% 1.0%
Rent and leases 386 0.6% 404 1.1% -4.5%
Payroll 20,233 32.0% 20,095 55.5% 0.7%
Accruals and other costs 807 1.3% 1,099 3.0% -26.6%Cost adjustments for in-house generation of non-current assets ( 3,305) -5.2% ( 3,483) -9.6% -5.1%
Operating costs net of non recurrent costs and of cost adjustments 30,387 48.1% 30,265 43.7% 0.4%- non recurrent costs 2,422 3.8% - 0.0% n.s.
Operating costs net of cost adjustments 32,809 52.0% 30,265 43.7% 8.4%

Management report at 31 December 2021 Eurotech _________________________________________________________________________________________________________________________________________________________________________________________________________________________
18
In 2021, non-recurring costs were reported mainly connected to the economic agreement resulting from the termination of the relationship between Eurotech S.p.A. and the CEO Roberto Siagri, concluded on 23 March 2021, which was fully described in a specific communication following the event, and partly due to some reorganisation costs incurred at Group level and, to a lesser extent, to the costs associated with the entry of the new CEO. The total of non-recurring costs amounted to €2.42 million. As a percentage of revenues, other operating costs, net of non-recurring costs and only cost adjustments for internal increases, grew from 43.7% for 2020 to 48.1% for 2021. Also considering these non-recurring costs, the operating costs amounted to a total of €32.81 million. In absolute terms, net operating costs rose from €30.26 million in 2020 to €32.81 million in 2021, an increase of 8.4%. The increase in the absolute value is the result of non-recurring costs, which have a one-off impact on the year's result, and of the increase in payroll costs. The most significant operating cost categories consist of the costs for services supporting the various company activities, with particular reference to development and commercial costs, and of payroll costs. The trend in service costs is shown below.
Service costs increased by 12.1%, or €1.47 million, from €12.15 million in 2020 to €13.62 million in 2021. As a percentage of revenues, this item stood at 21.6% (2020: 17.5%). Industrial service costs went from €4.99 million in 2020 to €4.58 million in 2021, a decrease of 8.3%. These costs are directly linked to both the quantity of products sold and their mix. Costs for commercial services, incurred in support of the product portfolio in the various reference markets, decreased slightly due to marketing and sales expenses that are still limited as a result of the restrictions arising from the measures to combat the COVID-19 pandemic; these costs amounted to €1.82 million in 2021 (2020: €1.89 million), a decrease of €0.07 million or 4.1%. Costs for general and administrative services were up by 37.3% compared to the previous year, from €5.26 million in 2020 to €7.23 million in 2021. The increase is mainly due to the non-recurring costs incurred during the year for €1.36 million in addition to the higher costs incurred for the implementation of the corporate strategy. The absolute value of leasing costs went from €0.40 million in 2020 to €0.39 million in 2021. The decrease is the result of lower costs incurred for activities related to the IoT business area. The percentage to revenues amounted to 0.6% (2020: 0.6%). In the period under review, payroll costs increased by 3.1%. The higher costs are due to some non-recurring costs for €488 thousand incurred for the reorganisation of the Group, the increase in the number of employees, the increase in wages and salaries and the different mix of salaries for people hired compared to those who left during the year.
(€'000) FY 2021 % FY 2020 % % change
Industrial services 4,579 33.6% 4,991 41.1% -8.3%
Commercial services 1,817 13.3% 1,894 15.6% -4.1%General and administrative costs 7,227 53.0% 5,265 43.3% 37.3%
Total costs of services 13,623 100.0% 12,150 100.0% 12.1%
% impact on sales 21.6% 17.5%
Management report at 31 December 2021 Eurotech _________________________________________________________________________________________________________________________________________________________________________________________________________________________
19
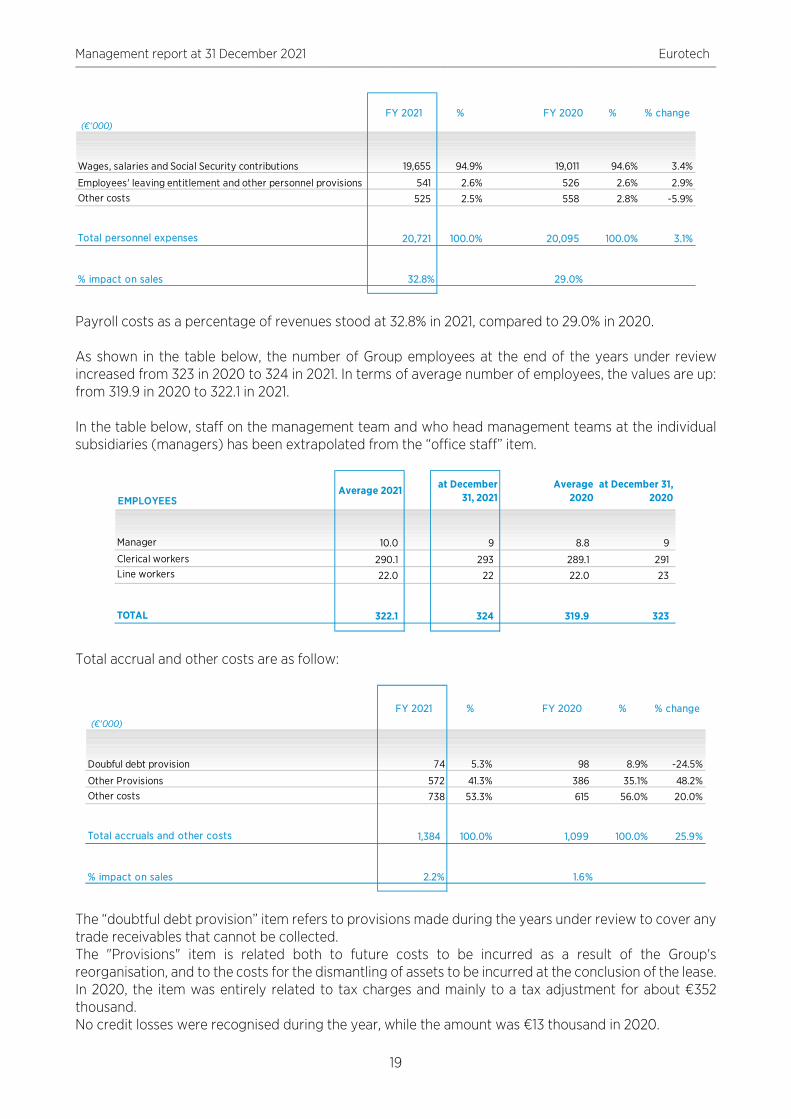
Payroll costs as a percentage of revenues stood at 32.8% in 2021, compared to 29.0% in 2020. As shown in the table below, the number of Group employees at the end of the years under review increased from 323 in 2020 to 324 in 2021. In terms of average number of employees, the values are up: from 319.9 in 2020 to 322.1 in 2021. In the table below, staff on the management team and who head management teams at the individual subsidiaries (managers) has been extrapolated from the “office staff” item.
Total accrual and other costs are as follow:
The “doubtful debt provision” item refers to provisions made during the years under review to cover any trade receivables that cannot be collected. The "Provisions" item is related both to future costs to be incurred as a result of the Group's reorganisation, and to the costs for the dismantling of assets to be incurred at the conclusion of the lease. In 2020, the item was entirely related to tax charges and mainly to a tax adjustment for about €352 thousand. No credit losses were recognised during the year, while the amount was €13 thousand in 2020.
(€'000) FY 2021 % FY 2020 % % change
Wages, salaries and Social Security contributions 19,655 94.9% 19,011 94.6% 3.4%
Employees' leaving entitlement and other personnel provisions 541 2.6% 526 2.6% 2.9%Other costs 525 2.5% 558 2.8% -5.9%
Total personnel expenses 20,721 100.0% 20,095 100.0% 3.1%
% impact on sales 32.8% 29.0%
EMPLOYEESAverage 2021 at December
31, 2021 Average
2020 at December 31,
2020
Manager 10.0 9 8.8 9
Clerical workers 290.1 293 289.1 291 Line workers 22.0 22 22.0 23
TOTAL 322.1 324 319.9 323
(€'000)
FY 2021 % FY 2020 % % change
Doubful debt provision 74 5.3% 98 8.9% -24.5%
Other Provisions 572 41.3% 386 35.1% 48.2%Other costs 738 53.3% 615 56.0% 20.0%
Total accruals and other costs 1,384 100.0% 1,099 100.0% 25.9%
% impact on sales 2.2% 1.6%

Management report at 31 December 2021 Eurotech _________________________________________________________________________________________________________________________________________________________________________________________________________________________
20
As a percentage of revenues, other provisions and costs increased from 1.6% in 2020 to 2.2% in 2021.
The "Other income" item increased by 54.1% over the period, from €0.38 million in 2020 to €0.58 million in 2021. During 2021, operating grants defined by the subsidiary EthLab relating to previous years were recognised. “Other revenues” item increased from 0.7% in 2020 to 2.2% in 2021, as a percentage of revenues.
Amortisation/depreciation increased from €4.04 million in 2020 to €4.57 million in 2021. This change is attributable to the impact of application of the amortisation relating to the investments made in the period and in previous periods. The write-down of fixed assets for the year is related to the write-down of the Goodwill on the Eurotech France Cash Generating Unit for €186 thousand, to the write-down of the building of the subsidiary IPS for €19 thousand to adjust it to the value of the preliminary sale agreement signed in November 2021 and for €61 thousand for the write-down made in advance of the termination of the contract on the right-of-use of a building that will no longer be used. In 2020, the write-down referred both to the €60 thousand write-down of the building of the subsidiary IPS to adjust it to the value resulting from the appraisal prepared in 2020 and to the €91 thousand write-down of development activities that were deemed to be no longer usable. Depreciation, amortisation and write-downs of fixed assets as a percentage of revenues rose to 7.7% in 2021 from 6.1% in 2020. With reference to the "Management of investments" item, the write-down of €3 thousand refers to the write-down of minority interests. In 2020, the revenue recognised related to the capital gain from the sale of the shares in Inasset S.r.l.
(€'000)FY 2021 % FY 2020 % % change
Government grants 379 64.9% 257 67.8% 47.5%Sundry revenues 205 35.1% 122 32.2% 68.0%
Total other revenues 584 100.0% 379 100.0% 54.1%
% impact on sales 2.2% 0.7%
(€'000) FY 2021 % FY 2020 % % change
Amortisation of intangile assets 2,745 56.7% 2,131 50.8% 28.8%
Amortisation of property, plant and equipment 1,829 37.8% 1,911 45.6% -4.3%Write-down of fixed assets 266 5.5% 151 3.6% 76.2%
Total amortisation and depreciation 4,840 100.0% 4,193 100.0% 15.4%
Management report at 31 December 2021 Eurotech _________________________________________________________________________________________________________________________________________________________________________________________________________________________
21
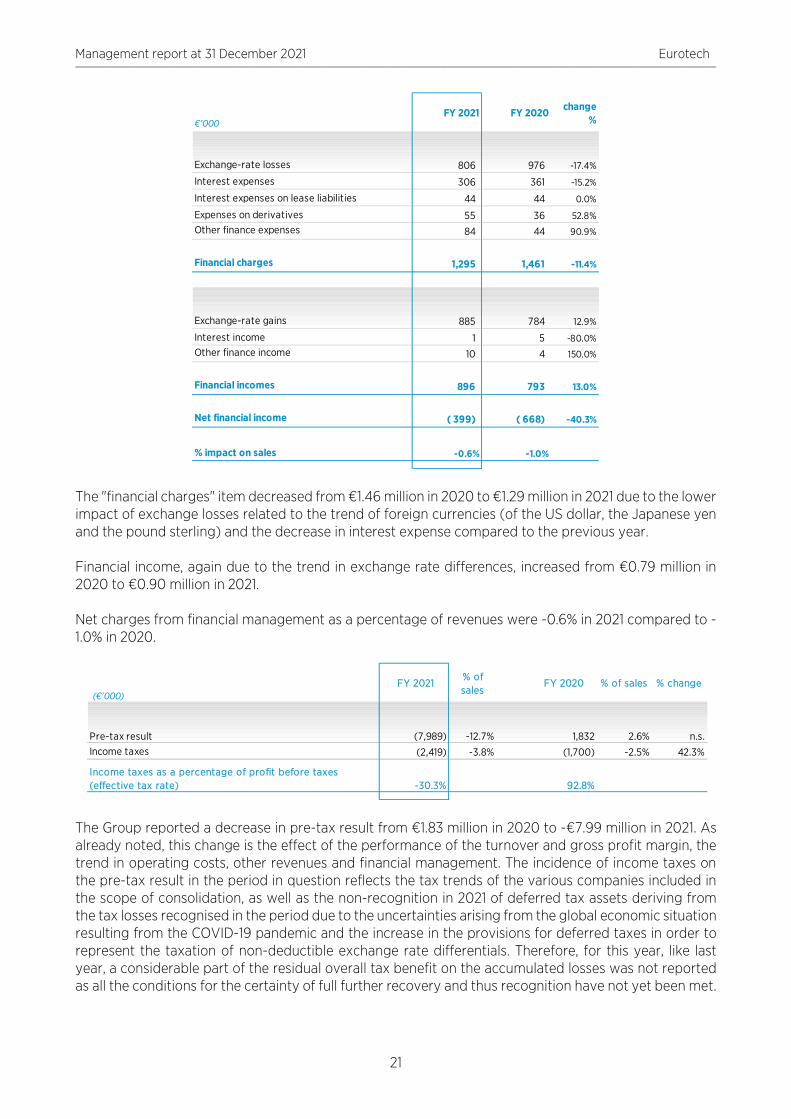
The "financial charges" item decreased from €1.46 million in 2020 to €1.29 million in 2021 due to the lower impact of exchange losses related to the trend of foreign currencies (of the US dollar, the Japanese yen and the pound sterling) and the decrease in interest expense compared to the previous year. Financial income, again due to the trend in exchange rate differences, increased from €0.79 million in 2020 to €0.90 million in 2021. Net charges from financial management as a percentage of revenues were -0.6% in 2021 compared to -1.0% in 2020.
The Group reported a decrease in pre-tax result from €1.83 million in 2020 to -€7.99 million in 2021. As already noted, this change is the effect of the performance of the turnover and gross profit margin, the trend in operating costs, other revenues and financial management. The incidence of income taxes on the pre-tax result in the period in question reflects the tax trends of the various companies included in the scope of consolidation, as well as the non-recognition in 2021 of deferred tax assets deriving from the tax losses recognised in the period due to the uncertainties arising from the global economic situation resulting from the COVID-19 pandemic and the increase in the provisions for deferred taxes in order to represent the taxation of non-deductible exchange rate differentials. Therefore, for this year, like last year, a considerable part of the residual overall tax benefit on the accumulated losses was not reported as all the conditions for the certainty of full further recovery and thus recognition have not yet been met.
€'000FY 2021 FY 2020 change
%
Exchange-rate losses 806 976 -17.4%
Interest expenses 306 361 -15.2%
Interest expenses on lease liabilities 44 44 0.0%
Expenses on derivatives 55 36 52.8%Other finance expenses 84 44 90.9%
Financial charges 1,295 1,461 -11.4%
Exchange-rate gains 885 784 12.9%
Interest income 1 5 -80.0%Other finance income 10 4 150.0%
Financial incomes 896 793 13.0%
Net financial income ( 399) ( 668) -40.3%
% impact on sales -0.6% -1.0%
(€'000) FY 2021
% of sales
FY 2020 % of sales % change
Pre-tax result (7,989) -12.7% 1,832 2.6% n.s.Income taxes (2,419) -3.8% (1,700) -2.5% 42.3%
Income taxes as a percentage of profit before taxes (effective tax rate) -30.3% 92.8%

Management report at 31 December 2021 Eurotech _________________________________________________________________________________________________________________________________________________________________________________________________________________________
22
The schedule below breaks down the income taxes sustained by Group companies for both years under review, distinguishing between current tax and deferred tax assets and liabilities, and between taxes due under Italian law and those due under foreign law.
With regard to current national taxes, Eurotech S.p.A. operates in a national tax consolidation scheme for Italian companies. The Group reported a loss of €10.41 million compared to a profit for 2020 of €0.13 million.
(€'000) FY 2021
% of sales
FY 2020 % of sales % change
IRES (Italian corporate income tax) 1,014 1.6% 179 0.3% 466.5%
IRAP (Italian Regional business tax) 88 0.1% 38 0.1% 131.6%Foreign current income taxes 101 0.2% 1,006 1.5% -90.0%
Total current income tax 1,203 1.9% 1,223 1.8% -1.6%
Net (prepaid) deferred taxes: Italy 776 1.2% (34) 0.0% n.s.Net (prepaid) deferred taxes: Non-italian 402 0.6% 511 0.7% -21.3%
Net (prepaid) deferred taxes 1,178 1.9% 477 0.7% 147.0%
Previous years taxes 38 0.1% - 0.0% N/A
Previous years taxes 38 0.1% - 0.0% N/A
TOTAL INCOME TAXES 2,419 3.8% 1,700 2.5% 42.3%

Management report at 31 December 2021 Eurotech _________________________________________________________________________________________________________________________________________________________________________________________________________________________
23
Statement of financial position
Non-current assets
The “Non-current assets” item decreased from €101.97 million in 2020 to €101.00 million in 2021. The change reflects primarily the change in intangible assets arising from the different conversion ratio for financial statements in foreign currency, in addition to the investments made and the related amortisation, as well as to the change in deferred tax assets, which decreased by €0.97 million mainly due to the greater offsetting between deferred tax assets and deferred tax provisions carried out on the parent company. With reference to the change in the period, which shows a decrease of €0.97 million, the exchange rate effect had an impact of €0.14 million: in fact, if the values at constant exchange rates had been compared, a decrease of €1.11 million would have resulted. The Group’s main investments break down as follows:
(€'000)
Intangible assets 88,043 86,775 1,268
Property, Plant and equipment 5,229 6,468 ( 1,239)
Investments in other companies 542 533 9
Deferred tax assets 6,504 7,478 ( 974) Medium/long term borrowing allowed to affiliates companies and other Group 62 57 5 Other non-current assets 620 661 ( 41)
Total non-current assets 101,000 101,972 ( 972)
at December 31, 2020
Changesat December 31, 2021
(€'000)
at December 31, 2021
at December 31, 2020 Changes
Intangible assets 3,673 4,270 ( 597)
Property, plant and equipment 1,173 1,929 ( 756)Investments 3 400 ( 397)
TOTAL MAIN INVESTMENTS 4,849 6,599 ( 1,750)

Management report at 31 December 2021 Eurotech _________________________________________________________________________________________________________________________________________________________________________________________________________________________
24
Current assets
The "Current assets" item decreased, from €77.75 million in 2020 to €63.69 million in 2021. The change is mainly due to the decrease in cash and cash equivalents due to the repayment of loan instalments and partially, as per the cash flow statement, for €3.28 million from the generation of operating cash during the year. Compared to 31 December 2020, at the end of 2021 there was a decrease in trade receivables of €5.16 million (-31.4%) and an increase in other current assets of €0.46 million (+27.9%).
Net working capital
Net working capital, which comprises current assets net of cash and cash equivalents and non-financial current liabilities, underwent the following changes in the reporting period:
Net working capital decreased by €5.38 million. This decrease is the result of the combined effect of a decrease in current assets and an increase in current liabilities. More specifically, there were net decreases in trade receivables and other current assets on the one hand and, on the other, an increase in the liability items related to trade payables as well as a decrease in income tax liabilities and other current liabilities. Net working capital as a percentage of turnover was 16.5%, due also to the effect of the reduced turnover, compared to 22.9% at the end of 2020.
(€'000)
Inventories 17,646 17,393 253
Trade receivables 11,280 16,441 ( 5,161)
Income tax receivables 801 900 ( 99)
Other current assets 2,130 1,665 465
Other current financial assets 123 125 ( 2)
Derivative instruments 4 - 4
Cash & cash equivalents 31,704 41,222 ( 9,518)
Total current assets 63,688 77,746 ( 14,058)
at December 31, 2021
at December 31, 2020
Changes
at December 31, 2021
at December 31, 2020 Changes
Inventories 17,646 17,393 253
Trade receivables 11,280 16,441 (5,161)
Income tax receivables 801 900 (99)
Other current assets 2,130 1,665 465
Current assets 31,857 36,399 (4,542)
Trade payables (13,005) (10,647) (2,358)
Income tax liabilities (215) (810) 595
Other current liabilities (8,193) (9,115) 922
Current liabilities (21,413) (20,572) (841)
Net working capital 10,444 15,827 (5,383)

Management report at 31 December 2021 Eurotech _________________________________________________________________________________________________________________________________________________________________________________________________________________________
25
Net financial position
The Group’s financial position at 31 December 2021 shows a positive net cash position of €6.21 million, compared with €8.55 million at 31 December 2020. This decrease stems from the use of cash and cash equivalents to support operations and the net investment in property, plant and equipment, intangible assets and equity investments totalling €2.0 million. Note that, effective 1 January 2019, the new IFRS 16 “Leases” standard was adopted, which establishes a new method of accounting for lease contracts (Right of Use), which must be recognised with a balancing entry in financial liabilities. Following the adoption of the new standard, greater financial liabilities were recognised at 31 December 2020 in the amount of €3.00 million; at 31 December 2021, the greater residual financial liabilities amounted to €2.26 million. The net financial position (net financial debt) is determined in accordance with the definitions of CONSOB notice no. 5/21 of 29 April 2021, which refers to the Guidelines of the European Securities and Markets Authority (ESMA), issued on 15 July 2020 and in force as from 5 May 2021. The net financial position at the end of both periods is broken down in the schedule below.
Existing financial liabilities of €23.31 million, plus current account overdrafts at year-end 2021 of €92 thousand, combine to form total debt toward banks of €23.41 million, of which €6.96 million is payable in the short term. The debt resulting from the reporting of lease contracts (Right of Use) amounted to €2.27 million at the end of 2021 versus €3.00 million at the end of 2020. At 31 December 2021, the Group had complied with all the financial covenants contained in the existing loan agreements.
(€'000)
at December 31, 2021
at December 31, 2020
Cash A ( 31,704) ( 41,222)
Cash equivalents B - -
Other current financial assets C ( 123) ( 125)
Cash equivalent D=A+B+C ( 31,827) ( 41,347)
Current financial debt E 99 328
Current portion of non-current financial debt F 8,045 8,654
Short-term financial position G=E+F 8,144 8,982
Short-term net financial position H=G+D ( 23,683) ( 32,365)
Non current financial debt I 17,535 23,874
Debt instrument J - -
Trade payables and other non-current payables K - -
Medium-/long-term net financial position L=I+J+K 17,535 23,874
(NET FINANCIAL POSITION) NET DEBT ESMA M=H+L ( 6,148) ( 8,491)Medium/long term borrowing allowed to affiliates companies and other Group companies N ( 62) ( 57)
(NET FINANCIAL POSITION) NET DEBT P O=M+N ( 6,210) ( 8,548)

Management report at 31 December 2021 Eurotech _________________________________________________________________________________________________________________________________________________________________________________________________________________________
26
Due to the performance of the period, operations generated a cash flow of €3.28 million, compared to €3.39 million in 2020. Investment activities derive from the investments made in developing new products in the form of modules, embedded systems and Internet of Things (IoT) platforms, from the investments for the change of the IT system at the Group level and the internal investments in industrial, commercial and hardware equipment. Finally, cash flows from financial activities was mainly due to the repayment of short-term portions of medium-term loans. Intragroup relations and transactions with related parties Within the scope of transactions aimed at routine management of the business of the Eurotech Group and constant promotion of new production and commercial synergies, the Group companies maintain reciprocal commercial relations whereby they sell products and services to some Group companies and buy products and services from the same Group companies. Relations between Group companies are governed by market conditions, taking into account the quality of the goods and services provided. The outstanding balances at the reporting date are not supported by guarantees, do not generate interest (except loans) and are settled in cash. No warranties, whether given or received, exist in relation to related-party receivables and payables. At the end of 2021, following the decision to reduce the sales activities of the subsidiary Eurotech France Sas, the parent company Eurotech Spa waived the trade receivables existing at 31 December 2021 for a value of €1.81 million as they are not recoverable with the assets held by the French subsidiary. As a result, for the period ended 31 December 2021 the Group made no provision to a doubtful debt provision for sums owed by related parties, except for the €447 thousand write-down already made in 2010 on the receivable from affiliated company in liquidation Rotowi Technologies S.p.A. (formerly UTRI S.p.A.). This valuation is performed every year by examining the financial position of the related parties and the market in which they operate. The Group companies also use the brands registered by the Parent Company. Specific contracts govern the uses of the brands. Starting from 2021, the Parent Company invoiced royalties relating to the Eurotech brand to those companies that commercially use the Eurotech brand, which is maintained by the Parent Company itself. Finally, some of the Group companies also have service relations with the Parent Company, which provides administrative, tax, corporate, business and strategic services for Eurotech Group subsidiaries. The reciprocal services and obligations between the subsidiaries and the Parent Company are governed by a specific master service contract.
(€'000)
at December 31, 2021
at December 31, 2020
Cash flow generated (used) in operations A 3,279 3,388
Cash flow generated (used) in investment activities B ( 5,274) ( 5,092)
Cash flow generated (absorbed) by financial assets C ( 8,059) 13,456
Net foreign exchange difference D 536 ( 1,217)
Increases (decreases) in cash & cash equivalents E=A+B+C+D ( 9,518) 10,535
Opening amount in cash & cash equivalents 41,222 30,687
Cash & cash equivalents at end of period 31,704 41,222

Management report at 31 December 2021 Eurotech _________________________________________________________________________________________________________________________________________________________________________________________________________________________
27
Relations with related parties include transactions arising in the course of normal business and financial relationships with companies in which the Directors of the Company or its subsidiaries have senior positions. These transactions are regulated under market conditions. Information on related party transactions, as required by CONSOB Resolution no. 6064293 of 28 July 2006, are described in Note 32 of the consolidated financial statements. Based on the information received from Group companies, no unusual or atypical transactions took place as defined by CONSOB in its communication no. 6064293 of 28 July 2006. The schedule below shows information on equity investments held in the Company and its subsidiaries by members of the management and supervisory bodies, general managers and managers with strategic responsibilities as well as spouses not legally separated and children, directly or through subsidiaries, trust companies or third parties, taken from the shareholders’ register, notifications received and other information acquired by the members of the management and supervisory bodies, general managers and managers with strategic responsibilities, pursuant to Art. 79 of CONSOB Regulation no. 11971/99 as subsequently amended.
Reconciliation statement of results for the year and shareholders’ equity The schedule below shows the reconciliation of net income and consolidated shareholders’ equity of the Issuer at 31 December 2021 and 31 December 2020:
Name Nomination Company Possessory
title
Share at January 1 or appointment
Share acquired in the period
Share disposed in the period
Share at the end of the
period
of which shares at the
end of the period
indirectly
Mapelli Patrizio President Eurotech - - - - - -
Fumagalli Aldo Director andVice President Eurotech - - - - - Chawla Paul Director from April 7, 2021 Eurotech Ownership 35,450 38,800 - 74,250 -
Costaguta Marco Director Eurotech - - - - - -
Mio Chiara Director Eurotech - - - - - -
Marti Antongiulio Director Eurotech - - - - - -
Curti Susanna Director Eurotech - - - - - -
Filippini Mariagrazia Director Eurotech - - - - - -
Rovizzi Laura Director Eurotech - - - - - -
Siagri Roberto CEO up to March 23, 2021 Eurotech Ownership (*)
503,770 - -
Monti Fabio President of Board of Statutory Auditors
Eurotech - - - - - -
Savi Daniela Statutory Auditor Eurotech - - - - - -
Monterisi Pietro Statutory Auditor from June 23, 2021
Eurotech - - - - - -
Rebecchini Gaetano Statutory Auditor up to June 23, 2021
Eurotech - - - - - -
Strategic Managers Eurotech Ownership (**)
- 41,000 - 41,000 -
at December 31, 2021
(*) From the date of the identification of the Strategic Manager (*) Shares owned at the end of office

Management report at 31 December 2021 Eurotech _________________________________________________________________________________________________________________________________________________________________________________________________________________________
28
Treasury shares of the Parent Company owned by the Parent Company or subsidiaries
The Parent Company Eurotech S.p.A. held 89,920 treasury shares at the end of the reporting period. Treasury shares changed as follows in 2021:
Investments and research and development
At 31 December 2021, technical investments (property, plant and equipment) in equipment and instruments amounted to €384 thousand, investments in property and other assets amounted to €194 thousand, investments to purchase user, software and know-how licenses amounted to €660 thousand. During the period, the Group invested in industrial research and development and technological innovation for new products and for improving the current products and processes. Research resulted in the development of new products/applications in the field of computers and embedded systems, high-integration and low-consumption computers, network appliances, software platforms and supercomputers. Research also led to improvements in the quality of products, the creation of new products, reduced manufacturing costs and a resulting increase in company competitiveness. During the period development costs for new products were capitalised for €2.99 million: 27.6% of said costs relate to the development of new hardware products based on the new ultra-
(€'000) Profit (Loss)
12/31/2021
Shareholders' Equity
12/31/2021 Profit (Loss) 12/31/2020
Shareholders' Equity
12/31/2020
Financial report of the Parent Company ( 6,633) 140,737 ( 3,006) 147,097
Group share of shareholders' equity and pro-quota value in consolidated companies ( 927) ( 83,350) 1,403 ( 82,380)
Differential arising from consolidation 48,033 49,009
Trademark 8,122 8,372
Reversal of Impairment of equity transactions 1,860 - 185 -
Elimination of unrealised internal profit on capitalizations ( 4) ( 350) ( 25) ( 346)
Exchange differences on equity investments in foreign companies ( 2,876) - 3,453 -
Stock option subsidiaries ( 74) - ( 122) -
Offset dividends ( 1,716) - ( 1,836) -
Tax effects on consolidation adjustments listed above ( 38) ( 2,756) 80 ( 2,888)
Consolidated financial statements ( 10,408) 110,436 132 118,864
No. of shares Face value of a
share % share
capital Carrying value Average unit
value
(Thousand of Euro) (Thousand of Euro)
Status as at 1 January 2021 290,520 73 0.82% 682 2.35
Purchases - - 0.00% -
Sales - - 0.00% -
Assignment-Performance share Plan ( 200,600) ( 50) -0.56% ( 471) 2.35
Status as at 31 December 2021 89,920 23 0.25% 211 2.35

Management report at 31 December 2021 Eurotech _________________________________________________________________________________________________________________________________________________________________________________________________________________________
29
low power architecture; 52.2% of said costs relate to software projects in the Edge computing segment and in the Internet of Things platforms; the remaining approximately 20.2% was used for a range of purposes in both hardware and software, including projects launched in previous years.
Main risks and uncertainties to which the Group is exposed
Risks associated with the COVID-19 pandemic The persistence of the state of health emergency due to the spread of COVID-19 and the failure to ease the restrictive measures issued by national and foreign authorities, in addition to the worsening of the European and global macroeconomic scenario and the risk of possible deterioration of the credit profile of customers in some sectors, could lead to slowdowns in business activities. These slowdowns may derive from the difficulty of meeting established customers, the difficulty of interacting with new customers, the situation of uncertainty and discontinuity in the supply chain and may have negative impacts on the Company’s overall results. The management of this emergency situation involves the implementation of all activities pertaining to the operational continuity of business processes with the aim of ensuring the functionality of the activities in support of customers, the services provided also to the Group companies and the protection of the health of the employees. Risks connected to general economic conditions The global macro-economic scenario in 2021 remained difficult to understand throughout the year. To date, there seems to be encouraging prospects regarding COVID-19 and many countries are planning the elimination of the emergency state but on the other hand the latest European events that led to a war in Ukraine could have significant consequences for the internal world economic scenario. The macro-economic context affects the Group's ability to implement the desired growth path. The technological sectors in which the Group operates, although impacted by the pandemic in the short term, remain with a positive outlook for the years to come. In part, the scenario will also depend on the investments that the States will decide to make in support of local economies. The Group's presence in various regions of the world however enables it to spread risk and to benefit from any positive situations arising in some regions in relation to or before other regions. The Group's presence in sectors such as industrial, commercial and transportation, which are more affected by reduced consumption, may generate losses and risks of loss, above all in a scenario of considerable weakness of overall economic conditions. Furthermore, leaving aside slow economic growth or recession, other economic conditions such as fluctuating raw material prices or their reduced availability or reduced spending on infrastructure may negatively affect the markets in which the Group operates, and may, in combination with other factors, have a significant impact on the Group's business outlook, operating performance and/or financial situation. The political instability of some European countries as well as the effects of the United Kingdom’s exit, still to be fully verified, from the European Community, still to be fully assessed, as well as the risk of Europe’s failure to recover quickly after the pandemic, could represent elements of instability for the European economy.

Management report at 31 December 2021 Eurotech _________________________________________________________________________________________________________________________________________________________________________________________________________________________
30
Risks connected to exchange rate and interest rate fluctuations The Eurotech Group operates at global level and has invested in countries such as the US, Japan and the UK, deriving cash flows from these countries that are not consistent. In addition, the individual foreign subsidiaries tend to operate on their respective core markets with the respective functional currencies. Owing to these considerations, exchange rate hedging operations are not carried out, despite the fact that the consolidated financial statements are constantly affected by exchange rate fluctuations when the financial statements of companies outside the Eurozone are translated. The Group is exposed via medium-term, variable-rate loans, particularly in Europe and to a lesser extent in Japan. The Group uses hedging instruments to mitigate the effects of interest rate variations on loans. Steep exchange rate or interest rate fluctuations may have an impact on the Group’s business performance and financial results. For more information, see Note 34. Risks connected to liquidity and required financial resources In view of its current net financial position, the Group plans to meet requirements for expiring financial payables with available cash and cash flows from operations. The Group believes that in order to generate positive cash flows, it must have a higher level of turnover than that achieved in 2021 and continue to focus on margins and operating costs in accordance with revenue levels while balancing the growth of the organisation in order to achieve the expected objectives. Group strategy is to maintain the available cash invested in at-sight or very short-term bank deposits, dividing the deposits between a sufficient number of selected banking counterparties operating in various regions. Even if the Group has implemented measures designed to maintain adequate levels of working capital and cash, any further contraction in sales volumes may have a negative effect on the cash-generating capacity of the Group’s operational units. The Group may therefore find it necessary to arrange further loans and/or refinancing of existing debt, including in unfavourable market conditions, with a general reduction in available financing sources and higher costs. Any difficulties in raising such financing could have a negative effect on the Group’s business outlook, as well as on its operational results and/or its financial position. Risks connected to management The Group’s success largely depends on the ability of certain Executive Directors and other members of management to run the Group and the individual local entities efficiently. Loss of the services of an Executive Director or other key resources without adequate replacement, and any inability to attract and retain new and qualified resources, could have negative effects on the Group’s outlook, business performance and operating and financial results. Risks connected to competitiveness in the sectors in which the Group operates With some exceptions, the Group’s markets are competitive in terms of product quality, innovation, reliability and customer support. The Group’s success will depend on its ability to maintain and build on its share of the markets in which it operates and/or to expand into new markets with innovative products and high quality standards ensuring profit levels similar to those on its current markets. In recent years competition has become more intense, particularly in terms of price, especially in the embedded boards and modules segment and to a lesser extent in systems sector.

Management report at 31 December 2021 Eurotech _________________________________________________________________________________________________________________________________________________________________________________________________________________________
31
If the Group were not able to offer more competitive and innovative products than its competitors, the Group’s market share could decline, with a negative effect on the profitability and operating and financial results of the Eurotech Group. Risks connected to customers In some regions, the Group operates with a limited number of customers. Due to this dependency on certain customers, the loss of these large customers or a significant reduction in the turnover generated from them could have a negative impact on the Group's sales revenues and profitability. Generally speaking, these customers are not the end-users of our products. Any lack of success of products into which our products are incorporated, and any difficulty experienced by our customers in selling the products that we design or produce for them, could have a negative effect on sales and margins. Adverse economic conditions in markets where our customers may sell or use our products would lead to a reduction in supplies to these customers. Some of these markets are characterised by intense competition, rapid technological change and economic uncertainty. The Group’s exposure to economic cycles and related fluctuations in demand from these customers could have a negative effect on revenues and therefore on the Group’s financial situation. In addition, a decision by some customers to make the products supplied by us in-house would reduce supplies to these customers and therefore sales revenues and profitability. Risks connected to environmental policy The Eurotech Group’s activities and products have to comply with national, community and international environmental legislation. This legislation is becoming increasingly stringent in the countries where the Group operates. The potential risk to which the Group is subject relates to the processing of electric and/or electronic parts that, pursuant to new legislation, could become unusable in production or separately saleable. The consequent disposal of such products, or of others that have become obsolete due to technological advances, incurs increasingly high costs. In order to comply with legislation in force, the Eurotech Group envisages having to continue to sustain costs that may rise in future years. Risks connected to relations with employees and suppliers In some of the countries in which the Group operates, employees are subject to various laws and/or collective employment agreements that guarantee them – including by means of local and national representatives – the right to be consulted on certain questions, such as workforce reductions. Such laws and/or collective employment agreements applicable by the Group could affect Group flexibility in the redefinition and/or strategic repositioning of its operations. Any unagreed decisions could lead to problems in workforce management. In addition, the Group acquires raw materials and components from numerous suppliers and depends on the services and products supplied by other companies external to the Group. Collaboration between producers and suppliers is normal in the segments in which the Group operates, and while this leads to economic benefits in the forms of reduced costs, it also means that the Group has to rely on these suppliers, with the consequent possibility that difficulties they experience (whether due to external or internal factors), including financial difficulties, could have negative repercussions on the Group's business outlook, as well as its operating results and/or its financial situation. The price and availability of the electronic components used depend on a wide variety of factors, largely beyond the control of the Group and difficult to predict. Over the past 18 months, supply-side tensions have led to procurement difficulties and increased costs with negative consequences on the Group's

Management report at 31 December 2021 Eurotech _________________________________________________________________________________________________________________________________________________________________________________________________________________________
32
economic results. Considering the persistence of this situation of uncertainty, in order to minimise the risks associated with a potential unavailability of components within the time required for production, the Group has adopted a strategy of planned purchases in the medium term. Risks connected to development activity The Group conducts major research and development activities that can last for more than 24 months. Development activities believed to be capable of producing future benefits in terms of revenues are posted as intangible fixed assets. Not all development activities may lead to production at a level that allows for complete recoverability of the posted asset. When products related to capitalised development activities do not achieve the success expected, the impact on expected Group revenues and profits is determined, as well as whether the asset has to be written down. Risks connected to the capacity to enrich the product portfolio and offer innovative products The success of the Group’s activities depends on its ability to maintain or increase its share on the markets in which it operates, and/or to expand into new markets with innovative products of a high standard of quality ensuring adequate profit levels. More specifically, if the Group were unable to develop and offer more innovative and competitive products than its main competitors, also in terms of price, quality and functionality, or if there were delays in the development of new innovative products, the Group's market share could contract, with a negative impact on the Group's business outlook as well as its operating results and/or financial situation. Risks and uncertainties connected to goodwill and assets with an indefinite life The Group carries out impairment tests on goodwill and other intangible assets with an indefinite useful life (trademarks), at least annually and during the course of the year if there are indications of loss in value. The test requires an estimate of the value in use of the cash generating unit to which the goodwill and other intangible assets with an indefinite useful life are attributed, based in turn on the estimated expected cash flows of the unit and on the discounting of these flows at an appropriate rate. In view of the general macroeconomic picture and the key sectors in which the Group operates, there is intrinsic uncertainty in estimating the cash flows used to test the assets for impairment. This uncertainty could give rise to the risk of failure to write down goodwill and intangible assets with an indefinite useful life, due to possible overestimation of future cash flows. Risks connected with the performance of the Group's operating results This risk factor brings out the risks connected with investment in the Company's capital in consideration of the performance of the Group's operating result in recent years and of current conditions in certain markets. It is difficult to foresee the Group's future performance in consideration of the sectors in which it operates. It is however evident that every external event, such as a significant drop in one of the major markets of relevant, the volatility of financial markets and the resulting deterioration of the capital market, the increase in cost of raw materials, unfavourable interest and exchange rate fluctuation, government policies, etc., might have a negative impact on the sectors in which the Group operates and negatively affect its prospects and activity, as well as affect its operating and financial results. The profitability of the Group's activities is also subject to risks tied to the fluctuation of interest rates, solvency and ability of the commercial counterparties to finance themselves, as well as to the overall economic conditions of the countries where the Group operates.

Management report at 31 December 2021 Eurotech _________________________________________________________________________________________________________________________________________________________________________________________________________________________
33
Cyber Security Risk The risk of cyber security is represented by the possibility that cyber-attacks compromise company information systems, with the main consequences being the theft of sensitive information (including company know-how), the interruption of services provided with both economic and reputational consequences. The consequences deriving from a cyber-attack could concern: - the loss of confidentiality, i.e. the intentional or accidental disclosure of confidential information, which may result in losses for the Eurotech Group in terms of competitive advantage, damage to its image and reputation and legal and economic impacts (e.g. sanctions) due to failure to compliance with regulatory and/or contractual obligations; - the loss of integrity and availability of the information and systems supporting the business, which may result in a loss of profit due to the non-provision of services and/or damage to company assets.
Disclosure on the environment and personnel
Although the Group does not carry out activities that could impact local areas or the environment, it has always tried to operate in line with national and international best practice, in accordance with the approaches of risk prevention and reducing and minimising environmental impacts. The Eurotech Group has always paid close attention and been highly committed to the topic of employee safety, spreading a culture of safety within the organisation, minimising risk exposure in every activity and conducting activities to control, prevent and protect against risk exposure. There have been no major work-related accidents at the Eurotech Group, and there is currently no risk of work-related illness.
Disclosure on sovereign exposure
Pursuant to CONSOB Communication no. DEM/11070007 of 5 August 2011 (a continuation of ESMA document no. 2011/266 of 28 July 2011) relating to disclosure in financial reports of the exposure of listed companies to sovereign debt, note that the Group does not hold sovereign debt securities.
Process of simplifying the standards based on CONSOB resolution no. 18079/2012
Pursuant to Art. 3 of CONSOB Resolution no. 18079 of 20 January 2012, Eurotech adheres to the simplification procedure provided for by Arts. 70, paragraph 8, and 71, paragraph 1-bis of the Regulations adopted by CONSOB with its resolution no. 11971 of 14 May 1999 as amended and supplemented, therefore benefiting from the right to derogate from the obligations to disclose information documents provided for by Annex 3B of the aforesaid CONSOB Regulation at the time of significant transactions concerning mergers, spin-offs, increases in capital by way of contributions in kind, purchases and sales.

Management report at 31 December 2021 Eurotech _________________________________________________________________________________________________________________________________________________________________________________________________________________________
34
Events after the reporting date
The developments of the COVID-19 pandemic and its variants, as well as the ongoing war in Europe, continues to be monitored to understand how any prolonged effects may affect the company's business. The Group has no economic significance in the territories involved in the current war conflict. In any case, the sound financial situation of the Group, the consolidated relationships with primary customers as well as the technology sector in which the company operates suggest that there are sufficient elements not to consider the Group's business continuity affected. There are no further events to note after the reporting date.
Report on corporate governance and ownership structure
The Report on Corporate Governance and Ownership Structure pursuant to art. 123-bis, paragraphs 1 and 2 of Legislative Decree no. 58 of 24 February 1998, as subsequently amended and supplemented, is contained in a separate report from the Management Report, which is published together with the latter on Eurotech's website (www.eurotech.com, Investor section).
Off-statement of financial position agreements
The information required by Art. 2427, paragraph 1(9) of the Italian Civil Code is hereby given that the Group has no agreements not disclosed in the Statement of financial position.
Subsidiaries created and regulated according to the law of countries outside the European Union
The Board of Directors hereby declares that conditions for listing exist pursuant to Art. 36 of CONSOB Regulation no. 16191/2007 (the “Stock Market Regulation”). In this regard, note that at 31 December 2021 the subsidiaries created and regulated under the laws of countries outside the European Union, pursuant to Art. 36, paragraph 2 of the above Regulation, are the US companies Eurotech Inc. and E-Tech USA Inc. and the Japanese company Advanet Inc. and the British company Eurotech Ltd. and that the requirements set out in paragraph 1 of said article are met for these subsidiaries. In accordance with Art. 15, paragraph 1 of CONSOB Regulation no. 16191/2007 (as amended by CONSOB Resolution no. 20249 of 28 December 2017, effective from 3 January 2018) it is acknowledged that the information flows provided by the Extra-EU subsidiaries, set forth in the aforementioned legislation, are adequate to regularly provide the Company with the economic, equity and financial data necessary for the preparation of the consolidated financial statements. Specifically, it should be noted that at 31 December 2021 the subsidiaries to which these provisions apply are those listed in the previous paragraph.

Management report at 31 December 2021 Eurotech _________________________________________________________________________________________________________________________________________________________________________________________________________________________
35
Competitive scenario, outlook and future growth strategy
Despite the economic situation related to the COVID-19 pandemic, the integration and the strengthened relations between the Group’s various companies, the global positioning of individual subsidiaries, as well as the Group’s statement of financial position and financial solidity, the outlook for 2022 and the years to come is positive, although uncertainties that arise from time to time in the market conditions in certain sectors persist. The Group will also pursue strategic development in 2022, along guidelines outlined in the previous years. The implementation of the strategic plan includes specifically the following actions:
• focus on markets that combine a larger size and a higher growth rate (CAGR) over the next 5 years;
• address applications in difficult environments or with high reliability requirements, which require more rugged solutions;
• strengthen commercial activities, particularly with regard to indirect sales channels along with direct ones;
• focus on vertical markets and sectors in which IT-OT integration is most valued; • create growth both organically and through external lines; • leverage both global and local accelerating factors and forces of change:
o Repatriation; o 5G; o New & smart energy; o Automation; o Recovery Plans

Accounting schedules for the Consolidated Financial Statements at 31 December 2021 Eurotech _________________________________________________________________________________________________________________________________________________________________________________________________________________________
0
Consolidated financial statements at 31 December 2021 prepared according to international accounting standards
Consolidated statement of financial position
Notes 31.12.2021 of which
related 31.12.2020 of which related
(€ '000)
ASSETS Intangible assets 1 88,043 86,775 Property, plant and equipment 2 5,229 6,468 Investments in other companies 3 542 533 Deferred tax assets 31 6,504 7,478 Medium/long-term loans allowed to affiliates companies and other Group companies 32 62 62 57 57
Other non-current assets 4 620 661 Total non-current assets 101,000 101,972 Inventories 5 17,646 17,393 Trade receivables 6 11,280 1 16,441 Income tax receivables 7 801 900 Other current assets 8 2,130 1,665 Other current financial assets 10 123 2 125 1
Derivative instruments 4 - Cash & cash equivalents 9 31,704 41,222 Total current assets 63,688 77,746
Non-current assets classified as held for sale 2 365 - Total assets 165,053 179,718
LIABILITIES AND EQUITY Share capital 8,879 8,879 Share premium reserve 136,400 136,400 Other reserves (34,843) (26,415) Group shareholders' equity 12 110,436 118,864 Equity attributable to minority interests 12 - - Total Shareholders' equity 12 110,436 118,864 Medium/long-term borrowing 14 17,535 23,874 Employee benefit obligations 15 2,844 2,918 Deferred tax liabilities 31 3,200 3,166 Other non-current liabilities 17 1,477 1,342 Total non-current liabilities 25,056 31,300 Trade payables 18 13,005 487 10,647 345
Short-term borrowing 14 8,137 8,901 Derivative instruments 34 11 81 Income tax liabilities 7 215 810 Other current liabilities 19 8,193 9,115 Total current liabilities 29,561 29,554 Total liabilities 54,617 60,854 Total liabilities and equity 165,053 179,718

Accounting schedules for the Consolidated Financial Statements at 31 December 2021 Eurotech _________________________________________________________________________________________________________________________________________________________________________________________________________________________
1
Consolidated income statement
Notes 31.12.2021 of which
non-recurring
of which related 31.12.2020 of which
related (€ '000)
Revenues from sales of products and services F 63,148 11 69,259 3 Other revenues 26 584 379
Costs of materials 21 (33,670) (32,741) - Service costs 23 (13,623) (1,357) (974) (12,150) (421) Leasing & hire costs (386) (404) Payroll costs 24 (20,721) (488) (20,095) Other provisions and other costs 25 (1,384) (577) (1,099) Cost adjustments for in-house generation of non-current assets 27 3,305 3,483 Depreciation & amortisation 28 (4,574) (4,042) Asset impairment 28 (266) (61) (151) Operating profit (7,587) (2,483) 2,439 Subsidiaries management 30 (3) 61 Finance expense 29 (1,295) (1,461) Finance income 29 896 1 793 4 Profit before taxes (7,989) 1,832 Income tax 31 (2,419) (1,700) Net Profit (loss) (10,408) 132
Minority interest - -
Group net profit (loss) for period (10,408) 132 Base earnings (losses) per share 13 (0.294) 0.004 Diluted earnings (losses) per share 13 (0.294) 0.004

Accounting schedules for the Consolidated Financial Statements at 31 December 2021 Eurotech _________________________________________________________________________________________________________________________________________________________________________________________________________________________
2
Consolidated statement of comprehensive income
(€ '000) Notes 31.12.2021 31.12.2020
Net profit (loss) before minority interest (A) (10,408) 132
Other elements of the statement of comprehensive income
Other comprehensive income to be reclassified to profit or loss insubsequent periods:
Net profit/(loss) from Cash Flow Hedge 34 75 (37) Tax effect - -
75 (37) Foreign balance sheets conversion difference (1,173) (2,767) Exchange differences on equity investments in foreign companies 12 2,877 (3,453) Tax effect - -
2,877 (3,453) After taxes net other comprehensive income to be reclassified to profit or loss in subsequent periods (B)
1,779
(6,257)
Items not to be reclassified to profit or loss in subsequent periods: Actuarial gains/(losses) on defined benefit plans for employees 15 17 (152) Tax effect 2 43
19 (109)
After taxes net other comprehensive income not being reclassified to profit orloss in subsequent periods (C)
19
(109)
Comprehensive net result (A+B+C)
(8,610)
(6,234)
Comprehensive minority interest
-
-
Comprehensive Group net profit (loss) for period
(8,610)
(6,234)

Accounting schedules for the Consolidated Financial Statements at 31 December 2021 Eurotech _________________________________________________________________________________________________________________________________________________________________________________________________________________________
3
Consolidated statement of changes in shareholders' equity
(€ '000) Notes Share
capital Legal
reserve
Share premium
reserve Shares
Conversion reserve
Other reserves
Cash flow
hedge reserve
Actuarial gains/(losse
s) on defined benefit plans
reserve
Exchange rate
differences reserve
Treasury shares
Profit (loss) for
the period
Group shareholders'
equity
Equity attributable to Minority
interest
Total shareholders
' equity
Balance as at 31 December 2019 8,879 1,776 136,400 14,224 (58,907) (44) (531) 4,650 (1,033) 19,242 124,656 - 124,656
2019 Result allocation - - - - 19,242 - - - - (19,242) - - -
Profit (loss) as at December 31, 2020 - - - - - - - - - 132 132 - 132
Comprehensive other profit (loss):
- Hedge transactions 34 - - - - (37) - - - - (37) - (37)
- Actuarial gains/(losses) on defined benefit plans for employees 15 - - - - - - (109) - - - (109) - (109)
- Foreign balance sheets conversion difference - - - (2,767) - - - - (2,767) - (2,767)
- Exchange differences on equity investments in foreign companies 12 - - - - - - - (3,453) - - (3,453) - (3,453)
Total Comprehensive result - - - (2,767) - (37) (109) (3,453) - 132 (6,234) - (6,234)
Performance Share Plan 16 - - - - 91 - - - 351 - 442 - 442
Balance as at 31 December 2020 8,879 1,776 136,400 11,457 (39,574) (81) (640) 1,197 (682) 132 118,864 - 118,864
(€ '000) Notes Share
capital Legal
reserve
Share premium
reserve Shares
Translation reserve
Other reserves
Cash flow hedge
reserve
Reserve for actuarial
(loss)/profit on defined-
benefit plans for
employees
Reserve for exchange
differences Treasury
shares
Profit (loss) for the period
attributable to the Group
Group shareholders'
equity
Equity attributable to Minority
interest
Total shareholders'
equity
Balance as at 31 December 2020 8,879 1,776 136,400 11,457 (39,574) (81) (640) 1,197 (682) 132 118,864 - 118,864
2020 Result allocation - - - - 132 - - - - (132) - - -
Result at 31 December 2021 - - - - - - - - - (10,408) (10,408) - (10,408)
Comprehensive other profit (loss):
- Hedge transactions 34 - - - - 75 - - - - 75 - 75
- Actuarial gains/(losses) on defined benefit plans for employees 15 - - - - - - 19 - - - 19 - 19
- Foreign balance sheets conversion difference - - - (1,173) - - - - (1,173) - (1,173)
- Exchange differences on equity investments in foreign companies 12 - - - - - - - 2,877 - - 2,877 - 2,877
Total Comprehensive result - - - (1,173) - 75 19 2,877 - (10,408) (8,610) - (8,610)
Performance Share Plan 16 - - - - (289) - - - 471 - 182 - 182
Balance as at 31 December 2021 8,879 1,776 136,400 10,284 (39,731) (6) (621) 4,074 (211) (10,408) 110,436 - 110,436

Accounting schedules for the Consolidated Financial Statements at 31 December 2021 Eurotech _________________________________________________________________________________________________________________________________________________________________________________________________________________________
4
Consolidated cash flow statement
CONSOLIDATED CASH FLOW STATEMENT
Notes at December 31, 2021
of which related
at December
31, 2020
of which related
(€ '000)
CASH FLOWS GENERATED BY OPERATIONS:
Group net profit (loss) for period (10,408) 132 Adjustments to reconcile net profit with cash and
cash equivalents generated (used) by operations:
Depreciation & amortization intangible assets, property, plant and equipment 28
4,840
4,193
Write-downs of receivables 6 74
98
Interest income 29 (1)
(5)
Interest expense 29 489
485
Capital gain on disposal of business units and equity investments 30 -
(61)
Income taxes (paid) get (888)
(1,336)
Income taxes of the period 31 2,419
1,700
Stock Grant expenses 16 182
442
Provision (use of) cumulative inventory write-down 5 (54)
(183)
Provision for (use of) long-term employee severance indemnities 15 (55)
205
Provision for (use of) risk provision 17 135
282
Changes in current assets and liabilities:
Trade receivables 6 5,273 (1) (5,090) (1) Other current assets 7/8 (342)
(198)
Inventories and contracts in progress 5 83
3,067
Trade payables 18 2,317 142 (504) 345 Other liabilities 7/19 (785)
161
Total adjustments and changes 13,687 3,256
Cash flows generated (used) in operations 3,279 3,388
CASH FLOWS FROM INVESTMENTS ACTIVITIES:
Sales of tangible and intangible assets 1/2 17
2
Interest income 29 1
5
Purchase of intangible fixed assets 1 (3,673)
(4,270)
Achievement from investments in other companies 2 (1,653)
(506)
Income from equity investments in other companies -
80
Decreases (increases) in other financial assets 10 2
(17)
Net investments in long-term investments and non-current assets 32
(386)
Cash generated (absorbed by) from assets classified as held for sale
-
-
Cash flow generated (used) in investment activities (5,274) (5,092)
CASH FLOWS FROM FINANCING ACTIVITIES:
Loans taken 14 2,301
20,972
(Increases) decreases of loans to other Group companies 32 -
24 24 Interest paid 29 (489)
(485)
(Repaid) loans short and medium/long term 14 (9,871)
(7,055)
Cash flow generated (absorbed) by financial assets
(8,059) 13,456 Net foreign exchange difference 536
(1,217)
Increase (decrease) in cash and cash equivalents (9,518) 10,535
Opening amount in cash & cash equivalents 9 41,222 30,687
Cash & cash equivalents at end of period 9 31,704 41,222

Explanatory notes to the Consolidated Financial Statements at 31 December 2021 Eurotech _________________________________________________________________________________________________________________________________________________________________________________________________________________________
5
Explanatory notes to financial statements
A – Corporate information
The publication of the consolidated financial statements of Eurotech S.p.A. for the financial year ended 31 December 2021 was authorised by resolution of the Board of Directors on 15 March 2022. Eurotech S.p.A. is a joint stock company incorporated and domiciled in Italy. The Group has its registered office in Amaro (Udine), Italy. Eurotech is a group active in the research, development, and marketing of miniaturised computers and high-performance computers featuring high computing capacity. Moreover, within this business line it provides complete solutions or blocks of solutions and products for the Internet of Things through intelligent devices and an intelligent proprietary connectivity and communications platform. For more information, see Note F.
B – Reporting policies and IFRS compliance
The consolidated financial statements were prepared in accordance with International Financial Reporting Standards (IFRSs) issued by the International Accounting Standards Board (IASB) and approved by the European Commission pursuant to Art. 6 of EC Regulation no. 1606/2002 of the European Parliament and European Council of 19 July 2002 by 31 December 2021, as well as to the measures enacted to implement Art. 9 of Italian Legislative Decree no. 38/2005. IFRSs include all international accounting standards that have been revised (IAS) and all the interpretations of the International Financial Reporting Interpretation Committee (IFRIC), formerly the Standing Interpretations Committee (SIC). The consolidated financial statements are based on recognition at cost, except for derivative financial instruments and for the equity investments in other companies recognised at fair value, as well as in compliance with the general principles of going concern, economic accrual, consistent presentation and comparability of information. The Group has assessed that, though the global economic environment is difficult, there are no material uncertainties (as these are defined in paragraph 25 of IAS 1) with regard to the business as a going concern, also in consideration of the actions taken to address this situation, industrial flexibility, the existing order portfolio and the opportunities available. The Group applied the content of CONSOB Resolution no. 15519 of 27 July 2006 on the subject of financial statements. The accounting standards applied are the same as those used at 31 December 2020, except for the following new or revised IFRSs or IFRICs, applied for the first time by the Group as of 1 January 2021. The standards, amendments and interpretations that became effective on 1 January 2021 are briefly described below. The application of these standards had no particular impact on the consolidated financial statements of the Group since they regulate matters not present, or affect only financial reporting: Interest rate benchmark reform - Amendments to IFRS 9, IAS 39, IFRS 7, IFRS 4 and IFRS 16 – On 14 January 2021 it was published in the Official Gazette, Regulation (EU) 2021/25 of the Commission dated 13 January 2021, which adopts the reform of interest rate benchmarks, the amendments of which provide for a specific accounting treatment to allocate over time the changes in value of financial instruments or leases due to the replacement of the reference index for determining interest rates. The application of these amendments did not have a significant impact on these consolidated financial statements. On 31 March 2021, the IASB has issued the document "Covid-19-Related Rent Concessions beyond 30 June 2021" (Amendments to IFRS 16) with which it extends (to 30 June 2022) the period of application of the amendment to IFRS 16, which was issued in 2020. The practical expedient makes it easier to

Explanatory notes to the Consolidated Financial Statements at 31 December 2021 Eurotech _________________________________________________________________________________________________________________________________________________________________________________________________________________________
6
account for any benefits from lease agreements, such as temporary reduction or suspension of instalments, received by lessees during the pandemic. The change is effective as from 1 April 2021. The application has no particular effect on the Group's annual report. The new standards and interpretations already issued and endorsed by the European Union, applicable to financial statements for years beginning after 1 January 2021, are illustrated below. The principles and interpretations, which by their nature cannot be adopted by the company, are excluded from the list. Amendments to IFRS 3 Business Combinations - The purpose of the amendments is to update the reference in IFRS 3 to the Conceptual Framework in its revised version, without making any changes to the provisions of IFRS 3. Amendments to IAS 16 Property, Plant and Equipment - The purpose of the amendments is not to allow the amount received from the sale of goods produced in the test phase of the activity to be deducted from the cost of property, plant and equipment. These sales revenues and the related costs shall therefore be recognised in the income statement. Amendments to IAS 37 Provisions, Contingent Liabilities and Contingent Assets - The amendment clarifies that in the estimate of the possible cost of a contract, all costs directly attributable to the contract must be considered. Annual Improvements 2018-2020 - The amendments were made to IFRS 1 First-time Adoption of International Financial Reporting Standards, IFRS 9 Financial Instruments, IAS 41 Agriculture and the Illustrative Examples of IFRS 16 Leases. The new standards, amendments and interpretations already issued but not yet endorsed by the European Union and applicable to the financial statements for years beginning after 1 January 2021 are also briefly illustrated. The principles and interpretations, which by their nature cannot be adopted by the company, are excluded from the list. IAS 1 – Presentation of Financial Statements - On 23 January 2020, the IASB issued amendments to IAS 1 – Presentation of Financial Statements to clarify the requirements for classifying liabilities as current or non-current. These amendments will become effective from 1 January 2023, following deferment of the date of entry into force due to the COVID-19 pandemic. On 12 February 2021, the IASB published the Amendments to IAS 1 Presentation of Financial Statements and IFRS Practice Statement 2: "Disclosure of Accounting policies". The document aims to help companies decide which accounting policies to disclose in their financial statements. The changes will take effect from 1 January 2023. IAS 8 - Accounting standards, changes in accounting estimates and errors - On 12 February 2021, the IASB published the “Definition of Accounting Estimates (Amendments to IAS 8)”. The definition of change in accounting estimates is replaced by a definition of accounting estimate. Under the new definition, accounting estimates are "monetary amounts reported in the financial statements subject to valuation uncertainty" and that a change in the accounting estimate resulting from new information or new developments is not the correction of an error. The changes will take effect from 1 January 2023. IAS 12 - Income taxes - On 7 May 2021 the IASB published the Amendments to IAS 12 Income Taxes: “Deferred Tax related to Assets and Liabilities arising from a Single Transaction”. The document aims to clarify the accounting of deferred taxes on particular transactions such as leases and decommissioning obligations. The changes will take effect from 1 January 2023. The consolidated financial statements were drafted in Euro, rounding amounts to the nearest thousand unless otherwise indicated. They consist of the Statement of financial position, Income statement,

Explanatory notes to the Consolidated Financial Statements at 31 December 2021 Eurotech _________________________________________________________________________________________________________________________________________________________________________________________________________________________
7
Statement of comprehensive income, Statement of changes in shareholders’ equity, Cash flow statement, and the following Explanatory Notes. The data used for consolidation have been taken from the income statements and statement of financial positions prepared by the Directors of individual subsidiaries. These figures have been appropriately amended and restated as necessary to align them with international accounting policies and with uniform Group-wide classification policies. Going concern The directors of the Group have analysed various internal and external factors to identify any risk on going concern. By way of example, the business plans approved by the individual group companies were assessed, the effect of the significant increase in orders compared to last year was verified, the effect of current financial availability was assessed, which allows the investments necessary to support the corporate strategies to be sustained, and the supply chain risk was also considered in relation to the contingent situation of the shortage of electronic components, which in any case is continuously monitored by a specific task force also in direct collaboration with some of the main customers. The analysis did not identify any significant risks on going concern.
C – Discretionary evaluations and relevant accounting estimates
The preparation of the Group’s financial statements requires all directors to make subjective assessments, estimates and assumptions that may affect the value of revenues, expenses, assets, liabilities, their disclosure and contingent liabilities at the reporting date. However, uncertainties about such assumptions and estimates may produce effects, that may require significant adjustments to the accounting value of said assets and/or liabilities. Discretionary evaluations In applying Group accounting policies, directors made decisions based on the following discretionary evaluations (not including those involving estimates) with a significant effect on the values posted in the financial statements: Recognition of revenues - Sale of components According to directors, sales of components made by the Group to outsourcers (which use these components in their operations and subsequently resell their products to the Group) imply a continued relationship with the transferred assets and do not give rise to collection of the contracted consideration. Consequently, on the basis of IFRS 15, these transactions are not recognised as sales. Uncertainty in the estimates The estimates at year-end are reviewed periodically and could lead to significant adjustments in the carrying value of the assets and liabilities within the subsequent financial period. Estimates are used to recognise: Impairment of non-financial assets At every reporting date, the Group tests for impairment of all non-financial assets. Specifically, goodwill and other intangible assets with an indefinite useful life (trademarks) are submitted to review at least annually and during the year to assess for impairment; this assessment requires the Group to make an estimate of the value in use of the cash-generating unit to which goodwill and other intangible assets with a definite useful life are attributed, in turn based on the estimated cash flows expected from the unit, time-discounted at an appropriate rate. At 31 December 2021, the book value of goodwill was €69,721 thousand (2020: €69,219 thousand). Further details are provided in Note 1.

Explanatory notes to the Consolidated Financial Statements at 31 December 2021 Eurotech _________________________________________________________________________________________________________________________________________________________________________________________________________________________
8
Other non-financial assets are annually tested for impairment when there is evidence that the assets may be impaired. In preparing calculations to determine value in use, directors need to estimate expected cash flows from operations or from the cash-generating unit and choose a discount rate that can adequately calculate the present value of these cash flows. Further details and a sensitivity analysis of key assumptions are provided in Note 1. Deferred tax assets Deferred tax assets are recognised against all temporary differences and tax losses carried forward, to the extent that future taxable profits are likely that can absorb said temporary differences or that can use said tax losses. The Board of Directors is required to make a significant discretionary evaluation to determine the amount of deferred taxes that can be posted. Directors have to determine the most likely timing and amount of future taxable profits and a planned strategy of future taxes payable. At 31 December 2021, the unrecognised tax losses carried by the Parent Company and the Allowance for Corporate Equity (ACE) on the basis of the tax consolidation were estimated at €36.6 million (2020: €29.6 million), which can be carried forward indefinitely. In the Group as a whole, unrecognised tax losses and ACE came to €41.8 million (2020: €34.7 million), which can be carried forward indefinitely. Development costs Development costs are capitalised as per the accounting standard described in Note E. Initial cost capitalisation is based on the Directors’ assessment of the technical and economic feasibility of the project, normally when the project itself has reached a certain stage in the development plan and it is likely that the asset will generate future economic benefits. In order to determine capitalised amounts, Directors need to make assumptions about expected future cash flows from fixed assets, discount rates to be applied and periods in which benefits will accrue. At 31 December 2021, the best estimate of the book value of capitalised development costs was €8,256 thousand, of which €3,785 thousand in progress (2020: €7,369 thousand, of which €3,762 thousand in progress). Other items subject to estimates Estimates are also used to recognise provisions for risks on receivables, for inventory obsolescence and slow movement or impairment, amortisation and depreciation, write-downs of assets, employee benefits, taxes and provisions for risks and charges, to determine any total costs of jobs and the respective state of progress, in order to record deferred tax assets and allocate the purchase price of business acquisitions. Moreover, with regard to the estimates on the effects of COVID-19, the company has taken the necessary steps to keep itself and the Group's companies safe but any new worsening of the pandemic also determined by the development of uncontrolled variants could have an impact in economic, equity and financial terms on the Group, the effects of which, due to the uncertainty of the event, are currently not quantifiable.
D – Scope of consolidation
The consolidated financial statements include the annual financial statements of the Parent Company, Eurotech S.p.A., and the Italian and foreign subsidiaries in which Eurotech directly or indirectly (through subsidiaries and affiliates) exercises control since it holds valid rights giving it the current capacity to manage significant assets, i.e. the assets that significantly affect returns of the investee. The companies included in the basis of consolidation on a line-by-line basis at 31 December 2021 are as follows:

Explanatory notes to the Consolidated Financial Statements at 31 December 2021 Eurotech _________________________________________________________________________________________________________________________________________________________________________________________________________________________
9
Company name Registered offices Share capital Group share Parent company Eurotech S.p.A. Via Fratelli Solari, 3/A – Amaro (UD) EUR 8,878,946 Subsidiaries consolidated line-by-line Aurora S.r.l. Via Fratelli Solari, 3/A – Amaro (UD) EUR 10,000 100.00% EthLab S.r.l. Via Dante, 300 – Pergine Valsugana
(TN) EUR 115,000 100.00%
Eurotech Inc. Columbia – MD (USA) USD 26,500,000 100.00% Eurotech Ltd. Cambridge (UK) GBP 33,333 100.00% E-Tech USA Inc. Columbia – MD (USA) USD 8,000,000 100.00% Eurotech France S.A.S. Vénissieux (France) Euro 795,522 100.00% I.P.S. Sistemi Programmabili S.r.l. Via Piave, 54 – Caronno Varesino
(VA) Euro 51,480 100.00%
Advanet Inc. Okayama (Japan) JPY 72,440,000 90.00% (1) (1) Officially, the Group owns 90% of the company, but as Advanet holds 10% of the share capital in the form of treasury shares, it is fully
consolidated.
Affiliates consolidated at equity Rotowi Technologies S.p.A. in liquidation (formerly U.T.R.I. S.p.A.)
Via Carlo Ghega, 15 – Trieste 21.31%
Other smaller companies valued at fair value Kairos Autonomi Inc. Sandy – UT (USA) 19.00% Interlogica S.r.l. Mestre (VE) 10.00%
There were no changes with regard to subsidiaries and affiliates compared to 31 December 2020. The consolidated financial statements at 31 December 2021 did not contain significant transactions or unusual events apart from what is reported in the explanatory notes to the financial statements.
E – Accounting standards and policies
Accounting basis The Consolidated Financial Statements consist of the Income Statement, the Statement of Financial Position, the Statement of Changes in Shareholders' Equity, the Cash Flow Statement and the Explanatory Notes. In the Statement of Financial Position, assets and liabilities are classified according to the "current/non-current" criterion, with specific separation of the assets held for sale and the liabilities associated with assets held for sale, if any. Current assets, including cash and cash equivalents, are those held to be realised, sold or consumed within the normal operating cycle of the Group or within the twelve months following the end of the year. Current liabilities are those whose extinction is expected within the normal operating cycle of the Group or within the twelve months after the end of the year. The Income Statement is classified based on the nature of the costs, while the Cash Flow Statement is presented using the indirect method. Consolidation policies The Financial Statements of the subsidiaries are drawn up using the same accounting standards as for the Parent Company; any consolidation adjustments are carried out to make consistent the items affected by the application of different accounting standards. All intragroup balances and transactions, including any unrealised profits deriving from relationships between Group companies, are completely

Explanatory notes to the Consolidated Financial Statements at 31 December 2021 Eurotech _________________________________________________________________________________________________________________________________________________________________________________________________________________________
10
derecognised. The portion pertaining to the Group of unrealised profits and losses with affiliates is derecognised. Subsidiaries are fully consolidated from the acquisition date, i.e. the date at which the Group acquires control, and cease to be consolidated on the date at which control is transferred outside the Group. Losses are attributed to minority interests, if there are any, even when this gives rise to a negative balance for minority shareholdings. Changes in the equity interest of the Parent Company in a subsidiary that do not involve the acquisition/loss of control are booked as equity transactions. Specifically, in the case of acquisitions of minority interests, the difference between the price paid and the book value of the portion of the net assets purchased is posted directly to equity. If the Parent Company loses control of a subsidiary, it:
- derecognises the subsidiary’s assets (including any goodwill) and liabilities; - derecognises cumulative exchange rate differences recognised in equity; - recognises the fair value of the payment received; - recognises the fair value of any equity interest retained in the former subsidiary; - recognises any profit or loss in the income statement; - restates the portion held by the Parent Company of the components previously posted to the
statement of comprehensive income to the income statement or to retained earnings, as appropriate.
Conversion of foreign currency items and financial statements from non-euro currency The Consolidated Financial Statements are presented in Euro, which is the functional and presentation currency used by the Group. Each Group entity determines its own functional currency, which is used to value the items in the individual financial statements. Transactions in foreign currency are initially recognised at the exchange rate (in relation to the functional currency) in force at the transaction date. Monetary assets and liabilities denominated in foreign currency are converted to the functional currency at the exchange rate in force at the reporting date. All exchange rate differences are posted to the income statement, except for differences deriving from loans in foreign currency that form part of a net investment in a foreign company, which are recognised directly in shareholders' equity until the net investment is disposed of, at which time it is recognised in the income statement. Taxes and tax receivables attributable to exchange rate differences on these loans are also posted directly to shareholders' equity. Non-monetary items valued at historic cost in foreign currency are translated using the exchange rates in force at the date at which the transaction is initially recognised. Non-monetary items posted at fair value in foreign currency are converted using the exchange rate in force at the date of calculation of this value. Any goodwill deriving from the acquisition of a foreign operation, and any changes in fair value that change the book values of the assets and liabilities deriving from the acquisition of this foreign operation, are booked as assets and/or liabilities of the foreign operation. These values are therefore expressed in the functional currency of the foreign operation and are translated at the exchange rate in force at the reporting date. The functional currency used by the US subsidiaries Eurotech Inc. and E-Tech USA Inc. is the US dollar; the functional currency used by the UK subsidiary Eurotech Ltd. is the UK pound; and the functional currency used by the Japanese subsidiary Advanet Inc. is the Japanese yen.

Explanatory notes to the Consolidated Financial Statements at 31 December 2021 Eurotech _________________________________________________________________________________________________________________________________________________________________________________________________________________________
11
At the reporting date, the assets and liabilities of these subsidiaries were translated to the presentation currency of the Eurotech Group (the Euro) at the exchange rate in force on this date, while the income statement was converted using the average exchange rate for the year. Exchange rate differences arising from the conversion of income statement items at a different rate from that in force at the reporting date, and those arising from the translation of opening shareholders' equity at a different rate from that in force at the reporting date, are recognised directly in shareholders' equity and presented separately in a dedicated reserve. When a foreign company is disposed of, the cumulative exchange rate differences recognised in shareholders' equity relating to that particular foreign company are posted to the income statement. The schedule below shows the exchange rates used, as issued by the Italian Foreign Exchange Bureau:
Accounting policies The accounting standards and policies applied to draft the Consolidated Financial Statements for the year ended 31 December 2021 are shown below. Intangible assets Intangible assets acquired separately are initially capitalised at cost, while assets acquired through business combinations are booked at fair value. After initial recognition, intangible assets are booked net of accumulated amortisation and accumulated value losses. Intangible assets produced in-house, except for development costs, are not capitalised and are reported in the income statement in the year in which they are incurred. The useful life of intangible assets is valued as definite or indefinite. Intangible assets with a definite useful life are amortised throughout their useful life and submitted to congruence tests whenever there are indications of possible impairment. The period and method of amortisation to be applied are re-examined at the end of each financial year or more frequently as necessary. Changes in the expected useful life and the methods with which future economic benefits related to intangible assets are achieved by the Group, are posted by modifying the period or method of amortisation and treated as modifications of the accounting estimates. Amortisation allowances of intangible assets with definite useful life are reported in the income statement in the cost category matching the function of the intangible asset. Intangible assets with indefinite useful life are submitted to annual impairment testing on an individual or cash-generating unit basis. No amortisation is reported for these assets. Profits or losses arising from the sale of an intangible asset are measured as the difference between the net proceeds of the sale and the book value of the intangible asset and are recognised in the income statement when the asset is derecognised.
Currency
Average 2021
As of December 31,
2021
Average 2020
As of December 31,
2020
British pound sterling 0.85960 0.84028 0.88970 0.89903
Japanese Yen 129.87671 130.38000 121.84576 126.49000
USA Dollar 1.18274 1.13260 1.14220 1.22710

Explanatory notes to the Consolidated Financial Statements at 31 December 2021 Eurotech _________________________________________________________________________________________________________________________________________________________________________________________________________________________
12
Business combinations and goodwill Business combinations from 1 January 2010 Business combinations are booked using the purchase method. The purchase cost is measured as the sum of the payment made at fair value at acquisition date and the amount of any minority interest in the acquiree measured at fair value. For every business combination, the acquirer must value any minority interest in the acquiree at fair value or in proportion to the share of the minority interest in the identifiable net assets of the acquiree. Acquisition costs are paid and classified in administrative expenses. When the Group acquires a business, it classifies or designates the financial assets acquired or liabilities assumed in accordance with the contractual terms and financial conditions and other pertinent conditions existing at acquisition date. This includes establishing whether an embedded derivative must be separated from the primary contract. If the business combination is carried out in more than one step, the acquirer recalculates the fair value of the equity interest previously held and valued using the equity method, and recognises any resulting profit or loss in the income statement. Any potential payment is recognised by the acquirer at fair value at acquisition date. Changes in the fair value of the potential payment classified as an asset or liability is recognised, pursuant to IFRS 9, in the income statement or as other components of comprehensive income. If the potential payment is classified in shareholders' equity, its value must not be recalculated until its extinction is booked against shareholders' equity. Goodwill is initially valued at cost, calculated as the excess between the sum of the payment made and the amount recognised for minority interests, and the identifiable assets acquired and liabilities assumed by the Group. If the payment is less than the fair value of the net assets of the acquired subsidiary, the difference is posted to the income statement. After initial recognition, goodwill is valued at the reduced cost of the accumulated impairment losses. For the purposes of the impairment test, goodwill acquired in a business combination is allocated, at acquisition date, to every Group cash-generating unit expected to benefit from the combination, aside from the fact that the other assets or liabilities of the acquired entity are assigned to these units. If goodwill is allocated to a cash-generating unit and the entity sells part of the assets of this unit, the goodwill associated with the asset sold must be included in the book value of the asset when calculating the gain or loss deriving from the disposal. The goodwill associated with the asset sold is calculated on the basis of the relative values of the asset sold and the portion retained by the cash-generating unit. Business combinations before 1 January 2010 Differences by comparison with the above policies are set out below. Business combinations were booked using the purchase method. Transaction costs directly attributable to the combination were regarded as part of the purchase cost. Minority interests were calculated according to the portion of the identifiable net assets of the acquiree pertaining to minorities. Business combinations carried out in stages were booked at separate times. Each new acquisition of shares did not affect the goodwill previously recognised. The potential payment was recognised if, and only if, the Group had a current obligation, and cash outflows were probable and the estimate could be reliably calculated. Subsequent changes to the potential payment were booked as part of goodwill. On first-time adoption of IFRS, the Group decided to not apply IFRS 3 – Business Combinations retroactively to acquisitions made before 1 January 2004; as a result, goodwill generated on acquisitions prior to the date of transition to IFRS was maintained at the previous value, determined according to Italian accounting standards, subject to testing and adjustment for impairment.

Explanatory notes to the Consolidated Financial Statements at 31 December 2021 Eurotech _________________________________________________________________________________________________________________________________________________________________________________________________________________________
13
Research and development costs
Research costs are recognised in the income statement at the time they are incurred. Development costs incurred with reference to a specific project are only capitalised when the Group can demonstrate (a) that it is technically practicable to complete the intangible asset so as to make it available for use or for sale; (b) that it intends to complete said asset for use or for sale; (c) the way in which it will probably generate future benefits; (d) the availability of technical, financial and all other resources needed to complete the asset; and (e) its ability to reliably determine the costs attributed to the asset throughout its development. Capitalised developed costs are amortised over the period in which all future expected revenues will occur. During the development period, the asset is re-examined annually to verify potential impairment. After the initial recognition, development costs are assessed at cost, minus any other amortisation or accumulated losses. Amortisation of the asset begins as soon as development is completed and the asset becomes available for use. If future economic benefits are no longer available, they will be written down in the year in which this occurs. All other development costs are reported in the income statement in the period they are incurred. Patents and trademarks
Patents have been granted by the competent body for a minimum of ten years with renewal option by the Group if the patent continues to produce utility over time. Trademarks acquired separately are initially recognised at cost inclusive of ancillary charges. Trademarks acquired through business combinations are recognised at their fair value measured at the acquisition date. Following initial recognition, trademarks are recorded at cost, net of accumulated amortisation and any accumulated impairment losses. Trademarks with a definite useful life recognised in the statement of financial position are amortised over a period of between 8 and 10 years and subject to impairment testing whenever a loss of value is indicated. Its useful life is reviewed on an annual basis. Trademarks with an indefinite useful life are not amortised but are subject to impairment testing at least annually. Registration costs in other countries of trademarks and patents developed internally are recorded in the income statement when they are incurred. Other intangible assets
The other intangible assets acquired or produced internally are recognised as assets in accordance with the provisions of IAS 38 – Intangible assets. Intangible assets with a definite useful life recognised within a business combination, such as customer relationships and order portfolios, are initially recognised at fair value at the date of acquisition, separately from goodwill, if this value can be reliably determined. After initial recognition, they are recognised net of related accumulated amortisation and of any impairment determined in the same way as for property, plant and equipment. Useful life is re-assessed annually, and any changes are applied prospectively as necessary.

Explanatory notes to the Consolidated Financial Statements at 31 December 2021 Eurotech _________________________________________________________________________________________________________________________________________________________________________________________________________________________
14
Gains or losses arising from the sale of an intangible asset are measured as the difference between the net revenues from the sale and the book value of the intangible asset and they are recognised in the income statement when the asset is derecognised. Property, plant and equipment The value of property, plant and equipment is stated at historical cost, including any direct ancillary charges for making the asset suitable for the use for which it was intended, increased, where relevant and in the case of current obligations, by the current value of the estimated cost for disposal or removal of the asset. If significant portions of these property, plant and equipment have different useful lives, these components are booked separately. Land, whether the site of buildings or free from construction, is not depreciated since it is considered to have an unlimited life. The value of a building, subject to revaluation in periods prior to 1 January 2004 (the date of transition to IFRS), is recognised according to fair value at the transition date and this value is the replacement cost starting from that date (deemed cost). Property, plant and equipment are listed net of respective accumulated depreciation and any impairment determined according to the methods described below. Depreciation is calculated on a straight-line basis, according to the estimated life of the asset for the company, which is re-examined annually and adjusted for changes on a case-by-case basis. The main technical depreciation rates used are based on the useful life of each individual item: Buildings 33 years Plant and machinery from 7 to 10 years Industrial and commercial equipment from 4 to 6 years Production equipment from 4 to 6 years Furniture and fixtures from 7 to 10 years Electronic office equipment from 3 to 5 years Automobiles and motor vehicles from 4 to 5 years The book value of property, plant and equipment is tested for impairment if events or situational changes indicate that the carrying value cannot be recovered. If there is such an indication and if the carrying value exceeds the estimated realisable value, the assets are written down to reflect their realisable value. The realisable value of property, plant and equipment is the higher of its net selling price and value in use. In determining value in use, estimated future cash flows are discounted to their current value using a pre-tax rate that reflects current market assessments of the time value of money and the risks specific to the asset. For assets that do not generate cash flows independently, the realisable value is determined in relation to the cash-generating unit to which the asset belongs. Impairment is booked in the income statement under amortisation, depreciation and write-downs. The initial value is reinstated if the causes of impairment in previous financial years are no longer valid. At the time of the sale or when future economic benefits no longer exist on the use of an asset, it is derecognised from the statement of financial position and related losses or gains (calculated as the differences between the sale price and the carrying value) are reported in the income statement in the year of its derecognition. The residual value of the asset, useful life and methods applied are reviewed annually and adjusted if necessary at the end of every financial year.

Explanatory notes to the Consolidated Financial Statements at 31 December 2021 Eurotech _________________________________________________________________________________________________________________________________________________________________________________________________________________________
15
Financial charges incurred for investments in assets for which there is generally a certain period of time to make the asset ready for use or sale (qualifying assets, pursuant to IAS 23 – Borrowing Costs) are capitalised and depreciated throughout the useful life of the class of assets to which they refer. All other financial charges are recognised in the income statement as they are incurred. Equity investments in affiliates Equity investments in affiliates, in which the Eurotech Group has significant influence, are valued using the equity method. The income statement reflects the Group share of the results of the associate. Equity investments in an associate are booked in the income statement at cost, increased by subsequent changes pursuant to acquisition of the Group share in the net assets of the associate, according to the equity method. Goodwill relating to the associate is included in the book value of the equity investment and is not subject to amortisation or to impairment testing. The Group share of the profits of the associate is recognised in the income statement. This share represents the profits of the associate attributable to shareholders, and therefore profits net of tax and the portions payable to the other shareholders of the associate. If an associate enters adjustments directly in shareholders' equity, the Group recognises its share and posts it, where applicable, in its statement of changes in shareholders’ equity. Gains and losses arising from transactions between the Group and the associate are derecognised in proportion to the investment in the associate. If the Group share of losses exceeds the carrying value of the equity investment, the latter is derecognised and the surplus is recorded in a special reserve in the amount in which the Group has legal or implicit obligations toward the subsidiary to cover its losses or, in any event, to make payments on its behalf. After applying the equity method, the Group assesses whether it is necessary to recognise a further impairment of its equity investment in the associate. The Group makes this assessment at every reporting date if there is objective evidence of impairment of the equity investment in the associate. If this is the case, the Group calculates the impairment as the difference between the recoverable value of the associate and the carrying value of the associate in its statement of financial position, recognising this difference in the income statement and classifying it under “Group share of the results of affiliates”. When significant influence over the associate has been lost, the Group calculates and recognises any residual equity investment at fair value. Any difference between the carrying value of the equity investment at the date of loss of significant influence and the fair value of the residual investment and of the payments received must be posted to the income statement. Affiliates end their financial year on the same date as the Group; when the accounting policies used do not comply with those used by the Group, they are adjusted at year-end to make them the same as those used by Group for transactions and events of the same nature and occurring in similar circumstances. Equity investments in other companies Financial assets constituting equity investments in companies that are not affiliates or joint ventures (generally with a percentage ownership of less than 20%) are called investments in other companies and form part of the category of financial assets measured at fair value, that normally corresponds, upon first recognition, to the consideration paid for the transaction, including the directly attributable transaction costs.

Explanatory notes to the Consolidated Financial Statements at 31 December 2021 Eurotech _________________________________________________________________________________________________________________________________________________________________________________________________________________________
16
Changes after measurement at fair value are recognised in the income statement (FVPL) or if an option provided for by the standard is exercised, in the statement of comprehensive income (FVOCI) under “Reserve instruments at FVOCI”. For equity investments measured at FVOCI, impairment is never recognised in the income statement, or the accumulated profits or losses if the equity investments are sold; the dividends distributed by the investee are recognised in the income statement only when:
- the Group obtains the right to receive the dividend payment; - it is probable that the financial benefits resulting from the dividend will accrue to the Group; - the amount of the dividend can be accurately measured.
Other non-current assets Receivables and other long-term financial assets held until expiration date are booked at cost, represented by the fair value of the initial amount given in exchange, increased by applicable transaction costs. The initial carrying value is subsequently adjusted to take account of capital refunds and any write-downs or amortisation of the difference between the repayment value and the initial posted value. Amortisation is charged according to the effective internal interest rate, which is the rate that equalises, at the time of their initial recognition, the current value of expected cash flows and the initial posted value (amortised cost method). Inventories Inventories, except for contracts in progress, are stated at the lower of the purchase or production cost and the estimated realisable value represented by the amount that the company expects to obtain from their sale in the course of normal operations. The cost of raw materials and finished products is calculated by applying the average weighted purchase cost for each transaction, including all ancillary purchase charges. The production cost of finished and semi-finished products comprises the direct cost of raw materials and labour plus a portion of general production expenses calculated according to standard production capacity, excluding any financial charges. Obsolete and/or slow-turnover inventories are written down, through the registration of a specific fund, based on their current potential use or on future realisation. The write-down is reversed in subsequent periods if the reason for maintaining it no longer exists. Financial assets The Group classifies financial assets on the basis of the categories identified by IFRS 9:
financial assets measured at amortised cost; assets measured at fair value through other comprehensive income (FVOCI); assets measured at fair value through profit or loss (FVTPL).
Financial assets measured at amortised cost The financial assets that meet the following requirements are classified in this category: (i) the asset is held within a business model whose objective is to hold assets in order to collect contractual cash flows; and (ii) the contractual terms of the financial asset give rise to cash flows that are solely payments of principal and interest on the principal amount outstanding. It mainly involves trade receivables and loans. With the exception of trade receivables that do not contain a significant financial component, the other receivables and loans are initially recognised at their fair value on the financial statements. On the other

Explanatory notes to the Consolidated Financial Statements at 31 December 2021 Eurotech _________________________________________________________________________________________________________________________________________________________________________________________________________________________
17
hand, trade receivables that do not contain a significant financial component are recognised at the price defined for the relative transaction (determined in accordance with the provisions of the IFRS 15 "Revenue from Contracts with Customers"). When the assets are subsequently measured, those belonging to that category are measured at amortised cost, using the effective interest rate. Any doubtful debt provision is determined with the forward looking approach through a three-stage model: 1) recognition of the expected losses in the first 12 months from initial recognition of the credit assuming that the credit risk has not increased; 2) recognition of the lifetime expected credit losses if the credit risk increases significantly from the initial recognition of the credit; interest is calculated on the gross carrying amount; 3) recognition of any other lifetime expected credit losses when the loss occurs; the interest is recognised on a net basis (the amortised cost is revised since the Internal Rate of Return changes as there is a change in the cash flows due to the occurrence of the trigger event). Financial assets measured at fair value through other comprehensive income (FVOCI) The financial assets that meet the following requirements are classified in this category: (i) the asset is held within a business model whose objective is achieved by collecting the contractual cash flows that come from sale of the asset itself; and (ii) the contractual terms of the asset give rise to cash flows that are solely payments of principal and interest on the principal amount outstanding. Capital instruments are also classified in this category (equity investments in which the Group does not have either control or significant influence) for which the Group applies the option given from the principle of measuring those instruments at fair value with an impact on the comprehensive income. These assets are initially recognised in the financial statements at their fair value; upon subsequent measurement, the measurement made upon recognition is updated, and any variations in fair value are recognised under the Other components of the statement of comprehensive income. Any write-downs for impairment, interest income or profits or loss for exchange rate differences are recognised in the Income statement. Financial assets measured at fair value through profit and loss (FVTPL) All financial assets that do not meet the requirements, in terms of business model or cash flow characteristics, are classified in this category, for measurement at amortised cost or at fair value with an effect on the Statement of comprehensive income. They mainly include derivative instruments; this category also includes listed and non-listed capital instruments that the Group has not irrevocably decided to classify as FVOCI upon initial recognition or during transition. The assets that belong to this category are classified as current or non-current assets in accordance with their maturity date, and recognised at fair value upon initial recognition. Upon subsequent measurement, the profit and loss resulting from changes in fair value are accounted for in the consolidated income statement in the period in which they are recognised. Impairment The measurement of impairment of the financial assets measured at amortised cost is carried out on the basis of a model based on the expected losses on the receivables. According to that model, the financial assets are classified at stage 1, stage 2 or stage 3 according to their credit quality compared to initial disbursement. More specifically: Stage 1: includes (i) the newly acquired credit exposures; (ii) the exposures that have not undergone significant impairment of the credit risk compared to the date of initial recognition and (iii) the exposures with low credit risk. Stage 2: includes the credit exposures that have undergone significant impairment of the credit risk compared to the date of initial recognition, even though they are not impaired. Stage 3: includes the impaired credit exposures. For exposures that belong to stage 1, the overall impairment equals the expected loss calculated on a time period of up to one year. For exposures that belong to stages 2 or 3, the overall impairment equals the expected loss calculated on a time period equal to the entire duration of the relative exposure. The criteria to determine the write-downs to make to the receivables is based on discounting the expected principal and interest flows to present values. In order to determine the current value of the

Explanatory notes to the Consolidated Financial Statements at 31 December 2021 Eurotech _________________________________________________________________________________________________________________________________________________________________________________________________________________________
18
flows, the basic elements are the identification of the estimated collections, the date of collection and the discount rate to apply. More specifically, the loss amount is obtained as the difference between the carrying amount and the current value of the estimated cash flows, discounted at the original interest rate of the financial asset. These assets are classified as current assets apart from those with a maturity of more than 12 months, which are included under non-current assets. Derivatives Derivative instruments entered into by the Group aim at managing the exposure to interest rate risk mainly relating to loan contracts. On the date of entering into the contract, the derivative instruments are initially accounted for at fair value, and if the derivative instruments are not accounted for as hedging instruments, the changes in fair value recognised after first recognition are treated as operating components or financial components of the profit/loss for the year in relation to the nature of the instrument. On the other hand, if the derivative instruments meet the requirements to be classified as hedging instruments, the subsequent changes in fair value are accounted for by following the specific criteria provided by IFRS 9 indicated below. For each derivative financial instrument identified as a hedging instrument, its relationship with the hedged position is recorded, including the risk management objectives, the hedging strategy and the assessment of the effectiveness of the hedge. The effectiveness of each hedge will be checked both when taking out each derivative instrument and during its life. Hedging is generally considered to be “effective” if, both at the beginning and during its life, the changes in the fair value for fair value hedges or the expected future cash flows for cash flow hedges of the hedged element are substantially offset by the changes in fair value of the hedging instrument. When the hedge relates to changes in fair value of assets or liabilities recorded on the financial statements (fair value hedge), both the changes in fair value of the hedging instrument and the changes in the hedged position are charged to the Income statement. If the hedging aims to neutralise the risk of changes in future cash flows originating from the future execution of transactions considered to be highly probable at the date of the financial statements (cash flow hedge), the changes in fair value of the derivative instrument recorded after the first recognition are accounted for as components of the comprehensive profit or loss, to the extent of the effective amount only. When the financial effects caused by the hedged positions become manifest, the reserve is reversed back to the Income statement among the operational components. If the hedge is not perfectly effective, the change in fair value of the hedging instrument, with respect to the ineffective potion, will be immediately recorded on the Income statement. If, during the life of a derivative instrument, there is no longer an expectation that the transaction the hedge was set up for will occur, the portion of “reserves” relating to that instrument will be immediately reversed back to that year’s Income statement. On the other hand, if the derivative instrument is sold or can no longer be classified as an effective hedging instrument, the portion of “reserves” representing the changes in fair value of the instrument, which had been recognised up to that point, is maintained as a component of the comprehensive profit or loss and reversed back to the Income Statement following the above-mentioned classification criteria, at the same time as occurrence of the economic effects of the transaction originally hedged. The fair value of listed instruments in public markets is determined by referring to the closing prices for the period. The fair value of unlisted instruments is measured by referring to financial measurement techniques: the fair value of interest rate swaps is measured by discounting back the expected cash flows, while the fair value of the forward exchange rates is calculated on the basis of the market exchange rates on the applicable date and the expected rate differentials between the currencies involved. The financial assets and liabilities measured at fair value are classified in the three hierarchical levels described below, on the basis of the relevance of the (input) information used to calculate their fair value. More specifically: Level 1: financial assets and liabilities whose fair value is calculated on the basis of listed prices (not amended) on active markets for identical assets and liabilities; Level 2: financial assets and liabilities whose fair value was calculated on the basis of other input besides the listed prices mentioned in Level 1, but that can be directly or indirectly observed (mainly: market

Explanatory notes to the Consolidated Financial Statements at 31 December 2021 Eurotech _________________________________________________________________________________________________________________________________________________________________________________________________________________________
19
exchange rates on the applicable date, the expected rate differentials between the currencies involved and volatility of the applicable markets, interest rates and the price of commodities); Level 3: financial assets and liabilities whose fair value is calculated on the basis of input data that is not based on observable market data. Financial assets are removed from the statement of financial position when the right to receive the cash flows from the instrument has come to an end, and the company has essentially transferred all the risks and benefits relating to the instrument and the relative control. Treasury shares Treasury shares purchased are deducted from shareholders' equity according to the relative purchase cost. The purchase, sale, issue or cancellation of the company’s own equity instruments does not entail recognition of any gain or loss in the income statement. Cash and cash equivalents Cash and cash equivalents include ready cash, i.e., values that are either available on demand or which can be quickly liquidated, will give good results and do not have collection costs. For the purposes of the consolidated cash flow statement, cash was represented gross of bank overdrafts at the reporting date. Financial liabilities Financial liabilities, including financial payables, trade payables, other payables and other liabilities besides the derivative instruments, are initially recognised at fair value, and afterwards measured at the amortised cost not including the repayments of principal already made. The payables and other liabilities are classified as current liabilities unless the Group has the contractual right to discharge its obligations at least twelve months following the date of the financial statements. Financial liabilities are eliminated when they are discharged or when the specific obligation in the contract has been fulfilled, cancelled or expired. Reverse factoring transactions In order to guarantee facilitated access to credit for its suppliers, the Parent Company has set up factoring agreements, generally in the form of reverse factoring agreements. On the basis of the contractual structures in place, the supplier can assign, at its own discretion, the receivables owed from the Parent Company to a financial institution and collect the amount before it falls due; the supplier can also grant further extensions, agreed between the supplier and the Parent Company, to the payment terms provided for in the invoice. The extensions granted can be interest-bearing or non-interest bearing. Since the primary obligation is with the supplier, the relations between the parties stay the same and are therefore still classified under trade liabilities. Derecognition of financial assets and liabilities Financial assets A financial asset (or where applicable, part of a financial asset or part of a group of similar assets) is derecognised from the financial statements when:
- rights to receive the cash flows from the asset are extinguished; - the Group holds the right to receive cash flows from the asset, but has undertaken a contractual
obligation to pay for them in full and immediately to a third party;

Explanatory notes to the Consolidated Financial Statements at 31 December 2021 Eurotech _________________________________________________________________________________________________________________________________________________________________________________________________________________________
20
- the Group has transferred the right to receive cash flows from the asset and (a) has essentially transferred all the risks and benefits of ownership of the financial asset or (b) has not transferred nor retained the risks and benefits of the asset, but has transferred its control.
If the Group has transferred the rights to receive cash flows from an asset and has neither transferred nor held all the risks and benefits or has not lost control of them, the asset is recognised in the Group financial statements to the extent of its residual involvement in the asset. Residual involvement, which takes the form of a guarantee on the transferred asset, is valued at the lesser of the initial book value of the asset and the maximum value of the amount that the Group could be required to pay. If the residual involvement takes the form of an option issued and/or acquired on the transferred asset (including the options regulated by cash or similar), the amount of Group involvement corresponds to the amount of the transferred asset that the Group can re-acquire; however, in the case of a put option issued on an asset measured at fair value (including options regulated in cash or with similar dispositions), the measure of residual involvement of the Group is limited to the lesser between the fair value of the transferred asset and the strike price of the option. Financial liabilities A financial liability is derecognised from the financial statements when the obligation underlying the liability is extinguished, voided or completed. If an existing financial liability is replaced by another by the same lender, at substantially different conditions, or the conditions of an existing liability are essentially changed, this exchange or change is treated like an accounting elimination of the original liability and a new liability is recorded, posting to the income statement any differences between the book values. Employee benefit obligations Benefits guaranteed to employees, paid concurrent to or subsequent to the cessation of the employment relationship through defined-benefit plans or other long-term benefits (withdrawal indemnity) are recognised in the period when this right vests. The Group implemented defined-benefit and/or defined-contribution pension plans, based on conditions and local practices in the countries where the Group operates. Liabilities related to defined-benefit programmes, net of any activities to service the plan, are determined based on actuarial assumptions and are recognised on an accrual basis consistent with the employment services necessary to obtain the benefits. The liabilities are valued by actuarial staff. Gains and losses arising from the actuarial calculation relating to the defined-benefit plan are fully recognised in the statement of comprehensive income in the period in which they occur. These actuarial gains and losses are immediately classified as retained earnings and are not reclassified in the income statement in the following reporting periods. Pursuant to amendments to employee severance indemnities under Italian Law no. 296 of 27 December 2006 (2007 Budget Law) and following decrees and regulations, the employee severance indemnities of Italian companies accrued as of 1 January 2007 or the date employees choose the option they will exercise are included in the defined benefit plan category, both in the event of option for supplementary pension and option for allocation to the treasury fund at INPS. The accounting treatment of employee severance indemnities is now similar to that used for other types of pension scheme contributions. Provisions for risks and charges Provisions for risks and charges are allocated to cover losses or liabilities of a stated nature or of a certain or probable existence, the amount or date of which was not identified at year-end. Provisions are recognised when there is a current obligation (legal or implicit) arising from a past event that necessitates

Explanatory notes to the Consolidated Financial Statements at 31 December 2021 Eurotech _________________________________________________________________________________________________________________________________________________________________________________________________________________________
21
an amount of resources to meet the obligation and a reliable estimate can be made of the amount of the obligation. When the Group believes that a provision to the reserve for risks and charges is partly or totally repaid, e.g. in the case of risks covered by insurance policies, the indemnity is only recognised as a separate item in the assets if, and only if, it is virtually certain. In this case, the cost of the provision in the income statement is stated net of the amount recognised for indemnity. Provisions are booked at the representative value of the best estimate of the amount that the company would pay to extinguish the obligation, or to transfer it to third parties at the reporting date. If the effect of time-discounting the value of the cash is significant, provisions are determined by time-discounting expected future cash flows at a pre-tax discount rate that reflects the current market evaluation of the cost of money in relation to the time. When time-discounting is performed, the increase in the provision due as time passes is recognised as a financial charge. Liabilities for decommissioning An accrual for decommissioning expenses was made against costs that some foreign operations will incur in future periods for the decommissioning, demolition, dismantling and removal of some fixed assets at the end of their useful life. A credit to the plant and machinery entry was stated as a contra entry. Decommissioning costs are carried at the present value of expected costs needed to settle the obligation, by using estimated cash flows and a pre-tax discount rate that reflects the specific risks related to the liabilities for decommissioning. The unwinding of the discount is recognised in the income statement as it occurs. Estimated cash flows are revised annually and adjusted as appropriate. Any change in cost estimates or in the discount rate applied is used to reduce the costs of the asset. Grants Grants made by public bodies are recognised at fair value when it is reasonably certain that they will be received and the conditions provided for obtaining them are met. If grants relate to cost components, they are recognised as revenues but are consistently spread out over the periods so that they refer to the costs they are intended to offset. If the grant is related to any activity or development activity whose value is recognised as a fixed asset, it directly reduces the value of the fixed assets. Operating grants (granted in order to provide immediate self-financing to the business or as compensation for expenses and losses incurred in a prior financial year) are fully recognised in the income statement at the time when the conditions for posting are met. Leases A contract, or part thereof, is classified as a lease if, in exchange for a consideration, it confers the right to control the use of a specified asset for a period of time, therefore, if along the entire period of use of the asset, the following rights can be exercised:
a) the right to obtain substantially all the economic benefits deriving from the use of the asset; and b) the right to decide on the use of the asset.
In the event of a change in the terms and conditions of the contract, a new assessment is carried out to determine whether the contract is or contains a lease. The Group does not apply these rules to:
• leases of intangible assets; • short-term leases (duration of less than or equal to 12 months); • leases in which the underlying asset is of modest value (assets with a unit value of less than or
equal to €5 thousand). Once it has been verified whether a contract is a lease, the asset consisting of the right of use and the liability of the lease are recognised at the effective date of the contract.

Explanatory notes to the Consolidated Financial Statements at 31 December 2021 Eurotech _________________________________________________________________________________________________________________________________________________________________________________________________________________________
22
The initial measurement of the right-of-use asset is at cost, which includes: a) the amount of the initial measurement of the lease liability; b) the payments made for the lease on or before the effective date, net of any lease incentives
received; and c) the initial direct costs incurred by the lessee.
The initial measurement of the lease liability takes place at the current value of the payments due for the lease and not yet paid at that date. Payments due for leases are discounted using the company-specific WACC. The lease term is determined as the non-cancellable period of the lease, to which both the following periods must be added:
a) periods covered by a lease extension option, if there is a reasonable certainty that the option will be exercised; and
b) periods covered by the lease termination option, if there is a reasonable certainty that the option will not be exercised.
The duration of the lease is redetermined in the event of a change in the non-cancellable period of the lease. After the initial recognition date, the asset is valued by applying the appropriate cost model. Assets consisting of the right of use are amortised from the effective date until the end of the lease term. After the effective date, the lease liability is measured:
a) by increasing the book value to take into account interest on the lease liability; b) by decreasing the book value to take into account the payments made for the lease; c) by restating the book value to take into account any new valuations or amendments to the lease
or a revision of payments due for the lease. Interest on the lease liability and the variable payments due for the lease, not included in the measurement of the lease liability, are recognised in the income statement of the year in which the event or circumstance that triggers the payments occurs. In the financial statements, the right-of-use assets are shown separately from the other assets, the lease liabilities are shown separately from the other liabilities, the interest expense on lease liabilities is recognised as financial expense and separately from the amortisation portion of the asset consisting of the right of use. Assignment of stock grants to employees The Group granted incentive plans based on instruments representing capital, on the basis of which the Group receives services from its employees, consultants or directors with delegation of authority in exchange for stock grants (units). The fair value of the services received is recognised as a labour cost. The total amount of the cost is determined based on the fair value of the granted units and a shareholders’ equity reserve is its contra entry. The total cost is recognised throughout the vesting period, which is the period during which all service conditions established for accrual of the rights must be met. The Group reviews the estimates based on the number of options expected to accrue on the basis of the accrual, and not the market, conditions on every reporting date. The effect of any changes from the original estimates is recognised in the consolidated income statement with contra entry in shareholders’ equity. Revenues and costs Recognition of revenues Revenues from contracts with customers are recognised on the basis of the temporary transfer of control of the goods and/or services to the customer. If the transfer of control is made while the item is being built or when the services are being provided, the revenues are recognised “over time”, i.e. as the activity gradually progresses; on the other hand, if control is not transferred while the item is being built or the services are being given, the revenues are recognised “at a point in time”, i.e. at the time of final delivery

Explanatory notes to the Consolidated Financial Statements at 31 December 2021 Eurotech _________________________________________________________________________________________________________________________________________________________________________________________________________________________
23
of the item or upon completion of provision of the services. In order to assess progress of the contracts “over time”, the Group has chosen the progress percentage criteria measured with the cost-to-cost method. When it is probable that the total costs of the contract for its entire life exceed the total revenues corresponding to the total life, the potential loss is recognised immediately in the Income statement. In the case of contracts where the fees are expressed in a different currency besides the operating currency, the conversion to functional currency of the revenue accrued to the applicable financial statements date is carried out: i) at the invoicing exchange rate in effect for the invoiced portion and at the exchange rate at the end of the period for the portion still to invoice; or ii) for hedging transactions, at the hedging exchange rate (in the case of hedging against exchange rate risks). The portion of fees held back by the principal, or in any case subject to repetition in accordance with the contractual clauses since they are subject to fulfilling obligations after delivery are not acquired. Interest Interest income and expenses are recognised according to interest accrued on the net value of related assets and liabilities using the effective interest rate (the rate that discounts all future cash flows based on the expected useful life of the financial instrument to equal the net book value of the financial asset). Dividends Dividends are reported when the shareholders’ right to receive payment is established. Income taxes Current tax assets and liabilities for the period and for all prior periods are carried at the amount expected to be recovered or to be paid to the tax authorities pursuant to tax legislation in force. Tax rates and fiscal provisions used to calculate the amount are as issued or substantially issued at the reporting date of 31 December 2021. Current taxes relating to elements recognised directly in shareholders' equity are recognised directly in shareholders' equity and not in the income statement. Deferred tax liabilities are calculated using the liability method on temporary differences at the reporting date between tax amounts related to assets and liabilities and the amounts recognised in the financial statements. Deferred tax liabilities are recognised with regard to all taxable temporary differences, except for:
• when deferred tax assets arise from initial posting of goodwill or an asset and liability in a transaction, which is not a business combination and which, at the time of the transaction, does not have an effect on income in the financial year calculated for the financial statements, nor on the income or loss calculated for tax purposes;
• with reference to taxable temporary differences associated with equity investments in subsidiaries, affiliates and joint ventures, in the event that recharging temporary differences can be controlled and it is likely that it will not take place in the foreseeable future.
Deferred tax assets are recognised against deductible temporary differences and tax losses carried forward to the extent that the company is likely to earn taxable income in the future, which can make applicable the use of deductible temporary differences and tax losses carried forward, unless:
• the deferred tax asset related to temporary deductible differences arises from the initial recognition of an asset or liability in a transaction that is a business combination and which, at the time of the transaction, does not influence the profit for the year calculated for the financial statements or income or loss calculated for tax purposes;

Explanatory notes to the Consolidated Financial Statements at 31 December 2021 Eurotech _________________________________________________________________________________________________________________________________________________________________________________________________________________________
24
• in the case of taxable temporary differences associated with equity investments in subsidiaries, affiliates and joint ventures, tax assets are recognised in the amount that temporary differences might be used in the immediate future and that there is adequate taxable income against which the temporary differences can be used.
The recoverability of deferred tax assets is reviewed at the end of every year and is reduced if it is unlikely that sufficient income will be earned in the future to allow all or part of this credit to be used. Unrecognised deferred tax assets are reviewed annually at year-end and are recorded to extent to which taxable profit is likely to be sufficient to allow these deferred tax assets to be recovered. Since certain Group companies reported losses in previous years, the Group recognises a deferred tax asset resulting from tax losses or unused tax credits only to the extent that the temporary taxable differences are sufficient or there is also convincing proof that there will be enough taxable income available for which the tax losses or unused tax credits could be used. Deferred tax assets and liabilities are recognised based on the tax rates expected to be applied during the year when these activities are realised or these liabilities extinguished, taking into account the rates in force and those issued or allocated at year-end. Deferred tax assets and liabilities related to items posted to shareholders' equity are directly recognised in shareholders' equity and not in the income statement. Deferred tax assets and deferred tax liabilities are offset if there is a legal right to offset current tax assets and liabilities and deferred income taxes referring to the same taxable object and the same tax authorities.
F – Segment information
For management purposes, the Group considers only one business sector as relevant: the “Modules and Platforms” sector. Thus, the disclosure is provided for the sole identified sector, broken down on a geographical basis. The geographical areas are produced in relation to the various group entities and based on the criteria with which they are currently monitored by top management. The Group’s geographical areas are defined according to the localisation of Group assets and operations. They are: Europe, North America and Asia. Management monitors the gross profit margin of the individual business units separately for the purposes of resources allocation and performance assessment.
The sales performance broken down by geographic area set out in the table above shows a decrease in all reference areas. The table below shows assets and investments in the Group’s individual business segments at 31 December 2021 and 31 December 2020.
(€' 000)
FY 2021 FY 2020 % YoY Change
FY 2021 FY 2020 % YoY Change
FY 2021 FY 2020 % YoY Change
FY 2021 FY 2020 FY 2021 FY 2020
Third party Sales 28,638 25,451 14,121 19,807 20,389 24,001 0 0 63,148 69,259
Infra-sector Sales 1,149 720 5,055 2,931 35 483 ( 6,239) ( 4,134) 0 0
Total Sales revenues 29,787 26,171 13.8% 19,176 22,738 -15.7% 20,424 24,484 -16.6% ( 6,239) ( 4,134) 63,148 69,259
Gross profit 10,523 10,772 -2.3% 7,827 11,521 -32.1% 10,523 14,598 -27.9% 605 ( 373) 29,478 36,518
Gross profit margin - % 35.3% 41.2% 40.8% 50.7% 51.5% 59.6% 46.7% 52.7%
EBITDA ( 2,747) 6,632
EBITDA margin - % -4.4% 9.6%
EBIT ( 7,587) 2,439
EBIT margin - % -12.0% 3.5%
North America Europe Asia Correction, reversal and
elimination Total

Explanatory notes to the Consolidated Financial Statements at 31 December 2021 Eurotech _________________________________________________________________________________________________________________________________________________________________________________________________________________________
25
(€'000)
FY 2021 FY 2020 FY 2021 FY 2020 FY 2021 FY 2020 FY 2021 FY 2020 FY 2021 FY 2020
Assets and liabilites
Segment assets 45,313 41,588 83,037 99,659 74,823 75,910 -38,662 -37,972 164,511 179,185 Investments in subsidiaries non consolidated, associate & other companies 116 117 426 45 0 0 0 0 542 162
Total assets 45,429 41,705 83,463 99,704 74,823 75,910 -38,662 -37,972 165,053 179,347
Segment liabilities 42,310 46,865 32,985 27,577 18,015 14,618 -38,693 -43,207 54,617 45,853
Total liabilities 42,310 46,865 32,985 27,577 18,015 14,618 -38,693 -43,207 54,617 45,853
Other segment information
Investments in tangible assets 70 877 273 920 830 132 0 0 1,173 1,929
Investments in intangible assets 417 687 2,523 2,782 809 896 -76 -95 3,673 4,270
Depreciation & amortisation 830 770 2,886 2,341 1,195 1,151 -71 -69 4,840 4,193
Total North America Europe Asia Correction, reversal and elimination

Explanatory notes to the Consolidated Financial Statements at 31 December 2021 Eurotech _________________________________________________________________________________________________________________________________________________________________________________________________________________________
26
G - Composition of the principal asset entries
1 – Intangible assets The following table shows the changes in the historical cost and accumulated amortisation of intangible assets in the reporting period:
The increase in intangible assets is the cumulative effect of investments, which for the year amounted to €3,673 thousand, of amortisation and write-downs, which add up to €2,931 thousand, and the change in exchange rates that, represented in the item “other changes”, have increased intangible assets by €526 thousand.
(€ '000) DEVELOPMENT
COSTS GOODWILL
SOFTWARE TRADEMARKS
PATENTS
ASSETS UNDER
CONSTRUCTION &
ADVANCES
OTHER INTANGIBLE
ASSETS
TOTAL INTANGIBLE
ASSETS
Purchase or production cost 14,672 76,668 22,356 4,593 28,391 146,680
Previous years' impairment ( 863) ( 7,449) ( 7,457) ( 56) - ( 15,825)
Previous years' amortisation ( 10,202) - ( 5,487) - ( 28,391) ( 44,080)
OPENING BALANCE 3,607 69,219 9,412 4,537 - 86,775
Purchases 267 - 106 3,300 - 3,673
Disposals ( 445) - ( 32) - - ( 477)
Other changes 57 1,183 414 90 ( 611) 1,133
Impairment in period - ( 186) - - - ( 186)
Transfers 2,736 - 852 ( 3,588) - -
Amortisation in period ( 2,128) - ( 617) - - ( 2,745)
Reversal of cumulative amortisation 353 - 32 - - 385
Decreases in cumulative impairment 92 - - - - 92
Other changes in cumulative impairment ( 7) ( 495) ( 572) - - ( 1,074)
Other changes in cumulative amortisation ( 61) - ( 83) - 611 467
TOTAL CHANGES 864 502 100 ( 198) - 1,268
Purchase or production costs 17,287 77,851 23,696 4,395 27,780 151,009
Impairment ( 778) ( 8,130) ( 8,029) ( 56) - ( 16,993)
Cumulative amortisation ( 12,038) - ( 6,155) - ( 27,780) ( 45,973)
CLOSING BALANCE 4,471 69,721 9,512 4,339 - 88,043

Explanatory notes to the Consolidated Financial Statements at 31 December 2021 Eurotech _________________________________________________________________________________________________________________________________________________________________________________________________________________________
27
Investments refer primarily to the recognition of development internal and external costs incurred by the Group companies for the implementation of the new ICT system and the costs for the purchase of new software licenses. The “Other changes” item refer to the exchange differences accrued on the opening balances of the values expressed in foreign currency, particularly the “goodwill” and “trademarks”, which include the value defined at the time of allocation of the price of the acquisitions, in addition to the reversal of intangible assets entirely amortised during the previous year. In 2021, the Group also spent about €7.6 million for research and development of numerous projects regarding product and process innovations that will allow, also in the future, to maintain the Group competitive in the high technology segments. The "trademarks" item was partially written down in 2008 to reflect the decision made by the management of Eurotech to no longer use the ADS and Arcom trademarks commercially, but to continue to retain their ownership for possible future use. Therefore, the “Advanet” trademark is still valued at the time of acquisition of the Advanet Group and it continues to be defined by management as an asset with an indefinite life, as its use for commercial and production purposes has no time limits, considering its characteristics and its position on the Japanese market. As a result, it is not subject to amortisation, but instead to annual impairment tests. Goodwill refers to the higher value paid, when fully-consolidated subsidiaries were acquired, in excess of the fair value of the assets and liabilities acquired. Goodwill is not subject to amortisation but is subject to annual impairment tests. At the end of 2021, following the impairment test, with the exception of goodwill recorded in the Eurotech France SBU, it was not deemed necessary to write down the goodwill and no write-downs were made in 2020. Despite the fact that in 2021 the results expected at the beginning of the year were not achieved for the reasons explained in the operating performance and analysing the conditions of the market in which the company operates and the order intake recorded in 2021, it is currently believed that there are no risks of impairment that may generate a possible write-down of the goodwill of the main individual SBUs. As mentioned, following the reorganisation decisions taken by the Parent Company's Board of Directors in November 2021, the residual value of the goodwill related to the French subsidiary Eurotech France was written down entirely (for €186 thousand). The increase on development costs relative to internal activities carried out by the Group during the year is capitalised net of any contributions received. These fixed assets with a definite useful life are amortised on a straight-line basis based on the life cycle of the products developed, which is estimated at three to five years, beginning from the date of completion of the relevant development project. This asset is subject to impairment tests whenever loss of value is indicated. The directors, on the basis of existing and prospective opportunities, consider the recognised values recoverable. The “software, trademarks, patents and licences” item mainly includes the costs incurred to implement what became the Group’s new single information system. Software is amortised on a straight-line basis over three financial years. The increase during the year is mainly due to costs incurred for the purchase of several software licenses. The “assets under construction” item of €4,339 thousand comprises development costs for €3,785 thousand (internal payroll, materials and services) related to new products in the Internet of Things area, and the embedded modules and systems, which were still at the project stage at year-end or for which production had not yet been launched, and costs related to the implementation of the new information system for €538 thousand.

Explanatory notes to the Consolidated Financial Statements at 31 December 2021 Eurotech _________________________________________________________________________________________________________________________________________________________________________________________________________________________
28
Carrying value of goodwill and the trademarks allocated to each of the cash-generating units: In order to carry out the annual impairment test, the posted individual goodwill and trademarks with an indefinite useful life acquired through business combinations were allocated to their respective cash-generating units, corresponding to the legal entity or Group of companies to which they refer to test for impairment.
The recoverable values of the individual cash-generating unit were calculated according to their value in use, which was determined using the discounted cash flow (DCF) method. The projected discounted cash flows set out in the new 2022-2026 operating and financial plan, approved by Parent Company directors by resolution of 10 February 2022, were used to calculate the relative value, while the cash flows beyond the specified time horizon as set out in the Plan, and for the purposes of calculating terminal value were extrapolated using the perpetual annuity method, based on flows not dissimilar to those contained in the third year of the approved plan. The plans were prepared in the respective functional currencies, and the consequent recoverable values were uniformly compared with the carrying values in foreign currency allocated to the various cash-generating units. The growth rate “g” used to calculate terminal value was 1.5% (2020: 1.5%), less than the average long-term growth rate forecast for the various core markets. The discount rate (WACC – Weighted Average Cost of Capital) applied to prospective cash flows is different depending on the different percentages of the main business lines in the Plan in the various years, so it was weighted annually. The WACC therefore varies within a range of 4.79% to 11.04% calculated according to the country where the individual companies operate, and to the debt structure over the various years of each company, and it was determined net of tax effects. The key parameters used for impairment tests are as follows:
With regard to risk free, the average rates of return for the three years prior to 31 December 2021 of government bonds of the reference countries, with a 10-year maturity, were used. For countries subject
(€ '000)
Cash generating units GoodwillTrademark with
an indefinite useful life
GoodwillTrademark with
an indefinite useful life
Advanet Inc. 42,773 8,122 44,088 8,372
Eurotech Inc. (ex Applied Data Systems e ex Arcom Inc.) 21,661 - 19,998 -
Eurotech Ltd. (ex Arcom Ltd.) 5,197 - 4,857 -
Eurotech France S.a.s. - - 186 -
Other 90 - 90 -
TOTAL 69,721 8,122 69,219 8,372
at December 31, 2021 at December 31, 2020
ITA JAP USA UK
Risk free 2.23% 0.00% 1.49% 0.64%
Total Market Premium 5.50% 5.20% 5.50% 5.60%
Beta unlevered 1,00 da 0,99 a 1,00 1,00 1,00
WACCda 7.20% a
11.04%da 4.79% a
8.53%da 6.52% a
10.31%da 5.82% a
9.57%
Explanatory notes to the Consolidated Financial Statements at 31 December 2021 Eurotech _________________________________________________________________________________________________________________________________________________________________________________________________________________________
29
to the ECB's expansionary monetary policies (including Italy), in consideration of the current macroeconomic environment and the indications emerging from a credit practices and national and international doctrine, it was considered necessary to apply corrective factors in considering the risk free rate, since the rates offered by the government securities of these countries is currently affected externally by actions and interventions of non-monetary nature. The methodology adopted (“WACC Unconditional Adjusted”), is supported by an external consulting firm and is consistent with the one used last year. It provides for usage of a risk free nominal rate that incorporates the country risk normalised by the monetary policies applied by central banks and calculated as the sum of the return of the 10-year government bond in countries with AAA rating (e.g. USA), re-expressed to consider the inflation differential between the reference country and the USA, and the risk premium of the specific country, determined by the spread between the Credit Default Swaps (CDSs) of the reference country and the CDSs of the USA (i.e. with AAA rating). The unlevered beta used differs slightly between the business Board&Systems and the IoT business; for all the Cash-Generating Units (CGUs) considered, it corresponds to the average beta observed by Bloomberg for listed companies that are comparable to the Parent Company in terms of the main business lines of the Parent Company itself. For calculation of the WACC for the CGUs, this Beta factor was considered in the re-levered version, taking into consideration the leverage effect from the average ratio of the debt and equity of the sector and the tax rate of the CGU reference country. Taking account of the assumptions underlying the 2022-2026 operating and financial plans and the use of the main parameters identified for the single markets of reference, the values in use coming from the impairment tests performed showed no need to reduce the value of goodwill and trademarks with indefinite life. With regard to the values related to the IoT business line, the highest WACC was used on all the CGUs and in line with what was done the previous year by virtue of the additional risk premium of 3.5% to reflect the general riskiness of a business that is still being developed. The WACC used for each CGU was calculated in consideration of the specific weighting between the Board&Systems business line and the IoT business line, based on their contribution to the Gross Profit of the CGU. The recoverability of the values of intangible assets related to the acquisition of the various CGUs and in line with what was done last year, appears to be conditional upon on the occurrence of possible changes in the key assumptions used to estimate them. The higher book values compared to the recoverable values is reflected differently for each CGU. In carrying out the impairment test, the Group made various assumptions to acquire evidence of which events could lead to impairment. Other conditions being equal, the WACC of the Terminal Value that would bring about an impairment situation should be equal to or higher than 18.8% for Eurotech Ltd., 39.7% for Eurotech Inc. and 9.0% for Advanet Inc. Acknowledging that, on the basis of the phase of expansion in which the individual CGUs are, the terminal values are significant (even more than 90% of the “value in use”), some assumptions of a significant reduction in EBITDA values were also analysed versus other items of the statement of financial position of the previous year and/or of the years included in the plan. It has emerged that, in the Advanet CGU, only a limited growth of 50% in the EBITDA of the last year of the plan, would entail a non-recoverability of the invested capital; with reference to the Eurotech Inc. CGU, the impairment test would give rise to problems if, in the last year of the plan, EBITDA were lower than the current values by around 50%. In the CGU relating to Eurotech Ltd., impairment risks would arise only if, again in 5 years, it was not possible to reach an amount of EBITDA higher than €0.8 million. Furthermore, management believes that the long-term growth estimate for 2021 of 1.5%, the same as for 2020, is far below estimates for the reference embedded PC markets (European, Japanese and U.S.). Generally, the directors also assumed in their assessments that on the basis of the current external indicators (particularly Eurotech's stock market performance and market capitalisation) that there were no risks of impairment of the net assets, as noted on a number of occasions. These indicators show how the amounts recognised can be recovered. In evaluating the recoverability of the book values upon testing for impairment, there was no additional impairment found since the total recoverable value was higher than the book value of the asset. The

Explanatory notes to the Consolidated Financial Statements at 31 December 2021 Eurotech _________________________________________________________________________________________________________________________________________________________________________________________________________________________
30
value of the existing orders, orders included in the portfolio, ongoing opportunities, stakeholder relations and products currently in the portfolio, as well as products developed, particularly in recent years for the IoT market, are regarded by the Directors as important factors to justify the current amounts considered, also represented by the external indicators and therefore not changing the amounts posted. A further analysis made by management, also in relation to recent market and economic conditions, determined that it would not be necessary to reduce the amounts recorded.
2 – Property, plant and equipment The table below shows changes in the historical cost and accumulated depreciation and the value of the assets in the period under review:
(€ '000) LAND AND BUILDINGS
PLANT AND MACHINERY
INDUSTRIAL &
COMMERCIAL EQUIPMENT
OTHER ASSETS
ASSETS UNDER
CONSTRUCTION &
ADVANCES RIGHT OF
USE ASSETS
TOTAL PROPERTY,
PLANT & EQUIPMENT
Purchase of production cost 2,847 5,768 5,317 5,801 33 5,611 25,377
Depreciation ( 101) - - - - - ( 101)
Previous year's depreciation ( 652) ( 5,541) ( 4,905) ( 5,083) - ( 2,627) ( 18,808)
OPENING BALANCE 2,094 227 412 718 33 2,984 6,468
Purchases 51 293 91 143 - 595 1,173
Disposals - ( 639) ( 36) ( 192) - ( 125) ( 992)
Assets reclassified among assets held for sale ( 733) - - - - - ( 733)
Other changes - ( 116) 21 56 - 87 48
Impairment in period ( 19) - - - - ( 61) ( 80)
Transfers 11 2 20 - ( 33) - -
Depreciation in period ( 75) ( 72) ( 188) ( 249) - ( 1,245) ( 1,829)
Reversal of cumulative depreciation - 641 36 176 - 2 855
Accumulated amortization reclassified under assets held for sale 248 - - - - - 248
Decreases in cumulative impairment due to reclassification to assets held for sale 120 - - - - - 120
Other changes in cumulative amortisation - 114 ( 28) ( 81) - ( 54) ( 49)
TOTAL CHANGES ( 397) 223 ( 84) ( 147) ( 33) ( 801) ( 1,239)
Purchase or production cost 2,176 5,308 5,413 5,808 - 6,168 24,873
Depreciation - - - - - ( 61) ( 61)
Cumulative depreciation ( 479) ( 4,858) ( 5,085) ( 5,237) - ( 3,924) ( 19,583)
CLOSING BALANCE 1,697 450 328 571 - 2,183 5,229

Explanatory notes to the Consolidated Financial Statements at 31 December 2021 Eurotech _________________________________________________________________________________________________________________________________________________________________________________________________________________________
31
The "land and buildings" item amounting to €1,697 thousand includes the value of the building (located in Amaro - UD - inclusive of land and improvement costs) in which the parent company's production site is located and the value of the Parent Company's property in Amaro (UD) inclusive of land (used as offices) purchased in January 2021 but already recorded at the purchase value at the end of 2020. Compared to 2020, the net carrying value (net of write-downs made during the period to adjust the value) of the land and building owned by the subsidiary I.P.S. Sistemi Programmabili S.r.l. (located in Caronno Varesino - VA - including the land) was reclassified under assets available for sale following a preliminary sale signed in November 2021 and the subsequent sale that was finalised at the end of January 2022. The amount reclassified under "assets classified as held for sale", which corresponds to the value defined by the parties, was equal to €365 thousand. The increases of €293 thousand in plant and machinery, €91 thousand in industrial and commercial equipment and €143 thousand in other assets refer mainly to equipment replacement and new assets required to make the operations of the individual Group companies more efficient and effective. Right-of-use assets includes mainly leases, in accordance with IFRS 16. Leases refer to the rents of industrial and commercial buildings as well as office areas and leases of office machines. During the year, following some renegotiations of contracts and the company decision to reduce the use of a property in France (the effects of which have been shown under disposals), the net increase was €470 thousand. These assets, concerning the "Right of use", are then depreciated on a straight line basis for the duration of the contract, taking account of the renewal/termination options, which are highly likely to occur. Depreciation recognised with reference to the “Rights of use” assets during the year amounted to a total of €1,245 thousand. The “other changes” item refers to exchange differences accrued on the opening balances of the values at cost and cumulative depreciation.
3 – Equity investments in affiliates and other companies The table below shows changes in equity investments in affiliates and other companies in the reporting period:

Explanatory notes to the Consolidated Financial Statements at 31 December 2021 Eurotech _________________________________________________________________________________________________________________________________________________________________________________________________________________________
32
At 31 December 2021, Eurotech owns the following equity investments in affiliates consolidated at equity: - Rotowi Technologies S.p.A. (former UTRI S.p.A.) = 21.32%, following a series of share purchases in
2007 and 2008. This affiliate presented a debt restructuring plan in 2010 pursuant to Art. 182-bis of the Italian Budget Law, which led to a non-recoverability valuation for the booked value. The book value had therefore already been fully written down in 2010.
The closing dates of the financial statements and the financial years of the affiliate coincide with those of the Parent Company. The schedule below shows the values of the assets, liabilities, revenues and annual results of equity investments in affiliates at 31 December 2020, as operating and financial information for year-end 2021 is not yet available.
(€'000)
INITIAL VALUE
INCREASES DECREASES WRITE-UPS /WRITE-DOWN
OTHER EOP VALUE %
OWNERSHIP
Investments in associate companies (valuation using the equity method):
Rotowi Technologies S.r.l. in liquidazione (ex U.T.R.I. S.p.A.) - - - - - - 21.32%
TOTAL INVESTMENTS IN ASSOCIATE COMPANIES - - - - - -
Investments in other companies (valuation at fair value on the Profit&Loss):
Consorzio Ecor' IT 2 - - - - 2
Consorzio Aeneas 5 - - - - 5
Consorzio Ditedi 19 - - - - 19 7.69%
Consorzio Rete Space Italy - 3 - ( 3) - -
Interlogica S.r.l. 400 - - - - 400 10.00%
Kairos Autonomi 106 - - - 9 115 19.00%
Others 1 - - - - 1
TOTAL INVESTMENTS IN OTHER COMPANIES 533 3 - ( 3) 9 542
TOTAL INVESTMENTS 533 3 - ( 3) 9 542
at December 31, 2021

Explanatory notes to the Consolidated Financial Statements at 31 December 2021 Eurotech _________________________________________________________________________________________________________________________________________________________________________________________________________________________
33
4 – Other non-current assets The schedule below shows the breakdown of other non-current assets at 31 December 2021 and 31 December 2020:
Other non-current receivables mainly comprise security deposits that do not accumulate interest; they are in line with the previous year. The decrease is essentially due to an exchange rate effect on the values expressed in JPY.
5 – Inventories The schedule below shows the breakdown of inventories at 31 December 2021 and 31 December 2020:
At December 31, 2020
(€'000) Rotowi
Tech. Rotowi Tech.
Share of the Associate's balance sheet: (*) (**)Current assets 172 176Non current assets 0 0Current liabilities (554) (54)Non current liabilities (245) (745)Net assets (627) (623)
Revenue 0 23Profit (Loss) (3) 18
Carrying amount of the investment 0 0
(*) FY2020(**) FY2019
At December 31, 2021
(€'000)
at December 31, 2021
at December 31, 2020
Other non-current receivables 620 661
TOTAL OTHER NON CURRENT ASSETS 620 661

Explanatory notes to the Consolidated Financial Statements at 31 December 2021 Eurotech _________________________________________________________________________________________________________________________________________________________________________________________________________________________
34
Inventories at 31 December 2021 amounted to €17,646 thousand (€17,393 thousand at 31 December 2020), net of inventory write-down provision totalling €5,627 thousand. The net increase in the inventory write-down provision of €302 thousand is due to the exchange rate effect and only partially mitigated by the combined effect, on the one hand, of the allocations for adjustment of the components and the products held by the Group, which have a risk of technical obsolescence and slow movement and on the other, the usage following specific scrapping. The following table shows the changes in inventory write-down provision in the periods under review:
The “other changes” item refers to changes in the write-down provisions due to foreign exchange differences. The raw materials inventory write-down provision of €2,478 thousand refers to obsolete or slow moving materials, whose full posted value some Group companies do not expect to recover. The increase for the year amounted to €123 thousand. The finished products write-down provision of €3,046 thousand, which covers the risk of slow turnover in certain standard and custom finished products, increased by €172 thousand to reflect the possible recovery value of obsolete products or the slow turnover.
(€'000)
at December 31, 2021
at December 31, 2020
Raw & auxiliary materials and consumables - gross 12,584 10,344
Inventory write-down provision (2,478) (2,355)
Raw & auxiliary materials and consumables - net 10,106 7,989
Work in process and semi-finished goods - gross 718 1,347
Inventory write-down provision (103) (96)
Work in process and semi-finished goods 615 1,251
Finished poducts and goods for resale - gross 9,767 10,869
Inventory write-down provision (3,046) (2,874)
Finished products and goods for resale - net 6,721 7,995
Advances 204 158
TOTAL INVENTORIES 17,646 17,393
(€'000)
at December 31, 2021
at December 31, 2020
OPENING BALANCE 5,325 5,810
Provisions 415 424
Other changes 356 (302) Utilisation (469) (607)
CLOSING BALANCE 5,627 5,325

Explanatory notes to the Consolidated Financial Statements at 31 December 2021 Eurotech _________________________________________________________________________________________________________________________________________________________________________________________________________________________
35
6 – Trade receivables The schedule below shows the breakdown of trade receivables and the respective doubtful debt provision at 31 December 2021 and 31 December 2020:
Trade receivables falling due within 12 months are normally non-interest bearing and generally fall due at 90/120 days. Trade receivables decreased by €5,161 thousand compared to 31 December 2020. There were no bank receipts presented subject to collection. Many of the existing receivables at 31 December 2021 have been collected to date. Receivables are shown net of a doubtful debt provision of €393 thousand. Changes in doubtful debt provision in the years under review were as follows:
Provisions of €74 thousand made during the year was necessary to adjust the value of individual receivables on the basis of their expected losses. Utilisation of the doubtful debt provision is the result of uncollectable receivables partially or totally covered by the relevant provision. Group policy is to specifically identify the individual receivables to be written down, and the allocations made therefore reflect a specific write-down. The “other changes” item includes the effect of translating financial statements in foreign currency. At 31 December 2021, trade receivables that were past due but not written down were as follows:
(€'000)
at December 31, 2021
at December 31, 2020
Trade receivables - customers 11,672 16,932
Trade receivables - realted paties 1 1 Doubtful debt provision (393) (492)
TOTAL TRADE RECEIVABLES 11,280 16,441
(€'000)
at December 31, 2021
at December 31, 2020
OPENING BALANCE 492 422
Provisioning 74 98
Other changes 7 (8) Utilisation (180) (20)
CLOSING BALANCE 393 492
€ '000 Total Not overdue < 30 days
30 - 60 days
60 - 90 days
90 - 180 days
Over 180 days
2021 11,280 9,544 994 444 50 123 125
2020 16,441 6,985 1,700 748 2,034 4,532 442
Overdue but not write-off

Explanatory notes to the Consolidated Financial Statements at 31 December 2021 Eurotech _________________________________________________________________________________________________________________________________________________________________________________________________________________________
36
Receivables over 180 days represented 1.1% of trade receivables at 31 December 2021, which is lower than the 2.7% relating to 2020. The Directors believe that though contained, the amount is still recoverable notwithstanding the extension of collection granted. There are no unexpired receivables, which provide for a deferred payment of more than 12 months.
7 – Tax receivables and payables Tax receivables represent receivables from individual governments for direct taxation (IRES and income taxes in various countries), which should be recovered within the next year, as well as receivables for withholdings made by the US companies following payment of interest charges on intragroup loans and dividends distributed to the Parent Company by Advanet Inc. Compared to 31 December 2020, the value decreased by €99 thousand, from €900 thousand in 2020 to €801 thousand in 2021. In 2021, part of the withholding taxes on dividends for a total €752 thousand were derecognised and written down, as it was not possible to use them in the period of their validity. Tax payables are made up of current taxes relating to the year still to liquidate and represent the amounts that the companies must pay to the tax authorities of the respective countries. These payables are calculated according to the tax rates currently in force in each country. Foreign tax payables amounted to €24 thousand (2020: €647 thousand) and Italian tax payables amounted to €191 thousand (2020: €163 thousand). Tax payables and receivables are offset if there is a legal right to do so.
8 – Other current assets The schedule below shows the breakdown of other current assets at 31 December 2021 and 31 December 2020:
Tax receivables mainly comprise receivables for indirect tax (VAT). VAT receivables do not bear interest and are generally settled with the competent tax authority on a monthly basis. Prepaid expenses relate to costs borne in advance for bank charges, maintenance fees, utilities, services and insurance.
(€'000)
at December 31, 2021
at December 31, 2020
Amounts receivable for grants 50 1
Advance payments to suppliers 185 209
Tax receivables 483 459
Other receivables 186 55Accrued income and prepaid expenses 1,226 941
TOTAL OTHER CURRENT ASSETS 2,130 1,665
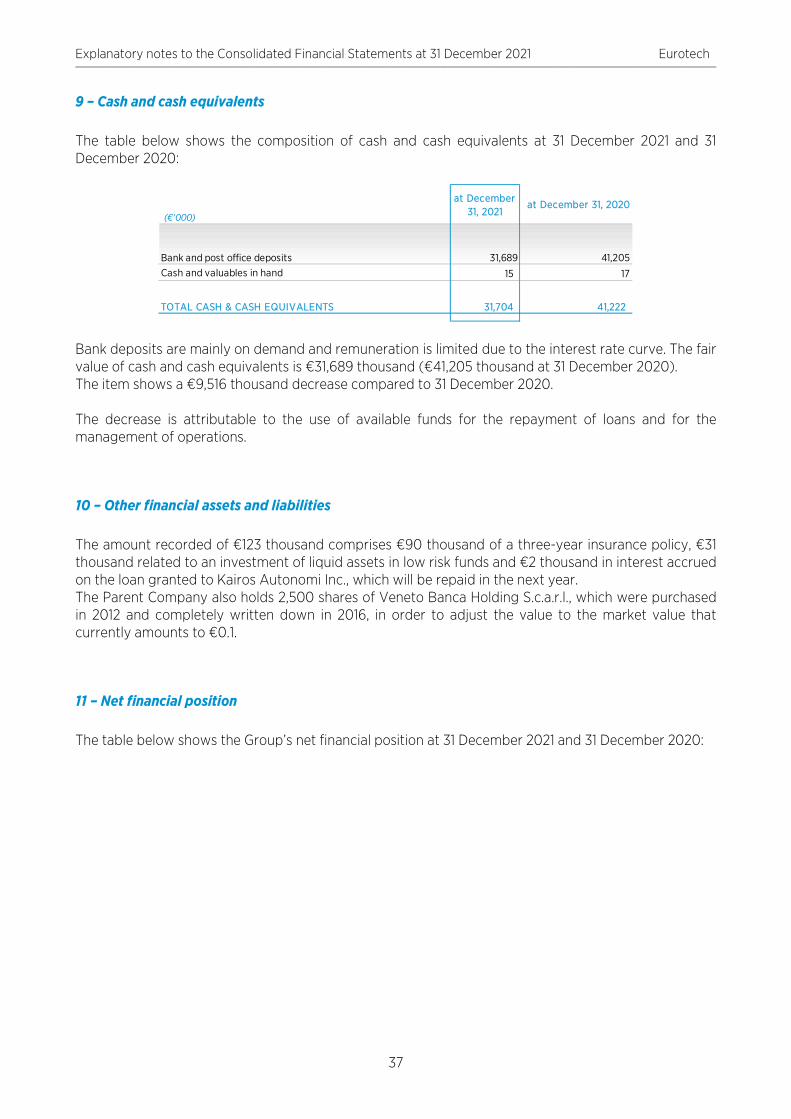
Explanatory notes to the Consolidated Financial Statements at 31 December 2021 Eurotech _________________________________________________________________________________________________________________________________________________________________________________________________________________________
37
9 – Cash and cash equivalents The table below shows the composition of cash and cash equivalents at 31 December 2021 and 31 December 2020:
Bank deposits are mainly on demand and remuneration is limited due to the interest rate curve. The fair value of cash and cash equivalents is €31,689 thousand (€41,205 thousand at 31 December 2020). The item shows a €9,516 thousand decrease compared to 31 December 2020. The decrease is attributable to the use of available funds for the repayment of loans and for the management of operations.
10 – Other financial assets and liabilities The amount recorded of €123 thousand comprises €90 thousand of a three-year insurance policy, €31 thousand related to an investment of liquid assets in low risk funds and €2 thousand in interest accrued on the loan granted to Kairos Autonomi Inc., which will be repaid in the next year. The Parent Company also holds 2,500 shares of Veneto Banca Holding S.c.a.r.l., which were purchased in 2012 and completely written down in 2016, in order to adjust the value to the market value that currently amounts to €0.1.
11 – Net financial position The table below shows the Group’s net financial position at 31 December 2021 and 31 December 2020:
(€'000)
at December 31, 2021
at December 31, 2020
Bank and post office deposits 31,689 41,205 Cash and valuables in hand 15 17
TOTAL CASH & CASH EQUIVALENTS 31,704 41,222

Explanatory notes to the Consolidated Financial Statements at 31 December 2021 Eurotech _________________________________________________________________________________________________________________________________________________________________________________________________________________________
38
The consolidated net financial position at 31 December 2021 amounted to net cash of €6.21 million, compared to a net financial position with net cash of €8.55 million at 31 December 2020. The adoption of the IFRS 16 accounting standard meant the recognition by Group companies of financial liabilities for rights of use at 31 December 2021 equal to €2.26 million (€3.00 million at 31 December 2020). At 31 December 2020, the company is complying with all covenants existing at 31 December 2021. The following table shows the reconciliation between the statement of financial position for liabilities arising from financing activities and the cash flow statement (IAS 7).
(€'000)
at December 31, 2021
at December 31, 2020
Cash A ( 31,704) ( 41,222)
Cash equivalents B - -
Other current financial assets C ( 123) ( 125)
Cash equivalent D=A+B+C ( 31,827) ( 41,347)
Current financial debt E 99 328
Current portion of non-current financial debt F 8,045 8,654
Short-term financial position G=E+F 8,144 8,982
Short-term net financial position H=G+D ( 23,683) ( 32,365)
Non current financial debt I 17,535 23,874
Debt instrument J - -
Trade payables and other non-current payables K - -
Medium-/long-term net financial position L=I+J+K 17,535 23,874
(NET FINANCIAL POSITION) NET DEBT ESMA M=H+L ( 6,148) ( 8,491)Medium/long term borrowing allowed to affiliates companies and other Group companies N ( 62) ( 57)
(NET FINANCIAL POSITION) NET DEBT P O=M+N ( 6,210) ( 8,548)
(€'000)
at January 1, 2021
Cash flows Business combinations
Fair value changes
Exchange differences
Other non monetary
transactions
at December 31, 2021
Short and Medium-/long-term borrowing 32,775 ( 7,570) - - ( 8) 475 25,672
Medium/long term borrowing allowed to affiliates companies and other Group companies ( 57) - - - ( 5) - ( 62)
Other current financial assets ( 125) 2 - - - - ( 123)
Derivative instruments 81 5 - ( 75) - - 11
Total Liabilities arising from financing activities 32,674 ( 7,563) - ( 75) ( 13) 475 25,498

Explanatory notes to the Consolidated Financial Statements at 31 December 2021 Eurotech _________________________________________________________________________________________________________________________________________________________________________________________________________________________
39
12 – Shareholders’ equity The schedule below shows the composition of shareholders’ equity at 31 December 2021 and 31 December 2020:
The share capital at 31 December 2021 was made up of 35,515,784 ordinary shares, wholly subscribed and paid up, with no nominal value. The balance of the Issuer’s legal reserve at 31 December 2021 was €1,776 thousand. The share premium reserve, which relates entirely to the Parent Company, is shown at a total amount of €136,400 thousand. The "Other Reserves" item for -€34,843 thousand includes different types of reserves as indicated in the statement of changes of the shareholders' equity in addition to the result for the year. The various reserves that make up the aggregate item are commented below. The positive translation reserve of €10,284 thousand is generated by inclusion in the consolidated financial statements of the statement of financial positions and income statements of US subsidiaries Eurotech Inc. and E-Tech USA Inc., as well and of UK subsidiary Eurotech Ltd. and Japanese subsidiary Advanet Inc. The “Other reserves” item was negative by €39,731 thousand and consisted of the Parent Company’s surplus reserve, formed by losses carried forward, allocations of retained earnings from prior years as well as other reserves of different origin. The change in the year is attributable to the allocation of 2020 results and the recognition of the Performance Share Plans as described in Note 16.
(€'000)
at January 1, 2020
Cash flows Business combinations
Fair value changes
Exchange differences
Other non monetary
transactions
at December 31, 2020
Short and Medium-/long-term borrowing 18,591 13,917 - - ( 169) 436 32,775
Medium/long term borrowing allowed to affiliates companies and other Group companies ( 89) 24 - - 8 - ( 57)
Other current financial assets ( 108) ( 17) - - - - ( 125)
Derivative instruments 44 - - 37 - - 81
Total Liabilities arising from financing activities 18,438 13,924 - 37 ( 161) 436 32,674
(€'000)
at December 31, 2021
at December 31, 2020
Share capital 8,879 8,879
Share premium reserve 136,400 136,400
Other reserves (34,843) (26,415)
Group shareholders' equity 110,436 118,864
Equity attributable to minority interest - -
Total shareholders' equity 110,436 118,864

Explanatory notes to the Consolidated Financial Statements at 31 December 2021 Eurotech _________________________________________________________________________________________________________________________________________________________________________________________________________________________
40
The cash flow hedge reserve, which includes cash flow hedges on the basis of IFRS 9, was negative for €6 thousand and decreased by a negative €75 thousand. The foreign exchange reserve in which – based on IAS 21 – foreign exchange differences relating to intragroup foreign-currency loans that constitute part of a net investment in foreign operations are recognised, was positive by €4,074 thousand. This reserve was increased by €2,877 thousand during the year. The Parent Company Eurotech S.p.A. held 89,920 treasury shares at the end of the year (at the end of 2020 it held 290,520). The changes, as indicated in the following table, relate to the allocation of shares following the Performance Share Plan.
13 – Basic and diluted earnings (losses) per share Base earnings (losses) per share (EPS) are calculated by dividing the income of the year pertaining to ordinary shareholders of the Parent Company by the average weighted number of ordinary shares in circulation during the year, net of treasury shares. No equity transactions were reported in the financial years 2020 and 2021 that diluted earnings per share. The schedule below shows earnings for the period and information on the shares used to calculate base and diluted EPS.
No. of shares Face value of a
share % share
capital Carrying value Average unit
value
(Thousand of Euro) (Thousand of Euro)
Status as at 1 January 2021 290,520 73 0.82% 682 2.35
Purchases - - 0.00% -
Sales - - 0.00% -
Assignment-Performance share Plan ( 200,600) ( 50) -0.56% ( 471) 2.35
Status as at 31 December 2021 89,920 23 0.25% 211 2.35

Explanatory notes to the Consolidated Financial Statements at 31 December 2021 Eurotech _________________________________________________________________________________________________________________________________________________________________________________________________________________________
41
14 – Borrowings The schedule below shows the breakdown of medium- to long-term financial payables at 31 December 2021:
Bank overdrafts Bank overdrafts are not backed by unsecured or secured warranties and include uses with the technical form of “subject to collection” and non-recourse liquidations. The amount includes financial liabilities as reverse factor for €92 thousand (€231 thousand in 2020).
at December 31, 2021
at December 31, 2020
Net income (loss) attributable to parent company shareholders ( 10,408,000) 132,000
Weighted average number of ordinary shares including own shares 35,515,784 35,515,784
Own shares ( 109,124) ( 372,189)
Weighted average number of ordinary shares except own shares 35,406,660 35,143,595
Weighted average number of ordinary shares except own shares for share diluted 35,406,660 35,143,595
Net income (loss):
- per share ( 0.294) 0.004
- per share diluted ( 0.294) 0.004
TYPE
(€'000)
CURRENT OUTSTANDINGS - (a) 247 92 92 - - -
Lease liabilities 3,010 2,265 1,173 1,092 1,092 -
TOTAL OTHER FINANCINGS - (b) 3,010 2,265 1,173 1,092 1,092 -
Unsecured loans Eurotech S.p.A. 27,383 19,520 5,952 13,568 13,568 -
Unsecured loans Advanet Inc. 2,134 3,795 920 2,875 2,875 -
TOTAL BANK DEBT - (c) 29,517 23,315 6,872 16,443 16,443 -
TOTAL OTHER FINANCING AND BANK DEBT - [(b) + (c)] 32,527 25,580 8,045 17,535 17,535 -
TOTAL DEBT - [(a) + (b) + (c)] 32,774 25,672 8,137 17,535 17,535 -
BALANCE ON 31.12.2020
COMPANY BALANCE
ON 31.12.2021
SHORT TERM within 12 months
Total Medium and
long-term
Mid term Over 12 months
Long term Over 5 years

Explanatory notes to the Consolidated Financial Statements at 31 December 2021 Eurotech _________________________________________________________________________________________________________________________________________________________________________________________________________________________
42
Other loans Other loans refer to:
• a residual debt of €2,265 thousand (of which €1,092 thousand medium-term) for leases accounted for in accordance with IRS 16 and also relating to financial debts that already existed at the beginning of the year in adoption of the previous IAS 17 for company vehicles purchased by the Parent Company and a server at the production site in Columbia (USA).
Bank loans Bank loans refer mainly to:
• some loans granted in 2020 and 2021 to Advanet Inc. by two local banks for a total remaining amount of €3,795 thousand, fully payable within 12 months for €920 thousand, to boost the Japanese company’s working capital;
• some loans granted to the Parent Company by various banks from 2019 to 2020 for a total remaining amount of €8,081 thousand (of which €3,219 thousand medium- to long-term) mainly to support the Group R&D investments or to boost the working capital of the Parent Company;
• some loans granted to the Parent Company by various banks in 2020, against the so-called "Cura Italia" loans for a total residual amount of €11,439 thousand (of which €10,349 thousand medium- to long-term) guaranteed by the Government or by SACE to support the investments and to boost the working capital of the Parent Company.
In order to manage interest rate risk, unsecured loans were entered into on a fixed-rate basis or were fully or partially covered by IRS. At 31 December 2021, there is no unsecured loan subject to economic/financial covenants. Other types of covenants were met at 31 December 2021. All bank loans out are denominated in euro apart from the loans granted to the Japanese subsidiary, which are in Japanese yen.
15 – Employee benefits The schedule below shows the breakdown of employee benefits at 31 December 2021 and 31 December 2020:
(€'000)
at December 31, 2021
at December 31, 2020
Employees' leaving indemnity 380 392
Foreing Employees' leaving indemnity 2,464 2,436
Employees' retirement fund - 90
TOTAL EMPLOYEES' BENEFITS 2,844 2,918

Explanatory notes to the Consolidated Financial Statements at 31 December 2021 Eurotech _________________________________________________________________________________________________________________________________________________________________________________________________________________________
43
Defined-benefit plans The Group has defined-benefit pension plans both in Italy and Japan, and these require contributions to a separately managed fund. As a result, the expected return of the assets servicing the defined-benefit plan was not booked to the income statement. The interest on the net liabilities of the defined-benefit plan (not including the plan assets) was, however, booked to the income statement. Interest is calculated using the discount rate used to measure the net assets or liabilities of the pension plan. In addition, the past service cost (not vested) can no longer be deferred to the future vesting period. All past service costs are instead recognised in the income statement at the date of the plan's amendment, or at the date of recognition of the related restructuring costs, or cessation of the employment relationship, whichever is earlier. With the move to IAS 19R, past service costs are recognised immediately in the income statement if the benefits vest immediately with the introduction or modification of the pension plan. The schedule below shows the breakdown of defined-benefit plans at 31 December 2021 and 31 December 2020:
The defined-benefit plans in force in Italy refer exclusively to employee severance indemnity. With adoption of the International Accounting Standards (IAS), and especially IAS 19, employee severance indemnity is considered a defined-benefit obligation whereby the liability is measured based on actuarial techniques. Pension plans in Japan are also considered as such and following the business combination the company valued the relative liability pursuant to IAS 19. Also, pursuant to the Italian "2007 Budget Law", employee severance indemnity accrued as of 1 January 2007 or as of the option date to exercise by the employees are included in the category of defined-benefit plans, both in the event of option for supplementary retirement and option for allocation to the treasury fund at INPS. The accounting treatment of employee severance indemnities is now similar to that used for other types of pension scheme contributions. The key assumptions used in determining the current value of defined-benefit plans are described below:
(€ '000)
at December 31, 2021
at December 31, 2020
at December 31, 2021
at December 31, 2020
Liabilities at start of period 392 343 2,436 2,164
Cost relating to present service 13 14 245 239
Past Service cost - - - -
Finance expense 3 2 9 6
Other changes - - ( 73) ( 88)
Benefits paid out ( 6) ( 8) ( 164) -
Actuarial loss (gain) reconised ( 22) 41 11 115
Liabilities at end of period 380 392 2,464 2,436
Italy Japan Defined benefit plans

Explanatory notes to the Consolidated Financial Statements at 31 December 2021 Eurotech _________________________________________________________________________________________________________________________________________________________________________________________________________________________
44
The following schedule summarises the change in the current value of defined-benefit plans at the end of the period, which, as indicated in the assessment standards, may not correspond with the recognised liability.
The following is the reconciliation of the current value of the obligation and the liability booked and the summary of the cost components recorded in the income statement.
Actuarial assumption
at December 31, 2021
at December 31, 2020
at December 31, 2021
at December 31, 2020
Discount Rate 1.27% 0.68% 0.40% 0.50%
Expected rates of future wages and salary increases 3.00% 3.00% 1.00% 1.00%
Expected rates of staff turnover 2.62% 2.36% 1.00% 1.00%
Duration 17 16 19 19
Defined benefit plans Italy Japan
(€ '000)
at December 31, 2021
at December 31, 2020
at December 31, 2021
at December 31, 2020
Projected benefit obligation at January 1, 392 343 2,436 2,164
Current Service cost 13 14 245 239
Past Service cost - - - -
Interest cost 3 2 9 6
Other changes - - ( 73) ( 88)
Pensions paid ( 6) ( 8) ( 164) -
Recognized actuarial gains or losses ( 22) 41 11 115
Projected benefit obligation at December 31 380 392 2,464 2,436
Italy Japan Defined benefit plans
(€ '000)
at December 31, 2021
at December 31, 2020
at December 31, 2021
at December 31, 2020
Projected benefit obligation 380 392 2,464 2,436
Unrecognized actuarial gains or losses - - - -
Provisions for pensions charged to balance sheet 380 392 2,464 2,436
Current Service cost 13 14 245 239
Past Service cost - - - -
Interest cost 3 2 9 6
Recognized actuarial gains or losses ( 22) 41 11 115
Costs charged to income statement ( 6) 57 265 360
Defined benefit plans Italy Japan

Explanatory notes to the Consolidated Financial Statements at 31 December 2021 Eurotech _________________________________________________________________________________________________________________________________________________________________________________________________________________________
45
Employees' retirement fund The employees' retirement fund refers to the charge that the subsidiary Eurotech France S.A.S. corresponds to employees if they are still employed by the subsidiary when they reach retirement age. As a result of the reduction in personnel in the French subsidiary and the definition of the amounts to be paid, the fund was used. With adoption of IFRS, the indemnity falls into the category of other long-term benefits to employees to be booked according to IAS 19. Results are recognised immediately in the income statement. The schedule below shows the breakdown of the employees' retirement fund at 31 December 2021 and 31 December 2020:
16 – Share-based payments “EUROTECH S.p.A. Performance Share Plan 2016” (hereinafter “PSP 2016”) On 22 April 2016, the Shareholders’ Meeting of the Company approved adoption of an incentive plan solely for individuals who have a directorship position and/or an employment contract and/or a freelance collaboration or consultancy agreement with Eurotech S.p.A. or one of its subsidiaries and who have key functions in the Group organisation chart; the plan is called “EUROTECH S.p.A. Performance Share Plan 2016”. The PSP 2016 provides that the beneficiaries identified by the Company’s Board of Directors be assigned the right (known as Unit) to receive Eurotech S.p.A. shares free of charge provided that on the Assignment Date they maintain a relationship with the Company or one of its subsidiaries. The Units assigned are subject to a retention period lasting 2 (two) years starting from the respective Assignment Date; during the Retention Period, the assigned Units cannot accrue unless the contract is terminated as a good leaver (for example: dismissed by the company not for just cause, death, the Beneficiary’s retirement and loss of the condition of Subsidiary by the employer company of the Beneficiary). In 2021, following the conclusion of the plan, all the shares decided upon and matured were assigned and there was no further assignment of units.
(€'000)
at December 31, 2021
at December 31, 2020
JANUARY 1, 90 97
Provision - - Utilization ( 90) ( 7)
RESERVE AT THE END OF THE PERIOD - 90

Explanatory notes to the Consolidated Financial Statements at 31 December 2021 Eurotech _________________________________________________________________________________________________________________________________________________________________________________________________________________________
46
At the reporting date the company had recorded a cost of €35 thousand in the income statement, whose contra entry was recognised in shareholders’ equity. From the beginning of the plan it has been recognised in the income statement and amounts to €2,257 thousand. “EUROTECH S.p.A. Performance Share Plan 2021-2023” (hereinafter “PSP 2021”) On 11 June 2021, the Shareholders’ Meeting of the Company approved adoption of an incentive plan solely for individuals who have a directorship position and/or an employment contract and/or a freelance collaboration or consultancy agreement with Eurotech S.p.A. or one of its subsidiaries and who have key functions in the Group organisation chart; the plan is called “EUROTECH S.p.A. Performance Share Plan 2021-2023". The PSP 2021 provides that the beneficiaries identified by the Company’s Board of Directors be assigned the right (known as Unit) to receive Eurotech S.p.A. shares free of charge (up to a maximum of 500,000 ordinary shares) provided that the Performance Objectives have been achieved on the respective Assignment Date and that the Relationship with the Company or with one of the Subsidiaries has been constant. The Objectives defined annually by the Board of Directors must be:
a) up to two objectives must be linked to the economic-financial performance of the Group in the medium-long term;
b) an objective must be linked to the trend of the market price of the Shares in the medium-long term (Total Shareholder Return).
The assigned Units are subject to a Vesting period of 3 (three) years during which the assigned Units may not vest, except in the case of termination in the event of Good Leaver (for example: dismissed by the company not for just cause, death, the Beneficiary’s retirement and loss of the condition of Subsidiary by the employer company of the Beneficiary). Subsequently, a portion equal to 20% of the vested shares will be subject to a lock-up period of 2 (two) years. With reference to the first cycle of the plan, the time period considered concerns the years 2021-2023 and the objectives identified (with target levels other than minimum and maximum) independent from each other are:
i the sum of the Group's consolidated EBIT; ii the consolidated turnover of the Group at the end of the 2023 financial year; iii the performance of the Total Shareholder Return of the Eurotech Shares compared to the
Total Shareholder Return of the shares of the companies belonging to the FTSE Italia STAR index.
The first two objectives are "non-market based" components (with a weight of 60% of the total rights assigned) while the third objective is a "market base" component (with a weight of 40% of the total rights assigned) linked the measurement of Eurotech performance in terms of TST with reference to the FTSE Italia STAR index.
No. Units granted
Value of the assign units
Value of the units for the
period No. Units
granted Value of the
assign units
Value of the units for the
period
(€'000) (€'000) (€'000) (€'000)
Perfornance Share Plan 2016
Nr. Unit at the begining of the period 200,600 722 35 364,600 1,153 492
Nr. Unit Granted during period - - - - - -
Nr. Unit Cancelled during period - - - ( 14,500) ( 55) ( 33)
Nr. Unit assigned during period ( 200,600) ( 722) - ( 149,500) ( 376) -
Nr. Unit Outstanding at the end of the period - - - 200,600 722 459
Year 2020Year 2021

Explanatory notes to the Consolidated Financial Statements at 31 December 2021 Eurotech _________________________________________________________________________________________________________________________________________________________________________________________________________________________
47
During 2021, 440,142 units were allocated.
At the reporting date the company had recorded a cost of €147 thousand in the income statement, whose contra entry was recognised in shareholders’ equity. The overall fair value of the first cycle of the Plan, determined on the assignment date by the Board (grant date of the first cycle) was equal to €1,056 thousand.
17 – Provisions for risks and charges The schedule below shows the breakdown of the provisions for risks and charges at 31 December 2021 and 31 December 2020:
Selling agents' commission fund The “selling agents' commission fund” is allocated based on the amounts envisaged by legislation and collective economic agreements regarding situations of interruption in the mandate given to agents. The effect of discounting the share of liabilities that will be liquidated beyond the next year is not expected to be significant. Directors’ termination fund The “directors’ termination fund” refers to the indemnity recognised for directors with powers set out in by the Bylaws of the Company or its subsidiaries. This indemnity is generally paid at the end of the
No. Units granted
Value of the assign units
Value of the units for the
period
(€'000) (€'000)
Perfornance Share Plan 2021
Nr. Unit at the begining of the period - - -
Nr. Unit Granted during period 440,142 2,065 147
Nr. Unit Cancelled during period - - -
Nr. Unit assigned during period - - -
Nr. Unit Outstanding at the end of the period 440,142 2,065 147
Year 2021
(€'000)
at December 31, 2021
at December 31, 2020
Selling agents' commission fund 27 76
Director termination fund 55 75
Guarantee reserve 365 370
Busting depreciable asset 486 402
Risk reserves 544 419
TOTAL FUNDS FOR COSTS AND FUTURE RISKS 1,477 1,342

Explanatory notes to the Consolidated Financial Statements at 31 December 2021 Eurotech _________________________________________________________________________________________________________________________________________________________________________________________________________________________
48
mandate of the Board in office and is allocated periodically for the relevant portion. In the course of 2021, the end-of-mandate compensation was paid, following the early departure of the Parent Company's CEO. Guarantee reserve The "guarantee reserve" is allocated based on the expectations of the charge to incur for non-fulfilment of the warranty commitment on products sold at year-end. Asset disposal reserve The "asset disposal reserve" was allocated in response to an obligation for future costs that a number of Japanese and English companies of the Group will incur in future years for the disposal, demolition, disassembly, and removal of a number of assets, and improvements to leased property, at the end of their useful lives or of the lease contract. The increase for 2021, refers to the obligation which arose on a leased property. Other risks reserves The "other risks reserve" is allocated on the basis of expected costs to be incurred for risks related to tax issues or legal dispute not yet settled. During the year, the reserve was increased by €488 thousand to cover the probable risk of paying indemnities to employees leaving the individual companies and by €21 thousand relating to a lawsuit with an employee of a subsidiary. The reserve was reduced due to the payment at the beginning of the year of the charges deriving from a tax audit carried out on the parent company. The schedule below shows the changes in the reserve for risks and charges in the years under review:
SELLING AGENTS' COMMISSION FUND
(€'000)
at December 31, 2021
at December 31, 2020
JANUARY 1, 76 66
Provision 1 13 Utilization ( 50) ( 3)
RESERVE AT THE END OF THE PERIOD 27 76

Explanatory notes to the Consolidated Financial Statements at 31 December 2021 Eurotech _________________________________________________________________________________________________________________________________________________________________________________________________________________________
49
DIRECTOR TERMINATION FUND
(€'000)
at December 31, 2021
at December 31, 2020
JANUARY 1, 75 140
Provision 102 41
Other ( 2) ( 2)Utilization ( 120) ( 104)
RESERVE AT THE END OF THE PERIOD 55 75
GUARANTEE RESERVE
(€'000)
at December 31, 2021
at December 31, 2020
JANUARY 1, 370 437
Provision - -
Other ( 16) ( 18)Utilization 11 ( 49)
RESERVE AT THE END OF THE PERIOD 365 370
BUSTING DEPRECIABLE ASSET
(€'000)
at December 31, 2021
at December 31, 2020
JANUARY 1, 402 417
Provision 84 2 Other - ( 17)
RESERVE AT THE END OF THE PERIOD 486 402
GENERIC RISK
(€'000)
at December 31, 2021
at December 31, 2020
JANUARY 1, 419 -
Provision 509 419
Other 2 - Utilization ( 386) -
RESERVE AT THE END OF THE PERIOD 544 419

Explanatory notes to the Consolidated Financial Statements at 31 December 2021 Eurotech _________________________________________________________________________________________________________________________________________________________________________________________________________________________
50
18 – Trade payables The schedule below shows the composition of trade payables at 31 December 2021 and 31 December 2020:
Trade payables at 31 December 2021 came to €13,005 thousand, decreasing by €2,358 thousand compared with 31 December 2020. Trade payables are non-interest bearing and, on average, are settled 90-120 days after invoice date.
19 – Other current liabilities The schedule below shows the composition of other current liabilities at 31 December 2021 and 31 December 2020:
Social security payables Social security payables refer to amounts due for social security contributions accrued and pertaining to the year. Advances for contributions Advances for contributions refer to prepayments made upon requests for contributions that were already accounted for and to be accounted for. Other payables The schedule below shows the breakdown of other payables at 31 December 2021 and 31 December 2020:
(€'000)
at December 31, 2021
at December 31, 2020
Third parties 12,518 10,302 Related companies 487 345
TOTAL TRADE PAYABLES 13,005 10,647
(€'000)
at December 31, 2021
at December 31, 2020
Social contributions 844 676
Other 4,688 4,771
Advances from customers 526 748
Grants advances 651 750
Other tax liabilities 523 464 Accrued expanses 961 1,706
TOTAL OTHER CURRENT LIABILITIES 8,193 9,115

Explanatory notes to the Consolidated Financial Statements at 31 December 2021 Eurotech _________________________________________________________________________________________________________________________________________________________________________________________________________________________
51
Amounts payable to employees refer to salaries and wages for the month of December 2021 and payable in the following month, as well as bonuses awarded to some categories of employees. Liabilities for holidays and leaves of absence refer to holidays and leaves accrued and not used by employees at the reporting dates. These recent payables include related contributions. Accrued expenses and deferred income The "accrued expenses and deferred income" item refers to the suspension of revenues that will have an economic recognition in future years. In particular, some revenues from services relating to the IoT business line will be recognised in 2022.
20 – Warranties The Eurotech Group had potential liabilities at 31 December 2021 deriving from sureties of €375 thousand granted by a number of credit institutions to Group companies.
H – Breakdown of key income statement items
For a note on trends in income statement items, and more specifically, on the basis of IFRS 15 relating to the different revenue disaggregation, please refer to the consolidated management report at 31 December 2021.
(€'000)
at December 31, 2021
at December 31, 2020
Employees 1,277 886
Vacation pay 1,195 1,194
Directors 994 576
Statutory auditors 261 195 Other 961 1,920
TOTAL OTHER PAYABLES 4,688 4,771

Explanatory notes to the Consolidated Financial Statements at 31 December 2021 Eurotech _________________________________________________________________________________________________________________________________________________________________________________________________________________________
52
21 – Costs of raw and auxiliary materials and consumables
The costs of raw and auxiliary materials and consumables shows an increase in the price of some intensively used components, but also affected by write-downs on inventory.
22 – Other operating costs
23 – Service costs
In the periods considered, the service costs recorded an increase of €1,473 thousand mainly due to non-recurring costs (which are entirely related to administrative services), which had an impact in the year 2021 alone for €1,357 thousand. Net of non-recurring costs, the reduction in costs for industrial services is matched by an increase in general and administrative costs.
(€'000)FY 2021 FY 2020
Purchases of raw materials, semi-finished and finished products 33,147 32,748
Changes in inventories of raw materials ( 503) 24 Change in inventories of semi-finished and finished products 1,026 ( 31)
TOTAL COST OF MATERIALS 33,670 32,741
(€'000) FY 2021 FY 2020
Service costs 13,623 12,150
- of which non recurrent costs 1,357 -
Rent and leases 386 404
Payroll 20,721 20,095
- of which non recurrent costs 488 -
Accruals and other costs 1,384 1,099
- of which non recurrent costs 577 - Cost adjustments for in-house generation of non-current assets ( 3,305) ( 3,483)
Operating costs net of cost adjustments 32,809 30,265
(€'000) FY 2021 FY 2020
Industrial services 4,579 4,991
Commercial services 1,817 1,894 General and administrative costs 7,227 5,265
Total costs of services 13,623 12,150

Explanatory notes to the Consolidated Financial Statements at 31 December 2021 Eurotech _________________________________________________________________________________________________________________________________________________________________________________________________________________________
53
24 – Payroll costs
The item indicating the payroll costs, in the period under analysis, shows an increase mainly due to non-recurring costs related to the reorganisation of the Group (€488 thousand). Net of non-recurring costs, the item wages, salaries and social security contributions increased by €138 thousand due to the increase in the number of employees and to some salary increases implemented during the year. The impact of accounting for the pro-rata temporis portion of the relative cost of the Performance Share Plans commented on in Note 16 was €182 thousand compared to €459 thousand in 2020. As shown in the schedule below, the exact number of Group employees increased at the end of the periods under review, from 323 in 2020 to 324 in 2021.
25 – Other provisions and costs
The amounts in the “doubtful debt provision” item refer to provisions made to the respective reserve to represent receivables at their realisable value.
(€'000) FY 2021 FY 2020
Wages, salaries and Social Security contributions 19,655 19,011
Employees' leaving entitlement and other personnel provisions 541 526 Other costs 525 558
Total personnel expenses 20,721 20,095
EMPLOYEESAverage 2021 at December
31, 2021Average
2020at December 31,
2020
Management 4.0 3 4.0 4
Clerical workers 296.1 299 293.9 296 Line workers 22.0 22 22.0 23
TOTAL 322.1 324 319.9 323
(€'000)
FY 2021 FY 2020
Doubful debt provision 74 98
Other Provisions 572 386 Other costs 738 615
Total accruals and other costs 1,384 1,099

Explanatory notes to the Consolidated Financial Statements at 31 December 2021 Eurotech _________________________________________________________________________________________________________________________________________________________________________________________________________________________
54
In 2021, no losses on receivables were recorded, while last year they amounted to €13 thousand. The "Provisions" item relates for €488 thousand to the costs arising from corporate reorganisation. In 2020, the provisions made covered costs related to a tax dispute.
26 – Other revenues
The contributions mainly relate to the definition of a project concluded in 2009 and which, following the final assessment by the local government authorities between the end of 2021 and the beginning of 2022, could be recognised as revenue for €357 thousand. The remaining amount of €22 thousand relates to research and development activities, which received funding from local governments as well as some funding for the employees and the training provided to employees. Other revenues mostly relate to releases of surplus funds, as was the case in 2020.
27 – Cost adjustments for internally generated non-current assets At 31 December 2021, cost adjustments for internally generated non-current assets (equal to €3,305 thousand) refers for €824 thousand to the cost incurred internally for the development of new circuit boards for a high-performance, low-consumption processor; for €1,562 thousand to the cost incurred by the Parent Company and the subsidiary Eurotech Inc. for new Cloud platform products; for €276 thousand mainly to payroll costs incurred for the implementation of the new ERP system; for €605 thousand to costs related to new development projects and for €38 thousand to internal constructions for property, plant and equipment. Total adjustments for internal increases comprise €1,470 thousand in payroll costs (2020: €1,781 thousand), €1,487 thousand in service costs (2020: €1,515 thousand), €348 thousand in materials costs (2020: €187 thousand).
28 – Depreciation, amortisation and write-downs
(€'000)FY 2021 FY 2020
Government grants 379 257 Sundry revenues 205 122
Total other revenues 584 379
(€'000) FY 2021 FY 2020
Amortisation of intangile assets 2,745 2,131
Amortisation of property, plant and equipment 1,829 1,911 Write-down of fixed assets 266 151
Total amortisation and depreciation 4,840 4,193

Explanatory notes to the Consolidated Financial Statements at 31 December 2021 Eurotech _________________________________________________________________________________________________________________________________________________________________________________________________________________________
55
Amortisation of intangible assets relates mainly to development costs and, to a lesser extent, the software licenses. Depreciation of property, plant and equipment includes €584 thousand for the portion pertaining to the period. The remaining €1,245 thousand relate to the depreciation due to the use of certain capital goods (€1,362 thousand related to 2020). The write-down of fixed assets is attributable for €19 thousand to the write-down of the building in Caronno Varesino to adjust it to the realisable value and for €61 thousand to the write-down of fixed assets with rights of use due to the decision not to use a leased building further than the natural expiry date of the contract and of development costs whose results are no longer deemed usable. In 2020, the write-down concerned for €60 thousand the write-down of the building in Caronno Varesino and for €91 thousand the write-down of development costs.
29 – Financial income and charges
The trend of financial management is annually affected by the exchange rate management that in the financial year 2021 had a net positive effect of €79 thousand (2020: negative effect of €192 thousand). Exchange rate performance is influenced by the booking of realised and unrealised gains and losses on the main foreign currents in which the Group operates (USD, GBP and JPY). The unrealised exchange differences totalled €200 million. The interest expense was down due to less use of lines of credit. Income from the management of interest income and other financial income is lower due to the elimination of interest income on bank accounts receivable.
30 – Valuation and management of equity investments Management of equity investments In 2021, the write-down of a minority interest in a Business Network had an economic effect of €3 thousand. In 2020, the capital gain resulted from the sale of a minority interest (Inasset S.r.l.).
€'000FY 2021 FY 2020 change
%
Exchange-rate losses 806 976 -17.4%
Interest expenses 306 361 -15.2%
Interest expenses on lease liabilities 44 44 0.0%
Expenses on derivatives 55 36 52.8%Other finance expenses 84 44 90.9%
Financial charges 1,295 1,461 -11.4%
Exchange-rate gains 885 784 12.9%
Interest income 1 5 -80.0%Other finance income 10 4 150.0%
Financial incomes 896 793 13.0%

Explanatory notes to the Consolidated Financial Statements at 31 December 2021 Eurotech _________________________________________________________________________________________________________________________________________________________________________________________________________________________
56
31 – Income taxes for the year Income taxes were negative for €2,419 thousand in 2021, while they were also negative for €1,700 thousand in 2020
The schedule below shows the breakdown in income taxes, distinguishing current taxes from deferred tax assets and liabilities and taxes related to Italian legislation from foreign taxes of Group companies:
Income taxes at 31 December 2021 represented a cost for a total of €2,419 thousand (of which €1,203 thousand for current taxes and €1,178 thousand for net deferred tax liabilities), compared to total tax assets of €1,700 thousand at 31 December 2020 (of which €1,223 thousand for current taxes and €477 thousand for net deferred tax liabilities), recording a change of €719 thousand. The IRES item amounted to €1,014 thousand due to the derecognition and write-down of receivables for withholdings on foreign dividends as they are no longer recoverable due to the expiry of the terms in which they may be used. In 2021, as already happened in 2020, no new deferred tax credits were recognised as regards the tax losses, which therefore remained recorded only for the part accounted for up to 2019 and which are believed to be used in future years based on the results of the business plan. The Group incurred tax and ACE losses in the past years, and for some companies in 2021 - arising from the Parent Company and the subsidiaries EthLab S.r.l., E-Tech USA Inc., Eurotech Inc., I.P.S. Sistemi
(€'000) FY 2021 FY 2020
Pre-tax result (7,989) 1,832 Income taxes (2,419) (1,700)
(€'000) FY 2021 FY 2020
IRES (Italian corporate income tax) 1,014 179
IRAP (Italian Regional business tax) 88 38 Foreign current income taxes 101 1,006
Total current income tax 1,203 1,223
Net (prepaid) deferred taxes: Italy 776 (34) Net (prepaid) deferred taxes: Non-italian 402 511
Net (prepaid) deferred taxes 1,178 477
Previous years taxes 38 -
Previous years taxes 38 -
TOTAL INCOME TAXES 2,419 1,700

Explanatory notes to the Consolidated Financial Statements at 31 December 2021 Eurotech _________________________________________________________________________________________________________________________________________________________________________________________________________________________
57
Programmabili S.r.l., Eurotech France SA and Eurotech Ltd., against which no deferred tax assets, for €41.8 million (2020: €34.7 million) were recognised - to be reported within the deadlines applicable in each country to offset future taxable profits of the companies in which these losses arise. No deferred tax assets were recognised in relation to these losses as the prerequisites for using them to offset taxable profits in a reasonable period of time. At 31 December 2021, there were no deferred tax liabilities, posted or unposted, for taxes on the undistributed earnings of some subsidiaries or affiliates because there are no assumptions regarding distribution. The reconciliation of income taxes applicable to the Group's pre-tax profit, using the rate in force, with the effective rate for the year ended 31 December 2021, is as follows:
Deferred tax assets at 31 December 2021 amounted to €6,504 thousand (€7,478 thousand at 31 December 2020) while deferred tax liabilities amounted to €3,200 thousand (€3,166 thousand at 31 December 2020) and are detailed as follows:
€ '000 FY 2021 FY 2020
Pre-tax result (7,989) 1,832
Theoretical income tax rate 24% 24%
Theoretical corporate income tax (1,917) 440
Effect of foreign rates 121 280
Impact of taxes relating to prior periods (76) (2)
Non-taxed income and non-deductible expenses 1,267 137
Interest deductible in future periods 0 (67)
Impact of tax losses (280) 0
Impact of permanent differences and unrecognized temporary differences 339 54
Impact of temporary differences not recognized in previous years 0 0
Effect of change in tax rates 25 (70)
DTA not recognises 1,840 389
Allowance for Corporate Equity 0 0
R&D credit 5 (11)
Other current taxes 1,003 174
Local taxes trough profit or loss 92 376
Total income taxes through profit or loss 2,419 1,700
Current taxes 1,203 1,223
Total defferred taxes 1,178 477
38 0

Explanatory notes to the Consolidated Financial Statements at 31 December 2021 Eurotech _________________________________________________________________________________________________________________________________________________________________________________________________________________________
58
I – Other information
32 – Related-party transactions The consolidated financial statements include the financial statements of Eurotech S.p.A., its subsidiaries and its affiliates shown in the schedule below:
€ '000
Sundry impairment
losses
Product warranty
Employees' leaving
indemnity
Carry forward tax
lossesR&D credit
Other tempory
differences
Transfer of taxes
Total
at December 31, 2019 483 80 746 3,920 1,325 2,595 (1,168) 7,981
Changes in 2020
-Business combination 0 0 0 0 0 0 0 0
- Through profit or loss 60 (18) 114 (863) (142) (80) 0 (929)
- Other changes 0 0 0 0 0 0 723 723
-Exchange rate differences 0 0 (26) 0 (112) (159) 0 (297)
at December 31, 2020 543 62 834 3,057 1,071 2,356 (445) 7,478
Changes in 2021
-Business combination 0 0 0 0 0 0 0 0
- Through profit or loss (77) (6) (17) (277) 68 (225) 0 (534)
- Other changes 0 0 0 0 0 0 (585) (585)
-Exchange rate differences 0 0 (24) 0 89 80 0 145
at December 31, 2021 466 56 793 2,780 1,228 2,211 (1,030) 6,504
€ '000
Business combination
R&D costs
Unrealised foreign
exchange gains or
Other temporary differences
Transfer of taxes
Total
at December 31, 2019 (3,039) (77) (1,065) (84) 1,168 (3,097)
Changes in 2020
-Business combination 0 0 0 0 0 0
-Through profit or loss 63 (299) 753 26 0 543
- Other changes 0 0 0 0 (723) 0
-Exchange rate differences 107 4 0 0 0 111
at December 31, 2020 (2,869) (372) (312) (58) 445 (3,166)
Changes in 2021
-Business combination 0 0 0 0 0 0
-Through profit or loss 0 (14) (694) 0 0 (708)
- Other changes 0 0 0 0 585 0
-Exchange rate differences 86 (1) 0 4 0 89
at December 31, 2021 (2,783) (387) (1,006) (54) 1,030 (3,200)

Explanatory notes to the Consolidated Financial Statements at 31 December 2021 Eurotech _________________________________________________________________________________________________________________________________________________________________________________________________________________________
59
The following schedule shows related-party transactions (in the period in which they were related), not derecognised on consolidation.
The following is information on equity investments held in the company and its subsidiaries by members of the management and supervisory bodies, general managers and managers with strategic responsibilities, as well as by their spouses not legally separated and their minor children, directly or via companies controlled, trustee companies or via an interposed third party, as shown by the shareholder register, notifications received and other information acquired from the members of the management and supervisory bodies, general managers, and strategically accountable managers in compliance with the requirements of Art. 79 of CONSOB Regulation no. 11971/99 as subsequently amended and Annex 3C of the same regulation.
Name
Location Currency % of ownership
31.12.2021 % of ownership
31.12.2020
Subsidiaries
Aurora S.r.l. Italy Euro 100.00% 100.00%
I.P.S. Sistemi Programmabili S.r.l. Italy Euro 100.00% 100.00%
ETH Lab S.r.l. Italy Euro 100.00% 100.00%
Eurotech France S.A.S. France Euro 100.00% 100.00%
Eurotech Ltd. UK GBP 100.00% 100.00%
E-Tech Inc. United States USD 100.00% 100.00%
Eurotech Inc. United States USD 100.00% 100.00%
Advanet Inc. Japan Yen 90.00% (1) 90.00% (1)
Affiliated companies
Rotowi Technologies S.p.A. in liquidation (ex U.T.R.I. S.p.A.) (2) Italy 21.32% 21.32%
(2) Company in liquidation
(1) The percentage of formal possession is 90%, but due to the possession by Advanet of 10% of the share capital in the form of treasury shares, it is fully consolidated
RELATED PARTIES
Revenues to related parties
Interest to related parties
Purchases from related parties
Financial receivables to related parties
Receivables from related parties
Payables from related parties
Other related partiesBluenergy Assistance srl 11 - - - 1 - Kairos Autonomi - 1 - 64 - - Interlogica srl - - 887 - - 487 Long Term Partners SRL - - 86 - - -
Total 11 1 974 64 1 487
Total with related parties 11 1 974 64 1 487
% impact on line item 0.0% 0.1% 2.1% 34.6% 0.0% 3.7%

Explanatory notes to the Consolidated Financial Statements at 31 December 2021 Eurotech _________________________________________________________________________________________________________________________________________________________________________________________________________________________
60
33 – Financial risk management: objectives and criteria The Group’s financial instruments, other than derivative contracts, include bank loans in the various technical forms, financial leases, short-term and at-sight bank deposits. These instruments are intended to finance Group operations. The Group has several other receivable and payable financial instruments at its disposal, such as trade receivables arising from operations and liquidity. The Group had also transactions in derivatives, mainly swap or collar transactions on interest rates. The objective is to manage interest rate risks caused by Group transactions and by its sources of finance. In accordance with Group policies, no speculative derivatives have been entered into. The main risks generated by Group financial instruments are interest rate risks, exchange risks, liquidity risks and credit risks. The Board of Directors has reviewed and agreed to the policies for managing these risks, as summarised below. Interest rate risk The Group’s exposure to the risk of interest rate fluctuations mainly involves medium-term obligations taken on by the Group, featuring variable interest rates linked to various indices. In previous years, the Group signed interest rate swap contracts providing for recognition of a variable rate against payment of a fixed rate. The contracts are designated to hedge changes in the interest rates in place on some loans. Group policy is to maintain between 30% and 60% of its loans at a fixed rate. At 31 December 2021, approximately 35.1% of the Group's loans were at fixed rates (in 2020, the percentage was around 33.5%). As for the loan in place at the Japanese company, it was taken up at fixed rate since it is more advantageous than those at variable rate.
Name Nomination Company Possessory
title
Share at January 1 or appointment
Share acquired in the period
Share disposed in the period
Share at the end of the
period
of which shares at the
end of the period
indirectly
Mapelli Patrizio President Eurotech - - - - - -
Fumagalli Aldo Director andVice President Eurotech - - - - - Chawla Paul Director from April 7, 2021 Eurotech Ownership 35,450 38,800 - 74,250 -
Costaguta Marco Director Eurotech - - - - - -
Mio Chiara Director Eurotech - - - - - -
Marti Antongiulio Director Eurotech - - - - - -
Curti Susanna Director Eurotech - - - - - -
Filippini Mariagrazia Director Eurotech - - - - - -
Rovizzi Laura Director Eurotech - - - - - -
Siagri Roberto CEO up to March 23, 2021 Eurotech Ownership (*)
503,770 - -
Monti Fabio President of Board of Statutory Auditors
Eurotech - - - - - -
Savi Daniela Statutory Auditor Eurotech - - - - - -
Monterisi Pietro Statutory Auditor from June 23, 2021
Eurotech - - - - - -
Rebecchini Gaetano Statutory Auditor up to June 23, 2021
Eurotech - - - - - -
Strategic Managers Eurotech Ownership (**)
- 41,000 - 41,000 -
at December 31, 2021
(*) From the date of the identification of the Strategic Manager (*) Shares owned at the end of office

Explanatory notes to the Consolidated Financial Statements at 31 December 2021 Eurotech _________________________________________________________________________________________________________________________________________________________________________________________________________________________
61
Exchange rate risk In view of the significant investment transactions in the US, Japan and the UK, with substantial foreign currency cash flows from business and financial operations, the Group’s financial statements could be significantly affected by changes in the USD/EUR, JP¥/EUR and GBP/EUR exchange rates. During the year, no foreign exchange hedges were executed because of the uneven USD, GBP and JP¥ flows, particularly taking into account that the individual subsidiaries tend to operate in their respective functional currencies in their respective core markets. About 75.8% of sales of goods and services (2020: 73.0%) and 62.4% (2020: 65.4%) of the cost of goods purchases and the operating costs of the Group are denominated in a different currency from the functional currency used by the Parent Company to draw up these Consolidated financial statements. Product and component price risk Group exposure to price risk is not significant. Credit risk The Group trades only with known and reliable customers. The Group’s policy is to check the creditworthiness grade of customers that request extended payment arrangements. In addition, the balance of receivables is monitored during the year so that the amount of non-performing positions is not significant. The maximum exposure to risk is shown in Note 6. Only some receivables of the main customers are insured. Financial assets, recorded by trading date, are recognised in the financial statements net of write-downs calculated according to the risk of counterparty default, taking into account the information available on the customer's level of solvency and historical data. With regard to the significant concentration of credit risk in the Group, there have been situations in the last 3 years where the largest customer generated more than 15% of the Group's revenues. More specifically, in 2021 a single Group customer generated approximately 30.0% of the Group’s turnover. Credit risk concerning other Group financial assets, which include cash and cash equivalents and financial instruments, presents a maximum risk equal to the book value of these assets in the event of insolvency of the counterparty. The recent international events related to the spread of the COVID-19 virus have increased the risk of insolvency, especially with reference to smaller companies. Since there has been an increase in the supply of products and services to international customers in recent years may curb said risk under extreme conditions. Liquidity risk The objective of the Group is to strike a balance between maintenance of funds and flexibility through the use of overdrafts, loans, as well as via equity financing in the market. Group policy states that no more than 40% of loans must fall due within 12 months. At 31 December 2021, 29.8% of Group financial payables will accrue within one year (2020: 26.0%), based on the balances of the original plans. Considering the current net financial position and the structure of working capital, the risk that the Group will be unable to honour its financial liabilities is limited. The Company systematically controls liquidity risk by analysing a specific reporting system and the economic environment; the uncertainties that are a periodic feature of the financial markets require a particular focus on liquidity risk management. With this in mind, initiatives have been taken to generate financial resources with business operations and to maintain an adequate level of available liquidity, to ensure a normal level of operations and to respond to the strategic decisions of the next few years. The Group therefore plans to respond to the requirements of payables falling due and planned investments via flows from business operations, available cash and, as necessary, via bank loans and other forms of funding.

Explanatory notes to the Consolidated Financial Statements at 31 December 2021 Eurotech _________________________________________________________________________________________________________________________________________________________________________________________________________________________
62
Capital management The aim of Group capital management is to ensure that adequate levels of the capital indicators are maintained in order to sustain the business and achieve maximum value for shareholders. The Group manages the capital structure and modifies it according to changes in economic conditions. Group policy does not currently include the distribution of dividends. To maintain or upgrade the capital structure, the Group may reimburse capital or issue new securities. No change was made to the objectives, policies, or procedures during the years 2020 and 2021. The Group will periodically verify its capital using a debt/capital ratio, i.e. the ratio of net debt to total equity plus net debt. Currently, given the decidedly unstable global financial situation, it is not easy to obtain financing from lending institutions, although the parameters set by management policy remain valid. Group policies should aim to maintain the debt/capital ratio at between 20% and 40%. Group net debt includes interest-bearing loans and payables for equity investments, net of cash and cash equivalents. Capital includes the capital attributable to Parent Company shareholders, net of undistributed net profits.
34 – Financial Instruments Measurement of fair value and relative hierarchical valuation levels All financial instruments recognised at fair value are classified within the following three categories: Level 1: market price Level 2: valuation techniques (based on observable market data) Level 3: valuation techniques (not based on observable market data).
€ '000
Less 12 months
1 to 2 yeears 3 to 5 years > 5 years Total
Borrowings 6,964 6,690 9,753 - 23,407
Trade payables and other liabilities 21,198 - - - 21,198
Contratti per beni in leasing 1,173 760 332 - 2,265
Fianancial derivatives - 8 3 - 11
Total as of December 31, 2021 29,335 7,458 10,088 - 46,881
(€'000)
at December 31, 2021
at December 31, 2020
Other current and non current financial assets (185) (182)
Derivative instruments 7 81
Borrowing 25,672 32,775
Cash & cash equivalents (31,704) (41,222)
Net financial position (6,210) (8,548)
Group Equity 110,436 118,864
Group Equity 110,436 118,864
EQUITY AND NET FINANCIAL POSITION 104,226 110,316
Net financial position on Equity -5.6% -7.2%

Explanatory notes to the Consolidated Financial Statements at 31 December 2021 Eurotech _________________________________________________________________________________________________________________________________________________________________________________________________________________________
63
The fair value of derivatives and of loans obtained has been calculated by discounting expected cash flows to present value applying prevailing interest rates. The fair value of the other financial assets was calculated by using market interest rates. As IFRS 13 requires, for each of the financial assets and liabilities the company analysed the effect of their measurement at fair value. The measurement process refers to Level 3 of the fair value hierarchy, except for trading in derivatives as described in greater detail hereunder, and revealed no considerable differences compared to the book values at 31 December 2021 and on the respective comparison figures. At 31 December 2021, the Group held the following financial instruments measured at fair value:
It should be noted that all assets and liabilities that are measured at fair value at 31 December 2021 are classified in hierarchical level 2 of fair value measurement. In addition, during 2021 there were no transfers from Level 1 to Level 2 or Level 3, or vice versa. Financial instruments by category As required by IFRS 7, the financial instruments are listed by category below:
The fair value of the financial assets and liabilities does not significantly differ from the book values.
(€'000)
Notional value at December 31,
2021
Fair value at December 31,
2021 (debit)
Fair value at December 31, 2021 (credit)
Notional value at December 31,
2020
Fair value at December 31, 2020 (debit)
Fair value at December 31, 2020 (credit)
Cash flow hedge
Contracts Interest Rate Swap (IRS) 6,398 0 (7) 10,965 0 (81)
(€'000)
Financial assets at fair value through profit or
loss
Financial assets at fair value through equity
Financial assets and receivables
carried at amortized cost
Total
(€'000)
Financial liabilities at fair value through
profit or loss
Financial liabilities at fair value through
equity
financial liabilities carried at
amortized costTotal
Asstes as per balance sheet Liabilities as per balance sheet
Derivative financial instruments 4 4
Trade and other receivables exluding pre-payments - - 11,280 11,280
Borrowings (excluding finance lease liabilities - - 23,407 23,407
Investments in other companies 542 - - 542 Finance lease liabilities - - 2,265 2,265
Other current financial assets 35 - 88 123 Derivative financial instruments 11 - 11
Cash & cash equivalents - - 31,704 31,704 Trade and other payables exluding non-financial liabilities - - 13,005 13,005
Total 577 4 43,072 43,653 Total - 11 38,677 38,688
at December 31, 2021
(€'000)
Financial assets at fair value through profit or
loss
Financial assets at fair value through equity
Financial assets and receivables
carried at amortized cost
Total
(€'000)
Financial liabilities at fair value through
profit or loss
Financial liabilities at fair value through
equity
financial liabilities carried at
amortized costTotal
Asstes as per balance sheet Liabilities as per balance sheet
Trade and other receivables exluding pre-payments - - 16,441 16,441
Borrowings (excluding finance lease liabilities - - 29,778 29,778
Investments in other companies 533 - - 533 Finance lease liabilities - - 2,997 2,997
Other current financial assets 34 - 91 125 Derivative financial instruments 81 - 81
Cash & cash equivalents - - 41,222 41,222 Trade and other payables exluding non-financial liabilities - - 10,647 10,647
Total 567 - 57,754 58,321 Total - 81 43,422 43,503
at December 31, 2020

Explanatory notes to the Consolidated Financial Statements at 31 December 2021 Eurotech _________________________________________________________________________________________________________________________________________________________________________________________________________________________
64
Interest rate risk Interest on financial instruments classified as variable-rate instruments is recalculated periodically during the financial year. Interest on financial instruments classified as fixed-rate instruments is kept constant until the maturity date of the instruments concerned. Hedging Cash flow hedges At 31 December 2021, the Group held six IRS contracts (of a notional contractual value of €11.0 million) of which two were signed during the year; all six contracts are designated as interest rate risk hedging instruments.
Interest rate swap contract conditions were negotiated to coincide with the conditions of the underlying commitments. The accounting treatment of these financial instruments entailed a decrease in shareholders' equity of €75 thousand and decreased the cash flow hedge reserve as a direct reduction of shareholders' equity to €6 thousand.
35 – Non-recurring costs and revenues In 2021, the company incurred costs that it identified as non-recurring in relation to ordinary operations and that it has disclosed separately in the financial statements and in the notes to the individual items of the income statement. In particular, as mentioned several times, the total value of non-recurring costs was €2.53 million and mainly related to the economic agreement resulting from the termination of the relationship between Eurotech S.p.A. and the previous CEO, finalised on 23 March 2021, as well as of some costs for reorganising the workforce and for some company facilities, incurred and to be incurred at Group level, in an amount that was less than the costs associated with the new CEO's appointment.
Due date Fixed rate Floating rate Market value(€'000)
Interest rate swap contracts
Euro 833,757.00 30 May 2022 0.10% Euribor 3 months (1)
Euro 1,562,500.00 31 March 2023 0.01% Euribor 3 months (6)
Euro 2,000,000.00 31 July 2025 -0.20% Euribor 3 months (3)
Euro 2,000,000.00 30 September 2026 -0.14% Euribor 3 months 4
TOTAL (6)

Explanatory notes to the Consolidated Financial Statements at 31 December 2021 Eurotech _________________________________________________________________________________________________________________________________________________________________________________________________________________________
65
36 – Potential liabilities There are no significant potential liabilities to report except for what is stated in Note 17.
37 – Information requested on the basis of Italian law no. 124/2017 With reference to the requirements under Italian law no. 124/2017, Art. 125, the grants received by the companies governed by Italian law only that belong to the Group are presented on the basis of the “cash method”:
38 – Events after the reporting period In February 2022, the international scenario was characterised by the beginning of the war conflict in Ukraine and by the subsequent economic sanctions that were applied to Russia, held responsible for the start of the conflict and the invasion of a sovereign state. These economic sanctions were followed by
(€'000) FY 2021
Service costs 1,357
Payroll 488
Accruals and other costs 577 Write-down of fixed assets 61
Non-recurrent costs 2,483
COMPANY LENDING INSTITUTION PROJECT DESCRIPTIONRECEIVED AMOUNT
Eurotech S.p.A.:
European social fund
National framework regime on State aid - COVID 19 (Articles 54-61 of the Recovery Decree as amended by art. 62 of Decree Law 104/2020) 13
GSE Photovoltaic system 3 Others residual 3
ETH Lab: Provincia autonoma di Trento Legge Provinciale n. 6/99 e s.m. - Art. 5 - Aid
for the promotion of research and development 357
Advanet: Others residual 3
379
at December 31, 2021
RECEIVED GRANTS

Explanatory notes to the Consolidated Financial Statements at 31 December 2021 Eurotech _________________________________________________________________________________________________________________________________________________________________________________________________________________________
66
actions undertaken by the Russian government, which resulted in the limitation of exports to various countries including those of the European Union. These circumstances, which are extraordinary in their nature and extent, may have direct and indirect repercussions on world economic activity and have begun to create a context of general uncertainty, the evolution and effects of which are currently unpredictable. The potential effects of this on the financial statements cannot be currently determined and the situation will be constantly monitored over the course of 2022. The Group is not involved in direct relationships with customers in the area affected by the conflict but the indirect effects due to increases in energy costs and/or shortage of raw materials can economically impact the Group's results. Despite this, the Group's solid financial position, as well as the fact that it is not involved in business with Russian and/or Ukrainian customers, suggests that there are sufficient elements not to jeopardise the Group's ability to continue as a going concern. No further significant events took place after the closing of the Consolidated Financial Statements at 31 December 2021. Amaro, 15 March 2022 On behalf of the Board of Directors The Chief Executive Officer Mr. Paul Chawla

Annex I – Information provided pursuant to Art. 149-duodecies of the CONSOB Issuers' Regulation Eurotech _________________________________________________________________________________________________________________________________________________________________________________________________________________________
67
Annex I – Information provided pursuant to Art. 149-duodecies of the CONSOB Issuers’ Regulation
The schedule below has been prepared in accordance with Art. 149-duodecies of the CONSOB Issuers’ Regulation and shows the amounts paid in 2021 for the auditing services.
.
(€) Service provider 2021 fees
Audit
PricewaterhouseCoopers S.p.A. Parent company - Eurotech S.p.A. 153,625
Network PricewaterhouseCoopers Subsidiaries 143,761
Other services TLS Associazione Professionale di Avvocati
e Commercialisti Parent company - Eurotech S.p.A. 32,950
TOTAL 330,336
Eurotech Group entity

Declaration of the Financial Reporting Manager Independent Auditor's report on the Consolidated Financial Statements Eurotech _________________________________________________________________________________________________________________________________________________________________________________________________________________________
68
Certification of the Consolidated Financial Statements pursuant to Art. 154-bis of Italian Legislative Decree of 24 February 1998, no. 58
Amaro, 15 March 2022 1. We the undersigned, Paul Chawla, in the capacity as Chief Executive Officer and Sandro Barazza, in the
capacity as Financial Reporting Manager of Eurotech S.p.A., hereby attest, pursuant to Art. 154-bis, paragraphs 3 and 4 of Italian Legislative Decree no. 58 of 24 February 1998, to: - the adequacy in relation to the characteristics of the company and - the actual implementation of administrative and accounting procedures for the drafting of the
financial statements during the financial year 2021. 2. The assessment of the adequacy of the administrative and accounting procedures for the formation of
the Consolidated Financial Statements at 31 December 2021 is based on a model defined by Eurotech in line with the CoSO framework (document in the CoSO Report) and also takes into account the document “Internal Control over Financial Reporting – Guidance for Smaller Public Companies”, both prepared by the Committee of Sponsoring Organizations of the Treadway Commission that represent a generally accepted reference framework on the international level.
3. We furthermore attest that:
3.1 the Consolidated Financial Statements at 31 December 2021: - were prepared in compliance with the international accounting standards recognised in the
European Union pursuant to Regulation (EC) no. 1606/2002 of the European Parliament and of the Council, dated 19 July 2002;
- correspond to the results in the corporate books and accounting records; - provide a fair and true representation of the assets, liabilities, financial position and profit or loss
of the Issuer and of all its consolidated companies.
3.2 The management report includes a fair review of the development and performance of the business and the situation of Eurotech as the Issuer and of all its consolidated companies, together with a description of the principal risks and uncertainties that they face.
Chief Executive Officer Financial Reporting Manager Paul Chawla Sandro Barazza

Independent Auditor’s Report Eurotech _________________________________________________________________________________________________________________________________________________________________________________________________________________________
69
Independent Auditor’s report on the Consolidated Financial Statements

Independent Auditor’s Report Eurotech _________________________________________________________________________________________________________________________________________________________________________________________________________________________
70

Independent Auditor’s Report Eurotech _________________________________________________________________________________________________________________________________________________________________________________________________________________________
71

Independent Auditor’s Report Eurotech _________________________________________________________________________________________________________________________________________________________________________________________________________________________
72

Independent Auditor’s Report Eurotech _________________________________________________________________________________________________________________________________________________________________________________________________________________________
73

Independent Auditor’s Report Eurotech _________________________________________________________________________________________________________________________________________________________________________________________________________________________
74

Eurotech _________________________________________________________________________________________________________________________________________________________________________________________________________________________
75
Page intentionally left blank

76

![[Your title here]](https://img.dokumen.tips/doc/110x75/631eb50d25add517740b2bfe/your-title-here.jpg)


