Embed Size (px)
Citation preview

1PHARMACEUTICAL ENGINEERING November/December 2012
regulatoryGlobalization Challenges
Introduction
T he World Health Organization (WHO) refers to herbs, herbal materials, and finished herbal products collectively as herbal medicines. A herbal medicine contains active ingredients which include parts of a plant, other plant materials, or combination thereof.1 Herbal medicines play an important role in the practice of traditional medicine, which also includes
animal parts and minerals.1-2 For the purpose of this review, traditional/herbal medicines in finished dosage forms will be referred to as Traditional/Herbal Medicinal Products (T/HMPs). Notably, the active ingredients in T/HMPs are not derived from synthetic sources. Terms such as complemen-tary and alternative medicines, botanicals, natural health products, and Chinese proprietary medicines have been used in various countries to describe certain types of T/HMPs. A number of constituents from herbs have been exten-sively researched and commercialized, and have found a place in the mainstream pharmaceutical industry. For example, atropine, hyoscine, and hyoscyamine, which are derived from Atropa belladonna, have been formulated into anti-cholinergic drug products. Morphine, codeine, and thebaine, which are well-known alkaloids derived from Pa-
paver somniferum (poppy plant), have been formulated into potent painkillers. Many other herbs, including Artemisia annua, Ginkgo biloba, St. John’s wort, and Tongkat Ali, have been reported to have promising therapeutic effects, resulting in a revival of interest in T/HMPs. However, this revival also has presented scientific and regulatory challeng-es in addition to specific concerns with regard to the safety, efficacy, and quality of T/HMPs. This article presents a scientific and regulatory review of T/HMPs and addresses various globalization challenges. Possible solutions and improvements to existing regulatory frameworks are proposed, keeping in mind the need for the regulator to balance the interests and perspectives of the dif-ferent stakeholders, including consumers, the trade, and the industry.
Overview of the Practice of Traditional MedicineThe practice of traditional medicine is known to embrace a holistic approach to health and it commonly involves the use of herbal materials.3-6 Different processing methods7 and combinations of herbal ingredients8-10 have been employed to maximize therapeutic efficacy and minimize toxicity of T/HMPs. The concepts underlying the practice of traditional medicine differ significantly from those of conventional medicine. Hence, traditional medicine and T/HMPs are
Current Scientific Status and Regulatory Control of Traditional/
Herbal Medicinal Products: Globalization Challenges
by Dr. Chan Lai Wah, Sia Chong Hock, and Tan Kiat Yun
This article presents an overview of the current scientific status of traditional/herbal medicinal products and the regulatory framework implemented by
major regulatory authorities and organizations. It discusses the challenges ahead and makes recommendations to address them.
Reprinted fromPHARMACEUTICAL ENGINEERINGThe Official Technical Magazine Of iSPe
NoveMbeR/DeCeMbeR 2012, vol 32, No 6
©Copyright ISPe 2012
www.PharmaceuticalEngineering.org

2 November/December 2012 PHARMACEUTICAL ENGINEERING
regulatoryGlobalization Challenges
generally viewed by consumers and healthcare professionals with some skepticism.11
Current Scientific Status and Challenges AheadIn recent years, T/HMPs have been gaining popularity among consumers in developed countries. Consumption of T/HMPs has grown tremendously as indicated by the marked increase in global expenditure on these products from $20 billion in 1997 to $83 billion in 2008.2,12 This has been attributed to the use of T/HMPs to maintain general well-being of the consumers amidst the rising cost (real and perceived) of conventional medicines.13,14 Of equal impor-tance is the perception that T/HMPs, being natural ingredi-ents, are safer than synthetic chemical drugs. The knowledge of T/HMPs is based mainly on traditional use that has been passed down from many generations. As consumers become more educated, some have questioned the safety, efficacy, and quality of T/HMPs. Consequently, more scientific studies on T/HMPs have followed in tandem.
Safety of T/HMPsTraditional/herbal medicinal products are often regarded to be safe based on the rationale that they are derived from natural sources. This has partly accounted for T/HMPs being sought as an alternative to conventional medicines. A case in point is the use of black cohosh and dong quai in place of Hormone Replacement Therapy (HRT) for the relief of menopausal symptoms. A pivotal clinical trial conducted by the Women’s Health Initiative revealed an association be-tween the long-term use of HRT and serious adverse events such as cardiovascular diseases and breast cancer.15 Upon the publication of these findings, there was a 37% decrease in the number of HRT prescriptions in US, from $91 million in 2001 to $57 million in 2003.16 It is plausible that patients taken off HRT have resorted to the use of T/HMPs such as black cohosh and/or dong quai for relief of menopausal symptoms as they perceive T/HMPs to be safer.16,17
However, consumption of some T/HMPs has resulted in both mild and serious adverse reactions, such as hypersensi-tivity and organ toxicities.18,19 In addition, T/HMPs contain-ing herbal ingredients, such as St. John’s wort, garlic, and Ginkgo biloba, have been found to modify the pharmacoki-netics and pharmacodynamics of some drugs.19-21 The con-comitant use of conventional medicines and T/HMPs may result in drug-herb interactions which could be potentially fatal.19,20 This undesirable situation is further aggravated by low disclosure rates whereby less than half of the consumers informed their physicians of concomitant T/HMP use.14,22,23
Efficacy of T/HMPsEvidence-based medicine serves as a way to increase con-sumers’ confidence in the use of T/HMPs. The Cochrane
Collaboration is an international network comprised of ex-perts and leaders in various fields of medicine, health policy, research methodology, and consumer advocacy. It publishes the Cochrane Library, which is a collection of databases that covers independent systematic reviews, clinical trials, meth-ods studies, technology assessments, and economic evalua-tions. A search of the Cochrane Library revealed a number of systematic reviews on garlic,24 Ginkgo biloba,25 St. John’s wort,26 Echinacea,27 saw palmetto,28 milk thistle,29 sanchi,30 danshen,31 and tong xin luo.32 Only one review clearly dem-onstrated the efficacy of St. John’s wort. Both the positive and negative findings reported in the remaining reviews could not be confirmed due to inconclusive evidence. There is a need to conduct larger trials27,28,30,32 or trials with better methodology24,28-32 to confirm the findings. Scientific evidence of safety and efficacy is generally lacking for many T/HMPs available in the market.33-36 The regulatory authorities have little choice and have to accept traditional use as an alternative or proxy form of evidence for safety and efficacy. According to the Therapeutic Guide to Herbal Medicines of the German Commission E, more than 100 T/HMPs were found to be unsafe or ineffective and traditional use does not always equate to efficacy or safety.35 More investigations need to be done. The mechanisms of action of salicylic acid, digoxin, and tamoxifen, which are of botanical origin, are well-studied and backed by scientific evidence.37 These compounds are used in conventional medi-cine. Therefore, it is plausible for T/HMPs to be adopted in conventional medicine if their safety and efficacy can be proven by conclusive scientific evidence.
Challenges Faced and Possible SolutionsChallenges: Poor Reporting Quality and Low Quality of TrialsConclusions regarding efficacy are often limited by both poor quality of reporting and low quality of trials. Low quality of trials may introduce bias and lead to an under- or over- estimation of treatment effects. The low quality of trials is also closely related to poor reporting quality.38 As a result, the Consolidated Standards of Reporting Trials (CONSORT) statement was introduced in 1995 to resolve the issue of poor reporting quality. This statement consists of recom-mendations to prepare reports of trial findings, facilitating their complete and transparent reporting, and aiding their critical appraisal and interpretation. It was reviewed in 2001, 2004, and 2010 as new evidence emerged.39-41
In particular, the reviewed statement in 2004 aimed to improve its relevance to research involving T/HMPs.39 An emphasis was placed on the quality of T/HMPs because the amount of active ingredient(s) in the finished dosage form is not standardized and is known to vary greatly.27,32,42 This could potentially affect the internal and external validity, as well as reproducibility of the trials. Although the CONSORT
3PHARMACEUTICAL ENGINEERING November/December 2012
regulatoryGlobalization Challenges
statement is deemed important and relevant to T/HMPs, current analyses have revealed a low adoption rate of the recommendations made in the CONSORT statement,38,43-45 indicating that poor reporting quality and low quality of tri-als involving T/HMPs still exist.
Proposed SolutionQuality scientific research is one approach to advance and promote the use of T/HMPs. However, this is often deterred by the high costs of Research and Development (R&D), which can rack up millions of dollars.2 In order to com-pensate the huge investment, patent is awarded to confer exclusive rights to sell the product developed for a period of time. Besides recuperation of money spent on R&D, patents allow generation of profits. As with conventional medicines, T/HMPs must have a novel aspect, which is justified by scientific evidence in order to successfully obtain a patent.46,47 Despite the benefits of patenting, few firms dealing with T/HMPs have committed themselves to perform R&D. It has been suggested that per-haps the patenting system is unsuitable for T/HMPs. Unlike conventional medicines, which are chemically synthesized, T/HMPs are derived from natural sources and it may be difficult to claim exclusive rights and prevent others from cultivating specific herbs.2 However, there are other novel aspects about T/HMPs, such as their specific methods of processing or administration, compositions, formulations, and indications which may qualify for patenting.46-49 For ex-ample, patents have been granted based on novel multi-herb compositions with synergistic action, development of new processes for isolation of active compounds, and standard-ization of active compounds in the T/HMPs. Knowledge of T/HMPs is often passed down by word of mouth with little documentation. This can create a loophole, by-passing the efforts of the original knowledge holder in obtaining a patent. This scenario, deliberate or unintentional, has been coined as “biopiracy.”46,50 It is therefore important to keep proper documentation of the work done.
Challenges Faced in Control of Safety and Quality; Improvements ProposedMonographs of herbal ingredients found in pharmacopoeias, such as the US and European Pharmacopoeias, provide exist-ing measures for quality control of T/HMPs through the use of chemical markers, validated tests, and microscopic/macro-scopic techniques for identification.51-53 Despite these existing measures for quality control of T/HMPs, adverse reactions as-sociated with the consumption of T/HMPs remain incessant.54
Factors Affecting Safety and Quality of T/HMPsQuality of Starting MaterialsThe quality of T/HMPs is affected by the quality of the starting materials. Factors such as geographic location,55,56
methods of cultivation,57 harvesting, and post-harvesting conditions55,58,59 can affect the level of active constituents in the herbal starting materials. This makes its quality dif-ficult to reproduce and results in variation of end product quality between batches, regardless of whether the T/HMPs were produced by the same or different manufactur-ers.60-62
Complexity of Nomenclature of Herbal IngredientsHerbal ingredients can be misidentified due to their complex nomenclature. A single herbal ingredient can have different names. Likewise, a single name can be applied to different herbal ingredients, including closely related or totally unre-lated species. For instance, the roots of Aristolochia fangchi, Stephania tetrandra, or Cocculus trilobus are commonly known as Fang Ji. However, only Aristolochia fangchi belongs to the Aristolochiaceae family, while the latter two belong to the Menispermaceae family.63
Misidentification of herbal ingredients can result in consumption of the wrong T/HMP, which may lead to dire consequences. For example, Aristolochia fangchi (Guang Fang Ji) containing aristolochic acid was inadvertently consumed instead of Stephania tetrandra (Han Fang Ji) as part of a slimming regimen.64-66 This mix-up was largely due to their common name, Fang Ji. Some of the consumers eventually presented with renal problems or terminal renal failure. Recognizing the dangers of consuming aristolochic acid, the sale of any T/HMP containing this compound was restricted/banned in the European Union and other coun-tries, such as the US and Australia.67-70 A chemical analysis was conducted on 190 T/HMPs sold in the Netherlands following the ban and 25 of them were found to contain aristolochic acid.69 These statistics revealed the continued consumption of aristolochic acid despite the ban, indicat-ing that the issue of misidentification remains unresolved. Substitution of herbs in the practice of traditional medi-cine63,65,71 and herbs processing71 can further contribute to misidentification.
Chemical Contamination by Heavy MetalsSoil and geographic location are two main factors that account for contamination by heavy metals during plant cultivation.72 In particular, some species of plants and plant parts have a higher tendency (up to hundred-fold) to absorb and accumulate heavy metals.73
In addition, certain practices of traditional medicine involve the intentional incorporation of heavy metals to achieve the desired therapeutic effects.72,74,75 These heavy metals are often “processed” before incorporation into T/HMPs to reduce toxicity.76 However, without standardiza-tion of heavy metal limits and proper processing methods, poisoning has resulted due to excessive consumption.72,74,77-79

4 November/December 2012 PHARMACEUTICAL ENGINEERING
regulatoryGlobalization Challenges
T/HMP Claims Possible Adulterants Effects of the Adulterants
Arthritis Non-steroidal anti-inflammatory drugs and steroids75,95,97
Action: Reduce inflammation and pain.Adverse reactions: Non-steroidal anti-inflammatory drugs may cause kidney failure, liver failure, and ulcers while steroids may cause osteoporosis and higher risk of infection.
erectile Dysfunction Sildenafil, tadalafil, vardenafil, and modified analogues71,75,90,95,97
Action: Selectively relax arterial walls in the lungs and penis.Adverse reactions: Impaired vision, severe hypotension, heart attack, and stroke.
epilepsy Phenytoin and Phenobarbital74,95,97 Action: Phenytoin reduces electrical conductance among brain cells while phenobarbital exerts widespread depressant action on cerebral function.Adverse reactions: Phenytoin may cause megaloblastic anemia, leukopenia, and suicide risk while phenobarbital may cause pulmonary edema and acute renal failure.
Fever, Flu, Cold Paracetamol and chlorpheniramine75,98
Action: Paracetamol reduces pain and fever while chlorpheniramine is an antihistamine that relieves the symptoms of allergy, hay fever, and common cold.Adverse reactions: overdose of paracetamol will cause acute liver failure while chlorpheniramine will cause increased chest congestion, visual problems, and difficulty in urination.
Slimming Fenfluramine, sibutramine, and modified analogues71,89,95,96
Action: Promote sense of satiety and decrease appetite.Adverse reactions: Heart failure and stroke.
Table A. Claims made by manufacturers of traditional/herbal medicinal products and possible adulterants.
Choice of Chemical MarkersChemical markers are used in standardization to ensure that all batches contain the specified concentration of active ingredients. The European Medicines Agency (EMA) defines chemical markers as chemically defined constituents or groups of constituents intended for the control of quality. Certain components of the product are used as chemical markers, which may be classified as active markers or ana-lytical markers. The former possess therapeutic activities, while the latter do not and are used for analytical purposes.80
Using a single active marker may not adequately repre-sent the synergistic or additive effects of the multiple herbal ingredients contained in many T/HMPs.52,81 Likewise, the use of an inappropriate analytical marker may not adequate-ly indicate the potency or quality of T/HMPs. The selection of an appropriate chemical marker is critical. An inappro-priate analytical marker may not pick up an adulterated T/HMP, especially if the analytical marker is non-specific and is found in many herbal ingredients (e.g., quercetin, oleano-lic acid).82,83 Generally, the use of chemical markers has its shortcomings when used alone for standardization.
Adulteration with Synthetic Chemical DrugsAlthough T/HMPs may claim to be “all natural,” some have been found to be adulterated with synthetic chemical drugs. Authentic T/HMPs generally consist of low concentrations of active compounds. In the recommended dose of T/HMP, the amount of active compounds is usually low and the effect produced is therefore mild. Hence, potent chemical drugs are deliberately added to the T/HMPs by unscrupulous manufacturers and traders to produce instantaneous and strong effects, which have resulted in adverse reactions in-
cluding fatalities. An example is PC-SPES – a health product containing eight herbal ingredients for prostate health.84 Adulteration of PC-SPES was discovered when chemical analysis conducted on selected batches revealed the pres-ence of indomethacin, diethylstilbestrol, and warfarin.85,86
Unethical manufacturers have exploited novel methods, such as adding adulterants to capsule shells87,88 and develop-ing modified analogues of chemical drugs89,90 to evade detec-tion of adulteration. Modified analogues may not be detected unless reference spectra of these analogues and analytical methods, such as liquid chromatography-mass spectrom-etry,91,92 nuclear magnetic resonance spectroscopy,92,93 and infrared spectroscopy93 are used for characterization and determination of these novel structures. Consumption of adulterated T/HMPs has resulted in ad-verse effects74,94,95 and even deaths75,79,96,97 in some consumers. The nature of the adulterants ranges from approved prescrip-tion medicines to banned drug substances. A strong correla-tion between the claims made by manufacturers of T/HMPs and types of adulterants has been observed in Table A.
Proposed SolutionsChromatographic FingerprintingDue to the complexity of their compositions, the sole use of chemical markers for standardization of T/HMPs is insuf-ficient. Chemical markers should be used in tandem with chromatographic fingerprinting for standardization of such products.99 Chromatographic fingerprinting is an analytical method accepted by various regulatory authorities and orga-nizations, including WHO, European Medicines Agency, US Food and Drug Administration, and China State Food and Drug Administration (China SFDA). Currently, only China

5PHARMACEUTICAL ENGINEERING November/December 2012
regulatoryGlobalization Challenges
SFDA mandates for standardization of T/HMPs intended for intravenous administration.100-101 Hence, despite the availability of chromatographic fingerprinting, it is often not employed in quality control as it has not been made manda-tory by most regulatory authorities. Chromatographic methods include high performance thin layer chromatography,52,102 high performance liquid chro-matography,52,101-103 and gas chromatography.52 Each of these methods gives rise to a fingerprint that is unique to each T/HMP. The fingerprint consists of a set of peaks representing different herbal ingredients, hence allowing for qualitative and quantitative analysis. Fingerprint patterns can be com-pared by chemometric approach (e.g., Principle Component Analysis) to detect adulteration.100,102
It should be noted that a single chromatographic analysis may not be sufficient to separate closely related species (e.g., Heracleum sphondylium and Heracleum sibiricum)104 or T/HMPs containing multiple herbal ingredients.100,105 For such cases, two-dimensional thin layer chromatography,104,106 multiple chromatographic fingerprinting,100,103 and metabolic fingerprinting105,107-109 have been suggested for more accurate analysis.
Multi-Pronged Approach to Combat AdulterationChemical analysis of every batch of T/HMPs by the regulator is difficult and impractical due to the limitations in man-power and resources;110 therefore, it is recommended that regulators perform targeted chemical analysis on T/HMPs. As part of overall quality risk management, the number and type of T/HMPs to be tested for adulterants could be short-listed to include those with claims listed in Table A, as well as those claiming fast and effective relief.75 A joint effort by regulators, industry, and consumers is required to combat adulteration. Information-sharing among regulators and the T/HMP industry in different countries can facilitate the detection of adulterated T/HMPs, regionally and interna-tionally. Consumers can play their part by purchasing T/HMPs only from reputable sources instead of unknown or unreli-able sources, such as the Internet.111 They should look out for information such as manufacturing and expiry dates, batch numbers, and the names and addresses of the manufactur-ers which can help provide clues about the authenticity of T/HMPs.112 It has been observed that T/HMPs with missing or scanty information are likely to be unregulated, adulterated, sub-standard, or falsified.
Good Agricultural and Collection PracticeGuidelines for Good Agricultural and Collection Practice (GACP) have been established by WHO,59 European Medi-cines Agency,113 and China State Food and Drug Adminis-tration.114 These guidelines can be adopted to overcome the challenges faced in the control of quality presented previ-
ously. Notably, GACP can alleviate the problem of herb misidentification. It ensures accurate identification of herbs through the adoption of scientific names and requirement for collectors’ ability to distinguish between botanically or morphologically similar medicinal plants. The scientific name includes the genus, species, subspecies/variety, au-thor, and family of the plant. Moreover, GACP helps to curb contamination by specify-ing permissible heavy metal limits, hence ensuring that the products collected are safe for consumption. Very impor-tantly, GACP also helps to ensure that the quality of start-ing herbal ingredients is reproducible as it stipulates good practices for cultivation, harvesting, and post-harvesting processes.
Current Regulatory Status and Challenges AheadHaving regulations in place helps to assure consumers of the safety, efficacy, and quality of T/HMPs.75,115 For instance, product information is more complete for regulated than un-regulated T/HMPs.115 Adequate product information allows consumers to make informed choices, promoting the safe use of T/HMPs. Consequently, more regulatory authorities have begun to regulate T/HMPs.36
Product CategorizationDepending on their national legislation and definition, coun-tries can either regulate T/HMPs like a food or a medicinal product. Regulatory requirements for food are usually less demanding than those for medicinal products. Clear product categorization will help to determine the level of regulatory control. However, the distinction between food and medici-nal products can be vague and pose challenges to regula-tors in classifying them. Product categorization may vary between and even within countries.116,117
Categorization is largely dependent on two factors, namely the claim(s) made and the presentation of the prod-uct.118,119 Products that do not make claims to treat or prevent diseases may be regulated as food. For example, garlic is regulated as a food when it is sold as a spice; but when it is claimed to lower blood cholesterol level, it is regulated as a medicinal product. Correspondingly, T/HMPs that are presented as drinks or snack bars may be regulated as food, in contrast to those presented as capsules or tablets, which should be regulated as medicinal products.
Regulatory AuthoritiesMost regulatory authorities operate a two-tier control system: pre-market control and post-market control. Under pre-mar-ket control, T/HMPs are assessed prior to their entry into the market. Continual assessments and surveillance of the prod-ucts while they are placed in the market are carried out under post-market control. In general, T/HMPs in finished dosage

6 November/December 2012 PHARMACEUTICAL ENGINEERING
regulatoryGlobalization Challenges
Regulatory Authority Terms Used to Describe T/HMPs Regulated as Details of Regulatory Control
US Food and Drug Administration (FDA)
Dietary Supplement Food • Productlicensenotapplicable.• Canbemarketedwithoutpriorapproval.• TheabovedoesnotapplytoT/HMPsthatcontain
herbal ingredients which are regulated as botanical drugs.
• Manufacturersareresponsibleforensuringsafetyof T/HMPs.110
Health Canada Natural Health Product Medicinal Product • Productlicenseisgrantedbasedonsafety,efficacy(according to traditional use) and quality.122,123
Australia Therapeutic Goods Administration(TGA)
Complementary Medicine Medicinal Product • LowriskT/HMPsareregulatedaslistedmedicines.• Listedmedicinesconsistofactiveingredientsthat
are allowed as stated in an approved list.• T/HMPsarerandomlyselectedforreview.Product
license may be granted without review of the information submitted.124,125
UK Medicines and Healthcare products Regulatory Agency (MHRA)
Herbal Medicine Medicinal Product • Pre-marketingapprovalrequired.• T/HMPsunderTraditionalHerbalRegistration
Scheme are approved based on safety, evidence of traditional use (at least 30 years of which 15 years are within the eU) and quality.126 This is in line with THMPD 2004/24/eC.
• T/HMPsfoundinanapprovedlistdonotrequireevidence for safety and traditional use.127
Singapore Health Sciences Authority (HSA)
Chinese Proprietary Medicine* Medicinal Product • Pre-marketingapprovalrequired.• Listed(asopposedtoregisteredforconventional
medicines), based on safety and quality information submitted to HSA.128,129
Traditional Medicine Medicinal Product • Pre-marketingapprovalnotrequiredyet.• Manufacturersareresponsibleforensuringproduct
safety and quality.130
China State Food and Drug Administration (SFDA)
Traditional Chinese Medicine Medicinal Product • Samelevelofregulatoryrequirementsasconventional medicines.
• Requireextensivepre-clinicalstudiesandclinicalstudies.131
*CPM: means any medicinal product used in the system of therapeutics according to the traditional Chinese method. It has been manufactured into a finished product and contains one or more active substances all of which are derived wholly from plants, animals, or minerals or a combination of any one or more of them, and the medicinal product or all of its active substances are described in the current edition of A Dictionary of Chinese Pharmacy, The Chinese Herbal Medicine Materia Medica, or such other publications as may be approved by the Minister,” but shall not include (i) any medicinal product to be injected into the human body: (ii) any item specified in the Poisons list in the Schedule to the Poisons Act (Cap.234) or (iii) any medicinal product which contains as an active substance any chemically defined isolated constituent of plants, animals, or minerals or a combination of any one or more of them.
Table B. Comparison of pre-market control of traditional/herbal medicinal products by various regulatory authorities.
forms are more strictly regulated compared to raw herbs120 and T/HMPs that are prescribed or compounded directly by practitioners of traditional medicine for their patients.121,122
Pre-Market and Post-Market ControlThe stringency of regulatory control imposed on T/HMPs depends on how they are classified. For example, T/HMPs are generally considered as dietary supplements in the US and thus subject to less stringent regulatory control com-pared to conventional medicines. In contrast, T/HMPs are considered as medicinal products in China and thus subject to the same level of regulatory requirements as for con-
ventional medicines. However, it must be emphasized that product classification is just one of the steps in the regulato-ry continuum for T/HMPs. Stringent pre-market evaluation and post-market enforcement for T/HMPs have to be put in place to help ensure safe, efficacious, and quality products. A comparison of the varying levels of control on T/HMPs by the regulatory authorities of various countries is summa-rized in Table B. Certain claims are not allowed for T/HMPs (Table C) and T/HMPs that make claims to treat diseases are subject to more stringent pre-market controls by the various regulatory authorities (Table D). In addition to the attention paid to the products, regulatory controls initiated

7PHARMACEUTICAL ENGINEERING November/December 2012
regulatoryGlobalization Challenges
by the various regulatory authorities include licensing of the dealers (i.e., manufacturers, packagers, labellers). They are required to meet specific legal requirements. For instance, manufacturers are required to conform to good manufactur-ing practice (GMP) and report serious adverse events associated with consump-tion of their products.110,123,124,129,131,132
Harmonization of Regulatory Requirements in the Face of GlobalizationAs shown in Table B, each country has its own set of regulations with differing levels of control on T/HMPs. In recent years, several regions of the world have initiated the harmonization of regulatory requirements to facilitate the inter-national movement of T/HMPs from one country to another. Transnational
movement of products will be permitted if they conform to the harmonized technical requirements. Regulatory harmo-nization is desirable as it brings about greater consistency, transparency, and convenience for regulators and manufac-
Table D. Pre-market control by various regulatory authorities for traditional/herbal medicinal products that make claims to treat diseases or are of higher risk.
Regulatory Authority T/HMPs regulated as Comments
US Food and Drug Administration (FDA)
botanical Drug • Productlicenseisgrantedbasedon safety, efficacy, and quality of the product.
• Regulatorystandardsequivalentto those of conventional medicines.122,124,148,155
Health Canada Medicinal Product
Australia Therapeutic Goods Administration (TGA)
Complementary Medicines (registered medicines)
UK Medicines and Healthcare products Regulatory Agency (MHRA)
licensed Herbal Medicines
Regulatory Authority Claims Not Allowed
US Food and Drug Administration (FDA)
Dietary supplements are not allowed to make claims to diagnose, prevent, mitigate, treat, or cure a disease110
Health Canada T/HMPs sold as natural health products are not allowed to claim treatment of the following diseases:
acute alcoholism, acute anxiety state, acute infectious respiratory syndromes, acute inflammatory and debilitating arthritis, acute psychotic conditions, addiction (except nicotine addiction), appendicitis, arteriosclerosis, asthma, cancer, congestive heart failure, convulsions, dementia, depression, diabetes, glaucoma, haematologic bleeding disorders, hepatitis, hypertension, nausea and vomiting of pregnancy, obesity, rheumatic fever, septicemia, sexually transmitted diseases, strangulated hernia, thrombotic and embolic disorders, thyroid disorder, ulcer of the gastro-intestinal tract152
Australia Therapeutic Goods Administration (TGA)
T/HMPs registered as listed medicines are only allowed to carry indications for health maintenance and health enhancement or certain indications for non-serious, self-limiting conditions. listed medicines are not allowed to make the following claims:
abortifacient action, cardiovascular diseases, dental and periodontal disease, diseases of joint, bone, collagen and rheumatic disease, diseases of the eye or ear likely to lead to severe impairment, blindness or deafness, diseases of the liver, biliary system or pancreas, endocrine diseases and conditions including diabetics and prostatic disease, gastrointestinal diseases, haematological disorders and diseases, immune disorders and diseases, infectious disease including sexually transmitted diseases, persistent insomnia, mental diseases, ailment or defects, including substance abuse, metabolic disorders, musculoskeletal diseases, neoplastic disease (all cancer), nervous system disease, renal diseases, diseases of the genito-urinary tract, respiratory tract diseases, skin diseases154
UK Medicines and Healthcare products Regulatory Agency (MHRA)
T/HMPs under Traditional Herbal Registration are intended for self-medication without the supervision of a medical practitioner. Manufacturers of these T/HMPs are not permitted to make certain medicinal claims which include the following diseases:
bone diseases, cardiovascular diseases, chronic insomnia, diabetes and other metabolic diseases, diseases of the liver, biliary system and pancreas, endocrine diseases, genetic diseases, joint, rheumatic and collagen diseases, malignant diseases, psychiatric diseases, serious disorder of the eye and ear, serious gastrointestinal disorders, serious infectious diseases including HIv-related diseases and tuberculosis, serious neurological and muscular diseases, serious renal diseases, serious respiratory diseases, serious skin disorders, sexually transmitted diseases153
Singapore Health Sciences Authority (HSA)
The labels, packaging and package inserts of Chinese proprietary medicines shall not make references to any of the 19 diseases/conditions specified in the First Schedule of the Singapore Medicines Act:
blindness, cancer, cataract, conception and pregnancy, drug addiction, deafness, diabetes, epilepsy or fits, frigidity, hypertension, impotency, insanity, infertility, kidney diseases, leprosy, menstrual disorders, paralysis, sexual function, tuberculosis129
Table C. Claims that are not allowed for traditional/herbal medicinal products by the various regulatory authorities.
8 November/December 2012 PHARMACEUTICAL ENGINEERING
regulatoryGlobalization Challenges
turers. However, harmonization can become a political and economic issue in countries which are unable to meet such requirements due to inadequate resources and expertise.
European Medicines Agency and the Association of Southeast Asian NationsThe European Medicines Agency allows three different regulatory routes, in which approval of T/HMPs for sale is based on traditional use, well-established use, and both respectively. The amount of evidence required to prove the safety and efficacy of the product depends on the regulatory route applied. In any case, all manufacturers must ensure the quality of their T/HMPs. The product may be approved based on “well established use” if it has been used for at least 10 years within the EU. A higher level of evidence for safety and efficacy is required if the T/HMPs do not have an ade-quate history of traditional use. The highest level of evidence is required for a T/HMP with new indication(s), whereby scientific evidence supporting its safety and efficacy must be submitted.133 Marketing authorizations can be applied through decentralized, centralized, or mutual-recognition procedures which simultaneously allow for marketing autho-rization of T/HMPs in multiple EU member states.134
The Association of Southeast Asian Nations (ASEAN) consists of 10 member countries. Each member country has its unique cultural, social, political, and geographical back-ground where distinct practices of traditional medicine have developed. Despite these differences, ASEAN leaders are aware of the advantages of a common regulatory framework and are working toward a harmonized regulatory framework for traditional medicines and health supplements, which will be implemented in 2015. The harmonized regulations in-clude common agreements by ASEAN regulators on restrict-ed substances, additives and excipients, pesticide residue levels, labeling requirements, and the need to minimize risk of transmissible spongiform encephalopathy.135,136
Impact of Regulatory Framework for T/HMPsImplementation of Good Agricultural and Collection PracticeIn comparison to GMP which provides guidelines to help assure quality of T/HMPs137, GACP provides guidelines to help ensure consistent quality of starting materials. Manufac-turing sites have to conform to GMP before a manufacturer license can be granted for the legal production of T/HMPs. However, the implementation of GACP is currently not man-dated legally for both the cultivators and the manufacturers. Moreover, there is still insufficient knowledge regarding best cultivation and harvesting period specific to each herb to enable standard operating procedures to be established. Hence, the implementation rate of GACP is low. In 2010, only 99 cultivation sites in China were certified to GACP standard.55,138 A majority of the cultivation sites still do not
practice GACP and many herbal ingredients continue to be collected from the wild.51,55 Furthermore, as shown by batch-to-batch variability, GMP compliance alone is insufficient to assure the quality of T/HMPs. Compliance to both GMP and GACP is necessary to further enhance the quality control of such products.
Transition PeriodThe nature of the T/HMP industry presents many challenges to the implementation of regulatory initiatives. Quite often, the T/HMP industry is cottage-like where manufacturers comprise small- and medium-sized companies with minimal or no scientific expertise/resources to comply with scientific and regulatory requirements.139 The alignment of regulatory requirements to the highest international standard, without considering feasibility, may lead to the exit of companies from the T/HMP industry. This is not desirable as it will lead to reduction of T/HMPs available in the market. Therefore, proper training and assessment of technical feasibility would have to be conducted prior to implementation of regulatory initiatives. A transition period should be introduced to allow for implementation of the regulations in stages and for the T/HMP manufacturers and dealers to adapt. For T/HMPs that are already in the market when the law is passed, they may be allowed to be sold freely for a prescribed period of time. However, they will become illegal if they remain unreg-istered at the end of the transition period.139,140
Evaluation of the Regulatory Framework of Specific Regulatory Authorities and Proposed ImprovementsUS Food and Drug Administration (FDA)In the 1950s, T/HMPs started to gain popularity in the US, but they remained largely unregulated. In order to protect public health, the US FDA had planned to regulate T/HMPs as medicinal products. However, the US FDA faced pres-sure from the industry stakeholders as the requirements of scientific evidence for product registration posed a technical challenge to the manufacturers. Interestingly, the consum-ers also were not in favor of the proposed regulation as it could possibly result in a reduction of T/HMPs available to them.141-143 Eventually, the Dietary Supplement Health and Education Act (DSHEA) was passed in 1994. With this legislation, T/HMPs are not assessed prior to their entry into the market and they have to be proven unsafe by the US FDA before their withdrawal from the market can be effected.110 This legislation has a major limitation which is illustrated by the difficulty in banning Ephedra in 1997 despite reports of adverse reactions associated with the herb. The US FDA could only release advisories to warn consumers about the possible dangers associated with the consumption of Ephedra. Under the DSHEA, the US FDA was unable to remove Ephedra from the market, resulting in continued

9PHARMACEUTICAL ENGINEERING November/December 2012
regulatoryGlobalization Challenges
and frequent occurrence of adverse reactions related to its consumption. Ephedra was finally banned in 2004 by which time many people had already been adversely exposed to the herb found in many T/HMPs.144-146
UK Medicines and Healthcare Products Regulatory Agency (MHRA)Like the US FDA, the UK MHRA also had sought to regulate T/HMPs as medicinal products;147 however, this was found to be unfeasible in the UK as not all T/HMPs had sufficient scientific evidence. Most T/HMPs were sold over-the-coun-ter as unregistered herbal medicines under Section 12(2) of the UK Medicines Act until the European Traditional Herbal Medicinal Products Directive (THMPD) 2004/24/EC came into effect on 30 April 2004. This led to the initiation of the Traditional Herbal Registration Scheme in Table B with Section 12(2) of the UK Medicines Act phased out in 2004. Unlicensed herbal medicines are no longer allowed to be sold over-the-counter in the UK.148 Unlike the US FDA, which regulates T/HMPs as food, the UK MHRA’s policy to regulate T/HMPs as medicinal products was carried through following the implementation of THMPD 2004/24/EC. This directive establishes a regulatory approval process for T/HMPs in EU, and it requires each EU member state to set up a traditional herbal registration scheme to assess T/HMPs. It is now mandatory to assess T/HMPs before their entry into the EU market.
As the T/HMP industry becomes more established, existing regulations could be
tightened and new standards (e.g., GACP) introduced.
Although there are challenges that would be encountered along the way, they are not
insurmountable.”Singapore Health Sciences Authority (HSA)Currently, Singapore HSA subjects Chinese Proprietary Medicines (CPM), but not other traditional medicines, such as Jamu and Ayurvedic medicines, to pre-market evaluation as a listed product. This is attributed to the prevalent use of CPM among Singaporeans when compared to the other
traditional medicines.149,150 Nevertheless, as the use of Jamu and Ayurvedic medicines is not insignificant, there may be a need for HSA to extend pre-market controls that are currently applied to CPM to these other forms of traditional medicines. The current regulatory framework employed by HSA to assure the quality of CPM includes the restriction of heavy metals, microbial limits, and the need to declare that its contents are consistent with its labeling.129 These regulatory requirements may not be adequate for assuring quality of CPM. Control of other aspects, such as the quality of starting materials (excipients, herbal ingredients), stability test-ing, pesticide residues, and container closure systems also should be made mandatory. HSA is in the midst of review-ing its regulatory framework for CPM and other traditional medicines.
ConclusionThe therapeutic value of various plants has been demon-strated by the successful development and use of plant-derived conventional medicines. However, the advancement of T/HMPs has been slow due to limited scientific evidence of safety and efficacy, and less than desirable quality control. Major regulatory authorities have since stepped up the regulation of T/HMPs to address the concerns of safety, efficacy, and quality of T/HMPs. Standards proposed should be feasible for manufacturers, as well as adequate to safeguard public health. As the T/HMP industry becomes more established, existing regulations could be tightened and new standards (e.g., GACP) introduced. Although there are challenges that would be encountered along the way, they are not insurmountable. As exemplified by the US FDA approval of Veregen (the first botanical drug), the systematic gathering of adequate scientific evidence and application of quality control in the manufacture of T/HMPs is attain-able.151 Overall, the general public will benefit considerably with greater application of science and regulatory oversight that can assure the safety, efficacy, and quality of T/HMPs.
AcknowledgementsThe authors have not received any funding and have no conflicts of interest that are directly relevant to the contents of this review.
References1. World Health Organization 2002. World Traditional
Medicine Strategy 2002-2005. <http://whqlibdoc.who.int/hq/2002/who_edm_trm_2002.1.pdf> 29 June 2012.
2. World Health Organization 2011. The World Medicines Situation 2011. Traditional Medicines: global situations, issues and challenges. <http://www.who.int/medicines/areas/policy/world_medicines_situation/WMS_ch18_wTraditionalMed.pdf>, 29 June 2012.

10 November/December 2012 PHARMACEUTICAL ENGINEERING
regulatoryGlobalization Challenges
18. Niggemann, B., Gruber, C., “Side-Effects of Complemen-tary and Alternative Medicine,” Allergy, 58(8), 2003, pp. 707-716.
19. Elvin-Lewis, M., “Should we be Concerned About Herbal Remedies,” J Ethnopharmacol, 5(2-3), 2001, pp. 141-164.
20. Ioannides, C., “Pharmacokinetic Interactions Between Herbal Remedies and Medicinal Drugs,” Xenobiotica, 32(6), 2002, pp. 451-478.
21. Fugh-Berman, A., “Herb-Drug Interactions,” Lancet, 355(9198), 2000, p. 1348.
22. Eisenberg, D.M., Davis, R.B., Ettner, S.L., et al., “Trends in Alternative Medicine Use in the United States, 1990-1997: Results of a Follow-Up National Survey,” J Amer Med Assoc, 280(18), 1998, pp. 1569-1575.
23. Kennedy, J., Wang, C.C., Wu, C.H., “Patient Disclosure About Herb and Supplement Use Among Adults in the US,” Evid-Based Compl Alt, 5(4), 2008, pp. 451-456.
24. Lissiman, E., Bhasale, A.L., Cohen, M., “Garlic for the Com-mon Cold,” Cochrane Db Syst Rev, 3, 2009, CD006206.
25. Birks, J., Evans, J.G., “Ginkgo biloba for Cognitive Im-pairment and Dementia,” Cochrane Db Syst Rev, 1, 2009, CD003120.
26. Linde, K., Berner, M.M., Kriston, L., “St John’s Wort for Major Depression,” Cochrane Db Syst Rev, 4, 2008, CD000448.
27. Linde, K., Barrett, B., Bauer, R., et al., “Echinacea for Preventing and Treating the Common Cold,” Cochrane Db Syst Rev,4, 2009, CD000530.
28. Tacklind, J., MacDonald, R., Rutks, I., et al., “Serenoa repens for Benign Prostatic Hyperplasia,” Cochrane Db Syst Rev, 2, 2009, CD001423.
29. Rambaldi, A., Jacobs, B.P., Gluud, C., “Milk Thistle for Alcoholic and/or Hepatitis B or C Virus Liver Diseases,” Cochrane Db Syst Rev, 4, 2007, CD003620.
30. Chen, X., Zhou, M., Li, Q., et al., “Sanchi for Acute Ihae-mic Stroke,” Cochrane Db Syst Rev, 4, 2008, CD006305.
31. Wu, T., Ni, J., Wei, J., “Danshen (Chinese MedicinalH) Preparations for Acute Myocardial Infarction,” Cochrane Db Syst Rev, 2, 2008, CD004465.
32. Wu, T., Harrison, R.A., Chen, X., et al., “Tongxinluo (Tong xin luo or Tong-xin-luo) Capsule for Unstable Angina Pectorisy,” Cochrane Db Syst Rev, 4, 2006, CD004474.
33. Bent, S., Ko, R., “Commonly Used Herbal Medicines in the United States: a Review,” Am J Med, 116(7), 2004, pp. 478-485.
34. Ernst, E., “Herbal Medicine: Buy One, Get Two Free,” Postgrad Med J, 83(984), 2007, pp. 615-616.
35. Matthews, H.B., Lucier, G.W., Fisher, K.D., “Medicinal Herbs in the United States: Research Needs,” Environ Health Perspect, 107(10), 1999, pp. 773-778.
36. World Health Organisation 2005. National Policy on Traditional Medicine and Regulation of Herbal Medicines. <http://apps.who.int/medicinedocs/pdf/s7916e/s7916e.
3. Gurib-Fakim, A., “Medicinal Plants: Traditions of Yes-terday and Drugs of Tomorrow, Mol Aspects Med, 27(1), 2006, pp. 1-93.
4. Patwardhan, B., Warude, D., Pushpangadan, P., et al., “Ayurvedic and Traditional Chinese Medicine: a compara-tive review,” Evid-based Compl Alt, 2(4), 2005, pp. 456-473.
5. Yu, F., Takahashi, T., Moriya, J., et al., “Traditional Chi-nese Medicine and Kampo: a review from the distant past for the future,” J Int Med Res, 34(3), 2006, pp. 231-239.
6. Chopra, A., Doiphode, V.V., “Ayurvedic Medicine: Core Concept, Therapeutic Principles, and Current Relevance,” Med Clin N AM, 86(1), 2002, pp. 75-89.
7. Zhao, Z., Liang, Z., Chan, K., et al., “A Unique Issue in the Standardization of Chinese Materia Medica: Processing,” Planta Med, 76(17), 2010, pp. 1975-1986.
8. Yang, W.J., Li, D.P., Li, J.K., et al., “Synergistic Antioxi-dant Activities of Eight Traditional Chinese Herb Pairs,” Biol Pharm Bull, 32(6), 2009, pp. 1021-1026.
9. Ung, C.Y., Li, H., Cao, Z.W., et al., “Are Herb-Pairs of Traditional Chinese Medicine Distinguishable From Oth-ers? Pattern Analysis and Artificial Intelligence Classifica-tion Study of Traditionally Defined Herbal Properties,” J Ethnopharmacol, 111(2), 2007, pp. 371-377.
10. Zhao, F.R., Mao, H.P., Zhang, H., et al., “Antagonistic Ef-fects of Two Herbs in Zuojin Wan, a Traditional Chinese Medicine Formula, on Catecholamine Secretion in Bovine Adrenal Medullary Cells,” Phytomedicine, 17(8-9), 2010, pp. 659-668.
11. Evans, S., “Changing the Knowledge Base in Western Herb-al Medicine,” Soc Sci Med, 67(12), 2008, pp. 2098-2106.
12. Khan, I.A., “Issues Related to Botanicals,” Life Sci, 78(18), 2006, pp. 2033-2038.
13. Gardiner, P., Graham, R., Legedza, ATR, et al., “Factors Associated with Herbal Therapy use by Adults in the United States,” Altern Ther Health M, 13(2), 2007, pp. 22-29.
14. Zhang A.L., Story D.F., Lin V., et al., “A Population Survey on the Use of 24 Common Medicinal Herbs in Australia,” Pharmacoepidem Dr S, 17(10), 2008, pp. 1006-1013.
15. Rossouw, J.E., Anderson, G.L., Prentice, R.L., et al., “Risks and Benefits of Estrogen Plus Progestin in Healthy Postmenopausal Women: Principal Results from the Women’s Health Initiative Randomized Controlled Trial,” J Amer Med Assoc, 288(3), 2002, pp. 321-333.
16. Cheema, D., Coomarasamy, A., El-Toukhy, T., “ Non-Hormonal Therapy of Post-menopausal Vasomotor Symptoms: a Structured Evidence-Based Review,” Arch Gynecol Obstet, 276(5), 2007, pp. 463-469.
17. Kessel, B., Kronenberg, F., “The Role of Complementary and Alternative Medicine in Management of Menopausal Symptoms,” Endocrin Metab Clin, 33(4), 2004, pp. 717-739.

11PHARMACEUTICAL ENGINEERING November/December 2012
regulatoryGlobalization Challenges
pdf> 29 June 2012.37. Corson, T.W., Crews, C.M., “Molecular Understanding
and Modern Application of Traditional Medicines: Tri-umphs and Trials, Cell, 130(5), 2007, pp. 769-774.
38. Gagnier, J.J., DeMelo, J., Boon, H., et al., “Quality of Report-ing of Randomized Controlled Trials of Herbal Medicine Interventions,” Am J Med, 119(9), 2006, 800.e1- 800.e11.
39. Gagnier, J.J., Boon, H., Rochon, P., et al., “Recommen-dations for Reporting Randomized Controlled Trials of Herbal Interventions: Explanation and Elaboration,” J Clin Epidemiol, 59(11), 2006, pp. 1134-1149.
40. Gagnier, J.J., Boon, H., Rochon, P., et al., “Reporting Randomized, Controlled Trials of Herbal Interventions: an Elaborated CONSORT Statement,” Ann Intern Med, 144(5), 2006, pp. 364-367.
41. Schulz, K.F., Altman, D.G., Moher,D., “CONSORT 2010 Statement: Updated Guidelines for Reporting Parallel Group Randomised Trials,” Int J of Surgery, 9(8), 2011, pp. 672-677.
42. Wolsko, P.M., Solondz, D.K., Phillips, R.S., et al., “Lack of Herbal Supplement Characterization in Published Ran-domized Controlled Trials,” Am J Med, 118(10), 2005, pp. 1087-1093.
43. Zhong,Y., Zhou, W., Jiang H, et al., “Quality of Reporting of Two-group Parallel Randomized Controlled Clinical Trials of Multi-Herb Formulae: A Survey of Reports In-dexed in the Science Citation Index Expanded,” European J of Integrative Med, 3(4), 2011, e303-e310.
44. Peng, X., Zhao, Y., Liang, X., et al., “Assessing the Quality of RCTs on the Effect of Beta-Elemene, One Ingredient of a Chinese Herb, Against Malignant Tumors,” Contemp Clin Trials, 27(1), 2006, pp. 70-82.
45. Linde, K., Jonas, WB, Melchart, D., et al., “The Meth-odological Quality of Randomized Controlled Trials of Homeopathy Herbal Medicines and Acupuncture,” Int J Epidemiol, 30(3), 2001, pp. 526-531.
46. Kartal, M., “Intellectual Property Protection in the Natural Product Drug Discovery, Traditional Herbal Medicine and Herbal Medicinal Products,” Phytother Res, 21(2), 2007, pp. 113-119.
47. Musthaba, M., Baboota, S., Athar, TMD, et al., “Patented Herbal Formulations and Their Therapeutic Applica-tions,” Recent Patents on Drug Delivery and Formula-tion, 4(3), 2010, pp. 231-244.
48. Sahoo, N., Manchikanti, P., Dey, SH, “Herbal Drug Pat-enting in India: IP potential,” J Ethnopharmacol, 137(1), 2011, pp. 289-297.
49. Wang, X, Chan, AW, “Challenges and Patenting Strate-gies for Chinese Herbal Medicines,” Chinese Medicine, 5, 2010, p. 24.
50. Timmermans, K., “Intellectual Property Rights and Tradi-tional Medicine: Policy Dilemma at the Interface,” Soc Sci Med, 57(4), 2003, pp. 745-756.
51. Bauer, R., Franz, G., “Modern European Monographs for Quality Control of Chinese Herbs,” Planta Med, 76(17), 2010, pp. 2004-2011.
52. Tistaert, C., Dejaegher, B., Heyden, Y.V., “Chromato-graphic Separation Techniques and Data Handling Meth-ods for Herbal Fingerprints: a Review,” Anal Chim Acta, 690(2), 2011, pp. 148-161.
53. Chan, K., Leung, K.S., Zhao, S.S., “Harmonization of Monographic Standards is Needed to Ensure the Quality of Chinese Medicinal Materials,” Chinese Medicine, 4, 2009, p. 18.
54. World Health Organization 2004. WHO Guidelines on Safety Monitoring of Herbal Medicines in Pharmacovigi-lance System. <http://apps.who.int/medicinedocs/en/m/abstract/Js7148e/> 29 June 2012.
55. Zhang, B., Peng, Y., Zhang, Z., et al., “GAP Production of TCM Herbs in China,” Planta Med, 76(17), 2010, pp. 1948-1955.
56. Xia, Q., Zhao, K.J., Huang, Z.G., et al., “Molecular Genetic and Chemical Assessment of Rhizoma curcumae in China,” J Agric Food Chem, 53(15), 2005, pp. 6019-6026.
57. Bergonzi, M.C., Bilia, A.R., Gallori, S., et al., “Variability in the Content of the Constituents of Hypericum perforatum L. and Some Commercial Extracts,” Drug Dev Ind Pharm, 27(6), 2001, pp. 491-497.
58. Van Beek, T.A., Lelyveld, G.P., “Concentration of Gink-golides and Bilobalide in Ginkgo Biloba Leaves in Relation to the Time of Year,” Planta Med, 58(5), 1992, pp. 413-416.
59. World Health Organization 2003. WHO Guidelines on Good Agricultural and Collection Practices (GACP) for Medicinal Plants. <http://whqlibdoc.who.int/publica-tions/2003/9241546271.pdf> 29 June 2012.
60. Gurley, B.J., Gardner, S.F., Hubbard, M.A.,“Content Ver-sus Label Claims in Ephedra-Containing Dietary Supple-ments,” Am J Health-Syst Ph, 57(10), 2000, pp. 963-969.
61. Constantine, G.H., Karchesy, J., “Variations in Hypericin Concentrations in Hypericum perforatum L. and Com-mercial Products,” Pharm Biol, 36(5), 1998, pp. 365-367.
62. Gordon, R.Y., Cooperman, T., Obermeyer ,W., et al., “Marked Variability of Monacolin Levels in Commercial Red Yeast Rice Products: Buyer Beware!” Arch Intern Med, 170(19), 2010, pp. 1722-1727.
63. Wu, K.M., Farrelly, J.G., Upton, R., Chen, J., “Complexities of the Herbal Nomenclature System in Traditional Chi-nese Medicine (TCM): Lessons Learned from the Misuse of Aristolochia-related Species and the Importance of the Pharmaceutical Name During Botanical Drug ProductDe-velopment,” Phytomedicine, 14(4), 2007, pp. 273-279.
64. Vanhaelen, M., Vanhaelen-Fastre, R., But, P., et al., “Iden-tification of Aristolochic Acid in Chinese Herbs,” Lancet, 343(8890), 1994, p. 174.
65. Debelle, F.D., Vanherweghem, J.L., Nortier, J.L., “Aris-tolochic Acid Nephropathy: A Worldwide Problem,”

12 November/December 2012 PHARMACEUTICAL ENGINEERING
regulatoryGlobalization Challenges
Kidney Int, 74(2), 2008, pp. 158-169.66. Vanherweghem, J.L., Depierreux, M., Tielemans, C., et al.,
“Rapidly Progressive Interstitial Renal Fibrosis In Young Women: Association With Slimming Regimen Including Chinese Herbs,” Lancet, 341(8842), 1993, pp. 387-391.
67. European Medicines Agency 2005. Public statement on the risks associated with the use of herbal products con-taining Aristolochia species. <http://www.ema.europa.eu/docs/en_GB/document_library/Scientific_guide-line/2010/04/WC500089957.pdf > 29 June 2012.
68. Medicines and Healthcare products Regulatory Agency 2011. Prohibited or restricted herbal ingredients. <http://www.mhra.gov.uk/Howweregulate/Medicines/Herbal-medicinesregulation/Prohibitedorrestrictedherbalingredi-ents/index.htm> 29 June 2012.
69. Martena, M.J., Van Der Wielen, J.C.A., Van De Laak, L.F.J., et al., “Enforcement of the Ban on Aristolochic Acids in Chi-nese Traditional Herbal Preparations on the Dutch Market,” Anal Biolanal Chem, 389(1), 2007, pp. 263-275.
70. Cheung, T.P., Xue, C., Leung, K., et al., “Aristolochic Acids Detected in Some Raw Chinese Medicinal Herbs and Manufactured Herbal Products – A Consequence of Inap-propriate Nomenclature and Imprecise Labeling?” Clin Toxicol, 44(4), 2006, pp. 371-378.
71. Jordan, S.A., Cunningham, D.J., Marles, R.J., “Assess-ment of Herbal Medicinal Products: Challenges, and Opportunities to Increase Knowledge Base For Safety Assessment,” Toxicol Appl Pharmacol, 243(2), 2010, pp. 198-216.
72. Kosalec, I., Cvek, J., Tomic, S., “Contaminants of Medici-nal Herbs and Herbal Products,” Arh Hig Rada Toksiko, 60(4), 2009, pp. 485-501.
73. Sarma, H., Deka, S., Deka, H., et al., “Accumulation of Heavy Metals in Selected Medicinal Plants,” Rev Environ Contam Toxicol, 214, 2011, pp. 63-86.
74. Ernest, E., “Toxic Heavy Metal and Undeclared Drugs in Herbal Medicines,” Trends Pharmacol Sci, 23(3), 2002, pp. 136-139.
75. Yee, S.K., Chu, S.S., Xu, Y.M., et al., “Regulatory Control of Chinese Proprietary Medicines in Singapore,” Health Policy, 71(2), 2005, pp. 133-149.
76. Gogtay, N.J., Bhatt, H.A., Dalvi, S.S., et al., “The Use And Safety of Non-Allopathic Indian Medicines,” Drug Safety, 25(14), 2002, pp. 1005-1019.
77. Prpi-Maji, D., Pizent, A., Jurasovi, J., et al., “Lead Poison-ing Associated with the Use of Ayurvedic Metal-Mineral Tonics,” Clin Toxicol, 34(4), 1996, pp. 417-423.
78. Saper, R.B., Kales, S.N., Paquin, J., et al., “Heavy Metal Content of Ayurvedic Herbal Medicine Products,” J Amer Med Assoc, 292(23), 2004, pp. 2868-2873.
79. Koh, H.L., Woo, S.O., “Chinese Proprietary Medicine in Singapore: Regulatory Control of Toxic Heavy Metals and Undeclared Drugs,” Drug Safety, 23(5), 2000, pp. 351-362.
80. European Medicines Agency 2008. Reflection paper on markers used for quantitative and qualitative analysis of herbal medicinal products and traditional herbal medici-nal products. <http://www.ema.europa.eu/docs/en_GB/document_library/Scientific_guideline/2009/09/WC500003211.pdf> 29 June 2012.
81. Zeng, Z., Chau, F.T., Chan, H.Y., et al., “Recent Advances in the Compound-Orientated and Pattern-Oriented Approaches to the Quality Control of Herbal Medicine,” Chinese Medicine, (3), 2008, p. 9.
82. Xie, P.S., Leung, A.Y., “Understanding the Traditional Aspect of Chinese Medicine in Order to Achieve Mean-ingful Quality Control of Chinese Materia Medica,” J Chromatogr A, 1216(11), 2009, pp. 1933-1940.
83. Crockett, S.L., Khan, I.A., “Challenges of Standardization: Marker Compounds in Plant Species Related and Unre-lated to Top-Selling Herbs,” J Herbs Spices Med Plants, 10(3), 2003, pp. 13-24.
84. Small, E.J., Frohlich, M.W., Bok, R., et al., “Prospective Trial of The Herbal Supplement PC-SPES in Patients With Progressive Prostate Cancer,” J Clin Oncol, 18(21), 2000, pp. 3595-3603.
85. Sovak, M., Seligson, AL, Konas, M., et al., “Herbal Com-position of PC-SPES for Management Of Prostate Cancer: Identification of Active Principles,” J Natl Cancer I, 94(17), 2002, pp. 1275-1281.
86. Van Breemen, R.B., Fong, H.H.S., Farnsworth, N.R., “The Role of Quality Assurance and Standardization in the Safety of Botanical Dietary Supplements,” Chem Res Toxicol, 20(4), 2007, pp. 577-582.
87. Venhuis, B.J., Tan, J., Vredenbergt, M.J., et al., “Capsule Shells Adulterated with Tadalafil,” Forensic Sci Int, 214(1-3), 2012, p. e20-22.
88. Health Sciences Authority 2009. HSA warns against consuming “XP Tongkat Ali Supreme” capsules found to contain undeclared potent substances. <http://www.hsa.gov.sg/publish/hsaportal/en/news_events/press_releas-es/20090/hsa_warns_against0.html> 29 June 2012.
89. Yuen, Y.P., Lai, C.K., Poon, W.T., et al., “Adulteration of Over-the-Counter Slimming Products with Pharmaceuti-cal Analogues- an Emerging Threat,” Hong Kong Medical J, 13(3), 2007, pp. 216-220.
90. Poon, W.T., Lam Y.H., Lai, C.K., et al., “Analogues of Erectile Dysfunction Drugs: an Under-Recognized Threat,” Hong Kong Medical J, 13(5), 2007, pp. 359-363.
91. Singh, S., Prasad, B., Savaliya, A.A., et al., “Strategies for Characterizing Sildenafil, Vardenafil, Tadalafil and Their Analogues in Herbal Dietary Supplements,” and “Detect-ing Counterfeit Products Containing These Drugs, TrAC,” Trends Anal Chem, 28(1), 2009, pp. 13-28.
92. Vaysse, J., Gilard, V., Balayssac, S., et al., “Identification of a Novel Sildenafil Analogue in an Adulterated Herbal Supple-ment,” J Pharmaceut Biomed, 59(1), 2012, pp. 58-66.

13PHARMACEUTICAL ENGINEERING November/December 2012
regulatoryGlobalization Challenges
93. Lee, H.M., Kim, C.S., Jang, Y.M., et al., “Separation and Structural Elucidation of a Novel Analogue of Vardenafil Included as an Adulterant In A Dietary Supplement By Liquid Chromatography-Electrospray Ionization Mass Spectrometry, Infrared Spectroscopy And Nuclear Mag-netic Resonance Spectroscopy,” J Pharmaceut Biomed, 54(3), 2011, pp. 491-496.
94. Kao, S.L., Chan, C.L., Tan, B., et al., “An Unusual Out-break of Hypoglycemia,” The New England Journal of Medicine, 360(7), 2009, pp. 734-736.
95. Sanzini, E., Badea, M., Santos, AD, et al., “Quality control of plant food supplements,” Food Funct, 2(12), 2011, pp. 740-746.
96. Corns, C., Metcalfe, K., “Risks Associated with Herbal Slimming Remedies,” The Journal of the Royal Society for the Promotion of Health, 122(4), 2002, pp. 213-219.
97. Ernst, E., “Adulteration of Chinese Herbal Medicines with Synthetic Drugs: a Systematic Review,” J Intern Med, 252(2), 2002, pp. 107-113.
98. Ko, R.J., “Adulterants in Asian Patent Medicines,” The New England Journal of Medicine, 339(12), 1998, p. 847.
99. Li, S., Han, Q,, Qiao, C., et al., “Chemical Markers for the Quality Control of Herbal Medicines: An Overview,” Chinese Medicine, 3, 2008, p. 7.
100. Fan, X.H., Cheng, Y.Y., Ye, Z.L., et al., “Multiple Chro-matographic Fingerprinting and its Application to the Quality Control of Herbal Medicines,” Anal Chim Acta, 555(2), 2006, pp. 217-224.
101. Li, S.P., Zhao, J., Yang, B., “Strategies for Quality Control of Chinese Medicines,” J Pharm Biomed Anal, 55(4), 2011, pp. 802-809.
102. Xie, P., Chen, S., Liang, Y.Z., et al., “Chromatographic Fingerprint Analysis- a Rational Approach for Quality Assessment of Traditional Chinese Herbal Medicine,” J Chromatogr A, 1112(1-2), 2006, pp. 171-180.
103. Zhang, J.L., Cui, M., He, Y., et al., “Chemical Fingerprint and Metabolic Fingerprint Analysis of Danshen Injection by HPLC-UV and HPLC-MS Methods,” J Pharm Biomed Anal, 36(5), 2005, pp. 1029-1035.
104. Ciesla, L., Bogucka-Kocka, A., Hajnos, M., et al., “Two-Dimensional Thin-Layer Chromatography with Adsor-bent Gradient as a Method of Chromatographic Finger-printing of Furanocoumarins for Distinguishing Selected Varieties and Forms of Heracleum spp,” J Chromatogr, 1207(1-2), 2008, pp. 160-168.
105. Jiang, Y., David, B., Tu, P., et al., “Recent Analytical Approaches in Quality Control of Traditional Chinese Medicines – a Review,” Analytia Chimica Acta, 657(1), 2010, pp. 9-18.
106. Ciesla, L., Waksmundzka-Hajnos, M., “Two-Dimensional Thin-Layer Chromatography in the Analysis of Secondary Plant Metabolites,” J Chromatogr A, 1216(7), 2009, pp. 1035-1052.
107. Holmes, E., Tang, H., Wang, Y., et al., “The Assessment of Plant Metabolite Profiles by NMR-based Methodolo-gies,” Planta Med, 72(9), 2006, pp. 771-785.
108. Krishnan, P., Kruger, NJ, Ratcliffe, RG, Metabolite Fingerprinting and Profiling in Plants using NMR,” J Exp Bot, 56(410), 2005, pp. 255-265.
109. Kim, H.K., Choi, Y.H., Erkelens, C., et al., “Metabolic Fin-gerprinting of Ephedra Species Using 1H-NMR Spectros-copy and Principal Component Analysis,” Chem Pharm Bull, 53(1), 2005, pp. 105-109.
110. Food and Drug Administration. Overview of Dietary Supplements. <http://www.fda.gov/food/dietarysupple-ments/consumerinformation/ucm110417.htm> 29 June 2012.
111. Chen, S.P.L., Tang, M.H.Y., Ng, S.W., et al., “Psychosis Associated with Usage of Herbal Slimming Products Adulterated with Sibutramine: a Case Series,” Clin Toxi-col, 48(8), 2010, pp. 832-838.
112. Low, M.Y., Zeng, Y., Li, L., et al., “Safety and Quality Assessment of 175 Illegal Sexual Enhancement Products Seized In Red-Light Districts In Singapore,” Drug Safety, 32(12), 2009, pp. 1141-1146.
113. European Medicines Agency 2006. Guidelines on Good Agricultural and Collection Practice for Starting Ma-terials of Herbal Origin. <http://www.ema.europa.eu/docs/en_GB/document_library/Scientific_guide-line/2009/09/WC500003362.pdf> 29 June 2012.
114. State Food and Drug Administration 2002. People’s Re-public of China: Good Agricultural Practice for Chinese Crude Drugs (Interim). <http://former.sfda.gov.cn/cmsweb/webportal/W45649039/A55807078.html> 29 June 2012.
115. Raynor, D.K., Dickinson, R., Knapp, P., et al., “Buyer Beware? Does the Information Provided with Herbal Products Available Over the Counter Enable Safe Use?” BMC Med 9, 2011, 174194.
116. Walj, R., Boon, H., “Natural Health Product Regulations: Perceptions and Impact,” Trends Food Sci Technol, 19(9), 2008, pp. 494-497.
117. Silano, V., Coppens, P., Larranaga-Guetaria, A., et al., “Regulations Applicable to Plant Food Supplements and Related Products in the European Union,” Food Funct, 2(12), 2011, pp. 710-719.
118. Farrell, J., Ries, N.M., Kachan, N., et al., “Foods and Natural Health Products: Gaps and Ambiguities in the Canadian Regulatory Regime,” Food Policy, 34(4), 2009, pp. 388-392.
119. Health Sciences Authority 2012. Food-Health Product Classification Tree. <http://www.hsa.gov.sg/publish/hsaportal/en/health_products_regulation/complemen-tary_medicines/product_tree.html> 29 June 2012.
120. Health Sciences Authority 2012. Guidelines for Raw Medicinal Herbs. <http://www.hsa.gov.sg/publish/

14 November/December 2012 PHARMACEUTICAL ENGINEERING
regulatoryGlobalization Challenges
hsaportal/en/health_products_regulation/complemen-tary_medicines/product_tree.html> 29 June 2012.
121. Medicines and Healthcare products Regulatory Agency 2012. Herbal Medicines Regulation: Unlicensed Herbal Medicines Supplied by a Practitioner Following a One-to-One Consultation. <http://www.mhra.gov.uk/How-weregulate/Medicines/Herbalmedicinesregulation/Unlicensedherbalmedicinessuppliedbyapractitionerfol-lowingaonetooneconsultation/index.htm>.29 June 2012.
122. Health Canada 2003. Overview of the Natural Health Products Regulations Guidance. <http://www.hc-sc.gc.ca/dhp-mps/alt_formats/hpfb-dgpsa/pdf/prodnatur/regula-regle_over-apercu-eng.pdf> 2 July 2012.
123. Health Canada. About Natural Health Product Regula-tion in Canada. <http://www.hc-sc.gc.ca/dhp-mps/prod-natur/about-apropos/index-eng.php> 2 July 2012.
124. Therapeutic Goods Administration 2007. The Regulation of Complementary Medicines in Australia- An Overview. <http://www.tga.gov.au/industry/cm-basics-regulation-overview.htm - framework> 2 July 2012.
125. Therapeutic Goods Administration 2011. Australian Guidelines for Complementary Medicines (ARGCM) Part II: Listed Complementary Medicine. <http://www.tga.gov.au/pdf/cm-argcm-p2.pdf> 2 July 2012.
126. Medicines and Healthcare products Regulatory Agency 2011. How to Register Your Product Under the Tradi-tional Herbal Medicine Registration Scheme: Traditional Use. <http://www.mhra.gov.uk/Howweregulate/Medi-cines/Herbalmedicinesregulation/RegisteredTradition-alHerbalMedicines/Howtoregisteryourproductunder-theTraditionalHerbalMedicinesRegistrationScheme/Traditionaluse/index.htm> 3 July 2012.
127. Medicines and Healthcare products Regulatory Agency 2011. How to Register Your Product Under the Tradi-tional Herbal Medicines Registration Scheme: The Posi-tive List and Committee For Herbal Medicinal Products. <http://www.mhra.gov.uk/Howweregulate/Medicines/Herbalmedicinesregulation/RegisteredTraditionalHerb-alMedicines/HowtoregisteryourproductundertheTra-ditionalHerbalMedicinesRegistrationScheme/Theposi-tivelistandCommiteeforHerbalMedicinalProducts/index.htm> 3 July 2012.
128. Health Sciences Authority 2010 . Regulatory framework. <http://www.hsa.gov.sg/publish/hsaportal/en/health_products_regulation/complementary_medicines/chi-nese_medicines/regulatory_framework.html> 3 July 2012.
129. Health Sciences Authority. Guidelines on Chinese Propri-etary Medicines Product Listing.
130. Health Sciences Authority 2010. Traditional Medicines and Homeopathic Medicines. <http://www.hsa.gov.sg/publish/hsaportal/en/health_products_regulation/
complementary_medicines/traditional_medicines.html> 3 July 2012.
131. State Food and Drug Administration. Provision for drug registration. <http://eng.sfda.gov.cn/WS03/CL0768/61645.html> 3 July 2012.
132. Medicines and Healthcare products Regulatory Agency 2007. <http://www.mhra.gov.uk/home/groups/pl-p/documents/websiteresources/con2030651.pdf> Tra-ditional Herbal Medicines Registration Scheme. 3 July 2012.
133. European Medicines Agency. Herbal medicinal products. <http://www.ema.europa.eu/ema/index.jsp?curl=pages/regulation/general/general_con-tent_000208.jsp&mid=WC0b01ac05800240cf> 3 July 2012.
134. European Medicines Agency. Central authorization of medicines. <http://www.ema.europa.eu/ema/index.jsp?curl=pages/about_us/general/general_con-tent_000109.jsp&murl=menus/about_us/about_us.jsp&mid=WC0b01ac0580028a47> 3 July 2012.
135. Association of South-East Asian Nations. Harmonization of Standards and Technical Requirements in ASEAN. <http://www.asean.org/18215.htm> 3 July 2012.
136. Association of South-East Asian Nations. Profile of Definition, Terminology and Technical Requirement of Traditional Medicines and Health Supplements Among ASEAN Members States. <http://www.asean.org/20258.pdf> 3 July 2012.
137. World Health Organization 2007. Guidelines on Good Manufacturing Practices (GMP) for Herbal Medicines. <http://apps.who.int/medicinedocs/en/m/abstract/Js14215e/> 3 July 2012.
138. Xu, Z., “Modernization: One Step at a Time,” Nature, 480(7387), 2011, S90-S92.
139. Medicines and Healthcare products Regulatory Agency. Full regulatory impact assessment: directive on tradi-tional herbal medicinal products (Directive 2004/24/EC). <http://www.mhra.gov.uk/home/groups/pl-p/documents/publication/con2022468.pdf> 3 July 2012.
140. Health Canada 2003. Transition guidance document for natural health products. <http://www.hc-sc.gc.ca/dhp-mps/prodnatur/legislation/docs/transition_guide_doc-eng.php> 3 July 2012.
141. Tyler, V.E., “Herbal Medicine: from the Past to the Fu-ture,” Public Health Nutr, 3(4A), 2000, pp. 447-452.
142. Brownie, S., “The Development of the US and Australian Dietary Supplement Regulations: What are the Implica-tions afor Product Quality,” Complement Ther Med, 13(3), 2005, pp. 191-198.
143. Larsen, L.L., Berry, J.A., “The Regulation of Dietary Supplements,” J Am Acad Nurse Prac, 15(9), 2003, pp. 410-414.

15PHARMACEUTICAL ENGINEERING November/December 2012
regulatoryGlobalization Challenges
144. Food and Drug Administration 2004. FDA acts to remove Ephedra-containing dietary supplements from market. <http://www.fda.gov/NewsEvents/Newsroom/PressAn-nouncements/2004/ucm108379.htm> 3 July 2012.
145. Winslow, L.C., Kroll, D.J., “Herbs as Medicine,” Arch Intern Med, 158(20), 1998, pp. 2192-2199.
146. Palamar, J., “How Ephedrine Escaped Regulation in the United States: A Historical Review of Misuse and Associ-ated Policy,” Health Policy, 99(1), 2011, pp. 1-9.
147. De Smet, P.A., “Herbal Medicine in Europe--Relaxing Regulatory Standards,” The New England Journal of Medicine, 352(12), 2005, pp. 1176-1178.
148. Medicine and Healthcare products Regulatory Agency. Placing a Herbal Medicine on the UK Market. <http://www.mhra.gov.uk/Howweregulate/Medicines/Herb-almedicines/PlacingaherbalmedicineontheUKmarket/index.htm> 3 July 2012.
149. Shih, V., Chiang, J.Y.L., Chan, A., “Complementary and Alternative Medicine (CAM) Usage in Singaporean Adult Cancer Patients,” Ann Oncol, 20(4), 2009, pp. 752-757.
150. Lim, M.K., Sadarangani, P., Chan, HL, et al., “Comple-mentary and Alternative Medicine use in Multiracial Sin-gapore,” Complement Ther Med, 13(1), 2005, pp. 16-24.
151. Chen, S.T., Dou, J., Temple, R., et al., “New Therapies from Old Medicines,” Nat Biotechnol, 26(10), 2008, pp. 1077-1083.
152. Health Canada 2010. Fact Sheet: Schedule a Health Claims for Natural Health Products. <http://www.hc-sc.gc.ca/dhp-mps/prodnatur/legislation/docs/fact-info_sched-anne_a-eng.php> 3 July 2012.
153. Medicines and Healthcare products Regulatory Agency 2004. Permitted indications under the Directive on Tra-ditional Herbal Medicinal Products. <http://www.mhra.gov.uk/home/groups/es-herbal/documents/websitere-sources/con009363.pdf> 3 July 2012.
154. Therapeutic Goods Administration 2011. Guidelines for levels and kinds of evidence to support indications and claims. <http://www.tga.gov.au/pdf/cm-evidence-claims.pdf> 3 July 2012.
155. Food and Drug Administration 2004. Guidance for Industry. <http://www.fda.gov/downloads/Drugs/GuidanceComplianceRegulatoryInformation/Guidances/ucm070491.pdf> 3 July 2012.
About the AuthorsDr. Chan Lai Wah has a bachelor’s degree in pharmacy, as well as a doctoral degree in pharmaceutics from the Na-tional University of Singapore. She is an Associate Professor with the Department of Pharmacy at the National University
of Singapore, where she lectures and conducts research in
pharmaceutical science, technology, and microbiology. She has published close to 100 research papers, many more conference papers, and a few book chapters. She also serves as an editorial board member and reviewer for scientific journals. Dr. Chan is a registered pharmacist in Singapore. She is particularly concerned about the quality, safety, and efficacy of pharmaceutical products and takes a keen interest in their formulation, manufacture, and regulatory control. In addition to her academic activities, she provides consultancy in pharmaceutical formulation and has served as an external specialist to the Health Sciences Authority of Singapore. She can be contacted by email: [email protected]. National University of Singapore – Pharmacy, Block S4, 18 Science Drive 4, Singapore 117543.
Sia Chong Hock holds a bachelor’s degree in pharmacy from the University of Singapore, as well as a master’s degree in healthcare management (with distinc-tion) from the University of Wales. He has worked close to 30 years in various
positions in the pharmaceutical and healthcare sectors of the Singapore Public Service – covering manufacturing and quality assurance of medicinal products, hospital and com-munity pharmacy management, drug product quality review, and Good Manufacturing Practice (GMP) inspection. At present, Sia is the Division Director of the Audit and Licens-ing Division, and concurrently, the Director of the Quality Assurance Office of the Health Products Regulations Group of Health Sciences Authority of Singapore. He is also an Adjunct Associate Professor with the National University of Singapore. Outside of his domestic regulatory and academic work, Sia is the Chairman of the ASEAN Joint Sectoral Com-mittee on GMP Inspection, Member of the Singapore Phar-macy Council, and the PIC/S Committee of Officials. From time to time, he joins in the PIC/S and WHO delegations on inspections and review missions of regulatory authorities. He can be contacted by email: [email protected]. Health Sciences Authority, Health Products Regulations Group, 150 Cantonment Road, Cantonment Centre, Blk A, #01-02, Singapore 089762.
Tan Kiat Yun has just graduated with a bachelor’s degree in pharmacy from the National University of Singapore. She is currently undergoing pre-registration training in a local hospital. She is con-cerned about the quality and safety of
medicines supplied to patients and has a strong interest in the regulatory control of medicines across the globe. She can be contacted by email: [email protected].

16 November/December 2012 PHARMACEUTICAL ENGINEERING
regulatoryGlobalization Challenges

1PHARMACEUTICAL ENGINEERING November/December 2012
regulatoryGlobal Regulatory News
InternationalChinese SFDA Commissioner Meets with the Ireland Department of Health and Children1
In August 2012, Yin Li, Commissioner of the State Food and Drug Adminis-tration (SFDA), met with Dr. James Reilly, the Minister of the Department of Health and Children of Ireland, and discussed medical device and drug supervision. Both exchanged ideas on strengthening cooperation in medical device supervision in the future. Rel-evant directors of SFDA’s Department of International Cooperation, Depart-ment of Medical Device Supervision and Department of Drug Registration attended the meeting.
Chinese SFDA Meets with the Ministry of Health, Welfare, and Sports of Netherlands2
In September 2012, Yin Li, Commis-sioner of the State Food and Drug Administration, met with Edith Schippers, the Minister of Health, Welfare, and Sports of the Nether-lands. Both sides exchanged opinions on the follow-ups after the signing of the Memorandum of Understanding between the two countries’ drug regu-latory authorities, the enhancement of supervision over active pharmaceu-tical ingredients under the new EU legislation on “falsified medicines,” as well as coordination of international standards and regulations on medi-cal device supervision. In addition, the two sides signed the Meeting Minutes on Cooperation Workplan (2012-2013) between the State Food
and Drug Administration of People’s Republic of China and the Health Care Inspectorate of the Kingdom of the Netherlands. Main directors of SFDA’s Department of International Cooperation, Department of Drug Registration, Department of Medical Device Supervision, relevant directors of SFDA’s Department of Drug Safety and Inspection, Bureau of Investiga-tion and Enforcement attended the meeting.
Chinese SFDA Meets with the Thai FDA.
In September 2012, SFDA Deputy Commissioner Wu Zhen and Deputy Commissioner Sun Xianze, respective-ly, met with Dr. Narangsant Pheerakij, the Deputy Secretary-General of the Thai Food and Drug Administration. Both sides exchanged opinions on drug GMP, quality control of tradi-tional Chinese medicine raw materi-als, post-marketing surveillance sys-tem, and monitoring of adverse drug reactions. Main directors of SFDA’s Department of International Coopera-tion, Department of Drug Safety and Inspection attended the meeting.
Chinese SFDA Commissioner Meets with the Poland Ministry of Health4
In September 2012, Yin Li, Commis-sioner of the State Food and Drug Administration, met with Bartosz Arlukowicz, the Minister of Health of Poland. Both sides exchanged opinions on the cooperation between the drug regulatory departments
of the two countries in the field of drug and medical device supervision and the signing of Memorandum of Understanding for cooperation. Main directors of SFDA’s Department of In-ternational Cooperation, Department of Drug Registration, and Depart-ment of Medical Device Supervision attended the meeting.
Asia/Pacific RimChinaChinese Requirements on Strengthening Supervision and Management of Pharmaceutical Excipients Released5
The State Food and Drug Admin-istration held a press conference on 2 August 2012, and released the “Relevant Requirements on Strength-ening Supervision and Management of Pharmaceutical Excipients.” The requirements specify the respective responsibilities of drug manufac-turers, pharmaceutical excipients manufacturers, and drug regulatory departments; define the supervision mode for pharmaceutical excipients; establish the work mechanisms including information publicity, supervision extension, and social su-pervision; and intensify the penalties for violations of laws and regulations. The requirements will come into effect on 1 February 2013.
IndiaIndia Issues Guidelines for Similar Biologics6
The “Guidelines on Similar Biologics” prepared by Central Drugs Standard Control Organization and the De-partment of Biotechnology, describe the regulatory pathway for a similar biologic claiming to be similar to an already authorized reference biologic. The guidelines address the regulatory pathway regarding manufacturing process and quality aspects for simi-lar biologics. These guidelines also address the pre-market regulatory requirements including comparabil-ity exercise for quality, preclinical,
Global RegulatoryNews
Reprinted fromPHARMACEUTICAL ENGINEERINGThe Official Technical Magazine Of iSPe
NovembeR/DecembeR 2012, vol 32, No 6
©copyright ISPe 2012
www.PharmaceuticalEngineering.org

2 November/December 2012 PHARMACEUTICAL ENGINEERING
regulatoryGlobal Regulatory News
and clinical studies, and post market regulatory requirements for similar biologics.
JapanJapanese PMDA Posts “Basic Principles on Global Clinical Trials (Reference Cases)”7
Since the issuance of “Basic Principles on Global Clinical Trials” (PFSB/ELD Notification No. 0928010, Direc-tor of the Evaluation and Licensing Division, Pharmaceutical and Food Safety Bureau, Ministry of Health, Labour and Welfare, dated 28 September 2007), Japan’s participa-tion in global clinical trials has been steadily increasing. In recent years, global clinical trials in East Asia (e.g., Japan, China, and South Korea) have been increasing as well as those in the US and Europe. The regula-tory cooperation between Japan and foreign countries also has been diversified. Specifically, Japan has been involved in global clinical trials at an early stage of drug develop-ment and large-scale global clinical trials in thousands of subjects. The regulatory cooperation among Japan, China, and South Korea also has been reinforced as that among Japan, US, and Europe. In the current trend of global drug development, smooth and appropriate conduct of global clinical trials, especially in East Asia, is a critical issue not only for industries, but also for regulatory authorities that evaluate study results. In order to respond to these changes and prog-ress, the Basic Principles on Global Clinical Trials (Reference Cases) has been developed. Based on recent cases, it intends to further promote an understanding of the former No-tification in 2007 and ensure Japan’s smooth participation in global drug development activities from an early stage as well as smooth and appropri-ate conduct of global clinical trials in East Asia where an increase in such trials is expected.
Japanese PMDA Publishes Presentation on its Vision, Current Situation, and Aims for the Future8
Tatsuya Kondo, Chief Executive of PMDA, gave a recent presentation outlining organizational updates, approval review, safety measures, regulatory science, and PMDA’s inter-national vision. The presentation can be found at http://www.pmda.go.jp/english/presentations/pdf/presenta-tions_20120327-28-1.pdf.
TaiwanTaiwanese FDA Actively Promotes the “Industrial Consultation and Guidance for Regulatory Science on Drugs and Medical Devices”9
Since the establishment of Food and Drug Administration (FDA), Depart-ment of Health in January 2010, the Executive Yuan has been dedicated to strengthening medical and pharma-ceutical industrial guidance through the promotion of the “Diamond Action Plan for Biotech Takeoff.” A consultation/guidance mechanism and diamond early harvest list for drug and medical device projects are developed for the domestic research and development of new drugs and medical devices. The project consul-tation and guidance mechanism for drugs includes four evaluation criteria – innovativeness, contribution, early harvest, and fulfillment of regulations; for medical devices, items are selected based on the following four evaluation criteria: 1. first of its kind in domesti-cally produced items, 2. best among same-category products, 3. new medi-cal indication, or 4. industry under focal support of a national project. The mechanism sets its goals based on the milestones of assisting the projects in reaching the pre-clinical to clinical test stage (first in human), en-tering the next clinical test, applying for inspection and registration, and obtaining the license.
EuropeEuropean UnionEuropean Commission Proposes New Clinical Trials Regulation10
The European Commission has pro-posed new legislation on the conduct of clinical trials. The proposed regula-tion comprises significant amend-ments to the current clinical trials directive (2001/20/EC). The proposed changes seek to address criticisms ex-pressed by patients, researchers, and industry. The new legislation will take the form of a regulation to ensure that the rules surrounding clinical trials are identical throughout the member states. More information on this topic is available in the question and answer sheet found at http://ec.europa.eu/health/files/clinicaltrials/2012_07/press-releases/memo-12-566_en.pdf, prepared by the European Commis-sion.
European Commission Publishes “New Rules on Importing Active Pharmaceutical Ingredients into the European Union11
The European Union (EU) has re-formed the rules for importing into the EU active substances for medici-nal products for human use. As of 2 January 2013, all imported active sub-stances must have been manufactured in compliance with standards of Good Manufacturing Practices (GMPs) at least equivalent to the GMPs of the EU. The manufacturing standards in the EU for active substances are those of the International Conference for Harmonisation – ICH Q7. As of 2 July 2013, this compliance must be confirmed in writing by the competent authority of the exporting country. This document also must confirm that the plant where the active substance was manufactured is subject to control and enforcement of good manufactur-ing practices at least equivalent to that in the EU.

3PHARMACEUTICAL ENGINEERING November/December 2012
regulatoryGlobal Regulatory News
European Medicines Agency Starts Consultation on Inventory of Needs for Children’s Medicines12
The European Medicines Agency has begun its first public consultation on its inventory of pediatric medi-cines. This inventory, which is being developed by the Agency’s Pediatric Committee (PDCO), sets out areas where further research and develop-ment into medicines for children are needed. It aims to enable:
• Companies to identify opportuni-ties for business development
• The PDCO to judge the need for medicines and studies when as-sessing draft pediatric investiga-tion plans, waivers, and deferrals
• Healthcare professionals and patients to have an information source available to support their decisions as to which medicines
EU Publishes Detailed Guidelines on Good Manufacturing Practices13
The European Commission launched the publication of three revised guide-lines:
• Chapter 1 on Pharmaceutical Qual-ity System is amended in order to align with the concepts and termi-nology described in the ICH Q10 tripartite guideline on Pharmaceu-tical Quality System. The title of the Chapter itself is also changed accordingly.
• Chapter 7 on Outsourced Activi-ties is revised in order to provide updated guidance on outsourced GMP regulated activities beyond the current scope of contract man-ufacture and analysis operations and in view of the ICH Q10 guide-line on the Pharmaceutical Quality System. The title of the Chapter has been changed to reflect this.
• Annex 2 on Manufacture of Biological Active Substances and Medicinal Products for Human Use
is revised as a consequence of the restructuring of the GMP Guide, new manufacturing technology and concepts, the increased breadth of biological medicinal products to include several new product types such as transgenic derived prod-ucts and the Advanced Therapy Medicinal Products (ATMPs) together with associated new legis-lation.
Pharmacovigilance Risk Assessment Committee Elects Chair and Vice-Chair14
The European Medicines Agency’s recently established Pharmacovigi-lance Risk Assessment Committee has elected June Raine from the United Kingdom as its Chair and Álmath Spooner from Ireland as its Vice-Chair at its second meeting from 3 to 5 Sep-tember 2012. Both mandates are for a three-year period.
European Committee for Orphan Medicinal Products Elects New Chair and Vice-Chair15
In September 2012, the European Medicines Agency’s Committee for Orphan Medicinal Products (COMP) elected Professor Bruno Sepodes from Portugal as its Chair and Lesley Greene, a volunteer patient represen-tative for Eurordis, as its Vice-Chair. Both have been elected for a three-year mandate.
EU Issues “News Bulletin for Small and Medium-Sized Enterprises”15
This newsletter, which can be found at: http://www.emea.europa.eu/docs/en_GB/document_library/Newslet-ter/2012/09/WC500132187.pdf, provides updates on new EU guidance documents and regulatory develop-ments.
Committee for Advanced Therapies’ Streamlines Activities16
The European Medicines Agency has replaced the activities of the two
working parties of the Committee for Advanced Therapies (CAT) - the Cell-based Products Working Party (CPWP) and Gene Therapy Working Party (GTWP) - with ad-hoc draft-ing groups. This is part of a drive to improve the efficiency of the Agency’s operations and optimize the use of the expertise available. From now on, the CAT will take the lead responsibility for the development of guidelines and organization of workshops, setting up drafting groups whenever needed to develop specific guidance documents. This is intended to strengthen the role of the CAT as the reference body deal-ing with all aspects of the develop-ment of advanced-therapy medicines in Europe.
European Commission Proposes New Rules on Medical Devices and In Vitro Diagnostic Medical Devices17
In September 2012, the European Commission adopted a package on in-novation in health consisting of:
• The Communication on safe, ef-fective, and innovative medical devices and in vitro diagnostic medical devices for the benefit of patients, consumers, and health-care professionals
• The Proposal for a Regulation of the European Parliament and of the Council on medical de-vices, and amending Directive 2001/83/EC, Regulation (EC) No 178/2002 and Regulation (EC) No 1223/2009
• The Proposal for a Regulation of the European Parliament and of the Council on in vitro diagnostic medical devices
United KingdomBritish Simplified Medicines Regulations Come into Force18
The Human Medicines Regulations 2012 have come into force 14 August 2012. The regulations are the result of the initiative by the Medicines and

4 November/December 2012 PHARMACEUTICAL ENGINEERING
regulatoryGlobal Regulatory News
Healthcare products Regulatory Agen-cy (MHRA) to consolidate and review UK medicines legislation, and follow extensive consultation with interested parties. The regulations significantly simplify medicines legislation while maintaining strong and effective safeguards for public health. They also will reduce regulatory burden on business. They replace much of the Medicines Act 1968 and around 200 statutory instruments, in the process repealing much obsolete law and con-tributing to the government’s drive for burden reduction.
North America/South AmericaCanadaHealth Canada Publishes Guideline on Classification of Observations Noted During Establishment Inspections According to Their Risk19
The purpose of this guideline is to classify the observations noted during establishment inspections according to their risk; to ensure uniformity among the inspectors of the Health Products and Food Branch Inspector-ate in the attribution of the rating following establishment inspections; and to inform the industry of the situ-ations that the Inspectorate considers unacceptable and that will generate a Non-Compliant rating following an in-spection. The document can be found at: http://www.hc-sc.gc.ca/dhp-mps/alt_formats/pdf/compli-conform/gmp-bpf/docs/gui-0023-eng.pdf.
United StatesUS FDA Releases New Issue of “Small Business Chronicles”20
This newsletter, which can be found at: http://www.fda.gov/downloads/Drugs/DevelopmentApprovalPro-cess/SmallBusinessAssistance/UCM319879.pdf, addresses new drug quality.
New FDA Task Force Support Innovation in Antibacterial Drug Development21
The task force is a multi-disciplinary group of 19 CDER scientists and clini-cians who will use existing partner-ships and collaborations to work with other experts in the field, including from academia, industry, professional societies, patient advocacy groups, and government agencies to identify priority areas and develop and imple-ment possible solutions to the chal-lenges of antibacterial drug develop-ment. The task force plans to:
• Explore novel scientific approaches to facilitate antibacterial drug development, like the broader use of clinical pharmacology data, sta-tistical methods, innovative clinical trial designs, use of additional available data sources, and the ad-vancement of alternative measures to evaluate clinical effectiveness of potential new therapies
• Identify issues related to unmet medical needs for antibacterial drugs, reasons for the lack of a ro-bust pipeline for antibacterial drug development, and new approaches for weighing the risks, benefits, and uncertainties of potential new antibacterial drugs
• Evaluate existing FDA guidances related to antibacterial drug devel-opment, determine if revision or elaboration is needed, and identify areas where future guidance would be helpful, as set forth in the GAIN Title of FDASIA
• Use existing collaborative agree-ments to work with think tanks and other thought leaders to explore various approaches that could enable antibacterial drug develop-ment, including innovative study designs and statistical analytical methods
US President’s Council of Advisors on Science and Technology Releases Report on Innovation in Drug Discovery and Development22
While basic biomedical sciences have seen stunning progress in past decades, challenges remain in trans-lating those scientific advances into practical solutions, according to the report—Propelling Innovation in Drug Discovery, Development, and Evalu-ation—produced by the President’s Council of Advisors on Science and Technology (PCAST). The report as-sesses the reasons for that long-term trend. The United States should set a goal of doubling the output of innova-tive new medicines that meet critical public health needs over the next 10 to 15 years, while continuing to increase drug safety, a presidentially appointed council of experts advised in a report released. The council recommends a number of actions involving industry, academia, and the Federal Govern-ment.
References1. Chinese State Food and Drug Ad-
ministration, http://eng.sfda.gov.cn/WS03/CL0757/74325.html.
2. Chinese State Food and Drug Ad-ministration, http://eng.sfda.gov.cn/WS03/CL0757/75184.html.
3. Chinese State Food and Drug Ad-ministration, http://eng.sfda.gov.cn/WS03/CL0757/75037.html.
4. Chinese State Food and Drug Ad-ministration, http://eng.sfda.gov.cn/WS03/CL0757/75183.html
5. Chinese State Food and Drug Ad-ministration, http://eng.sfda.gov.cn/WS03/CL0757/74010.htm
6. Indian Central Drugs Standard Control Agency, http://www.cdsco.nic.in/Bio%20Similar%20Guideline.pdf.

5PHARMACEUTICAL ENGINEERING November/December 2012
regulatoryGlobal Regulatory News
7. Japanese Pharmaceuticals and Medical Devices Administra-tion, http://www.pmda.go.jp/english/service/pdf/notifica-tions/20120906.pdf.
8. Japanese Pharmaceuticals and Medical Devices Administration, http://www.pmda.go.jp/english/presentations/pdf/presenta-tions_20120327-28-1.pdf.
9. Taiwanese Food and Drug Ad-ministration, http://www.doh.gov.tw/EN2006/DM/DM2_p01.aspx?class_no=387&now_fod_list_no=9073&level_no=1&doc_no=86213.
10. Finnish Medicines Agency, http://www.fimea.fi/whats_new/1/0/eu-ropean_commission_proposes_new_clinical_trials_regulation.
11. European Commission, http://ec.europa.eu/health/files/docu-ments/active_pharmaceutical_in-gredients_leaflet_en.pdf.
12. European Medicines Agency, http://www.ema.europa.eu/ema/index.jsp?curl=pages/news_and_events/news/2012/08/news_detail_001591.jsp&mid=WC0b01ac058004d5c1.
13. European Commission, http://ec.europa.eu/health/human-use/quality/developements/index_en.htm.
14. European Medicines Agency, http://www.ema.europa.eu/ema/index.jsp?curl=pages/news_and_events/news/2012/09/news_detail_001595.jsp&mid=WC0b01ac058004d5c1.
15. European Medicines Agency, http://www.emea.europa.eu/docs/en_GB/document_li-brary/Newsletter/2012/09/WC500132187.pdf.
16. European Medicines Agency, http://www.ema.europa.eu/ema/index.jsp?curl=pages/news_and_events/news/2012/09/news_detail_001597.jsp&mid=WC0b01ac058004d5c1.
17. European Commission, http://ec.europa.eu/health/medical-devices/documents/revision/index_en.htm.
18. British Medicines and Healthcare products Regulatory Agency, http://www.mhra.gov.uk/News-Centre/Pressreleases/CON179741.
19. Health Canada, http://www.hc-sc.gc.ca/dhp-mps/alt_formats/pdf/compli-conform/gmp-bpf/docs/gui-0023-eng.pdf.
20. United States Food and Drug Ad-ministration, http://www.fda.gov/downloads/Drugs/Developmen-tApprovalProcess/SmallBusines-sAssistance/UCM319879.pdf.
21. United States Food and Drug Ad-ministration, http://www.fda.gov/NewsEvents/Newsroom/Pres-sAnnouncements/ucm320643.htm?source=govdelivery.
22. United States President’s Council of Advisors on Science and Tech-nology, http://www.whitehouse.gov/sites/default/files/micro-sites/ostp/pcast_fda_release_fi-nal.pdf.

1PHARMACEUTICAL ENGINEERING November/December 2012
verificationFacility Design and Construction
Introduction
T he global economic landscape has dras-tically changed, in recent years, result-ing in a world of great uncertainty. The economies in the developing world are rapidly powering ahead, creating huge wealth and rising disposable incomes. In stark contrast, however, the western economies are stagnating, buried under huge mountains of debt with falling
disposable incomes. If the western economies are to emerge from their current economic difficulties, they desperately need to focus their efforts on innovation, cost, and quality. In the 1980s, Edward Deming’s philosophies for quality management were introduced to American manufacturing and many companies began applying his statistical process control methods and quality management principles to production lines and business processes. Deming’s work had begun in post-war Japan working with Japanese manufacturers and executives. His message to Japan’s chief executives was:
“Improving quality will reduce expenses while increasing productivity and market share. By adopting appropriate principles of management, organizations can increase quality and simultaneously reduce costs by reducing waste, rework, staff attrition and litigation while increasing customer loyalty.”1
In today’s market, “Less” is the new “More” and finding ways to drive up quality without increasing cost is the key focus. In the highly technical and regulated world of biophar-maceutical manufacturing, life science companies are faced with falling revenues; largely due to loss of patent protection on their blockbuster drugs and a lack of pipeline for new medicines. As a result, the biopharmaceutical manufacturing world is focused on reducing costs, increasing efficiency and productivity, without lowering quality. Similarly, from a capital projects perspective, there is also great urgency for controlling costs and assuring return on capital invested, especially for complex capital-intensive projects with long lead times such as in the biopharmaceuti-cal industry. Although companies cautiously continue to commit capi-tal, there is more pressure today than ever, especially from a field execution perspective, to mitigate risks, accelerate schedule, manage cost, and drive up field quality perfor-mance. In addition, good operability, cost effective mainte-nance, and the entire “asset life” are becoming common key performance indicators for the value of the investment. Large program delays, costly over-runs, and poor oper-ability/reliability resulting from poor quality are no longer acceptable in today’s market place. For many years and with dramatic cost to our economy, the construction sector has been struggling with field quality issues resulting in commissioning/qualification delays and ultimately facilities with poor operability and reliability. However, this cost could potentially be reduced significantly if the industry were to embrace technology and apply Dem-ing’s philosophy of “quality” that has been used with great
Assured Construction Quality Saves Time and Money
by Jay Lad and Bruce Beck
This article demonstrates how Eli Lilly increased field efficiency and productivity, lowered costs, and improved overall build quality by
implementing a proactive field quality assurance program and the latest technology.
Reprinted fromPHARMACEUTICAL ENGINEERINGThe Official Technical Magazine Of iSPe
NoveMbeR/DeCeMbeR 2012, vol 32, No 6
©Copyright ISPe 2012
www.PharmaceuticalEngineering.org

2 November/December 2012 PHARMACEUTICAL ENGINEERING
verificationFacility Design and Construction
Figure 1. Construction quality modeled on safety program.
success by the manufacturing sector of the economy. In recent years, significant work has gone into studying construction quality and specifically, how to reduce rework. Unfortunately, it’s often been difficult to gather data and ef-fectively analyze field quality performance. The article, “Construction Quality: the Key to Success-ful Capital Projects Delivery,” published in Pharmaceutical Engineering, November/December 2009 discussed how to manage construction quality. As a follow up, the two case studies below demonstrate how Eli Lilly and Company lowered costs and improved overall build quality for two new recently built facilities, one in the developed world and one in the developing world. The article also shares some of the field performance data, the challenges it encountered, as well as key learning points.
BackgroundIn 2001, Eli Lilly found itself in an intense period of capital expansion worldwide. At the same time, the industry was going through increased regulatory scrutiny of manufactur-ing practices and validation of new facilities. This resulted in more rigorous testing and verification of system design, installed equipment and operation, and the documentation and rigor of testing requirements increased significantly. Lilly addressed these increased demands by developing and implementing a robust Commissioning and Qualifica-tion (C&Q) program, which significantly improved cost and schedule. However, as it improved its program, it began to realize that construction quality issues were having an adverse effect. Therefore, in 2005, Lilly began to examine the impact of construction quality on the C&Q program and soon con-cluded that construction deficiencies and poor field qual-ity management were a significant hindrance. Each time a construction issue was found, the company had to halt commissioning and re-engage the construction team to rec-tify the issue – costing time, money, and more importantly, compromising schedule. As a result, Lilly decided to develop a Construction Quality Assurance (CQA) program to avoid similar problems in the future.
Quality ProgramThe primary aim of Lilly’s CQA program was to assure that construction contrac-tors met design specifications, through a managed process, with the outcome resulting in a trouble-free C&Q program. The overall approach was to apply quality concepts and practices to the construc-tion activities to ensure that the facility was delivered on time as specified, defect free, and in an operable state. One of the objectives of our CQA
program was to raise the importance of quality and self-in-spections to the contractors in order to prevent deficiencies, minimize defective work, and strive toward a zero critical items punch list. It was critical that field issues were identi-fied early during construction and resolved quickly in order to prevent them from surfacing late in the project. Lilly modeled its CQA program on its “Contractor Safety Program,” which had been highly successful for many years. The program comprises three primary elements, as seen in Figure 1.
• Pre-Qualification: contractor quality program assess-ment.
• Job Quality Plans: establish an expectation of having defined job specific quality plans that are developed and managed by contractors.
• Monitoring Program: a rigorous project quality monitor-ing program with immediate feedback to contractors.
It was important to Lilly that its CQA program was scalable and only implemented on projects that were deemed to be high risk. As a result, Lilly developed a quantitative ap-proach to assessing risks, based on complexity and size of the project as seen in Figure 2.
TechnologyAlthough significant work has gone into studying construc-tion quality and specifically, how to reduce rework, it has of-ten been difficult to gather data and effectively analyze field quality performance, as historically methods for collecting data have often relied on manual/paper-based systems. However, recent advances in technology have made the capture and sharing of field information much easier than in the past. Today there are several web-based software applications that will allow you to easily assimilate, system-ize, categorize, prioritize, and disseminate field performance information, including the capture of digital pictures. Therefore, when Lilly developed its field quality program, it decided to take advantage of the latest construction field

3PHARMACEUTICAL ENGINEERING November/December 2012
verificationFacility Design and Construction
software, tablet PCs, and the internet to help implement its program. By implementing web-based tools, field inspectors would be able to document, communicate, and track field issues throughout the project in one web-hosted database as op-posed to historical approaches of notebooks, spreadsheets, and emails.
Field Issue ManagementEach issue identified in the field by Lilly was entered into a web-based field quality system and given a unique identify-ing number. Several attributes also could be assigned to each issue to properly assess and characterize the issue, including items such as:
• Description of issue• System that issue belonged to• Contractor responsible for issue• Date identified
• Expected resolution date• Priority of issue rating• Commissioning impacting potential• Root cause
The issue also could be classified by severity. This classification identified the nature of the issue and urgency for resolution as seen in Figure 3. Having these tools not only im-proved Lilly’s ability to record and track issues, but also provided valuable data for analyzing the overall effectiveness of our CQA program. The data allowed field inspectors to assess a variety of important factors for managing the CQA program such as:
• Time to resolve issues• Number of open and closed issues• Contractor and subcontractor perfor-
mance over time• Issues identified prior to TCCC and
post TCCC• Root cause assessment and patterns
For Lilly’s CQA program to be success-ful, it was crucial that at Transfer of Care, Custody, and Control (TCCC) of each system (from the construction team to the commissioning/qualification team) there were minimal quality issues that could impact on the commissioning/qualifica-tion team’s ability to proceed with its
work. The intent was to have all or the majority of issues identified pre-TCCC and to track whether any issues could impact commissioning and qualification.
Case Study 1:Biotech Facility, Kinsale, IrelandIn 2007, Eli Lilly committed to build a new $400 million biotech facility in Kinsale, Ireland, which was critical to its long-term strategy in biotechnology. With almost half a billion dollars at stake, Lilly was keen to ensure that the facility was delivered on time, within budget, and defect free. As a result, it was decided to implement a CQA program on the project, utilizing the latest web-based construction field software and tablet PCs.
The FindingsThe data generated from the CQA program was insightful and helpful in identifying future improvements. In all, Lilly recorded 10,990 issues during the Kinsale biotech project,
Figure 2. Project scaling.
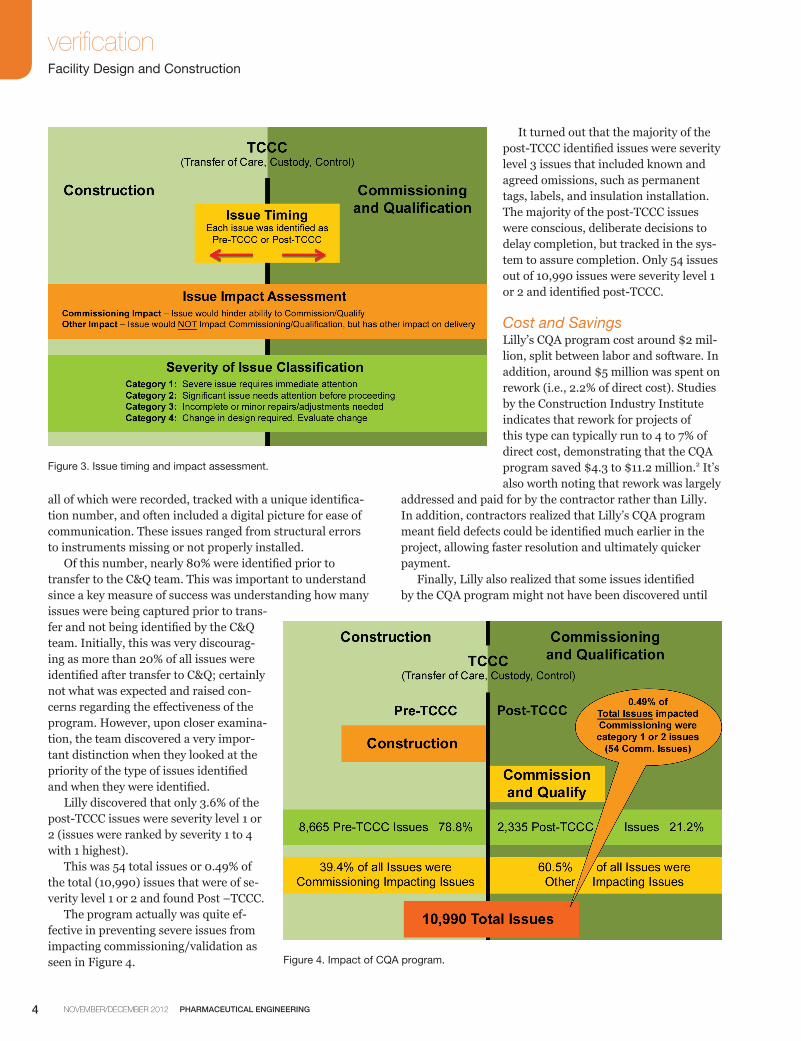
4 November/December 2012 PHARMACEUTICAL ENGINEERING
verificationFacility Design and Construction
Figure 4. Impact of CQA program.
all of which were recorded, tracked with a unique identifica-tion number, and often included a digital picture for ease of communication. These issues ranged from structural errors to instruments missing or not properly installed. Of this number, nearly 80% were identified prior to transfer to the C&Q team. This was important to understand since a key measure of success was understanding how many issues were being captured prior to trans-fer and not being identified by the C&Q team. Initially, this was very discourag-ing as more than 20% of all issues were identified after transfer to C&Q; certainly not what was expected and raised con-cerns regarding the effectiveness of the program. However, upon closer examina-tion, the team discovered a very impor-tant distinction when they looked at the priority of the type of issues identified and when they were identified. Lilly discovered that only 3.6% of the post-TCCC issues were severity level 1 or 2 (issues were ranked by severity 1 to 4 with 1 highest). This was 54 total issues or 0.49% of the total (10,990) issues that were of se-verity level 1 or 2 and found Post –TCCC. The program actually was quite ef-fective in preventing severe issues from impacting commissioning/validation as seen in Figure 4.
It turned out that the majority of the post-TCCC identified issues were severity level 3 issues that included known and agreed omissions, such as permanent tags, labels, and insulation installation. The majority of the post-TCCC issues were conscious, deliberate decisions to delay completion, but tracked in the sys-tem to assure completion. Only 54 issues out of 10,990 issues were severity level 1 or 2 and identified post-TCCC.
Cost and SavingsLilly’s CQA program cost around $2 mil-lion, split between labor and software. In addition, around $5 million was spent on rework (i.e., 2.2% of direct cost). Studies by the Construction Industry Institute indicates that rework for projects of this type can typically run to 4 to 7% of direct cost, demonstrating that the CQA program saved $4.3 to $11.2 million.2 It’s also worth noting that rework was largely
addressed and paid for by the contractor rather than Lilly. In addition, contractors realized that Lilly’s CQA program meant field defects could be identified much earlier in the project, allowing faster resolution and ultimately quicker payment. Finally, Lilly also realized that some issues identified by the CQA program might not have been discovered until
Figure 3. Issue timing and impact assessment.

5PHARMACEUTICAL ENGINEERING November/December 2012
verificationFacility Design and Construction
much later after handover to operations, and this could have potentially resulted in costly repairs.
Comparing ProjectsA comparison between Kinsale and a similar biotech facil-ity built in 2006 in Indianapolis, USA, which didn’t use a formal construction quality assurance program, showed that the Kinsale project used less than half the number of people in commissioning and qualification, which resulted in significant savings. Kinsale came in under budget and com-pleted commissioning and qualification four months earlier than the Indianapolis project - Table A).
Case Study 2:Packaging Facility, Suzhou, ChinaIn early 2012, Lilly completed the construction of a packag-ing and storage facility in Suzhou, China. This was the first capital project in China by Lilly of any size in a number of years (~$70 million) and Lilly was on a steep learning curve to understand current China building practices, skills, and capabilities. A decision was made to apply the CQA program on this project as we had successfully done on other projects throughout the world. The CQA team was assembled and trained on the intent and elements of the program. The actu-al implementation, though, became an adventure in learning culture, capabilities, and the need for absolute persistence.
Challenges to CQA ProgramThe general contractor on the Suzhou project struggled to adhere to specifications and it became evident that the most important goals for the contractor were speed and cost since they were doing much of the work on fixed bid contract. Quality was only a consideration if it impacted the first two goals of speed and cost. Quality of work was often left for inspectors to evaluate and discover deficiencies. This meant inspectors had to be very diligent in their inspections and
timely in identifying, tracking, and communicating issues. After a slow start to the CQA program, it gained momentum and regular quality meetings were being held with contrac-tors to assess system status and open issues. The impact of the months of tracking issues became clearer to the contractors and construction management team as we got closer to TCCC of specific systems. The data-base allowed the team to sort the issues list by systems and clearly understand what issues were still open and must be addressed prior to TCCC for each system. This focused the energy of the contractor and construction management team to meet the defined TCCC dates. Though we had a slow start to the CQA program and have many opportunities to improve on future projects, Lilly did see a benefit in using the CQA program. Many issues were identified by inspectors and resolved by the contractor at the contractor’s expense. Transfer of systems was often delayed as we had identified issues the contractor was required to address, but in the end only 1% of the issues identified post TCCC were classified as a severity level 1 or 2. All other is-sues identified post TCCC were of a minor level of severity. As a result, once system TCCC occurred, the C&Q program proceeded smoothly and with minimal disruption.
The FindingsThe project has identified and tracked more than 2,200 quality issues. Initially, uptake of the program was difficult. The discipline of recording issues in a timely manner was not valued by members of the construction management team or the contractors. In fact, there was a strong belief that recording issues was a negative and should be avoided. This was compounded by individuals struggling to see the long-term value of recording each issue in a central web-based tool and database. The desire was either to not record at all or keep records in individual notebooks, computers, etc. After significant coaching and training, we began to
Table A. Final project performance comparison – Kinsale facility delivered faster and cheaper.
Categories 2010 2006
Facility Type: biotech Manufacturing biotech Manufacturing
Capital Project Cost: $400 M $400 M
Project location: Kinsale, Ireland Indianapolis, Indiana, USA
Defined CQA Program: Yes No
Commissioning/validation Peak Staff: 20 People 70 People
Commissioning/Qualification Costs: < 4% TIC(Total Installed Cost)
~ 10% TIC(Total Installed Cost)
Performance Against budget: Under budget over budget
Total Commissioning/validation Duration: 7.1 Months 11.4 Months

6 November/December 2012 PHARMACEUTICAL ENGINEERING
verificationFacility Design and Construction
make traction and the impact of having items in a central da-tabase became clearer over time. As we approached system TCCC to C&Q, it was very powerful to sort data by system and understand clearly open issues requiring attention. The data indicates that 92% of all issues were identified prior to TCCC to the C&Q team. The C&Q team worked very closely with the construction management team to identify issues and address prior to TCCC. This resulted in systems being transferred to C&Q in good shape with minimal to few issues after TCCC. There were significant construction qual-ity issues and challenges on the project, but the CQA pro-gram acted as a filter to assure these issues were addressed prior to transfer to C&Q.
Key Learning PointsThese projects shared the following common learning points:
• Upfront CQA training and oversight is essential for success – investing energy and effort into training the contractors, Construction Management Team, and inspec-tors on the program and tools is extremely important. It is very important to create understanding of the program, tools, and metrics to engage as many people as possible.
• Job Specific Construction Quality Plans surface issues and misalignment – insisting that contractors and subcontractors create Job Specific Quality Plans is extremely valuable in highlighting misunderstandings regarding specifications and expectations.
• There must be an established CQA leader who is passionate about Quality – leadership of the CQA program is critical for success. The individual must be passionate about quality and highly credible with the construction team contractors. In addition, they must be disciplined in following the process.
• Subject Matter Experts must be used in inspec-tions – it is important to have inspectors who are subject matter experts for the discipline they are inspecting. Besides knowledge they add credibility to the contractor and findings.
• Routine and regular quality meetings must be held with contractors – quality should be a regular meeting between the CQA Team Contractors and Con-struction Management team.
• Tools to record issues and manage data are es-sential – the technology now available is essential for tracking of issues in a CQA program. They allow timely tracking and provide meaningful metrics of performance and status.
Technology ConsiderationsWhen selecting CQA tools, it is recommended that the fol-lowing should be considered:
• User and field friendly for construction environment – the tool should be simple to use by the user with minimal key strokes or actions to input or retrieve data. It should take a minimal time to learn the tool and how to use it.
• Utilize digital cameras to capture issues – most tools today take advantage of internally mounted cameras and capture digital photographs and insert them within the database tool automatically.
• Document download – determine if the tool will allow unique check-list, drawings, etc., to be down loaded into the tool to assist inspectors.
• Metrics and reporting – assess the tool’s ability to create metrics and reports that are applicable and useful to your project. Determine if these are configurable by the users.
• Capable of extracting data for learning – the tool should allow users to access data for analysis and exporting to other databases if desired.
• Web-based – easy access from anywhere in world – a web-based tool allows people to easily access the da-tabase. This improves communication of issues since essentially all contractors have access to the internet.
• Hardware requirements – determine what type of equip-ment is needed to effectively utilize software. Many systems now can use iPads as well as tablets in the field.
• Ease of configuration – when choosing a system, it will be necessary to configure the system for your specific project. Understand the effort required by your staff to configure the tool. Understand the level of help the pro-vider will provide for configuring.
• Robust and supported system – the provider must dem-onstrate a stable, robust system with adequate technical support and training.
ConclusionIn summary, the CQA program together with technology was critical to the overall success of the projects as it allowed early detection of field issues and faster resolution. This proactive approach to field quality resulted in fewer issues impacting the back end of the project. As a result, the commissioning/qualification team was able to focus its attention and efforts on functional performance rather than construction rework. Today’s technology has made CQA programs more practi-cal and easier to implement. It has also allowed them to be more effectively managed and facilitated the collection/assessment of large quantities of field data in a more useful way. Lilly’s experience has shown that a relatively small in-vestment upfront (i.e., 0.5% of total installed cost) in a field quality program and technology can increase field efficiency and productivity, improve quality, accelerate schedule, reduce costs, and ultimately help speed medicines to market.

7PHARMACEUTICAL ENGINEERING November/December 2012
verificationFacility Design and Construction
References1. Darmen-Haven.org, http://www.dharma-haven.org/
five-havens/deming.htm, April 27, 1998. 2. CII RT-153, “Causes and effects of Field Re-work Re-
search Team.”
About the AuthorsJay Lad is the Managing Director of SPGL (formerly the business of Skanska Pharma-ceutical Group Ltd.), leading its construc-tion quality, commissioning, qualification, and regulatory compliance services glob-ally. He is a chartered chemical engineer
with more than 20 years of experience in the pharmaceutical and biotechnology industry, covering facility and process design, construction, commissioning, qualification, and project management. Lad has worked in a variety of sectors, including bulk, pharmaceutical, biotechnology, and medical devices, and has considerable experience managing commis-sioning/qualification businesses in the pharmaceutical and biotechnology realm. He holds a BEng in chemical engineer-ing, graduating with honors, from the University of Brad-ford in the United Kingdom and he has previously worked for several EPC contractors, including Raytheon, AMEC, Washington Group International and Skanska. He can be contacted by telephone: +44(0)7970-652-880 or +44(0)20-7084-6873 or email: [email protected]. SPGL, 1a Aylesbury Street, London EC1R 0ST, United Kingdom.
Bruce Beck is a Director at Eli Lilly and Company who has responsibility for leading the Global Facilities Delivery (GFD) Com-missioning and Qualification group. This group has responsibility for assuring new facilities delivered by Lilly’s GFD are prop-
erly commissioned and qualified. This group has established corporate C&Q procedures, standards, and methods used throughout the corporation for delivering capital projects and have been very successful in driving standardization and global improvement. Beck has a BS in chemistry and an MS in chemical engineering from Ohio State University. He has worked for Eli Lilly and Company for more than 30 years in a variety of roles including technical services, manufacturing management, environmental, and health and safety manage-ment and most recently over the last 12 years has managed the corporate commissioning and qualification group for Global Facilities Delivery. He can be contacted by telephone: +1-317-277-3413 or email: [email protected]. Eli Lilly & Company, Lilly Corporate Center, Indianapo-lis, Indiana 46285 USA.

1PHARMACEUTICAL ENGINEERING November/December 2012
engineering and designAPI Equipment Mix Determination
Equipment Mix Determination for Multi-Product API Facility Planning
by Joseph R. Hettenbach, P.E.
This article presents a method of determining the major equipment set for the planning of new or revamped existing API multi-product facilities.
Introduction
A t this period of time, in the chang-ing business market, pharmaceutical companies are generally not building new Active Pharmaceutical Ingredient (API) facilities. However, companies are using a number of API manu-facturing facilities both within their company, in a more dynamic less dedicated fashion, as well as utilizing
API facilities of outside parties for manufacture of many of their products. Despite this trend, there may be a need at times to revamp existing facilities to be able to accommodate a number of smaller bulk volume APIs in a single facility or alternatively, to build new facilities to fill this need. A number of years ago, a need was recognized to develop a model which could provide a basis for the planning of a major equipment list and identify the key features to be in-cluded. This tool could be considered for use in an upgrade/expansion of an existing multi-product API facility, as well as for the planning of a new “flexible” multi-product facility. It was expected that the model could have ongoing use in the planning of any facility, be it a new API facility or fine chem-ical plant facility. This was recognized as a challenge, since the model would have to be able to determine the number and sizes of reactors, support equipment, API product isola-tion devices, such as filters and centrifuges, and dryers. In addition, the Materials of Construction (MOC) of the major process equipment, piping, etc., must be compatible with the processes and chemistries to be run in the facility. One of the key elements in this exercise is determining the right number of reactors and product isolation devices and dryer combinations and a MOC “mix” to define this multi-pool
type facility, designed for simultaneous manufacture of a number of processes. It should be pointed out that the scope of this article does not include incorporation of the many variables involved in running API manufacturing operations for a large pharmaceutical company into a very complex model. The focus is a single facility which will handle a small fraction of such a company’s API manufacturing needs. This proposed facility would have to reasonably accom-modate the different processes expected to be made in the plant and satisfy the production volume requirements for selected product mixes from the company’s “portfolio” of required APIs. In many cases, the product mix to be accom-modated by these type of facilities is changing, along with variable specific product bulk volume needs. At the same time, it would be desirable to achieve a high level of effective reactor volume utilization, which would involve the use of the reactors for reactor service, as opposed to using the reactors for support services. In some cases, reactors are used as wash pots and as vessels to hold waste streams for subsequent treatment. Further, there are times that some of the reactors are left idle during a given cam-paign. The purpose of this article is to describe the methodology that was developed and utilized to develop the “optimum equipment mix” for planning these type of facilities. While it is conceivable to use this methodology to plan bioprocessing type facilities (which typically include, smaller scale reac-tors, product isolation devices, etc.), experience to date has only been in API, where commonly, the processing has been strongly organic synthesis based, at a larger scale. Its mode of operation is characterized mainly as batch or semi-batch in nature. For this reason, the primary focus area of this discussion is batch processing of APIs or fine chemicals.
Reprinted fromPHARMACEUTICAL ENGINEERINGThe Official Technical Magazine Of iSPe
NovEMbER/DEcEMbER 2012, vol 32, No 6
©copyright ISPE 2012
www.PharmaceuticalEngineering.org

2 November/December 2012 PHARMACEUTICAL ENGINEERING
engineering and designAPI Equipment Mix Determination
The technique has been subsequently applied successfully on a number of other major projects. Its description will fol-low, concluding with a case study to illustrate the use of the model developed for use, initially, on one project. The basis for this discussion is a “typical” generic batch process, depicted in the flow diagram in Figure 1. In such a process, one or more reactors are used with a product isolation device (i.e., a centrifuge or product filter for a solid product), a dryer (if the product is dried), and a number of auxiliary/support equipment pieces and systems. For more complex processes, additional reactors and support equip-ment would be added to this “picture.”
Equipment ConsiderationsThe list that follows identifies the major types of equipment and important features that typically need to be specified for a multi-product plant. Table A includes additional charac-teristics and design aspects that are normally related to that equipment. The equipment mix, then, includes:
• The number and sizes of reactors and the support equip-ment pieces directly associated with them to be provided. It is important to recognize that some processes require special heating and cooling systems, and the applica-tion of special instrumentation and controls, including Process Analytical Technology (PAT). It would be good practice to make some provisions for these features on a selected number of reactors in the mix, particularly for those reactors to be used as specialized reactors and crystallization vessels.
• The number of head tanks (for charging liquids and solutions to reactors and solid/liquid separators) to be provided.
• The number of specialty commodity liquid chemical tanks of the appropriate Materials of Construction (MOC) to be provided. Examples could be commercial grade hydro-chloric acid, sulfuric acid, sodium hydroxide, others.
• The number of API product isolation devices provided, including various types of filters and centrifuges, which are used to collect/separate the API product from the crystallization slurry produced in the process. Since products have different handling characteristics and cake washing requirements, it is important to have at least a few different types of product isolation devices available.
• The number of product dryers provided. It is also impor-tant to have a few different dryer types available (Table A) to handle the different product handling and processing characteristics one would anticipate in the multi-product facility. For general information, it should be noted that a significant issue to address with the use of filter dryers is the management of the residual heels produced in the operation.
• The number of other major equipment pieces and sup-
port features as needed for the type of processes and chemistries to be encountered. Examples would be continuous extraction, filtration, and drying to be used in semi-batch processing schemes.
In addition to the major equipment considerations, there are other elements that define how the facility can operate in a flexible mode. Two examples of such features are:
• The number of process vacuum pumps which are often “shared” for reactor service
• The number of process inlet lines and process outlet lines, which typically are routed to and from process manifold rooms, sometimes called transfer stations
The Process BasisOne concept is to analyze a considerable number of products either targeted for the facility or products similar to those types of processes and chemistries reasonably expected to be manufactured/utilized in the planned facility. If one can comfortably consider these to represent a “universe of processes,” averaging techniques and ranges can be used to come up with the guidelines for the equipment list develop-ment. A flow sheet would be developed for each synthetic pro-cess step looking at some reasonable batch size and using some reactor size as the average one in your standard manu-facturing practice; in the case study described below, it was 7500 liters. The reactors can then be scaled up and down to comfortably hold the respective maximum – and minimum – process volumes to be handled in each reactor at some volume utilization. In general practice, this could be 85% of the maximum volume (on the high side); and low volumes
Figure 1. A Typical batch “single reactor“ process train.

3PHARMACEUTICAL ENGINEERING November/December 2012
engineering and designAPI Equipment Mix Determination
Equipment Type Equipment Attributes and Design Considerations
Reactors Typical reactor design considerations that must be resolved. What material of construction they should be? How many should have solids charging capability? How many should have decanters? How many should have distillate receivers? What type(s) of distillation and heating/cooling capability should be provided?
Reactor construction will be metal or glass-lined.
Glass-lined carbon steel reactors will mainly have dished head bottoms with heating/cooling jackets; some could be specified as cone bottom.
Metal reactors are typically 316l stainless steel (s/s), or Hastelloy®, or equivalent. The metal reactors are better suited for high temperature service and better heat transfer and can be fitted with internal coils or removable tube bundles, which inherently pose some process cleaning challenges, as a trade-off.
There are a number of different impeller designs available to suit agitation requirements, which are not readily met by the standard impeller choices offered with glass-lined reactors, which are more limited.
Reactors are usually fitted with overhead condensers; vertical units (typically Hastelloy® Moc on the tube side) are often preferred over horizontal for shell and tube units since they are easier to clean; plate type design units could be considered. There are also specialty reactors with their unique requirements. Examples could include hydrogenators, which could be stirred tank or loop type designs.
Process Piping Reactor inlet and outlet process lines are general purpose, and are typically Teflon-lined (T/l) carbon steel pipe unless the vessel is a s/s Moc. In addition, s/s lines would be added to the numbers of general purpose process lines to accommodate higher numbers of solvents to be handled for the processes envisioned to be run in the facility, as well as some solvents for which the T/l pipe could be an issue, e.g., toluene.
Head Tanks Typically glass-lined carbon steel, jacketed, with agitators.
Solvent wash tanks would likely be jacketed with agitators, and stainless steel Moc.
A high proportion of the head tanks would be jacketed with agitators and heating and cooling to handle miscellaneous chemicals, solvents, and solutions – to be charged to reactors with process temperature control.
Some of the head tanks should have solids charging capability as well, e.g., to make up solutions such as sodium bicarbonate into water. This is preferable to using a reactor for this simple service.
Stainless steel jacketed tanks, with agitators, heating and cooling can be provided for solvents used to wash product filters and centrifuges.
commodity chemical Tanks
commodity tanks are head tanks, suitably sized (say 1000 to 2000 liters).
They are typically g/l, but at times other Moc are provided for specific material compatibility requirements.
Generally would not have jackets.
Typical commodity chemicals might be 50% sodium hydroxide, 37% hydrochloric acid, and 99% sulfuric acid.
Mother liquor Tanks
They are typically of g/l Moc with jackets, agitators, and heating and cooling capability, and are used to receive mother liquors from product isolations/filtrations and to neutralize the pH if necessary.
Typically one nominal size larger than the reactors/crystallizers it would be serving, e.g., a 10,000 liters size mother liquor tank for a 7500 liter size reactor.
Also used to receive extract and wash layers destined for waste/effluent treatments operations or outside disposal, at times requiring some pre-treatment.
can be used as additional distillate receivers for processes having more distillations, as well as for miscellaneous process services as holding/surge tanks, etc.
Distillate Receivers Used to collect solvent (cuts) from atmospheric and vacuum distillation operations.
Typically glass-lined Moc.
Sizing should be appropriate to its related reactor (e.g., 5000 liters for a 7500 liter reactor it would serve).
Product Isolation Devices
Product isolation devices include filters and centrifuges.
Filters could include candle type and plate type.
There are number of different centrifuges; both horizontal basket and vertical basket are the most common for API processing.
Solids charging Devices
Solids charging to reactors, head tanks, and product dryers would entail contained Intermediate bulk containers (Ibcs). They are used with charge chutes or alternative acceptable contained systems, product dryers should be provided with contained discharge systems suitable for the products handled.
Product Dryers Product dryers are generally vacuum type, ranging from tray driers to various agitated and paddle types.
Filter dryers are also used quite extensively and are handy for doing “in-situ” repulps, prior to the drying operation.
Table A. Significant consideration in the determination of the multi-product equipment mix.

4 November/December 2012 PHARMACEUTICAL ENGINEERING
engineering and designAPI Equipment Mix Determination
Figure 2. Filtration Intensity Ratio (FIR).
may be processed by the use of special agitator/impeller designs (somewhat enhanced by using cone-bottomed reac-tors). The flow sheet should show all of the equipment listed above, the features required, as well as the numbers of inlet/outlet lines for each reactor. The number of reactors needed is, of course, also a function of your manufacturing practices regarding the number of vessels used for operations such as batch extractions, etc.
In practice, the FIR concept has provided a powerful tool to quickly characterize multi-
product plants.” A central concept in identifying the optimum equipment mix is a parameter defined as the Filtration Intensity Ratio, hereafter referred to as FIR or F/I/R in a few of the tables. The FIR is defined as the ratio of the number of reactors to the number of product isolation device and product dryer combinations. A simplified depiction of this can be seen in Figure 2. In this case, there are four reactors and one product isolation device and dryer combination, resulting in a FIR of 4. For example, in a plant having 16 reactors, 4 product isolation devices, and 4 dryers, the FIR would be 16/4 = 4.0 for the entire plant. Each product isolation device is valued at 0.5 units, and each product dryer is valued at 0.5 units, in this calculation. A filter dryer (combining the product isolation and product drying operations in one unit) is valued at 1.0 unit. Specific process steps in which the product is kept as a wet cake (i.e., not dried before subsequent processing) would have higher effective FIRs by calculation. For processes with higher FIRs, the process “train” would require more reac-tors, and conversely for processes with lower FIRs. Note that the centrifuge in the diagram in Figure 2 is representative of a product isolation device, accounted for in the “Filters + Dryers” term in the FIR calculation shown for a sample process in schematic form. The number of reactors used for a given process can be increased with the benefit of achieving lower “batch turnaround” times (TA), the period of time between batch make-ups, but with the “trade-off ” of having higher FIRs and fewer reactors available for other processes run simulta-neously in the facility. The effect of having fewer reactors available, because one process train is using a higher number of reactors from the total mix available, could be underutilizing the installed number of product isolation devices and drying capacity for
plants configured to have lower FIRs. In practice, the FIR concept has provided a powerful tool to quickly characterize multi-product plants. Experience has demonstrated that the more recent processes coming down the pipeline were trending toward needing lower FIRs. This trend rendered some of our older facilities, which generally had higher installed FIRs, as not being good fits for those same processes since some significant level of reactor capac-ity would be “wasted.” Of course, for planning purposes, one way to rectify that situation would be to install additional product isolation devices and dryers to the extent that capi-tal funding and space were available.
Guidelines for a Multi-Product Plant Equipment SetThe data derived from the process analyzes can be tabulated for each specific process step, including the number, sizes, and MOCs of the reactors and support equipment pieces (head tanks, commodity tanks, mother liquor tanks, receiv-ers); the number and sizes of the reactors that require solids charging capability, decanters, and vacuum pumps typically used for vacuum batch distillations; the number of process inlet and outlet lines on the reactors; and the number of product isolation equipment devices and dryers required. Note: At times, a product is isolated as a wet cake and then re-pulped or re-dissolved and recrystallized; then the prod-uct from this additional processing is isolated and dried, all as part of one distinct process train with its resulting calcu-lated FIR. The data from all of the processes can be compiled to determine averages and reasonable ranges for FIR values. An example of one such table of results is illustrated in Table F in the case study.

5PHARMACEUTICAL ENGINEERING November/December 2012
engineering and designAPI Equipment Mix Determination
Case StudyIn order to illustrate the method described above, the follow-ing is a summary of the results for analyzes performed for the first project in which this method was applied, which in-volved the revamp and upgrade of an older API facility. This existing plant did not have an equipment mix very suitable for a multi-product facility, was overcrowded, had outdated process transfer station rooms, and needed different product isolation and drying equipment to replace older, outdated units.
Definition of a Process BasisTen new emerging products to be considered for manufac-ture in a revamped 17 reactor plant involving varying num-bers of process synthesis steps, different chemistries, etc., were analyzed, including drawing up detailed flow sheets, scaling, etc., as described above. The scope of the analyzes included a total of 52 synthetic process steps as follows:
Product #1 – 7 steps Product #2 – 3 steps Product #3 – 6 steps Product #4 – 9 steps Product #5 – 4 steps Product #6 – 5 steps Product #7 – 4 steps Product #8 – 5 stepsProduct #9 – 4 steps Product #10 – 5 steps
To characterize these processes, the number of steps from this group having distillation operations was 25, which represents, on average, approximately one out of every two processes with this attribute. Approximately one out of every three of these process steps (18 in number) used reflux operations, and about one half of the process steps (23 in number) used batch extraction.
Case Study ResultsThe details of the analyzes performed and the results of the study are summarized in the tables with qualifying notes.
Reactors AnalyzesThe process flow diagrams for the 52 process steps were ana-lyzed and scaled to give the number of reactors of different sizes which are needed. These total counts for each size were tabulated and percentages by size were tabulated, shown as Table B. For comparative purpose, a size breakdown for an existing plant is shown, alongside the tentative size break-down for the planned 17 reactor plant. The breakdown for the proposed plant includes both existing reactors and new ones (replacements or additional ones). The breakdowns will also illustrate how the plants stack up against the Process Fit Analysis results for the new product mix studied. So, it can be seen that the reactor size mixes for each of the facilities shown here for comparison roughly reasonably match the profile dictated by the process steps considered in this case study.
Reactors with Solids Charging CapabilitySolids charging capability is a significant attribute of the reactor mix tabulated above. For the referenced existing API multi-product plant (again, for comparative purposes), 9 out of the 13 reactors have solids charging capability (68% ). The process analysis for the case study plant determined that 12 out of 17 reactors would have solids charging capability (71 %). The breakdown by reactor size for solids charging
Size(liters)
Existing API Plant(4 “Pools”)
Case Study Plant(5 “Pools”)
4,0007,50010,00012,000
2421
3432
Totals ---> 2 12
Note: number of metal charge reactors included in the totals
2 2
Table C. Solids charging capable reactors listing.
Process Fit Analysis Results
(for the 52 steps)
Existing API Plant
(for comparison)(13 reactors)
Case Study Plant
(tentative)(17 reactors)
Size (liters)
Counts % of Total
% of Total % of Total
4,000 21 13 15 19
7,500 77 48 54 44
10,000 39 24 15 12
12,000 20 12 15 19
16,000 5 3 - 6
162
Table B. Reactor sizes/counts analysis.
Product No.
Average Numbers per Process Step
M.L. Tanks / Receivers(does not include
treatment operations)
Header Vessels(includes commodity
bead tanks)
12345678910
2 (1 to 3)1
3 (2 to 3)3 (1 to 5)2 (1 to 5)4 (1 to 5)3 ( 2 to 4)2 (2 to 3)3 (1 to 8)2 (1 to 4)
2 (0 to 4)2 (2 to 3)3 (2 to 4)2 (1 to 6)3 (1 to 5)4 (1 to 9)4 (0 to 6)2 (1 to 4)2 (1 to 5)2 (1 to 3)
Table D. Mother liquor tanks/receivers and header vessels analyses.

6 November/December 2012 PHARMACEUTICAL ENGINEERING
engineering and designAPI Equipment Mix Determination
capability is shown in Table C. The term “pool” designates a set of equipment, including reactors, and support equipment to isolate and dry a product from one distinct process. The use of the term (4 “pools”) in Table C means that up to four (4) processes could be manufactured simultaneously in the facility, provided that the equipment is available (a function of process scheduling, etc.), whereas the term (5 “pools”) means that up to five processes could be manufactured simultaneously. The number of metal reactors (included in the totals in Table C) is significant and important to consider since some processes needing solids charging cannot be performed in the standard g/l reactors, due to some specific chemi-cal, solvent, or solids incompatibility. There have been some problems with certain high temperature alkali (high pH) solutions and other specific liquid chemicals in glass-lined reactors. Certain solvents such as hexane and hexane can produce static discharge (a significant safety hazard) in non-metal (conductive) vessels. Some solids, such as metalcatalyst particles and others, can be very abrasive to the glass lining. Beyond material capability considerations, glass-lined reactors also have limitations regarding heat transfer, particularly when very low process temperatures are required.
Support Equipment AnalyzesThe average number of mother liquor tanks (also serving as larger volume solvent receivers) and head tanks (for miscel-laneous solutions and commodity type chemical solutions) were determined for each product (which includes a number of different, distinct synthetic process steps). Table D shows the averages for each product, and the range of the counts determined from the process analyzes (flow diagrams) that were developed (as done for the reac-tors). This is included to show the wide range of variability expected in a multi-product plant using this type of equip-ment. A number of distinct process steps is included in each of 10 products listed in Table D. The “Average Numbers per Process Step” of “M.L. Tanks and Receivers” and “Header Vessels,” show the range of the numbers of each type of ves-sel for all of the process steps of that product in parentheses, as well as the rounded off average for all of those specific process steps. For example, for Product No. 4, the numbers of M.L.Tanks and Receivers for the 9 distinct processes steps ranges from 1 to 5 with a rounded-off average of 3, for all of the 9 process steps of that particular product. Not surprisingly, processes needing more of these equip-ment pieces (the higher end of the ratios shown) would not generally be a good fit for the facility “designed” using the average ratios. Alternatively, reactors could be used for other services to supplement the apparent “count” deficiencies for certain products, resulting in a drop in the effective capacity based on reactor count utilization.
Mother liquor tanks or reactors can be used to treat mother liquors and other waste streams prior to disposal, or subsequent treatment, or recovery for re-use. Of course, the number of mother liquor tanks available can affect the production scheduling and the effective reactor capacity utilization. The support equipment ratio (expressed as the number of specific equipment type pieces/the number of reactors) is shown in Table E.
The Filtration Intensity Ratio (FIR) Analyzes This brings us to the key characteristic parameter for multi-product plants, introduced in this discussion. The filtration intensity ratios were calculated for all of the processes, using the process flow diagrams. The incidence of the FIRs (i.e., the number of processes having that ratio) were compiled for each product. Product averages and totals were calculat-ed to give a good feel for what the “average” situation looks like. The use of averages is basic to implementation of this method. Table F lists the filtration intensity ratios that an analysis of the processes determined. To clarify the number entries in this table, and to show how the calculations are performed:
Product 9, for example, includes four specific process steps: 2 steps have a F/I/R = 1.0, 1 step has a F/I/R = 2.0, and 1 step has a F/I/R = 6.0. The average then for Product 9, shown in the last column on the right = (2 × 1 + 1 × 2 + 1 × 6) / 4 = (10 / 4) = 2.5
Note: N/A: There are no FIRs for these process steps since a solid product is not isolated.
For the 49 data entries for the specific process steps for FIR values (not including those listed in the N/A column in the table above):
• 32 had FIRs Less Than 3.0• 17 had FIRs Equal to or Greater than 3.0
Table E. Support equipment ratios.
Support Equipment Ratios(per Reactor)
Proposed Design
Guideline
Existing API Plant
(for comparison)
Case Study Plant
(tentative)
Head Tanks 0.5 - 0.7 0.67 0.5
Mother Liquor Tanks
0.8 - 0.9 0.83 1.1
RR’s (Reactor Distill. Receivers)
0.3 - 0.4 0.33 0.14
Commodity Tanks
0.2 - 0.3 0.6 0.29

7PHARMACEUTICAL ENGINEERING November/December 2012
engineering and designAPI Equipment Mix Determination
Product Analyzed
Incidence of F/I/R (Rounded) in the Process Steps Product Average
N/A 1 2 3 4 5 6 9
1 1 1 4 1 2.71
2 1 2 1.67
3 2 2 1 2.03
4 2 3 1 1 1 1 2.9
5 1 2 1 2.06
6 2 1 1 1 5.33
7 2 1 1 4
8 5 1 2.16
9 2 1 1 2.5
10 2 2 1 1.8
Totals: 3 11 21 8 3 2 3 1 2.716
Table F. Filtration Intensity Ratio (FIR) Analysis (FIR) for the process steps analyzed.
• 8 had FIRs Equal to 4.0 or Greater
As a means for a comparison, a similar, existing highly functional multi-product API plant has 14 reactors in total including 13 reactors and 1 mother liquor tank, similarly outfitted; 3 filter dryers, 1 centrifuge (for product isolation), 1 pan dryer, and 1 rotary dryer; and the calculated FIR (from the definition above) for that equipment mix = 14/4.5 = 3.1. For the case study plant, the proposed FIR for a configu-ration (allowing for planned future additions) was 3.40 (= 17/5). This FIR (3.40) was used to develop the equipment set for the case study plant; future additions of one reactor, one product isolation device, and one dryer (in spaces reserved for this equipment) could reduce the FIR to 3.0 (18/6), which is the proposed guideline value. It should be emphasized that the FIR is intended to iden-tify the major equipment, in total, for a facility. If multiple products are run simultaneously, there could be different FIR configurations for individual process steps/equipment trains. The assumption here is that any and all of the prod-uct isolation devices and drying equipment is accessible to any and all of the reaction vessels. Of course, for scheduling product mixes, the FIR require-ments for specific processes could restrict the total utiliza-tion of the reaction vessels and product isolation devices and drying equipment for a given “product mix” campaign.
Capacity Determinations and Checking the Facility for Accommodating Product MixesIn addition to the process basis (i.e., having the right equip-
ment set), another important consideration is the process fit with regard to product bulk volume requirements. One can test a given equipment set by analyzing a number of product mix scenarios. This, of course, would involve some iteration with the goal of maximizing effective installed total reactor volume (capacity) utilization. One formula that can be used to determine the capacity utilization for a given process at a scale (average reactor size) suitable for anticipated product volumes, and utilizing an equipment pool chosen is (Equation #1):
Capacity (days) = (#) × (1 / 24) × (TA) + (C) × {(CT - TA) × (1 / 24) + (CO) + (CU)}
Where:• # = the number of batches at the batch size (product out-
put) determined to meet the annual production volume needs.
• TA = the batch turn around time in hours (also called the “bottleneck time”) which is the period of time between subsequent batch make-ups, using the number of reac-tors specified in your flow sheet. (Again, using additional reactors can reduce the TA).
• C = the number of campaigns run per year (typically 2, perhaps 3).
• CT = the overall batch cycle time in hours. The (CT - TA) term represents the “tail” of the last batch, finishing up the campaign.
• CO = the changeover time in days between campaigns for the particular pool used and incorporating the peculiar process particulars involved.
• CU = the cleanup time in days for the equipment used for that process.
Performing the process fit studies pro-vide a reality check on the size/scale/number of equipment pools (“average” process trains) to be provided in a new facility, and can identify some of the operational constraints inherent in the upgrade/expanded existing facility.
Conceptual Model Calculations Results and Proposed GuidelinesThe results generated for the case study analysis were compiled into a design guidance document for a multi-product organic synthesis facility. Table G sum-marizes some key aspects of the guid-ance document, showing the results of the process analyzes described above in the column labeled “Process Based

8 November/December 2012 PHARMACEUTICAL ENGINEERING
engineering and designAPI Equipment Mix Determination
Conceptual Model Results” and the derived guidance in the “Proposed Design Guidelines” column. Regarding the data in the third column, “An Existing API Plant for Comparison” has been included to show the actual equipment mix factors for a relatively new API plant located in the same produc-tion site, which was completed about four years earlier than the case study. The existing, relatively new API plant had been planned with a product mix basis that was similar to, but somewhat different than the product mix utilized in the
case study project for the upgrade of the older API plant, i.e., involving older (in-line) products. The actual equipment set was developed using this table as a guide, and the new equipment was installed while al-lowing space for future additions to improve the FIR for the longer term. The ranges delineated in the “Proposed Design Guidelines” column were accepted by management as a vi-able tool to be carefully applied, still with an eye towards the evolving product pipeline, subject to adjustments. Of course, it should be recognized that the overall project time schedule for a new API plant – from the time the Equipment List is “frozen” for the design to the time that the construction is completed and the facility is approved and ready for actual production startup – can be on the order of two to three years, depending on the size of the facility and other factors. During this time period, product mixes and capacity utilizations can change due to production volume requirements, as well as the actual processes utilized, due to process changes, optimization, etc. A good, flexible design will provide a facility that can better meet the changing product profile, recognizing that the model used for plan-ning has its limitations and cannot always ensure that the variable needs can be met in a given facility. Note that while the proposed guidelines follow the results from the conceptual model (case study), they are not an exact match. Some areas were adjusted in the interest of greater flexibility. Admittedly there is some “feel” involved here, based on the designer’s familiarity with the historical performance of similar facilities. For example, in the cat-egory of reactors with solids charging capability, the values were slanted toward the existing plant with which we had a lot of operating experience. It should be emphasized, again, that these guidelines are appropriate for use in planning facilities utilizing similar chemistries and manufacturing practices.
Product Mix Details and Capacity Calculations ResultsAn initial example product mix was chosen to check the suit-ability of the equipment set determined for the case study plant, utilizing the “equipment set” dictated by the factors in the proposed guidelines from Table G. This involved specific process steps chosen for five of the products, which had been analyzed as part of the model development. A calcula-tion showed a good fit with reactor count utilization > 90%; 16 of the 17 reactors of the facility would be utilized for this product mix (16 /17 × 100% = 94%). Table H is included to give a feel for the production cycles and output volumes for this same product mix that might be expected of an equipment “pool” in the size range, as discussed earlier in this article. The process turnaround times (TA) and batch sizes from the process analysis were used in the capacity formula de-
Multi-purpose Facility Summary Table
Proposed Design
Guidelines
Process Basis
Conceptual Model Results
An Existing API Plant for Comparison
Reactor Quantity 15 15 14
Reactor Sizes (% of Total)
<4000 liters 0% 0% 0%
4000 liters 10 - 15% 13 15
7500 liters 40 - 50% 48 55
10000 liters 20 - 30% 24 15
12000 liters 10 - 20% 12 15
16000 liters 0 - 5% 3 N/A
Reactor Moc Ratio(metal ones/ total ones)
< .25 < .25 < .23
Reactors w/ Solids charging capability
60 - 70% 35% 69%
Support Equipment Ratios (per Reactor)
Head Tanks 0.5 - 0.7 0.67 0.5
Mother liquor Tanks
0.8 - 0.9 0.83 1.1
Reactor Distillate Receivers
0.3 - 0.4 0.33 0.14
commodity Tanks
0.2 - 0.3 0.6 0.29
Overall Equipment Mix
Filtration Intensity Ratio F/I/R
3 < 3.0 3.1
Simultaneous Process Trains
5 5 4
Table G. Model results and proposed guidelines for equipment set and features.

9PHARMACEUTICAL ENGINEERING November/December 2012
engineering and designAPI Equipment Mix Determination
Process Step
TA (hrs) Lot
Frequency
KG/Batch
KG/Week/at TA
FG Conversion Equivalent
(KG)
Product #7 – Step 3
24 188 1316 1877
Product #10 – Step 4
24 240 1680 1400
Product #5 – Step 2
36 697 3253 2954
Product #8 – Step 1
29 638 3696 4228
Product #6 – Step 5
20 300 2520 2520
Table H. Product output for the example product mix.
scribed above (Equation #1) to calculate the number of oper-ating days needed in that specific pool to produce the desired annual output of product. The F.G. (Finished Equivalent (Finished Goods, Final API product, from the multi-step synthesis), numbers listed in the last column on the right side of Table H are the amounts of the finished product that would be produced from the particular intermediate step listed (for the specific product), assuming standard yields are met for all of the remaining sequential process synthesis steps for that product. The total numbers for the head tanks, commodity tanks, mother liquor tanks, and distillate receivers also were con-sistent with the ratios (to the number of reactors) as speci-fied in the proposed guidelines.
Outcome of the Case Study Plant ProjectThe case study plant project was completed with the revamp work and new equipment additions implemented, closely following the guidelines developed in Table G, except that a FIR of 3.4 was used (suggested to be = 3.0). The facility was operated successfully for a number of years, before it was shut down due to a business decision involving downsizing of worldwide capacity.
An Illustrative Example of the Use of the GuidelinesSay a company which has the same chemistries and manu-facturing practices as those used to develop the guidelines from the detailed process analyzes described above (i.e., as-suming that the guidelines in Table F are applicable) wants to get a feel for the approximate level of investment needed for a new 15 reactor API facility to manufacture a number of promising new products. Applying the FIR of 3.0 from Table E, then 15 / 3 = 5 fil-ter and dryer combinations would be needed. A good mix of these units to handle variable product characteristics could
be 2 filter driers, 1 pressure filter, 2 centrifuges, 1 cone dryer, and 2 pan dryers. The facility would be nominal “5 pool” one – meaning up to 5 processes could be run simultaneously. Applying the % factors in Table E for reactor sizes, metal reactors, and solids charging features, the breakdown could be 2 @ 4000 L, 7 @ 7500 L, 3 @ 10,000 L, 2 @ 12,000 L, and 1 @ 16,000 L. Two of these would be metal reactors with the rest being g/l vessels and 10 of these would be set up with solids charging capabilities. Using the factors in the table for support equipment, the major process equipment list would round out as 9 head tanks, 4 commodity chemical tanks, 13 mother liquor tanks, and 5 distillate receivers. A ball park cost for the facility could be estimated by using a factor of 6 to 8 times the total equipment cost (from the company’s experience) or by using a factor of $X / in-stalled reactor liter (again from the company’s experience). If this factor is pegged at $1850 / liter of installed reactor capacity based on the company’s current cost experience, then for this facility with 130,500 liters of reactor capac-ity, the ball park (off the top of the head) estimate would be $240 million (to be used for discussion purposes only).
“Reduced Scope” ApproachesIf there is a need to reduce the scope/cost of a new or upgraded/expanded facility project, the following are sug-gestions for alternative approaches. In some respects, these changes or reductions to the “full blown,” more flexible facil-ity could be considered a “semi-dedicated” approach. Since it is widely accepted in the project engineering/management domain that the capital cost of a project is very much a func-tion of the process and support equipment list/cost included in the scope, there are some significant cost reductions that could be achieved by the “semi-dedicated” approaches, which could include:
• Use of only a few different reactor sizes – planning to run smaller process volumes at times (reiterating a few points made above), aided by the installation of the ap-propriate agitation system, including impeller designs, speed control, etc., to appropriately “manage” these low volumes. A number of coned bottom vessels, both g/l and metal, also could be used to help manage the low volumes.
• Installation of fewer reactors, but reserving ample space, and the planning of the infrastructure, and consideration of the people and materials flows, utilities services, etc., to accommodate the future additions. This would, of course, translate into fewer potential “process trains” in the shorter term.
• Although not recommended strictly, one could install an overhead condenser that could be shared by two reac-tors, while reserving ample space, local utilities services, etc., for future additions.

10 November/December 2012 PHARMACEUTICAL ENGINEERING
engineering and designAPI Equipment Mix Determination
and drying. An alternative way to set up a solvent wash for a product isolation device is to utilize a pump and an in-line heat exchanger with temperature and flow control systems thereby reducing the need for the solvent wash pot.
ConclusionThere are a number of ways to develop an equipment list for a multi-product plant. One method to achieve this has been described here which involves extensive analyzes, but provides a workable model to determine the list. It should be emphasized that the ratios and percentages shown here re-garding equipment pieces, etc., are very much a function of the manufacturing practices we employed and are sensitive to the type of processes and chemistries with which we have had experience. The Proposed Design Guidelines, based on our chemistries and processes, proved to be quite useful for a number of our applications. The FIR concept allows one to come up with a good starting point for development of the equipment list for a new facility, or an expansion/revamp of an existing one, provided that one analyzes at least a good number of processes expected to be manufactured in the fa-cility. We used this model successfully for projects based in a number of locations worldwide and generally found that the facilities “fashioned” using these guidelines were versatile enough, while achieving reasonably good, effective installed reactor volume capacity utilization. Of course, the use of “averages” as an acceptable ana-lytical technique in the development of this “tool” (model) inherently can lead to some issues, particularly in dealing with “outliers” – specific processes which require much different ratios of the number of major process equipment and support equipment pieces to the number of reactors provided. There are also other variables involved in the API manufacturing business operations, which could challenge the basic assumptions used in the model development. The model does not include any factors to account for these vari-ables, as its scope is a single API multi-pool flexible facility, intended to manufacture a carefully selected product mix to best utilize the facility capacity. It can be assumed that pharmaceutical companies manufacturing large numbers of API products would use a number of API facilities in their manufacturing network, including, when needed, outside parties to handle variable bulk volume requirements, con-flicts between products for scheduling, etc. The methodology described in this article is also of value as a screening measure for proposed expansions or new multi-product facilities. Proposals with FIR values as signifi-cant “outliers” to the values shown in table G might suggest that a more detailed process review is warranted (nearly two thirds of our processes had FIR values in the 2-4 range). The same methods described here can be used for any process type/product mix, recognizing that the model will
• Where charge chutes and IBCs cannot be accommodated, alternative contained solids charging systems could be employed. One example is an approach which involves use of vacuum and air/nitrogen to remove material from drums/containers in a contained room – the preferred method – or in a booth and charging the material to the reactor or head tank. Although this could be setup somewhat remotely from the reactor, it is preferred that the distance between the two be practically minimized.
• A higher FIR could be used by providing fewer product isolation devices (i.e., centrifuges and product filters) and dryers for the number of reactors to be set up. Ide-ally, one would want to reserve space for the future ad-ditions of some additional product isolation devices and dryers, if future needs dictate that. Of course, this would translate into fewer potential effective “process trains” in the shorter term.
• Fewer head tanks could be provided by setting up a “con-tained” room or a booth to transfer liquid raw materials in a controlled fashion directly to reactors. In addition, some smaller, portable vessels on wheels could be used for this service, on an “as-needed” basis. These typically would be non-jacketed, but could have air-driven por-table, typically “propeller type“ agitators, if needed, and must be docked securely in a “safe” location. Of course, the portable vessels inherently afford a lower degree of containment in their design and operation.
• Fewer process lines to and from reactors and selected equipment and solvent lines could be installed in the shorter term, while reserving space on racks, etc., for pipe routing; and installing additional spools in the pro-cess manifold room walls to be piped to in the future. All future piping should be included in the detailed design to a reasonable extent (to suit foreseeable needs – prefera-bly in 3-D), including pipe routing studies and isometric drawings of future lines to improve the chances of doing the future piping installation with minimum issues/in-terferences in the field.
• Fewer commodity tanks, distillate receivers, and mother liquor tanks can be installed in the shorter term with full provisions for future additions reasonably anticipated.
• It is good practice to have transfer pumps and agitators on all process vessels and support equipment to facilitate process cleaning by allowing closed-loop re-circulation type techniques and better sampling.
• Some degree of semi-dedication can be incorporated by setting up some reactors as solids charging capable (typically used at the beginning of a process) and other reactors as “crystallizers” (for the “isolation” of the prod-uct) with perhaps a mother liquor tank and a stainless steel solvent wash pot “semi-dedicated” to the product isolation device (be it a centrifuge, filter, or filter dryer) used for collecting the product and washing the cake,

11PHARMACEUTICAL ENGINEERING November/December 2012
engineering and designAPI Equipment Mix Determination
predict approximations which must be reviewed and likely adjusted based on additional considerations. This model also provides a means to plan facilities for cases when available capital investment is limited, while improving the prospects for more expeditious expansions and product specific addi-tions, as the needs for the facility change. In our experience, we were able to make product specific additions fairly read-ily to the base facilities in a number of cases, as the needs for new/different products developed, because we had planned for those eventualities.
AcknowledgementMuch thanks is to given Gregory Jack Hounsell, P.E. for his help in technical reviews and detailed editing of this article. Gregory and I worked together over a period of 30 years on a wide variety of process and environmental engineering initiatives, new facility designs, and revamps of existing fa-cilities. We also collaborated on a number of innovations in-volving new technologies and novel equipment and systems applications, as well as alternative approaches for process engineering problem solving at Pfizer Inc. throughout the US and internationally. His input on this article, including some of the tables and the graphics, is greatly appreciated.
About the AuthorJoseph R. Hettenbach, P.E. has more than 35 years of process engineering and environmental engineering experience, spending 33 years at Pfizer Inc., servicing manufacturing and research facilities in many US locations, Puerto Rico, Ireland,
England, and Singapore. He has managed the detailed process design of a number of projects for laboratory development, kilo plant, pilot plant, and commercial scale manufacturing API facilities. He has made presentations on the subject of “Improving the Process of Process Design of Multi-Product API Facilities” to a number of E&C, A&E, and CM companies throughout the US and in Ireland, to ISPE, and to the AICHE. He has Masters Degrees in chemical en-gineering and environmental engineering from Manhattan College. He is a licensed Professional Engineer in New York State. He is currently an adjunct professor in the Graduate Environmental Technology Program at the New York Insti-tute of Technology. He can be contacted by email: [email protected]. Process Engineering Works P.C., 155 Centershore Rd., Centerport, New York 11721, USA.

1PHARMACEUTICAL ENGINEERING November/December 2012
engineering and designWastewater Treatment
Introduction
T here has been much discussion on environmental problems with municipal Wastewater Treatment Plants (WWTPs) and their effluent recipients with a focus on micro-pollutants in human pharmaceuticals and endocrine1 active substances as a source of potential pol-lutants.2
Considering the relatively high throughput of WWTPs (i.e., a low effluent residence time and inadequate retention and reduction of compounds dur-ing treatment), it is not surprising that additional environ-mental problems have surfaced with municipal WWTPs and their effluent recipients. Indeed, the focus on another group of potential water pollutants, namely, human pharmaceu-ticals and endocrine active substances in particular, e.g., the synthetic manufactured hormone 17α-Ethinylestradiol, which has an effect on aquatic organisms, has become the subject of great concern over the past decade.3
Despite the numerous reports on environmental occur-rence of APIs at levels in the range of ng, the environmental significance, pertaining to environmental effects, is largely unknown. As an exception, the synthetic estrogen ethinyl-estradiol is well known for its potential for endocrine disrup-tive and reproductive effects in aquatic organisms.4
There is growing concern about a range of substances,which are suspected of interfering with the endocrine system also known as “endocrine disruptors.” In the European Union, an increasing number of parliamentary questions have been addressed to the Commission since 1997 concern-ing the use and regulation of a range of suspected endocrine disrupting substances. Many member states in the European Union2 have identified the hormonal effect acting chemicals and pharmaceuticals as a key problem, which is expressed
in the “Community Strategy for Endocrine Disruptors,” 17.12.1999. A Global Endocrine Disrupter Research Inven-tory (GEDRI), initially based on inventories established in the USA, Canada, and Germany, has been established.2
Treatment of wastewater containing aqua-toxic substanc-es, discharged from pharmaceutical manufacturing facilities can only be effective when it is not mixed with wastewater from other sources, i.e., before it gets diluted.5-6
It also implies that pre-treatment processes are needed at the source and not at the end-of-the-pipe, i.e., when it is mixed in conventional WWTPs. Conventional biological wastewater treatment plants using the activated sludge process are designed so that they are able to eliminate Carbon, Nitrogen, and Phosphorus to a high percentage out from the wastewater. Conventional WWTPs using the activated sludge process require the fol-lowing properties of substances for their elimination from the wastewater:
• High biological degradation• Good adsorption at suspense• Low polarity• Hydrophobic properties
These properties are different than those needed for an API, which in general have a high biological activity in a very low concentration and hydrophilic with a low adsorption rate, etc. This is the reason that API molecules are mostly very stable and have a high persistence for biodegradation. Therefore, a selective elimination of trace elements of APIs is not possible in conventional WWTPs. Micro-pollutants can most effectively be reduced with a dedicated production integrated WWTP, direct at source, before it is mixed with wastewater from other production facilities. In this case, the pharmaceutical WWTP can work
Effective Wastewater Treatment in the Pharmaceutical Industry
by Manfred Martz
This article presents a strategy to effectively treat pharmaceutical wastewater.
Reprinted fromPHARMACEUTICAL ENGINEERINGThe Official Technical Magazine Of iSPe
NovEmbER/DEcEmbER 2012, vol 32, No 6
©copyright ISPE 2012
www.PharmaceuticalEngineering.org

2 November/December 2012 PHARMACEUTICAL ENGINEERING
engineering and designWastewater Treatment
more efficiently in regard to the removal of pharmaceuti-cal compounds and in investment and operation costs. The wastewater to be treated from dedicated pharmaceutical production facilities will be reduced to a fraction of the total wastewater amount and the WWTP has a more efficient selective effect to aqua-toxic substances.
“Pharmaceutical wastewater treatment can directly impact GMP compliance for the manufacture of medicinal products; therefore, manufacturers need to know how to deal with the treatment of pharmaceutical wastewater and be aware of and understand the regulatory requirements.7
This article will demonstrate through a series of case studies how to implement dedicated WWTPs within phar-maceutical manufacturing facilities. The case studies are presented for this specific application only and cannot be generalized. There are many other wastewater treatment processes which could be used for similar applications; how-ever, this article will focus on the following objectives:
1. Establishing a strategy to effectively treat pharmaceutical wastewater
2. Identifying the need for and advantages of the treatment of pharmaceutical wastewater at point of source
3. Reducing investment, maintenance, and operating costs by selecting simple and effective wastewater treatment processes
PurposeThe purpose of establishing a wastewater treatment process is to minimize water contamination through wastewater discharges from pharmaceutical research, pharmaceutical development, and pharmaceutical production activities. The treatment of pharmaceutical wastewater should be part of the pharmaceutical manufacturing process, i.e., the waste-water treatment process must be established within the pharmaceutical production facility. Pharmaceutical waste-water treatment can directly impact GMP compliance for the manufacture of medicinal products; therefore, manufactur-ers need to know how to deal with the treatment of phar-
maceutical wastewater and be aware of and understand the regulatory requirements.7
General and Regulatory RequirementsIn general, the discharge of water pollutants from the phar-maceutical industry is regulated by environmental protec-tion authorities, e.g., the Environmental Protection Agency (EPA) in the US and the European Environmental Agency (EEA) in Europe. They set discharge limits for pharmaceuti-cal compounds for the concerned manufacturing sites. The US EPA has defined regulations for effluent limita-tions dedicated for pharmaceutical manufacturers1 and there is an overview of EPA regulations for pharmaceutical manufactures.7
In the EU, there are actually no binding limits for dis-charge of pharmaceuticals into surface and ground water available and the reduction of hazardous waste into surface water is regulated via the Water Framework Directive.5,6,8
Some responsibility concerning environmental protec-tion has been transferred to the regulatory bodies of the ICH tripartite European Union, Japan, and USA. The impact of a medicinal product or API discharged into surface or ground water have to be evaluated and for the marketing authoriza-tion, an Environmental Risk Assessment (ERA) is request-ed.9-11
Establishing a Strategy to Effectively Treat Pharmaceutical WastewaterIdentify the need for and advantages of the treat-ment of pharmaceutical wastewater at point of source:
• Municipal WWTPs do not remove micro-pollutants completely. Since many pharmaceuticals have a high biological activity, even if they occur in traces only (ng/l or lower), a negative impact on aquatic organisms is to be expected.12,13
Figure 1. Wastewater management.Continues on page 52.

3PHARMACEUTICAL ENGINEERING November/December 2012
engineering and designWastewater Treatment
• Micro-pollutants, especially when they occur in traces only, can be removed or bio-degraded more easily when it is not mixed with other wastewater.
• Subsequent elimination of micro-pollutants, which are further diluted and mixed with other wastewater compounds, may require more invest-ment costs than measures/provisions at point of source.
Waste ManagementFor waste management, the first priority is the prevention or reduction of pollut-ants into aquatic systems. The reuse of recycled compounds for pharmaceutical production is limited due to GMP com-pliance - Figure 1. An exception is the API production where solvents, filtrates, etc., can be recovered and reused.14,15
A good sample for recycle/reuse of residuals from the production of x-ray Contract Media (CM) is the incineration of bind iodine solutions and extraction as iodide solution by waste gas scrubbing, which can be sold on the world marked.16
Iodine containing CM is used in computer tomography for diagnostic purposes. To be GMP compliant, recycled compounds cannot be reused for phar-maceutical production, but the iodine can be sold on the market. The iodine containing residuals comes, for example, from CIP processes during the manu-facturing process. Using a membrane filtration process (discussed in the case study below), the iodine load in wastewa-ter can be reduced by > 99%; permeate can be discharged into an official sewage system. Another example of wastewater reduction from pharmaceutical produc-tion facilities is the optimization of CIP processes. The wastewater from finished pharmaceutical facilities comes primarily from rinsing solutions from the manu-facturing process. The wastewater can be reduced by optimization of the water consumption for these cleaning processes by using PAT for detecting the maximum allowable level of residues present. A real-time, inline process monitoring tool, which can analyze water samples down to
1 Fresh Water (Potable Water)
1.1 How and where is your fresh water (incoming water) delivered?
1.2 How is this water analyzed and which quality standard does it meet?
1.3 Which average quantities are used for which purposes?
2 Wastewater, General
2.1 Where do you discharge your wastewater to?
2.2 Is the wastewater treated after discharging? If yes, how?
2.3 Is the wastewater discharged separately depending on its use, i.e., as domestic wastewater, wastewater from production, laboratories, etc.?
3 Analysis of Wastewater
3.1 Which substances are, according to your experience, contained in your wastewater? Which substances are most likely to be found in your wastewater when considering the kind of work which is performed in your pharmaceutical production plant?
3.2 chemical oxygen demand (coD) =
3.3 biochemical oxygen Demand (boD) =
3.4 Dissolved organic carbon (Doc) =
3.5 Total organic carbon (Toc) =
3.6 Absorbable organic halogens (AoX) =
3.7 pH =
3.8 Do you determine any other solvents in your wastewater? If yes, which ones and what are the results?
3.9 Which biological methods do you apply for analyzing your wastewater?
4 Treatment of Wastewater
4.1 How is the wastewater treated?
4.2 Which regulations of your local authorities exist concerning wastewater?
4.3 What do these regulations stipulate?
4.4 How, how often, and by whom is the wastewater controlled?
4.5 Which results brought the last controls for your production plant?
4.6 Do you take special measurements, e.g., diluting the wastewater with fresh water?
5 Miscellaneous
5.1 How much are you charged for fresh water?
5.2 How much does wastewater cost you?
5.3 Do you face problems with odor originating from the wastewater?
5.4 In case your wastewater is not discharged into the municipal sewage system, but is left to sweep, please state the distance between seeping pit and the closest located deep well.
Table A. Questionnaire dedicated for pharmaceutical wastewater from existing finished pharmaceuticals production facilities of which have been used to collect basic information from affiliates worldwide to investigate the possibility of establishing the same wastewater treatment process technology.

4 November/December 2012 PHARMACEUTICAL ENGINEERING
engineering and designWastewater Treatment
the defined maximum allowable level of residues present on the vessels, can reduce the water consumption. A reduction of wastewater up to 50% is possible. Definition and interpretation of impurities for process equipment is product related. The concentration of micro-pollutants discharged into dedicated WWTP is needed to design the treatment process sufficiently that it is able to reduce aqua-toxic substances as much as possible below No Observed Effect Level (NOEL). Due to this production integrated wastewater discharge and treatment process, sufficient production and operation experience, as well as understanding regulatory require-ments, are needed. Understanding the properties of the product is the pre-condition for a successful design and operation of production integrated dedicated WWTPs.
Basic Conditions for Effective Treatment of Wastewater from Pharmaceutical Production FacilitiesThere are two basic conditions that should be considered in order to meet an effective and economical solution:
1. The treatment of pharmaceutical wastewater is part of the manufacturing process.
2. Dedicated technical knowledge and skill is needed to develop an integrated, effective, and economical phar-maceutical wastewater treatment process which has to be maintained to be in compliance with EPA requirements.
Condition 1 does also mean that this WWTP should be im-plemented within the pharmaceutical production organiza-tion as it can have impact on GMP related production facili-ties. For example, a second dedicated wastewater discharge system for contaminated CIP water is needed, which has to be installed within GMP areas. Signals from control valves for wastewater discharge and sensors, including monitor-ing requirements, have to be implemented in the PLC of the manufacturing process plant, which is the responsibility of the production management. The preferred solution is to pretreat before discharge into the central WWTP where the wastewater from differ-ent production facilities is mixed and the chance to reduce or destroy aqua-toxic substances is limited. The decision to treat the wastewater in a dedicated or centralized manner depends on the amount of wastewater, the ability for the WWTP to reduce micro-pollutants, the financial impact, and the scope of maintenance (operation costs). The decision has to be investigated case by case in order to determine the most economical and compliant solution. Condition 2 is needed to define all sources and concen-tration of aqua-toxic contaminants from the production facilities, e.g., wastewater from CIP or cleaning and rinsing processes has to be collected; connection points and the decision on “contaminated or non-contaminated” in GMP areas have to be defined, etc. The following tools are helpful to collect this basic information:
a. Wastewater questionnaire to evaluate the current situation - Table A
b. Wastewater map (wastewater flow/mass balance) - Table B
The intention of creating a wastewater map is to:
• Reduce the amount of wastewater due to process optimization and recovery of process water by analyzing the manufacturing processes.
• Determine and size the final wastewa-ter treatment process according to the Best Available Technology (BAT).
• Establish a clear and permanent record of the amount, load, and sum parameters (e.g., COD, BOD, AOX, etc.) of wastewater, depending on local requirements. In general, EPA’s regulations require monitoring of the relevant parameters. Specific require-ments may vary in individual cases.
1 Overview about the manufacturing processes (block diagram, etc.)
1.1 Type/declaration of manufacturing processes (dosage forms); cIP processes, cleaning, and rinsing steps.
1.2 Sequence of production, number of shifts (time of start and finished).
2 Wastewater flow and load (e.g., BOD5, COD, AOX, N, P) of each source
2.1 Parameter related overviews (boD5, coD, AoX, volatile organic halogens, heavy metals, N, P, temperature, pH, suspended solids) of each wastewater supplier if relevant to the wastewater amount.
2.2 Information regarding process or process equipment:• Specific information of the concerned excipient or API, including degree of
biodegradability from dedicated production facilities • Description of chemical reaction• Amount ingredient and manufacturing substances• Abstract of process description referring to process flow diagrams
3 Possibility of wastewater savings (wastewater reductions)
3.1 optimize cIP rinsing processes by validating minimum rinsing time and number of rinsing steps needed.
3.2 Reuse of wastewater for cooling processes in non-GmP areas or plant irrigation purposes, etc.
3.3 Possibility of load reductions of wastewater by analyzing the synthesis and manufacturing processes.
Table B. General scope of information which should be included in wastewater map.

5PHARMACEUTICAL ENGINEERING November/December 2012
engineering and designWastewater Treatment
The monitoring requirements shall, where applicable, be based on the conclusions on monitoring as described in the BAT conclusions.5,6,24
The main information of a wastewater map should be incor-porated into a map flow chart.
Wastewater from Pharmaceutical Manufacturing ProcessesThe amount of discharged wastewater from the pharma-ceutical manufacturing investigated at 10 different affiliates worldwide is relatively small (roughly 20 to 100 m3/day) in comparison to the wastewater discharged from the manu-facturing processes for Active Pharmaceutical Ingredients (APIs) or chemicals. For solid pharmaceuticals (e.g., tablet production), the source of wastewater is discharged from rinsing and cleaning processes only; this wastewater amount is relatively small in comparison to liquid pharmaceuticals, e.g., from x-ray CM production where residuals are solvent and from rinsing and cleaning processes will be discharged. Two APIs in wastewater from the final pharmaceutical manufacturing process will be discussed in detail:
1. Treatment of wastewater from the manufacturing process of contraceptives containing the synthetic hormone EE2
2. Treatment of wastewater from the X-ray Contrast Media (CM) manufacturing process containing iodine
Properties of Active Pharmaceutical Ingredients (APIs) in Wastewater17α-Ethinylestradiol
Endocrine Disrupting Substances (EDS) are for, e.g., natural or synthetic steroid hormones:
• Natural estrogens E2 used as menopause preparation• Synthetic estrogens EE2, an API in oral contraceptives• Other endocrine disrupting substances are Bisphenol
A and F used in the manufacture of polycarbonate and epoxy resins
EDS can disrupt the normal growth, development, and repro-duction processes in aquatic systems, humans, and wildlife. The synthetic estrogen EE2 is probably the most effec-tive estrogen-active substance to fish and leads already from 0.32 ng/l concentrations of impaired fertility and sexual relations shifted in thick-head minnows.17 The estrogenic activity of sewage is the reason for the reduced fertility example of fish,12,18 despite the already effective reduction of about 80 to 90% by conventional purification according to the activated sludge process.19
X-Ray CMIodine containing x-ray CM is used with CT for radiography that permits visualization details of the internal structure or organs, etc.
• Iodized CM is a non-dissociable derivative of tri-iodine benzoic acid and carries three iodine atoms per molecule.
• Strong C-I bound ensures that the CM will not be me-tabolized in your body.
To prevent their metabolization in the patient’s body, these preparations are hard to biodegrade and their adsorption behavior is rather poor. So far, the tests have shown that 90% of the organic iodine compounds discharged with the wastewater leave the sewage treatment plant unchanged, and these compounds can be detected in local water bodies and in the ground water.18
Samples of Possible Processes for Reduction of API in Pharmaceutical WastewaterSamples of possible treatment processes for endocrine dis-rupting substances, e.g., EE2 in very low concentration and on Iodized CM can be seen in Table E. Previous research of the aerobic and anaerobic degrada-tion shows that the synthetic estrogen EE2 shows neither an aerobic nor an anaerobic degradation within relevant days
Properties of X-ray Contrast Media (CM)
• Hardtobiodegrade(lowpotentialforbioaccumulation)20
• Stablecomplex• Adsorptionbehaviorisratherpoor• Stablechemicalbond(2,4,6-Triiodbenzol)• Highwatersolubility• Lowdistributioncoefficientbetweenoctanol/water(logKow)• Target:reduceAOX*<1mg/l(<1ppm)23 *AOX=adsorbableorganicallyboundhalogens,X=Cl,Br,I
Table D. Physical and chemical characteristics of X-ray contrast media.
Properties of Ethinylestradiol EE2:
• Theoralcontraceptivecontainsaslowas20µgEE2perhormone pill only
• NoObservableEffectConcentrationinaquaticsystems(NoEc) = 1 ng/l (1 ppb)21-22
• Molecularweight=296.403,C20H24o2
• Biodegradableunderoptimizedcultureaerobicconditions,22 i.e.,bio-degradabilitydifficult(ratioBOD/COD<0.15)
• Lowsolubilityindistilledwater:approximately4.8mg/lat27°c22
• Highdistributioncoefficientbetweenoctanol/water(logKow=4.2 at pH 7)22
• Half-valuetime:46days(comparison:3to27daysforthenature “Estradiol” ) at 20°c22
Table C. Physical, chemical, and biological characteristics of EE2.

6 November/December 2012 PHARMACEUTICAL ENGINEERING
engineering and designWastewater Treatment
Figure 2. Already employed processes.
below the No Observable Effect Concentration (NOEC) in line with the Responsible Care Management System (RCMS) initiative.
2. 100% biological treatment of pharmaceutical wastewa-ter from OC production facilities together with sanitary wastewater to fulfill local discharge values and to reduce EE2 in this central production WWT concept in line with the RCMS.
3. Concentration of iodine solutions from CIP cleaning solutions of CM production to reduce disposal costs and for discharge of iodine-containing effluents below the set limit of 1 ppm AOX.
ExamplesUV – H2O2 Oxidation ProcessToday’s biological wastewater treatment plants are designed so that they are able to eliminate carbon, nitrogen, and phosphorus from the wastewater.
in municipal sewage treatment systems (activated sludge process).19
Essential elimination of natural and synthetic estrogens within sewage treatment plants is caused by sorption. A bio-logical transformation/degradation is verified for the nature E2 to Estron, whereas the synthetic EE2 will be biodegraded very slowly and aerobe only. In sewage treatment plants, EE2 will be discharged to almost equal parts into the water after passing through the WWTP and into the sludge by sorption processes. The elimination rate in trickling filters is less effective than in activated sludge processes; membrane bio-film reac-tors have the highest elimination rate for estrogens.19
For iodine based x-ray CM, only a small or varying per-centage (~ 8%) can be eliminated with the help of biological treatment. Ozonization led to an average “elimination” (in this case, degradation/transformation) of about 60% de-pending on the type of x-ray CM. Since ozonization contin-ues to transform, the impact on its by-products and proper-ties must be studied. With active carbon filtration, an average elimination rate of about 75% to 82%, depending on the type of x-ray CM, can be achieved. As iodine based x-ray CM are highly polar, only fresh activated carbon achieve a reduction, which is not cost-effective.18
Established Processes Dedicated for Treatment of Pharmaceutical WastewaterThe following are processes that are currently used to treat pharmaceutical wastewater with their own goals and objec-tives identified:
1. Decomposition of EE2; wastewater from CIP cleaning solutions from fluid bed granulators, cleaning of filters from fluid bed granulators, tablet press machine, coating machine, HEPA filters, etc. The target is to reduce EE2
Possible Treatment Processes
• Non-biodegradablecompounds - chemical/physical processes, e.g., > Uv-activated H2o2 oxidation process > combustion > Adsorption on activated carbon > ozonation > membrane filtration process• Biodegradablecompounds - biological processes, e.g., > Activated sludge process > bio-film processes -- on solid surfaces (e.g., Rotating biological
contactors = Rbc) -- on membrane surfaces (e.g., mbfR=membrane bio-
film Reactor)
Table E. Samples of possible treatment processes for endocrine disrupting substances.

7PHARMACEUTICAL ENGINEERING November/December 2012
engineering and designWastewater Treatment
Numerous pollutants cannot be effectively decomposed by traditional oxidants (e.g., ozone, hydrogen peroxide, chlorine, etc.). UV-activated oxidation facilitates this decomposition. Radiating contaminated water with UV-light after addition of hydrogen per-oxide creates high oxidation potentials, which lead to an efficient decomposition of pollutants. EE2 or iodine containing CM is bro-ken down into base elements leaving no residuals to be discarded.
Why Was This Wastewater Project Initiated?background• The Predicted Environmental Concen-
tration (PEC) at effluent from munici-pal WWTP for EE2 is 0.1 ng/l (0.1 ppb) due to domestic sewage only and by a factor of 10 below the (NOEC) received by chronic studies (1 ng/l).13,19,20
• Technical measurements are requested to reduce the in feed of rinsing water from the hormone production into the municipal sewage system.2
Sources of Wastewater from the Production of Oral ContraceptiveEE2 will be emitted into the wastewater by using water for rinsing for the production equipment cleaning process - Figure 3. The wastewater from the contraceptive production (ca. 35 m3/d at 50-60°C) with an average EE2 concentration of 16 µg/L will be collected in a separator for solid matters. In this separator, settleable particles will be discharged into two Polyethylene-containers below the separator and regularly discarded. The wastewater will be cooled down to 30°C. Not settled particle > 2.5 mm will be filtered by a sieve before the waste-water enters the UV reactor as the quality of the UV emitter will be reduced by particles and fouling at the UV emitter surfaces. Oxidizing agent H2O2 35%ig, 0.8 l/m3 (= 2 l H2O2/h) will be fed to the wastewater by a dosing pump. The capacity of the UV reactors is 2500 l/h. Wastewater from production is stored in two storage tanks, each 10 m3, made of polypropylene. The wastewater will be fed to the cylindrical UV reactor with tangential water injection.
Result of the UV – H2O2 Oxidation ProcessUV resources have a relatively high energy density (50 to 200 watt/cm). With the oxidation agent hydrogen peroxide,
Figure 3. Process flow of the UV-H2O2 oxidation process.
high activated hydroxyl radicals will be developed, which have the highest oxidation potential. The oxidation agent H2O2 alone is not sufficient to de-stroy the Ethinylestradiol complex. The UV reactor is made of stainless steel with a cooling jacket. The outlet temperature after the second UV reactor increased to a maximum 41°C. The maximum wastewater temperature is limited to 30°C at the final effluent discharge point. An additional cooler had been installed to reach the maximum allowed discharge temperature into the municipal sewage system. The UV emitter, type mercury (Hg) medium pressure 20 KW is installed in the cylindrical UV chamber. The radiation of the UV lamp is in the UV-C range (200 to 280 nm). With an energy in-feed of 21 KWh/m3 wastewater, EE2 concen-tration is below detection limit. The energy demand is 735 KWh/d, i.e., 30.6 KW is needed. Due to the varying initial concentration of EE2 two 20 KW UV reactors were installed in series to ensure that the EE2 concentration is below the detection limit. The depth of penetration of UV radiation into water is relatively low. The intensity will be reduced by absorption of dissolved substances and turbid water as well as by reflec-tion of water substances. Fouling problems have been encountered in the tubular reactors:
A milky film (covering) will be burned into the surface of the quartz tube (glass) and have to be cleaned with citric acid twice per week to avoid degrease of energy trans-ferred into the wastewater by the UV lamp. The condition of the quartz tube is checked by a UV-sensor measuring system.

8 November/December 2012 PHARMACEUTICAL ENGINEERING
engineering and designWastewater Treatment
Figure 5. Biological film process realized in RBCs.
Rotating Biological Contactors (RBC)2,22
ObjectiveThe existing wastewater plant (activated sludge process) in a pharmaceutical manufacturing facility in Jakarta (Indone-sia) did not work properly because of the following:
• Increased wastewater flow rate• Insufficient pre-settling and final sedimentation tank
(i.e., insufficient retention time to establish special organ-isms for selective removal of organic matters) resulting in the inability to establish a flocculent sludge with sufficient sedimentation ability)
• Not optimized sludge reflux from final settling tank
Therefore, the existing wastewater plant has to be replaced by a new wastewater plant using Rotating Biological Contac-tors (RBC) as the biological treatment process. The objec-tives for this full-biological WWTP are:
• Fulfil the companies own responsibility (responsible care) for environmental protection
• Realization of a standardized wastewater treatment pro-cess, which can be used as a model for all our production sites for finished pharmaceuticals
• Fulfil local requirements• Possible reduction of Ethinylestradiol
(EE2) and other APIs
To fulfil the above mentioned objec-tives, this WWTP has to be designed and installed with the following limited conditions:
a. Flexible extension without changes of the basic process when the waste-water amount will rise up or the limit values of the wastewater discharge are exceeded
b. Selective effect for disposal of compounds of pharmaceu-tical wastewater
c. Simple operation and insignificant energy consumption and maintenance demand
These objectives will be met by a biological WWTP using Rotating Biological Contactors (RBC) as the biological treat-ment system. The main advantages of RBCs are that they are energy effiecient and require little maintenance, due to few wear parts. Also, they are simple in operation and make a robust and cost-effective wastewater treatment option. The chosen biological oxidation process is able to build up a biological environment containing special organisms that have a targeted effect for organic matters which are not easy for biodegradation. The goal is to treat all wastewater from different sources (production, sanitary, etc.) together in a central wastewa-ter plant. This will lead to a good equalization regarding production wastewater and sanitary wastewater contain-ing nutrients like ammonia, phosphorus, sulphur, and iron needed for the biological process.
Principal Function of the RBCDiscs made of plypropylene (PP) are mounted on a horizon-tal shaft which rotates at a low speed (1.0 up to 2.5 rpm) par-tially immersed in the wastewater and leads to an alternate exposure of the contact surface of the discs to the wastewater and atmospheric oxygen leading to the growth of bacterial film on their surface. The principle function in activated sludge plants is that a mass of activated sludge is kept moving in water by stirring or aeration. In contrast to the RBC process, the retention time for activated sludge depends on hydraulic matters, i.e., there is not enough time for growing specific micro-organ-isms for removal of specific organic matters.
Process FlowFrom the equalization wastewater tank, the wastewater flows by two alternate operated progressive cavity pumps
Figure 4. Two UV oxidation reactors operating in parallel.

9PHARMACEUTICAL ENGINEERING November/December 2012
engineering and designWastewater Treatment
installed outside the equalization tank to the RBC units, which are installed in series. The average flow (adjustable by frequency converter) to the RBC units is 4.5 m3/h. The wastewater flows through the RBC plant by gravity to the following final sedimentation tank. The surplus sludge (already miner-alized biological sludge from the RBC units) will be separated in the final settling tank and delivered by a surplus sludge pump in intervals (approximately once in 2 hours) to the sludge building tank (sludge storage). The turbid water (supernatant-liquor), which results from the sludge thicken-ing, is delivered back to the equalization wastewater tank by a sludge liquor pump
Figure 6. Construction of the RBC units.
or by gravitation depending on arrangement of the sludge building tank on site. Clear water will be discharged by grav-ity into the public sewage system by a submerged discharge system (integrated into the clarification tank). The RBC is built up in cascade; these support a faster biological degradation, especially at the beginning. In the first cascade, easily degradable components, like C- bonds, will be removed. In the second and third cascade, a special biocenosis can arise, which have a more selective effect also for components, which are difficult in their biodegradation. Each cascade can build up a different biocenosis depending on the nutrient supply. Components, which are not easy for biodegradation, can be better eliminated in fixed biofilms than in an activated sludge process, where active flocks are created in a large volume of water. The cascades also have a higher operation stability when sudden changes of the wastewater flow or concentration occurs.
Result of the RBC Treatment ProcessRBCs have the lowest energy demand of all biofilm process-es; the energy demand is less than 1/3 of the activated sludge process only. No sludge reflux, no additional air intake, etc., is needed for this RBC process; the rate of substrate removal in the outer layer of the biofilm reaches much higher values than in activated sludge flocks. The enzymatic activity increases due to significant rates of substrate inflow and product outflow from the biofilm. EE2 could be removed by one decimal power from 0.02 µm to 0.002 µm in average; it is not clear if the EE2 has been adsorbed at the sludge or it was biodegraded.
Membrane Filtration ProcessA manufacturing site in Berlin produces final pharmaceuti-
Parameter Influent Effluent
Designedmin.-Ø-max.
In operationmin.-Ø-max.
Required In OperationMin.-Ø-Max.
Wastewater flow
m3/d max. 180 14 - 33 - 69
coD 850 33 - 211 - 216
<100 4 - 32 - 83
KMnO4-
consumptionmg/l 13 - 55 - 175 3 - 19 - 50
Sold matters (ss)
mg/l 212 31 - 69 - 191 <60 3 - 22 - 57
pH value 7 7.4 - 7.9 - 8.2
6 - 10 7.3 - 7.9 - 8.2
EE2* µg/l 0.011 - 0.022 - 0.043
n.d. - 0.00435 - 0.0052
Table F. Influent and effluent parameters of the RBC plant.

10 November/December 2012 PHARMACEUTICAL ENGINEERING
engineering and designWastewater Treatment
Figure 8. Process flow principle and design data of the membrane filtration process.
cals, including a different type of x-ray CM. During the CIP/SIP cleaning processes of different production lines, rinsing water containing iodine has to be discarded. In the past, 100% of the rinsing water was incinerated in the API plant Begkamen. During a process optimization project,23 a membrane process has been developed to concentrate iodine containing rinsing water to reduce the incineration costs as the energy consumption for evaporation of water is very cost intensive.
Objectives of the Membrane Filtration Process• Concentration of iodine (retentate) from 0.3% to 6% to
reduce hazard wastewater amount considerably• Reduce costs for transportation and incineration of haz-
ard wastewater• Reduce drawbacks of incinerating the wastewater: - high energy demand - > 95% of the energy is used to evaporate water• Discharge permeate into the official sewage system; set
limit AOX < 1 mg/l (AOI < 3.6 mg/l).
Figure 7. Comparison maintenance and control works.
Result of the Membrane Filtration Process• Iodine load in wastewater reduced by
> 99% (AOI < 3.6 ppm, AOX < 1 ppm) - permeate can be discharged to a
municipal WWTP• Operation costs (without deprecia-
tion): 3.80 €/m3 CIP rinsing water (6,000 m³ CIP rinsing water/a)
• Incineration is only needed for the concentrate (5-10% of the initial vol-ume)
- saving energy and treatment costs
Investment and Operation CostsThe investment costs depend on the existing infrastructure of the specific affiliate and cannot be compared directly.
ConclusionThe UV oxidation process can be used for small amounts of dedicated pharmaceutical wastewater only when it is not mixed with any other wastewater stream. The Ethinylestra-diol complex can be reduced below limit of detection; unfor-tunately, it is unknown if this UV oxidation process creates any oxidation by-products (transformation by-products), which still have to be studied. Investment costs for the membrane process are in the range of the UV oxidation process; due to the high pressure demand for the membrane process, there is only a minor en-ergy saving in comparison with the UV oxidation process. To keep the operation cost low, this process is suitable for small amounts of dedicated pharmaceutical wastewater streams only. The RBC process has the lowest operation costs for treatment of pharmaceutical wastewater as it has the lowest maintenance demand and lowest energy consumption of all three processes. The wastewater compounds must be biodegradable; in this case, it would be appropriate to mix it with the sanitary wastewater or wastewater from other
production facilities under the condition that it promotes the biodegradation of wastewater components. This is the most flexible process concerning wastewater compounds (as long they are biodegrad-able), shock load, and flow rate. The chosen biological oxidation process is able to build up a biological environment containing special organisms, which have a more selective effect on organic matters which are not easy for biodegradation. It is the company’s responsibility to ensure that their manufacturing opera-tion produces GMP compliant phar-

11PHARMACEUTICAL ENGINEERING November/December 2012
engineering and designWastewater Treatment
maceuticals; it is also a company’s responsibility to ensure environmental protection during the process. Municipal wastewater treatment facilities cannot reduce pharmaceuti-cal micropollutants sufficiently; only dedicated wastewater pre-treatment processes (at point of source) can support this target to reduce these micropollutants below the level of NOEC. Despite advances in water treatment, a precautionary ap-proach toward water and chemical management – one that reduces introduction of problematic chemicals into the en-vironment in the first place – should be given a high priority for reducing risks to human health and ecosystem integrity.
AbbreviationsAOX Adsorbable organically bound halogens, X = Cl, Br, IAPI Active Pharmaceutical IngredientBAT Best Available TechnologyCIP Cleaning In PlaceCM Contrast MediaCT Computer TomographyEDS Endocrine Disrupting SubstancesE2 17β-EstradiolEE2 17α-EthinylestradiolEEA European Environmental AgencyEPA Environmental Protection AgencyERA Environmental Risk Assessment
GEDRI Global Endocrine Disruptor Research InventoryGMP Good Manufacturing PracticeNOEC No Observed Effect ConcentrationNOEL No Observed Effect LevelOC Oral ContraceptivePEC Predicted Environmental ConcentrationPLC Process Logic ControllerPP PlypropyleneRBC Rotating Biological ContactorRCMS Responsible Care Management SystemWWTP Wastewater Treatment Plant
References1. 50388 Federal Register/Vol. 63, No. 182/Monday, Sep-
tember 21, 1998/Rules and Regulations Part III Envi-ronmental Protection Agency 40 CFR Part 439, Pharma-ceutical Manufacturing Category Effluent Limitations Guidelines, Pretreatment Standards, and New Source Performance Standards, Final Rule.
2. “Community Strategy for Endocrine Disruptors,” A Range of Substances Suspected of Interfering with the Hormone Systems of Humans and Wildlife, Brussels, 17.12.1999 COM (1999) 706 final.
3. Wu, M., Atchley, D., Greer, L., Janssen, S., and Rosen-berg, D., “Dosed Without Prescription: Preventing Pharmaceutical Contamination of Our Nation’s Drinking
Table G. Comparison of investment and operation costs for removal for API.
Subsidiary Wastewater Treatment Process/ Parameters Investment1 (T€)
Operation Costs1
(T€/a)Operation Costs1
(€/m3)
Germany/Weimar
Uv-activated H2o2 oxidation process, removal EE2. Flow rate 35 m3/d (total wastewater from production).
300 25 3
Germany/berlin
Uv-activated H2o2 oxidation process, removal EE2. Flow rate 4 m3/batch (from hormonal production only).
200 9 ./.
France Uv-activated H2o2 oxidation process, removal EE2. Flow rate 12 m3/d (from hormonal production only).
approx. 258 14 5
Pakistan/lahore
Wastewater Treatment consists of a biological oxidation process realized by Rotating biological contactors (Rbc) process. Flow rate 40 m3/d (total wastewater from ointment production and sanitary wastewater).
100 1 0.03
Indonesia/Jakarta
Rotating biological contactors (Rbc) process; possibility for degradation of EE2. Flow rate 105 m3/d (total wastewater, including sanitary wastewater).*Includingrevampingoftheexistingsewagewatersystemincludingsump pits and connection to the new wastewater plant.
417* 2 0.06
Italy Rotating biological contactors (Rbc) process; API reduction from ointment/creams and cytostatic production. Flow rate 185 m3/d (total wastewater, including sanitary wastewater)
approx. 200 4 0.08
Germany/berlin
Nano-membrane filtration process; water from X-ray contrast media only: 20m3/d, 6000 m3/a
800 20 3.80
Note 1. Without depreciation; cost accuracy: ± 30%

12 November/December 2012 PHARMACEUTICAL ENGINEERING
engineering and designWastewater Treatment
Institute.16. International Commission for the Protection of the
Rhine (ICPR), “Evaluation Report Radio-Contrast Agents, Report no. 187, ISBN 935324-53-7, © IKSR-CIPR-ICBR 2010.
17. Parrott, J.L., Blunt, B.R., “Life-cycle Exposure of Fat-head Minnows to an Ethinylestradiol Concentration Below 1 ng/l Reduces Egg Fertilization Success and De-Masculinizes Males, Environmental Toxicology, 2005, Vol. 20, ISS 2, pp. 131-42.
18. Laenge, R., Hutchinson, T.H., Croudace, C.P., Siegmund, F., Schweinfurth, H., Panter, GH, and Sumpter, J.P., “Ef-fect of the Synthetic Estrogen 17 Alpha-Ethinylestradiol on the Lifecycle of the Fathead Minnow, Environ Toxicol Chem, 2001 Jun; 20 (6): 1216-27.
19. Sabine Kunst, et al, Arbeitsbericht der Arbeitsgruppe ATV-DVWK-AG IG-5.4 Endokrin wirksame Substanzen in Kläranlagen, 2002, ISBN 978-3-936514-18-6.
20. Schweinfurth et al.: Umweltverhalten und aquatische Toxizitaet von Ethinylestradiol; Muenchner Beitraege zur Abwasser-, Fischerei- und Flussbiologie, 1997 (50).
21. Chan, R., Stenstrom, M., A.M.,” Low Maintenance Wastewater Treatment,” Journal of the Environmental Engineering Division, December 1979, page 1172.
22. Ute-Aaustermann-Haun, Martz, M.,et al: Arbeitsbericht der Arbeitsgruppe ATV-DVWK-AG IG-5.6 “Biofilmver-fahren” Aerobe Biofilmverfahren in Industrial Abwas-serreiningung, Beispielanlagen; May 2007.
23. Drews et al., “Nanofiltration of CIP Waters From Iodine X-ray Contrast Media Production: Process Design and Modeling,” Desalination 259 (2003) 119-129.
About the AuthorManfred Martz has more than 30 years of experience in the chemical/pharma-ceutical industry. He spent 22 years in project management for capital investment projects for pharmaceutical manufactur-ing facilities. His various experiences cover
sterile (aseptic processing) for cytotoxic and high potent API and final formulation projects including development proj-ects for cytotoxic parenterals and ointments. Martz currently holds the position of Senior Expert Healthcare Process for Bayer Technology and Engineering (Shanghai) Co., Ltd. He holds an MSc from the Technical University Berlin in chemi-cal engineering and a Dipl.- Ing. From the University of Applied Science Frankfurt am Main in process engineering. He is a member of ISPE and DWA, a German Association specializing in water and wastewater, and is currently part of the biofilm processes Working Group. He can be contacted by email: [email protected]. Bayer Technology Services GmbH, Gatower Str. 78, D-13595 Berlin, Germany.
Water,” NRDC White paper, December 2009.4. Carlsson, C., Johansson, A.K., Alvan, G., Bergman, K.,
and Kuehler, T., “Are Pharmaceuticals Potent Environ-mental Pollutants? Part I: Environmental Risk Assess-ments of Selected Active Pharmaceutical Ingredients,” Science of the Total Environment, 364 (2006) 67– 87.
5. Directive 2010/75/EU of the European Parliament and of the Council of 24 November 2010 on Industrial Emissions (Integrated Pollution Prevention and Control) (Recast).
6. European Commission: Integrated Pollution Preven-tion and Control Reference Document on Best Available Techniques in Common Wastewater and Waste Gas Treatment/Management Systems in the Chemical Sec-tor, February 2003.
7. Watkins, D. and Weiss, K., “New Air and Wastewater Compliance Challenges for the Pharmaceutical Indus-try,” Pharmaceutical Engineering, November/Decem-ber 1999, Vol. 19, No. 6.
8. Directive 2000/60/EC of the European Parliament and of the Council of 23 October 2000, Establishing a Frame-work for Community Action in the Field of Water Policy Official Journal L 327, 22/12/2000, P. 0001-0073.
9. Directive 2001/83/EC of the European Parliament and of the Council of 6 November 2001 on the Community Code Relating to Medicinal Products for Human Use. Official Journal L – 311, 28/11/2004, p. 67-128.
10. EMEA Committee for Medicinal Products for Hu-man Use (CHMP): Guideline on the Environmental Risk Assessment of Medicinal Products for Human Use, London, 01 June 2006, Doc. Ref. EMEA/CHMP/SWP/4447/00.
11. Guidance for Industry Environmental Assessment of Human Drug and Biologics Applications; U.S. Depart-ment of Health and Human Services, FDA (CDER, CBER), July 1998 CMC 6 Revision 1.
12. Snyder, S., “Endocrine Disruptors as Water Contami-nants: Toxicological Implications for Humans and Wild-life,” Southwest Hydrology, November/December 2003.
13. Nagpal, N., and Meays, C., Water Quality Guide-lines for Pharmaceutically-Active-Compounds: 17α-Ethinylestradiol (EE2), Technical Appendix, September 2009, Ministry of Environment Province of British Columbia.
14. “EudraLex: The Rules Governing Medicinal Products in the European Union, Volume 4 – Good Manufacturing Practice; Medicinal Products for Human and Veterinary Use Part II: Basic Requirements for Active Substances Used as Starting Materials,” Brussels, 03 February 2010, ENTR/F/2/AM/an D(2010) 3374.
15. Teunter, R.H., Inderfurth, K., Minner, S. and Kleber, R., “Reverse Logistics in a Pharmaceutical Company: A Case Study, No EI 2003-30, Econometric Institute Report from Erasmus University Rotterdam, Econometric

1PHARMACEUTICAL ENGINEERING November/December 2012
industry interview
G eorge Wittmann has nearly 30 years of facilities management and project manage-ment experience, most recently as
an Executive Director of Facility Op-erations for Merck. Wittmann leads Jones Lang LaSalle’s overall technical operations within the biopharma and life sciences practice and plays a key role in expanding service offerings and supporting key business develop-ment opportunities. Wittmann holds a BS in civil engineering from Rutgers University, an MS in engineering from the New Jersey Institute of Technol-ogy, and an MBA from Fairleigh Dickinson University. He is a licensed professional engineer and profession-al planner in the State of New Jersey, and holds an N-2 Industrial Wastewa-ter License for New Jersey.
Please explain what it is that Jones Lang LaSalle (JLL) provides to your Life Science clients. JLL provides a comprehensive facilities management solution to our clients. Through partnering with our clients, we are able to understand
their needs and provide the right set of integrated facilities management solutions that include:
• Consulting• CorporateResearch• EnergyandSustainability• FacilityManagement,including
PlannedMaintenance,CalibrationcGMP and non GMP instruments, Housekeeping, Move Adds and Changes,PredictiveMaintenanceServices, Operation and Mainte-nance of Utility Plants, Waste Wa-ter Treatment Facilities, Environ-mental Health and Safety Support, Waste (hazardous and nonhazard-ous waste) Management, Planning and Scheduling, MRO Stockroom Management, Management of contracted services, such as Pest Control,ElevatorMaintenance,Snow Removal and Landscaping, CafeteriaServices,ManagementofCMMS,Training,EngineeringDrawings and Records Manage-ment, Workplace Services, and Portfolio Management
• LeaseAdministration• ProjectandDevelopmentServices• TenantRepresentation• TransactionManagement
Having led the same types of service teams while on the “owners” side at Schering-Plough and Merck, what do you see are the differences between the in-house and outsourced solutions? The major difference between in-house and outsourced services teams is that the outsourced provider has to be by design, leaner and more focused on the delivery of services at an economical price point. The outsourced provider has to have top talent on their staff in order to be suc-cessful because there is little room for bureaucracy or for carrying employees who are not able to effectively perform the core service delivery.
PHarMaceuticaL engineering interviews
George Wittmann, Senior Vice President, Technical Operations, Jones Lang LaSalle
Reprinted fromPHARMACEUTICAL ENGINEERINGThe Official Technical Magazine Of iSPe
NOVembeR/DecembeR 2012, VOL 32, NO 6
©copyright ISPe 2012
www.PharmaceuticalEngineering.org

2 November/December 2012 PHARMACEUTICAL ENGINEERING
industry interview
“Yes, I do think that this trend [outsourcing Integrated Facility Management (IFM) and Project Management (PM)] is here to stay and the reason is simple, firms want to do what they do best and stick to their core competencies. Integrated facility management and project management allow a firm to concentrate their efforts on their core business and leave the management of facilities and projects to others who make it their core competency.
What’s your current role and responsibilities at JLL and what do you see yourself doing a year from now as your teams become more successful? I am currently Senior Vice President of Technical Operations for Jones Lang LaSalle in the Life Sciences vertical. My role is to work with all of the JLL Life Science clients from a technical standpoint to ensure that JLL delivers a consistent product that meets their expectations as well as meeting regulatory requirements in the areas of Environmental Health and Safety, Quality Assurance, GMP Services, Innovation, and Engineering Services.
What enticed you to make the move from the owner’s team to the service provider team? I was very happy working for an owner and spent almost 30 years working for Schering Plough and Merck, but was ready for a change. Facility Management and Engineer-ing is not the core business of a PharmaceuticalfirmlikeitiswithJones Lang LaSalle. When I con-sidered the offer to join JLL it came down to the question of “where can I enjoy the most personal satisfaction and growth?” Jones Lang LaSalle provides that opportunity to me as theyhavegrownsignificantlyinthemarketplace and they felt that I could make a positive contribution to that growth. It is a very exciting time for our industry and we have a very dynamic staff that is poised to grow as the Integrated Facility Management (IFM) model proliferates throughout the Life Sciences industry.
Would you please explain in broad terms, the Key Performance indicators (KPis) against which you and your teams are judged so that our members can better understand? The KPIs that we are judged against are the same ones that you
would hold your internal staff to and include:financialtargets,ProjectManagement (PM) completion rate, work order backlog, service requests completion rates, moves, adds and changes completed per month, energy savings in Million Metric British Thermal Units (MMBTUs) per year, equipment failures, Environmental Health and Safety (EHS) rates, such
as Total Recordable Incident Rate (TRIR)andLostWorkdayCaseRate(LWDCR)foremployeesandcontrac-tors, environmental incidents per month and annual cost savings targets to name just some of them.
Do you think outsourcing integrated Facility Management (iFM) and Project Management (PM) is a trend to stay, and if so, why? Yes, I do think that this trend is here to stay and the reason is simple, firmswanttodowhattheydobestand stick to their core competencies. Integrated facility management and projectmanagementallowafirmtoconcentrate their efforts on their core business and leave the management of facilities and projects to others who make it their core competency.
Jones Lange LaSalle has tools and systems that allow us to provide the client with reports and information that they would have to spend time and money developing that we have already developed which allows us to share these platforms at a much lower price point. Due to our presence in the marketplace, we can leverage our resources across a wider base and
provide partial or variable resources as appropriate to meet the needs of our clients.
initial iFM and PM outsourcing had centered on commercial and non-r&D or non-manufacturing facilities/services; it is now being expanded to include r&D facilities; do you see this continuing and will it ever include manufacturing? IFM and PM outsourcing will con-tinue to grow and in some cases is al-ready provided to a few of our clients in manufacturing spaces. The cost pressures faced by the pharmaceuti-calandlifesciencesfirmsissuchthatintegrated facilities management pro-vides a way for them to concentrate on their core business while reduc-ingcostswithoutsacrificingquality.

3PHARMACEUTICAL ENGINEERING November/December 2012
industry interview
Delivery of services to manufacturing and research clients is an natural ex-tension of the IFM model, and allows firmslikeJLLtotakeadvantageofthenatural synergies on mixed use sites by sharing resources and employees across an entire campus instead of limiting them to commercial or R&D spaces. As IFM continues to grow in the space, it is important that the right tools and expertise is brought to the client. Part of my role is to ensure that the infrastructure, such as a quality manual, SOPs, quality management system and playbooks are able to work in a cGMP environment and that the employees have the proper expertise and training to be successful.
How can the iSPe consultant, contractor, and vendor community work more closely with you and your teams to create win-win-win solutions for you, them and your owners? I think there is a lot of opportunity for the ISPE consultants, contrac-tors, and vendors to work with JLL in this space and provide value added solutions to our clients. Our model is to deliver services to our custom-ers that is compliant and at a lower cost than they can self-perform the service themselves. JLL partners with a number of vendors and consultants and does not want to self-perform services that can be purchased from the vendor community in a more ef-ficientandeffectivefashion.Specialtyservices, such as maintenance of WFI stills,ROunits,HEPAfiltercertifica-tions, specialty calibrations, con-struction and repairs to facilities and engineering, and architectural design are some examples of services that IseefirmsaddingvaluetotheIFMproposition. In addition, commission-ingandqualificationofequipmentand SOP creation are other examples of services that JLL would collaborate with outside consultants and vendors.
What can iSPe do in the future to enable you to be more successful in your provided solutions? One thing that ISPE might want to consider is establishing a working group within it that deals with IFM in a regulated environment. I would welcome them to work with the IFM providers to establish practice guides that incorporate the do’s and don’ts of integrated facility management in a regulated area. I am thinking of something along the lines of the ISPE Maintenance Guide which touches on this area, but not in great detail. In my opinion, the proliferation of IFM warrants that a practice guide team be established to help ensure that ISPE has a seat at the table and helps to establish the criteria on what needs to be done for the client and the IFM provider.
as a “seasoned veteran” of the industry, what advice do you offer to other owners who are either contemplating outsourcing, just embarking on it, or are fully immersed in it already? My advice to the owner’s that are starting down this path is to take a hard look at what services are truly part of the core business before contacting an IFM provider. What can happen is that too little scope is considered for outsourcing limiting the ability of the IFM provider to have the critical mass on site to deliver the servicesinanefficientmanner.Thesecond point is to look at the current operations with a critical eye for what are the current service levels, metrics, andstaffingthatisbeingprovided.What sometimes happens is that the client cuts staff prior to the transition to the IFM provider and the IFM pro-vider is left with an organization that isinsufficientinsizetoperformthework. I would also highly recommend that the owner transfer their top talent to the IFM provider to make the tran-sition as smooth as possible. There is a tendency on the part of the owners
to hold back some or all of their key employees during a transition. This ends up impacting the client in the long run as new staff from outside the client has to be hired and trained on the client’s procedures, means and methodswhichisinefficientandtimeconsuming. My advice to the owner’s that have just embarked on this journey is to be realistic about the process, and understand that it takes some time to establish all the systems and hire a staff to perform the work. The client needs to understand that there will be some friction between employees that transitioned to the IFM provider andtheretainedstaffandfindawayto work through this. If the KPIs are notidentifiedintheRFPinsufficientdetail, the client needs to partner with the IFM provider to establish them in a way that takes into account the scope of work and transitioned work toreflectwhatthenewdeliverymodelis. For owners that have yet to con-sider IFM, I would suggest that they should take a serious look at doing soastheyareplacingtheirfirmsatacompetitive disadvantage. As the IFM model matures the facilities manage-ment and engineering expertise will start to move from the owner’s to the IFM provider. As IFM gains critical mass, the buying power of the provid-ers will outpace that of the owner for IFM services. In addition, the pace and development of innovative solu-tions and best practices will shift from the owner to the provider. I foresee, in the not too distant future, that the IFM provider will be consulted on a host of topics that in the past would have naturally been with the owner’s personnel.
What advice do you have for students and young professionals? My advice to students and young professionals is to be patient and learn the business from the ground up. A

4 November/December 2012 PHARMACEUTICAL ENGINEERING
industry interview
good way to begin a career in facility management is to look foraninternshiporCooppositionwithanIFMprovider.Thiswill help the student or young professional understand what a career in facilities management entails. It is also important for young professionals to take assignments outside of their comfort zone to help round out their knowledge base and ex-perience. The other factor that I see with some younger pro-fessionals is that they sometimes have unreasonable expec-tations on how fast they are promoted to the next level. My advice is for them to do their very best on every assignment to demonstrate their ability. If they do so, they will be rewarded withpromotionsandraisestoreflecttheirhardwork.Finally,this is a people business and communication and customer service is key. Young professionals need to understand that public speaking, developing interpersonal relationships, and presentation skills are as important as technical skills.

1PHARMACEUTICAL ENGINEERING November/December 2012
quality systemsResource Scheduling
Resource Scheduling in QC Laboratories
by Rafi Maslaton
This article presents the various aspects of scheduling in QC laboratories.
Introduction
T oday’s environment reflects a transition we have been observing for the past de-cade driven by external economic forces, patents expiration, dwindling pipeline of new drug candidates, and increased competition. Price controls are currently enforced throughout Europe, while, in the US, changes in the healthcare sys-tem are expected to reduce profitability
and drive increased demand for lower cost products. Over the next five years, $92 billion worth of name-brand drugs will come off patent. The result: more emphasis on efficient drug manufacturing and R&D and greater recognition of the strategic importance of drug manufacturing. Wall Street expects to see companies better manage their expenses, and 2012 is focused on achieving operational excellence as a means to better compete against peers in light of these trends. The labs are a critical component of any drug manu-facturing and can have a major impact on the overall supply chain service level, e.g., cycle time and on-time delivery. The importance of resource planning in QC labs to meet both capacity and compliance needs has been written about previ-ously.1 This article is focused on the scheduling aspect of QC labs; if we are forced to choose a key focus area for a QC labs performance, it will be lab scheduling. Scheduling by far contributes to all aspects of the lab operation efficiency and makes it the single most important process in the QC labs. Most of the labs today are using MS Excel based tools, whiteboard, and using LIMS to define the assignments, yet these are still primarily manual scheduling techniques or communication methods that are time consuming espe-cially for the supervisors. Lean labs initiatives have helped simplify the lab scheduling process, yet do not offer a robust and computerized scheduling solution. At the end of the day,
lab scheduling heavily relies on the supervisor knowledge and experience to manage the schedule of his/her team. This article focuses on how to automate the scheduling process in the labs and provides guidance on how to better schedule the labs, and what the critical elements and considerations are for a computerized scheduling solution to enhance the overall lab performance.
Background – The Lab EnvironmentThe following is a typical description of lab situations that could be magnified when it comes to generic or contract manufacturing (also in some of the brand labs), where there are more changes during the week (compared to typical brand labs), more products are manufactured, and less vis-ibility or control on the incoming samples. It is not uncommon to see a daily meeting with supply chain and the QC labs discussing priority and changes to the schedule that was updated only a few hours ago. The supply chain provides a list of samples that need to be released and asks the QC labs for committed dates. Then, the labs have to make changes in their schedule and assignments, reduce their campaign size, or avoid campaigning to accommodate the supply chain requests. When you have a backlog and every efficiency gain is crucial to remediate the situation, what has just happened is completely the opposite of what needs to have happened. These requested samples by the supply chain group, which does not always fully understand the implications of scheduling changes on the labs, leads to a smaller campaign size, hence reduced efficiency and changes in what the analysts are doing, leading to another loss of efficiency (waste of set up or some preparations that need to be scrapped); this makes the backlog even more severe than a couple of days ago. With overtime, more support, and allocation of resources within the labs we eventually end up reducing the backlog to a more manageable level.
Reprinted fromPHARMACEUTICAL ENGINEERINGThe Official Technical Magazine Of iSPe
NovembeR/DeCembeR 2012, voL 32, No 6
©Copyright ISPe 2012
www.PharmaceuticalEngineering.org

2 November/December 2012 PHARMACEUTICAL ENGINEERING
quality systemsResource Scheduling
In short, the supply chain group, which does not have the means to schedule the lab or understand the impact of schedule changes on the lab, is making the calls. The labs are under a lot of pressure and are forced to follow up on the demanding requests from the supply chain; the com-pany server is overloaded with emails complaining about the labs and no one is raising the flag saying what we are doing is the opposite of what we should be do-ing. What was described is actually the typical behavior of most companies dur-ing a backlog situation. This is one of the key reasons for companies to move to-ward a computerized scheduling solution compared with the schedule/priority list that changes by the time it is being dis-tributed. Going back to our backlog situa-tion, what both the supply chain and the QC labs should have done is actually increase campaign size knowing this will lead to slight delays in the delivery dates of some samples. However, it will increase the efficiency and allow the lab to catch up. The labs will increase their capac-ity as a result of increased campaign size, reduce the number of daily changes, and gradually will handle the backlog situ-ation. This is not an intuitive strategy, yet it is the only one that could work in this type of situation. Of course there are exceptions and some samples should be prioritized, but the rule of thumb is not to exceed about 10% of the samples to be high priority/rush samples.
“Scheduling by far contributes to all aspects of the lab operation efficiency and makes it the single most important process in the QC labs. Many of these issues could have been resolved with a robust computerized scheduling solution that will take into consideration all the aspects that affect both the labs’ ef-ficiency and the service level. One important note is related to resource planning: the planning aspect of the lab may have been poor and the labs were under staffed as a result to handle the requested volume, which brings us back to the
importance of resource planning as discussed previously.1 Not having sufficient resources to handle the incoming volume will put the labs in a backlog situation; poor schedul-ing will make this situation last longer and hinder the overall service level provided by the QC Labs.
Managing Labs Operation: Strategic and Day to Day OperationBefore diving into the scheduling process, let’s first establish the overall strategic view and the role of planning schedul-ing and key performance indicators. QC resource modeling is one of three major steps in managing lab operations. As can be seen in Figure 1,1 the first step is resource planning, which enables us to determine if we have sufficient number of ana-lysts and equipment resources to meet customer/business de-mand. There may be short term gaps that could be managed via over-time, temporary work force, outside lab services; there may be more long term gaps that may require hiring and/or outsourcing to implement operational excellence im-provements. Once we determine we have sufficient resources, we then move into the second step, the daily scheduling, which is our main topic for this article. This is the day to day lab operation scheduling effort performed primarily manually by the supervisor due to the lack of a computerized solution. In this step, the incoming samples/tests are scheduled to the various analysts based on their qualifications, proficiency, experience level, availability, due date, priority, etc. Unlike the first step of planning, which is the strategic level in managing the lab operations, this is the tactical level and requires a de-tailed and constant effort to schedule and maintain it. The last step is reports, Key Performance Indicators (KPI), dashboard, and overall monitoring of the lab performance. The common
Figure 1. Managing labs operation: strategic level and daily operation.

3PHARMACEUTICAL ENGINEERING November/December 2012
quality systemsResource Scheduling
component of all the steps is the data set required for the lab resource modeling that is the foundation for planning, sched-uling, and reporting.
Scheduling Complexity in the LabWhile manufacturing needs to schedule a batch, we have to realize what a batch represents to the lab. One batch includes samples of raw material API and excipients that require 5 to 20 different tests, samples of In Process (IP) testing, Finish Product (FG) testing, and stability. Each sam-ple, similar to a manufacturing batch, needs to go through several instruments and can only be performed by qualified analysts. However, each batch represents several samples and each sample represents several tests. To illustrate this, here is a simple example. We will use Little’s Law to make the calculation. Little’s Law is named after John D.C. Little, who proved it mathematically in 1961 that “The average number of customers in a system (over some interval) is equal to their average arrival rate, multiplied by their aver-age time in the system.” A corollary has been added: “The average time in the system is equal to the average time in queue plus the average time it takes to receive service.” Little’s Law can be written as:
L L = l • w or w = ____
l
Where: • L = average inventory (tests in the lab); • l = Start rate (batches/FG samples per week); • w = Cycle time (weeks)Also: • L = average # in queue + average # in process
Let’s take the Finish Product (FG) sample and let’s assume there are 10 tests per sample, the lab cycle time is (w) 14 days, and we have (l) 50 batches per week (assuming one batch represents one sample). This means (based on Little’s Law) on average there are (L = l • w) → (50 • 10) • (14 / 7) different tests/tasks that need to be scheduled and man-aged which is equal to 1,000 tasks (some of the tests may require multiple instruments, i.e., dissolution and HPLC which increases that complexity). In comparison, manufac-turing cycle time, as an example, also will be 14 days and we have a solid dose process that includes pharmacy, granula-tion, compression, coating, and packaging (five areas), so the number of batches needed to be managed throughout the process will be (L = l • w) → (50) • (14 / 7) equal to 100 (10% of the volume compared with the lab). Now if we add the raw materials, the in-process and the stability samples and tests we are looking at 10 times the amount of activities that need to be managed and scheduled at the lab. Now let’s focus on the lab, with the exception of stabil-
ity, the lab has limited control over incoming samples, and the campaigning strategy of manufacturing may not always be aligned with the lab requirements, which leads to loss of efficiency. In addition, each analyst has a different training profile; we have 50 HPLCs vs. 5 to 6 compression suites, and the pressure in the lab is much higher because the lab is a downstream operation (closer to the end of the supply chain), and hence delaying the shipments. Next we should look at the breakdown of tests and the complexity associated with scheduling each one to the appropriate center of excel-lence, and to the proficient and available analysts. In short, lab scheduling complexity is significant and presents ad-ditional difficulties compared with manufacturing, especially in terms of the sheer volume of activities.
The Effect of Scheduling on QC LabOptimizing the schedule will help maximize campaigning, while ensuring service level is not negatively affected. This is a key focus area for the supply chain in order to avoid the ser-vice level focus leading to a reduction in the lab campaigning level, which could majorly contribute to a labs inefficiency. Optimizing the schedule will ensure assigning the samples/tests to the best available analysts who are the most efficient in this method. Optimized campaign level leads to efficiency improvement, which affects the overall lab costs and service level. Other key performance indicators that are directly influenced by the scheduling effectiveness are: cycle time and on-time delivery. Optimizing the schedule will ensure the right tests are started at the right time and all tests related to a given sample are completed at approximately the same time. Poor scheduling may lead to starting with the wrong test or missing a test and finding out only later on that this test was not started, at which point it is too late and the cycle time goal is missed. On-time delivery, similar to cycle time, is significantly affected by scheduling. While cycle time focuses on getting the samples completed within the allowable nego-tiated cycle time with the supply chain on average, on-time delivery ensures that the exceptions are being managed as well (e.g., expedite sample although it may meet its regular cycle time, but miss its due date). Finally, with optimized schedule, the overall organization can eliminate waste associ-ated with numerous meetings, emails, and telephone calls to manage the incoming samples. This leads us to the next related aspect of scheduling, which is the automation or the computerizing of the actual scheduling process. Why AutomateThe schedule, as discussed earlier, has a major effect on several key performance indicators in QC labs. The schedule complexity can be greater than the manufacturing or pack-aging. Furthermore, in more dynamic labs, the priority and due dates are frequently changed and this directly affects the lab priority and schedule. Automating the lab schedule

4 November/December 2012 PHARMACEUTICAL ENGINEERING
quality systemsResource Scheduling
makes sense when one considers all of the complexity, flex-ibility, and dynamics of the supply chain in addition to the time required to produce and change a schedule. Automat-ing the schedule could result in freeing up more time for supervisors to manage investigations, conduct FMEA, lead root cause analyses, coach analysts, develop a training road map, analyze key performance indicators, identify areas for improvements, and communicate the lab schedule with the supply chain, etc. In a complex and dynamic lab, the scheduling process may consume two to three hours daily from each supervisor if it is done correctly, e.g., maximizing campaigning in general, identifying campaigning between finished goods and stability, and managing the on-going schedule changes. In order to automate the schedule, we need to assess what attributes are associated with the sched-uling process that supervisors use during the scheduling process. Automating the schedule also will provide improvements in many of the key performance indica-tors as a by-product, as well as providing a more real time labs’ dashboard that we can use to more accurately trace the progress on the samples/tests that are being scheduled and processed. Leverag-ing the scheduling algorithm can provide the supply chain with a cycle time projec-tion for the samples in the labs, including when these are expected to be released.
Scheduling AttributesIn order to computerize the scheduling process in the lab, the various scheduling related attributes that should be consid-ered must be identified. Based on the lab
goals and business environment, these attributes should be configured to meet these goals. For example, considering the qualifications of a resource (analyst) is a requirement, this should be aligned with the learning/training management system. Adding proficiency can enhance the assignments and provide the lab with the ability to determine which analyst will be preferred to receive a certain assignment vs. other analysts. This is currently performed by the supervi-sor based on his/her knowledge of his/her team. In order to computerize some of these preferences, we need to com-municate this information to the scheduling algorithm. Due date and priority helps determine the order in which a given test should be performed. It is important to note that two tests with the same due date may need to be assigned differ-ently since one test may have two days of analyst and instru-ment time vs. perhaps five days for another test. Looking at the due date alone will not provide the proper priority. This leads to the need to project the expected completion time of these tests and compare it to the due date. One of the key as-pects of scheduling is to assign the longest test (critical path) first, including the instruments involved. This is intended to ensure the analysts start on the longest test before starting a short test. When few samples of different products have ar-rived to the lab and if these samples once campaigned have a long test in terms of analyst hands on time and instrument time, the overall schedule adherence will improve by start-ing these long tests first before moving on to others. (This is generalizing yet it provides the most likelihood scenario.) The chart in Figure 3 illustrates the approach of initiating the longest test (critical path) first and while the longest test is being processed in one of the instruments, other tests could start. Other attributes are listed in Figure 2 and in-clude items such as workload balancing between the various lab teams to enable a more rapid execution of the tasks on
Figure 2. Scheduling attributes.
Figure 3. Critical path consideration.

5PHARMACEUTICAL ENGINEERING November/December 2012
quality systemsResource Scheduling
hand. With a computerized scheduling system, we have the information on what tests are being performed and we can use this information to schedule additional tests that require the same set up to the analyst who has already started a similar test. Other attributes include analyst availability and shift hours that will ensure high priority tests should be scheduled to the current shift if sufficient time remains or to the upcoming shift so these high priority tasks can be executed on time.
The Scheduling ProcessIn order to illustrate what an automated schedule would look like, I have used one of the commercially available software solutions. The process starts with receiving samples and tests from Lab Information Management System (LIMS). Simple integration between LIMS and the scheduling system will prevent any redundant data entry. (Not all QC Labs are using LIMS; if no LIMS is used, samples could be entered directly to the scheduling system.) Then, these samples are first broken down to the individual tests. Each sample has a due date and priority. With a pre-defined set of batching/campaigning rules, the algorithm will combine the samples and the tests together considering parameters, such as due date and the priority, the probability for these test, to be completed on-time, and maximum campaign size (not to over campaign). In addition, with the projection comple-tion algorithm, we can hold the scheduling process for other upcoming samples without risking a miss of the due date. As can be seen in Figure 4, Test A is common for all the four samples that arrived and are campaigned; however, Test C
is not needed for Sample #2, etc. Once the algorithm establishes the batches and their related parameters, the scheduling process begins, and now a broader picture is looked at: the analyst workload, quali-fications, and proficiency, and the actual structure of the labs is being considered, e.g., center of excellence, organized by value stream, cell approach. Assignments are determined by the software algorithm and provided to the analysts with various colors of criticality where red indicates lateness, yellow indicates close to being late, and green stands for ahead of sched-ule. This communicates to the analysts the order of importance of assignments for the business. Once we computerize the scheduling process, other attributes of the lab performance can be managed such as analyst/workcenter/team efficiency, more detailed cycle time assessment and root causes for delays, and as the critical ability to react to changes in the schedule
by running the algorithm in one click. Once the algorithm is completed, each analyst will see the changes in their own dashboard and can react accordingly. This is one of the most challenging tasks to accomplish when using a manual white-board or simple communication as we need to update each affected analyst by the change.
In order to schedule this level of complexity, a robust computerized solution is required to minimize the time spent by the supervisors and
provide the flexibility to react to schedule changes and optimize the overall lab performance in terms of
cycle time, on-time delivery, and efficiency.”Summary
QC laboratories are one of the most complicated environ-ments to schedule, especially in labs that have a high prod-uct mix and diversified products that are tested with large number of analysts and instruments. In order to schedule this level of complexity, a robust computerized solution
Figure 4. Automated scheduling flow.

6 November/December 2012 PHARMACEUTICAL ENGINEERING
quality systemsResource Scheduling
is required to minimize the time spent by the supervisors and provide the flexibility to react to schedule changes and optimize the overall lab performance in terms of cycle time, on-time delivery, and efficiency. Improving campaigning by leveraging a computerized solution can significantly reduce overtime and improve efficiency. These are key in reducing lab costs and provide a more reliable supply chain partner to the manufacturing. While having the right number of resources using a resource model is key in ensuring the lab ability to support incoming samples, the ability to effectively schedule the lab will help manage the daily and weekly fluc-tuations that are inherent in our current business conditions that call for low inventory and an agile supply chain.
References1. Maslaton, R. “Resource Planning in QC Labs,” Pharma-
ceutical Engineering, March/April 2012, Vol. 32, No. 2, pp.66-73, www.PharmaceuticalEngineering.org.
2. CFR – Code of Federal Regulations Title 21, Sec. 211.25, Personnel Qualifications.
3. Barbarite, J. and Maslaton, R., “Managing Efficiency in a Quality Organization.”
4. Leachman, R., “Closed-loop Measurement of Equipment Efficiency and Equipment Capacity,” ESRC 95-03/CSM-2, Department of Industrial Engineering, University of California – Berkeley, Berkeley, CA, January 1997.
5. Shanley, A. “Is Pharma Stuck on the Way to Six Sigma?” Pharmaceutical Manufacturing Magazine.
About the AuthorRafi Maslaton, President, cResults, an IPS affiliate, has more than 19 years of diversified experience in operations, manufacturing engineering, information systems, and business management issues for fortune 500 firms. Prior to joining
cResults, he served as COO of Sparta Systems, the maker of TrackWise, overseeing the complete project life cycle for clients. Maslaton has managed operational excellence projects for more than 100 QC laboratories and works with Fortune 500 clients, such as Abbott, Amgen, Baxter, Bausch and Lomb, Bayer, Centocor/OBI, C.R. Bard, Eli Lilly, Fort Dodge, Genentech, J&J, Merck, Novartis, Par, Pfizer, Phar-macia, Roche, Sandoz, Shire, Schering-Plough, Teva,Wyeth, Agere Systems, HADCO, IBM, Intel, Lucent, Motorola, Nortel Network, Philips, Raytheon, and Siemens. Maslaton developed the first resource planning, scheduling, and cost of quality software for the QC laboratories Smart-QC and the first batch record and efficiency management software solu-tion for QA cME. He can be contacted by email: [email protected]. cResults, 3 Executive Dr., Somerset, New Jersey 08873, USA.

1PHARMACEUTICAL ENGINEERING November/December 2012
manufacturing and operationsEnvironmental Monitoring/Decontamination
IntroductionEnvironmental Monitoring and Testing of Pharmaceutical Facilities
M aintaining a comprehensive environmental monitoring pro-gram is critical to the pharma-ceutical industry, as it can act as an early indication for potential contamination of products. An effective environmental moni-toring program includes the sampling of microbiological
risk areas within the plant to find organisms before they get into the product, and verifying that all cleaning and sani-tizing procedures are working effectively. When analyzing and revising a sampling program, many questions must be answered. “What organisms (bacteria, viruses, fungi, spores) are of greatest concern?” “What are the acceptable microbio-logical limits for our sample results?” “Where should we take samples from?” “Is air sampling necessary?” The first step is to understand the microorganism(s) of concern.
• What is the primary habitat? Some, like Staphylococcus and Pseudomonas, are found on people’s skin, hair, nasal passageways, and mouth; or is it a soil organism (like Bacillus spp)? Sources can be very widespread for many microorganisms and can include “the great outdoors,”
ingredients, the production plant environment, pallets, drains, humans, animals, and insects.
• What nutrients and conditions (water availability, oxy-gen, temperature, pH, etc.) are required for the organism to grow and survive? Organisms like Pseudomonas spp and yeasts thrive in moist environments.
• What are the necessary steps required to kill the organ-ism (sterilization, disinfecting solutions, fumigation)?
• Has the organism been implicated in contamination for the same or similar products? Pseudomonas spp has been linked with contaminations in Liquids, Ointments, and Creams (LOCs).
• Are there USP tests available to detect the organisms? Some organisms (like B. cepacia) are not detected by cur-rent USP tests.
• What should you be concerned with? Some bacteria have a high infectious dose in order for most individuals to ex-hibit symptoms (Bacillus spp is ~105 – 108 viable cells or spores). Others such as Staphylococcus spp and Pseudo-monas spp can come from people (workers) and are easy to kill, but have the ability to quickly become resistant.
In the beginning of an environmental monitoring program review, in-depth baseline testing should be done to thor-oughly understand the plant environment and location of harbors and niches where organisms reside. There are two components of an environmental monitoring program and both can be failure points: the sampling frequency and the
Environmental Monitoring and Decontamination of Pharmaceutical
Production FacilitiesPaul Lorcheim and Melissa Hughes
This article reviews a facilities environmental monitoring program and the decontamination measures that might need to be added in order to achieve
satisfactory results within the program.
Reprinted fromPHARMACEUTICAL ENGINEERINGThe Official Technical Magazine Of iSPe
NovEMbER/DEcEMbER 2012, vol 32, No 6
©copyright ISPE 2012
www.PharmaceuticalEngineering.org

2 November/December 2012 PHARMACEUTICAL ENGINEERING
manufacturing and operationsEnvironmental Monitoring/Decontamination
sampling method. Sampling methods should include air sampling, both passive and active, to measure the quantity and type of airborne organisms present. Swabbing both wide areas as well as pinpoint areas in crevices and on equipment also should be performed. During the initial environmental monitoring phase, as well as periodically thereafter, both Total Aerobic Plate Counts (TPC) as well as identifying specifically what organisms are present should be performed. This provides a good baseline of what organisms are present. Sample locations should be expanded to test the hard-to-reach areas that might not be easily accessible and might require the disassembly of some equipment and components in order to properly sample and survey them. Much like the rule of Real Estate, the rule of sampling is “location, location, location.” It’s important to test in as many locations as pos-sible, including ones that have never been tested before. The goal is to have as complete a survey of the facility as possible, knowing where contaminations originate and are harbored. Once this baseline has been established, the normal cleaning and sanitizing methods should be performed. It is important that the cleaning step be performed without forewarning of the review such that the truest measure of the cleaning staff and the cleaning program are taken. Indicator organisms and biological indicators are commonly used during this step, and placed throughout the facility, allowing for a measurable result of the cleaning that was performed. Upon completion of the standard cleaning method, another round of sampling should occur and the indicators can be tested to gauge the efficacy of the established cleaning method.
The presence of these organisms in the pharmaceutical facilities can lead to costly product recalls, which can result in loss of revenue, customers, prestige, and brand reputation.” Contamination continues to be a difficult challenge for all sectors of the pharmaceutical industry and poses a significant hazard to human health. The presence of these organisms in the pharmaceutical facilities can lead to costly product recalls, which can result in loss of revenue, custom-ers, prestige, and brand reputation. Bad publicity, expensive legal fees, increased insurance premiums, and perhaps even closure are other potential hazards of plant contamination.
Another important step in setting up an environmental sampling plan is to know your product, the target con-sumer group (children, the elderly, pregnant women, and immunocompromised individuals are more susceptible to bacteria induced illness), and the environment in which the drug is being produced. Certain products and manufactur-ing operations are more susceptible to certain microbial contaminants, making the sampling of those organisms a priority. Some processing facility attributes to consider are the following: • Type of processing (terminal sterilization available or
not)• Plant cleaning and sanitation schedule• Rotation of sanitizers• Separation of production and storage areas• Flow of product compared to worker traffic patterns• Age and wear of equipment and facilities• Presence of rust• Floors, drains, roof, and overhead concerns• Standing water• Air handling systems and dust• Pest control and trash management• Sink areas
So what corrective and preventive action needs to occur if the sample results show that the standard cleaning method is not able to satisfy the requirements of the environmental monitoring program and positive samples are being found? The facility must look at the source of contamination for a possible solution (replacing equipment with more sanitary model?) or enact a more thorough cleaning step through a more aggressive cleaning agent. The frequency that the en-vironmental monitoring program should perform sampling should be determined by the facility’s management. One factor to consider when determining a sampling schedule includes the maximum production batch acceptable to recall if positive samples are found. Sanitization frequency would be determined through a similar process based on sampling results and the sanitization method’s potency. If a facility’s environmental monitoring results stay good for three weeks, but then positives arise after four weeks, it might be neces-sary to increase the decontamination frequency using the existing method or to move to a more effective method to eliminate a greater portion of the organisms initially.
High-Level Antimicrobial Cleaning MethodsThe United States Environmental Protection Agency (US EPA) defines antimicrobial pesticides as substances or mix-tures of substances used to destroy or suppress the growth of harmful microorganisms, such as bacteria, viruses, or fungi on a variety of objects and surfaces. Antimicrobial pesticides have two major uses:

3PHARMACEUTICAL ENGINEERING November/December 2012
manufacturing and operationsEnvironmental Monitoring/Decontamination
• To disinfect, sanitize, reduce, or mitigate growth or devel-opment of microbiological organisms
• To protect objects (e.g., floors and walls), industrial processes or systems, surfaces, water, or other chemical substances from contamination, fouling, or deteriora-tion caused by bacteria, viruses, fungi, protozoa, algae, or slime1
Pesticides are classified by their levels of kill by the USEPA,1 which are:
• Antiseptics and Germicides: used to prevent infec-tion and decay by inhibiting the growth of microorgan-isms. Because these products are used in or on living humans or animals, they are considered drugs and are thus approved and regulated by the US Food and Drug Administration (FDA).
• Sanitizers: used to reduce, but not necessarily elimi-nate microorganisms from the inanimate environment to levels considered safe as determined by public health codes or regulations.
• Disinfectants: used on hard inanimate surfaces and ob-jects to destroy or irreversibly inactivate infectious fungi and bacteria, but not necessarily their spores. Disinfec-tant products are divided into two major types: hospital and general use.
• Sterilizers (Sporicides): used to destroy or elimi-nate all forms of microbial life including fungi, viruses, and all forms of bacteria and their spores. Spores are considered to be the most difficult form of microorgan-ism to destroy. Therefore, the USEPA considers the term Sporicide to be synonymous with “Sterilizer.”
No matter what antimicrobial pesticide is used, and no mat-ter what level of kill is desired, the following items must be achieved in order for the method to be successful:
• Good and complete distribution• Good and total penetration• Sufficient contact time• Sufficient concentrations
A method cannot work if it does not contact the organism for the proper amount of time at the right concentration. No matter what the method is classified as, it will be unsuc-cessful if it cannot come in contact with the organism. If the method becomes diluted or breaks down quickly, it will be unsuccessful. As such, it is important to look at the methods and examine their traits to see whether it can be efficacious for your application.
There are several available methods for decontamination. The most prevalent or most common method is spraying and wiping. In this method, the user sprays a liquid sanitizer/disinfectant/sterilant around the area to coat all surfaces. While this method is the most common, it is also the most fallible. It is extremely difficult for the user to spray or wipe all surfaces within an area and keep them wet at the cor-rect concentrations for the prescribed amount of time. For example, Luftman2 described a facility which had a Salmo-nella contamination. In this facility, the users attempted to clean and decontaminate it on two separate occasions using a spray and wipe method, but were unsuccessful each time at eliminating the contamination. They were unsuc-cessful because they could not reach all the niches to fully decontaminate the facility. To eliminate the contamination at the facility, a gaseous fumigant (chlorine dioxide gas) was utilized. This method was successful in eliminating the salmonella contamination because the gas was able to reach the contamination, even in niches, and was monitored at the proper concentration for the appropriate amount of time. Automatic foggers are another method that is used, but still has the same limitation of reaching all surfaces. In this method, an atomizer is utilized to create a fine mist of physical particles (5 to 100 microns) which then coats all surfaces. This method is subject to room geometry though, and odd shaped rooms create blind spots because of fogger equipment placement. When locating the foggers within the space, it is critical to have a line of sight to all areas in order for the disinfectant to reach all surfaces. This is extremely difficult when equipment is in the room, as mists and fogs have trouble reaching behind and below surfaces. It must be remembered that organisms are 0.5 to 2 microns in size, and can hide in niches too small for the 5+ micron mist to reach. Lack of total distribution and an inability of penetrating crevices where organisms can exist limit the effectiveness of fogging methods. Ionized foggers attempt to overcome limited distribution by atomizing and positively charging a 7.5% hydrogen per-oxide solution to allow the disinfectant to stick to negatively charged surfaces. While this helps with negatively charged surfaces, which most are, positively charged surfaces such as glass and aluminum would actually repel the ionized fog. This method still holds the same limitations of not being able to distribute to all surfaces and penetrate into crevices and niches where organisms can exist. The limitation of reaching all surfaces is where fumiga-tion comes into focus. For applications where it is critical to reach all surfaces (such as a plant-wide contamination with pathogenic bacteria), fumigation is the process that achieves total coverage. The fumigation methods available consist of vapors (hydrogen peroxide dry process and hydrogen peroxide wet process) and the true gases (chlorine dioxide, formaldehyde, and ozone).

4 November/December 2012 PHARMACEUTICAL ENGINEERING
manufacturing and operationsEnvironmental Monitoring/Decontamination
Vapor Phase Hydrogen Peroxide (VPHP) is a residue-free fumigant that has been used for more than 30 years for sterilization.3 The International Agency for Research on Cancer (IARC), National Toxicology Program (NTP), and the Occupational Safety and Health Administration (OSHA) do not list hydrogen peroxide as a carcinogen; however, the American Conference of Industrial Hygienists (ACGIH) does classify it as an A3 animal carcinogen. Typically, a 35% hydrogen peroxide and 65% water solution is boiled or va-porized and then injected into the room or target chamber. There are currently two processes for VPHP: a dry process and a wet process. In the “dry” process, the Relative Humid-ity (RH) is lowered to maximize the amount of vapor in the air. The vapor is maintained in the dry state to maximize distribution of the vapor. In the “wet” process, the RH is not lowered prior to injection, and the vapor is injected and allowed to condense on surfaces. Either process will have varying amounts of condensation since VPHP is not a true gas at room temperatures (hydrogen peroxide’s boiling point is 109°C) and RH levels can typically exceed 90%.4 When this condensation occurs, the concentration increases to a maximum concentration of 78% hydrogen peroxide.5 This concentrated oxidizer can cause surface damage to painted surfaces6,7 and epoxy surfaces.7,8 Another drawback with VPHP is it has poor distribution9,10 and poor penetration abilities into 5 mm gaps11 and small tubing and openings.12 Gaseous methods fumigate by introducing a gas into the facility, allowing the gas to fill the space according to natural gas laws which state that a gas will completely and evenly fill the volume in which it is contained in. Gases dif-fer from fogs and vapors in this way, as fogs and vapors are poor at achieving passive diffusion and are thus limited in their distribution. Gases, whose molecules are measured in picometers, also are smaller than fogs (5 to 100 microns) or bacteria (approximately 1 to 2 microns). Some gases used for antimicrobial fumigation are methyl bromide, ethylene oxide, formaldehyde, ozone, and chlorine dioxide gas. These gases all share the ability to distribute readily throughout a space, but there are distinguishing traits that make some unsuitable for fumigation within a facility. Methyl bromide, for instance, is recognized as an ozone-depleting substance13 and as such is banned from most uses. Ethylene oxide is a carcinogen and is explosive at use concentrations14 and needs to be used within special chambers using damage limiting construction. Formaldehyde is a known carcinogen15 and also leaves a dangerous residue,16 both of which make it ill-suited for use in a production facility. Ozone has been shown to have limited efficacy against a variety of organisms17 and has a lifespan (20 to 30 minutes) much shorter than its contact time (multiple hours). However, Chlorine Dioxide (CD) gas is non-carcinogenic, non-residue forming, and highly effective against pathogens and microorganisms.18,19 For this reason, chlorine dioxide gas is being used for antimicrobial fumiga-
tion within the pharmaceutical, life science, defense, health-care, and food industries for a wide range of applications including whole facility decontamination.2,20,21
Gaseous fumigation methods such as chlorine dioxide gas hold a distinct advantage toward achieving high-level decontamination in hard-to-reach areas. Tall areas such as warehouses and processing tank rooms prove too difficult for vapors and fogs to reach the upper surfaces as gravity affects the fog and vapor droplets and prevents them from reaching such heights. True gases are able to reach high sur-faces with no drop in concentration, offering the same level of decontamination from floor to ceiling. Gases evenly mix per the kinetic theory of gases enabling the decontaminating gas to evenly mix with the air which touches all surfaces. Verification of the effectiveness of the decontamina-tion also can be accomplished in various ways. For fogging, vapor, and gassing methods, biological indicators can be placed around a facility demonstrating sporicidal kill. They can range from 3 log of organisms to 6 logs depending on customer preferences. Swabbing for viable organisms also is another method that can be utilized for all decontaminat-ing methods. For certain gases, continuous concentration monitoring exists to ensure that the cycle parameters were attained for the desired level of decontamination. This can assure that even remote areas of the facility have met the required dosage before the decontamination cycle is ended. This also will ensure that the proper dosage is attained even if a facility is not completely airtight. Safety and use instructions, including concentrations and application rates for the organisms in question, for all decontamination methods must be obtained by reading the complete USEPA approved label instructions and used accordingly. Material compatibility should be verified when choosing a decontaminating agent. The agents also should be investigated regarding residues that might affect product. Safety data and warnings also are found on the MSDS sheets for each specific agent and should be read and followed. In the event that a widespread contamination does occur at a facility, gaseous decontamination would prove the most effective method towards eliminating the problem. It would prove impossible to spray and wipe an entire facility, and vapors would not be able to contact all surfaces either. By filling the facility uniformly with a gaseous sterilant proven to eliminate all viruses, bacteria, molds, and spores, such as chlorine dioxide gas, a facility can be guaranteed that the microbial contamination is eliminated from all surfaces, including cracks and crevices. A whole facility decontamina-tion can take place in as little as one day depending on the size and timeframe necessary.
ConclusionMicrobial contamination of pharmaceutical production facilities continues to be a difficult challenge for the indus-

5PHARMACEUTICAL ENGINEERING November/December 2012
manufacturing and operationsEnvironmental Monitoring/Decontamination
try, and can provide a significant health hazard to human safety when disease-causing microorganisms get into the final product. Companies that have a comprehensive envi-ronmental monitoring program have an advantage toward limiting microbial contamination and its effect. A well-main-tained program will include microbiological testing of the risk areas in the plant, locating the organisms before they get into the product, and also will verify that the cleaning and sanitizing procedures are effective. Once the environmental monitoring program has been made as comprehensive as possible, the sanitization plan should be reformed to meet the needs and risk areas defined by the environmental moni-toring program. If a persistent or widespread environmental contamina-tion does occur in the facility, fumigation may be necessary as it provides a decontamination method to completely eliminate pathogens. There are many ways to decontaminate spaces. Regardless of which method is chosen, the agent or technology must achieve complete distribution, good pen-etration, and sufficient contact time at the required concen-tration. Chlorine dioxide gas is the only non-carcinogenic, residue-free fumigant which is able to reach all surfaces from floor to ceiling (including cracks and crevices) and eliminate all viruses, bacteria, fungi, and spores. With an im-proved sampling program and a more thorough sanitization program involving a high-level decontamination method, contamination control within a pharmaceutical facility will be able to shift to a more preventative program with less chance of widespread contamination and costly product recalls.
References1. U.S. Environmental Protection Agency, What are Anti-
microbial Pesticides?, (2011), http://www.epa.gov/op-pad001/ad_info.htm.
2. Luftman, H.S., Regits, M.A., Lorcheim, P., Czarneski, M.A., Boyle, T., Aceto, H., et al. “Chlorine Dioxide Gas Decontamination of Large Animal Hospital Intensive and Neonatal Care Units,” Applied Biosafety: Journal of the American Biological Safety Association, Vol. 11, No. 3, 2006, pp.144-154.
3. Moore, Francis C., Perkinson, Leon R., Hydrogen Per-oxide Vapor Sterilization Method, United States Patent 4,169,123, 1979
4. Rogers, James V., Choi, Young W., and Richter, Wil-liam R., “ Effects of Drying and Exposure to Vaporous Hydrogen Peroxide on the Inactivation of Highly Patho-genic Avian Influenza (H5N1) on non-porous Surfaces,” Applied Biosafety: Journal of the American Biological Safety Association, Vol. 16 No. 1, 2011, pp. 4-8.
5. Hultman, C., Hill, A., and McDonnell, G., “The Physical Chemistry of Decontamination with Gaseous Hydrogen Peroxide,” Pharmaceutical Engineering, January/Feb-
ruary 2007, Vol. 27, No. 1, pp. 22-32, www. Pharmaceu-ticalEngineering.org.
6. Malmborg, A., Wingren, M., Bonfield, P., and McDon-nell, G., “VHP Takes its Place in Room Decontamina-tion,” CleanRooms, Vol. 15, 2001, No. 11.
7. Sawyer, Megan, “Got Gas? Chlorine Dioxide or Vapor-ized Hydrogen Peroxide: Which One Is Right For You?” The Midwest Area Biosafety Network (MABION) Sym-posium, 8-10 August 2011, Ames, IA.
8. Feldman, Leslie A. and Hui, Henry K., “Compatibility of Medical Devices and Materials with Low-Temperature Hydrogen Peroxide Gas Plasma,” Medical Device and Diagnostic Industry, December 1997.
9. Herd, M., “Hydrogen Peroxide Vapor for Room/Build-ing Decontamination Following a Chemical or Biological Agent Attack: Overview of Efficacy and Practical Is-sues,” Presentation for Workshop on Decontamination, Cleanup, and Associated Issues for Sites Contaminated with Chemical, Biological, or Radiological Materials, S. Dun, J. Wood, & B. Martin (Eds). Washington, DC: Of-fice of Research and Development, U.S. Environmental Protection Agency. Contract No. EP-C-04-056. 2005.
10. Shearrer, S., “Comparison of Formaldehyde vs. VHP Decontamination within Operational BSL-4 Laboratory at Southwest Foundation for Biomedical Research,” San Antonio, Texas. Boston: Presentation at 49th Annual Biological Safety Conference Program, 2006.
11. Steris Corp., Industry Review: Room Decontamina-tion with Hydrogen Peroxide Vapor, Publication ID #M1941EN.2002-09 Rev. C, 2000.
12. Devine, Steve, Woolard, Keith, and Mahler, Axel, “Chal-lenges Encountered in Decontamination of Small Spaces and Tubes,” 52nd Annual Biological Safety Conference, 15-21 October 2009, Miami, FL.
13. U.S. Environmental Protection Agency, Environmental Protection Agency, 40 CFR Part 82, Protection of Strato-spheric Ozone, 58(236), 65018 (Rule) 8006, 1993.
14. National Institute for Occupational Safety and Health & Centers for Disease Control and Prevention, Internation-al Chemical Safety Cards, ethylene oxide, 1994, http://www.cdc.gov/niosh/ipc sneng/neng0155.html.
15. International Agency for Research on Cancer (2004), ac-cessed online 2010, http://www.iarc.fr/ENG/Press_Re-leases/archives/pr153a.html.
16. Luftman, H.S., “Neutralization of Formaldehyde Gas by Ammonium Bicarbonate and Ammonium Carbonate,” Applied Biosafety: Journal of the American Biological Safety Association, Vol. 10, No. 2, 2005, pp. 101-106.
17. Beswick, A.J., Farrant, J., Makison, C., Gawn, J., Frost, G., Crook, B., and Pride, J., “Comparison of Multiple Systems for Laboratory Whole Room Fumigation,” Applied Biosafety: Journal of the American Biological Safety Association, Vol. 16, No. 3, 2011, pp. 139-157.

6 November/December 2012 PHARMACEUTICAL ENGINEERING
manufacturing and operationsEnvironmental Monitoring/Decontamination
18. Jeng, D.K., and Woodworth, A.G., “Chlorine Dioxide Gas Sterilization under Square-Wave Conditions,” Applied Environmental Microbiology, Vol. 56, 1990, pp. 514-519.
19. Han, Y., Sherman, D.M., Linton, R.H., Nielsen, S.S., and Nelson, P.E., “The Effects of Washing and Chlorine Dioxide Gas on Survival and Attachment of Escherichia coli O157: H7 to green pepper surfaces,” Food Microbiol-ogy, Vol. 17, No. 5, 2000, pp. 521-533.
20. Czarneski, M.A., “Microbial decontamination of a 65-room new pharmaceutical research facility,” Applied Biosafety: Journal of the American Biological Safety Association, Vol. 14, No. 2, 2009, pp. 81-88.
21. Mattson, T., “Gaseous Decontamination using Chlorine Dioxide can Scrub Facilities of Pathogens Better Than Vaporized Hydrogen Peroxide,” Food Quality, Oct/Nov 2011.
About the AuthorsPaul Lorcheim has been with ClorDiSys Solutions, Inc. since 2001 as Director of Operations directing the commercializa-tion and manufacturing of various decon-tamination and sterilization equipment for the pharmaceutical, life science, and food
industries. Prior to ClorDiSys Solutions, Lorcheim worked for Johnson and Johnson for 20 years with positions in engineering, sterilization, and manufacturing operations. He is registered as a Licensed Professional Engineer and holds a BSEE from the New Jersey Institute of Technology. He can be contacted by telephone: +1-908-236-4100 or email: [email protected]. ClorDiSys Solutions, Inc., PO Box 549, Lebanon, New Jersey 08833, USA.
Melissa Hughes is the Director of Sales, Marketing and Training at AEMTEK, Inc., an accredited pharmaceutical, food, and environmental microbiological test-ing laboratory in the San Francisco Bay Area. Hughes earned a Master of Science
degree in Food Science from Texas Tech University, with an emphasis in microbiology. She has given many techni-cal presentations, and has written several publications and conference abstracts. Hughes also is an active member of many organizations, including the International Associa-tion for Food Protection, Institute of Food Technologists, American Society for Microbiology, American Association for the Advancement of Science, and the Society for Applied Microbiology. AEMTEK, Inc., 46309 Warm Springs Blvd., Fremont, California 94539, USA.

1PHARMACEUTICAL ENGINEERING November/December 2012
research and developmentUltrasonic Drug Delivery
Introduction
D ocetaxel is a semi synthetic analog of paclitaxel derived from 10-deacetyle-baccatin III, extracted from needles of the European yew tree and has been used to successfully treat metastatic breast cancer along with ovarian, gastric, and prostate cancer.1 At the molecular level, docetaxel impairs cell proliferation by binding
to the β-subunit of tubulin in microtubules. Binding inhibits microtubule disassembly and disrupts normal microtubule dynamics resulting in cell cycle arrest and cell death through apoptosis, mitotic catastrophe, or lytic necrosis.2 Docetaxel has a 1.9 fold higher affinity for microtubules and induces microtubule polymerization at 2.1 fold lower concentrations compared to paclitaxel3 and has shown activity in patients with metastatic solid tumors that are resistant to paclitaxel.4 The intravenous administration of docetaxel is hindered by its low aqueous solubility (6 to 7 µg/ml)5 making it neces-sary to deliver docetaxel in a formulation of polysorbate 80 and ethanol.6 Unfortunately, systemic delivery of docetaxel in this formulation can result in side effects, including acute hypersensitivy reactions, neutropenia, fluid retention, and peripheral neurotoxicity, which limits the amount of drug that can be administered safely.1,6,7
The drawbacks associated with the current formulation of docetaxel in polysorbate 80 and ethanol have motivated the development of alternative, less toxic delivery methods, including micelles, liposomes, and nanoparticles.8,9 Encap-
sulating docetaxel in these delivery vehicles can improve the drug’s dispersibility in aqueous media and enhance drug delivery by passively targeting solid tumors through the En-hanced Permeability and Retention (EPR) effect.10 The EPR effect is the result of the extensive angiogenesis in a growing tumor leading to a hyperpermeable tumor vasculature with pore sizes ranging between 380 and 780 nm.11,12 Tumors also lack adequate functional lymphatic drainage leading to the accumulation of particles less than 780 nm.13
To improve on passive targeting, more sophisticated forms of active targeting have been developed. These include molecular targeting by designing nanoparticles conjugated to antibodies that can selectively bind to the desired target.14 Other forms of active targeting involve creating a delivery vehicle that will respond to a localized external stimulus such as heat, magnetic fields, or ultrasound waves which can trigger the carrier to deliver drug at the desired location while reducing systemic exposure.15-17 Ultrasound Contrast Agents (UCA) are small (less than 6 µm) gas microbubbles stabilized with a lipid, protein, or polymer shell. These agents are injected intravenously and are readily detected in tumor vasculature.18 When exposed to ultrasound, the compressible nature of the gas bubble allows the UCA to experience significant primary radiation forces that can displace the bubble toward the vessel wall.19 Ultra-sound also causes the gas core of a bubble to rapidly expand and contract in response to the oscillating pressure of the ul-trasound wave.20 When exposed to ultrasound with sufficient intensity, UCA cavitation can generate enough shear force to create temporary pores in cell membranes and disrupt
In Vitro Characterization of Docetaxel Loaded Microbubbles for Ultrasound Triggered Drug Delivery
by Michael Cochran, Theresa Bustamante, John Eisenbrey, and Margaret Wheatley
This article is based on the research of an ISPE 2011 Student Poster Competitor.
Reprinted fromPHARMACEUTICAL ENGINEERINGThe Official Technical Magazine Of iSPe
NoVeMbeR/DeCeMbeR 2012, VoL 32, No 6
©Copyright ISPe 2012
www.PharmaceuticalEngineering.org
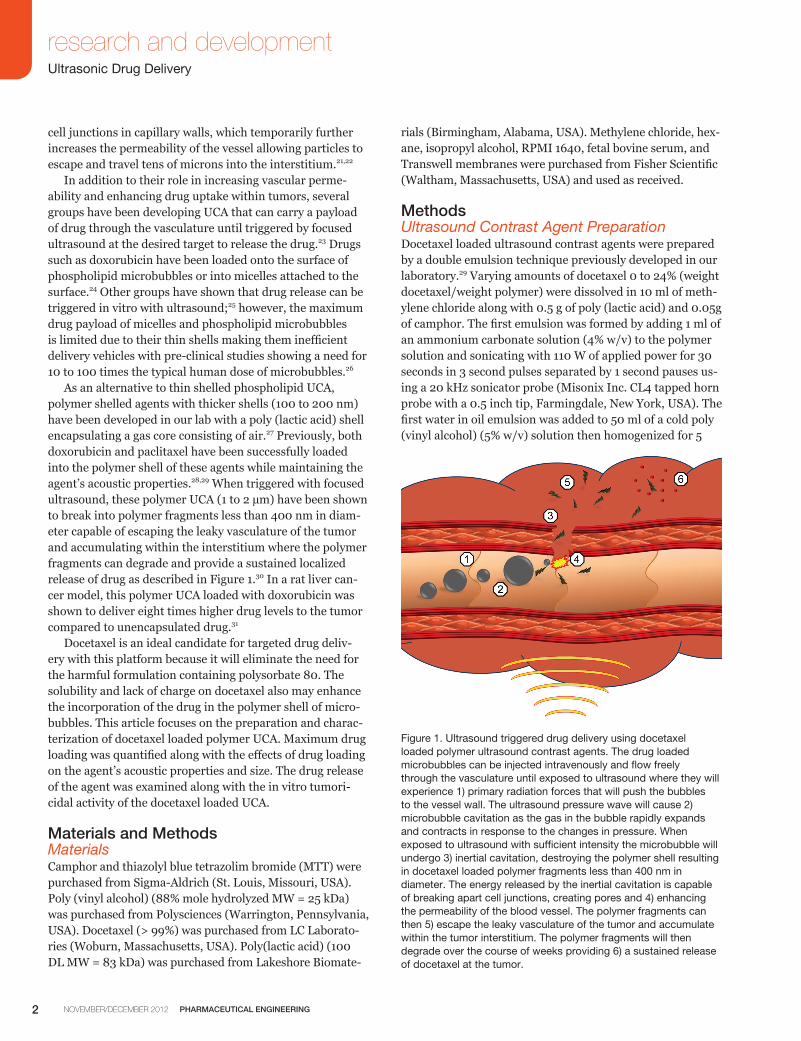
2 November/December 2012 PHARMACEUTICAL ENGINEERING
research and developmentUltrasonic Drug Delivery
cell junctions in capillary walls, which temporarily further increases the permeability of the vessel allowing particles to escape and travel tens of microns into the interstitium.21,22 In addition to their role in increasing vascular perme-ability and enhancing drug uptake within tumors, several groups have been developing UCA that can carry a payload of drug through the vasculature until triggered by focused ultrasound at the desired target to release the drug.23 Drugs such as doxorubicin have been loaded onto the surface of phospholipid microbubbles or into micelles attached to the surface.24 Other groups have shown that drug release can be triggered in vitro with ultrasound;25 however, the maximum drug payload of micelles and phospholipid microbubbles is limited due to their thin shells making them inefficient delivery vehicles with pre-clinical studies showing a need for 10 to 100 times the typical human dose of microbubbles.26 As an alternative to thin shelled phospholipid UCA, polymer shelled agents with thicker shells (100 to 200 nm) have been developed in our lab with a poly (lactic acid) shell encapsulating a gas core consisting of air.27 Previously, both doxorubicin and paclitaxel have been successfully loaded into the polymer shell of these agents while maintaining the agent’s acoustic properties.28,29 When triggered with focused ultrasound, these polymer UCA (1 to 2 µm) have been shown to break into polymer fragments less than 400 nm in diam-eter capable of escaping the leaky vasculature of the tumor and accumulating within the interstitium where the polymer fragments can degrade and provide a sustained localized release of drug as described in Figure 1.30 In a rat liver can-cer model, this polymer UCA loaded with doxorubicin was shown to deliver eight times higher drug levels to the tumor compared to unencapsulated drug.31 Docetaxel is an ideal candidate for targeted drug deliv-ery with this platform because it will eliminate the need for the harmful formulation containing polysorbate 80. The solubility and lack of charge on docetaxel also may enhance the incorporation of the drug in the polymer shell of micro-bubbles. This article focuses on the preparation and charac-terization of docetaxel loaded polymer UCA. Maximum drug loading was quantified along with the effects of drug loading on the agent’s acoustic properties and size. The drug release of the agent was examined along with the in vitro tumori-cidal activity of the docetaxel loaded UCA.
Materials and MethodsMaterialsCamphor and thiazolyl blue tetrazolim bromide (MTT) were purchased from Sigma-Aldrich (St. Louis, Missouri, USA). Poly (vinyl alcohol) (88% mole hydrolyzed MW = 25 kDa) was purchased from Polysciences (Warrington, Pennsylvania, USA). Docetaxel (> 99%) was purchased from LC Laborato-ries (Woburn, Massachusetts, USA). Poly(lactic acid) (100 DL MW = 83 kDa) was purchased from Lakeshore Biomate-
Figure 1. Ultrasound triggered drug delivery using docetaxel loaded polymer ultrasound contrast agents. The drug loaded microbubbles can be injected intravenously and flow freely through the vasculature until exposed to ultrasound where they will experience 1) primary radiation forces that will push the bubbles to the vessel wall. The ultrasound pressure wave will cause 2) microbubble cavitation as the gas in the bubble rapidly expands and contracts in response to the changes in pressure. When exposed to ultrasound with sufficient intensity the microbubble will undergo 3) inertial cavitation, destroying the polymer shell resulting in docetaxel loaded polymer fragments less than 400 nm in diameter. The energy released by the inertial cavitation is capable of breaking apart cell junctions, creating pores and 4) enhancing the permeability of the blood vessel. The polymer fragments can then 5) escape the leaky vasculature of the tumor and accumulate within the tumor interstitium. The polymer fragments will then degrade over the course of weeks providing 6) a sustained release of docetaxel at the tumor.
rials (Birmingham, Alabama, USA). Methylene chloride, hex-ane, isopropyl alcohol, RPMI 1640, fetal bovine serum, and Transwell membranes were purchased from Fisher Scientific (Waltham, Massachusetts, USA) and used as received.
MethodsUltrasound Contrast Agent PreparationDocetaxel loaded ultrasound contrast agents were prepared by a double emulsion technique previously developed in our laboratory.29 Varying amounts of docetaxel 0 to 24% (weight docetaxel/weight polymer) were dissolved in 10 ml of meth-ylene chloride along with 0.5 g of poly (lactic acid) and 0.05g of camphor. The first emulsion was formed by adding 1 ml of an ammonium carbonate solution (4% w/v) to the polymer solution and sonicating with 110 W of applied power for 30 seconds in 3 second pulses separated by 1 second pauses us-ing a 20 kHz sonicator probe (Misonix Inc. CL4 tapped horn probe with a 0.5 inch tip, Farmingdale, New York, USA). The first water in oil emulsion was added to 50 ml of a cold poly (vinyl alcohol) (5% w/v) solution then homogenized for 5

3PHARMACEUTICAL ENGINEERING November/December 2012
research and developmentUltrasonic Drug Delivery
minutes at 9500 rpm with a saw tooth homogenizer probe (Brinkmann Instruments, Westbury, New York, USA) to form the second emulsion. To allow the methylene chloride to evaporate, 100 ml of 2% isopropyl alcohol was added to the second emulsion and stirred for 1 hour at room tempera-ture. The suspension was then centrifuged for 5 minutes at 2500 g. The supernatant was discarded and microbubbles were washed with hexane three times to help remove re-sidual methylene chloride. The samples were washed again with water then frozen in liquid nitrogen and lyophilized for 48 hours with a Vitris Benchtop freeze dryer (Gardiner, New York, USA). Freeze drying allows the water, ammo-nium carbonate, and camphor to sublime, resulting in a void encapsulated by a porous poly (lactic acid) shell contain-ing docetaxel. The void is filled with air upon release of the vacuum on the lyophilizer.
In Vitro Acoustic TestingThe ability of ultrasound contrast agent samples to reflect ultrasound was measured using an in vitro acoustic setup. A 5 MHz ultrasound transducer (Panametrics-NDT Waltham, Massachusetts, USA) with a diameter of 0.5 inches and a fo-cal length of 1.75 inches was chosen in order to insonate the samples with a frequency matching the resonance frequency of the microbubbles. An acrylic sample holder with an acous-tically transparent window and containing 50 ml of phos-phate buffered saline (pH = 7.4) was placed in a 37°C water bath with the submersible transducer aligned with the center of the acoustic window. The transducer was triggered with a pulser/receiver (Panametrics Waltham, Massachusetts, USA) to generate an acoustic signal with a pulse repetition frequency of 100 Hz and a peak negative pressure ampli-tude of 0.45 MPa measured with a 0.5 mm polyvinylidene fluoride needle hydrophone (Precision Acoustics, Dorset, UK). The signal reflected from the ultrasound contrast agent is detected by the transducer and amplified 40 dB by the pulser/receiver then read by an oscilloscope (Lecroy 9350 Chestnut Ridge, New York, USA). The signal was stored and analyzed using Labview 7 Express (National Instruments, Austin, Texas, USA). Acoustic backscattering enhancement was measured as a function of ultrasound contrast agent concentration in order to measure the agent’s ability to respond to ultrasound for imaging and drug delivery applications. Dry samples of ultrasound contrast agent made with varying amounts of docetaxel (0 to 24% w/w) were weighed and suspended in phosphate buffered saline then transferred into the buf-fer in the acrylic sample holder where they were allowed to mix for 10 seconds before measuring the acoustic response. Enhancement compared to a baseline reading was measured for increasing concentrations of agent and acoustic backscat-tering enhancement (in decibels) was defined as equation 1:
Acoustic rms[Ultrasound contrast agent] = 20 log ( _______________________ )Enhancement rms[Blank]
Where rms[Ultrasound contrast agent] is the root mean square of the signal given by the agent at each dose and rms[Blank] is the root mean square of the backscatter signal given by the buffer containing no contrast. In addition to measuring the acoustic backscatter with respect to dose, the acoustic stability of the ultrasound contrast agents exposed to ultrasound also was measured to determine the effect of drug loading on the stability of the polymer shell. Three micrograms of ultrasound contrast agent per milliliter of PBS was continuously insonated in the sample holder with a pulse repetition frequency of 100 Hz and a peak negative pressure amplitude of 0.45 MPa. The acoustic enhancement was measured every minute for 15 minutes then normalized with respect to the enhancement taken at the initial time point.
Particle SizingThe size distribution of ultrasound contrast agent samples was measured with dynamic light scattering using a Zeta-sizer Nano ZS (Malvern Inst., Worcestershire, UK). One mil-ligram of dry ultrasound contrast agent was suspended in 1.5 ml of phosphate buffered saline by vortexing for 10 seconds. The samples were then measured in triplicate and particle sizes were reported as peak % number.
Quantification of Docetaxel LoadingThe amount of docetaxel loaded into the ultrasound con-trast agents was quantified using High Pressure Liquid Chromatography (HPLC). Three milligrams of ultrasound contrast agent was dissolved in 1 ml of methylene chloride. The docetaxel was then extracted into 3 ml of the running buffer (acetonitrile/water, 50:50, v/v). The methylene chloride was then allowed to evaporate in the fume hood under a nitrogen stream. A reverse phase Inertsil ODS-3 column (150 × 3 mm internal diameter, 5 µm pore size (GL Sciences, Tokyo, Japan)) was used for HPLC analysis. The mobile phase (acetonitrile/water, 50:50, v/v) was delivered at a flow rate of 1ml/min with a Waters 1525 binary pump (Milford, Massachusetts, USA) and docetaxel was quanti-fied by UV absorbance at λ = 227 nm (Waters 2487, Milford, Massachusetts, USA). The area under the curve for the peak corresponding to docetaxel was calculated and the docetaxel concentration loaded into the ultrasound contrast agent was calculated based on a linear calibration curve. The encapsu-lation efficiency was defined as equation 2:
Encapsulation Amount of drug in sample (µg) = _______________________ × 100Efficiency (%) Initial amount of drug (µg)

4 November/December 2012 PHARMACEUTICAL ENGINEERING
research and developmentUltrasonic Drug Delivery
In Vitro Docetaxel ReleaseDocetaxel loaded ultrasound contrast agents with an initial loading of 18% docetaxel (w/w) (the maximum drug loading that maintained peak acoustic enhancement) were sus-pended in phosphate buffered saline at 37 °C in the acoustic sample holder described above. The sample was continu-ously stirred, and the 5 MHz transducer described above was used to insonate the ultrasound contrast agents with a peak negative pressure amplitude of 0.94 MPa and a pulse repeti-tion frequency of 5000 Hz for 25 minutes. Controls were performed without insonation. Ten milliliters of the suspen-sion was then transferred into centrifuge tubes and rotated end over end while being incubated at 37°C. Docetaxel release was quantified at selected time intervals over 40 days by first centrifuging samples at 48,000 g for 20 minutes (Sorvall WX ultracentrifuge, AH-629 rotor, Thermo Electron Corp., Waltham, Massachusetts, USA). The pellet was then suspended in fresh phosphate buffered saline and placed in the incubator to continue release while the collected super-natant was extracted two times with 1 ml of methylene chlo-ride. The methylene chloride was then allowed to evaporate under a stream of nitrogen and the docetaxel was dissolved in 1 ml of the mobile phase and measured using the HPLC protocol described above.
Nanoparticle Extravasation PotentialThe ability of docetaxel loaded ultrasound contrast agents to be triggered by ultrasound to break into fragments capable of escaping the leaky vasculature of tumors was modeled in vitro with Corning Transwell inserts with a polyester membrane containing 400 nm pores (Corning Incorporated, Corning, New York, USA). An insert was placed in a 6 well plate containing 3 ml of phosphate buffered saline with 1 mg of docetaxel loaded ultrasound contrast agent. The insert was then filled with 1 ml of phosphate buffered saline and the plate was partially submerged in at 37°C water bath. A 5 MHz spherically focused transducer was placed 1.75 inches from the bottom of the membrane and the sample was in-sonated for 20 minutes with a peak negative pressure of 0.94 MPa and a pulse repetition frequency of 5000 Hz. Samples were taken prior to insonation and at 5 minute intervals to measure the amount of drug forced across the membrane. Docetaxel levels were quantified with HPLC using the proto-col described previously. Tests were performed in triplicate and controls were performed with no insonation.
In Vitro Tumoricidal ActivityThe human breast cancer cell line MCF7 (passage number 6-12) was obtained from American Type Culture Collection (Manassas, Virginia, USA). The cells were grown in RPMI medium supplemented with 10% (v/v) FBS and 1% (v/v) an-tibiotic. The cells were maintained in a humidified incubator at 37°C with a 5 % CO2 atmosphere.
The ability of docetaxel loaded ultrasound contrast agents triggered with ultrasound to inhibit the growth of cancer cells was tested in vitro. Cells were seeded in 48 well plates with a density of 2.5 × 10⁴ cells per well in 500 µl of media and allowed to attach overnight. Ultrasound contrast agents loaded with 18% docetaxel (weight docetaxel/weight polymer) and controls containing no docetaxel (0%) were insonated in media for 20 minutes with a peak negative pres-sure of 0.94 MPa and a pulse repetition frequency of 5000 Hz. After insonation, samples were passed through 0.45 µm filters to simulate the leaky vasculature of a tumor and only allow the nanoparticles to pass through. Controls were per-formed without insonation. The samples were then diluted in media and added to the attached cells and incubated for 72 hours. After incubation, the cells were washed and tumori-cidal activity was evaluated with an MTT assay. The washed cells were incubated with 0.5 ml of an MTT solution (0.5 mg MTT/ml serum free RPMI media) for 3 hours at 37°C. The solution was then aspirated and the formazan crystals were dissolved in 1 ml of an acidic isopropyl alcohol solution (isopropyl alcohol – 0.04 M HCl). The absorbance of the solution was then measured at 570 nm with a Tecan Infinite M200 plate reader (Männedorf, Switzerland). Cells that were not treated with MTT were used as a blank to calibrate absorbance measurements and untreated cells were used as controls. The cell viability was calculated as equation 3:
Cell Absorbance (sample) – Absorbance (blank) = __________________________ × 100Viability (%) Absorbance (control) – Absorbance (blank)
Statistical AnalysisStatistical differences among groups were determined using a one way ANOVA and individual groups were compared us-ing Student’s t-test. Statistical significance was determined using α = 0.05. Values are represented as the average of three trials and readings in triplicate with a standard error about the mean.
ResultsAcoustic Enhancement and StabilityThe effect of docetaxel loading on the acoustic enhancement and stability was examined. Figure 2a shows the effect of docetaxel loading on the ability of the ultrasound contrast agent to reflect ultrasound, which is measured in decibels relative to the enhancement provided with no contrast agent. Ultrasound contrast agents were loaded with up to 18% docetaxel with no significant drop in maximum acoustic enhancement compared to unloaded control microbubbles (18.38 ± 1.8 dB vs. 21.13 ± 1.1 dB, p = 0.11). However, micro-bubbles loaded with 24% docetaxel showed a significant drop in maximum acoustic enhancement compared to unloaded microbubbles (16.8 ± 1.0 dB vs. 21.13 ± 1.1 dB, p = 0.02).

5PHARMACEUTICAL ENGINEERING November/December 2012
research and developmentUltrasonic Drug Delivery
for ultrasound contrast agents loaded with any of the tested concentrations of docetaxel (0 – 24%) p > 0.5.
Docetaxel Payload and Encapsulation EfficiencyDocetaxel encapsulation was measured using HPLC and is shown in Figure 4a. Final drug payload increased signifi-cantly with each increase in initial loading concentration with a maximum drug payload of 106.9 ± 12.7 µg docetaxel/mg contrast agent corresponding to an initial loading of 24%. The drug payload was used to calculate the encapsu-lation efficiency shown in Figure 4b. Ultrasound contrast agents loaded with 24% docetaxel had an encapsulation efficiency of 40 ± 5%. Ultrasound contrast agents loaded with 18% docetaxel had a final payload of 80.8 ± 2.97 µg and encapsulation efficiency of 40 ± 2%.
In Vitro Docetaxel ReleaseThe release of docetaxel from ultrasound contrast agents loaded with 18% docetaxel was examined in vitro for both insonated and uninsonated microbubbles and is shown in Figure 5. After 6 hours, there was no significant difference in release from insonated compared to uninsonated micro-bubbles (25.8 ± 1.5% vs. 22.5 ± 4.8%, p = 0.5) (20.9 vs. 18.2 µg docetaxel/mg UCA). After 24 hours, significantly more docetaxel had been released from insonated microbubbles compared to the uninsonated samples (40.1 ± 2.1% vs. 30.3 ± 3.7%, (32.4 vs 23.5 µg docetaxel/mg UCA) p < 0.05). After 40 days, a total of 70.2 ± 1.2% (56.7 µg docetaxel/mg UCA) of docetaxel had been released from insonated samples compared to only 57.8 ± 2.8% (46.7 µg docetaxel/mg UCA) of uninsonated samples.
Figure 2. Effect of docetaxel loading on the acoustic enhancement (a) and acoustic stability (b) in vitro of polymer ultrasound contrast agents loaded with 0% , 3% , 6% , 12% , 18% , and 24% docetaxel. A significant decrease in maximum acoustic enhancement was observed in samples loaded with 24% docetaxel (*p < 0.05) while samples loaded with 18% or less showed no significant change. A significant decrease in acoustic stability was observed in all samples loaded with 12% docetaxel or greater (*p < 0.05).
The effect of docetaxel loading on the ultrasound con-trast agents’ stability while exposed to ultrasound also was examined and is shown in Figure 2b. The enhancement decreases over time as the microbubbles pass though the ultrasound beam and the polymer shell is destroyed, gener-ating nanoparticles and allowing the gas core to diffuse into solution. Unloaded microbubbles were able to maintain 78% of their acoustic enhancement after 15 minutes of insonation while microbubbles loaded with 12% docetaxel or greater had significantly lower acoustic enhancement (p < 0.04).
Particle SizeThe effect of docetaxel loading on particle size was examined and is shown in Figure 3. Unloaded ultrasound contrast agents had a peak particle diameter of 1.38 ± 0.12 µm. No statistically significant change in particle size was observed
Figure 3. Effect of docetaxel loading on ultrasound contrast agent size. Unloaded contrast agent had an average diameter of 1.38 ± 0.12 µm with no significant change in size observed with docetaxel loading.

6 November/December 2012 PHARMACEUTICAL ENGINEERING
research and developmentUltrasonic Drug Delivery
Nanoparticle Extravasation PotentialThe leaky vasculature of a tumor was modeled with Corning transwell inserts with a thin membrane containing pores 400 nm in diameter to determine if docetaxel can be forced through the pores when the drug loaded microbubbles are triggered with ultrasound. The delivery of docetaxel through the porous membrane over 20 minutes of insonation was quantified with HPLC and is shown in Figure 6 compared with uninsonated microbubbles. After 5 minutes, significant-ly more docetaxel had been forced through the membrane when the samples were triggered with ultrasound compared to uninsonated controls (p < 0.01). After 20 minutes, nearly three times more docetaxel had been forced through the pores compared to uninsonated controls.
In Vitro Tumoricidal ActivityThe MCF7 human breast cancer cell line was used to de-termine the tumoricidal activity of docetaxel loaded micro-bubbles in vitro. Cells were incubated with insonated and uninsonated ultrasound contrast agents that were loaded
with 18% docetaxel or unloaded controls. After 72 hours, cell viability was measured with an MTT assay as shown in Figure 7. Incubating cells with unloaded ultrasound contrast agent that were insonated or uninsonated had no effect on cell viability for any of the concentrations tested (p = 0.5). However, treating cells with ultrasound contrast agent loaded with 18% docetaxel and triggered with ultrasound was able to cause a significant drop in cell viability at concentrations greater than 0.1 µg ultrasound contrast agent/ml (p < 0.01).
DiscussionA drug delivery platform has previously been developed in our lab in which drugs can be loaded into the shell of a polymer ultrasound contrast agent.29 The agent can be injected intravenously and pass freely through blood vessels and capillaries until triggered with focused ultrasound at the desired target. Ultrasound contrast agents exposed to ultra-sound will experience primary radiation forces which will push the microbubbles towards the vessel wall.19 When the agent is exposed to ultrasound with sufficient intensity, the gas core within the agent will rapidly expand and contract causing the polymer shell to break into polymer fragments less than 400 nm in diameter.30 The energy released by iner-tial cavitation is capable of creating pores in cell membranes and breaking apart cell junctions in blood vessels to enhance the permeability of the tumor blood vessel walls.22 The drug loaded polymer fragments generated by destruction of the microbubble shell can escape the leaky vasculature of the tu-mor and accumulate within the interstitial space of a tumor where they can provide a sustained release of drug as the polymer degrades.
Figure 4.Docetaxel payload (a) and encapsulation efficiency (b) as a function of initial loading concentration. A maximum docetaxel payload of 106.9 ± 22.0 µg docetaxel/mg contrast agent was observed with an initial loading of 24% resulting in an encapsulation efficiency of 40 ± 8%.
Figure 5. In vitro drug release profile from polymer ultrasound contrast agents loaded with 18% docetaxel that were either insonated or uninsonated . After 24 hours, significantly more docetaxel had been released from the insonated samples compared to uninsonated microbubbles (p < 0.05). Inset: docetaxel release over first 6 days.

7PHARMACEUTICAL ENGINEERING November/December 2012
research and developmentUltrasonic Drug Delivery
The beneficial effects of ultrasound contrast agents trig-gered by ultrasound require the docetaxel loaded contrast agents to maintain their acoustic properties. As shown in Figure 2a, ultrasound contrast agents could be loaded with a
maximum of 18% docetaxel without a significant reduction in maximum acoustic enhancement. The over 4 dB drop in acoustic enhancement in contrast agent loaded with 24% docetaxel indicates the formation of particles that are not acoustically active, which could include solid particles or contrast agent with an incomplete shell that will have no beneficial effect when exposed to ultrasound. For this rea-son, an initial loading of 18% docetaxel was chosen for fur-ther examination. A significant drop in acoustic stability was observed when microbubbles were loaded with greater than 12% docetaxel. This drop in acoustic stability also had been observed when loading other drugs, including doxorubicin and paclitaxel, and may be advantageous for ultrasound triggered drug delivery because less stable microbubbles can be destroyed by ultrasound more effectively to generate the nano-sized, drug loaded polymer fragments for accumula-tion in the tumor. Ultrasound contrast agents loaded with 18% docetaxel had a final drug payload of 80.8 µg docetaxel/mg ultrasound contrast agent and an encapsulation efficiency of 40.4%. This payload of docetaxel is more than 12 times greater than the maximum payload of the more hydrophilic chemothera-peutic drug doxorubicin (6.9 µg doxorubicin/mg contrast agent),29 but 38% less than the payload of the more hydro-phobic taxane paclitaxel (128.46 µg paclitaxel/mg contrast
agent).28 This suggests that the loading capacity of these polymer contrast agents is dependent on the ability of the drug to interact with the shell consisting of the hydrophobic polymer poly(lactic acid). In vitro studies have shown the IC50 of docetaxel to be near 100 nM correspond-ing to approximately 80 ng of docetaxel/ml,32 suggesting the docetaxel loaded ultrasound contrast agents are capable of delivering sufficient drug levels to inhibit tumor cell growth. One potential advantage of this delivery vehicle is the ability to provide a sustained release of docetaxel at the tumor as the polymer degrades. The in vitro release profile (Figure 5) shows that more than 51% (41.6 µg docetaxel/mg UCA) of the loaded docetaxel is released over the first 4 days, but a continuous release is observed over at least 40 days with a 1 mg dose being capable of release over 150 ng of docetaxel per day for the first 35 days. It also was observed that the release from insonated microbubbles was more rapid than uninsonated micro-bubbles, which is most likely caused by the increased exposed surface area of the
Figure 7. Tumoricidal activity of docetaxel loaded microbubbles. MCF 7 breast cancer cells were treated with unloaded microbubbles that were not exposed to ultrasound , unloaded microbubbles exposed to ultrasound , microbubbles loaded with 18% docetaxel and not exposed to ultrasound , and microbubbles loaded with 18% docetaxel and exposed to ultrasound . Cell viability 72 hours post treatment showed that unloaded microbubbles had no effect on cell viability while docetaxel loaded microbubbles exposed to ultrasound had significantly greater antitumor activity compared to unloaded bubbles and drug loaded bubbles that had not been exposed to ultrasound at concentrations greater than 0.1 µg contrast agent/ml.
Figure 6. Transport through membranes with 400 nm pores of ultrasound contrast agent loaded with 18% docetaxel that were insonated or uninsonated . After 20 minutes of exposure to ultrasound, significantly more docetaxel had been forced through the pores compared to the uninsonated samples (p < 0.05).

8 November/December 2012 PHARMACEUTICAL ENGINEERING
research and developmentUltrasonic Drug Delivery
microbubbles that have been destroyed by ultrasound. Ultra-sound triggered cavitation also has been shown to generate enough force to fracture polymer chains, which can reduce the polymer molecular weight and enhance the degradation of the drug loaded polymer fragments.33
Docetaxel loaded microbubbles also showed an enhanced transport across 400 nm pores with almost three times more drug being forced through the membrane when triggered with ultrasound compared to uninsonated microbubbles. This in vitro model represents the leaky vasculature of a tumor and is used to demonstrate the ability of the docetaxel loaded ultrasound contrast agent to be triggered and destroyed by ultrasound to create drug loaded polymer frag-ments less than 400 nm in diameter capable of escaping the tumoral blood vessel through these pores. In vitro cell culture studies showed that ultrasound con-trast agents not loaded with drug had no effect on cell viabil-ity while 18% docetaxel loaded ultrasound contrast agents triggered with ultrasound were able to significantly reduce cancer cell viability at concentrations greater than 0.1 µg/ml. This indicates that the tumoricidal activity is caused by the docetaxel and that the docetaxel is still able to kill cells and has not been inactivated by the encapsulation procedure or the insonation of the agent. In conclusion, an ultrasound contrast agent with a poly (lactic acid) shell had been loaded with docetaxel while maintaining the agent’s acoustic properties. The polymer shell can be destroyed when triggered with ultrasound resulting in drug loaded polymer fragments that are capable of passing through the leaky vasculature of a tumor and pro-viding a sustained release of drug for over one month. This formulation has the potential for active treatment with di-minished side effects either alone or in combination therapy for various cancers, including colorectal, ovarian, prostate, liver, renal, gastric, head, and neck cancers.
AcknowledgmentsThis work was funded by the National Institutes of Health (Grant HL-52091) and the National Science Foundation (Grant No. EEC 0649033 DREAM).
References1. Rowinsky, E.K., “The Development and Clinical Utility
off the Taxane Class of Antimicrotubule Chemotherapy Agents,” Annual Review of Medicine, Vol. 48, No. 1997, pp. 353-74.
2. Morse, D.L., H. Gray, C.M. Payne, and R.J. Gillies, “Docetaxel Induces Cell Death Through Mitotic Catas-trophe in Human Breast Cancer Cells,” Mol Cancer Ther, Vol. 4, No. 10, 2005, pp. 1495-504.
3. Diaz, J.F. and J.M. Andreu, “Assembly of Purified GDP-Tubulin Into Microtubules Induced by Taxol and Tax-
otere: Reversibility, Ligand Stoichiometry, and Competi-tion,” Biochemistry, Vol. 32, No. 11, 1993, pp. 2747-55.
4. Montero, A., F. Fossella, G. Hortobagyi, and V. Valero, “Docetaxel for Treatment of Solid Tumours: A System-atic Review of Clinical Data,” Lancet Oncol, Vol. 6, No. 4, 2005, pp. 229-39.
5. Mathew, A.E., M.R. Mejillano, J.P. Nath, R.H. Himes, and V.J. Stella, “Synthesis and Evaluation of Some Water-Soluble Prodrugs and Derivatives of Taxol with Antitumor Activity,” J Med Chem, Vol. 35, No. 1, 1992, pp. 145-51.
6. Engels, F.K., R.A. Mathot, and J. Verweij, “Alternative drug formulations of docetaxel: a review,” Anti-cancer drugs, Vol. 18, No. 2, 2007, pp. 95-103.
7. Bissery, M.C., “Preclinical Pharmacology of Docetaxel,” European Journal of Cancer (Oxford, England : 1990), Vol. 31A Suppl 4, No. 1995, pp. S1-6.
8. Yan, F., C. Zhang, Y. Zheng, L. Mei, L. Tang, C. Song, H. Sun, and L. Huang, “The Effect of Poloxamer 188 on Nanoparticle Morphology, Size, Cancer Cell Uptake, and Cytotoxicity,” Nanomedicine, Vol. 6, No. 1, 2010, pp. 170-8.
9. Yang, M., Y. Ding, L. Zhang, X. Qian, X. Jiang, and B. Liu, “Novel Thermosensitive Polymeric Micelles for Docetaxel Delivery,” J Biomed Mater Res A, Vol. 81, No. 4, 2007, pp. 847-57.
10. Gaucher, G., R.H. Marchessault, and J.C. Leroux, “Polyester-Based Micelles and Nanoparticles for the Parenteral Delivery of Taxanes,” J Control Release, Vol. 143, No. 1, 2010, pp. 2-12.
11. Vaupel, P., “Tumor Microenvironmental Physiology and its Implications for Radiation Oncology,” Seminars in Radiation Oncology, Vol. 14, No. 3, 2004, pp. 198-206.
12. Hashizume, H., P. Baluk, S. Morikawa, J.W. McLean, G. Thurston, S. Roberge, R.K. Jain, and D.M. McDonald, “Openings Between Defective Endothelial Cells Explain Tumor Vessel Leakiness,” Am J Pathol, Vol. 156, No. 4, 2000, pp. 1363-80.
13. Maeda, H., J. Wu, T. Sawa, Y. Matsumura, and K. Hori, “Tumor Vascular Permeability and the EPR Effect in Macromolecular Therapeutics: A Review,” J Control Release, Vol. 65, No. 1-2, 2000, pp. 271-84.
14. Esmaeili, F., M.H. Ghahremani, S.N. Ostad, F. Atyabi, M. Seyedabadi, M.R. Malekshahi, M. Amini, and R. Dinarvand, “Folate-Receptor-Targeted Delivery of Docetaxel Nanoparticles Prepared by PLGA-PEG-Folate Conjugate,” J Drug Target, Vol. 16, No. 5, 2008, pp. 415-23.
15. Ferrara, K.W., M.A. Borden, and H. Zhang, “Lipid-Shelled Vehicles: Engineering for Ultrasound Molecular

9PHARMACEUTICAL ENGINEERING November/December 2012
research and developmentUltrasonic Drug Delivery
Imaging and Drug Delivery,” Acc Chem Res, Vol. 42, No. 7, 2009, pp. 881-92.
16. Sun, C., J.S. Lee, and M. Zhang, “Magnetic Nanoparticles in MR Imaging and Drug Delivery,” Adv Drug Deliv Rev, Vol. 60, No. 11, 2008, pp. 1252-65.
17. Bae, Y., W.D. Jang, N. Nishiyama, S. Fukushima, and K. Kataoka, “Multifunctional polymeric Micelles with Folate-Mediated Cancer Cell Targeting and Ph-Triggered Drug Releasing Properties for Active Intracellular Drug Delivery,” Mol Biosyst, Vol. 1, No. 3, 2005, pp. 242-50.
18. Eisenbrey, J.R. and F. Forsberg, “Contrast-Enhanced Ultrasound for Molecular Imaging of Angiogenesis,” Eur J Nucl Med Mol Imaging, Vol. No. 2010.
19. Lum, A.F., M.A. Borden, P.A. Dayton, D.E. Kruse, S.I. Simon, and K.W. Ferrara, “Ultrasound Radiation Force Enables Targeted Deposition of Model Drug Carriers Loaded on Microbubbles,” J Control Release, Vol. 111, No. 1-2, 2006, pp. 128-34.
20. Ferrara, K., R. Pollard, and M. Borden, “Ultrasound Mi-crobubble Contrast Agents: Fundamentals and Applica-tion to Gene and Drug Delivery,” Annu Rev Biomed Eng, Vol. 9, No. 2007, pp. 415-47.
21. Ferrara, K.W., “Driving Delivery Vehicles with Ultra-sound,” Adv Drug Deliv Rev, Vol. 60, No. 10, 2008, pp. 1097-102.
22. Price, R.J., D.M. Skyba, S. Kaul, and T.C. Skalak, “Deliv-ery of Colloidal Particles and Red Blood Cells to Tissue Through Microvessel Ruptures Created by Targeted Microbubble Destruction with Ultrasound,” Circulation, Vol. 98, No. 13, 1998, pp. 1264-7.
23. Lentacker, I., B. Geers, J. Demeester, S.C. De Smedt, and N.N. Sanders, “Design and Evaluation of Doxorubicin-Containing Microbubbles for Ultrasound-Triggered Doxorubicin Delivery: Cytotoxicity and Mechanisms Involved,” Mol Ther, Vol. 18, No. 1, 2010, pp. 101-8.
24. Ibsen, S., M. Benchimol, D. Simberg, C. Schutt, J. Steiner, and S. Esener, “A Novel Nested Liposome Drug Delivery Vehicle Capable of Ultrasound Triggered Re-lease of its Payload,” J Control Release, Vol. 155, No. 3, 2011, pp. 358-66.
25. Yudina, A., M. de Smet, M. Lepetit-Coiffe, S. Langereis, L. Van Ruijssevelt, P. Smirnov, V. Bouchaud, P. Voisin, H. Grull, and C.T. Moonen, “Ultrasound-Mediated Intracellular Drug Delivery Using Microbubbles and Temperature-Sensitive Liposomes,” J Control Release, Vol. 155, No. 3, 2011, pp. 442-8.
26. Kheirolomoom, A., P.A. Dayton, A.F.H. Lum, E. Little, E.E. Paoli, H. Zheng, and K.W. Ferrara, “Acoustically-Active Microbubbles Conjugated to Liposomes: Char-acterization of a Proposed Drug Delivery Vehicle,” J
Control Release, Vol. 118, No. 3, 2007, pp. 275-84.
27. El-Sherif, D.M. and M.A. Wheatley, “Development of a Novel Method for Synthesis of a Polymeric Ultrasound Contrast Agent,” J Biomed Mater Res A, Vol. 66, No. 2, 2003, pp. 347-55.
28. Cochran, M.C., J. Eisenbrey, R.O. Ouma, M. Soulen, and M.A. Wheatley, “Doxorubicin and Paclitaxel Loaded Microbubbles for Ultrasound Triggered Drug Delivery,” International journal of pharmaceutics, Vol. 414, No. 1-2, 2011, pp. 161-70.
29. Eisenbrey, J.R., O.M. Burstein, R. Kambhampati, F. Fors-berg, J.B. Liu, and M.A. Wheatley, “Development and Optimization of a Doxorubicin Loaded Poly(Lactic Acid) Contrast Agent for Ultrasound Directed Drug Delivery,” J Control Release, Vol. 143, No. 1, 2010, pp. 38-44.
30. Eisenbrey, J.R., M.C. Soulen, and M.A. Wheatley, “De-livery of Encapsulated Doxorubicin by Ultrasound-Me-diated Size Reduction of Drug-Loaded Polymer Contrast Agents,” IEEE Trans Biomed Eng, Vol. 57, No. 1, 2010, pp. 24-8.
31. Cochran, M.C., J.R. Eisenbrey, M.C. Soulen, S.M. Schul-tz, R.O. Ouma, S.B. White, E.E. Furth, and M.A. Wheat-ley, “Disposition of Ultrasound Sensitive Polymeric Drug Carrier in a Rat Hepatocellular Carcinoma Model,” Acad Radiol, Vol. 18, No. 11, 2011, pp. 1341-8.
32. Hernandez-Vargas, H., J. Palacios, and G. Moreno-Bueno, “Molecular Profiling of Docetaxel Cytotoxicity in Breast Cancer Cells: Uncoupling of Aberrant Mitosis and Apoptosis,” Oncogene, Vol. 26, No. 20, 2007, pp. 2902-13.
33. El-Sherif, D.M., J.D. Lathia, N.T. Le, and M.A. Wheat-ley, “Ultrasound degradation of Novel Polymer Contrast Agents,” Journal of Biomedical Materials Research Part A, Vol. 68, No. 1, 2004, pp. 71-8.
About the AuthorsMichael Cochran did his undergradu-ate work at the University of California at Davis where he earned a BS in biomedical engineering. He is currently a PhD candi-date at Drexel University in biomedical en-gineering, focusing on polymer ultrasound
contrast agents for targeted drug and gene delivery. His academic achievements include being awarded the Society of Interventional Radiology Foundation Allied Scientist Re-search Fellowship and first place in the Nano Business Com-mercialization Association competition. He can be contacted by telephone: +1-215-895-1349 or email: [email protected]. Drexel University, School of Biomedical Engineering, Sci-ence and Health Systems, 3141 Chestnut St., Philadelphia, Pennsylvania 19104, USA.

10 November/December 2012 PHARMACEUTICAL ENGINEERING
research and developmentUltrasonic Drug Delivery
Theresa Bustamante is currently study-ing bioelectrical engineering at Marquette University as an undergraduate. She has aided in biomedical engineering research projects at Drexel University and Duke University for ultrasound drug delivery and
dual-depth OCT imaging, respectively. She is on Marquette University’s College of Engineering’s Dean’s List and is also a SMART scholar. She can be contacted by email: [email protected]. Marquette University, College of Engineering, Milwau-kee, Wisconsin 53233, USA.
John Eisenbrey is currently employed as a research fellow at Thomas Jefferson Uni-versity’s Department of Radiology where he focuses on emerging applications of ultrasound contrast agents. He completed his undergraduate degrees in mechanical
engineering and management at the University of Delaware before completing his masters and PhD in biomedical engi-neering at Drexel University. His academic honors include the 2010 Drexel University Best Doctoral Thesis Award in the Physical and Life Sciences Category, and the 2009 Martin Blomley Award for Best Clinical Poster at the 14th European Symposium on Ultrasound Contrast Imaging. He can be contacted by telephone: +1-215-503-5188 or email: [email protected]. Thomas Jefferson University, Department of Radiology, 132 S. 10th St., Philadelphia, Pennsylvania 19107, USA.
Margaret Wheatley is the John M. Reid Professor of Biomedical Engineering at Drexel University. She obtained her un-dergraduate training at Oxford University, United Kingdom, graduate training at Uni-versity of Toronto, Canada, and postdoc-
toral training at MIT, Cambridge, Massachusetts. One cur-rent research interest includes development of ultrasound contrast agent for diagnosis and therapy. Particular focus ar-eas are drug delivery, tumor specific targeting, and contrast agents in the nano scale. Other research areas include design and construction of smart constructs for spinal cord repair. Drexel has acknowledged her contribution by award of the Drexel University Research Achievement Award. She is an elected fellow of AIMBE. She can be contacted by telephone: +1-215-895-2232 or email: [email protected]. Drexel University, School of Biomedical Engineering, Sci-ence and Health Systems, 3141 Chestnut St., Philadelphia, Pennsylvania 19104, USA.

1PHARMACEUTICAL ENGINEERING November/December 2012
president’s message
ISPE – The Pharmaceutical Industry’s Defining Body
ISPE’s President and CEO discusses the importance of maintaining a global perspective, the Society’s focus on becoming the leading force in scientific,
technical and regulatory advancement, and its commitment to better understand company and industry challenges.
T his year I have par-ticipated in member events throughout Europe, Asia and the United States and note with pride that ISPE has Members in more
than 90 countries worldwide. Our re-cent Annual Meeting in San Francisco alone was attended by Members from more than 30 different countries. Throughout all these trips and events, it occurred to me how important it is for organizations like ISPE to maintain a truly global perspective in their planning, communication and activities. In my view, ISPE (not unlike many US-based associations) has had the tendency to appear more “North American” than global and I am certain that the nearly 50% of ISPE Members who live and work in other corners of the world notice that
as well. At the same time, it strikes me that at every meeting, despite the differences in business norms, culture and language, the ISPE Member com-munity is a tremendously successful team that has no competition when it comes to networking, information sharing and problem-solving. We are ignited and connected by a global Membership commitment to high quality pharmaceutical solutions for our patient customers. As your CEO, my job is to help cultivate, maintain and leverage that Member culture, particularly during times when indus-try is facing so many challenges and change.
Looking Ahead – What I see for ISPEEvery industry has a defining body – an organization that carriers the ban-ner, defines the mission and spear-heads the dialog. For the international pharmaceutical industry, ISPE is that organization. In our updated Strategic Plan, one of our objectives is to be less introspective, evolving toward a
more dynamic organization that both leads and serves its Members and industry. Our plans are intended to strengthen ISPE’s focus on relevant global issues and collaboration among Members, companies and regulators, and evolving the Society to be a more contemporary, nimble and purposeful organization. Overall, our goal is to be a leading force in the scientific, techni-cal and regulatory advancement of our industry worldwide, and we look to strategic partnerships with Members to achieve this.
Race for RelevanceOne of the most important words in my last paragraph is the word relevant which is defined as being connected to the matter(s) at hand. The importance of being a relevant professional society is the theme of the book “Race for Relevance” in which authors describe the important transformation that must take place within all membership groups like ISPE. I mention a book that was writ-ten principally for the not-for-profit
Did you know? ISPE is a truly global association with members in 90 countries. How may we help you or your companies? Contact your four ISPE Offices today!
ISPE’s Global Headquarters – Tampa, FL USA
European Office – Brussels, Belgium
Asia-Pacific Office – Singapore
ISPE China Office – Shanghai, China
Reprinted fromPHARMACEUTICAL ENGINEERINGThe Official Technical Magazine Of iSPe
NOvEmBER/DECEmBER 2012, vOL 32, NO 6
©Copyright ISPE 2012
www.PharmaceuticalEngineering.org

2 November/December 2012 PHARMACEUTICAL ENGINEERING
president’s message
world only to communicate that the authors’ recommended transformational approaches mirror the strategic plan-ning approaches underway at ISPE. Over the past year, our strategic planning process included assessing the organiza-tion’s programs, services and activities, and rationalizing the Member market. With consolidation and globalization at the heart of the pharmaceutical industry, ISPE must become more flexible and more responsive to the needs of its broad Membership. One of the ways ISPE will achieve greater relevancy is to better understand the challenges facing companies and industry and respond to those needs with appropriately positioned programs and services. In 2013, ISPE will form a Global Strategic Forum to help build our understanding of future trends and help us plan and reach into the fu-ture. ISPE also will form three new Regional Forums – one focused on Asia, one on Europe and the third on North America. These new Forums will be strategic in their agen-das and populated with local leaders who have knowledge of the region and industry – and a vision for ISPE’s role in that part of the world. The three Regional Forums will include representation by the ISPE Affiliates and Chapters, Commu-nities of Practice, Regulatory Affairs, academia and industry and will be focused on how ISPE can evolve to be more relevant to industry in matters of member communication, continuing education, training and regulatory affairs. Two of the primary motivators for the new Regional Forums are 1. To ensure that ISPE understands and is responsive and reflective of the needs of its Members and 2. To support ISPE in “scaling innovation,” as suggested by Jim Collins in his new book “Great By Choice,” in order to meet our goal of being more strategic and focused on those activities with the greatest relevance. Through pragmatic business planning, we envision becoming more deliberate in our approach to Member needs, moving away from busi-ness practices that have focused on delivering everything to everybody. ISPE will be resourceful and focused and in this stead, we will not mechanically replicate what works well in one region to another, unless that makes sense for the region.
Next Issue: ISPE’s New DirectionIn my next article, I will share more specifics on the Soci-ety’s direction and its new mission to be the leading society for scientific, technical and regulatory problem-solving and information sharing across the pharmaceutical lifecycle. Our value proposition will be to support companies in the integration of development, production, quality and supply chains in the delivery of safe and effective pharmaceutical and biologic medicines. With an end-to-end mission, ISPE members are the innovators, producers, suppliers and the integrators who help to produce and maintain a safe and reliable drug supply.
Save the DateISPE 2013 Conferences
www.ISPE.org
ISPE events offer a wide range of industry- and career-advancing opportunities. Note these topic-specific Conferences!
Sponsorship and Table Top Exhibit Opportunities Available
Critical Utilities Intensive: Cost-Optimization Alternatives for Critical Utilities• 25 – 26 February Tampa, Florida USA
• March Copenhagen, Denmark
Aseptic Conference: Barrier Isolation, Sterilization and Disposables• 4 – 5 March Baltimore, Maryland USA
Executive Forum: Best Quality Practices of World-Class Organizations (Non-Pharma) • 2 – 3 April Philadelphia, Pennsylvania USA
The State of QbD in the Pharmaceutical and Biotech Industries • 10 – 11 April San Francisco, California USA
ICHQ10 Workshop at ISPE China Annual Meeting• 22 – 23 April Shanghai, China
Supply Management Summit • 13 – 14 May Indianapolis, Indiana USA
• June Prague, Czech Republic
Regulatory Compliance• Spring Brussels, Belgium
Redefining the “C” in GMP: Creating, Implementing and Sustaining a Culture of Compliance • 11 – 13 June Baltimore, Maryland USA
Biotechnology 2013: Looking Ahead to the 4th Decade • 26 – 27 August Raleigh, North Carolina USA
• September France
Proactive Compliance: Strategies to Prevent Consent Decree and Other Citations • 14 – 15 October Philadelphia, Pennsylvania USA
Process Validation Conference• 16 – 17 October Philadelphia, Pennsylvania USA
Lean Manufacturing• October Berlin, Germany
2013 Annual Meeting: Quality throughout the Product Lifecycle• 3 – 6 November Washington, D.C. USA
2013 half pg vert_PE.indd 1 10/26/12 10:48 AM
1PHARMACEUTICAL ENGINEERING November/December 2012
ISPE update
Meet Your New BoardThe following Members were elected to positions on the 2012-2013
ISPE International Board of Directors.
OfficersChairCharlotte Enghave Fruergaard is Director of Technolo-gy/Process for NNE Pharmaplan Denmark where she has 18 years of experience with projects focused on pharmaceutical production, isolator and barrier technology and sterilization techniques. She has led or participated in projects through-out the Nordic region, the European continent, in the US, and in Brazil. Fruergaard has been an ISPE Member for 17 years; she is a founding member of the Nordic Affiliate and served on the Affiliate Board of Directors in a variety of roles including Chair. She has been an ISPE conference leader and has participated on the Sterile Products Processing Commu-nity of Practice Steering Committee. She was elected to the ISPE International Board of Directors in 2007. Fruergaard holds an MSc and a PhD in Mechanical Engineering from
Danmarks Tekniske Universitet, as well as an EBA in Engi-neering Business Administration from Copenhagen Univer-sity College of Engineering.
Vice ChairDamian J. Greene is Global Network Strategy Lead for Pfizer Animal Health where he is responsible for the com-pany’s manufacturing and supply network strategy, product sourcing, and long-range capacity planning. Throughout his 29 year career at Pfizer he has held leadership roles in Pfizer’s Global Supply, Manufacturing, Food Sciences and Chemical Divisions where he has been responsible for API operations, product launch, and network evaluation/re-structuring. Damian Greene has been a Member of ISPE for nearly 8 years where he has been involved in the API Com-munity of Practice and has chaired the Community of Prac-tice Council. He was elected to the ISPE International Board of Directors in 2007. Damian Greene holds a BE in Chemi-cal Engineering from University College Dublin, an MSc in Chemical Engineering from the University of Missouri-Rolla, and a Certified Diploma in Accounting and Finance from the Chartered Association of Certified Accountants.
TreasurerBrian H. Lange, PE is Operations Director/PMO, North American Operations and Merck Consumer Care for Merck & Co, Inc. He has been with Merck for more than 24 years and held leadership roles in Manufacturing, Engineering and Quality. Prior to his current role, he spent 12 years in various leadership roles within Vaccine and Sterile Opera-tions, as well as Director of Quality Engineering supporting the Global Vaccine Operations network. Lange has been a Member of ISPE for 21 years and is a past Chairman of the ISPE International Board of Directors. He served on numer-ous International Committees over the years, chairing the Education and Technical Documents Committees, as well as the Chapter Council. He is currently a judge for the FOYA program. In 2012 he was the co-leader of the Future Vision-ing Team and he was also a conference leader for the cGMP Conference held in June. Lange holds a BS in Mechanical Engineering from Villanova University and he is a registered Professional Engineer in the Commonwealth of Pennsylva-nia, USA.
Continues on page 3.
2013 Critical Utilities Conference
ISPE will hold a two-day education intensive confer-ence (25-26 February 2013, Tampa, Florida, USA) that will offer relevant case studies to illustrate alternatives for cost-effective, risk-based approaches to design, construction, and maintenance for critical utilities. Attendees will gain a better understanding of US FDA and international regulatory requirements during panel discussions and understand how to optimize lifecycle costs through interactive workshops. Plenty of networking opportunities will be available.
Featured tracks include:• Alternatives for Pharmaceutical Water and Ozone• Alternatives for HVAC and Process Gases
In addition, delegates will receive one complimentary guide from the following choices: Pharmaceutical Water Systems, Ozone Sanitization of Pharmaceutical Water, HVAC or Process Gases.
Reprinted fromPHARMACEUTICAL ENGINEERINGThe Official Technical Magazine Of iSPe
NoveMBeR/DeCeMBeR 2012, vol 32, No 6
©Copyright ISPe 2012
www.PharmaceuticalEngineering.org

2 November/December 2012 PHARMACEUTICAL ENGINEERING
ISPE update
The Roger F. Sherwood Article of the Year Award recognizes the contribution of authors. Articles are evaluated by a panel of volunteer reviewers according to a number of criteria, concentrating on the importance and timeliness of the subject matter and the quality of the presentation. The criteria for judging includes:
• Is it directly useful to the readers in their efforts to improve the industry and themselves?
• Does it improve knowledge/understanding of key topics? • Is it clear, easy to read? (Low jargon usage)
The finalists for the Article of the Year are chosen from the September/October issue of the previous year, through the July/August issue of the current year. The award program was established to express appre-ciation to all of the authors who submit their work for publication in Pharmaceutical Engineering.
Pharmaceutical Engineering Announces Winner of the Article of the Year Award
November/December 2011volume 31, Number 6
Online Rouge Monitoring: A Science-Based Technology to Measure Rouge Ratesby Nissan Cohen and Allan Perkins
This article presented the implemen-tation and installation of an online rouge monitor which measures in near real-time the rouge rate and rouge accumulation (metal loss) over time helping to determine derouging and passivation frequency based on empirical data.
March/April 2012volume 32, Number 2
Application of Pre-Owned Equipment in Pharmaceutical Manufacturing Operationsby Stephan Sirabian, Bob Matje, Jeff Biskup, and Witold Lehmann
This article presented considerations to be made prior to making a capital investment in pre-owned equipment for new or refurbished pharmaceutical facilities.
P harmaceutical Engineering is pleased to announce that the winner of the 2012 Roger F.
Sherwood Article of the Year is:
January/February 2012volume 32, Number 1
Risk Analysis and Mitigation Matrix (RAMM) – A Risk Tool for Quality Management by Alex Brindle, Steve Davy, David Tiffany, and Chris Watts
This article presented a new type of risk tool. Risk Analysis and Mitigation Matrix (RAMM) was developed to be incorporat-ed into a modern risk manage-ment system and align with latest FDA guidances.
The winner was recognized at ISPE’s 2012 Annual Meeting, 11-14 Novem-ber in San Francisco, California, USA, and selected from the following group of finalists:
September/october 2011volume 31, Number 5
Cleaning Validation for the 21st Century: Acceptance Limits for Active Pharmaceutical Ingredients (API’s): Part IIby Andrew Walsh
This article discussed how to establish true science-based limits using data from clinical and toxicological studies, a risk-based approach to evaluating cleaning validation data, and guidance on setting statistical process control limits from that data.
May/June 2012volume 32, Number 3
Pressure Pulse Approach for Optimized Tank Cooling after Steaming by Magnus Stering, Olivier Chancel, and Luc Pisarik
This article presented an approach for faster cooling after steaming or after hot cleaning in place without the risk of generating vacuum inside the vessel and without the need for any large sized vent filter.
July/August 2012volume 32, Number 4
The Use of Acceptable Daily Exposure (ADE’s) for Managing the Risk of Cross Contamination in Pharmaceutical Manufacturingby Stephanie Wilkins and Julian Wilkins
This article presented a convincing justification for the use of Acceptable Daily Exposures (ADEs) to scientifi-cally manage the risk of cross con-tamination in all types of bio/pharma-ceutical facilities.

3PHARMACEUTICAL ENGINEERING November/December 2012
ISPE update
SecretaryAndrew D. Skibo is Executive Vice President, Operations for MedImmune where he affects changes in manufacturing operations, quality oversight, and cross-functional rela-tions throughout the company. Previously he has worked in other senior leadership roles at Amgen, Genentech, and Foster Wheeler, among others. In these roles he has been responsible for significant aspects of the companies’ opera-tions including engineering, construction, and validation for large-scale capital projects related to bio-pharmaceutical manufacturing. He is a member of the International Leader-ship Forum (ILF), and a member of the Materials Technical Advisory Committee of the US Department of Commerce, specializing in non-proliferation issues associated with biological and chemical weapons. As an ISPE Member for more than 23 years, Skibo has served on the judging panel for the FOYA program, he has been a conference leader, and he participates on several committees. He was elected to the ISPE International Board of Directors in 2011. Skibo holds a BS in Organic Chemistry and an MS in Chemical Engineer-ing, both from MIT.
Past ChairmanArthur “Randy” Perez currently holds the position of Director, IT Risk Management and Compliance for Novartis Pharmaceuticals. His responsibilities at Novartis include a wide range of IT Compliance issues, such as GxP, Sarbanes-Oxley, and data privacy. During his 29-year tenure at No-vartis, he has worked as a chemistry group leader in process research, managed a chemical manufacturing process vali-dation initiative, and ran both a GMP training program and a QA validation group for pharmaceutical operations. Perez has been an ISPE Member for 10 years. He was instrumental in the formation of GAMP Americas and from 2002-2008 he was Chairman of that group. He has been a member of the global GAMP® Council since 2002. He initiated and led the Global Information Systems SIG, who wrote a GAMP® Good Practice Guide that was published in 2005, and was part of the core team that led the development of GAMP® 5, published in 2008. He was elected to the ISPE International Board of Directors in 2005, and he served as Chairman in 2012. Perez earned a BS in Chemistry at MIT and a PhD in Organic Chemistry at University of Michigan.
Re-elected DirectorsJoseph C. Famulare, Senior Director, Global Quality Compliance and External Collaboration, Genentech, USA
Gordon Leichter, PhD, Eastern Regional Sales Manager, Belimed, USA
New DirectorsMichael A. Arnold, Senior Director, Strategic Partner-ships, Pfizer Inc., USA
Jennifer Lauria Clark, CPIP, Technical Services Project Manager, Commissioning Agents, Inc., USA
James A. Durkin, Project Manager, United Kingdom National Health Service, United Kingdom
Directors elected in 2011 to serve a two-year term:James A. Breen, Jr., PE, LEED AP, Vice President, Worldwide Engineering and Technical Operations, Johnson & Johnson’s Supply chain, USA
Timothy P. Howard, CPIP, PE, Vice President and Com-pany Officer at Commissioning Agents, Inc., USA
Doyle R. Johnson, New England Operations Leader, Har-grove Life Sciences LLC, USA
Morten Stenkilde, Director of QA, Novo Nordisk, Den-mark
Udo J. Vetter, Chairman of the Control Board, Vetter Group, Germany
Meet Your New BoardContinued from page 1.
Complete biographical information on all of ISPE’s Directors can be found at www.ispe.org/meet-your-new-board.

4 November/December 2012 PHARMACEUTICAL ENGINEERING
ISPE update
Revised ISPe Guide Focuses on Risk-Based Approach to Testing of GxP Systems
T he first edition of the ISPE GAMP Good Practice Guide (GPG) – Testing was released in 2005. During the years
since the document was written, there has been recent regulatory and indus-try developments focusing attention on patient safety, product quality, and data integrity. In an effort to address these developments, ISPE is expected to publish in December the ISPE GAMP GPG: A Risk-Based Approach to Testing of GxP Systems, a revision of the first edition on this topic. The revised Guide also has been updated to align with the concepts and terminology of GAMP® 5 and associ-ated GAMP guidance. GAMP 5 and associated GPGs aim to provide guid-ance to achieve computerized systems that are fit for intended use and meet current GxP regulatory requirements, by building upon existing industry good practice in an efficient and effec-tive manner. The revised Guide builds on the framework described in GAMP 5 and provides detailed guidance on testing GxP systems. The approach and terminology used in this Guide are generally har-monized with the following industry guidance:
• International Conference on Harmonization (ICH) Guidance including Q8, Q9, and Q10
• ASTM Standard E2500-07, Standard Guide for Specification, Design, and Verification of Phar-maceutical and Biopharmaceutical Manufacturing Systems and Equip-ment
• EU GMP EudraLex Volume 4 An-nex 11 and Chapter 4 revisions
This edition of the Guide has also been aligned with advances in indus-try best practice, including:
• Increased adoption and imple-mentation of Process Analytical Technology (PAT) and Quality by Design (QbD)
• Increased industry focus on risk-based approaches
• Increased use of non-linear devel-opment life cycles
• Increased use of automated test tools
This Guide has been written to provide regulated organizations and suppliers with pragmatic guidance on the testing of computerized and software based systems that impact patient safety, product quality, and data integrity. The key objective of this Guide is to encourage regulated organizations and suppliers to work together to ensure sufficient test coverage to guarantee fitness for intended use, while mini-mizing any duplication of effort. The Guide seeks to identify the testing that should be performed and the associated level of documenta-tion. Where suppliers’ systems do not
meet the expectations of a regulated organization, the Guide identifies suitable risk control strategies. These strategies can include the execution of additional testing, or the selection and use of alternative suppliers or prod-ucts, by the regulated organization.This Guide intends to provide prag-matic answers to questions such as:
• Why should I test?• What should I test?• How much testing is enough?• How should I conduct tests?• How should I document my test-
ing?
Specifically, this Guide is intended to take a risk-based approach to compli-ance of GxP computerized systems and provide practical advice on the application of this approach in the planning and execution of testing.
The Guide is intended to assist:• Regulated organizations (the phar-
maceutical customer or regulated user organization contracting a supplier to provide a product)
• Suppliers (usually external third parties, but also including “in-house” providers of IT services) including:
- suppliers of standard products - systems integrators responsible
for configuration and coding of standard product to create a specific application
- suppliers of control systems that are packaged with the process equipment
- service providers• regulatory agencies
Anticipated release is December 2012. This Guide is available for pre-order at www.ISPE.org/Guidance-Documents.

5PHARMACEUTICAL ENGINEERING November/December 2012
ISPE update
World Class Directory Benefits Buyers,
Suppliers, and Industry
L aunched earlier this year, the international ISPE Buyers Guide is a free resource for both pharmaceutical profes-sionals seeking technical products and services and for
suppliers who want international exposure. Currently, there are more than 500 listings of suppliers from 35 countries worldwide, allowing for an increased op-portunity for a buyer to find the equipment or service they need on an international level. Listings include suppliers in emerging markets such as India, China, and Brazil, giving ISPE Buyers Guide users direct contacts in local markets where they are likely to be building facilities. It is also an economical way for suppliers to reach poten-tial customers on a global scale, according to John Phillips, ISPE Director of International Sales. “The supplier com-munity represents 40% of ISPE’s Membership. Marketers these days, more than ever, are looking for more economical ways to reach potential customers on a global scale. Our international Buyers Guide helps achieve this by offering detailed standard listings free of charge, as well as a variety of upgrades for enhanced exposure.” While the Buyers Guide reaches more than 20,000 ISPE Members from 90 countries worldwide, an individual does not have to be a Member of ISPE to have access to the direc-tory and search for suppliers, nor does a supplier need to be a Member of ISPE to submit a listing.
“Ultimately, the directory contributes to industry by making
it easier for suppliers and potential customers to connect to build
innovative, cutting-edge facilities that improve regulatory compliance, product quality, and patient safety,”
said Phillips.
The international ISPE Buyers Guide can be found online at www.ISPE.org. A printed copy of the Buyers Guide will be included in the next issue (January/February 2013) of Pharmaceutical Engineering.
ISPe Releases New Knowledge Briefs
K nowledge Briefs are concise summary documents that provide easy-to-read overviews of issues, processes, and technologies impacting the contemporary pharmaceuti-
cal industry. Knowledge Briefs are intended to help industry professionals of all levels and disciplines get up-to-speed quickly on a particular topic and are categorized as Funda-mental, Intermediate, or Advanced. Each brief includes links to additional ISPE resources, such as technical documents, Pharmaceutical Engineering articles, webinars, Communities of Practice, and educational seminars and training courses to provide more specific and detailed information on the subject. Knowledge Briefs are available for immediate download. They are free to ISPE Members, $5 US / €3 to non-Members. The following are the latest additions to the ISPE Knowledge Briefs library:
Packaging Equipment: Blow/Fill/Seal (B/F/S) Technologyby Andrew W. GollLevel: FundamentalThis Knowledge Brief provides a basic introduction to B/F/S technology and discusses how it may be suited for pharma-ceutical liquid filling applications. It also provides a basic guidance for what is required to install a system and what complementing utilities, cleanrooms, environmental condi-tions, and inspection equipment may be considered.
Environmental and Financial Benefits of Single-Use Technologyby Wayne Flaherty and Pietro Perrone, PELevel: IntermediateThis Knowledge Brief highlights the options available when considering single-use products and what financial advan-tages can result. Overall use of the products is covered, with a focus on the handling of the products after use.
ISPe Publishes Concept Paper on Controlled Temperature Chamber
MappingI SPE published a Concept Paper that describes good practices for the mapping of controlled temperature chambers, warehouses, and refrigerated storage areas used in the pharmaceutical and biopharmaceutical in-dustries. The Concept Paper and relevant information can be found on the Packaging COP Resources page.

1PHARMACEUTICAL ENGINEERING November/December 2012
classified advertising
Architects, Engineers, Constructors
CRB, 7410 N.W. Tiffany Springs Pkwy., Ste. 100, Kansas City, MO 64153. (816) 880-9800. See our ad in this issue.
NNE Pharmaplan, Nybrovej 80, 2820 Gentofte, Denmark. +45 4444 7777. See our ad in this issue.
Pharmadule Morimatsu AB, Dan-vikCenter 28, SE – 131 30 Nacka, Swe-den. +46 (0)8 587 42 000. See our ad in this issue.
Consulting
Hyde Engineering + Consulting, Inc., 6260 Lookout Rd., Ste. 120, Boulder, CO 80301. (303) 530-4526. See our ad in this issue.
NNE Pharmaplan, Nybrovej 80, 2820 Gentofte, Denmark. +45 4444 7777. See our ad in this issue.
Dust Collection Systems and Equipment
Camfil Farr APC, 3505 S. Airport Dr., Jonesboro, AR 72401. (866) 530-5474. See our ad in this issue.
Electric Dry Steam Generators
Employment Search Firms
Jim Crumpley & Associates, 1200 E. Woodhurst Dr., Bldg. B-400, Spring-field, MO 65804. (417) 882-7555. See our ad in this issue.
Instrumentation
Bürkert, Christian-Bürkert-Strasse 13-17, D-74653 Ingelfingen, Germany. +49 (0)7940 10 0. See our ad in this issue.
GE Analytical Instruments, 6060 Spine Rd., Boulder, CO 80301. (800) 255-6964. See our ad in this issue.
Particle Measuring Systems, 5475 Air-port Blvd., Boulder, CO 80301.(800) 238-1801. See our ad in the issue.
Pumps
Alfa Laval, Inc., 5400 International Trade Dr., Richmond, VA 23231. (804) 222-5300. See our ad in this issue.
Pumps (continued)
Fristam Pumps USA, 2410 Parview Rd., Middleton, WI 53562. (800) 841-5001. See our ad in this issue.
Software Simulation and Processing Systems
Intelligen, Inc., 2326 Morse Ave., Scotch Plains, NJ 07076. (908) 654-0088. See our ad in this issue.
Sterile Products Manufacturing
Tray Systems
Hurst Corp., P.O. Box 737, Devon, PA 19333. (610) 687-2404. See our ad in this issue.
Validation Services
Commissioning Agents, Inc., 1515 N. Girls School Rd., Indianapolis, IN 46214. (317) 710-1530. See our ad in this issue.
ProPharma Group, Inc., 10975 Benson Dr., Ste. 330, Corporate Woods Bldg. 12, Overland Park, KS 66210. (888) 242-0559. See our ad in the issue.
Water Treatment and Purification
ELETTRACQUA Srl, Via Adamoli 513, 16141 Genova, Italy. +39 0108300014. See our ad in this issue.
MAR COR Purification, 4450 Town-ship Line Rd., Skippack, PA 19474. (484) 991-0220. See our ad in this issue.
MECO, 12505 Reed Rd., Ste. 100, Sug-ar Land, TX 77478. (800) 421-1798. See our ad in this issue.
ESTABLISHED 1952
Clean Steam Generatorsfor Pharmaceutical [email protected] Free: 1-866-617-0764
3257R ELS 2.125x1_Layout 1 3/19/12 11:52 AM
Reprinted fromPHARMACEUTICAL ENGINEERINGThe Official Technical Magazine Of iSPe
NovembeR/DecembeR 2012, vol 32, No 6
©copyright ISPe 2012
www.PharmaceuticalEngineering.org

2 November/December 2012 PHARMACEUTICAL ENGINEERING
advertiser’s index
AlFA lAVAl ................................................... 100
BurkErT ......................................................... 23
CAMFIl FArr APC ............................................ 2
CoMMISSIonInG AGEnTS InC ....................... 7
CrB .................................................................... 3
ElETTrACquA Srl ........................................ 21
EMErSon ProCESS MAnAGEMEnT ............ 91
FrISTAM PuMPS uSA .................................... 99
GE AnAlyTICAl InSTruMEnTS .................... 29
HurST CorP .................................................. 19
HyDE EnGInEErInG + ConSulTInG InC .... 65
InTEllIGEn InC .............................................. 27
JIM CruMPlEy & ASSoCIATES..................... 96
MAr Cor PurIFICATIon ............................... 35
MECo ................................................................. 5
nnE PHArMAPlAn ................................... 50, 51
PArTIClE MEASurInG SySTEMS InC ......... 37
PHArMACEuTICAl onlInE ........................... 63
PHArMADulE MorIMATSu AB..................... 47
ProPHArMA GrouP ..................................... 11


![Respecifying Globalization [Globalization In Practice] 2014](https://img.dokumen.tips/doc/110x75/631e105c05964b686800a1bd/respecifying-globalization-globalization-in-practice-2014.jpg)


