Embed Size (px)
Citation preview

INTRODUCTION
Every nation is vigorously seeking the systematic pathways to assess their health system performance and benchmark the performance
against other nations. It has been recognised that without measuring their health system performance, it is challenging to recognize
whether they are delivering good or bad service practice. Not only will it be impossible to plan for health system reforms, it will be
difficult to safeguard patients or payers. Most importantly, it will be unclear which area of health needs maximum expenditure. Many of
the international organisations such as OECD, WHO, European commission, the Common Wealth fund, and even nations individually
are developing ways to compare the performance of health systems on international level but they are still in the early stage of their
efforts. There are many challenges regarding how to the design and implement the comparison schemes (Papanicolas & Smith, 2013).
Besides this, it is important to compare the health systems internationally as it gives insight to one’s own health system and assesses the
strengths and weaknesses of the system. By reviewing other health systems, one country may have the opportunity to learn from others
and in turn improve their system by making new amendments to their models of care. The comparison also provide the comprehensive
perspective for policy makers, researchers, and also the public. Therefore, being aware of achievements and setbacks of other nations, It
may enlighten how new policies, preventive measures, and health interventions are established and implemented in one’s own country.

The comparison of health care management in two different countries might help identify the factors needed to boost up the role of the health
care systems in these and other countries that are burdened with high mortality rate, low health status and other related issues. The essay
welcomes an opportunity to perform a comparative study on Australia and Canada, in reference to its performance in health care sector. The
reason to choose these provinces is that these countries have played a key role in developing a new model in health care organisation.
2.FUNDING SYSTEM and GOVERNANCE
FIGURE 1:
ROLE OF GOVERNMENT FINANCING
PUBLIC SYSTEM
PRIVATE
INSURANCE
(main benefits; cost-
sharing; non covered
aids; private services;
alternatives for public
insurance)
COST SHARING
CAPS
LOW INCOME
PROTECTION AND
EXEMPTION
AUSTRALIA Administered regionally,
collaborative (state and federal)
public hospital funding
Universal medical public
insurance(Medicare)
General tax income;
reserved income tax
47.3% purchase
optional (optometry,
dental care and private
hospitals) and add-on
coverage (amplified
choice, sooner access
for nonemergency
facilities,
reimbursements for
selected services)
Caps for
pharmaceutical OOP
disbursement only,
reliant on the revenue
and total OOP
disbursement in the
same year
Older people and low
income: Lesser cost-
sharing; lesser
pharmaceutical OOP
cap and minor OOP
maximum for 80%
Medicare facilities
refund

In Australia, both the government and the private based health organisations exist, which provide a wide range of services worldwide
(Eijkenaar, Emmert, Scheppach, & Schöffski, 2013).This country has six states and two territories. The country provides free medical treatment
and financial assistance, since the introduction of “Medicare”, in 1984 (Walls et al., 2012). The universal taxation system funds most of these
services (Bourke, Humphreys, Wakerman, & Taylor, 2012).Australia is a federated system with equal division of power between the state and
central government in health care related matters (Mossialos et al., 2015). Australia is having a commonwealth government, to support the
revenue for fiscal transfers and the health care system, with the main authority being the government in raising the revenue (Papanicolas et al.,
2013). The “five- year health agreements” have consolidated improved the commonwealth powers.
The health care system in Australia is versatile with its equal distribution of its role and responsibilities in different states of the country
(Oderkirk, Ronchi, & Klazinga, 2013).There is a complex interplay of services in private and public organisation. In Australia, 52 % of the
elderly population (above 65 years) possess health insurances, which are estimated to be 1.84 million.
In Canada, there exist a public funded and a cost free health care system. Private institutions provide most of the medical services
(Schäfer et al., 2015)The quality assurance of the care delivered comes from the government through its federal standards (Schäfer et al., 2015).
CANADA Provincially ordered universal public
insurance program that devices and funds
(mainly private) provision
Federal /provincial
tax income
67% purchase
optional coverage for
non-covered benefits
(e.g. Dental care,
prescribed drugs,
private rooms,
optometry)
NO No cost sharing for
publically enclosed
facilities; shield for
low-income people
from prescription
expenses

There is no data collection on a daily basis pertaining to the individual’s health. The health administration maintains its simplicity by
maintaining the provision of cost effective services based on the Medicare system (Nicholson, Jackson, Marley, & Wells, 2012)Out of the total
health care associated finances, 30% accounts for the private health expenditure. Canada follows a “Single-payer healthcare system” (Janssen,
2013).In this system, the state does not pay the cost of the healthcare rather it is taken care by the private insurers. Public as a whole or in part
financially supports the single-payer system (Walls et al., 2012). Overall provinces continue to dominate in Canada with new emerging model
for taking national initiatives.
In Canada, there exists a federal based governance system (Schäfer et al., 2015). Although one can expect the governance to have centralised
characteristics, the actual scenario is somewhat opposite. The country’s provincial government system deals with formulating laws and
regulations specifically for a region. On the other hand, the federal system governs the whole province (Foroughi, Lam, Lim, Saremi, &
Ahmadvand, 2016).The governance system of Australia and Canada has evolved to be similar.
Cost Sharing Caps: Out-of-pocket costs represented for 18 % of total health expenses in 2013–2014in Australia. The prime share (38%) was for
prescriptions, dental care (20%), referred or non-referred private medical services. But there are no cost sharing caps available in Canada.
Safety net: Medicare services are reimbursed. There is low cost sharing for older and low income people, lesser pharmaceutical OOP cap and
minor OOP maximum for 80%in Australia. However, in Canada, no cost sharing for publically enclosed facilities. There is protection for low
income people for prescription expenses

GOVERNANCE SYSTEM
Source:(Mossialos, Wenzl, Osborn, & Anderson, 2015)
3.Selected Population Health Indicators
(a)Maternal Mortality Rate
Maternal mortality is defined by WHO as the death of mother while pregnancy or after 42 days of delivery, from any cause related to pregnancy
or its management, but not from accidental or incidental issues. The low rate of maternal mortality depicts the social, educational, and healthy
life styles of the women. It also reflects the quality care and effectiveness of the health system
country Body Constitutes of Responsibilities DATA SOURCES Australia COAG-Council of Australian
Government
Prime minister and first
ministers of state
Funding
Policy
Changes in
responsibilities
Federal department of health
oversee policies such as MBS
and PBS
ABS
AIHW
Canada Because of the high level of
decentralization, provinces
have primary jurisdiction over
administration and governance
of their health systems.
The federal ministry of health,
Health Canada, plays a part in
encouraging overall health,
disease surveillance and
control, food and drug safety,
and medical device and
technology review.
The Public Health Agency of
Canada is responsible for
public health,
The Canadian Institute for
Health Information
Statistics Canada

FIGURE 2:
Trends in estimates of maternal mortality ratio (MMR; maternal deaths per 100 000 live births) and progress towards MDG 5A, by
country, 1990–2015
Countrya
MMRb
% change in
MMR
between
1990 and
2015c
Average
annual %
change in
MMR
between
1990 and
2015
Range of uncertainty
on annual % change in
MMR (80% UI)
Progress
towards
MDG 5Ad
1990
1995
2000
2005
2010
2015
Lower
estimate
Upper
estimate
AUSTRALIA 8
8
9
7
6
6
25.0
1 .3
0.1
2.0
NA
CANADA 7 9 9 9 8 7 0.0 0.3 -0.9 1.6 NA
(Source: “Trends in Maternal Mortality: 1990 to 2015Estimates by WHO, UNICEF, UNFPA, World Bank Group and the United Nations
Population Division", 2016)
FIGURE 3: Maternal Mortality Rate (per 100,000live births), 2015
(Source:(WHO &
UNICEF, 2016)
Country Year 2015
Australia 6(5-7)
Canada 7(5-9)

The FIGURE 3 shows the trends of mortality ratio for Canada and Australia from the last two decades till 2015.If we look at Australia table, it
clearly shows that there are less maternal deaths as the years are progressing. It means Australia, so far, controlled the situation. However, in
Canada maternal mortality ratio was a bit higher and constant in the middle of two decades and improved on it by 2015, however still higher
than Australia.
(B)INFANT MORTALITY RATE
Infant mortality rate was the next health indictor used to compare both the countries. It refers to number of deaths per 1000 live births
occurring before an infant completes one year (Janssen, 2013). It depicts the effect of social and economic conditions on the health of new
born babies and mother, life styles and social environment and effectiveness of the health systems.
According to WHO, from last five years, it has been indicated that both Australia and Canada have the same frequency (1) of neonatal deaths per
thousand births. However, when it comes to the neonatal mortality rate, Australia is improving every year by margin of 1 which is the same for
Canada. Australia recorded 2.2 neonatal mortality rate by 2015 still better from Canada which recently recorded as 3.2 by 2015. Over all,
Australia has got less infant mortality rate as compared to Canada.

FIGURE 4:
(SOURCE :(WHO, 2015)http://apps.who.int/gho/data/node.country.country-AUS?lang=en
FIGURE 5:
Canada Canada Canada Canada Canada
Indicator 2015 2014 2013 2012 2011
Number of neonatal deaths (thousands) 1 1 1 1 1
Neonatal mortality rate (per 1000 live births) 3.2 [2.6-3.9] 3.3 [2.8-3.9] 3.4 [2.9-3.9] 3.5 [3.1-3.9] 3.6 [3.2-4.0]
(SOURCE: WHO,2015)http://apps.who.int/gho/data/node.country.country-CAN?lang=en
FIGURE 6:
COUNTRY NEONATAL mortality rate 2015
PER 1000 live births
Number of neonatal deaths(thousands)
Australia Australia Australia Australia Australia
Indicator 2015 2014 2013 2012 2011
Number of neonatal deaths (thousands) 1 1 1 1 1
Neonatal mortality rate (per 1000 live
births)
2.2 [2.0-2.4] 2.3 [2.1-2.5] 2.4 [2.3-2.5] 2.5 [2.4-2.6] 2.6 [2.5-2.8]

Australia 2.2(2.0-2.4) 1
Canada 3.2(2.6-3.9) 1
(d) Life expectancy
The other indicator for describing the health condition of the population is Life Expectancy at Birth. It indicates the mortality rate of the
population (Marchildon, 2013). It determines the life span of the individual as per their age and specific rate of death. It has been found that life
expectancy is increasing 3-4 month per year. This longevity depicts better education, healthy lifestyles and improvement in health care. This
parameter has improved for the public in Australia.
FIGURE 7: Life Expectancy at Birth (years) 2015
Country Both sexes Female male Healthy life expectancy at
birth(years)
Australia 82.8 84.8 80.9 71.9
Canada 82.2 84.1 80.2 72.3
(SOURCE: WHO,2015) http://apps.who.int/gho/data/node.main.688?lang=en
The figure 7 shows the recent data (WHO,2015) for life expectancy at birth for both sexes, female and male individually and healthy life
expectancy for both of the countries. Overall life expectancy at birth (both sexes) is higher in Australia than Canada. Females and males in
Australia has life expectancy of 84.8 and 80.9 respectively which is little bit high than Canadian females (84.1) and males (80.2). However,
besides the reasonable life expectancy of Australians, they do not have healthy life expectancy as of Canadians as mentioned before, the poor
health conditions of the aboriginals in Australia may be one of the reason for this.
4.Health status
Health status is a holistic concept that is determined by more than the presence or absence of any disease. It is often summarised by life
expectancy or self-assessed health status, and more broadly includes measures of functioning, physical illness, and mental wellbeing
(AIHW,2015). As per (Marchildon, 2013) Australia is recognised to be “one of the healthiest countries” in the world. The rate of diseases and
associated death occurs rarely in this country(Lecours & Béland, 2013).
(a)Low birth weight

A key indicator of baby’s survival and determinant of healthy life later is the birth weight(AIHW, 2015) . Low birth weight is defined as when
new born baby is under 2500 gms. It is one of vital indicator and has close relationship with infant mortality and morbidity.
FIGURE 8: Australia low birth rate, (2013)
SOURCE: ABS,2015
FIGURE 9: Low birth weight rates
Canada (2009-2011)
(SOURCE: (StatisticsCanada, 2014c)
http://www12.statcan.gc.ca/health-sante/82-213/Op2.cfm?Lang=eng&TABID=0&IND=R&SX=FEMALE&LINE_ID=2550&change=no&S=9&O=A
Low birth weight Proportion of low birth weight
Both sexes 6.4%
Males 5.9%
females 6.9%
2009 2010 2011
BOTH SEXES 6.1% 6.2% 6.1%
MALES 5.7% 5.7% 5.7%
FEMALES 6.4% 6.7% 6.5%

According to ABS (2015), the national health survey conducted in 2015 reported that, In Australia, 3,355 gms were the mean birth weight of
the live born as reported in 2013. Most of the baby’s born with normal birth weight (92%) whereas 6.4 % born with low birth weight. It has also
reported 1.6% of babies born with high birth weights(Hilder, Zhichao, Parker, Jahan, & Chambers, 2014).
In case of Canada, the latest data available for low birth weight is of year 2011. Of course, it will hinder the effectiveness of comparison but it
will not deviate much of the average of the last 2years. Both of table above shows that males in both countries are tend to have lower rate of
low birth weight as compared to females and males constitute 5.7 % (as of 2011) constant from last three years for Canada and 5.9 % for
Australia. While, females have high rates of low birth weight which constitutes 6.5 % (as of 2011) and 6.9% for Canada and Australia
respectively. The situation for both of the countries is more or less same.
(b)Obesity
Since last three decades, there is a growing incidence of “obesity and associated complications” in Australia (Foroughi et al., 2016).
As per figure 10 below obesity rate among adults in Australia (28.3%) was higher than Canada (25.8%) in 2013(OECD, 2015).
FIGURE 10

Reports of national health survey(ABS, 2015e), in Australia shows that there was intensification in prevalence of overweight and obesity in adults (over 18 years) in Australia
from 1993 (56.3%) to 2011-12 (62.8%). However, no significant inflation between 2011-12 and 2014-15. In 2014-15, men overweight or obese were 70.8% and women
56.3%. it has also been found that rates of obesity and overweight rise with the age. In Men, older than 45 years almost 4 out of 5(79.4%) were obese or overweight, whereas
2 out of 3 females were obese or overweight of same age. Likewise, in Canada, according to recent self-reported survey report of adults (StatisticsCanada, 2014e) ,men were
more obese as compared to women with significant rise of 20.1%(2013) to 21.8 %(2014) and it is highest obesity rate for men recorded since 2003. In case of women, the
obesity rate in 2014 was 18.7% and significantly increased over the time. Self-report survey of height and weight of Canadian adults in 2014 classified them as overweight
was 40% for men and 27.5 % account for women. The rate for men who were overweight remain same as 2012 but less from 41.9% in 2013. Women overweight rates has
been steady since 2003.Converse to Australia, it has been found in Canada that obesity rate remains the same for men and women with increasing age. Overall, men in both
countries have higher rate of obesity as compared to females. But Australia has highest rate of obesity than Canada.

(C)Diabetes
FIGURE 11 :SOURCE: STATISTICS CANADA , 2014a FIGURE 12 SOURCE: (ABS, 2015c)
The major concern in Canada remains to be diabetes, which is leading towards the “third highest rate of mortality” (Tchouaket, Lamarche,
Goulet, & Contandriopoulos, 2012). According to ABS 2014-15, 5.1 % (1.2 million people) of the Australian people had diabetes, it got
inflated significantly as it was 4.5 %(840,000) people in2011-12. There was inflation in type 2 diabetes that intensified to 4.4 %in 2014-15
from 3.8% in 2011-12. Type 1 diabetes was also escalated significantly in 2014-15 and constitutes 0.7 %(158,900) people of the population

which was 0.5% in 2011-12. Australian men (5.7%)had more diabetes as compared to women (4.6%) in 2014-15. One in five people of 75 years
of age had diabetes in 2014-15. The condition of Canada is worse than Australia as 7.4 % (20 -79 years) of the population in Canada had
some type of diabetes. According to Statistics Canada in 2014, 2,011,347 people had some type of diabetes in Canada which was higher than
Australia. In Canada, same as Australia, men (1,120,432) has got more diabetes as compared to women. The highest prevalence of diabetes was
in the age group 64 or older which was quite similar in Australia(StatisticsCanada, 2014b).
(D)Asthma
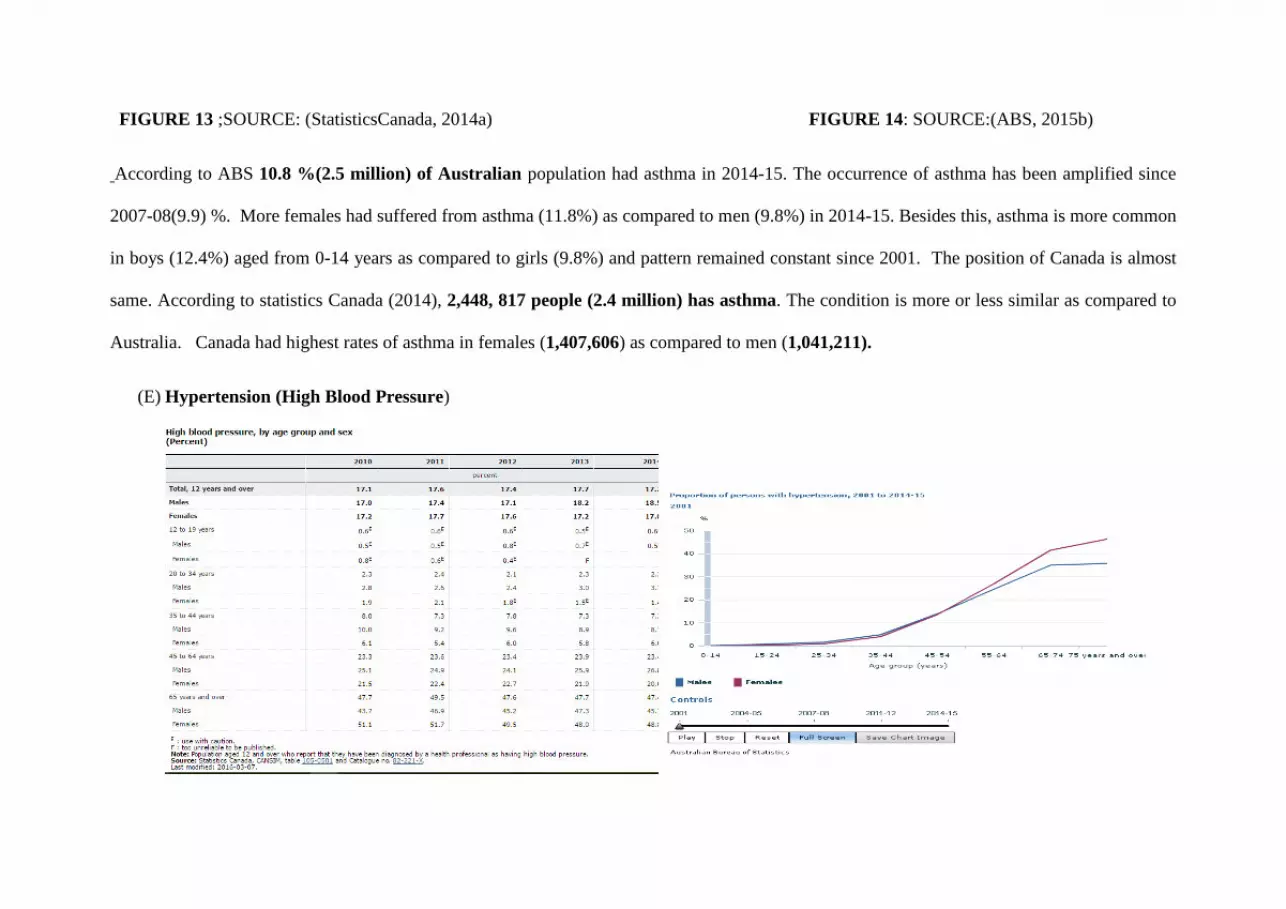
FIGURE 13 ;SOURCE: (StatisticsCanada, 2014a) FIGURE 14: SOURCE:(ABS, 2015b)
According to ABS 10.8 %(2.5 million) of Australian population had asthma in 2014-15. The occurrence of asthma has been amplified since
2007-08(9.9) %. More females had suffered from asthma (11.8%) as compared to men (9.8%) in 2014-15. Besides this, asthma is more common
in boys (12.4%) aged from 0-14 years as compared to girls (9.8%) and pattern remained constant since 2001. The position of Canada is almost
same. According to statistics Canada (2014), 2,448, 817 people (2.4 million) has asthma. The condition is more or less similar as compared to
Australia. Canada had highest rates of asthma in females (1,407,606) as compared to men (1,041,211).
(E) Hypertension (High Blood Pressure)

FIGURE 15 :Source:(StatisticsCanada, 2014d) FIGURE16: source:(ABS, 2015d)
country Of total population Males females
Australia 11.3%(2.6 million) 12.0% 10.7%
Canada 17.7% 18.5% 17.0%
According to ABS 2014-15, 11.3%(2.6 million) of Australian population reported hypertension. The more prevalence amongst the men
(12.0%) as compared to females (10.7%). over the past decade rate of hypertension remained stable (10.7% in 2004-05). As the occurrence of
hypertension increases with aging, 45.5% of all people aged 75 years or more reported hypertension. According to statistics Canada, 17.7 % of
people reported hypertension in 2014, which is quite higher than Australia and it further constitutes 18.5 % of males and17.0% of females.
There was significant drop of hypertension amongst females from last 3 years in Canada which was 17.7 % in 2011. Overall, Australia is so far
in better condition than Canada in terms of prevalence of hypertension.
(F)Cancer
All cancers incidence ,2012

country Total Men women
Australia 323.0 373.9 278.6
Canada 295.7 320.8 277.4
Cancer mortality rates ,2013 age standardised per 100 000 population
country Total Men Women
Australia 197.7 251.3 157.3
Canada 207.5 248.7 177.9
Source: OECD Health Statistics 2015, http://dx.doi.org/10.1787/health-data-en (extracted from WHO).
Though Australian male’s mortality rate was high than Canada, overall Australia was less than the average of OECD countries. As tables above
show that cancer incidences were more in Australia but overall mortality rates were less than Canada. It depicts quality care and efficiency of
Australian health systems.
According to (ABS, 2015a), 1.6% of the Australian population was suffering from cancer in 2014-15 and the rates of cancer remained stable over the past
fifteen years (1.4% in 2001). The most prevalent type of cancer was skin cancer which constitutes (30.3%). Largely, 1.7% of males and 1.5 % of females

had cancer as reported in 2014-15. With the ageing, men used to have higher chances of cancer. 10.9% of 75 and older of age have reported cancer.
According to Canadian cancer statistics (2015), approximately 2 out of 5Canadians have chances to develop cancer in their life and about 1 out of 4 Canadian
will die because of cancer. It was estimated that 196,900 will develop cancer in 2015 and 78,00 will die because of cancer. Lung cancer (51%) will be one of
the prominent cancer that will lead to more deaths of Canadians(Canadian Cancer Statistics 2015).
6.Performance measurement
GDP
Australia is spending 9.8 % of its GDP on health which is comparatively less than Canada that is spending 10.9 %. In 2013-2014, with the rise of
3.1% from 2012-13, total health expenditure accounted 9.8%of GDP in Australia. About 2/3rd (67.8%) of this expenditure derived from 2012-
13(Australian Institute of Health and Welfare [AIHW], 2015). In case of Canada, the GDP spent on health is just a little higher than Australia. It
has been estimated that total and public health expenditure accounts 10.9% and 8.0% of the GDP respectively, in 2015. It reveals that 70.7% of
total health expenditure originates from the public sources (Canadian Institute for Health Information (2015a).

FIGURE 17 : INTERNATIONAL RANKING OF HEALTH SYSTEMS SOURCE:(Davis, Stremikis, Squires, & Schoen, 2014)
Though Canada is spending more GDP than Australia, but still Australia is ranked 4 in overall health system rankings. It means Australian health
system is more efficient. In terms of efficiency Australia is leading and ranked at 4 whereas Canada ranked 10. However, they both lack behind
when compared with other countries in terms of their advancement in health sector. Both these provinces must enhance their medical care
services, as health is the foundation of healthy nation. Australia ranks higher than Canada in all of the indicators but is lower than Germany and
U.S.

FIGURE 18: QUALITY CARE INDICATORS SOURCE:(OECDindicators, 2015)

Figure 19: results
of comparison on
different
indicator s
√ depicts
good
performance
× depicts
relatively low
performance
Colour
green on both
side shows
approximate
same condition
In terms of the quality care ( figure 17) Australia ranked 2 in overall and Canada ranked at 10(Davis et al., 2014) . Further the quality care is
fragmented into effective care, safe care, coordinated care and patient centred care in which Australia almost ranked above Canada at each of the
aspect. It has been reported that 57% Australian health consultations receive appropriate care (Appropriate care the right healthcare at the right
Selected health indicators AUSTRALIA CANADA
Maternal mortality rate √ ×
Infant mortality √ ×
life expectancy at birth √ ×
Health status ×
1.
a. Low birth weight
√ √
diabetes √ ×
asthma √ √
Hypertension √ ×
cancer × √
Obesity × √
%GDP √ ×

time).As figure 18 above shows that Australia is one of the top performers with lowest rates in case fatality, for AMI, breast cancer survival and
colorectal cancer. It reveals the Australia making progress in providing quality care by using preventing measures and interventions for these
chronic conditions. However, when it comes Canada figure shows that Canada is poor performer on most aspects with being top performer in
case-fatality and colorectal cancer survival.
In terms of Access of healthcare services, the Australia ranked 8 whereas the ranking of Canada is 9 (FIGURE17). It has been revealed that
more Australians (58%) able to get appointment on same day as compared to Canadians (41%.) Australians can easily (46%) access after hour
services than in Canadians (38%)(Mossialos et al., 2015). The Australia is facing higher cost related problems than Canada. According to
OECD 2014, Australian population is spending 3.2 % out of pocket whereas Canadian spending quite low i.e. 2.3%. It means Australia needs to
develop strategies to make their health system less costly, so that everybody can afford the primary health care.
FIGURE 20: OUT OF POCKET SPENDING FIGURE 21: PHYSICIANS DENSITY IN RURAL AND URBAN

In Australia, the life expectancy decreases with increasing remoteness due to less access to services. The physician density is high i.e. 4.2 % in
the urban areas of Australia and low (2.5%)in the rural areas. Therefore, in indigenous population, the Torres Strait Islanders experienced worse
health concerns than any other communities did (Walls et al., 2012).The aboriginals in Canada were in much better position than aboriginals in
Australian. In terms of equity, Canada ranked 9 which is lower than Australia. Equity means “providing care that does not vary in quality
because of personal characteristics such as gender, ethnicity, geographic location, and socioeconomic status.” Australia must overcome its health
service discrimination between the Indigenous and non-indigenous Australians. The long waiting times are also considered as an important issue.
Australia has got long waiting times for cataract, hip replacement and knee replacement surgery as compared to Canada(OECDindicators, 2015).
When it comes to safety, health professionals did not review the prescriptions of aged person is 16 % for both countries(Mossialos et al., 2015).
In Canada, the “patient first approach” should be more focused on rather than on different governing structures.
Conclusion:
Acceptable Acceptable in health care means how much the needs of the population could be met through planning, preventive measure,
delivery etc. Health care system of both countries are universal but Australian health system seems to be more acceptable
APPROPRIATE Appropriateness in health system refers to treatment, diagnosis and research and development to ensure quality services
delivered to the people. Australian health system has got more cases of cancers but less mortality rate than Canada .it shows

the appropriateness of Australian health system.
Effective Effective refers to address the medical needs of the people. Australian health system is more effective than Canada.
Efficient Efficiency defined as whether the resources utilised at maximum at cost of least wastage. Australia ranked 4 whereas Canada
ranked 10. Australian health system is more efficient.
safe Safety in health care refers to hidden risk due to lack of standards in diagnosis, intervention and treatment. Australia ranked 3
at safety which means Canada need to put effort on minimising the risks.
Both countries health systems are according to the latest standards. However, both need to review their safety measures. Both the above
countries have undergone several health reforms since last few years, there still remains a challenge in rising costs and workforce related to
health care. These issues need to be paid more attention.

References:
ABS. (2015a). 4364.0.55.001 - National Health Survey: First Results, 2014-15
http://www.abs.gov.au/ausstats/[email protected]/Lookup/by%20Subject/4364.0.55.001~2014-15~Main%20Features~Cancer~10
ABS. (2015b). Asthma. http://www.abs.gov.au/ausstats/[email protected]/Lookup/by%20Subject/4364.0.55.001~2014-
15~Main%20Features~Asthma~9
ABS. (2015c). Diabetes Melitus. http://www.abs.gov.au/ausstats/[email protected]/Lookup/by%20Subject/4364.0.55.001~2014-
15~Main%20Features~Diabetes%20mellitus~12
ABS. (2015d). Hypertension. http://www.abs.gov.au/ausstats/[email protected]/Lookup/by%20Subject/4364.0.55.001~2014-
15~Main%20Features~Hypertension%20and%20measured%20high%20blood%20pressure~14
ABS. (2015e). Obesity and overweight Retrieved from http://www.abs.gov.au/ausstats/[email protected]/Lookup/by%20Subject/4364.0.55.001~2014-
15~Main%20Features~Overweight%20and%20obesity~22.
AIHW. (2015). Australia's mothers and babies 2013.
. Appropriate care the right healthcare at the right time. Retrieved from
https://aihi.mq.edu.au/sites/default/files/aihi/resources/Appropriate%20care%20the%20right%20healthcare%20at%20the%20right%20ti
me.pdf.
Bourke, L., Humphreys, J. S., Wakerman, J., & Taylor, J. (2012). Understanding rural and remote health: a framework for analysis in Australia.
Health & Place, 18(3), 496-503.
. Canadian Cancer Statistics (2015). Retrieved from
https://www.cancer.ca/~/media/cancer.ca/CW/cancer%20information/cancer%20101/Canadian%20cancer%20statistics/Canadian-
Cancer-Statistics-2015-EN.pdf.
Davis, K., Stremikis, K., Squires, D., & Schoen, C. (2014). Mirror, mirror on the wall. How the performance of the US Health care system
compares internationally. New York: CommonWealth Fund.
Eijkenaar, F., Emmert, M., Scheppach, M., & Schöffski, O. (2013). Effects of pay for performance in health care: a systematic review of
systematic reviews. Health policy, 110(2), 115-130.
Foroughi, F., Lam, A. K., Lim, M. S., Saremi, N., & Ahmadvand, A. (2016). “Googling” for Cancer: An Infodemiological Assessment of Online
Search Interests in Australia, Canada, New Zealand, the United Kingdom, and the United States. JMIR Cancer, 2(1), e5.
Hilder, L., Zhichao, Z., Parker, M., Jahan, S., & Chambers, G. (2014). Australia's mothers and babies 2012.
Janssen, I. (2013). The public health burden of obesity in Canada. Canadian journal of diabetes, 37(2), 90-96.
Lecours, A., & Béland, D. (2013). The institutional politics of territorial redistribution: Federalism and equalization policy in Australia and
Canada. Canadian Journal of Political Science, 46(01), 93-113.
Marchildon, G. P. (2013). Health Systems in Transition. Health, 15(1), 1-179.
Mossialos, E., Wenzl, M., Osborn, R., & Anderson, C. (2015). 2015 International Profiles of Health Care Systems.
Nicholson, C., Jackson, C. L., Marley, J. E., & Wells, R. (2012). The Australian experiment: how primary health care organizations supported
the evolution of a primary health care system. The Journal of the American Board of Family Medicine, 25(Suppl 1), S18-S26.
Oderkirk, J., Ronchi, E., & Klazinga, N. (2013). International comparisons of health system performance among OECD countries: opportunities
and data privacy protection challenges. Health policy, 112(1), 9-18.
OECD. (2015). OECD HEALTH STATISTICS. http://stats.oecd.org/index.aspx?DataSetCode=HEALTH_STAT
OECDindicators. (2015). Health at a Glance 2015.
Papanicolas, I., & Smith, P. (2013). Health system performance comparison: an agenda for policy, information and research: an agenda for
policy, information and research: McGraw-Hill Education (UK).
Schäfer, W. L., Boerma, W. G., Murante, A. M., Sixma, H. J., Schellevis, F. G., & Groenewegen, P. P. (2015). Assessing the potential for
improvement of primary care in 34 countries: a cross-sectional survey. Bulletin of the World Health Organization, 93(3), 161-168.
StatisticsCanada. (2014a). Asthma, by age group and sex Retrieved from http://www.statcan.gc.ca/tables-tableaux/sum-som/l01/cst01/health49a-
eng.htm.
StatisticsCanada. (2014b). Diabetes, by age group and sex.
StatisticsCanada. (2014c). Health Trends low birth weight. Retrieved from http://www12.statcan.gc.ca/health-sante/82-
213/Op2.cfm?Lang=eng&TABID=0&IND=R&SX=FEMALE&LINE_ID=2550&change=no&S=9&O=A.
StatisticsCanada. (2014d). High blood pressure, by age group and sex
StatisticsCanada. (2014e). Overweight and obese adults (self-reported). http://www.statcan.gc.ca/pub/82-625-x/2015001/article/14185-eng.htm
Tchouaket, É. N., Lamarche, P. A., Goulet, L., & Contandriopoulos, A. P. (2012). Health care system performance of 27 OECD countries. The
International journal of health planning and management, 27(2), 104-129.
Walls, H. L., Magliano, D. J., Stevenson, C. E., Backholer, K., Mannan, H. R., Shaw, J. E., & Peeters, A. (2012). Projected progression of the
prevalence of obesity in Australia. Obesity, 20(4), 872-878.
WHO. (2015). Australia statistics summary (2002 - present). http://apps.who.int/gho/data/node.country.country-AUS?lang=en
WHO, & UNICEF. (2016). Trends in maternal mortality: 1990 to 2015: estimates by WHO, UNICEF, UNFPA, The World Bank and the United
Nations Population Division: executive summary.


