Embed Size (px)
Citation preview

1
Health-related quality of life and paid work
participation after duodenal switch
Obes Surg 2010;20(3):340-5.
John Roger Andersen1 4
, Anny Aasprang1, Per Bergsholm
2, Nils Sletteskog
3, Villy
Våge3, Gerd Karin Natvig
4
1 Faculty of Health Studies, Sogn and Fjordane University College. Box 523,
6803 Førde, Norway.
2 Department of Psychiatry, Førde Central Hospital. 6807 Førde, Norway.
3 Department of Surgery, Førde Central Hospital. 6807 Førde, Norway.
4 Section of Nursing Science, Department of Public Health and Primary Health
Care, University of Bergen. Box 7804, 5200 Bergen.
Corresponding author: John Roger Andersen. Faculty of Health Studies, Sogn
and Fjordane University College. Box 523, 6803 Førde, Norway. E-mail:
[email protected], Telephone: + 47-57722522, Fax: + 47-57722501.
Keywords: health-related quality of life, morbid obesity, paid work participation,
employment, bariatric surgery, duodenal switch.
2
ABSTRACT
Background
Morbid obesity can reduce the health-related quality of life (HRQL) and paid
work participation, and the duodenal switch (DS) can induce large weight loss in
patients suffering from this disease. However, data about HRQL combined with
paid work participation after duodenal switch are lacking. The aim of this study
was to provide longitudinal data of these issues.
Methods
Fifty-one consecutive morbidly obese patients accepted for DS gave their
informed consent to participate in the study. Mean age was 37.7 years (SD, 8.0),
and 54.9% were women. HRQL was assessed using the “Short-Form 36 Health
Status Survey”. Eight subscores, the physical component summary (PCS), and the
mental component summary (MCS) were calculated. Paid work participation was
assessed as performing or not performing paid work. Data were assessed before
DS (T0), one year after DS (T1), and two years after DS (T2).
Results
All the SF-36 scores improved significantly from T0 to T1 and T2 (p<0.001),
when they were in the normal range compared to the population norm. The
number of patients performing paid work increased from 28 (54.9%) at T0 to 34
(66.7%) at T2, p = 0.031. The patients who performed paid work had significantly
better PCS and MCS scores than those who did not before, but not after, DS.

3
Conclusion
Our data indicate that the SF-36 scores of the patients were normalized after DS.
A marked improvement in the paid work participation was also observed.

4
Introduction
The impact of morbid obesity (body mass index (BMI) > 40 or ≥ 35 with obesity-
related comorbidities) on the health-related quality of life (HRQL) is often
devastating [1]. Work is also an important aspect of quality of life, and morbid
obesity has been associated with decreased participation in paid work [2].
Improving the HRQL and paid work participation are therefore important
treatment goals, not only for the well-being of the individuals suffering from
morbid obesity [1] but also for the reduction of the financial burden on society
[2].
The only current treatment documented to provide sustained weight loss in
patients with morbid obesity is bariatric surgery [3]. Studies have suggested that
different bariatric procedures can lead to significant weight loss and improve
HRQL [1, 4]. A few studies also suggest that paid work participation may
increase after bariatric surgery [2, 5-7]. One of the most powerful types of
bariatric surgery for inducing weight loss is the duodenal switch (DS) [8]. Few
studies have examined how this procedure affects HRQL, but the results so far
have been promising [9-11]. Furthermore, to our knowledge, no one has ever
studied changes in paid work participation after DS. Since different bariatric
procedures may give rise to different treatment effects, the effects of each
procedure should be carefully documented longitudinally.
The aim of this study was therefore to study HRQL and paid work
participation before and after DS. For HRQL, our primary outcome measures
were the summary scores of the “Short-Form 36 Health Status Survey” (SF-36).
For the paid work participation, our primary outcome was defined as performing
versus not performing paid work. Other results in this paper are secondary
5
outcomes. We hypothesized that we would observe a substantial improvement in
the HRQL and a small improvement in paid work participation after DS.
Methods
Study design and patients
The first 51 patients with morbid obesity who were accepted for DS at Førde
Central Hospital were invited to participate in the study. Our bariatric surgery
program was initiated in 2001, and the inclusion criteria for participation were
BMI ≥ 40.0 or ≥ 35.0-39.9 with obesity-related comorbidities, age 18-60, no
alcohol or drug problems, no active psychosis, and failure to lose weight through
other methods. Power calculations were done using a two-sided paired t-test
(predicted effect size = 0.6, providing 90% power, p<0.05) indicating that 32-
paired observations would be needed to detect changes in the SF-36 scores. To
ensure that the study was robust concerning missing data, 51 patients were
recruited. Data were assessed before DS (T0), one year after DS (T1), and two
years after DS (T2).
The treatment: Duodenal switch
The duodenal switch is performed by resecting the greater curvature of the
stomach, leaving a narrow gastric tube of 100 to 120 ml along the lesser
curvature. The pylorus is left intact, and the duodenum is divided 3 to 4 cm distal
to the pylorus. The small bowel is usually divided 250 cm above the coecum, and
the proximal end of the distal small bowel is anastomosed to the proximal end of
duodenum (alimentary limb). The distal end of the proximal small bowel is
usually anastomosed to the alimentary limb 75 to 100 cm above the coecum

6
(common limb). Due to the malabsorption induced, patients are encouraged to eat
a high protein diet and to take prescribed daily doses of vitamins and minerals.
Sociodemographics and clinical variables
Age, gender and the educational level were noted. Body weight was measured in
light clothing without shoes to the nearest 0.1 kg. Height was measured in a
standing position without shoes to the nearest 0.01 m. BMI was calculated as
weight divided by height squared (kg/m2). The percent excess BMI loss
(%EBMIL) was calculated as: 100- (follow- up BMI–25 / beginning BMI–25)
×100).
Health-related quality of life
HRQL refers to the aspects of quality of life that specially relate to a person’s
health and can be defined as self-perceived multidimensional health status [12,
13]. To measure HRQL, we used the SF-36 (Norwegian version 1.2), which is a
well-established self-administrated generic measure of the health burden of
chronic diseases [14]. The SF-36 has demonstrated good validity and reliability
[15]. SF-36 assesses eight dimensions of physical and mental health, each ranging
from 100 (optimal) to zero (poorest). The subscales are physical functioning,
physical role functioning, bodily pain, and general health, which all reflect
physical health. The subscales of vitality, social functioning, emotional role
functioning, and mental health reflect mental health. The eight SF-36 subscales
can be factor-analyzed and reduced to two summary scores, the physical
component summary (PCS) and the mental component summary (MCS) [16]. To
calculate the PCS and MCS, we used the oblique method, which allows for the
correlation of physical and mental health [17]. A higher score on both these scales

7
represents better health. Norm data on the SF-36 were obtained from the Short
Form 36 (SF-36) health survey in Norway 1998 (n=2323) [18].
Work participation
Data on paid work participation were based on self-reports. The patients were
asked if they performed paid work at the time of the questioning. This was
assessed on a continuous scale ranging from zero to 100% (i.e., 100% was defined
as full-time in paid work). For descriptive purposes the patients were classified as
“not working” (not performing paid work), “working-part-time”(less than 100%),
and “working full-time “(100%). We also estimated the average weekly hours in
paid work (full-time = 37.5 hours per week). Norm data on paid work
participation (performing versus not performing paid work) were obtained from
the “Labor Force Survey” in Norway 2004 (n=96000) [19].
Statistics
The population norm data for the SF-36 and paid work participation were adjusted
by age and gender to reflect the same distribution as in our study sample. The
patients’ SF-36 data are presented as means and standard deviations and as means
for the population norm. We calculated effect sizes to illustrate the differences in
SF-36 scores between the patients and the population norm by subtracting the
mean scores of the population norm from the mean scores of the patient group
divided by the standard deviations of the patient group at T0, T1, and T2. Effect
sizes were judged against the standard criteria proposed by Cohen [20]: trivial
(<0.2), small (0.2 to <0.5), moderate (0.5 to <0.8), and large (≥ 0.8). Mixed-effect
models were used to calculate repeated mean changes and 95% CIs for the SF-36

8
scores from T0 to T1 and T2 [21]. By performing these analyses, data from all 51
patients were included. Simple and multiple regression analysis were used to
study if the change in BMI from T0 to T2 was predictive for changes in the PCS
and MCS from T0 to T2. In the multiple regression analysis, the initial SF-36
summary score was entered as a covariate to account for the fact that those with a
higher level on this score had less room for improvement (ceiling effect) and to
control for regression to the mean [22]. The McNemar’s test was used to explore
longitudinal changes in paid work participation (performing versus not
performing paid work). The Wilcoxon-test was used to study the average paid
work participation per week before and after DS. Differences in the PCS and
MCS in the patients, who performed versus not performed paid work before and
after DS, were studied using multiple regression analysis (adjustments were done
for age, gender and educational level). In the regression analysis, the
unstandardized regression coefficients (B) are reported. A paired t-test was used
to explore changes in BMI. A two tailed p-value of <0.05 was considered
statistically significant. The SF-36 scores were calculated with the SF Health
Outcomes TM
Scoring Software, basic version (Quality Metric Inc. Lincoln, USA).
The mixed linear analyses were conducted with the package nlme in the statistical
program R (the R Foundation for Statistical Computing, Vienna, Austria). The
remaining analyses were performed using the statistical program SPSS for
Windows, version 15.0 (SPSS Inc. Chicago, USA).
Ethics
Informed consent was obtained from all participants. This investigation conforms
to the principles outlined in the Declaration of Helsinki. The study was approved
9
by The Norwegian Social Science Data Services and by the Regional Committee
of Ethics in Medicine, West-Norway.
Results
Characteristics of the study participants
All 51 patients who were invited agreed to participate in the study. The mean age
was 37.7 years (SD, 8.0), 28 patients (54.9%) were women and 38 patients
(74.5%) had less than 13 years of education. We had complete data on all patients
for changes in BMI. All completed the SF-36 at T0, 48 (94%) at T1, and 42 (82%)
at T2. Eight of the incomplete SF-36 datasets at T2 were caused by an error at the
hospital that lead to omissions of several items in some of the questionnaires. The
nine patients who did not complete the SF-36 at T2 had practically identical
sociodemograpic characteristics, BMI and SF-36 summary scores at T0.
Furthermore their weight loss was similar to the rest of the sample (data not
shown). Regarding paid work participation, we lacked data at T2 for two patients.
For these patients, we used the available data collected at T1 and at follow-up
control 18-months after surgery.
Weight loss
Mean BMI at T0 was 51.9 (SD, 7.5). At T1, it was 32.8 (SD, 5.8), (p<0.001,
compared to T0), and at T2, it was 31.8 (SD, 5.6) (p<0.001, compared to T0). The
mean %EBMIL at T2 was 74.8% (SD, 22.1%), and 88.3% of the patients had a
%EBMIL >50%.

10
SF-36 scores
The effect sizes at T0 indicated that there were large impairments in all the SF-36
scores compared to the population norm (Table 1). Effect sizes at T1 and T2
indicated that the scores had changed considerably and were in the normal range
(Table 1). This was reflected by statistically significant improvements in the all
the SF-36 subscores (p<0.001) and SF-36 summary scores in the mixed-effect
analysis (Table 2).
Using simple regression, the degree of BMI unit change from T0 to T2
was significantly correlated to the degree of change in the PCS (B= 0.57 (95% CI,
0.08 to 1.06), p=0.026). No significant association was however found when we
adjusted for the initial PCS score (B= 0.28 (95% CI, -0.10 to 0.66), p= 0.145). We
found no association between the degree of BMI unit change and change in the
MCS (data not shown).
Work participation
The number of patients who performed paid work was unchanged from T0 to T1
(Table 3). However, the number increased from 28 (54.9%) at T0 to 34 (66.7%) at
T2, p=0.031. The percentage of the patients performing paid work at T2 was still
somewhat lower than the age and gender adjusted population norm (82.7%). The
average paid work participation peer week in those who performed paid work
both before and after DS (n=28) was 31.2 hours at T0 and 32.8 hours per week at
T2, p=0.505. The average paid work participation in the six patients (two women
and four men), who started to perform paid work after DS, was 26.9 hours per
week at T2.

11
Paid work participation and the SF—36 summary scores
At T0, the patients who performed paid work (n=28) had significantly better
scores on the PCS (B=8.4 (95% CI, 2.8 to 14.0), p<0.004) and the MCS (B= 8.6
(95% CI, 1.5 to 15.6), p<0.018), than those who did not (n=23). At T2, no
significant differences were found in the PCS (B= 4.1 (95% CI -1.6 to 9.9),
p=0.157) or MCS (B= -1.1 (95% CI -9.2 to 7.0), p=0.782) in those who performed
(n=26) versus not performed paid work (n=16). The B-values were adjusted for
age, gender and educational level. These covariates showed no statistically
associations with the PCS or MCS (data not shown). Due to small sample size,
we were unable to perform meaningful analyzes of changes in the PCS and MCS
in patients who improved their workability versus those who did not.
Discussion
This study shows that the patients’ SF-36 scores normalized after DS. A marked
improvement in paid work participation was also observed.
There are now several studies showing excellent improvements of HRQL
after a range of bariatric surgery procedures [4, 23-26]. It is likely that that the
procedure associated with the best long-term weight loss maintenance (>5 to 10
years), and having few side-effects, also will have the best long-term effect on
HRQL [4]. Longer follow-up is therefore needed to study this issue.
However, our results are promising and support the previous findings in
the studies on DS, HRQL, and other patient-reported outcomes. Thus, Weiner et
al. described 23 patients one year after DS and found large improvements in
HRQL measured with the SF-12v2, the Gastrointestinal Quality of Life Index and
the Bariatric Quality of Life Score [9]. Marceau et al. conducted a 15-year follow-
12
up on 1423 patients [11]. The patients’ level of overall satisfaction with the
treatment results, taking all factors into consideration, was good at the 5-year
follow-up (95% were satisfied). However, as some patients experienced some
weight gain over the years, the level of satisfaction tended to decrease somewhat
with time.
In our study, 67% of patients were still obese (BMI≥30) at T2, while the
prevalence in the general adult Norwegian population is approximately 20% [27].
Our finding that the SF-36 scores at T2 were practically identical to those of the
population norm is therefore somewhat better than expected. Similar findings
have also been reported by others [24, 26]. Differences in most SF-36 sub-
domains are usually 5 to10 points lower in individuals from the general
population with a BMI between 30 and 34.9 compared to persons with a BMI <30
[28, 29]. Such differences are therefore what we would expect in studies like the
present one. Some have suggested that this discrepancy may be related to some
short-term euphoria and relief due to a long-term disability having finally been
relieved (“the honeymoon effect”) [26]. It has been shown that this effect is
probably temporary and that there is a small fallback to “expected values” after a
longer follow-up period [26]. However, several studies suggest that a relatively
good HRQL can be maintained as long as 10 to 25 years after bariatric surgery [4,
30, 31].
Our finding that the degree of change in BMI was not a significant
predictor of changes of PCS and MCS, is partly in agreement with previous
research, which shows only small associations between the degree of weight loss
and a range of HRQL measures [4, 26]. Our study does not seem to have enough
power to detect small associations. Furthermore, we suggest that most patients in
13
our study had a weight loss that exceeded a threshold above which little difference
in generic HRQL is observed. Thus, longitudinal data after DS suggest that most
patients with an initial BMI above 50 will be fairly satisfied if they maintain a
long-term BMI less than 40 and that most patients with an initial BMI less than 50
will be fairly satisfied with a long-term BMI less than 35 [32]. The association
between HRQL and changes in BMI in our cohort may therefore be strengthened
after prolonged follow-up, when some patients may regain some weight. Another
explanation may be that procedures like the DS may change an individuals'
relationship to food by increasing a perception of control over eating behavior
[33-35]. This effect may in turn affect some aspects of HRQL favorably without
being strongly related to the degree of weight loss.
Most previous studies indicate that bariatric surgery improves paid work
participation [2, 5-7]. Even small increases in paid work participation can be
important, since patients having bariatric surgery often have decades of working
life ahead of them. Although the number of patients who performed paid work in
this study increased significantly, the rate was still lower than the population
norm. However, at T2, many of the patients had just reached a plateau of weight
loss, and some needed a panniculectomy. It is therefore reasonable to expect that
the paid work participation in this cohort may continue to increase. Some possible
confounders could have caused the increase in the paid work participation. The
youngest patients in our study could have started to perform paid work during the
follow-up period for natural reasons, and improved economics could have lead to
higher paid work participation. However, only one patient was less than 25 years
old at the start of the study, and that patient performed paid work before and after
14
DS. Furthermore, the paid work participation in Norway showed a small reduction
during the follow-up period [19].
Our finding that not performing paid work was associated with a poorer
PCS and MCS scores was expected, since similar findings have been reported by
others [6, 36]. The association between performing paid work and HRQL is likely
bidirectional. Performing paid work may influence HRQL positively, and having
poor HRQL may lead to inability to perform paid work. At T2, there were no
differences in the PCS and MCS scores between those who performed versus not
performed paid work. This observation is most likely related to the large
improvements in the PCS and MCS scores from T0 to T2.
Some limitations of the study should be considered. First, the data on paid
work participation were based on self-reports, and recall bias may have occurred.
Second, since we lacked data on sick-leave days, it was not possible to calculate
an exact estimate of the participation in paid work. Third, we lacked SF-36 data in
nine patients at T2. However, we consider this to be a random error. Finally, we
acknowledge that using an obesity-specific HRQL measure could have been
complementary.
In conclusion, our data support the hypothesis that DS can normalize
generic HRQL and increase paid work participation in patients with morbid
obesity. However, studies with a longer follow-up period are warranted.

15
Acknowledgements
This study was supported by a grant from Sogn and Fjordane College University,
Norway. We are grateful for the statistical assistance provided by statistician Tore
Wentzel-Larsen (Centre for Clinical Research, Western Norway Regional Health
Authority). The authors also acknowledge the patients who participated in the
study.

16
Literature
[1] Fontaine KR, Barofsky I. Obesity and health-related quality of life. Obes
Rev. 2001; 2: 173-82.
[2] Neovius K, Johansson K, Rossner S et al. Disability pension, employment
and obesity status: a systematic review. Obes Rev. 2008; 9: 572-81.
[3] World Health Organization. European ministerial conference on
counteracting obesity. Copenhagen, 2006. (Accessed 05.12. 2008, at
http://www.euro.who.int/Document/NUT/Instanbul_conf_edoc06.pdf.)
[4] Karlsson J, Taft C, Ryden A et al. Ten-year trends in health-related quality
of life after surgical and conventional treatment for severe obesity: the SOS
intervention study. Int J Obes. 2007; 31: 1248-61.
[5] Wagner AJ, Fabry JM, Jr., Thirlby RC. Return to work after gastric bypass
in Medicaid-funded morbidly obese patients. Arch Surg. 2007; 142: 935-40.
[6] Hawkins SC, Osborne A, Finlay IG et al. Paid work increases and state
benefit claims decrease after bariatric surgery. Obes Surg. 2007; 17: 434-7.
[7] Velcu LM, Adolphine R, Mourelo R et al. Weight loss, quality of life and
employment status after Roux-en-Y gastric bypass: 5-year analysis. Surg Obes
Relat Dis. 2005; 1: 413-6.

17
[8] Hess DS, Hess DW, Oakley RS. The biliopancreatic diversion with the
duodenal switch: results beyond 10 years. Obes Surg. 2005; 15: 408-16.
[9] Weinera S, Sauerland S, Weiner RA et al. Quality of life after bariatric
surgery – is there a difference? Chir Gastroenterol 2005; 21: 34-6.
[10] Perez N, Baltasar A, Serra C et al. Comparative analysis of vertical banded
gastroplasty and duodenal switch at five years follow-up. Obes Surg. 2005; 15:
1061-5.
[11] Marceau P, Biron S, Hould FS, et al. Duodenal switch: long-term results.
Obes Surg. 2007; 17: 1421-30.
[12] Cramer JA, Spilker B. Quality of life and pharmacoeconomics an
introduction. Philadelphia: Lippincott-Raven, 1998.
[13] Wilson IB, Cleary PD. Linking clinical variables with health-related
quality of life. A conceptual model of patient outcomes. JAMA. 1995; 273: 59-65.
[14] Ware JE, Kosinski M, Gandek B. SF-36 health survey: manual &
interpretation guide, [2. ed] edn. Lincoln, RI: QualityMetric Inc., 2000.
[15] Loge JH, Kaasa S, Hjermstad MJ et al. Translation and performance of the
Norwegian SF-36 Health Survey in patients with rheumatoid arthritis. I. Data
quality, scaling assumptions, reliability, and construct validity. J Clin Epidemiol.
1998; 51: 1069-76.

18
[16] Ware JE, Kosinksi M. SF-36 physical and mental health summary scales: a
manual for users of version 1. Lincoln, RI: QualityMetric Inc., 2001.
[17] Simon GE, Revicki DA, Grothaus L et al. SF-36 summary scores: are
physical and mental health truly distinct? Med Care. 1998; 36: 567-72.
[18] Loge JH, Kaasa S. Short form 36 (SF-36) health survey: normative data
from the general Norwegian population. Scand J Soc Med. 1998; 26: 250-8.
[19] Statistics Norway. Work statistics. (Accessed 02.03. 2009, at
http://www.ssb.no/arbeid/.)
[20] Cohen J. Statistical Power Analysis for the Behavioral Sciences. New
York: Academic Press, 1978.
[21] Pinheiro J, Bates D. Mixed Effects Models in S and S-PLUS. New York:
Springer, 2002.
[22] Barnett AG, van der Pols JC, Dobson AJ. Regression to the mean: what it
is and how to deal with it. Int J Epidemiol. 2005; 34: 215-20.
[23] Adami GF, Ramberti G, Weiss A et al. Quality of life in obese subjects
following biliopancreatic diversion. Behav Med. 2005; 31: 53-60.

19
[24] Choban PS, Onyejekwe J, Burge JC et al. A health status assessment of the
impact of weight loss following Roux-en-Y gastric bypass for clinically severe
obesity. J Am Coll Surg. 1999; 188: 491-7.
[25] Carmichael AR, Sue-Ling HM, Johnston D. Quality of life after the
Magenstrasse and Mill procedure for morbid obesity. Obes Surg. 2001; 11: 708-
15.
[26] Dixon JB, Dixon ME, O'Brien PE. Quality of life after lap-band
placement: influence of time, weight loss, and comorbidities. Obes Res. 2001; 9:
713-21.
[27] Ulset E, Undheim R, Malterud K. Has the obesity epidemic reached
Norway? Tidsskr Nor Laegeforen. 2007; 127: 34-7.
[28] Doll HA, Petersen SE, Stewart-Brown SL. Obesity and physical and
emotional well-being: associations between body mass index, chronic illness, and
the physical and mental components of the SF-36 questionnaire. Obes Res. 2000;
8: 160-70.
[29] Fine JT, Colditz GA, Coakley EH et al. A prospective study of weight
change and health-related quality of life in women. JAMA. 1999; 282: 2136-42.
[30] de Zwaan M, Lancaster KL, Mitchell JE et al. Health-related quality of life
in morbidly obese patients: effect of gastric bypass surgery. Obes Surg. 2002; 12:
773-80.

20
[31] Våge V, Solhaug JH, Viste A, Bergsholm P et al. Anxiety, depression and
health-related quality of life after jejunoileal bypass: a 25-year follow-up study of
20 female patients. Obes Surg. 2003; 13: 706-13.
[32] Biron S, Hould FS, Lebel S et al. Twenty years of biliopancreatic
diversion: what is the goal of the surgery? Obes Surg. 2004; 14: 160-4.
[33] Näslund E, Melin I, Gryback P et al. Reduced food intake after jejunoileal
bypass: a possible association with prolonged gastric emptying and altered gut
hormone patterns. Am J Clin Nutr. 1997; 66: 26-32.
[34] Ogden J, Clemeti C, Aylwin S. The impact of obesity surgery and the
paradox of control: A qualitative study. Psychol Health. 2006; 21: 273-93.
[35] Marceau P, Cabanac M, Frankham PC et al. Accelerated satiation after
duodenal switch. Surg Obes Relat Dis. 2005; 1: 408-12.
[36] Jiang Y, Hesser JE. Associations between health-related quality of life and
demographics and health risks. Results from Rhode Island's 2002 behavioral risk
factor survey. Health Qual Life Outcomes. 2006; 4: 14.

21
Table 1. SF-36 data in the patient group before and after duodenal switch (DS) and in
the population norm. Effect sizes are for differences between the patient group and the
population norm.
SF-36 scores T0
(n = 51)
T1
(n = 48)
T2
(n = 42)
Population
norm
(n=2323)
Physical functioning
Effect size
43.0 (24.8)
-1.95
87.6 (19.2)
-0.20
91.0 (13.3)
-0.03
91.4
Physical role functioning
Effect size
25.5 (33.7)
-1.74
74.8 (36.8)
-0.26
81.0 (31.6)
-0.10
84.2
Bodily pain
Effect size
38.5 (27.3)
-1.43
73.3 (26.7)
-0.16
77.1 (22.8)
-0.02
77.5
General health
Effect size
42.0 (23.7)
-1.60
81.0 (20.7)
0.05
78.8 (23.8)
-0.05
79.9
Vitality
Effect size
31.1 (22.3)
-1.29
64.7 (22.7)
0.21
63.7 (22.4)
0.17
59.9
Social functioning
Effect size
55.7 (29.7)
-1.03
86.7 (18.1)
0.02
83.6 (21.5)
-0.13
86.3
Emotional role functioning
Effect size
45.8 (42.7)
-0.90
78.5 (36.1)
-0.16
77.8 (36.6)
-0.18
84.3
Mental health
Effect size
60.1 (21.3)
-0.86
80.5 (18.7)
0.11
76.9 (20.1)
-0.08
78.5
22
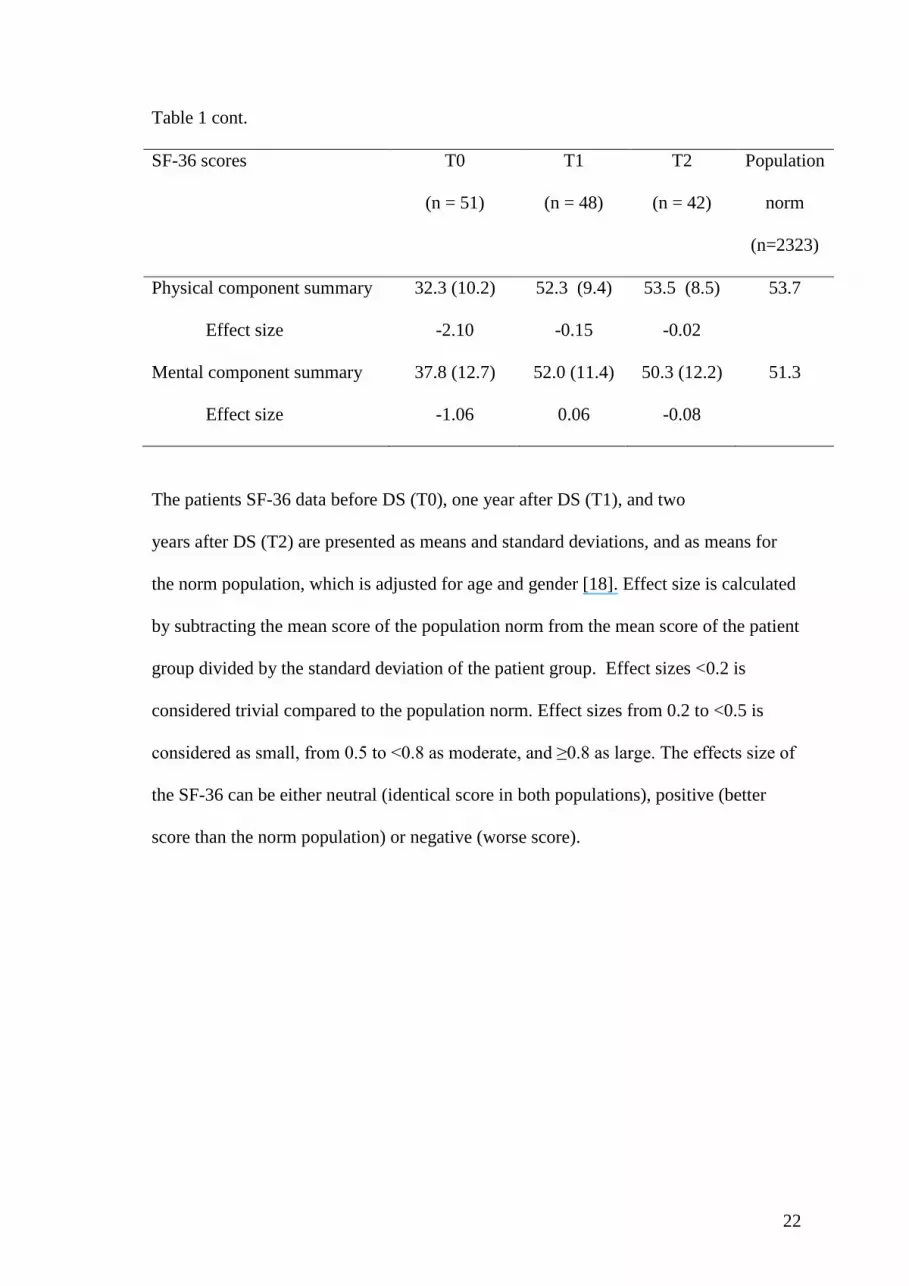
Table 1 cont.
SF-36 scores T0
(n = 51)
T1
(n = 48)
T2
(n = 42)
Population
norm
(n=2323)
Physical component summary
Effect size
32.3 (10.2)
-2.10
52.3 (9.4)
-0.15
53.5 (8.5)
-0.02
53.7
Mental component summary
Effect size
37.8 (12.7)
-1.06
52.0 (11.4)
0.06
50.3 (12.2)
-0.08
51.3
The patients SF-36 data before DS (T0), one year after DS (T1), and two
years after DS (T2) are presented as means and standard deviations, and as means for
the norm population, which is adjusted for age and gender [18]. Effect size is calculated
by subtracting the mean score of the population norm from the mean score of the patient
group divided by the standard deviation of the patient group. Effect sizes <0.2 is
considered trivial compared to the population norm. Effect sizes from 0.2 to <0.5 is
considered as small, from 0.5 to <0.8 as moderate, and ≥0.8 as large. The effects size of
the SF-36 can be either neutral (identical score in both populations), positive (better
score than the norm population) or negative (worse score).
23
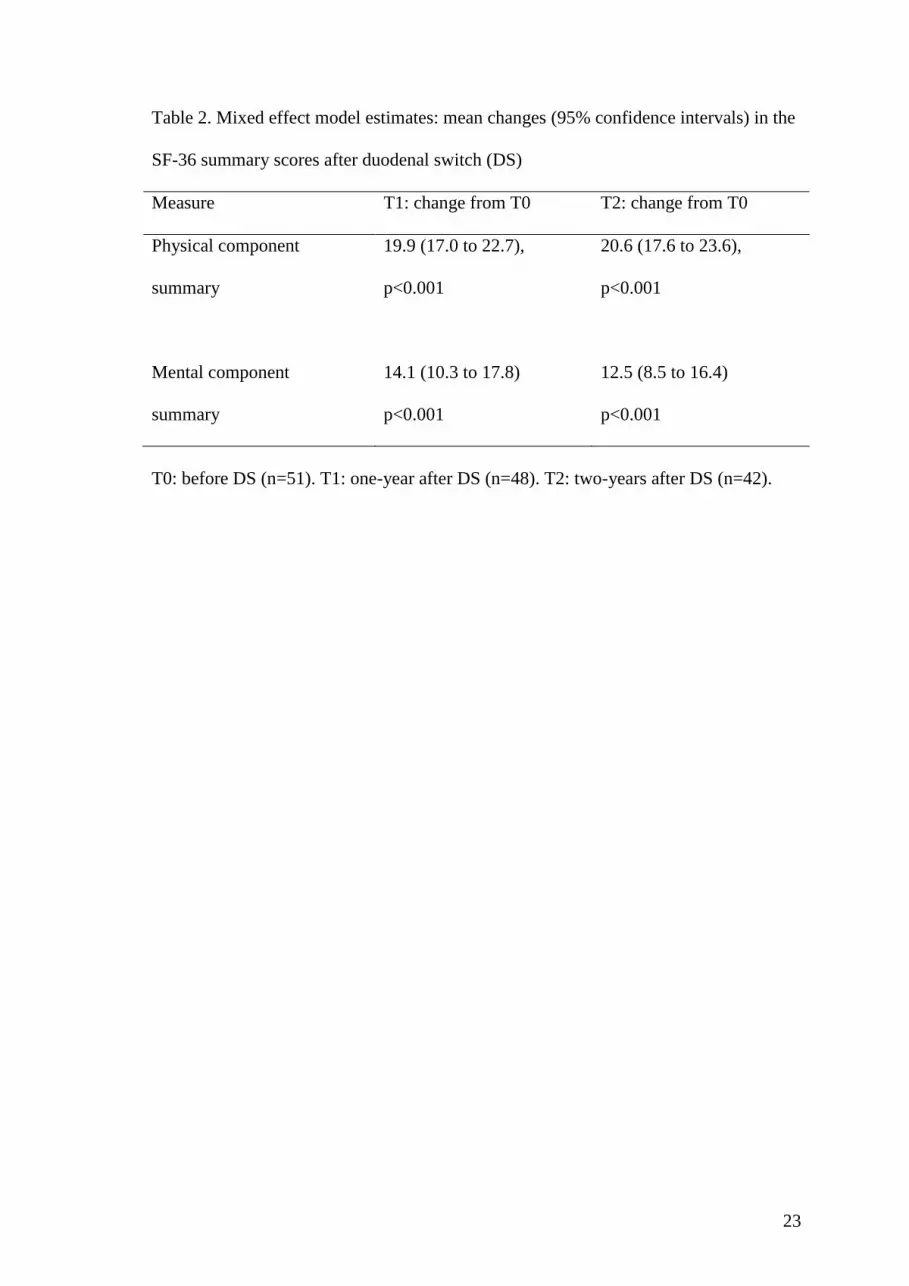
Table 2. Mixed effect model estimates: mean changes (95% confidence intervals) in the
SF-36 summary scores after duodenal switch (DS)
Measure T1: change from T0 T2: change from T0
Physical component
summary
19.9 (17.0 to 22.7),
p<0.001
20.6 (17.6 to 23.6),
p<0.001
Mental component
summary
14.1 (10.3 to 17.8)
p<0.001
12.5 (8.5 to 16.4)
p<0.001
T0: before DS (n=51). T1: one-year after DS (n=48). T2: two-years after DS (n=42).
24
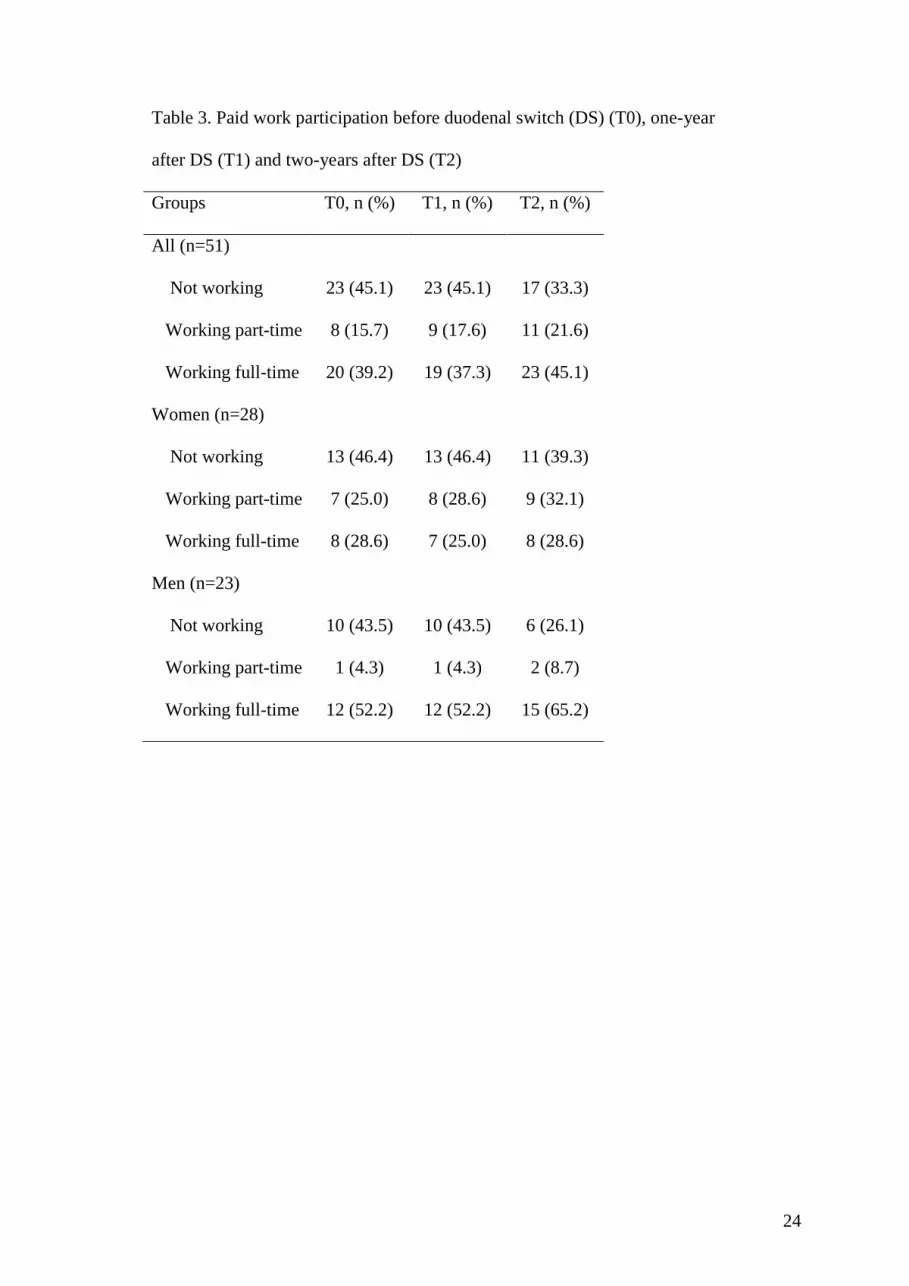
Table 3. Paid work participation before duodenal switch (DS) (T0), one-year
after DS (T1) and two-years after DS (T2)
Groups T0, n (%) T1, n (%) T2, n (%)
All (n=51)
Not working 23 (45.1) 23 (45.1) 17 (33.3)
Working part-time 8 (15.7) 9 (17.6) 11 (21.6)
Working full-time 20 (39.2) 19 (37.3) 23 (45.1)
Women (n=28)
Not working 13 (46.4) 13 (46.4) 11 (39.3)
Working part-time 7 (25.0) 8 (28.6) 9 (32.1)
Working full-time 8 (28.6) 7 (25.0) 8 (28.6)
Men (n=23)
Not working 10 (43.5) 10 (43.5) 6 (26.1)
Working part-time 1 (4.3) 1 (4.3) 2 (8.7)
Working full-time 12 (52.2) 12 (52.2) 15 (65.2)


