Embed Size (px)
Citation preview


HALF-YEARLY ECONOMIC REPORT 2013
ECONOMIC ANALYSIS DIVISION ECONOMIC ANALYSIS AND BUSINESS FACILITATION UNIT
FINANCIAL SECRETARY’S OFFICE GOVERNMENT OF THE
HONG KONG SPECIAL ADMINISTRATIVE REGION
August 2013

CONTENTS
Paragraphs CHAPTER 1: OVERVIEW OF ECONOMIC PERFORMANCE
Overall situation 1.1 - 1.2 The external sector 1.3 - 1.4 The domestic sector 1.5 - 1.6 The labour sector 1.7 The asset markets 1.8 - 1.9 Inflation 1.10 - 1.11 GDP by major economic sector 1.12 Other major developments 1.13 - 1.17 Box 1.1 The US Federal Reserve’s conditional timetable for tapering asset purchases
Box 1.2 Diffusion indices on small and medium-sized enterprises (an update)
CHAPTER 2: THE EXTERNAL SECTOR
Visible trade Total exports of goods 2.1 - 2.5 Imports of goods 2.6 Invisible trade Exports of services 2.7 Imports of services 2.8 Visible and invisible trade balance 2.9 Other developments 2.10 - 2.11 Box 2.1 A look at intra-regional trade in East Asia Box 2.2 Performance of exports of consumer goods – a longer-term perspective
CHAPTER 3: DEVELOPMENTS IN SELECTED SECTORS
Property 3.1 - 3.14 Land 3.15 - 3.16 Tourism 3.17 - 3.19 Logistics 3.20 - 3.21 Transport 3.22 - 3.24 Environment 3.25 Box 3.1 Spending pattern of inbound visitors CHAPTER 4: THE FINANCIAL SECTOR
Interest rates and exchange rates 4.1 - 4.5 Money supply and banking sector 4.6 - 4.16 The debt market 4.17 - 4.18 The stock and derivatives markets 4.19 - 4.23 Fund management and investment funds 4.24 Insurance sector 4.25 - 4.26 Highlights of policy and market developments 4.27

CHAPTER 5: THE LABOUR SECTOR
Overall labour market situation 5.1 Total employment and labour force 5.2 - 5.4 Profile of unemployment 5.5 - 5.9 Profile of underemployment 5.10 Profile of employment in establishments 5.11 - 5.12 Vacancies 5.13 - 5.16 Wages and earnings 5.17 - 5.21 Recent labour-related measures 5.22 - 5.25 Box 5.1 Part-time employment in Hong Kong CHAPTER 6: PRICES
Consumer prices 6.1 - 6.3 Costs of factor inputs and import prices 6.4 - 6.5 Output prices 6.6 GDP deflator 6.7 STATISTICAL APPENDIX

1
CHAPTER 1 : OVERVIEW OF ECONOMIC PERFORMANCE Summary
The Hong Kong economy grew moderately in the second quarter of 2013, by 3.3% in real terms over a year earlier, slightly faster than the 2.9% growth in the first quarter. Domestic demand continued to render the key impetus to growth, while the external sector was still lacklustre amid an unsteady external environment.
Externally, demand conditions in the advanced economies on the whole were still sluggish. While the eurozone economy remained weak, the pace of recovery in the US was constrained by the fiscal drag. Major emerging markets also saw some slowdown in growth. Moreover, the US Fed’s conditional timetable for reducing asset purchases, together with the Bank of Japan’s more aggressive quantitative easing, created new uncertainties. Against this backdrop, exports across many Asian economies remained subdued. Hong Kong’s total exports of goods, after excluding exports of non-monetary gold, showed only a modest growth in the second quarter. Meanwhile, exports of services picked up visibly, thanks to a surge in visitor spending during the quarter.
Domestic demand held up well in the second quarter. Private consumption expenditure rose further, thanks to favourable job and income conditions. Investment expenditure reverted to quite a notable growth after a brief dip in the first quarter, mainly on robust machinery and equipment investment and hectic infrastructure works.
The labour market remained in a state of full employment. Reflecting the firm labour demand, job vacancies in the private sector surged to a 19-year high in March. During the second quarter, total employment increased further to a new high, pushing the seasonally adjusted unemployment rate down to 3.3%. Amid a tight labour market, wages and earnings recorded further growth in real terms in the first quarter.
Local stock prices rallied in April and early May upon some stabilisation in the euro debt situation and monetary easing in the advanced economies, but experienced a sharp correction in late May and June. Local property market cooled off visibly after the Government’s further demand management measures in late February, with thinner transactions and slower increase in flat prices during the second quarter.
Inflation held largely stable. The underlying rate edged up by only 0.1 percentage point from the first quarter to 3.9% in the second quarter.

2
Imported inflation eased further. Local labour cost pressures were largely contained with moderated wage growth. Flat rentals showed moderated increases, though only to show up in consumer price inflation later this year.
Overall situation 1.1 Economic growth remained moderate and below trend in the second quarter of 2013, amid a still unsteady external environment. The eurozone economy stayed weak, although the economic sentiment improved slightly. In the US, private sector demand was slowly reviving, thanks to healing housing and labour markets, but the overall growth pace was constrained by the fiscal drag. The Japanese economy showed some pick-up in activity under the support of its government’s aggressive stimulus strategy. On the whole, the performance of the advanced economies was still subpar, continuing to weigh on production and trading activities in Asia. Even the Mainland saw some weakening in manufacturing and exports. As such, Hong Kong’s merchandise exports posted only modest growth in the second quarter. Yet exports of services fared better, thanks to vibrant inbound tourism. Domestic demand also held up well, with a bounce-back in investment and with private consumption displaying further growth amid favourable labour market conditions. Underlying consumer price inflation held largely stable, though going up slightly in June. 1.2 In the second quarter of 2013, Gross Domestic Product (GDP)(1) grew by 3.3% in real terms over a year earlier, slightly faster than the 2.9% growth in the first quarter (revised from the earlier estimate of 2.8%). In the first half of 2013, real GDP expanded by 3.1% over a year earlier. On a seasonally adjusted quarter-to-quarter comparison(2), real GDP grew by 0.8% in the second quarter, also faster than the 0.2% growth in the preceding quarter (same as the earlier estimate).

3
Q12008
Q12009
Q12010
Q12011
Q12012
Q12013
-10
-8
-6
-4
-2
0
2
4
6
8
10
12
14Percent
Year-on-year rate of change of GDPin real terms
Seasonally adjusted quarter-to-quarterrate of change of GDP in real terms
Diagram 1.1 : The economy grew moderately in the second quarter of 2013
The external sector 1.3 Total exports of goods compiled under the GDP accounting framework grew by 6.2% year-on-year in real terms in the second quarter, slower than the 8.8% growth in the first quarter. Excluding the substantial increase in exports of non-monetary gold in the quarter, export performance was actually rather lacklustre. The advanced markets were still the weak spots, as exports to the US, EU and Japan continued to post moderate year-on-year declines in the second quarter. Moreover, exports to the major Asian markets including the Mainland, Taiwan and Singapore also showed some slowdown. Reflecting the drag from sluggish external demand and its negative spillover to Asian production activities and domestic demand, exports of raw materials and consumer goods to many Asian economies remained subdued in the second quarter. 1.4 Yet exports of services fared visibly better and picked up to an 8.1% year-on-year growth in real terms in the second quarter, up from the 5.3% growth in the first quarter. Exports of travel services remained the key growth driver, with visitor spending accelerating markedly in the second quarter amid a spike in visitors’ purchases of gold-related items. Exports of financial and other business services saw moderate year-on-year growth as fund-raising activities stabilised somewhat from low levels in last year. Yet exports of trade-related services grew only mildly in tandem with the subdued trading activities, while those of transportation services continued to record a modest decline on the slowdown in cargo flows.

4
Table 1.1 : Gross Domestic Product and its main expenditure components and the main price indicators
(year-on-year rate of change (%))
2011# 2012# 2012 2013
Q1# Q2# Q3# Q4# Q1# Q2+ Change in real terms of GDP and its main expenditure components (%)
Private consumption expenditure
8.4 3.0 5.5 (1.0)
2.3 (-0.1)
1.5 (0.6)
2.7 (1.2)
6.3 (4.4)
4.2 (-2.0)
Government consumption expenditure
2.5 3.7 3.2 (1.2)
4.2 (1.0)
4.0 (0.7)
3.3 (0.6)
2.1 (-0.2)
3.1 (2.1)
Gross domestic fixed capital formation
10.2 9.4 12.5 5.8 8.2 11.4 -3.3 6.9
of which :
Building and construction 15.5 13.2 14.6 14.7 8.8 14.6 -2.6 -2.1
Machinery, equipment and intellectual property products
12.2 10.7 21.1 5.2 10.1 9.2 -4.0 19.4
Total exports of goods
3.4 1.8 -4.7 (1.3)
0.3 (-1.7)
4.6 (3.1)
6.7 (4.8)
8.8 (1.8)
6.2 (-3.1)
Imports of goods
4.7 3.0 -1.8 (2.7)
1.2 (-1.0)
4.7 (1.6)
7.6 (5.2)
9.6 (3.1)
7.6 (-2.2)
Exports of services
5.6 2.0 2.3 (0.4)
2.6 (1.3)
0.2 (-1.5)
3.0 (2.9)
5.3 (2.7)
8.1 (3.9)
Imports of services
3.5 0.4 3.0 (0.8)
0.9 (-1.3)
-1.5 (-2.0)
-0.7 (1.9)
0.5 (1.9)
-1.4 (-3.0)
Gross Domestic Product
4.9 1.5 0.7 (0.3)
0.9 (-0.1)
1.5 (1.1)
2.8 (1.4)
2.9 (0.2)
3.3 (0.8)
Change in the main price indicators (%)
GDP deflator 3.9 3.9 3.9 (1.1)
3.0 (0.5)
4.3 (2.0)
4.3 (0.7)
1.4 (-1.8)
0.7 (-0.1)
Composite CPI
Headline
5.3 4.1 5.2 (1.2)
4.2 (0.8)
3.1 (-1.9)
3.8 (3.7)
3.7 (1.2)
4.0 (1.1)
Underlying^
5.3 4.7 5.9 (1.2)
5.1 (0.9)
4.0 (0.6)
3.8 (1.1)
3.8 (1.2)
3.9 (1.0)
Change in nominal GDP (%) 9.0 5.5 4.6 3.9 5.8 7.3 4.3 4.0 Notes : Figures are subject to revision later on as more data become available. Seasonally adjusted
quarter-to-quarter rate of change is not applicable to gross domestic fixed capital formation, as no clear seasonal pattern is found for the category due to the presence of considerable short term fluctuations. Figures of private consumption expenditure, exports of goods, and imports and exports of services were revised back to 2009 as a result of a technical revision exercise conducted by the Census and Statistics Department in mid-2013. For details, please see Note (3) to this chapter.
(#) Revised figures. (+) Preliminary figures. (+) Seasonally adjusted quarter-to-quarter rate of change. (^) After netting out the effects of Government’s one-off relief measures.

5
Box 1.1
The US Federal Reserve’s conditional timetable for tapering asset purchases
The Federal Open Market Committee (FOMC) of the US Federal Reserve (the Fed) began its third round of quantitative easing (QE3) in September 2012 by buying agency mortgage-backed securities (MBS) at a pace of US$40 billion per month. In December 2012, the Fed expanded its purchases by also taking up longer-term Treasury securities at a pace of US$45 billion per month, and tied its forward rate guidance to developments in unemployment rate, near-term inflation projection and longer-term inflation expectation.
FOMC members, though mostly approved of the effectiveness of the open-ended program in easing financial conditions and helping economic recovery, held diverse views on the potential costs and risks arising from the additional purchases(1). As the US economy continued to recover at a moderate pace despite the drag from fiscal adjustment in the first half of this year, there were increased discussions on the possibility of scaling down QE3(2).
On 19 June 2013, after the FOMC meeting, Fed Chairman Bernanke put forward the conditional timetable for tapering asset purchases(3). In essence, if the incoming data are broadly consistent with FOMC’s forecast, the Fed would moderate the pace of its asset purchases in measured steps later this year, resulting in an end to QE3 around mid-2014. According to the FOMC’s projections in June, the US unemployment rate was expected to come down gradually to 7.2-7.3% in 2013 Q4 and 6.5-6.8% in 2014 Q4 and the US economic growth to pick up to 2.3-2.6% year-on-year in 2013 Q4 and further to 3.0-3.5% year-on-year in 2014 Q4, while inflation would move closer to the 2% target.
As expectations on the prospect of QE3 began to shift, global financial markets saw notable gyrations in recent months, especially during May and June. The yield on 10-year US Treasury bond, albeit still close to its historic low, has increased by around 1 percentage point since early May, alongside rebounds in other longer-term rates (Charts 1a and 1b). Global equity and commodity prices (Charts 2a and 2b) as well as exchange rates have also turned more volatile.
At the current juncture, there is still much uncertainty surrounding the materialisation of the Fed’s conditional timetable. Inflation in the US has been subdued and is likely to be less of a concern in the near term (Chart 3a). However, it remains to be seen whether the job gains would be large enough to bring down the unemployment rate (Chart 3b) and whether the private sector demand would strengthen to offset the fiscal drag and result in faster GDP growth in the coming quarters as forecast by the FOMC. Specifically, the recent rises in long-term interest rates, including the mortgage rates, may restrain the pace of the US housing market recovery as well as business investments going forward. The outlook for the US economy will also hinge on how the euro debt crisis will evolve and whether the emerging markets will maintain their growth momentum in the coming quarters.
(1) See, for example, the minutes of the FOMC meeting in September 2012, when QE3 was first launched (http://www.federalreserve.gov/monetarypolicy/files/fomcminutes20120913.pdf).
(2) See, for example, the minutes of the FOMC meeting in March 2013, in which several FOMC members already opined that asset purchases could be reduced over the course of the second half of 2013 (http://www.federalreserve.gov/monetarypolicy/files/fomcminutes20130320.pdf). Also, Fed Chairman Bernanke, during his Testimony to the US Congress on 22 May, already indicated that the Fed could slow down the purchases should the economic improvement sustain (see the archive of the hearing at http://www.jec.senate.gov).
(3) For details, see the transcript for the press conference held after the FOMC meeting in June 2013 (http://www.federalreserve.gov/mediacenter/files/FOMCpresconf20130619.pdf).

6
Box 1.1 (Cont’d)
Chart 1 : Longer-term US Treasury yields picked up in recent months on the market
expectation of potential asset purchase tapering
0.0
0.5
1.0
1.5
2.0
2.5
3.0
07/12 10/12 01/13 04/13 07/13
Start of QE3:FOMC (12-13 Sep 2012 meeting) decided topurchase MBS byUS$40 bn per month
Additional QE3:FOMC (11-12 Dec 2012 meeting) decided to purchase longer-term Treasury securities, by US$45 bn per month, on top of the ongoing purchases of MBS by US$40 bn per month
Conditional timetable for tapering asset purchases revealed:After FOMC (18-19 Jun 2013) meeting, Bernanke laid out the roadmap for normalization of the monetary policy(19 June 2013)
(a) US Government 10-year Treasury yield %
0.0
1.0
2.0
3.0
4.0
3M 6M 2Y 5Y 10Y 30Y
(b) US Government Treasury yield curves
13 Sep 2012 (Start of QE3)
12 Dec 2012 (Additional QE3)
19 Jun 2013 (Conditional timetable fortapering asset purchases revealed)
8 Aug 2013
%
Expectation of asset purchase tapering emerged in the market
Chart 2 : Global stock and commodity prices saw notable gyrations of late
90
100
110
120
130
140
150
160
170
180
07/12 10/12 01/13 04/13 07/13
Dow Jones Industrial Average IndexFTSE 100 IndexNikkei 225 IndexKorea Composite IndexTaiwan Weighted IndexSingapore Straits Times IndexHang Seng Index
(a) Global stock market indicesIndex (2 Jul 2012 = 100)
60
70
80
90
100
110
120
130
07/12 10/12 01/13 04/13 07/13
CRB FoodstuffsCRB MetalsCRB Raw IndustrialsOil price - Brent
Expectation of asset purchase tapering emerged in the market
Start of QE3 Additional QE3
Conditional timetable for tapering asset purchases revealed
Index (2 Jul 2012 = 100)
(b) Global commodity prices
Start of QE3
Additional QE3
Conditional timetable for tapering asset purchases revealed
Expectation of asset purchase tapering emerged in the market

7
Box 1.1 (Cont’d)
Chart 3 : Recent developments of inflation and labour market conditions in the US
-3
-2
-1
0
1
2
3
4
5
6
01/07 01/08 01/09 01/10 01/11 01/12 01/13
Consumer price index
Core consumer price index -excluding food and energy items
(a) Consumer price inflationYear-on-year rate of change (%)
-1000
-500
0
500
1000
1500
0
2
4
6
8
10
12
01/07 01/08 01/09 01/10 01/11 01/12 01/13
Change in non-farm payroll (RHS)
Unemployment rate
Number (Thousand)
(b) Labour market%
The Fed’s several rounds of massive QE measures since the outbreak of global financial crisis in 2008 had quadrupled the size of its balance sheet by July 2013 (Chart 4). Even if the conditional timetable can be materialised, the Fed’s balance sheet would continue to increase until its asset purchases come to an end in mid-2014. Fed Chairman Bernanke also indicated that the Fed would likely maintain unprecedented stimulus with a record-high balance sheet and near-zero target interest rate even after the Fed stopped asset purchases(4). In other words, the global liquidity glut and low interest rate environment, created by the major central banks, including the Fed, the European Central Bank and the Bank of Japan, and being the major drivers behind cross-border capital flows and elevated asset bubble risks in some economies, would likely last for an extended period of time.
As far as Hong Kong is concerned, our small open economy is susceptible to the ebb and flow in global economic and financial conditions. There is much uncertainty about the Fed’s imminent tapering of asset purchases, and also about when the various major central banks would eventually exit from their unconventional monetary policies. Market sentiments would be easily swung by incoming economic data and changes of policy actions by central banks, leading to heightened volatility in global financial, commodity and foreign exchange markets. Asian and emerging economies, including Hong Kong, may experience significant capital flow reversals, increasing the interest rate risks faced by investors and causing larger-than-desirable asset price fluctuations.
(4) See, for example, the testimony presented by Fed Chairman Bernanke to the US Congress on 17 July 2013 (http://www.federalreserve.gov/newsevents/testimony/bernanke20130717a.pdf).

8
Box 1.1 (Cont’d)
Chart 4 : Changes in the Fed’s balance sheet since the global financial crisis
0
500
1,000
1,500
2,000
2,500
3,000
3,500
4,000
08/07 02/08 08/08 02/09 08/09 02/10 08/10 02/11 08/11 02/12 08/12 02/13 08/13
Total assetsAll liquidity facilities*MBSAgencyTreasuries
US$Bn
Note : (*) All Liquidity Facilities include: Term Auction credit; primary credit; secondary credit; seasonal credit;
Primary Dealer Credit Facility; Asset-Backed Commercial Paper Money Market Mutual Fund Liquidity Facility; Term Asset-Backed Securities Loan Facility; Commercial Paper Funding Facility; and central bank liquidity swaps.
While Hong Kong’s financial sector is more than capable of handling the massive capital inflows and outflows day in and day out, the local regulatory bodies have implemented various prudential measures to mitigate systemic risks and keep the financial system sound and resilient. Both supply-side and demand-side measures have also been implemented to contain the housing market bubble risks and to ensure its healthy and stable developments. The Government will stay vigilant to the developments in the external environment and roll out additional measures to safeguard Hong Kong’s macroeconomic and financial stability as and when appropriate.

9
The domestic sector 1.5 The domestic sector stayed resilient in the second quarter. On the back of sanguine local consumer sentiment amid sustained job and income growth, private consumption expenditure (PCE)(3) rose by 4.2% in real terms in the second quarter over a year earlier, following the notable 6.3% increase in the first quarter. Government consumption expenditure grew steadily further, by 3.1% in the second quarter.
Table 1.2 : Consumer spending by major component(a) (year-on-year rate of change in real terms (%))
Total consumer
spending in the domestic
market(a)
Of
Food
which :
Durables
Non- durables
Services
Residents’ expenditure
abroad
Visitor
spending
Private consumption expenditure(b)
2012 Annual 4.1 0.4 19.3 3.9 2.0 4.6 10.8 3.0
H1 4.7 -0.7 26.8 5.0 1.6 6.4 10.9 3.8
H2 3.7 1.6 13.5 2.8 2.4 2.9 10.8 2.2
Q1 5.9 -1.8 32.3 7.4 2.1 6.9 8.7 5.5 Q2 3.5 0.2 21.4 2.8 1.0 6.0 13.1 2.3 Q3 2.5 1.8 9.9 1.3 1.6 4.7 8.5 1.5 Q4 4.7 1.3 16.5 4.1 3.1 1.0 12.8 2.7
2013 H1 8.6 2.6 16.0 18.2 4.3 2.2 23.4 5.2
Q1 8.5 2.9 31.3 9.2 3.9 5.5 18.6 6.3 Q2 8.6 2.4 -0.4 27.1 4.7 -0.9 28.3 4.2
Notes : (a) Consumer spending in the domestic market comprises both local consumer and visitor
spending. Figures of private consumption expenditure, exports of goods, and imports and exports of services were revised back to 2009 as a result of a technical revision exercise conducted by the Census and Statistics Department in mid-2013. For details, please see Note (3) to this chapter.
(b) Private consumption expenditure is obtained by deducting visitor spending from the total consumer spending in the domestic market, and adding back residents’ expenditure abroad.

10
Q12008
Q12009
Q12010
Q12011
Q12012
Q12013
-8
-6
-4
-2
0
2
4
6
8
10
12
14
Year-on-year rate ofchange in real terms
Seasonally adjustedquarter-to-quarter
rate of changein real terms
Percent
Q12008
Q12009
Q12010
Q12011
Q12012
Q12013
-25
-20
-15
-10
-5
0
5
10
15
20
25
30
35
Expenditure on machinery, equipmentand intellectual property products
Expenditure on building and construction
Year-on-year rate of change in real terms (%)
Overall investment expenditure
Diagram 1.2 : Private consumption expenditure was still resilient in the second quarter
Diagram 1.3 : Investment spendingreverted to increase
1.6 Overall investment spending in terms of gross domestic fixed capital formation reverted to increase by 6.9% year-on-year in real terms in the second quarter, after dipping by 3.3% in the first quarter. The bounce-back in the second quarter was mainly driven by a strong rebound in the volatile machinery and equipment investment, which surged by 19.4% in the second quarter. This was largely in line with the latest results of the Quarterly Business Tendency Survey, which indicated a still-positive business sentiment among large enterprises, although that among small and medium-sized enterprises (SMEs) was still rather cautious (see Box 1.2 for details of the consultation on SMEs). Meanwhile, building and construction expenditure edged down in real terms in the second quarter over a year earlier, as the growth in public sector infrastructure works was offset by the decline in private sector construction activity.

11
Box 1.2
Diffusion indices on small and medium-sized enterprises (an update)
To gain a better understanding of the current situation of business receipts, employment and credit access for small and medium-sized enterprises (SMEs)(1), an ad-hoc consultation exercise has been conducted by the Census and Statistics Department on behalf of the Economic Analysis and Business Facilitation Unit since late November 2008 on a sample panel of around 500 SMEs to solicit their feedback. This note provides a further update of the results reported in Box 1.1 in the First Quarter Economic Report 2013.
From June 2011 onwards, the industry coverage and questionnaire design for the exercise have been modified. Specifically, three sectors (viz. travel agents, financing institutions, and insurance agents and brokers) are dropped from the exercise, while questions on access to credit have been modified to gauge SMEs’ views as to whether the current and expected credit access situation are “easy”, “fair” or “tight”, rather than in respect of a comparison with the normal times. The sample size of the panel has consequently been reduced to around 400.
A set of diffusion indices is compiled to indicate the general directions of change in the respondents’ views on business receipts and employment versus the preceding month. While the findings should be interpreted with considerable caution given the coverage and nature of the consultation exercise, they can serve as a rough indicator to enable high frequency monitoring of SMEs’ situation.
Business receipts of the SMEs surveyed, as depicted by the set of diffusion indices, showed that the overall situation remained rather sluggish in recent months (Table 1). In July 2013, the readings for all surveyed sectors were lower than the boom-bust threshold of 50, indicating a relatively weak business situation. The diffusion index for the real estate sector, though seeing some relative improvement since May, remained well below 50 as the property market turned quiet after the Government’s rolling out of further demand management measures earlier this year. Meanwhile, SMEs in the import/export trade and logistics sectors also saw some deterioration in business situation compared with the preceding month, reflecting a challenging external trading environment. As to the employment situation, the feedback from SMEs indicated broadly stable development in recent months (Table 2).
Specifically for import and export trading firms, their views on new export orders were sought separately to gauge the export performance. The diffusion index on new export orders edged up from 49.0 in April 2013 to 49.5 in May and June, but subsequently fell back to 48.5 in July, suggesting a still-unsteady external demand amid the fiscal consolidation in Europe and the US, as well as the mixed performance across many major Asian markets.
(1) Manufacturing enterprises with fewer than 100 employees and non-manufacturing enterprises with fewer
than 50 employees are regarded as SMEs in Hong Kong.

12
Box 1.2 (Cont’d)
The proportion of SMEs reporting tight credit access remained low, at 0.6% in July 2013, thanks to the generally accommodative monetary conditions and the Government’s continued efforts to support SMEs through various loan guarantee schemes.
Table 1 : Diffusion indices^ on business receipts 2012 2013Aug Sep Oct Nov Dec Jan Feb Mar Apr May Jun Jul
Local segments Restaurants 51.0 47.1 49.0 48.0 48.4 49.2 48.4 48.3 45.8 46.7 45.8 48.2 Real estate 55.9 54.4 47.1 39.7 50.0 51.5 39.7 39.7 38.2 42.6 44.1 44.1 Retail trade 46.8 49.1 47.2 48.6 48.1 46.3 47.7 48.1 47.6 47.6 47.1 49.0 Wholesale trade 44.7 44.7 42.1 47.2 47.2 47.2 47.2 47.2 44.4 50.0 47.1 41.2 Business services 48.5 45.5 50.0 45.5 47.0 50.0 53.0 47.0 43.9 48.5 48.5 45.5
External segments Import/export trade 45.9 47.2 47.7 50.5 50.0 50.0 49.0 51.0 49.0 50.0 50.0 48.1 Logistics 38.2 44.1 41.2 43.8 45.0 50.0 44.7 47.4 47.4 44.7 50.0 47.4
All the above sectors* 46.9 47.6 47.2 48.2 48.7 48.9 48.2 48.6 47.0 48.4 48.3 47.3 Notes : (^) The diffusion index is computed by adding the percentage of SMEs reporting “up” to one half
of the percentage of SMEs reporting “same”. A diffusion index reading above 50 indicates that the business condition is generally favourable, whereas an index below 50 indicates otherwise. Respondents were requested to exclude seasonal effects in reporting their views.
(*) Weighted average using total number of SMEs in individual sectors as weights. Table 2 : Diffusion indices on employment situation
2012 2013Aug Sep Oct Nov Dec Jan Feb Mar Apr May Jun Jul
Local segments Restaurants 50.0 48.1 50.0 48.0 48.4 49.2 49.2 49.2 49.2 50.0 48.3 50.0 Real estate 52.9 50.0 50.0 47.1 51.5 50.0 50.0 50.0 50.0 50.0 48.5 50.0 Retail trade 49.5 50.0 50.0 50.0 49.5 50.5 50.0 50.0 50.0 50.0 50.0 50.0 Wholesale trade 50.0 50.0 50.0 50.0 50.0 50.0 50.0 50.0 50.0 50.0 50.0 50.0 Business services 50.0 50.0 53.0 51.5 48.5 50.0 54.5 53.0 51.5 50.0 50.0 48.5
External segments Import/export trade 49.5 50.0 50.0 49.1 50.0 49.1 50.0 50.5 50.0 50.5 51.0 49.0 Logistics 50.0 47.1 47.1 50.0 50.0 50.0 50.0 50.0 50.0 50.0 47.4 47.4
All the above sectors* 49.9 49.7 50.2 49.5 49.7 49.7 50.4 50.5 50.1 50.2 50.1 49.3 Note : (*) Weighted average using total number of SMEs in individual sectors as weights.
Table 3 : Diffusion index on current new export orders 2012 2013Aug Sep Oct Nov Dec Jan Feb Mar Apr May Jun Jul
Import/export trade 46.4 46.8 46.8 49.1 50.0 49.1 50.0 50.5 49.0 49.5 49.5 48.5
Table 4 : Percentage of SMEs reporting tight current access to credit 2012 2013Aug Sep Oct Nov Dec Jan Feb Mar Apr May Jun Jul
All selected sectors* 0.7 0.7 0.7 0.9 1.3 1.3 1.2 0.7 0.9 0.6 0.6 0.6
Note : (*) Weighted average using total number of SMEs in individual sectors as weights.

13
The labour sector 1.7 The labour market remained in a state of full employment. Thanks to a resilient domestic sector as well as buoyant inbound tourism, labour demand remained firm, with total employment increasing steadily further to a fresh record high in the second quarter. Job vacancies likewise surged on a broad front to a 19-year high in March. Enticed by the abundant job opportunities and favourable income conditions, labour supply grew at a slightly faster pace in the second quarter. As a result, the seasonally adjusted unemployment rate fell to 3.3% in the second quarter, from 3.5% in the first quarter. The underemployment rate also stayed low at 1.6%. Amid a tight labour market, wages and earnings saw further improvement in the first quarter. Thanks to the rather tight manpower resource situation in the lower-skilled segment and an additional boost from the upward adjustment of the Statutory Minimum Wage rate since 1 May, average employment earnings for full-time employees in the lowest decile group rose further by 7.7% in nominal terms or 2.9% in real terms in the second quarter over a year earlier. The asset markets 1.8 The local stock market rallied in the first half of the second quarter on some stabilisation of the euro debt situation, as well as the aggressive monetary easing in Japan and rate cut by the European Central Bank. Yet the stock market experienced a sharp correction in the latter part of the second quarter, along with other major overseas stock markets, amid increasing signs of slowdown in the major emerging markets as well as US Fed’s indication of a scale-back in asset purchases. The Hang Seng Index closed the second quarter at 20 803, down 7% from end-March 2013 and down 8% from end-2012. Average daily turnover shrank to $62.3 billion in the second quarter while fund-raising activities stabilized somewhat from low levels. 1.9 The residential property market cooled off visibly after the Government’s introduction of further demand management measures in late February. Trading volume plunged in the second quarter, by 49% from a year earlier or by 30% from the first quarter. Residential property prices edged up by 1% during the second quarter, a notable moderation from the surge of 5% during the preceding quarter. Yet, overall flat prices in June still surpassed the 1997 historic peak by 40%. Also, the housing affordability ratio remained elevated at around 56% in the second quarter. Flat rentals rose by about 1% during the second quarter. As for non-residential property market, the upward pressures on office rentals also eased somewhat, registering a 2% gain during the second quarter, while shop rentals rose further by 5% in tandem with the

14
strength in consumption market. Inflation 1.10 Consumer price inflation held largely stable. Headline consumer price inflation was 4.0% in the second quarter, up from 3.7% in the first quarter. Netting out the effects of the Government’s relief measures to reflect more accurately the underlying inflation situation, underlying consumer price inflation went up only marginally to 3.9% in the second quarter, from 3.8% in the first quarter. The slight rise-back in the second quarter was mainly driven by the progressive feed-through of the rise in private housing rentals in 2012 and by higher prices of basic foodstuffs, yet many other major components saw moderate price increases. Locally, apart from the lagged effects of rental increase last year, the growth in wage costs remained moderate. Externally, imported inflation stayed tame and actually went lower amid the generally still soft global commodity prices as well as easing inflation in Hong Kong’s major import sources. 1.11 The GDP deflator rose modestly by 0.7% in the second quarter, mainly reflecting the moderate increase in prices for consumption expenditure and a notable fall in prices for machinery and equipment.
Q12008
Q12009
Q12010
Q12011
Q12012
Q12013
-4
-2
0
2
4
6
8 Year-on-year rate of change (%)
Composite Consumer Price Index
Diagram 1.4 : Consumer price inflation edged up in the second quarter
Domesticdemand deflator
GDP deflator

15
GDP by major economic sector 1.12 With the economy growing moderately in the first quarter of 2013, net output of the services sector as a whole picked up slightly to 2.8% growth in real terms over a year earlier, from 2.7% in the fourth quarter of 2012. Among the major services sectors, many of them saw solid growth in the first quarter, notably wholesale and retail, information and communications, financing and insurance, accommodation and food services, and professional and business services, reflecting the relatively firm domestic sector and buoyant consumption market. Meanwhile, the net output of import and export trade saw somewhat faster growth in the first quarter compared with the preceding quarter, while transportation and storage relapsed to a small decline amid sluggish cargo flows. Real estate, which mainly reflects the net output of private sector developers and property agency activity, fell back modestly amid a quieter property market following the introduction of further demand management measures during the quarter. As for the secondary sector, manufacturing output grew slightly by 0.5%. Against a higher base of comparison, construction output decreased by 1.5% amid a fall-back in private building activity and moderated expansion in public infrastructure works.

16
Table 1.3 : GDP by economic activity(a) (year-on-year rate of change in real terms (%))
2012 2012 2013
Q1 Q2 Q3 Q4 Q1
Manufacturing
-0.8 -1.6 -2.9 -0.1 1.3 0.5
Construction
11.3 13.1 10.1 5.2 16.1 -1.5
Services(b)
1.8 1.4 1.2 1.9 2.7 2.8
Import/export, wholesale and retail trades
1.5 -0.4 0.3 1.6 3.8 5.8
Import and export trade
0.5 -2.6 -0.9 1.3 3.3 4.1
Wholesale and retail trades
5.8 9.1 5.8 3.0 5.9 12.6
Accommodation(c) and food services
2.2 -0.6 1.6 3.2 4.6 3.8
Transportation, storage, postal and courier services
3.0 4.7 0.5 2.7 3.9 -0.5
Transportation and storage
2.8 4.7 0.4 2.5 3.3 -0.9
Postal and courier services
8.1 4.6 3.3 9.2 14.2 7.6
Information and communications
2.8 0.8 1.4 4.1 4.6 6.0
Financing and insurance
1.1 2.3 0.2 0.8 1.1 4.1
Real estate, professional and business services
3.6 3.6 5.1 3.8 2.2 -0.3
Real estate
5.9 4.5 8.2 6.6 4.5 -2.6
Professional and business services
1.4 2.2 2.1 1.3 0.2 2.2
Public administration, social and personal services
2.0 2.2 2.1 2.0 1.6 1.8
Notes : Figures are subject to revision later on as more data become available.
(a) The GDP figures shown in this table are compiled from the production approach, in parallel with those shown in Table 1.1 which are compiled from the expenditure approach. For details, see Note (1) to this chapter.
(b) In the context of value-added contribution to GDP, the services sectors include ownership of premises as well, which is analytically a service activity.
(c) Accommodation services cover hotels, guesthouses, boarding houses and other establishments providing short term accommodation.

17
Other major developments 1.13 On strengthening economic ties with the Mainland, the Joint Working Group under the Mainland and Hong Kong Closer Economic Partnership Arrangement (CEPA) held its first meeting in Guangzhou on 18 June. Representatives of the Central, Guangdong, and Hong Kong Governments held interactive discussions to address issues relating to the implementation of CEPA in Guangdong. The Governments agreed to continue promoting the effective implementation of CEPA and assisting Hong Kong enterprises in gaining access to the Mainland market. Specifically, progress was made in the five services sectors of audiovisual, accounting, construction, medical, and property management. The two sides also agreed to maintain close co-operation to help businesses make good use of CEPA through enhancing transparency and providing more facilitation measures. 1.14 On addressing longer-term challenges, the Working Group on Long-Term Fiscal Planning was established on 11 June to explore ways to formulate a more comprehensive planning of public finances to cope with the ageing population and the Government’s other long-term commitments. The Working Group is charged with assessing long-term public expenditure needs and changes in government revenue, and proposing feasible measures with reference to overseas experience. 1.15 On housing issues, in the past few months the Steering Committee of the Long Term Housing Strategy discussed various issues, including the current housing situation and problems, projection of housing demand in the next ten years, and formulated plans and priorities for fulfilling the housing needs of different social strata. The Steering Committee aims to launch a public consultation on its findings and recommendations in September. 1.16 On the financial front, the Ministry of Finance issued renminbi (RMB) sovereign bond in Hong Kong for the fifth consecutive year, totalling RMB23 billion in two batches. The issuance offered for the first time a 30-year tenor for institutional investors, extending the benchmark yield curve for RMB bonds in Hong Kong. The increased supply of long-term RMB-denominated fixed income products for institutional investors would also deepen Hong Kong’s bond market. In addition, the Hong Kong Government’s third issuance of inflation-linked bond (iBond) was well received, with trading commencing on 25 June. This would help the development of the local retail bond market.

18
1.17 On fostering overseas linkages, the Government continued to promote economic co-operation and exchanges with our major trading partners as well as new and emerging markets such as Cambodia and Burma. Preparation work was kick-started on Hong Kong’s formal participation in negotiations among World Trade Organisation members for a trade in services agreement, or Plurilateral Services Agreement, which would strengthen Hong Kong’s trade ties with other economies and open up more business opportunities. Hong Kong’s future as an intellectual property trading and management centre was also explored at an overseas visit to the US. Hong Kong and Qatar signed an agreement for the avoidance of double taxation to facilitate Qatari companies to do business and invest in Hong Kong. Indeed, according to the United Nations Conference on Trade & Development’s World Investment Report 2013, Hong Kong’s foreign direct investment inflows ranked third globally in 2012, after the US and the Mainland. Hong Kong remains attractive as a centre of global operations and regional headquarters for leading multinational companies, and as a springboard for Mainland companies to go global. Notes : (1) The Gross Domestic Product (GDP) is an overall measure of net output produced
within an economy in a specified period, such as a calendar year or a quarter, before deducting the consumption of fixed capital. In accordance with the expenditure approach to its estimation, GDP is compiled as total final expenditures on goods and services (including private consumption expenditure, government consumption expenditure, gross domestic fixed capital formation, changes in inventories, and exports of goods and services), less imports of goods and services.
(2) The seasonally adjusted quarter-to-quarter GDP series, by removing the variations that
occur at about the same time and in about the same magnitude each year, provides another perspective for discerning the trend, particularly in regard to turning points. A detailed examination reveals the presence of seasonality in the overall GDP and in some of its main components, including private consumption expenditure, government consumption expenditure, exports of goods, imports of goods, exports of services, and imports of services. However, due to the presence of considerable short-term fluctuations, no clear seasonal pattern is found in gross domestic fixed capital formation. Therefore, the seasonally adjusted series of GDP is compiled separately at the overall level, rather than summing up from its main components.
(3) In mid-2013, Census and Statistics Department conducted a technical revision exercise
to review the estimation method of cross-boundary movements of goods and services in the GDP compilation framework. As a result of the exercise, estimates of private consumption expenditure, exports of goods, and imports and exports of services were revised back to 2009. The levels and growth rates pertaining to the entire series of overall GDP were however not affected by this non-routine revision, as the exercise involved only re-classification of consumption expenditure on goods and services between residents and non-residents.

19
CHAPTER 2 : THE EXTERNAL SECTOR Summary
The global economic environment stayed sluggish in the second quarter of 2013 and continued to weigh on the performance of Hong Kong’s external sector. The recovery of the US economy, confined by the ongoing fiscal adjustment, was still tepid and unsteady. The eurozone economy remained weak, while major emerging markets also grew at a more moderate pace. Consequently, trading and production activities in many Asian economies remained lacklustre.
Merchandise exports grew modestly with considerable fluctuations during the second quarter, reflecting a rather capricious external trading environment. Exports to the advanced countries, including the US, EU and Japan, shrank further. Exports to the Mainland moderated in growth, while those to some major East Asian markets also registered rather weak growth.
Exports of services picked up visibly in the second quarter of 2013. Thanks to the substantial increase in visitor spending, exports of travel services accelerated markedly further and continued to provide the impetus to overall exports of services. Exports of financial and other business services also saw moderate growth as financial and commercial activities improved. Yet held back by the still rather slack external environment, exports of trade-related services grew only modestly, which in turn also dampened those of transportation services.
Hong Kong constantly seeks to strengthen economic cooperation and explore business opportunities with major trading partners. In June, the Joint Working Group under the Mainland and Hong Kong Closer Economic Partnership Arrangement (CEPA) held its first meeting to discuss implementation issues of CEPA in Guangdong. Separately, an agreement for the avoidance of double taxation was signed with Qatar in May, while similar tax treaties signed earlier with Jersey and Kuwait became effective in July.

20
Visible trade Total exports of goods 2.1 The sluggish external environment continued to pose significant challenges to Hong Kong’s trading sector. Merchandise exports (comprising re-exports and domestic exports) expanded modestly by 2.4% in real terms(1) in the second quarter of 2013 over a year earlier, somewhat slower than the 4.0% growth in the first quarter of 2013. Furthermore, the year-on-year rates of change in exports fluctuated considerably during the quarter, starting from a notable year-on-year rise in April, followed by a slight year-on-year decline in May and a marginal increase in June. On a seasonally adjusted quarter-to-quarter comparison, merchandise exports, after a modest 1.5% contraction in the first quarter, shrank further by 2.9% in the second quarter. 2.2 Global economic growth remained subdued in the second quarter, reflecting continued sluggishness in the advanced markets and weakening of growth momentum in some major emerging markets. In the US, the housing market and consumer sentiment saw further improvements, yet the pace of recovery was constrained by the still-elevated jobless rates and the restrictive fiscal policy. The eurozone economy, in spite of some stabilisation in business activity of late, continued to be dragged by the fiscal and structural reforms for redressing the euro debt problems. Meanwhile, the Bank of Japan’s aggressive monetary easing heightened volatility in foreign exchange markets and added burdens on some Asian exporters. In July, the IMF trimmed its global economic growth forecast for 2013 to 3.1%, same as the growth pace in 2012, implying no visible improvement from the performance last year. 2.3 Re-exports(2), the mainstay of overall merchandise exports and accounting for 98.4% of total exports by value, grew by 2.6% year-on-year in real terms in the second quarter of 2013, decelerating somewhat from a 4.2% rise in the first quarter of 2013. Domestic exports, which constitute the remaining 1.6% of total exports, fell by 10.1% in real terms in the second quarter of 2013 over a year earlier, after a 4.5% decline in the preceding quarter.

21
Table 2.1 : Total exports of goods, re-exports and domestic exports (year-on-year rate of change (%))
Total exports of goods
Re-exports Domestic exports
In value terms
In real terms(a)
Change in prices
In value terms
In real terms(a)
Change in prices
In value terms
In real terms(a)
Change in prices
2012 Annual
2.9 -0.1 3.4 3.2 0.1 3.4 -10.4 -13.0 2.5
H1 0.3 -4.6 5.3 0.7 -4.3 5.3 -19.4 -22.2 2.8 H2 5.4 4.2 1.6 5.5 4.4 1.6 -0.3 -2.5 2.0 Q1 -1.5 -7.1 (1.9) 6.2 -1.0 -6.7 (1.9) 6.2 -24.1 -26.9 (-0.4) 3.0 Q2 1.9 -2.2 (-2.3) 4.4 2.3 -1.9 (-2.4) 4.4 -14.8 -17.6 (1.2) 2.6 Q3 3.8 2.5 (2.6) 1.8 3.9 2.6 (2.6) 1.8 0.5 -1.2 (2.9) 1.4 Q4
7.0 6.0 (4.9) 1.4 7.1 6.2 (5.1) 1.3 -1.2 -3.8 (-6.0) 2.7
2013 H1 3.2 3.2 0.5 3.3 3.4 0.4 -4.6 -7.5 3.2
Q1 4.0 4.0 (-1.5) 0.6 4.0 4.2 (-1.5) 0.5 -0.9 -4.5 (-3.0) 4.2 Q2 2.4 2.4 (-2.9) 0.4 2.6 2.6 (-2.9) 0.4 -7.9 -10.1 (-4.2) 2.3
Notes : ( ) Seasonally adjusted quarter-to-quarter rate of change. (a) The growth rates here are not strictly comparable with those in the GDP accounts in Table
1.1, due to differences in coverage and methodology.
Q12008
Q12009
Q12010
Q12011
Q12012
Q12013
-40
-30
-20
-10
0
10
20
30
40 -8
-6
-4
-2
0
2
6
8
4
Trade-weightedreal EERI *
(RHS)
Total import demand inHong Kong's
major markets #(LHS)
Hong Kong's total exportsof goods (LHS)
Diagram 2.1 : The subdued external environment continued to weigh on Hong Kong's exports
Year-on-year rate of change (%) Year-on-year rate of change (%)
Notes : Total exports of goods as depicted refer to the year-on-year rate of change in real terms, while
total import demand in Hong Kong’s major markets as depicted refers to the year-on-year rate of change in US dollar terms in the aggregate import demand in Asia, the United States and the European Union taken together.
(*) The real EERI in this graph is inverted in scale for easier comprehension. A positive
change denotes real appreciation of the Hong Kong dollar.
(#) Import demand figure for the second quarter of 2013 is based on statistics for April and May 2013.

Q12008
Q12009
Q12010
Q12011
Q12012
Q12013
-50
-40
-30
-20
-10
0
10
20
30
40
50Percent
Re-exports
(a) Year-on-year rate of changein real terms
Totalexports
of goods
Q12008
Q12009
Q12010
Q12011
Q12012
Q12013
-30
-25
-20
-15
-10
-5
0
5
10
15
20
25 Percent
(b) Seasonally adjusted quarter-to-quarterrate of change in real terms
Re-exports
Totalexportsof goods
Diagram 2.2 : The further contraction in seasonally adjusted figures pointed to a lacklustre export performance
Domestic exports
Domestic exports
22
India$42.5 billion
(2.5%)Rest of Asia
$116.8 billion(7.0%)
Singapore$28.6 billion
(1.7%)Taiwan
$39.1 billion(2.3%)
Korea$30.4 billion
(1.8%)
Japan$64.1 billion
(3.8%)
EU$153.6 billion
(9.2%)
United States$151.1 billion
(9.0%)
Q12008
Q12009
Q12010
Q12011
Q12012
Q12013
-30-25-20-15-10
-505
1015202530354045
Total exports to Asia
Total exports to non-Asia
Total exports toall markets
Year-on-year rate of change in nominal terms (%)
Diagram 2.3 : Asian markets continued to feature prominently in Hong Kong's exports
Others$131.3 billion
(7.9%)
Mainland of China$913.4 billion
(54.7%)
Total exports of goods in the first half of 2013 :$1,670.9 billion

23
Table 2.2 : Total exports of goods by major market (year-on-year rate of change in real terms (%))
2012 2013 Annual Q1 Q2 Q3 Q4 Q1 Q2 Mainland of China 3.4 -7.8 -0.6 9.7 12.1 8.5 6.3 United States -1.3 -7.1 0.1 -0.1 1.4 -5.0 -8.0 European Union -10.4 -9.7 -12.5 -14.1 -4.8 -5.4 -2.5 Japan 0.9 -1.5 1.5 3.3 0.4 -4.9 -5.5 India* -22.5 -23.8 -23.7 -22.3 -20.0 0.3 8.0 Taiwan -7.9 -21.4 -2.1 -10.7 2.4 14.2 -12.1 Korea -4.0 -5.2 -5.7 -2.2 -2.8 0.5 2.0 Singapore -3.3 -14.1 2.1 -0.3 -0.8 5.2 0.2
Note : (*) A unit value index specifically compiled for exports to India is available since January 2012. The volume figures for growth in exports to India prior to 2013 are crude estimates.
2.4 Analysed by major market, merchandise exports to major Asian economies saw mixed performance in the second quarter of 2013. Exports to the Mainland expanded further by 6.3% year-on-year in real terms, albeit slower than the 8.5% growth in the preceding quarter. Exports to Japan, on the other hand, dipped further in the second quarter with those of consumer goods and raw materials and semi-manufactures registering visible year-on-year contractions, possibly reflecting the still-torpid economic activities in Japan and conceivably also the discouraged import demand because of the much weakened yen. Exports to other higher-income Asian markets saw mixed performance, with those to Taiwan relapsing to a notable decline while those to Singapore and Korea notching up 0.2% and 2.0% respectively compared to the same period last year. Meanwhile, exports to India picked up further in the second quarter, after bottoming out in the first quarter. 2.5 Exports to the US and the EU remained the weak spots in the second quarter of 2013. Despite continued revival in the US housing market, the relatively high unemployment rate and the restrictive fiscal measures further weighed on import demand. As a result, total exports to the US suffered another visible decline in the second quarter from a year earlier. Meanwhile, exports to the EU stayed on a downtrend in the second quarter, amid the subdued final demand and ongoing austerity measures in the eurozone.

24
Box 2.1
A look at intra-regional trade in East Asia(1)
Intra-regional trade is a prominent feature in East Asia’s merchandise trade flows. In 2012, as illustrated in Chart 1, this kind of trade accounted for about 49% of East Asia’s total merchandise exports, up from around 46% in 2000(2). Meanwhile, the share of the region’s exports to the US and the EU fell visibly from 39% to 26% during the period, leaving an impression that the significance of the US and EU markets has been diminishing over time.
However, the higher share of East Asia’s intra-regional trade does not necessarily imply decoupling from the influence of vicissitudes in the advanced economies, as East Asia’s intra-regional trade and the region’s exports to the advanced countries are strongly correlated. Chart 2 shows the year-on-year rates of change in East Asia’s intra-regional trade and the region’s exports to the US and EU over the past decade, which generally move together. The simple correlation between the two series during the period is as high as 0.92. The co-movement between the two series continued in recent periods, with the slowdown in East Asia’s exports to the US and the EU from a peak of over 30% year-on-year in early 2010 to a slight negative growth in the first quarter of 2013, matched by a similar magnitude of deceleration in the intra-regional trade growth.
____________________________
(1) In this Box, East Asia refers to the following ten economies: the Mainland, Hong Kong, Indonesia, Japan, Malaysia, the Philippines, Singapore, Korea, Taiwan and Thailand.
(2) According to the Asia Regional Integration Centre of the Asian Development Bank, the intra-regional trade share in East Asia-15 (viz. the ten member countries of the Association of Southeast Asian Nations (ASEAN), the Mainland, Hong Kong, Japan, South Korea and Taiwan) rose from 52.2% in 2000 to 53.6% in 2011 (latest year available). This was broadly consistent with the trend depicted in this article.
38.9 38.0 36.4 34.4 33.7 33.4 32.9 31.7 29.9 28.8 27.8 26.6 25.7
46.4 46.5 48.1 49.9 50.2 49.6 48.7 47.6 46.7 48.2 48.9 48.9 49.5
14.6 15.5 15.6 15.8 16.1 17.0 18.4 20.6 23.3 23.1 23.3 24.5 24.8
0%
10%
20%
30%
40%
50%
60%
70%
80%
90%
100%
2000 2001 2002 2003 2004 2005 2006 2007 2008 2009 2010 2011 2012
East Asia's exports to rest of the world Intra-regional exports East Asia's exports to US and EU
Chart 1 : Intra-regional exports feature prominently in East Asia's total exports% share in total exports

25
Box 2.1 (Cont’d)
The high degree of co-movement observed could be partly explained by rapidly growing intra-industry trade within East Asia, where companies in different countries specialise in different stages of production, export and import intermediaries between them with a view to sell the final products to the US and EU markets. Dissecting the intra-regional flows in East Asia by end-use category in 2012(3), raw material and capital goods accounted for a majority 75% of the intra-regional trade, while consumer goods contributed less than one-fifth. The heavy concentration on intermediate goods conceivably indicates that the bulk of intra-regional trade in East Asia is related to intra-industry trade. The disproportionately large share of intermediate goods in East Asia’s intra-regional trade also suggests that exports within the region are mostly motivated by vertical specialisation across borders in an attempt to exploit comparative advantages of different countries. This conjecture, coupled with the observation that East Asia’s intra-regional exports tend to move closely in sync with the region’s exports to the US and the EU, suggests that still quite a significant proportion of the intra-regional exports could eventually be destined to the advanced markets after multiple rounds of processing. This conjecture means that East Asia’s exports still come under the heavy influence of the global economic cycle at present and that the lacklustre export performance of East Asia in recent periods stemmed largely from the sluggish final demand in the US and the EU.
____________________________
(3) Intra-regional exports by end-use category are broad-bush estimates based on statistics from the United Nations Comtrade Database.
-40
-30
-20
-10
0
10
20
30
40
50
60
2000 2001 2002 2003 2004 2005 2006 2007 2008 2009 2010 2011 2012 2013
East Asia's intra-regional exports
East Asia's exports to the US and EU
Year-on-year rate of change in US$ terms (%)
Chart 2 : Intra-regional exports in East Asia tended to move closely in line with the region's exports to the US and the EU

26
-50
-40
-30
-20
-10
0
10
20
30
40
Q12008
Q12009
Q12010
Q12011
Q12012
Q12013
-25
-20
-15
-10
-5
0
5
10
15
20Year-on-year rate of change (%)
HK$ / Euro(RHS)
Hong Kong's total exports to EU (RHS)
Year-on-year rate of change (%)
-25
-20
-15
-10
-5
0
5
10
15
20
25
30
35
Q12008
Q12009
Q12010
Q12011
Q12012
Q12013
-50
-40
-30
-20
-10
0
10
20
30
40
50
60
70
Hong Kong's total exports to Mainland
of China (RHS)
Year-on-year rate of change (%)
Mainland of China'simport demand
(LHS)HK$ / RMB
(RHS)
Year-on-year rate of change (%)
Diagram 2.4 : Exports to the Mainland maintained relatively better performance
EU's import demand*
(LHS)
Diagram 2.5 : Exports to the EU remained subdued
Import demand figure for the second quarter of 2013 is based on statistics for Apr-May 2013.
Note : (*)
Q12008
Q12009
Q12010
Q12011
Q12012
Q12013
-30
-25
-20
-15
-10
-5
0
5
10
15
20
25Year-on-year rate of change (%)
Hong Kong'stotal exports
to US
US' import demand
Q12008
Q12009
Q12010
Q12011
Q12012
Q12013
-25
-20
-15
-10
-5
0
5
10
15
20
25
30Year-on-year rate of change (%)
Hong Kong'stotal exports
to Japan
Diagram 2.7 : Exports to Japan also stayed weak amid tepid growth and yen depreciation
Japan'simport
demand
Diagram 2.6 : Exports to the US fell further

27
Q12008
Q12009
Q12010
Q12011
Q12012
Q12013
-60
-40
-20
0
20
40
60
80
100
120
HK$ / INRHong Kong's
total exports toIndia
India'simport demand
Year-on-year rate of change (%)
Q12008
Q12009
Q12010
Q12011
Q12012
Q12013
-40
-30
-20
-10
0
10
20
30
40
50
60
70Year-on-year rate of change (%)
Hong Kong'stotal exports to
Taiwan
Taiwan'simport demand
Diagram 2.8 : Exports to India showed some relative improvement
Diagram 2.9 : Exports to Taiwan reverted to a notable year-on-year decline
HK$ / NT$
Q12008
Q12009
Q12010
Q12011
Q12012
Q12013
-40
-30
-20
-10
0
10
20
30
40Year-on-year rate of change (%)
Hong Kong'stotal exports
to Korea
Korea's import demand
Diagram 2.10 : Exports to Korea picked up to a modest growth
HK$ / Won
Q12008
Q12009
Q12010
Q12011
Q12012
Q12013
-40
-30
-20
-10
0
10
20
30Year-on-year rate of change (%)
HK$ / S$
Hong Kong'stotal exports to
Singapore
Singapore'simport demand
Diagram 2.11 : Exports to Singapore eased mainly on slower exports of consumer goods

28
Imports of goods 2.6 Imports of goods grew by 4.2% in real terms in the second quarter of 2013 over a year earlier, down slightly from a 5.0% growth in the prior quarter, as re-export trade growth moderated and hence reduced import intake for subsequent re-exporting. Retained imports, which accounted for over one-quarter of total imports, held up relatively well and grew by 8.1% in real terms in the second quarter of 2013 over a year earlier, compared with 7.1% in the preceding quarter. Analysed by end-use category, retained imports of foodstuffs and consumer goods expanded only modestly during the period. Retained imports of capital goods recovered strongly, partly helped by the low base a year ago. Those of fuels and raw materials and semi-manufactures, however, relapsed to year-on-year declines in the second quarter.
Table 2.3 : Imports of goods and retained imports (year-on-year rate of change (%))
Imports of goods
Retained imports(a)
In value terms
In real terms
Change in prices
In value terms
In real terms
Change in prices
2012 Annual
3.9 1.0 3.3 3.0 3.5 0.2
H1 1.4 -2.7 4.4 0.4 1.6 -0.7 H2 6.3 4.6 2.2 5.3 5.3 0.9 Q1 0.7 -4.1 (1.6) 5.0 2.4 3.5 (0.6) -1.2 Q2 2.1 -1.3 (-0.9) 3.9 -1.2 * (3.0) -0.3 Q3 4.5 2.7 (2.2) 2.3 3.1 2.9 (1.1) 0.6 Q4
8.1 6.6 (4.7) 2.1 7.6 7.7 (4.0) 1.3
2013 H1
4.1 4.5 0.6 6.4 7.6 1.1
Q1 4.9 5.0 (-1.4) 1.1 7.1 7.1 (-1.3) 2.9 Q2 3.5 4.2 (-1.1) 0.2 5.8 8.1 (3.6) -0.4 Notes : (a) Based on the results of the Annual Survey of Re-export Trade conducted by the
Census and Statistics Department, re-export margins by individual end-use category are estimated and adopted for deriving the value of imports retained for use in Hong Kong.
( ) Seasonally adjusted quarter-to-quarter rate of change.
(*) Change within ±0.05%.

Q12008
Q12009
Q12010
Q12011
Q12012
Q12013
-30
-20
-10
0
10
20
30
40
50
60Percent
Retainedimports
Importsof goods
(a) Year-on-year rate of changein real terms
Q12008
Q12009
Q12010
Q12011
Q12012
Q12013
-20
-15
-10
-5
0
5
10
15
20
25
30Percent
(b) Seasonally adjusted quarter-to-quarterrate of change in real terms
Retainedimports
Importsof goods
Diagram 2.12 : Import growth slowed slightly, but retained imports held up well
29
Table 2.4 : Retained imports by end-use category (year-on-year rate of change in real terms (%))
Consumer goods
Foodstuffs
Capital goods
Raw materials and
semi-manufactures
Fuels
2012 Annual
6.4 1.6 21.7 -6.4 -6.6
H1 7.4 3.6 23.9 -12.2 -5.4 H2 5.4 -0.1 20.0 -0.3 -7.8 Q1 16.1 4.8 50.7 -19.8 -6.9 Q2 0.5 2.5 6.6 -5.1 -4.0 Q3 -5.4 -5.6 20.0 1.6 -4.3 Q4
17.1 4.8 19.9 -2.3 -11.2
2013 H1
2.9 6.6 18.7 5.0 0.9
Q1 4.7 12.0 -3.1 12.3 7.6 Q2 1.3 1.3 38.7 -0.8 -5.4

30
Invisible trade Exports of services
2.7 Exports of services rose notably by 8.1% year-on-year in real terms in the second quarter of 2013, significantly faster than the 5.3% growth in the preceding quarter. Exports of travel services registered even stronger growth amid a spike in visitors’ purchases of gold-related items, providing the key impetus to overall service exports. Those of financial and other business services showed moderate growth, as commercial activities expanded and as fund raising activities stabilised somewhat from low levels last year. However, exports of trade-related services, comprising mainly offshore trade activities, grew only modestly amid the still rather soft trade flows, while those of transportation services continued to record a small decline alongside a slowdown in cargo flows.
Financial andbusiness services
$113.9 billion(22.5%)
Travel services$146.3 billion
(28.9%)
Q12008
Q12009
Q12010
Q12011
Q12012
Q12013
-10
-5
0
5
10
15
20 Percent
Diagram 2.14 : Exports of services grew notably in the second quarter
Diagram 2.13 : Each major service group accounted for a similar share of Hong Kong's
service exports, reflecting our diversified and competitive services sector
Exports of services in the first half of 2013 :$506.4 billion
Transportationservices
$122.9 billion(24.3%)
Seasonally adjustedquarter-to-quarter
rate of change in real terms
Trade-relatedservices
$123.3 billion(24.4%)
Year-on-yearrate of changein real terms

31
Table 2.5 : Exports of services by major service group (year-on-year rate of change in real terms (%))
Exports
of services
Of which :
Trade-related services(a)
Transportation services
Travel services(b)
Financial and
business services
2012 Annual
2.0 0.6 -3.0 11.1 -0.2
H1 2.4 -0.5 -0.7 11.3 1.1 H2
1.6 1.5 -5.1 11.1 -1.5
Q1 2.3 (0.4) -1.6 3.0 9.1 * Q2 2.6 (1.3) 0.7 -3.9 13.6 2.6 Q3 0.2 (-1.5) 1.2 -5.8 8.9 -3.3 Q4
3.0 (2.9) 1.8 -4.3 13.0 0.4
2013 H1
6.7 2.3 -2.0 24.4 2.5
Q1 5.3 (2.7) 2.8 -2.3 19.5 1.5 Q2 8.1 (3.9) 1.8 -1.8 29.4 3.8
Notes : (a) Comprising mainly offshore trade. (b) Comprising mainly inbound tourism receipts. ( ) Seasonally adjusted quarter-to-quarter rate of change. (*) Change within ±0.05%.
Imports of services
2.8 Imports of services resumed a moderate 1.4% decline in real terms in the second quarter of 2013 over a year earlier, reversing the marginal growth of 0.5% in the preceding quarter. Outbound travel of local residents fell slightly on a year-on-year comparison due partly to the difference in timing of the Easter holidays, which fell in late March this year but early April last year. Imports of transportation services and trade-related services also remained dented by the modest regional trade flows. On the other hand, imports of financial and other business services grew modestly, reversing the marginal decline in the preceding quarter.

32
Diagram 2.15 : Travel services had the
largest share in imports of services
Trade-relatedservices
$15.0 billion(6.9%)
Q12008
Q12009
Q12010
Q12011
Q12012
Q12013
-15
-10
-5
0
5
10
15
20 Percent
Diagram 2.16 : Imports of services fell moderately
Year-on-yearrate of changein real terms
Imports of services in the first half of 2013 :$217.5 billion
Seasonally adjustedquarter-to-quarter
rate of change in real terms
Financial andbusiness services
$58.3 billion(26.8%)
Travel services$78.3 billion
(36.0%)
Transportationservices
$65.9 billion(30.3%)
Table 2.6 : Imports of services by major service group (year-on-year rate of change in real terms (%))
Of which :
Imports of services
Travel
services(+)
Transportation
services
Trade-related s
ervices
Financial and business services
2012 Annual
0.4 3.8 -2.4 -0.1 -0.6
H1 2.0 5.2 0.4 -0.7 0.4 H2 -1.1 2.5 -5.1 0.3 -1.4 Q1 3.0 (0.8) 5.7 4.0 * -0.3 Q2 0.9 (-1.3) 4.7 -2.8 -1.3 1.3 Q3 -1.5 (-2.0) 2.9 -4.6 -0.8 -3.7 Q4
-0.7 (1.9) 2.0 -5.7 1.3 0.6
2013 H1
-0.4 2.6 -5.2 1.1 1.0
Q1 0.5 (1.9) 6.0 -5.3 2.3 -0.1 Q2 -1.4 (-3.0) -0.7 -5.1 -0.2 2.4 Notes : (+) Comprising mainly outbound travel spending. ( ) Seasonally adjusted quarter-to-quarter rate of change. (*) Change within ±0.05%.

33
Box 2.2
Performance of exports of consumer goods – a longer-term perspective
Hong Kong’s external trade has seen much volatility in recent years. The slow recovery in the advanced economies has weighed on final demand there, in turn adversely affecting production activity and intra-regional trade in Asia. Yet cyclicality aside, the faster income growth of Asia and, consequently, the strengthening of domestic demand in the region could eventually be an important factor underpinning our trade performance in the longer term. This article highlights the performance of our exports of consumer goods to selected Asian economies over the past decade.
Chart 1 shows that Hong Kong’s exports of consumer goods to selected Asian economies grew much faster than those to the advanced economies, namely the US, EU and Japan (G3), over the past 10 years between 2002 and 2012. Among them, the Mainland market was the brightest spot, registering a cumulative growth of 120% in value terms (or 8.2% per annum). Strong growth was also recorded in a number of developing Southeast Asian markets as well as the newly industrialised economies (namely, Korea, Singapore and Taiwan). In stark contrast, exports of consumer goods to the G3 markets plummeted sharply after the global financial crisis that broke out in late 2008, and remained distinctly weak over the past few years amid their sluggish economic recovery. Against this background, the share of these selected Asian markets in our exports of consumer goods rose from 17% in 2002 to 26% in 2012. Nonetheless, the G3 economies still represented our largest export markets for consumer goods, accounting for a combined 51% of such exports in 2012.
Chart 1 : Exports of consumer goods to selected Asian markets and advanced markets
90
100
110
120
130
140
150
160
170
180
190
200
210
220
230
240
2002 2003 2004 2005 2006 2007 2008 2009 2010 2011 2012
To US, EU and Japan
To the Mainland
To Korea, Singapore and Taiwan
To other selected Southeast Asian economies(Thailand, Malaysia, Philippines, Indonesia)
+120%
+84%
+71%
0%
Index (2002 = 100)

34
Box 2.2 (Cont’d)
A closer examination suggests that the performance of our exports of consumption goods to Asian markets is related to their consumption demand. Using Taiwan and Singapore as examples, Chart 2 illustrates that our exports of consumer goods to these markets roughly followed the movements of their retail sales, an indicator of their consumption demand. However, the ups and downs of their consumption demand still appeared to be sensitive to the global economic cycle, which was mainly driven by the conditions of the advanced economies in recent periods.
Chart 2 : Exports of consumer goods to some Asian markets tended to move in sync with consumption demand there
-20
-10
0
10
20
30
40
2002 2003 2004 2005 2006 2007 2008 2009 2010 2011 2012 2013
HK's exports of consumer goods to TaiwanTaiwan's retail sales in US$ terms
Year-on-year % changeTaiwan
-30
-20
-10
0
10
20
30
40
2002 2003 2004 2005 2006 2007 2008 2009 2010 2011 2012 2013
HK's exports of consumer goods to Singapore
Singapore's retail sales excluding autos in US$ terms
Year-on-year % changeSingapore
As exemplified by the great recession of 2008-09 amid the global financial crisis, consumption demand in many Asian economies, Taiwan and Singapore included, decelerated visibly, conceivably in view of their export-dependent nature. More recently, our exports of consumer goods to the selected Asian markets slowed visibly to a 0.6% year-on-year growth in the first half of 2013, in tandem with the slowdown in many Asian economies’ GDP growth amid the drag from their external sector.
Furthermore, consumer goods accounted for 26% of Hong Kong’s total exports in 2012, considerably smaller than the combined share of raw materials and capital goods at 73%. The latter categories are closely related to production activities involving the regional supply chains, which are more affected by the global economic conditions than by the consumption demand in Asia. As such, our overall export performance is still highly sensitive to the conditions in the advanced economies, which have weighed heavily on the global economy in the recent past (see Box 2.1).
All in all, in the longer run, Asia remains the bright spot in the global economy, and its better growth prospects should bode well for Hong Kong’s exports. Accompanying Asia’s relatively fast economic growth would be a growing appetite for consumption. This is especially true in the case of the Mainland, whose rapid rise in income over the past decade has fuelled a strong growth in our exports of consumer goods there that far outpaced other markets. The Central Government’s strategy of rebalancing the economy towards consumption-led growth should further unleash consumption demand in a vast market, and Hong Kong looks set to benefit from these developments in the years to come.

35
Visible and invisible trade balance 2.9 With the challenging external trading environment still weighing on exports and the resilient domestic demand continuing to lend support to retained imports, the combined visible and invisible trade account recorded a deficit of $25 billion (equivalent to 2.1% of the total value of imports of goods and services) in the second quarter of 2013, similar to the overall trade deficit of $23 billion in the same quarter of 2012 (or 2.1% of the total value of imports of goods and services).
Table 2.7 : Visible and invisible trade balance
($ billion at current market prices)
Total exports Imports Trade balance
Goods Services
Goods
Services
Goods
Services
Combined
As % of impor
ts
2012
Annual 3,592 998 4,116 448 -525 550 25 0.5
H1 1,685 471 1,961 216 -277 255 -22 -1.0 H2
1,907 526 2,155 232 -248 295 47 2.0
Q1 806 240 933 111 -128 129 2 0.2 Q2 879 231 1,028 106 -149 126 -23 -2.1 Q3 946 256 1,059 113 -113 143 29 2.5 Q4
961 270 1,096 118 -135 152 17 1.4
2013 H1 1,801 506 2,124 218 -323 289 -35 -1.5 Q1 872 256 1,024 113 -152 143 -9 -0.8 Q2 929 251 1,100 105 -171 146 -25 -2.1
Note : Figures may not add up exactly to the total due to rounding. Other developments 2.10 Hong Kong constantly seeks to strengthen economic cooperation with major trading partners. The Joint Working Group under the Mainland and Hong Kong Closer Economic Partnership Arrangement (CEPA) held its first meeting in June. The Chief Executive announced in his 2013 Policy Address that an additional Joint Working Group would be established to provide targeted assistance in sectors which have encountered relatively more entry barriers, and helps to resolve CEPA implementation problems encountered in individual provinces and municipalities. The first meeting focused on discussing the CEPA implementation problems in Guangdong.
The representatives from both sides agreed to take additional steps to make good use of CEPA and facilitate Hong Kong businesses in various sectors,

36
particularly in audiovisual, accounting, construction, medical and property management services. Relevant bureaux and departments will maintain close cooperation and follow up with their Mainland counterparts after the meeting. 2.11 Separately, an agreement for avoidance of double taxation and the prevention of fiscal evasion with respect to taxes on income was signed with Qatar in May, representing the 29th comprehensive agreement for the avoidance of double taxation (CDTA) that Hong Kong has concluded with its trading partners. Meanwhile, the CDTA between Hong Kong and Kuwait, signed in May 2010, and that between Hong Kong and Jersey, signed in February 2012, both became effective in July 2013. Notes : (1) Changes in merchandise exports and imports in real terms are derived by discounting
the effect of price changes from changes in the value of the trade aggregates. Estimates of price changes for the trade aggregates are based on changes in unit values, which do not take into account changes in the composition or quality of the goods traded, except for some selected commodities for which specific price indices are available. The real growth figures reported here are based on the constant price measures adopted for compiling the external trade quantum index numbers. They are not strictly comparable with the real trade aggregates under GDP (reported in Chapter 1) which are based on the chain volume measures using the preceding-year prices as weights for aggregating the components. In addition, non-monetary gold is recorded as a separate item in the statistics of merchandise trade and not included in the trade aggregates reported in Chapter 2, but is included in the trade aggregates under GDP in accordance to the international compilation standard.
(2) Re-exports are those goods which have previously been imported into Hong Kong and
are subsequently exported without having undergone in Hong Kong any manufacturing processes which change permanently the shape, nature, form or utility of the goods.

37
CHAPTER 3 : DEVELOPMENTS IN SELECTED SECTORS Summary The residential property market took a breather in the second quarter of
2013, following the announcement of the latest demand-side management measures by the Government in late February and the subsequent mortgage rate hike by major local banks in mid-March. Between March and June, overall flat prices edged up by 1%, a notable moderation from the surge of 5% during the preceding quarter. Meanwhile, trading activities fell to subdued levels.
Raising flat supply through increasing land supply remains the Government’s top policy priority in ensuring a healthy and stable property market. Reflecting the Government’s sustained efforts, total flat supply in the coming few years increased to 70 000 units, the highest level since September 2007.
The commercial and industrial property markets also showed some cool-off
after the introduction of the latest demand-side management measures. Trading activities shrank, and the upward momentum in prices tapered somewhat.
Inbound tourism maintained strong growth in the second quarter, with the
Mainland market remaining the major growth impetus. Total visitor arrivals increased notably by 13.7% over a year earlier to 12.6 million.
Amid the unsteady external trade environment, the performance of the
logistics sector remained generally tepid in the second quarter. In particular, container throughput experienced a sharp fall, partly hit by the strike of a few hundred workers at the Kwai Chung Container Terminals. Meanwhile, air freight throughput recorded modest growth.
Property 3.1 The residential property market took a breather in the second quarter of 2013. It experienced a mild correction in March and April following the announcement of the latest demand-side management measures by the Government in late February and the subsequent mortgage rate hike by major local banks in mid-March. While the market re-gathered some momentum in May, sentiment was dampened again in late June by the US Federal Reserve’s

38
indication of its intention to reduce asset purchases later this year. 3.2 Between March and June 2013, overall flat prices edged up by 1%, a notable moderation from the surge of 5% during the preceding quarter. Flats of different sizes showed mixed performance. Prices of small/medium-sized flats went up marginally by 1%, while prices of large flats declined by 1%. Overall flat prices in June 2013 rose by a cumulative 7% over December 2012. Following the almost uninterrupted uptrend in the past few years, they have surpassed the 1997 peak by a sharp 40%. 3.3 Trading activities were subdued in the second quarter. The total number of sale and purchase agreements for residential property received by the Land Registry plummeted by 30% from the preceding quarter or 49% from a year earlier to 11 443, with declines recorded for all ranges of consideration. Within the total, primary and secondary market transactions shrank by 14% and 33% respectively from the first quarter. In tandem, total consideration fell sharply by 35% from the preceding quarter or 51% from a year earlier to $61.4 billion. In the first six months of 2013, both the number of agreements and total considerations recorded a sharp fall of 31% from the preceding half-year period, to 27 714 and $155.7 billion respectively.
0
1 000
2 000
3 000
4 000
5 000
6 000
7 000
< 1 1-2 2-3 3-5 5-10 > 10
Q2 2012
Q2 2013
Agreements received
0
5 000
10 000
15 000
20 000
25 000
30 000
35 000
40 000
Q12008
Q12009
Q12010
Q12011
Q12012
Q12013
Agreements received
Secondary market
Diagram 3.1 : Trading activities plummeted to a very low level in the second quarter of 2013
Primary market
Consideration in million dollars

39
3.4 By comparison, the leasing market was relatively steady. Overall flat rentals rose by 1% between March and June 2013, same as the 1% gain during the first quarter. Analysed by class, rentals of small/medium-sized flats rose by 1%, while those of large flats declined further by 2%. Compared with December 2012, overall flat rentals in June 2013 rose by 2%. The average rental yield for residential property stayed at 2.8% in June 2013, same as the level in March.
03 04 05 06 07 08 09 10 11 12 1330
40
50
60
70
80
90
100
110
120
130
140
150 Large flats
All flats
Small/medium-sized flats
Index (Oct 1997=100)(b) Rentals
03 04 05 06 07 08 09 10 11 12 1330
40
50
60
70
80
90
100
110
120
130
140
150 Large flats
All flats
Small/medium-sized flats
Index (Oct 1997=100)(a) Prices
Diagram 3.2 : The gain in flat prices moderated in the second quarter of 2013, while rentals rose steadily
Note : Residential property price index pertains to secondary market transactions only. Large flats refer to those with a saleable area of atleast 100 m2, and small/medium-sized flats with a saleable area of less than 100 m2.
3.5 The home purchase affordability (i.e. the ratio of mortgage payment for a 45-square metre flat to median income of households, excluding those living in public housing) remained elevated at around 56% in the second quarter, still markedly above the long-term average of 47.9% over 1993-2012. Should interest rates rise by three percentage points to a more normal level, the ratio would soar to 72%.

40
93
92 93 94 95 96 97 98 99 00 01 02 03 04 05 06 07 08 09 10 11 12 130
10
20
30
40
50
60
70
80
90
100Repayment-income ratio^ (%)
Diagram 3.3 : The mortgage payment to income ratio remained elevatedin the second quarter of 2013
1993-2012 average
Note : (^) The ratio of mortgage payment for a 45m2 flat (assuming 70% loan-to-value ratio and tenor of 20 years) to median income of households (excluding those living in public housing).
56
3.6 Raising flat supply through increasing land supply remains the Government’s top policy priority in ensuring a healthy and stable development of the property market. To demonstrate the Government’s firm resolve to increase land supply and to ensure a steady flat supply, in June the Government announced that a total of nine residential sites, which could provide for about 2 500 flats, would be sold by tender in the third quarter of 2013. Also, in response to the demand by the public and the industry, in June the Government announced that the pre-sale consent for uncompleted flats may be granted 30 months, from the current 20 months, before the expected completion date of the development. 3.7 As a result of the Government’s sustained efforts on increasing land supply, the total supply of flats in the coming few years (comprising unsold completed flats, flats already under construction but not yet sold and flats on disposed sites where construction has yet to commence) continued to rise, from 67 000 units as estimated at end-March 2013 to 70 000 units as estimated at end-June, the highest since September 2007. In addition, another 10 700 units could be added to the supply through conversion of a number of residential sites into “disposed sites” and the completions of auction/tendering of some sites in the months ahead. Nonetheless, short-term supply remains tight. There were only 1 500 private domestic units completed and 5 800 domestic units with notification of commencement of general building and superstructure work in the first half of 2013, representing sharp decreases of 35% and 43% respectively from a year earlier.

41
3.8 As it will take time to increase flat supply, the Government has also put in significant efforts to manage demand and reduce the possible risks to financial stability arising from an exuberant property market(1). In late February the Government introduced another round of demand-side management measures for both residential and non-residential properties by doubling the rates of ad valorem stamp duty (AVD) on transactions of all types of properties and advancing the charging of AVD on transactions of non-residential properties. The Hong Kong Monetary Authority (HKMA) also introduced another round of macro-prudential measures on mortgage lending business, the sixth round since October 2009.
3.9 These measures have yielded notable results. On speculative activities, the number of short-term resale (comprising confirmor transactions and resale within 24 months after assignment) declined further to an average of 154 cases per month or 3.6% of total transactions in the second quarter of 2013, markedly below the monthly average of 2 661 cases or 20.0% in January to November 2010 (i.e. the period before the introduction of the Special Stamp Duty). Reflecting the effects of the Buyer’s Stamp Duty, purchases by non-local individuals and non-local companies plunged to an average of 78 cases per month or 1.8% of total transactions in the second quarter of 2013, markedly lower than the monthly average of 365 cases or 4.5% in January to October 2012. As to mortgage lending, the average loan-to-value ratio of new mortgages was 54% in the second quarter of 2013, much lower than the average of 64% in January to October 2009 before the first round of macro-prudential measures for residential property mortgage lending was introduced by the HKMA.

42
0
5
10
15
20
25
30
0
1 000
2 000
3 000
4 000
5 000
6 000
7 000
8 000
9 000
10 000
11 000
12 000
Q11998
Q11999
Q12000
Q12001
Q12002
Q12003
Q12004
Q12005
Q12006
Q12007
Q12008
Q12009
Q12010
Q12011
Q12012
Q12013
Number
Diagram 3.4 : Speculative activities stayed subdued
Share of total transactions (%)
Resale within 12 - 24 months after assignment
Resale within 6 - 12 months after assignment
Resale within 0 - 6 months after assignment
Confirmor transactions (LHS) Confirmor transactions and short-term resale cases within 24 months as a share of total transactions (RHS)
Note : Confirmor transactions refer to resale before assignment.
0
1
2
3
4
5
6
7
8
9
10
11
12
100
200
300
400
500
600
700
800
900
1 000
1 100
1 200
11 12 01 02 03 04 05 06 07 08 09 10 11 12 01 02 03 04 05 06 07 08 09 10 11 12 01 02 03 04 05 06
2010 2011 2012 2013
Purchases by non-local individuals and non-localcompanies as a share of total transactions (RHS)
Purchases by non-local individuals (LHS)
Purchases by non-local companies (LHS)
Number Share of total transactions (%)
Diagram 3.5 : Purchases by non-local buyers remained low
3.10 The US Federal Reserve announced in June that it might reduce its asset purchases later this year depending on the economic situation in the United States. This might lead to possible fluctuations in international capital flows and market expectation in the months ahead, with significant ramifications on asset prices including flat prices in Hong Kong. The Government will continue to monitor the situation closely, and may introduce measures to ensure a stable and healthy development of the property market as appropriate.

43
3.11 As to the Long Term Housing Strategy, in the past few months the Steering Committee has discussed various issues, including the current housing market situation and problems, projection of housing demand in the next ten years, and formulated plans and priorities for fulfilling the housing needs of different social strata. The Steering Committee aims to publish a consultation document on its findings and recommendations in September for public discussion. 3.12 The commercial and industrial property markets showed some cool-off after the Government’s introduction of the latest demand-side management measures in late February. In the second quarter of 2013, transactions for retail shop space plunged by 69% from the preceding quarter or 66% from a year earlier to 690 cases, a very low level by historical standards(2). Sale prices of retail shop space rose by 2% between March and June 2013, compared with the 3% gain during the first quarter. By comparison, rentals rose by another 5% during the second quarter, after gaining 2% during the first quarter. Between December 2012 and June 2013, sale prices increased by 5%, and rentals by 6%. The average rental yield for retail shop space edged up from 2.3% in March to 2.4% in June 2013. 3.13 Trading activities for office space also plummeted in the second quarter of 2013. The number of transactions for these properties fell sharply by 67% from both the preceding quarter and a year earlier to a low level of 280 cases. The uptrend in sale prices of office space has also tapered. Overall sale prices in June 2013 edged up by 1% over March, decelerating from the surge of 6% during the first quarter. Within the total, prices of Grade A office space were little changed during the second quarter, while those of Grade B and C office space recorded modest increases of 3% and 2% respectively. Meanwhile, overall office rentals continued to rise steadily, by 2% between March and June 2013, slightly lower than the 3% increase during the first quarter. Analysed by grade, rentals of Grade A, B and C office space rose by 2%, 2% and 4% respectively during the second quarter. Compared with December 2012, overall sale prices of office space in June 2013 rose by 8%, while overall rentals increased by 5%. The average rental yields for Grade A and C office space stayed at a low level of 2.8% in June 2013, virtually unchanged from March, while that of Grade B office edged up from 2.8% to 2.9%. 3.14 Similarly, transactions for flatted factory space tumbled by 69% from the preceding quarter or 68% from a year earlier to 700 cases in the second quarter of 2013. Compared with March, sale prices in June 2013 rose by 2%, significantly lower than the rally of 10% during the first quarter. Meanwhile,

44
the rise in rentals picked up somewhat, from 2% during the first quarter to 5% during the second quarter. Sale prices of flatted factory space in June 2013 rose by a noticeable 12% over December 2012, and rentals by a less rapid 7%. The average rental yield stayed at a low level of 2.7% in June, same as in March.
03 04 05 06 07 08 09 10 11 12 1350
100
150
200
250
300
350
400
450
500
550
600
650
700Office spaceRetail shop spaceFlatted factory space
Index (1999=100)(a) Prices
03 04 05 06 07 08 09 10 11 12 1360
80
100
120
140
160
180
200
220Office spaceRetail shop spaceFlatted factory space
Index (1999=100)(b) Rentals
Diagram 3.6 : The non-residential property market slowed down since March
Land 3.15 Reflecting the Government’s ongoing efforts to increase land supply, 11 land sites with a total area of about 9.9 hectares were sold by public tender in the second quarter of 2013, fetching a land premium of $16.7 billion. Within the total, there were seven residential sites, two sites for petrol filling stations, one commercial site and one site for logistics development. For the first half as a whole, 19 land sites with a total area of about 22.5 hectares were sold by public tender. In June the tender exercises for two residential sites in Tuen Mun and Sha Tin, one hotel site in Central and one site for high-tier data centre in Tseung Kwan O commenced, while the tenders for two residential sites in Tseung Kwan O and Lantau Island were awarded in July. 3.16 Regarding exchange of land, one residential site with an area of about 1.4 hectares was approved in the second quarter. As to lease modifications, 14 sites were approved.

45
Tourism 3.17 The inbound tourism sector maintained strong growth in the second quarter. Overall visitor arrivals rose notably by 13.7% over a year earlier to 12.6 million, similar to the growth of 13.5% in the first quarter. Yet the performance of different markets was mixed. The Mainland market remained the major growth impetus, with Mainland visitors surging by another 21.2% to 9.3 million, representing 73.8% of the total. In contrast, visitors from the long-haul and short-haul markets declined by 2.7% and 3.2% respectively(3), reflecting the generally austere economic environment in these economies. Taking the first six months as a whole, overall visitor arrivals rose by 13.6% to 25.4 million. Analysed by the length of stay, same-day visitors leapt by 17.4% over a year earlier in the second quarter, much faster than the 9.9% growth in overnight visitors. As a result, the share of same-day visitors expanded further from 51.1% a year earlier to 52.7% in the second quarter, while that of overnight visitors fell from 48.9% to 47.3% (Box 3.1).
Q12008
Q12009
Q12010
Q12011
Q12012
Q12013
-20
-15
-10
-5
0
5
10
15
20
25
30
35
40 All sources Mainland Short-haul markets* Long-haul markets*
Year-on-year rate of change (%)
Diagram 3.7 : Inbound tourism maintained strong growthon the back of sustained surge in Mainland visitors
Note : (*) See note (3) at the end of this chapter for the definition of short-haul and long-haul markets. 3.18 The average hotel room occupancy rate remained high at 88% in the second quarter. Yet the average achieved hotel room rate declined by 2.6% from a year earlier to $1,376(4) in the second quarter, after rising noticeably in the past few years.

46
Box 3.1
Spending pattern of inbound visitors
Sustained influx of inbound visitors has been rendering strong support to the Hong Kong economy in recent years. According to the Hong Kong Tourism Board, total destination consumption expenditure, including all spending on goods and services consumed in Hong Kong and excluding cross-boundary transportation services, reached record-highs of $185,841 million for overnight visitors and $52,606 million for same-day in-town visitors in 2012.
Inbound visitors spent on a wide spectrum of goods and services in various economic sectors, including apparels, cosmetics and luxury goods, hotel and accommodation, food and beverage, sight-seeing tour and entertainment. In particular, Hong Kong has a long-standing international reputation as the “Shopping Paradise” and its retail sector is crowned for competitive pricing, diversity of merchandise goods available and credibility. Indeed, shopping has accounted for the most of visitor spending through the years. In 2012, shopping took up almost 60% of the spending of overnight visitors and a much higher 90% of that of same-day in-town visitors.
Meanwhile, overnight visitors spent around 20% of their expenditure on hotel bills and 11% on meals outside hotel. In contrast, given the nature of their short-stay in Hong Kong, same-day in-town visitors consumed far less on hotel bills and meals outside hotel, in both absolute terms and as a share of total spending (chart 1).
(a) Overnight visitorsShopping$110,657 million (59.5%)
Hotel Bills$37,663 million (20.3%)Meals Outside Hotel
$20,806 million (11.2%)
Others$16,714 million(9.0%)
Total spending: $185,841 million
(b) Same-day in-town visitors
Total spending: $52,606 million
Meals Outside Hotel$1,851 million (3.5%)
Others$2,995 million(5.7%)
Chart 1 : Spending pattern of overnight and same-day in-town visitors in 2012
Shopping$47,474 million (90.2%)
Hotel Bills$286 million (0.5%)
Notes : Figures might not add up to the total due to rounding. Figures in brackets represent the share in the total.

47
Box 3.1 (Cont’d) It is also interesting to note that the spending patterns differ distinctly among visitors from different markets. Mainland visitors were very enthusiastic in shopping, with overnight visitors from this market spending 71% of their expenditure on merchandise goods. Meanwhile, shopping took up much smaller shares of the spending of short-haul and long-haul(1) overnight visitors, at 42% and 24% respectively (chart 2a). Long-haul overnight visitors spent most on hotel bills, accounting for around 48% of their total spending. A similar pattern was also observed for same-day in-town visitors, with shopping accounting for a high 92% of the expenditure by Mainland visitors. Relatively speaking, short-haul and long-haul visitors spent less on shopping, at 66% and 51% of their expenditures respectively (chart 2b). This is conceivably due to the fact that more than half of the same-day non-Mainland visitors were en-route to other destinations and thus had limited time for shopping in Hong Kong.
0
20
40
60
80
100
0 20 40 60 80 100Share of spending on shopping (%)
(a) Overnight visitors
Long-haul (23.8%, 76.2%)
Short-haul (42.0%, 58.0%)
The Mainland(70.8%, 29.2%)
Chart 2 : Share of spending on shopping and non-shopping in 2012
0
20
40
60
80
100
0 20 40 60 80 100Share of spending on shopping (%)
(b) Same-day in-town visitors
Long-haul (50.6%, 49.4%)
Short-haul (65.5%, 34.5%)
The Mainland (92.1%, 7.9%)
Note: Figures in brackets refer to the share of spending on shopping and non-shopping respectively.
Share of spending on non-shopping (%)
Share of spending on non-shopping (%)
(1) See note (3) at the end of this chapter for the definition of short-haul and long-haul markets.

48
3.19 In June the first berth of the Kai Tak Cruise Terminal, a major infrastructure project in Hong Kong, commenced operation. Together with the two existing berths at Ocean Terminal, Hong Kong can now offer a wider range of cruise facilities for the world’s cruise liners. Upon the completion of the second berth in 2014-15, Hong Kong’s berthing capacity for cruise ships would be vastly enhanced, and our competitiveness and attractiveness as an international tourist destination further strengthened. Logistics 3.20 Amid the unsteady external trade environment, the performance of the logistics sector remained tepid in the second quarter of 2013. Total container throughput fell by another 7.9% from a year earlier to 5.4 million TEUs, partly hit by the strike of a few hundred workers at the Kwai Chung Container Terminals from late March to early May asking for higher pay and improved working conditions(5). For the first half as a whole, container throughput declined by 7.7% from a year earlier to 10.7 million TEUs. In tandem, the value of trade handled at the Hong Kong Port slumped by 6.2% in the second quarter, and its share in overall trade value declined further from 25.5% a year earlier to 23.2%.
-25
-20
-15
-10
-5
0
5
10
15
20
25
30
0
1 000
2 000
3 000
4 000
5 000
6 000
7 000
8 000
9 000
Q12008
Q12009
Q12010
Q12011
Q12012
Q12013
Container throughput by river vessels (LHS) Container throughput by ocean vessels (LHS) Overall year-on-year rate of change (RHS)
Diagram 3.8 : Container throughput continued to record subdued performancein the second quarter
TEU ('000) Percent
*
Note : (*) The container throughput figure for the latest quarter is the preliminary estimate by the Hong Kong Port DevelopmentCouncil, for which a breakdown by ocean and river vessels is not yet available.
3.21 Compared to maritime transport, air cargo movements fared better in the second quarter of 2013. Air freight throughput rose by a modest 2.4% over a year earlier to 1.02 million tonnes. Within the total, inward air cargo

49
throughput increased by 1.4%, and outward cargo by 3.0%. For the first half as a whole, air freight throughput recorded a 2.0% gain over a year earlier to 1.97 million tonnes. Meanwhile, the total value of trade by air rose by 4.5% in the second quarter, and its share in overall trade value edged up from 36.7% a year earlier to 37.2%.
0
200
400
600
800
Q22009
Q22010
Q22011
Q22012
Q22013
(b) Value of trade handled by air*
0
200
400
600
800
1 000
1 200
Q22009
Q22010
Q22011
Q22012
Q22013
(a) Air cargo volume
Diagram 3.9 : Air cargo throughput and value of trade handled by air registered modest growth
Tonne ('000) $Bn
Note : (*) Not including transhipment. Transport 3.22 Traffic flows for most major modes of transport improved in the second quarter. Air passenger traffic increased by 4.2% over a year earlier to 14.6 million, while water-borne passenger trips rose by 1.8% to 6.7 million. As to land-based cross-boundary traffic movements, average daily passenger trips rose by 2.1% to 553 700, though average daily vehicular movements dropped by 1.3% to 42 100. 3.23 The review of the Fare Adjustment Mechanism (FAM) of the MTR Corporation Limited (MTRCL) was completed in April, and the new FAM subsequently took effect in June. The new FAM has incorporated profitability and service performance of the MTRCL and public affordability as additional factors for consideration when the fares are adjusted. The new FAM and its related arrangements will let the MTRCL maintain its financial prudence as a listed company while at the same time taking social responsibility into account during fare adjustment.

50
3.24 In May the three-month “Our Future Railway” Stage 2 Public Engagement exercise for the Review and Update of the Railway Development Strategy 2000 ended. Based on the public’s views and comments collected, the Consultant would optimise the planning for major regional railway corridors and local enhancement schemes so as to map out a long-term railway development blueprint for Hong Kong. The Government would then consider the Consultant’s recommendations, taking into account transport demand, cost effectiveness and development needs of new development areas, with the target of publishing the way forward in 2014. Environment 3.25 In May the Environment Bureau unveiled “Hong Kong: Blueprint for Sustainable Use of Resources 2013-2022”. The blueprint analyses the challenges and opportunities of waste management in Hong Kong, and maps out a comprehensive strategy, targets, policies and action plans for waste management in the coming ten years. The Government aims to achieve a 40% reduction in the per capita disposal rate of municipal solid waste by 2022 through policies including municipal solid waste charging and producer responsibility schemes. The Government will also roll out targeted territory-wide waste reduction campaigns, such as those on food waste reduction, and will allocate resources to enhance and develop new waste-related infrastructure including organic waste treatment facilities, waste-to-energy integrated waste management facilities as well as extension of the existing landfills. These would help cultivate a “Use Less, Waste Less” culture and achieve sustainable waste management in Hong Kong.

51
Notes : (1) For details of the measures promulgated in 2010, see Box 3.1 in the First Quarter
Economic Report 2010, Box 3.1 in the Third Quarter Economic Report 2010 and note (2) at the end of Chapter 4 in the 2010 Economic Background and 2011 Prospects. For details of the measures promulgated in 2011, see note (2) at the end of Chapter 3 in the Half-yearly Economic Report 2011, Box 3.1 in the Third Quarter Economic Report 2011. For details of the measures promulgated in 2012, see Box 3.1 in the Third Quarter Economic Report 2012 and Box 4.1 in the 2012 Economic Background and 2013 Prospects. For details of the measures promulgated in 2013, see Box 4.2 in the 2012 Economic Background and 2013 Prospects and Box 3.1 in the First Quarter Economic Report 2013.
(2) The figures on transaction refer to commercial space, which comprises retail premises
and other premises designed or adapted for commercial use but excludes purpose-built office space.
(3) Short-haul markets refer to North Asia, South & Southeast Asia, Taiwan and Macao,
but excluding the Mainland, while long-haul markets refer to the Americas, Europe, Africa, the Middle East, Australia, New Zealand and South Pacific. In the second quarter of 2013, visitor arrivals from the Mainland, short-haul and long-haul markets accounted for respective shares of 74%, 17% and 9% of total visitors.
(4) The figures on hotel room occupancy and achieved room rate do not include tourist
guesthouses. (5) After the Government took active steps in conciliating the dispute and facilitating all
relevant parties to engage in direct dialogue and explore viable options, the labour strike ended on 6 May.

52
CHAPTER 4 : THE FINANCIAL SECTOR# Summary The low interest rate environment in Hong Kong continued in the second
quarter of 2013 amid the ongoing accommodative monetary policy in the United States.
The Hong Kong dollar exchange rate remained stable against the US dollar
during the second quarter. Meanwhile, the trade-weighted Nominal Effective Exchange Rate Index for the Hong Kong dollar edged down while the Real Effective Exchange Rate Index rose marginally.
Total loans and advances rose by an accelerated pace in the second quarter,
with loans to most economic sectors recording increases. After a volatile first quarter, the local stock market underwent a correction
in the second quarter of 2013. With the market suffering a major setback since mid-May mainly due to concerns over the possible tapering of asset purchases in the United States, the Hang Seng Index at end-June was 6.7% lower than at end-March. Trading activities quietened down while fund raising activities remained subdued.
__________ (#) This chapter is jointly prepared by the Hong Kong Monetary Authority (HKMA) and
the Economic Analysis Division.

53
Interest rates and exchange rates 4.1 The low interest rate environment in Hong Kong continued in the second quarter of 2013 amid the ongoing accommodative monetary policy in the United States. With the Federal Funds Target Rate unchanged at 0-0.25%, the Base Rate under the Discount Window operated by the HKMA stayed at 0.5%(1). The Hong Kong dollar interbank interest rates also hovered at low levels. The overnight HIBOR edged up from 0.08% at end-March to 0.09% at end-June, while the three-month HIBOR stayed virtually unchanged at 0.38%. 4.2 The Hong Kong dollar and US dollar yield curves both steepened sharply during the second quarter amid market concerns over the possible tapering of asset purchases by the US Federal Reserve. Reflecting the larger increase in the Hong Kong dollar yields at the longer tenor, the negative yield spread between 10-year Exchange Fund Notes and 10-year US Treasury Notes narrowed from 75 basis points at end-March to 52 basis points at end-June. Meanwhile, the yield spread between 6-month Exchange Fund Notes and 6-month US Treasury Bills reverted from negative three basis points to positive eight basis points.
0.0
0.5
1.0
1.5
2.0
2.5
3.0
1M 3M 6M 1Y 2Y 3Y 5Y 7Y 10Y
Diagram 4.1 : The US dollar and Hong Kong dollar yield curves both steepened sharply during the second quarter
Percent per annum
Spread of yield between Exchange Fund Bills/Notesand US Treasuries at end-June 2013 :6-month Time to Maturity : +8 basis point5-year Time to Maturity : -29 basis points10-year Time to Maturity : -52 basis points
Time to Maturity
US Treasuries (end-March 2013)
Exchange FundBills/Notes
(end-June 2013)
US Treasuries(end-June 2013)
Exchange FundBills/Notes
(end-March 2013)

54
4.3 Interest rates at the retail level remained at low levels. The Best Lending Rates stayed unchanged at 5.00% or 5.25% through the second quarter. Likewise, the average savings deposit rate and the one-year time deposit rate quoted by the major banks for deposits of less than $100,000 stayed at low levels of 0.01% and 0.15% respectively. Yet some banks raised the short-term interest rates for large-denomination time deposits in June, conceivably to meet their interim liquidity needs at mid-year. As a result, the composite interest rate(2), which indicates the average cost of funds for retail banks, picked up from 0.25% at end-March to 0.32% at end-June.
0
40
80
120
160
200
240
280
320
360
0
1
2
3
4
5
6
1/09 4/09 7/09 10/09 1/10 4/10 7/10 10/10 1/11 4/11 7/11 10/11 1/12 4/12 7/12 10/12 1/13 4/13
Best Lending Rate
Three-monthHIBOR
Aggregate Balance (RHS)
Percent per annum
Overnight HIBOR
Base Rate under the Discount Window
Diagram 4.2 : Hong Kong dollar interest rates remained low (end for the week)
$Bn
4.4 The Hong Kong dollar spot exchange rate remained stable against the US dollar during the second quarter, moving within a narrow range of 7.756 to 7.765 per US dollar. It traded at 7.757 at end-June, slightly strengthened from 7.762 at end-March. Meanwhile, the discounts of the 3-month and 12-month Hong Kong dollar forward rates to the spot rate narrowed from 35 and 110 pips (each pip equivalent to HK$0.0001) to 27 and 70 pips respectively.

55
4.5 Under the Linked Exchange Rate system, movements in the Hong Kong dollar exchange rate against other currencies closely followed those of the US dollar. With the US dollar weakening against the euro and renminbi (RMB) though strengthening against most other Asian currencies, the trade-weighted Nominal Exchange Rate Index for the Hong Kong dollar edged down by 0.1% during the second quarter. On the other hand, the Real Effective Exchange Rate Index(3) rose by a marginal 0.3%.
7.55
7.60
7.65
7.70
7.75
7.80
7.85
7.90
1/10 7/10 1/11 7/11 1/12 7/12 1/13
HK$/US$spot rate
HK$/US$twelve-month forward rate
HK$/US$three-month forward rate
HK$/US$
85
90
95
100
105
110
115
1/08 1/09 1/10 1/11 1/12 1/13
Index (Jan 2010=100)
Nominal EERI
Real EERI
Diagram 4.3 : Hong Kong dollar moved within a narrow range against the US dollar
(end for the week)
Diagram 4.4 : Trade-weighted nominal EERI edged down while real EERI rose marginally
in the second quarter(average for the month)
Linked Rate/Convertibility Zone*
Note : (*) The shaded area represents the Convertibility Zonethat was introduced in May 2005 as part of the threerefinements to the Linked Exchange Rate System.
Money supply and banking sector 4.6 Monetary aggregates continued to expand in the second quarter. The seasonally adjusted Hong Kong dollar narrow money supply (HK$M1) increased by a solid 4.1% over end-March to $982 billion at end-June, while the broad money supply (HK$M3) edged up by 0.1% to $4,554 billion(4). Meanwhile, total deposits with authorised institutions (AIs)(5) grew by 1.5% to $8,481 billion. Among the total, foreign currency deposits expanded by 3.0%, while Hong Kong dollar deposits stayed virtually unchanged.

56
Q12008
Q12009
Q12010
Q12011
Q12012
Q12013
-20
-10
0
10
20
30
40
50
60Percent
Position at end-June 2013 :$982 billion
Year-on-yearrate of change
Quarter-to-quarterrate of change
(a) HK$M1^(seasonally adjusted)
Diagram 4.5 : The monetary aggregates continued to expand in the second quarter
Q12008
Q12009
Q12010
Q12011
Q12012
Q12013
-20
-10
0
10
20
30
40
50
60
(b) HK$M3#^
Percent
Year-on-yearrate of change
Quarter-to-quarterrate of change
Position at end-June 2013 :$4,554 billion
Notes : (^) Figures refer to the positions at end of period. (#) Adjusted to include foreign currency swap deposits.
Table 4.1 : Hong Kong dollar money supply and total money supply
M1 M2 M3 % change during the quarter HK$^ Total HK$(a) Total HK$(a) Total 2012 Q1 2.1 4.6 2.8 2.5 2.7 2.4 Q2 3.6 3.2 -0.3 0.7 -0.3 0.7 Q3 3.4 6.4 4.6 3.2 4.6 3.2 Q4 5.8 6.4 4.6 4.3 4.7 4.3 2013 Q1 3.8 1.0 0.1 1.1 0.1 1.1 Q2 4.1 2.7 0.0 1.9 0.1 1.9 Total amount at end-June 2013 ($Bn) 982 1,428 4,543 9,220 4,554 9,243
% change over a year earlier 18.2 17.4 9.6 10.8 9.7 10.9
Notes : (^) Seasonally adjusted.
(a) Adjusted to include foreign currency swap deposits.
4.7 Total loans and advances rose by an accelerated 6.3% over end-March to $6,098 billion at end-June 2013. Within the total, foreign currency loans surged by 9.7% while Hong Kong dollar loans picked up by 3.9%. Reflecting the faster growth in loans than in deposits, the foreign currency loan-to-deposit ratio rose from 56.8% at end-March to 60.5% at end-June, and that for Hong Kong dollar from 80.6% to 83.7%.

57
4.8 Loans for use in Hong Kong grew by a brisk 7.1% over end-March 2013 to $4,388 billion at end-June, and loans for use outside Hong Kong also increased by 4.2% to $1,710 billion. Within the former, loans to most economic sectors recorded increases. Loans to manufacturing and to wholesale and retail trade rose by 9.3% and 8.9% respectively. Meanwhile, trade financing rallied by another 24.2% despite an unsteady external trade performance. As for property-related lending, loans to building, construction, property development and investment rebounded by 4.2%, while loans for purchase of residential property rose by a decelerated 1.3% amid a cool-off in the property market.
Table 4.2 : Loans and advances
All loans and advances for use in Hong Kong Loans to :
Building, Whole- construction, All loans sale property Purchase and advances Total
% change and development of for use loans during Trade Manu- retail and residential Financial Stock- outside and the quarter finance facturing trade investment property(a) concerns brokers Total(b) Hong Kong(c) advances 2012 Q1 7.3 -0.1 2.9 -1.5 0.1 3.1 -14.6 1.4 4.5 2.3
Q2 5.0 -2.8 3.0 -0.9 2.3 -3.4 -1.4 1.6 4.4 2.3 Q3 5.6 -1.7 4.4 1.9 2.0 -2.5 -16.1 1.6 2.6 1.9 Q4 -8.2 -0.3 2.0 1.7 2.9 6.5 36.7 2.4 3.6 2.8
2013 Q1 19.3 2.6 1.1 -0.7 1.7 3.2 26.2 2.9 3.3 3.0
Q2 24.2 9.3 8.9 4.2 1.3 3.3 17.2 7.1 4.2 6.3 Total amount at end-June 2013 ($Bn)
567 202 390 960 942 291 29 4,388 1,710 6,098
% change over a year earlier
43.5 9.9 17.2 7.2 8.2 10.7 69.7 14.7 14.5 14.7
Notes : Some loans have been reclassified. As such, the figures are not strictly comparable with those of previous quarters.
(a) Figures also include loans for the purchase of flats under the Home Ownership Scheme, Private Sector Participation Scheme and Tenants Purchase Scheme, in addition to those for the purchase of private residential flats.
(b) Loans to individual sectors may not add up to all loans and advances for use in Hong Kong, as some sectors are not included.
(c) Also include loans where the place of use is not known.

58
4.9 The Hong Kong banking sector remains resilient, with the capital positions of the Hong Kong incorporated AIs staying strong. The capital adequacy ratio of these AIs stayed high at an average of 16.6% at end-March 2013. As all of the AIs are well capitalised, so far there has not been any difficulty in complying with the statutory minimum ratios required by the HKMA under the Basel III framework(6). 4.10 The HKMA has been implementing the Basel III framework promulgated by the Basel Committee on Banking Supervision (Basel Committee) since 1 January 2013 in accordance with the transitional timetable set by the Basel Committee. Following the implementation of the first phase of Basel III standards, which covers revised minimum capital requirements calculated based on a stricter definition of capital base and a wider risk coverage, the Banking (Disclosure) Rules 2013 took effect on 30 June 2013 to implement the disclosure requirements. The HKMA targets to have the standards set out in the framework fully phased in by 1 January 2019. 4.11 Meanwhile, the HKMA is preparing for the introduction of the Basel III capital buffers in Hong Kong, in particular the counter-cyclical capital buffer. To this end, the HKMA is assessing appropriate indicators which, in addition to the Basel Committee’s baseline credit-to-GDP ratio gap, may serve as a signal for excessive credit growth with systemic implications (the condition for triggering buffer build-up) and for an impending downturn of the credit cycle (the condition for triggering buffer release).
4.12 On the liquidity standards, in July the HKMA launched the industry consultation on the revised proposals for the local implementation of the Liquidity Coverage Ratio (LCR). The HKMA planned to finalise its policy proposals for LCR implementation within 2013, and to complete the rule-making and legislative processes in 2014, with a view to implementing a set of Banking (Liquidity) Rules on 1 January 2015. 4.13 The HKMA continued to participate in the Basel Committee’s implementation monitoring process (IMP) and carry out its local IMP to assess both the impact of the Basel III requirements and the implementation progress of AIs. Based on the local IMP results, AIs in Hong Kong are generally not expected to encounter major difficulties in complying with the liquidity standards, though some AIs may need to adjust their liquidity profiles or liquid asset composition to satisfy the requirements.

59
4.14 Asset quality of the local banking sector remained strong. The ratio of classified loans to total loans declined further from 0.48% at end-2012 to a record low of 0.46% at end-March 2013. While the delinquency ratio for credit card lending edged up from 0.20% to 0.23%, it was still a low level by historical standards. The delinquency ratio for residential mortgage loans also hovered at a very low level of 0.02% at end-June.
Table 4.3 : Asset quality of retail banks* (as % of total loans)
As at end of period Pass loans Special mention loans Classified loans (gross)
2012 Q1 98.17 1.27 0.57 Q2 98.19 1.28 0.52 Q3 98.19 1.31 0.50 Q4 98.16 1.36 0.48 2013 Q1 98.32 1.22 0.46
Notes : Due to rounding, figures may not add up to 100.
(*) Period-end figures relate to Hong Kong offices and overseas branches. Loans and advances are classified into the following categories: Pass, Special Mention, Substandard, Doubtful and Loss. Loans in the substandard, doubtful and loss categories are collectively known as “classified loans”.
4.15 Offshore RMB business recorded broad-based growth in the second quarter of 2013. RMB trade settlement handled by banks in Hong Kong rose by 34.7% over a year earlier to RMB864 billion in the second quarter. The offshore RMB liquidity pool also expanded, with the outstanding amount of RMB deposits and certificates of deposit issued growing by 6.0% over end-March or 25.9% over a year earlier to RMB861 billion at end-June. Meanwhile, RMB financing activities remained vibrant. The outstanding amount of RMB loans increased from RMB89 billion at end-March to RMB110 billion at end-June. RMB bond issuance also surged from RMB24 billion in the first quarter to RMB45 billion in the second quarter. 4.16 In June the Central Government issued RMB sovereign bonds in Hong Kong for the fifth consecutive year, which included bonds of 30-year tenor for the first time. Apart from broadening the investment options for investors, the issuance of sovereign bonds with longer tenor extended the benchmark yield curve for RMB bonds in Hong Kong, thereby promoting the development of offshore RMB bond market. Separately, the Treasury Markets Association launched the CNH Hong Kong Interbank Offered Rate fixing in June, which provides a reliable benchmark for offshore RMB financial contracts.

60
Table 4.4 : Renminbi deposits and cross-border renminbi trade settlement in Hong Kong
Interest rates on(a)
Number of AIs engaged in
RMB business
Amount of cross-border RMB trade settlement(c) As at end of period
Demand and
savings deposits
Time deposits
Total deposits
Savings deposits(b)
Three-month time deposits(b)
(RMB Mn) (RMB Mn) (RMB Mn) (%) (%) (RMB Mn) 2012 Q1 156,788 397,528 554,317 0.25 0.52 135 571,176 Q2 136,616 421,094 557,710 0.25 0.52 133 641,907 Q3 118,997 426,703 545,701 0.25 0.52 136 716,946 Q4 123,542 479,453 602,996 0.25 0.52 139 702,474 2013 Q1 144,314 523,744 668,058 0.25 0.52 140 830,955 Q2 127,512 570,447 697,959 0.25 0.53 140 864,366 % change in 2013 Q2 over 2012 Q2
-6.7 35.5 25.1 N.A. N.A. N.A. 34.7
% change in 2013 Q2 over 2013 Q1
-11.6 8.9 4.5 N.A. N.A. N.A. 4.0
Notes : (a) The interest rates are based on a survey conducted by the HKMA.
(b) Period average figures.
(c) Figures during the period.
N.A. Not available. The debt market 4.17 The Hong Kong dollar debt market continued to grow in the second quarter. Total gross issuance of Hong Kong dollar debt securities rose by 13.4% over a year earlier or 6.2% over the preceding quarter to $604.7 billion. Public sector debt issuance increased by 7.0% over the preceding quarter, with the issuance of Exchange Fund papers, that by statutory bodies/ government-owned corporations and the Government all recording increases. Meanwhile, private sector debt(7) issuance declined by 2.1%, as the plunge in debt issued by local corporations more than offset the increases in that by AIs and other borrowers. At end-June 2013, the total outstanding balance of Hong Kong dollar debt increased by 3.7% over end-March to a record-high of $1,405.0 billion. This was equivalent to 30.9% of HK$M3 or 25.0% of Hong Kong dollar-denominated assets of the entire banking sector(8). 4.18 For the Government Bond (“GB”) Programme, $3.0 billion of 3-year institutional GBs were issued in May. Meanwhile, the third issuance of inflation-linked retail GB (i.e. iBond) in June was very well received by the

61
general public, receiving over 520 000 valid applications for around $39.6 billion of subscription. The bond was subsequently issued on 24 June and listed on the Stock Exchange of Hong Kong on 25 June. As at end-June 2013, the outstanding size of bonds issued under the GB Programme amounted to $83.5 billion, including 11 institutional issues for a total of $53.5 billion, and three retail issues (iBonds) for a total of $30.0 billion.
Table 4.5 : New issuance and outstanding value of Hong Kong dollar debt securities ($Bn)
Exchange Fund paper
Statutory bodies/government-owned c
orporations Govern-ment
Public sector total AIs
Local corporations
Non-MDBs overseas bor
rowers(a)
Private sector total MDBs(a) Total
New Issuance
2012 Annual 1,851.6 12.0 26.0 1,889.6 190.1 27.7 22.2 240.0 0.8 2,130.4 Q1 455.6 3.4 5.0 464.0 66.9 10.0 5.4 82.2 0.4 546.6 Q2 462.3 2.9 14.5 479.7 40.8 4.1 8.3 53.1 0.4 533.2 Q3 464.6 3.7 3.5 471.9 48.4 8.8 2.7 59.9 - 531.7 Q4 469.0 2.0 3.0 474.0 34.0 4.8 5.9 44.7 - 518.8 2013 Q1 508.9 3.5 7.0 519.4 32.5 11.6 6.1 50.3 - 569.7 Q2 537.6 5.0 13.0 555.6 39.5 2.2 7.5 49.2 - 604.7 % change in 2013 Q2 over 2012 Q2
16.3 72.4 -10.3 15.8 -3.2 -46.3 -9.6 -7.3 - 13.4
% change in 2013 Q2 over 2013 Q1
5.6 42.9 85.7 7.0 21.6 -81.3 22.3 -2.1 - 6.2
Outstanding (as at end of period) 2012 Q1 655.9 50.6 51.0 757.5 250.7 102.3 157.8 510.8 12.4 1,280.7 Q2 656.4 46.8 65.5 768.8 245.4 104.8 151.4 501.5 10.6 1,280.9 Q3 656.8 45.8 65.5 768.1 258.4 112.1 150.7 521.2 10.6 1,299.8 Q4 657.4 45.2 68.5 771.0 263.4 116.2 147.7 527.3 10.3 1,308.6 2013 Q1 708.6 45.7 72.0 826.4 249.7 123.0 145.8 518.5 10.2 1,355.1 Q2 750.1 43.2 85.0 878.3 250.9 117.0 149.0 516.9 9.9 1,405.0 % change in 2013 Q2 over 2012 Q2
14.3 -7.8 29.8 14.2 2.2 11.7 -1.6 3.1 -6.8 9.7
% change in 2013 Q2 over 2013 Q1
5.8 -5.6 18.1 6.3 0.5 -4.9 2.2 -0.3 -3.1 3.7
Notes : Figures may not add up to the corresponding totals due to rounding and may be subject to revisions.
(a) MDBs : Multilateral Development Banks.

62
The stock and derivatives markets 4.19 After a volatile first quarter, the local stock market underwent a correction in the second quarter of 2013. The Hang Seng Index (HSI) has suffered a major setback since mid-May, from 23 493 on 20 May to 20 803 at end-June, mainly due to concerns over the possible tapering of asset purchases in the United States later this year and the liquidity strains in the Mainland. The HSI at end-June was 6.7% lower than at end-March and 8.2% lower than at end-2012. In parallel, the market capitalisation of the Hong Kong stock market shrank to $20.7 trillion at end-June, 5.7% lower than at end-March. Yet it was still the sixth largest stock exchange in the world and second largest in Asia according to the World Federation of Exchanges(9). 4.20 Trading activities also quietened down in the second quarter. Average daily turnover in the securities market fell by 16.2% from the preceding quarter to $62.3 billion, though still representing an increase of 24.2% over the low base a year earlier. Trading of derivatives products showed a mixed performance. The average daily trading volume of futures and options(10) edged up by 2.0% over the preceding quarter. Within the total, trading of H-shares Index futures, HSI options and HSI futures rose by 13.7%, 12.6% and 10.4% respectively, while that for stock options dropped by 7.9%. As to securitised derivatives products, average daily trading value plunged by 22.8%, with trading of derivative warrants and callable bull/bear contracts falling by 30.4% and 9.9% respectively.

63
0
2,000
4,000
6,000
8,000
10,000
12,000
14,000
16,000
18,000
20,000
22,000
24,000
0
20
40
60
80
100
120
140
160
Q12008
Q12009
Q12010
Q12011
Q12012
Q12013
Market capitalisation* (RHS)
Average daily turnover (LHS)
Diagram 4.7 : Trading activities quietened down while market capitalisation shrank
in the second quarter
0
50
100
150
1/11 7/11 1/12 7/12 1/13
Hang Seng Index
S & P 500 Index
FTSE 100 Index
Topix Index (Tokyo)
MSCI Asia ex. Japan Index
Performance in the second quarter of 2013 :HSI : -6.7% Topix : +9.6% S&P : +2.4% FTSE : -3.1%MSCI Asia ex Jp : -6.3%
Index#(end-2010=100)
Diagram 4.6 : The Hang Seng Index has suffered a major setback since mid-May
$Bn $Bn
Notes : (#) Position at end of month. Note : (*) Position at end of quarter.
Table 4.6 : Average daily turnover of derivatives products
of the Hong Kong market
Hang Seng Index futur
es
Hang Seng Index optio
ns
H-shares Index futur
es Stock
options
Total futures and options tra
ded*
Derivative warrants ($Mn)
Callable bull/bear
contracts ($Mn)
Total securitised derivatives traded ($M
n)^ 2012 Annual 82 905 37 597 64 863 228 438 487 994 6,666 6,207 12,873 Q1 84 278 35 475 63 286 238 445 493 555 8,621 7,612 16,234 Q2 88 614 43 634 65 131 225 266 501 374 6,274 6,317 12,590 Q3 77 549 36 050 60 055 211 479 454 782 5,558 5,748 11,307 Q4 81 372 35 255 71 281 239 438 503 888 6,264 5,174 11,438 2013 Q1 82 570 38 464 77 111 278 115 552 686 10,268 6,032 16,301 Q2 91 137 43 304 87 653 256 162 563 658 7,150 5,433 12,583 % change in 2013 Q2 over 2012 Q2
2.8 -0.8 34.6 13.7 12.4 14.0 -14.0 -0.1
% change in 2013 Q2 over 2013 Q1
10.4 12.6 13.7 -7.9 2.0 -30.4 -9.9 -22.8
Notes : (*) Turnover figures for individual futures and options are in number of contracts, and may not add up to the total futures and options traded as some products are not included.
(^) Comprising derivative warrants and callable bull/bear contracts.

64
4.21 Fund raising activities remained subdued. Total equity capital raised, comprising new share floatations and post-listing arrangements on the Main Board and the Growth Enterprise Market (GEM)(11), amounted to only $73.0 billion in the second quarter, though still representing an increase of 14.5% over the low base in the preceding quarter or 10.0% over a year earlier. Within the total, the amount of funds raised through IPOs amounted to $31.5 billion. This was a low level by historical standards, despite soaring by 285% against the low base of comparison in the preceding quarter. Reportedly, some planned launches were postponed amid the stock market correction in the second quarter. Taking the first half as a whole, total equity capital raised plunged by 22.7% from the preceding half-year period to $136.8 billion. 4.22 Mainland enterprises continued to play a dominant role in the local stock market. At end-June, a total of 743 Mainland enterprises (including 176 H-share companies, 121 “Red Chips” companies and 446 private enterprises) were listed on the Main Board and GEM, accounting for 47% of the total number of listed companies and 56% of total market capitalisation. Mainland-related stocks also accounted for 71% of equity turnover and 75% of total equity fund raised in the Hong Kong stock exchange in the second quarter. 4.23 To provide for a regulatory framework for the over-the-counter (OTC) derivative market, the Securities and Futures (Amendment) Bill 2013 was gazetted in June and then introduced into the Legislative Council in July. The Bill introduces mandatory reporting, clearing and trading obligations in line with the Group of Twenty (G20) commitments as appropriate, provides for the establishment and regulation of the necessary infrastructure for fulfilling the mandatory obligations, and provides for the regulation and oversight of key players in the OTC derivative market such as AIs. It would enable Hong Kong to put in place an appropriate and effective regime which meets the requirements of the G20 and is in line with developments in other international financial centres.

65
Fund management and investment funds 4.24 The fund management industry showed mixed performance in the second quarter. Gross retail sales of mutual funds rose by a modest 1.1% over the preceding quarter to US$20.2 billion in the second quarter(12). However, aggregate net asset value of the approved constituent funds under the Mandatory Provident Fund (MPF) schemes(13) edged down by 0.7% from end-March to $452 billion at end-June. Meanwhile, the amount of net assets managed by retail hedge funds decreased further(14). Insurance sector 4.25 The insurance sector(15) continued to record notable growth in early 2013. In the first quarter, gross premium income from long-term business grew by another 17.9% over a year earlier. Within the total, premium income from non-investment linked plans rose by 16.4% and that from investment-linked plans by a sharper 24.2%. Gross and net premium income from general business also expanded, by 13.1% and 15.1% respectively.
Table 4.7 : Insurance business in Hong Kong* ($Mn)
General business Premium for long-term business^
Gross pre
mium Net premi
um Underwriting
profit
Individual life and
annuity (non-linked)
Individual life and
annuity (linked)
Other individual business
Non-retirement scheme
group business
All long-term business
Gross premium
from long-term business
and general busi
ness
2012 Annual 39,312 27,008 2,215 60,339 17,122 104 279 77,844 117,156 Q1 10,924 7,608 853 15,056 3,961 16 79 19,112 30,036 Q2 9,328 6,593 735 14,697 3,924 28 50 18,699 28,027 Q3 10,264 6,930 464 15,351 3,998 26 115 19,490 29,754 Q4 8,796 5,877 163 15,235 5,239 34 35 20,543 29,339 2013 Q1 12,359 8,759 657 17,527 4,919 36 53 22,535 34,894 % change in 2013Q1 over 2012Q1
13.1 15.1 -23.0 16.4 24.2 125.0 -32.9 17.9 16.2
Notes : (*) Figures are based on provisional statistics of the Hong Kong insurance industry.
(^) Figures refer to new business only. Retirement scheme business is excluded.

66
4.26 In June the Government published the consultation conclusions on the key legislative proposals for the establishment of an independent Insurance Authority (IIA). After considering respondents’ comments, the Government refined various proposals including the draft legislative provisions governing the constitution of the IIA, the appointment of responsible officers and certain conduct requirements. The IIA would serve to modernise the regulatory infrastructure of the insurance industry to provide better protection for policyholders, facilitate the stable development of the industry and align with international practice that financial regulators are financially and operationally independent of the Government. The Government is finalising a bill to amend the Insurance Companies Ordinance based on the refined legislative proposals and plans to introduce the bill into the Legislative Council by the end of this year, with a view to setting up the IIA in 2015. Highlights of policy and market developments 4.27 In April the Government launched a three-month public consultation on the legislative proposals to improve Hong Kong’s corporate insolvency law. The proposals covered various aspects of the company winding-up process, including the commencement of winding-up; the appointment, powers, vacation of office and release of provisional liquidators and liquidators; and the conduct of the winding-up process. The proposals would facilitate more efficient administration of the winding-up process, and increase the protection of creditors through streamlining and rationalising the company winding-up procedures and enhancing the regulation of the winding-up process, thereby strengthening Hong Kong’s status as a major international financial and business centre.

67
Notes : (1) Prior to 9 October 2008, the Base Rate was set at either 150 basis points above the
prevailing US Federal Funds Target Rate (FFTR) or the average of the five-day moving averages of the overnight and one-month HIBORs, whichever was higher. Between 9 October 2008 and 31 March 2009, this formula for determination of the Base Rate was temporarily changed by reducing the spread of 150 basis points above the prevailing FFTR to 50 basis points and by removing the other leg relating to the moving averages of the relevant interbank interest rates. After a review of the appropriateness of the new Base Rate formula, the narrower 50 basis point spread over the FFTR was retained while the HIBOR leg was re-instated in the calculation of the Base Rate after 31 March 2009.
(2) In December 2005, the HKMA published a new data series on composite interest rate,
reflecting movement in various deposit rates, interbank and other interest rates to closely track the average cost of funds for banks. The published data enable the banks to keep track of changes in funding cost and thus help improve interest rate risk management in the banking sector.
(3) The trade-weighted Nominal Effective Exchange Rate Index (EERI) is an indicator of
the overall exchange value of the Hong Kong dollar against a fixed basket of other currencies. Specifically, it is a weighted average of the exchange rates of the Hong Kong dollar against some 15 currencies of its major trading partners, with the weights adopted being the respective shares of these trading partners in the total value of merchandise trade for Hong Kong during 2009 and 2010.
The Real EERI of the Hong Kong dollar is obtained by adjusting the Nominal EERI
for relative movements in the seasonally adjusted consumer price indices of the respective trading partners.
(4) The various definitions of the money supply are as follows: M1 : Notes and coins with the public, plus customers’ demand deposits with
licensed banks.
M2 : M1 plus customers’ savings and time deposits with licensed banks, plus negotiable certificates of deposit (NCDs) issued by licensed banks, held outside the monetary sector as well as short-term Exchange Fund placements of less than one month.
M3 : M2 plus customers’ deposits with restricted licence banks and deposit-taking
companies, plus NCDs issued by such institutions and held outside the monetary sector.
Among the various monetary aggregates, more apparent seasonal patterns are found in HK$M1, currency held by the public, and demand deposits.
(5) AIs include licensed banks, restricted licence banks and deposit-taking companies. At
end-June 2013, there were 156 licensed banks, 21 restricted licence banks and 24 deposit-taking companies in Hong Kong. Altogether, 201 AIs (excluding representative offices) from 31 countries and territories (including Hong Kong) had a presence in Hong Kong.
(6) Basel III was introduced by the Basel Committee in December 2010 (and subsequently
revised in June 2011) to strengthen the resilience of banks and banking systems in the

68
light of lessons drawn from the global financial crisis. It tightens the definition of regulatory capital and increases the minimum common equity requirement from 2% to 4.5% of risk-weighted assets and the Tier 1 capital from 4% to 6% (with the total capital ratio remaining at 8%); requires banks to hold a Capital Conservation Buffer of 2.5% during good times and a Countercyclical Capital Buffer in the range of 0% to 2.5% at times of excessive credit growth, both to be met by common equity. It introduces a supplementary leverage ratio as a backstop to risk-weighted capital measures and enhances the transparency of the capital base. In addition, Basel III introduces two liquidity standards i.e. the Liquidity Coverage Ratio to promote short term liquidity resilience and the Net Stable Funding Ratio to encourage more stable funding structures.
(7) The figures for private sector debt may not represent a full coverage of all the
Hong Kong dollar debt paper issued. (8) Assets of the banking sector include notes and coins, amount due from AIs in Hong
Kong as well as from banks abroad, loans and advances to customers, negotiable certificates of deposit (NCDs) held, negotiable debt instruments other than NCDs held, and other assets. Certificates of indebtedness issued by Exchange Fund and the counterpart bank notes issued are nevertheless excluded.
(9) The ranking is made by the World Federation of Exchanges, a global trade association
for the securities exchange industry. Its membership comprises 57 securities exchanges, covering almost all globally recognised stock exchanges.
(10) At end-June 2013, there were 65 classes of stock options contracts and 41 classes of
stock futures contracts. (11) At end-June 2013, there were 1 384 and 183 companies listed on the Main Board and
GEM respectively. (12) These figures are obtained from the Sales and Redemptions Survey conducted by the
Hong Kong Investment Funds Association on their members, and cover only the active authorised funds that have responded to the survey. At end-June 2013, the survey covered a total of 1 216 active authorised funds.
(13) At end-June 2013, there were 19 approved trustees. On MPF products, 38 master
trust schemes, two industry schemes and one employer sponsored scheme, comprising altogether 470 constituent funds, were approved by the Mandatory Provident Fund Schemes Authority. A total of 260 000 employers, 2.39 million employees and 218 000 self-employed persons have participated in MPF schemes.
(14) At end-June 2013, there were four SFC-authorised retail hedge funds with combined
net asset size of US$283 million. The amount of net assets under management represented a 42.0% decrease from the end-March level, though still represented an increase of more than 1.5 times of that at end-2002, the year when the hedge funds guidelines were first issued.
(15) At end-June 2013, there were 154 authorised insurers in Hong Kong. Within this
total, 44 were engaged in long-term insurance business, 91 in general insurance business, and 19 in composite insurance business. These authorised insurers come from 22 countries and territories (including Hong Kong).

69
CHAPTER 5 : THE LABOUR SECTOR Summary • Labour market remained tight in the second quarter of 2013 despite the
continued moderate local economic growth, thanks to buoyant domestic demand and thriving inbound tourism.
• The labour force grew further to 3 877 200 in the second quarter, partly
lured by the abundant job opportunities and better income prospects in the lower-skilled segment. The augmented labour force was thus entirely absorbed by the creation of new jobs, with total employment climbing on a broad front to a new record high of 3 745 100. On a year-on-year comparison, both the labour force and total employment sustained solid growth.
• Consequently, the unemployment situation held largely stable, with the
number of unemployed persons showing little change at 132 100. After discounting for seasonal factors, the seasonally adjusted unemployment rate edged down by 0.2 percentage point to 3.3% in the second quarter.
• Nominal wages and earnings saw further steady and widespread improvement in the first quarter amid the tight labour market conditions. More recent data enumerated from domestic households suggested that grassroots workers continued to enjoy appreciable earnings growth in both nominal and real terms.
Overall labour market situation(1) 5.1 Labour demand stayed strong on the back of a resilient domestic sector, resulting in a slight tightening in labour market conditions in the second quarter. With new job creation completely offsetting the concurrent expansion in labour supply, the number of unemployed persons held virtually unchanged at 132 100. After discounting for seasonal factors, the seasonally adjusted unemployment rate(2) edged down by 0.2 percentage point over the preceding quarter to 3.3% in the second quarter. The underemployment rate(3) stayed low at 1.6% over the same period. Meanwhile, the number of private sector job vacancies soared to a 19-year high in March 2013, with signs of manpower shortage increasingly evident in some sectors and occupations. These developments, coupled with the sustained and across-the-board improvement in wages and earnings, signified a tight labour market on the whole.

70
0
1
2
3
4
5
6
Q1 Q2 Q3 Q4 Q1 Q2 Q3 Q4 Q1 Q2 Q3 Q4 Q1 Q2 Q3 Q4 Q1 Q2 Q3 Q4 Q1 Q2
2008 2009 2010 2011 2012 2013
Diagram 5.1 : Unemployment rate stayed low and signified virtually full employment in the second quarter of 2013
Percent
Seasonally adjustedunemployment rate
Underemployment rate
Long-term unemployment rate
Seasonally adjustedunemployment rate
3.3 3.2 3.5 4.1 5.2 5.3 5.4 5.0 4.6 4.6 4.2 3.9 3.5 3.6 3.2 3.3 3.4 3.2 3.3 3.2 3.5 3.3
Underemployment rate 1.9 1.9 1.8 1.9 2.1 2.3 2.4 2.3 2.2 2.0 1.9 1.8 1.8 1.8 1.8 1.4 1.6 1.4 1.6 1.5 1.6 1.6
Long-term unemploymentrate
0.8 0.6 0.8 0.8 1.1 1.4 1.7 1.6 1.5 1.4 1.1 1.0 0.9 0.9 0.8 0.7 0.8 0.8 0.8 0.7 0.9 0.7
Annual averageunemployment rate
3.5 5.3 4.3 3.4 3.3 Total employment and labour force 5.2 While employers in some segments have turned somewhat more cautious towards recruiting new staff, local hiring sentiment held largely positive in overall terms. Total employment(4) sustained a respectable growth at 2.4% in the second quarter over a year earlier, following the 2.2% gain in the first quarter. With a net addition of 24 900 new jobs during the quarter, total employment reached an all-time high of 3 745 100. On a seasonally adjusted quarter-to-quarter basis, total employment grew further by 0.8%, after the 1.2% growth in the preceding quarter. 5.3 Thanks to the continuous activity expansion in most service sectors, quarter-to-quarter job gains were observed in financing and insurance (up 8 100), transportation, storage, postal and courier services (up 6 400), and real estate (up 6 100) in the second quarter. On the back of continued growth in public infrastructure works, the construction sector also saw a distinct increase in employment of 7 900 over the same period. On the other hand, wholesale, food and beverage service activities, and repair, laundry, domestic and other personal services recorded declines in employment (down by 4 600, 4 100 and 3 600 respectively) between the quarters, though they still posted positive year-on-year employment growth in the second quarter. Analysed by occupational category, employment gains were rather evenly distributed among the higher-skilled and lower-skilled segments (up by 11 300 and 13 600 respectively) during the quarter, though with the former still recording job losses over a year earlier. In terms of social attributes, job creation was

71
particularly vibrant among the older workforce (aged 50 and above), with their employment up visibly by 39 300. 5.4 As regards labour supply, the labour force(5) grew by 2.5% year-on-year in the second quarter, slightly faster than the corresponding 2.4% growth in the preceding quarter. In absolute terms, the labour force registered a net addition of 24 500 job seekers over the quarter, reaching an all-time high of 3 877 200. Further notable increases in labour force participation rates were observed among older workers, in particular females aged 50 – 59, and males aged 60 or above in the second quarter, conceivably induced by the abundant job opportunities in the lower-skilled segment and brighter income prospects after the upward adjustment of the Statutory Minimum Wage (SMW) rate from $28 to $30 per hour with effect from 1 May 2013. In tandem, the labour force participation rate among the youth aged 15 – 19 also increased by 0.8 percentage point to 11.3%. Consequently, the overall labour force participation rate rose by 0.3 percentage point to 61.5%, the highest since the third quarter of 2007. On a seasonally adjusted quarter-to-quarter basis, the labour force expanded by 0.5% in the second quarter, further to the 1.5% growth in the first quarter.
Table 5.1 : The labour force, and persons employed, unemployed and underemployed
Labour force
Persons employed Persons
unemployed(a) Persons underempl
oyed 2012 Annual 3 785 200 (2.2) 3 660 700 (2.4) 124 500 57 600
Q1 3 762 800 (2.9) 3 639 700 (3.0) 123 100 58 600 Q2 3 784 400 (2.2) 3 658 000 (2.6) 126 500 54 400 Q3 3 781 800 (1.5) 3 650 100 (1.4) 131 700 59 200 Q4 3 794 900 (1.7) 3 678 100 (1.7) 116 800 55 900
2013 Q1 3 852 700 (2.4) 3 720 200 (2.2) 132 500 61 100 Three months ending
2013 Apr 3 851 700 (2.4) 3 718 300 (2.2) 133 500 61 800 May 3 869 700 (2.6) 3 735 500 (2.4) 134 200 63 200 Jun 3 877 200 (2.5) 3 745 100 (2.4) 132 100 61 400 <0.5> <0.8> Notes : (a) These include first-time job-seekers and re-entrants into the labour force. ( ) % change over a year earlier.
Seasonally adjusted quarter-to-quarter % change for the second quarter of 2013. Source : General Household Survey, Census and Statistics Department.

72
Q12008
Q12009
Q12010
Q12011
Q12012
Q12013
-1.5
-1.0
-0.5
0.0
0.5
1.0
1.5
2.0
2.5
3.0
3.5
4.0
(a) Year-on-year rate of change
Total employment
Labour force
Percent
Q12008
Q12009
Q12010
Q12011
Q12012
Q12013
-1.5
-1.0
-0.5
0.0
0.5
1.0
1.5
2.0
2.5
3.0
3.5
4.0
(b) Quarter-to-quarter rate of change(seasonally adjusted)
Total employment
Labour force
Percent
Diagram 5.2 : Both employment and labour force continued to expand at a steady pace
Q12008
Q12009
Q12010
Q12011
Q12012
Q12013
-4.0-3.0-2.0-1.00.01.02.03.04.05.06.07.08.09.0
10.0
(a) Year-on-year rate of change
Higher-skilled employment
Lower-skilled employment
Percent
Q12008
Q12009
Q12010
Q12011
Q12012
Q12013
-4.0-3.0-2.0-1.00.01.02.03.04.05.06.07.08.09.0
10.0
(b) Quarter-to-quarter rate of change
Higher-skilled employment
Lower-skilled employment
Percent
Diagram 5.3 : Demand for lower-skilled workers remained sturdy, while that for the higher-skilled ones stayed soft

73
Table 5.2 : Labour force participation rates by gender and by age group
(%)
2008 2009 2010 2011 2012 2013 Q1 2013 Q2 Male 15-24 38.7 38.1 35.4 35.7 36.4 37.4 37.4 of which:
15-19 13.0 12.5 10.2 9.9 10.5 10.6 10.9 20-24 65.5 64.1 60.6 61.1 61.1 63.1 62.0
25-29 94.2 94.7 94.0 93.9 94.5 94.3 93.7 30-39 96.6 96.4 96.5 96.5 96.8 96.1 97.1 40-49 95.2 95.1 95.0 95.1 95.3 95.6 96.3 50-59 83.9 84.3 84.4 84.9 85.1 86.8 86.9 ≥ 60 19.9 21.3 22.0 23.4 25.6 26.0 27.3
Overall 69.7 69.4 68.5 68.4 68.7 69.0 69.5
Female 15-24 42.4 40.3 36.7 37.0 37.5 39.3 39.5 of which:
15-19 12.4 11.3 9.2 9.1 9.7 10.5 11.7 20-24 69.3 66.0 61.4 62.1 62.0 64.6 63.5
25-29 87.4 87.0 86.6 87.5 87.2 88.1 85.2 30-39 77.0 77.3 75.6 76.8 77.5 79.2 79.1 40-49 66.6 68.8 68.2 69.9 70.8 72.7 72.7 50-59 48.6 48.9 49.0 51.6 53.8 54.8 57.1 ≥ 60 5.6 6.6 6.8 8.1 8.8 9.4 9.7
Overall 53.1 53.2 51.9 53.0 53.6 54.6 54.7
Both genders combined 15-24 40.6 39.2 36.0 36.4 37.0 38.4 38.4 of which:
15-19 12.7 11.9 9.7 9.5 10.1 10.5 11.3 20-24 67.5 65.1 61.0 61.6 61.6 63.8 62.8
25-29 90.4 90.3 89.8 90.2 90.3 90.7 88.8 30-39 85.2 85.3 84.3 84.9 85.4 86.0 86.4 40-49 79.8 80.8 80.2 81.0 81.4 82.6 82.8 50-59 66.1 66.5 66.5 68.0 69.2 70.4 71.6 ≥ 60 12.5 13.7 14.1 15.5 16.9 17.4 18.1
Overall 60.9 60.8 59.6 60.1 60.5 61.2 61.5
Source : General Household Survey, Census and Statistics Department.

74
Profile of unemployment 5.5 Labour market conditions remained generally tight as the pace of job creation kept up its strong trend matching the growth in labour supply. Overall, the unemployment situation held broadly stable, with the number of unemployed persons (not seasonally adjusted) remaining virtually unchanged from the preceding quarter at 132 100 in the second quarter. After discounting for seasonal factors, the unemployment rate fell slightly by 0.2 percentage point to 3.3%. 5.6 Analysed by economic sector, art, entertainment and recreation, wholesale, and human health activities recorded notable declines of 2.0, 1.4, and 0.9 percentage points in unemployment rate (not seasonally adjusted) in the second quarter respectively, partially offsetting the increases observed in postal and courier activities, accommodation services and retail (up by 0.9, 0.6 and 0.5 percentage point respectively). For retail and accommodation services in particular, the rise in unemployment rate in the former was mainly due to seasonal softening in staff requirements, while that in the latter was caused by an upsurge in job seekers therein which could not be fully absorbed by newly created jobs. For the low paying sectors(6) as a whole, the unemployment rate remained low at 3.2%, same as the level immediately before the implementation of SMW in May 2011 and slightly lower than that before the recent upward adjustment in May 2013. 5.7 As for occupational category, the unemployment rate for higher-skilled workers decreased across-the-board by 0.3 percentage point to 1.9% in the second quarter. Meanwhile, that for lower-skilled workers was stable at 3.7%, with the unemployment rates of almost all occupational categories within this skill segment holding steady or declining slightly, except elementary occupations. 5.8 In terms of other socio-economic attributes, the unemployment situation showed somewhat diverse performance across different age and educational attainment groups. In the second quarter, decreases in unemployment rate were observed among the mature and older workers aged 40 – 59, while that for the youth aged 15 – 24 witnessed a notable increase. Moreover, workers with lower secondary education saw a visible decline in unemployment rate, offsetting the increases among those with upper secondary and post-secondary education.
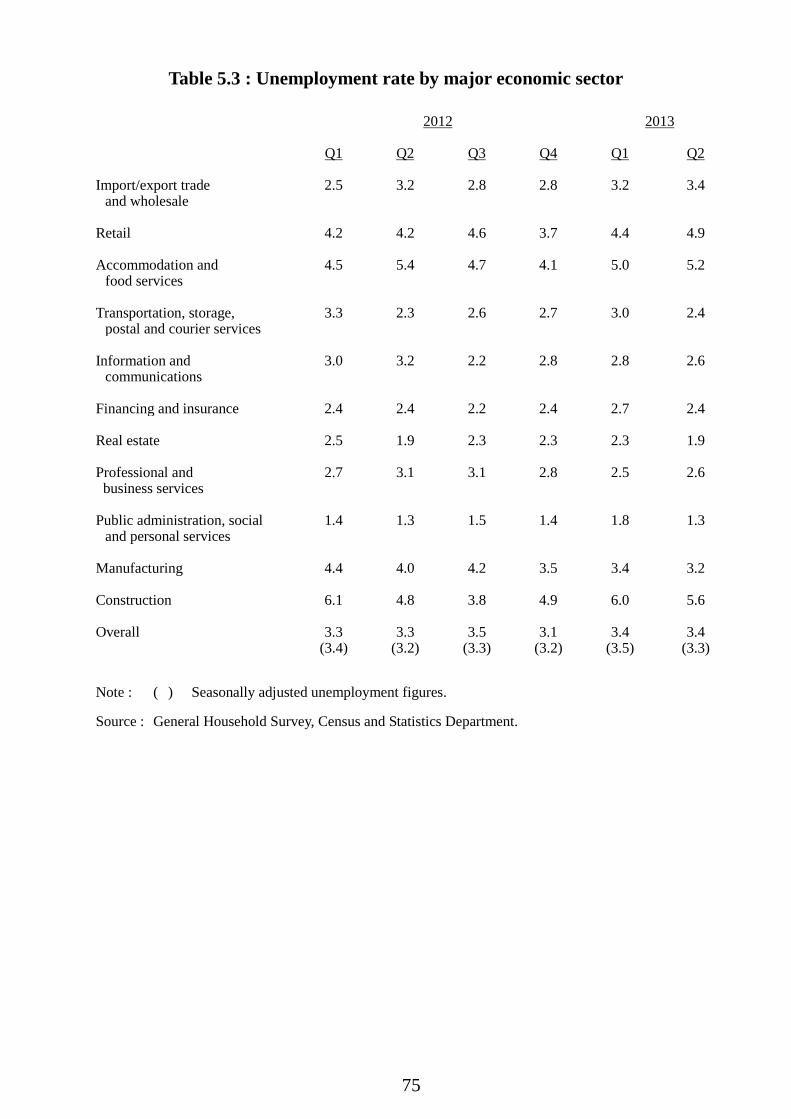
75
Table 5.3 : Unemployment rate by major economic sector
2012 2013 Q1 Q2 Q3 Q4 Q1 Q2 Import/export trade
and wholesale 2.5 3.2 2.8 2.8 3.2 3.4
Retail 4.2 4.2 4.6 3.7 4.4 4.9 Accommodation and
food services 4.5 5.4 4.7 4.1 5.0 5.2
Transportation, storage,
postal and courier services 3.3 2.3 2.6 2.7 3.0 2.4
Information and
communications 3.0 3.2 2.2 2.8 2.8 2.6
Financing and insurance 2.4 2.4 2.2 2.4 2.7 2.4 Real estate 2.5 1.9 2.3 2.3 2.3 1.9 Professional and business services
2.7 3.1 3.1 2.8 2.5 2.6
Public administration, social
and personal services 1.4 1.3 1.5 1.4 1.8 1.3
Manufacturing 4.4 4.0 4.2 3.5 3.4 3.2 Construction 6.1 4.8 3.8 4.9 6.0 5.6 Overall 3.3 3.3 3.5 3.1 3.4 3.4
(3.4) (3.2) (3.3) (3.2) (3.5) (3.3)
Note : ( ) Seasonally adjusted unemployment figures.
Source : General Household Survey, Census and Statistics Department.

76
Q12008
Q12009
Q12010
Q12011
Q12012
Q12013
0
1
2
3
4
5
6
7
Diagram 5.4 : The unemployment rate of the lower-skilled segment held stable as the increase in job seekers therein was mitigated by the creation of new jobs,
while that of the higher-skilled improved somewhatPercent
Unemployment rate of lower-skilled workers
Unemployment rate of higher-skilled workers
Seasonally adjustedunemployment rate
Table 5.4 : Unemployment rates* by skill segment 2012 2013 Q1 Q2 Q3 Q4 Q1 Q2 Higher-skilled segment 1.7 1.8 1.9 2.0 2.2 1.9 Managers and administrators 1.1 1.5 1.4 1.8 1.9 1.6 Professionals 1.7 1.2 1.5 1.5 1.9 1.4 Associate professionals 2.0 2.2 2.3 2.3 2.5 2.2 Lower-skilled segment 3.7 3.6 3.4 3.2 3.7 3.7 Clerical support workers 2.9 3.1 3.5 2.9 3.0 2.9 Service and sales workers 4.1 4.3 4.4 3.6 4.5 4.4 Craft and related workers 6.2 5.0 4.0 4.2 5.5 5.3 Plant and machine operators and assemblers
2.6 1.6 1.6 2.2 1.8 1.8
Elementary occupations 3.5 3.4 2.8 3.0 3.3 3.4 Note : * Not seasonally adjusted, and not including first-time job-seekers and re-entrants into the
labour force. Source : General Household Survey, Census and Statistics Department.

77
Table 5.5 : Unemployment rates* by age and educational attainment
2012 2013 Q1 Q2 Q3 Q4 Q1 Q2 Age 15-24 8.1 9.7 11.5 7.8 8.1 9.6 of which:
15-19 12.2 14.7 15.1 12.3 13.5 17.8
20-24 7.6 8.9 10.9 7.2 7.3 8.3 25-29 3.2 3.8 3.2 3.1 3.3 3.5 30-39 2.4 2.4 2.6 2.1 2.3 2.5 40-49 2.9 2.9 2.7 2.7 3.3 2.7 50-59 3.1 2.8 2.9 3.1 3.5 3.1 ≥ 60 2.7 1.8 1.5 1.8 2.4 2.6 Educational attainment
Primary education and below
3.8 3.8 3.0 3.2 4.1 4.1
Lower secondary
education 4.2 4.3 3.7 4.1 5.1 4.5
Upper secondary
education^ 3.4 3.2 3.4 2.7 3.1 3.2
Post-secondary
education 2.5 2.9 3.6 3.0 2.9 3.0
Notes : * Not seasonally adjusted, but including first-time job-seekers and re-entrants into the
labour force. ^ Including craft courses. Source : General Household Survey, Census and Statistics Department. 5.9 Indicators measuring the intensity of unemployment suggested that the employment conditions remained broadly favourable in the second quarter. Specifically, the number of long-term unemployed persons (i.e. unemployed for six months or longer) fell noticeably by 5 400 over the preceding quarter to 28 900 in the second quarter, as did the long-term unemployment rate by 0.2 percentage point to 0.7%. Meanwhile, the median duration of unemployment fell from 79 to 68 days over the same period. As regards the reasons of unemployment, the proportion of dismissal or lay-offs among those unemployed declined to 51.1%, from 51.9% in the first quarter. All these indicators suggested that the labour market held up relatively well in the recent period.

78
Profile of underemployment 5.10 The overall underemployment situation held steady in the second quarter, with the underemployment rate staying at a low level of 1.6%. When compared with the preceding quarter, the number of underemployed persons remained largely unchanged at 61 400. Among the major economic sectors, decreases in underemployment were found in postal and courier activities, cleaning and similar activities, and accommodation services, offsetting the modest rises seen in warehousing and support activities for transportation, wholesale, and art, entertainment and recreation. Analysed by occupational category, craft and related workers, and clerical support workers faced an increase in underemployment rate in the second quarter compared to the preceding quarter, but this was offset by lower underemployment rate among service and sales workers. Indeed, underemployment tends to be more prevalent in the lower-skilled segment, which accounted for 92% of the total numbers underemployed in the second quarter of 2013.

79
Box 5.1
Part-time employment in Hong Kong The proportion of part-time employees(1) to total employees in Hong Kong held largely stable in recent years. This notwithstanding, the corresponding proportion in 2012, at 7.1% was actually markedly higher than that of 3.7% in 1997. In absolute terms, the number of part-time employees more than doubled to 215 700 between 1997 and 2012 (up by 116%). This also translated into an average annual growth of 5.3%, as against only 0.8% for all employees.
Some of these part-timers worked fewer hours involuntarily (i.e. underemployed) due to sluggish business conditions or having difficulties in finding full-time jobs, especially when the local economy slackened. Chart 1 showed that the number of underemployed persons increased after the Hong Kong economy was badly hit by the 1997-1998 Asian Financial Crisis, the subsequent economic downturn in 2002 and 2003, as well as the 2008-2009 Global Financial Tsunami. As the labour market conditions improved, the number of these involuntary part-timers dwindled. It actually hit its post-1997 low of 50 700 in 2012 when the labour market was relatively tight.
Chart 1 : The number and proportion of voluntary part-time employees
grew notably over the years
0
1
2
3
4
5
6
0
50
100
150
200
250
300
1997 1998 1999 2000 2001 2002 2003 2004 2005 2006 2007 2008 2009 2010 2011 2012
Involuntary part-time(i.e. underemployed) (LHS)Voluntary part-time (LHS)
Voluntary part-time as a shareof all employees (RHS)
(%)Number ('000)
Part-time employeesin which:
Source : General Household Survey, Census and Statistics Department.
In contrast, the number of voluntary part-timers has been broadly on a visible uptrend. In terms of its percentage share among all employees, the figure jumped from 2.4% in 1997 to 5.5% in 2012. The above observations suggested that, apart from cyclical factors, some underlying structural changes might be at work to make part-time employment more prevalent in Hong Kong between 1997 and 2012.
_________________ (1) Part-time employees are defined here to include persons working less than 35 hours during the seven days
before enumeration due to reasons other than vacation. All labour statistics in this box article exclude foreign domestic helpers.

80
Box 5.1 (Cont’d) From employers’ perspective, offering part-time employment represents a more flexible work arrangement in response to the changing economic and market conditions to fit their operational needs. Comparing 2012 with 1997, the percentage share of voluntary part-timers increased across all industries (Chart 2), particularly in retail, food and beverage service activities, and public administration, social and personal services. Some industries like financing, insurance, real estate, professional and business services used to hire predominantly full-time workers, with voluntary part-time employees comprising only around 1% of all employees therein in 1997. However, the corresponding ratio went up sharply to around 3.7% in 2012. Mirroring this, the propensity of higher-skilled jobs having voluntarily part-time nature also increased, even though the lower-skilled segment still accounted for over 80% of voluntary part-time jobs in 2012, similar to the situation in 1997.
Chart 2: All industries and skill segments became more prone to hire part-time employees
1.8 1.7 1.2
4.0 3.6
2.2
1.0
4.4
1.5
2.7 2.4
3.9
2.4 3.0
8.9
10.4
4.8
3.7
8.3
2.6
7.3
5.5
0
2
4
6
8
10
12
Manufacturing Construction Import/exporttrade andwholesale
Retail Food andbeverageservice
activities
Transportation,storage, postal
and courierservices,
informationand
communications
Financing,insurance,real estate,
professionaland business
services
Publicadministration,
social andpersonalservices
Higher-skilled
Lower-skilled
Overall
1997
2012
Share of voluntary part-time to total number of employees (%)
By industry By skill segment
Note : Statistics in 1997 are based on Hong Kong Standard Industrial Classification (HSIC) version 1.1, while that in 2012 are based on
HSIC version 2.0. Industries selected in the above chart are chosen based on the closest classification as far as possible. Source : General Household Survey, Census and Statistics Department.
Besides, the manpower requirements of industries like retail, and public administration, social and personal services which tended to hire more part-timers expanded substantially over the years. Between 1997 and 2012, the number of employees in these two specific industries saw robust growth of 40% and 19% respectively, thereby rendering further impetus to the significant increase in part-time employment.

81
Box 5.1 (Cont’d) Not only were there more part-time job openings, an increasing number of job seekers likewise preferred to engage in part-time employment. Analysed by the reasons of voluntarily taking up part-time jobs (Chart 3), a significant share of employees expressed that they were too busy with housework in both 1997 and 2012. In 1997, around 89% of employees within this category were currently married, working-aged (aged 25-54) women who might wish to find a paid job to supplement their household incomes or to keep up with the society, on top of fulfilling family responsibilities. In 2012, only 68% of respondents citing the same reason belonged to the same age-sex and marital status group, while another 18% were females aged 55 and above. This suggested that the voluntary part-time workforce, which is typically female-dominated, turned more mature over the years.
Chart 3: Reasons of employees voluntarily taking up part-time jobs (i.e. employees not available to work for longer hours) in 1997 and 2012
Working in a full-time job with less than
35 hours per week^(16%)
Too busy with housework
(52%)Too busy with school
(6%)
No financial need
(2%)
Permanent sickness, disablement, old age
or partially retired (8%)
Others(15%)
Too busy with housework
(45%)
Too busy with school
(17%)
No financial need
(7%)
Others(12%)
2012
Permanent sickness, disablement, old age or partially retired
(14%)
Working in a full-time job with less than
35 hours per week^(5%)
1997 Notes: (^) Probably due to the specific nature of certain jobs, such as pilots and flight attendants, these employees indicated that they
worked in full-time jobs even though they worked less than 35 hours during the 7 days before enumeration. Figures may not add up to100 due to rounding. Source : General Household Survey, Census and Statistics Department.
Echoing the above observation, the number of the older (aged 55 and above) voluntary part-timers leaped by almost four folds from 1997 to 2012, far exceeding the population(2) growth of this age group (around 60%) over the same period. The proportion of the older group in all voluntary part-timers also doubled from only 12% in 1997 to 24% in 2012. Around half of these older employees cited “permanent sickness, disablement, old age or partially retired” for not working longer hours in 2012.
Conceivably, better income prospects and ample job opportunities could potentially entice older people to join the labour market by taking up part-time jobs. This is observed in recent years when the labour market was tight, as well as after the implementation of Statutory Minimum Wage in May 2011. For example, there were only around 1.5% of the older population taking up voluntary part-time jobs during 2008-2010. The proportion went up to 1.8% in 2011 and increased further to 2.1% in 2012. Nevertheless, it is worth noting that a visibly higher share of older voluntary part-timers (10% in 2012 vis-à-vis 3% in 1997) did not want to work for longer hours as they had no financial need. Apparently, part-time employment has been regarded by these older workers concerned as one of the ways to stay active in the society.
_________________
(2) Population refers to land-based non-institutional population which does not cover inmates of institutions and persons living on board vessels.

82
Box 5.1 (Cont’d) Meanwhile, although the labour force participation rate of young people (aged 15-24) fell from 47.5% in 1997 to 35.9% in 2012 as a result of enhanced educational pathways, there were more opportunities for young people to combine work with education for paving the way to develop their longer-term career. In 2012, 12% of employees aged 15-24 were voluntary part-timers, up markedly from 2% in 1997. The increased prevalence of such a two-pronged development was also borne out by a notable increase in the proportion of young voluntary part-time employees saying that they were too busy with schoolwork, from 46% in 1997 to 78% in 2012.
All in all, the notable growth in part-time employment over the years was the combined results of market responses to economic and social changes, as well as people’s changing attitude towards work. More flexible working arrangements allow workers to have a better balance between work and other activities, and more importantly, work in accord with their preferences. With the labour force expected to start a secular decline amid an ageing population in about 5 years’ time, the availability of part-time employment opportunities shall continue to provide more options for people from different social and demographic strata to participate in the local labour market and to contribute to Hong Kong’s economic growth.

83
Profile of employment in establishments 5.11 The quarterly statistics collected from private sector establishments on employment, vacancies, wages and payroll are available only up to March 2013. Attempts have been made where possible to bring the analysis more up-to-date by drawing reference to information from supplementary sources. 5.12 Total employment in private sector establishments enumerated in March 2013 expanded further by 1.9% over a year earlier to a new record high of 2 689 700, indicating that job creation remained vibrant in the first quarter despite the moderate local economic growth. Job gains were almost across-the-board and particularly notable in construction sites (up 10.1% year-on-year), the latter being underpinned by a sustained high level of public infrastructure works. Solid increases in employment were also seen in most of the service sectors, such as real estate (up 4.0%), professional and business services (up 3.4%), information and communications (up 3.3%), social and personal services (up 3.2%), accommodation and food services (up 2.4%), and retail (up 2.3%), thanks to resilient domestic demand and gradually improving business activities amid the relative stabilisation of global financial conditions. On the contrary, manufacturing employment continued its secular downtrend (down 3.7% year-on-year), while that in financing and insurance reverted to a modest decline (down 1.1%). Analysed by establishment size, employment in large enterprises expanded further by 2.8% year-on-year in March and contributed 78% of all additional headcounts in March 2013, while that in small and medium-sized enterprises (SMEs)(7) grew only modestly by 0.9%. As regards the civil service, employment sustained a steady growth at 0.9% over a year earlier.

84
Table 5.6 : Employment by major economic sector 2012 2013 Annual average Mar Jun Sep Dec Mar Import/export trade
and wholesale 556 400
(-1.1) 557 200
(-1.4) 558 300
(-0.4) 555 400
(-1.6) 554 600
(-0.9) 558 000
(0.1) Retail 259 100
(2.5) 256 800
(2.2) 259 400
(2.9) 259 700
(2.7) 260 200
(2.1) 262 700
(2.3) Accommodation(a) and
food services 272 300
(2.6) 269 000
(2.3) 272 300
(2.3) 273 700
(2.8) 274 200
(3.0) 275 600
(2.4) Transportation, storage,
postal and courier services
166 600 (1.8)
165 600 (2.2)
166 700 (2.2)
166 900 (1.9)
167 200 (1.1)
168 100 (1.5)
Information and
communications 96 400
(5.6) 95 200
(6.6) 95 900
(5.3) 97 500
(6.3) 97 200
(4.2) 98 400
(3.3) Financing, insurance,
real estate, professional and business services
666 500 (3.1)
662 200 (4.6)
664 700 (3.5)
668 200 (2.4)
671 000 (1.9)
676 100 (2.1)
Social and personal services 450 000
(2.4) 444 600
(1.9) 450 600
(2.7) 450 800
(2.3) 454 200
(2.8) 458 600
(3.2) Manufacturing 106 900
(-5.1) 108 000
(-6.2) 107 600
(-5.4) 106 800
(-4.3) 105 300
(-4.6) 104 000
(-3.7) Construction sites
(manual workers only) 71 300 (13.8)
70 600 (20.1)
71 700 (22.4)
72 200 (13.4)
70 600 (1.7)
77 800 (10.1)
All establishments surveyed
in the private sector(b) 2 656 000
(1.9) 2 639 700
(2.1) <0.4>
2 657 700 (2.3)
<0.7>
2 661 500 (1.6)
<0.2>
2 665 000 (1.3)
<0.1>
2 689 700 (1.9)
<0.9> Civil service(c) 159 300
(1.1) 159 200
(1.5) 159 200
(1.2) 159 100
(0.9) 159 700
(0.7) 160 700
(0.9)
Notes : Employment figures enumerated from business establishments, as obtained from the Quarterly Survey of Employment and Vacancies, are somewhat different from those enumerated from households, as obtained from the General Household Survey. This is mainly due to difference in sectoral coverage: while the former survey covers selected major sectors, the latter survey covers all sectors in the economy.
(a) Accommodation services sector covers hotels, guesthouses, boarding houses and other establishments providing short term accommodation.
(b) The total figures on private sector employment cover also employment in mining and quarrying; and in electricity and gas supply, and waste management, besides employment in the major sectors indicated above.
(c) These figures cover only those employed on civil service terms of appointment. Judges, judicial officers, ICAC officers, locally engaged staff working in the Hong Kong Economic and Trade Offices outside Hong Kong, and other government employees such as non-civil service contract staff are not included.
( ) % change over a year earlier.
< > Seasonally adjusted quarter-to-quarter % change. Sources : Quarterly Survey of Employment and Vacancies, Census and Statistics Department. Quarterly Employment Survey of Construction Sites, Census and Statistics Department.

85
Vacancies
5.13 Job vacancies in private sector establishments rose considerably further across most economic sectors on entering 2013 amid a relatively tight labour market. The number of private sector vacancies rose by 14.6% year-on-year to a 19-year high of 80 170 in March 2013, following an increase of 18.0% in December 2012. On a seasonally adjusted basis, the number of vacancies grew by 6.0% in March 2013 over three months ago. 5.14 Among all the major economic sectors, more prominent increases were seen in accommodation and food services (up 40.9% year-on-year), construction sites (up 39.6%), import/export trade and wholesale (up 16.7%), and retail (up 15.0%) in March 2013. Analysed by occupational category, the increases in job openings were concentrated in the lower-skilled segment (up 22.7% year-on-year), more notably among craft and related workers (up 50.2%), service and sales workers (up 33.9%), and plant and machine operators and assemblers (up 33.0%). Meanwhile, the decline in higher-skilled vacancies eased to 0.5%, as the improved job openings for associate professionals (up 7.2%) helped cushion against the persistent softness in managers and administrators (down 26.6%) and professionals (down 19.7%). In terms of establishment size, SMEs posted a notable year-on-year increase of 18.0% in job vacancies, while large enterprises also recorded an appreciable growth at 11.6%. Within the civil service, the number of vacancies was 6 220 in March 2013, represented a steady growth of 5.8% over a year earlier. 5.15 Analysing the number of job openings in private sector establishments relative to that of job-seekers, the ratio of job vacancies per 100 unemployed persons was 61 in March 2013, up from 56 and 57 recorded three months ago and a year earlier respectively, pointing to a further tightening in overall manpower resource balance. While the ratio for lower-skilled jobs held broadly stable at 62 between December 2012 and March 2013, that for higher-skilled jobs rebounded from 61 to 78. The latter improvement was mainly driven by the increased job openings for associate professionals. Analysed by economic sector, manpower shortage was particularly apparent in residential care and social work services, human health services, and accommodation services, as reflected by the markedly larger number of vacancies vis-a-vis unemployed therein. When expressed as a percentage of job vacancies to total employment opportunities, the vacancy rate rose to 2.9% in March 2013 from 2.6% a year earlier, the highest since late 1994. More notable increases in vacancy rate were seen in accommodation and food services, residential care and social work services, and retail over the same period.

86
Table 5.7 : Vacancies by major economic sector
Number of vacancies 2012 2013
Annual
Vacancy rate in
average Mar Jun Sep Dec Mar Mar 2013 (%)
Import/export trade and wholesale
8 510 (8.5)
8 950 (7.8)
9 140 (10.6)
8 240 (6.4)
7 710 (9.0)
10 440 (16.7)
1.8
Retail 7 900
(33.6) 8 180 (35.7)
6 900 (32.7)
8 950 (45.9)
7 560 (20.4)
9 400 (15.0)
3.5
Accommodation(a) and
food services 12 030 (46.5)
11 040 (42.7)
12 270 (51.1)
12 940 (62.0)
11 860 (31.9)
15 550 (40.9)
5.3
Transportation, storage,
postal and courier services
3 290 (25.5)
3 200 (26.1)
3 410 (13.2)
3 540 (45.7)
3 010 (20.2)
3 620 (13.1)
2.1
Information and
communications 2 370 (1.7)
2 480 (-7.4)
2 380 (8.6)
2 150 (-4.0)
2 480 (11.6)
2 680 (8.2)
2.7
Financing, insurance,
real estate, professional and business services
16 090 (14.5)
16 180 (14.8)
16 610 (14.0)
15 820 (10.6)
15 750 (18.9)
17 510 (8.2)
2.5
Social and personal
services 15 170 (16.0)
16 310 (23.1)
16 490 (29.5)
14 820 (6.6)
13 070 (5.0)
17 330 (6.2)
3.6
Manufacturing 2 740
(25.0) 2 860 (21.1)
2 970 (37.2)
2 370 (2.6)
2 770 (42.5)
2 600 (-9.1)
2.4
Construction sites
(manual workers only) 640
(95.1) 670
(347.0) 590 (94.7)
510 (-4.3)
800 (142.7)
930 (39.6)
1.2
All establishments
surveyed in the private sector(b)
68 840 (21.5)
69 970 (22.3) <9.0>
70 840 (25.1) <5.1>
69 460 (20.4)
<-3.5>
65 100 (18.0) <6.5>
80 170 (14.6) <6.0>
2.9
Civil service(c) 6 340
(0.9) 5 880 (-2.5)
6 350 (1.8)
6 600 (-0.5)
6 550 (5.0)
6 220 (5.8)
3.7
Notes : Vacancy rate refers to the ratio of vacancies to total employment opportunities (actual employment plus vacancies).
(a) Accommodation services sector covers hotels, guesthouses, boarding houses and other establishments providing short term accommodation.
(b) The total figures on private sector vacancies cover also vacancies in mining and quarrying; and in electricity and gas supply, and waste management, besides vacancies in the major sectors indicated above.
(c) These figures cover only vacancies for those staff to be employed on civil service terms of appointment.
( ) % change over a year earlier.
< > Seasonally adjusted quarter-to-quarter % change.
Sources : Quarterly Survey of Employment and Vacancies, Census and Statistics Department.
Quarterly Employment Survey of Construction Sites, Census and Statistics Department.
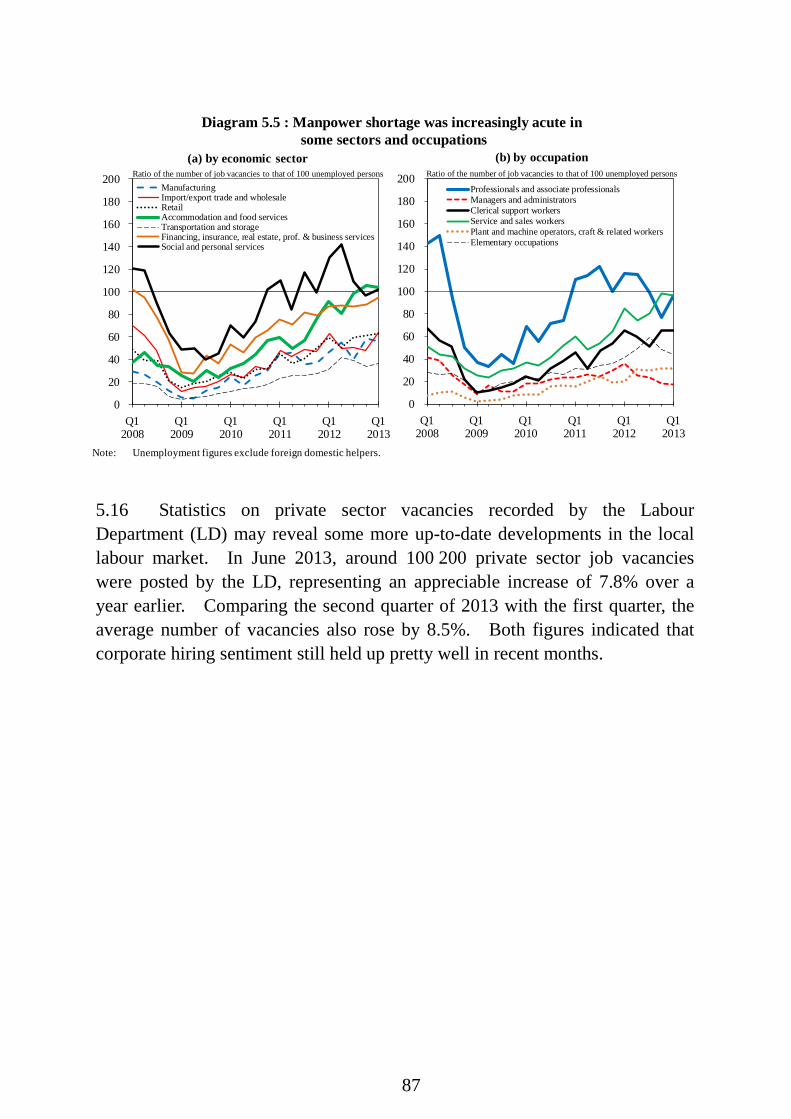
87
5.16 Statistics on private sector vacancies recorded by the Labour Department (LD) may reveal some more up-to-date developments in the local labour market. In June 2013, around 100 200 private sector job vacancies were posted by the LD, representing an appreciable increase of 7.8% over a year earlier. Comparing the second quarter of 2013 with the first quarter, the average number of vacancies also rose by 8.5%. Both figures indicated that corporate hiring sentiment still held up pretty well in recent months.
Q12008
Q12009
Q12010
Q12011
Q12012
Q12013
0
20
40
60
80
100
120
140
160
180
200
(a) by economic sector
ManufacturingImport/export trade and wholesaleRetailAccommodation and food servicesTransportation and storageFinancing, insurance, real estate, prof. & business servicesSocial and personal services
Ratio of the number of job vacancies to that of 100 unemployed persons
Q12008
Q12009
Q12010
Q12011
Q12012
Q12013
0
20
40
60
80
100
120
140
160
180
200
(b) by occupation
Professionals and associate professionalsManagers and administratorsClerical support workersService and sales workersPlant and machine operators, craft & related workersElementary occupations
Ratio of the number of job vacancies to that of 100 unemployed persons
Diagram 5.5 : Manpower shortage was increasingly acute insome sectors and occupations
Note: Unemployment figures exclude foreign domestic helpers.

88
Wages and earnings 5.17 Wages and earnings sustained solid and broad-based improvement on entering 2013, echoing the generally tight labour market conditions. Nominal Wage Index, as a measure of regular employment income of employees at the supervisory level or below, moved up solidly further by 4.7% year-on-year in March 2013, following the 5.1% growth in December 2012. After adjusting for inflation(8), labour wages registered a modest gain of 0.7% in real terms over a year earlier. 5.18 Nominal pay rises were widespread across most economic sectors, and particularly visible in some domestically-oriented sectors, such as personal services (up 7.3% year-on-year), accommodation and food service activities (up 6.9%), and real estate leasing and maintenance management (up 5.8%). Likewise, nominal wages also rose across-the-board in terms of occupational category. Notable pay gains were seen in supervisory and technical workers (up 5.2% year-on-year) and service workers (up 5.1%), thanks to the sturdy demand for lower-skilled workers amid the buoyant performance of many labour-intensive sectors. 5.19 Labour earnings(9), as measured by payroll per person engaged in the private sector which includes overtime, discretionary bonuses and other irregular payments, recorded a similar increase at 5.2% in the first quarter of 2013 over a year earlier, further to the 5.9% rise in the preceding quarter. After discounting the price effects, labour earnings recorded a real growth of 1.5%. 5.20 All major sectors witnessed improvements in nominal payroll in the first quarter of 2013, with more appreciable growth seen in financial and insurance activities (up 6.4% year-on-year) and social and personal services (up 5.8%). Workers engaged in retail (up 4.9%), professional and business services (up 4.8%), and accommodation and food services activities (up 4.7%) also saw sizeable increases in earnings, amid the prevailing strength of local consumption and inbound tourism.

89
Q12008
Q12009
Q12010
Q12011
Q12012
Q12013
-6
-4
-2
0
2
4
6
8
10
12
(a) Year-on-year rate of changein nominal terms
Payroll index
Wage index
Percent
Q12008
Q12009
Q12010
Q12011
Q12012
Q12013
-6
-4
-2
0
2
4
6
8
10
12
(b) Year-on-year rate of changein real terms
Payroll index
Wage index
Percent
Diagram 5.6 : Labour earnings and wages improved further in both nominal and real terms
5.21 More recent data from the General Household Survey, whilst not strictly comparable to those from the business establishment surveys, indicated that the average monthly employment earnings(10) (excluding foreign domestic helpers) for full-time employees in the lowest decile group maintained notable year-on-year increase at 7.7% in nominal terms in the second quarter, further to the appreciable gain of 7.5% in the first quarter, thanks mainly to the tight manpower resource situation in the lower-skilled segment. The boosting effect of the upward adjustment of the SMW rate in May 2013 might have contributed somewhat as well. After adjusting for inflation, the lowest decile group continued to enjoy a solid year-on-year growth at 2.9% in real terms in the second quarter.

90
Recent labour-related measures 5.22 LD has regularly organised large-scale job fairs in different locations and canvassed vacancies from various industries for application by job-seekers on the spot. During January to July 2013, LD organised 10 large-scale job fairs. 300 participating organisations offered some 22 300 vacancies from the retail, catering, property management and other industries. There were also 15 training bodies joining the job fairs to introduce job training courses and receive applications on the spot. Apart from large-scale job fairs, mini job fairs are also regularly organised at LD’s Job Centres to assist job-seekers in seeking employment. Moreover, employers stage recruitment activities at the two industry-based recruitment centres specifically for the catering and retail industries almost every working day. 5.23 To enhance the employability and employment opportunities of young people, middle-aged persons and persons with disabilities, LD has increased the allowance payable to employers under the Youth Employment and Training Programme (YETP) (formerly known as the Youth Pre-employment Training Programme and Youth Work Experience and Training Scheme (YPTP&YWETS)), the Employment Programme for the Middle-aged and the Work Orientation and Placement Scheme with effect from June 2013 so as to encourage employers to offer them more openings and provide them with on-the-job training. To encourage participation in workplace attachment training under YETP, LD has increased the allowance payable to trainees with effect from June 2013. Moreover, to strengthen employment services to residents living in remote areas, LD will set up a job centre in Tung Chung to facilitate job-seekers in the area in seeking employment services. 5.24 Starting from the claim months of 2013, the territory-wide Work Incentive Transport Subsidy (WITS) Scheme has been enhanced to the effect that low-income employed persons may apply for the subsidy on an individual basis, as an alternative to household-based application (i.e. the “dual track” approach). The income and asset limits for the WITS have also been relaxed in parallel. Applicants who became eligible under the enhanced Scheme might apply in July 2013 at the earliest for subsidy from January to June 2013. 5.25 The SMW rate has been adjusted from $28 to $30 per hour, an increase of 7.1%, with effect from 1 May 2013. LD has organised extensive publicity activities to promote public awareness of the revised rate. Targeted enforcement actions are undertaken to ensure employers’ compliance with the new requirement.

91
Notes : (1) Labour force statistics enumerated from the General Household Survey are statistics
which involve the use of the population figures in the compilation process. These statistics of the three-month periods of November 2011 – January 2012 to October – December 2012 have been revised to take into account the final end-2012 population estimates.
The classification of occupation adopted by the Census and Statistics Department
follows the International Standard Classification of Occupations (ISCO), which is used to classify the occupation of an employed person or the previous occupation of an unemployed person. After the implementation of the new ISCO, 2008 (ISCO-08), the General Household Survey has been enhanced to adopt the ISCO-08 in compiling labour force statistics by occupation, with statistics backcasted to the quarter of January to March 2011. Starting from the reference quarter of January to March 2011, all the labour force statistics by occupation, unless otherwise specified, are compiled based on the ISCO-08.
(2) For a person aged 15 or above to be classified as unemployed, he or she should:
(a) not have a job and not be performing any work for pay or profit during the reference period (i.e. seven days before enumeration); and (b) be available for work during the reference period; and (c) be seeking work during the 30 days before enumeration.
Notwithstanding the above, the following types of persons are also considered
unemployed: (a) persons without a job, having sought work but not available for work because of temporary sickness; (b) persons without a job, available for work but not having sought work because they will take up new jobs or start business at a subsequent date, or expect to return to their original jobs; and (c) discouraged workers not having sought work because they believe work is not available to them.
Even at full employment, some frictional unemployment is bound to exist as workers
move between jobs in order to obtain better terms of employment. The precise level of unemployment which can be described as purely frictional varies amongst economies, depending on the structure and characteristics of their labour markets.
The seasonally adjusted series is compiled using the X-12 ARIMA method, which is a
standard method applied in compiling seasonally adjusted statistical data series. (3) The main criteria for an employed person aged 15 or above to be classified as
underemployed are: involuntarily working less than 35 hours during the reference period (i.e. seven days before enumeration), and either available for additional work during the reference period or seeking additional work during the 30 days before enumeration.
Following these criteria, employed persons taking no-pay leave due to slack work
during the reference period are also classified as underemployed if they had worked less than 35 hours or were on leave for the entire reference period.
(4) Figures enumerated from household data. The employed population is defined here to
include those persons aged 15 or above who performed work for pay or profit or had a formal job attachment during the reference period (i.e. seven days before enumeration).
(5) The labour force, or the economically active population, is defined to include all

92
persons aged 15 or above who either were engaged in productive work during the reference period (i.e. seven days before enumeration) or would otherwise have been engaged in productive work but were unemployed.
(6) The low paying sectors as identified by the Minimum Wage Commission include:
(i) retail; (ii) restaurants (including Chinese restaurants, non-Chinese restaurants, fast food cafes, and Hong Kong-style tea cafes. However, beverage serving places, event catering and other food service activities are not included.); (iii) estate management, security and cleaning services (including real estate maintenance management, security services, cleaning services and membership organisations); (iv) other low paying sectors, namely - elderly homes; - laundry and dry cleaning services; - hairdressing and other personal services; - local courier services; and - food processing and production.
(7) Manufacturing enterprises with fewer than 100 employees and non-manufacturing enterprises with fewer than 50 employees are regarded as small and medium-sized enterprises (SMEs) in Hong Kong. Yet, establishments with the same main business registration number (BRN) and engaging in activities of the same industry sector are grouped into one business unit for the purpose of calculating the number of SMEs. Thus, a business with a lot of small chain stores each employing a small number of employees will be considered as a single large enterprise, instead of separate SMEs.
(8) Different consumer price indices are used for compiling the real indices of labour
earnings and wages, taking into account their relevance to the respective occupation coverage. Specifically, the Composite CPI, being an indicator of overall consumer prices, is taken as the price deflator for earnings received by employees at all levels of the occupational hierarchy. The CPI(A), being an indicator of consumer prices for the relatively low expenditure group, is taken as the price deflator for wages in respect of employees engaged in occupations up to the supervisory level.
(9) In addition to wages, which include all regular and guaranteed payments like basic pay
and stipulated bonuses and allowances, earnings also cover overtime pay and other non-guaranteed or irregular bonuses and allowances, except severance pay and long service payment. Because of this difference, as well as the difference in sectoral and occupational coverage, the movements in average earnings, as measured by payroll per person engaged, do not necessarily match closely with those in wage rates.
(10) The average (mean) monthly employment earnings are easily affected by extreme
values in the survey sample, more so when reckoned for higher-end workers. They should therefore be interpreted with caution, in particular when they are compared over time.

93
CHAPTER 6 : PRICES Summary
Inflation was broadly stable in the first half of 2013, as external price pressures were contained while domestic cost pressures also eased slightly. The Composite Consumer Price Index (Composite CPI)(1) rose by 4.0% in the second quarter over a year earlier, compared to a 3.7% increase in the preceding quarter. After netting out the effects of the Government’s one-off relief measures to more accurately reflect the underlying inflation trend, the underlying Composite CPI rose by 3.9% over the same period, up only by 0.1 percentage point from the 3.8% increase in the first quarter.
The uptrend in domestic costs, whilst still notable in some segments, tended to taper off in the more recent period. Residential rentals saw only modest increase after the Government’s recent launch of demand-management measures, though their surge last year continued to pose some upward pressures on the Composite CPI. The rise in office rentals slowed slightly during the second quarter, but that in shop rentals was still notable, supported by the vibrant consumption market. The increase in labour costs, as evidenced by the movements of wages and earnings, tended to moderate.
External price pressures eased more visibly, thanks to lower international energy and raw material prices, moderating inflation trends in major trading partners, as well as the depreciation of the yen. Except for a small uptick in food prices due to a temporary rise in Mainland’s food prices in April, imported inflation in overall terms was well contained.
Inflation is expected to edge up somewhat in the coming months as the lagged effects of higher fresh-letting housing rentals last year feed through. Yet the upside risk to inflation should be rather limited, in face of the expected benign imported inflation and the recent deceleration in fresh letting housing rentals. The ramifications from the upward adjustment of the Statutory Minimum Wage rate in May on labour costs are also expected to be mild.
Consumer prices 6.1 Inflation held largely steady in the first half of 2013, though going up slightly in June. In the second quarter, imported inflation remained subdued, amid relatively soft commodity prices in the international markets and tame inflation in the Mainland and other import suppliers. The major

94
exception was imported foodstuffs, the prices of which saw a moderate uptick in the second quarter. Locally, labour costs continued to show moderate increase, broadly consistent with the macroeconomic environment. The rise in office rentals slowed slightly during the second quarter while the increase in shop rentals remained notable on the back of buoyant consumption market. The upward momentum for fresh-letting residential rentals also started to taper recently, particularly on a year-on-year comparison, but the lagged effects of higher residential rentals last year slightly pushed up the price increase in the housing component of the CPI. Overall, the broadly stable local inflation in the first half of the year was in line with those in a number of Asian and emerging market economies(2).
Q12008
Q12009
Q12010
Q12011
Q12012
Q12013
-2
0
2
4
6
8
10Composite CPI
Underlying Composite CPI
Year-on-year rate of change (%)
Diagram 6.1 : Inflation stayed broadly stable in the first half of 2013
Note : The year-on-year rates of change of the Consumer Price Indices from the fourth quarter of
2010 onwards are computed from the 2009/10-based series, and those before that from the 2004/05-based series. Splicing has been applied to the indices to maintain continuity.
6.2 Headline consumer price inflation, as measured by the year-on-year rate of change in the Composite CPI, was 4.0% in the second quarter of 2013, compared with 3.7% in the preceding quarter. Netting out the effects of the Government’s one-off relief measures to more accurately reflect the underlying inflation trend, underlying consumer price inflation increased slightly from 3.8% to 3.9% over the same period. For the first half of 2013 as a whole, the headline and underlying consumer price inflation averaged at 3.9% and 3.8% respectively. 6.3 Among the major components of the underlying Composite CPI, food and private housing rentals were the largest contributors to inflation in the

95
first half of 2013. Local food inflation (including costs of dining out) picked up slightly to 4.5% in the second quarter from 4.1% in the preceding quarter, partly because of a temporary surge in Mainland’s food prices in April. Reflecting the lagged effects of the higher fresh-letting residential rentals over the past year, the year-on-year increase in the private housing rental component went up slightly from 5.4% to 5.7%. At the same time, the components in Composite CPI with a higher import content such as clothing and footwear showed more moderate increases. The secular decline in the prices of durable goods enlarged further in the second quarter.
-4
0
4
8
12
16
20
24
Q12008
Q12009
Q12010
Q12011
Q12012
Q12013
-2
0
2
4
6
8
10
12Underlying Composite CPI (LHS)
Import prices (LHS)
Nominal wage index (LHS)
Fresh-letting residential rentals (RHS)
Year-on-year rate of change (%) Year-on-year rate of change (%)
Diagram 6.2 : Inflationary pressures were more visible on the domestic front
0
3
6
9
12
15
18
21
Jan2011
Jul2011
Jan2012
Jul2012
Jan2013
0
2
4
6
8
10
12
14Underlying CCPI - private housing rental (LHS)
Fresh-letting residential rentals (24-monthmoving average) (RHS)
Q12008
Q12009
Q12010
Q12011
Q12012
Q12013
-5
0
5
10
15
20
25Underlying CCPI - foodNominal wage indexMainland's food inflation
Year-on-year rate of change (%)Year-on-year rate of change (%)
Year-on-year rate of change (%)
Diagram 6.3 : Food and private housing rental components of the underlying CCPI(a) Food inflation picked up, partly due to an earlier
temporary surge in Mainland's food prices (b) Higher fresh-letting rentals last year continued to
feed through, yet the recent deceleration should be favourable for inflation down the road

96
Table 6.1 : Consumer Price Indices (year-on-year rate of change (%))
Composite CPI CPI(A) CPI(B) CPI(C)
Underlying(a) Headline
2012 Annual 4.7 4.1 3.6 4.3 4.1
H1 5.5 4.7 4.2 5.0 4.9
H2 3.9 3.5 3.1 3.7 3.4
Q1 5.9 5.2 4.6 5.5 5.4
Q2 5.1 4.2 3.7 4.5 4.4
Q3 4.0 3.1 1.9 3.7 3.4
Q4 3.8 3.8 4.2 3.6 3.3
2013 H1 3.8 3.9 4.4 3.6 3.5
Q1 3.8 3.7 4.2 3.5 3.3
Q2 3.9 4.0 4.6 3.8 3.6
(seasonally adjusted quarter-to-quarter rate of change (%))
2012 Q1 1.2 1.2 1.3 1.3 1.1
Q2 0.9 0.8 0.8 0.8 0.7
Q3 0.6 -1.9 -5.9 -0.3 0.4
Q4 1.1 3.7 8.5 1.8 1.1
2013 Q1 1.2 1.2 1.3 1.2 1.1
Q2 1.0 1.1 1.2 1.1 1.0
Note : (a) Underlying consumer price inflation is calculated by netting out the effects of all
relevant one-off measures introduced since 2007, including the waiver and Government’s payment of public housing rentals, rates concession, suspension of Employees Retraining Levy, and subsidies for household electricity charges.

97
-6
-4
-2
0
2
4
6
8
10
12
14
16
18
Food Meals out Otherfoodstuffs
Housing Privatedwellings
Publicdwellings
Electricity,gas andwater
Alcoholicdrinks and
tabacco
Clothingand
footwear
Durablegoods
Misc. goods Transport Misc.services
First quarter of 2013
Second quarter of 2013
Diagram 6.4 (a) : The price increases in many major components in the underlying Composite CPI remained moderate
Year-on-year rate of change (%)
Food Housing
4.9
5.7
6.3
5.4
3.1
1.2
-0.3 -0.1
0.8
1.5 2.0
2.4
3.7
5.0
6.1 6.4
5.9
5.1
4.0 3.8 3.8 3.9
-2
-1
0
1
2
3
4
5
6
7
8
Q12008
Q12009
Q12010
Q12011
Q12012
Q12013
Diagram 6.4 (b) : Contribution to underlying consumer price inflationby major component
Underlying consumer price inflation
Percent
FoodPrivate housing rentalsTransportOthers
Note : The year-on-year rates of change of the Composite CPI from the fourth quarter of 2010
onwards are computed from the 2009/10-based series, and those before that from the 2004/05-based series.

98
Table 6.2 : Composite Consumer Price Index by component (year-on-year rate of change (%))
2012 2013 Expenditure component Weighting (%) 2012 Q1 Q2 Q3 Q4 Q1 Q2 Food 27.45 5.8 7.4 6.6 5.1 4.2 4.1 4.5 Meals bought away from home
17.07 5.4 6.1 5.7 5.3 4.6 4.4 4.3
Other foodstuffs 10.38 6.5 9.4 8.1 5.0 3.6 3.6 4.8 Housing(a) 31.66 5.6 8.1 6.4 2.8 5.2 5.2 6.1 (6.4) (8.1) (6.7) (5.5) (5.4) (5.5) (5.8) Private dwellings 27.14 6.8 9.2 7.3 5.8 5.1 5.0 6.1 (7.0) (9.1) (7.7) (6.0) (5.3) (5.4) (5.7) Public dwellings 2.05 -7.1 -1.5 -1.1 -87.8 9.7 9.7 8.9
(3.2) (-0.1) (0.1) (3.2) (9.5) (9.5) (9.2) Electricity, gas and water 3.10 -8.2 -17.2 -18.3 3.6 4.6 4.9 5.9 (3.6) (4.0) (3.9) (2.8) (3.6) (3.6) (4.4) Alcoholic drinks and
tobacco 0.59 3.0 11.6 0.1 0.5 0.6 1.6 1.9
Clothing and footwear 3.45 3.1 4.9 3.2 2.3 1.9 1.5 1.0 Durable goods 5.27 -1.4 -1.8 -0.9 -1.2 -1.7 -3.5 -5.0 Miscellaneous goods 4.17 2.2 3.4 2.2 1.4 2.0 1.4 2.2 Transport 8.44 3.0 4.4 3.3 2.2 2.2 2.0 2.2 Miscellaneous services 15.87 2.8 2.8 3.1 2.3 2.9 3.5 3.1
(2.8) (2.8) (3.1) (2.3) (3.0) (3.5) (3.1)
All items 100.00 4.1 5.2 4.2 3.1 3.8 3.7 4.0 (4.7) (5.9) (5.1) (4.0) (3.8) (3.8) (3.9)
Notes : (a) The housing component covers rents, rates, Government rent, maintenance costs and
other housing charges. Its sub-components on private and public dwellings as presented here, however, cover rents, rates and Government rent only. Hence, the combined weighting of private and public dwellings is slightly less than the weighting of the entire housing component.
(b) Figures in bracket represent the underlying rates of change after netting out the effect
of Government’s one-off relief measures.

99
Costs of factor inputs and import prices
6.4 The upward pressures on domestic costs, whilst still notable in some segments, showed signs of tapering off in recent months. The increase in office rentals slowed slightly during the second quarter. By contrast, the rise in shop rentals was still quite notable, supported by the sustained vibrancy in retail business. As for labour costs, wages and earnings tended to increase more moderately in recent periods alongside a subpar overall economic performance. Yet, income rises among the lower income workers were more visible in the second quarter, reflecting the rather tight manpower resource situation in the lower-skilled segment and an additional boost from the upward adjustment of the Statutory Minimum Wage rate.
Q12008
Q12009
Q12010
Q12011
Q12012
Q12013
-5
0
5
10
15
20Overall import prices
Import prices of foodstuffs
Import prices of capital goods
Import prices of consumer goods
Import prices of raw materials
Year-on-year rate of change (%)
and semi-manufactures
Diagram 6.5 : Domestic cost pressures tended to taper off in some segments, while import prices generally saw moderate rises
(a) Commercial rentals and labour cost (b) Import prices by selected end-use category
0
5
10
15
20
25
Jan2011
Jul2011
Jan2012
Jul2012
Jan2013
0
5
10
15Nominal payroll index (LHS)
Office rental index (RHS)
Shop rental index (RHS)
Year-on-year rate of change (%)

100
6.5 Compared with domestic costs, price pressure from the external front was much more modest and continued to ease in the first half of 2013. Continuing the decelerating trend since early 2012, the year-on-year increase in overall import prices slowed to 1.1% in the first quarter and to a mere 0.2% in the second quarter. For the first half of 2013, there was only a moderate increase of 0.6%, much decelerated from that of 2.2% in the second half of 2012. Analysed by major end-use category, import prices of consumer goods, raw materials and capital goods all registered mild year-on-year changes ranging between -0.8% and 1.4% in the second quarter, thanks to the lower global commodity prices, yen depreciation and also modest inflation in the supply sources. Also, in line with the trends in international energy prices, imported fuel prices remained soft with a decline of 5.4% in the second quarter, further to a 5.5% fall in the first quarter. Yet, import prices of foodstuffs rose slightly faster at 2.7% year-on-year in the second quarter, up from 1.8% in the first quarter, mainly due to a temporary uptick in Mainland’s food inflation amid bad weather conditions.
Table 6.3 : Prices of imports by end-use category
(year-on-year rate of change (%))
Foodstuffs
Consumer
goods
Raw materials and semi-manufact
ures
Fuels
Capital goods
All
2012 Annual 4.1 4.1 1.4 2.6 4.7 3.3 H1 7.3 5.8 2.2 8.0 5.0 4.4 H2 1.3 2.6 0.5 -2.3 4.3 2.2 Q1 9.3 7.1 2.3 16.5 4.6 5.0 Q2 5.4 4.7 2.1 0.8 5.4 3.9 Q3 2.5 2.8 0.3 -2.6 4.6 2.3 Q4 0.4 2.3 0.7 -2.0 4.0 2.1 2013 H1 2.2 1.7 0.5 -5.4 0.6 0.6 Q1 1.8 2.0 0.4 -5.5 2.0 1.1 Q2 2.7 1.4 0.7 -5.4 -0.8 0.2

101
-12
-8
-4
0
4
8
12
16
20
Q12008
Q12009
Q12010
Q12011
Q12012
Q12013
-20
-16
-12
-8
-4
0
4
8
12
Import-weighted nominal effective exchange rate index of theHong Kong dollar (LHS, inverted)
Prices of imports of consumer goods (RHS)
Year-on-year rate of change (%)
Year-on-year rate of change (%)
-40
-20
0
20
40
60
80
Q12008
Q12009
Q12010
Q12011
Q12012
Q12013
-20
-10
0
10
20
30
40Mainland's retail price index for food items (LHS)
Prices of imports of foodstuffs (LHS)
FAO food price index (RHS)
Year-on-yearrate of change (%)
Diagram 6.6 : Import prices by end-use category
Year-on-yearrate of change (%)
(a) Import prices of foodstuffs rose slightly faster amid a pick-up in Mainland's food inflation
(b) Import prices of consumer goods increased at a moderated pace
An increase in the nominal EERI indicates strengthening of the Hong Kong dollar. The y-axis of nominal EERI in this graph is inverted for easier comprehension.
Note :
-8
-4
0
4
8
12
16
Q12008
Q12009
Q12010
Q12011
Q12012
Q12013
-40
-20
0
20
40
60
80CRB spot index (LHS)
Prices of imports of raw materials
Year-on-year rate of change (%)
and semi-manufactures (RHS)
Year-on-year rate of change (%)
Q12008
Q12009
Q12010
Q12011
Q12012
Q12013
-60
-40
-20
0
20
40
60
80
100North Sea Brent
Prices of imports of fuels
Year-on-year rate of change (%)
(c) Import prices of raw materials stayed subduedamid steady global commodity prices
(d) Import prices of fuels remained soft

102
Output prices
6.6 Output prices, as measured by the Producer Price Indices(3), continued to show mixed movements in the first quarter of 2013. Output prices for the manufacturing sector saw a mild increase as compared to the same period last year, in tandem with the small rise in import prices of raw materials. Among the services sectors, output prices for accommodation services continued to go up, conceivably supported by the buoyant inbound tourism, but the pace was much slower than in 2012. Output prices for land transport, air transport and courier services all registered moderate year-on-year increases in the first quarter, while those for water transport saw faster rise, partly helped by a lower base of comparison. Separately, output prices for telecommunications services stayed on a downtrend amid technological breakthroughs and intense competition.
Table 6.4 : Producer Price Indices for the local manufacturing
sector and selected services sectors (year-on-year rate of change (%))
2012
2013
Industry group
Annual Q1 Q2 Q3 Q4 Q1
Manufacturing
0.1 3.6 -0.6 -1.4 -1.0 0.6
Selected services sectors(a)
Accommodation services
7.9 12.1 8.2 8.3 3.5 2.5
Land transport
1.5 2.1 1.8 1.3 0.7 0.6
Water transport
6.4 -4.3 18.5 6.3 5.3 7.3
Air transport
0.6 -3.3 1.2 1.0 3.5 4.0
Telecommunications
-2.4 -4.4 -1.6 -1.6 -1.9 -1.6
Courier services 2.1 3.1 2.0 1.2 2.3 2.7 Note : (a) Producer Price Indices for other services sectors are not available, due to the
difficulties involved in defining and delineating the various types of services and hence in measuring their respective price changes. This is particularly so for such sectors as banking and insurance, where the producers often do not charge their customers explicitly.

103
GDP deflator 6.7 As a broad measure of the overall change in prices in the economy, the GDP deflator(4) rose by 0.7% in the second quarter of 2013 over a year earlier, after the 1.4% increase in the preceding quarter. Within the GDP deflator, the terms of trade(5) reverted to a marginal increase of 0.1% in the second quarter of 2013 over a year earlier. Taking out the external components, the domestic demand deflator went up by 0.5% year-on-year in the second quarter of 2013, slower than the 2.4% increase in the preceding quarter, mainly reflecting the moderate increase in prices for consumption expenditure and a notable fall in prices for machinery and equipment.
Q12008
Q12009
Q12010
Q12011
Q12012
Q12013
-4
-2
0
2
4
6
GDP deflator
Domestic demand deflator
Year-on-year rate of change (%)
(a) GDP deflator rose modestly over a year earlier in the second quarter of 2013
Q12008
Q12009
Q12010
Q12011
Q12012
Q12013
-4
-2
0
2
4
6
GDP deflator
Terms of trade in goods and services
Year-on-year rate of change (%)
Diagram 6.7 : GDP deflator
(b) Terms of trade reverted to a marginal increase

104
Table 6.5 : GDP deflator and the main expenditure component deflators (year-on-year rate of change (%))
2011 2012 2013 Annual# Annual# Q1# Q2# Q3# Q4# Q1# Q2+
Private consumption expenditure
3.6 3.1 4.3 3.0 2.5 2.7 1.8 2.1
Government consumption expenditure
4.5 6.1 6.3 5.9 6.1 6.2 6.0 4.4
Gross domestic fixed capital formation
6.8 8.2 6.3 6.7 9.3 10.2 3.6 -4.4
Total exports of goods
7.7 3.1 5.8 4.8 1.3 1.0 -0.5 -0.5
Imports of goods
8.2 3.8 6.8 5.9 1.8 1.2 0.1 -0.5
Exports of services
7.6 3.8 6.3 5.3 2.4 1.8 1.1 0.3
Imports of services
6.4 1.8 3.4 1.0 0.5 2.5 1.1 0.7
Gross Domestic Product
3.9 3.9 3.9 <1.1>
3.0 <0.5>
4.3 <2.0>
4.3 <0.7>
1.4 <-1.8>
0.7 <-0.1>
Total final demand
6.7 3.7 5.7 4.6 2.5 2.3 0.6 *
Domestic demand
4.5 4.7 5.0 4.0 4.8 4.9 2.4 0.5
Terms of trade in goods and services
-0.3 -0.3 -0.5 -0.5 -0.1 -0.2 -0.4 0.1
Notes : Figures are derived based on the series of chain volume measures of GDP. They are subject to revision later on as more data become available.
(#) Revised figures. (+) Preliminary figures.
< > Seasonally adjusted quarter-to-quarter rate of change. (*) Change within ±0.05%.

105
Notes : (1) The Consumer Price Indices (A), (B) and (C) are compiled by reference to the average
expenditure patterns for different groups of households as obtained from the Household Expenditure Survey. Then, by aggregating the expenditure patterns of all the households covered by the above three indices, a Composite CPI is compiled.
The expenditure ranges of the households covered in the 2009/10-based CPIs are shown
below:
Approximate proportion of households covered
Average monthly expenditure range during Oct 2009 to Sep 2010
(%) ($) CPI(A) 50 4,500 to 18,499 CPI(B) 30 18,500 to 32,499 CPI(C) 10 32,500 to 65,999
The weightings of the various components in the 2009/10-based CPIs are as follows:
Expenditure component
Composite CPI
CPI(A)
CPI(B)
CPI(C)
(%) (%) (%) (%) Food 27.45 33.68 27.16 20.87 Meals bought away from
home 17.07 19.23 17.90 13.55
Other foodstuffs 10.38 14.45 9.26 7.32 Housing 31.66 32.19 31.43 31.36 Private dwellings 27.14 24.78 28.13 28.45 Public dwellings 2.05 5.49 0.72 -- Maintenance costs and
other housing charges 2.47 1.92 2.58 2.91
Electricity, gas and water 3.10 4.36 2.84 2.03 Alcoholic drinks and
tobacco 0.59 0.91 0.56 0.29
Clothing and footwear 3.45 2.60 3.45 4.39 Durable goods 5.27 3.73 5.73 6.39 Miscellaneous goods 4.17 3.87 4.17 4.49 Transport 8.44 7.22 8.35 9.93 Miscellaneous services
15.87 11.44 16.31 20.25
All items 100.00 100.00 100.00 100.00

106
(2) The table below presents the year-on-year rates (%) of consumer price inflation in selected economies.
2011 2012
2013
Annual Annual Q1 Q2 Q3 Q4 Q1 Q2
Selected developed economies
US 3.2 2.1 2.8 1.9 1.7 1.9 1.7 1.4 Canada 2.9 1.5 2.3 1.6 1.2 0.9 0.9 0.8 EU 3.1 2.6 2.9 2.6 2.6 2.5 2.0 1.6 Japan -0.3 0.0 0.3 0.2 -0.4 -0.2 -0.6 -0.3
Major emerging economies
Mainland China 5.4 2.6 3.8 2.9 1.9 2.1 2.4 2.4 Russia 8.4 5.1 3.9 3.8 6.0 6.5 7.1 7.2 India 8.9 9.3 7.2 10.1 9.8 10.1 11.7 10.7 Brazil 6.6 5.4 5.8 5.0 5.2 5.6 6.4 6.6
Selected Asian economies
Hong Kong 5.3 4.1 5.2 4.2 3.1 3.8 3.7 4.0 Singapore 5.2 4.6 4.9 5.3 4.2 4.0 4.0 1.6 Taiwan 1.4 1.9 1.3 1.6 2.9 1.8 1.8 0.8 Korea 4.0 2.2 3.0 2.4 1.6 1.7 1.4 1.1 Malaysia 3.2 1.7 2.3 1.7 1.4 1.3 1.5 1.8 Thailand 3.8 3.0 3.4 2.5 2.9 3.2 3.1 2.3 Indonesia 5.4 4.3 3.7 4.5 4.5 4.4 5.3 5.6 Philippines 4.7 3.1 3.1 2.9 3.5 3.0 3.2 2.7 Vietnam 18.7 9.0 15.9 8.6 5.6 6.5 6.9 6.6 Macao 5.8 6.1 6.3 6.6 6.0 5.6 5.4 5.1
(3) The Producer Price Index is designed to reflect changes in the prices of goods and
services received by local producers. Producer prices refer to the transacted prices, net of any discounts or rebates allowed to the buyers. Transportation and other incidental charges are not included.
(4) The implicit price deflators of GDP and its main expenditure components are derived by
dividing GDP at current prices by the corresponding chained-dollar figures. The rate of change in the GDP deflator may differ substantially from that in the Composite CPI over the same time span. The Composite CPI covers consumer price inflation in particular. Yet the GDP deflator is a much broader measure of inflation for the entire economy, and takes into account all the price changes related to consumption, investment, exports and imports. Also, the rate of change in the GDP deflator may differ appreciably from that in the total final demand deflator, depending on the movement in the prices of final demand and imports. Likewise, the rate of change in the GDP deflator may differ appreciably from that in the domestic demand deflator, depending on the movement in the prices of imports and exports.
(5) The terms of trade is defined as the ratio of the prices of total exports to the prices of
total imports.

107
Table Page
1. Gross Domestic Product by expenditure component (at current market prices) 108-109
2. 110-111
3. Gross Domestic Product by economic activity (at current prices) 112
4. 113
5. Balance of Payments by major component (at current prices) 114
6. 115
6a. 116
7. Total exports of goods by market (in value terms) 117
8. Imports of goods by source (in value terms) 118
9. Retained imports of goods by end-use category (in value terms) 118
10. Exports and imports of services by component (at current market prices) 119
10a. 120
11. Incoming visitors by source 121
12. Property market 122-123
13. 124-125
14. Monetary aggregates 126-127
15. Rates of change in business receipts indices for services industries/domains 128
16. Labour force characteristics 129
17. Employment in selected major industries 130
18. Number of workers engaged at building and construction sites 131
19. Rates of change in indices of payroll per person engaged by selected industry section 132
20. Rates of change in wage indices by selected industry section 133
21. Rates of change in prices 134-135
22. Rates of change in Composite Consumer Price Index 136-137
23. 138-139
Visible and invisible trade (at current market prices)
Rates of change in implicit price deflators of GDP and its main expenditurecomponents
Statistical Appendix
Property prices and rentals
Rates of change in chain volume measures of Gross Domestic Product byexpenditure component (in real terms)
Rates of change in chain volume measures of Gross Domestic Product by economicactivity (in real terms)
Visible and invisible trade based on the change of ownership principle
Exports and imports of services based on the change of ownership principle bycomponent (at current market prices)

108
($Mn)
2003 2004 2005 2006 2007 2008
Private consumption expenditure 722,961 771,443 811,654 868,691 982,368 1,026,482Government consumption expenditure 138,147 136,354 130,566 131,837 138,967 148,017Gross domestic fixed capital formation 272,127 287,360 302,152 337,153 340,356 350,796 of which:
Building and construction 116,628 107,692 105,993 106,268 111,776 127,312 Machinery, equipment and intellectual property products 147,088 162,871 176,269 214,093 204,083 198,633
Changes in inventories 9,111 7,076 -4,761 -2,129 12,841 8,480
Total exports of goods& 1,749,089 2,027,031 2,251,744 2,467,357 2,698,850 2,843,998
Imports of goods& 1,794,059 2,099,545 2,311,091 2,576,340 2,852,522 3,024,089
Exports of services& 363,765 431,090 496,985 566,416 664,100 720,837
Imports of services& 204,472 243,860 265,124 289,634 334,204 367,034
GDP 1,256,669 1,316,949 1,412,125 1,503,351 1,650,756 1,707,487
Per capita GDP ($) 186,704 194,140 207,263 219,240 238,676 245,406
GNI 1,288,895 1,344,927 1,419,589 1,538,864 1,703,567 1,807,994
Per capita GNI ($) 191,492 198,264 208,359 224,419 246,312 259,851
Total final demand 3,255,200 3,660,354 3,988,340 4,369,325 4,837,482 5,098,610Total final demand excluding re-exports(a) 1,919,463 2,088,521 2,243,119 2,436,589 2,697,292 2,836,222
Domestic demand 1,142,346 1,202,233 1,239,611 1,335,552 1,474,532 1,533,775 Private 947,804 1,012,565 1,062,587 1,163,262 1,297,607 1,342,889 Public 194,542 189,668 177,024 172,290 176,925 190,886
External demand 2,112,854 2,458,121 2,748,729 3,033,773 3,362,950 3,564,835
Table 1 : Gross Domestic Product by expenditure component(at current market prices)
Definition of Terms :
Total final demand = private consumption expenditure + government consumption expenditure + gross domesticfixed capital formation + changes in inventories + total exports of goods + exports of services
Private sector domestic demand = private consumption expenditure + gross domestic fixed capital formation by the private sector + changes in inventories
Public sector domestic demand = government consumption expenditure + gross domestic fixed capital formation by the publicsector
Domestic demand = private sector domestic demand + public sector domestic demand
External demand = total exports of goods + exports of services

109
($Mn)
2009 2010 2011# 2012# 2012 2013Q3# Q4# Q1# Q2#
Private consumption expenditure 1,013,615 1,090,234 1,224,823 1,300,242 315,794 344,768 339,662 346,692Government consumption expenditure 152,512 157,371 168,487 185,380 46,653 47,459 51,011 47,522Gross domestic fixed capital formation 339,552 386,852 455,048 538,951 141,292 148,773 121,079 130,964 of which:
Building and construction 123,746 139,249 179,110 220,904 54,534 61,072 57,699 54,237 Machinery, equipment and intellectual property products 191,568 209,568 239,839 283,973 78,142 77,896 54,893 70,449
Changes in inventories 22,941 37,522 11,742 -7,728 -8,344 -1,020 3,200 -6,050
Total exports of goods& 2,500,143 3,068,444 3,420,076 3,591,776 946,114 961,124 871,855 929,078
Imports of goods& 2,702,966 3,395,057 3,848,200 4,116,410 1,059,267 1,096,046 1,024,117 1,100,267
Exports of services& 672,794 829,495 942,683 997,852 255,960 270,497 255,717 250,716
Imports of services& 339,346 398,078 438,576 448,118 113,356 118,319 112,657 104,865
GDP 1,659,245 1,776,783 1,936,083 2,041,945 524,846 557,236 505,750 493,790
Per capita GDP ($) 237,960 252,952 273,783 285,403 -- -- -- --
GNI 1,709,007 1,814,379 1,988,909 2,085,429 531,870 563,310 518,327 N.A.
Per capita GNI ($) 245,096 258,304 281,253 291,481 -- -- -- --
Total final demand 4,701,557 5,569,918 6,222,859 6,606,473 1,697,469 1,771,601 1,642,524 1,698,922Total final demand excluding re-exports(a) 2,687,437 3,058,478 3,435,212 3,684,368 929,050 989,140 933,583 939,151
Domestic demand 1,528,620 1,671,979 1,860,100 2,016,845 495,395 539,980 514,952 519,128 Private 1,327,688 1,449,592 1,614,207 1,740,094 429,690 465,504 435,933 450,891 Public 200,932 222,387 245,893 276,751 65,705 74,476 79,019 68,237
External demand 3,172,937 3,897,939 4,362,759 4,589,628 1,202,074 1,231,621 1,127,572 1,179,794
Table 1 : Gross Domestic Product by expenditure component(at current market prices) (Cont'd)
Notes: (a) Re-export margin is nevertheless retained in the total final demand.
(#) Figures are subject to revision later on as more data become available.
(&) Figures are based on the System of National Accounts 2008, other than the change of ownership principle. For figures based on the change of ownership principle, please see Table 6a. For details about the change of ownership principle, please refer to the Special Report on Gross Domestic Product published by the Census and Statistics Department in September 2012.
(--) Not applicable.
N.A. Not yet available.
Figures of private consumption expenditure, exports of goods, and imports and exports of services were revised back to 2009 as a result of a technical revision exercise conducted by the Census and Statistics Department in mid-2013. For details, please see paragraph 31 of the explanatory notes given at the end of the report Gross Domestic Product (Quarterly) (Second Quarter 2013).

110
(%)
2003 2004 2005 2006 2007 2008
Private consumption expenditure -1.6 7.1 3.5 6.1 8.6 1.9Government consumption expenditure 2.4 1.4 -2.6 0.9 3.2 2.0Gross domestic fixed capital formation 1.5 3.4 4.0 7.1 3.2 1.4 of which:
Building and construction -5.4 -10.7 -7.6 -7.1 -0.3 6.8 Machinery, equipment and intellectual property products 7.8 11.4 12.1 18.2 2.5 *
Total exports of goods& 14.0 14.9 10.4 9.3 7.0 1.9
Imports of goods& 13.1 13.7 8.0 9.2 8.8 1.8
Exports of services& 7.4 17.9 11.6 10.0 14.3 5.0
Imports of services& -2.7 14.6 7.6 8.4 12.1 5.8
GDP 3.1 8.7 7.4 7.0 6.5 2.1
Per capita GDP 3.3 7.9 6.9 6.3 5.6 1.5
RGNI 2.5 4.1 4.3 6.7 8.2 3.3
Per capita RGNI 2.7 3.3 3.9 6.0 7.3 2.7
Total final demand 7.8 11.9 7.8 8.4 8.2 2.2Total final demand excluding re-exports(a) 3.0 9.1 5.6 7.4 7.9 1.7
Domestic demand -0.1 5.3 2.0 6.1 7.8 1.4 Private -0.5 6.5 3.4 7.6 8.9 1.2 Public 1.9 -0.4 -5.7 -2.8 0.6 3.2
External demand 12.8 15.4 10.6 9.4 8.4 2.5
Table 2 : Rates of change in chain volume measures of Gross Domestic Productby expenditure component (in real terms)
Notes: (a) Re-export margin is nevertheless retained in the total final demand.
(#) Figures are subject to revision later on as more data become available.
(&) Figures are based on the System of National Accounts 2008, other than the change of ownership principle. For figures based on the change of ownership principle, please see Table 6a. For details about the change of ownership principle, please refer to the Special Report on Gross Domestic Product published by the Census and Statistics Department in September 2012.
(--) Not applicable.
(*) Change within ±0.05%.
N.A. Not yet available.
Figures of private consumption expenditure, exports of goods, and imports and exports of services were revised back to 2009 as a result of a technical revision exercise conducted by the Census and Statistics Department in mid-2013. For details, please see paragraph 31 of the explanatory notes given at the end of the report Gross Domestic Product (Quarterly) (Second Quarter 2013).

111
(%)
2009 2010 2011# 2012# 2012 2013
Q3# Q4# Q1# Q2#
10 years2002 to
2012#
5 years2007 to
2012#
Private consumption expenditure 0.2 6.1 8.4 3.0 1.5 2.7 6.3 4.2 4.3 3.9Government consumption expenditure 2.3 3.4 2.5 3.7 4.0 3.3 2.1 3.1 1.9 2.8Gross domestic fixed capital formation -3.5 7.7 10.2 9.4 8.2 11.4 -3.3 6.9 4.4 4.9 of which:
Building and construction -5.5 5.7 15.5 13.2 8.8 14.6 -2.6 -2.1 0.1 6.9 Machinery, equipment and intellectual property products -2.2 6.5 12.2 10.7 10.1 9.2 -4.0 19.4 7.8 5.3
Total exports of goods& -12.5 17.3 3.4 1.8 4.6 6.7 8.8 6.2 6.4 2.0
Imports of goods& -9.5 18.1 4.7 3.0 4.7 7.6 9.6 7.6 6.9 3.3
Exports of services& 0.4 14.8 5.6 2.0 0.2 3.0 5.3 8.1 8.8 5.4
Imports of services& -5.0 11.1 3.5 0.4 -1.5 -0.7 0.5 -1.4 5.4 3.0
GDP -2.5 6.8 4.9 1.5 1.5 2.8 2.9 3.3 4.5 2.5
Per capita GDP -2.7 6.0 4.1 0.3 -- -- -- -- 3.9 1.8
RGNI -4.6 3.7 4.8 0.2 2.4 3.5 2.4 N.A. 3.3 1.4
Per capita RGNI -4.8 2.9 4.1 -1.0 -- -- -- -- 2.7 0.7
Total final demand -6.8 13.6 4.7 2.4 3.3 5.5 6.8 5.7 5.9 3.0Total final demand excluding re-exports(a) -2.6 10.5 5.6 3.0 2.5 4.6 5.8 4.6 5.0 3.5
Domestic demand 0.5 7.1 6.5 3.6 2.4 4.7 4.1 3.7 4.0 3.8
Private -0.1 6.6 6.7 3.2 2.3 4.0 4.4 3.5 4.3 3.5 Public 4.5 10.2 5.5 5.9 3.1 9.0 2.0 5.0 2.2 5.8External demand -9.9 16.8 3.9 1.9 3.6 5.8 8.0 6.6 6.9 2.7
Table 2 : Rates of change in chain volume measures of Gross Domestic Productby expenditure component (in real terms) (Cont'd)
Average annualrate of change:

112
2007 2008 2009
$Mn%
share $Mn%
share $Mn%
share $Mn%
share $Mn%
share
Agriculture, fishing, mining and quarrying 1,015 0.1 925 0.1 1,090 0.1 948 0.1 944 *
Manufacturing 32,365 2.0 31,506 1.9 28,714 1.8 30,410 1.7 30,578 1.6
Electricity, gas and water supply, and waste management 40,747 2.5 39,651 2.4 35,032 2.2 34,486 2.0 33,882 1.8
Construction 40,643 2.5 48,403 3.0 50,264 3.2 56,531 3.3 65,484 3.4
Services 1,490,475 92.9 1,499,529 92.6 1,466,724 92.7 1,615,373 93.0 1,771,677 93.1Import/export, wholesale and retail trades 379,466 23.6 399,200 24.6 370,226 23.4 413,308 23.8 492,900 25.9Accommodation (a) and food services 48,830 3.0 53,600 3.3 48,789 3.1 56,418 3.2 66,421 3.5Transportation, storage, postal and courier services 119,862 7.5 98,390 6.1 99,208 6.3 137,941 7.9 120,034 6.3Information and communications 51,551 3.2 49,127 3.0 47,893 3.0 55,024 3.2 62,952 3.3
Financing and insurance 322,644 20.1 277,112 17.1 255,900 16.2 284,203 16.4 306,787 16.1Real estate, professional and business services 147,339 9.2 166,086 10.3 173,903 11.0 188,476 10.8 213,965 11.2Public administration, social and personal services 262,395 16.3 278,100 17.2 288,109 18.2 295,257 17.0 313,612 16.5
Ownership of premises 158,388 9.9 177,915 11.0 182,696 11.5 184,745 10.6 195,005 10.2
GDP at basic prices 1,605,245 100.0 1,620,013 100.0 1,581,824 100.0 1,737,748 100.0 1,902,565 100.0
Taxes on products 64,634 -- 58,233 -- 54,689 -- 68,707 -- 69,401 --
Statistical discrepancy (%) -1.2 -- 1.7 -- 1.4 -- -1.7 -- -1.9 --
GDP at current market prices 1,650,756 -- 1,707,487 -- 1,659,245 -- 1,776,783 -- 1,936,083 --
Table 3 : Gross Domestic Product by economic activity(at current prices)
2011#2010
Notes: Individual figures may not add up exactly to the total due to rounding.
(a) Accommodation services cover hotels, guesthouses, boarding houses and other establishments providing short term accommodation.
(#) Figures are subject to revision later on as more data become available.
(--) Not applicable.
(*) Less than 0.05%.

113
(%)
2007 2008 2009 2010 2011# 2012# 2012 2013
Q2# Q3# Q4# Q1#
Agriculture, fishing, mining and quarrying -4.3 -17.0 -4.6 3.9 0.8 0.3 -7.1 2.3 1.6 2.4
Manufacturing -0.8 -7.0 -8.2 3.3 0.7 -0.8 -2.9 -0.1 1.3 0.5
Electricity, gas and water supply, and waste management 1.4 0.7 1.5 -0.2 0.6 1.6 3.7 -0.5 -0.4 -1.6
Construction -1.2 8.9 -7.5 15.6 18.1 11.3 10.1 5.2 16.1 -1.5
Services 7.1 2.4 -1.7 7.0 5.2 1.8 1.2 1.9 2.7 2.8Import/export, wholesale and retail trades 5.8 6.8 -9.5 16.7 9.1 1.5 0.3 1.6 3.8 5.8Accommodation (a) and food services 10.7 1.7 -11.3 9.5 8.3 2.2 1.6 3.2 4.6 3.8Transportation, storage, postal and courier services 5.1 2.5 -5.5 6.0 7.2 3.0 0.5 2.7 3.9 -0.5Information and communications 6.3 -1.2 1.3 1.5 2.8 2.8 1.4 4.1 4.6 6.0
Financing and insurance 16.8 -0.5 4.1 6.6 6.9 1.1 0.2 0.8 1.1 4.1Real estate, professional and business services 6.6 1.4 1.6 2.5 2.6 3.6 5.1 3.8 2.2 -0.3Public administration, social and personal services 2.7 1.4 3.0 2.2 1.5 2.0 2.1 2.0 1.6 1.8
Ownership of premises 3.0 2.0 0.3 0.8 0.7 0.4 0.3 0.3 0.5 0.3
Taxes on products 24.9 -1.7 -4.8 6.3 -6.8 -10.4 -8.5 -13.9 -4.2 -1.3
GDP in chained (2011) dollars 6.5 2.1 -2.5 6.8 4.9 1.5 0.9 1.5 2.8 2.9
Table 4 : Rates of change in chain volume measures of Gross Domestic Productby economic activity (in real terms)
Notes: (#) Figures are subject to revision later on as more data become available.
(a) Accommodation services cover hotels, guesthouses, boarding houses and other establishments providing short term accommodation.

114
($Mn)
2008 2009 2010 2011 2012# 2012 2013
Q2# Q3# Q4# Q1#
Current account(a) 255,808 164,001 124,820 109,018 47,038 -6,817 31,481 17,077 -1,323
Goods 194,753 103,008 25,564 -58,203 -165,392 -71,743 -18,632 -29,238 -72,344
Services -21,041 27,617 79,240 134,186 190,492 48,434 48,083 46,494 63,142
Primary income 100,507 49,762 37,596 52,826 43,484 21,140 7,024 6,074 12,577
Secondary income -18,412 -16,386 -17,580 -19,791 -21,547 -4,648 -4,994 -6,253 -4,698
Capital and financial account(a) -254,709 -144,532 -88,838 -113,242 -37,591 31,399 -51,176 -32,047 -12,528
Capital account -1,958 -3,021 -4,436 -2,021 -1,439 -947 -91 -316 -123
Financial account -252,750 -141,511 -84,402 -111,220 -36,152 32,346 -51,084 -31,731 -12,405 Financial non-reserve assets -28,774 470,987 -25,257 -24,437 152,736 25,232 -13,222 62,612 3,999
Direct investment 77,371 -28,421 -122,026 1,868 -72,919 9,557 -19,200 -54,430 -91,761
Portfolio investment -281,141 -310,083 -442,460 -10,979 -12,553 17,684 -53,698 -171,437 33,735
Financial derivatives 63,338 24,560 18,677 20,884 15,274 550 1,140 11,887 3,914
Other investment 111,659 784,930 520,552 -36,210 222,935 -2,559 58,536 276,592 58,111
Reserve assets -223,976 -612,498 -59,145 -86,783 -188,889 7,114 -37,862 -94,343 -16,404
Net errors and omissions -1,099 -19,470 -35,981 4,224 -9,447 -24,582 19,695 14,970 13,851
Overall Balance of Payments 223,976 612,498 59,145 86,783 188,889 -7,114 37,862 94,343 16,404
Table 5 : Balance of Payments by major component(at current prices)
Notes: Individual figures may not add up exactly to the total due to rounding.
Figures of goods and services were revised back to 2009 as a result of a technical revision exercise conducted by the Census and Statistics Department in mid-2013. For details, please see paragraph 31 of the explanatory notes given at the end of the report Gross Domestic Product (Quarterly) (Second Quarter 2013).
(a) In accordance with the accounting rules adopted in compiling Balance of Payments, a positive value for the balance figure in the current account represents a surplus whereas a negative value represents a deficit. In the capital and financial account, a positive value indicates a net financial inflow while a negative value indicates a net outflow. As increases in external assets are debit entries and decreases are credit entries, a negative value for the reserve assets represents a net increase while a positive value represents a net decrease.
(#) Figures are subject to revision later on as more data become available.

115
($Mn)
2008 2009 2010 2011# 2012# 2012 2013
Q3# Q4# Q1# Q2#
Total exports of goods 2,843,998 2,500,143 3,068,444 3,420,076 3,591,776 946,114 961,124 871,855 929,078
Imports of goods 3,024,089 2,702,966 3,395,057 3,848,200 4,116,410 1,059,267 1,096,046 1,024,117 1,100,267
Visible trade balance -180,091 -202,823 -326,613 -428,124 -524,634 -113,153 -134,922 -152,262 -171,189(-6.0) (-7.5) (-9.6) (-11.1) (-12.7) (-10.7) (-12.3) (-14.9) (-15.6)
Exports of services 720,837 672,794 829,495 942,683 997,852 255,960 270,497 255,717 250,716
Imports of services 367,034 339,346 398,078 438,576 448,118 113,356 118,319 112,657 104,865
Invisible trade balance 353,803 333,448 431,417 504,107 549,734 142,604 152,178 143,060 145,851(96.4) (98.3) (108.4) (114.9) (122.7) (125.8) (128.6) (127.0) (139.1)
Exports of goods and services 3,564,835 3,172,937 3,897,939 4,362,759 4,589,628 1,202,074 1,231,621 1,127,572 1,179,794Imports of goods and services 3,391,123 3,042,312 3,793,135 4,286,776 4,564,528 1,172,623 1,214,365 1,136,774 1,205,132Visible and invisible trade balance 173,712 130,625 104,804 75,983 25,100 29,451 17,256 -9,202 -25,338
<5.1> <4.3> <2.8> <1.8> <0.5> <2.5> <1.4> <-0.8> <-2.1>
Table 6 : Visible and invisible trade(at current market prices)
Notes: Figures in this table are reckoned on GDP basis and based on the System of National Accounts 2008, other than the change of ownership principle. For figures based on the change of ownership principle, please see Table 6a. For details about the change of ownership principle, please refer to the Special Report on Gross Domestic Product published by the Census and Statistics Department in September 2012.
Figures of exports of goods, and imports and exports of services were revised back to 2009 as a result of a technical revision exercise conducted by the Census and Statistics Department in mid-2013. For details, please see paragraph 31 of the explanatory notes given at the end of the report Gross Domestic Product (Quarterly) (Second Quarter 2013).
(#) Figures are subject to revision later on as more data become available.
( ) As a percentage of the total value of imports of goods/services.
< > As a percentage of the total value of imports of goods and services.

116
2008 2009 2010 2011# 2012# 2012 2013
Q3# Q4# Q1# Q2#
At current market prices ($Mn)
Total exports of goods 2,758,181 2,454,394 3,021,492 3,406,765 3,614,770 953,976 980,409 886,488 939,212
Imports of goods 2,563,428 2,351,386 2,995,928 3,464,968 3,780,162 972,608 1,009,647 958,832 1,033,794
Visible trade balance 194,753 103,008 25,564 -58,203 -165,392 -18,632 -29,238 -72,344 -94,582(7.6) (4.4) (0.9) (-1.7) (-4.4) (-1.9) (-2.9) (-7.5) (-9.1)
Exports of services 544,358 501,303 626,170 712,221 758,966 191,323 198,210 201,714 199,887
Imports of services 565,399 473,686 546,930 578,035 568,474 143,240 151,716 138,572 130,643
Invisible trade balance -21,041 27,617 79,240 134,186 190,492 48,083 46,494 63,142 69,244(-3.7) (5.8) (14.5) (23.2) (33.5) (33.6) (30.6) (45.6) (53.0)
Exports of goods and services 3,302,539 2,955,697 3,647,662 4,118,986 4,373,736 1,145,299 1,178,619 1,088,202 1,139,099
Imports of goods and services 3,128,827 2,825,072 3,542,858 4,043,003 4,348,636 1,115,848 1,161,363 1,097,404 1,164,437
Visible and invisible trade balance 173,712 130,625 104,804 75,983 25,100 29,451 17,256 -9,202 -25,338
<5.6> <4.6> <3.0> <1.9> <0.6> <2.6> <1.5> <-0.8> <-2.2>
Rates of change in real terms (%)
Total exports of goods 3.2 -11.2 18.0 4.6 2.7 5.3 6.5 9.7 8.1
Imports of goods 3.7 -7.0 19.9 6.7 4.6 6.6 8.4 11.6 10.1
Exports of services 4.9 1.7 15.4 5.8 2.5 -0.1 3.4 6.0 9.9
Imports of services 1.1 -12.9 10.0 -0.2 -2.3 -4.8 -1.7 -1.8 -1.9
Table 6a : Visible and invisible trade based on the change of ownership principle
Notes: Figures in this table are reckoned on GDP basis and based on the System of National Accounts 2008.
Statistics on visible and invisible trade presented in this table provide supplementary information for analysis of international trade in goods and services, compiled using the change of ownership principle in recording goods sent abroad for processing and merchanting under the System of National Accounts 2008. The statistics are consistent with the goods and services statistics in the current account of Hong Kong's Balance of Payments. For details about the change of ownership principle, please refer to the Special Report on Gross Domestic Product published by the Census and Statistics Department in September 2012.
Figures of exports of goods, and imports and exports of services were revised back to 2009 as a result of a technical revision exercise conducted by the Census and Statistics Department in mid-2013. For details, please see paragraph 31 of the explanatory notes given at the end of the report Gross Domestic Product (Quarterly) (Second Quarter 2013).
(#) Figures are subject to revision later on as more data become available.
( ) As a percentage of the total value of imports of goods/services.
< > As a percentage of the total value of imports of goods and services.

117
2008 2009 2010 2011 2012 2013Q3 Q4 Q1 Q2
(% change) ($Mn)
All markets 5.1 -12.6 22.8 10.1 2.9 3,434,346 3.8 7.0 4.0 2.4
Mainland of China 4.7 -7.8 26.5 9.3 6.3 1,857,759 11.2 12.1 6.3 5.1
United States -2.4 -20.6 16.4 -0.4 2.3 338,505 2.1 2.7 -1.4 -4.8
Japan 1.2 -10.0 17.2 5.9 6.5 143,970 7.5 4.3 -3.1 -7.5
Taiwan 3.8 -0.4 25.4 24.3 -5.2 80,842 -12.9 5.3 19.4 -13.3
Germany 15.8 -15.5 1.6 10.7 -12.8 77,812 -16.1 -3.7 -6.5 -5.7
India 50.0 0.2 42.4 25.6 -17.5 77,181 -20.2 -16.4 3.8 7.1
Republic of Korea -6.4 -13.0 24.4 14.2 -4.0 58,853 -3.9 -2.3 2.7 5.8
Singapore 9.6 -23.6 20.7 10.3 -0.5 55,950 1.1 1.5 8.3 3.0
United Kingdom 0.7 -20.8 1.9 -3.4 -6.0 55,164 -17.7 3.5 -10.1 -8.9
Vietnam 19.4 16.6 33.9 37.3 9.9 50,702 5.3 -5.3 1.5 14.7
Rest of the world 8.4 -20.2 20.9 15.1 0.6 637,607 -3.5 3.3 2.3 3.3
Table 7 : Total exports of goods by market(in value terms)
2012
(% change over a year earlier)(% change)
Note: Individual figures may not add up exactly to the total due to rounding.

118
2008 2009 2010 2011 2012 2013Q3 Q4 Q1 Q2
(% change) ($Mn)
All sources 5.5 -11.0 25.0 11.9 3.9 3,912,163 4.5 8.1 4.9 3.5
Mainland of China 6.1 -11.4 22.4 10.9 8.5 1,840,862 8.5 17.5 9.9 5.9
Japan 3.6 -20.6 30.4 3.4 -2.2 311,605 -1.6 -4.0 -12.6 -10.7
Singapore 0.1 -10.4 35.9 7.2 -3.2 246,346 3.5 -5.4 6.3 -1.7
Taiwan -6.4 -8.5 28.0 7.2 1.6 244,889 8.4 2.0 10.3 8.9
United States 8.6 -5.7 26.0 18.0 -3.3 204,459 -0.2 -9.6 -3.4 3.6
Republic of Korea -1.1 -12.7 29.8 12.2 2.4 153,527 12.1 10.0 9.3 6.2
Malaysia 5.3 2.8 24.5 5.1 -6.0 83,649 -6.1 -7.2 -4.0 -13.9
India 21.5 -9.3 36.5 20.6 -5.5 81,831 -11.9 -4.9 9.7 -0.2
Switzerland 31.1 -11.5 26.3 51.7 -0.7 78,546 -19.6 -8.2 -2.6 -10.7
Thailand 11.1 -9.7 32.5 0.3 -4.8 72,873 -12.5 30.4 13.4 2.5
Rest of the world 9.5 -8.2 19.2 20.2 5.8 593,575 4.2 6.2 -0.5 8.6
2008 2009 2010 2011 2012 2013Q3 Q4 Q1 Q2
(% change) ($Mn)
Overall 5.3 -10.8 27.3 17.3 3.0 1,056,611 3.1 7.6 7.1 5.8
Foodstuffs 19.7 9.9 17.0 18.8 5.1 114,870 -2.7 2.5 13.4 5.1
Consumer goods 9.0 -14.0 33.8 36.0 5.9 265,125 -7.0 15.9 4.2 2.1
Raw materials and semi-manufactures -4.5 -6.4 32.3 0.2 -6.5 306,262 1.9 10.3 27.5 12.7
Fuels 26.6 -18.4 33.8 21.9 -4.2 135,728 -7.4 -12.5 1.7 -11.4
Capital goods 2.5 -18.7 12.9 27.3 19.0 234,489 26.4 11.0 -15.0 10.1
(% change)
2012
(% change) (% change over a year earlier)
Table 8 : Imports of goods by source(in value terms)
Table 9 : Retained imports of goods by end-use category(in value terms)
2012
(% change over a year earlier)
Note: Individual figures may not add up exactly to the total due to rounding.
Note: Individual figures may not add up exactly to the total due to rounding.

119
2008 2009 2010 2011# 2012 2013Q3# Q4# Q1# Q2#
(% change) ($Mn)
Exports of services 8.5 -6.7 23.3 13.6 5.9 997,852 2.6 4.8 6.5 8.4
Transportation 12.5 -18.6 26.3 7.8 * 250,161 -4.4 -4.1 -2.5 -4.5
Travel 11.1 6.7 35.6 28.4 15.9 256,644 11.8 15.2 20.5 28.6
Trade-related 8.5 -4.3 18.0 11.0 3.8 281,043 3.0 3.2 3.4 2.2
Other services 1.8 -3.1 16.7 10.6 4.8 210,004 0.9 4.7 4.7 9.7
Imports of services 9.8 -7.5 17.3 10.2 2.2 448,118 -1.0 1.8 1.7 -0.7
Transportation 13.0 -21.6 20.7 14.3 -1.5 137,354 -5.1 -4.2 -4.1 -4.6
Travel 6.8 -3.8 11.9 9.8 5.2 155,716 2.9 4.2 6.9 -0.4
Trade-related 10.6 0.5 21.6 1.1 3.0 34,192 1.5 3.4 3.4 *
Other services 9.5 5.7 19.5 8.7 2.5 120,856 -1.9 4.7 1.3 4.0
Net exports of services 7.2 -5.8 29.4 16.8 9.1 549,734 5.7 7.3 10.6 16.1
(% change over a year earlier)(% change)
Table 10 : Exports and imports of services by component(at current market prices)
2012#
Notes: Individual figures may not add up exactly to the total due to rounding.
Figures are based on the System of National Accounts 2008, other than the change of ownership principle. For figures based on the change of ownership principle, please see Table 10a. For details about the change of ownership principle, please refer to the Special Report on Gross Domestic Product published by the Census and Statistics Department in September 2012.
Figures of imports and exports of services were revised back to 2009 as a result of a technical revision exercise conducted by the Census and Statistics Department in mid-2013. For details, please see paragraph 31 of the explanatory notes given at the end of the report Gross Domestic Product (Quarterly) (Second Quarter 2013).
(#) Figures are subject to revision later on as more data become available.
(*) Change within ±0.05%.

120
2008 2009 2010 2011# 2012 2013Q3# Q4# Q1# Q2#
(% change) ($Mn)
Exports of services 8.3 -7.9 24.9 13.7 6.6 758,966 2.5 5.4 7.3 10.1
Transportation 12.5 -18.6 26.3 7.8 * 250,161 -4.4 -4.1 -2.5 -4.5
Travel 11.1 6.7 35.6 28.4 15.9 256,644 11.8 15.2 20.5 28.6
Other services 2.4 -4.6 16.4 8.5 4.8 252,161 1.5 4.6 4.5 8.5
Imports of services 5.5 -16.2 15.5 5.7 -1.7 568,474 -5.1 -0.6 -1.4 -1.8
Transportation 13.0 -21.6 20.7 14.3 -1.5 137,354 -5.1 -4.2 -4.1 -4.6
Travel 6.8 -3.8 11.9 9.8 5.2 155,716 2.9 4.2 6.9 -0.4
Other services 2.1 -19.0 15.1 0.1 -5.2 275,404 -9.4 -1.4 -4.4 -1.1
(% change)
Table 10a: Exports and imports of services based on the change of ownershipprinciple by component (at current market prices)
2012#
(% change over a year earlier)
Notes: Individual figures may not add up exactly to the total due to rounding.
Statistics on exports and imports of services presented in this table provide supplementary information for analysis of international trade in goods and services, compiled using the change of ownership principle in recording goods sent abroad for processing and merchanting under the System of National Accounts 2008. The statistics are consistent with the goods and services statistics in the current account of Hong Kong's Balance of Payments. For details about the change of ownership principle, please refer to the Special Report on Gross Domestic Product published by the Census and Statistics Department in September 2012.
Figures of imports and exports of services were revised back to 2009 as a result of a technical revision exercise conducted by the Census and Statistics Department in mid-2013. For details, please see paragraph 31 of the explanatory notes given at the end of the report Gross Domestic Product (Quarterly) (Second Quarter 2013).
(#) Figures are subject to revision later on as more data become available.
(*) Change within ±0.05%.

121
2008 2009 2010 2011 2012 2012 2013Q3 Q4 Q1 Q2
('000)
All sources 29 506.6 29 590.7 36 030.3 41 921.3 48 615.1 13 053.6 13 238.7 12 742.3 12 623.5
Mainland of China 16 862.0 17 956.7 22 684.4 28 100.1 34 911.4 9 743.8 9 584.9 9 500.6 9 314.6
South and Southeast Asia 2 936.2 2 885.2 3 500.9 3 751.1 3 651.8 804.2 1 046.7 818.6 972.2
Taiwan 2 240.5 2 009.6 2 164.8 2 148.7 2 088.7 570.0 525.2 515.1 488.7
Europe 1 711.4 1 610.5 1 757.8 1 801.3 1 867.7 406.7 534.6 483.1 461.0
Japan 1 324.8 1 204.5 1 316.6 1 283.7 1 254.6 346.6 259.1 267.3 237.2
United States 1 146.4 1 070.1 1 171.4 1 212.3 1 184.8 270.5 314.7 270.3 285.0
Others 3 285.3 2 854.0 3 434.5 3 623.9 3 656.1 912.0 973.5 887.3 864.8
(% change over a year earlier)
All sources 4.7 0.3 21.8 16.4 16.0 17.7 15.1 13.5 13.7
Mainland of China 8.9 6.5 26.3 23.9 24.2 26.8 24.2 20.3 21.2
South and Southeast Asia 1.7 -1.7 21.3 7.1 -2.6 -9.4 -2.7 0.3 -1.3
Taiwan 0.1 -10.3 7.7 -0.7 -2.8 -2.7 3.2 3.9 -1.8
Europe -3.4 -5.9 9.1 2.5 3.7 -1.4 2.5 -0.1 4.0
Japan * -9.1 9.3 -2.5 -2.3 4.7 -26.7 -22.3 -22.2
United States -6.9 -6.7 9.5 3.5 -2.3 -3.3 -7.9 -4.9 -9.6
Others 1.7 -13.1 20.3 5.5 0.9 0.3 -0.6 -1.8 -0.2
Table 11 : Incoming visitors by source
Notes: Individual figures may not add up exactly to the total due to rounding.
(*) Change within ±0.05%.

122
2003 2004 2005 2006 2007 2008 2009
Residential property(a) (in units) 26 397 26 036 17 321 16 579 10 471 8 776 7 157Commercial property 417 371 145 291 368 390 235
of which :Office space 299 279 34 108 320 341 151Other commercial premises(b) 118 91 111 183 48 49 84
Industrial property(c) 15 1 17 27 16 78 3of which :Industrial-cum-office premises 15 0 4 0 0 4 0Conventional flatted factory space 0 1 0 0 16 70 3Storage premises(d) 0 0 13 27 0 4 0
Production of public housing(in units)Rental housing flats(e) 13 705 20 614 24 691 4 430 4 795 22 759 19 021Subsidised sales flats(e) 320 0 0 0 2 010 2 200 370
Residential property 1 038.4 530.0 550.7 706.7 900.0 530.0 546.8Commercial property 200.0 161.3 481.9 468.4 327.5 147.7 178.3Industrial property(f) 0.8 16.4 35.1 23.9 103.5 106.6 97.1Other properties 444.2 407.1 408.0 199.2 207.7 212.8 253.2Total 1 683.3 1 114.8 1 475.8 1 398.2 1 538.6 997.1 1 075.4
Agreements for sale and purchaseof property (Number)Residential property(g) 71 576 100 630 103 362 82 472 123 575 95 931 115 092
Primary market 26 498 25 694 15 994 13 986 20 123 11 046 16 161Secondary market 45 078 74 936 87 368 68 486 103 452 84 885 98 931
Selected types of non-residential properties(h)
Office space 1 817 3 213 3 431 2 874 4 129 2 845 2 521Other commerical premises 4 142 7 833 7 143 4 402 5 490 4 149 5 359Flatted factory space 3 813 5 889 6 560 7 409 9 072 5 741 5 554
Table 12 : Property market
Completion of new property by the private sector('000 m2 of internal floor area)
Building plans with consent to commence work in the private sector('000 m2 of usable floor area)
Notes: Individual figures may not add up exactly to the total due to rounding. (a) Figures before 2002 cover all completed residential premises to which either temporary or full Occupation Permits
have been granted, as well as village type houses issued with Letters of Compliance. Property developments subject to a Consent Scheme need a Certificate of Compliance, Consent to Assign or Consent to Lease in addition to an Occupation Permit before the premises can be individually assigned. Village-type housing units are excluded as from 2002 and units issued with temporary Occupation Permits are also excluded as from 2004 onwards.
Residential premises here pertain to private residential units, excluding units built under the Private Sector Participation Scheme (PSPS), Home Ownership Scheme (HOS), Buy or Rent Option, Mortgage Subsidy Scheme, Sandwich Class Housing Scheme, Urban Improvement Scheme (UIS) and Flat-for-Sale Scheme. Figures from 2004 onwards also cover those private flats converted from subsidised flats.
(b) These include retail premises and other premises designed or adapted for commercial use, with the exception of purpose-built offices. Car-parking space and commercial premises built by the Hong Kong Housing Authority and the Hong Kong Housing Society are excluded.
(c) These include industrial-cum-office premises, but exclude specialised factory buildings which are developed mainly for own use.
(d) These include storage premises at the container terminals and the airport.

123
2010 2011 2012 2012 2013Q3 Q4 Q1 Q2
Residential property(a) (in units) 13 405 9 449 10 149 3 854 4 016 236 1 249Commercial property 189 197 226 36 104 5 28
of which :Office space 124 155 136 22 62 1 19Other commercial premises(b) 65 42 90 13 42 4 9
Industrial property(c) 21 105 170 8 0 0 0of which :Industrial-cum-office premises 0 0 0 0 0 0 0Conventional flatted factory space 21 32 46 8 0 0 0Storage premises(d) 0 73 123 0 0 0 0
Production of public housing(in units)Rental housing flats(e) 6 385 17 787 9 778 0 0 10 407 N.A.Subsidised sales flats(e) 1 110 0 0 0 0 0 N.A.
Residential property 570.5 580.6 796.4 245.5 59.8 149.8 214.5Commercial property 158.4 133.6 210.2 28.8 34.0 48.3 56.8Industrial property(f) 34.3 109.3 70.7 16.5 41.5 90.4 5.1Other properties 459.2 232.7 428.9 223.3 94.9 11.5 12.1Total 1 222.4 1 056.2 1 506.1 514.1 230.3 299.9 288.4
Agreements for sale and purchase ofproperty (Number)Residential property(g) 135 778 84 462 81 333 21 097 19 035 16 271 11 443
Primary market 13 646 10 880 12 968 3 711 3 639 2 924 2 508Secondary market 122 132 73 582 68 365 17 386 15 396 13 347 8 935
Selected types of non-residential properties(h)
Office space 3 591 3 071 3 269 808 1 099 867 282Other commerical premises 7 639 5 980 7 282 1 685 2 451 2 216 693Flatted factory space 8 206 7 619 9 731 2 426 3 630 2 267 699
Table 12 : Property market (Cont'd)
Completion of new property by the private sector('000 m2 of internal floor area)
Building plans with consent to commence work in the private sector('000 m2 of usable floor area)
Notes: (e) The series, sourced from the Housing Authority's housing production figures, exhaustively cover all housing production and to count projects (including surplus HOS projects) which undergo transfer of usage at the time of (cont'd) disposal and according to their actual usage. Moreover, surplus HOS courts and blocks pending disposal are excluded from production statistics until they are disposed. Rental and sales flats projects of the Housing Society are included.
(f) These include multi-purpose industrial premises designed also for office use. (g) The figures are derived from sale and purchase agreements of domestic units received for registration for the
relevant periods. They generally relate to transactions executed up to four weeks prior to their submission for registration. Sales of domestic units refer to sale and purchase agreements with payment of stamp duty. These statistics do not include sales of units under the Home Ownership Scheme, the Private Sector Participation Scheme and the Tenants Purchase Scheme except those after payment of premium. Primary sales generally refer to sales from developers. Secondary sales refer to sales from parties other than developers.
(h) Timing of the figures for non-residential properties is based on the date on which the S&P Agreement is signed, which may differ from the date on which the Agreement is received for registration.
N.A. Not yet available.

124
2003 2004 2005 2006 2007 2008 2009
(Index (1999=100))
Property price indices :
Residential flats(a) 61.6 78.0 92.0 92.7 103.5 120.5 121.3
Office space 62.5 99.3 133.0 139.3 165.5 199.0 179.8
Shopping space 85.5 119.3 149.3 153.5 172.5 192.2 193.1
Flatted factory space 71.7 88.6 125.0 158.5 199.5 235.9 216.3
Property rental indices(b):
Residential flats 73.6 77.7 86.5 91.6 101.8 115.7 100.4
Office space 74.6 78.1 96.4 117.4 131.9 155.5 135.7
Shopping space 86.4 92.8 100.5 104.3 111.8 116.2 110.9
Flatted factory space 74.9 77.3 82.6 91.0 100.5 109.3 99.4
(% change)
Property price indices :
Residential flats(a) -11.9 26.6 17.9 0.8 11.7 16.4 0.7
Office space -8.6 58.9 33.9 4.7 18.8 20.2 -9.6
Shopping space 0.6 39.5 25.1 2.8 12.4 11.4 0.5
Flatted factory space -4.1 23.6 41.1 26.8 25.9 18.2 -8.3
Property rental indices(b):
Residential flats -11.8 5.6 11.3 5.9 11.1 13.7 -13.2
Office space -12.6 4.7 23.4 21.8 12.4 17.9 -12.7
Shopping space -7.0 7.4 8.3 3.8 7.2 3.9 -4.6
Flatted factory space -9.4 3.2 6.9 10.2 10.4 8.8 -9.1
Table 13 : Property prices and rentals
Notes: (a) Figures pertain to prices of existing flats traded in the secondary market, but not new flats sold in the primary market.
(b) All rental indices shown in this table have been adjusted for concessionary leasing terms such as provision of refurbishment, granting of rent-free periods, and waiver of miscellaneous charges, if known.
For residential property, changes in rentals cover only new tenancies for which rentals are freshly determined. For non-residential property, changes in rentals cover also lease renewals upon which rentals may be revised.
(#) Figures for non-residential property are provisional.
(+) Provisional figures.

125
2010 2011 2012 2012 2013Q3 Q4 Q1# Q2+
(Index (1999=100))
Property price indices :
Residential flats(a) 150.9 182.1 206.2 211.6 225.7 237.5 240.9
Office space 230.4 297.9 334.7 342.0 371.7 399.8 406.7
Shopping space 257.2 327.4 420.5 439.3 477.4 499.9 506.5
Flatted factory space 284.4 385.0 489.8 509.2 570.0 636.3 656.7
Property rental indices(b):
Residential flats 119.7 134.0 142.6 146.2 150.7 151.7 153.3
Office space 147.6 169.9 188.3 190.8 193.2 196.8 202.4
Shopping space 122.9 134.3 151.3 154.4 157.7 160.1 165.1
Flatted factory space 108.9 118.6 131.9 133.9 137.1 140.2 145.0
(% change over a year earlier)
Property price indices :
Residential flats(a) 24.4 20.7 13.2 14.3 23.9 28.2 19.1
Office space 28.1 29.3 12.4 10.5 22.1 32.3 26.0
Shopping space 33.2 27.3 28.4 30.7 38.7 37.6 26.0
Flatted factory space 31.5 35.4 27.2 26.7 41.8 52.0 42.3
Property rental indices(b):
Residential flats 19.2 11.9 6.4 6.4 10.2 13.5 9.7
Office space 8.8 15.1 10.8 9.1 7.7 7.8 8.5
Shopping space 10.8 9.3 12.7 13.0 13.2 11.7 10.1
Flatted factory space 9.6 8.9 11.2 10.5 12.2 12.1 10.3
Table 13 : Property prices and rentals (Cont'd)
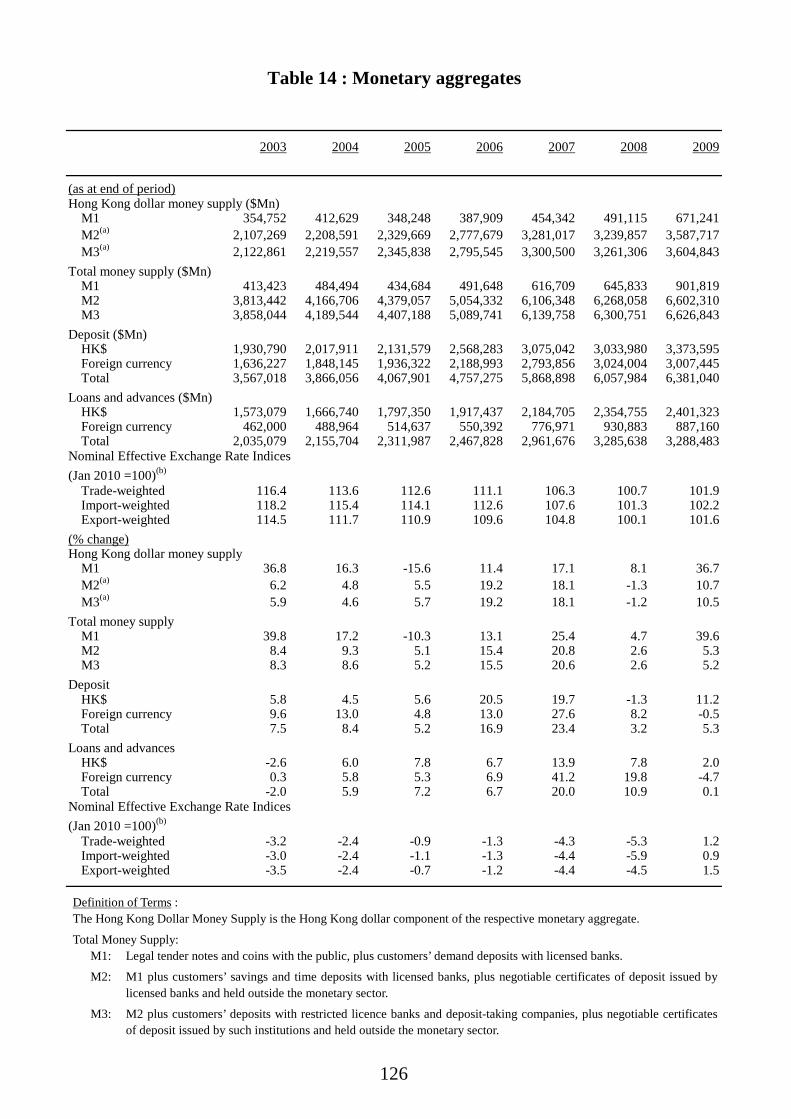
126
2003 2004 2005 2006 2007 2008 2009
(as at end of period)Hong Kong dollar money supply ($Mn)
M1 354,752 412,629 348,248 387,909 454,342 491,115 671,241M2(a) 2,107,269 2,208,591 2,329,669 2,777,679 3,281,017 3,239,857 3,587,717M3(a) 2,122,861 2,219,557 2,345,838 2,795,545 3,300,500 3,261,306 3,604,843
Total money supply ($Mn)M1 413,423 484,494 434,684 491,648 616,709 645,833 901,819M2 3,813,442 4,166,706 4,379,057 5,054,332 6,106,348 6,268,058 6,602,310M3 3,858,044 4,189,544 4,407,188 5,089,741 6,139,758 6,300,751 6,626,843
Deposit ($Mn)HK$ 1,930,790 2,017,911 2,131,579 2,568,283 3,075,042 3,033,980 3,373,595Foreign currency 1,636,227 1,848,145 1,936,322 2,188,993 2,793,856 3,024,004 3,007,445Total 3,567,018 3,866,056 4,067,901 4,757,275 5,868,898 6,057,984 6,381,040
Loans and advances ($Mn)HK$ 1,573,079 1,666,740 1,797,350 1,917,437 2,184,705 2,354,755 2,401,323Foreign currency 462,000 488,964 514,637 550,392 776,971 930,883 887,160Total 2,035,079 2,155,704 2,311,987 2,467,828 2,961,676 3,285,638 3,288,483
Trade-weighted 116.4 113.6 112.6 111.1 106.3 100.7 101.9Import-weighted 118.2 115.4 114.1 112.6 107.6 101.3 102.2Export-weighted 114.5 111.7 110.9 109.6 104.8 100.1 101.6
(% change)Hong Kong dollar money supply
M1 36.8 16.3 -15.6 11.4 17.1 8.1 36.7M2(a) 6.2 4.8 5.5 19.2 18.1 -1.3 10.7M3(a) 5.9 4.6 5.7 19.2 18.1 -1.2 10.5
Total money supplyM1 39.8 17.2 -10.3 13.1 25.4 4.7 39.6M2 8.4 9.3 5.1 15.4 20.8 2.6 5.3M3 8.3 8.6 5.2 15.5 20.6 2.6 5.2
DepositHK$ 5.8 4.5 5.6 20.5 19.7 -1.3 11.2Foreign currency 9.6 13.0 4.8 13.0 27.6 8.2 -0.5Total 7.5 8.4 5.2 16.9 23.4 3.2 5.3
Loans and advancesHK$ -2.6 6.0 7.8 6.7 13.9 7.8 2.0Foreign currency 0.3 5.8 5.3 6.9 41.2 19.8 -4.7Total -2.0 5.9 7.2 6.7 20.0 10.9 0.1
Trade-weighted -3.2 -2.4 -0.9 -1.3 -4.3 -5.3 1.2Import-weighted -3.0 -2.4 -1.1 -1.3 -4.4 -5.9 0.9Export-weighted -3.5 -2.4 -0.7 -1.2 -4.4 -4.5 1.5
Table 14 : Monetary aggregates
Nominal Effective Exchange Rate Indices(Jan 2010 =100)(b)
Nominal Effective Exchange Rate Indices(Jan 2010 =100)(b)
Definition of Terms : The Hong Kong Dollar Money Supply is the Hong Kong dollar component of the respective monetary aggregate.
Total Money Supply: M1: Legal tender notes and coins with the public, plus customers’ demand deposits with licensed banks.
M2: M1 plus customers’ savings and time deposits with licensed banks, plus negotiable certificates of deposit issued by licensed banks and held outside the monetary sector.
M3: M2 plus customers’ deposits with restricted licence banks and deposit-taking companies, plus negotiable certificates of deposit issued by such institutions and held outside the monetary sector.

127
2010 2011 2012 2012 2013Q3 Q4 Q1 Q2
(as at end of period)Hong Kong dollar money supply ($Mn)
M1 730,093 794,726 920,920 862,098 920,920 945,074 956,250M2(a) 3,866,788 4,046,216 4,537,384 4,336,166 4,537,384 4,541,179 4,543,265M3(a) 3,878,193 4,055,404 4,545,590 4,343,359 4,545,590 4,549,476 4,553,639
Total money supply ($Mn)M1 1,017,227 1,127,320 1,377,359 1,294,493 1,377,359 1,390,746 1,428,400M2 7,136,271 8,057,530 8,950,005 8,581,471 8,950,005 9,047,164 9,219,727M3 7,156,260 8,081,079 8,970,396 8,600,621 8,970,396 9,069,868 9,242,717
Deposit ($Mn)HK$ 3,617,183 3,740,240 4,176,200 3,985,551 4,176,200 4,165,265 4,166,844Foreign currency 3,245,081 3,851,020 4,120,234 3,954,523 4,120,234 4,187,837 4,313,985Total 6,862,265 7,591,260 8,296,434 7,940,074 8,296,434 8,353,102 8,480,829
Loans and advances ($Mn)HK$ 2,824,445 3,160,002 3,333,059 3,242,089 3,333,059 3,358,731 3,489,634Foreign currency 1,403,281 1,920,659 2,233,950 2,175,775 2,233,950 2,377,783 2,608,235Total 4,227,726 5,080,661 5,567,009 5,417,863 5,567,009 5,736,514 6,097,869
Trade-weighted 99.5 94.6 94.9 95.5 94.2 94.7 95.0Import-weighted 99.2 93.9 94.2 94.8 93.5 94.3 94.8Export-weighted 99.8 95.4 95.6 96.4 94.9 95.2 95.2
(% change over a year earlier)Hong Kong dollar money supply
M1 8.8 8.9 15.9 10.3 15.9 17.6 18.1M2(a) 7.8 4.6 12.1 11.0 12.1 9.2 9.6M3(a) 7.6 4.6 12.1 10.9 12.1 9.2 9.7
Total money supplyM1 12.8 10.8 22.2 15.7 22.2 17.9 17.4M2 8.1 12.9 11.1 10.5 11.1 9.5 10.8M3 8.0 12.9 11.0 10.4 11.0 9.6 10.9
DepositHK$ 7.2 3.4 11.7 10.5 11.7 9.0 9.3Foreign currency 7.9 18.7 7.0 6.4 7.0 8.9 10.8Total 7.5 10.6 9.3 8.4 9.3 8.9 10.1
Loans and advancesHK$ 17.6 11.9 5.5 3.7 5.5 6.5 8.9Foreign currency 58.2 36.9 16.3 14.3 16.3 16.5 23.4Total 28.6 20.2 9.6 7.7 9.6 10.4 14.7
Trade-weighted -2.4 -4.9 0.3 2.2 -0.4 0.2 -0.3Import-weighted -2.9 -5.3 0.3 2.4 -0.5 0.4 0.1Export-weighted -1.8 -4.4 0.2 2.1 -0.4 0.0 -0.8
Table 14 : Monetary aggregates (Cont'd)
Nominal Effective Exchange Rate Indices(Jan 2010 =100)(b)
Nominal Effective Exchange Rate Indices(Jan 2010 =100)(b)
Notes: (a) Adjusted to include foreign currency swap deposits.
(b) Period average.

128
Table 15 : Rates of change in business receipts indices forservices industries/domains
(%)
2009 2010 2011 2012 2012 2013
Q2 Q3 Q4 Q1
Services Industry
Import and export trade -13.7 19.7 8.9 -1.3 -2.8 -3.8 5.7 0.6
Wholesale -12.6 25.0 12.7 3.2 2.7 1.2 4.7 6.3
Retail 0.6 18.3 24.9 9.8 10.3 5.8 7.6 13.9
Transportation -19.9 24.5 4.4 0.9 -0.6 1.0 3.1 1.2within which :Land transport -2.6 6.0 7.0 11.9 13.4 14.9 11.0 7.6Water transport -24.1 20.5 0.6 -2.4 -8.1 1.2 4.5 2.3Air transport -21.0 33.7 6.7 0.3 1.3 -2.8 * -1.2
Warehousing and storage 1.4 9.5 9.4 25.2 29.4 24.1 16.3 1.4
Courier -6.1 28.3 17.3 16.1 7.8 17.5 27.5 16.4
Accommodation services(a) -17.4 25.3 19.6 13.8 15.1 18.9 13.3 11.3
Food services 0.6 5.1 6.4 5.0 4.2 4.4 5.2 3.7
Information and communications -3.2 4.9 8.8 9.3 8.6 5.4 13.0 7.0within which :Telecommunications 1.4 3.0 8.1 14.7 9.7 7.5 26.3 9.6Film entertainment -12.6 -6.4 -5.6 1.9 3.9 8.0 1.1 -8.1
Banking 1.5 8.8 10.8 9.4 10.3 10.9 6.8 17.8
Financing (except banking) -10.3 16.7 -2.4 1.6 -7.0 3.8 10.9 0.2within which :Financial markets and asset management -11.7 15.3 -3.2 1.7 -7.6 4.0 13.0 -2.0
within which : Asset management -12.1 28.4 10.6 -5.4 -11.6 -5.1 2.0 6.8
Insurance 0.7 8.3 9.4 13.6 12.1 12.6 15.0 13.6
Real estate 9.7 11.4 -0.9 11.8 2.5 29.1 11.5 5.7
Professional, scientific and technical services -0.5 13.9 7.3 -0.5 -0.2 -2.1 0.4 4.1
Administrative and support services -12.4 12.3 10.2 8.2 9.0 10.3 7.5 7.1
Services Domain
Tourism, convention and exhibition services 3.2 30.6 20.6 14.8 17.7 12.2 15.4 15.2+
Computer and information technology services -15.0 32.5 10.4 15.1 22.0 13.5 9.7 4.6
Notes: Upon the implementation of the new HSIC Version 2.0 by the C&SD in October 2008, the new classification has been adopted in compiling the quarterly business receipts indices. Starting from the first quarter of 2009, all business receipts indices are compiled based on the HSIC Version 2.0, and the base period of the indices has been changed to 2008 (i.e. with the quarterly average of the indices in 2008 taken as 100). The series of business receipts indices under the HSIC Version 2.0 has also been backcasted to the first quarter of 2005.
(a) Accommodation services covers hotels, guesthouses, boarding houses and other establishments providing short term accommodation.
(*) Change within ±0.05%.
(+) Provisional figure.

129
2008 2009 2010 2011 2012 2012 2013
Q3 Q4 Q1 Q2
(%)Labour force participation rate 60.9 60.8 59.6 60.1 60.5 60.4 60.4 61.2 61.5
Seasonally adjusted unemployment rate 3.5 5.3 4.3 3.4 3.3 3.3 3.2 3.5 3.3
Underemployment rate 1.9 2.3 2.0 1.7 1.5 1.6 1.5 1.6 1.6
('000)Population of working age 5 977.1 6 022.9 6 093.8 6 164.4 6 253.4 6 263.3 6 283.6 6 299.7 6 305.1
Labour force 3 637.2 3 660.3 3 631.3 3 703.1 3 785.2 3 781.8 3 794.9 3 852.7 3 877.2
Persons employed 3 509.1 3 467.6 3 474.1 3 576.4 3 660.7 3 650.1 3 678.1 3 720.2 3 745.1
Persons unemployed 128.1 192.6 157.2 126.7 124.5 131.7 116.8 132.5 132.1
Persons underemployed 67.9 83.8 72.5 63.3 57.6 59.2 55.9 61.1 61.4
(% change over a year earlier)Population of working age 1.0 0.8 1.2 1.2 1.4 1.3 1.3 1.2 0.9
Labour force 0.4 0.6 -0.8 2.0 2.2 1.5 1.7 2.4 2.5
Persons employed 0.9 -1.2 0.2 2.9 2.4 1.4 1.7 2.2 2.4
Persons unemployed -11.9 50.4 -18.4 -19.4 -1.8 4.6 0.7 7.6 4.5
Persons underemployed -14.5 23.4 -13.5 -12.7 -9.0 -9.2 6.7 4.2 12.7
Table 16 : Labour force characteristics

130
2008 2009 2010 2011 2012 2012Jun Sep Dec
Selected major industries (No.)
Manufacturing -3.5 -5.7 -4.5 -5.6 -5.1 -5.4 -4.3 -4.6 -3.7 104 022
Construction sites (manual workers only) -1.5 2.2 9.6 13.2 13.8 22.4 13.4 1.7 10.1 77 803
Import and export trade -0.3 -4.4 0.9 -0.3 -1.1 -0.6 -1.6 -0.9 0.4 495 218
Wholesale -2.7 -2.0 1.2 * -0.6 0.7 -1.6 -0.6 -1.5 62 767
Retail 2.8 -0.3 3.3 4.0 2.5 2.9 2.7 2.1 2.3 262 670
Food and beverage services 1.8 * 3.7 6.6 1.6 1.5 1.8 2.0 2.1 237 476
Accommodation services(a) 3.1 -1.0 1.5 5.8 9.2 7.8 9.6 9.2 4.6 38 114
Transportation, storage, postal and courier services 3.5 1.1 1.5 2.0 1.8 2.2 1.9 1.1 1.5 168 108
Information and communications 3.6 -1.6 1.3 3.4 5.6 5.3 6.3 4.2 3.3 98 376
Financing and insurance 5.6 -0.5 4.8 6.3 1.9 2.0 * 0.2 -1.1 207 594
Real estate 2.7 0.5 4.1 8.0 4.2 4.7 4.7 3.0 4.0 126 997
Professional and business services (excluding cleaning and similar services) 3.4 0.9 2.2 4.2 3.4 3.9 2.7 2.6 3.6 263 124
Cleaning and similar services -1.7 6.7 13.7 9.5 3.3 3.9 4.1 2.8 2.9 78 416
Education 4.8 5.3 3.4 1.5 2.4 3.0 2.2 2.5 3.1 176 054
Human health services 5.1 3.8 3.0 4.1 4.9 4.3 5.7 5.0 5.1 104 638
Residential care and social work services 1.3 1.5 1.8 1.3 2.0 2.1 1.7 2.9 2.0 59 291
Arts, entertainment, recreation and other services 1.9 0.8 5.0 2.8 0.6 1.3 * 1.5 2.2 118 655
Civil Service(b) 0.1 1.1 0.5 0.7 1.1 1.2 0.9 0.7 0.9 160 663
Others(c) 7.0 -1.0 3.1 -0.6 -5.1 -6.1 -6.2 -3.2 -0.4 10 400
2013
Table 17 : Employment in selected major industries
(% change over a year earlier)Mar
(% change)
Notes: Starting from March 2009, the survey coverage has been expanded to include more economic activities in some of the industries due to the change in industrial classification based on the Hong Kong Standard Industrial Classification Version 2.0. The activities newly covered are in the industries of transportation, storage, postal and courier services; professional and business services; and arts, entertainment, recreation and other services. The series of employment statistics under the HSIC Version 2.0 has also been backcasted to March 2000.
(a) Accommodation services covers hotels, guesthouses, boarding houses and other establishments providing short term accommodation.
(b) These figures cover only those employed on civil service terms of appointment. Judges, judicial officers, ICAC officers, locally engaged staff working in the Hong Kong Economic and Trade Offices outside Hong Kong, and other government employees such as non-civil service contract staff are not included.
(c) Include employment in mining and quarrying; and in electricity and gas supply, and waste management.
(*) Change within ±0.05%.

131
2008 2009 2010 2011 2012 2012 2013Jun Sep Dec Mar
(Number)
Building sites
Private sector 28 899 28 776 28 620 31 780 37 687 39 260 37 375 36 461 39 845
Public sector(a) 8 136 10 277 11 463 12 335 10 578 9 612 11 311 10 579 11 744
Sub-total 37 034 39 053 40 083 44 115 48 265 48 872 48 686 47 040 51 589
Civil engineering sites
Private sector 1 686 1 618 1 544 1 250 1 410 1 434 1 473 1 359 1 055
Public sector(a) 10 703 9 831 13 714 17 270 21 621 21 415 22 079 22 179 25 159
Sub-total 12 388 11 449 15 258 18 520 23 030 22 849 23 552 23 538 26 214
Total 49 422 50 501 55 341 62 635 71 295 71 721 72 238 70 578 77 803
(% change over a year earlier)
Building sites
Private sector -1.2 -0.4 -0.5 11.0 18.6 36.8 9.1 -2.5 5.8
Public sector(a) 4.7 26.3 11.5 7.6 -14.2 -26.8 3.3 -5.4 8.6
Sub-total 0.1 5.5 2.6 10.1 9.4 16.8 7.7 -3.1 6.5
Civil engineering sites
Private sector 0.7 -4.0 -4.6 -19.0 12.8 17.5 17.5 -6.7 -23.1
Public sector(a) -7.0 -8.1 39.5 25.9 25.2 37.8 27.8 14.5 20.9
Sub-total -6.0 -7.6 33.3 21.4 24.4 36.3 27.1 13.0 18.2
Total -1.5 2.2 9.6 13.2 13.8 22.4 13.4 1.7 10.1
Table 18 : Number of workers engaged at building and construction sites
Notes: Individual figures may not add up exactly to the total due to rounding.
(a) Including the Mass Transit Railway Corporation Limited and the Airport Authority Hong Kong.

132
(%)
2008 2009 2010 2011 2012 2012 2013
Selected industry section Q2 Q3 Q4 Q1
(in nominal terms)
Manufacturing 0.9 -3.5 2.6 7.2 8.6 5.8 8.6 5.9 2.1Sewerage, waste management and remediation activities -8.6 2.1 -0.1 5.6 4.5 4.4 5.6 2.1 3.5
Import/export and wholesale trade 6.3 -1.6 2.6 12.9 4.4 4.7 3.8 6.1 3.2
Retail trade 8.1 -1.5 3.9 12.3 10.1 6.7 8.1 9.9 4.9Transportation, storage, postal and courier services -0.6 -0.2 3.4 4.0 1.7 1.6 5.0 5.8 4.6Accommodation(a) and food service activities 2.6 -0.6 3.3 9.7 6.0 6.1 5.0 5.9 4.7
Information and communications 6.6 0.2 2.6 7.4 8.3 7.7 9.0 7.1 4.4
Financial and insurance activities 9.0 -3.3 7.2 11.5 4.4 3.7 4.1 3.8 6.4
Real estate activities 8.0 -2.4 1.3 11.4 7.5 5.9 3.9 6.1 4.5
Professional and business services 3.5 0.6 2.4 2.0 4.9 6.8 2.7 4.0 4.8
Social and personal services 3.1 1.7 -2.4 3.1 7.4 8.7 7.4 5.2 5.8
All industries surveyed 2.6 0.5 2.4 7.9 6.5 6.6 6.3 5.9 5.2
(in real terms)
Manufacturing -3.3 -4.1 0.3 1.9 4.4 1.5 5.4 2.1 -1.4Sewerage, waste management and remediation activities -12.3 1.5 -2.3 0.3 0.5 0.1 2.5 -1.6 -0.1
Import/export and wholesale trade 1.9 -2.3 0.2 7.2 0.3 0.4 0.7 2.2 -0.4
Retail trade 3.6 -2.1 1.6 6.7 5.8 2.4 4.9 5.9 1.3Transportation, storage, postal and courier services -4.7 -0.8 1.1 -1.2 -2.3 -2.5 1.9 2.0 0.9Accommodation(a) and food service activities -1.7 -1.2 1.0 4.2 1.8 1.8 2.0 2.1 1.0
Information and communications 2.2 -0.4 0.3 2.0 4.1 3.3 5.8 3.2 0.8
Financial and insurance activities 4.6 -3.9 4.8 6.0 0.3 -0.5 1.0 * 2.7
Real estate activities 3.5 -3.0 -1.0 5.8 3.3 1.6 0.9 2.2 0.9
Professional and business services -0.7 * 0.1 -3.1 0.8 2.5 -0.3 0.3 1.1
Social and personal services -1.2 1.1 -4.6 -2.1 3.3 4.3 4.3 1.4 2.1
All industries surveyed -1.7 -0.1 0.1 2.5 2.3 2.3 3.2 2.0 1.5
Table 19 : Rates of change in indices of payroll per person engagedby selected industry section
Notes: The rates of change in real terms are compiled from the Real Indices of Payroll per Person Engaged. The Indices are derived by deflating the Nominal Indices of Payroll per Person Engaged by the 2009/10-based Composite CPI.
Upon the implementation of the new Hong Kong Standard Industrial Classification Version 2.0 (HSIC V2.0) by the C&SD in October 2008, the new classification has been adopted in compiling the payroll statistics. Starting from the first quarter of 2009, all the payroll statistics, unless otherwise specified, are compiled based on the HSIC V2.0. The series of payroll indices under HSIC V2.0 has also been backcasted to the first quarter of 2004.
(a) Accommodation services covers hotels, guesthouses, boarding houses and other establishments providing short term accommodation.
(*) Change within ±0.05%.

133
(%)
2008 2009 2010 2011 2012 2012 2013
Jun Sep Dec Mar
(in nominal terms)Manufacturing 2.6 -1.2 -1.0 6.7 4.3 3.8 4.2 1.6 2.4Import/export, wholesale and retail trades(a) 3.6 -1.1 2.6 7.8 4.5 4.3 3.0 3.7 3.6
within which :Import/export and wholesale trades 3.1 -1.2 2.7 8.3 4.8 -- 3.3 -- 3.8Retail trade 4.9 -0.2 1.1 -0.3 2.1 -- 2.0 -- 2.1
Transportation 1.8 * 1.1 4.0 3.4 3.2 3.3 2.9 3.6Accommodation(b) and food service activities
3.1 -2.3 2.5 9.3 8.0 7.6 7.7 8.4 6.9
Financial and insurance activities(c) 2.8 -0.5 3.0 6.7 4.3 2.6 4.3 6.1 5.3Real estate leasing and maintenance management 2.7 -0.4 2.6 8.6 8.0 5.3 6.7 7.1 5.8Professional and business services 4.9 0.8 3.4 12.6 6.8 5.7 5.3 3.7 3.3Personal services 0.5 -0.7 3.4 9.6 9.7 9.5 9.0 8.4 7.3All industries surveyed 3.4 -0.9 2.4 8.1 5.7 5.1 4.8 5.1 4.7
(in real terms)Manufacturing -0.1 -1.8 -3.7 1.3 0.3 0.5 -0.1 -2.5 -1.5Import/export, wholesale and retail trades(a) 0.9 -1.7 -0.2 2.4 0.5 1.0 -1.3 -0.5 -0.4
within which :Import/export and wholesale trades 0.4 -1.7 -0.1 2.8 0.7 -- -1.0 -- -0.2Retail trade 2.2 -0.7 -1.6 -5.3 -1.8 -- -2.2 -- -1.8
Transportation -0.8 -0.5 -1.7 -1.2 -0.6 -0.1 -1.0 -1.3 -0.4Accommodation(b) and food service activities 0.4 -2.8 -0.3 3.8 3.8 4.2 3.3 4.0 2.8Financial and insurance activities(c) 0.2 -1.0 0.2 1.3 0.2 -0.7 * 1.8 1.3Real estate leasing and maintenance management 0.1 -1.0 -0.2 3.1 3.8 2.0 2.3 2.7 1.8Professional and business services 2.2 0.3 0.6 6.9 2.7 2.4 1.0 -0.5 -0.7Personal services -2.1 -1.2 0.6 4.1 5.5 6.0 4.5 4.0 3.2All industries surveyed 0.7 -1.5 -0.4 2.7 1.6 1.7 0.4 0.9 0.7
Table 20 : Rates of change in wage indicesby selected industry section
Selected industry section
Notes: The rates of change in real terms are compiled from the Real Wage Indices. The Indices are derived by deflating the Nominal Wage Indices by the 2009/10-based CPI(A).
Upon the implementation of the new Hong Kong Standard Industrial Classification Version 2.0 (HSIC V2.0) by the C&SD in October 2008, the new classification has been adopted in compiling the wage statistics. Starting from March 2009, all the wage statistics, unless otherwise specified, are compiled based on the HSIC V2.0. The series of wage indices under HSIC V2.0 has also been backcasted to March 2004.
(a) Starting from 2009, the sample size of the wage enquiry conducted in the second and fourth quarters of a year will be reduced. Therefore, wage statistics at detailed industry breakdowns will not be available for June and December of a year.
(b) Accommodation services covers hotels, guesthouses, boarding houses and other establishments providing short term accommodation.
(c) Excluding stock, commodity and bullion brokers, exchanges and services companies; insurance agents and brokers; and real estate agencies.
(*) Change within ±0.05%.
(--) Not applicable.

134
(%)
2003 2004 2005 2006 2007 2008 2009 2010
GDP deflator -6.0 -3.6 -0.2 -0.5 3.1 1.3 -0.4 0.3
Domestic demand deflator -4.0 -0.1 1.1 1.6 2.4 2.6 -0.8 2.2
Consumer Price Indices(a) :Composite CPI -2.6 -0.4 1.0 2.0 2.0 4.3 0.5 2.4CPI(A) -2.1 * 1.1 1.7 1.3 3.6 0.4 2.7CPI(B) -2.7 -0.5 1.0 2.1 2.2 4.6 0.5 2.3CPI(C) -2.9 -0.9 0.8 2.2 2.7 4.7 0.6 2.1
Unit Value Indices :Domestic exports 0.2 1.5 2.2 -2.1 0.8 5.1 -0.2 5.5Re-exports -1.5 1.1 1.2 1.1 2.4 3.8 1.2 4.6Total exports of goods -1.4 1.2 1.3 1.0 2.3 3.8 1.1 4.7Imports of goods -0.4 2.9 2.7 2.1 2.3 4.4 -0.1 6.4
Terms of Trade Index -1.0 -1.7 -1.4 -1.1 0.1 -0.5 1.3 -1.7
Producer Price Index for all manufacturing industries(b) -0.3 2.2 0.8 2.2 3.0 5.6 -1.7 6.0
Tender Price Indices :
Public sector building projects -0.3 -1.5 1.4 5.0 20.1 41.9 -15.9 12.5Public housing projects -10.0 3.5 7.7 11.2 19.7 30.8 -6.8 6.7
Table 21 : Rates of change in prices
Notes: (a) The year-on-year rates of change before October 2010 were derived using the index series in the bases periods at that time (for instance the 2004/05-based index series), compared with the index a year earlier in the same base period.
(b) Starting from the first quarter of 2009, the producer price indices for all manufacturing industries are compiled based on the HSIC Version 2.0, and the base period of the indices has been changed to 2008 (i.e. with the quarterly average of the indices in 2008 taken as 100). The new series has also been backcasted to the first quarter of 2005. The rates of change before 2006 presented here are the old series compiled based on the HSIC Version 1.1. The two series are therefore not strictly comparable.
(#) Figures are subject to revision later on as more data become available.
(*) Change within ±0.05%.
(--) Not applicable.
N.A. Not yet available.
Figures of domestic demand were revised back to 2009 as a result of a technical revision exercise conducted by the Census and Statistics Department in mid-2013. For details, please see paragraph 31 of the explanatory notes given at the end of the report Gross Domestic Product (Quarterly) (Second Quarter 2013).

135
(%)
2011 2012 2012 2013
Q3 Q4 Q1 Q210 years
2002 to 20125 years
2007 to 2012
GDP deflator# 3.9 3.9 4.3 4.3 1.4 0.7 0.1 1.8
Domestic demand deflator# 4.5 4.7 4.8 4.9 2.4 0.5 1.4 2.6
Consumer Price Indices(a) :Composite CPI 5.3 4.1 3.1 3.8 3.7 4.0 1.8 3.3CPI(A) 5.6 3.6 1.9 4.2 4.2 4.6 1.8 3.2CPI(B) 5.2 4.3 3.7 3.6 3.5 3.8 1.9 3.4CPI(C) 5.1 4.1 3.4 3.3 3.3 3.6 1.8 3.3
Unit Value Indices :Domestic exports 6.4 2.5 1.4 2.7 4.2 2.3 2.2 3.8Re-exports 8.0 3.4 1.8 1.3 0.5 0.4 2.5 4.2Total exports of goods 8.0 3.4 1.8 1.4 0.6 0.4 2.5 4.2Imports of goods 8.1 3.3 2.3 2.1 1.1 0.2 3.1 4.4
Terms of Trade Index -0.1 0.1 -0.5 -0.7 -0.5 0.2 -0.6 -0.2
Producer Price Index for all manufacturing industries(b) 8.3 0.1 -1.4 -1.0 0.6 N.A. -- 3.6
Tender Price Indices :
Public sector building projects 11.6 8.3 7.2 6.3 7.2 N.A. 7.4 10.2Public housing projects 10.1 6.4 5.7 6.8 N.A. N.A. 7.4 8.8
Average annualrate of change:
Table 21 : Rates of change in prices (Cont'd)

136
(%)
Weight 2003 2004 2005 2006 2007 2008 2009
All items 100.0 -2.6 -0.4 1.0 2.0 2.0 4.3 0.5(--) (--) (--) (--) (2.8) (5.6) (1.0)
Food 27.45 -1.5 1.0 1.8 1.7 4.3 10.1 1.3
Meals bought away from home 17.07 -1.5 0.2 0.9 1.3 2.5 5.9 1.6Food, excluding meals bought away from home 10.38 -1.7 2.5 3.2 2.5 7.1 16.8 0.9
Housing(a) 31.66 -4.8 -5.2 0.1 4.7 2.0 4.1 3.7
Private housing rent 27.14 -6.3 -6.6 -0.1 5.6 4.0 6.8 3.6
Public housing rent 2.05 9.1 2.5 0.2 0.1 -17.7 -27.2 9.5
Electricity, gas and water 3.10 1.4 11.4 4.1 2.1 -0.7 -6.5 -25.3
Alcoholic drinks and tobacco 0.59 0.1 * 0.4 -3.7 -1.2 0.1 18.7
Clothing and footwear 3.45 -2.7 6.4 2.0 1.0 4.1 0.8 2.7
Durable goods 5.27 -6.4 -2.2 -3.2 -6.4 -4.7 -2.0 -3.0
Miscellaneous goods 4.17 2.3 3.6 1.5 1.7 2.5 5.0 2.3
Transport 8.44 -0.4 0.4 1.4 0.7 -0.1 2.5 -0.9
Miscellaneous services 15.87 -3.2 -0.2 1.0 1.9 1.7 0.8 -2.1
Table 22 : Rates of change in Composite Consumer Price Index
Notes: The year-on-year rates of change before October 2010 were derived using the index series in the bases periods at that time (for instance the 2004/05-based index series), compared with the index a year earlier in the same base period. The weights quoted in this table correspond to that in the 2009/10-based index series.
Figures in bracket represent the underlying rate of change after netting out the effects of Government's one-off relief measures.
(a) Apart from "Private housing rent" and "Public housing rent", the "Housing" section also includes "Management fees and other housing charges" and "Materials for house maintenance".
(*) Change within ±0.05%.
(--) Not applicable.

137
(%)
Weight 2010 2011 2012 2012 2013
Q3 Q4 Q1 Q2
10 years2002 to
2012
5 years2007 to
2012
All items 100.0 2.4 5.3 4.1 3.1 3.8 3.7 4.0 1.8 3.3(1.7) (5.3) (4.7) (4.0) (3.8) (3.8) (3.9) (--) (3.7)
Food 27.45 2.4 7.0 5.8 5.1 4.2 4.1 4.5 3.3 5.3
Meals bought away from home 17.07 1.7 5.2 5.4 5.3 4.6 4.4 4.3 2.3 3.9Food, excluding meals bought away from home 10.38 3.5 9.9 6.5 5.0 3.6 3.6 4.8 5.0 7.4
Housing(a) 31.66 0.4 7.2 5.6 2.8 5.2 5.2 6.1 1.7 4.2
Private housing rent 27.14 0.9 7.2 6.8 5.8 5.1 5.0 6.1 2.1 5.0
Public housing rent 2.05 -7.8 11.9 -7.1 -87.8 9.7 9.7 8.9 -3.4 -5.2
Electricity, gas and water 3.10 43.3 -4.2 -8.2 3.6 4.6 4.9 5.9 0.5 -2.5
Alcoholic drinks and tobacco 0.59 3.4 17.1 3.0 0.5 0.6 1.6 1.9 3.5 8.2
Clothing and footwear 3.45 1.8 6.8 3.1 2.3 1.9 1.5 1.0 2.6 3.0
Durable goods 5.27 -2.7 -3.8 -1.4 -1.2 -1.7 -3.5 -5.0 -3.6 -2.6
Miscellaneous goods 4.17 2.4 3.8 2.2 1.4 2.0 1.4 2.2 2.7 3.1
Transport 8.44 2.0 4.4 3.0 2.2 2.2 2.0 2.2 1.3 2.2
Miscellaneous services 15.87 2.0 3.5 2.8 2.3 2.9 3.5 3.1 0.8 1.4
Table 22 : Rates of change in Composite Consumer Price Index (Cont'd)
Average annualrate of change:

138
(%)
2003 2004 2005 2006 2007 2008 2009
Private consumption expenditure -2.4 -0.4 1.6 0.9 4.1 2.5 -1.4
Government consumption expenditure -2.2 -2.6 -1.7 0.1 2.2 4.4 0.7
Gross domestic fixed capital formation -9.2 2.2 1.1 4.2 -2.1 1.7 0.3
Total exports of goods -1.8 0.9 0.6 0.3 2.2 3.4 0.5
Imports of goods -0.9 2.9 1.9 2.1 1.7 4.1 -1.3
Exports of services -3.1 0.5 3.3 3.6 2.5 3.4 -7.0
Imports of services 2.7 4.1 1.0 0.8 3.0 3.8 -2.7
Gross Domestic Product -6.0 -3.6 -0.2 -0.5 3.1 1.3 -0.4
Total final demand -2.7 0.5 1.1 1.1 2.3 3.1 -1.1
Domestic demand -4.0 -0.1 1.1 1.6 2.4 2.6 -0.8
Table 23 : Rates of change in implicit price deflators of GDPand its main expenditure components
Notes: (#) Figures are subject to revision later on as more data become available.
Figures of private consumption expenditure, exports of goods, and imports and exports of services were revised back to 2009 as a result of a technical revision exercise conducted by the Census and Statistics Department in mid-2013. For details, please see paragraph 31 of the explanatory notes given at the end of the report Gross Domestic Product (Quarterly) (Second Quarter 2013).
(*) Change within ±0.05%.

139
(%)
2010 2011# 2012# 2012 2013
Q3# Q4# Q1# Q2#
10 years2002 to
2012#
5 years2007 to
2012#
Private consumption expenditure 1.4 3.6 3.1 2.5 2.7 1.8 2.1 1.3 1.8
Government consumption expenditure -0.2 4.5 6.1 6.1 6.2 6.0 4.4 1.1 3.1
Gross domestic fixed capital formation 5.8 6.8 8.2 9.3 10.2 3.6 -4.4 1.8 4.5
Total exports of goods 4.6 7.7 3.1 1.3 1.0 -0.5 -0.5 2.1 3.9
Imports of goods 6.3 8.2 3.8 1.8 1.2 0.1 -0.5 2.9 4.2
Exports of services 7.4 7.6 3.8 2.4 1.8 1.1 0.3 2.1 2.9
Imports of services 5.6 6.4 1.8 0.5 2.5 1.1 0.7 2.6 2.9
Gross Domestic Product 0.3 3.9 3.9 4.3 4.3 1.4 0.7 0.1 1.8
Total final demand 4.3 6.7 3.7 2.5 2.3 0.6 * 1.9 3.3
Domestic demand 2.2 4.5 4.7 4.8 4.9 2.4 0.5 1.4 2.6
Average annualrate of change:
Table 23 : Rates of change in implicit price deflators of GDPand its main expenditure components (Cont'd)


