Embed Size (px)
Citation preview
Half-Year Report 2021
(A joint stock company incorporated in the People’s Republic of China with limited liability)
Stock Code: 939 (Ordinary H-share)601939 (Ordinary A-Share)360030 (Domestic Preference Share)
China Construction Bank Corporation
ContentsDEFINITIONS 4
IMPORTANT NOTICE 7
1 FINANCIAL HIGHLIGHTS 8
2 CORPORATE INFORMATION 9
3 MANAGEMENT DISCUSSION AND ANALYSIS 11
3.1 FINANCIAL REVIEW 11
3.1.1 Statement of Comprehensive Income Analysis 11
3.1.2 Statement of Financial Position Analysis 19
3.1.3 Other Financial Information 25
3.2 BUSINESS REVIEW 26
3.2.1 Promotion of Three Major Strategies 26
3.2.2 Corporate Banking 28
3.2.3 Personal Banking 30
3.2.4 Treasury Business 31
3.2.5 Overseas Commercial Banking Business 33
3.2.6 Integrated Operation Subsidiaries 35
3.2.7 Analysed by Geographical Segment 37
3.2.8 Building of Branch Network and Channels 38
3.2.9 Digitalised Operation and Product Innovation 40
3.2.10 Human Resources 41
3.3 RISK MANAGEMENT 42
3.3.1 Credit Risk Management 42
3.3.2 Market Risk Management 46
3.3.3 Operational Risk Management 49
3.3.4 Liquidity Risk Management 49
3.3.5 Reputational Risk Management 50
3.3.6 Country Risk Management 51
3.3.7 Consolidated Management 51
3.3.8 Internal Audit 51
3.4 CAPITAL MANAGEMENT 51
3.4.1 Capital Adequacy Ratios 51
3.4.2 Leverage Ratio 53
3.5 PROSPECTS 53
4 CHANGES IN SHARE CAPITAL AND PARTICULARS OF SHAREHOLDERS 56
4.1 CHANGES IN ORDINARY SHARES 56
4.2 NUMBER OF ORDINARY SHAREHOLDERS AND PARTICULARS OF SHAREHOLDING 56
4.3 CHANGES IN CONTROLLING SHAREHOLDERS AND ACTUAL CONTROLLING PARTIES 57
4.4 INTERESTS AND SHORT POSITIONS OF SUBSTANTIAL SHAREHOLDERS AND OTHER PERSONS 57
4.5 DIRECTORS’ AND SUPERVISORS’ INTERESTS AND SHORT POSITIONS 57
4.6 DETAILS OF PREFERENCE SHARES 58
We have included in this report certain forward-looking statements with respect to our financial position, operating results and business development. These statements are based on current plans, estimates and projections. Although we believe that the expectations reflected in these forward-looking statements are reasonable, these statements do not constitute a substantive commitment to investors. Please be fully aware of the risks and understand the differences between plans, projections and commitments.
The main risks faced by the Group include credit risk, market risk, operational risk, liquidity risk, reputational risk and country risk. We proactively took measures to manage various risks effectively. For more information, please refer to “Risk Management” in the “Management Discussion and Analysis”.
This report is prepared in both Chinese and English. In the case of discrepancy between the two versions, the Chinese version shall prevail.
5 CORPORATE GOVERNANCE 59
5.1 SHAREHOLDERS’ GENERAL MEETING CONVENED 59
5.2 PROFILES OF DIRECTORS, SUPERVISORS AND SENIOR MANAGEMENT 59
5.2.1 Particulars of Directors, Supervisors and Senior Management 59
5.2.2 Changes in Directors, Supervisors and Senior Management 60
5.2.3 Changes in Personal Information of Directors, Supervisors and Senior Management 60
5.2.4 Directors’ and Supervisors’ Securities Transactions 60
5.3 FORMULATION AND IMPLEMENTATION OF CASH DIVIDEND POLICY 61
5.4 PROGRESS OF IMPLEMENTATION OF EMPLOYEE STOCK INCENTIVE PLAN 61
6 CORPORATE SOCIAL RESPONSIBILITIES (ENVIRONMENTAL, SOCIAL AND GOVERNANCE) 62
6.1 GOVERNANCE 62
6.2 ENVIRONMENT 62
6.3 SOCIETY 64
7 MAJOR ISSUES 67
APPENDIX I: INDEPENDENT AUDITOR’S REPORT AND FINANCIAL STATEMENTS 69
APPENDIX II: SUPPLEMENTARY INFORMATION TO CAPITAL ADEQUACY RATIOS 177
Definitions
4 China Construction Bank Corporation Half-Year Report 2021
In this half-year report, unless the context otherwise requires, the following terms shall have the meanings set out below.
Institutions
Bank China Construction Bank Corporation
Baowu Steel Group China Baowu Steel Group Corporation Limited
Board Board of directors
CBIRC China Banking and Insurance Regulatory Commission
CCB or Group China Construction Bank Corporation and its subsidiaries
CCB Asia China Construction Bank (Asia) Corporation Limited
CCB Brasil China Construction Bank (Brasil) Banco Múltiplo S/A
CCB Europe China Construction Bank (Europe) S.A.
CCB Financial Leasing CCB Financial Leasing Co., Ltd.
CCB Futures CCB Futures Co., Ltd.
CCB Housing CCB Housing Services Co., Ltd.
CCB Indonesia PT Bank China Construction Bank Indonesia Tbk
CCB International CCB International (Holdings) Limited
CCB Investment CCB Financial Asset Investment Co., Ltd.
CCB Life CCB Life Insurance Co., Ltd.
CCB London China Construction Bank (London) Limited
CCB Malaysia China Construction Bank (Malaysia) Berhad
CCB New Zealand China Construction Bank (New Zealand) Limited
CCB Pension CCB Pension Management Co., Ltd.
CCB Principal Asset Management CCB Principal Asset Management Co., Ltd.
CCB Property & Casualty CCB Property & Casualty Insurance Co., Ltd.
CCB Russia China Construction Bank (Russia) Limited
CCB Trust CCB Trust Co., Ltd.
CCB Wealth Management CCB Wealth Management Co., Ltd.
CSRC China Securities Regulatory Commission
Hong Kong Stock Exchange The Stock Exchange of Hong Kong Limited
Huijin Central Huijin Investment Ltd.
MOF Ministry of Finance of the People’s Republic of China
PBC The People’s Bank of China
China Construction Bank CorporationHalf-Year Report 2021 5
Definitions
Sino-German Bausparkasse Sino-German Bausparkasse Co., Ltd.
State Council State Council of the People’s Republic of China
State Grid State Grid Corporation of China
Yangtze Power China Yangtze Power Co., Limited
Platforms, products and services
CCB Cloud A cloud service brand built and operated independently by the Bank on the basis of cloud computing, so as to provide multi-level FinTech products and diversified ecological services to all kinds of users, including the Group, financial institutions and those who pursue services such as government affairs service and housing service
CCB Huidongni A one-stop mobile finance service platform built by the Bank for inclusive finance customers by using the Internet, big data, artificial intelligence and biometric technologies
CCB Long Fortune A uniform service platform and major marketing brand created by the Bank to all personal customers for wealth management based on inclusive finance concept and FinTech toolkits
CCB Match Plus An open platform leveraging FinTech to provide corporate customers with smart matchmaking services and a full range of financial solutions in cross-border transaction scenarios
CCB SMART Custody A comprehensive custody services brand of the Bank featuring safety, multiple choices, accuracy, reliability and technology
CCB Startup Station A service model and brand created by the Bank to provide one-stop comprehensive services featuring “Finance + Incubation + Industry + Education” for start-ups and innovative enterprises, by leveraging online platform and offline service entities, integrating internal and external resources and focusing on financial services
CCB Yunongtong A comprehensive service brand for rural revitalisation by implementing New Finance through offline inclusive finance service outlets, online comprehensive service platform and ecological scenarios for smart agriculture industry chain of the Bank
Cloud Workshop A whole-process closed-loop, standardised, professional and personalised online service window customised by the Bank for client managers
Cross-border Quick Loan An online unsecured credit trade financing service provided by the Bank for small and micro cross-border trade businesses
FITS Financial Total Solutions, a comprehensive investment banking brand of the Bank incorporating a host of financial products and instruments
Huishibao A comprehensive settlement service platform of the Bank designed to fulfill the treasury management requirements of niche markets and core enterprises in the supply chains
Long Pay An internet-based enterprise-level mobile digital payment brand of the Bank, which provides customers with a portfolio of products consisting of comprehensive integrated payment and settlement services
Mingonghui An innovative financial service product of the Bank to address pain points in the payment of migrant workers’ wages
Shanfutong A supply chain financial service provided by the Bank on e.ccb.com to customers as well as upstream and downstream businesses based on supply chain relationship with corporate customers
WMPs Wealth management products
Yunong Quick Loan A loan service provided by the Bank for agriculture-related small and micro businesses, new agricultural operators, organisations of rural collective economy, self-employed individuals, and farmers based on data of agricultural production and operation
6 China Construction Bank Corporation Half-Year Report 2021
Definitions
Others
AML Anti-money laundering
IFRS International Financial Reporting Standards
Listing Rules of Hong Kong Stock Exchange
The Rules Governing the Listing of Securities on The Stock Exchange of Hong Kong Limited
New financial instruments standard or IFRS 9
International Financial Reporting Standard No. 9 – Financial Instruments issued by International Accounting Standards Board, which came into effect on 1 January 2018
PRC GAAP Accounting Standards for Business Enterprises and other relevant requirements promulgated by the MOF on 15 February 2006 and afterwards
SFO Securities and Futures Ordinance (Chapter 571 of the Laws of Hong Kong)
Important Notice
China Construction Bank CorporationHalf-Year Report 2021 7
The Board, the board of supervisors, directors, supervisors and senior management of the Bank warrant that the information in this half-year report is truthful, accurate and complete and there are no false presentations, misleading statements or material omissions, and they assume several and joint legal liability for such contents.
The Half-Year Report 2021 and results announcement have been reviewed and approved at the Board meeting of the Bank held on 27 August 2021. All the 13 directors of the Bank attended the meeting in person.
As approved by the 2020 annual general meeting, the Bank distributed the 2020 cash dividend of RMB0.326 per share (including tax), totalling RMB3,128 million approximately, on 15 July 2021 to its A-share holders whose names appeared on the register of members after the close of market on 14 July 2021; the Bank distributed the 2020 cash dividend of RMB0.326 per share (including tax), totalling RMB78,376 million approximately, on 5 August 2021 to its H-share holders whose names appeared on the register of members after the close of market on 14 July 2021. The Bank does not declare any 2021 interim dividend, nor does it propose any capitalisation of capital reserve into share capital.
The Group’s 2021 half-year financial statements prepared under PRC GAAP have been reviewed by Ernst & Young Hua Ming LLP and the Group’s 2021 half-year financial statements prepared under IFRS have been reviewed by Ernst & Young.
Mr. Wang Jiang, vice chairman, executive director and president of the Bank, Mr. Kenneth Patrick Chung and Mr. Michel Madelain, independent non-executive directors of the Bank, hereby warrant the truthfulness, accuracy and completeness of the financial statements in this half-year report.
8 China Construction Bank Corporation Half-Year Report 2021
1 Financial Highlights
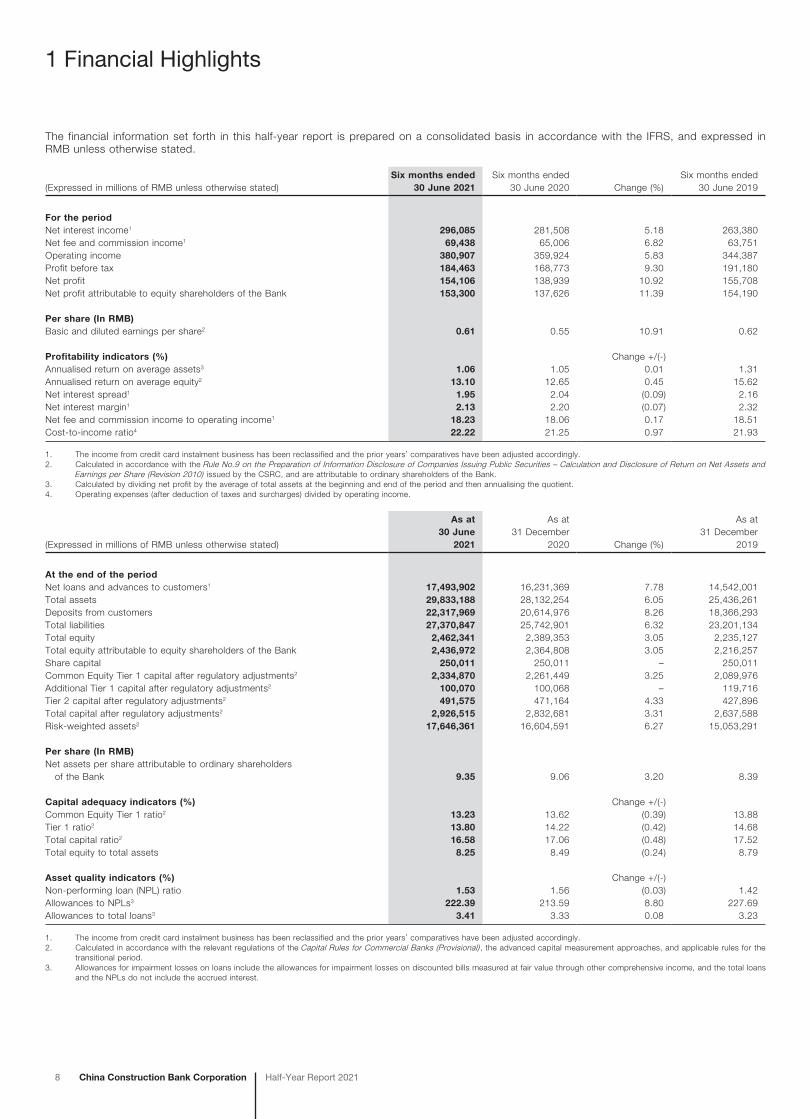
The financial information set forth in this half-year report is prepared on a consolidated basis in accordance with the IFRS, and expressed in RMB unless otherwise stated.
(Expressed in millions of RMB unless otherwise stated)Six months ended
30 June 2021Six months ended
30 June 2020 Change (%)Six months ended
30 June 2019
For the periodNet interest income1 296,085 281,508 5.18 263,380Net fee and commission income1 69,438 65,006 6.82 63,751Operating income 380,907 359,924 5.83 344,387Profit before tax 184,463 168,773 9.30 191,180Net profit 154,106 138,939 10.92 155,708Net profit attributable to equity shareholders of the Bank 153,300 137,626 11.39 154,190
Per share (In RMB)Basic and diluted earnings per share2 0.61 0.55 10.91 0.62
Profitability indicators (%) Change +/(-)Annualised return on average assets3 1.06 1.05 0.01 1.31Annualised return on average equity2 13.10 12.65 0.45 15.62Net interest spread1 1.95 2.04 (0.09) 2.16Net interest margin1 2.13 2.20 (0.07) 2.32Net fee and commission income to operating income1 18.23 18.06 0.17 18.51Cost-to-income ratio4 22.22 21.25 0.97 21.93
1. The income from credit card instalment business has been reclassified and the prior years’ comparatives have been adjusted accordingly.2. Calculated in accordance with the Rule No.9 on the Preparation of Information Disclosure of Companies Issuing Public Securities – Calculation and Disclosure of Return on Net Assets and
Earnings per Share (Revision 2010) issued by the CSRC, and are attributable to ordinary shareholders of the Bank.3. Calculated by dividing net profit by the average of total assets at the beginning and end of the period and then annualising the quotient.4. Operating expenses (after deduction of taxes and surcharges) divided by operating income.
(Expressed in millions of RMB unless otherwise stated)
As at 30 June
2021
As at 31 December
2020 Change (%)
As at 31 December
2019
At the end of the periodNet loans and advances to customers1 17,493,902 16,231,369 7.78 14,542,001Total assets 29,833,188 28,132,254 6.05 25,436,261Deposits from customers 22,317,969 20,614,976 8.26 18,366,293Total liabilities 27,370,847 25,742,901 6.32 23,201,134Total equity 2,462,341 2,389,353 3.05 2,235,127Total equity attributable to equity shareholders of the Bank 2,436,972 2,364,808 3.05 2,216,257Share capital 250,011 250,011 – 250,011Common Equity Tier 1 capital after regulatory adjustments2 2,334,870 2,261,449 3.25 2,089,976Additional Tier 1 capital after regulatory adjustments2 100,070 100,068 – 119,716Tier 2 capital after regulatory adjustments2 491,575 471,164 4.33 427,896Total capital after regulatory adjustments2 2,926,515 2,832,681 3.31 2,637,588Risk-weighted assets2 17,646,361 16,604,591 6.27 15,053,291
Per share (In RMB)Net assets per share attributable to ordinary shareholders of the Bank 9.35 9.06 3.20 8.39
Capital adequacy indicators (%) Change +/(-)Common Equity Tier 1 ratio2 13.23 13.62 (0.39) 13.88Tier 1 ratio2 13.80 14.22 (0.42) 14.68Total capital ratio2 16.58 17.06 (0.48) 17.52Total equity to total assets 8.25 8.49 (0.24) 8.79
Asset quality indicators (%) Change +/(-)Non-performing loan (NPL) ratio 1.53 1.56 (0.03) 1.42Allowances to NPLs3 222.39 213.59 8.80 227.69Allowances to total loans3 3.41 3.33 0.08 3.23
1. The income from credit card instalment business has been reclassified and the prior years’ comparatives have been adjusted accordingly.2. Calculated in accordance with the relevant regulations of the Capital Rules for Commercial Banks (Provisional) , the advanced capital measurement approaches, and applicable rules for the
transitional period.3. Allowances for impairment losses on loans include the allowances for impairment losses on discounted bills measured at fair value through other comprehensive income, and the total loans
and the NPLs do not include the accrued interest.
2 Corporate Information
China Construction Bank CorporationHalf-Year Report 2021 9
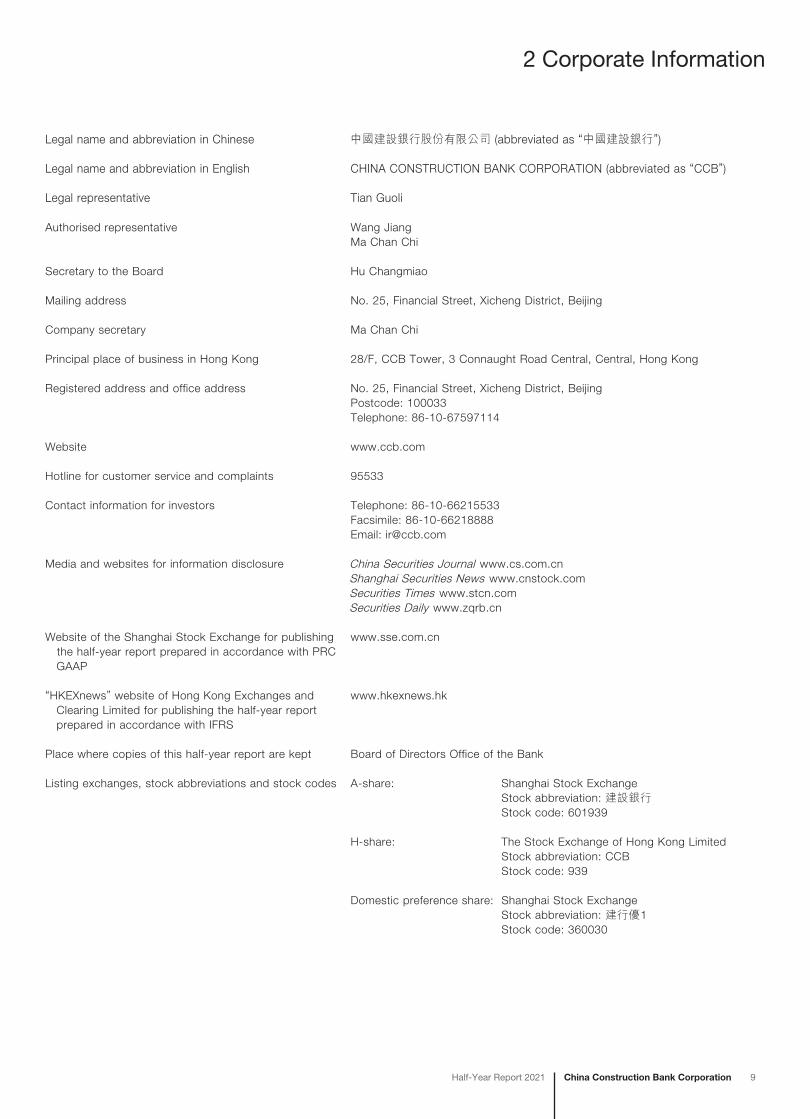
Legal name and abbreviation in Chinese 中國建設銀行股份有限公司 (abbreviated as “中國建設銀行”)
Legal name and abbreviation in English CHINA CONSTRUCTION BANK CORPORATION (abbreviated as “CCB”)
Legal representative Tian Guoli
Authorised representative Wang JiangMa Chan Chi
Secretary to the Board Hu Changmiao
Mailing address No. 25, Financial Street, Xicheng District, Beijing
Company secretary Ma Chan Chi
Principal place of business in Hong Kong 28/F, CCB Tower, 3 Connaught Road Central, Central, Hong Kong
Registered address and office address No. 25, Financial Street, Xicheng District, BeijingPostcode: 100033Telephone: 86-10-67597114
Website www.ccb.com
Hotline for customer service and complaints 95533
Contact information for investors Telephone: 86-10-66215533Facsimile: 86-10-66218888Email: [email protected]
Media and websites for information disclosure China Securities Journal www.cs.com.cnShanghai Securities News www.cnstock.comSecurities Times www.stcn.comSecurities Daily www.zqrb.cn
Website of the Shanghai Stock Exchange for publishing the half-year report prepared in accordance with PRC
GAAP
www.sse.com.cn
“HKEXnews” website of Hong Kong Exchanges and Clearing Limited for publishing the half-year report prepared in accordance with IFRS
www.hkexnews.hk
Place where copies of this half-year report are kept Board of Directors Office of the Bank
Listing exchanges, stock abbreviations and stock codes A-share: Shanghai Stock Exchange Stock abbreviation: 建設銀行 Stock code: 601939
H-share: The Stock Exchange of Hong Kong Limited Stock abbreviation: CCB Stock code: 939
Domestic preference share: Shanghai Stock Exchange Stock abbreviation: 建行優1 Stock code: 360030
10 China Construction Bank Corporation Half-Year Report 2021
2 Corporate Information
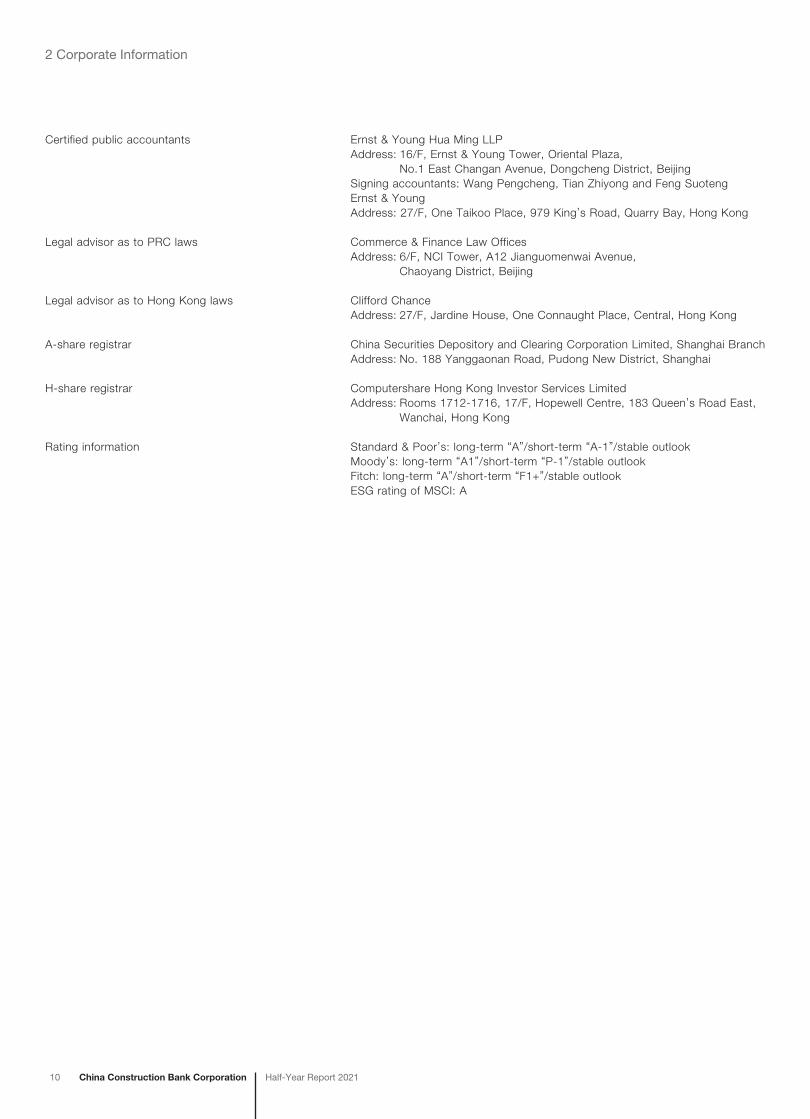
Certified public accountants Ernst & Young Hua Ming LLPAddress: 16/F, Ernst & Young Tower, Oriental Plaza, No.1 East Changan Avenue, Dongcheng District, BeijingSigning accountants: Wang Pengcheng, Tian Zhiyong and Feng SuotengErnst & YoungAddress: 27/F, One Taikoo Place, 979 King’s Road, Quarry Bay, Hong Kong
Legal advisor as to PRC laws Commerce & Finance Law OfficesAddress: 6/F, NCI Tower, A12 Jianguomenwai Avenue, Chaoyang District, Beijing
Legal advisor as to Hong Kong laws Clifford ChanceAddress: 27/F, Jardine House, One Connaught Place, Central, Hong Kong
A-share registrar China Securities Depository and Clearing Corporation Limited, Shanghai BranchAddress: No. 188 Yanggaonan Road, Pudong New District, Shanghai
H-share registrar Computershare Hong Kong Investor Services LimitedAddress: Rooms 1712-1716, 17/F, Hopewell Centre, 183 Queen’s Road East,
Wanchai, Hong Kong
Rating information Standard & Poor’s: long-term “A”/short-term “A-1”/stable outlookMoody’s: long-term “A1”/short-term “P-1”/stable outlookFitch: long-term “A”/short-term “F1+”/stable outlookESG rating of MSCI: A
3 Management Discussion and Analysis
China Construction Bank CorporationHalf-Year Report 2021 11
3.1 Financial Review
In the first half of 2021, the global economy continued to recover, though with growing divergence. Major developed economies continued to maintain monetary easing policies, while certain emerging economies began to raise interest rates in response to pressures such as inflation, capital outflows and currency depreciation. China continued to consolidate its achievements in COVID-19 prevention and control as well as economic and social development, and its economic development maintained an overall stable and upward trend. Domestic consumption gradually improved, investment continued to recover, and the growth of import and export trades remained favourable. In the first half of 2021, China’s gross domestic product and consumer price index rose by 12.7% and 0.5% from the same period last year, respectively.
Domestic regulators carefully coordinated the relationship between economic recovery and risk prevention, placed greater importance on serving the real economy, and the banking industry maintained a good momentum of stable operation. The banking industry continuously enhanced its financial services with steady growth of total assets, basically stable credit asset quality, continued profit growth, relatively strong risk mitigation capability and steady liquidity.
In the first half of 2021, the Group enhanced the quality and efficiency in serving the real economy, and achieved new progress in its high-quality development. The Group’s total assets and liabilities steadily increased. Total assets reached RMB29.83 trillion, up 6.05%, of which net loans and advances to customers amounted to RMB17.49 trillion, up 7.78%. Total liabilities reached RMB27.37 trillion, up 6.32%, of which deposits from customers were RMB22.32 trillion, up 8.26%. As compared to the first half of 2020, net interest income increased by 5.18%, net fee and commission income increased by 6.82%, and operating income increased by 5.83% to RMB380,907 million. The Group’s NPL ratio was 1.53%, down 0.03 percentage points from the end of 2020. The Group’s net profit was RMB154,106 million, up 10.92% from the same period last year. Annualised return on average assets was 1.06%, annualised return on average equity was 13.10%, and capital adequacy ratio was 16.58%.
3.1.1 Statement of Comprehensive Income Analysis
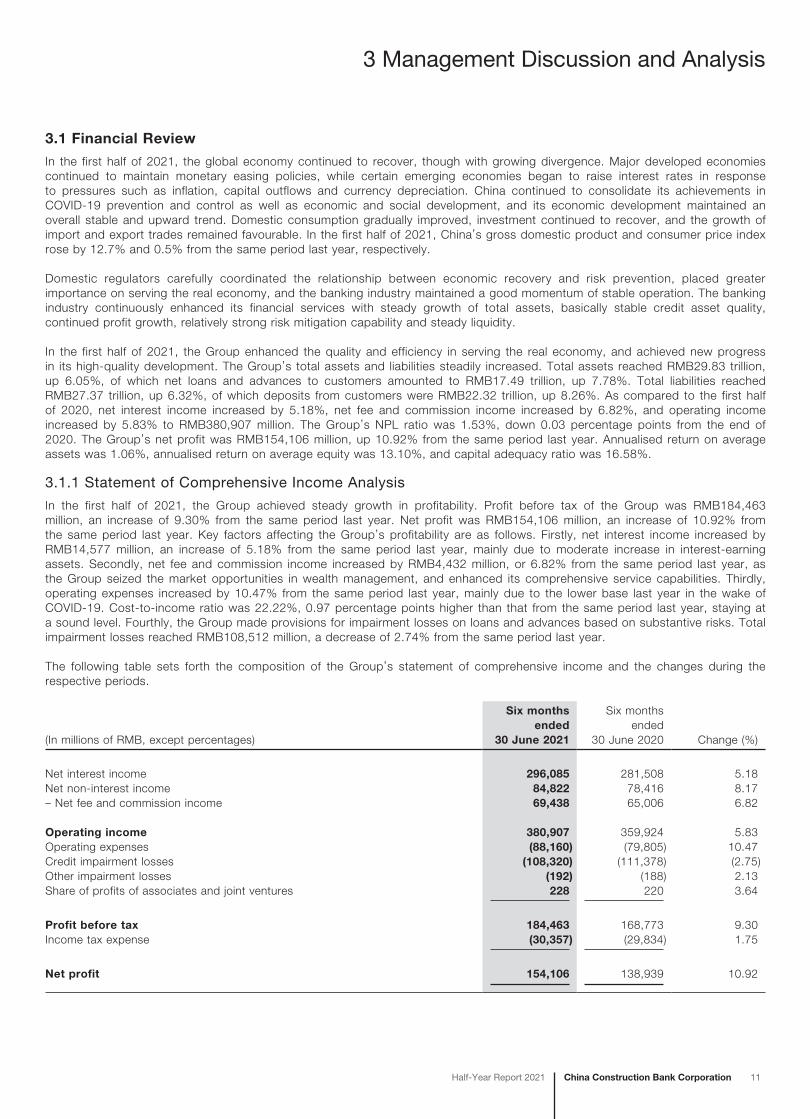
In the first half of 2021, the Group achieved steady growth in profitability. Profit before tax of the Group was RMB184,463 million, an increase of 9.30% from the same period last year. Net profit was RMB154,106 million, an increase of 10.92% from the same period last year. Key factors affecting the Group’s profitability are as follows. Firstly, net interest income increased by RMB14,577 million, an increase of 5.18% from the same period last year, mainly due to moderate increase in interest-earning assets. Secondly, net fee and commission income increased by RMB4,432 million, or 6.82% from the same period last year, as the Group seized the market opportunities in wealth management, and enhanced its comprehensive service capabilities. Thirdly, operating expenses increased by 10.47% from the same period last year, mainly due to the lower base last year in the wake of COVID-19. Cost-to-income ratio was 22.22%, 0.97 percentage points higher than that from the same period last year, staying at a sound level. Fourthly, the Group made provisions for impairment losses on loans and advances based on substantive risks. Total impairment losses reached RMB108,512 million, a decrease of 2.74% from the same period last year.
The following table sets forth the composition of the Group’s statement of comprehensive income and the changes during the respective periods.
(In millions of RMB, except percentages)
Six months ended
30 June 2021
Six months ended
30 June 2020 Change (%)
Net interest income 296,085 281,508 5.18Net non-interest income 84,822 78,416 8.17– Net fee and commission income 69,438 65,006 6.82
Operating income 380,907 359,924 5.83Operating expenses (88,160) (79,805) 10.47Credit impairment losses (108,320) (111,378) (2.75)Other impairment losses (192) (188) 2.13Share of profits of associates and joint ventures 228 220 3.64
Profit before tax 184,463 168,773 9.30Income tax expense (30,357) (29,834) 1.75
Net profit 154,106 138,939 10.92
12 China Construction Bank Corporation Half-Year Report 2021
3 Management Discussion and Analysis
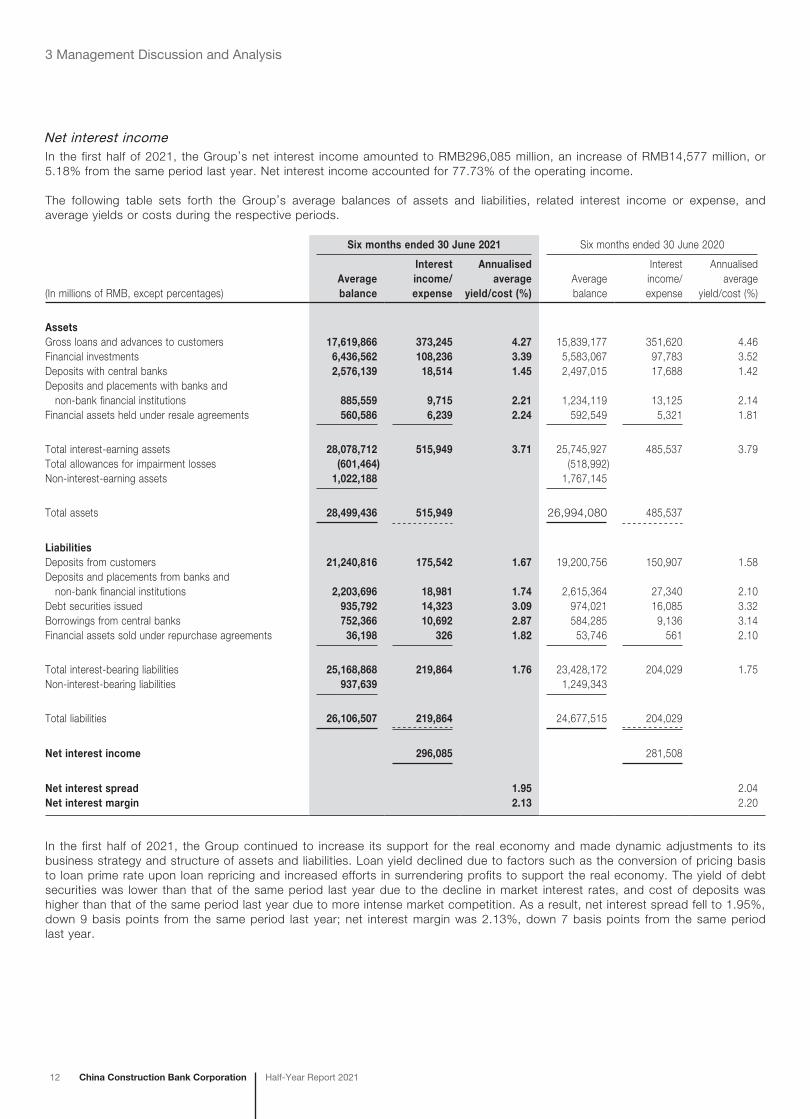
Net interest incomeIn the first half of 2021, the Group’s net interest income amounted to RMB296,085 million, an increase of RMB14,577 million, or 5.18% from the same period last year. Net interest income accounted for 77.73% of the operating income.
The following table sets forth the Group’s average balances of assets and liabilities, related interest income or expense, and average yields or costs during the respective periods.
Six months ended 30 June 2021 Six months ended 30 June 2020
(In millions of RMB, except percentages)Average balance
Interest income/expense
Annualised average
yield/cost (%)Average balance
Interest income/expense
Annualised average
yield/cost (%)
AssetsGross loans and advances to customers 17,619,866 373,245 4.27 15,839,177 351,620 4.46Financial investments 6,436,562 108,236 3.39 5,583,067 97,783 3.52Deposits with central banks 2,576,139 18,514 1.45 2,497,015 17,688 1.42Deposits and placements with banks and non-bank financial institutions 885,559 9,715 2.21 1,234,119 13,125 2.14Financial assets held under resale agreements 560,586 6,239 2.24 592,549 5,321 1.81
Total interest-earning assets 28,078,712 515,949 3.71 25,745,927 485,537 3.79Total allowances for impairment losses (601,464) (518,992)Non-interest-earning assets 1,022,188 1,767,145
Total assets 28,499,436 515,949 26,994,080 485,537
LiabilitiesDeposits from customers 21,240,816 175,542 1.67 19,200,756 150,907 1.58Deposits and placements from banks and non-bank financial institutions 2,203,696 18,981 1.74 2,615,364 27,340 2.10Debt securities issued 935,792 14,323 3.09 974,021 16,085 3.32Borrowings from central banks 752,366 10,692 2.87 584,285 9,136 3.14Financial assets sold under repurchase agreements 36,198 326 1.82 53,746 561 2.10
Total interest-bearing liabilities 25,168,868 219,864 1.76 23,428,172 204,029 1.75Non-interest-bearing liabilities 937,639 1,249,343
Total liabilities 26,106,507 219,864 24,677,515 204,029
Net interest income 296,085 281,508
Net interest spread 1.95 2.04Net interest margin 2.13 2.20
In the first half of 2021, the Group continued to increase its support for the real economy and made dynamic adjustments to its business strategy and structure of assets and liabilities. Loan yield declined due to factors such as the conversion of pricing basis to loan prime rate upon loan repricing and increased efforts in surrendering profits to support the real economy. The yield of debt securities was lower than that of the same period last year due to the decline in market interest rates, and cost of deposits was higher than that of the same period last year due to more intense market competition. As a result, net interest spread fell to 1.95%, down 9 basis points from the same period last year; net interest margin was 2.13%, down 7 basis points from the same period last year.
China Construction Bank CorporationHalf-Year Report 2021 13
3 Management Discussion and Analysis
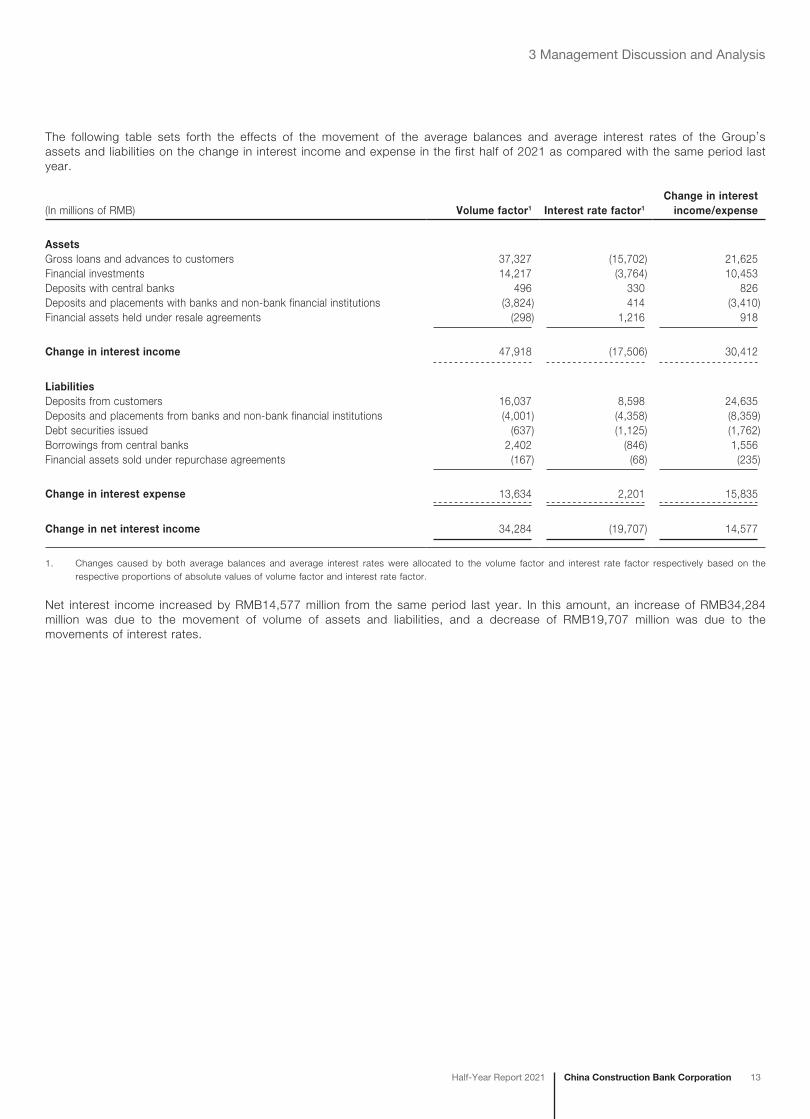
The following table sets forth the effects of the movement of the average balances and average interest rates of the Group’s assets and liabilities on the change in interest income and expense in the first half of 2021 as compared with the same period last year.
(In millions of RMB) Volume factor1 Interest rate factor1
Change in interest income/expense
AssetsGross loans and advances to customers 37,327 (15,702) 21,625Financial investments 14,217 (3,764) 10,453Deposits with central banks 496 330 826Deposits and placements with banks and non-bank financial institutions (3,824) 414 (3,410)Financial assets held under resale agreements (298) 1,216 918
Change in interest income 47,918 (17,506) 30,412
LiabilitiesDeposits from customers 16,037 8,598 24,635Deposits and placements from banks and non-bank financial institutions (4,001) (4,358) (8,359)Debt securities issued (637) (1,125) (1,762)Borrowings from central banks 2,402 (846) 1,556Financial assets sold under repurchase agreements (167) (68) (235)
Change in interest expense 13,634 2,201 15,835
Change in net interest income 34,284 (19,707) 14,577
1. Changes caused by both average balances and average interest rates were allocated to the volume factor and interest rate factor respectively based on the respective proportions of absolute values of volume factor and interest rate factor.
Net interest income increased by RMB14,577 million from the same period last year. In this amount, an increase of RMB34,284 million was due to the movement of volume of assets and liabilities, and a decrease of RMB19,707 million was due to the movements of interest rates.
14 China Construction Bank Corporation Half-Year Report 2021
3 Management Discussion and Analysis
Interest income
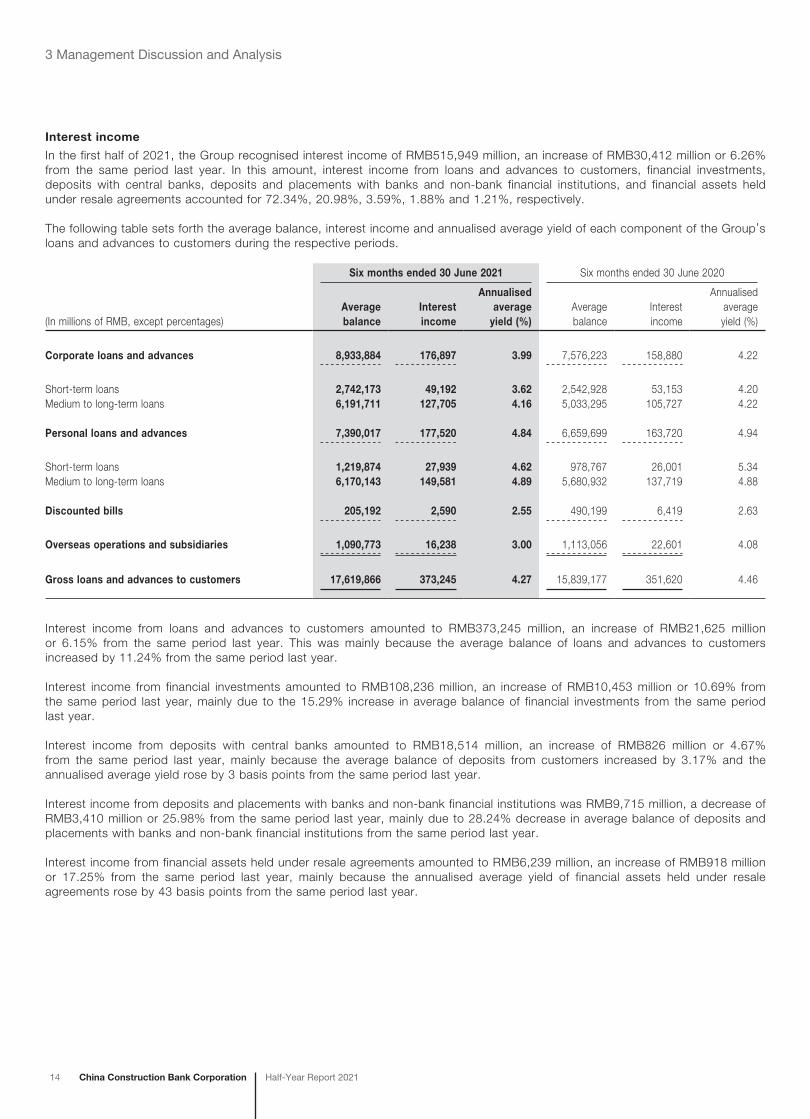
In the first half of 2021, the Group recognised interest income of RMB515,949 million, an increase of RMB30,412 million or 6.26% from the same period last year. In this amount, interest income from loans and advances to customers, financial investments, deposits with central banks, deposits and placements with banks and non-bank financial institutions, and financial assets held under resale agreements accounted for 72.34%, 20.98%, 3.59%, 1.88% and 1.21%, respectively.
The following table sets forth the average balance, interest income and annualised average yield of each component of the Group’s loans and advances to customers during the respective periods.
Six months ended 30 June 2021 Six months ended 30 June 2020
(In millions of RMB, except percentages)Average balance
Interest income
Annualised average
yield (%)Average balance
Interest income
Annualised average yield (%)
Corporate loans and advances 8,933,884 176,897 3.99 7,576,223 158,880 4.22
Short-term loans 2,742,173 49,192 3.62 2,542,928 53,153 4.20Medium to long-term loans 6,191,711 127,705 4.16 5,033,295 105,727 4.22
Personal loans and advances 7,390,017 177,520 4.84 6,659,699 163,720 4.94
Short-term loans 1,219,874 27,939 4.62 978,767 26,001 5.34Medium to long-term loans 6,170,143 149,581 4.89 5,680,932 137,719 4.88
Discounted bills 205,192 2,590 2.55 490,199 6,419 2.63
Overseas operations and subsidiaries 1,090,773 16,238 3.00 1,113,056 22,601 4.08
Gross loans and advances to customers 17,619,866 373,245 4.27 15,839,177 351,620 4.46
Interest income from loans and advances to customers amounted to RMB373,245 million, an increase of RMB21,625 million or 6.15% from the same period last year. This was mainly because the average balance of loans and advances to customers increased by 11.24% from the same period last year.
Interest income from financial investments amounted to RMB108,236 million, an increase of RMB10,453 million or 10.69% from the same period last year, mainly due to the 15.29% increase in average balance of financial investments from the same period last year.
Interest income from deposits with central banks amounted to RMB18,514 million, an increase of RMB826 million or 4.67% from the same period last year, mainly because the average balance of deposits from customers increased by 3.17% and the annualised average yield rose by 3 basis points from the same period last year.
Interest income from deposits and placements with banks and non-bank financial institutions was RMB9,715 million, a decrease of RMB3,410 million or 25.98% from the same period last year, mainly due to 28.24% decrease in average balance of deposits and placements with banks and non-bank financial institutions from the same period last year.
Interest income from financial assets held under resale agreements amounted to RMB6,239 million, an increase of RMB918 million or 17.25% from the same period last year, mainly because the annualised average yield of financial assets held under resale agreements rose by 43 basis points from the same period last year.
China Construction Bank CorporationHalf-Year Report 2021 15
3 Management Discussion and Analysis
Interest expense
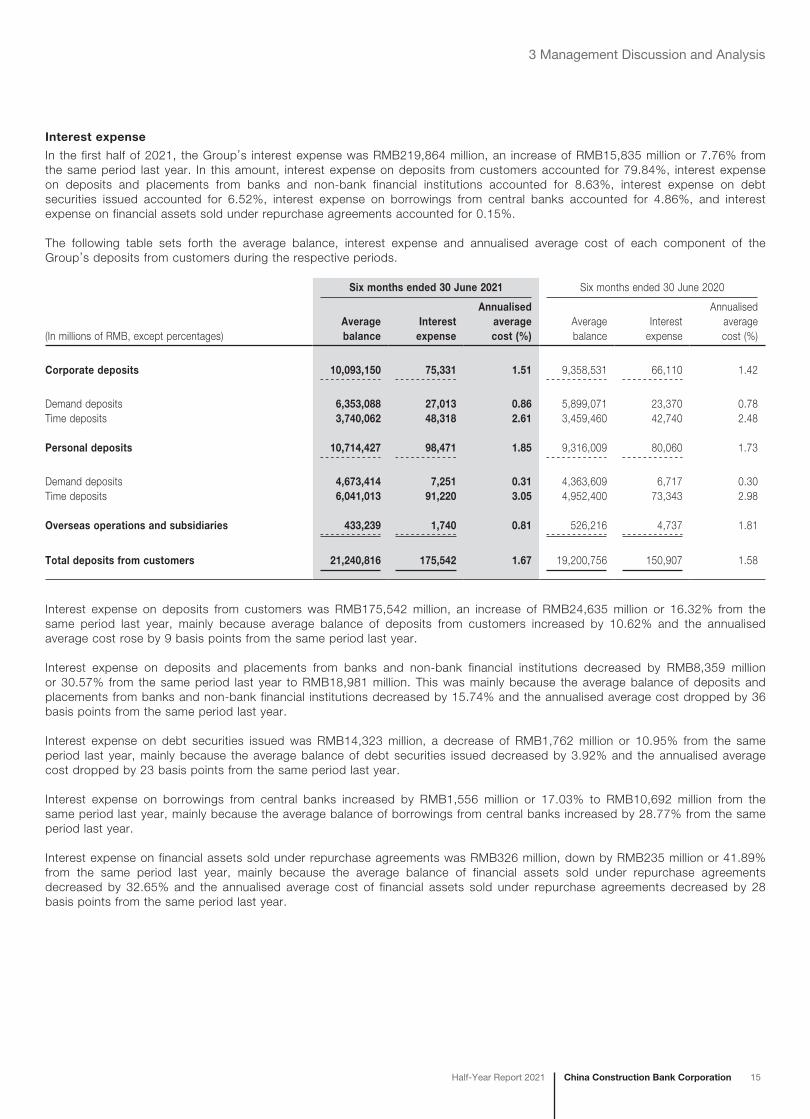
In the first half of 2021, the Group’s interest expense was RMB219,864 million, an increase of RMB15,835 million or 7.76% from the same period last year. In this amount, interest expense on deposits from customers accounted for 79.84%, interest expense on deposits and placements from banks and non-bank financial institutions accounted for 8.63%, interest expense on debt securities issued accounted for 6.52%, interest expense on borrowings from central banks accounted for 4.86%, and interest expense on financial assets sold under repurchase agreements accounted for 0.15%.
The following table sets forth the average balance, interest expense and annualised average cost of each component of the Group’s deposits from customers during the respective periods.
Six months ended 30 June 2021 Six months ended 30 June 2020
(In millions of RMB, except percentages)Average balance
Interest expense
Annualised average cost (%)
Average balance
Interest expense
Annualised average cost (%)
Corporate deposits 10,093,150 75,331 1.51 9,358,531 66,110 1.42
Demand deposits 6,353,088 27,013 0.86 5,899,071 23,370 0.78Time deposits 3,740,062 48,318 2.61 3,459,460 42,740 2.48
Personal deposits 10,714,427 98,471 1.85 9,316,009 80,060 1.73
Demand deposits 4,673,414 7,251 0.31 4,363,609 6,717 0.30Time deposits 6,041,013 91,220 3.05 4,952,400 73,343 2.98
Overseas operations and subsidiaries 433,239 1,740 0.81 526,216 4,737 1.81
Total deposits from customers 21,240,816 175,542 1.67 19,200,756 150,907 1.58
Interest expense on deposits from customers was RMB175,542 million, an increase of RMB24,635 million or 16.32% from the same period last year, mainly because average balance of deposits from customers increased by 10.62% and the annualised average cost rose by 9 basis points from the same period last year.
Interest expense on deposits and placements from banks and non-bank financial institutions decreased by RMB8,359 million or 30.57% from the same period last year to RMB18,981 million. This was mainly because the average balance of deposits and placements from banks and non-bank financial institutions decreased by 15.74% and the annualised average cost dropped by 36 basis points from the same period last year.
Interest expense on debt securities issued was RMB14,323 million, a decrease of RMB1,762 million or 10.95% from the same period last year, mainly because the average balance of debt securities issued decreased by 3.92% and the annualised average cost dropped by 23 basis points from the same period last year.
Interest expense on borrowings from central banks increased by RMB1,556 million or 17.03% to RMB10,692 million from the same period last year, mainly because the average balance of borrowings from central banks increased by 28.77% from the same period last year.
Interest expense on financial assets sold under repurchase agreements was RMB326 million, down by RMB235 million or 41.89% from the same period last year, mainly because the average balance of financial assets sold under repurchase agreements decreased by 32.65% and the annualised average cost of financial assets sold under repurchase agreements decreased by 28 basis points from the same period last year.
16 China Construction Bank Corporation Half-Year Report 2021
3 Management Discussion and Analysis
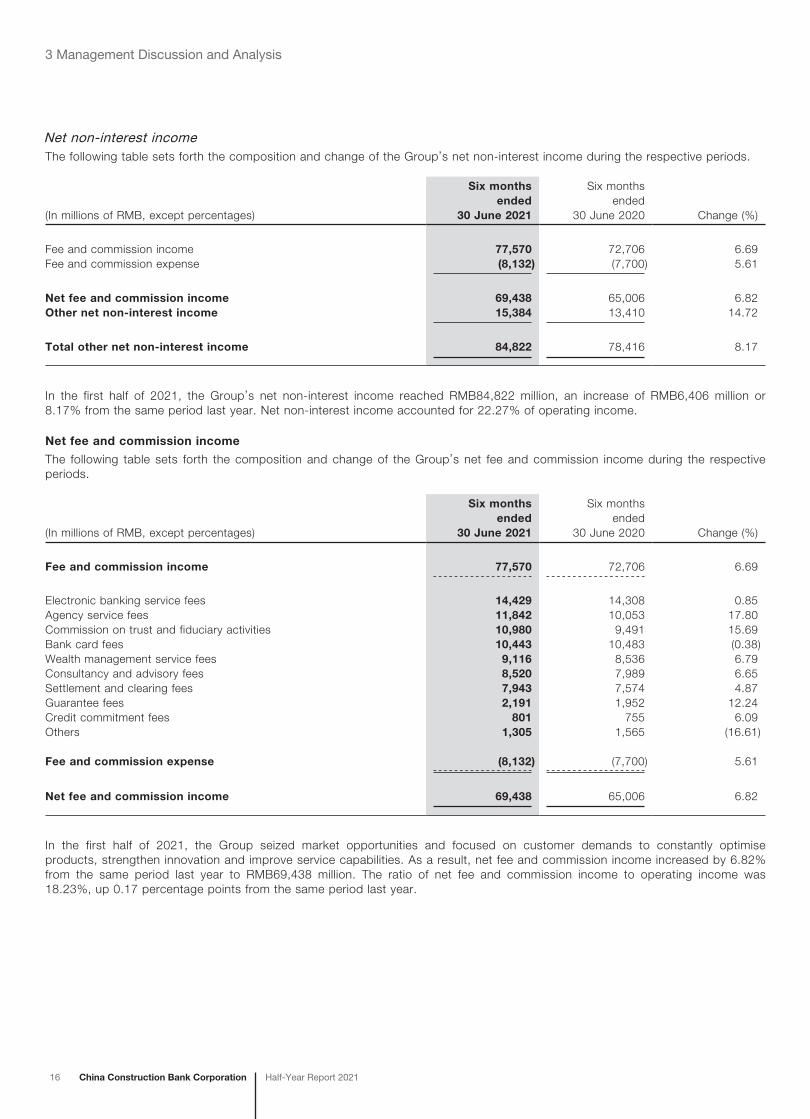
Net non-interest incomeThe following table sets forth the composition and change of the Group’s net non-interest income during the respective periods.
(In millions of RMB, except percentages)
Six months ended
30 June 2021
Six months ended
30 June 2020 Change (%)
Fee and commission income 77,570 72,706 6.69Fee and commission expense (8,132) (7,700) 5.61
Net fee and commission income 69,438 65,006 6.82Other net non-interest income 15,384 13,410 14.72
Total other net non-interest income 84,822 78,416 8.17
In the first half of 2021, the Group’s net non-interest income reached RMB84,822 million, an increase of RMB6,406 million or 8.17% from the same period last year. Net non-interest income accounted for 22.27% of operating income.
Net fee and commission income
The following table sets forth the composition and change of the Group’s net fee and commission income during the respective periods.
(In millions of RMB, except percentages)
Six months ended
30 June 2021
Six months ended
30 June 2020 Change (%)
Fee and commission income 77,570 72,706 6.69
Electronic banking service fees 14,429 14,308 0.85Agency service fees 11,842 10,053 17.80Commission on trust and fiduciary activities 10,980 9,491 15.69Bank card fees 10,443 10,483 (0.38)Wealth management service fees 9,116 8,536 6.79Consultancy and advisory fees 8,520 7,989 6.65Settlement and clearing fees 7,943 7,574 4.87Guarantee fees 2,191 1,952 12.24Credit commitment fees 801 755 6.09Others 1,305 1,565 (16.61)
Fee and commission expense (8,132) (7,700) 5.61
Net fee and commission income 69,438 65,006 6.82
In the first half of 2021, the Group seized market opportunities and focused on customer demands to constantly optimise products, strengthen innovation and improve service capabilities. As a result, net fee and commission income increased by 6.82% from the same period last year to RMB69,438 million. The ratio of net fee and commission income to operating income was 18.23%, up 0.17 percentage points from the same period last year.
China Construction Bank CorporationHalf-Year Report 2021 17
3 Management Discussion and Analysis
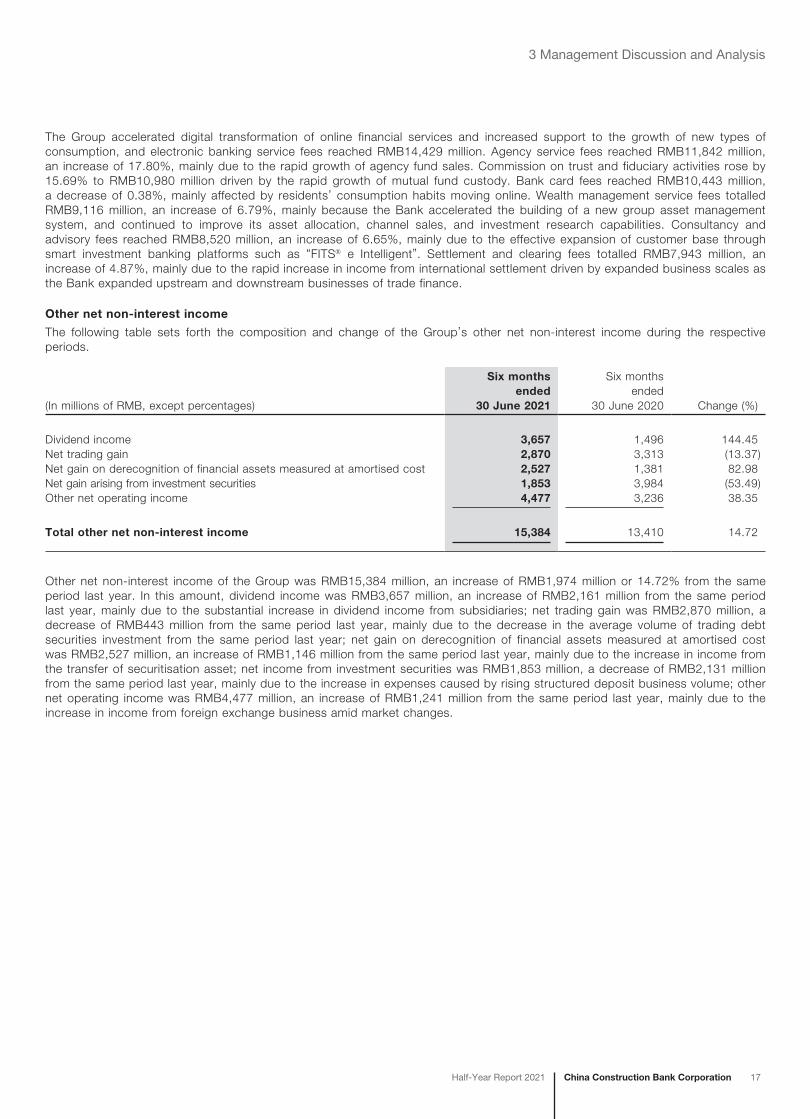
The Group accelerated digital transformation of online financial services and increased support to the growth of new types of consumption, and electronic banking service fees reached RMB14,429 million. Agency service fees reached RMB11,842 million, an increase of 17.80%, mainly due to the rapid growth of agency fund sales. Commission on trust and fiduciary activities rose by 15.69% to RMB10,980 million driven by the rapid growth of mutual fund custody. Bank card fees reached RMB10,443 million, a decrease of 0.38%, mainly affected by residents’ consumption habits moving online. Wealth management service fees totalled RMB9,116 million, an increase of 6.79%, mainly because the Bank accelerated the building of a new group asset management system, and continued to improve its asset allocation, channel sales, and investment research capabilities. Consultancy and advisory fees reached RMB8,520 million, an increase of 6.65%, mainly due to the effective expansion of customer base through smart investment banking platforms such as “FITS e Intelligent”. Settlement and clearing fees totalled RMB7,943 million, an increase of 4.87%, mainly due to the rapid increase in income from international settlement driven by expanded business scales as the Bank expanded upstream and downstream businesses of trade finance.
Other net non-interest income
The following table sets forth the composition and change of the Group’s other net non-interest income during the respective periods.
(In millions of RMB, except percentages)
Six months ended
30 June 2021
Six months ended
30 June 2020 Change (%)
Dividend income 3,657 1,496 144.45Net trading gain 2,870 3,313 (13.37)Net gain on derecognition of financial assets measured at amortised cost 2,527 1,381 82.98Net gain arising from investment securities 1,853 3,984 (53.49)Other net operating income 4,477 3,236 38.35
Total other net non-interest income 15,384 13,410 14.72
Other net non-interest income of the Group was RMB15,384 million, an increase of RMB1,974 million or 14.72% from the same period last year. In this amount, dividend income was RMB3,657 million, an increase of RMB2,161 million from the same period last year, mainly due to the substantial increase in dividend income from subsidiaries; net trading gain was RMB2,870 million, a decrease of RMB443 million from the same period last year, mainly due to the decrease in the average volume of trading debt securities investment from the same period last year; net gain on derecognition of financial assets measured at amortised cost was RMB2,527 million, an increase of RMB1,146 million from the same period last year, mainly due to the increase in income from the transfer of securitisation asset; net income from investment securities was RMB1,853 million, a decrease of RMB2,131 million from the same period last year, mainly due to the increase in expenses caused by rising structured deposit business volume; other net operating income was RMB4,477 million, an increase of RMB1,241 million from the same period last year, mainly due to the increase in income from foreign exchange business amid market changes.
18 China Construction Bank Corporation Half-Year Report 2021
3 Management Discussion and Analysis
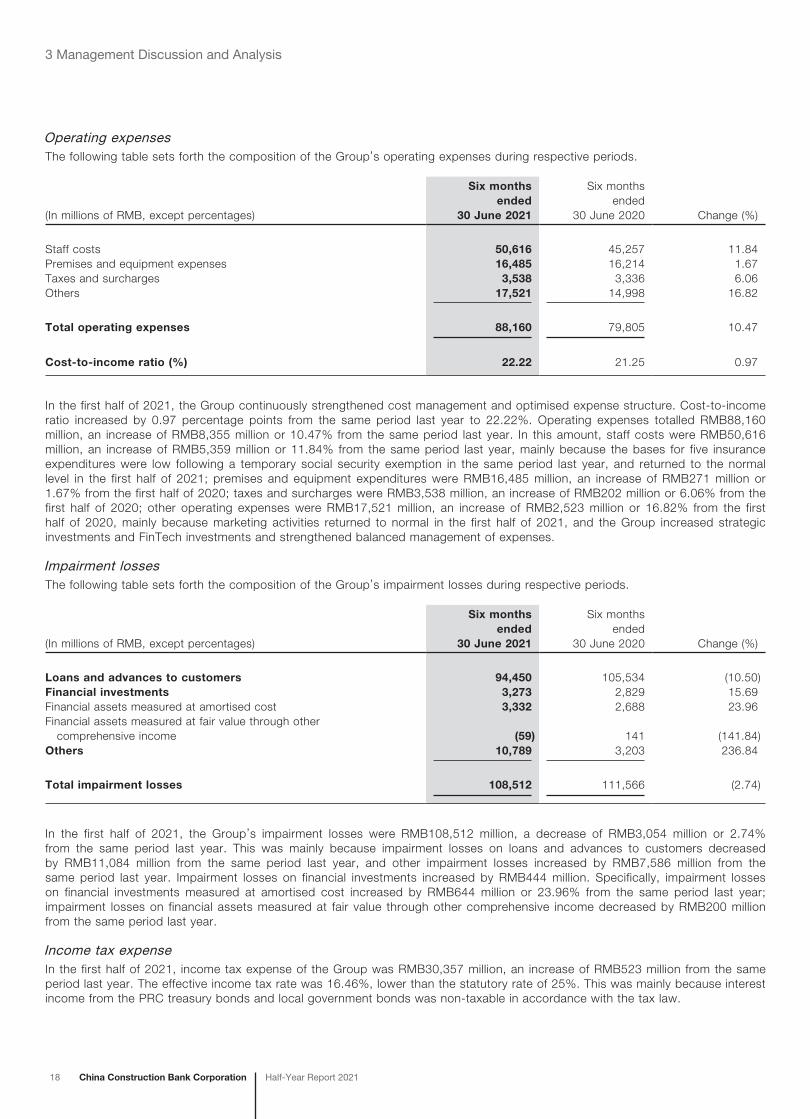
Operating expensesThe following table sets forth the composition of the Group’s operating expenses during respective periods.
(In millions of RMB, except percentages)
Six months ended
30 June 2021
Six months ended
30 June 2020 Change (%)
Staff costs 50,616 45,257 11.84Premises and equipment expenses 16,485 16,214 1.67Taxes and surcharges 3,538 3,336 6.06Others 17,521 14,998 16.82
Total operating expenses 88,160 79,805 10.47
Cost-to-income ratio (%) 22.22 21.25 0.97
In the first half of 2021, the Group continuously strengthened cost management and optimised expense structure. Cost-to-income ratio increased by 0.97 percentage points from the same period last year to 22.22%. Operating expenses totalled RMB88,160 million, an increase of RMB8,355 million or 10.47% from the same period last year. In this amount, staff costs were RMB50,616 million, an increase of RMB5,359 million or 11.84% from the same period last year, mainly because the bases for five insurance expenditures were low following a temporary social security exemption in the same period last year, and returned to the normal level in the first half of 2021; premises and equipment expenditures were RMB16,485 million, an increase of RMB271 million or 1.67% from the first half of 2020; taxes and surcharges were RMB3,538 million, an increase of RMB202 million or 6.06% from the first half of 2020; other operating expenses were RMB17,521 million, an increase of RMB2,523 million or 16.82% from the first half of 2020, mainly because marketing activities returned to normal in the first half of 2021, and the Group increased strategic investments and FinTech investments and strengthened balanced management of expenses.
Impairment lossesThe following table sets forth the composition of the Group’s impairment losses during respective periods.
(In millions of RMB, except percentages)
Six months ended
30 June 2021
Six months ended
30 June 2020 Change (%)
Loans and advances to customers 94,450 105,534 (10.50)Financial investments 3,273 2,829 15.69Financial assets measured at amortised cost 3,332 2,688 23.96Financial assets measured at fair value through other comprehensive income (59) 141 (141.84)Others 10,789 3,203 236.84
Total impairment losses 108,512 111,566 (2.74)
In the first half of 2021, the Group’s impairment losses were RMB108,512 million, a decrease of RMB3,054 million or 2.74% from the same period last year. This was mainly because impairment losses on loans and advances to customers decreased by RMB11,084 million from the same period last year, and other impairment losses increased by RMB7,586 million from the same period last year. Impairment losses on financial investments increased by RMB444 million. Specifically, impairment losses on financial investments measured at amortised cost increased by RMB644 million or 23.96% from the same period last year; impairment losses on financial assets measured at fair value through other comprehensive income decreased by RMB200 million from the same period last year.
Income tax expenseIn the first half of 2021, income tax expense of the Group was RMB30,357 million, an increase of RMB523 million from the same period last year. The effective income tax rate was 16.46%, lower than the statutory rate of 25%. This was mainly because interest income from the PRC treasury bonds and local government bonds was non-taxable in accordance with the tax law.
China Construction Bank CorporationHalf-Year Report 2021 19
3 Management Discussion and Analysis
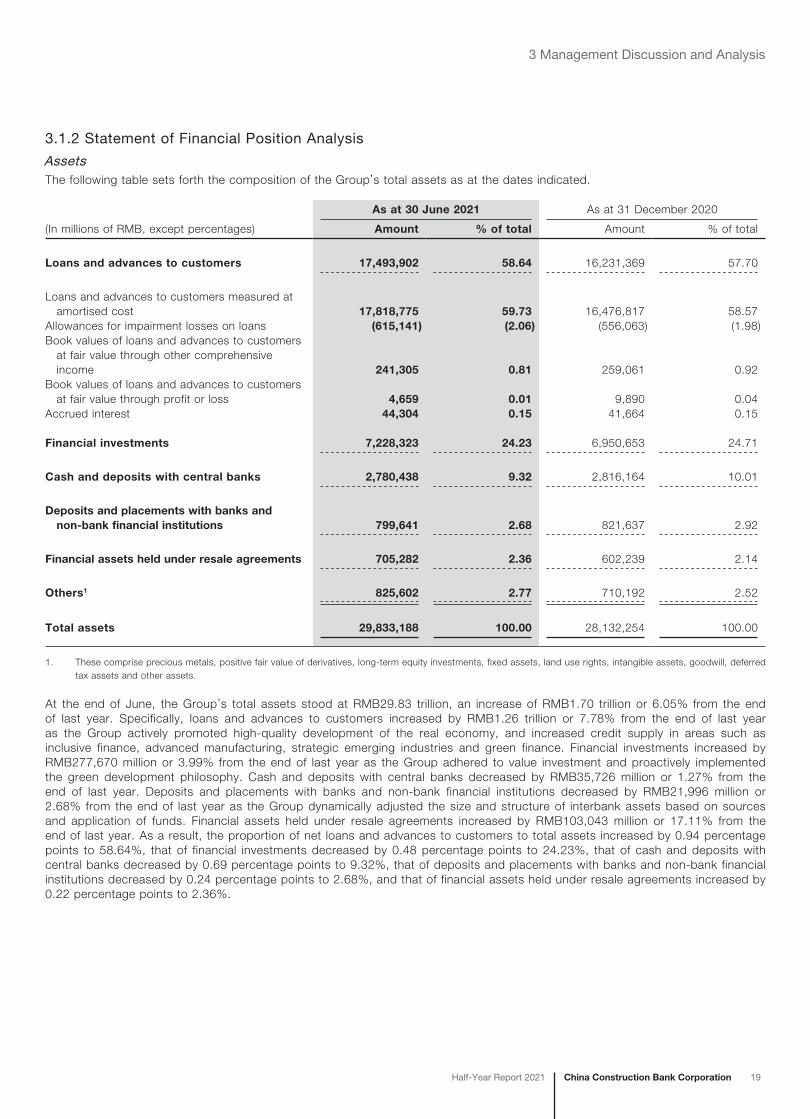
3.1.2 Statement of Financial Position Analysis
AssetsThe following table sets forth the composition of the Group’s total assets as at the dates indicated.
As at 30 June 2021 As at 31 December 2020
(In millions of RMB, except percentages) Amount % of total Amount % of total
Loans and advances to customers 17,493,902 58.64 16,231,369 57.70
Loans and advances to customers measured at amortised cost 17,818,775 59.73 16,476,817 58.57
Allowances for impairment losses on loans (615,141) (2.06) (556,063) (1.98)Book values of loans and advances to customers
at fair value through other comprehensive income 241,305 0.81 259,061 0.92
Book values of loans and advances to customers at fair value through profit or loss 4,659 0.01 9,890 0.04
Accrued interest 44,304 0.15 41,664 0.15
Financial investments 7,228,323 24.23 6,950,653 24.71
Cash and deposits with central banks 2,780,438 9.32 2,816,164 10.01
Deposits and placements with banks and non-bank financial institutions 799,641 2.68 821,637 2.92
Financial assets held under resale agreements 705,282 2.36 602,239 2.14
Others1 825,602 2.77 710,192 2.52
Total assets 29,833,188 100.00 28,132,254 100.00
1. These comprise precious metals, positive fair value of derivatives, long-term equity investments, fixed assets, land use rights, intangible assets, goodwill, deferred tax assets and other assets.
At the end of June, the Group’s total assets stood at RMB29.83 trillion, an increase of RMB1.70 trillion or 6.05% from the end of last year. Specifically, loans and advances to customers increased by RMB1.26 trillion or 7.78% from the end of last year as the Group actively promoted high-quality development of the real economy, and increased credit supply in areas such as inclusive finance, advanced manufacturing, strategic emerging industries and green finance. Financial investments increased by RMB277,670 million or 3.99% from the end of last year as the Group adhered to value investment and proactively implemented the green development philosophy. Cash and deposits with central banks decreased by RMB35,726 million or 1.27% from the end of last year. Deposits and placements with banks and non-bank financial institutions decreased by RMB21,996 million or 2.68% from the end of last year as the Group dynamically adjusted the size and structure of interbank assets based on sources and application of funds. Financial assets held under resale agreements increased by RMB103,043 million or 17.11% from the end of last year. As a result, the proportion of net loans and advances to customers to total assets increased by 0.94 percentage points to 58.64%, that of financial investments decreased by 0.48 percentage points to 24.23%, that of cash and deposits with central banks decreased by 0.69 percentage points to 9.32%, that of deposits and placements with banks and non-bank financial institutions decreased by 0.24 percentage points to 2.68%, and that of financial assets held under resale agreements increased by 0.22 percentage points to 2.36%.
20 China Construction Bank Corporation Half-Year Report 2021
3 Management Discussion and Analysis
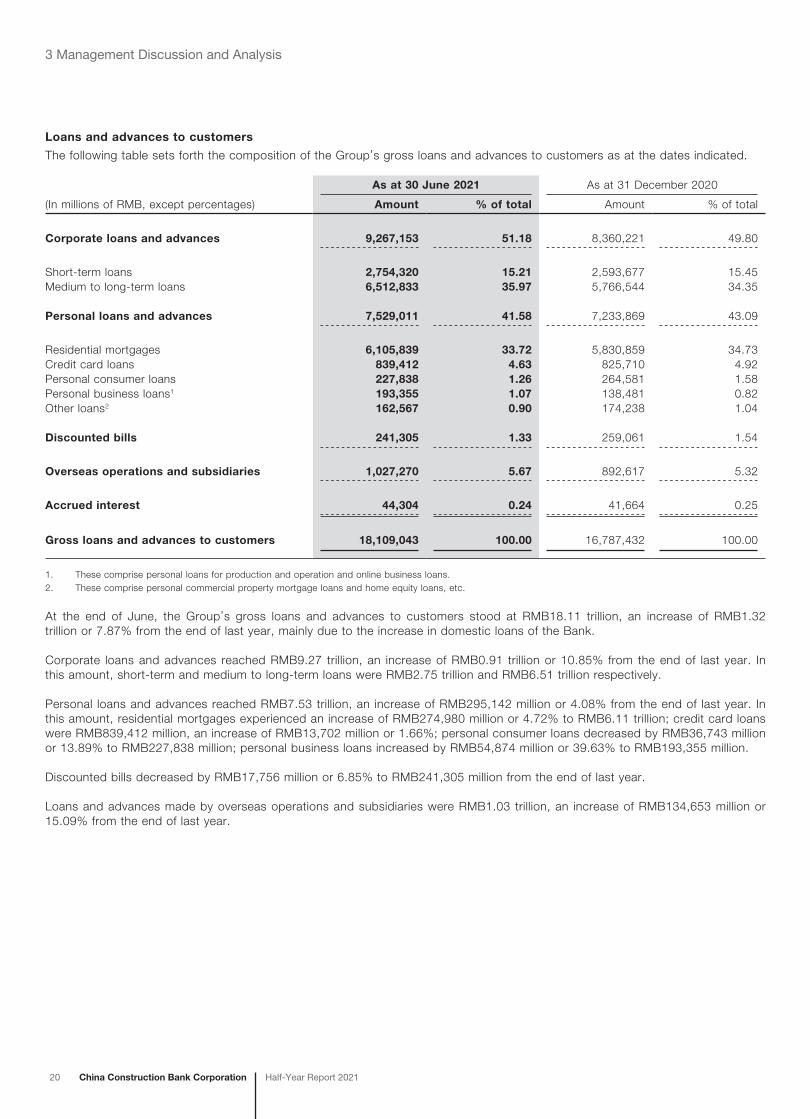
Loans and advances to customers
The following table sets forth the composition of the Group’s gross loans and advances to customers as at the dates indicated.
As at 30 June 2021 As at 31 December 2020
(In millions of RMB, except percentages) Amount % of total Amount % of total
Corporate loans and advances 9,267,153 51.18 8,360,221 49.80
Short-term loans 2,754,320 15.21 2,593,677 15.45Medium to long-term loans 6,512,833 35.97 5,766,544 34.35
Personal loans and advances 7,529,011 41.58 7,233,869 43.09
Residential mortgages 6,105,839 33.72 5,830,859 34.73Credit card loans 839,412 4.63 825,710 4.92Personal consumer loans 227,838 1.26 264,581 1.58Personal business loans1 193,355 1.07 138,481 0.82Other loans2 162,567 0.90 174,238 1.04
Discounted bills 241,305 1.33 259,061 1.54
Overseas operations and subsidiaries 1,027,270 5.67 892,617 5.32
Accrued interest 44,304 0.24 41,664 0.25
Gross loans and advances to customers 18,109,043 100.00 16,787,432 100.00
1. These comprise personal loans for production and operation and online business loans.2. These comprise personal commercial property mortgage loans and home equity loans, etc.
At the end of June, the Group’s gross loans and advances to customers stood at RMB18.11 trillion, an increase of RMB1.32 trillion or 7.87% from the end of last year, mainly due to the increase in domestic loans of the Bank.
Corporate loans and advances reached RMB9.27 trillion, an increase of RMB0.91 trillion or 10.85% from the end of last year. In this amount, short-term and medium to long-term loans were RMB2.75 trillion and RMB6.51 trillion respectively.
Personal loans and advances reached RMB7.53 trillion, an increase of RMB295,142 million or 4.08% from the end of last year. In this amount, residential mortgages experienced an increase of RMB274,980 million or 4.72% to RMB6.11 trillion; credit card loans were RMB839,412 million, an increase of RMB13,702 million or 1.66%; personal consumer loans decreased by RMB36,743 million or 13.89% to RMB227,838 million; personal business loans increased by RMB54,874 million or 39.63% to RMB193,355 million.
Discounted bills decreased by RMB17,756 million or 6.85% to RMB241,305 million from the end of last year.
Loans and advances made by overseas operations and subsidiaries were RMB1.03 trillion, an increase of RMB134,653 million or 15.09% from the end of last year.
China Construction Bank CorporationHalf-Year Report 2021 21
3 Management Discussion and Analysis
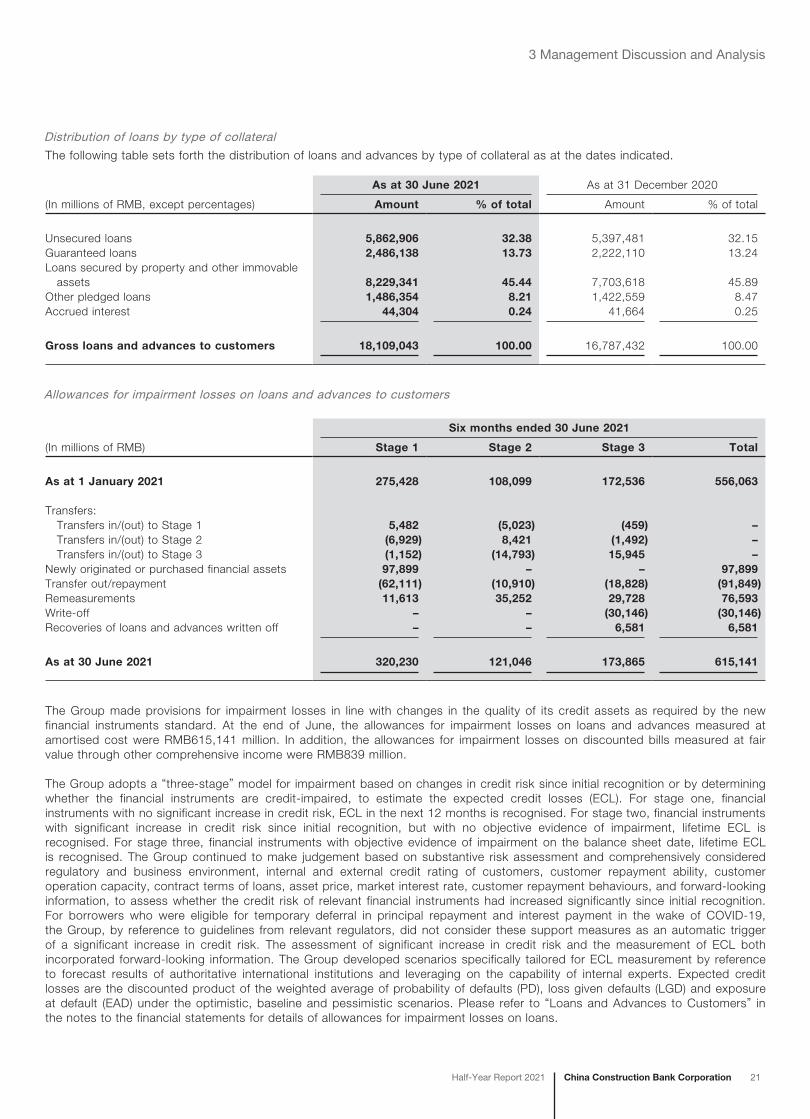
Distribution of loans by type of collateral
The following table sets forth the distribution of loans and advances by type of collateral as at the dates indicated.
As at 30 June 2021 As at 31 December 2020
(In millions of RMB, except percentages) Amount % of total Amount % of total
Unsecured loans 5,862,906 32.38 5,397,481 32.15Guaranteed loans 2,486,138 13.73 2,222,110 13.24Loans secured by property and other immovable assets 8,229,341 45.44 7,703,618 45.89Other pledged loans 1,486,354 8.21 1,422,559 8.47Accrued interest 44,304 0.24 41,664 0.25
Gross loans and advances to customers 18,109,043 100.00 16,787,432 100.00
Allowances for impairment losses on loans and advances to customers
Six months ended 30 June 2021
(In millions of RMB) Stage 1 Stage 2 Stage 3 Total
As at 1 January 2021 275,428 108,099 172,536 556,063
Transfers: Transfers in/(out) to Stage 1 5,482 (5,023) (459) – Transfers in/(out) to Stage 2 (6,929) 8,421 (1,492) – Transfers in/(out) to Stage 3 (1,152) (14,793) 15,945 –Newly originated or purchased financial assets 97,899 – – 97,899Transfer out/repayment (62,111) (10,910) (18,828) (91,849)Remeasurements 11,613 35,252 29,728 76,593Write-off – – (30,146) (30,146)Recoveries of loans and advances written off – – 6,581 6,581
As at 30 June 2021 320,230 121,046 173,865 615,141
The Group made provisions for impairment losses in line with changes in the quality of its credit assets as required by the new financial instruments standard. At the end of June, the allowances for impairment losses on loans and advances measured at amortised cost were RMB615,141 million. In addition, the allowances for impairment losses on discounted bills measured at fair value through other comprehensive income were RMB839 million.
The Group adopts a “three-stage” model for impairment based on changes in credit risk since initial recognition or by determining whether the financial instruments are credit-impaired, to estimate the expected credit losses (ECL). For stage one, financial instruments with no significant increase in credit risk, ECL in the next 12 months is recognised. For stage two, financial instruments with significant increase in credit risk since initial recognition, but with no objective evidence of impairment, lifetime ECL is recognised. For stage three, financial instruments with objective evidence of impairment on the balance sheet date, lifetime ECL is recognised. The Group continued to make judgement based on substantive risk assessment and comprehensively considered regulatory and business environment, internal and external credit rating of customers, customer repayment ability, customer operation capacity, contract terms of loans, asset price, market interest rate, customer repayment behaviours, and forward-looking information, to assess whether the credit risk of relevant financial instruments had increased significantly since initial recognition. For borrowers who were eligible for temporary deferral in principal repayment and interest payment in the wake of COVID-19, the Group, by reference to guidelines from relevant regulators, did not consider these support measures as an automatic trigger of a significant increase in credit risk. The assessment of significant increase in credit risk and the measurement of ECL both incorporated forward-looking information. The Group developed scenarios specifically tailored for ECL measurement by reference to forecast results of authoritative international institutions and leveraging on the capability of internal experts. Expected credit losses are the discounted product of the weighted average of probability of defaults (PD), loss given defaults (LGD) and exposure at default (EAD) under the optimistic, baseline and pessimistic scenarios. Please refer to “Loans and Advances to Customers” in the notes to the financial statements for details of allowances for impairment losses on loans.
22 China Construction Bank Corporation Half-Year Report 2021
3 Management Discussion and Analysis
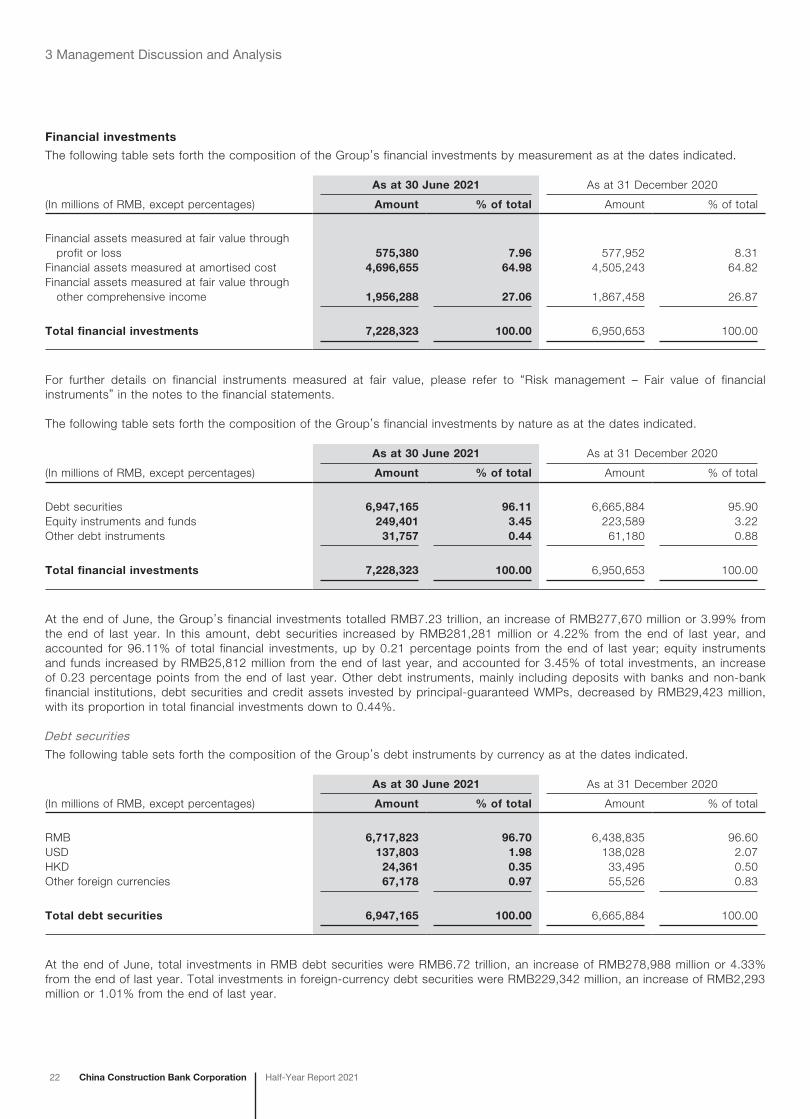
Financial investments
The following table sets forth the composition of the Group’s financial investments by measurement as at the dates indicated.
As at 30 June 2021 As at 31 December 2020
(In millions of RMB, except percentages) Amount % of total Amount % of total
Financial assets measured at fair value through profit or loss 575,380 7.96 577,952 8.31
Financial assets measured at amortised cost 4,696,655 64.98 4,505,243 64.82Financial assets measured at fair value through
other comprehensive income 1,956,288 27.06 1,867,458 26.87
Total financial investments 7,228,323 100.00 6,950,653 100.00
For further details on financial instruments measured at fair value, please refer to “Risk management – Fair value of financial instruments” in the notes to the financial statements.
The following table sets forth the composition of the Group’s financial investments by nature as at the dates indicated.
As at 30 June 2021 As at 31 December 2020
(In millions of RMB, except percentages) Amount % of total Amount % of total
Debt securities 6,947,165 96.11 6,665,884 95.90Equity instruments and funds 249,401 3.45 223,589 3.22Other debt instruments 31,757 0.44 61,180 0.88
Total financial investments 7,228,323 100.00 6,950,653 100.00
At the end of June, the Group’s financial investments totalled RMB7.23 trillion, an increase of RMB277,670 million or 3.99% from the end of last year. In this amount, debt securities increased by RMB281,281 million or 4.22% from the end of last year, and accounted for 96.11% of total financial investments, up by 0.21 percentage points from the end of last year; equity instruments and funds increased by RMB25,812 million from the end of last year, and accounted for 3.45% of total investments, an increase of 0.23 percentage points from the end of last year. Other debt instruments, mainly including deposits with banks and non-bank financial institutions, debt securities and credit assets invested by principal-guaranteed WMPs, decreased by RMB29,423 million, with its proportion in total financial investments down to 0.44%.
Debt securities
The following table sets forth the composition of the Group’s debt instruments by currency as at the dates indicated.
As at 30 June 2021 As at 31 December 2020
(In millions of RMB, except percentages) Amount % of total Amount % of total
RMB 6,717,823 96.70 6,438,835 96.60USD 137,803 1.98 138,028 2.07HKD 24,361 0.35 33,495 0.50Other foreign currencies 67,178 0.97 55,526 0.83
Total debt securities 6,947,165 100.00 6,665,884 100.00
At the end of June, total investments in RMB debt securities were RMB6.72 trillion, an increase of RMB278,988 million or 4.33% from the end of last year. Total investments in foreign-currency debt securities were RMB229,342 million, an increase of RMB2,293 million or 1.01% from the end of last year.
China Construction Bank CorporationHalf-Year Report 2021 23
3 Management Discussion and Analysis
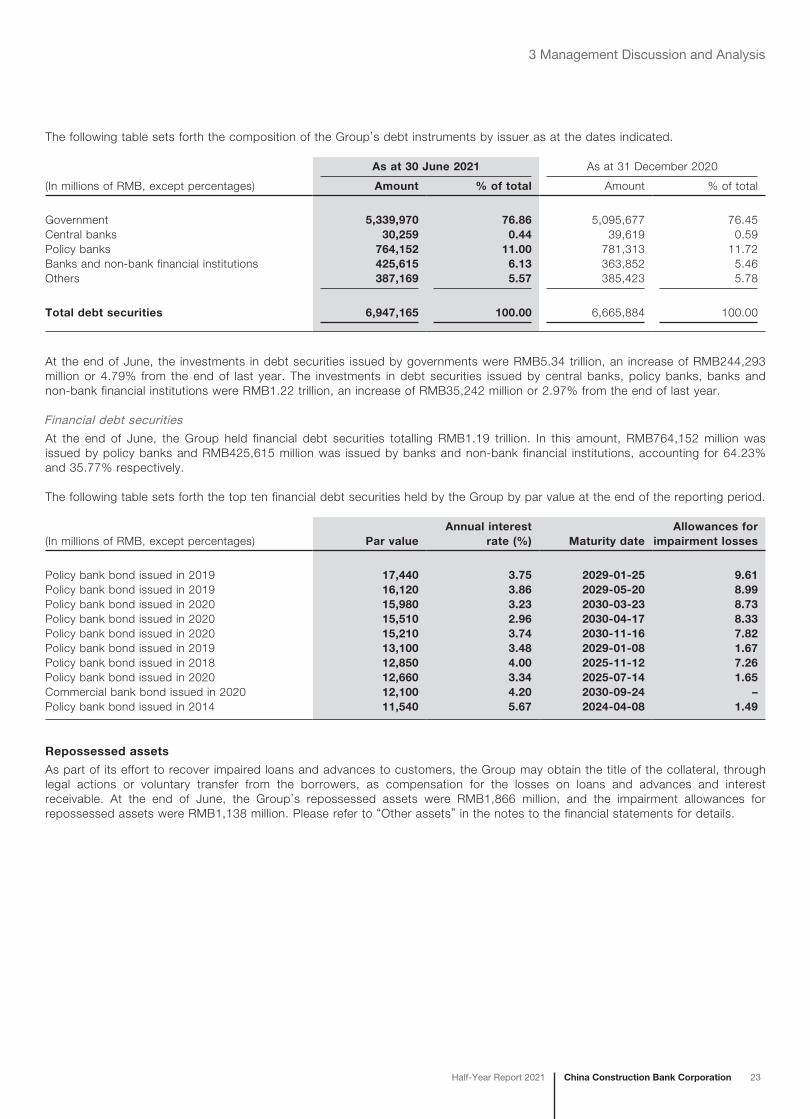
The following table sets forth the composition of the Group’s debt instruments by issuer as at the dates indicated.
As at 30 June 2021 As at 31 December 2020
(In millions of RMB, except percentages) Amount % of total Amount % of total
Government 5,339,970 76.86 5,095,677 76.45Central banks 30,259 0.44 39,619 0.59Policy banks 764,152 11.00 781,313 11.72Banks and non-bank financial institutions 425,615 6.13 363,852 5.46Others 387,169 5.57 385,423 5.78
Total debt securities 6,947,165 100.00 6,665,884 100.00
At the end of June, the investments in debt securities issued by governments were RMB5.34 trillion, an increase of RMB244,293 million or 4.79% from the end of last year. The investments in debt securities issued by central banks, policy banks, banks and non-bank financial institutions were RMB1.22 trillion, an increase of RMB35,242 million or 2.97% from the end of last year.
Financial debt securities
At the end of June, the Group held financial debt securities totalling RMB1.19 trillion. In this amount, RMB764,152 million was issued by policy banks and RMB425,615 million was issued by banks and non-bank financial institutions, accounting for 64.23% and 35.77% respectively.
The following table sets forth the top ten financial debt securities held by the Group by par value at the end of the reporting period.
(In millions of RMB, except percentages) Par valueAnnual interest
rate (%) Maturity dateAllowances for
impairment losses
Policy bank bond issued in 2019 17,440 3.75 2029-01-25 9.61Policy bank bond issued in 2019 16,120 3.86 2029-05-20 8.99Policy bank bond issued in 2020 15,980 3.23 2030-03-23 8.73Policy bank bond issued in 2020 15,510 2.96 2030-04-17 8.33Policy bank bond issued in 2020 15,210 3.74 2030-11-16 7.82Policy bank bond issued in 2019 13,100 3.48 2029-01-08 1.67Policy bank bond issued in 2018 12,850 4.00 2025-11-12 7.26Policy bank bond issued in 2020 12,660 3.34 2025-07-14 1.65Commercial bank bond issued in 2020 12,100 4.20 2030-09-24 –Policy bank bond issued in 2014 11,540 5.67 2024-04-08 1.49
Repossessed assets
As part of its effort to recover impaired loans and advances to customers, the Group may obtain the title of the collateral, through legal actions or voluntary transfer from the borrowers, as compensation for the losses on loans and advances and interest receivable. At the end of June, the Group’s repossessed assets were RMB1,866 million, and the impairment allowances for repossessed assets were RMB1,138 million. Please refer to “Other assets” in the notes to the financial statements for details.
24 China Construction Bank Corporation Half-Year Report 2021
3 Management Discussion and Analysis
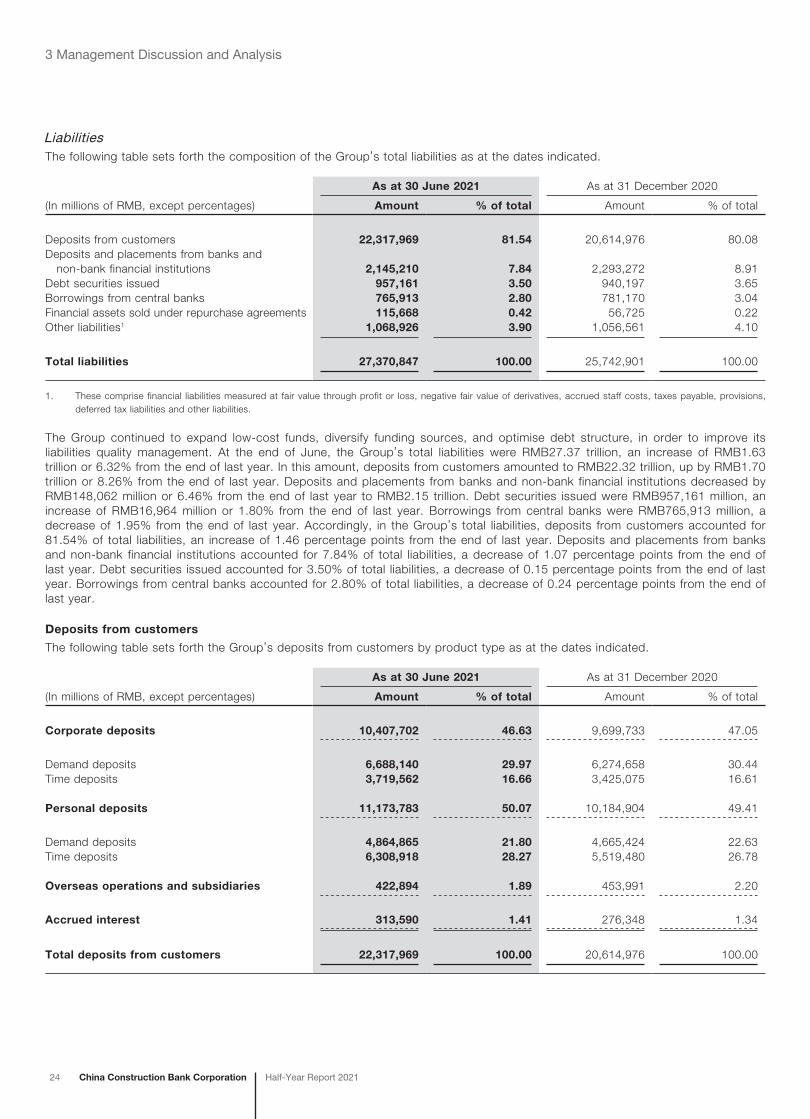
LiabilitiesThe following table sets forth the composition of the Group’s total liabilities as at the dates indicated.
As at 30 June 2021 As at 31 December 2020
(In millions of RMB, except percentages) Amount % of total Amount % of total
Deposits from customers 22,317,969 81.54 20,614,976 80.08Deposits and placements from banks and
non-bank financial institutions 2,145,210 7.84 2,293,272 8.91Debt securities issued 957,161 3.50 940,197 3.65Borrowings from central banks 765,913 2.80 781,170 3.04Financial assets sold under repurchase agreements 115,668 0.42 56,725 0.22Other liabilities1 1,068,926 3.90 1,056,561 4.10
Total liabilities 27,370,847 100.00 25,742,901 100.00
1. These comprise financial liabilities measured at fair value through profit or loss, negative fair value of derivatives, accrued staff costs, taxes payable, provisions, deferred tax liabilities and other liabilities.
The Group continued to expand low-cost funds, diversify funding sources, and optimise debt structure, in order to improve its liabilities quality management. At the end of June, the Group’s total liabilities were RMB27.37 trillion, an increase of RMB1.63 trillion or 6.32% from the end of last year. In this amount, deposits from customers amounted to RMB22.32 trillion, up by RMB1.70 trillion or 8.26% from the end of last year. Deposits and placements from banks and non-bank financial institutions decreased by RMB148,062 million or 6.46% from the end of last year to RMB2.15 trillion. Debt securities issued were RMB957,161 million, an increase of RMB16,964 million or 1.80% from the end of last year. Borrowings from central banks were RMB765,913 million, a decrease of 1.95% from the end of last year. Accordingly, in the Group’s total liabilities, deposits from customers accounted for 81.54% of total liabilities, an increase of 1.46 percentage points from the end of last year. Deposits and placements from banks and non-bank financial institutions accounted for 7.84% of total liabilities, a decrease of 1.07 percentage points from the end of last year. Debt securities issued accounted for 3.50% of total liabilities, a decrease of 0.15 percentage points from the end of last year. Borrowings from central banks accounted for 2.80% of total liabilities, a decrease of 0.24 percentage points from the end of last year.
Deposits from customers
The following table sets forth the Group’s deposits from customers by product type as at the dates indicated.
As at 30 June 2021 As at 31 December 2020
(In millions of RMB, except percentages) Amount % of total Amount % of total
Corporate deposits 10,407,702 46.63 9,699,733 47.05
Demand deposits 6,688,140 29.97 6,274,658 30.44Time deposits 3,719,562 16.66 3,425,075 16.61
Personal deposits 11,173,783 50.07 10,184,904 49.41
Demand deposits 4,864,865 21.80 4,665,424 22.63Time deposits 6,308,918 28.27 5,519,480 26.78
Overseas operations and subsidiaries 422,894 1.89 453,991 2.20
Accrued interest 313,590 1.41 276,348 1.34
Total deposits from customers 22,317,969 100.00 20,614,976 100.00
China Construction Bank CorporationHalf-Year Report 2021 25
3 Management Discussion and Analysis
At the end of June, domestic corporate deposits of the Bank were RMB10.41 trillion, an increase of RMB707,969 million or 7.30% from the end of last year. Domestic personal deposits of the Bank were RMB11.17 trillion, an increase of RMB988,879 million or 9.71% from the end of last year and its proportion in domestic deposits from customers rose by 0.55 percentage points to 51.77%. Deposits from overseas operations and subsidiaries were RMB422,894 million, a decrease of RMB31,097 million, accounting for 1.89% of total deposits form customers. Domestic demand deposits were RMB11.55 trillion, an increase of RMB612,923 million or 5.60% from the end of last year and its proportion in domestic deposits from customers was 53.53%. Domestic time deposits were RMB10.03 trillion, an increase of RMB1.08 trillion or 12.12% and its proportion in domestic deposits from customers rose by 1.49 percentage points to 46.47%.
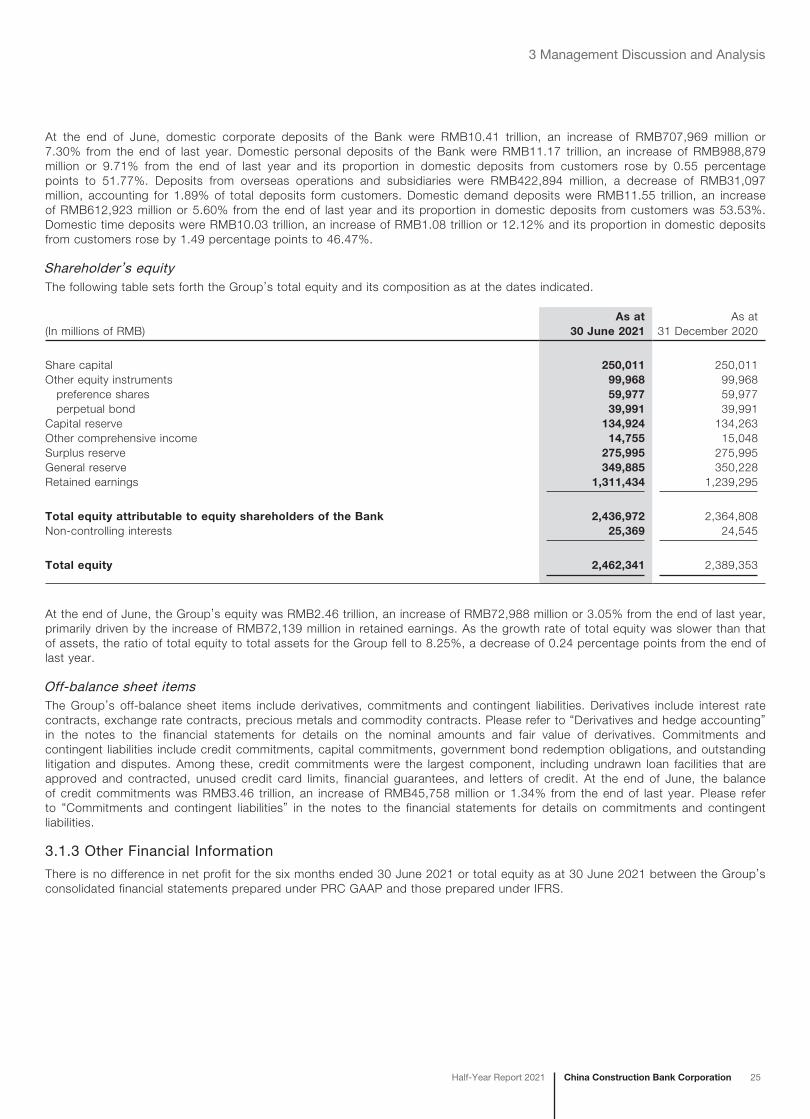
Shareholder’s equityThe following table sets forth the Group’s total equity and its composition as at the dates indicated.
(In millions of RMB)As at
30 June 2021As at
31 December 2020
Share capital 250,011 250,011Other equity instruments 99,968 99,968
preference shares 59,977 59,977perpetual bond 39,991 39,991
Capital reserve 134,924 134,263Other comprehensive income 14,755 15,048Surplus reserve 275,995 275,995General reserve 349,885 350,228Retained earnings 1,311,434 1,239,295
Total equity attributable to equity shareholders of the Bank 2,436,972 2,364,808Non-controlling interests 25,369 24,545
Total equity 2,462,341 2,389,353
At the end of June, the Group’s equity was RMB2.46 trillion, an increase of RMB72,988 million or 3.05% from the end of last year, primarily driven by the increase of RMB72,139 million in retained earnings. As the growth rate of total equity was slower than that of assets, the ratio of total equity to total assets for the Group fell to 8.25%, a decrease of 0.24 percentage points from the end of last year.
Off-balance sheet itemsThe Group’s off-balance sheet items include derivatives, commitments and contingent liabilities. Derivatives include interest rate contracts, exchange rate contracts, precious metals and commodity contracts. Please refer to “Derivatives and hedge accounting” in the notes to the financial statements for details on the nominal amounts and fair value of derivatives. Commitments and contingent liabilities include credit commitments, capital commitments, government bond redemption obligations, and outstanding litigation and disputes. Among these, credit commitments were the largest component, including undrawn loan facilities that are approved and contracted, unused credit card limits, financial guarantees, and letters of credit. At the end of June, the balance of credit commitments was RMB3.46 trillion, an increase of RMB45,758 million or 1.34% from the end of last year. Please refer to “Commitments and contingent liabilities” in the notes to the financial statements for details on commitments and contingent liabilities.
3.1.3 Other Financial Information
There is no difference in net profit for the six months ended 30 June 2021 or total equity as at 30 June 2021 between the Group’s consolidated financial statements prepared under PRC GAAP and those prepared under IFRS.
26 China Construction Bank Corporation Half-Year Report 2021
3 Management Discussion and Analysis
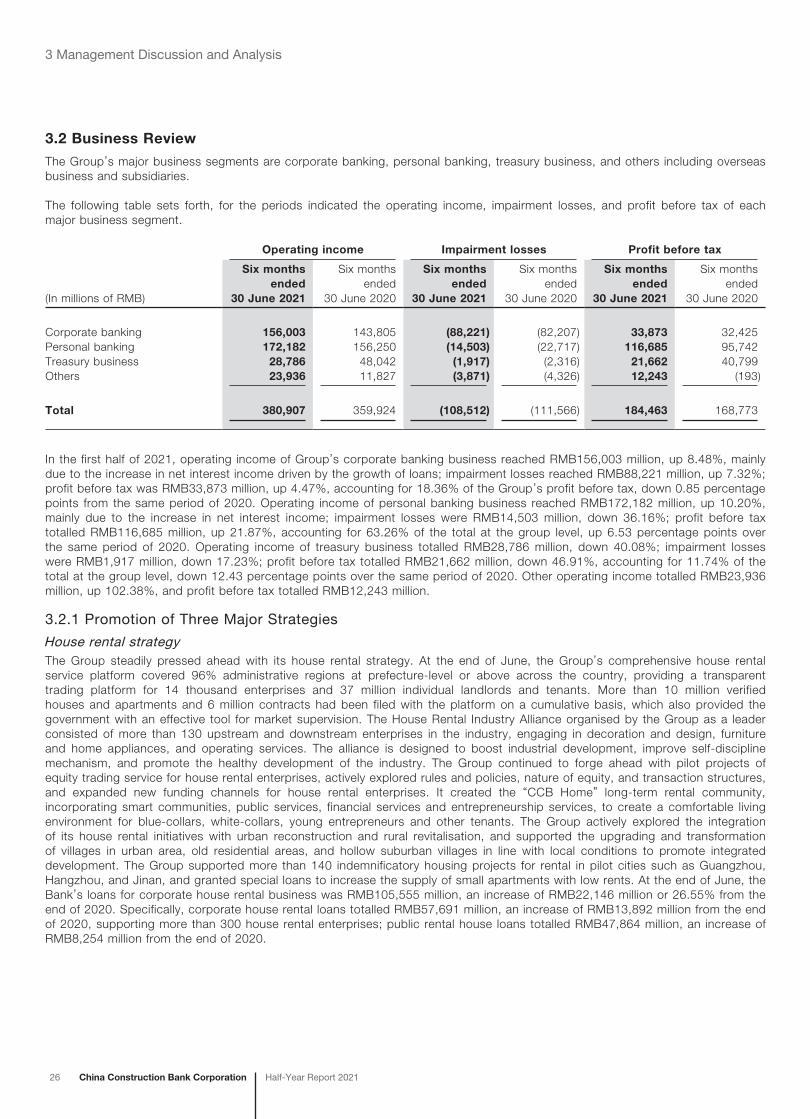
3.2 Business Review
The Group’s major business segments are corporate banking, personal banking, treasury business, and others including overseas business and subsidiaries.
The following table sets forth, for the periods indicated the operating income, impairment losses, and profit before tax of each major business segment.
Operating income Impairment losses Profit before tax
(In millions of RMB)
Six months ended
30 June 2021
Six months ended
30 June 2020
Six months ended
30 June 2021
Six months ended
30 June 2020
Six months ended
30 June 2021
Six months ended
30 June 2020
Corporate banking 156,003 143,805 (88,221) (82,207) 33,873 32,425Personal banking 172,182 156,250 (14,503) (22,717) 116,685 95,742Treasury business 28,786 48,042 (1,917) (2,316) 21,662 40,799Others 23,936 11,827 (3,871) (4,326) 12,243 (193)
Total 380,907 359,924 (108,512) (111,566) 184,463 168,773
In the first half of 2021, operating income of Group’s corporate banking business reached RMB156,003 million, up 8.48%, mainly due to the increase in net interest income driven by the growth of loans; impairment losses reached RMB88,221 million, up 7.32%; profit before tax was RMB33,873 million, up 4.47%, accounting for 18.36% of the Group’s profit before tax, down 0.85 percentage points from the same period of 2020. Operating income of personal banking business reached RMB172,182 million, up 10.20%, mainly due to the increase in net interest income; impairment losses were RMB14,503 million, down 36.16%; profit before tax totalled RMB116,685 million, up 21.87%, accounting for 63.26% of the total at the group level, up 6.53 percentage points over the same period of 2020. Operating income of treasury business totalled RMB28,786 million, down 40.08%; impairment losses were RMB1,917 million, down 17.23%; profit before tax totalled RMB21,662 million, down 46.91%, accounting for 11.74% of the total at the group level, down 12.43 percentage points over the same period of 2020. Other operating income totalled RMB23,936 million, up 102.38%, and profit before tax totalled RMB12,243 million.
3.2.1 Promotion of Three Major Strategies
House rental strategyThe Group steadily pressed ahead with its house rental strategy. At the end of June, the Group’s comprehensive house rental service platform covered 96% administrative regions at prefecture-level or above across the country, providing a transparent trading platform for 14 thousand enterprises and 37 million individual landlords and tenants. More than 10 million verified houses and apartments and 6 million contracts had been filed with the platform on a cumulative basis, which also provided the government with an effective tool for market supervision. The House Rental Industry Alliance organised by the Group as a leader consisted of more than 130 upstream and downstream enterprises in the industry, engaging in decoration and design, furniture and home appliances, and operating services. The alliance is designed to boost industrial development, improve self-discipline mechanism, and promote the healthy development of the industry. The Group continued to forge ahead with pilot projects of equity trading service for house rental enterprises, actively explored rules and policies, nature of equity, and transaction structures, and expanded new funding channels for house rental enterprises. It created the “CCB Home” long-term rental community, incorporating smart communities, public services, financial services and entrepreneurship services, to create a comfortable living environment for blue-collars, white-collars, young entrepreneurs and other tenants. The Group actively explored the integration of its house rental initiatives with urban reconstruction and rural revitalisation, and supported the upgrading and transformation of villages in urban area, old residential areas, and hollow suburban villages in line with local conditions to promote integrated development. The Group supported more than 140 indemnificatory housing projects for rental in pilot cities such as Guangzhou, Hangzhou, and Jinan, and granted special loans to increase the supply of small apartments with low rents. At the end of June, the Bank’s loans for corporate house rental business was RMB105,555 million, an increase of RMB22,146 million or 26.55% from the end of 2020. Specifically, corporate house rental loans totalled RMB57,691 million, an increase of RMB13,892 million from the end of 2020, supporting more than 300 house rental enterprises; public rental house loans totalled RMB47,864 million, an increase of RMB8,254 million from the end of 2020.
China Construction Bank CorporationHalf-Year Report 2021 27
3 Management Discussion and Analysis
Inclusive finance strategyThe Group continued to deepen the model of inclusive finance featuring “batch customer acquisition, accurate profiling, automated approval, intelligent risk control, and integrated services”, and promoted online business development and platform operations through technologies such as the Internet and big data. The Group improved “CCB Huidongni” service to improve its efficiency, coverage and customer experience. By the end of June, such service platform had attracted over 130 million online user visits and been downloaded more than 17 million times. It had over 5.56 million certified enterprises and more than 1 million credit customers. Over 700 billion loans had been granted to borrowers via the application. The Group leveraged its strength in branch network to make its service more accessible to common people and attract more customers. The Bank had more than 14,000 branches that can provide inclusive finance services, and over 18,000 inclusive finance specialists. The Bank also established more than 250 inclusive finance (small business) service centres and small business centres, as well as more than 1,900 featured inclusive finance outlets. Thus, efficient online service at hand was smoothly combined with warm and high-quality offline service. The Group continued to improve a series of products with new pattern such as “Quick Loan for Small and Micro Business”, “Quick Loan for Personal Business”, “Yunong Quick Loan” and “Quick Loan for Transactions” and built diversified lines of inclusive finance products. By the end of June, the Group had granted more than RMB4.7 trillion loans, benefiting more than 2.1 million customers. The Group pressed ahead with the building of “CCB Startup Station”, and integrated internal and external resources of the industry, as well as online and offline service models to provide comprehensive services for innovative and entrepreneurial enterprises. The Group continued to strengthen risk control and built an enterprise-level, whole-process automatic and intelligent risk management system which helped keep the quality of credit assets stable. At the end of June, according to the regulatory classification requirements in 2021, the Bank’s inclusive finance loans totalled RMB1.71 trillion, an increase of RMB288,382 million from the end of 2020, and the interest rate of new inclusive loans granted to small and micro businesses was 4.17%, down 0.19 percentage points from the end of 2020. The number of inclusive finance loan borrowers reached 1,801.8 thousand, an increase of 106.3 thousand from the end of 2020.
By the end of June, the total number of “CCB Yunongtong” inclusive finance service outlets was 520,000, covering nearly 80% of towns, townships and administrative villages across the country, which provided convenient financial services, convenience services, smart government affairs services, and e-commerce services for agriculture enterprises, farmers and enterprises in rural areas. The Bank established “CCB Yunongtong” comprehensive service platform for rural revitalisation, which had granted RMB2,115 million loans, completed payments of over RMB26 million, and served more than 950,000 users on a cumulative basis. A total of 13.75 million “Rural Revitalisation • Yunongtong” cards had been issued to key personal customers working in innovation and entrepreneurship sectors. The Bank also customised “Yunong Quick Loan” series to legal persons, collectives, and farmers to realise whole-process online loans processing, and effectively reduce the financing costs of agriculture-related loans. Taking into account characteristics of local markets, it actively carried out product innovation pilots such as “high-standard farmland loans” in the fields of food and agriculture to support the development of agricultural industry. At the end of June, the balance of agriculture-related loans of the Bank was RMB2.31 trillion, up RMB224,305 million or 10.74% from the end of 2020. Specifically, the balance of agriculture-related corporate loans was RMB1.68 trillion; the balance of agriculture-related personal loans was RMB637,727 million; and the balance of agriculture-related inclusive loans (excluding discounted bills) was RMB271,234 million, up RMB45,976 million or 20.41% from the end of 2020. The number of agriculture-related loans borrowers was 2,184,200, and the average interest rate of agriculture-related loans was 4.69%, down 0.06 percentage points from the end of 2020.
28 China Construction Bank Corporation Half-Year Report 2021
3 Management Discussion and Analysis
FinTech strategyThe Group optimised FinTech governance system and promoted in-depth development of FinTech strategy. The Board reviewed and approved the FinTech Strategic Plan 2021-2025 , which sets out the overall arrangement of the Group’s FinTech development goals, key tasks and safeguard measures for the next five years. The Group continued to promote the building of technology and data middle offices and improved its ability in technology and data multiplexing, agile delivery and collaboration. The AI platform realised pooled management and flexible supply of computing resources, and supported efficient model research and development and online reasoning. The Group researched and developed 180 models in the five fields of computer vision, intelligent voice, natural language processing, knowledge graph and intelligent decision-making, and put into operation 507 application scenarios on a cumulative basis. It developed an autonomic computer vision algorithm suitable for small edge computing devices, supported real-time video analysis scenarios in fields such as security and compliance by connecting with IoT, and innovated the application of AI + satellite remote sensing technology to agriculture-related loans. The blockchain service platform realised cloud-based service supply, adapted to various blockchain underlying technology frameworks, supported cross-chain interconnection of heterogeneous architecture, and established relatively complete capability in underlying management and application support of blockchain, which was applied in more than 30 scenarios including 12 business areas such as trade finance, cross-border payments, smart government affairs, and housing rental. CCB Cloud is committed to building a cloud service brand preferred by users in the financial industry, forming a multi-region, multi-function, safe and reliable layout, providing cloud service support for 401 projects across nine major fields such as government affairs, housing, and financial institution business to further improve its cooperation with government institutions and the level of ecological empowerment. The Group enabled large-scale cloud-based resource supply through the big data platform, and significantly enhanced the capacity in massive data processing and real-time computing. It further upgraded the data lake technology and migrated all business data to the data lake to provide more abundant data resources and data processing modes for business development. It managed and shared the Group’s data as assets, to support digitalised operation, group-level integration and other big data scenarios. It built an applet-based open ecology for mass development through the mobile internet platform. It continued to build special IoT network, which connected with over one million Internet of Things (IoT) terminals and supported 26 IoT applications including data collection by event tracking for digitalised operation, 5G smart banking, intelligent security, operation and distribution and CCB Yunongtong. Furthermore, the Group strengthened the enterprise-level security architecture management and control and completed the construction and promotion of Phase One of a smart security operation platform. The Bank’s subsidiary, CCB Fintech Co., Ltd., introduced three strategic investors for capital injection and share issuance and its valuation rose to RMB10 billion after capital injection.
At the end of June, the number of the Group’s FinTech personnel was 14,012, accounting for 3.79% of its total headcount. The Group had been granted a total of 606 patents, including 389 invention patents, maintaining a leading position in the domestic banking industry in terms of invention patents.
3.2.2 Corporate Banking
Corporate financial serviceCorporate deposits increased steadily, and the customer base was continuously consolidated. At the end of June, domestic corporate deposits of the Bank amounted to RMB10.41 trillion, up RMB707,969 million or 7.30% from the end of 2020. Specifically, demand deposits increased by 6.59% and time deposits increased by 8.60%. The number of the Bank’s corporate customers was 7,547.7 thousand, an increase of 267.2 thousand or 3.67% from the end of 2020.
Corporate loans maintained rapid growth, vigorously supporting the real economy. At the end of June, the Bank’s domestic corporate loans and advances amounted to RMB9.27 trillion, an increase of RMB906,932 million or 10.85% from the end of 2020. The NPL ratio of corporate loans and advances was 2.49%. The business kept sound growth momentums in key areas. The balance of loans to infrastructure sectors reached RMB4.83 trillion, an increase of RMB497,723 million or 11.48% from the end of 2020, accounting for 52.14% of domestic corporate loans and advances, with an NPL ratio of 1.80%. Medium to long-term manufacturing loans amounted to RMB616,849 million, an increase of RMB96,917 million or 18.64% from the end of 2020. The balance of loans to private enterprises was RMB3.22 trillion, an increase of RMB332,391 million or 11.52% from the end of 2020. Loans to strategic emerging industries amounted to RMB767,760 million, an increase of RMB152,240 million or 24.73% from the end of 2020. The balance of property development loans amounted to RMB502,075 million, an increase of RMB29,347 million or 6.21% from the end of 2020. The Bank provided more than RMB380 billion supply chain financing to over 56,000 enterprises across more than 3,700 industrial chains, of which private enterprises accounted for 97% and small and micro businesses accounted for 90%.
China Construction Bank CorporationHalf-Year Report 2021 29
3 Management Discussion and Analysis
Institutional businessThe Bank supported the modernisation of state governance system and governance capacity with its innovative smart government affairs service, to enable the development of digital government, digital society and digital economy. By the end of June, the Bank had established cooperative relationships with 28 provincial governments, and participated in the construction of the national service platform for government affairs, and many other platforms or scenarios related to the CBIRC, the Beijing-Tianjin-Hebei region as well as “Internet + Government Affairs Service” and “Internet + Supervision” in 13 provincial and 10 municipal governments. The total number of registered users of the online platform reached 160 million, and the total number of government affairs handled reached more than 1.7 billion. The Bank actively explored the model for constructing a “cross-provincial” government affairs service platform, and coordinated its 14 thousand outlets to provide government affairs services, where one could handle, make appointments for and inquire about more than 4,600 government affairs items. By innovatively building the designated smart teller machine (STM) service zone for “cross-provincial” government affairs, the Bank built “government service lobbies for the public” at 35 branches, which can provide services related to 436 government affairs items.
The Bank built platforms for the supervision of rural collective assets management, the rural property transactions and the smart village affairs, focused on making smart government affairs services more accessible for rural residents, and supported the implementation of the “Internet + Governance at Community Level” initiative. The Bank used “CCB Smart Campus” platform to provide over ten thousand schools and thousands of teachers and students with digital campus learning and life service scenarios, created an “educational service fund supervision platform” to meet national policies and public needs, and helped government, businesses and communities to empower social development. Centred on the “fully online medical services”, the “CCB Smart Healthcare” platform enhanced the medical efficiency and service levels for hundreds of medical and healthcare institutions, making it easier for the public to seek treatment or manage their health. The Bank created scenarios for nucleic acid testing appointment payment and COVID-19 vaccination appointment to help the government to improve its public health care services.
International businessThe Bank increased support for foreign trade customers and actively assisted in the establishment of a new development pattern of dual circulation where domestic and foreign markets can boost each other. The Group deepened cooperation with China Export & Credit Insurance Corporation, and the amount of insurance policy financing in the first half of 2021 increased by 111.28% from the same period last year. The cumulative transaction amount of forfaiting exceeded RMB370 billion, while more than RMB15 billion loans were granted through the “Cross-border Quick Loan” series to nearly 10,000 customers. As the first batch of banks directly linked to China International Trade “Single Window”, the Group launched over 10 online financial service functions, maintaining a leading position among peers. It made overall use of products and services such as international syndicate, cross-border merger and acquisition and export credit, and provided all-round financial support and financing facilities for the Belt and Road construction with solutions that combined financing with intelligence.
The Bank accelerated the innovation and development of key green finance products, clarified the recognition criteria for green letters of credit, and took the green industry as a key area to develop the trade finance business such as international factoring. Trade finance business meeting the PBC’s recognition criteria for green credit amounted to RMB20,331 million. The Bank focused on green topics and used the “CCB Match Plus” platform to hold several cross-border connection activities such as “Promote ESG, Embrace Green Finance” of Sino-UK New Energy-Webinar.
The Bank vigorously developed cross-border RMB business to promote the RMB internationalisation strategy. In the first half of 2021, the Bank’s cross-border RMB settlement volume reached RMB1.28 trillion. It supported the development of offshore RMB market, and its three RMB clearing banks in the UK, Switzerland and Chile operated steadily. Specifically, CCB London Branch continued to be the largest RMB clearing bank outside Asia, with a cumulative clearing amount of over RMB57 trillion.
Asset custody serviceThe Bank cultivated the brand of “CCB SMART Custody” to promote high-quality custody service, and successfully became custodian for the National Green Development Funds and the Industrial Investment Funds for Beijing-Tianjin-Hebei Coordinated Development. At the end of June, assets under the Bank’s custody amounted to RMB16.79 trillion, an increase of RMB1.54 trillion over the end of 2020. Specifically, insurance assets, assets entrusted to security companies and QFII assets under the Bank’s custody increased by RMB593.3 billion, RMB176.5 billion and RMB52.7 billion, respectively, all ranking first in the industry. Fee income from custody service totalled RMB3,848 million, an increase of RMB757 million, or 24.50% from the same period last year.
30 China Construction Bank Corporation Half-Year Report 2021
3 Management Discussion and Analysis
Settlement and cash management businessThe Bank continued to improve the quality and efficiency of account services and streamlined small and micro businesses account opening process. The Bank actively participated in anti-gambling and anti-fraud social governance and built an enterprise-level gambling and fraud risk monitoring system. The Bank took advantage of new opportunities in digital economy and vigorously expanded e-CNY agency business. The Bank further diversified scenarios and services of cash management products. Specifically, it launched “Jianguanyi” to safeguard the construction of major national projects and the safe operation of supply chain funds, as well as the proper use of funds by educational service institutions. It upgraded “Huishibao” to cover more application scenarios such as renovation and medical services, explored digital account payment, and enhanced the connection and collaboration capabilities of the digital service platforms. The Bank continued to refine the global cash management product system by integrating domestic and overseas markets, domestic and foreign currencies, and further advanced the digitalised operation of services to long-tail corporate customers. At the end of June, the Bank had 11.86 million corporate RMB settlement accounts, an increase of 404.8 thousand over the end of 2020, while its active cash management customers increased by 171.7 thousand to 1,847.8 thousand from the same period last year.
3.2.3 Personal Banking
Personal financial serviceMarket competitiveness of retail banking continued to strengthen. The business model of digitalised operation was more mature. The Bank innovatively upgraded “Cloud Workshop + Corporate Wechat Account”, and made breakthroughs in the direct operating system for long-tail customers. It enhanced its capacity in setting up scenarios, seized its first mover advantage in e-CNY to actively create the consumption ecology, and solidly promoted the unified, merchants-sharing comprehensive service platform. The number of merchants with high personal contribution increased by 1.62 million, up 14% from the same period last year. The Bank vigorously carries out theme activities such as “Benefit Season” and “Fighting Season” to expand its social influence and facilitate business development, and significantly improved its capacity in digitalised operation. The mega wealth system achieved initial results, and the brand and platform of “CCB Long Fortune” were comprehensively upgraded. Personal deposits grew rapidly, and the business foundation was further consolidated. At the end of June, domestic personal deposits of the Bank rose by RMB988,879 million or 9.71% from the end of 2020 to RMB11.17 trillion. Personal customers held financial assets of over RMB14 trillion. The proportion of pre-tax profit of personal banking in total profit of the Group was 63.26%.
In accordance with the requirements of China’s control and loan concentration management policies for the real estate market, the Bank strictly implemented differentiated credit policies for residential mortgages, supporting the borrowers’ reasonable housing needs. The Bank actively practised the whole-process risk prevention and control concept, and took solid measures in risk prevention to ensure the sustainable, stable and healthy development of residential mortgages. At the end of June, domestic personal loans of the Bank increased by RMB295,142 million, or 4.08% from the end of 2020, to RMB7.53 trillion. Specifically, the balance of residential mortgages was RMB6.11 trillion, an increase of 4.72%; the balance of personal consumer loans was RMB227,838 million, including RMB203,491 million personal quick loans; and the balance of agriculture-related personal loans was RMB4,363 million, an increase of 57.43% from the end of 2020.
Entrusted housing finance businessThe Bank adhered to the purpose of “supporting housing reform and serving the public” for the entrusted housing finance business and drove service transformation and upgrading with digital solutions. At the end of June, the balance of housing fund deposits was RMB1.01 trillion, while personal provident housing fund loans amounted to RMB2.69 trillion. The Bank issued a total of 38.27 million co-branded provident housing fund cards. The Bank steadily pressed ahead with financial services in the indemnificatory housing market, and had cumulatively provided RMB117,283 million indemnificatory housing loans to nearly 600,000 low- and middle-income households, and RMB53,161 million loans for 220 pilot indemnificatory housing projects.
Debit card businessThe Bank deeply engaged in the building of consumption ecosystem, and provided diversified debit card products functions and services. At the end of June, the number of active debit cards was 1,226 million, including 680 million financial IC debit cards. The consumption amount via debit cards totalled RMB12.85 trillion, an increase of 19.98% from the same period last year. The Bank continuously optimised “Long Pay” products functions, maintaining a leading position among its peers in terms of business size and brand image. In the first half of 2021, the number of users of “Long Pay” exceeded 173 million.
China Construction Bank CorporationHalf-Year Report 2021 31
3 Management Discussion and Analysis
Credit card businessThe Bank innovatively used ideas and methods of digitalised operation to strengthen the refined management of credit card business. It launched the “Leader” credit card in its Transformers series, and fully upgraded the benefits and services for bilibili credit card, “My love” Family Card and other “Long” cards, creating competitive popular products. It cooperated with more than 30 leading merchants to build the “Long Credit Card Discounts 666” marketing brand. It stepped up instalment loans innovation, and promoted instalment loans for new energy vehicles. The Bank also pressed ahead with the building of business circles. It applied online authentication tools such as facial recognition, optical character recognition, online identity verification to enhance its anti-fraud capability online, and strengthened the active detection of suspected inflows of credit card funds into real estate, investment, production and operation sectors and cash out activities, to improve proactive intelligent risk management.
At the end of June, the cumulative number of credit cards issued by the Bank and customers reached 146 million and 105 million, respectively. The spending amount via credit cards totalled RMB1.50 trillion. The loan balance was RMB839,412 million with an NPL ratio of 1.28%. The Bank remained as a market leader in terms of multiple core indicators, including the total number of customers and loan balance of credit cards.
Private banking businessThe Bank increased the supply of private banking products and services and maintained a leading position for its family trust advisory business in the industry. It accelerated the progress of improving professional capabilities in asset allocation, continued to issue allocation strategies for major classes of assets, and promoted asset management services of private banking. It pressed ahead with the building of the whole-process integrated system for smart APPs and customer services of private banking and created a high-standard quality service experience for private banking customers. At the end of June, the private banking customers’ assets under management reached RMB1.93 trillion, an increase of 8.45% from the end of 2020. The Bank had 175,610 private banking customers, an increase of 9.21% from the end of 2020. The balance of assets under management of family trust advisory business was RMB46 billion.
3.2.4 Treasury Business
Financial market businessThe Bank’s financial market business actively supported the national strategies and the development of the real economy, continued to make progress in operating management, trading platforms building, digitalised operation, customer service and expansion, and risk management and control, and maintained a leading position among its peers in terms of key business indicators.
Money market business
The Bank strengthened its proactive management with a combination of money market tools, and maintained reasonable RMB and foreign currency positions, to ensure sound liquidity. With regard to its RMB money market business, the Bank strengthened market analysis to gain in-depth understanding of market movement patterns, explored foreign investors for interbank certificates of deposits, and enhanced transaction capacity, continuously improving its market influence. With regard to its foreign currency money market business, the Bank tracked the monetary policies of US Federal Reserve and market trends to improve the yields of its foreign currency funds and its market influence; it actively innovated domestic third-party foreign currency repurchase business, and successfully issued the Bank’s first foreign currency interbank certificates of deposits in the domestic market.
Debt securities business
The Bank adhered to the strategy of value investment, optimised its portfolio structure, and supported the development of the real economy. The Bank actively implemented the concept of green development and increased green bond investment. The Bank continuously studied the trend of interest rate movements, set a reasonable pace of investment, enhanced credit risk control, and raised the overall return on investment. The Bank applied FinTech to empower small- and medium-sized financial institutions and effectively met their needs for government bond investments. The Bank actively underwrote and invested in domestic USD bonds, and contributed to the building of domestic market of foreign currency bonds.
Customer-based trading business
The Bank steadily carried forward the high-quality development of its customer-based trading business, and further strengthened its IT system construction. It promoted the concept of risk neutrality, consolidated customer base, implemented tiered customer services, actively met the trading needs of foreign institutional investors, and strengthened management and control of the business risk. It successfully introduced the “Quick Transaction for Micro and Small Enterprises” transaction function as well as other modules. In the first half of 2021, the customer-based trading volume amounted to US$297.5 billion, the volume of foreign exchange interbank market-making transactions reached US$2.49 trillion, and the Bank remained a top market maker.
32 China Construction Bank Corporation Half-Year Report 2021
3 Management Discussion and Analysis
Precious metals and commodities
The Bank continuously promoted the steady development of its precious metals and commodities business. It paid close attention to market fluctuations and provided bulk commodity hedging services for enterprises to help them operate steadily; strengthened digitalised operation and improved customer service experience; and strengthened risk management and consumer rights and interests protection. In the first half of 2021, the total trading volume of precious metals of the Bank reached 40,339 tonnes.
Assets management businessThe Bank continued to promote the building of a new system for asset management at the group level, strengthened key activities such as assets allocation, channel sales, investment research and investment operation, FinTech, and risk management. It strictly followed regulatory guidance to carry out operation and rectification of existing WMPs in a smooth and orderly manner. It accelerated asset management business model transformation and innovation and strove to build the Bank’s third pillar of business development. At the end of June, the Group’s WMPs amounted to RMB1,849,393 million. In this amount, those managed by the Bank were RMB903,127 million, and those managed by CCB Wealth Management, its subsidiary, were RMB946,266 million.
In the first half of 2021, the Bank independently issued various WMPs totalling RMB2,579,222 million to effectively meet the investment needs of customers. In this amount, six net-asset-value type WMPs were launched, with a balance of RMB286,238 million, accounting for 31.69% of the total. The balance of expected-return WMPs was RMB616,889 million, accounting for 68.31% of the total. The balance of WMPs to personal customers was RMB639,101 million, accounting for 70.77% of the total; and that to corporate customers was RMB264,026 million, accounting for 29.23% of the total. The Bank carried out product transition to its subsidiary in an orderly manner to protect the interests of customers, with a better asset structure and a higher proportion of standardised assets. The standardised assets that can be traded in the open market amounted to RMB653,093 million, accounting for 65.34% of the total, up 5.21 percentage points over the end of 2020.
Information on issuance, maturity and balance of the Bank’s WMPs during the reporting period is as follows.
As at 31 December 2020 WMPs issued WMPs matured As at 30 June 2021
(In millions of RMB, except periods) Batches Amount Batches Amount Batches Amount Batches Amount
Non-principal guaranteed WMPs 2,390 1,471,010 850 2,578,804 2,513 3,175,014 727 874,800Principal guaranteed WMPs 1 56,854 – 418 – 28,945 1 28,327
Total 2,391 1,527,864 850 2,579,222 2,513 3,203,959 728 903,127
The assets in which the Bank’s WMPs invested directly and indirectly as at the dates indicated are as follows.
As at 30 June 2021 As at 31 December 2020
(In millions of RMB, except percentages) Amount % of total Amount % of total
Cash, deposits and interbank negotiable certificates of deposit 181,286 18.14 393,298 24.02
Bonds 522,925 52.32 688,972 42.08Non-standardised debt assets 196,661 19.67 358,187 21.88Other assets 98,688 9.87 196,807 12.02
Total 999,560 100.00 1,637,264 100.00
At the end of June, the balance of various WMPs managed by CCB Wealth Management was RMB946,266 million. The balance of WMPs to personal customers was RMB814,526 million, accounting for 86.08% of the total; that to corporate customers was RMB131,740 million, accounting for 13.92% of the total. The standardised assets that can be traded in the open market accounted for 69.24% of the total, amounting to RMB733,613 million.
China Construction Bank CorporationHalf-Year Report 2021 33
3 Management Discussion and Analysis
Investment banking businessThe Bank actively pressed ahead with bond and securitisation projects in the fields of people’s livelihood such as rural revitalisation, innovation and entrepreneurship, high growth, and private enterprises, and leveraged platforms such as “FITS e Intelligent” and “FITS e+” to improve the quality and efficiency of inclusive customer services. It optimised the structure of bond underwriting business and underwrote a total of 396 batches of bond financing instruments for enterprises with an aggregate financing amount of RMB260.7 billion. New non-standard debt and equity assets amounted to RMB115,590 million. The size of asset securitisation business was RMB18,710 million. It issued six batches of trust beneficial right transfer products of corporate loans credit assets, amounting to RMB26,871 million. In the first half of 2021, the Bank’s income from investment banking reached RMB5,562 million. It had a total number of over 60,000 customers, of which exceeding 57,000 were inclusive customers. It provided over RMB400 billion direct financing for enterprises.
Financial institutional businessThe Bank continued to promote the upgrading and expansion of the interbank cooperation platform, focusing on the building of ecological scenarios such as interbank finance and joint risk management. The platform has successively launched products such as deposits and placements with banks and non-bank financial institutions, cooperative placements with banks and non-bank financial institutions, non-settlement deposits from banks and non-bank financial institutions, the “Hui” series and the “Micro” series. By the end of June, the cumulative transaction volume of the platform reached RMB19 billion, and more than 900 financial institutions had used the Bank’s joint risk management products of “Hui” series. At the end of June, the Bank’s amounts due to other domestic financial institutions (including insurance deposits) were RMB1.64 trillion, a decrease of RMB171,875 million from the end of 2020. The Bank’s assets placed with other domestic financial institutions were RMB679,387 million, a decrease of RMB45,095 million from the end of 2020.
3.2.5 Overseas Commercial Banking Business
The Group steadily expanded its overseas business and institutional network to enhance globalised customer service capability and international competitiveness. By the end of June, the Group had established overseas commercial banking institutions in 30 countries and regions. The Group had wholly-owned operating subsidiaries including CCB Asia, CCB London, CCB Russia, CCB Europe, CCB New Zealand, CCB Brasil and CCB Malaysia, and held 60% of equity in CCB Indonesia. In the first half of 2021, net profit achieved by overseas commercial banking institutions of the Group was RMB3,294 million.
CCB AsiaChina Construction Bank (Asia) Corporation Limited is a licensed bank registered in Hong Kong with an issued and fully paid capital of HK$6,511 million and RMB17,600 million.
CCB Asia holds a banking license to engage in multiple lines of business, with its core base in Hong Kong and Macau and a wide reach spreading to the Chinese mainland and Southeast Asia. The targeted customers of its wholesale business include local Blue-Chip and large Red-Chip companies, large Chinese conglomerates and multinational corporations, while it also provides high-quality financial services to premium local customers. CCB Asia has rich experience and traditional advantages in providing professional financial services such as overseas syndicated loans and structured finance and has achieved rapid growth in corporate financial services in international settlement, trade finance, financial market trading and financial advisory service. CCB Asia is the Group’s service platform for retail and small and medium-sized enterprises in Hong Kong, and has 38 branches and outlets. At the end of June, total assets of CCB Asia amounted to RMB410,501 million, and shareholders’ equity was RMB65,047 million. Net profit for the first half of 2021 was RMB1,188 million.
CCB LondonChina Construction Bank (London) Limited is a wholly-owned subsidiary of the Bank, established in the UK in 2009, with a registered capital of US$200 million and RMB1.5 billion.
In order to better respond to changes in the external market environment and the needs of internal operation and management, the Group has steadily promoted the business integration of London institutions, and the existing businesses of CCB London were transferred to London Branch in an orderly manner. At the end of June, total assets of CCB London amounted to RMB3,421 million, and shareholders’ equity was RMB3,420 million. Net losses for the first half of 2021 were RMB68,200.
CCB RussiaChina Construction Bank (Russia) Limited is a wholly-owned subsidiary of the Bank, established in Russia in 2013, with a registered capital of RUB4.2 billion. CCB Russia holds a comprehensive banking license, a precious metal business license and a security market participant license issued by the Central Bank of Russia.
CCB Russia is dedicated to serving Chinese enterprises in Russia, large Russian enterprises and multinational enterprises involved in Sino-Russia bilateral trade. It is mainly engaged in corporate deposits and loans, international settlement and trade finance, financial market trading, financial institutional business, clearing, etc. At the end of June, total assets of CCB Russia amounted to RMB1,984 million, and shareholders’ equity was RMB580 million. Net profit for the first half of 2021 was RMB1 million.
34 China Construction Bank Corporation Half-Year Report 2021
3 Management Discussion and Analysis
CCB EuropeChina Construction Bank (Europe) S.A. is a wholly-owned subsidiary of the Bank, established in Luxembourg in 2013, with a registered capital of EUR550 million. Based in Luxembourg, CCB Europe has established branches in Paris, Amsterdam, Barcelona, Milan, Warsaw and Hungary.
CCB Europe mainly provides services to large and medium-sized enterprises in Europe as well as European multinational enterprises in China. It is mainly engaged in corporate deposits and loans, international settlement, trade finance, and cross-border trading. At the end of June, total assets of CCB Europe amounted to RMB18,653 million, and shareholders’ equity was RMB4,021 million. Net losses for the first half of 2021 were RMB36 million.
CCB New ZealandChina Construction Bank (New Zealand) Limited is a wholly-owned subsidiary of the Bank, established in New Zealand in 2014, with a registered capital of NZD199 million.
CCB New Zealand holds wholesale and retail business license, and offers all-round and high-quality financial services, including corporate loans, trade finance, RMB clearing and cross-border trading. At the end of June, total assets of CCB New Zealand amounted to RMB8,583 million, and shareholders’ equity was RMB1,139 million. Net profit for the first half of 2021 was RMB54 million.
CCB BrasilChina Construction Bank (Brasil) Banco Múltiplo S/A is a wholly-owned subsidiary acquired by the Bank in Brasil in 2014. The name of its predecessor, Banco Industrial e Comercial S.A., was changed to the present one in 2015.
CCB Brasil provides banking services, including corporate loans, trading and personal lending, as well as non-banking financial services such as leasing. CCB Brasil has eight domestic branches and sub-branches in Brasil, one Cayman branch, and eight subsidiaries. These subsidiaries provide personal loans, prepaid cards, leasing, factoring and other services. At the end of June, total assets of CCB Brasil amounted to RMB21,929 million, and shareholders’ equity was RMB1,368 million. Net losses for the first half of 2021 were RMB82 million.
CCB MalaysiaChina Construction Bank (Malaysia) Berhad is a wholly-owned subsidiary of the Bank, established in Malaysia in 2016, with a registered capital of MYR822.6 million.
As a licensed commercial bank, CCB Malaysia can provide various financial services, including global credit granting, trade finance, supply chain finance, clearing in multiple currencies, and cross-border fund transactions for key projects under the Belt and Road Initiative, enterprises engaging in Sino-Malaysian bilateral trade, and large local infrastructure projects in Malaysia. At the end of June, total assets of CCB Malaysia were RMB8,346 million, and shareholders’ equity was RMB1,398 million. Net profit for the first half of 2021 was RMB44 million.
CCB IndonesiaPT Bank China Construction Bank Indonesia Tbk is a fully licensed commercial bank listed on the Indonesia Stock Exchange. Headquartered in Jakarta, CCB Indonesia has 84 branches, sub-branches and cash offices across the country. The Bank completed the acquisition of 60% equity in PT Bank Windu Kentjana International Tbk in September 2016 and renamed it PT Bank China Construction Bank Indonesia Tbk in February 2017. CCB Indonesia completed procedures related to public offering in December 2020, leading to new registered capital of IDR3.79 trillion. The Bank invested IDR1.92 trillion to subscribe to these shares, and the proportion of ownership remained unchanged at 60%.
The business priorities of CCB Indonesia include corporate business, small and medium-sized enterprise business, trade finance and infrastructure finance. It is committed to promoting the bilateral investment and trade between China and Indonesia, serving Blue-Chip companies in Indonesia, and supporting the Belt and Road Initiative. At the end of June, total assets of CCB Indonesia amounted to RMB11,521 million, and shareholders’ equity was RMB2,695 million. Net profit for the first half of 2021 was RMB26 million.
China Construction Bank CorporationHalf-Year Report 2021 35
3 Management Discussion and Analysis
3.2.6 Integrated Operation Subsidiaries
The Group has multiple domestic and overseas subsidiaries, including CCB Principal Asset Management, CCB Financial Leasing, CCB Trust, CCB Life, Sino-German Bausparkasse, CCB Futures, CCB Pension, CCB Property & Casualty, CCB Investment, CCB Wealth Management and CCB International. In the first half of 2021, the overall development of integrated operation subsidiaries was robust with steady business growth. At the end of June, total assets of integrated operation subsidiaries were RMB753,054 million. Net profit reached RMB6,659 million.
CCB Principal Asset ManagementCCB Principal Asset Management Co., Ltd. was established in 2005, with a registered capital of RMB200 million, to which the Bank, Principal Financial Services, Inc. and China Huadian Capital Holdings Company Limited contribute 65%, 25% and 10%, respectively. It is engaged in the raising and selling of funds, and asset management.
CCB Principal Asset Management gave full play to its professional strength and steadily improved its business performance. At the end of June, total assets managed by CCB Principal Asset Management were RMB1.24 trillion. Specifically, mutual funds were RMB578,584 million; separately managed accounts were RMB364,973 million; assets managed by its subsidiary CCB Principal Capital Management Co., Ltd. reached RMB297,416 million. Total assets of CCB Principal Asset Management were RMB8,315 million, and shareholders’ equity was RMB7,268 million. Net profit for the first half of 2021 was RMB497 million.
CCB Financial LeasingCCB Financial Leasing Co., Ltd., a wholly-owned subsidiary of the Bank, was established in 2007, with a registered capital of RMB11 billion. It is mainly engaged in finance leasing, transfer and purchase of finance lease assets, and fixed-income securities investment.
CCB Financial Leasing gave full play to its license advantages, adhered to the concept of returning to the origin business priority – leasing, based itself on key regions, and strengthened parent-subsidiary cooperation, to improve the quality and efficiency of serving the real economy. It actively participated in the New Financial practices and focused on the transformation to green leasing. It promoted the transformation of inclusive leasing business and digitalised operation. It strengthened the base of risk management and kept its NPL ratio at a low level in the industry. At the end of June, total assets of CCB Financial Leasing were RMB138,146 million, and shareholders’ equity was RMB21,540 million. Net profit for the first half of 2021 reached RMB974 million.
CCB TrustCCB Trust Co., Ltd. is a trust subsidiary invested and controlled by the Bank in 2009, with a registered capital of RMB10.5 billion. The Bank and Hefei Xingtai Financial Holding (Group) Co., Ltd. hold 67% and 33% of its shares, respectively. It is mainly engaged in trust business, investment banking and proprietary business.
CCB Trust stepped up efforts in improving compliance in its operations, actively engaged in innovation-driven development, and delivered strong operating results. At the end of June, trust assets under management amounted to RMB1.63 trillion. Total assets of CCB Trust were RMB40,131 million, and shareholders’ equity was RMB23,752 million. Net profit for the first half of 2021 was RMB1,195 million.
CCB LifeCCB Life Insurance Co., Ltd. was established in 1998 with a registered capital of RMB7,120 million. The Bank, China Life Insurance Co., Ltd. (Taiwan), the National Council for Social Security Fund, Shanghai Jin Jiang International Investment and Management Company Limited, Shanghai China-Sunlight Investment Co., Ltd. and China Jianyin Investment Limited hold 51%, 19.9%, 16.14%, 4.9%, 4.85% and 3.21% of its shares, respectively. It is mainly engaged in personal insurance such as life, health, accidental injury insurance and reinsurance of the above-mentioned offerings.
CCB Life further optimised its business structure and its financial results continued to improve. At the end of June, total assets of CCB Life were RMB253,361 million, and shareholders’ equity was RMB22,490 million. Net profit for the first half of 2021 was RMB1,113 million.
Sino-German BausparkasseSino-German Bausparkasse Co., Ltd. was established in 2004 with a registered capital of RMB2 billion. The Bank and Bausparkasse Schwaebisch Hall AG hold 75.10% and 24.90% of its shares, respectively. As a specialised commercial bank committed to serving the housing finance sector, Sino-German Bausparkasse is engaged in housing savings deposits and loans, residential mortgages, and real estate development loans for indemnificatory housing supported by state policies.
Sino-German Bausparkasse achieved steady business development, and the sales of housing savings products amounted to RMB10,128 million in the first half of 2021. At the end of June, total assets of Sino-German Bausparkasse were RMB28,380 million, and shareholders’ equity was RMB3,054 million. Net profit for the first half of 2021 was RMB44 million.
36 China Construction Bank Corporation Half-Year Report 2021
3 Management Discussion and Analysis
CCB FuturesCCB Futures Co., Ltd. is a futures subsidiary invested and controlled by the Bank in 2014, with a registered capital of RMB936 million. CCB Trust and Shanghai Liangyou (Group) Co., Ltd. hold 80% and 20% of its shares respectively. It is mainly engaged in commodity futures brokerage, financial futures brokerage, asset management and futures investment advisory business. CCB Trading Company Limited, a wholly-owned risk management subsidiary of CCB Futures, is engaged in pilot risk management operations approved by the CSRC, such as warehouse receipt service and pricing service, and general trade business.
CCB Futures gave full play to its professional strength, strengthened its ability to serve the real economy and maintained stable development in all business lines. At the end of June, total assets of CCB Futures were RMB11,443 million, and shareholders’ equity was RMB1,119 million. Net profit for the first half of 2021 was RMB41 million.
CCB PensionCCB Pension Management Co., Ltd. was established in 2015 with a registered capital of RMB2.3 billion. The Bank and the National Council for Social Security Fund hold 85% and 15% of its shares, respectively. It is mainly engaged in investment and management of national social security funds, businesses related to the management of enterprise annuity funds, entrusted management of pension funds, and pension advisory service for the above-mentioned asset management activities.
CCB Pension steadily promoted the building of the Group’s pension financial ecosystem, further explored the regional pension industry alliance, and made innovative breakthroughs in the “house deposit for pension” business. It also achieved remarkable success in the expansion of occupational annuity market and won all public tenders for government-administered occupational annuity plans. At the end of June, assets under management by CCB Pension reached RMB541,242 million, total assets of CCB Pension were RMB3,506 million, and shareholders’ equity was RMB2,632 million. Net profit for the first half of 2021 was RMB70 million.
CCB Property & CasualtyCCB Property & Casualty Insurance Co., Ltd. was established in 2016 with a registered capital of RMB1 billion. CCB Life, Ningxia Communications Investment Group Co., Ltd. and Yinchuan Tonglian Capital Investment Operation Co., Ltd. hold 90.2%, 4.9% and 4.9% of its shares, respectively. It is mainly engaged in motor vehicle insurance, insurance for business and household property, construction and engineering, liability insurance, hull and cargo insurance, short-term health and accidental injury insurance, and reinsurance of the above-mentioned offerings.
CCB Property & Casualty witnessed a steady business development. At the end of June, total assets of CCB Property & Casualty were RMB1,415 million, and shareholders’ equity was RMB472 million. Net losses for the first half of 2021 were RMB8 million.
CCB InvestmentCCB Financial Asset Investment Co., Ltd. is a wholly-owned subsidiary of the Bank, established in 2017, with a registered capital of RMB27 billion. It is mainly engaged in debt-for-equity swaps and relevant supporting businesses.
CCB Investment adopted a market-oriented approach and made active efforts to explore opportunities with business innovations. By the end of June, it had realised a total contractual amount of RMB913,596 million under framework agreements and an actual investment amount of RMB351,286 million. At the end of June, total assets of CCB Investment were RMB138,401 million, and shareholders’ equity was RMB29,662 million. Net profit for the first half of 2021 was RMB1,547 million.
CCB Wealth ManagementCCB Wealth Management Co., Ltd. is a wholly-owned subsidiary of the Bank, established in 2019, with a registered capital of RMB15 billion. It is mainly engaged in the offering of WMPs, investment and management of entrusted properties, and wealth management advisory and consulting services.
CCB Wealth Management persisted in serving the real economy, continuously improved its proactive management capability of asset management business, and actively participated in the development of capital market on the basis of sound and compliant operations. At the end of June, total assets of CCB Wealth Management were RMB16,609 million, and shareholder’s equity was RMB15,926 million. The size of WMPs amounted to RMB946,266 million. Net profit for the first half of 2021 was RMB529 million.
China Construction Bank CorporationHalf-Year Report 2021 37
3 Management Discussion and Analysis
CCB InternationalCCB International (Holdings) Limited is one of the Bank’s wholly-owned subsidiaries in Hong Kong, established in 2004, with a registered capital of US$601 million. It offers through its subsidiaries investment banking related services, including sponsoring and underwriting of public offerings, corporate merger and acquisition and restructuring, direct investment, asset management, securities brokerage and market research.
CCB International maintained stable development in all business lines by continuing to focus on the trend of China concept stocks seeking listings on A-share or H-share market, supporting the development of national strategies and providing innovative services to the real economy. It led the industry in acting as securities sponsor and underwriter as well as M&A financial advisor. At the end of June, total assets of CCB International were RMB88,871 million, and shareholders’ equity was RMB14,526 million. Net profit for the first half of 2021 was RMB690 million.
3.2.7 Analysed by Geographical Segment
The following table sets forth the distribution of the Group’s profit before tax by geographical segment.
Six months ended 30 June 2021 Six months ended 30 June 2020
(In millions of RMB, except percentages) Amount % of total Amount % of total
Yangtze River Delta 29,914 16.22 27,486 16.29Pearl River Delta 27,530 14.92 28,208 16.71Bohai Rim 30,590 16.58 27,311 16.18Central 34,711 18.82 16,021 9.49Western 25,170 13.65 26,105 15.47Northeastern 1,970 1.07 3,292 1.95Head Office 34,112 18.49 37,763 22.38Overseas 466 0.25 2,587 1.53
Profit before tax 184,463 100.00 168,773 100.00
The following table sets forth the distribution of the Group’s assets by geographical segment.
As at 30 June 2021 As at 31 December 2020
(In millions of RMB, except percentages) Amount % of total Amount % of total
Yangtze River Delta 5,265,601 13.47 4,874,094 13.05Pearl River Delta 4,148,127 10.61 3,942,366 10.55Bohai Rim 6,885,064 17.61 6,671,861 17.86Central 4,655,545 11.91 4,423,501 11.84Western 4,179,766 10.69 3,985,433 10.67Northeastern 1,494,281 3.82 1,451,185 3.88Head Office 10,862,198 27.79 10,577,145 28.31Overseas 1,602,453 4.10 1,434,781 3.84
Total assets1 39,093,035 100.00 37,360,366 100.00
1. Total assets exclude elimination and deferred tax assets.
38 China Construction Bank Corporation Half-Year Report 2021
3 Management Discussion and Analysis
The following table sets forth the distribution of the Group’s loans and NPLs by geographical segment.
As at 30 June 2021 As at 31 December 2020
(In millions of RMB, except percentages)
Gross loans and advances % of total NPLs
NPL ratio (%)
Gross loans and advances % of total NPLs
NPL ratio (%)
Yangtze River Delta 3,312,352 18.33 34,830 1.05 3,003,466 17.93 32,932 1.10Pearl River Delta 2,987,484 16.54 37,657 1.26 2,770,718 16.55 38,323 1.38Bohai Rim 3,031,962 16.78 43,259 1.43 2,819,557 16.84 43,467 1.54Central 3,310,716 18.33 73,232 2.21 3,084,244 18.42 65,990 2.14Western 2,923,996 16.19 41,311 1.41 2,741,336 16.37 39,218 1.43Northeastern 798,547 4.42 29,263 3.66 766,232 4.57 22,581 2.95Head Office 843,827 4.67 10,833 1.28 830,609 4.96 11,772 1.42Overseas 855,855 4.74 6,596 0.77 729,606 4.36 6,446 0.88
Gross loans and advances excluding accrued interest 18,064,739 100.00 276,981 1.53 16,745,768 100.00 260,729 1.56
The following table sets forth the distribution of the Group’s deposits by geographical segment.
As at 30 June 2021 As at 31 December 2020
(In millions of RMB, except percentages) Amount % of total Amount % of total
Yangtze River Delta 4,124,012 18.48 3,648,098 17.70Pearl River Delta 3,557,540 15.94 3,213,868 15.59Bohai Rim 4,161,840 18.65 3,875,480 18.80Central 4,341,276 19.45 4,018,270 19.49Western 3,970,236 17.79 3,741,594 18.15Northeastern 1,444,711 6.47 1,389,559 6.74Head Office 4,457 0.02 17,164 0.08Overseas 400,307 1.79 434,595 2.11Accrued interest 313,590 1.41 276,348 1.34
Total deposits from customers 22,317,969 100.00 20,614,976 100.00
3.2.8 Building of Branch Network and Channels
The Group provides its customers with convenient and high-quality services through branches and sub-branches, self-service facilities and specialised service entities across the world as well as e-banking service platforms. At the end of June, the Bank had a total of 14,656 operating entities, consisting of 14,622 domestic entities including the head office, 37 tier-one branches, 361 tier-two branches, 14,045 sub-branches, 177 outlets under the sub-branches and a specialised credit card centre at the head office, and 34 overseas institutions. The Bank had 19 major subsidiaries with a total of 592 entities, including 425 domestic ones and 167 overseas ones. For addresses of domestic and overseas tier-one branches and subsidiaries, please refer to the 2020 annual report of the Bank.
China Construction Bank CorporationHalf-Year Report 2021 39
3 Management Discussion and Analysis
Physical channelsThe Bank strengthened the overall planning of its physical channel construction. While keeping the total number of outlets basically stable, it prioritised investment in channel construction in key strategic regions such as the Beijing-Tianjin-Hebei region, the Yangtze River Delta, and the Guangdong-Hong Kong-Macao Greater Bay Area. It continuously optimised the branch network layout, considering the development of city clusters, the progress in new-type urbanisation and the trend of population migration. Its flagship stores reached 1,484, which played a leading and synergistic role in its branches. The Bank also took measures to streamline inefficient outlets where there were too many banks, and 192 outlets were withdrawn, merged or relocated in the first half of 2021. It also continued to improve the level of intelligent service and customer experience of outlets, and built seven new smart banking outlets in Beijing, Guangzhou, Shaoguan, Jiangmen and other places. Moreover, the Bank continued to optimise the self-service channel service network, and had 73,065 ATMs, 24,831 self-service banks, including 10,683 off-premise self-service banks, and 48,549 smart teller machines to fully support corporate and personal banking. By the end of June, it had established more than 250 inclusive finance (small business) service centres and small business centres, and over 1,800 personal loan centres.
The Bank built a group-wide intelligent operation system. Based on the three-tier structure of “access, delivery and control” for intelligent operation, the Bank focused on improving the construction of operation governance system, deepening the application of artificial intelligence (AI) in channel operation, and building the shared operation capability to support digitalised operation. It expanded the application of cloud-based production model in 12 scenarios in four fields to optimise operation resource allocation. It promoted the application of robotic process automation (RPA), intelligent character recognition (ICR) and AI in various fields. In the first half of 2021, 240 RPA application scenarios were released to realise the high-precision identification of 16 kinds of certificates in counter business, and to complete the data annotation of scenarios such as the identification of bills at counter and remote cash stock taking. It promoted the implementation of customer journey programs, the building of employee community and the evaluation of customer experience, to improve internal and external user experience. It strengthened omni-channel integrated development capabilities, to provide customers with seamless experience through all channels. It leveraged its WeChat official account “CCB Banking Centre” to effectively expand its service radius and efficiency of outlets. The cumulative number of users who followed the account reached 10 million. At the same time, the transaction volume of “CCB Doorstep Service” exceeded 7.9 million, and the cumulative number of users using the order service exceeded 1.68 million. 78 products were offered through “online order, centralised processing, physical distribution and doorstep service”.
The Bank expanded the scope of financial services. It incorporated government affairs services into the standard service system of outlets and turned its outlets into “government affairs service lobbies for the public”. By the end of June, all 37 domestic tier-one branches of the Bank provided smart government affairs services covering 19 areas, such as tax, social security, education and transportation. The Bank opened 14,100 “Workers’ Harbours” to the public, served more than 161 million people times and had more than 11.67 million registered online users. The Bank broke industrial barriers and focused on the fields of people’s livelihood. It cooperated with 1,065 third-party organisations, including the Party and government organisations, labour unions, enterprises and institutions, and vigorously expanded the service functions of “Workers’ Harbours” in Party building, elderly care, low carbon initiative, poverty alleviation, justice and other aspects. The Bank deeply explored high-frequency daily life service scenarios, introduced featured merchants around the outlets, leveraged the local life service platform it built, and empowered outlets to be operated in the community ecosystem. Online and offline collaborative integration enabled customers to enjoy more comprehensive services in the integrated scenario of “Finance + Life + Social Networking”.
E-channelsThe Bank accelerated the pace of digital transformation of online financial services, and pressed ahead with the data-driven decision-making management, the agile adjustment of business mechanism, the intelligent restructuring of business model, the collaborative construction of ecosystem and the technology-enabled risk prevention and control, to further promote the high-quality development of online financial business.
Mobile finance
Personal mobile banking application version 5.0 was officially released, which used the cutting-edge FinTech to innovate the functions of intelligent voice, intelligent search and intelligent recommendation, so as to provide customers with new visual experience and share higher quality intelligent mobile financial services. Corporate mobile banking focused on corporate customers, innovatively launched professional service platforms such as “mobile operation platform for custody services”, and continuously optimised the cross-customer services process of money transfer and agency business, to improve user experience. At the end of June, the number of personal online banking users rose to 403 million, an increase of 14,913,500 or 3.84% from the end of 2020; the monthly average number of active users of personal mobile banking was 142 million; and the number of transactions was 26.51 billion, amounting to RMB47.15 trillion. The number of corporate mobile banking users reached 2,510.3 thousand, an increase of 341 thousand or 15.72% from the end of 2020, and the number of transactions was 8,604.1 thousand, amounting to RMB975.1 billion. The number of users who followed the Bank’s WeChat account reached 128 million, an increase of 8,273.5 thousand or 6.92% from the end of 2020. The number of users who linked their bank cards with their WeChat accounts reached 104 million, an increase of 9,153.3 thousand or 9.70% from the end of 2020, and the number of SMS financial service users reached 503 million, an increase of 9 million or 1.89% from the end of 2020.
40 China Construction Bank Corporation Half-Year Report 2021
3 Management Discussion and Analysis
Online banking
CCB’s personal online banking introduced new features such as recommendation of selected WMPs, application for prepayment of personal loans, and security lock for savings account. Corporate online banking continuously promoted product upgrading, optimised customer experience, and strived to build an intelligent and collaborative comprehensive service platform. The size of customers and transactions continued to grow. Visits to the Bank’s international website hit a record high with more customers attracted. At the end of June, the number of personal online banking users was 383 million, an increase of 11,263.4 thousand or 3.03% from the end of 2020; the number of active users was 5,489.2 thousand; and the number of transactions was 2,603 million, amounting to RMB9.03 trillion. The number of corporate online banking users rose to 10,802.8 thousand, an increase of 514.1 thousand or 5.00% from the end of 2020; the number of active users was 3,797.8 thousand; and the number of transactions was 924 million, amounting to RMB133.17 trillion. The average daily page views of the international website reached 142 million, with the number of average daily unique visitors of 16,754 thousand. The highest one-day page views reached 267 million, and the total number of registered members of international websites reached 97,143.5 thousand.
Online payment
The Bank continued to strengthen its online payment services, promoted product innovation to support the growth of new types of consumption, and facilitated the domestic circulation of consumption. At the end of June, the number of online payment transactions was 23,339 million, amounting to RMB10.71 trillion. Specifically, the transaction volume of the aggregated payment service amounted to RMB949,437 million, an increase of 60.96% as compared to the same period last year, and the number of merchants that used the Bank’s aggregated payment service was 2,428.9 thousand. The Bank outperformed its peers in terms of the proportion of transactions with leading Internet institutions such as Alipay, JD, Meituan and Tik Tok in China.
E.ccb.com
The Bank focused on the industrial chain and used “Shanfutong” to provide financial and non-financial comprehensive services such as payment and settlement, order management, and information sharing for leading agricultural enterprises of industrialisation and other agricultural operators. It proactively built the agricultural industrial chain model of “Shanfutong + Mall + Enterprise of agricultural industrialisation + Dealer + Farmer”, which covers many links such as supply of agricultural resources, agricultural production, and processing and sales of agricultural products, to promote the co-existence, win-win cooperation and mutual benefit of operators at each node of the agricultural industrial chain. By the end of June, the Bank completed RMB6,911 million consumption-assisted poverty alleviation transactions via e.ccb.com. Shanfutong had attracted 11,800 core members and 1,155 active business circles, covering more than 150 thousand upstream and downstream active customers, with a transaction volume of RMB63,217 million.
Remote intelligent banking
The Bank enhanced the application of FinTech and refined management. It continuously provided high-quality and efficient remote financial services for customers through multimedia, multiple scenarios, and various service functions. The Bank also deepened its application of AI robots in many fields, such as voice navigation, consulting services, customer marketing, and loan collection. In the first half of 2021, the Bank served a total of 860 million customers across all channels, and 94.07% of manual inquiries were successfully connected to customer service representatives. Its WeChat official account “CCB Customer Service” served 9.11 million customers and the cumulative number of followers exceeded 10 million.
3.2.9 Digitalised Operation and Product Innovation
Digitalised operationThe Group actively practiced the New Finance concept, adhered to the basic logic of “building ecosystems, setting up scenarios and expanding user base”, and coordinated and established working mechanisms for digitalised operation, to steadily promote digitalised operation on a regular basis. The Group focused on digitalisation in key areas, such as the “Three Major Strategies”, rural revitalisation, and smart government affairs, to improve the capacity of digitalised operation and duplicate and share advanced experience. The Group accelerated the building of three major middle offices in terms of business, data and technology, and finalised the building scheme for the “3+1” Competence Centres of business middle office, which takes users, merchants, rights and interests, and payment as the core. The Group set up a cross-service line and cross-department flexible team to consolidate the talent pool for digitalised operation and continued to improve the overall awareness and ability to carry out digitalised operation leveraging scenario-based platforms.
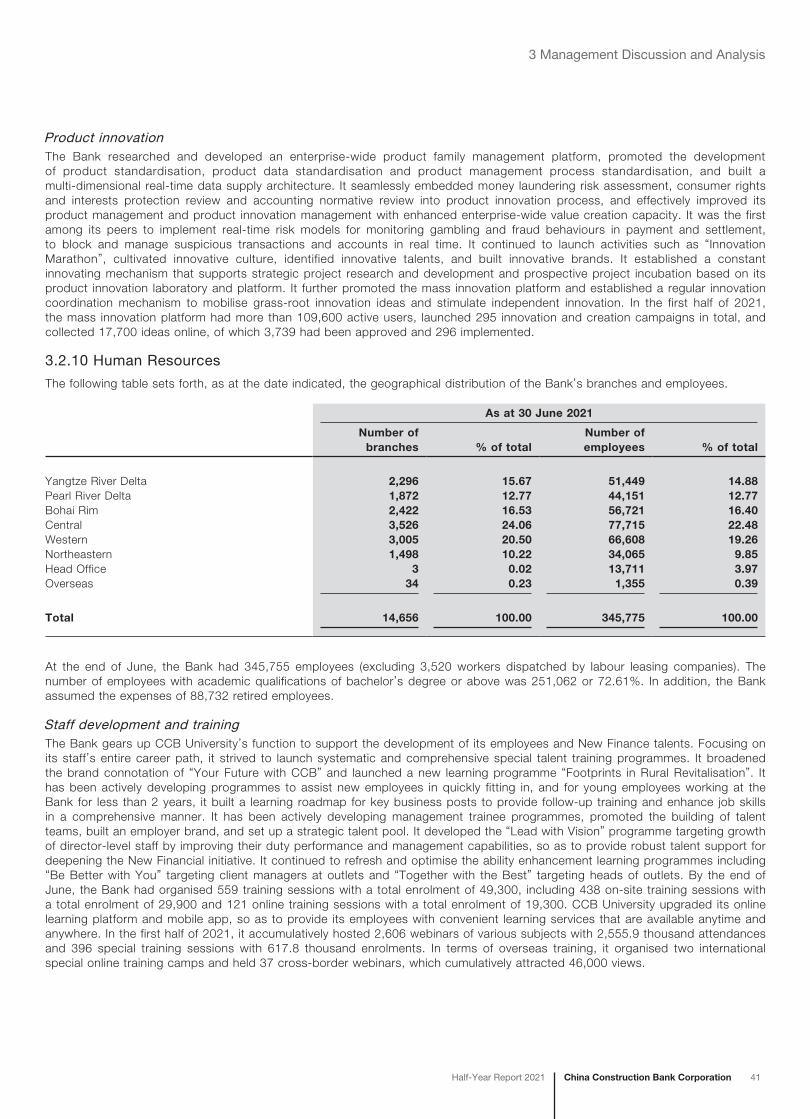
China Construction Bank CorporationHalf-Year Report 2021 41
3 Management Discussion and Analysis
Product innovationThe Bank researched and developed an enterprise-wide product family management platform, promoted the development of product standardisation, product data standardisation and product management process standardisation, and built a multi-dimensional real-time data supply architecture. It seamlessly embedded money laundering risk assessment, consumer rights and interests protection review and accounting normative review into product innovation process, and effectively improved its product management and product innovation management with enhanced enterprise-wide value creation capacity. It was the first among its peers to implement real-time risk models for monitoring gambling and fraud behaviours in payment and settlement, to block and manage suspicious transactions and accounts in real time. It continued to launch activities such as “Innovation Marathon”, cultivated innovative culture, identified innovative talents, and built innovative brands. It established a constant innovating mechanism that supports strategic project research and development and prospective project incubation based on its product innovation laboratory and platform. It further promoted the mass innovation platform and established a regular innovation coordination mechanism to mobilise grass-root innovation ideas and stimulate independent innovation. In the first half of 2021, the mass innovation platform had more than 109,600 active users, launched 295 innovation and creation campaigns in total, and collected 17,700 ideas online, of which 3,739 had been approved and 296 implemented.
3.2.10 Human Resources
The following table sets forth, as at the date indicated, the geographical distribution of the Bank’s branches and employees.
As at 30 June 2021
Number ofbranches % of total
Number ofemployees % of total
Yangtze River Delta 2,296 15.67 51,449 14.88Pearl River Delta 1,872 12.77 44,151 12.77Bohai Rim 2,422 16.53 56,721 16.40Central 3,526 24.06 77,715 22.48Western 3,005 20.50 66,608 19.26Northeastern 1,498 10.22 34,065 9.85Head Office 3 0.02 13,711 3.97Overseas 34 0.23 1,355 0.39
Total 14,656 100.00 345,775 100.00
At the end of June, the Bank had 345,755 employees (excluding 3,520 workers dispatched by labour leasing companies). The number of employees with academic qualifications of bachelor’s degree or above was 251,062 or 72.61%. In addition, the Bank assumed the expenses of 88,732 retired employees.
Staff development and trainingThe Bank gears up CCB University’s function to support the development of its employees and New Finance talents. Focusing on its staff’s entire career path, it strived to launch systematic and comprehensive special talent training programmes. It broadened the brand connotation of “Your Future with CCB” and launched a new learning programme “Footprints in Rural Revitalisation”. It has been actively developing programmes to assist new employees in quickly fitting in, and for young employees working at the Bank for less than 2 years, it built a learning roadmap for key business posts to provide follow-up training and enhance job skills in a comprehensive manner. It has been actively developing management trainee programmes, promoted the building of talent teams, built an employer brand, and set up a strategic talent pool. It developed the “Lead with Vision” programme targeting growth of director-level staff by improving their duty performance and management capabilities, so as to provide robust talent support for deepening the New Financial initiative. It continued to refresh and optimise the ability enhancement learning programmes including “Be Better with You” targeting client managers at outlets and “Together with the Best” targeting heads of outlets. By the end of June, the Bank had organised 559 training sessions with a total enrolment of 49,300, including 438 on-site training sessions with a total enrolment of 29,900 and 121 online training sessions with a total enrolment of 19,300. CCB University upgraded its online learning platform and mobile app, so as to provide its employees with convenient learning services that are available anytime and anywhere. In the first half of 2021, it accumulatively hosted 2,606 webinars of various subjects with 2,555.9 thousand attendances and 396 special training sessions with 617.8 thousand enrolments. In terms of overseas training, it organised two international special online training camps and held 37 cross-border webinars, which cumulatively attracted 46,000 views.
42 China Construction Bank Corporation Half-Year Report 2021
3 Management Discussion and Analysis
Staff in subsidiariesAt the end of June, the subsidiaries of the Bank had 24,318 employees (excluding 546 workers dispatched by labour leasing companies). Specifically, the domestic and overseas employees numbered 19,447 and 4,871 respectively. In addition, the subsidiaries assumed the expenses of 88 retired employees.
3.3 Risk Management
In the first half of 2021, the Group constantly improved its comprehensive, proactive, intelligent and modern risk management system and promoted high-quality development of New Finance practices. It continuously optimised risk control approaches such as risk appetite, risk evaluation, risk assessment, credit policy and risk limits, enriched the “toolkit” for digital and intelligent risk management, and strengthened forward-looking and proactive risk control. The Group also deepened the research on features of new risks, and explored climate risk stress testing. It strengthened risk resolution and disposal in key areas, promoted risk information sharing between parent and subsidiaries and between domestic and overseas entities, and accelerated the full implementation of Basel III.
3.3.1 Credit Risk Management
In the first half of 2021, the Group strengthened macroeconomic trend analysis, enhanced strategic support capabilities, vigorously developed green finance, and focused on achieving goals of carbon peak and carbon neutrality. It continued to optimise credit structure, improved its capability in supporting the real economy and strengthened fundamental management, to safeguard the bottom line of wiping out risks and maintain stable asset quality.
The Group constantly optimised its credit structure. It implemented differentiated credit policies and arrangements, supported the development of house rental business, ensured the provision of inclusive loans, accelerated the fostering of new advantages in green finance, promoted the high-quality development of the manufacturing industry, reinforced advantages in infrastructure sectors, strictly controlled credit to high energy consumption and high emission projects, and tightened the concentration management of real estate loans.
The Group improved its fundamental management efficiency. It strengthened the use of FinTech in key steps of credit process, improved the overall credit risk monitoring, enhanced the credit customer selection and whole-process refined management, realised the unified collection from retail customers and carried out intelligent management and control over collaterals.
The Group strengthened its credit approval risk management and control. It strictly implemented its credit approval strategy, strengthened risk control in key areas, and further optimised credit structure. It advanced the development of a decision-making support system to meet the requirements of process automation, intelligent approval and digitalised management. It adhered to dynamic authorisation adjustments, continuously improved the quality and efficiency of credit approval, and improved its capability in strategic services. It implemented the “environmental protection veto policy”, adopted differentiated processes for projects that meet green credit standards, and advanced the green transformation of asset compositions.
The Group enhanced its risk measurement capabilities. It fully took into account new economic situations and upgraded the LGD model to objectively reflect the level of losses based on characteristics of loan write-offs and disposals by the Group in recent years. It promoted credit enhancement based on exclusive evaluation of sci-tech innovation enterprises and optimised its credit structure. It promoted the risk model development and toolkit construction for inclusive finance and rural financial businesses. What’s more, it expanded the coverage of risk control systems such as risk scan and alert to various key areas, institutions and products, to improve the quality and efficiency of risk management and control.
The Group intensified its disposal capacity for non-performing assets. It proactively responded to changes in external landscape and made full use of the mechanism of creditors’ committee and means such as debt restructuring and market-oriented debt-to-equity swaps, to reduce corporate leverage ratio. It took multiple measures to intensify NPL disposals, and steadily enhanced its operation, disposal and value creation capacity for non-performing assets.
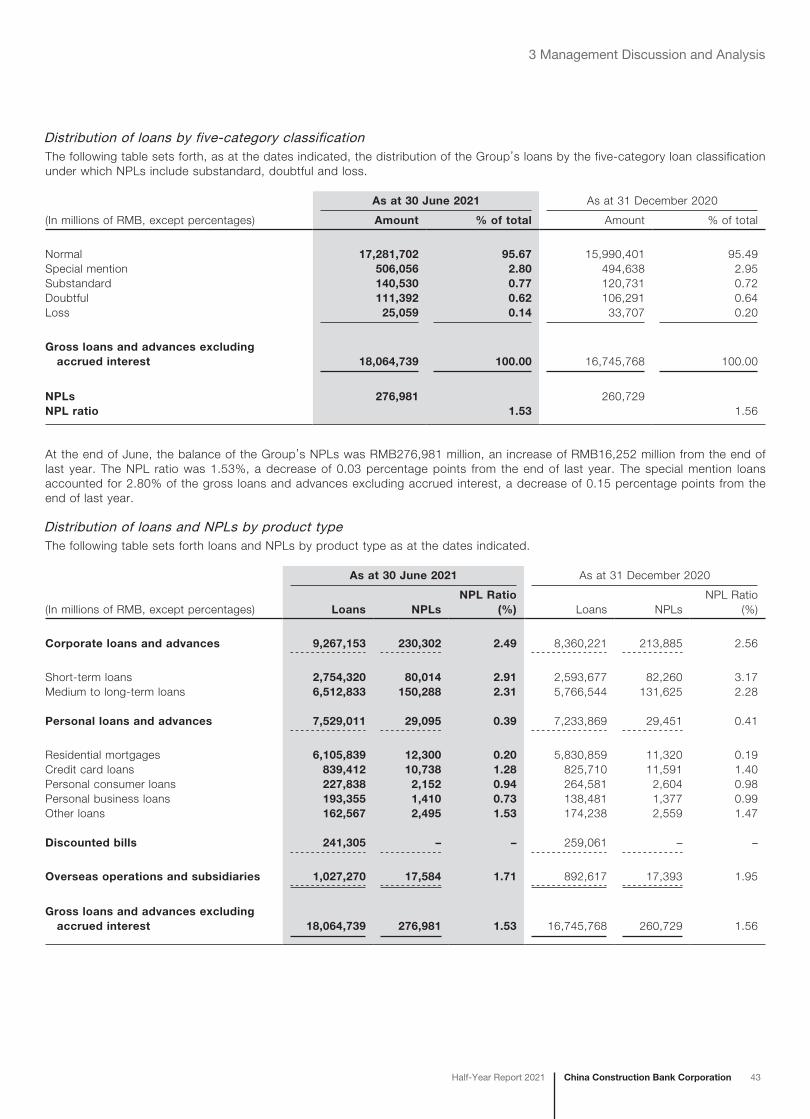
China Construction Bank CorporationHalf-Year Report 2021 43
3 Management Discussion and Analysis
Distribution of loans by five-category classificationThe following table sets forth, as at the dates indicated, the distribution of the Group’s loans by the five-category loan classification under which NPLs include substandard, doubtful and loss.
As at 30 June 2021 As at 31 December 2020
(In millions of RMB, except percentages) Amount % of total Amount % of total
Normal 17,281,702 95.67 15,990,401 95.49Special mention 506,056 2.80 494,638 2.95Substandard 140,530 0.77 120,731 0.72Doubtful 111,392 0.62 106,291 0.64Loss 25,059 0.14 33,707 0.20
Gross loans and advances excluding accrued interest 18,064,739 100.00 16,745,768 100.00
NPLs 276,981 260,729NPL ratio 1.53 1.56
At the end of June, the balance of the Group’s NPLs was RMB276,981 million, an increase of RMB16,252 million from the end of last year. The NPL ratio was 1.53%, a decrease of 0.03 percentage points from the end of last year. The special mention loans accounted for 2.80% of the gross loans and advances excluding accrued interest, a decrease of 0.15 percentage points from the end of last year.
Distribution of loans and NPLs by product typeThe following table sets forth loans and NPLs by product type as at the dates indicated.
As at 30 June 2021 As at 31 December 2020
(In millions of RMB, except percentages) Loans NPLsNPL Ratio
(%) Loans NPLsNPL Ratio
(%)
Corporate loans and advances 9,267,153 230,302 2.49 8,360,221 213,885 2.56
Short-term loans 2,754,320 80,014 2.91 2,593,677 82,260 3.17Medium to long-term loans 6,512,833 150,288 2.31 5,766,544 131,625 2.28
Personal loans and advances 7,529,011 29,095 0.39 7,233,869 29,451 0.41
Residential mortgages 6,105,839 12,300 0.20 5,830,859 11,320 0.19Credit card loans 839,412 10,738 1.28 825,710 11,591 1.40Personal consumer loans 227,838 2,152 0.94 264,581 2,604 0.98Personal business loans 193,355 1,410 0.73 138,481 1,377 0.99Other loans 162,567 2,495 1.53 174,238 2,559 1.47
Discounted bills 241,305 – – 259,061 – –
Overseas operations and subsidiaries 1,027,270 17,584 1.71 892,617 17,393 1.95
Gross loans and advances excluding accrued interest 18,064,739 276,981 1.53 16,745,768 260,729 1.56
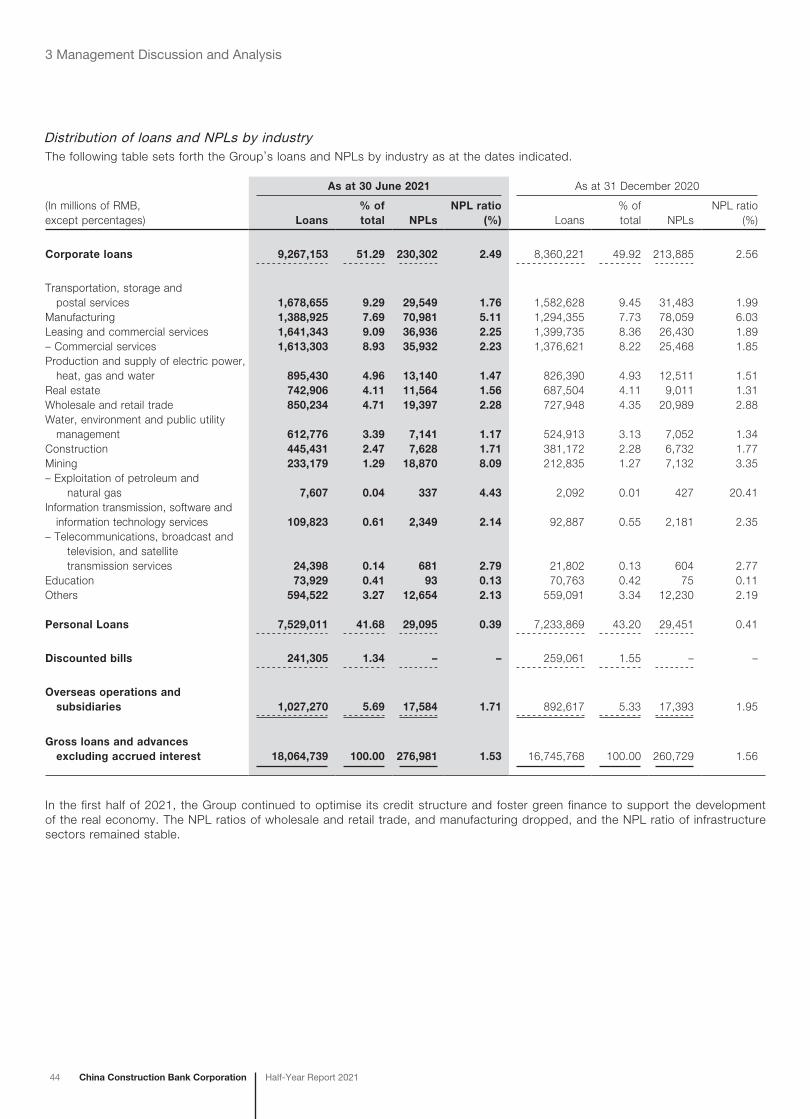
44 China Construction Bank Corporation Half-Year Report 2021
3 Management Discussion and Analysis
Distribution of loans and NPLs by industryThe following table sets forth the Group’s loans and NPLs by industry as at the dates indicated.
As at 30 June 2021 As at 31 December 2020
(In millions of RMB, except percentages) Loans
% of total NPLs
NPL ratio (%) Loans
% of total NPLs
NPL ratio (%)
Corporate loans 9,267,153 51.29 230,302 2.49 8,360,221 49.92 213,885 2.56
Transportation, storage and postal services 1,678,655 9.29 29,549 1.76 1,582,628 9.45 31,483 1.99Manufacturing 1,388,925 7.69 70,981 5.11 1,294,355 7.73 78,059 6.03Leasing and commercial services 1,641,343 9.09 36,936 2.25 1,399,735 8.36 26,430 1.89– Commercial services 1,613,303 8.93 35,932 2.23 1,376,621 8.22 25,468 1.85Production and supply of electric power, heat, gas and water 895,430 4.96 13,140 1.47 826,390 4.93 12,511 1.51Real estate 742,906 4.11 11,564 1.56 687,504 4.11 9,011 1.31Wholesale and retail trade 850,234 4.71 19,397 2.28 727,948 4.35 20,989 2.88Water, environment and public utility management 612,776 3.39 7,141 1.17 524,913 3.13 7,052 1.34Construction 445,431 2.47 7,628 1.71 381,172 2.28 6,732 1.77Mining 233,179 1.29 18,870 8.09 212,835 1.27 7,132 3.35– Exploitation of petroleum and natural gas 7,607 0.04 337 4.43 2,092 0.01 427 20.41Information transmission, software and information technology services 109,823 0.61 2,349 2.14 92,887 0.55 2,181 2.35– Telecommunications, broadcast and television, and satellite transmission services 24,398 0.14 681 2.79 21,802 0.13 604 2.77Education 73,929 0.41 93 0.13 70,763 0.42 75 0.11Others 594,522 3.27 12,654 2.13 559,091 3.34 12,230 2.19
Personal Loans 7,529,011 41.68 29,095 0.39 7,233,869 43.20 29,451 0.41
Discounted bills 241,305 1.34 – – 259,061 1.55 – –
Overseas operations and subsidiaries 1,027,270 5.69 17,584 1.71 892,617 5.33 17,393 1.95
Gross loans and advances excluding accrued interest 18,064,739 100.00 276,981 1.53 16,745,768 100.00 260,729 1.56
In the first half of 2021, the Group continued to optimise its credit structure and foster green finance to support the development of the real economy. The NPL ratios of wholesale and retail trade, and manufacturing dropped, and the NPL ratio of infrastructure sectors remained stable.
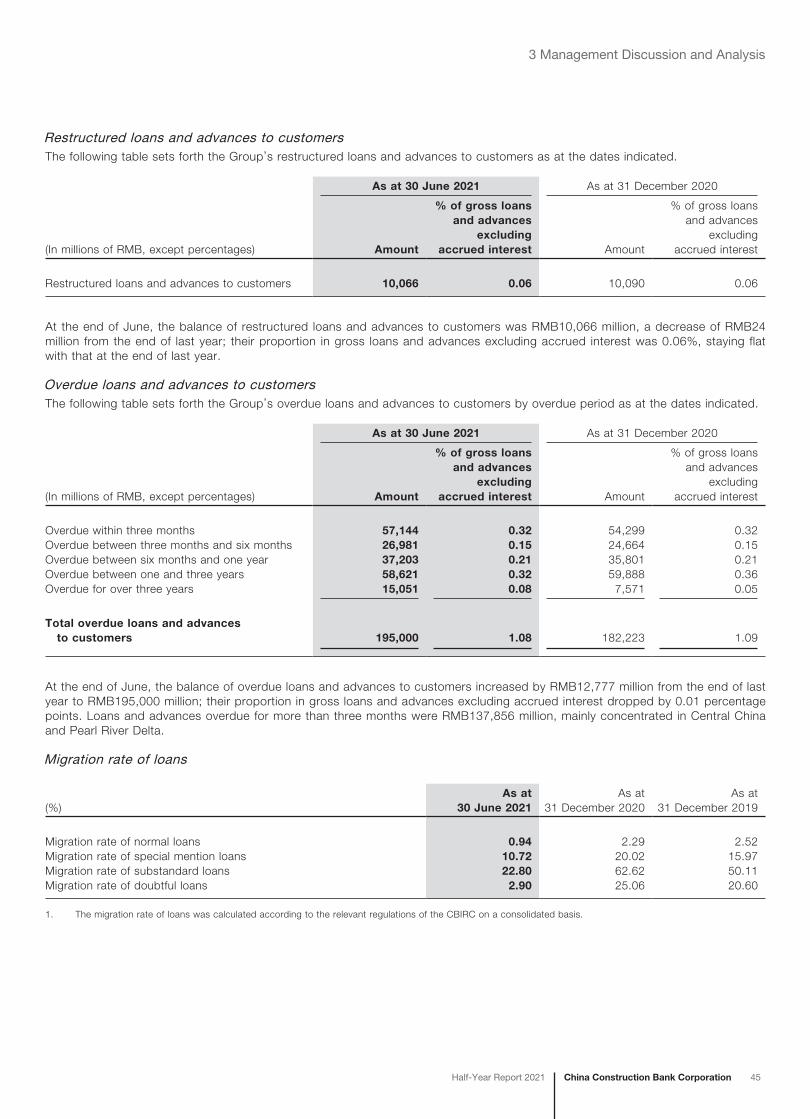
China Construction Bank CorporationHalf-Year Report 2021 45
3 Management Discussion and Analysis
Restructured loans and advances to customersThe following table sets forth the Group’s restructured loans and advances to customers as at the dates indicated.
As at 30 June 2021 As at 31 December 2020
(In millions of RMB, except percentages) Amount
% of gross loans and advances
excluding accrued interest Amount
% of gross loans and advances
excluding accrued interest
Restructured loans and advances to customers 10,066 0.06 10,090 0.06
At the end of June, the balance of restructured loans and advances to customers was RMB10,066 million, a decrease of RMB24 million from the end of last year; their proportion in gross loans and advances excluding accrued interest was 0.06%, staying flat with that at the end of last year.
Overdue loans and advances to customersThe following table sets forth the Group’s overdue loans and advances to customers by overdue period as at the dates indicated.
As at 30 June 2021 As at 31 December 2020
(In millions of RMB, except percentages) Amount
% of gross loans and advances
excluding accrued interest Amount
% of gross loans and advances
excluding accrued interest
Overdue within three months 57,144 0.32 54,299 0.32Overdue between three months and six months 26,981 0.15 24,664 0.15Overdue between six months and one year 37,203 0.21 35,801 0.21Overdue between one and three years 58,621 0.32 59,888 0.36Overdue for over three years 15,051 0.08 7,571 0.05
Total overdue loans and advances to customers 195,000 1.08 182,223 1.09
At the end of June, the balance of overdue loans and advances to customers increased by RMB12,777 million from the end of last year to RMB195,000 million; their proportion in gross loans and advances excluding accrued interest dropped by 0.01 percentage points. Loans and advances overdue for more than three months were RMB137,856 million, mainly concentrated in Central China and Pearl River Delta.
Migration rate of loans
(%)As at
30 June 2021As at
31 December 2020As at
31 December 2019
Migration rate of normal loans 0.94 2.29 2.52Migration rate of special mention loans 10.72 20.02 15.97Migration rate of substandard loans 22.80 62.62 50.11Migration rate of doubtful loans 2.90 25.06 20.60
1. The migration rate of loans was calculated according to the relevant regulations of the CBIRC on a consolidated basis.
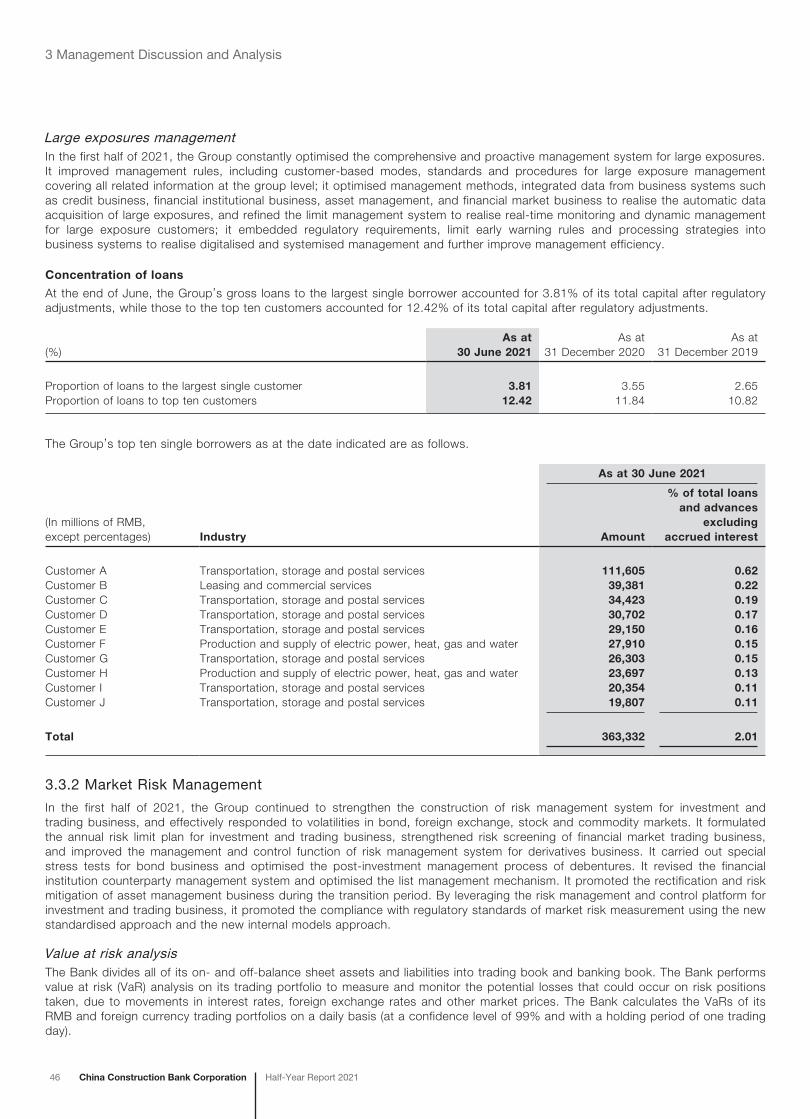
46 China Construction Bank Corporation Half-Year Report 2021
3 Management Discussion and Analysis
Large exposures managementIn the first half of 2021, the Group constantly optimised the comprehensive and proactive management system for large exposures. It improved management rules, including customer-based modes, standards and procedures for large exposure management covering all related information at the group level; it optimised management methods, integrated data from business systems such as credit business, financial institutional business, asset management, and financial market business to realise the automatic data acquisition of large exposures, and refined the limit management system to realise real-time monitoring and dynamic management for large exposure customers; it embedded regulatory requirements, limit early warning rules and processing strategies into business systems to realise digitalised and systemised management and further improve management efficiency.
Concentration of loans
At the end of June, the Group’s gross loans to the largest single borrower accounted for 3.81% of its total capital after regulatory adjustments, while those to the top ten customers accounted for 12.42% of its total capital after regulatory adjustments.
(%)As at
30 June 2021As at
31 December 2020As at
31 December 2019
Proportion of loans to the largest single customer 3.81 3.55 2.65Proportion of loans to top ten customers 12.42 11.84 10.82
The Group’s top ten single borrowers as at the date indicated are as follows.
(In millions of RMB,except percentages)
As at 30 June 2021
Industry Amount
% of total loans and advances
excluding accrued interest
Customer A Transportation, storage and postal services 111,605 0.62Customer B Leasing and commercial services 39,381 0.22Customer C Transportation, storage and postal services 34,423 0.19Customer D Transportation, storage and postal services 30,702 0.17Customer E Transportation, storage and postal services 29,150 0.16Customer F Production and supply of electric power, heat, gas and water 27,910 0.15Customer G Transportation, storage and postal services 26,303 0.15Customer H Production and supply of electric power, heat, gas and water 23,697 0.13Customer I Transportation, storage and postal services 20,354 0.11Customer J Transportation, storage and postal services 19,807 0.11
Total 363,332 2.01
3.3.2 Market Risk Management
In the first half of 2021, the Group continued to strengthen the construction of risk management system for investment and trading business, and effectively responded to volatilities in bond, foreign exchange, stock and commodity markets. It formulated the annual risk limit plan for investment and trading business, strengthened risk screening of financial market trading business, and improved the management and control function of risk management system for derivatives business. It carried out special stress tests for bond business and optimised the post-investment management process of debentures. It revised the financial institution counterparty management system and optimised the list management mechanism. It promoted the rectification and risk mitigation of asset management business during the transition period. By leveraging the risk management and control platform for investment and trading business, it promoted the compliance with regulatory standards of market risk measurement using the new standardised approach and the new internal models approach.
Value at risk analysisThe Bank divides all of its on- and off-balance sheet assets and liabilities into trading book and banking book. The Bank performs value at risk (VaR) analysis on its trading portfolio to measure and monitor the potential losses that could occur on risk positions taken, due to movements in interest rates, foreign exchange rates and other market prices. The Bank calculates the VaRs of its RMB and foreign currency trading portfolios on a daily basis (at a confidence level of 99% and with a holding period of one trading day).
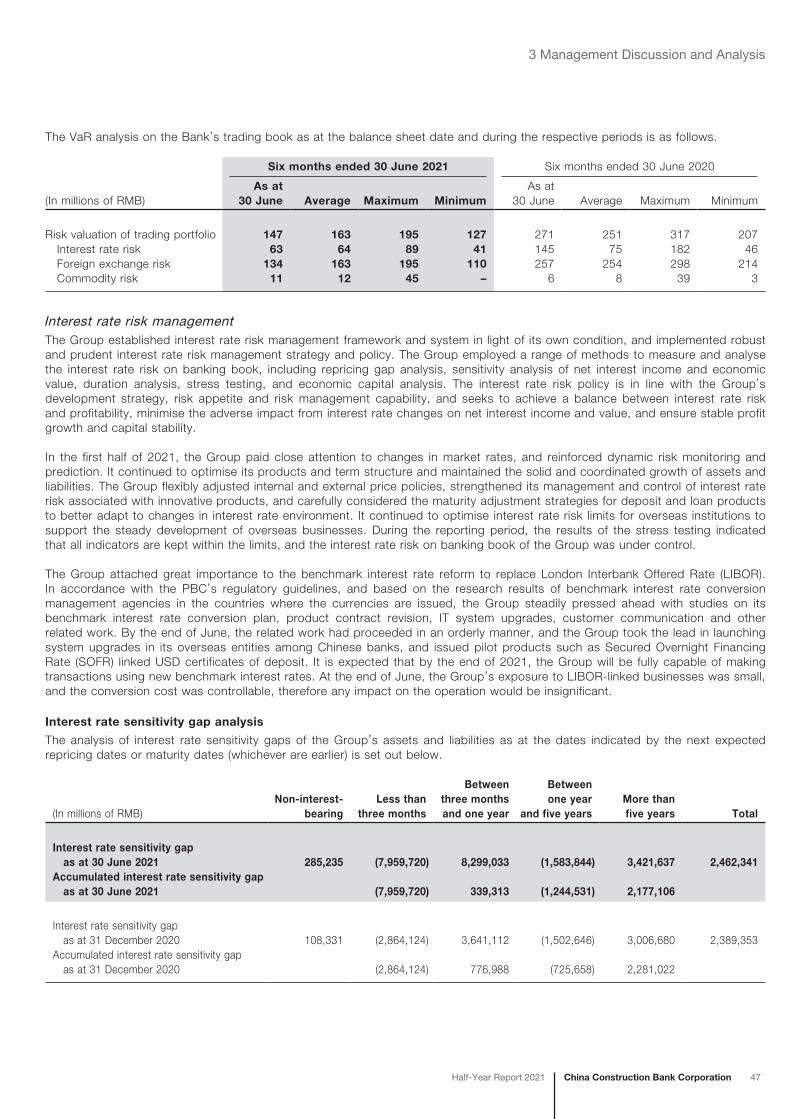
China Construction Bank CorporationHalf-Year Report 2021 47
3 Management Discussion and Analysis
The VaR analysis on the Bank’s trading book as at the balance sheet date and during the respective periods is as follows.
Six months ended 30 June 2021 Six months ended 30 June 2020
(In millions of RMB)As at
30 June Average Maximum MinimumAs at
30 June Average Maximum Minimum
Risk valuation of trading portfolio 147 163 195 127 271 251 317 207 Interest rate risk 63 64 89 41 145 75 182 46 Foreign exchange risk 134 163 195 110 257 254 298 214 Commodity risk 11 12 45 – 6 8 39 3
Interest rate risk managementThe Group established interest rate risk management framework and system in light of its own condition, and implemented robust and prudent interest rate risk management strategy and policy. The Group employed a range of methods to measure and analyse the interest rate risk on banking book, including repricing gap analysis, sensitivity analysis of net interest income and economic value, duration analysis, stress testing, and economic capital analysis. The interest rate risk policy is in line with the Group’s development strategy, risk appetite and risk management capability, and seeks to achieve a balance between interest rate risk and profitability, minimise the adverse impact from interest rate changes on net interest income and value, and ensure stable profit growth and capital stability.
In the first half of 2021, the Group paid close attention to changes in market rates, and reinforced dynamic risk monitoring and prediction. It continued to optimise its products and term structure and maintained the solid and coordinated growth of assets and liabilities. The Group flexibly adjusted internal and external price policies, strengthened its management and control of interest rate risk associated with innovative products, and carefully considered the maturity adjustment strategies for deposit and loan products to better adapt to changes in interest rate environment. It continued to optimise interest rate risk limits for overseas institutions to support the steady development of overseas businesses. During the reporting period, the results of the stress testing indicated that all indicators are kept within the limits, and the interest rate risk on banking book of the Group was under control.
The Group attached great importance to the benchmark interest rate reform to replace London Interbank Offered Rate (LIBOR). In accordance with the PBC’s regulatory guidelines, and based on the research results of benchmark interest rate conversion management agencies in the countries where the currencies are issued, the Group steadily pressed ahead with studies on its benchmark interest rate conversion plan, product contract revision, IT system upgrades, customer communication and other related work. By the end of June, the related work had proceeded in an orderly manner, and the Group took the lead in launching system upgrades in its overseas entities among Chinese banks, and issued pilot products such as Secured Overnight Financing Rate (SOFR) linked USD certificates of deposit. It is expected that by the end of 2021, the Group will be fully capable of making transactions using new benchmark interest rates. At the end of June, the Group’s exposure to LIBOR-linked businesses was small, and the conversion cost was controllable, therefore any impact on the operation would be insignificant.
Interest rate sensitivity gap analysis
The analysis of interest rate sensitivity gaps of the Group’s assets and liabilities as at the dates indicated by the next expected repricing dates or maturity dates (whichever are earlier) is set out below.
(In millions of RMB)Non-interest-
bearingLess than
three months
Between three months and one year
Between one year
and five yearsMore than five years Total
Interest rate sensitivity gap as at 30 June 2021 285,235 (7,959,720) 8,299,033 (1,583,844) 3,421,637 2,462,341Accumulated interest rate sensitivity gap as at 30 June 2021 (7,959,720) 339,313 (1,244,531) 2,177,106
Interest rate sensitivity gap as at 31 December 2020 108,331 (2,864,124) 3,641,112 (1,502,646) 3,006,680 2,389,353Accumulated interest rate sensitivity gap as at 31 December 2020 (2,864,124) 776,988 (725,658) 2,281,022
48 China Construction Bank Corporation Half-Year Report 2021
3 Management Discussion and Analysis
At the end of June, the repricing gap of the Group’s assets and liabilities with maturities of less than one year was RMB339,313 million, a decrease of RMB437,675 million from the end of last year, primarily because the growth of deposits with maturities of less than one year was faster than that of loans and advances. The positive gap with maturities of more than one year was RMB1,837,793 million, an increase of RMB333,759 million from the end of last year, primarily because the growth of debt investments was faster than that of time deposits with maturities of more than one year.
Net interest income sensitivity analysis
The net interest income sensitivity analysis is based on two scenarios. The first assumes that all yield curves rise or fall by 100 basis points in a parallel way, while the interest rates for deposits at the PBC remain the same; the second assumes that the interest rates for deposits at the PBC and the demand deposits remain the same, while the other yield curves rise or fall by 100 basis points in a parallel way.
The change in net interest income of the Group under different scenarios as at the specified dates is set out below.
Scenario 1: the interest rates for deposits at the PBC being constant
Scenario 2: the interest rates for deposits at the PBC and the demand
deposits being constant
(In millions of RMB)Rise by 100
basis pointsFall by 100
basis pointsRise by 100
basis pointsFall by 100
basis points
As at 30 June 2021 (73,054) 73,054 56,718 (56,718)
As at 31 December 2020 (45,546) 45,546 80,344 (80,344)
Exchange rate risk managementThe Group is exposed to exchange rate risk primarily because of the currency mismatch of assets and liabilities it holds in currencies other than RMB and the positions it takes as a market maker in the financial markets. The Group measures and analyses its exchange rate risk using a combination of methods such as exchange rate risk exposure and stress testing, and controls and mitigates its risk by matching its assets and liabilities, setting limits, and hedging.
In the first half of 2021, the Group adhered to a prudent and sound exchange rate risk management strategy, paid close attention to the changes in global economic situation in the wake of COVID-19, strengthened research on exchange rates of currencies of major economies and emerging markets, and dynamically monitored and analysed changes in the Group’s exchange rate risk exposure. Affected by the need to purchase foreign currencies for distribution of dividends overseas, the Group’s exchange rate risk exposure rose slightly at the end of June, but this was expected to fall after dividend distribution. The stress testing results of exchange rate risk showed that the overall risk was under control, which continued to satisfy regulatory requirements of the CBIRC.
Currency concentrations
The Group’s currency concentrations as at the dates indicated are set out below.
As at 30 June 2021 As at 31 December 2020
(In millions of RMB)USD (RMB equivalent)
HKD (RMB equivalent)
Others (RMB equivalent) Total
USD (RMB equivalent)
HKD (RMB equivalent)
Others (RMB equivalent) Total
Spot assets 1,090,518 331,080 384,169 1,805,767 945,417 352,098 376,645 1,674,160Spot liabilities (1,119,001) (349,831) (281,342) (1,750,174) (1,000,213) (330,942) (290,448) (1,621,603)Forward purchases 1,776,408 146,346 106,669 2,029,423 1,826,299 75,051 137,232 2,038,583Forward sales (1,765,394) (87,199) (188,631) (2,041,224) (1,758,605) (60,684) (203,639) (2,022,928)Net options position 14,778 – (1,163) 13,615 (16,261) (29) (4) (16,294)
Net (short)/long position (2,691) 40,396 19,702 57,407 (3,362) 35,494 19,787 51,919
At the end of June, the Group’s net exposure to exchange rate risk was RMB57,407 million, an increase of RMB5,488 million from the end of last year. The Group’s exchange rate risk exposure rose temporarily mainly due to the purchase of foreign exchange for dividend distribution, and will drop after dividend distribution.
China Construction Bank CorporationHalf-Year Report 2021 49
3 Management Discussion and Analysis
3.3.3 Operational Risk Management
In the first half of 2021, the Group continued to strengthen operational risk management, revised operational risk management policies, improved governance structure, enriched management tools and defined control measures. It improved the management mechanism of financial services in response to emergencies by reference to regulatory requirements.
Anti-money launderingIn the first half of 2021, the Group strictly implemented regulatory requirements, and followed the risk-based management principle to continuously press ahead with AML, counter-terrorist financing and anti-tax evasion. The Bank continued to improve governance structure, policies and systems, actively satisfied performance obligations, took proactive and effective measures and significantly improved the scientific and technological level for risk management. The Group made great progress in intelligent money laundering risk assessment, differentiated management and control of high-risk customers, standardisation of AML data, integration of the Group’s system construction and compliance with sanctions and anti-sanctions policies, to effectively support the development of strategic businesses across the Bank and ensure compliant operation.
3.3.4 Liquidity Risk Management
In the first half of 2021, monetary policies of central banks remained prudent, neutral, flexible, precise, and reasonably moderate. The Group adhered to the principle of robustness and prudence to manage liquidity risk and continued to strengthen liquidity risk expectation management. It appropriately arranged the use of the Group’s funding sources, and ensured the coordinated development of assets and liabilities business. As a result, all related indicators continued to meet the requirements. It strengthened the coordinated liquidity management at the group level, fully improved the refined liquidity risk management, and continued to improve the level of forward-looking and precise fund adjustment and control to ensure the security of the Bank’s payment and settlement.
Stress testing of liquidity riskThe Group conducted quarterly stress testing on its liquidity risk in order to gauge its risk tolerance in unlikely extreme scenarios and other adverse scenarios. It kept improving its liquidity risk stress testing methods in accordance with regulatory and internal management requirements. The results of stress testing showed that under different stress scenarios, the Group’s liquidity risk was under control.
Indicators of liquidity risk managementThe Group adopted liquidity indicator analysis, remaining maturity analysis and undiscounted cash flow analysis to measure the liquidity risk.
The following table sets forth the liquidity ratios and loan-to-deposit ratio of the Group as at the dates indicated.
(%)Regulatory
standard
As at 30 June
2021
As at 31 December
2020
As at 31 December
2019
Liquidity ratio1 RMB ≥25 55.13 55.66 51.87Foreign currency ≥25 66.32 58.64 68.29
Loan-to-deposit ratio2 RMB 77.83 78.49 77.68
1. Calculated by dividing current assets by current liabilities in accordance with the requirements of the CBIRC.2. Calculated on the basis of domestic legal person in accordance with the requirements of the CBIRC.
In accordance with the requirements of the Administrative Measures for Liquidity Risk Management of Commercial Banks , the liquidity coverage ratio of a commercial bank is the high-quality liquid assets divided by net cash outflows in the future 30 days. High-quality liquid assets of the Group mainly include securities guaranteed or issued by sovereign states and central banks with a risk weight of zero or 20%, and central bank reserves that may be used under stress circumstances. The average daily liquidity coverage ratio of the Group for the second quarter of 2021 was 134.20%, meeting the regulatory requirements. It decreased by 14.58 percentage points from the previous quarter, mainly due to the increase in net cash outflow following the decrease in secured lending (including reverse repos and securities borrowing).
50 China Construction Bank Corporation Half-Year Report 2021
3 Management Discussion and Analysis
The following table sets forth the liquidity coverage ratio of the Group as at the dates indicated.
(In millions of RMB, except percentages)Second quarter
2021First quarter
2021Fourth quarter
2020
High-quality liquid assets 4,696,566 4,667,230 4,719,927Net cash outflows 3,502,773 3,151,858 2,981,377Liquidity coverage ratio (%)1 134.20 148.78 158.53
1. Calculated in accordance with the applicable regulatory requirements, definitions and accounting standards for the period. All figures represent simple arithmetic means of the values for every calendar day in the quarter.
Net stable funding ratio (NSFR) is the available stable funding divided by required stable funding. NSFR is used to evaluate whether commercial banks have sufficient and stable funding sources to meet the needs of various assets and off-balance sheet risk exposures. According to the applicable regulatory requirements, definitions and accounting standards for the period, at the end of June 2021, the Group’s NSFR was 123.55%, meeting the regulatory requirements. It dropped by 2.01 percentage points from the end of March, and 3.60 percentage points from the end of 2020, mainly due to the increase in the required stable funding from the increase of performing loans and securities.
The following table sets forth the NSFR of the Group as at the dates indicated.
(In millions of RMB, except percentages)As at
30 June 2021As at
31 March 2021As at
31 December 2020
Available stable funding 20,748,109 20,724,535 19,727,180Required stable funding 16,793,067 16,505,566 15,515,100NSFR (%) 123.55 125.56 127.15
Please refer to “Unaudited Supplementary Financial Information” for more details of liquidity coverage ratio and net stable funding ratio.
The analysis of the Group’s assets and liabilities by remaining maturity as at the dates indicated is set out below.
(In millions of RMB) IndefiniteRepayable
on demandWithin
one month
Between one and
three months
Between three months and one year
Between one and
five yearsMore than five years Total
Net gaps as at 30 June 2021 3,038,753 (11,940,841) (344,709) (541,047) (641,726) 2,271,834 10,620,077 2,462,341
Net gaps as at 31 December 2020 2,959,627 (11,562,623) (491,243) (131,281) (362,539) 2,061,094 9,916,318 2,389,353
The Group regularly monitored the maturity gaps between its assets and liabilities for various businesses in order to assess its liquidity risk in different time periods. At the end of June, the cumulative maturity gap of the Group was RMB2.46 trillion, an increase of RMB72,988 million over the end of 2020. The negative gap for repayment on demand was RMB11.94 trillion, an increase of RMB378,218 million over the end of 2020, mainly due to the Group’s relatively fast growth of deposits with the expansive customer base. Considering the low turnover rate of the Group’s demand deposits and steady growth of deposits, the Group expects to enjoy a steady source of funding and maintain stable liquidity in the future.
3.3.5 Reputational Risk Management
The Group conscientiously implemented regulatory requirements for reputational risk, continued to improve the reputational risk management system and mechanism, and strengthened the consolidated management of reputational risk. It consistently adhered to the forward-looking, comprehensive, proactive and effective management principle, focused on identifying and issuing early warning for potential reputational risk factors, and strengthened daily public opinions monitoring. It continued to provide training to address reputational risk and public opinions, strengthened the reputational risk awareness of all employees, improved capability in public opinion response to build a defence line against reputational risks.
China Construction Bank CorporationHalf-Year Report 2021 51
3 Management Discussion and Analysis
3.3.6 Country Risk Management
In the first half of 2021, in the context of increasingly complex international political and economic situation, the Group continued to strengthen centralised country risk management at the group level. It closely monitored changes in country risk exposures, dynamically rechecked country risk ratings and limits, and conducted country risk monitoring and warning. It upgraded the country risk management system and enhanced the management of risk identification, measurement, monitoring, control and reporting. The Group’s country risk exposure was mainly concentrated in countries or regions with “low” or “relatively low” country risk, and the overall country risk was maintained at a reasonable level.
3.3.7 Consolidated Management
In the first half of 2021, the Bank continuously enhanced consolidated management and reinforced various aspects of the Group’s consolidated management, including business collaboration, corporate governance, risk management and capital management. It strengthened the strategic management of subsidiaries and deepened the building of the parent-subsidiary coordination system. It optimised the corporate governance mechanism of its subsidiaries and clarified that the board of subsidiaries was responsible for risk management. It continued to optimise the consolidated management system and improved the automation level of consolidated management.
3.3.8 Internal Audit
The Internal Audit Department is committed to evaluating and supervising the improvement of risk management, control and governance processes, promoting value creation and improving business operation. It continued to improve its audit mechanisms to cover all relevant aspects, highlight key areas, coordinate the overall business with priorities and agility, and tackle similar problems in other areas with a typical audit finding, and covered auditable units of all business segments with its audit procedures. In the first half of 2021, audit procedures were performed on credit business for large- and medium-sized customers, special assets resolution, loans to small businesses, key liability products and services, private banking, foreign exchange, credit cards, major channel operation, operational risk management, key financial matters management, important compliance matter management and other business areas. Meanwhile, it pushed relevant departments and branches to continuously improve their management mechanisms, business processes and internal management, to effectively promote the stable and healthy development of the Bank’s operations and management.
3.4 Capital Management
The Group adheres to its steady and prudent capital management strategy. It strengthens capital constraints and incentives and promotes intensive capital management to continuously enhance the efficiency of capital use. The Group relies both on internal capital accumulation and external capital replenishment, and maintains capital adequacy ratios that are constantly above the regulatory requirements with a proper safety margin and buffer zone.
In the first half of 2021, the Group gave full play to the role of capital in supporting the development of various businesses, reinforced the capital-centred planning evaluation mechanism, and strived to maintain the reasonable growth and optimise the structure of total risk-weighted assets. It further implemented intensive capital management measures, and improved the efficiency of capital use. It also actively prepared for the implementation of the final set of Basel Ⅲ rules across the Bank.
3.4.1 Capital Adequacy Ratios
Capital adequacy ratiosIn accordance with regulatory requirements, the scope for calculating capital adequacy ratios of the Group includes the Bank’s domestic and overseas branches and sub-branches, as well as financial subsidiaries (insurance companies excluded). At the end of June, under the rules during the parallel period, the Group’s total capital ratio, Tier 1 ratio and Common Equity Tier 1 ratio, which had been calculated in accordance with the Capital Rules for Commercial Banks (Provisional) , were 16.58%, 13.80% and 13.23%, respectively, all in compliance with regulatory requirements. They decreased by 0.48, 0.42 and 0.39 percentage points, respectively, from 31 December 2020, mainly due to the rapid growth of total risk-weighted assets to support the development of the real economy and key areas, and the slowdown in accumulation of internal capital following dividend distribution.
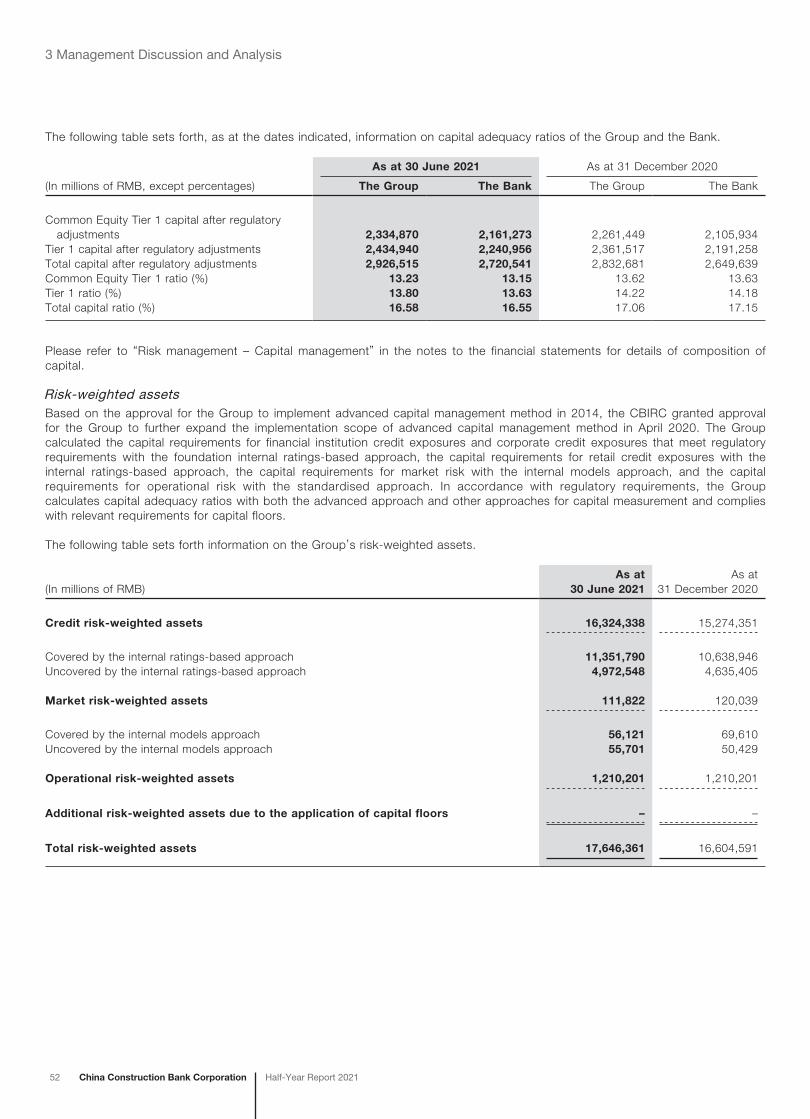
52 China Construction Bank Corporation Half-Year Report 2021
3 Management Discussion and Analysis
The following table sets forth, as at the dates indicated, information on capital adequacy ratios of the Group and the Bank.
As at 30 June 2021 As at 31 December 2020
(In millions of RMB, except percentages) The Group The Bank The Group The Bank
Common Equity Tier 1 capital after regulatory adjustments 2,334,870 2,161,273 2,261,449 2,105,934Tier 1 capital after regulatory adjustments 2,434,940 2,240,956 2,361,517 2,191,258Total capital after regulatory adjustments 2,926,515 2,720,541 2,832,681 2,649,639Common Equity Tier 1 ratio (%) 13.23 13.15 13.62 13.63Tier 1 ratio (%) 13.80 13.63 14.22 14.18Total capital ratio (%) 16.58 16.55 17.06 17.15
Please refer to “Risk management – Capital management” in the notes to the financial statements for details of composition of capital.
Risk-weighted assetsBased on the approval for the Group to implement advanced capital management method in 2014, the CBIRC granted approval for the Group to further expand the implementation scope of advanced capital management method in April 2020. The Group calculated the capital requirements for financial institution credit exposures and corporate credit exposures that meet regulatory requirements with the foundation internal ratings-based approach, the capital requirements for retail credit exposures with the internal ratings-based approach, the capital requirements for market risk with the internal models approach, and the capital requirements for operational risk with the standardised approach. In accordance with regulatory requirements, the Group calculates capital adequacy ratios with both the advanced approach and other approaches for capital measurement and complies with relevant requirements for capital floors.
The following table sets forth information on the Group’s risk-weighted assets.
(In millions of RMB)As at
30 June 2021As at
31 December 2020
Credit risk-weighted assets 16,324,338 15,274,351
Covered by the internal ratings-based approach 11,351,790 10,638,946Uncovered by the internal ratings-based approach 4,972,548 4,635,405
Market risk-weighted assets 111,822 120,039
Covered by the internal models approach 56,121 69,610Uncovered by the internal models approach 55,701 50,429
Operational risk-weighted assets 1,210,201 1,210,201
Additional risk-weighted assets due to the application of capital floors – –
Total risk-weighted assets 17,646,361 16,604,591
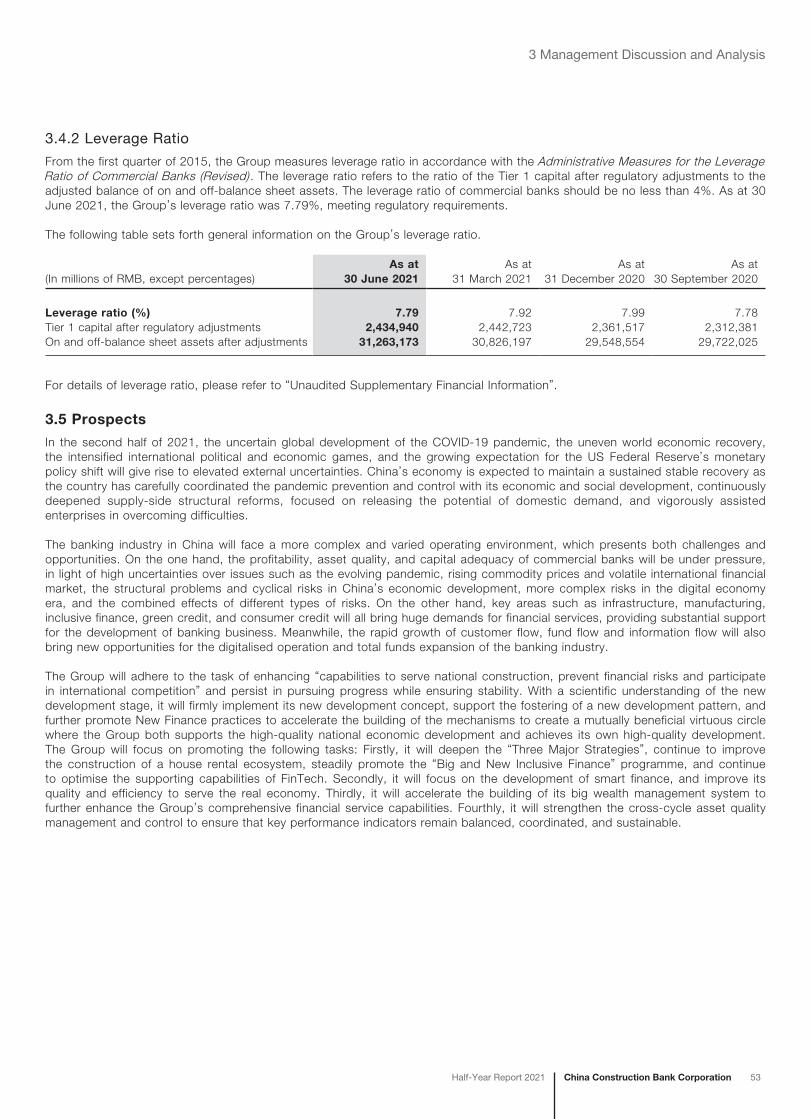
China Construction Bank CorporationHalf-Year Report 2021 53
3 Management Discussion and Analysis
3.4.2 Leverage Ratio
From the first quarter of 2015, the Group measures leverage ratio in accordance with the Administrative Measures for the Leverage Ratio of Commercial Banks (Revised) . The leverage ratio refers to the ratio of the Tier 1 capital after regulatory adjustments to the adjusted balance of on and off-balance sheet assets. The leverage ratio of commercial banks should be no less than 4%. As at 30 June 2021, the Group’s leverage ratio was 7.79%, meeting regulatory requirements.
The following table sets forth general information on the Group’s leverage ratio.
(In millions of RMB, except percentages)As at
30 June 2021As at
31 March 2021As at
31 December 2020As at
30 September 2020
Leverage ratio (%) 7.79 7.92 7.99 7.78Tier 1 capital after regulatory adjustments 2,434,940 2,442,723 2,361,517 2,312,381On and off-balance sheet assets after adjustments 31,263,173 30,826,197 29,548,554 29,722,025
For details of leverage ratio, please refer to “Unaudited Supplementary Financial Information”.
3.5 Prospects
In the second half of 2021, the uncertain global development of the COVID-19 pandemic, the uneven world economic recovery, the intensified international political and economic games, and the growing expectation for the US Federal Reserve’s monetary policy shift will give rise to elevated external uncertainties. China’s economy is expected to maintain a sustained stable recovery as the country has carefully coordinated the pandemic prevention and control with its economic and social development, continuously deepened supply-side structural reforms, focused on releasing the potential of domestic demand, and vigorously assisted enterprises in overcoming difficulties.
The banking industry in China will face a more complex and varied operating environment, which presents both challenges and opportunities. On the one hand, the profitability, asset quality, and capital adequacy of commercial banks will be under pressure, in light of high uncertainties over issues such as the evolving pandemic, rising commodity prices and volatile international financial market, the structural problems and cyclical risks in China’s economic development, more complex risks in the digital economy era, and the combined effects of different types of risks. On the other hand, key areas such as infrastructure, manufacturing, inclusive finance, green credit, and consumer credit will all bring huge demands for financial services, providing substantial support for the development of banking business. Meanwhile, the rapid growth of customer flow, fund flow and information flow will also bring new opportunities for the digitalised operation and total funds expansion of the banking industry.
The Group will adhere to the task of enhancing “capabilities to serve national construction, prevent financial risks and participate in international competition” and persist in pursuing progress while ensuring stability. With a scientific understanding of the new development stage, it will firmly implement its new development concept, support the fostering of a new development pattern, and further promote New Finance practices to accelerate the building of the mechanisms to create a mutually beneficial virtuous circle where the Group both supports the high-quality national economic development and achieves its own high-quality development. The Group will focus on promoting the following tasks: Firstly, it will deepen the “Three Major Strategies”, continue to improve the construction of a house rental ecosystem, steadily promote the “Big and New Inclusive Finance” programme, and continue to optimise the supporting capabilities of FinTech. Secondly, it will focus on the development of smart finance, and improve its quality and efficiency to serve the real economy. Thirdly, it will accelerate the building of its big wealth management system to further enhance the Group’s comprehensive financial service capabilities. Fourthly, it will strengthen the cross-cycle asset quality management and control to ensure that key performance indicators remain balanced, coordinated, and sustainable.
54 China Construction Bank Corporation Half-Year Report 2021
3 Management Discussion and Analysis
Feature Column: Key Topics in Business Development
E-CNY Pilots and Promotion
The Bank was among the first to engage in the development and testing project of the digital fiat currency (i.e., e-CNY), and steadily carried forward the development and pilots of e-CNY under the overall guidance of the PBC. The Bank has iteratively developed CCB e-CNY system and e-CNY wallet system, including modules of personal wallet, corporate wallet, software wallet, hardware wallet, parent wallet and sub-wallet, to effectively provide e-CNY exchange and circulation services. It actively engaged in e-CNY pilots in Shenzhen, Suzhou, Xiong’an and other areas, and created many scenarios such as convenient payment for payrolls, taxes, medical fees and tickets for the use of e-CNY. It innovated application models, and cooperated with e-commerce platforms such as JD.com and e.ccb.com, as well as investment and wealth management institutions such as Tiantian Fund, to enable e-CNY online payment and investment scenarios. It expanded offline scenarios to enable e-CNY payment via near field communication (NFC) and hardware wallets in environment without network coverage. As of the end of June, the Bank has extended the use of e-CNY to various scenarios, including fee payment for utilities, catering services, transportation, shopping, education, and government affairs services. More than 7.23 million personal wallets and over 1.19 million corporate wallets had been opened, with over 28.45 million transactions and a total amount approximating RMB18.9 billion.
The Bank will continue to steadily push forward the pilot projects and development of e-CNY under the guidance of the PBC, explore new technologies, deepen the application of smart contract, hardware wallet and dual offline payment, and further expand the coverage of application scenarios to achieve full coverage in designated pilot regions.
Reform of the Deposit Pricing Mechanism
In June 2021, in order to effectively maintain a healthy and well-ordered deposit market and avoid disordered competition and other issues, the Self-Regulatory Mechanism for the Pricing of Market-Oriented Interest Rates decided to reform the deposit pricing mechanism. The reform mainly consisted of two aspects: first, changing the deposit pricing method from “benchmark deposit rate * multipliers” to “benchmark deposit rate + basis points”; second, reasonably adjusting the maturity premium for deposits. The self-regulatory upper limits of deposit rates for various maturities moved in different directions after the adjustment. Specifically, the self-regulatory upper limits of interest rates for short-term time deposits and large-denomination certificates of deposit with maturities within half a year rose, while those for of long-term deposits with maturities over one year decreased. The reform will help commercial banks, including CCB, improve their independent pricing capabilities. The Group actively reformed relevant supporting systems, immediately revised the internal deposit pricing authorisation system and customer contract templates to comply with the requirements of the Self-Regulatory Mechanism, and timely evaluated the compliance of its deposit price demonstration via various channels to avoid misleading customers’ deposit behaviours. At the same time, it also effectively protected the legitimate rights and interests of consumers and actively responded to customer inquiries and suggestions.
The Group will seize the opportunity of optimisation of the self-regulatory deposit pricing mechanism, steadily advance the reform of deposit rate liberalisation, alleviate the pressure of rising deposit costs, and adhere to the principle of balanced development of volume and pricing to further enhance its value creation capabilities.
China Construction Bank CorporationHalf-Year Report 2021 55
3 Management Discussion and Analysis
Deposits from Customers
The Group earnestly implemented the Administrative Measures for the Quality of Liabilities of Commercial Banks , and continuously promoted the high-quality development of liabilities business. At the end of June, the Group’s deposits from customers increased by RMB1.70 trillion or 8.26% from the end of 2020. From the perspective of average balance and average cost ratio, the Group’s deposits from customers increased by RMB2.04 trillion or 10.62% as compared with the same period of 2020; in the first half of 2021, interest rate of deposits from customers was 1.67%. Interest rates of corporate deposits and personal deposits were 1.51% and 1.85% respectively, with balanced development in terms of volume and pricing. From the perspective of composition of customers, the Bank’s domestic personal deposits increased by 9.71%, mainly because the Bank leveraged the advantage of digitalised operation, actively attracted fund sources and scenario-based funds by “building ecosystems, setting up scenarios, and expanding user base”, and enhanced its ability to take deposits through diversified channels. The Bank’s domestic corporate deposits increased by 7.30%, mainly because the Bank focused on the flow of funds, further expanded to upstream and downstream customers, gave full play to the advantage of settlement products to attract and retain deposits from customers, and continuously consolidated its edges in traditional businesses such as financial, social security and housing funds.
The Group will continue to improve its liability quality management and performance evaluation system, take liability quality management as the key to promote healthy and sustainable development of its liability business. It will fully strengthen liability quality management from the perspective of stability of liability sources, diversity of liability sources, appropriateness of the matching of asset and liability, active acquisition of liability and reasonableness of liability cost, ensure the compliant and sound development of the liability business, and continuously improve its sustainable development capabilities.
Asset Quality
In the first half of 2021, the Group continued to maintain its proactive management of credit risk. It conducted forward-looking and proactive risk identification and classification management in a scientific and prudent manner, made sufficient provisions, and maintained stable credit asset quality on the whole. At the end of June, the Group’s NPLs were RMB276,981 million, an increase of RMB16,252 million over the end of 2020. The Group’s NPL ratio was 1.53%, a decrease of 0.03 percentage points from the end of 2020. Specifically, the NPL ratios of domestic corporate loans and personal loans were 2.49% and 0.39% respectively, and that for overseas operations and subsidiaries was 1.71%. In the first half of 2021, the Group’s credit impairment losses on loans and advances to customers were RMB94,450 million, a decrease of RMB11,084 million or 10.50% from the same period last year. Specifically, provisions for credit impairment losses on domestic corporate loans and discounted bills were RMB79,215 million, a decrease of RMB3,083 million or 3.75% from the same period last year, while credit impairment losses on domestic personal loans were RMB14,073 million, a decrease of RMB7,469 million or 34.67% from the same period last year.
The Group will continue to improve the comprehensive, proactive and intelligent system for risk prevention, monitoring and management, objectively reflect the COVID-19 impact on asset quality, and proactively identify risks in high carbon fields in a forward-looking manner.
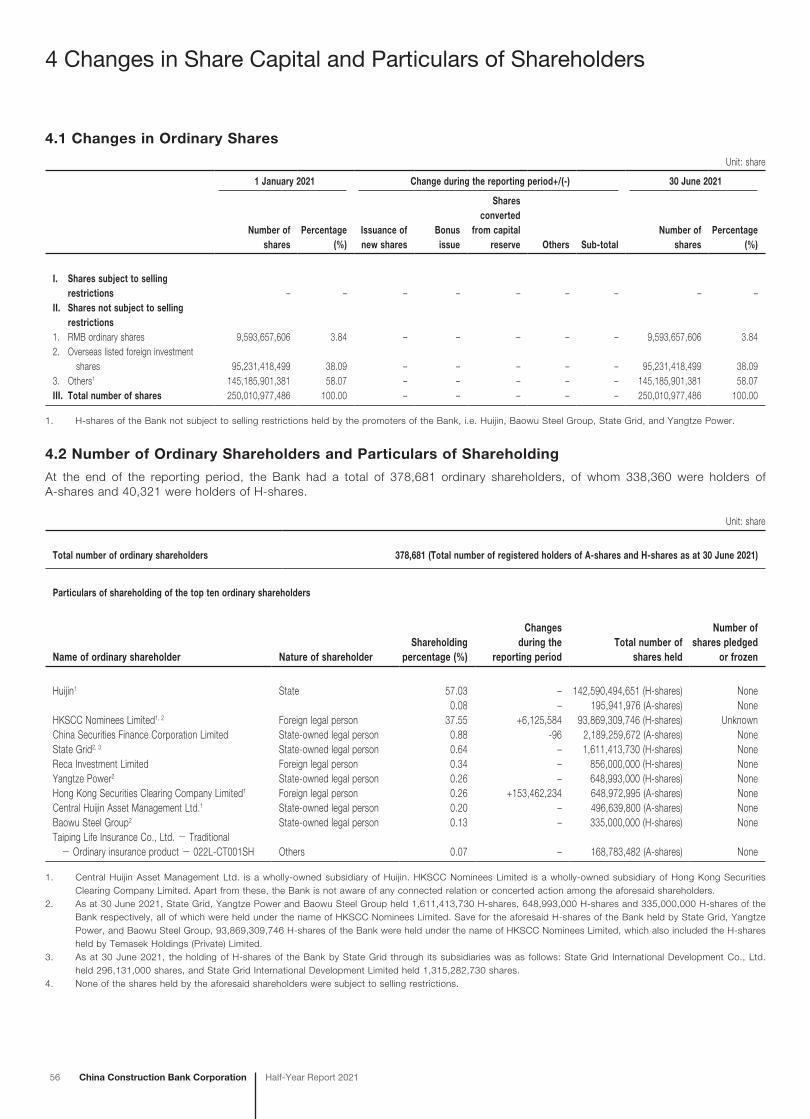
4 Changes in Share Capital and Particulars of Shareholders
56 China Construction Bank Corporation Half-Year Report 2021
4.1 Changes in Ordinary Shares
Unit: share
1 January 2021 Change during the reporting period+/(-) 30 June 2021
Number of shares
Percentage (%)
Issuance of new shares
Bonus issue
Shares converted
from capital reserve Others Sub-total
Number of shares
Percentage(%)
I. Shares subject to selling restrictions – – – – – – – – –
II. Shares not subject to selling restrictions
1. RMB ordinary shares 9,593,657,606 3.84 – – – – – 9,593,657,606 3.842. Overseas listed foreign investment
shares 95,231,418,499 38.09 – – – – – 95,231,418,499 38.093. Others1 145,185,901,381 58.07 – – – – – 145,185,901,381 58.07III. Total number of shares 250,010,977,486 100.00 – – – – – 250,010,977,486 100.00
1. H-shares of the Bank not subject to selling restrictions held by the promoters of the Bank, i.e. Huijin, Baowu Steel Group, State Grid, and Yangtze Power.
4.2 Number of Ordinary Shareholders and Particulars of Shareholding
At the end of the reporting period, the Bank had a total of 378,681 ordinary shareholders, of whom 338,360 were holders of A-shares and 40,321 were holders of H-shares.
Unit: share
Total number of ordinary shareholders 378,681 (Total number of registered holders of A-shares and H-shares as at 30 June 2021)
Particulars of shareholding of the top ten ordinary shareholders
Name of ordinary shareholder Nature of shareholderShareholding
percentage (%)
Changes during the
reporting periodTotal number of
shares held
Number of shares pledged
or frozen
Huijin1 State 57.03 – 142,590,494,651 (H-shares) None0.08 – 195,941,976 (A-shares) None
HKSCC Nominees Limited1, 2 Foreign legal person 37.55 +6,125,584 93,869,309,746 (H-shares) UnknownChina Securities Finance Corporation Limited State-owned legal person 0.88 -96 2,189,259,672 (A-shares) NoneState Grid2, 3 State-owned legal person 0.64 – 1,611,413,730 (H-shares) NoneReca Investment Limited Foreign legal person 0.34 – 856,000,000 (H-shares) NoneYangtze Power2 State-owned legal person 0.26 – 648,993,000 (H-shares) NoneHong Kong Securities Clearing Company Limited1 Foreign legal person 0.26 +153,462,234 648,972,995 (A-shares) NoneCentral Huijin Asset Management Ltd.1 State-owned legal person 0.20 – 496,639,800 (A-shares) NoneBaowu Steel Group2 State-owned legal person 0.13 – 335,000,000 (H-shares) NoneTaiping Life Insurance Co., Ltd. - Traditional - Ordinary insurance product - 022L-CT001SH Others 0.07 – 168,783,482 (A-shares) None
1. Central Huijin Asset Management Ltd. is a wholly-owned subsidiary of Huijin. HKSCC Nominees Limited is a wholly-owned subsidiary of Hong Kong Securities Clearing Company Limited. Apart from these, the Bank is not aware of any connected relation or concerted action among the aforesaid shareholders.
2. As at 30 June 2021, State Grid, Yangtze Power and Baowu Steel Group held 1,611,413,730 H-shares, 648,993,000 H-shares and 335,000,000 H-shares of the Bank respectively, all of which were held under the name of HKSCC Nominees Limited. Save for the aforesaid H-shares of the Bank held by State Grid, Yangtze Power, and Baowu Steel Group, 93,869,309,746 H-shares of the Bank were held under the name of HKSCC Nominees Limited, which also included the H-shares held by Temasek Holdings (Private) Limited.
3. As at 30 June 2021, the holding of H-shares of the Bank by State Grid through its subsidiaries was as follows: State Grid International Development Co., Ltd. held 296,131,000 shares, and State Grid International Development Limited held 1,315,282,730 shares.
4. None of the shares held by the aforesaid shareholders were subject to selling restrictions.
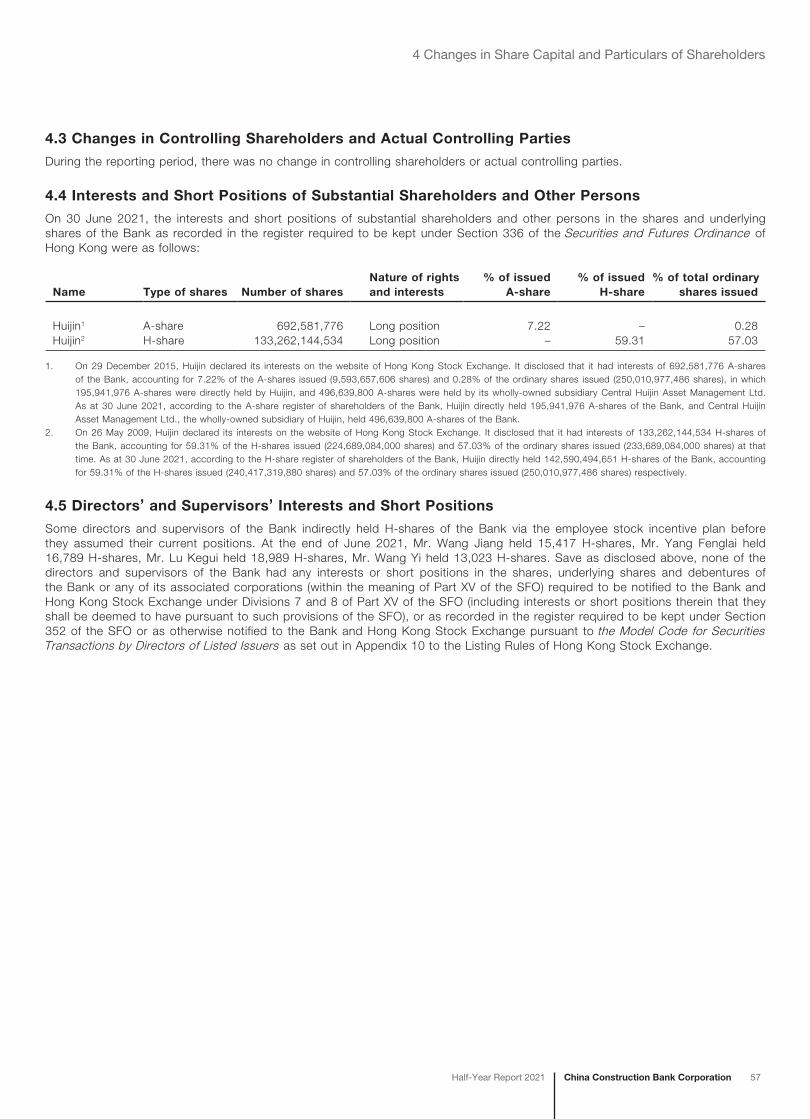
China Construction Bank CorporationHalf-Year Report 2021 57
4 Changes in Share Capital and Particulars of Shareholders
4.3 Changes in Controlling Shareholders and Actual Controlling Parties
During the reporting period, there was no change in controlling shareholders or actual controlling parties.
4.4 Interests and Short Positions of Substantial Shareholders and Other Persons
On 30 June 2021, the interests and short positions of substantial shareholders and other persons in the shares and underlying shares of the Bank as recorded in the register required to be kept under Section 336 of the Securities and Futures Ordinance of Hong Kong were as follows:
Name Type of shares Number of sharesNature of rights and interests
% of issued A-share
% of issued H-share
% of total ordinary shares issued
Huijin1 A-share 692,581,776 Long position 7.22 – 0.28Huijin2 H-share 133,262,144,534 Long position – 59.31 57.03
1. On 29 December 2015, Huijin declared its interests on the website of Hong Kong Stock Exchange. It disclosed that it had interests of 692,581,776 A-shares of the Bank, accounting for 7.22% of the A-shares issued (9,593,657,606 shares) and 0.28% of the ordinary shares issued (250,010,977,486 shares), in which 195,941,976 A-shares were directly held by Huijin, and 496,639,800 A-shares were held by its wholly-owned subsidiary Central Huijin Asset Management Ltd. As at 30 June 2021, according to the A-share register of shareholders of the Bank, Huijin directly held 195,941,976 A-shares of the Bank, and Central Huijin Asset Management Ltd., the wholly-owned subsidiary of Huijin, held 496,639,800 A-shares of the Bank.
2. On 26 May 2009, Huijin declared its interests on the website of Hong Kong Stock Exchange. It disclosed that it had interests of 133,262,144,534 H-shares of the Bank, accounting for 59.31% of the H-shares issued (224,689,084,000 shares) and 57.03% of the ordinary shares issued (233,689,084,000 shares) at that time. As at 30 June 2021, according to the H-share register of shareholders of the Bank, Huijin directly held 142,590,494,651 H-shares of the Bank, accounting for 59.31% of the H-shares issued (240,417,319,880 shares) and 57.03% of the ordinary shares issued (250,010,977,486 shares) respectively.
4.5 Directors’ and Supervisors’ Interests and Short Positions
Some directors and supervisors of the Bank indirectly held H-shares of the Bank via the employee stock incentive plan before they assumed their current positions. At the end of June 2021, Mr. Wang Jiang held 15,417 H-shares, Mr. Yang Fenglai held 16,789 H-shares, Mr. Lu Kegui held 18,989 H-shares, Mr. Wang Yi held 13,023 H-shares. Save as disclosed above, none of the directors and supervisors of the Bank had any interests or short positions in the shares, underlying shares and debentures of the Bank or any of its associated corporations (within the meaning of Part XV of the SFO) required to be notified to the Bank and Hong Kong Stock Exchange under Divisions 7 and 8 of Part XV of the SFO (including interests or short positions therein that they shall be deemed to have pursuant to such provisions of the SFO), or as recorded in the register required to be kept under Section 352 of the SFO or as otherwise notified to the Bank and Hong Kong Stock Exchange pursuant to the Model Code for Securities Transactions by Directors of Listed Issuers as set out in Appendix 10 to the Listing Rules of Hong Kong Stock Exchange.
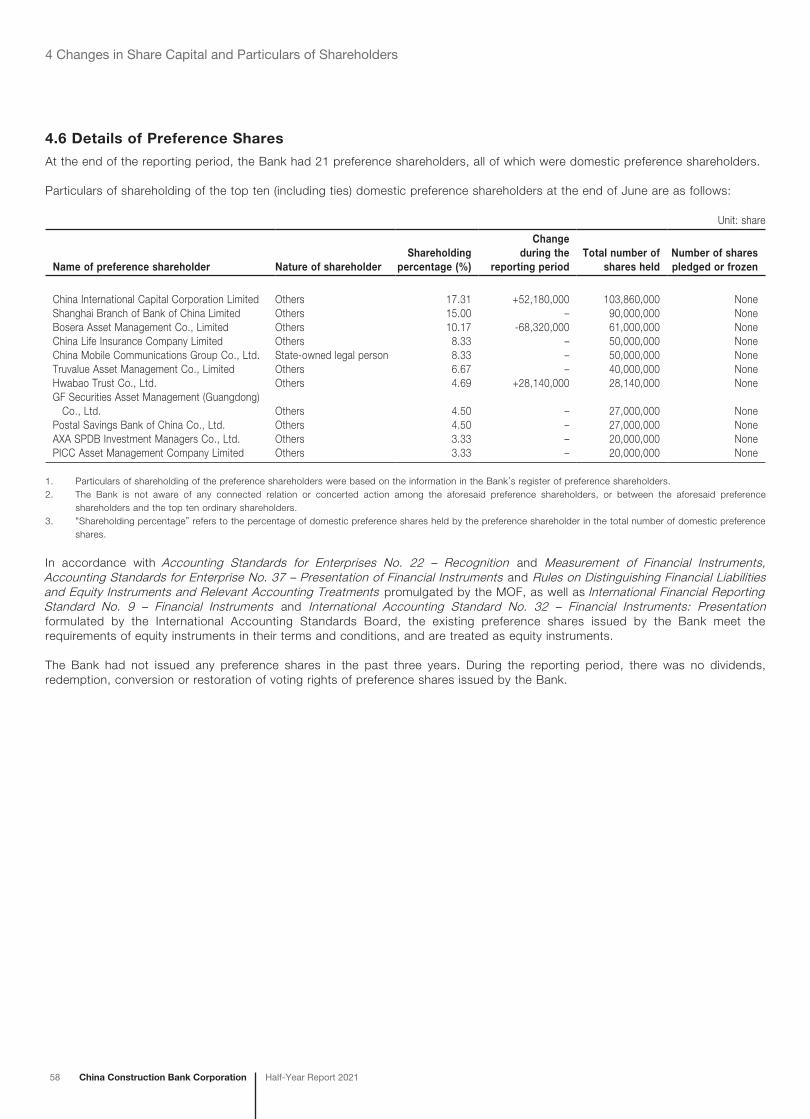
58 China Construction Bank Corporation Half-Year Report 2021
4 Changes in Share Capital and Particulars of Shareholders
4.6 Details of Preference Shares
At the end of the reporting period, the Bank had 21 preference shareholders, all of which were domestic preference shareholders.
Particulars of shareholding of the top ten (including ties) domestic preference shareholders at the end of June are as follows:
Unit: share
Name of preference shareholder Nature of shareholderShareholding
percentage (%)
Change during the
reporting period Total number of
shares heldNumber of shares pledged or frozen
China International Capital Corporation Limited Others 17.31 +52,180,000 103,860,000 NoneShanghai Branch of Bank of China Limited Others 15.00 – 90,000,000 NoneBosera Asset Management Co., Limited Others 10.17 -68,320,000 61,000,000 NoneChina Life Insurance Company Limited Others 8.33 – 50,000,000 NoneChina Mobile Communications Group Co., Ltd. State-owned legal person 8.33 – 50,000,000 NoneTruvalue Asset Management Co., Limited Others 6.67 – 40,000,000 NoneHwabao Trust Co., Ltd. Others 4.69 +28,140,000 28,140,000 NoneGF Securities Asset Management (Guangdong)
Co., Ltd. Others 4.50 – 27,000,000 NonePostal Savings Bank of China Co., Ltd. Others 4.50 – 27,000,000 NoneAXA SPDB Investment Managers Co., Ltd. Others 3.33 – 20,000,000 NonePICC Asset Management Company Limited Others 3.33 – 20,000,000 None
1. Particulars of shareholding of the preference shareholders were based on the information in the Bank’s register of preference shareholders.2. The Bank is not aware of any connected relation or concerted action among the aforesaid preference shareholders, or between the aforesaid preference
shareholders and the top ten ordinary shareholders.3. “Shareholding percentage” refers to the percentage of domestic preference shares held by the preference shareholder in the total number of domestic preference
shares.
In accordance with Accounting Standards for Enterprises No. 22 – Recognition and Measurement of Financial Instruments, Accounting Standards for Enterprise No. 37 – Presentation of Financial Instruments and Rules on Distinguishing Financial Liabilities and Equity Instruments and Relevant Accounting Treatments promulgated by the MOF, as well as International Financial Reporting Standard No. 9 – Financial Instruments and International Accounting Standard No. 32 – Financial Instruments: Presentation formulated by the International Accounting Standards Board, the existing preference shares issued by the Bank meet the requirements of equity instruments in their terms and conditions, and are treated as equity instruments.
The Bank had not issued any preference shares in the past three years. During the reporting period, there was no dividends, redemption, conversion or restoration of voting rights of preference shares issued by the Bank.
5 Corporate Governance
China Construction Bank CorporationHalf-Year Report 2021 59
The Bank is in strict compliance with the Company Law of the PRC, the Law of the PRC on Commercial Banks and other laws and regulations, as well as the listing rules of the listing venues. The Bank continued to refine its corporate governance mechanism and governance rules based on its corporate governance practices, give full play to the assessment and guiding role of corporate governance and maintain sound and good operation of corporate governance. During the reporting period, the Bank has complied with the code provisions of the Corporate Governance Code and Corporate Governance Report as set out in Appendix 14 to the Listing Rules of Hong Kong Stock Exchange, and has substantially adopted the recommended best practices therein.
5.1 Shareholders’ General Meeting Convened
On 25 June 2021, the Bank held the 2020 annual general meeting, which reviewed and approved proposals including the 2020 report of the board of directors, 2020 report of the board of supervisors, 2020 final financial accounts, 2020 profit distribution plan, 2021 fixed assets investment budget, election of independent non-executive directors, the appointment of external auditors for 2021. The executive directors, namely Mr. Tian Guoli and Mr. Wang Jiang, the non-executive directors, namely Mr. Xu Jiandong, Mr. Zhang Qi, Mr. Tian Bo, Mr. Xia Yang, Ms. Shao Min and Ms. Liu Fang, and the independent non-executive directors, namely Ms. Anita Fung Yuen Mei, Sir Malcolm Christopher McCarthy, Mr. Carl Walter, Mr. Kenneth Patrick Chung, Mr. Graeme Wheeler and Mr. Michel Madelain attended the meeting. The directors’ attendance rate was 100%. The domestic and international accounting firms of the Bank, the legal advisors as to PRC laws and Hong Kong laws of the Bank attended the meeting. The convening of this shareholders’ general meeting was in compliance with relevant laws and regulations. The announcement on the resolutions of the meeting was published on the websites of Shanghai Stock Exchange, Hong Kong Stock Exchange and the Bank on 25 June 2021, and on the Bank’s designated newspapers for information disclosure on 26 June 2021.
On 26 March 2021, the Bank held the 2021 first extraordinary general meeting, which reviewed and approved proposals including election of executive director, confirming the donations of anti-pandemic materials made in 2020, additional limit on poverty alleviation donations. The executive directors, namely Mr. Tian Guoli and Mr. Lyu Jiajin, the non-executive directors, namely Mr. Xu Jiandong, Mr. Zhang Qi, Mr. Tian Bo, Mr. Xia Yang, Ms. Shao Min and Ms. Liu Fang, and the independent non-executive directors, namely Ms. Anita Fung Yuen Mei, Sir Malcolm Christopher McCarthy, Mr. Carl Walter, Mr. Kenneth Patrick Chung, Mr. Graeme Wheeler and Mr. Michel Madelain attended the meeting. The directors’ attendance rate was 100%. The domestic and international accounting firms of the Bank, the legal advisors as to PRC laws and Hong Kong laws of the Bank attended the meeting. The convening of this shareholders’ general meeting was in compliance with relevant laws and regulations. The announcement on the resolutions of the meeting was published on the websites of Shanghai Stock Exchange, Hong Kong Stock Exchange and the Bank on 26 March 2021, and on the Bank’s designated newspapers for information disclosure on 27 March 2021.
5.2 Profiles of Directors, Supervisors and Senior Management
5.2.1 Particulars of Directors, Supervisors and Senior Management
Directors of the BankMembers of the Board of the Bank include executive directors: Mr. Tian Guoli and Mr. Wang Jiang; non-executive directors: Mr. Xu Jiandong, Mr. Zhang Qi, Mr. Tian Bo, Mr. Xia Yang, Ms. Shao Min and Ms. Liu Fang; and independent non-executive directors: Sir Malcolm Christopher McCarthy, Mr. Kenneth Patrick Chung, Mr. Graeme Wheeler, Mr. Michel Madelain and Mr. William Coen.
Supervisors of the BankMembers of the board of supervisors of the Bank include shareholder representative supervisors: Mr. Wang Yongqing and Mr. Yang Fenglai; employee representative supervisors: Mr. Lu Kegui and Mr. Wang Yi; and external supervisors: Mr. Zhao Xijun, Mr. Liu Huan and Mr. Ben Shenglin.
Senior Management of the BankSenior management of the Bank include Mr. Wang Jiang, Mr. Ji Zhihong, Mr. Wang Hao, Ms. Zhang Min, Mr. Hu Changmiao, Mr. Jin Panshi and Mr. Cheng Yuanguo.
60 China Construction Bank Corporation Half-Year Report 2021
5 Corporate Governance
5.2.2 Changes in Directors, Supervisors and Senior Management
Directors of the BankUpon election at the 2020 annual general meeting of the Bank, Mr. Kenneth Patrick Chung continued to serve as independent non-executive director of the Bank from June 2021. Upon election at the 2021 first extraordinary general meeting and approval of the Board of the Bank, Mr. Wang Jiang commenced his position as vice chairman and executive director of the Bank from March 2021. Upon election at the 2020 first extraordinary general meeting of the Bank and approval of the CBIRC, Ms. Shao Min and Ms. Liu Fang commenced their positions as non-executive directors of the Bank from January 2021. Upon election at the 2020 first extraordinary general meeting of the Bank and approval of the CBIRC, Mr. William Coen commenced his position as independent non-executive director of the Bank from June 2021. Upon approval of the Board of the Bank, Mr. Leung Kam Chung, Antony was nominated as independent non-executive director of the Bank, and relevant proposal has been considered by the 2020 general meeting of the Bank with his appointment qualification subject to approval of the CBIRC.
Due to expiration of their terms of office, Ms. Anita Fung Yuen Mei and Mr. Carl Walter ceased to serve as independent non-executive directors of the Bank from June 2021. Due to change of job, Mr. Lyu Jiajin ceased to serve as executive director of the Bank from May 2021. Due to change of job, Ms. Feng Bing ceased to serve as non-executive director of the Bank from January 2021.
Supervisors of the BankDue to expiration of his term of office, Mr. Wu Jianhang ceased to serve as shareholder representative supervisor of the Bank from June 2021. Due to change of job, Mr. Cheng Yuanguo ceased to serve as employee representative supervisor of the Bank from March 2021.
Senior Management of the BankUpon appointment of the Board of the Bank and approval of the CBIRC, Mr. Zhang Yi commenced his position as chief financial officer of the Bank from April 2021 and Mr. Cheng Yuanguo commenced his position as chief risk officer of the Bank from April 2021. Upon appointment of the Board of the Bank and filing with the CBIRC, Mr. Jin Panshi commenced his position as chief information officer of the Bank from March 2021. Upon appointment of the Board of the Bank and filing with the CBIRC, Mr. Wang Jiang commenced his position as president of the Bank from February 2021.
Due to change of job, Mr. Zhang Yi ceased to serve as chief financial officer of the Bank from September 2021. Due to change of job, Mr. Lyu Jiajin ceased to serve as executive vice president of the Bank from May 2021. Due to change of job, Mr. Jin Yanmin ceased to serve as chief risk officer of the Bank from April 2021.
5.2.3 Changes in Personal Information of Directors, Supervisors and Senior Management
Mr. Wang Jiang, vice chairman of the Board, executive director and president of the Bank ceased to serve as the vice chairman of the board of directors, executive director, president of Bank of China Limited, and the vice chairman of the board of directors, non-executive director of BOC Hong Kong (Holdings) Limited from February 2021.
Mr. William Coen, independent non-executive director of the Bank, commenced his positions as member of the Advisory Board of Baton Systems, Inc. from June 2021, chief regulatory adviser of Suade Labs from April 2021, and vice chairman of Reference Point from January 2021.
Mr. Liu Huan, external supervisor of the Bank, ceased to serve as independent non-executive director of Liaoning Wellhope Agri-Tech Joint Stock Co., Ltd. from February 2021.
Mr. Ben Shenglin, external supervisor of the Bank, commenced his position as independent non-executive director of Industrial Bank Co., Ltd. from August 2021 and ceased to serve as external supervisor of Industrial Bank Co., Ltd. from June 2021.
5.2.4 Directors’ and Supervisors’ Securities Transactions
The Bank has adopted a code of practice in relation to securities transactions by directors and supervisors as set out in the Appendix 10 Model Code for Securities Transactions by Directors of Listed Issuers to the Listing Rules of Hong Kong Stock Exchange. All directors and supervisors had complied with the provisions of this code during the reporting period.
China Construction Bank CorporationHalf-Year Report 2021 61
5 Corporate Governance
5.3 Formulation and Implementation of Cash Dividend Policy
As approved by the 2020 annual general meeting, the Bank distributed the 2020 cash dividend of RMB0.326 per share (including tax), totalling RMB3,128 million approximately, on 15 July 2021 to its A-share holders whose names appeared on the register of members after the close of market on 14 July 2021; it distributed the 2020 cash dividend of RMB0.326 per share (including tax), totalling RMB78,376 million approximately, on 5 August 2021 to its H-share holders whose names appeared on the register of members after the close of market on 14 July 2021. The Bank does not declare 2021 interim dividend nor does it propose any capitalisation of capital reserve into share capital.
Pursuant to the articles of association of the Bank, the Bank may distribute dividends in the form of cash, shares or a combination of cash and shares. Unless under special circumstances, as long as it is in profit for the year and has positive accumulative undistributed profits, the Bank distributes cash dividends no less than 10% of the net profit attributable to shareholders of the Bank on a consolidated basis for the accounting year. For adjustments of the profit distribution policy, the Board shall hold a special discussion to verify the rationale to make the adjustments in detail and produce a written report, independent non-executive directors shall express their opinions, and a special resolution shall be submitted to the shareholders’ general meeting for approval. The Bank shall provide the shareholders with online voting channels when considering the adjustments to the profit distribution policy.
The formulation and implementation of the Bank’s profit distribution policy are in line with the provisions of the articles of association and the requirements of the resolution of the shareholders’ general meeting. The procedures and mechanism for decision-making are sound, and the dividend criteria and payout ratio are clear and explicit. The independent non-executive directors performed their duties with due diligence in the decision-making process of the profit distribution plan. Minority shareholders can fully express their opinions and requests, with their legitimate rights and interests fully protected.
5.4 Progress of Implementation of Employee Stock Incentive Plan
During the reporting period, the Bank did not implement any new round of stock incentive plan.
6 Corporate Social Responsibilities (Environmental, Social and Governance)
62 China Construction Bank Corporation Half-Year Report 2021
The Group attaches great importance to environmental, social and governance (ESG) work, and integrates ESG management concept and key elements into the operating management process of the Group. While working on its own ESG management, it guided its customers to strengthen their ESG management. The Group also closely tracked domestic and international regulatory requirements, and incorporated ESG risks, including environmental and climate risks, into its comprehensive risk management framework. It enhanced environmental and climate risk control mechanisms, and explored stress testing of environmental and climate risks, so as to establish a financial service and risk control system that meets the requirements of high-quality development.
6.1 Governance
The Board of the Bank is responsible for formulating the Group’s ESG strategies, and supervising and evaluating their implementation. In April 2021, the Board held an ESG seminar to carry out in-depth communication and discussion on ESG development trends, information disclosure requirements, and regulatory developments at home and abroad as well as management recommendations. In the first half of 2021, the related party transaction, social responsibility and consumer protection committee of the Board convened five meetings. It revised the committee’s working rules, and clarified its responsibilities in providing guidance to push forward work related to ESG and green finance, and reviewed reports on issues such as the ESG work progress. The risk management committee of the Board continuously encouraged the management to establish an ESG risk reporting mechanism, focusing on the integration of goals for achieving carbon peak and carbon neutrality with operating management and risk appetite. It stressed the importance of forward-looking management of environmental and climate risks, and promptly adjusted its credit policies for high energy consumption and high emission industries according to policy requirements.
The board of supervisors of the Bank paid close attention to the implementation of the Group’s ESG work from the perspective of sustainable operation and development, focused on promoting the establishment of green finance system, and included the promotion of green finance development as one of its priorities in annual supervision. In the first half of 2021, the finance and internal control supervision committee of the board of supervisors listened to special reports on the development of green credit, put forward opinions such as timely formulating green finance development plans, and seizing market opportunities to accelerate structural adjustments. The committee also closely followed up on the implementation of supervisory opinions.
The Bank’s management continued to improve ESG and green finance management structure and strengthened the assessment of green finance work. In the first half of 2021, a leading team for achieving carbon peak and carbon neutrality was set up to coordinate and promote related work and formulate relevant action plans; an environmental, social and governance promotion committee was set up to promote the implementation of ESG work. Performance indicators for “work done to support ecological civilisation strategy” were included as performance appraisal measurements with an expanded scope of departments subject to assessment, and the weight of green finance indicator was raised in assessment. In May 2021, the Bank became a supporting organisation of the Task Force on Climate-related Financial Disclosures (TCFD), and would gradually improve its response to climate change risk and related information disclosure in future based on the disclosure framework of TCFD. The Bank strengthened ESG training for all employees. In the first half of 2021, the Bank organised 448 ESG training sessions, including live webcasts, through CCB University, covering topics such as ESG strategy and management, risks and procedures, and information disclosure, so as to improve its staff’s ESG working capabilities.
The Bank attaches great importance to corporate code of conduct. It has implemented whole-process procurement management, and formulated and refined rules and regulations on procurement. It strictly implements probity requirements on procurement, and prohibits employees from having improper financial and non-financial dealings with suppliers. The internal auditors conduct risk-based audits over all business segments within every two to three years. Please refer to “Corporate Governance” and “Management Discussion and Analysis – Risk Management” for additional information on governance.
6.2 Environment
Green Finance
In the first half of 2021, the Group focused on national visions and goals of achieving carbon peak and carbon neutrality, continued to enrich the green connotation of New Finance Initiative, accelerated the fostering of new advantages in green finance, and improved the long-term mechanism for green finance development. It formulated and coordinated to advance the action plan for “achieving carbon peak and carbon neutrality”; held bank-level committee meetings on green finance, leading team meetings for achieving carbon peak and carbon neutrality, and special meetings on granting green loans on a regular basis; researched and conducted credit structure adjustment with an emphasis on green development; and strengthened environmental and climate risk management.
China Construction Bank CorporationHalf-Year Report 2021 63
6 Corporate Social Responsibilities (Environmental, Social and Governance)
The Group gave full play to the advantages of FinTech and full-coverage financial licenses, and actively explored new products, new services and new initiatives for the development of green finance. With an array of financial instruments such as green loans, green bonds, green leasing and green trusts, it extensively attracted funds to actively support key areas including clean energy, green transportation, green construction, green manufacturing, and biodiversity conservation, as well as the research, development and application of advanced low-carbon technologies. In accordance with the definition of the former CBRC, at the end of June, the Bank’s green loans amounted to RMB1.57 trillion, up RMB223,601 million or 16.65% from the end of 2020. The Bank strengthened management over industries with high energy consumption and high emissions such as the thermal power industry and steel industry, and eliminated industries with outdated production capacity, and the proportion of loans to industries with high energy consumption and high emissions has been declining for many consecutive years. In the first half of 2021, the Bank simultaneously issued multi-currency ESG-themed bonds overseas, which were well received by the market with total proceeds approximating US$2.4 billion.
The Bank focused on improving its capacity to provide comprehensive green finance services. It formulated an implementation plan for expanding its footprint in green capital market, and promoted the development of its innovative business of green direct financing in a coordinated manner. It was elected as the “2021 Low Carbon Role Model”, an award jointly reviewed by China News Service, the National Development and Reform Commission (NDRC), and the Ministry of Ecology and Environment. The “FITS®-Green” green investment and financing service platform and Shandong Shouguang vegetable smart management service platform of the Bank were recognised as “2021 Excellent Cases of Green Influence in China” and “2021 Leading Financial Service Innovation Project” by Xinhuanet. It released the “CCB-WIND Green ESG Bond Issuance Index and Yield Curve”, which were dynamically updated in Wind Terminal and the Luxembourg Stock Exchange, to assist domestic and foreign market participants in understanding the trend of China’s green bond market in real time. In the first half of 2021, the Bank cumulatively underwrote 14 green bonds and sustainability-linked bonds, amounting to RMB10.8 billion, up 108% from the same period last year, including the first batch of non-financial corporate “carbon neutrality bonds” and “sustainability-linked bonds” in China’s interbank bond market. At the end of June, the Bank underwrote 97 domestic and overseas green bonds, with a cumulative amount of over RMB430 billion.
CCB subsidiaries actively carried out green investment and financing business. CCB Principal Asset Management joined the United Nations Principles for Responsible Investment (UN PRI) programme and issued several ESG-themed products. CCB Wealth Management launched special ESG wealth management products and increased investment in green assets. CCB Life and CCB Futures continued to increase the allocation of various types of green assets. CCB Financial Leasing took the lead in building a green leasing brand in the industry, and completed RMB106,491 million green leases at the end of June on a cumulative basis.
The Bank focused on incorporating environmental and climate risk factors into whole-process credit management, and integrating environmental and climate related indicators into relevant industrial policies, and took the carbon emission indicators as well as environmental and social risks as important criteria for pre-lending customer selection and loan granting. Fixed asset loans must comply with national policies and requirements on environmental protection and green development, as well as the Bank’s policies on environment and social risk management. The Bank promoted the green and low-carbon transformation of credit structure, formulated and continuously updated relevant policies for agriculture, electricity, forestry, mining, petroleum and natural gas, transportation, materials and construction industries, and guided the optimisation of credit resources allocation so as to promote a credit asset structure in line with economic structure transformation.
• The Bank focused on supporting modern agriculture in areas such as agricultural industrialisation, agricultural mechanisation, research and promotion of agricultural science and technology, and distribution of agricultural products, and actively supported energy-saving agricultural customers.
• The Bank controlled total loans to the thermal power industry and increased the proportion of loans for clean energy such as wind power and photovoltaic power.
• The Bank focused on supporting the construction of key national bases for improving forest tree breeds and key projects such as the national forest management planning, and actively supported land greening and forest stock expansion.
• The Bank strictly controlled total loans to mining-related industries, specified the requirements for production safety, environmental protection, and resource utilisation in the customer selection criteria, and resolutely reduced and withdrew from loans to enterprises with illegal or outdated production capacity that did not conform to the national industrial policies, and enterprises whose environmental protection and safety production did not meet relevant goals.
• The Bank controlled total loans to petroleum and natural gas-related industries, specified the requirements for safe production, clean production, energy consumption level and carbon emission intensity in customer selection criteria, and resolutely withdrew from projects that did not meet the national industrial planning and environmental protection policies, as well as enterprises that did not meet the requirements of green and low-carbon development and those with high environmental and climate risks.
64 China Construction Bank Corporation Half-Year Report 2021
6 Corporate Social Responsibilities (Environmental, Social and Governance)
• The Bank actively supported the green transformation of transportation structure, focused on supporting key green transportation projects such as urban public transport and rail transit, and satisfied the credit demand for the electrification, new energy transformation and clean upgrading of transportation.
• The Bank strictly controlled total loans to steel, cement and chemical industries, specified the requirements for low-carbon environmental protection and energy efficiency level in customer selection criteria, paid close attention to the impact of corporate production and project construction on areas such as energy consumption, carbon emission, ecological environment and biodiversity, and resolutely withdrew from projects that did not meet the national industrial planning and environmental protection policies, and enterprises that did not meet the environmental protection and safety production goals.
• The Bank actively advanced the coordinated development of green finance, green city construction and green building promotion, and supported energy conservation and carbon emission reduction in construction sector. The Bank considered green building standards as an important factor when selecting real estate projects.
• The Bank valued biodiversity conservation, focused on supporting the industrial application of biological breeding, basic breeding research and key breeding projects, and paid close attention to the impact of relevant projects on biodiversity.
Green Operations
The Bank attached great importance to green operations, took the lead in setting up a carbon footprint management work group, and steadily promoted a “zero carbon” pilot program. It practiced energy conservation and emission reduction through technology upgrade, management optimisation, publicity and education, and promoted energy conservation and emission reduction in an all-round way. The Bank used green design, environment-friendly building materials and energy-efficient and water-saving equipment in building or renovating office premises. It upgraded key energy-consuming equipment such as central air-conditioning systems and elevators, and used LED energy-saving lighting to reduce carbon emissions. It expanded the application of information management platforms such as “Smart Canteen” to prepare meals on demand. Electricity consumption at the head office declined continuously in recent years, and carbon emissions continued to fall after reaching a peak in 2014. The Bank accelerated intelligent operations, leveraged technologies to promote the implementation of a paperless office, reduced the use of disposable office supplies and increased the use of video conferencing systems. It spread knowledge and skills on energy conservation, emission reduction, and green and low-carbon development, advocated green travelling, launched “Clear Your Plate” campaign, and organised “CCB Low-Carbon Life Month” activity to encourage customers and citizens to actively participate in low-carbon environmental protection. Qinghai Branch has been engaging in afforestation in barren mountains for years, planting 3,967.6 thousand trees of various species and covering an area of 3,100 mu (1,000 mu = 66.67 hectares). The Bank promoted a “zero carbon” pilot program in outlets and strived to build itself into a low-carbon bank. The Zhongshan Cuiheng New District Sub-branch of Guangdong Branch became the first “zero-carbon outlet” in the industry and obtained a carbon neutrality certificate issued by China Emissions Exchange.
The Bank upheld the concept of green procurement, and considered factors such as energy conservation, environmental protection, and green and low-carbon development in supplier and product selection and procurement review. It established a recycling mechanism and was the first among its peers to standardise the recycling of wasted power supplies. In addition, it promoted the use of new energy vehicles and increased the proportion of new energy business vehicles procurement.
6.3 Society
Rural Revitalisation and Consolidation of Achievements in Poverty Alleviation
The Bank made great efforts to realise the smooth transition from consolidation of achievements in poverty alleviation to rural revitalisation, and activated the momentum of sustainable rural development with its green development concept and New Finance practices. Based on the previous team on poverty alleviation, a leading team on rural revitalisation was set up and headed by the Chairman of the Board, under which an office was set up to coordinate and facilitate related work. The Bank built on its experience in eradicating poverty in designated regions in 2020, i.e. Hanbin District, Hanyin County, Ziyang County, and Langao County of Ankang City in Shaanxi Province, and made sure that poverty alleviation policies, mechanisms and teams would continue and the strength of its support would not abate.
The Bank strengthened assistance in local industrial development, refined its products including online supply chains, Mingonghui, Quick Loan for Small and Micro Businesses, loans to new community factories, and cloud-based corporate loans, and promoted the innovative application of these products. It also increased loans for poverty alleviation. The growth of its loans to key counties that need national assistance in rural revitalisation was higher than that of loans to provinces where they are located. The Bank also expanded its financial poverty alleviation products and service models. Its 520 thousand “CCB Yunongtong” inclusive finance service outlets covered nearly 80% of towns and administrative villages across the country, and the “CCB Yunongtong” comprehensive service platform for rural revitalisation cumulatively extended loans of RMB2,115 million.
China Construction Bank CorporationHalf-Year Report 2021 65
6 Corporate Social Responsibilities (Environmental, Social and Governance)
The Bank carried out consumption-driven poverty alleviation via e.ccb.com. In light of daily needs of rural customers, it placed an entrance to the rural zone of e.ccb.com on the rural customer version of mobile banking, and introduced an entrance to the consumption upgrading zone on the “CCB Yunongtong” comprehensive service platform for rural revitalisation as well as CCB WeChat official account, to reach rural customers and Yunongtong users. At the end of June, e.ccb.com had 5,444 merchants from assisted areas, with total transaction volume of RMB6,911 million.
The Bank’s poverty alleviation work has been widely recognised. In the first half of 2021, the Bank’s leading team for poverty alleviation and the poverty alleviation special task force to Ankang received the accolade of “China’s Outstanding Group in Eradicating Poverty” awarded by the State Council. The Bank’s initiative of poverty alleviation through e-commerce via e.ccb.com won the award of “Best Inclusive Finance Service” from the China e-Finance Alliance.
Charity
The Bank actively supported flood control and disaster relief, and assisted in combating the pandemic and resuming work and production in China. It provided effective financial services in the critical periods, and ensured the life and property safety of domestic and overseas staff and customers to support economic and social development. The Bank also donated RMB20 million to the flood-stricken areas in Henan Province to support flood control and disaster relief and post-disaster reconstruction.
Protection of Consumer Rights and Interests
Adhering to its “customer-centric” philosophy, the Bank integrated the protection of consumer rights and interests into its business development strategy and corporate culture development. It continuously improved the management rules and operation mechanism for consumer rights protection, and constantly pushed forward the work in a more systematic, standardised and comprehensive manner to protect the rights and interests of financial consumers effectively.
The Board of the Bank assumes the ultimate responsibility for protection of consumer rights and interests and is responsible for formulating relevant strategies, policies and objectives. The related party transaction, social responsibility and consumer protection committee of the Board is responsible for guiding and overseeing the formulation and improvement of the system of management rules for protection of consumer rights and interests, and supervising the comprehensiveness, timeliness and effectiveness of related work of senior management and the department of protection of consumer rights and interests. The performance and due diligence supervision committee under the board of supervisors regularly listens to reports on and reviews the progress of the work on consumer rights and interests protection, and puts forward guidance, opinions and work requirements. The consumer rights protection committee at the management level is responsible for overall planning and deployment of the work on consumer rights and interests protection throughout the bank, and regularly studies work progress in areas including complaint resolution, reviews from consumer protection perspective, consumer education and publicity. The department of protection of consumer rights and interests is responsible for organising, coordinating, supervising and guiding the work related to consumer interests and rights protection across the bank.
The Bank attaches importance to the management of customer issues and complaints. The related party transaction, social responsibility and consumer protection committee under the Board, as well as the consumer rights protection committee at the management level, regularly listen to work progress reports on the protection of consumer rights and interests, including complaints, presale review of products and services, and consumer education and publicity. The committee meetings are usually held every six months. According to regulatory requirements, the Bank formulated rules for complaint management and contingency plans for major complaints among others, in order to clarify the principles of complaint management, refine the division of responsibilities, standardise the complaint handling process, and improve the quality and efficiency of the Bank’s complaint response and management capability. Rules and measures concerning the reviews for protection of consumer rights and interests and the complaint management were all reviewed and approved by the consumer rights protection committee. The Bank maintained smooth complaint channels, standardised the complaint handling process, and flexibly employed diversified measures to settle customer complaints. It publicised the complaint hotline through outlets, self-service devices, online banking platform and other channels, and strengthened the supervision and management of the quality and efficiency of complaint response by setting up a complaint supervision hotline at the head office. It established a presale review mechanism for products and services to eliminate customer complaints from the source of problems and proactively safeguard the rights and interests of consumers. The Bank formulated rules and procedures for advertising management and operations, and strictly complied with related laws and regulations. A specialised department conducts comprehensive reviews on the content of advertisements, ensuring that these advertisements accurately reflect product research and development intentions and related risk considerations, so as to help customers better understand their financial needs and make informed decisions. The Bank also published online and offline service contact information such as telephone numbers and websites to facilitate customers’ further inquiry.
66 China Construction Bank Corporation Half-Year Report 2021
6 Corporate Social Responsibilities (Environmental, Social and Governance)
The Bank continued to strengthen information protection of financial consumers by continuously improving relevant rules and IT controls. It enhanced the early warning and monitoring capability for information protection, effectively protected data security and customer privacy, and improved the security of e-banking transactions. It formulated rules and measures for information security, IT information security protection, and production data application security. It established an information system use behaviour monitoring platform and a behaviour model base to oversee its staff’s use of customer financial information. The Bank adhered to the principles of “He who uses the data should take responsibility” and “least privilege” for data access and use, with full authorisation from customers. The analysis, implementation, delivery, use, archiving and destruction of data requests, as well as the acquisition and use of external data, strictly complied with relevant laws, regulations and the Bank’s information security requirements. The Bank monitored and controlled transactions through various channels from all aspects, provided proactive risk early warning, linked automatic response mechanism with manual involvement, addressed risk transactions before they would cause any financial loss to customers, interrupted dubious transactions, and effectively prevented the risk of customers’ funds being stolen due to suspected external data leakage.
The Bank strengthened training on the protection of consumer rights and interests for employees at all levels, and leveraged on CCB University’s platform to set up the “CCB Consumer Protection • Protection of Rights and Interests” channel to post courses on special topics. It organised special training sessions on protection of consumer rights and interests across the bank, interpreted various rules and regulations in depth, and clarified management requirements. It embedded special topics on protection of consumer rights and interests in training for each business line, to further promote the integration of business development with concepts of protection of consumer rights and interests. It established a mechanism for information security training, security warning, education and annual inspection for all employees. It issued a series of training manuals and online coursewares, and organised on-site sessions or webcasts to introduce relevant policies, conduct case analysis and promote security technologies, to continuously strengthen employees’ awareness of the protection of consumer rights and interests and their capability of risk prevention.
The Bank actively engaged in public financial knowledge education, and expanded the coverage of consumer education, particularly focusing on the elderly, teenagers, migrant workers and people with disabilities. It regularly carried out financial knowledge education activities, providing people with access to financial knowledge and skills to prevent risks. The Talent Exchange Centre of the Ministry of Industry and Information Technology (MIIT) included CCB in its organisation pool for operation and management leading talents training project for small and medium-sized enterprises, to provide customers with practical and effective financial empowerment training. The “Financial Literacy Promotion” project focused on advancing universal financial education in terms of rural finance, inclusive finance, and protection of consumer rights and interests via online and offline channels. By the end of June 2021, 3.87 million people had benefited from the project. The Bank set up a feature column called “Public Education and Consumer Rights and Interests Protection Classroom” in “Financial Literacy Promotion” channel on CCB University learning platform to provide various courses to customers, and continuously updated information on the protection of consumer rights and interest through multiple social applications. The Bank organised activities such as “Publicity Month for Prevention of Illegal Fund-raising” and “Education Tour of Financial Knowledge”, to effectively improve financial consumers’ knowledge of financial products and services, their capability to identify illegal fund-raising activity and telecommunications fraud, and the public awareness of self-protection and risk prevention.
Employee Rights and Interests
The Bank actively implemented the guiding spirit of the policies on ensuring stability in employment, financial operations, foreign trade, foreign investment, domestic investment and economic expectations, as well as security in job, basic living needs, operations of market participants, food and energy supply, stable industrial and supply chains, and the normal functioning of primary-level governments, and was committed to not taking initiatives to reduce headcount, continuously expanding recruitment scale, providing welfare and social security to employees at all levels, and enhancing care for the staff. The Bank improved the mechanisms for collecting employee opinions and suggestions and conveying their appeals, such as the systems for employee representatives’ meeting, solicitation of proposals and grassroot visits by employee representatives to understand the extent of employee satisfaction. The Bank dealt with employees’ concerns and improved employee satisfaction by means of the president’s open day and the chairman’s mailbox. The labour union actively mediated labour disputes to protect the legitimate rights and interests of employees.
The Bank attaches great importance to talent cultivation. It improved the professional and technical ranking management, formulated policies on professional and technical roles’ qualification examinations, and organised related examinations across the bank, creating a full-process talent cultivation mechanism. The Bank signed a memorandum of understanding with the Hong Kong University of Science and Technology to launch a master programme in FinTech, the first one of its kind jointly initiated by banks and Hong Kong universities in the Guangdong-Hong Kong-Macao Greater Bay Area, so as to explore a new path for young people from the Chinese mainland and Hong Kong to integrate and grow together.
7 Major Issues
China Construction Bank CorporationHalf-Year Report 2021 67
Performance of Undertakings
In September 2004, Huijin made a commitment of “non-competition within the industry”, i.e. as long as Huijin continues to hold any shares of the Bank, or is deemed as a controlling shareholder or a related party of a controlling shareholder of the Bank in accordance with the laws or listing rules in China or other listing places of the Bank, Huijin would not engage or participate in any competing commercial banking businesses, including but not limited to granting loans, taking deposits, and providing settlement, fund custody, bank card and currency exchange services. However, Huijin may still engage or participate in competing businesses through investing in other commercial banks. Accordingly, Huijin committed that it would: (1) fairly treat its investments in commercial banks, and would not abuse its shareholder position in the Bank or the information it obtained through its shareholder position in the Bank to make decisions detrimental to the Bank and beneficial to other commercial banks; (2) exercise its shareholder’s rights in the best interests of the Bank.
On 6 April 2016, in accordance with relevant rules of the CSRC, in order to ensure the effective fulfilment of the measures to make up for the immediate return diluted by the issuance of preference shares of the Bank, Huijin undertook not to intervene with the operation and management of the Bank and not to misappropriate the interests of the Bank.
As of 30 June 2021, Huijin had not breached any of the above undertakings.
Misappropriation of Funds for Non-operational Purpose
During the reporting period, there was no misappropriation of the Bank’s funds by its controlling shareholder or other related parties for non-operational purpose.
Illegal Guarantees
During the reporting period, the Bank had not entered into any guarantee contract in non-compliance.
Material Litigations and Arbitrations
During the reporting period, the Bank was not subject to any material litigation or arbitration.
Purchase, Sale and Redemption of Shares
During the reporting period, there was no purchase, sale or redemption of the shares of the Bank by the Bank or any of its subsidiaries.
Penalties
During the reporting period, the Bank was not subject to any investigations in accordance with the law for any suspected crimes. Neither the controlling shareholder, the actual controller, the directors, the supervisors nor senior management of the Bank was subject to coercive measures in accordance with the law for any suspected crimes or was detained by disciplinary inspection and supervision authorities for suspected serious violations of discipline and law or duty-related crimes and was unable to fulfil the duties due to such reason. Neither the Bank, its controlling shareholder, the actual controller, the directors, the supervisors nor senior management was subject to criminal penalty, investigation or administrative penalty by the CSRC for suspected violations of discipline and law, material administrative punishments by other relevant authorities, or administrative supervision measures by the CSRC and disciplinary sanctions by the stock exchanges. Neither the directors, the supervisors nor senior management of the Bank was subject to coercive measures by other relevant authorities for suspected violations of laws and regulations and was unable to fulfil the duties due to such reason.
Integrity
During the reporting period, there was no significant unperformed judgement of the courts, or significant outstanding debt at maturity of the Bank and its controlling shareholder.
Material Related Party Transactions
During the reporting period, there was no material related party transaction of the Bank. For the details of related party transactions, please refer to “Related party relationships and transactions” in the notes to the financial statements.
68 China Construction Bank Corporation Half-Year Report 2021
7 Major Issues
Material Contracts and Their Performance
During the reporting period, the Bank did not enter into any material arrangement for custody, contracting or leasing of other companies’ assets, or allow its assets to be subject to such arrangements by other companies.
The guarantee business is an off-balance sheet service in the ordinary course of the Bank’s business. The Bank did not have any material guarantee that is required to be disclosed except for the financial guarantee services within its business scope approved by the regulators. During the reporting period, the Bank did not enter into any other material contract that is required to be disclosed.
Other Shareholding or Share Participations
In May 2021, the Bank completed the fourth capital contribution of RMB750 million to the National Financing Guarantee Fund Co., Ltd. Up to now, the Bank has completed all four instalments of capital contribution with the total capital contribution of RMB3 billion. Please refer to the announcement published by the Bank on 31 July 2018 for details.
In April 2021, upon approval of the CBIRC, the Bank intended to contribute RMB8 billion to the National Green Development Fund Co., Ltd. In May 2021, the Bank completed the first capital contribution of RMB800 million. Please refer to the announcement published by the Bank on 29 April 2021 for details.
In March 2021, CCB Investment completed the procedures related to capital injection, and the registered capital increased from RMB12 billion to RMB27 billion. Please refer to the announcement published by the Bank on 2 December 2020 for details.
Major Events
In April 2021, the Bank simultaneously issued multi-currency ESG-themed bonds overseas, including three-year and five-year dual tranche sustainability-linked bonds of US$1.15 billion, a three-year green bond of EUR800 million, and a two-year offshore transition bond of RMB2 billion. The USD bond, listed simultaneously in Hong Kong and Dubai exchanges, was the first sustainability-linked USD bond issued by financial institution; the EUR bond, listed simultaneously in Hong Kong, Luxembourg and London exchanges, was the first offshore “water area protection” themed green bond issued by Chinese-funded institutions; the offshore RMB bond, listed simultaneously in Hong Kong and Singapore exchanges, was the largest offshore RMB transition bond.
In January 2021, with approvals from the CBIRC and PBC, the Bank issued a three-year special financial bond for small and micro business loans with a fixed interest rate of 3.30% and a total face value of RMB20 billion issued in the domestic interbank bond market. The proceeds were specifically used for financing small and micro business loans. Please refer to the announcement published by the Bank on 27 January 2021 for details.
For other major events during the reporting period, please refer to announcements disclosed by the Bank on the websites of Shanghai Stock Exchange, Hong Kong Stock Exchange and the Bank.
Review of Half-Year Report
The Group’s 2021 half-year financial statements prepared under PRC GAAP have been reviewed by Ernst & Young Hua Ming LLP, and the Group’s 2021 half-year financial statements prepared under IFRS have been reviewed by Ernst & Young.
The Group’s 2021 half-year report has been reviewed by the audit committee of the Bank and approved by the Board.
Events after the Reporting Period
On 10 August 2021, the Bank completed the issuance of Tier 2 capital bonds amounting to RMB80 billion in the domestic market. The bonds consist of two types. The first type of the bonds is fixed rate bonds with a term of 10 years, coupon rate of 3.45% and an issue size of RMB65 billion, and the issuer is entitled to redeem such bonds at the end of the fifth year. The second type of the bonds is fixed rate bonds with a term of 15 years, coupon rate of 3.80% and an issue size of RMB15 billion, and the issuer is entitled to redeem such bonds at the end of the tenth year. Proceeds were used to replenish the Bank’s Tier 2 capital.
On 22 July 2021, the Group completed the issuance of US$600 million fixed-rate bonds maturing in 2026 with a five-year term and a coupon rate of 1.80% in the overseas market.
Appendix I: Independent Auditor’s Report and Financial Statements
China Construction Bank CorporationHalf-Year Report 2021 69
CONTENTS
Report on Review of Interim Financial Information 70
Financial Statements
Consolidated statement of comprehensive income 71
Consolidated statement of financial position 73
Consolidated statement of changes in equity 74
Consolidated statement of cash flows 76
Notes to the Financial Statements
1 Company information 78
2 Basis of preparation and significant accounting policies 78
3 Net interest income 80
4 Net fee and commission income 81
5 Net trading gain 81
6 Dividend income 81
7 Net gain arising from investment securities 82
8 Net gain on derecognition of financial assets measured at amortised cost
82
9 Other operating income, net 82
10 Operating expenses 83
11 Credit impairment losses 83
12 Other impairment losses 83
13 Income tax expense 84
14 Earnings per share 84
15 Cash and deposits with central banks 85
16 Deposits with banks and non-bank financial institutions 85
17 Placements with banks and non-bank financial institutions 86
18 Derivatives and hedge accounting 86
19 Financial assets held under resale agreements 88
20 Loans and advances to customers 88
21 Financial investments 92
22 Long-term equity investments 99
23 Structured entities 102
24 Fixed assets 103
25 Land use rights 104
26 Intangible assets 104
27 Goodwill 105
28 Deferred tax 106
29 Other assets 107
30 Movements of allowances for impairment losses 108
31 Borrowings from central banks 108
32 Deposits from banks and non-bank financial institutions 109
33 Placements from banks and non-bank financial institutions 109
34 Financial liabilities measured at fair value through profit or loss 110
35 Financial assets sold under repurchase agreements 110
36 Deposits from customers 111
37 Accrued staff costs 112
38 Taxes payable 114
39 Provisions 115
40 Debt securities issued 116
41 Other liabilities 118
42 Share capital 118
43 Other equity instruments 119
44 Capital reserve 121
45 Other comprehensive income 122
46 Surplus reserve 123
47 General reserve 123
48 Profit distribution 123
49 Notes to the statement of cash flows 123
50 Transferred financial assets 124
51 Operating segments 124
52 Entrusted lending business 130
53 Pledged assets 130
54 Commitments and contingent liabilities 130
55 Related party relationships and transactions 132
56 Risk Management 136
57 Statement of financial position and statement of changes in equity of the Bank
165
58 Events after the reporting period 168
59 Comparative figures 168
60 Ultimate parent 168
61 Possible impact of amendments, new standards and interpretations issued but not yet effective
169
Unaudited Supplementary Financial Information
1 Difference between the financial statements prepared under IFRS and those prepared in accordance with PRC GAAP
171
2 Liquidity coverage ratio and net stable funding ratio 171
3 Leverage Ratio 173
4 Currency concentrations 174
5 International claims 175
6 Overdue loans and advances to customers by geographical sector
176
7 Exposures to non-banks in the Chinese mainland 176
Report on Review of Interim Financial Information
70 China Construction Bank Corporation Half-Year Report 2021
27/F, One Taikoo Place, 979 King’s Road, Quarry Bay, Hong Kong
To the Board of Directors of China Construction Bank Corporation(Established in the People’s Republic of China with limited liability)
IntroductionWe have reviewed the accompanying interim condensed financial information set out on pages 71 to 170, which comprises the consolidated statement of financial position of China Construction Bank Corporation (the “Bank”) and its subsidiaries (the “Group”) as at 30 June 2021 and the consolidated statement of comprehensive income, the consolidated statement of changes in equity and the consolidated statement of cash flows for the six-month period then ended, and condensed explanatory notes. The Rules Governing the Listing of Securities on The Stock Exchange of Hong Kong Limited require the preparation of a report on interim financial information to be in compliance with the relevant provisions thereof and International Accounting Standard 34 Interim Financial Reporting (“IAS 34”) issued by the International Accounting Standards Board. The directors of the Bank are responsible for the preparation and presentation of interim condensed financial information in accordance with IAS 34. Our responsibility is to express a conclusion on this interim condensed financial information based on our review. Our report is made solely to you, as a body, in accordance with our agreed terms of engagement, and for no other purpose. We do not assume responsibility towards or accept liability to any other person for the contents of this report.
Scope of reviewWe conducted our review in accordance with Hong Kong Standard on Review Engagements 2410 Review of Interim Financial Information Performed by the Independent Auditor of the Entity issued by the Hong Kong Institute of Certified Public Accountants. A review of interim financial information consists of making inquiries, primarily of persons responsible for financial and accounting matters, and applying analytical and other review procedures. A review is substantially less in scope than an audit conducted in accordance with Hong Kong Standards on Auditing and consequently does not enable us to obtain assurance that we would become aware of all significant matters that might be identified in an audit. Accordingly, we do not express an audit opinion.
ConclusionBased on our review, nothing has come to our attention that causes us to believe that the accompanying interim condensed financial information is not prepared, in all material respects, in accordance with IAS 34.
Ernst & YoungCertified Public Accountants
Hong Kong27 August 2021
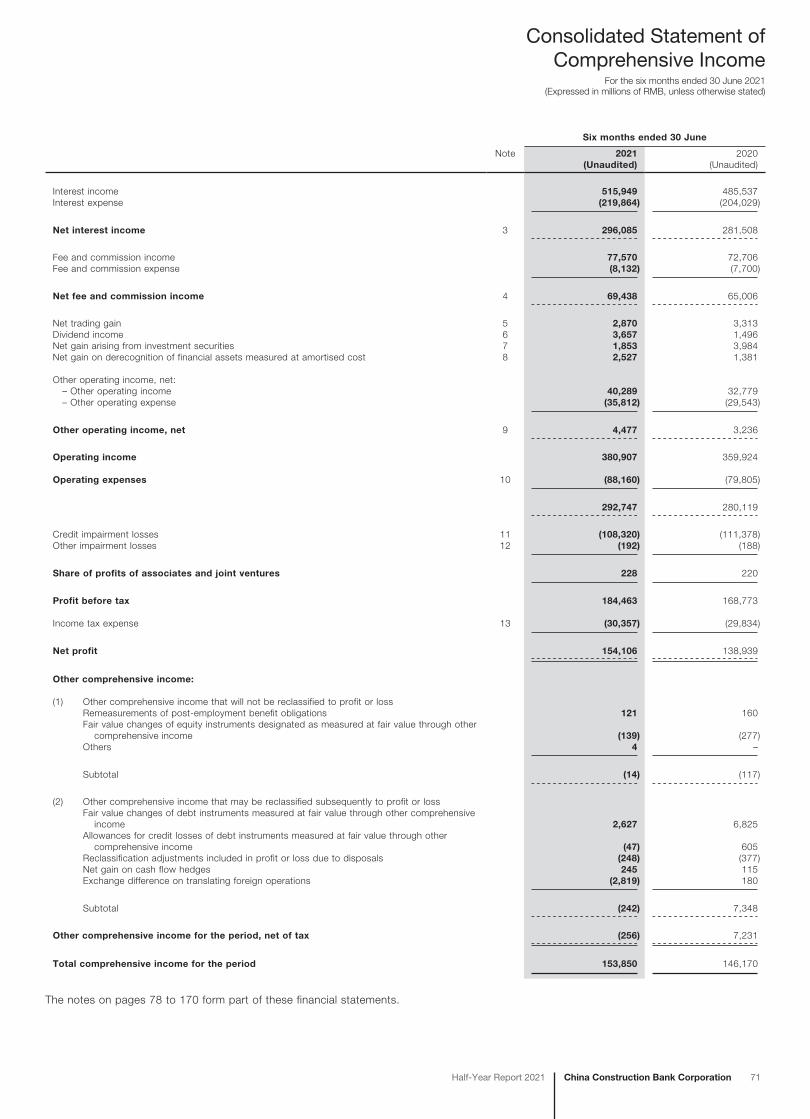
Consolidated Statement of Comprehensive Income
For the six months ended 30 June 2021(Expressed in millions of RMB, unless otherwise stated)
China Construction Bank CorporationHalf-Year Report 2021 71
Six months ended 30 June
Note 2021 2020(Unaudited) (Unaudited)
Interest income 515,949 485,537Interest expense (219,864) (204,029)
Net interest income 3 296,085 281,508
Fee and commission income 77,570 72,706Fee and commission expense (8,132) (7,700)
Net fee and commission income 4 69,438 65,006
Net trading gain 5 2,870 3,313Dividend income 6 3,657 1,496Net gain arising from investment securities 7 1,853 3,984Net gain on derecognition of financial assets measured at amortised cost 8 2,527 1,381
Other operating income, net: – Other operating income 40,289 32,779 – Other operating expense (35,812) (29,543)
Other operating income, net 9 4,477 3,236
Operating income 380,907 359,924
Operating expenses 10 (88,160) (79,805)
292,747 280,119
Credit impairment losses 11 (108,320) (111,378)Other impairment losses 12 (192) (188)
Share of profits of associates and joint ventures 228 220
Profit before tax 184,463 168,773
Income tax expense 13 (30,357) (29,834)
Net profit 154,106 138,939
Other comprehensive income:
(1) Other comprehensive income that will not be reclassified to profit or lossRemeasurements of post-employment benefit obligations 121 160Fair value changes of equity instruments designated as measured at fair value through other
comprehensive income (139) (277)Others 4 –
Subtotal (14) (117)
(2) Other comprehensive income that may be reclassified subsequently to profit or lossFair value changes of debt instruments measured at fair value through other comprehensive
income 2,627 6,825Allowances for credit losses of debt instruments measured at fair value through other
comprehensive income (47) 605Reclassification adjustments included in profit or loss due to disposals (248) (377)Net gain on cash flow hedges 245 115Exchange difference on translating foreign operations (2,819) 180
Subtotal (242) 7,348
Other comprehensive income for the period, net of tax (256) 7,231
Total comprehensive income for the period 153,850 146,170
The notes on pages 78 to 170 form part of these financial statements.
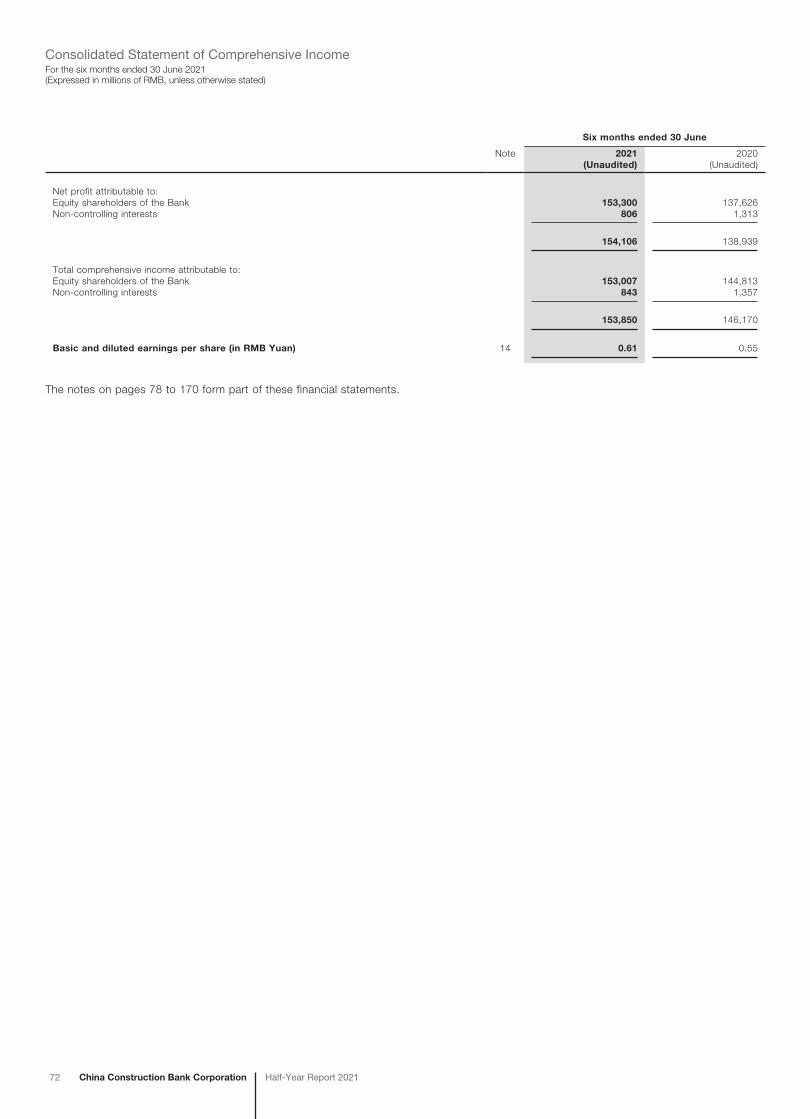
72 China Construction Bank Corporation Half-Year Report 2021
Consolidated Statement of Comprehensive IncomeFor the six months ended 30 June 2021(Expressed in millions of RMB, unless otherwise stated)
Six months ended 30 June
Note 2021 2020(Unaudited) (Unaudited)
Net profit attributable to:Equity shareholders of the Bank 153,300 137,626Non-controlling interests 806 1,313
154,106 138,939
Total comprehensive income attributable to:Equity shareholders of the Bank 153,007 144,813Non-controlling interests 843 1,357
153,850 146,170
Basic and diluted earnings per share (in RMB Yuan) 14 0.61 0.55
The notes on pages 78 to 170 form part of these financial statements.
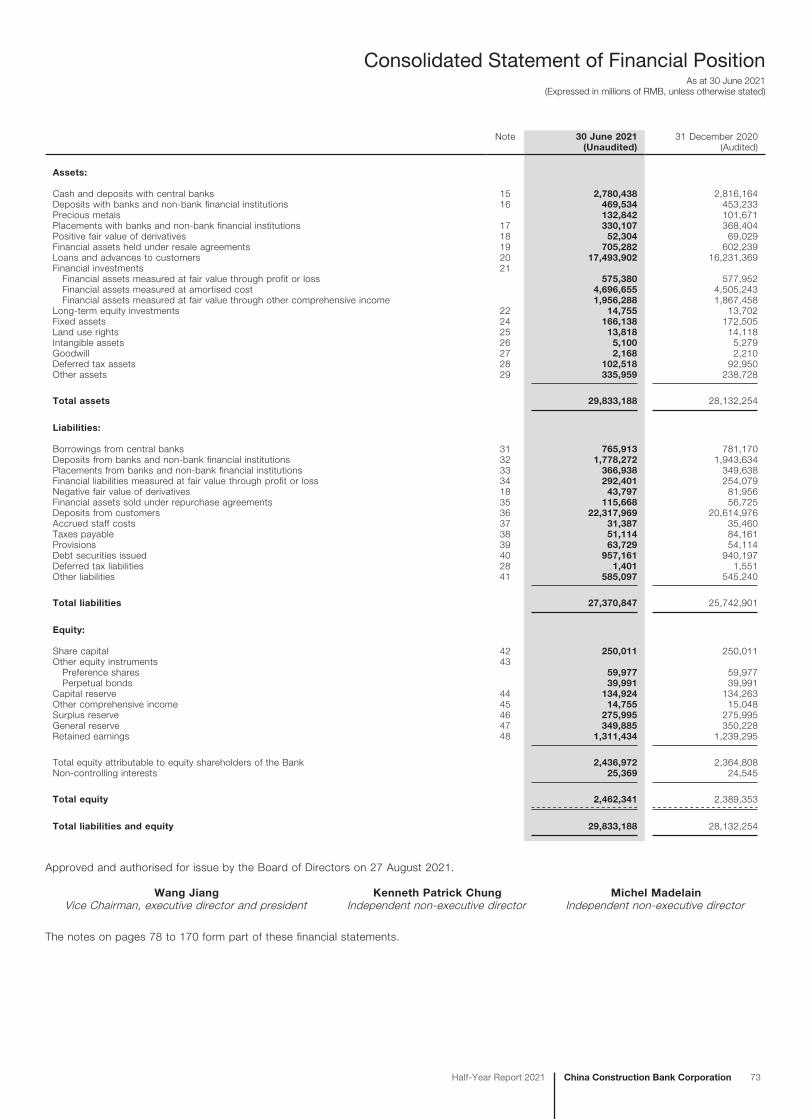
China Construction Bank CorporationHalf-Year Report 2021 73
Consolidated Statement of Financial PositionAs at 30 June 2021
(Expressed in millions of RMB, unless otherwise stated)
Note 30 June 2021 31 December 2020(Unaudited) (Audited)
Assets:
Cash and deposits with central banks 15 2,780,438 2,816,164Deposits with banks and non-bank financial institutions 16 469,534 453,233Precious metals 132,842 101,671Placements with banks and non-bank financial institutions 17 330,107 368,404Positive fair value of derivatives 18 52,304 69,029Financial assets held under resale agreements 19 705,282 602,239Loans and advances to customers 20 17,493,902 16,231,369Financial investments 21 Financial assets measured at fair value through profit or loss 575,380 577,952 Financial assets measured at amortised cost 4,696,655 4,505,243 Financial assets measured at fair value through other comprehensive income 1,956,288 1,867,458Long-term equity investments 22 14,755 13,702Fixed assets 24 166,138 172,505Land use rights 25 13,818 14,118Intangible assets 26 5,100 5,279Goodwill 27 2,168 2,210Deferred tax assets 28 102,518 92,950Other assets 29 335,959 238,728
Total assets 29,833,188 28,132,254
Liabilities:
Borrowings from central banks 31 765,913 781,170Deposits from banks and non-bank financial institutions 32 1,778,272 1,943,634Placements from banks and non-bank financial institutions 33 366,938 349,638Financial liabilities measured at fair value through profit or loss 34 292,401 254,079Negative fair value of derivatives 18 43,797 81,956Financial assets sold under repurchase agreements 35 115,668 56,725Deposits from customers 36 22,317,969 20,614,976Accrued staff costs 37 31,387 35,460Taxes payable 38 51,114 84,161Provisions 39 63,729 54,114Debt securities issued 40 957,161 940,197Deferred tax liabilities 28 1,401 1,551Other liabilities 41 585,097 545,240
Total liabilities 27,370,847 25,742,901
Equity:
Share capital 42 250,011 250,011Other equity instruments 43 Preference shares 59,977 59,977 Perpetual bonds 39,991 39,991Capital reserve 44 134,924 134,263Other comprehensive income 45 14,755 15,048Surplus reserve 46 275,995 275,995General reserve 47 349,885 350,228Retained earnings 48 1,311,434 1,239,295
Total equity attributable to equity shareholders of the Bank 2,436,972 2,364,808Non-controlling interests 25,369 24,545
Total equity 2,462,341 2,389,353
Total liabilities and equity 29,833,188 28,132,254
Approved and authorised for issue by the Board of Directors on 27 August 2021.
Wang Jiang Kenneth Patrick Chung Michel MadelainVice Chairman, executive director and president Independent non-executive director Independent non-executive director
The notes on pages 78 to 170 form part of these financial statements.
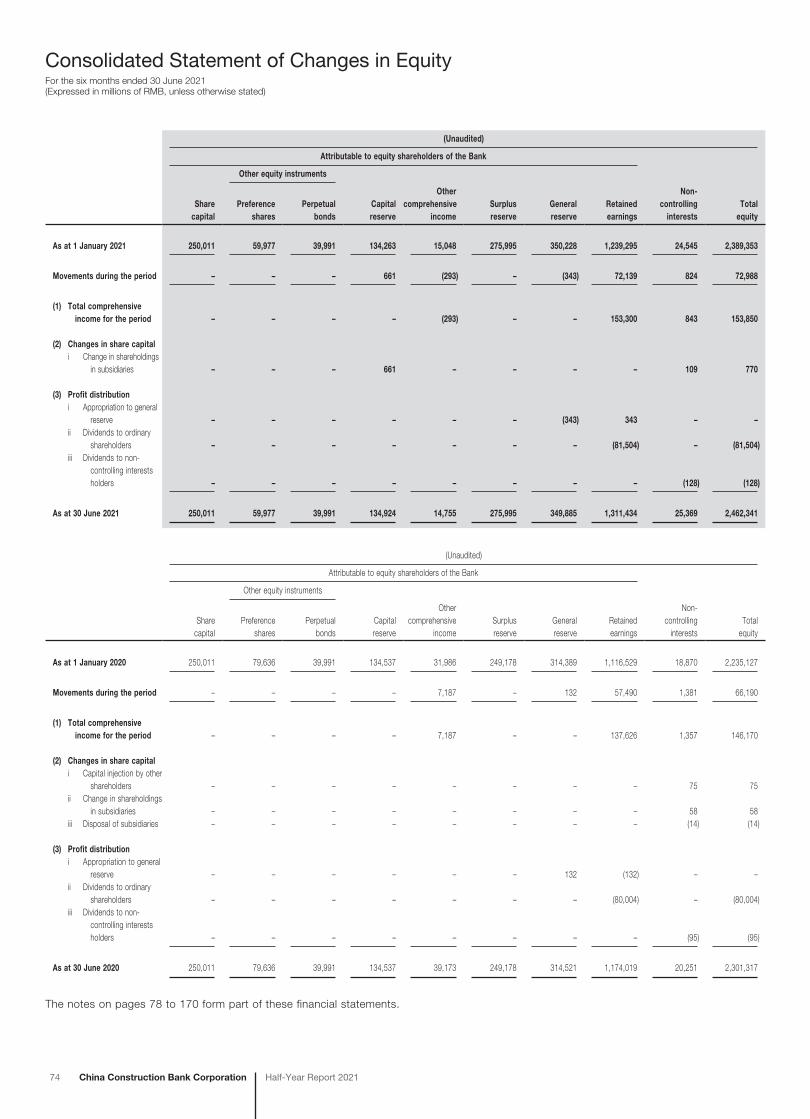
74 China Construction Bank Corporation Half-Year Report 2021
Consolidated Statement of Changes in EquityFor the six months ended 30 June 2021(Expressed in millions of RMB, unless otherwise stated)
(Unaudited)
Attributable to equity shareholders of the Bank
Other equity instruments
Sharecapital
Preferenceshares
Perpetual bonds
Capitalreserve
Other comprehensive
incomeSurplusreserve
Generalreserve
Retainedearnings
Non-controlling
interestsTotal
equity
As at 1 January 2021 250,011 59,977 39,991 134,263 15,048 275,995 350,228 1,239,295 24,545 2,389,353
Movements during the period – – – 661 (293) – (343) 72,139 824 72,988
(1) Total comprehensive income for the period – – – – (293) – – 153,300 843 153,850
(2) Changes in share capitali Change in shareholdings
in subsidiaries – – – 661 – – – – 109 770
(3) Profit distributioni Appropriation to general
reserve – – – – – – (343) 343 – –ii Dividends to ordinary
shareholders – – – – – – – (81,504) – (81,504)iii Dividends to non-
controlling interests holders – – – – – – – – (128) (128)
As at 30 June 2021 250,011 59,977 39,991 134,924 14,755 275,995 349,885 1,311,434 25,369 2,462,341
(Unaudited)
Attributable to equity shareholders of the Bank
Other equity instruments
Sharecapital
Preferenceshares
Perpetual bonds
Capitalreserve
Other comprehensive
incomeSurplusreserve
Generalreserve
Retainedearnings
Non-controlling
interestsTotal
equity
As at 1 January 2020 250,011 79,636 39,991 134,537 31,986 249,178 314,389 1,116,529 18,870 2,235,127
Movements during the period – – – – 7,187 – 132 57,490 1,381 66,190
(1) Total comprehensive income for the period – – – – 7,187 – – 137,626 1,357 146,170
(2) Changes in share capitali Capital injection by other
shareholders – – – – – – – – 75 75ii Change in shareholdings
in subsidiaries – – – – – – – – 58 58iii Disposal of subsidiaries – – – – – – – – (14) (14)
(3) Profit distributioni Appropriation to general
reserve – – – – – – 132 (132) – –ii Dividends to ordinary
shareholders – – – – – – – (80,004) – (80,004)iii Dividends to non-
controlling interests holders – – – – – – – – (95) (95)
As at 30 June 2020 250,011 79,636 39,991 134,537 39,173 249,178 314,521 1,174,019 20,251 2,301,317
The notes on pages 78 to 170 form part of these financial statements.
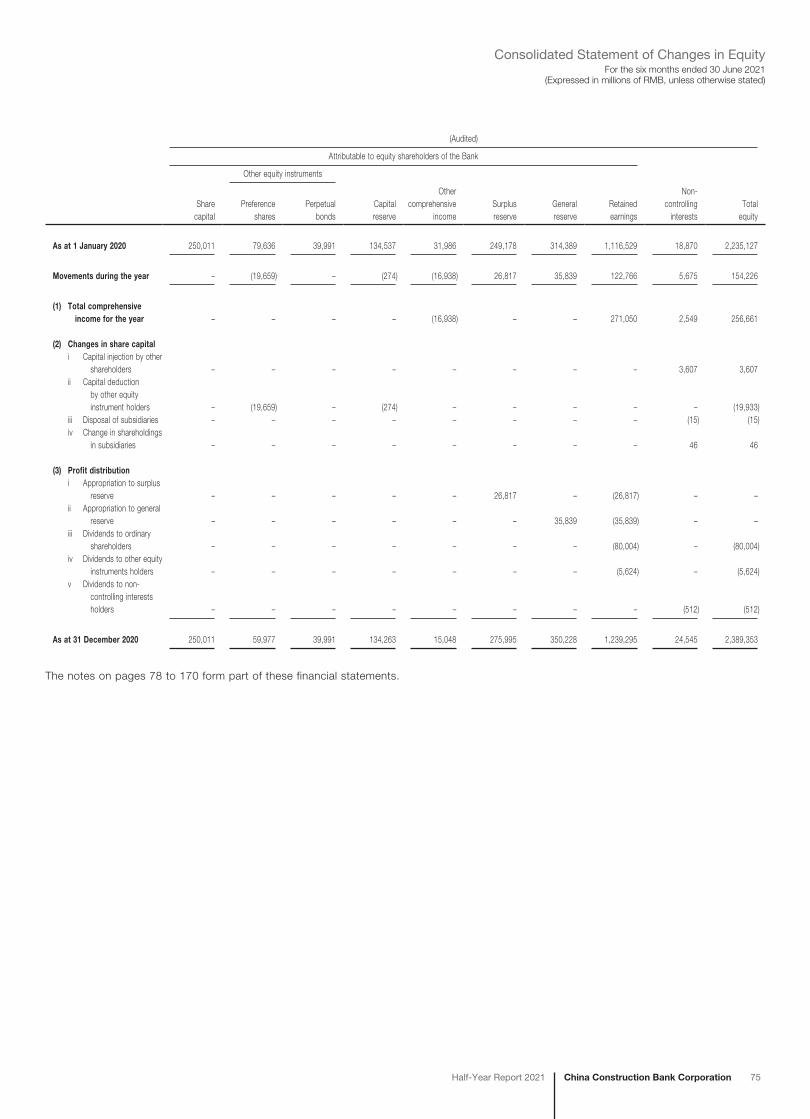
China Construction Bank CorporationHalf-Year Report 2021 75
For the six months ended 30 June 2021(Expressed in millions of RMB, unless otherwise stated)
Consolidated Statement of Changes in Equity
(Audited)
Attributable to equity shareholders of the Bank
Other equity instruments
Sharecapital
Preferenceshares
Perpetual bonds
Capitalreserve
Other comprehensive
incomeSurplusreserve
Generalreserve
Retainedearnings
Non-controlling
interestsTotal
equity
As at 1 January 2020 250,011 79,636 39,991 134,537 31,986 249,178 314,389 1,116,529 18,870 2,235,127
Movements during the year – (19,659) – (274) (16,938) 26,817 35,839 122,766 5,675 154,226
(1) Total comprehensive income for the year – – – – (16,938) – – 271,050 2,549 256,661
(2) Changes in share capitali Capital injection by other
shareholders – – – – – – – – 3,607 3,607ii Capital deduction
by other equity instrument holders – (19,659) – (274) – – – – – (19,933)
iii Disposal of subsidiaries – – – – – – – – (15) (15)iv Change in shareholdings
in subsidiaries – – – – – – – – 46 46
(3) Profit distributioni Appropriation to surplus
reserve – – – – – 26,817 – (26,817) – –ii Appropriation to general
reserve – – – – – – 35,839 (35,839) – –iii Dividends to ordinary
shareholders – – – – – – – (80,004) – (80,004)iv Dividends to other equity
instruments holders – – – – – – – (5,624) – (5,624)v Dividends to non-
controlling interests holders – – – – – – – – (512) (512)
As at 31 December 2020 250,011 59,977 39,991 134,263 15,048 275,995 350,228 1,239,295 24,545 2,389,353
The notes on pages 78 to 170 form part of these financial statements.
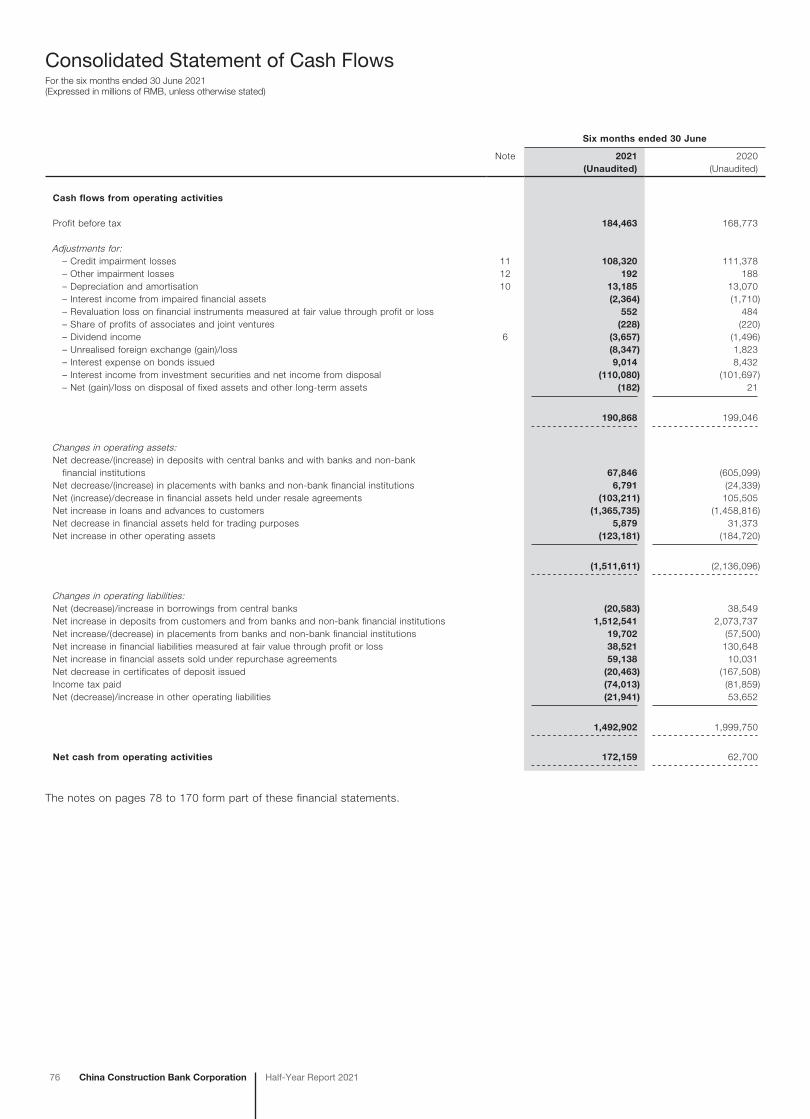
76 China Construction Bank Corporation Half-Year Report 2021
Consolidated Statement of Cash FlowsFor the six months ended 30 June 2021(Expressed in millions of RMB, unless otherwise stated)
Six months ended 30 June
Note 2021 2020(Unaudited) (Unaudited)
Cash flows from operating activities
Profit before tax 184,463 168,773
Adjustments for: – Credit impairment losses 11 108,320 111,378 – Other impairment losses 12 192 188 – Depreciation and amortisation 10 13,185 13,070 – Interest income from impaired financial assets (2,364) (1,710) – Revaluation loss on financial instruments measured at fair value through profit or loss 552 484 – Share of profits of associates and joint ventures (228) (220) – Dividend income 6 (3,657) (1,496) – Unrealised foreign exchange (gain)/loss (8,347) 1,823 – Interest expense on bonds issued 9,014 8,432 – Interest income from investment securities and net income from disposal (110,080) (101,697) – Net (gain)/loss on disposal of fixed assets and other long-term assets (182) 21
190,868 199,046
Changes in operating assets:Net decrease/(increase) in deposits with central banks and with banks and non-bank financial institutions 67,846 (605,099)Net decrease/(increase) in placements with banks and non-bank financial institutions 6,791 (24,339)Net (increase)/decrease in financial assets held under resale agreements (103,211) 105,505Net increase in loans and advances to customers (1,365,735) (1,458,816)Net decrease in financial assets held for trading purposes 5,879 31,373Net increase in other operating assets (123,181) (184,720)
(1,511,611) (2,136,096)
Changes in operating liabilities:Net (decrease)/increase in borrowings from central banks (20,583) 38,549Net increase in deposits from customers and from banks and non-bank financial institutions 1,512,541 2,073,737Net increase/(decrease) in placements from banks and non-bank financial institutions 19,702 (57,500)Net increase in financial liabilities measured at fair value through profit or loss 38,521 130,648Net increase in financial assets sold under repurchase agreements 59,138 10,031Net decrease in certificates of deposit issued (20,463) (167,508)Income tax paid (74,013) (81,859)Net (decrease)/increase in other operating liabilities (21,941) 53,652
1,492,902 1,999,750
Net cash from operating activities 172,159 62,700
The notes on pages 78 to 170 form part of these financial statements.
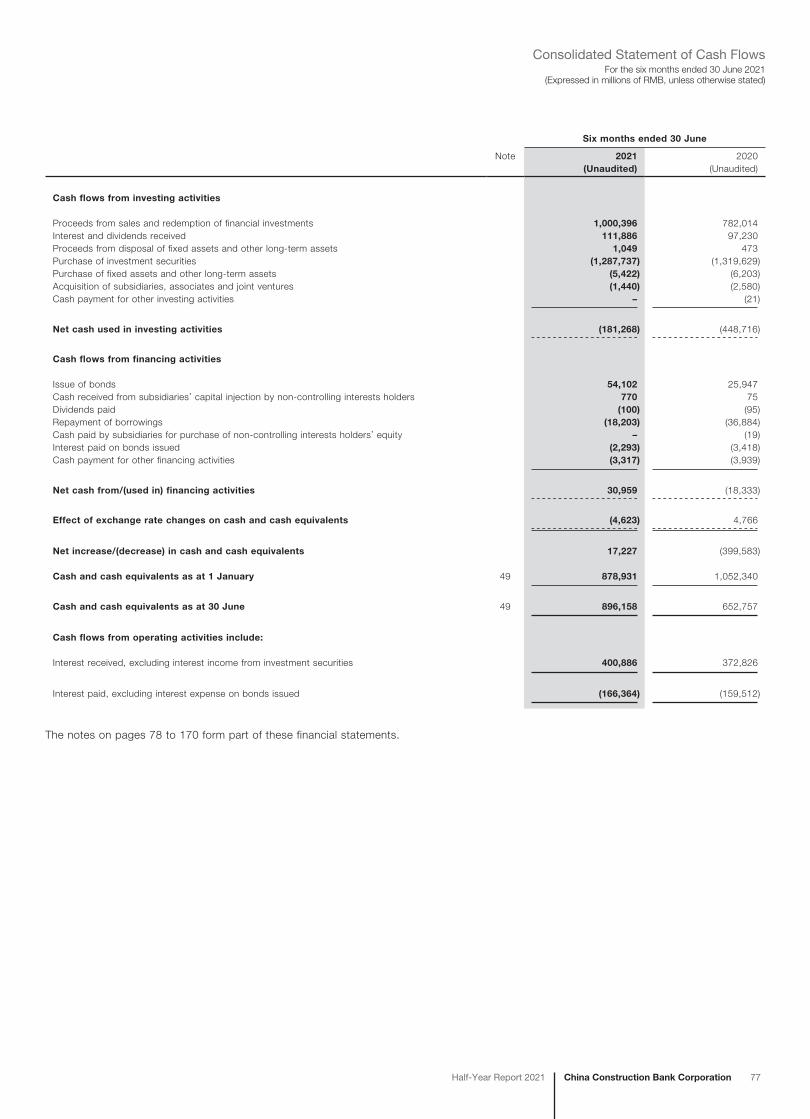
China Construction Bank CorporationHalf-Year Report 2021 77
For the six months ended 30 June 2021(Expressed in millions of RMB, unless otherwise stated)
Consolidated Statement of Cash Flows
Six months ended 30 June
Note 2021 2020(Unaudited) (Unaudited)
Cash flows from investing activities
Proceeds from sales and redemption of financial investments 1,000,396 782,014Interest and dividends received 111,886 97,230Proceeds from disposal of fixed assets and other long-term assets 1,049 473Purchase of investment securities (1,287,737) (1,319,629)Purchase of fixed assets and other long-term assets (5,422) (6,203)Acquisition of subsidiaries, associates and joint ventures (1,440) (2,580)Cash payment for other investing activities – (21)
Net cash used in investing activities (181,268) (448,716)
Cash flows from financing activities
Issue of bonds 54,102 25,947Cash received from subsidiaries’ capital injection by non-controlling interests holders 770 75Dividends paid (100) (95)Repayment of borrowings (18,203) (36,884)Cash paid by subsidiaries for purchase of non-controlling interests holders’ equity – (19)Interest paid on bonds issued (2,293) (3,418)Cash payment for other financing activities (3,317) (3,939)
Net cash from/(used in) financing activities 30,959 (18,333)
Effect of exchange rate changes on cash and cash equivalents (4,623) 4,766
Net increase/(decrease) in cash and cash equivalents 17,227 (399,583)
Cash and cash equivalents as at 1 January 49 878,931 1,052,340
Cash and cash equivalents as at 30 June 49 896,158 652,757
Cash flows from operating activities include:
Interest received, excluding interest income from investment securities 400,886 372,826
Interest paid, excluding interest expense on bonds issued (166,364) (159,512)
The notes on pages 78 to 170 form part of these financial statements.
Notes to the Financial Statements(Expressed in millions of RMB, unless otherwise stated)
78 China Construction Bank Corporation Half-Year Report 2021
1 Company informationThe history of China Construction Bank Corporation (the “Bank”) dates back to 1954, which was previously known as the People’s Construction Bank of China when it was established. It was responsible for the management and distribution of government funds for construction and infrastructure related projects under the state economic plan. The People’s Construction Bank of China gradually evolved into a comprehensive commercial bank following the takeover of the function of granting policy loans by China Development Bank in 1994. In 1996, the People’s Construction Bank of China changed its name to China Construction Bank (“CCB”). On 17 September 2004, China Construction Bank Corporation was established in the People’s Republic of China (the “PRC”) as a result of a separation procedure undertaken by its predecessor, China Construction Bank. In October 2005 and September 2007, the Bank’s H shares and A shares were listed on the Hong Kong Stock Exchange (Stock Code: 939) and the Shanghai Stock Exchange (Stock Code: 601939), successively. As at 30 June 2021, the Bank issued the total ordinary share capital of RMB250,011 million, with a par value of RMB1.00 per share.
The Bank obtained its finance permit No. B0004H111000001 from the China Banking Regulatory Commission (“CBRC”) (In 2018, it was renamed as China Banking and Insurance Regulatory Commission, hereinafter referred to as the “CBIRC”) of the PRC. The Bank obtained its unified social credit code No.911100001000044477 from the Beijing Administration for Industry and Commerce. The registered office of the Bank is located at No.25, Financial Street, Xicheng District, Beijing, the PRC.
The principal activities of the Bank and its subsidiaries (collectively the “Group”) are the provision of corporate and personal banking services, conducting treasury business, the provision of asset management, trustee, finance leasing, investment banking, insurance and other financial services. The Group mainly operates in the Chinese mainland and also has a number of overseas branches and subsidiaries. For the purpose of these financial statements, “the Chinese mainland” refers to the PRC excluding the Hong Kong Special Administrative Region of the PRC (“Hong Kong”), the Macau Special Administrative Region of the PRC (“Macau”) and Taiwan. “Overseas” refers to countries and regions other than the Chinese mainland.
The Bank is under the supervision of the banking regulatory bodies empowered by the State Council of the PRC (the “State Council”). The overseas financial institutions of the Bank are required to comply with the regulatory requirements of their respective local jurisdictions. Central Huijin Investment Ltd. (“Huijin”), a wholly-owned subsidiary of China Investment Corporation (“CIC”), exercises its rights and obligations as an investor in accordance with laws on behalf of the PRC government.
2 Basis of preparation and significant accounting policies(1) Basis of preparation
The interim financial statements have been prepared in accordance with International Accounting Standard (“IAS”) 34 Interim Financial Reporting and all applicable disclosure provisions of the Rules Governing the Listing of Securities on the Stock Exchange of Hong Kong Limited.
The unaudited interim financial statements contain selected explanatory notes, which provide explanations of events and transactions that are significant to the understanding of the changes in financial position and performance of the Group since the financial statements for the year ended 31 December 2020. The selected notes do not include all of the information and disclosures required for a full set of financial statements prepared in accordance with International Financial Reporting Standards (“IFRSs”), and should be read in conjunction with the Group’s annual financial statements for the year ended 31 December 2020.
(2) Use of estimates and assumptionsThe preparation of the interim financial statements requires management to make judgements, estimates and assumptions that affect the application of policies and reported amounts of assets and liabilities, income and expenses. Actual results in the future may differ from those reported as a result of the use of estimates and assumptions about future conditions.
(3) ConsolidationThe interim financial statements comprise the Bank and its subsidiaries and the Group’s interests in associates and joint ventures.
The financial results and performance of subsidiaries are included in the consolidated financial statements from the date that control commences until the date that control ceases. Necessary adjustments on the accounting period and accounting policies of subsidiaries are made to comply with those of the Bank. Intragroup balances and transactions, and any profits or losses arising from intragroup transactions are eliminated in full in preparing the consolidated financial statements.
The Group’s interests in associates or joint ventures are included from the date that significant influence or joint control commences until the date that significant influence or joint control ceases. Profits and losses resulting from transactions between the Group and its associates or joint ventures are eliminated to the extent of the Group’s interests in the associates or joint ventures.
China Construction Bank CorporationHalf-Year Report 2021 79
(Expressed in millions of RMB, unless otherwise stated)Notes to the Financial Statements
2 Basis of preparation and significant accounting policies (continued)
(4) Changes in significant accounting policiesThe Group has adopted the following amendments for the first time for the current interim period.
Amendments to IFRS 9, IAS 39, IFRS 7, IFRS 4 and IFRS 16 Interest Rate Benchmark Reform: Phase 2Amendments to IFRS 16 COVID-19-Related Rent Concessions beyond 30 June 2021
The adoption of the above amendments does not have a significant impact on the Group’s consolidated financial statements.
Except for those described above, the significant accounting policies adopted by the Group for the interim financial statements are consistent with those applied in the preparation of the Group’s annual financial statements for the year ended 31 December 2020.
(5) TaxationThe Group’s main applicable taxes and tax rates are as follows:
Value added tax (“VAT”)Pursuant to the Circular on the Comprehensive Plan for Levying VAT in place of Business Tax (CaiShui [2016] No.36) jointly issued by the Ministry of Finance and the State Administration of Taxation, business tax that used to be levied on taxable income of the Bank and its subsidiaries in the Chinese mainland was replaced by VAT from 1 May 2016, and the main VAT taxation rate is 6%.
City construction taxCity construction tax is calculated as 1% to 7% of VAT.
Education surchargeEducation surcharge is calculated as 3% of VAT.
Local education surchargeLocal education surcharge is calculated as 2% of VAT.
Income taxThe income tax rate that is applicable to the Bank and its subsidiaries in the Chinese mainland is 25%. Taxation on overseas operations is charged at the relevant local rates. Tax paid on overseas operations is set off to the extent allowed under the relevant income tax laws of the PRC.
(6) Interim financial statementsThe interim financial statements have been reviewed by the Audit Committee of the Bank, and were approved by the Board of Directors of the Bank on 27 August 2021. The interim financial statements have also been reviewed by the Bank’s auditors, Ernst & Young, in accordance with Hong Kong Standard on Review Engagements 2410 “Review of Interim Financial Information Performed by the Independent Auditor of the Entity” issued by the Hong Kong Institute of Certified Public Accountants.
The financial information relating to the financial year ended 31 December 2020 that is included in the interim financial statements is derived from those financial statements. The auditors have expressed an unqualified opinion on those financial statements in their report dated 26 March 2021.
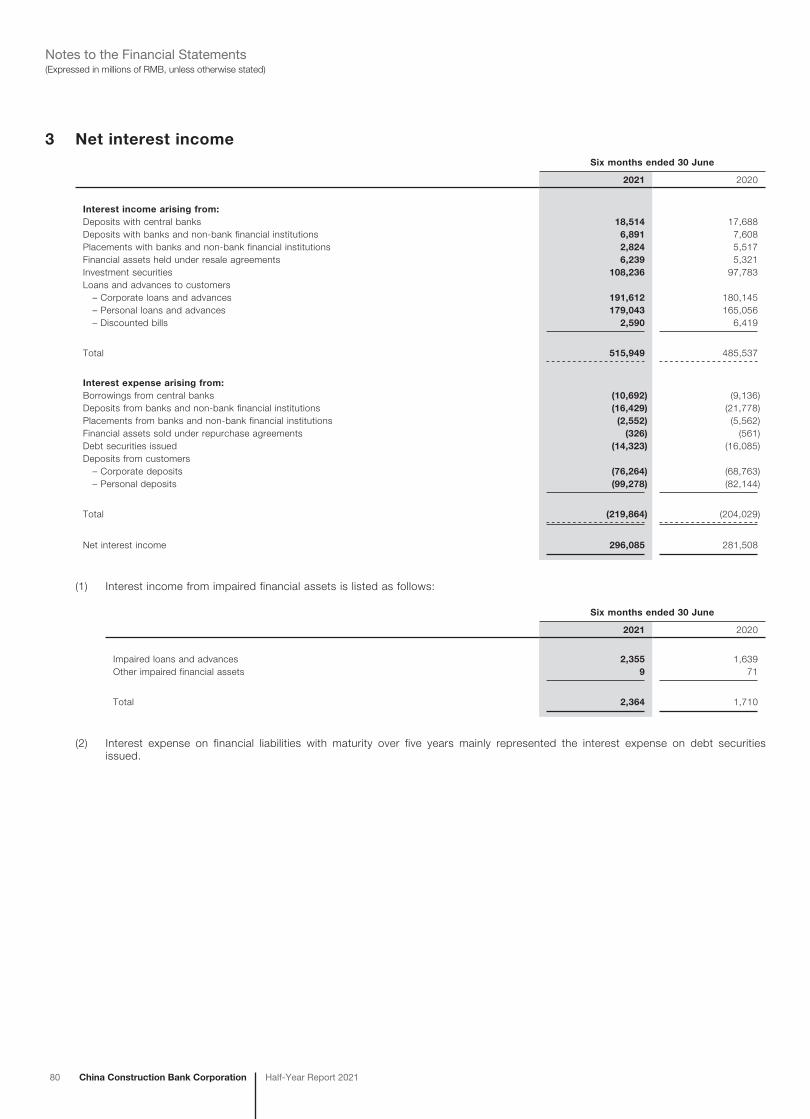
80 China Construction Bank Corporation Half-Year Report 2021
(Expressed in millions of RMB, unless otherwise stated)Notes to the Financial Statements
3 Net interest incomeSix months ended 30 June
2021 2020
Interest income arising from:Deposits with central banks 18,514 17,688Deposits with banks and non-bank financial institutions 6,891 7,608Placements with banks and non-bank financial institutions 2,824 5,517Financial assets held under resale agreements 6,239 5,321Investment securities 108,236 97,783Loans and advances to customers – Corporate loans and advances 191,612 180,145 – Personal loans and advances 179,043 165,056 – Discounted bills 2,590 6,419
Total 515,949 485,537
Interest expense arising from:Borrowings from central banks (10,692) (9,136)Deposits from banks and non-bank financial institutions (16,429) (21,778)Placements from banks and non-bank financial institutions (2,552) (5,562)Financial assets sold under repurchase agreements (326) (561)Debt securities issued (14,323) (16,085)Deposits from customers – Corporate deposits (76,264) (68,763) – Personal deposits (99,278) (82,144)
Total (219,864) (204,029)
Net interest income 296,085 281,508
(1) Interest income from impaired financial assets is listed as follows:
Six months ended 30 June
2021 2020
Impaired loans and advances 2,355 1,639Other impaired financial assets 9 71
Total 2,364 1,710
(2) Interest expense on financial liabilities with maturity over five years mainly represented the interest expense on debt securities issued.
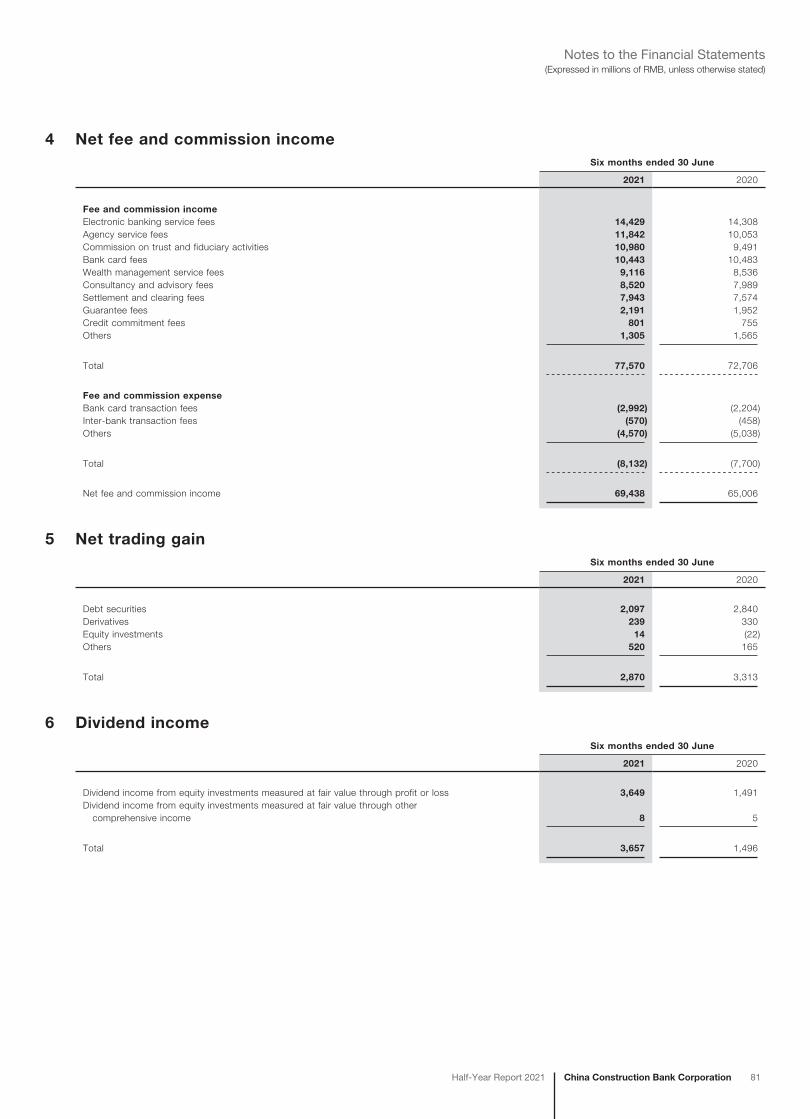
China Construction Bank CorporationHalf-Year Report 2021 81
(Expressed in millions of RMB, unless otherwise stated)Notes to the Financial Statements
4 Net fee and commission incomeSix months ended 30 June
2021 2020
Fee and commission incomeElectronic banking service fees 14,429 14,308Agency service fees 11,842 10,053Commission on trust and fiduciary activities 10,980 9,491Bank card fees 10,443 10,483Wealth management service fees 9,116 8,536Consultancy and advisory fees 8,520 7,989Settlement and clearing fees 7,943 7,574Guarantee fees 2,191 1,952Credit commitment fees 801 755Others 1,305 1,565
Total 77,570 72,706
Fee and commission expenseBank card transaction fees (2,992) (2,204)Inter-bank transaction fees (570) (458)Others (4,570) (5,038)
Total (8,132) (7,700)
Net fee and commission income 69,438 65,006
5 Net trading gainSix months ended 30 June
2021 2020
Debt securities 2,097 2,840Derivatives 239 330Equity investments 14 (22)Others 520 165
Total 2,870 3,313
6 Dividend incomeSix months ended 30 June
2021 2020
Dividend income from equity investments measured at fair value through profit or loss 3,649 1,491Dividend income from equity investments measured at fair value through other comprehensive income 8 5
Total 3,657 1,496
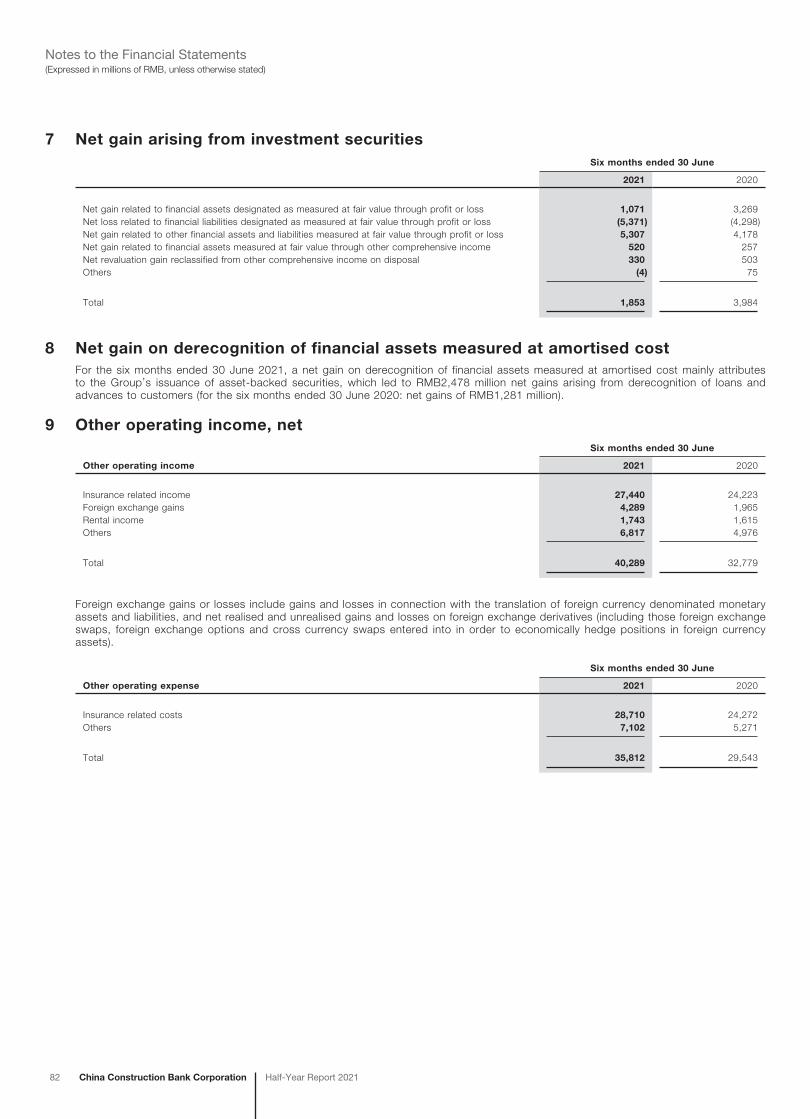
82 China Construction Bank Corporation Half-Year Report 2021
(Expressed in millions of RMB, unless otherwise stated)Notes to the Financial Statements
7 Net gain arising from investment securitiesSix months ended 30 June
2021 2020
Net gain related to financial assets designated as measured at fair value through profit or loss 1,071 3,269Net loss related to financial liabilities designated as measured at fair value through profit or loss (5,371) (4,298)Net gain related to other financial assets and liabilities measured at fair value through profit or loss 5,307 4,178Net gain related to financial assets measured at fair value through other comprehensive income 520 257Net revaluation gain reclassified from other comprehensive income on disposal 330 503Others (4) 75
Total 1,853 3,984
8 Net gain on derecognition of financial assets measured at amortised costFor the six months ended 30 June 2021, a net gain on derecognition of financial assets measured at amortised cost mainly attributes to the Group’s issuance of asset-backed securities, which led to RMB2,478 million net gains arising from derecognition of loans and advances to customers (for the six months ended 30 June 2020: net gains of RMB1,281 million).
9 Other operating income, netSix months ended 30 June
Other operating income 2021 2020
Insurance related income 27,440 24,223Foreign exchange gains 4,289 1,965Rental income 1,743 1,615Others 6,817 4,976
Total 40,289 32,779
Foreign exchange gains or losses include gains and losses in connection with the translation of foreign currency denominated monetary assets and liabilities, and net realised and unrealised gains and losses on foreign exchange derivatives (including those foreign exchange swaps, foreign exchange options and cross currency swaps entered into in order to economically hedge positions in foreign currency assets).
Six months ended 30 June
Other operating expense 2021 2020
Insurance related costs 28,710 24,272Others 7,102 5,271
Total 35,812 29,543
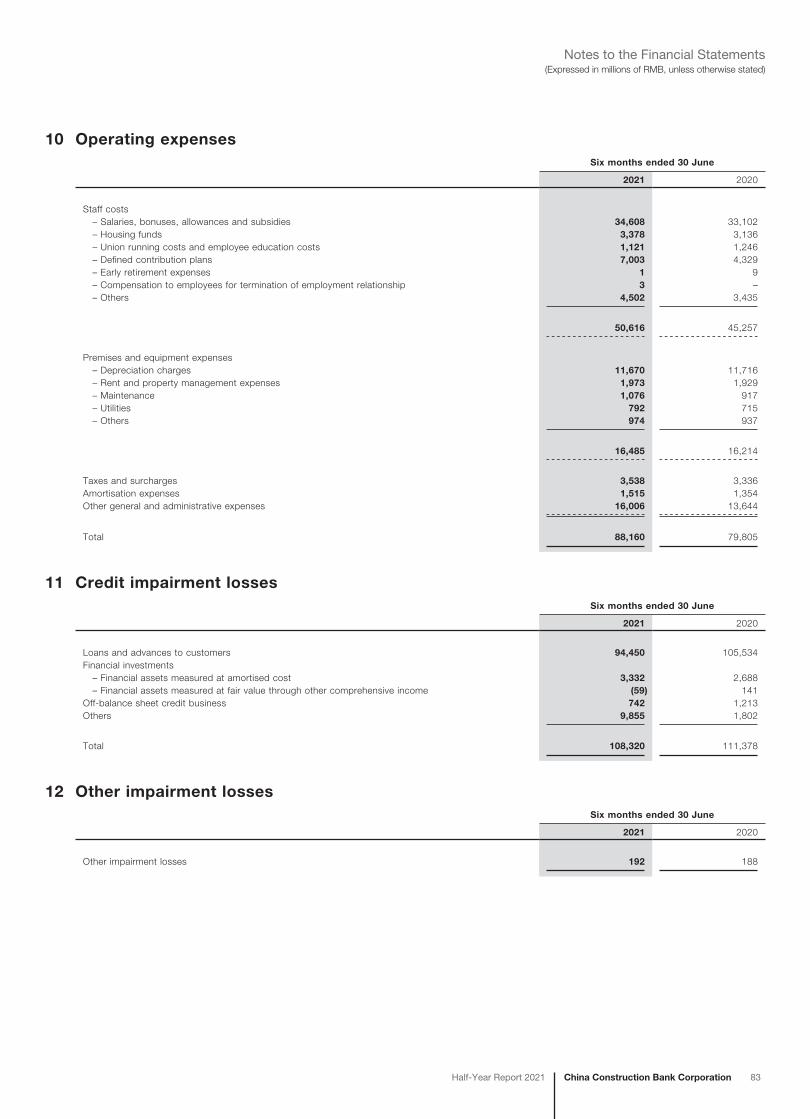
China Construction Bank CorporationHalf-Year Report 2021 83
(Expressed in millions of RMB, unless otherwise stated)Notes to the Financial Statements
10 Operating expensesSix months ended 30 June
2021 2020
Staff costs – Salaries, bonuses, allowances and subsidies 34,608 33,102 – Housing funds 3,378 3,136 – Union running costs and employee education costs 1,121 1,246 – Defined contribution plans 7,003 4,329 – Early retirement expenses 1 9 – Compensation to employees for termination of employment relationship 3 – – Others 4,502 3,435
50,616 45,257
Premises and equipment expenses – Depreciation charges 11,670 11,716 – Rent and property management expenses 1,973 1,929 – Maintenance 1,076 917 – Utilities 792 715 – Others 974 937
16,485 16,214
Taxes and surcharges 3,538 3,336Amortisation expenses 1,515 1,354Other general and administrative expenses 16,006 13,644
Total 88,160 79,805
11 Credit impairment lossesSix months ended 30 June
2021 2020
Loans and advances to customers 94,450 105,534Financial investments – Financial assets measured at amortised cost 3,332 2,688 – Financial assets measured at fair value through other comprehensive income (59) 141Off-balance sheet credit business 742 1,213Others 9,855 1,802
Total 108,320 111,378
12 Other impairment lossesSix months ended 30 June
2021 2020
Other impairment losses 192 188
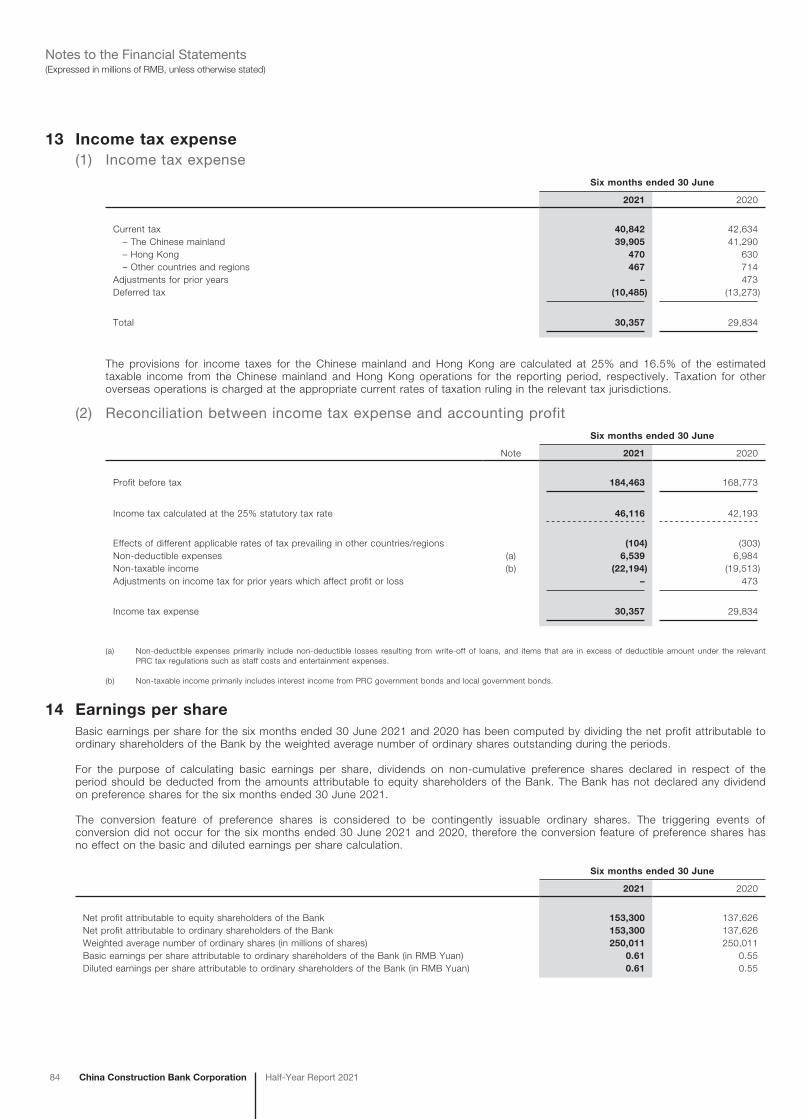
84 China Construction Bank Corporation Half-Year Report 2021
(Expressed in millions of RMB, unless otherwise stated)Notes to the Financial Statements
13 Income tax expense(1) Income tax expense
Six months ended 30 June
2021 2020
Current tax 40,842 42,634 – The Chinese mainland 39,905 41,290 – Hong Kong 470 630 – Other countries and regions 467 714Adjustments for prior years – 473Deferred tax (10,485) (13,273)
Total 30,357 29,834
The provisions for income taxes for the Chinese mainland and Hong Kong are calculated at 25% and 16.5% of the estimated taxable income from the Chinese mainland and Hong Kong operations for the reporting period, respectively. Taxation for other overseas operations is charged at the appropriate current rates of taxation ruling in the relevant tax jurisdictions.
(2) Reconciliation between income tax expense and accounting profitSix months ended 30 June
Note 2021 2020
Profit before tax 184,463 168,773
Income tax calculated at the 25% statutory tax rate 46,116 42,193
Effects of different applicable rates of tax prevailing in other countries/regions (104) (303)Non-deductible expenses (a) 6,539 6,984Non-taxable income (b) (22,194) (19,513)Adjustments on income tax for prior years which affect profit or loss – 473
Income tax expense 30,357 29,834
(a) Non-deductible expenses primarily include non-deductible losses resulting from write-off of loans, and items that are in excess of deductible amount under the relevant PRC tax regulations such as staff costs and entertainment expenses.
(b) Non-taxable income primarily includes interest income from PRC government bonds and local government bonds.
14 Earnings per shareBasic earnings per share for the six months ended 30 June 2021 and 2020 has been computed by dividing the net profit attributable to ordinary shareholders of the Bank by the weighted average number of ordinary shares outstanding during the periods.
For the purpose of calculating basic earnings per share, dividends on non-cumulative preference shares declared in respect of the period should be deducted from the amounts attributable to equity shareholders of the Bank. The Bank has not declared any dividend on preference shares for the six months ended 30 June 2021.
The conversion feature of preference shares is considered to be contingently issuable ordinary shares. The triggering events of conversion did not occur for the six months ended 30 June 2021 and 2020, therefore the conversion feature of preference shares has no effect on the basic and diluted earnings per share calculation.
Six months ended 30 June
2021 2020
Net profit attributable to equity shareholders of the Bank 153,300 137,626Net profit attributable to ordinary shareholders of the Bank 153,300 137,626Weighted average number of ordinary shares (in millions of shares) 250,011 250,011Basic earnings per share attributable to ordinary shareholders of the Bank (in RMB Yuan) 0.61 0.55Diluted earnings per share attributable to ordinary shareholders of the Bank (in RMB Yuan) 0.61 0.55
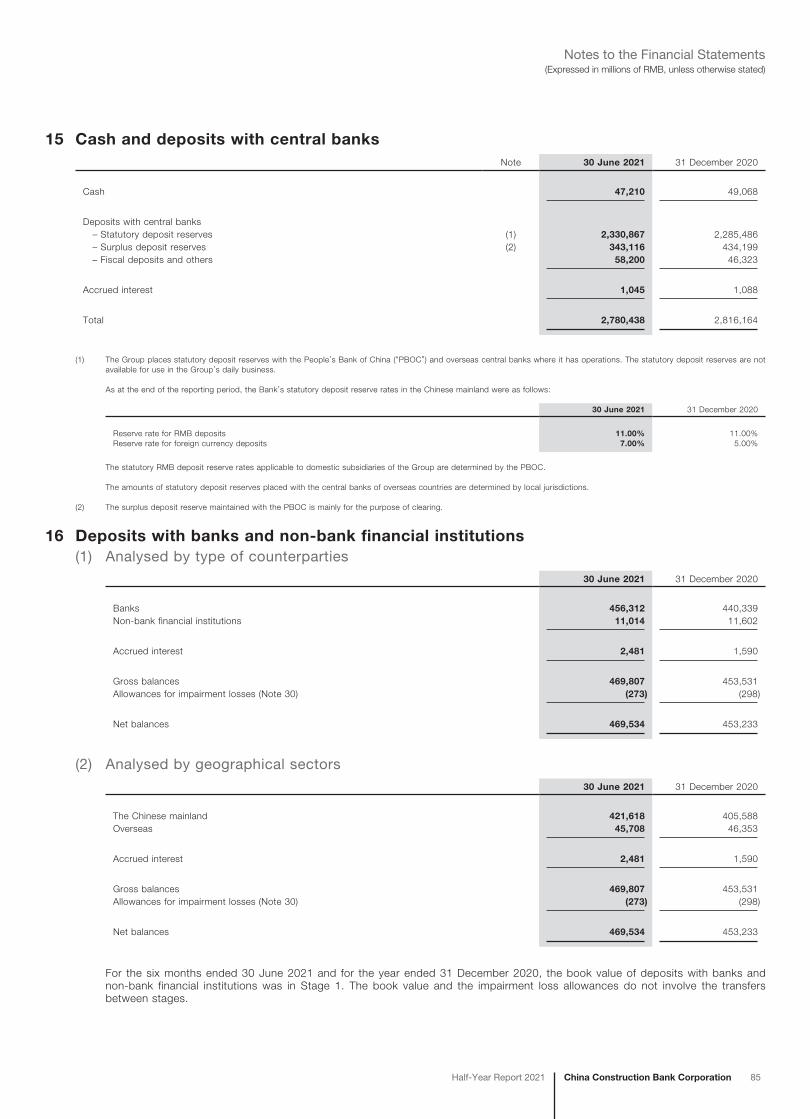
China Construction Bank CorporationHalf-Year Report 2021 85
(Expressed in millions of RMB, unless otherwise stated)Notes to the Financial Statements
15 Cash and deposits with central banksNote 30 June 2021 31 December 2020
Cash 47,210 49,068
Deposits with central banks – Statutory deposit reserves (1) 2,330,867 2,285,486 – Surplus deposit reserves (2) 343,116 434,199 – Fiscal deposits and others 58,200 46,323
Accrued interest 1,045 1,088
Total 2,780,438 2,816,164
(1) The Group places statutory deposit reserves with the People’s Bank of China (“PBOC”) and overseas central banks where it has operations. The statutory deposit reserves are not available for use in the Group’s daily business.
As at the end of the reporting period, the Bank’s statutory deposit reserve rates in the Chinese mainland were as follows:
30 June 2021 31 December 2020
Reserve rate for RMB deposits 11.00% 11.00%Reserve rate for foreign currency deposits 7.00% 5.00%
The statutory RMB deposit reserve rates applicable to domestic subsidiaries of the Group are determined by the PBOC.
The amounts of statutory deposit reserves placed with the central banks of overseas countries are determined by local jurisdictions.
(2) The surplus deposit reserve maintained with the PBOC is mainly for the purpose of clearing.
16 Deposits with banks and non-bank financial institutions(1) Analysed by type of counterparties
30 June 2021 31 December 2020
Banks 456,312 440,339Non-bank financial institutions 11,014 11,602
Accrued interest 2,481 1,590
Gross balances 469,807 453,531Allowances for impairment losses (Note 30) (273) (298)
Net balances 469,534 453,233
(2) Analysed by geographical sectors30 June 2021 31 December 2020
The Chinese mainland 421,618 405,588Overseas 45,708 46,353
Accrued interest 2,481 1,590
Gross balances 469,807 453,531Allowances for impairment losses (Note 30) (273) (298)
Net balances 469,534 453,233
For the six months ended 30 June 2021 and for the year ended 31 December 2020, the book value of deposits with banks and non-bank financial institutions was in Stage 1. The book value and the impairment loss allowances do not involve the transfers between stages.
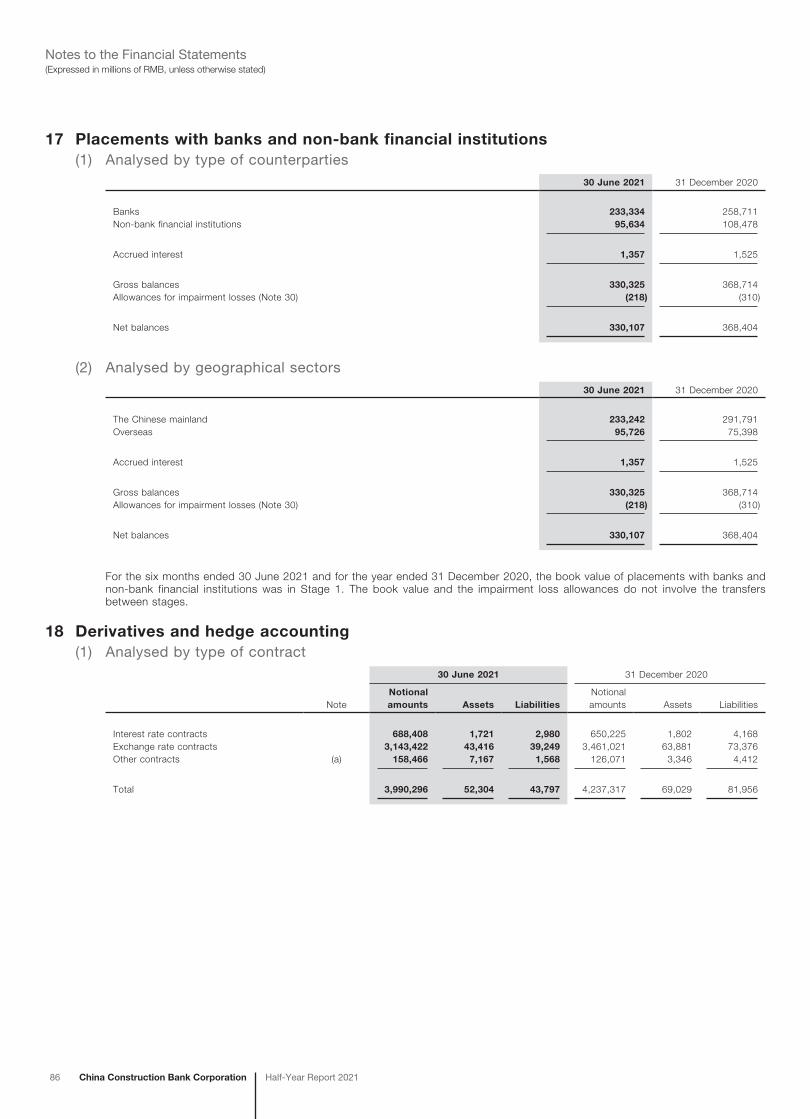
86 China Construction Bank Corporation Half-Year Report 2021
(Expressed in millions of RMB, unless otherwise stated)Notes to the Financial Statements
17 Placements with banks and non-bank financial institutions(1) Analysed by type of counterparties
30 June 2021 31 December 2020
Banks 233,334 258,711Non-bank financial institutions 95,634 108,478
Accrued interest 1,357 1,525
Gross balances 330,325 368,714Allowances for impairment losses (Note 30) (218) (310)
Net balances 330,107 368,404
(2) Analysed by geographical sectors30 June 2021 31 December 2020
The Chinese mainland 233,242 291,791Overseas 95,726 75,398
Accrued interest 1,357 1,525
Gross balances 330,325 368,714Allowances for impairment losses (Note 30) (218) (310)
Net balances 330,107 368,404
For the six months ended 30 June 2021 and for the year ended 31 December 2020, the book value of placements with banks and non-bank financial institutions was in Stage 1. The book value and the impairment loss allowances do not involve the transfers between stages.
18 Derivatives and hedge accounting(1) Analysed by type of contract
30 June 2021 31 December 2020
NoteNotionalamounts Assets Liabilities
Notionalamounts Assets Liabilities
Interest rate contracts 688,408 1,721 2,980 650,225 1,802 4,168Exchange rate contracts 3,143,422 43,416 39,249 3,461,021 63,881 73,376Other contracts (a) 158,466 7,167 1,568 126,071 3,346 4,412
Total 3,990,296 52,304 43,797 4,237,317 69,029 81,956
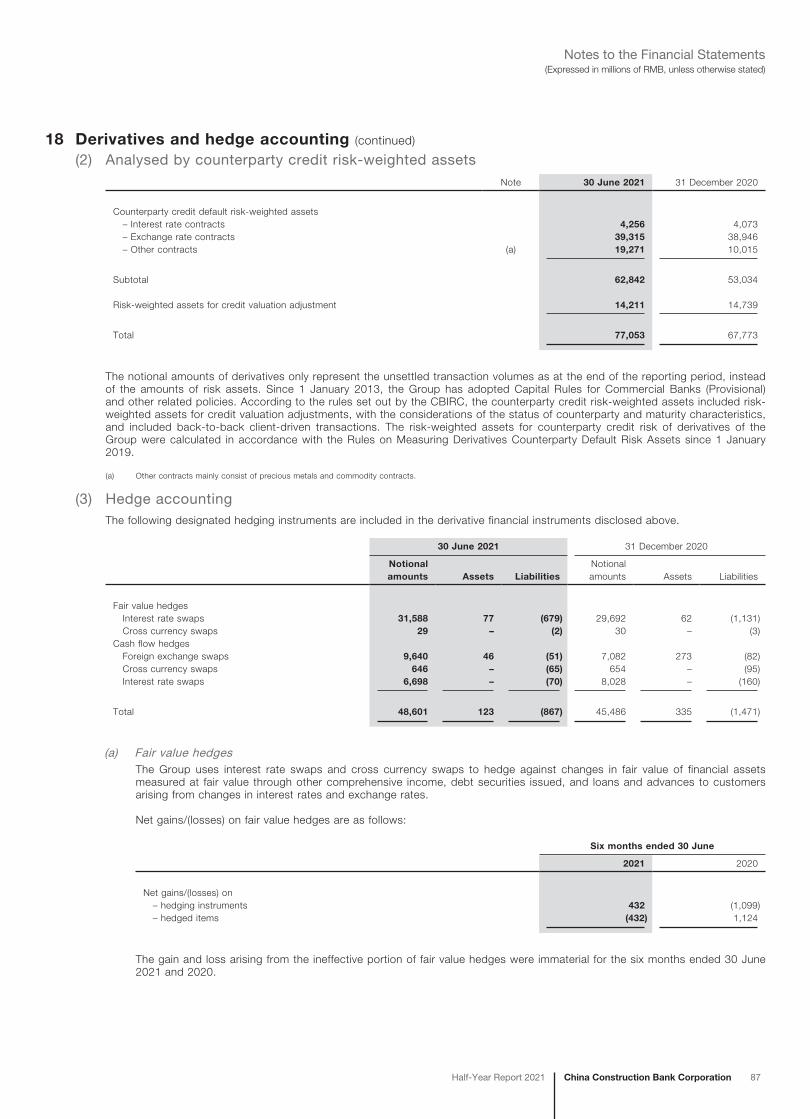
China Construction Bank CorporationHalf-Year Report 2021 87
(Expressed in millions of RMB, unless otherwise stated)Notes to the Financial Statements
18 Derivatives and hedge accounting (continued)
(2) Analysed by counterparty credit risk-weighted assetsNote 30 June 2021 31 December 2020
Counterparty credit default risk-weighted assets – Interest rate contracts 4,256 4,073 – Exchange rate contracts 39,315 38,946 – Other contracts (a) 19,271 10,015
Subtotal 62,842 53,034
Risk-weighted assets for credit valuation adjustment 14,211 14,739
Total 77,053 67,773
The notional amounts of derivatives only represent the unsettled transaction volumes as at the end of the reporting period, instead of the amounts of risk assets. Since 1 January 2013, the Group has adopted Capital Rules for Commercial Banks (Provisional) and other related policies. According to the rules set out by the CBIRC, the counterparty credit risk-weighted assets included risk-weighted assets for credit valuation adjustments, with the considerations of the status of counterparty and maturity characteristics, and included back-to-back client-driven transactions. The risk-weighted assets for counterparty credit risk of derivatives of the Group were calculated in accordance with the Rules on Measuring Derivatives Counterparty Default Risk Assets since 1 January 2019.
(a) Other contracts mainly consist of precious metals and commodity contracts.
(3) Hedge accountingThe following designated hedging instruments are included in the derivative financial instruments disclosed above.
30 June 2021 31 December 2020
Notional amounts Assets Liabilities
Notional amounts Assets Liabilities
Fair value hedges Interest rate swaps 31,588 77 (679) 29,692 62 (1,131) Cross currency swaps 29 – (2) 30 – (3)Cash flow hedges Foreign exchange swaps 9,640 46 (51) 7,082 273 (82) Cross currency swaps 646 – (65) 654 – (95) Interest rate swaps 6,698 – (70) 8,028 – (160)
Total 48,601 123 (867) 45,486 335 (1,471)
(a) Fair value hedgesThe Group uses interest rate swaps and cross currency swaps to hedge against changes in fair value of financial assets measured at fair value through other comprehensive income, debt securities issued, and loans and advances to customers arising from changes in interest rates and exchange rates.
Net gains/(losses) on fair value hedges are as follows:
Six months ended 30 June
2021 2020
Net gains/(losses) on – hedging instruments 432 (1,099) – hedged items (432) 1,124
The gain and loss arising from the ineffective portion of fair value hedges were immaterial for the six months ended 30 June 2021 and 2020.
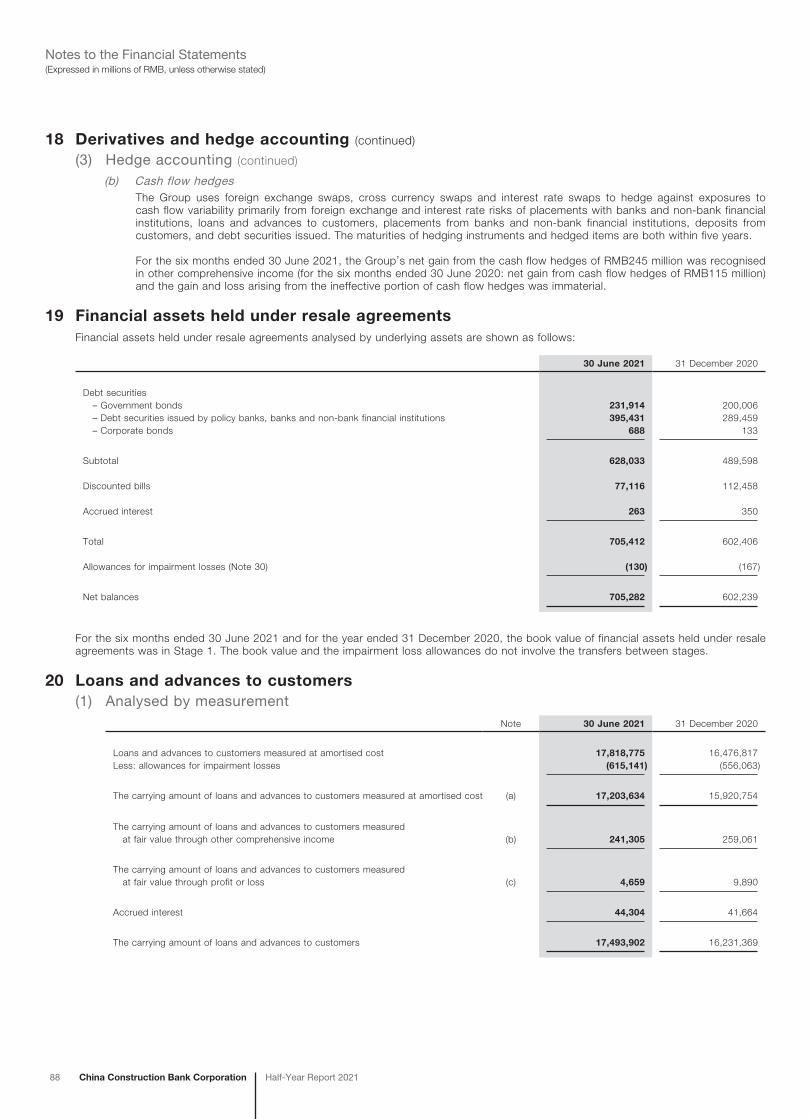
88 China Construction Bank Corporation Half-Year Report 2021
(Expressed in millions of RMB, unless otherwise stated)Notes to the Financial Statements
18 Derivatives and hedge accounting (continued)
(3) Hedge accounting (continued)
(b) Cash flow hedgesThe Group uses foreign exchange swaps, cross currency swaps and interest rate swaps to hedge against exposures to cash flow variability primarily from foreign exchange and interest rate risks of placements with banks and non-bank financial institutions, loans and advances to customers, placements from banks and non-bank financial institutions, deposits from customers, and debt securities issued. The maturities of hedging instruments and hedged items are both within five years.
For the six months ended 30 June 2021, the Group’s net gain from the cash flow hedges of RMB245 million was recognised in other comprehensive income (for the six months ended 30 June 2020: net gain from cash flow hedges of RMB115 million) and the gain and loss arising from the ineffective portion of cash flow hedges was immaterial.
19 Financial assets held under resale agreementsFinancial assets held under resale agreements analysed by underlying assets are shown as follows:
30 June 2021 31 December 2020
Debt securities – Government bonds 231,914 200,006 – Debt securities issued by policy banks, banks and non-bank financial institutions 395,431 289,459 – Corporate bonds 688 133
Subtotal 628,033 489,598
Discounted bills 77,116 112,458
Accrued interest 263 350
Total 705,412 602,406
Allowances for impairment losses (Note 30) (130) (167)
Net balances 705,282 602,239
For the six months ended 30 June 2021 and for the year ended 31 December 2020, the book value of financial assets held under resale agreements was in Stage 1. The book value and the impairment loss allowances do not involve the transfers between stages.
20 Loans and advances to customers(1) Analysed by measurement
Note 30 June 2021 31 December 2020
Loans and advances to customers measured at amortised cost 17,818,775 16,476,817Less: allowances for impairment losses (615,141) (556,063)
The carrying amount of loans and advances to customers measured at amortised cost (a) 17,203,634 15,920,754
The carrying amount of loans and advances to customers measured at fair value through other comprehensive income (b) 241,305 259,061
The carrying amount of loans and advances to customers measured at fair value through profit or loss (c) 4,659 9,890
Accrued interest 44,304 41,664
The carrying amount of loans and advances to customers 17,493,902 16,231,369
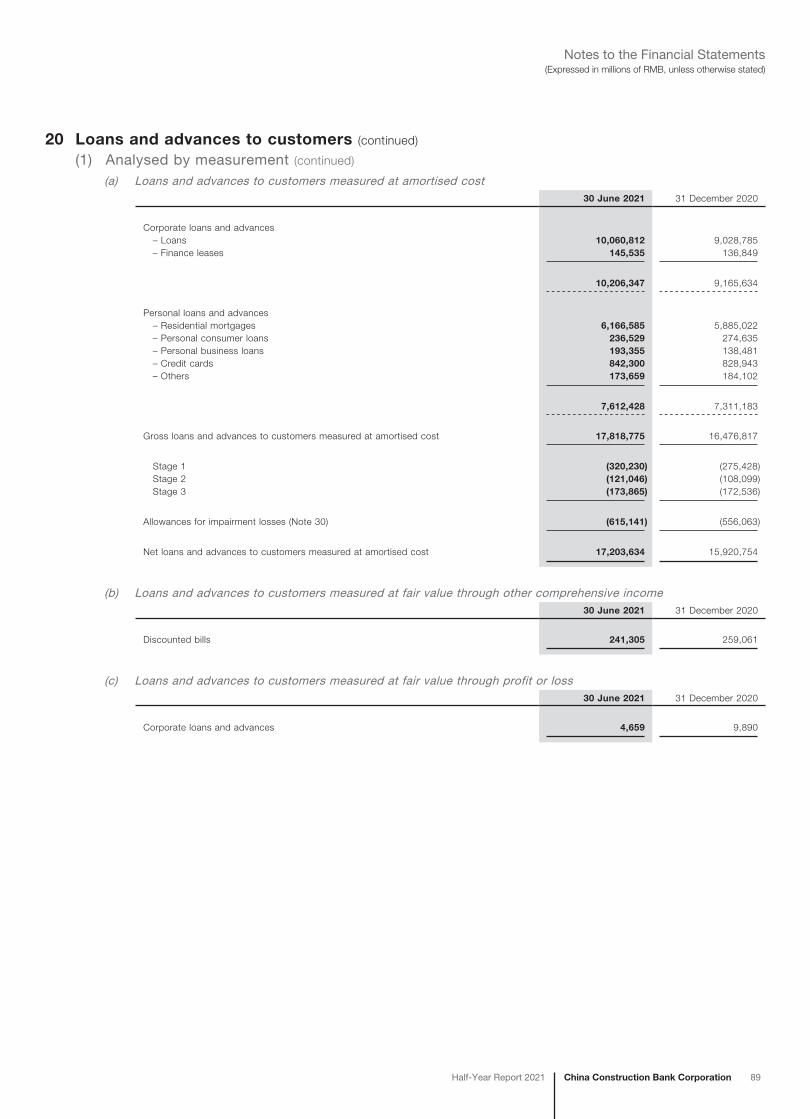
China Construction Bank CorporationHalf-Year Report 2021 89
(Expressed in millions of RMB, unless otherwise stated)Notes to the Financial Statements
20 Loans and advances to customers (continued)
(1) Analysed by measurement (continued)
(a) Loans and advances to customers measured at amortised cost30 June 2021 31 December 2020
Corporate loans and advances – Loans 10,060,812 9,028,785 – Finance leases 145,535 136,849
10,206,347 9,165,634
Personal loans and advances – Residential mortgages 6,166,585 5,885,022 – Personal consumer loans 236,529 274,635 – Personal business loans 193,355 138,481 – Credit cards 842,300 828,943 – Others 173,659 184,102
7,612,428 7,311,183
Gross loans and advances to customers measured at amortised cost 17,818,775 16,476,817
Stage 1 (320,230) (275,428) Stage 2 (121,046) (108,099) Stage 3 (173,865) (172,536)
Allowances for impairment losses (Note 30) (615,141) (556,063)
Net loans and advances to customers measured at amortised cost 17,203,634 15,920,754
(b) Loans and advances to customers measured at fair value through other comprehensive income30 June 2021 31 December 2020
Discounted bills 241,305 259,061
(c) Loans and advances to customers measured at fair value through profit or loss30 June 2021 31 December 2020
Corporate loans and advances 4,659 9,890
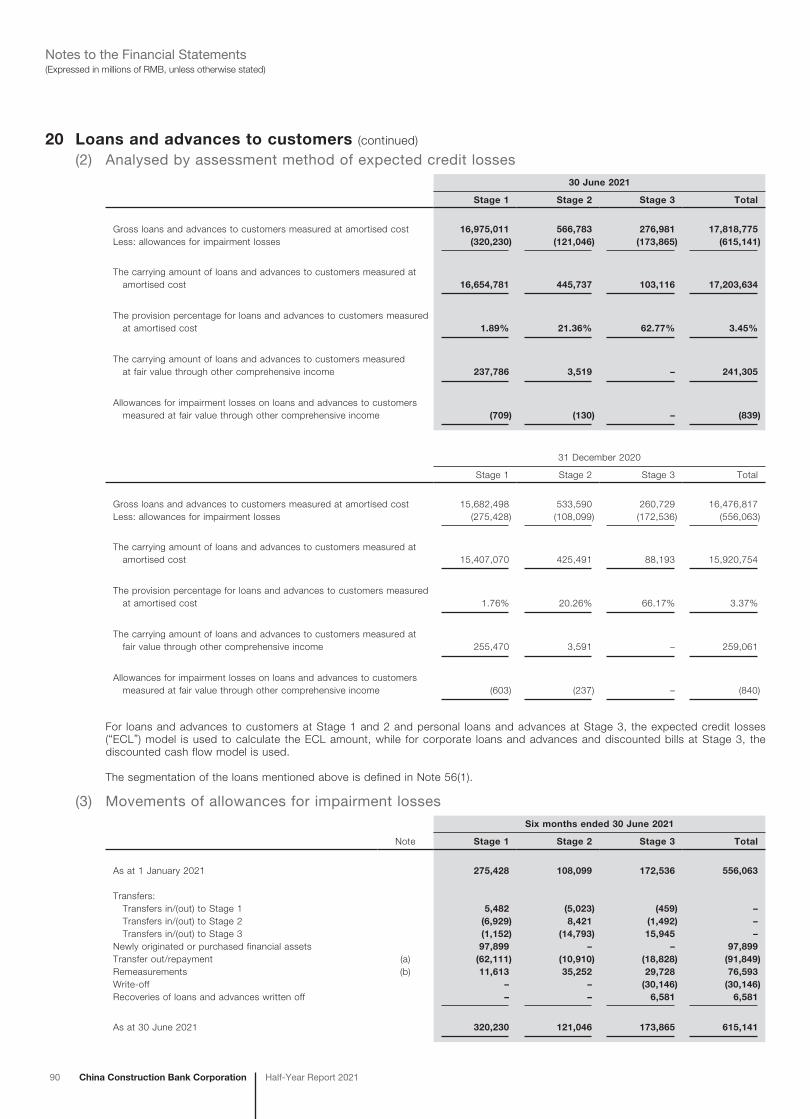
90 China Construction Bank Corporation Half-Year Report 2021
(Expressed in millions of RMB, unless otherwise stated)Notes to the Financial Statements
20 Loans and advances to customers (continued)
(2) Analysed by assessment method of expected credit losses30 June 2021
Stage 1 Stage 2 Stage 3 Total
Gross loans and advances to customers measured at amortised cost 16,975,011 566,783 276,981 17,818,775Less: allowances for impairment losses (320,230) (121,046) (173,865) (615,141)
The carrying amount of loans and advances to customers measured at amortised cost 16,654,781 445,737 103,116 17,203,634
The provision percentage for loans and advances to customers measured at amortised cost 1.89% 21.36% 62.77% 3.45%
The carrying amount of loans and advances to customers measured at fair value through other comprehensive income 237,786 3,519 – 241,305
Allowances for impairment losses on loans and advances to customers measured at fair value through other comprehensive income (709) (130) – (839)
31 December 2020
Stage 1 Stage 2 Stage 3 Total
Gross loans and advances to customers measured at amortised cost 15,682,498 533,590 260,729 16,476,817Less: allowances for impairment losses (275,428) (108,099) (172,536) (556,063)
The carrying amount of loans and advances to customers measured at amortised cost 15,407,070 425,491 88,193 15,920,754
The provision percentage for loans and advances to customers measured at amortised cost 1.76% 20.26% 66.17% 3.37%
The carrying amount of loans and advances to customers measured at fair value through other comprehensive income 255,470 3,591 – 259,061
Allowances for impairment losses on loans and advances to customers measured at fair value through other comprehensive income (603) (237) – (840)
For loans and advances to customers at Stage 1 and 2 and personal loans and advances at Stage 3, the expected credit losses (“ECL”) model is used to calculate the ECL amount, while for corporate loans and advances and discounted bills at Stage 3, the discounted cash flow model is used.
The segmentation of the loans mentioned above is defined in Note 56(1).
(3) Movements of allowances for impairment lossesSix months ended 30 June 2021
Note Stage 1 Stage 2 Stage 3 Total
As at 1 January 2021 275,428 108,099 172,536 556,063
Transfers: Transfers in/(out) to Stage 1 5,482 (5,023) (459) – Transfers in/(out) to Stage 2 (6,929) 8,421 (1,492) – Transfers in/(out) to Stage 3 (1,152) (14,793) 15,945 –Newly originated or purchased financial assets 97,899 – – 97,899Transfer out/repayment (a) (62,111) (10,910) (18,828) (91,849)Remeasurements (b) 11,613 35,252 29,728 76,593Write-off – – (30,146) (30,146)Recoveries of loans and advances written off – – 6,581 6,581
As at 30 June 2021 320,230 121,046 173,865 615,141
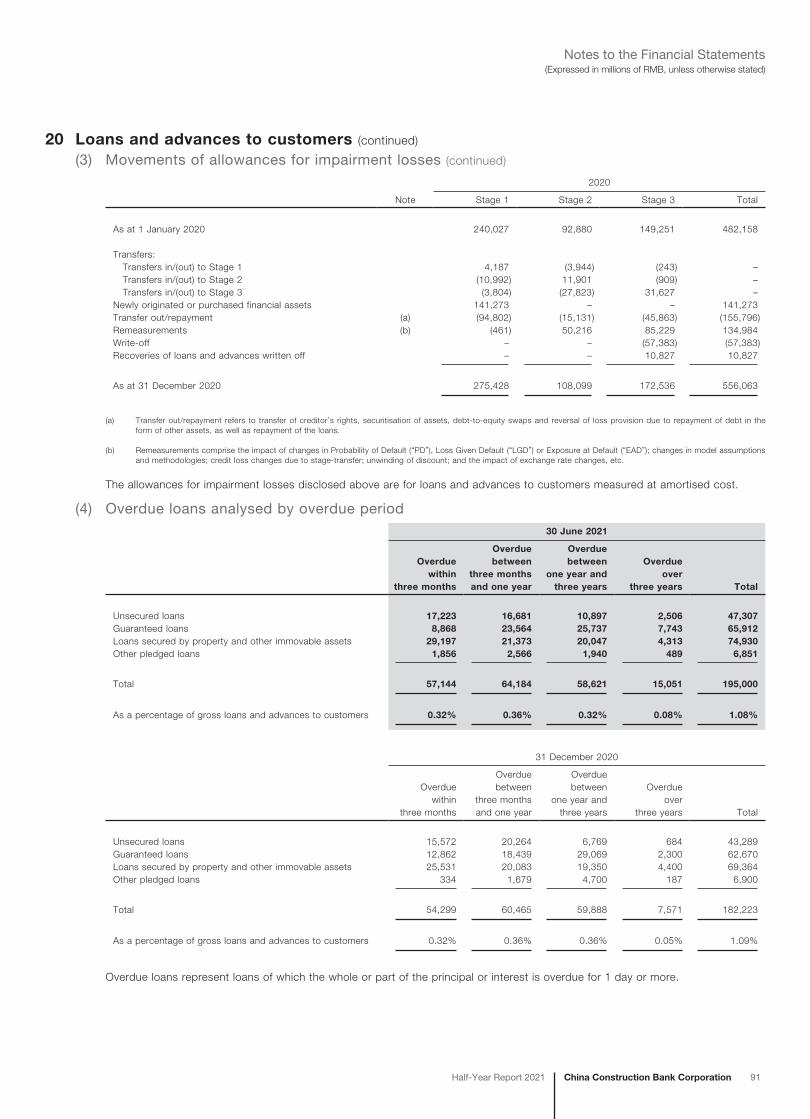
China Construction Bank CorporationHalf-Year Report 2021 91
(Expressed in millions of RMB, unless otherwise stated)Notes to the Financial Statements
20 Loans and advances to customers (continued)
(3) Movements of allowances for impairment losses (continued)
2020
Note Stage 1 Stage 2 Stage 3 Total
As at 1 January 2020 240,027 92,880 149,251 482,158
Transfers: Transfers in/(out) to Stage 1 4,187 (3,944) (243) – Transfers in/(out) to Stage 2 (10,992) 11,901 (909) – Transfers in/(out) to Stage 3 (3,804) (27,823) 31,627 –Newly originated or purchased financial assets 141,273 – – 141,273Transfer out/repayment (a) (94,802) (15,131) (45,863) (155,796)Remeasurements (b) (461) 50,216 85,229 134,984Write-off – – (57,383) (57,383)Recoveries of loans and advances written off – – 10,827 10,827
As at 31 December 2020 275,428 108,099 172,536 556,063
(a) Transfer out/repayment refers to transfer of creditor’s rights, securitisation of assets, debt-to-equity swaps and reversal of loss provision due to repayment of debt in the form of other assets, as well as repayment of the loans.
(b) Remeasurements comprise the impact of changes in Probability of Default (“PD”), Loss Given Default (“LGD”) or Exposure at Default (“EAD”); changes in model assumptions and methodologies; credit loss changes due to stage-transfer; unwinding of discount; and the impact of exchange rate changes, etc.
The allowances for impairment losses disclosed above are for loans and advances to customers measured at amortised cost.
(4) Overdue loans analysed by overdue period30 June 2021
Overduewithin
three months
Overduebetween
three monthsand one year
Overduebetween
one year andthree years
Overdueover
three years Total
Unsecured loans 17,223 16,681 10,897 2,506 47,307Guaranteed loans 8,868 23,564 25,737 7,743 65,912Loans secured by property and other immovable assets 29,197 21,373 20,047 4,313 74,930Other pledged loans 1,856 2,566 1,940 489 6,851
Total 57,144 64,184 58,621 15,051 195,000
As a percentage of gross loans and advances to customers 0.32% 0.36% 0.32% 0.08% 1.08%
31 December 2020
Overduewithin
three months
Overduebetween
three monthsand one year
Overduebetween
one year andthree years
Overdueover
three years Total
Unsecured loans 15,572 20,264 6,769 684 43,289Guaranteed loans 12,862 18,439 29,069 2,300 62,670Loans secured by property and other immovable assets 25,531 20,083 19,350 4,400 69,364Other pledged loans 334 1,679 4,700 187 6,900
Total 54,299 60,465 59,888 7,571 182,223
As a percentage of gross loans and advances to customers 0.32% 0.36% 0.36% 0.05% 1.09%
Overdue loans represent loans of which the whole or part of the principal or interest is overdue for 1 day or more.
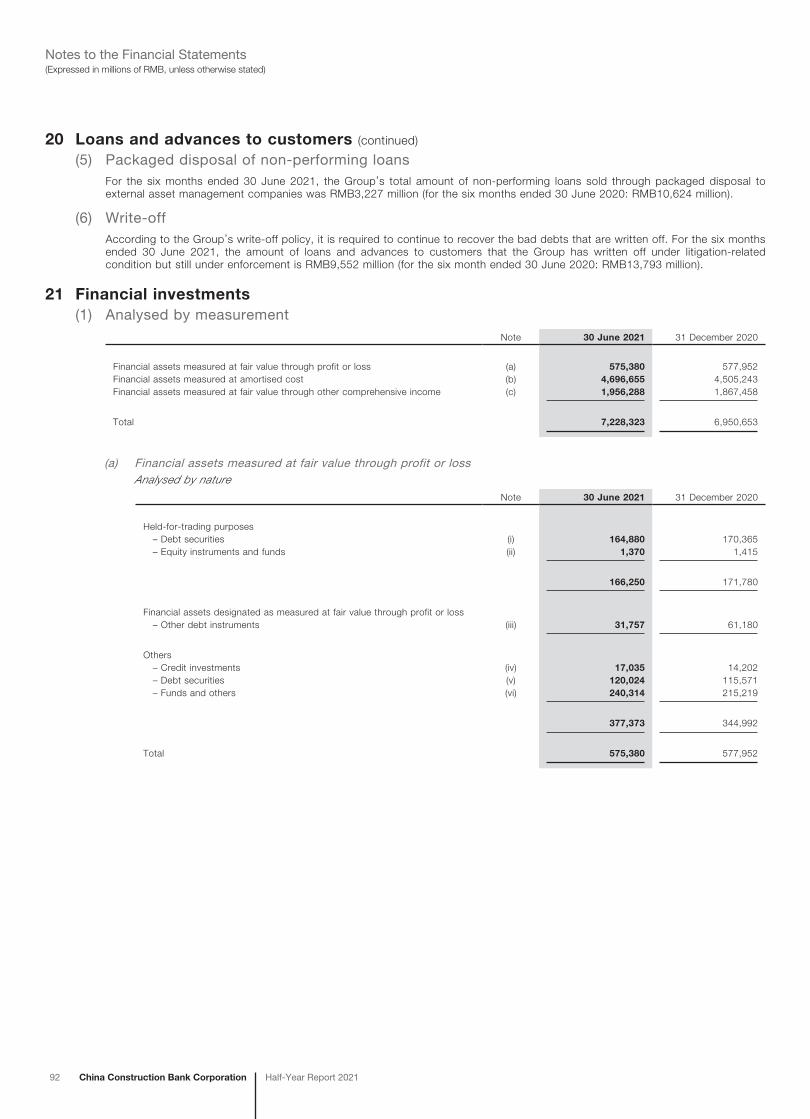
92 China Construction Bank Corporation Half-Year Report 2021
(Expressed in millions of RMB, unless otherwise stated)Notes to the Financial Statements
20 Loans and advances to customers (continued)
(5) Packaged disposal of non-performing loansFor the six months ended 30 June 2021, the Group’s total amount of non-performing loans sold through packaged disposal to external asset management companies was RMB3,227 million (for the six months ended 30 June 2020: RMB10,624 million).
(6) Write-offAccording to the Group’s write-off policy, it is required to continue to recover the bad debts that are written off. For the six months ended 30 June 2021, the amount of loans and advances to customers that the Group has written off under litigation-related condition but still under enforcement is RMB9,552 million (for the six month ended 30 June 2020: RMB13,793 million).
21 Financial investments(1) Analysed by measurement
Note 30 June 2021 31 December 2020
Financial assets measured at fair value through profit or loss (a) 575,380 577,952Financial assets measured at amortised cost (b) 4,696,655 4,505,243Financial assets measured at fair value through other comprehensive income (c) 1,956,288 1,867,458
Total 7,228,323 6,950,653
(a) Financial assets measured at fair value through profit or lossAnalysed by nature
Note 30 June 2021 31 December 2020
Held-for-trading purposes – Debt securities (i) 164,880 170,365 – Equity instruments and funds (ii) 1,370 1,415
166,250 171,780
Financial assets designated as measured at fair value through profit or loss – Other debt instruments (iii) 31,757 61,180
Others – Credit investments (iv) 17,035 14,202 – Debt securities (v) 120,024 115,571 – Funds and others (vi) 240,314 215,219
377,373 344,992
Total 575,380 577,952
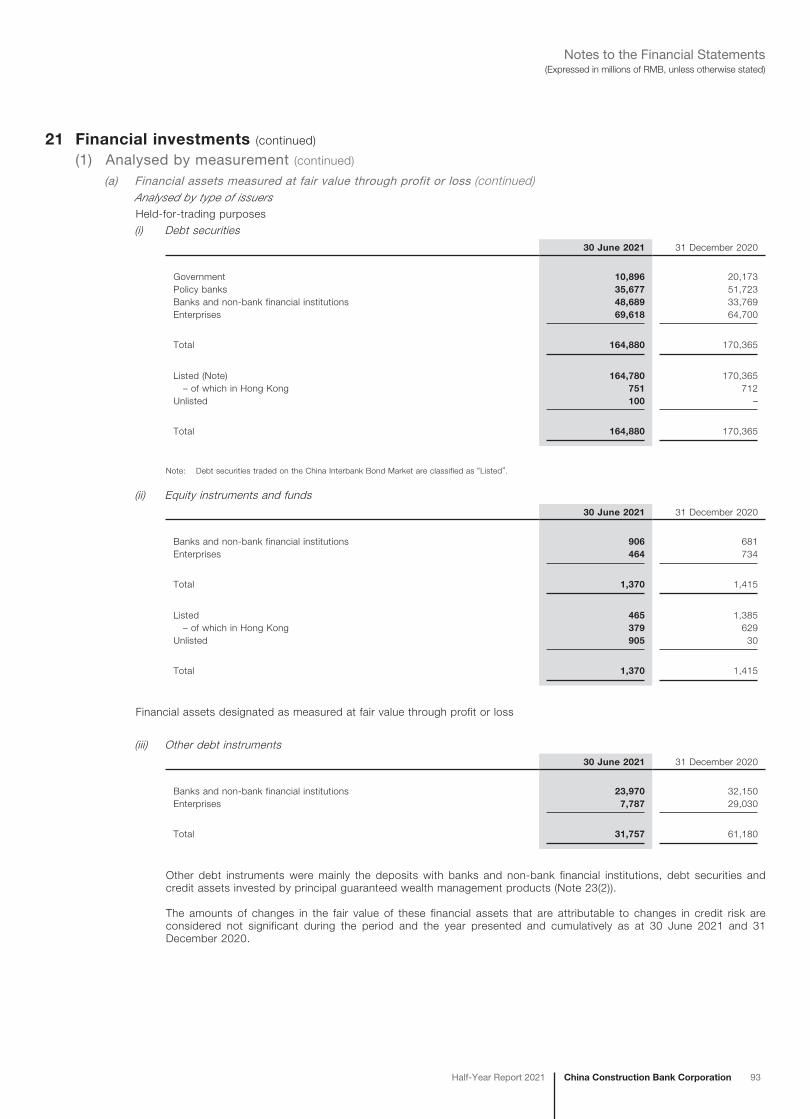
China Construction Bank CorporationHalf-Year Report 2021 93
(Expressed in millions of RMB, unless otherwise stated)Notes to the Financial Statements
21 Financial investments (continued)
(1) Analysed by measurement (continued)
(a) Financial assets measured at fair value through profit or loss (continued)Analysed by type of issuersHeld-for-trading purposes
(i) Debt securities30 June 2021 31 December 2020
Government 10,896 20,173Policy banks 35,677 51,723Banks and non-bank financial institutions 48,689 33,769Enterprises 69,618 64,700
Total 164,880 170,365
Listed (Note) 164,780 170,365 – of which in Hong Kong 751 712Unlisted 100 –
Total 164,880 170,365
Note: Debt securities traded on the China Interbank Bond Market are classified as “Listed”.
(ii) Equity instruments and funds30 June 2021 31 December 2020
Banks and non-bank financial institutions 906 681Enterprises 464 734
Total 1,370 1,415
Listed 465 1,385 – of which in Hong Kong 379 629Unlisted 905 30
Total 1,370 1,415
Financial assets designated as measured at fair value through profit or loss
(iii) Other debt instruments30 June 2021 31 December 2020
Banks and non-bank financial institutions 23,970 32,150Enterprises 7,787 29,030
Total 31,757 61,180
Other debt instruments were mainly the deposits with banks and non-bank financial institutions, debt securities and credit assets invested by principal guaranteed wealth management products (Note 23(2)).
The amounts of changes in the fair value of these financial assets that are attributable to changes in credit risk are considered not significant during the period and the year presented and cumulatively as at 30 June 2021 and 31 December 2020.
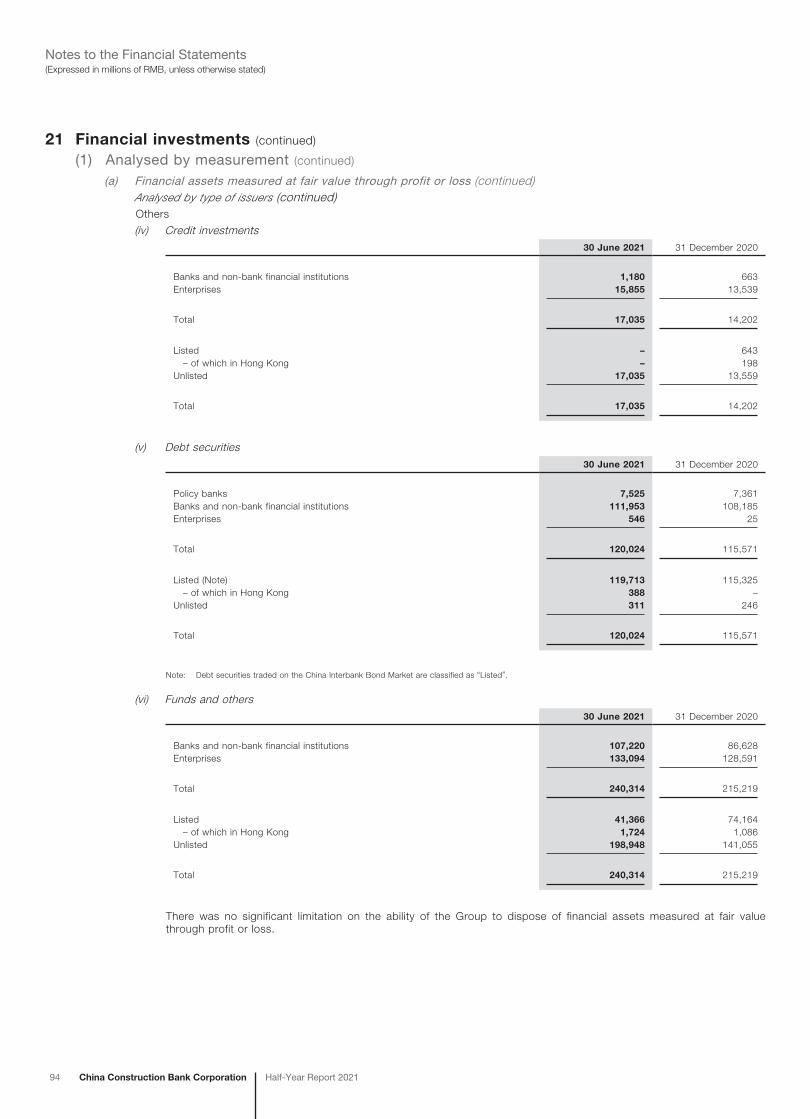
94 China Construction Bank Corporation Half-Year Report 2021
(Expressed in millions of RMB, unless otherwise stated)Notes to the Financial Statements
21 Financial investments (continued)
(1) Analysed by measurement (continued)
(a) Financial assets measured at fair value through profit or loss (continued)Analysed by type of issuers (continued)Others
(iv) Credit investments30 June 2021 31 December 2020
Banks and non-bank financial institutions 1,180 663Enterprises 15,855 13,539
Total 17,035 14,202
Listed – 643 – of which in Hong Kong – 198Unlisted 17,035 13,559
Total 17,035 14,202
(v) Debt securities30 June 2021 31 December 2020
Policy banks 7,525 7,361Banks and non-bank financial institutions 111,953 108,185Enterprises 546 25
Total 120,024 115,571
Listed (Note) 119,713 115,325 – of which in Hong Kong 388 –Unlisted 311 246
Total 120,024 115,571
Note: Debt securities traded on the China Interbank Bond Market are classified as “Listed”.
(vi) Funds and others30 June 2021 31 December 2020
Banks and non-bank financial institutions 107,220 86,628Enterprises 133,094 128,591
Total 240,314 215,219
Listed 41,366 74,164 – of which in Hong Kong 1,724 1,086Unlisted 198,948 141,055
Total 240,314 215,219
There was no significant limitation on the ability of the Group to dispose of financial assets measured at fair value through profit or loss.
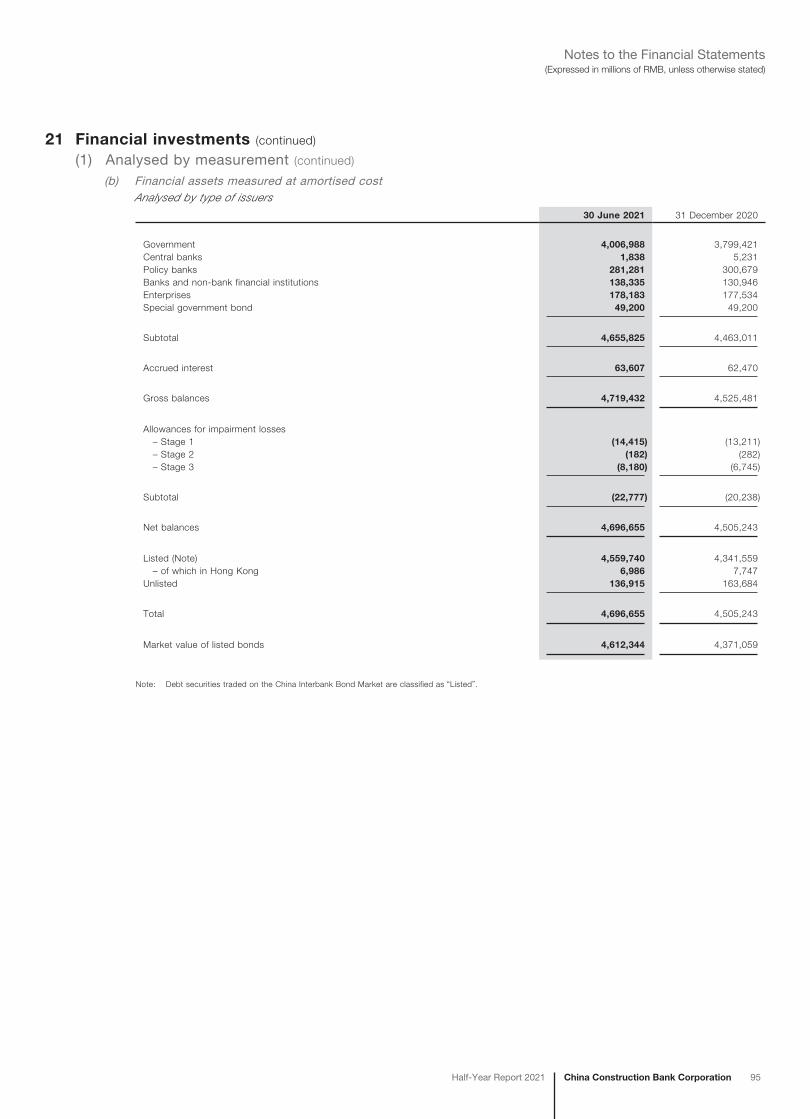
China Construction Bank CorporationHalf-Year Report 2021 95
(Expressed in millions of RMB, unless otherwise stated)Notes to the Financial Statements
21 Financial investments (continued)
(1) Analysed by measurement (continued)
(b) Financial assets measured at amortised costAnalysed by type of issuers
30 June 2021 31 December 2020
Government 4,006,988 3,799,421Central banks 1,838 5,231Policy banks 281,281 300,679Banks and non-bank financial institutions 138,335 130,946Enterprises 178,183 177,534Special government bond 49,200 49,200
Subtotal 4,655,825 4,463,011
Accrued interest 63,607 62,470
Gross balances 4,719,432 4,525,481
Allowances for impairment losses – Stage 1 (14,415) (13,211) – Stage 2 (182) (282) – Stage 3 (8,180) (6,745)
Subtotal (22,777) (20,238)
Net balances 4,696,655 4,505,243
Listed (Note) 4,559,740 4,341,559 – of which in Hong Kong 6,986 7,747Unlisted 136,915 163,684
Total 4,696,655 4,505,243
Market value of listed bonds 4,612,344 4,371,059
Note: Debt securities traded on the China Interbank Bond Market are classified as “Listed”.
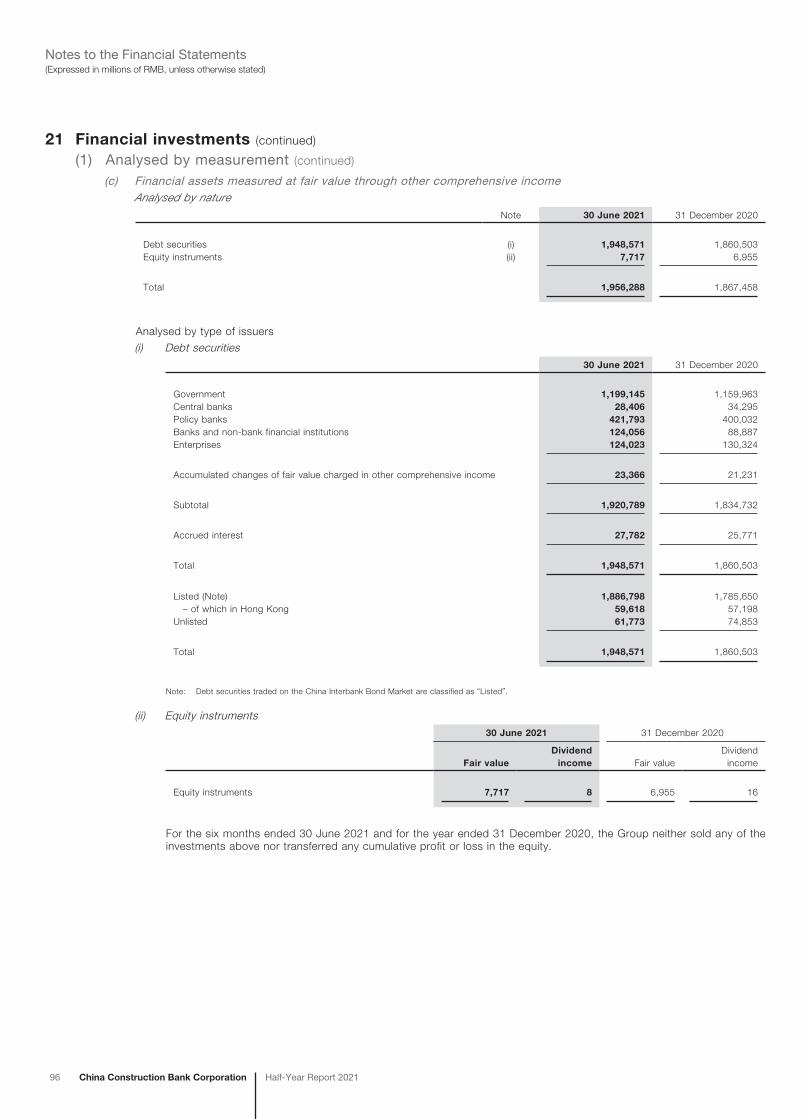
96 China Construction Bank Corporation Half-Year Report 2021
(Expressed in millions of RMB, unless otherwise stated)Notes to the Financial Statements
21 Financial investments (continued)
(1) Analysed by measurement (continued)
(c) Financial assets measured at fair value through other comprehensive incomeAnalysed by nature
Note 30 June 2021 31 December 2020
Debt securities (i) 1,948,571 1,860,503Equity instruments (ii) 7,717 6,955
Total 1,956,288 1,867,458
Analysed by type of issuers
(i) Debt securities30 June 2021 31 December 2020
Government 1,199,145 1,159,963Central banks 28,406 34,295Policy banks 421,793 400,032Banks and non-bank financial institutions 124,056 88,887Enterprises 124,023 130,324
Accumulated changes of fair value charged in other comprehensive income 23,366 21,231
Subtotal 1,920,789 1,834,732
Accrued interest 27,782 25,771
Total 1,948,571 1,860,503
Listed (Note) 1,886,798 1,785,650 – of which in Hong Kong 59,618 57,198Unlisted 61,773 74,853
Total 1,948,571 1,860,503
Note: Debt securities traded on the China Interbank Bond Market are classified as “Listed”.
(ii) Equity instruments30 June 2021 31 December 2020
Fair valueDividend
income Fair valueDividend
income
Equity instruments 7,717 8 6,955 16
For the six months ended 30 June 2021 and for the year ended 31 December 2020, the Group neither sold any of the investments above nor transferred any cumulative profit or loss in the equity.
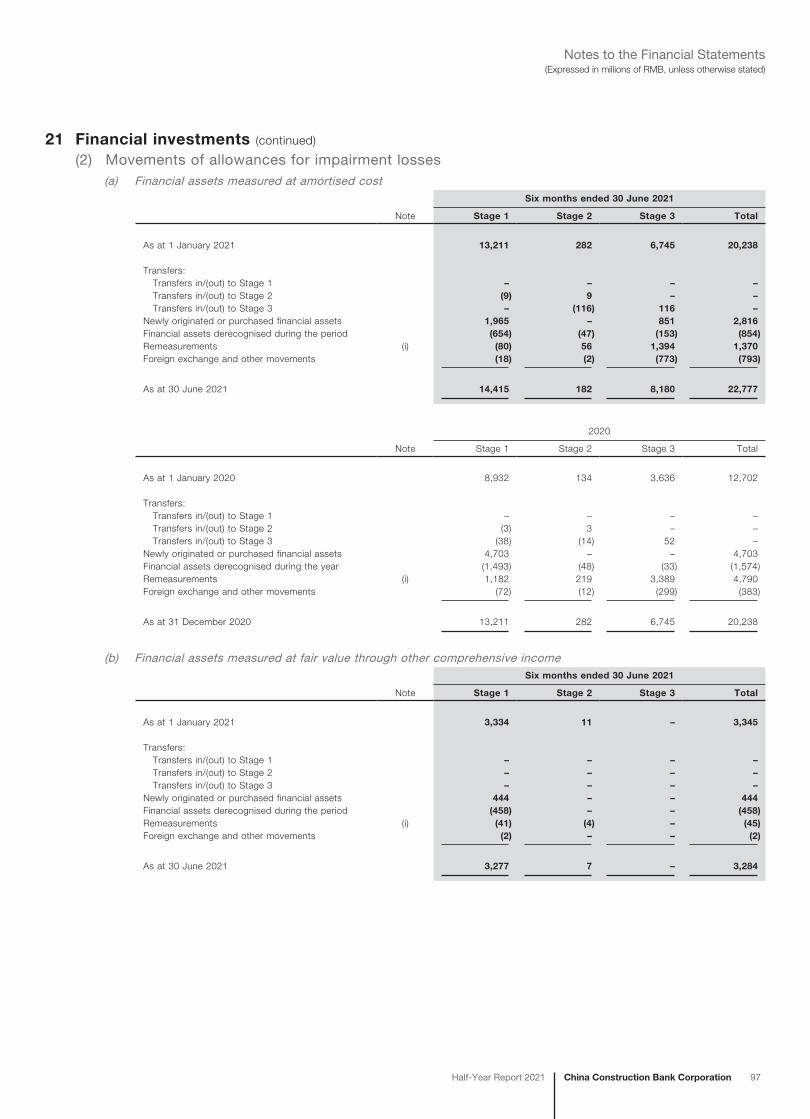
China Construction Bank CorporationHalf-Year Report 2021 97
(Expressed in millions of RMB, unless otherwise stated)Notes to the Financial Statements
21 Financial investments (continued)
(2) Movements of allowances for impairment losses(a) Financial assets measured at amortised cost
Six months ended 30 June 2021
Note Stage 1 Stage 2 Stage 3 Total
As at 1 January 2021 13,211 282 6,745 20,238
Transfers: Transfers in/(out) to Stage 1 – – – – Transfers in/(out) to Stage 2 (9) 9 – – Transfers in/(out) to Stage 3 – (116) 116 –Newly originated or purchased financial assets 1,965 – 851 2,816Financial assets derecognised during the period (654) (47) (153) (854)Remeasurements (i) (80) 56 1,394 1,370Foreign exchange and other movements (18) (2) (773) (793)
As at 30 June 2021 14,415 182 8,180 22,777
2020
Note Stage 1 Stage 2 Stage 3 Total
As at 1 January 2020 8,932 134 3,636 12,702
Transfers: Transfers in/(out) to Stage 1 – – – – Transfers in/(out) to Stage 2 (3) 3 – – Transfers in/(out) to Stage 3 (38) (14) 52 –Newly originated or purchased financial assets 4,703 – – 4,703Financial assets derecognised during the year (1,493) (48) (33) (1,574)Remeasurements (i) 1,182 219 3,389 4,790Foreign exchange and other movements (72) (12) (299) (383)
As at 31 December 2020 13,211 282 6,745 20,238
(b) Financial assets measured at fair value through other comprehensive incomeSix months ended 30 June 2021
Note Stage 1 Stage 2 Stage 3 Total
As at 1 January 2021 3,334 11 – 3,345
Transfers: Transfers in/(out) to Stage 1 – – – – Transfers in/(out) to Stage 2 – – – – Transfers in/(out) to Stage 3 – – – –Newly originated or purchased financial assets 444 – – 444Financial assets derecognised during the period (458) – – (458)Remeasurements (i) (41) (4) – (45)Foreign exchange and other movements (2) – – (2)
As at 30 June 2021 3,277 7 – 3,284
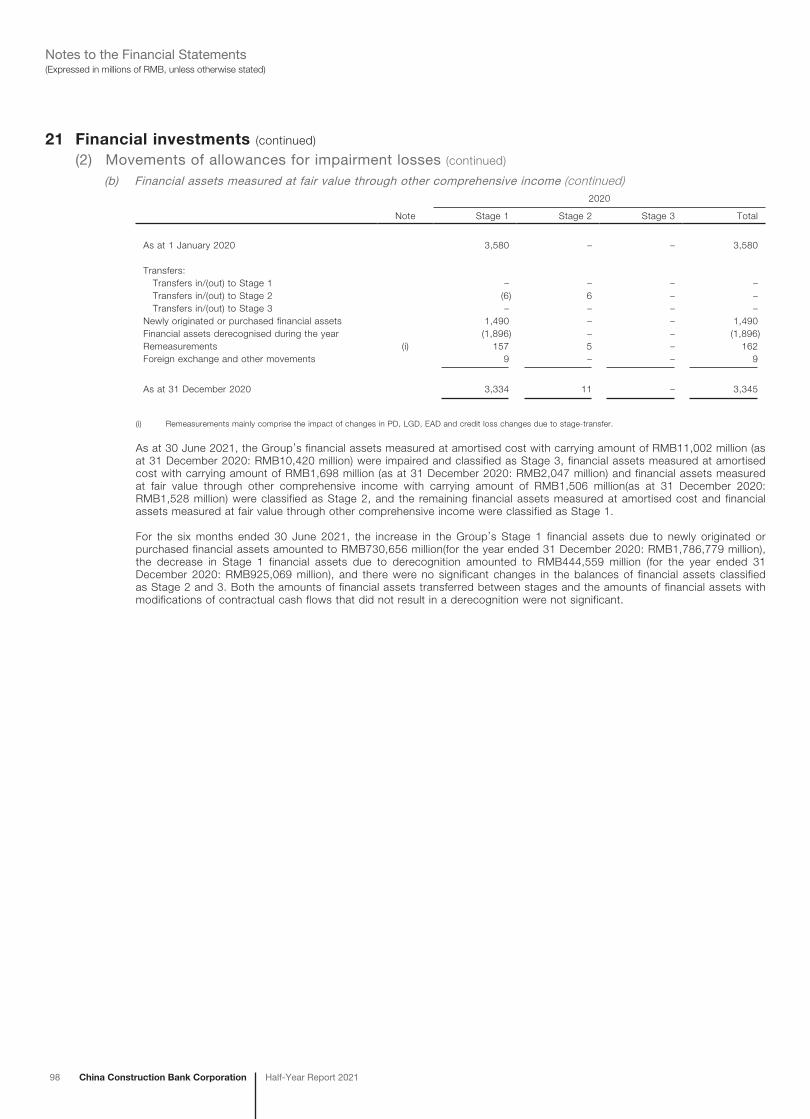
98 China Construction Bank Corporation Half-Year Report 2021
(Expressed in millions of RMB, unless otherwise stated)Notes to the Financial Statements
21 Financial investments (continued)
(2) Movements of allowances for impairment losses (continued)
(b) Financial assets measured at fair value through other comprehensive income (continued)2020
Note Stage 1 Stage 2 Stage 3 Total
As at 1 January 2020 3,580 – – 3,580
Transfers: Transfers in/(out) to Stage 1 – – – – Transfers in/(out) to Stage 2 (6) 6 – – Transfers in/(out) to Stage 3 – – – –Newly originated or purchased financial assets 1,490 – – 1,490Financial assets derecognised during the year (1,896) – – (1,896)Remeasurements (i) 157 5 – 162Foreign exchange and other movements 9 – – 9
As at 31 December 2020 3,334 11 – 3,345
(i) Remeasurements mainly comprise the impact of changes in PD, LGD, EAD and credit loss changes due to stage-transfer.
As at 30 June 2021, the Group’s financial assets measured at amortised cost with carrying amount of RMB11,002 million (as at 31 December 2020: RMB10,420 million) were impaired and classified as Stage 3, financial assets measured at amortised cost with carrying amount of RMB1,698 million (as at 31 December 2020: RMB2,047 million) and financial assets measured at fair value through other comprehensive income with carrying amount of RMB1,506 million(as at 31 December 2020: RMB1,528 million) were classified as Stage 2, and the remaining financial assets measured at amortised cost and financial assets measured at fair value through other comprehensive income were classified as Stage 1.
For the six months ended 30 June 2021, the increase in the Group’s Stage 1 financial assets due to newly originated or purchased financial assets amounted to RMB730,656 million(for the year ended 31 December 2020: RMB1,786,779 million), the decrease in Stage 1 financial assets due to derecognition amounted to RMB444,559 million (for the year ended 31 December 2020: RMB925,069 million), and there were no significant changes in the balances of financial assets classified as Stage 2 and 3. Both the amounts of financial assets transferred between stages and the amounts of financial assets with modifications of contractual cash flows that did not result in a derecognition were not significant.
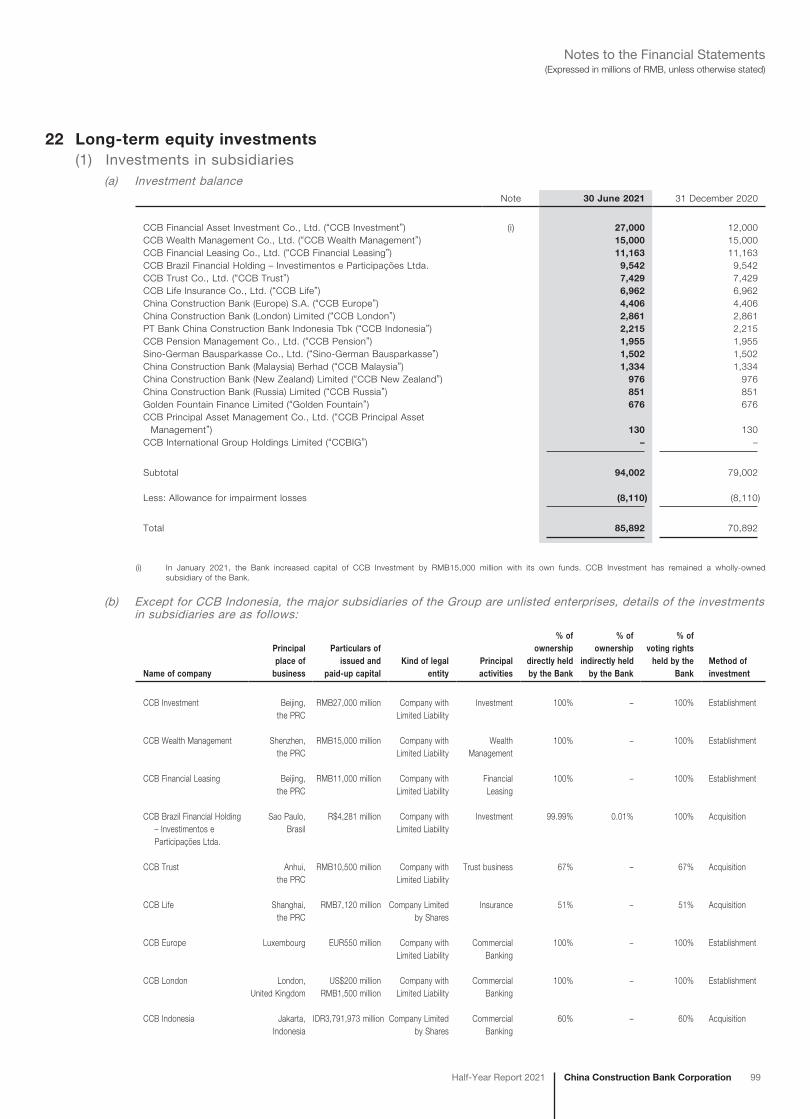
China Construction Bank CorporationHalf-Year Report 2021 99
(Expressed in millions of RMB, unless otherwise stated)Notes to the Financial Statements
22 Long-term equity investments(1) Investments in subsidiaries
(a) Investment balanceNote 30 June 2021 31 December 2020
CCB Financial Asset Investment Co., Ltd. (“CCB Investment”) (i) 27,000 12,000CCB Wealth Management Co., Ltd. (“CCB Wealth Management”) 15,000 15,000CCB Financial Leasing Co., Ltd. (“CCB Financial Leasing”) 11,163 11,163CCB Brazil Financial Holding – Investimentos e Participações Ltda. 9,542 9,542CCB Trust Co., Ltd. (“CCB Trust”) 7,429 7,429CCB Life Insurance Co., Ltd. (“CCB Life”) 6,962 6,962China Construction Bank (Europe) S.A. (“CCB Europe”) 4,406 4,406China Construction Bank (London) Limited (“CCB London”) 2,861 2,861PT Bank China Construction Bank Indonesia Tbk (“CCB Indonesia”) 2,215 2,215CCB Pension Management Co., Ltd. (“CCB Pension”) 1,955 1,955Sino-German Bausparkasse Co., Ltd. (“Sino-German Bausparkasse”) 1,502 1,502China Construction Bank (Malaysia) Berhad (“CCB Malaysia”) 1,334 1,334China Construction Bank (New Zealand) Limited (“CCB New Zealand”) 976 976China Construction Bank (Russia) Limited (“CCB Russia”) 851 851Golden Fountain Finance Limited (“Golden Fountain”) 676 676CCB Principal Asset Management Co., Ltd. (“CCB Principal Asset
Management”) 130 130CCB International Group Holdings Limited (“CCBIG”) – –
Subtotal 94,002 79,002
Less: Allowance for impairment losses (8,110) (8,110)
Total 85,892 70,892
(i) In January 2021, the Bank increased capital of CCB Investment by RMB15,000 million with its own funds. CCB Investment has remained a wholly-owned subsidiary of the Bank.
(b) Except for CCB Indonesia, the major subsidiaries of the Group are unlisted enterprises, details of the investments in subsidiaries are as follows:
Name of company
Principal place of
business
Particulars ofissued and
paid-up capitalKind of legal
entityPrincipalactivities
% ofownership
directly heldby the Bank
% ofownership
indirectly heldby the Bank
% ofvoting rights held by the
BankMethod of investment
CCB Investment Beijing,the PRC
RMB27,000 million Company withLimited Liability
Investment 100% – 100% Establishment
CCB Wealth Management Shenzhen,the PRC
RMB15,000 million Company with Limited Liability
WealthManagement
100% – 100% Establishment
CCB Financial Leasing Beijing,the PRC
RMB11,000 million Company withLimited Liability
FinancialLeasing
100% – 100% Establishment
CCB Brazil Financial Holding – Investimentos e Participações Ltda.
Sao Paulo,Brasil
R$4,281 million Company withLimited Liability
Investment 99.99% 0.01% 100% Acquisition
CCB Trust Anhui,the PRC
RMB10,500 million Company withLimited Liability
Trust business 67% – 67% Acquisition
CCB Life Shanghai,the PRC
RMB7,120 million Company Limited by Shares
Insurance 51% – 51% Acquisition
CCB Europe Luxembourg EUR550 million Company withLimited Liability
CommercialBanking
100% – 100% Establishment
CCB London London,United Kingdom
US$200 million RMB1,500 million
Company withLimited Liability
CommercialBanking
100% – 100% Establishment
CCB Indonesia Jakarta,Indonesia
IDR3,791,973 million Company Limited by Shares
CommercialBanking
60% – 60% Acquisition
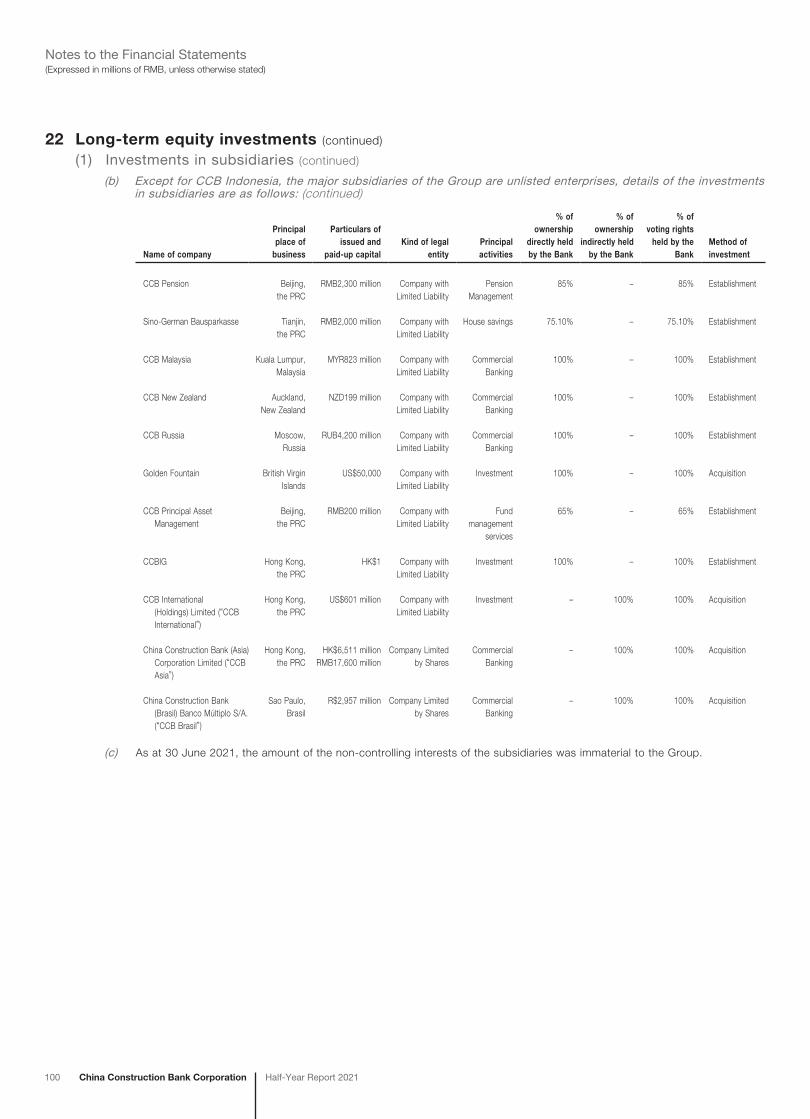
100 China Construction Bank Corporation Half-Year Report 2021
(Expressed in millions of RMB, unless otherwise stated)Notes to the Financial Statements
Name of company
Principal place of
business
Particulars ofissued and
paid-up capitalKind of legal
entityPrincipalactivities
% ofownership
directly heldby the Bank
% ofownership
indirectly heldby the Bank
% ofvoting rights held by the
BankMethod of investment
CCB Pension Beijing,the PRC
RMB2,300 million Company withLimited Liability
Pension Management
85% – 85% Establishment
Sino-German Bausparkasse Tianjin,the PRC
RMB2,000 million Company withLimited Liability
House savings 75.10% – 75.10% Establishment
CCB Malaysia Kuala Lumpur, Malaysia
MYR823 million Company with Limited Liability
CommercialBanking
100% – 100% Establishment
CCB New Zealand Auckland,New Zealand
NZD199 million Company withLimited Liability
CommercialBanking
100% – 100% Establishment
CCB Russia Moscow,Russia
RUB4,200 million Company withLimited Liability
CommercialBanking
100% – 100% Establishment
Golden Fountain British VirginIslands
US$50,000 Company withLimited Liability
Investment 100% – 100% Acquisition
CCB Principal Asset Management
Beijing,the PRC
RMB200 million Company withLimited Liability
Fundmanagement
services
65% – 65% Establishment
CCBIG Hong Kong,the PRC
HK$1 Company withLimited Liability
Investment 100% – 100% Establishment
CCB International (Holdings) Limited (“CCB International”)
Hong Kong,the PRC
US$601 million Company withLimited Liability
Investment – 100% 100% Acquisition
China Construction Bank (Asia) Corporation Limited (“CCB Asia”)
Hong Kong,the PRC
HK$6,511 millionRMB17,600 million
Company Limited by Shares
CommercialBanking
– 100% 100% Acquisition
China Construction Bank (Brasil) Banco Múltiplo S/A. (“CCB Brasil”)
Sao Paulo,Brasil
R$2,957 million Company Limited by Shares
CommercialBanking
– 100% 100% Acquisition
(c) As at 30 June 2021, the amount of the non-controlling interests of the subsidiaries was immaterial to the Group.
22 Long-term equity investments (continued)
(1) Investments in subsidiaries (continued)
(b) Except for CCB Indonesia, the major subsidiaries of the Group are unlisted enterprises, details of the investments in subsidiaries are as follows: (continued)
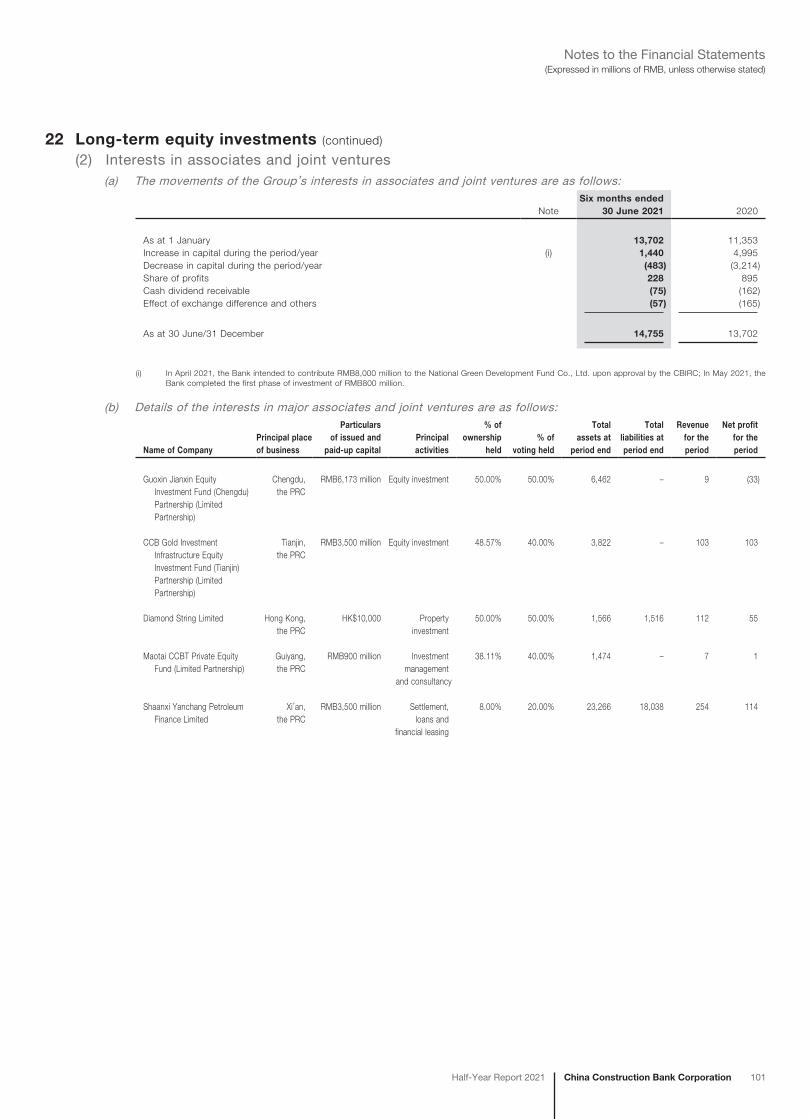
China Construction Bank CorporationHalf-Year Report 2021 101
(Expressed in millions of RMB, unless otherwise stated)Notes to the Financial Statements
22 Long-term equity investments (continued)
(2) Interests in associates and joint ventures(a) The movements of the Group’s interests in associates and joint ventures are as follows:
NoteSix months ended
30 June 2021 2020
As at 1 January 13,702 11,353Increase in capital during the period/year (i) 1,440 4,995Decrease in capital during the period/year (483) (3,214)Share of profits 228 895Cash dividend receivable (75) (162)Effect of exchange difference and others (57) (165)
As at 30 June/31 December 14,755 13,702
(i) In April 2021, the Bank intended to contribute RMB8,000 million to the National Green Development Fund Co., Ltd. upon approval by the CBIRC; In May 2021, the Bank completed the first phase of investment of RMB800 million.
(b) Details of the interests in major associates and joint ventures are as follows:
Name of CompanyPrincipal place of business
Particularsof issued and
paid-up capitalPrincipalactivities
% of ownership
held% of
voting held
Total assets at
period end
Total liabilities at period end
Revenuefor theperiod
Net profitfor the period
Guoxin Jianxin Equity Investment Fund (Chengdu) Partnership (Limited Partnership)
Chengdu, the PRC
RMB6,173 million Equity investment 50.00% 50.00% 6,462 – 9 (33)
CCB Gold Investment Infrastructure Equity Investment Fund (Tianjin) Partnership (Limited Partnership)
Tianjin,the PRC
RMB3,500 million Equity investment 48.57% 40.00% 3,822 – 103 103
Diamond String Limited Hong Kong,the PRC
HK$10,000 Property investment
50.00% 50.00% 1,566 1,516 112 55
Maotai CCBT Private Equity Fund (Limited Partnership)
Guiyang,the PRC
RMB900 million Investment management
and consultancy
38.11% 40.00% 1,474 – 7 1
Shaanxi Yanchang Petroleum Finance Limited
Xi’an,the PRC
RMB3,500 million Settlement, loans and
financial leasing
8.00% 20.00% 23,266 18,038 254 114
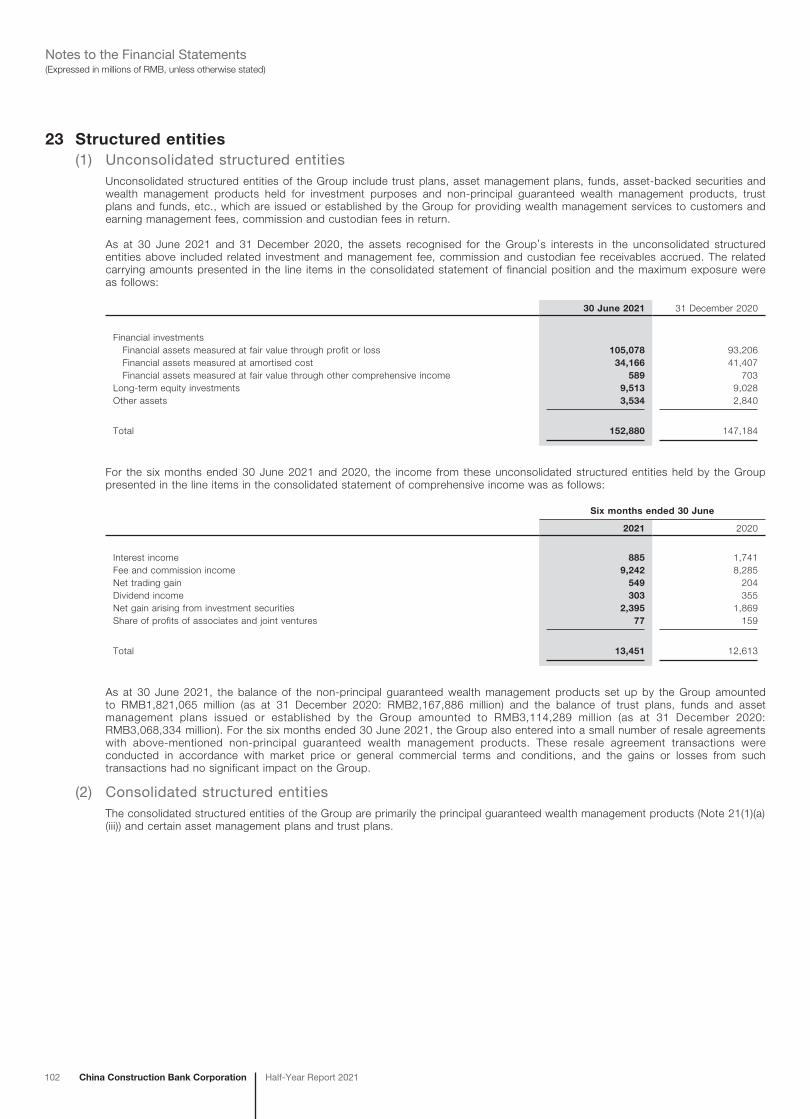
102 China Construction Bank Corporation Half-Year Report 2021
(Expressed in millions of RMB, unless otherwise stated)Notes to the Financial Statements
23 Structured entities(1) Unconsolidated structured entities
Unconsolidated structured entities of the Group include trust plans, asset management plans, funds, asset-backed securities and wealth management products held for investment purposes and non-principal guaranteed wealth management products, trust plans and funds, etc., which are issued or established by the Group for providing wealth management services to customers and earning management fees, commission and custodian fees in return.
As at 30 June 2021 and 31 December 2020, the assets recognised for the Group’s interests in the unconsolidated structured entities above included related investment and management fee, commission and custodian fee receivables accrued. The related carrying amounts presented in the line items in the consolidated statement of financial position and the maximum exposure were as follows:
30 June 2021 31 December 2020
Financial investments Financial assets measured at fair value through profit or loss 105,078 93,206 Financial assets measured at amortised cost 34,166 41,407 Financial assets measured at fair value through other comprehensive income 589 703Long-term equity investments 9,513 9,028Other assets 3,534 2,840
Total 152,880 147,184
For the six months ended 30 June 2021 and 2020, the income from these unconsolidated structured entities held by the Group presented in the line items in the consolidated statement of comprehensive income was as follows:
Six months ended 30 June
2021 2020
Interest income 885 1,741Fee and commission income 9,242 8,285Net trading gain 549 204Dividend income 303 355Net gain arising from investment securities 2,395 1,869Share of profits of associates and joint ventures 77 159
Total 13,451 12,613
As at 30 June 2021, the balance of the non-principal guaranteed wealth management products set up by the Group amounted to RMB1,821,065 million (as at 31 December 2020: RMB2,167,886 million) and the balance of trust plans, funds and asset management plans issued or established by the Group amounted to RMB3,114,289 million (as at 31 December 2020: RMB3,068,334 million). For the six months ended 30 June 2021, the Group also entered into a small number of resale agreements with above-mentioned non-principal guaranteed wealth management products. These resale agreement transactions were conducted in accordance with market price or general commercial terms and conditions, and the gains or losses from such transactions had no significant impact on the Group.
(2) Consolidated structured entitiesThe consolidated structured entities of the Group are primarily the principal guaranteed wealth management products (Note 21(1)(a)(iii)) and certain asset management plans and trust plans.
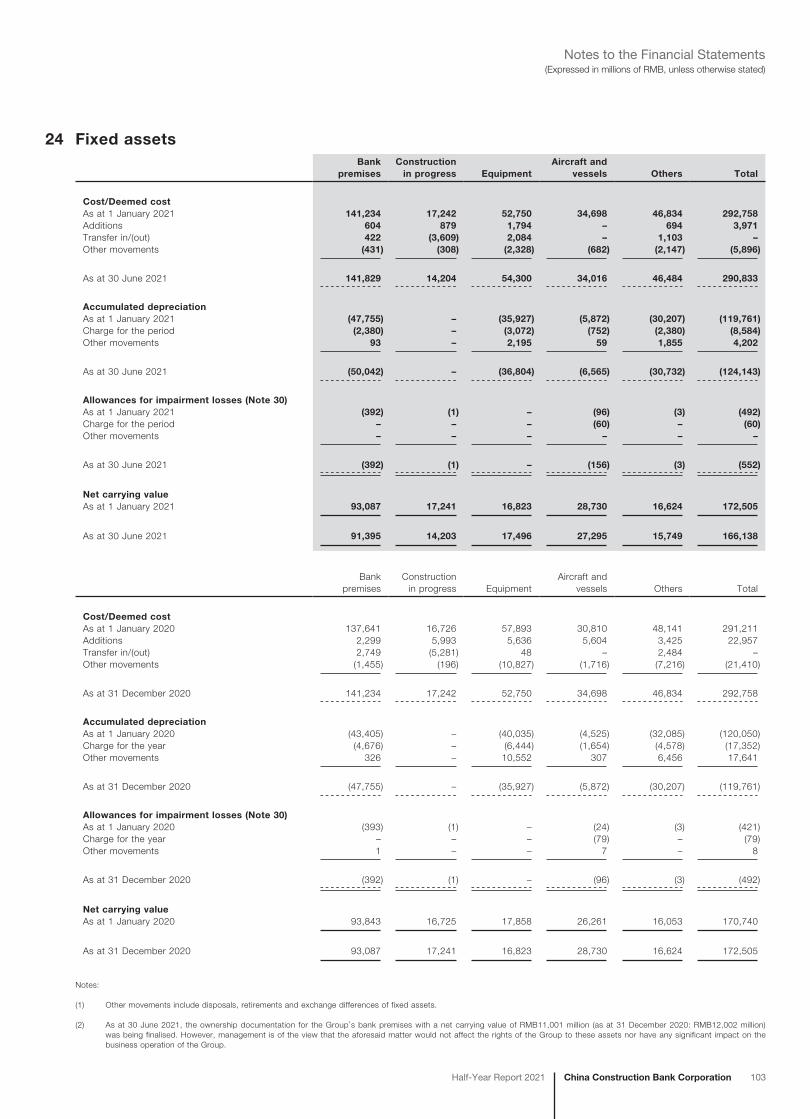
China Construction Bank CorporationHalf-Year Report 2021 103
(Expressed in millions of RMB, unless otherwise stated)Notes to the Financial Statements
24 Fixed assetsBank
premisesConstruction
in progress EquipmentAircraft and
vessels Others Total
Cost/Deemed costAs at 1 January 2021 141,234 17,242 52,750 34,698 46,834 292,758Additions 604 879 1,794 – 694 3,971Transfer in/(out) 422 (3,609) 2,084 – 1,103 –Other movements (431) (308) (2,328) (682) (2,147) (5,896)
As at 30 June 2021 141,829 14,204 54,300 34,016 46,484 290,833
Accumulated depreciationAs at 1 January 2021 (47,755) – (35,927) (5,872) (30,207) (119,761)Charge for the period (2,380) – (3,072) (752) (2,380) (8,584)Other movements 93 – 2,195 59 1,855 4,202
As at 30 June 2021 (50,042) – (36,804) (6,565) (30,732) (124,143)
Allowances for impairment losses (Note 30)As at 1 January 2021 (392) (1) – (96) (3) (492)Charge for the period – – – (60) – (60)Other movements – – – – – –
As at 30 June 2021 (392) (1) – (156) (3) (552)
Net carrying valueAs at 1 January 2021 93,087 17,241 16,823 28,730 16,624 172,505
As at 30 June 2021 91,395 14,203 17,496 27,295 15,749 166,138
Bank premises
Construction in progress Equipment
Aircraft and vessels Others Total
Cost/Deemed costAs at 1 January 2020 137,641 16,726 57,893 30,810 48,141 291,211Additions 2,299 5,993 5,636 5,604 3,425 22,957Transfer in/(out) 2,749 (5,281) 48 – 2,484 –Other movements (1,455) (196) (10,827) (1,716) (7,216) (21,410)
As at 31 December 2020 141,234 17,242 52,750 34,698 46,834 292,758
Accumulated depreciationAs at 1 January 2020 (43,405) – (40,035) (4,525) (32,085) (120,050)Charge for the year (4,676) – (6,444) (1,654) (4,578) (17,352)Other movements 326 – 10,552 307 6,456 17,641
As at 31 December 2020 (47,755) – (35,927) (5,872) (30,207) (119,761)
Allowances for impairment losses (Note 30)As at 1 January 2020 (393) (1) – (24) (3) (421)Charge for the year – – – (79) – (79)Other movements 1 – – 7 – 8
As at 31 December 2020 (392) (1) – (96) (3) (492)
Net carrying valueAs at 1 January 2020 93,843 16,725 17,858 26,261 16,053 170,740
As at 31 December 2020 93,087 17,241 16,823 28,730 16,624 172,505
Notes:
(1) Other movements include disposals, retirements and exchange differences of fixed assets.
(2) As at 30 June 2021, the ownership documentation for the Group’s bank premises with a net carrying value of RMB11,001 million (as at 31 December 2020: RMB12,002 million) was being finalised. However, management is of the view that the aforesaid matter would not affect the rights of the Group to these assets nor have any significant impact on the business operation of the Group.
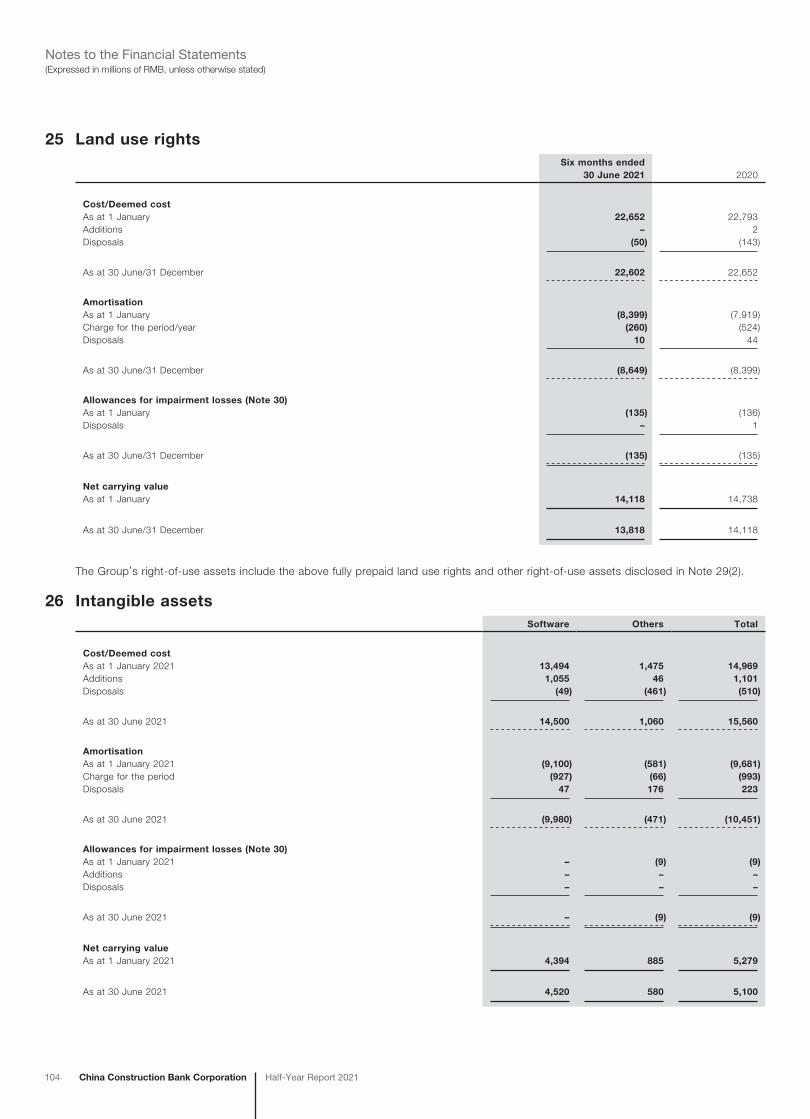
104 China Construction Bank Corporation Half-Year Report 2021
(Expressed in millions of RMB, unless otherwise stated)Notes to the Financial Statements
25 Land use rightsSix months ended
30 June 2021 2020
Cost/Deemed costAs at 1 January 22,652 22,793Additions – 2Disposals (50) (143)
As at 30 June/31 December 22,602 22,652
AmortisationAs at 1 January (8,399) (7,919)Charge for the period/year (260) (524)Disposals 10 44
As at 30 June/31 December (8,649) (8,399)
Allowances for impairment losses (Note 30)As at 1 January (135) (136)Disposals – 1
As at 30 June/31 December (135) (135)
Net carrying valueAs at 1 January 14,118 14,738
As at 30 June/31 December 13,818 14,118
The Group’s right-of-use assets include the above fully prepaid land use rights and other right-of-use assets disclosed in Note 29(2).
26 Intangible assetsSoftware Others Total
Cost/Deemed costAs at 1 January 2021 13,494 1,475 14,969Additions 1,055 46 1,101Disposals (49) (461) (510)
As at 30 June 2021 14,500 1,060 15,560
AmortisationAs at 1 January 2021 (9,100) (581) (9,681)Charge for the period (927) (66) (993)Disposals 47 176 223
As at 30 June 2021 (9,980) (471) (10,451)
Allowances for impairment losses (Note 30)As at 1 January 2021 – (9) (9)Additions – – –Disposals – – –
As at 30 June 2021 – (9) (9)
Net carrying valueAs at 1 January 2021 4,394 885 5,279
As at 30 June 2021 4,520 580 5,100
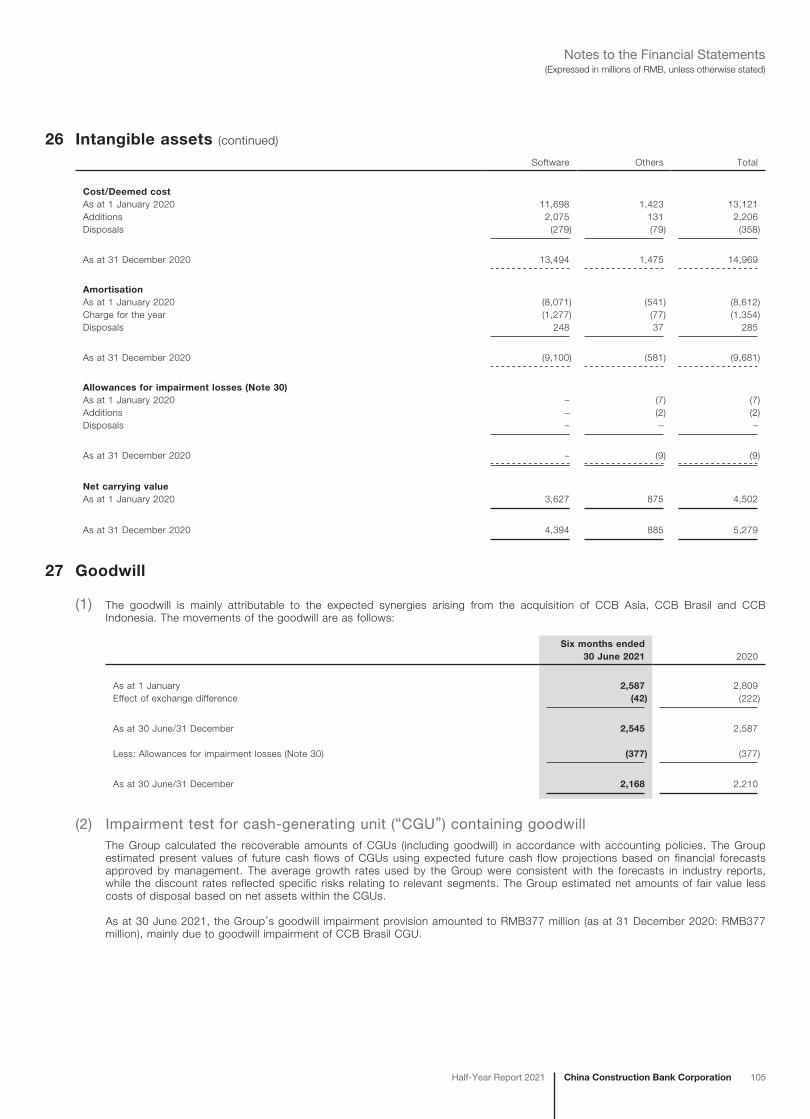
China Construction Bank CorporationHalf-Year Report 2021 105
(Expressed in millions of RMB, unless otherwise stated)Notes to the Financial Statements
26 Intangible assets (continued)
Software Others Total
Cost/Deemed costAs at 1 January 2020 11,698 1,423 13,121Additions 2,075 131 2,206Disposals (279) (79) (358)
As at 31 December 2020 13,494 1,475 14,969
AmortisationAs at 1 January 2020 (8,071) (541) (8,612)Charge for the year (1,277) (77) (1,354)Disposals 248 37 285
As at 31 December 2020 (9,100) (581) (9,681)
Allowances for impairment losses (Note 30)As at 1 January 2020 – (7) (7)Additions – (2) (2)Disposals – – –
As at 31 December 2020 – (9) (9)
Net carrying valueAs at 1 January 2020 3,627 875 4,502
As at 31 December 2020 4,394 885 5,279
27 Goodwill
(1) The goodwill is mainly attributable to the expected synergies arising from the acquisition of CCB Asia, CCB Brasil and CCB Indonesia. The movements of the goodwill are as follows:
Six months ended 30 June 2021 2020
As at 1 January 2,587 2,809Effect of exchange difference (42) (222)
As at 30 June/31 December 2,545 2,587
Less: Allowances for impairment losses (Note 30) (377) (377)
As at 30 June/31 December 2,168 2,210
(2) Impairment test for cash-generating unit (“CGU”) containing goodwillThe Group calculated the recoverable amounts of CGUs (including goodwill) in accordance with accounting policies. The Group estimated present values of future cash flows of CGUs using expected future cash flow projections based on financial forecasts approved by management. The average growth rates used by the Group were consistent with the forecasts in industry reports, while the discount rates reflected specific risks relating to relevant segments. The Group estimated net amounts of fair value less costs of disposal based on net assets within the CGUs.
As at 30 June 2021, the Group’s goodwill impairment provision amounted to RMB377 million (as at 31 December 2020: RMB377 million), mainly due to goodwill impairment of CCB Brasil CGU.
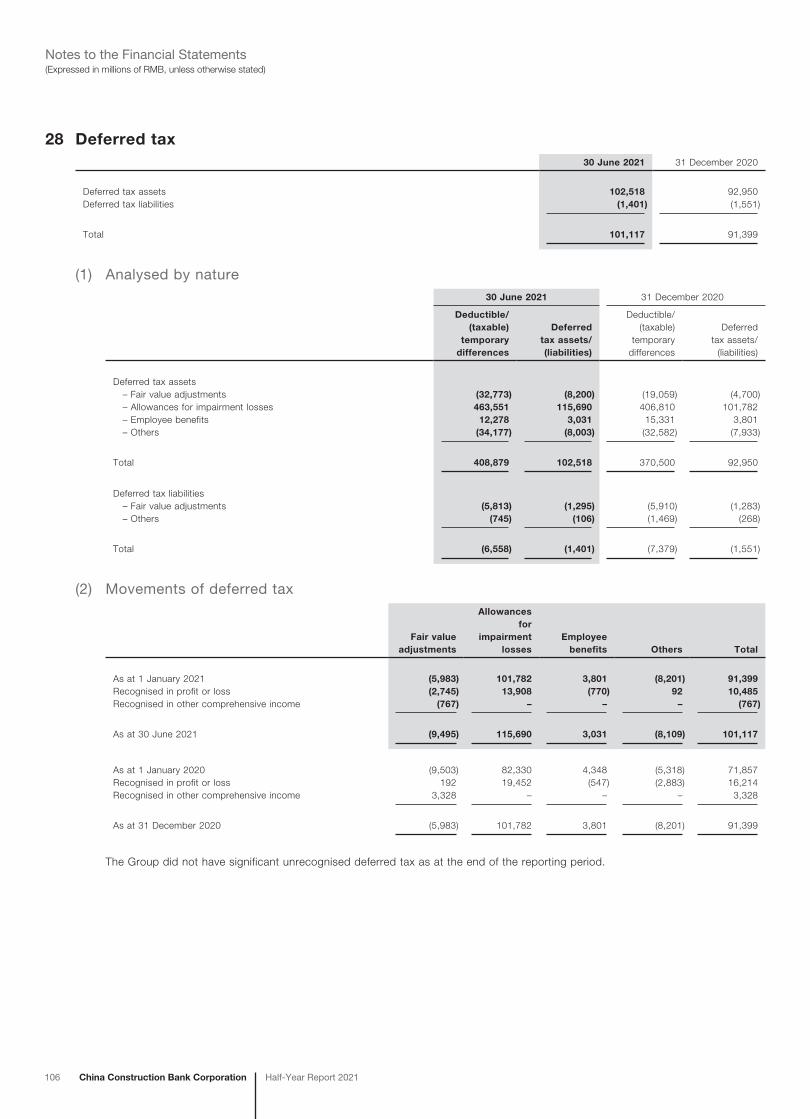
106 China Construction Bank Corporation Half-Year Report 2021
(Expressed in millions of RMB, unless otherwise stated)Notes to the Financial Statements
28 Deferred tax30 June 2021 31 December 2020
Deferred tax assets 102,518 92,950Deferred tax liabilities (1,401) (1,551)
Total 101,117 91,399
(1) Analysed by nature30 June 2021 31 December 2020
Deductible/(taxable)
temporarydifferences
Deferredtax assets/(liabilities)
Deductible/(taxable)
temporarydifferences
Deferredtax assets/
(liabilities)
Deferred tax assets – Fair value adjustments (32,773) (8,200) (19,059) (4,700) – Allowances for impairment losses 463,551 115,690 406,810 101,782 – Employee benefits 12,278 3,031 15,331 3,801 – Others (34,177) (8,003) (32,582) (7,933)
Total 408,879 102,518 370,500 92,950
Deferred tax liabilities – Fair value adjustments (5,813) (1,295) (5,910) (1,283) – Others (745) (106) (1,469) (268)
Total (6,558) (1,401) (7,379) (1,551)
(2) Movements of deferred tax
Fair valueadjustments
Allowancesfor
impairmentlosses
Employee benefits Others Total
As at 1 January 2021 (5,983) 101,782 3,801 (8,201) 91,399Recognised in profit or loss (2,745) 13,908 (770) 92 10,485Recognised in other comprehensive income (767) – – – (767)
As at 30 June 2021 (9,495) 115,690 3,031 (8,109) 101,117
As at 1 January 2020 (9,503) 82,330 4,348 (5,318) 71,857Recognised in profit or loss 192 19,452 (547) (2,883) 16,214Recognised in other comprehensive income 3,328 – – – 3,328
As at 31 December 2020 (5,983) 101,782 3,801 (8,201) 91,399
The Group did not have significant unrecognised deferred tax as at the end of the reporting period.
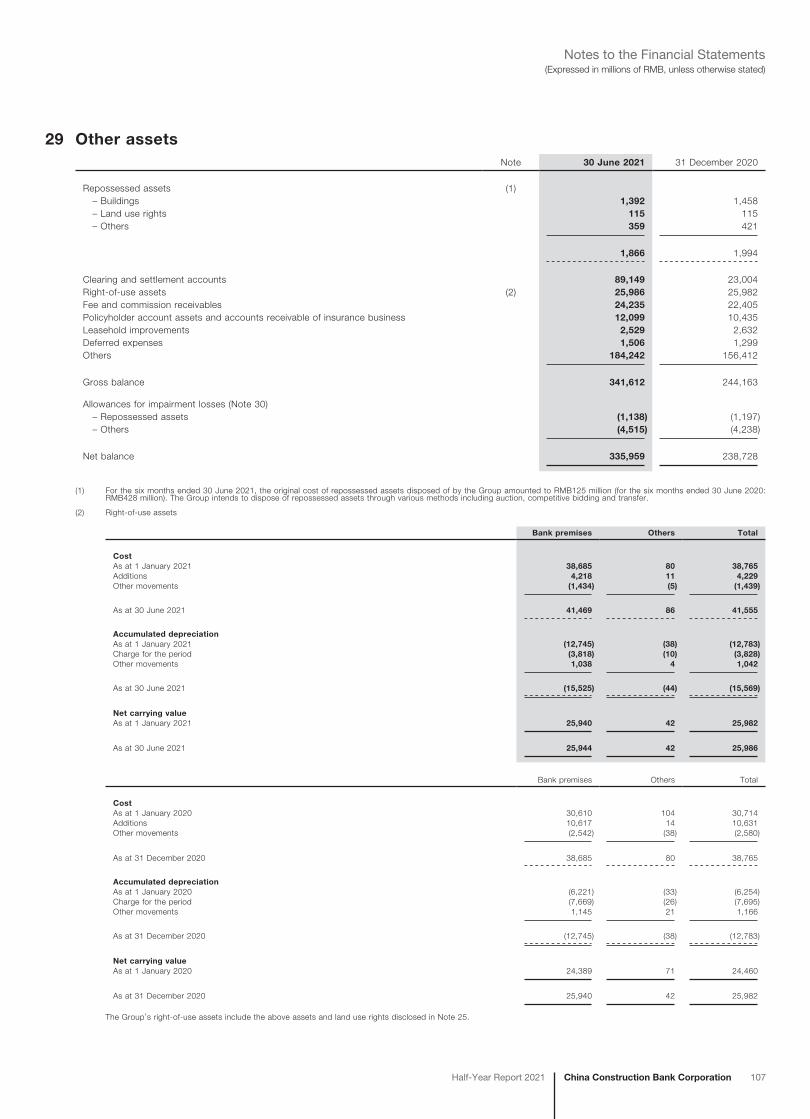
China Construction Bank CorporationHalf-Year Report 2021 107
(Expressed in millions of RMB, unless otherwise stated)Notes to the Financial Statements
29 Other assetsNote 30 June 2021 31 December 2020
Repossessed assets (1) – Buildings 1,392 1,458 – Land use rights 115 115 – Others 359 421
1,866 1,994
Clearing and settlement accounts 89,149 23,004Right-of-use assets (2) 25,986 25,982Fee and commission receivables 24,235 22,405Policyholder account assets and accounts receivable of insurance business 12,099 10,435Leasehold improvements 2,529 2,632Deferred expenses 1,506 1,299Others 184,242 156,412
Gross balance 341,612 244,163
Allowances for impairment losses (Note 30) – Repossessed assets (1,138) (1,197) – Others (4,515) (4,238)
Net balance 335,959 238,728
(1) For the six months ended 30 June 2021, the original cost of repossessed assets disposed of by the Group amounted to RMB125 million (for the six months ended 30 June 2020: RMB428 million). The Group intends to dispose of repossessed assets through various methods including auction, competitive bidding and transfer.
(2) Right-of-use assets
Bank premises Others Total
CostAs at 1 January 2021 38,685 80 38,765Additions 4,218 11 4,229Other movements (1,434) (5) (1,439)
As at 30 June 2021 41,469 86 41,555
Accumulated depreciationAs at 1 January 2021 (12,745) (38) (12,783)Charge for the period (3,818) (10) (3,828)Other movements 1,038 4 1,042
As at 30 June 2021 (15,525) (44) (15,569)
Net carrying valueAs at 1 January 2021 25,940 42 25,982
As at 30 June 2021 25,944 42 25,986
Bank premises Others Total
CostAs at 1 January 2020 30,610 104 30,714Additions 10,617 14 10,631Other movements (2,542) (38) (2,580)
As at 31 December 2020 38,685 80 38,765
Accumulated depreciationAs at 1 January 2020 (6,221) (33) (6,254)Charge for the period (7,669) (26) (7,695)Other movements 1,145 21 1,166
As at 31 December 2020 (12,745) (38) (12,783)
Net carrying valueAs at 1 January 2020 24,389 71 24,460
As at 31 December 2020 25,940 42 25,982
The Group’s right-of-use assets include the above assets and land use rights disclosed in Note 25.
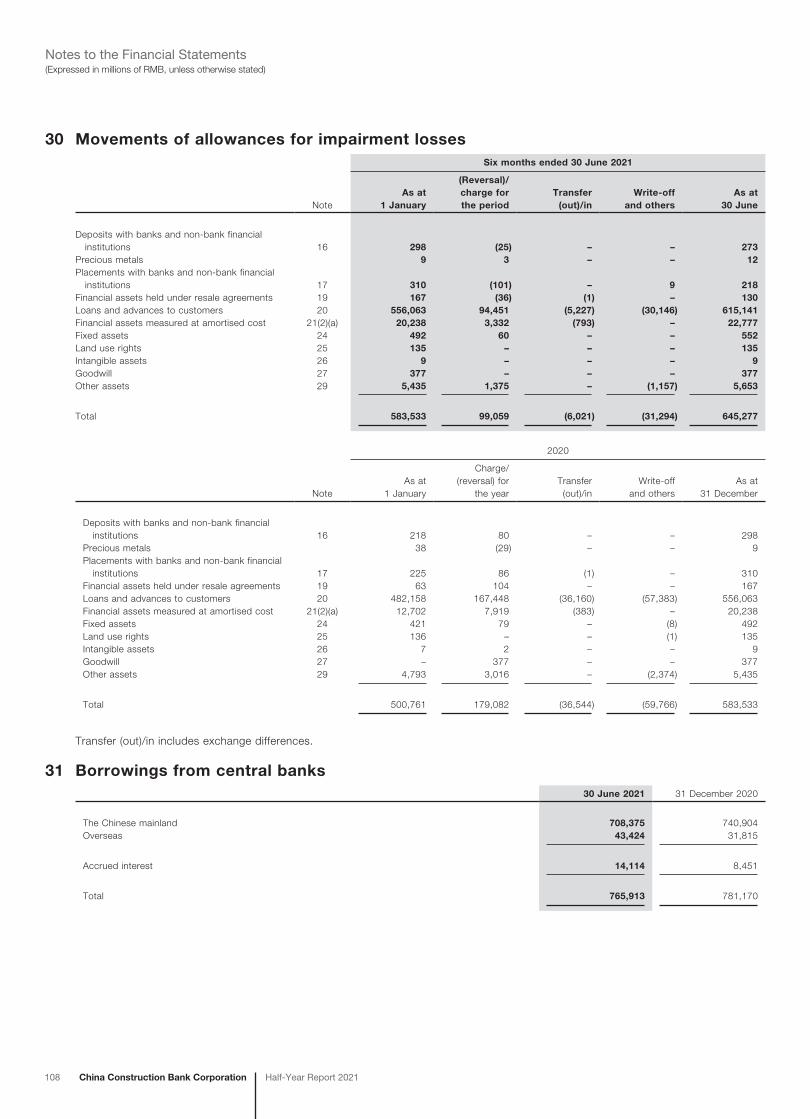
108 China Construction Bank Corporation Half-Year Report 2021
(Expressed in millions of RMB, unless otherwise stated)Notes to the Financial Statements
30 Movements of allowances for impairment lossesSix months ended 30 June 2021
NoteAs at
1 January
(Reversal)/charge forthe period
Transfer(out)/in
Write-off and others
As at30 June
Deposits with banks and non-bank financial institutions 16 298 (25) – – 273Precious metals 9 3 – – 12Placements with banks and non-bank financial institutions 17 310 (101) – 9 218Financial assets held under resale agreements 19 167 (36) (1) – 130Loans and advances to customers 20 556,063 94,451 (5,227) (30,146) 615,141Financial assets measured at amortised cost 21(2)(a) 20,238 3,332 (793) – 22,777Fixed assets 24 492 60 – – 552Land use rights 25 135 – – – 135Intangible assets 26 9 – – – 9Goodwill 27 377 – – – 377Other assets 29 5,435 1,375 – (1,157) 5,653
Total 583,533 99,059 (6,021) (31,294) 645,277
2020
NoteAs at
1 January
Charge/(reversal) for
the yearTransfer
(out)/inWrite-off
and othersAs at
31 December
Deposits with banks and non-bank financial institutions 16 218 80 – – 298Precious metals 38 (29) – – 9Placements with banks and non-bank financial institutions 17 225 86 (1) – 310Financial assets held under resale agreements 19 63 104 – – 167Loans and advances to customers 20 482,158 167,448 (36,160) (57,383) 556,063Financial assets measured at amortised cost 21(2)(a) 12,702 7,919 (383) – 20,238Fixed assets 24 421 79 – (8) 492Land use rights 25 136 – – (1) 135Intangible assets 26 7 2 – – 9Goodwill 27 – 377 – – 377Other assets 29 4,793 3,016 – (2,374) 5,435
Total 500,761 179,082 (36,544) (59,766) 583,533
Transfer (out)/in includes exchange differences.
31 Borrowings from central banks30 June 2021 31 December 2020
The Chinese mainland 708,375 740,904Overseas 43,424 31,815
Accrued interest 14,114 8,451
Total 765,913 781,170
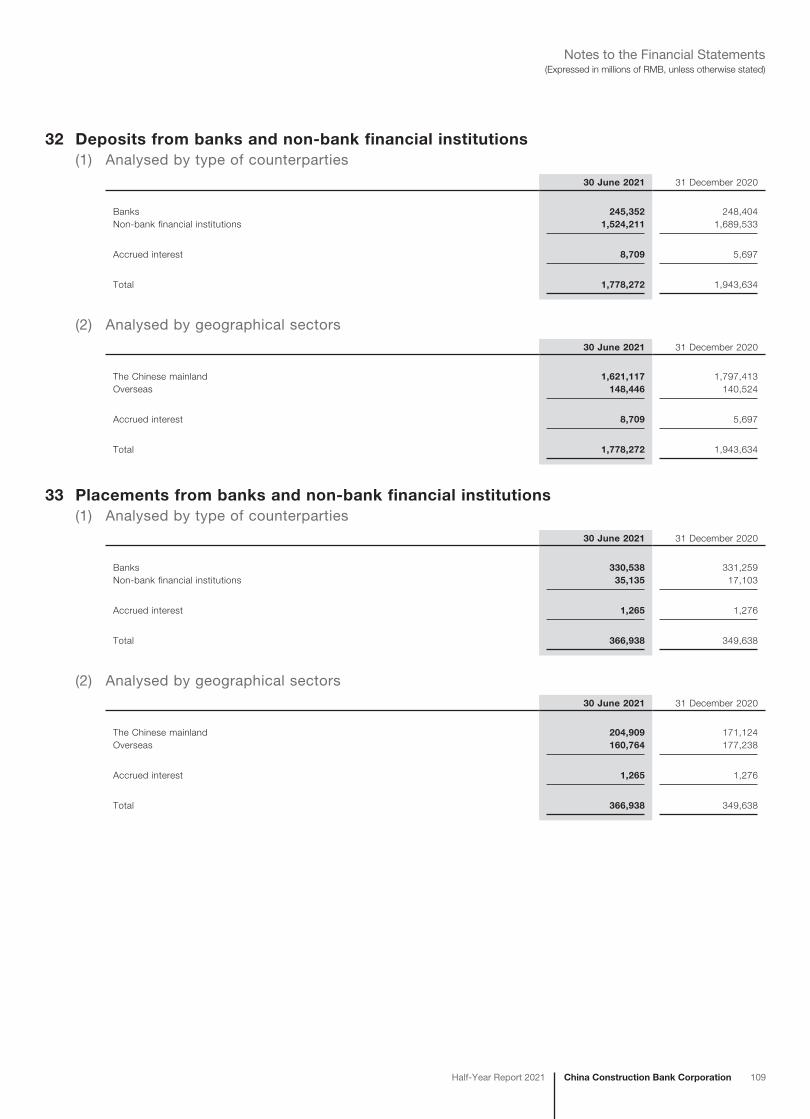
China Construction Bank CorporationHalf-Year Report 2021 109
(Expressed in millions of RMB, unless otherwise stated)Notes to the Financial Statements
32 Deposits from banks and non-bank financial institutions(1) Analysed by type of counterparties
30 June 2021 31 December 2020
Banks 245,352 248,404Non-bank financial institutions 1,524,211 1,689,533
Accrued interest 8,709 5,697
Total 1,778,272 1,943,634
(2) Analysed by geographical sectors30 June 2021 31 December 2020
The Chinese mainland 1,621,117 1,797,413Overseas 148,446 140,524
Accrued interest 8,709 5,697
Total 1,778,272 1,943,634
33 Placements from banks and non-bank financial institutions(1) Analysed by type of counterparties
30 June 2021 31 December 2020
Banks 330,538 331,259Non-bank financial institutions 35,135 17,103
Accrued interest 1,265 1,276
Total 366,938 349,638
(2) Analysed by geographical sectors30 June 2021 31 December 2020
The Chinese mainland 204,909 171,124Overseas 160,764 177,238
Accrued interest 1,265 1,276
Total 366,938 349,638
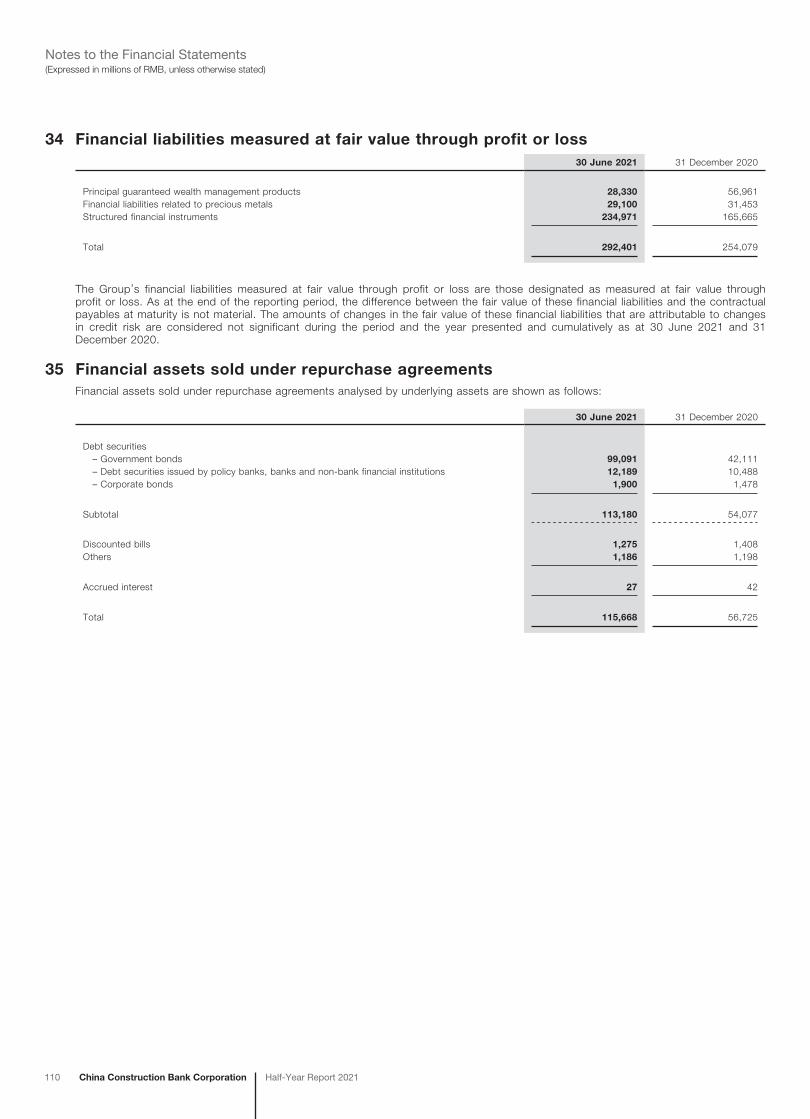
110 China Construction Bank Corporation Half-Year Report 2021
(Expressed in millions of RMB, unless otherwise stated)Notes to the Financial Statements
34 Financial liabilities measured at fair value through profit or loss30 June 2021 31 December 2020
Principal guaranteed wealth management products 28,330 56,961Financial liabilities related to precious metals 29,100 31,453Structured financial instruments 234,971 165,665
Total 292,401 254,079
The Group’s financial liabilities measured at fair value through profit or loss are those designated as measured at fair value through profit or loss. As at the end of the reporting period, the difference between the fair value of these financial liabilities and the contractual payables at maturity is not material. The amounts of changes in the fair value of these financial liabilities that are attributable to changes in credit risk are considered not significant during the period and the year presented and cumulatively as at 30 June 2021 and 31 December 2020.
35 Financial assets sold under repurchase agreementsFinancial assets sold under repurchase agreements analysed by underlying assets are shown as follows:
30 June 2021 31 December 2020
Debt securities – Government bonds 99,091 42,111 – Debt securities issued by policy banks, banks and non-bank financial institutions 12,189 10,488 – Corporate bonds 1,900 1,478
Subtotal 113,180 54,077
Discounted bills 1,275 1,408Others 1,186 1,198
Accrued interest 27 42
Total 115,668 56,725
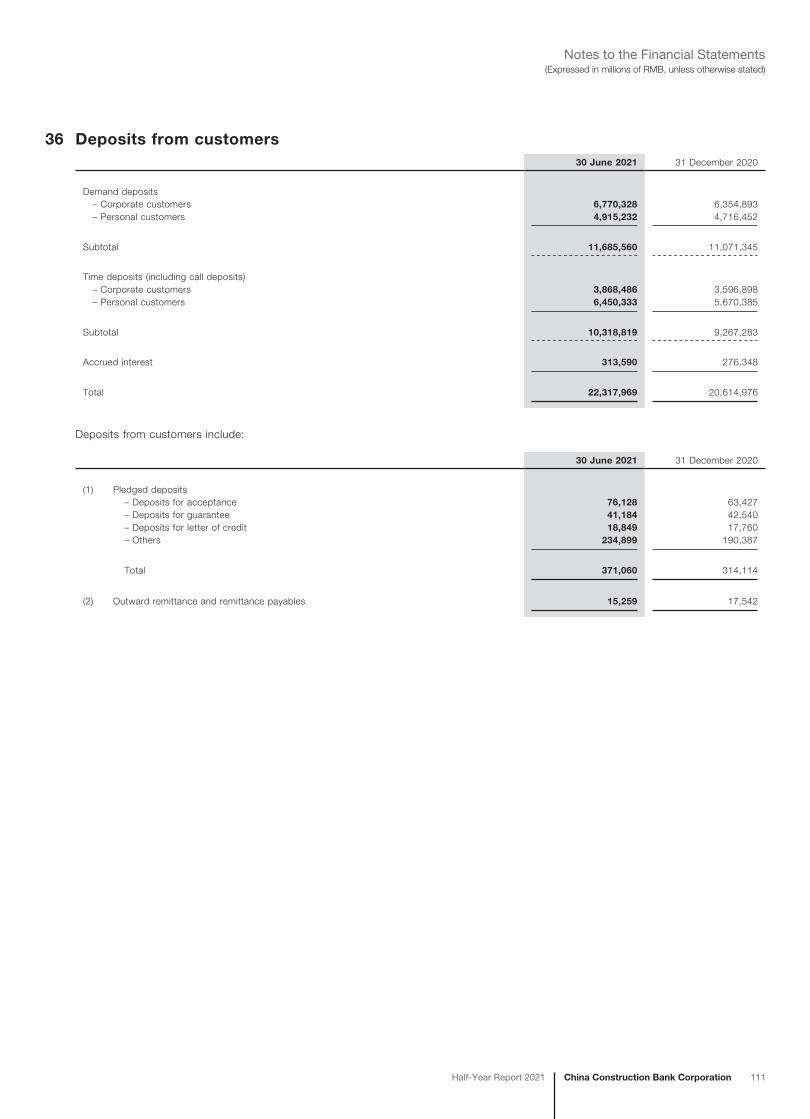
China Construction Bank CorporationHalf-Year Report 2021 111
(Expressed in millions of RMB, unless otherwise stated)Notes to the Financial Statements
36 Deposits from customers30 June 2021 31 December 2020
Demand deposits – Corporate customers 6,770,328 6,354,893 – Personal customers 4,915,232 4,716,452
Subtotal 11,685,560 11,071,345
Time deposits (including call deposits) – Corporate customers 3,868,486 3,596,898 – Personal customers 6,450,333 5,670,385
Subtotal 10,318,819 9,267,283
Accrued interest 313,590 276,348
Total 22,317,969 20,614,976
Deposits from customers include:
30 June 2021 31 December 2020
(1) Pledged deposits– Deposits for acceptance 76,128 63,427– Deposits for guarantee 41,184 42,540– Deposits for letter of credit 18,849 17,760– Others 234,899 190,387
Total 371,060 314,114
(2) Outward remittance and remittance payables 15,259 17,542
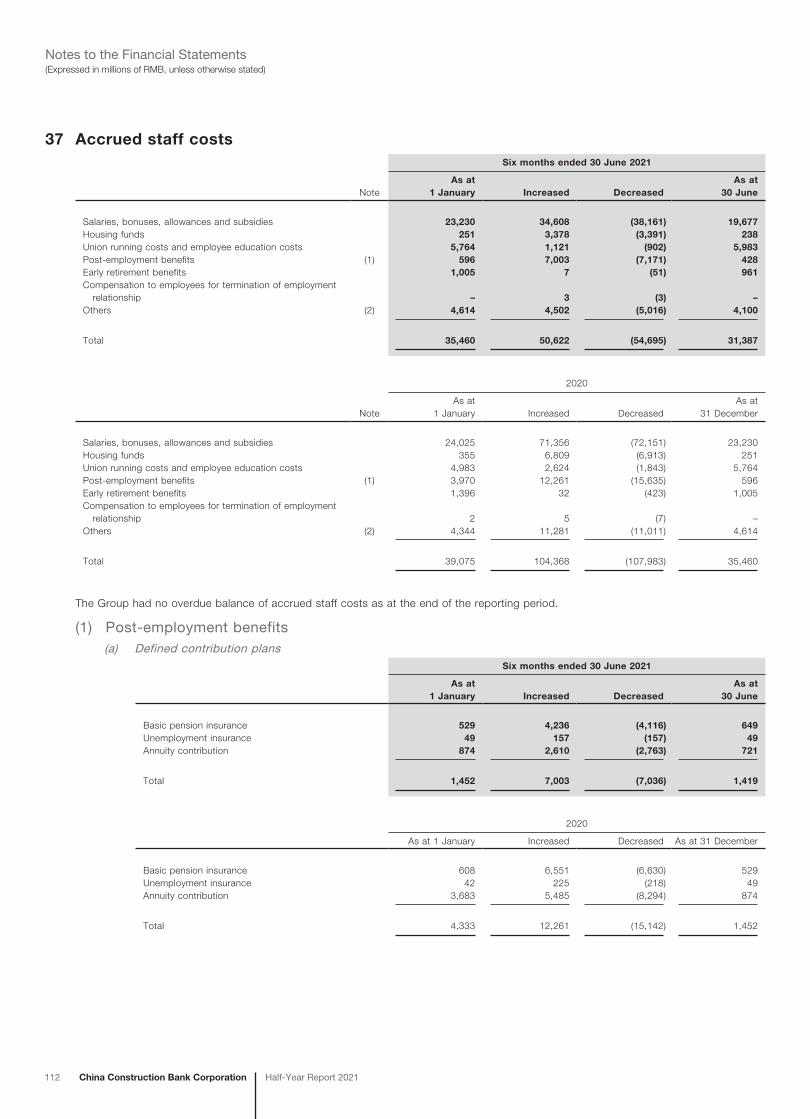
112 China Construction Bank Corporation Half-Year Report 2021
(Expressed in millions of RMB, unless otherwise stated)Notes to the Financial Statements
37 Accrued staff costsSix months ended 30 June 2021
NoteAs at
1 January Increased DecreasedAs at
30 June
Salaries, bonuses, allowances and subsidies 23,230 34,608 (38,161) 19,677Housing funds 251 3,378 (3,391) 238Union running costs and employee education costs 5,764 1,121 (902) 5,983Post-employment benefits (1) 596 7,003 (7,171) 428Early retirement benefits 1,005 7 (51) 961Compensation to employees for termination of employment relationship – 3 (3) –Others (2) 4,614 4,502 (5,016) 4,100
Total 35,460 50,622 (54,695) 31,387
2020
NoteAs at
1 January Increased DecreasedAs at
31 December
Salaries, bonuses, allowances and subsidies 24,025 71,356 (72,151) 23,230Housing funds 355 6,809 (6,913) 251Union running costs and employee education costs 4,983 2,624 (1,843) 5,764Post-employment benefits (1) 3,970 12,261 (15,635) 596Early retirement benefits 1,396 32 (423) 1,005Compensation to employees for termination of employment relationship 2 5 (7) –Others (2) 4,344 11,281 (11,011) 4,614
Total 39,075 104,368 (107,983) 35,460
The Group had no overdue balance of accrued staff costs as at the end of the reporting period.
(1) Post-employment benefits(a) Defined contribution plans
Six months ended 30 June 2021
As at1 January Increased Decreased
As at30 June
Basic pension insurance 529 4,236 (4,116) 649Unemployment insurance 49 157 (157) 49Annuity contribution 874 2,610 (2,763) 721
Total 1,452 7,003 (7,036) 1,419
2020
As at 1 January Increased Decreased As at 31 December
Basic pension insurance 608 6,551 (6,630) 529Unemployment insurance 42 225 (218) 49Annuity contribution 3,683 5,485 (8,294) 874
Total 4,333 12,261 (15,142) 1,452
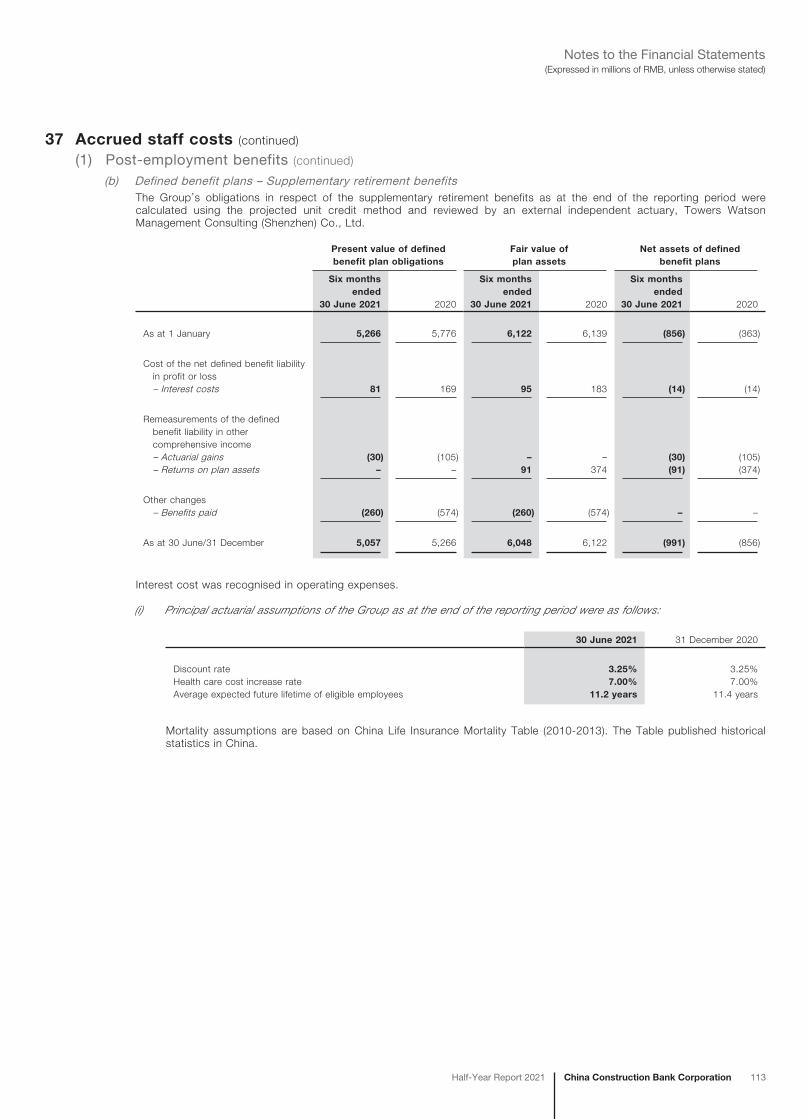
China Construction Bank CorporationHalf-Year Report 2021 113
(Expressed in millions of RMB, unless otherwise stated)Notes to the Financial Statements
37 Accrued staff costs (continued)
(1) Post-employment benefits (continued)
(b) Defined benefit plans – Supplementary retirement benefitsThe Group’s obligations in respect of the supplementary retirement benefits as at the end of the reporting period were calculated using the projected unit credit method and reviewed by an external independent actuary, Towers Watson Management Consulting (Shenzhen) Co., Ltd.
Present value of defined benefit plan obligations
Fair value of plan assets
Net assets of defined benefit plans
Six months ended
30 June 2021 2020
Six months ended
30 June 2021 2020
Six months ended
30 June 2021 2020
As at 1 January 5,266 5,776 6,122 6,139 (856) (363)
Cost of the net defined benefit liability in profit or loss – Interest costs 81 169 95 183 (14) (14)
Remeasurements of the defined benefit liability in other comprehensive income – Actuarial gains (30) (105) – – (30) (105) – Returns on plan assets – – 91 374 (91) (374)
Other changes – Benefits paid (260) (574) (260) (574) – –
As at 30 June/31 December 5,057 5,266 6,048 6,122 (991) (856)
Interest cost was recognised in operating expenses.
(i) Principal actuarial assumptions of the Group as at the end of the reporting period were as follows:
30 June 2021 31 December 2020
Discount rate 3.25% 3.25%Health care cost increase rate 7.00% 7.00%Average expected future lifetime of eligible employees 11.2 years 11.4 years
Mortality assumptions are based on China Life Insurance Mortality Table (2010-2013). The Table published historical statistics in China.
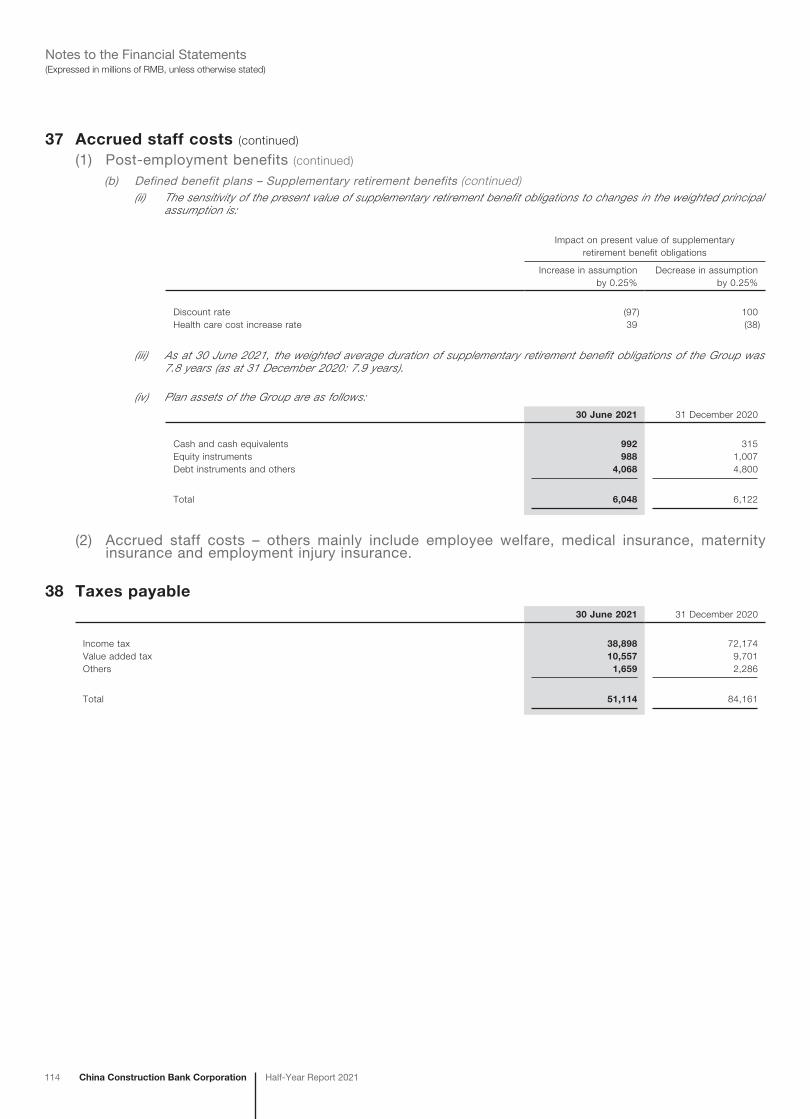
114 China Construction Bank Corporation Half-Year Report 2021
(Expressed in millions of RMB, unless otherwise stated)Notes to the Financial Statements
37 Accrued staff costs (continued)
(1) Post-employment benefits (continued)
(b) Defined benefit plans – Supplementary retirement benefits (continued)(ii) The sensitivity of the present value of supplementary retirement benefit obligations to changes in the weighted principal
assumption is:
Impact on present value of supplementary retirement benefit obligations
Increase in assumption by 0.25%
Decrease in assumption by 0.25%
Discount rate (97) 100Health care cost increase rate 39 (38)
(iii) As at 30 June 2021, the weighted average duration of supplementary retirement benefit obligations of the Group was 7.8 years (as at 31 December 2020: 7.9 years).
(iv) Plan assets of the Group are as follows:
30 June 2021 31 December 2020
Cash and cash equivalents 992 315Equity instruments 988 1,007Debt instruments and others 4,068 4,800
Total 6,048 6,122
(2) Accrued staff costs – others mainly include employee welfare, medical insurance, maternity insurance and employment injury insurance.
38 Taxes payable30 June 2021 31 December 2020
Income tax 38,898 72,174Value added tax 10,557 9,701Others 1,659 2,286
Total 51,114 84,161
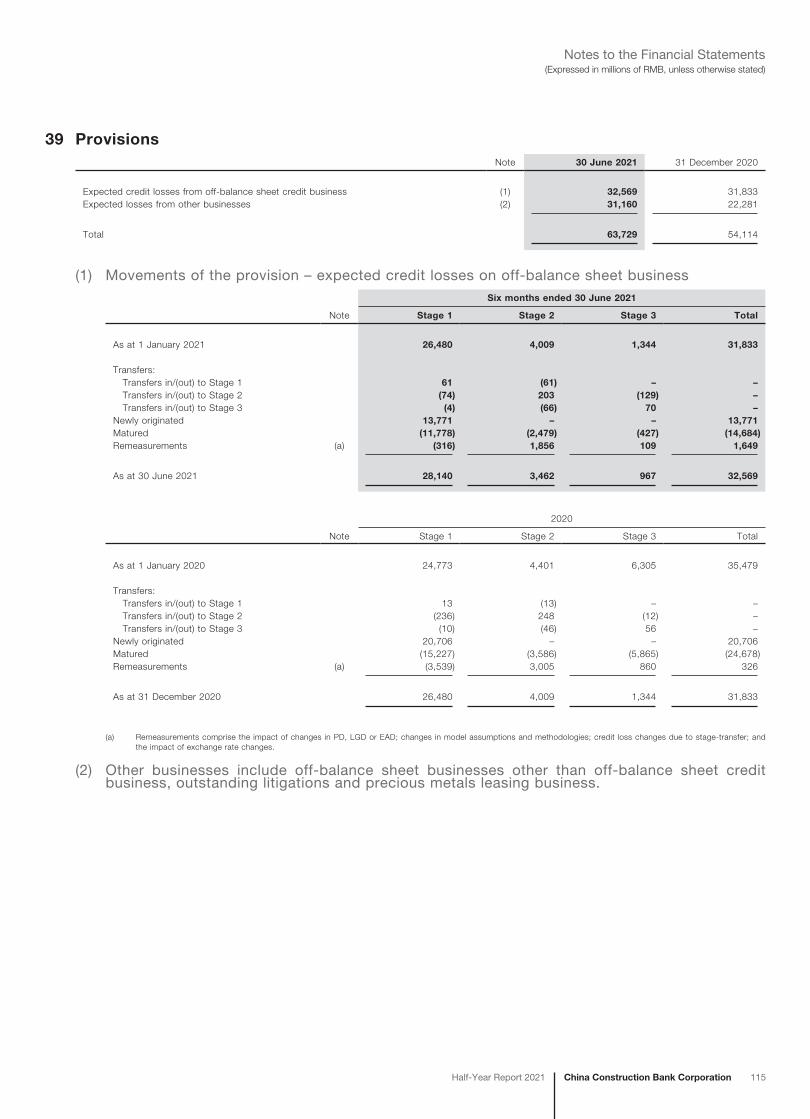
China Construction Bank CorporationHalf-Year Report 2021 115
(Expressed in millions of RMB, unless otherwise stated)Notes to the Financial Statements
39 ProvisionsNote 30 June 2021 31 December 2020
Expected credit losses from off-balance sheet credit business (1) 32,569 31,833Expected losses from other businesses (2) 31,160 22,281
Total 63,729 54,114
(1) Movements of the provision – expected credit losses on off-balance sheet businessSix months ended 30 June 2021
Note Stage 1 Stage 2 Stage 3 Total
As at 1 January 2021 26,480 4,009 1,344 31,833
Transfers: Transfers in/(out) to Stage 1 61 (61) – – Transfers in/(out) to Stage 2 (74) 203 (129) – Transfers in/(out) to Stage 3 (4) (66) 70 –Newly originated 13,771 – – 13,771Matured (11,778) (2,479) (427) (14,684)Remeasurements (a) (316) 1,856 109 1,649
As at 30 June 2021 28,140 3,462 967 32,569
2020
Note Stage 1 Stage 2 Stage 3 Total
As at 1 January 2020 24,773 4,401 6,305 35,479
Transfers: Transfers in/(out) to Stage 1 13 (13) – – Transfers in/(out) to Stage 2 (236) 248 (12) – Transfers in/(out) to Stage 3 (10) (46) 56 –Newly originated 20,706 – – 20,706Matured (15,227) (3,586) (5,865) (24,678)Remeasurements (a) (3,539) 3,005 860 326
As at 31 December 2020 26,480 4,009 1,344 31,833
(a) Remeasurements comprise the impact of changes in PD, LGD or EAD; changes in model assumptions and methodologies; credit loss changes due to stage-transfer; and the impact of exchange rate changes.
(2) Other businesses include off-balance sheet businesses other than off-balance sheet credit business, outstanding litigations and precious metals leasing business.
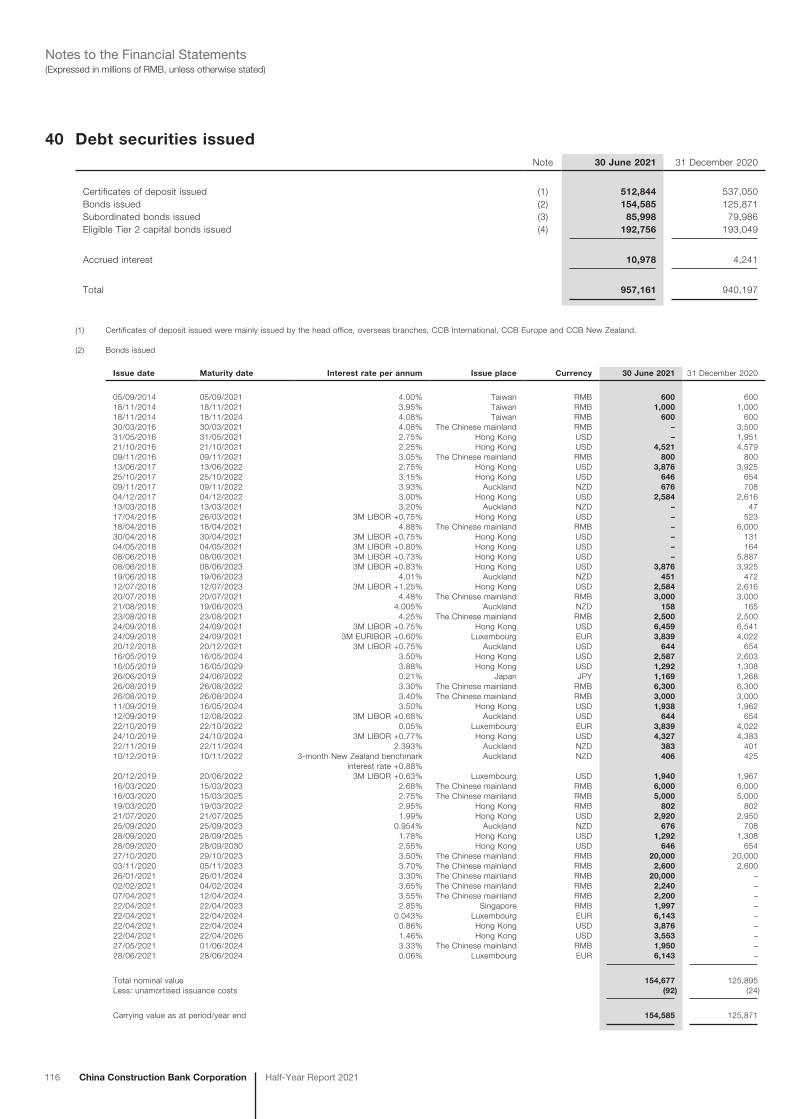
116 China Construction Bank Corporation Half-Year Report 2021
(Expressed in millions of RMB, unless otherwise stated)Notes to the Financial Statements
40 Debt securities issuedNote 30 June 2021 31 December 2020
Certificates of deposit issued (1) 512,844 537,050Bonds issued (2) 154,585 125,871Subordinated bonds issued (3) 85,998 79,986Eligible Tier 2 capital bonds issued (4) 192,756 193,049
Accrued interest 10,978 4,241
Total 957,161 940,197
(1) Certificates of deposit issued were mainly issued by the head office, overseas branches, CCB International, CCB Europe and CCB New Zealand.
(2) Bonds issued
Issue date Maturity date Interest rate per annum Issue place Currency 30 June 2021 31 December 2020
05/09/2014 05/09/2021 4.00% Taiwan RMB 600 60018/11/2014 18/11/2021 3.95% Taiwan RMB 1,000 1,00018/11/2014 18/11/2024 4.08% Taiwan RMB 600 60030/03/2016 30/03/2021 4.08% The Chinese mainland RMB – 3,50031/05/2016 31/05/2021 2.75% Hong Kong USD – 1,95121/10/2016 21/10/2021 2.25% Hong Kong USD 4,521 4,57909/11/2016 09/11/2021 3.05% The Chinese mainland RMB 800 80013/06/2017 13/06/2022 2.75% Hong Kong USD 3,876 3,92525/10/2017 25/10/2022 3.15% Hong Kong USD 646 65409/11/2017 09/11/2022 3.93% Auckland NZD 676 70804/12/2017 04/12/2022 3.00% Hong Kong USD 2,584 2,61613/03/2018 13/03/2021 3.20% Auckland NZD – 4717/04/2018 26/03/2021 3M LIBOR +0.75% Hong Kong USD – 52318/04/2018 18/04/2021 4.88% The Chinese mainland RMB – 6,00030/04/2018 30/04/2021 3M LIBOR +0.75% Hong Kong USD – 13104/05/2018 04/05/2021 3M LIBOR +0.80% Hong Kong USD – 16408/06/2018 08/06/2021 3M LIBOR +0.73% Hong Kong USD – 5,88708/06/2018 08/06/2023 3M LIBOR +0.83% Hong Kong USD 3,876 3,92519/06/2018 19/06/2023 4.01% Auckland NZD 451 47212/07/2018 12/07/2023 3M LIBOR +1.25% Hong Kong USD 2,584 2,61620/07/2018 20/07/2021 4.48% The Chinese mainland RMB 3,000 3,00021/08/2018 19/06/2023 4.005% Auckland NZD 158 16523/08/2018 23/08/2021 4.25% The Chinese mainland RMB 2,500 2,50024/09/2018 24/09/2021 3M LIBOR +0.75% Hong Kong USD 6,459 6,54124/09/2018 24/09/2021 3M EURIBOR +0.60% Luxembourg EUR 3,839 4,02220/12/2018 20/12/2021 3M LIBOR +0.75% Auckland USD 644 65416/05/2019 16/05/2024 3.50% Hong Kong USD 2,587 2,60316/05/2019 16/05/2029 3.88% Hong Kong USD 1,292 1,30826/06/2019 24/06/2022 0.21% Japan JPY 1,169 1,26826/08/2019 26/08/2022 3.30% The Chinese mainland RMB 6,300 6,30026/08/2019 26/08/2024 3.40% The Chinese mainland RMB 3,000 3,00011/09/2019 16/05/2024 3.50% Hong Kong USD 1,938 1,96212/09/2019 12/08/2022 3M LIBOR +0.68% Auckland USD 644 65422/10/2019 22/10/2022 0.05% Luxembourg EUR 3,839 4,02224/10/2019 24/10/2024 3M LIBOR +0.77% Hong Kong USD 4,327 4,38322/11/2019 22/11/2024 2.393% Auckland NZD 383 40110/12/2019 10/11/2022 3-month New Zealand benchmark
interest rate +0.88%Auckland NZD 406 425
20/12/2019 20/06/2022 3M LIBOR +0.63% Luxembourg USD 1,940 1,96716/03/2020 15/03/2023 2.68% The Chinese mainland RMB 6,000 6,00016/03/2020 15/03/2025 2.75% The Chinese mainland RMB 5,000 5,00019/03/2020 19/03/2022 2.95% Hong Kong RMB 802 80221/07/2020 21/07/2025 1.99% Hong Kong USD 2,920 2,95025/09/2020 25/09/2023 0.954% Auckland NZD 676 70828/09/2020 28/09/2025 1.78% Hong Kong USD 1,292 1,30828/09/2020 28/09/2030 2.55% Hong Kong USD 646 65427/10/2020 29/10/2023 3.50% The Chinese mainland RMB 20,000 20,00003/11/2020 05/11/2023 3.70% The Chinese mainland RMB 2,600 2,60026/01/2021 26/01/2024 3.30% The Chinese mainland RMB 20,000 –02/02/2021 04/02/2024 3.65% The Chinese mainland RMB 2,240 –07/04/2021 12/04/2024 3.55% The Chinese mainland RMB 2,200 –22/04/2021 22/04/2023 2.85% Singapore RMB 1,997 –22/04/2021 22/04/2024 0.043% Luxembourg EUR 6,143 –22/04/2021 22/04/2024 0.86% Hong Kong USD 3,876 –22/04/2021 22/04/2026 1.46% Hong Kong USD 3,553 –27/05/2021 01/06/2024 3.33% The Chinese mainland RMB 1,950 –28/06/2021 28/06/2024 0.06% Luxembourg EUR 6,143 –
Total nominal value 154,677 125,895Less: unamortised issuance costs (92) (24)
Carrying value as at period/year end 154,585 125,871
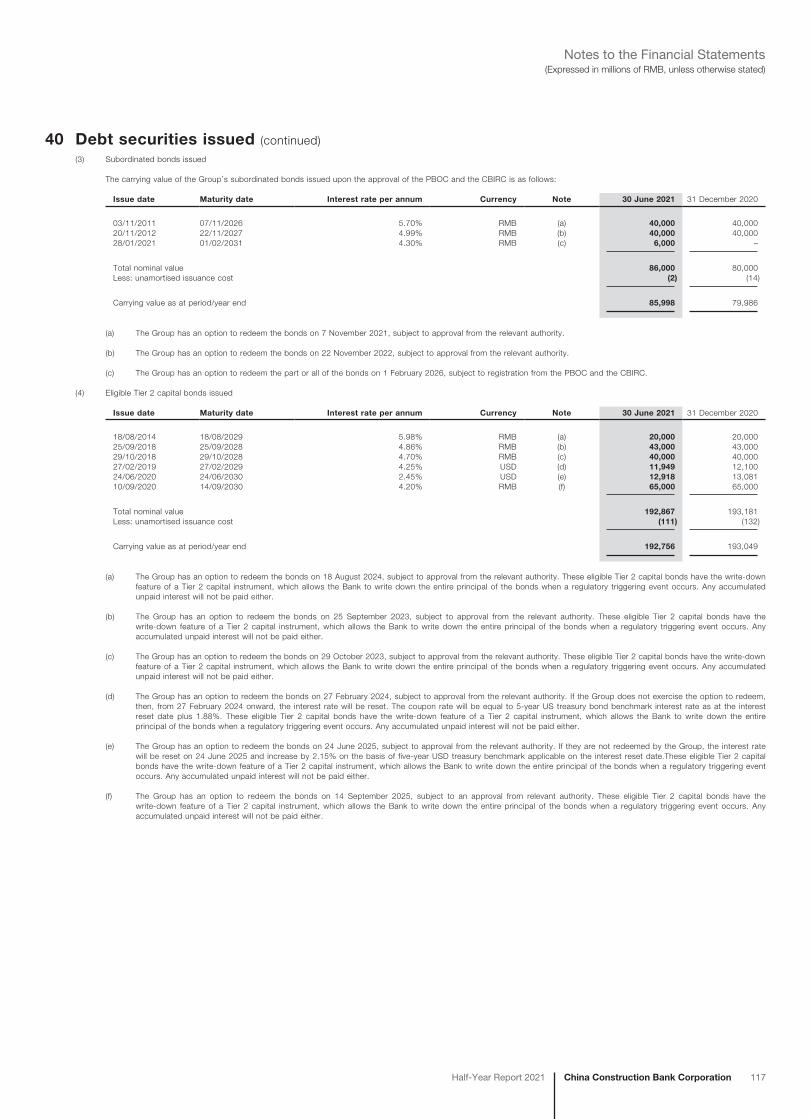
China Construction Bank CorporationHalf-Year Report 2021 117
(Expressed in millions of RMB, unless otherwise stated)Notes to the Financial Statements
40 Debt securities issued (continued)(3) Subordinated bonds issued
The carrying value of the Group’s subordinated bonds issued upon the approval of the PBOC and the CBIRC is as follows:
Issue date Maturity date Interest rate per annum Currency Note 30 June 2021 31 December 2020
03/11/2011 07/11/2026 5.70% RMB (a) 40,000 40,00020/11/2012 22/11/2027 4.99% RMB (b) 40,000 40,00028/01/2021 01/02/2031 4.30% RMB (c) 6,000 –
Total nominal value 86,000 80,000Less: unamortised issuance cost (2) (14)
Carrying value as at period/year end 85,998 79,986
(a) The Group has an option to redeem the bonds on 7 November 2021, subject to approval from the relevant authority.
(b) The Group has an option to redeem the bonds on 22 November 2022, subject to approval from the relevant authority.
(c) The Group has an option to redeem the part or all of the bonds on 1 February 2026, subject to registration from the PBOC and the CBIRC.
(4) Eligible Tier 2 capital bonds issued
Issue date Maturity date Interest rate per annum Currency Note 30 June 2021 31 December 2020
18/08/2014 18/08/2029 5.98% RMB (a) 20,000 20,00025/09/2018 25/09/2028 4.86% RMB (b) 43,000 43,00029/10/2018 29/10/2028 4.70% RMB (c) 40,000 40,00027/02/2019 27/02/2029 4.25% USD (d) 11,949 12,10024/06/2020 24/06/2030 2.45% USD (e) 12,918 13,08110/09/2020 14/09/2030 4.20% RMB (f) 65,000 65,000
Total nominal value 192,867 193,181Less: unamortised issuance cost (111) (132)
Carrying value as at period/year end 192,756 193,049
(a) The Group has an option to redeem the bonds on 18 August 2024, subject to approval from the relevant authority. These eligible Tier 2 capital bonds have the write-down feature of a Tier 2 capital instrument, which allows the Bank to write down the entire principal of the bonds when a regulatory triggering event occurs. Any accumulated unpaid interest will not be paid either.
(b) The Group has an option to redeem the bonds on 25 September 2023, subject to approval from the relevant authority. These eligible Tier 2 capital bonds have the write-down feature of a Tier 2 capital instrument, which allows the Bank to write down the entire principal of the bonds when a regulatory triggering event occurs. Any accumulated unpaid interest will not be paid either.
(c) The Group has an option to redeem the bonds on 29 October 2023, subject to approval from the relevant authority. These eligible Tier 2 capital bonds have the write-down feature of a Tier 2 capital instrument, which allows the Bank to write down the entire principal of the bonds when a regulatory triggering event occurs. Any accumulated unpaid interest will not be paid either.
(d) The Group has an option to redeem the bonds on 27 February 2024, subject to approval from the relevant authority. If the Group does not exercise the option to redeem, then, from 27 February 2024 onward, the interest rate will be reset. The coupon rate will be equal to 5-year US treasury bond benchmark interest rate as at the interest reset date plus 1.88%. These eligible Tier 2 capital bonds have the write-down feature of a Tier 2 capital instrument, which allows the Bank to write down the entire principal of the bonds when a regulatory triggering event occurs. Any accumulated unpaid interest will not be paid either.
(e) The Group has an option to redeem the bonds on 24 June 2025, subject to approval from the relevant authority. If they are not redeemed by the Group, the interest rate will be reset on 24 June 2025 and increase by 2.15% on the basis of five-year USD treasury benchmark applicable on the interest reset date.These eligible Tier 2 capital bonds have the write-down feature of a Tier 2 capital instrument, which allows the Bank to write down the entire principal of the bonds when a regulatory triggering event occurs. Any accumulated unpaid interest will not be paid either.
(f) The Group has an option to redeem the bonds on 14 September 2025, subject to an approval from relevant authority. These eligible Tier 2 capital bonds have the write-down feature of a Tier 2 capital instrument, which allows the Bank to write down the entire principal of the bonds when a regulatory triggering event occurs. Any accumulated unpaid interest will not be paid either.
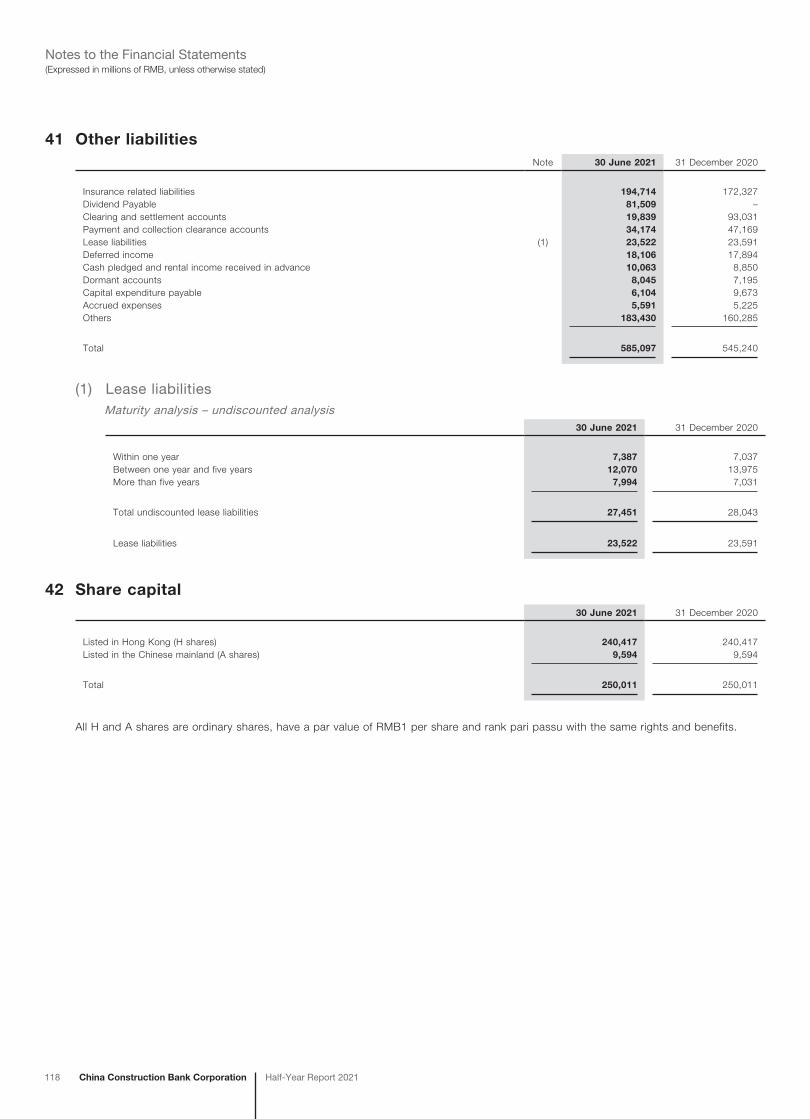
118 China Construction Bank Corporation Half-Year Report 2021
(Expressed in millions of RMB, unless otherwise stated)Notes to the Financial Statements
41 Other liabilitiesNote 30 June 2021 31 December 2020
Insurance related liabilities 194,714 172,327Dividend Payable 81,509 –Clearing and settlement accounts 19,839 93,031Payment and collection clearance accounts 34,174 47,169Lease liabilities (1) 23,522 23,591Deferred income 18,106 17,894Cash pledged and rental income received in advance 10,063 8,850Dormant accounts 8,045 7,195Capital expenditure payable 6,104 9,673Accrued expenses 5,591 5,225Others 183,430 160,285
Total 585,097 545,240
(1) Lease liabilitiesMaturity analysis – undiscounted analysis
30 June 2021 31 December 2020
Within one year 7,387 7,037Between one year and five years 12,070 13,975More than five years 7,994 7,031
Total undiscounted lease liabilities 27,451 28,043
Lease liabilities 23,522 23,591
42 Share capital30 June 2021 31 December 2020
Listed in Hong Kong (H shares) 240,417 240,417Listed in the Chinese mainland (A shares) 9,594 9,594
Total 250,011 250,011
All H and A shares are ordinary shares, have a par value of RMB1 per share and rank pari passu with the same rights and benefits.
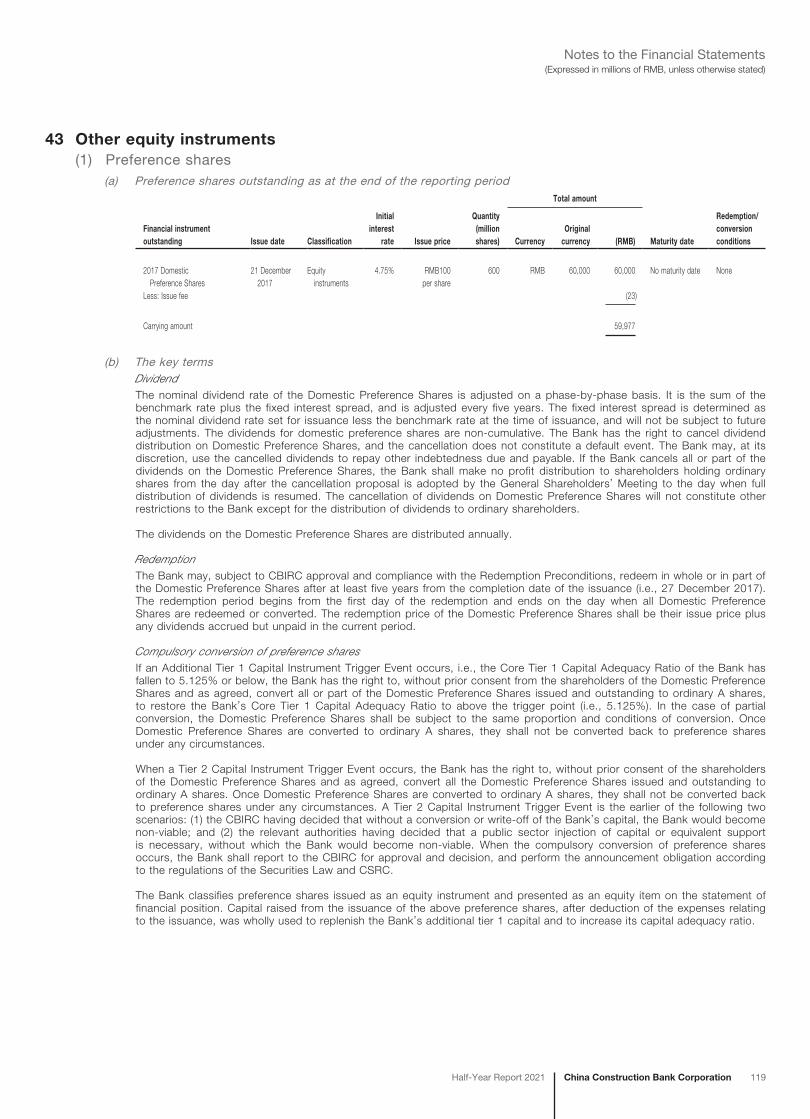
China Construction Bank CorporationHalf-Year Report 2021 119
(Expressed in millions of RMB, unless otherwise stated)Notes to the Financial Statements
43 Other equity instruments(1) Preference shares
(a) Preference shares outstanding as at the end of the reporting periodTotal amount
Financial instrument outstanding Issue date Classification
Initial interest
rate Issue price
Quantity (million shares) Currency
Original currency (RMB) Maturity date
Redemption/conversion conditions
2017 Domestic Preference Shares
21 December 2017
Equity instruments
4.75% RMB100 per share
600 RMB 60,000 60,000 No maturity date None
Less: Issue fee (23)
Carrying amount 59,977
(b) The key termsDividendThe nominal dividend rate of the Domestic Preference Shares is adjusted on a phase-by-phase basis. It is the sum of the benchmark rate plus the fixed interest spread, and is adjusted every five years. The fixed interest spread is determined as the nominal dividend rate set for issuance less the benchmark rate at the time of issuance, and will not be subject to future adjustments. The dividends for domestic preference shares are non-cumulative. The Bank has the right to cancel dividend distribution on Domestic Preference Shares, and the cancellation does not constitute a default event. The Bank may, at its discretion, use the cancelled dividends to repay other indebtedness due and payable. If the Bank cancels all or part of the dividends on the Domestic Preference Shares, the Bank shall make no profit distribution to shareholders holding ordinary shares from the day after the cancellation proposal is adopted by the General Shareholders’ Meeting to the day when full distribution of dividends is resumed. The cancellation of dividends on Domestic Preference Shares will not constitute other restrictions to the Bank except for the distribution of dividends to ordinary shareholders.
The dividends on the Domestic Preference Shares are distributed annually.
RedemptionThe Bank may, subject to CBIRC approval and compliance with the Redemption Preconditions, redeem in whole or in part of the Domestic Preference Shares after at least five years from the completion date of the issuance (i.e., 27 December 2017). The redemption period begins from the first day of the redemption and ends on the day when all Domestic Preference Shares are redeemed or converted. The redemption price of the Domestic Preference Shares shall be their issue price plus any dividends accrued but unpaid in the current period.
Compulsory conversion of preference sharesIf an Additional Tier 1 Capital Instrument Trigger Event occurs, i.e., the Core Tier 1 Capital Adequacy Ratio of the Bank has fallen to 5.125% or below, the Bank has the right to, without prior consent from the shareholders of the Domestic Preference Shares and as agreed, convert all or part of the Domestic Preference Shares issued and outstanding to ordinary A shares, to restore the Bank’s Core Tier 1 Capital Adequacy Ratio to above the trigger point (i.e., 5.125%). In the case of partial conversion, the Domestic Preference Shares shall be subject to the same proportion and conditions of conversion. Once Domestic Preference Shares are converted to ordinary A shares, they shall not be converted back to preference shares under any circumstances.
When a Tier 2 Capital Instrument Trigger Event occurs, the Bank has the right to, without prior consent of the shareholders of the Domestic Preference Shares and as agreed, convert all the Domestic Preference Shares issued and outstanding to ordinary A shares. Once Domestic Preference Shares are converted to ordinary A shares, they shall not be converted back to preference shares under any circumstances. A Tier 2 Capital Instrument Trigger Event is the earlier of the following two scenarios: (1) the CBIRC having decided that without a conversion or write-off of the Bank’s capital, the Bank would become non-viable; and (2) the relevant authorities having decided that a public sector injection of capital or equivalent support is necessary, without which the Bank would become non-viable. When the compulsory conversion of preference shares occurs, the Bank shall report to the CBIRC for approval and decision, and perform the announcement obligation according to the regulations of the Securities Law and CSRC.
The Bank classifies preference shares issued as an equity instrument and presented as an equity item on the statement of financial position. Capital raised from the issuance of the above preference shares, after deduction of the expenses relating to the issuance, was wholly used to replenish the Bank’s additional tier 1 capital and to increase its capital adequacy ratio.
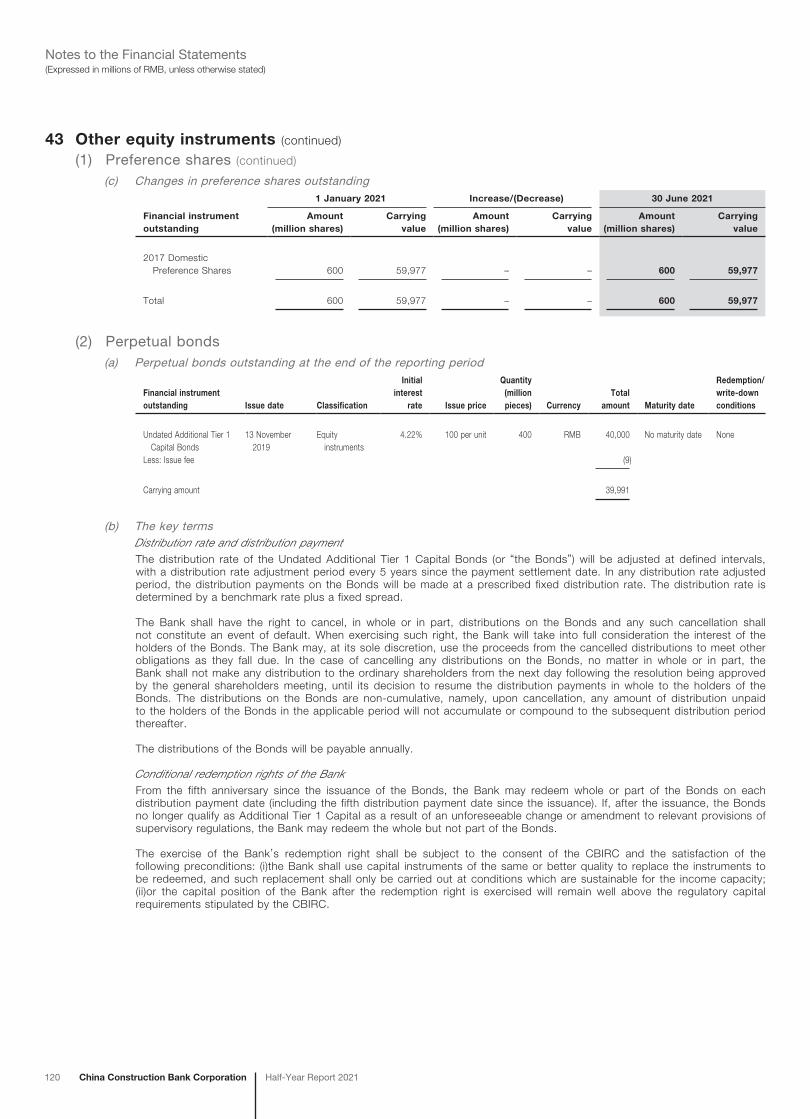
120 China Construction Bank Corporation Half-Year Report 2021
(Expressed in millions of RMB, unless otherwise stated)Notes to the Financial Statements
43 Other equity instruments (continued)
(1) Preference shares (continued)
(c) Changes in preference shares outstanding1 January 2021 Increase/(Decrease) 30 June 2021
Financial instrument outstanding
Amount (million shares)
Carrying value
Amount (million shares)
Carrying value
Amount (million shares)
Carrying value
2017 Domestic Preference Shares 600 59,977 – – 600 59,977
Total 600 59,977 – – 600 59,977
(2) Perpetual bonds(a) Perpetual bonds outstanding at the end of the reporting period
Financial instrument outstanding Issue date Classification
Initial interest
rate Issue price
Quantity (million pieces) Currency
Total amount Maturity date
Redemption/ write-down conditions
Undated Additional Tier 1 Capital Bonds
13 November 2019
Equity instruments
4.22% 100 per unit 400 RMB 40,000 No maturity date None
Less: Issue fee (9)
Carrying amount 39,991
(b) The key termsDistribution rate and distribution paymentThe distribution rate of the Undated Additional Tier 1 Capital Bonds (or “the Bonds”) will be adjusted at defined intervals, with a distribution rate adjustment period every 5 years since the payment settlement date. In any distribution rate adjusted period, the distribution payments on the Bonds will be made at a prescribed fixed distribution rate. The distribution rate is determined by a benchmark rate plus a fixed spread.
The Bank shall have the right to cancel, in whole or in part, distributions on the Bonds and any such cancellation shall not constitute an event of default. When exercising such right, the Bank will take into full consideration the interest of the holders of the Bonds. The Bank may, at its sole discretion, use the proceeds from the cancelled distributions to meet other obligations as they fall due. In the case of cancelling any distributions on the Bonds, no matter in whole or in part, the Bank shall not make any distribution to the ordinary shareholders from the next day following the resolution being approved by the general shareholders meeting, until its decision to resume the distribution payments in whole to the holders of the Bonds. The distributions on the Bonds are non-cumulative, namely, upon cancellation, any amount of distribution unpaid to the holders of the Bonds in the applicable period will not accumulate or compound to the subsequent distribution period thereafter.
The distributions of the Bonds will be payable annually.
Conditional redemption rights of the BankFrom the fifth anniversary since the issuance of the Bonds, the Bank may redeem whole or part of the Bonds on each distribution payment date (including the fifth distribution payment date since the issuance). If, after the issuance, the Bonds no longer qualify as Additional Tier 1 Capital as a result of an unforeseeable change or amendment to relevant provisions of supervisory regulations, the Bank may redeem the whole but not part of the Bonds.
The exercise of the Bank’s redemption right shall be subject to the consent of the CBIRC and the satisfaction of the following preconditions: (i)the Bank shall use capital instruments of the same or better quality to replace the instruments to be redeemed, and such replacement shall only be carried out at conditions which are sustainable for the income capacity; (ii)or the capital position of the Bank after the redemption right is exercised will remain well above the regulatory capital requirements stipulated by the CBIRC.
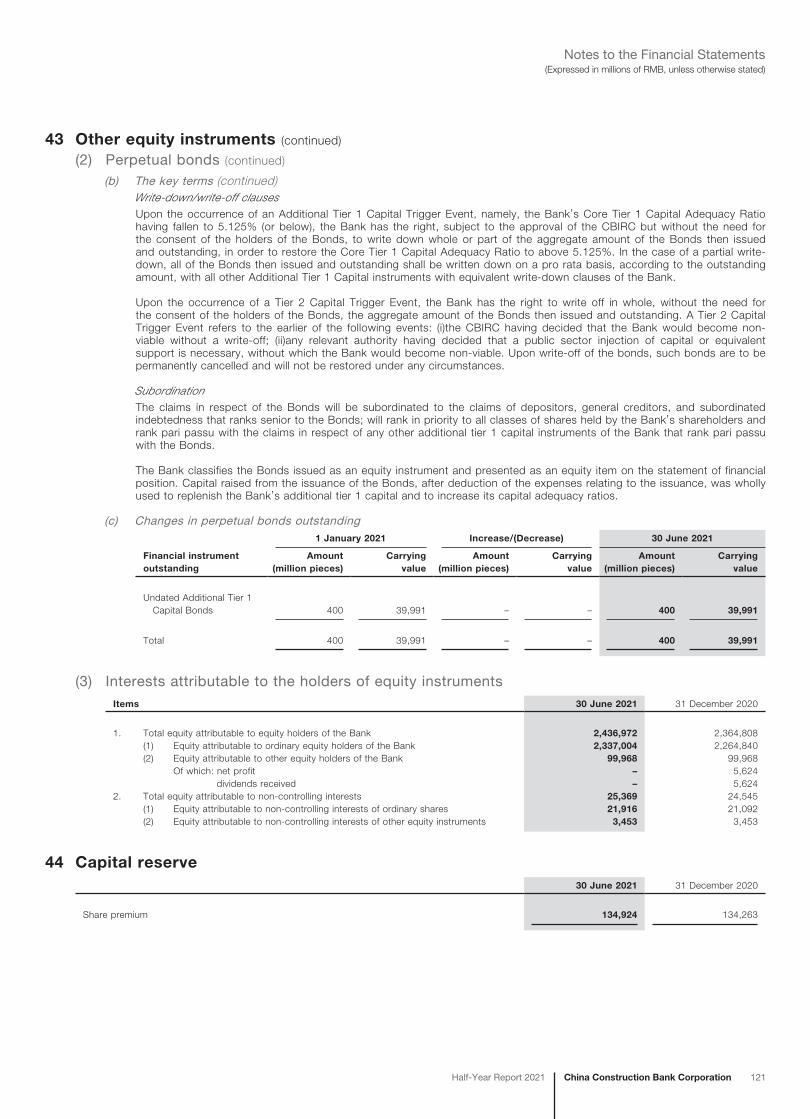
China Construction Bank CorporationHalf-Year Report 2021 121
(Expressed in millions of RMB, unless otherwise stated)Notes to the Financial Statements
43 Other equity instruments (continued)
(2) Perpetual bonds (continued)
(b) The key terms (continued)Write-down/write-off clausesUpon the occurrence of an Additional Tier 1 Capital Trigger Event, namely, the Bank’s Core Tier 1 Capital Adequacy Ratio having fallen to 5.125% (or below), the Bank has the right, subject to the approval of the CBIRC but without the need for the consent of the holders of the Bonds, to write down whole or part of the aggregate amount of the Bonds then issued and outstanding, in order to restore the Core Tier 1 Capital Adequacy Ratio to above 5.125%. In the case of a partial write-down, all of the Bonds then issued and outstanding shall be written down on a pro rata basis, according to the outstanding amount, with all other Additional Tier 1 Capital instruments with equivalent write-down clauses of the Bank.
Upon the occurrence of a Tier 2 Capital Trigger Event, the Bank has the right to write off in whole, without the need for the consent of the holders of the Bonds, the aggregate amount of the Bonds then issued and outstanding. A Tier 2 Capital Trigger Event refers to the earlier of the following events: (i)the CBIRC having decided that the Bank would become non-viable without a write-off; (ii)any relevant authority having decided that a public sector injection of capital or equivalent support is necessary, without which the Bank would become non-viable. Upon write-off of the bonds, such bonds are to be permanently cancelled and will not be restored under any circumstances.
SubordinationThe claims in respect of the Bonds will be subordinated to the claims of depositors, general creditors, and subordinated indebtedness that ranks senior to the Bonds; will rank in priority to all classes of shares held by the Bank’s shareholders and rank pari passu with the claims in respect of any other additional tier 1 capital instruments of the Bank that rank pari passu with the Bonds.
The Bank classifies the Bonds issued as an equity instrument and presented as an equity item on the statement of financial position. Capital raised from the issuance of the Bonds, after deduction of the expenses relating to the issuance, was wholly used to replenish the Bank’s additional tier 1 capital and to increase its capital adequacy ratios.
(c) Changes in perpetual bonds outstanding1 January 2021 Increase/(Decrease) 30 June 2021
Financial instrument outstanding
Amount (million pieces)
Carrying value
Amount (million pieces)
Carrying value
Amount (million pieces)
Carrying value
Undated Additional Tier 1 Capital Bonds 400 39,991 – – 400 39,991
Total 400 39,991 – – 400 39,991
(3) Interests attributable to the holders of equity instrumentsItems 30 June 2021 31 December 2020
1. Total equity attributable to equity holders of the Bank 2,436,972 2,364,808(1) Equity attributable to ordinary equity holders of the Bank 2,337,004 2,264,840(2) Equity attributable to other equity holders of the Bank 99,968 99,968
Of which: net profit – 5,624dividends received – 5,624
2. Total equity attributable to non-controlling interests 25,369 24,545(1) Equity attributable to non-controlling interests of ordinary shares 21,916 21,092(2) Equity attributable to non-controlling interests of other equity instruments 3,453 3,453
44 Capital reserve30 June 2021 31 December 2020
Share premium 134,924 134,263
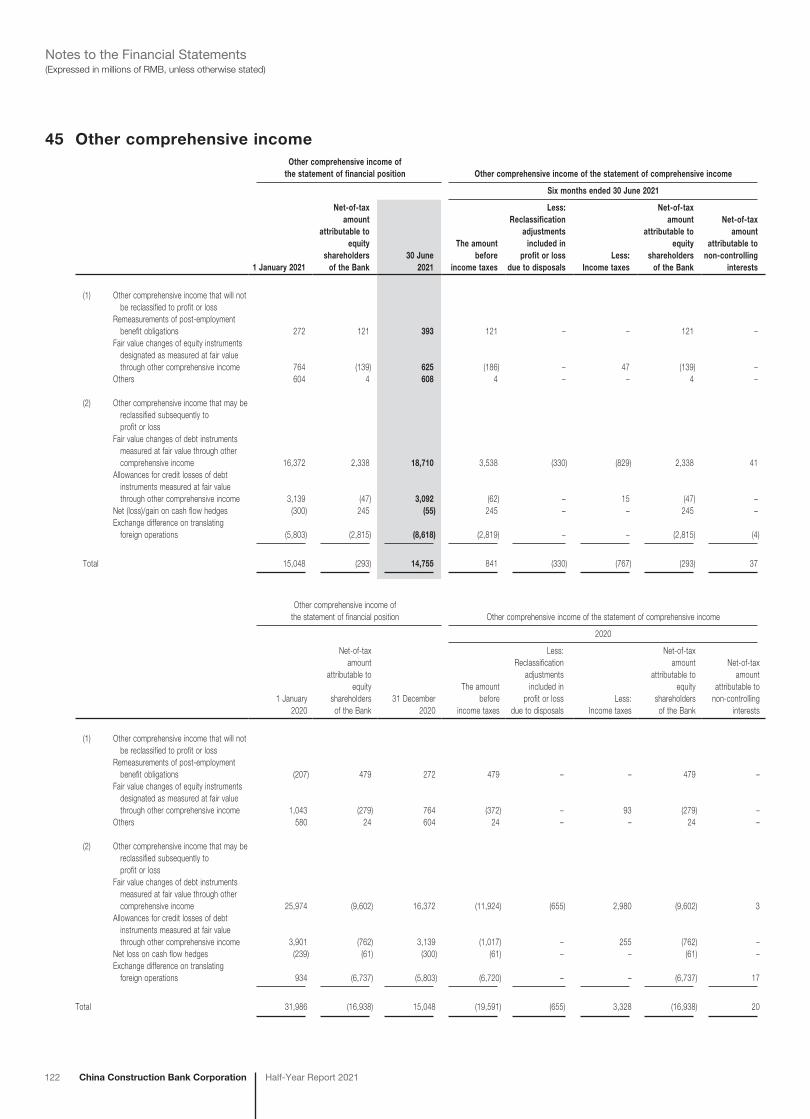
122 China Construction Bank Corporation Half-Year Report 2021
(Expressed in millions of RMB, unless otherwise stated)Notes to the Financial Statements
45 Other comprehensive incomeOther comprehensive income of
the statement of financial position Other comprehensive income of the statement of comprehensive income
Six months ended 30 June 2021
1 January 2021
Net-of-tax amount
attributable to equity
shareholders of the Bank
30 June 2021
The amount before
income taxes
Less: Reclassification
adjustments included in
profit or loss due to disposals
Less: Income taxes
Net-of-tax amount
attributable to equity
shareholders of the Bank
Net-of-tax amount
attributable to non-controlling
interests
(1) Other comprehensive income that will not be reclassified to profit or lossRemeasurements of post-employment benefit obligations 272 121 393 121 – – 121 –Fair value changes of equity instruments designated as measured at fair value through other comprehensive income 764 (139) 625 (186) – 47 (139) –Others 604 4 608 4 – – 4 –
(2) Other comprehensive income that may be reclassified subsequently to profit or lossFair value changes of debt instruments measured at fair value through other comprehensive income 16,372 2,338 18,710 3,538 (330) (829) 2,338 41Allowances for credit losses of debt instruments measured at fair value through other comprehensive income 3,139 (47) 3,092 (62) – 15 (47) –Net (loss)/gain on cash flow hedges (300) 245 (55) 245 – – 245 –Exchange difference on translating foreign operations (5,803) (2,815) (8,618) (2,819) – – (2,815) (4)
Total 15,048 (293) 14,755 841 (330) (767) (293) 37
Other comprehensive income of the statement of financial position Other comprehensive income of the statement of comprehensive income
2020
1 January 2020
Net-of-tax amount
attributable to equity
shareholders of the Bank
31 December 2020
The amount before
income taxes
Less: Reclassification
adjustments included in
profit or loss due to disposals
Less: Income taxes
Net-of-tax amount
attributable to equity
shareholders of the Bank
Net-of-tax amount
attributable to non-controlling
interests
(1) Other comprehensive income that will not be reclassified to profit or lossRemeasurements of post-employment benefit obligations (207) 479 272 479 – – 479 –Fair value changes of equity instruments designated as measured at fair value through other comprehensive income 1,043 (279) 764 (372) – 93 (279) –Others 580 24 604 24 – – 24 –
(2) Other comprehensive income that may be reclassified subsequently to profit or lossFair value changes of debt instruments measured at fair value through other comprehensive income 25,974 (9,602) 16,372 (11,924) (655) 2,980 (9,602) 3Allowances for credit losses of debt instruments measured at fair value through other comprehensive income 3,901 (762) 3,139 (1,017) – 255 (762) –Net loss on cash flow hedges (239) (61) (300) (61) – – (61) –Exchange difference on translating foreign operations 934 (6,737) (5,803) (6,720) – – (6,737) 17
Total 31,986 (16,938) 15,048 (19,591) (655) 3,328 (16,938) 20
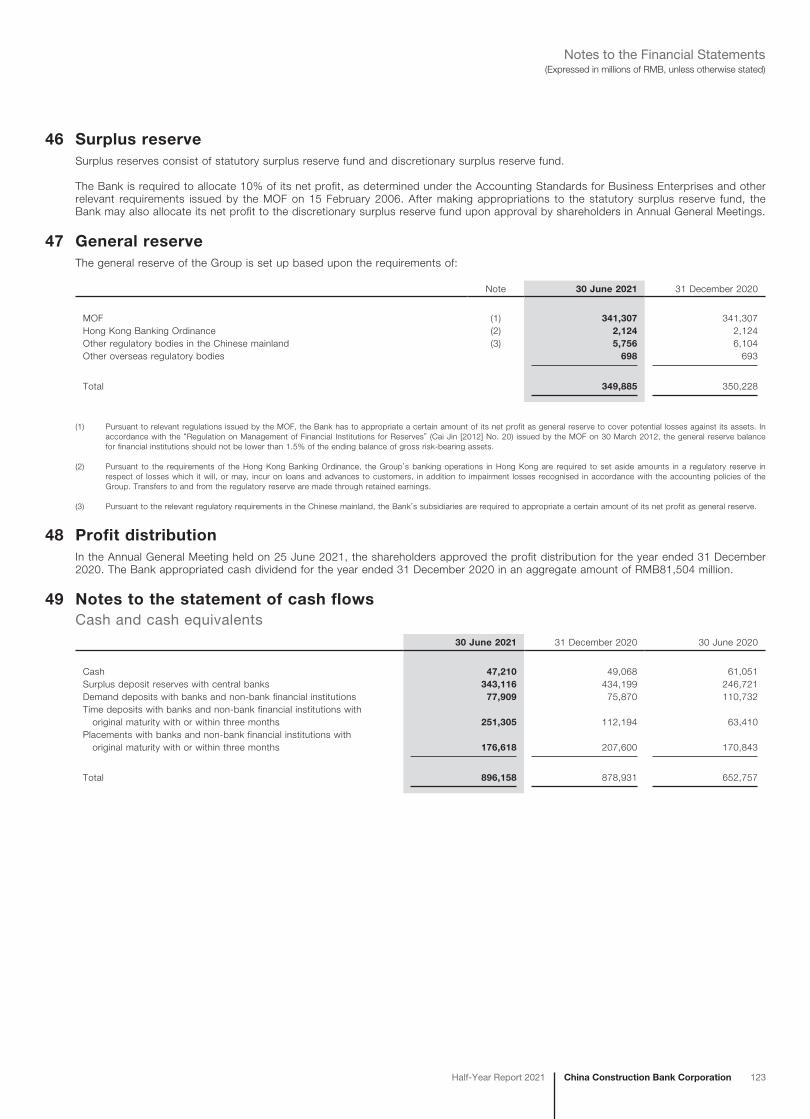
China Construction Bank CorporationHalf-Year Report 2021 123
(Expressed in millions of RMB, unless otherwise stated)Notes to the Financial Statements
46 Surplus reserveSurplus reserves consist of statutory surplus reserve fund and discretionary surplus reserve fund.
The Bank is required to allocate 10% of its net profit, as determined under the Accounting Standards for Business Enterprises and other relevant requirements issued by the MOF on 15 February 2006. After making appropriations to the statutory surplus reserve fund, the Bank may also allocate its net profit to the discretionary surplus reserve fund upon approval by shareholders in Annual General Meetings.
47 General reserveThe general reserve of the Group is set up based upon the requirements of:
Note 30 June 2021 31 December 2020
MOF (1) 341,307 341,307Hong Kong Banking Ordinance (2) 2,124 2,124Other regulatory bodies in the Chinese mainland (3) 5,756 6,104Other overseas regulatory bodies 698 693
Total 349,885 350,228
(1) Pursuant to relevant regulations issued by the MOF, the Bank has to appropriate a certain amount of its net profit as general reserve to cover potential losses against its assets. In accordance with the “Regulation on Management of Financial Institutions for Reserves” (Cai Jin [2012] No. 20) issued by the MOF on 30 March 2012, the general reserve balance for financial institutions should not be lower than 1.5% of the ending balance of gross risk-bearing assets.
(2) Pursuant to the requirements of the Hong Kong Banking Ordinance, the Group’s banking operations in Hong Kong are required to set aside amounts in a regulatory reserve in respect of losses which it will, or may, incur on loans and advances to customers, in addition to impairment losses recognised in accordance with the accounting policies of the Group. Transfers to and from the regulatory reserve are made through retained earnings.
(3) Pursuant to the relevant regulatory requirements in the Chinese mainland, the Bank’s subsidiaries are required to appropriate a certain amount of its net profit as general reserve.
48 Profit distributionIn the Annual General Meeting held on 25 June 2021, the shareholders approved the profit distribution for the year ended 31 December 2020. The Bank appropriated cash dividend for the year ended 31 December 2020 in an aggregate amount of RMB81,504 million.
49 Notes to the statement of cash flowsCash and cash equivalents
30 June 2021 31 December 2020 30 June 2020
Cash 47,210 49,068 61,051Surplus deposit reserves with central banks 343,116 434,199 246,721Demand deposits with banks and non-bank financial institutions 77,909 75,870 110,732Time deposits with banks and non-bank financial institutions with original maturity with or within three months 251,305 112,194 63,410Placements with banks and non-bank financial institutions with original maturity with or within three months 176,618 207,600 170,843
Total 896,158 878,931 652,757
124 China Construction Bank Corporation Half-Year Report 2021
(Expressed in millions of RMB, unless otherwise stated)Notes to the Financial Statements
50 Transferred financial assetsThe Group enters into transactions in the normal course of business by which it transfers recognised financial assets to third parties or to structured entities. In some cases where these transferred financial assets qualify for derecognition, the transfers may give rise to full or partial derecognition of the financial assets concerned. In other cases where the transferred assets do not qualify for derecognition as the Group has retained substantially all the risks and rewards of these assets, the Group continued to recognise the transferred assets.
Securities lending transactionsTransferred financial assets that do not qualify for derecognition mainly include debt securities lent to counterparties under securities lending agreements. The counterparties are allowed to sell or repledge those securities lent under agreements to repurchase in the absence of default by the Group, but have an obligation to return the securities at the maturity of the contract. The Group has determined that it retains substantially all the risks and rewards of these securities and therefore has not derecognised them. As at 30 June 2021, the carrying value of the Group’s debt securities lent to counterparties was RMB6,039 million (as at 31 December 2020: RMB4,010 million).
Credit asset securitisation transactionsThe Group enters into securitisation transactions by which it transfers credit assets to structured entities which issue asset-backed securities to investors. The Group may retain interests in the form of holding subordinated tranches which would give rise to the Group’s continuing involvement in the transferred assets. Those financial assets are recognised on the statement of financial position to the extent of the Group’s continuing involvement, otherwise the financial assets are derecognized.
As at 30 June 2021, loans with an original carrying amount of RMB930,439 million (as at 31 December 2020: RMB829,400 million) have been securitised by the Group under arrangements in which the Group retained a continuing involvement in such assets. As at 30 June 2021, the carrying amount of assets that the Group continued to recognise was RMB96,255 million (as at 31 December 2020: RMB88,625 million). As at 30 June 2021, the carrying amount of continuing involvement assets and liabilities that the Group continued to recognise was RMB97,008 million (as at 31 December 2020: RMB88,951 million).
As at 30 June 2021, the carrying amount of asset-backed securities held in the securitisation transaction derecognised by the Group was RMB1,234 million (as at 31 December 2020: RMB1,340 million), and its maximum loss exposure approximates to the carrying amount.
51 Operating segmentsThe Group has presented the operating segments in a manner consistent with the way in which information is reported internally to the Group’s chief operating decision makers for the purposes of resource allocation and performance assessment. Measurement of segment assets and liabilities and segment income and results is based on the Group’s accounting policies.
Transactions between segments are conducted under normal commercial terms and conditions. Internal charges and transfer prices are determined with reference to market rates and have been reflected in the performance of each segment. Net interest income and expense arising from internal charges and transfer pricing adjustments are referred to as “internal net interest income/expense”. Interest income and expense earned from third parties are referred to as “external net interest income/expense”.
Segment revenues, results, assets and liabilities include items directly attributable to a segment as well as those that can be allocated on a reasonable basis. Segment income and results are determined before intra-group transactions are eliminated as part of the consolidation process. Segment capital expenditure is the total cost incurred during the period to acquire fixed assets, intangible assets and other long-term assets.
China Construction Bank CorporationHalf-Year Report 2021 125
(Expressed in millions of RMB, unless otherwise stated)Notes to the Financial Statements
51 Operating segments (continued)
(1) Geographical segmentsThe Group operates principally in the Chinese mainland with branches covering all provinces, autonomous regions and municipalities directly under the central government, and several subsidiaries located in the Chinese mainland. The Group also has bank branch operations in Hong Kong, Macau, Taiwan, Singapore, Frankfurt, Johannesburg, Tokyo, Seoul, New York, Sydney, Ho Chi Minh City, Luxembourg, Toronto, London, Zurich, Dubai, Chile, Astana, Labuan, Auckland, etc., and certain subsidiaries operating in Hong Kong, London, Moscow, Luxembourg, British Virgin Islands, Auckland, Jakarta, San Paulo and Kuala Lumpur, etc.
In presenting information on the basis of geographical segments, operating income is allocated based on the location of the branches and subsidiaries that generate the income. Segment assets, liabilities and capital expenditure are allocated based on their geographical location.
Geographical segments of the Group, as defined for management reporting purposes, are defined as follows:
– “Yangtze River Delta” refers to the following areas where the tier-1 branches and the subsidiaries of the Bank operate: Shanghai Municipality, Jiangsu Province, Zhejiang Province, City of Ningbo and City of Suzhou;
– “Pearl River Delta” refers to the following areas where the tier-1 branches and the subsidiaries of the Bank operate: Guangdong Province, City of Shenzhen, Fujian Province and City of Xiamen;
– “Bohai Rim” refers to the following areas where the tier-1 branches and the subsidiaries of the Bank operate: Beijing Municipality, Shandong Province, Tianjin Municipality, Hebei Province and City of Qingdao;
– the “Central” region refers to the following areas where the tier-1 branches and the subsidiaries of the Bank operate: Shanxi Province, Guangxi Autonomous Region, Hubei Province, Henan Province, Hunan Province, Jiangxi Province, Hainan Province and Anhui Province;
– the “Western” region refers to the following areas where the tier-1 branches of the Bank operate: Sichuan Province, Chongqing Municipality, Guizhou Province, Yunnan Province, Tibet Autonomous Region, Inner Mongolia Autonomous Region, Shaanxi Province, Gansu Province, Qinghai Province, Ningxia Autonomous Region and Xinjiang Autonomous Region; and
– the “Northeastern” region refers to the following areas where the tier-1 branches of the Bank operate: Liaoning Province, Jilin Province, Heilongjiang Province and City of Dalian.
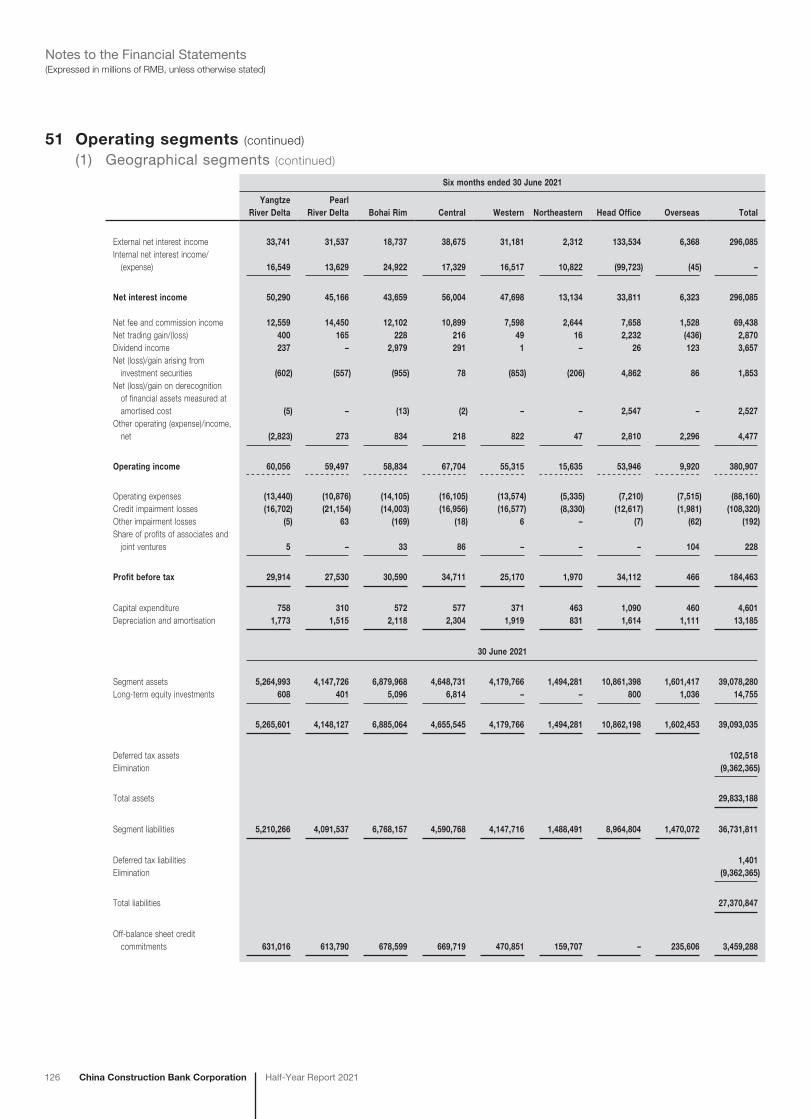
126 China Construction Bank Corporation Half-Year Report 2021
(Expressed in millions of RMB, unless otherwise stated)Notes to the Financial Statements
51 Operating segments (continued)
(1) Geographical segments (continued)
Six months ended 30 June 2021
Yangtze River Delta
Pearl River Delta Bohai Rim Central Western Northeastern Head Office Overseas Total
External net interest income 33,741 31,537 18,737 38,675 31,181 2,312 133,534 6,368 296,085Internal net interest income/ (expense) 16,549 13,629 24,922 17,329 16,517 10,822 (99,723) (45) –
Net interest income 50,290 45,166 43,659 56,004 47,698 13,134 33,811 6,323 296,085
Net fee and commission income 12,559 14,450 12,102 10,899 7,598 2,644 7,658 1,528 69,438Net trading gain/(loss) 400 165 228 216 49 16 2,232 (436) 2,870Dividend income 237 – 2,979 291 1 – 26 123 3,657Net (loss)/gain arising from investment securities (602) (557) (955) 78 (853) (206) 4,862 86 1,853Net (loss)/gain on derecognition of financial assets measured at amortised cost (5) – (13) (2) – – 2,547 – 2,527Other operating (expense)/income, net (2,823) 273 834 218 822 47 2,810 2,296 4,477
Operating income 60,056 59,497 58,834 67,704 55,315 15,635 53,946 9,920 380,907
Operating expenses (13,440) (10,876) (14,105) (16,105) (13,574) (5,335) (7,210) (7,515) (88,160)Credit impairment losses (16,702) (21,154) (14,003) (16,956) (16,577) (8,330) (12,617) (1,981) (108,320)Other impairment losses (5) 63 (169) (18) 6 – (7) (62) (192)Share of profits of associates and joint ventures 5 – 33 86 – – – 104 228
Profit before tax 29,914 27,530 30,590 34,711 25,170 1,970 34,112 466 184,463
Capital expenditure 758 310 572 577 371 463 1,090 460 4,601Depreciation and amortisation 1,773 1,515 2,118 2,304 1,919 831 1,614 1,111 13,185
30 June 2021
Segment assets 5,264,993 4,147,726 6,879,968 4,648,731 4,179,766 1,494,281 10,861,398 1,601,417 39,078,280Long-term equity investments 608 401 5,096 6,814 – – 800 1,036 14,755
5,265,601 4,148,127 6,885,064 4,655,545 4,179,766 1,494,281 10,862,198 1,602,453 39,093,035
Deferred tax assets 102,518Elimination (9,362,365)
Total assets 29,833,188
Segment liabilities 5,210,266 4,091,537 6,768,157 4,590,768 4,147,716 1,488,491 8,964,804 1,470,072 36,731,811
Deferred tax liabilities 1,401Elimination (9,362,365)
Total liabilities 27,370,847
Off-balance sheet credit commitments 631,016 613,790 678,599 669,719 470,851 159,707 – 235,606 3,459,288
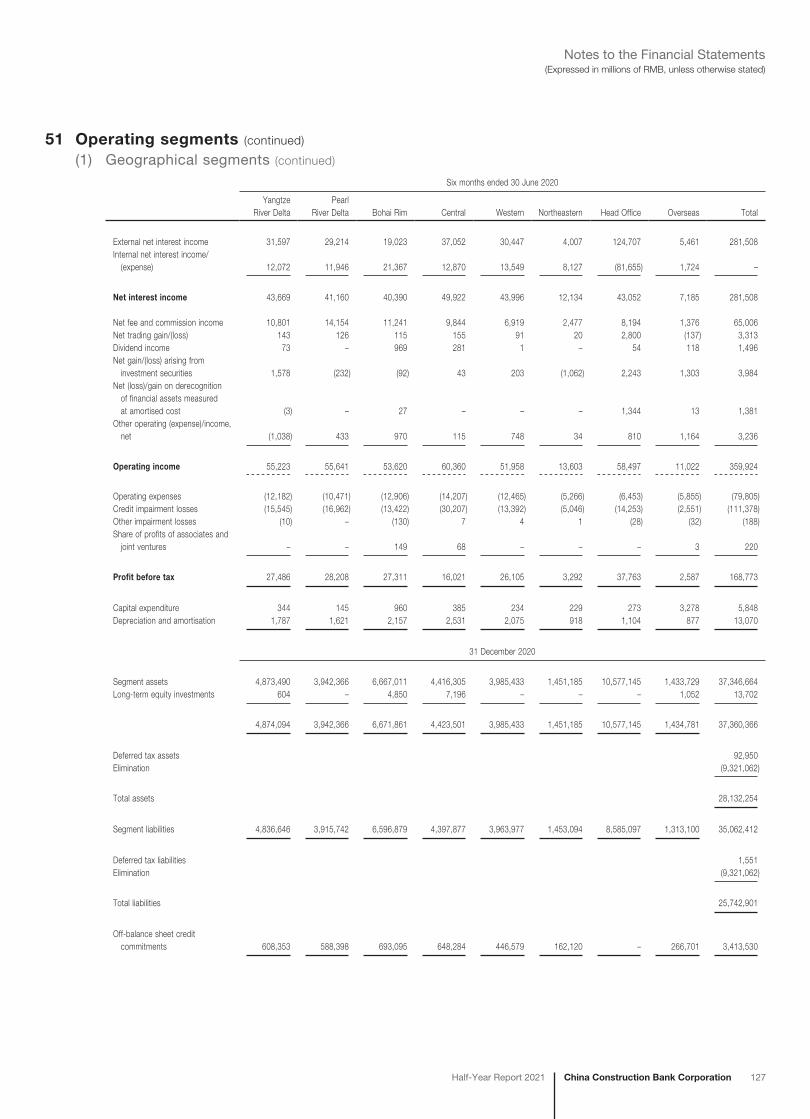
China Construction Bank CorporationHalf-Year Report 2021 127
(Expressed in millions of RMB, unless otherwise stated)Notes to the Financial Statements
51 Operating segments (continued)
(1) Geographical segments (continued)
Six months ended 30 June 2020
Yangtze River Delta
Pearl River Delta Bohai Rim Central Western Northeastern Head Office Overseas Total
External net interest income 31,597 29,214 19,023 37,052 30,447 4,007 124,707 5,461 281,508Internal net interest income/ (expense) 12,072 11,946 21,367 12,870 13,549 8,127 (81,655) 1,724 –
Net interest income 43,669 41,160 40,390 49,922 43,996 12,134 43,052 7,185 281,508
Net fee and commission income 10,801 14,154 11,241 9,844 6,919 2,477 8,194 1,376 65,006Net trading gain/(loss) 143 126 115 155 91 20 2,800 (137) 3,313Dividend income 73 – 969 281 1 – 54 118 1,496Net gain/(loss) arising from investment securities 1,578 (232) (92) 43 203 (1,062) 2,243 1,303 3,984Net (loss)/gain on derecognition of financial assets measured at amortised cost (3) – 27 – – – 1,344 13 1,381Other operating (expense)/income, net (1,038) 433 970 115 748 34 810 1,164 3,236
Operating income 55,223 55,641 53,620 60,360 51,958 13,603 58,497 11,022 359,924
Operating expenses (12,182) (10,471) (12,906) (14,207) (12,465) (5,266) (6,453) (5,855) (79,805)Credit impairment losses (15,545) (16,962) (13,422) (30,207) (13,392) (5,046) (14,253) (2,551) (111,378)Other impairment losses (10) – (130) 7 4 1 (28) (32) (188)Share of profits of associates and joint ventures – – 149 68 – – – 3 220
Profit before tax 27,486 28,208 27,311 16,021 26,105 3,292 37,763 2,587 168,773
Capital expenditure 344 145 960 385 234 229 273 3,278 5,848Depreciation and amortisation 1,787 1,621 2,157 2,531 2,075 918 1,104 877 13,070
31 December 2020
Segment assets 4,873,490 3,942,366 6,667,011 4,416,305 3,985,433 1,451,185 10,577,145 1,433,729 37,346,664Long-term equity investments 604 – 4,850 7,196 – – – 1,052 13,702
4,874,094 3,942,366 6,671,861 4,423,501 3,985,433 1,451,185 10,577,145 1,434,781 37,360,366
Deferred tax assets 92,950Elimination (9,321,062)
Total assets 28,132,254
Segment liabilities 4,836,646 3,915,742 6,596,879 4,397,877 3,963,977 1,453,094 8,585,097 1,313,100 35,062,412
Deferred tax liabilities 1,551Elimination (9,321,062)
Total liabilities 25,742,901
Off-balance sheet credit commitments 608,353 588,398 693,095 648,284 446,579 162,120 – 266,701 3,413,530
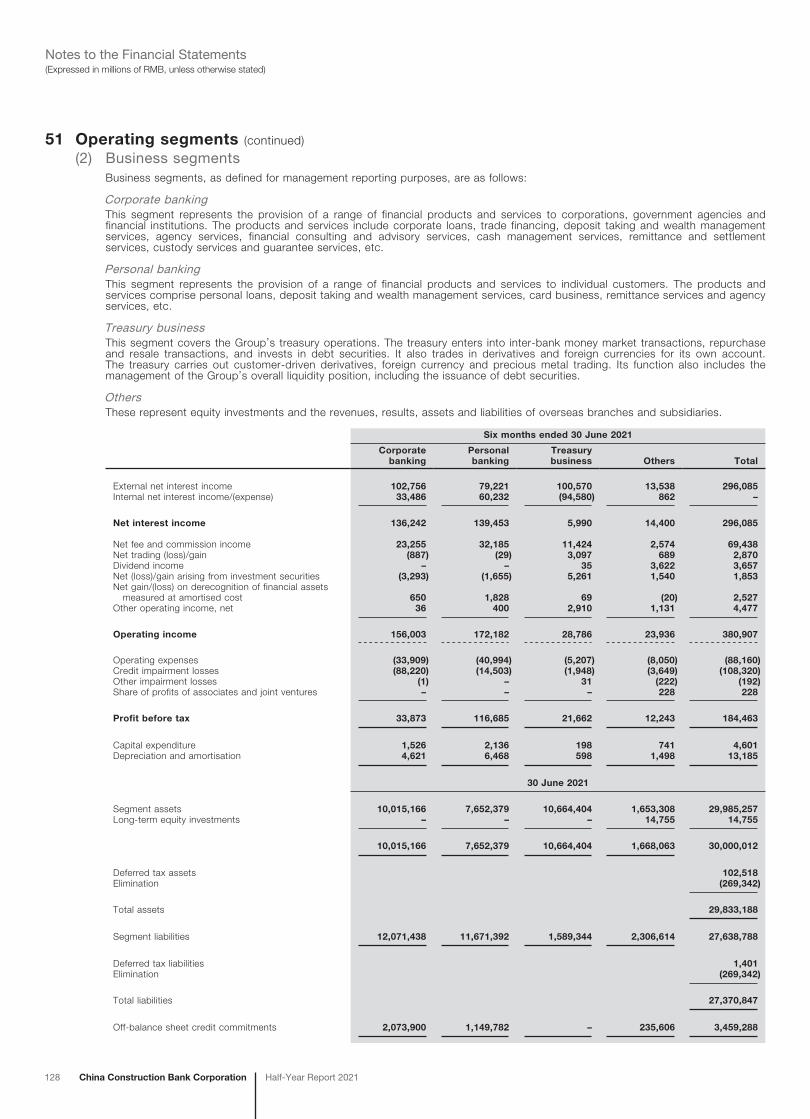
128 China Construction Bank Corporation Half-Year Report 2021
(Expressed in millions of RMB, unless otherwise stated)Notes to the Financial Statements
51 Operating segments (continued)
(2) Business segmentsBusiness segments, as defined for management reporting purposes, are as follows:
Corporate bankingThis segment represents the provision of a range of financial products and services to corporations, government agencies and financial institutions. The products and services include corporate loans, trade financing, deposit taking and wealth management services, agency services, financial consulting and advisory services, cash management services, remittance and settlement services, custody services and guarantee services, etc.
Personal bankingThis segment represents the provision of a range of financial products and services to individual customers. The products and services comprise personal loans, deposit taking and wealth management services, card business, remittance services and agency services, etc.
Treasury businessThis segment covers the Group’s treasury operations. The treasury enters into inter-bank money market transactions, repurchase and resale transactions, and invests in debt securities. It also trades in derivatives and foreign currencies for its own account. The treasury carries out customer-driven derivatives, foreign currency and precious metal trading. Its function also includes the management of the Group’s overall liquidity position, including the issuance of debt securities.
OthersThese represent equity investments and the revenues, results, assets and liabilities of overseas branches and subsidiaries.
Six months ended 30 June 2021
Corporate banking
Personal banking
Treasury business Others Total
External net interest income 102,756 79,221 100,570 13,538 296,085Internal net interest income/(expense) 33,486 60,232 (94,580) 862 –
Net interest income 136,242 139,453 5,990 14,400 296,085
Net fee and commission income 23,255 32,185 11,424 2,574 69,438Net trading (loss)/gain (887) (29) 3,097 689 2,870Dividend income – – 35 3,622 3,657Net (loss)/gain arising from investment securities (3,293) (1,655) 5,261 1,540 1,853Net gain/(loss) on derecognition of financial assets measured at amortised cost 650 1,828 69 (20) 2,527Other operating income, net 36 400 2,910 1,131 4,477
Operating income 156,003 172,182 28,786 23,936 380,907
Operating expenses (33,909) (40,994) (5,207) (8,050) (88,160)Credit impairment losses (88,220) (14,503) (1,948) (3,649) (108,320)Other impairment losses (1) – 31 (222) (192)Share of profits of associates and joint ventures – – – 228 228
Profit before tax 33,873 116,685 21,662 12,243 184,463
Capital expenditure 1,526 2,136 198 741 4,601Depreciation and amortisation 4,621 6,468 598 1,498 13,185
30 June 2021
Segment assets 10,015,166 7,652,379 10,664,404 1,653,308 29,985,257Long-term equity investments – – – 14,755 14,755
10,015,166 7,652,379 10,664,404 1,668,063 30,000,012
Deferred tax assets 102,518Elimination (269,342)
Total assets 29,833,188
Segment liabilities 12,071,438 11,671,392 1,589,344 2,306,614 27,638,788
Deferred tax liabilities 1,401Elimination (269,342)
Total liabilities 27,370,847
Off-balance sheet credit commitments 2,073,900 1,149,782 – 235,606 3,459,288
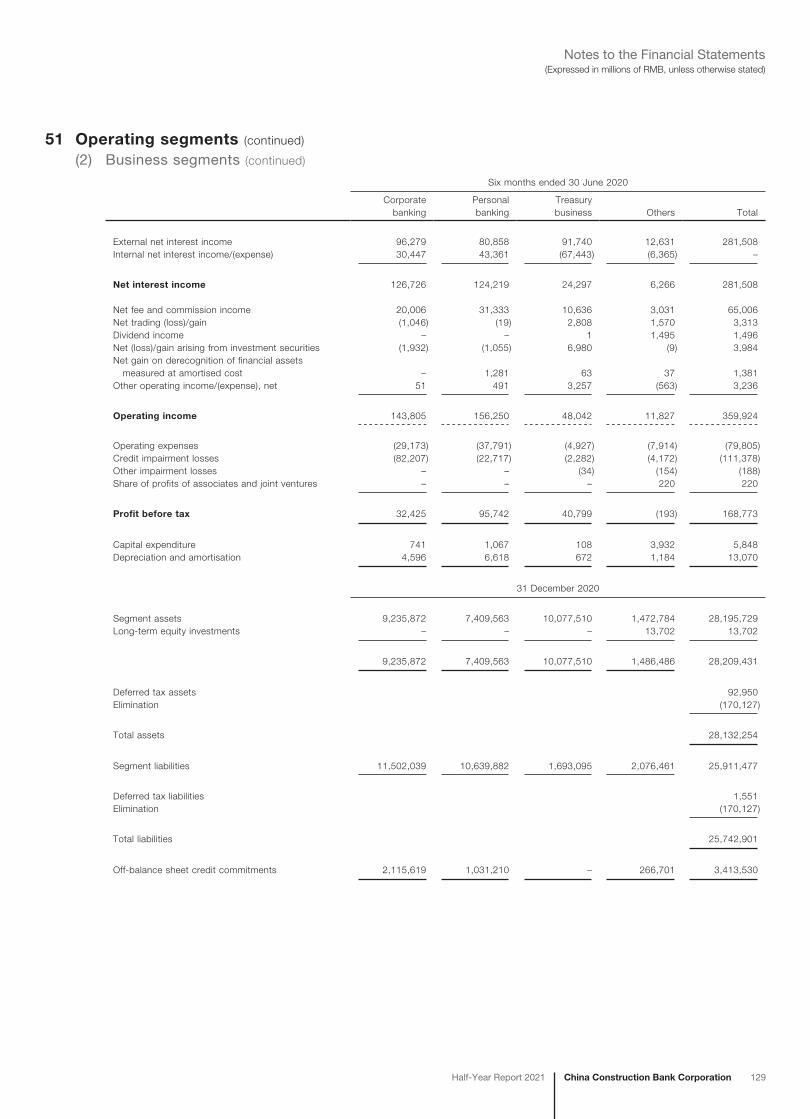
China Construction Bank CorporationHalf-Year Report 2021 129
(Expressed in millions of RMB, unless otherwise stated)Notes to the Financial Statements
51 Operating segments (continued)
(2) Business segments (continued)
Six months ended 30 June 2020
Corporate banking
Personal banking
Treasury business Others Total
External net interest income 96,279 80,858 91,740 12,631 281,508Internal net interest income/(expense) 30,447 43,361 (67,443) (6,365) –
Net interest income 126,726 124,219 24,297 6,266 281,508
Net fee and commission income 20,006 31,333 10,636 3,031 65,006Net trading (loss)/gain (1,046) (19) 2,808 1,570 3,313Dividend income – – 1 1,495 1,496Net (loss)/gain arising from investment securities (1,932) (1,055) 6,980 (9) 3,984Net gain on derecognition of financial assets measured at amortised cost – 1,281 63 37 1,381Other operating income/(expense), net 51 491 3,257 (563) 3,236
Operating income 143,805 156,250 48,042 11,827 359,924
Operating expenses (29,173) (37,791) (4,927) (7,914) (79,805)Credit impairment losses (82,207) (22,717) (2,282) (4,172) (111,378)Other impairment losses – – (34) (154) (188)Share of profits of associates and joint ventures – – – 220 220
Profit before tax 32,425 95,742 40,799 (193) 168,773
Capital expenditure 741 1,067 108 3,932 5,848Depreciation and amortisation 4,596 6,618 672 1,184 13,070
31 December 2020
Segment assets 9,235,872 7,409,563 10,077,510 1,472,784 28,195,729Long-term equity investments – – – 13,702 13,702
9,235,872 7,409,563 10,077,510 1,486,486 28,209,431
Deferred tax assets 92,950Elimination (170,127)
Total assets 28,132,254
Segment liabilities 11,502,039 10,639,882 1,693,095 2,076,461 25,911,477
Deferred tax liabilities 1,551Elimination (170,127)
Total liabilities 25,742,901
Off-balance sheet credit commitments 2,115,619 1,031,210 – 266,701 3,413,530
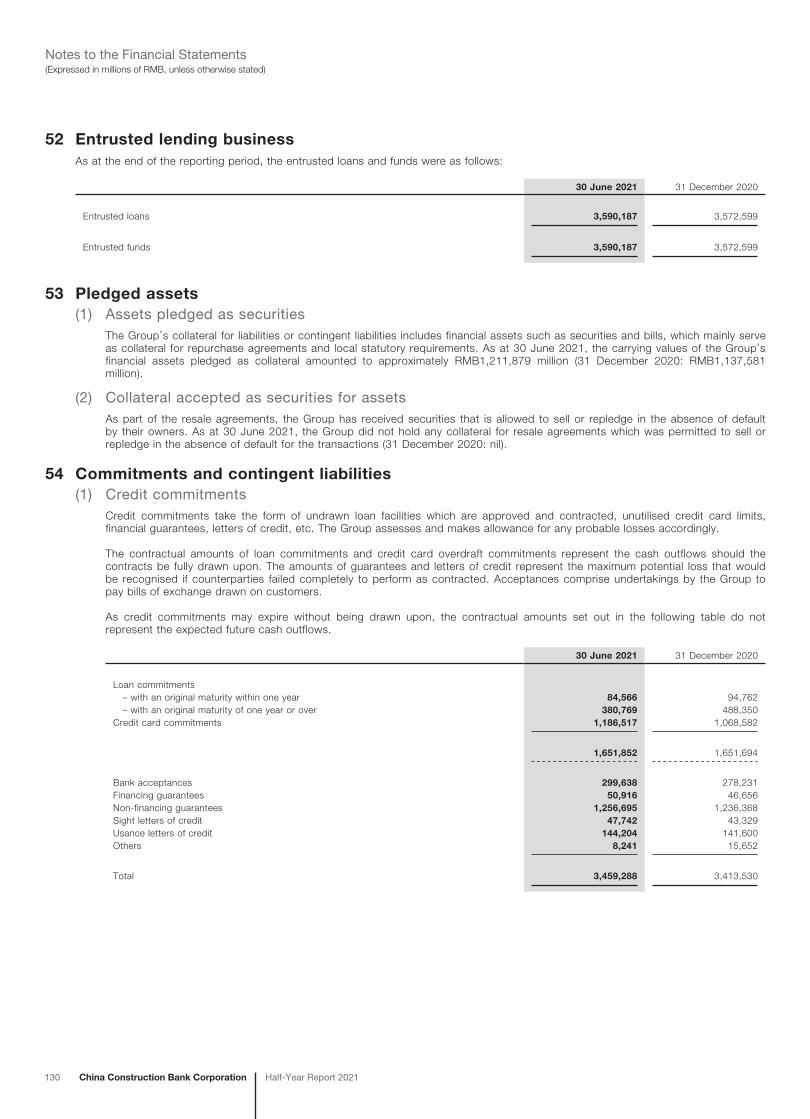
130 China Construction Bank Corporation Half-Year Report 2021
(Expressed in millions of RMB, unless otherwise stated)Notes to the Financial Statements
52 Entrusted lending businessAs at the end of the reporting period, the entrusted loans and funds were as follows:
30 June 2021 31 December 2020
Entrusted loans 3,590,187 3,572,599
Entrusted funds 3,590,187 3,572,599
53 Pledged assets(1) Assets pledged as securities
The Group’s collateral for liabilities or contingent liabilities includes financial assets such as securities and bills, which mainly serve as collateral for repurchase agreements and local statutory requirements. As at 30 June 2021, the carrying values of the Group’s financial assets pledged as collateral amounted to approximately RMB1,211,879 million (31 December 2020: RMB1,137,581 million).
(2) Collateral accepted as securities for assetsAs part of the resale agreements, the Group has received securities that is allowed to sell or repledge in the absence of default by their owners. As at 30 June 2021, the Group did not hold any collateral for resale agreements which was permitted to sell or repledge in the absence of default for the transactions (31 December 2020: nil).
54 Commitments and contingent liabilities(1) Credit commitments
Credit commitments take the form of undrawn loan facilities which are approved and contracted, unutilised credit card limits, financial guarantees, letters of credit, etc. The Group assesses and makes allowance for any probable losses accordingly.
The contractual amounts of loan commitments and credit card overdraft commitments represent the cash outflows should the contracts be fully drawn upon. The amounts of guarantees and letters of credit represent the maximum potential loss that would be recognised if counterparties failed completely to perform as contracted. Acceptances comprise undertakings by the Group to pay bills of exchange drawn on customers.
As credit commitments may expire without being drawn upon, the contractual amounts set out in the following table do not represent the expected future cash outflows.
30 June 2021 31 December 2020
Loan commitments – with an original maturity within one year 84,566 94,762 – with an original maturity of one year or over 380,769 488,350Credit card commitments 1,186,517 1,068,582
1,651,852 1,651,694
Bank acceptances 299,638 278,231Financing guarantees 50,916 46,656Non-financing guarantees 1,256,695 1,236,368Sight letters of credit 47,742 43,329Usance letters of credit 144,204 141,600Others 8,241 15,652
Total 3,459,288 3,413,530
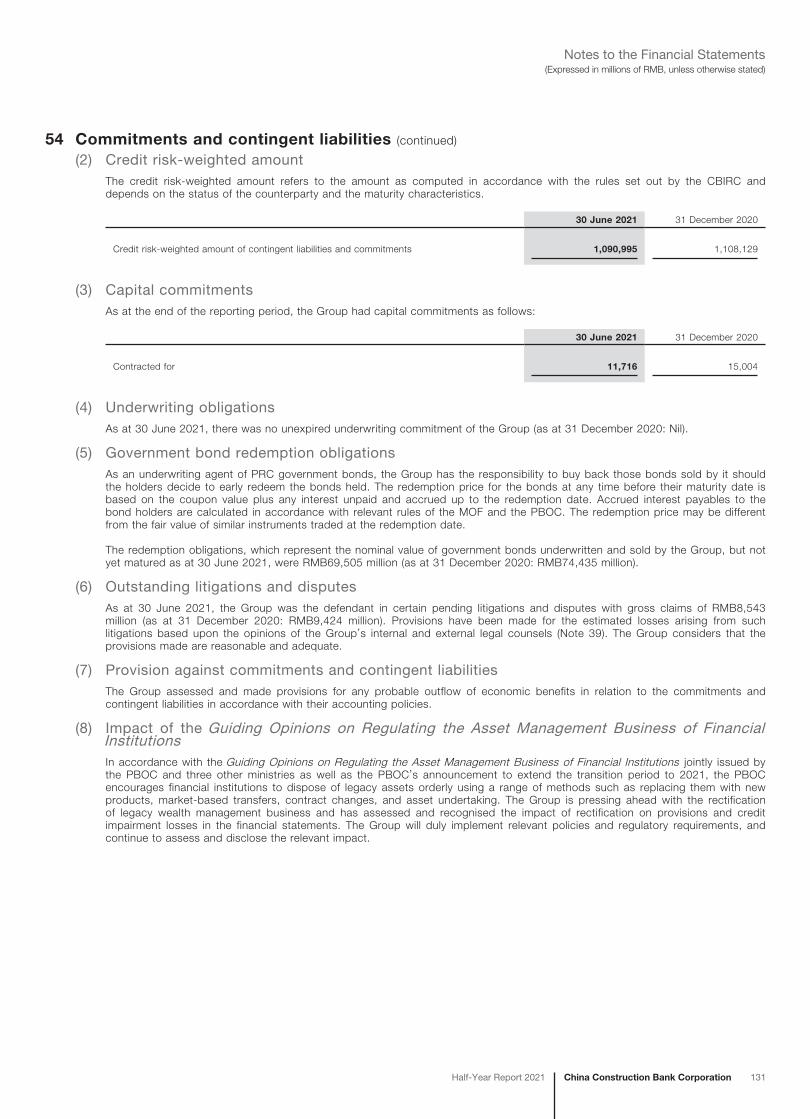
China Construction Bank CorporationHalf-Year Report 2021 131
(Expressed in millions of RMB, unless otherwise stated)Notes to the Financial Statements
54 Commitments and contingent liabilities (continued)
(2) Credit risk-weighted amountThe credit risk-weighted amount refers to the amount as computed in accordance with the rules set out by the CBIRC and depends on the status of the counterparty and the maturity characteristics.
30 June 2021 31 December 2020
Credit risk-weighted amount of contingent liabilities and commitments 1,090,995 1,108,129
(3) Capital commitmentsAs at the end of the reporting period, the Group had capital commitments as follows:
30 June 2021 31 December 2020
Contracted for 11,716 15,004
(4) Underwriting obligationsAs at 30 June 2021, there was no unexpired underwriting commitment of the Group (as at 31 December 2020: Nil).
(5) Government bond redemption obligationsAs an underwriting agent of PRC government bonds, the Group has the responsibility to buy back those bonds sold by it should the holders decide to early redeem the bonds held. The redemption price for the bonds at any time before their maturity date is based on the coupon value plus any interest unpaid and accrued up to the redemption date. Accrued interest payables to the bond holders are calculated in accordance with relevant rules of the MOF and the PBOC. The redemption price may be different from the fair value of similar instruments traded at the redemption date.
The redemption obligations, which represent the nominal value of government bonds underwritten and sold by the Group, but not yet matured as at 30 June 2021, were RMB69,505 million (as at 31 December 2020: RMB74,435 million).
(6) Outstanding litigations and disputesAs at 30 June 2021, the Group was the defendant in certain pending litigations and disputes with gross claims of RMB8,543 million (as at 31 December 2020: RMB9,424 million). Provisions have been made for the estimated losses arising from such litigations based upon the opinions of the Group’s internal and external legal counsels (Note 39). The Group considers that the provisions made are reasonable and adequate.
(7) Provision against commitments and contingent liabilitiesThe Group assessed and made provisions for any probable outflow of economic benefits in relation to the commitments and contingent liabilities in accordance with their accounting policies.
(8) Impact of the Guiding Opinions on Regulating the Asset Management Business of Financial InstitutionsIn accordance with the Guiding Opinions on Regulating the Asset Management Business of Financial Institutions jointly issued by the PBOC and three other ministries as well as the PBOC’s announcement to extend the transition period to 2021, the PBOC encourages financial institutions to dispose of legacy assets orderly using a range of methods such as replacing them with new products, market-based transfers, contract changes, and asset undertaking. The Group is pressing ahead with the rectification of legacy wealth management business and has assessed and recognised the impact of rectification on provisions and credit impairment losses in the financial statements. The Group will duly implement relevant policies and regulatory requirements, and continue to assess and disclose the relevant impact.
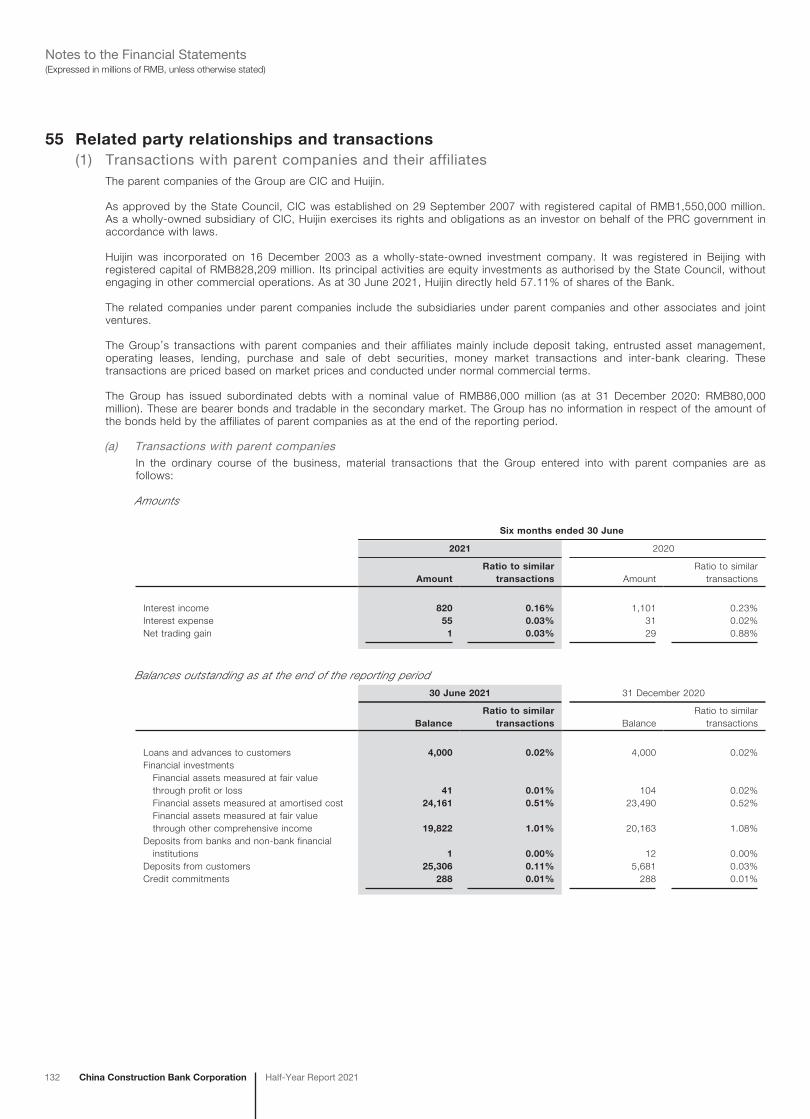
132 China Construction Bank Corporation Half-Year Report 2021
(Expressed in millions of RMB, unless otherwise stated)Notes to the Financial Statements
55 Related party relationships and transactions(1) Transactions with parent companies and their affiliates
The parent companies of the Group are CIC and Huijin.
As approved by the State Council, CIC was established on 29 September 2007 with registered capital of RMB1,550,000 million. As a wholly-owned subsidiary of CIC, Huijin exercises its rights and obligations as an investor on behalf of the PRC government in accordance with laws.
Huijin was incorporated on 16 December 2003 as a wholly-state-owned investment company. It was registered in Beijing with registered capital of RMB828,209 million. Its principal activities are equity investments as authorised by the State Council, without engaging in other commercial operations. As at 30 June 2021, Huijin directly held 57.11% of shares of the Bank.
The related companies under parent companies include the subsidiaries under parent companies and other associates and joint ventures.
The Group’s transactions with parent companies and their affiliates mainly include deposit taking, entrusted asset management, operating leases, lending, purchase and sale of debt securities, money market transactions and inter-bank clearing. These transactions are priced based on market prices and conducted under normal commercial terms.
The Group has issued subordinated debts with a nominal value of RMB86,000 million (as at 31 December 2020: RMB80,000 million). These are bearer bonds and tradable in the secondary market. The Group has no information in respect of the amount of the bonds held by the affiliates of parent companies as at the end of the reporting period.
(a) Transactions with parent companiesIn the ordinary course of the business, material transactions that the Group entered into with parent companies are as follows:
Amounts
Six months ended 30 June
2021 2020
AmountRatio to similar
transactions AmountRatio to similar
transactions
Interest income 820 0.16% 1,101 0.23%Interest expense 55 0.03% 31 0.02%Net trading gain 1 0.03% 29 0.88%
Balances outstanding as at the end of the reporting period
30 June 2021 31 December 2020
BalanceRatio to similar
transactions BalanceRatio to similar
transactions
Loans and advances to customers 4,000 0.02% 4,000 0.02%Financial investments Financial assets measured at fair value through profit or loss 41 0.01% 104 0.02% Financial assets measured at amortised cost 24,161 0.51% 23,490 0.52% Financial assets measured at fair value through other comprehensive income 19,822 1.01% 20,163 1.08%Deposits from banks and non-bank financial institutions 1 0.00% 12 0.00%Deposits from customers 25,306 0.11% 5,681 0.03%Credit commitments 288 0.01% 288 0.01%
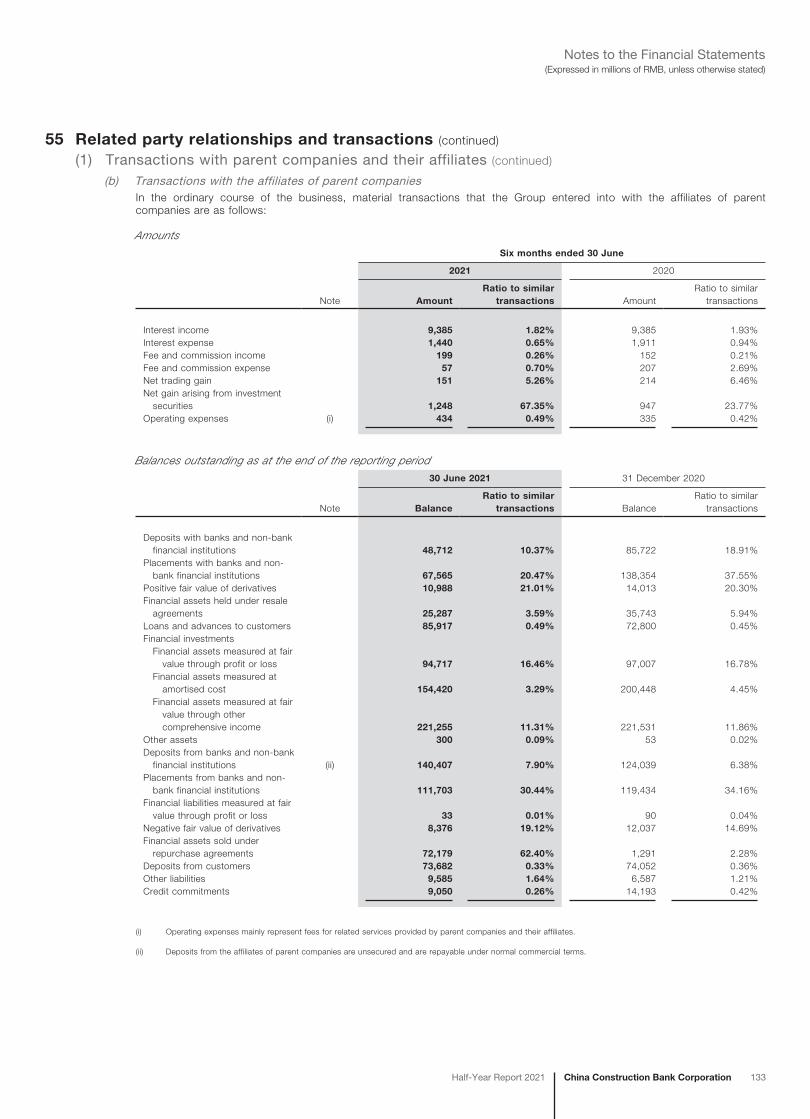
China Construction Bank CorporationHalf-Year Report 2021 133
(Expressed in millions of RMB, unless otherwise stated)Notes to the Financial Statements
55 Related party relationships and transactions (continued)
(1) Transactions with parent companies and their affiliates (continued)
(b) Transactions with the affiliates of parent companiesIn the ordinary course of the business, material transactions that the Group entered into with the affiliates of parent companies are as follows:
Amounts
Six months ended 30 June
2021 2020
Note AmountRatio to similar
transactions AmountRatio to similar
transactions
Interest income 9,385 1.82% 9,385 1.93%Interest expense 1,440 0.65% 1,911 0.94%Fee and commission income 199 0.26% 152 0.21%Fee and commission expense 57 0.70% 207 2.69%Net trading gain 151 5.26% 214 6.46%Net gain arising from investment securities 1,248 67.35% 947 23.77%Operating expenses (i) 434 0.49% 335 0.42%
Balances outstanding as at the end of the reporting period
30 June 2021 31 December 2020
Note BalanceRatio to similar
transactions BalanceRatio to similar
transactions
Deposits with banks and non-bank financial institutions 48,712 10.37% 85,722 18.91%Placements with banks and non- bank financial institutions 67,565 20.47% 138,354 37.55%Positive fair value of derivatives 10,988 21.01% 14,013 20.30%Financial assets held under resale agreements 25,287 3.59% 35,743 5.94%Loans and advances to customers 85,917 0.49% 72,800 0.45%Financial investments Financial assets measured at fair value through profit or loss 94,717 16.46% 97,007 16.78% Financial assets measured at amortised cost 154,420 3.29% 200,448 4.45% Financial assets measured at fair value through other comprehensive income 221,255 11.31% 221,531 11.86%Other assets 300 0.09% 53 0.02%Deposits from banks and non-bank financial institutions (ii) 140,407 7.90% 124,039 6.38%Placements from banks and non- bank financial institutions 111,703 30.44% 119,434 34.16%Financial liabilities measured at fair value through profit or loss 33 0.01% 90 0.04%Negative fair value of derivatives 8,376 19.12% 12,037 14.69%Financial assets sold under repurchase agreements 72,179 62.40% 1,291 2.28%Deposits from customers 73,682 0.33% 74,052 0.36%Other liabilities 9,585 1.64% 6,587 1.21%Credit commitments 9,050 0.26% 14,193 0.42%
(i) Operating expenses mainly represent fees for related services provided by parent companies and their affiliates.
(ii) Deposits from the affiliates of parent companies are unsecured and are repayable under normal commercial terms.
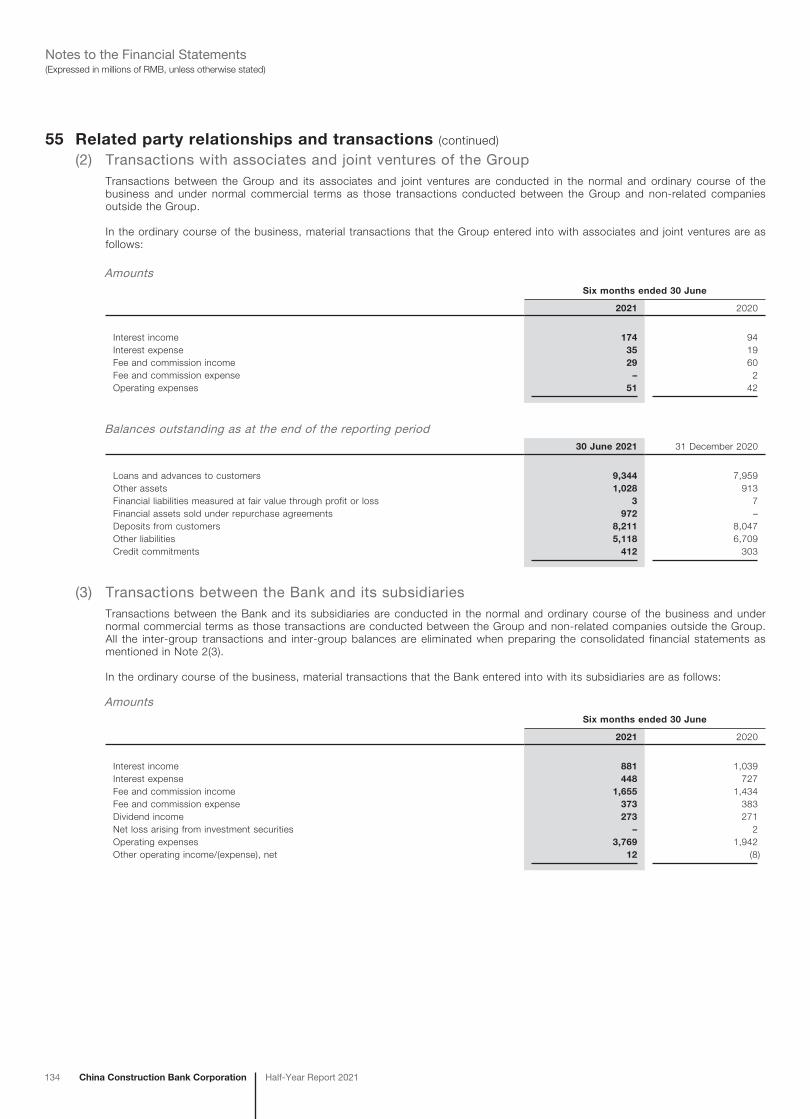
134 China Construction Bank Corporation Half-Year Report 2021
(Expressed in millions of RMB, unless otherwise stated)Notes to the Financial Statements
55 Related party relationships and transactions (continued)
(2) Transactions with associates and joint ventures of the GroupTransactions between the Group and its associates and joint ventures are conducted in the normal and ordinary course of the business and under normal commercial terms as those transactions conducted between the Group and non-related companies outside the Group.
In the ordinary course of the business, material transactions that the Group entered into with associates and joint ventures are as follows:
AmountsSix months ended 30 June
2021 2020
Interest income 174 94Interest expense 35 19Fee and commission income 29 60Fee and commission expense – 2Operating expenses 51 42
Balances outstanding as at the end of the reporting period30 June 2021 31 December 2020
Loans and advances to customers 9,344 7,959Other assets 1,028 913Financial liabilities measured at fair value through profit or loss 3 7Financial assets sold under repurchase agreements 972 –Deposits from customers 8,211 8,047Other liabilities 5,118 6,709Credit commitments 412 303
(3) Transactions between the Bank and its subsidiariesTransactions between the Bank and its subsidiaries are conducted in the normal and ordinary course of the business and under normal commercial terms as those transactions are conducted between the Group and non-related companies outside the Group. All the inter-group transactions and inter-group balances are eliminated when preparing the consolidated financial statements as mentioned in Note 2(3).
In the ordinary course of the business, material transactions that the Bank entered into with its subsidiaries are as follows:
AmountsSix months ended 30 June
2021 2020
Interest income 881 1,039Interest expense 448 727Fee and commission income 1,655 1,434Fee and commission expense 373 383Dividend income 273 271Net loss arising from investment securities – 2Operating expenses 3,769 1,942Other operating income/(expense), net 12 (8)
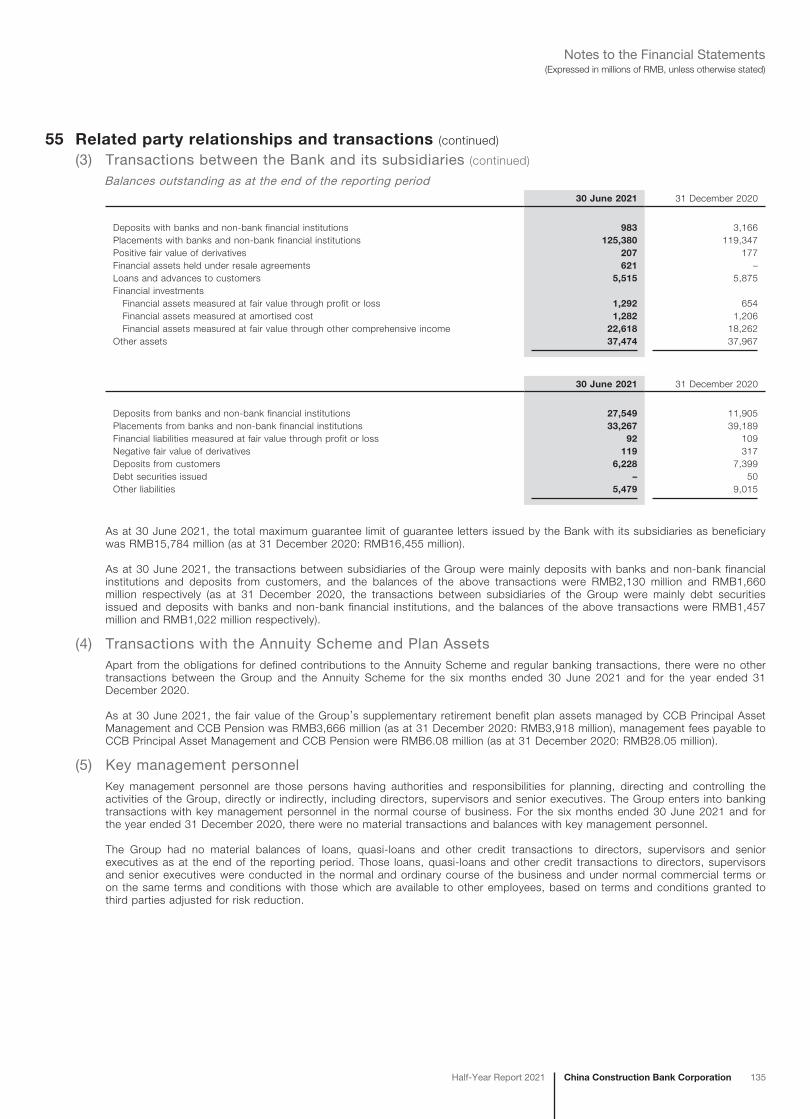
China Construction Bank CorporationHalf-Year Report 2021 135
(Expressed in millions of RMB, unless otherwise stated)Notes to the Financial Statements
55 Related party relationships and transactions (continued)
(3) Transactions between the Bank and its subsidiaries (continued)
Balances outstanding as at the end of the reporting period30 June 2021 31 December 2020
Deposits with banks and non-bank financial institutions 983 3,166Placements with banks and non-bank financial institutions 125,380 119,347Positive fair value of derivatives 207 177Financial assets held under resale agreements 621 –Loans and advances to customers 5,515 5,875Financial investments Financial assets measured at fair value through profit or loss 1,292 654 Financial assets measured at amortised cost 1,282 1,206 Financial assets measured at fair value through other comprehensive income 22,618 18,262Other assets 37,474 37,967
30 June 2021 31 December 2020
Deposits from banks and non-bank financial institutions 27,549 11,905Placements from banks and non-bank financial institutions 33,267 39,189Financial liabilities measured at fair value through profit or loss 92 109Negative fair value of derivatives 119 317Deposits from customers 6,228 7,399Debt securities issued – 50Other liabilities 5,479 9,015
As at 30 June 2021, the total maximum guarantee limit of guarantee letters issued by the Bank with its subsidiaries as beneficiary was RMB15,784 million (as at 31 December 2020: RMB16,455 million).
As at 30 June 2021, the transactions between subsidiaries of the Group were mainly deposits with banks and non-bank financial institutions and deposits from customers, and the balances of the above transactions were RMB2,130 million and RMB1,660 million respectively (as at 31 December 2020, the transactions between subsidiaries of the Group were mainly debt securities issued and deposits with banks and non-bank financial institutions, and the balances of the above transactions were RMB1,457 million and RMB1,022 million respectively).
(4) Transactions with the Annuity Scheme and Plan AssetsApart from the obligations for defined contributions to the Annuity Scheme and regular banking transactions, there were no other transactions between the Group and the Annuity Scheme for the six months ended 30 June 2021 and for the year ended 31 December 2020.
As at 30 June 2021, the fair value of the Group’s supplementary retirement benefit plan assets managed by CCB Principal Asset Management and CCB Pension was RMB3,666 million (as at 31 December 2020: RMB3,918 million), management fees payable to CCB Principal Asset Management and CCB Pension were RMB6.08 million (as at 31 December 2020: RMB28.05 million).
(5) Key management personnelKey management personnel are those persons having authorities and responsibilities for planning, directing and controlling the activities of the Group, directly or indirectly, including directors, supervisors and senior executives. The Group enters into banking transactions with key management personnel in the normal course of business. For the six months ended 30 June 2021 and for the year ended 31 December 2020, there were no material transactions and balances with key management personnel.
The Group had no material balances of loans, quasi-loans and other credit transactions to directors, supervisors and senior executives as at the end of the reporting period. Those loans, quasi-loans and other credit transactions to directors, supervisors and senior executives were conducted in the normal and ordinary course of the business and under normal commercial terms or on the same terms and conditions with those which are available to other employees, based on terms and conditions granted to third parties adjusted for risk reduction.
136 China Construction Bank Corporation Half-Year Report 2021
(Expressed in millions of RMB, unless otherwise stated)Notes to the Financial Statements
55 Related party relationships and transactions (continued)
(6) Transactions related to natural personsAs at 30 June 2021, the aggregate balance of loans and credit card overdraft to the persons who were considered as related parties according to the relevant rules of the Shanghai Stock Exchange was RMB5.59 million (as at 31 December 2020: RMB3.70 million).
As at 30 June 2021, the aggregate balance of credit related transactions to the related parties as defined in the Administration of Connected Transactions between Commercial Banks and Their Insiders by the CBRC was RMB183 million (as at 31 December 2020: RMB191 million).
56 Risk managementThe Group has exposure to the following risks:
– credit risk– market risk– liquidity risk– operational risk– insurance risk
This note presents information about the Group’s exposures to each of the above risks, the Group’s objectives, policies and processes for measuring and managing risk, and the Group’s capital management.
Risk management frameworkThe Board performs risk management responsibilities pursuant to the Bank’s Articles of Association and regulatory requirements. The Risk Management Committee under the Board is responsible for developing risk management strategies, supervising the implementation, and assessing the overall risk profile on a regular basis. The Board reviews the statements of risk appetite regularly and transmits risk appetite through policies. The Board of Supervisors supervises the construction of the comprehensive risk management system, as well as the performance of the Board and senior management in delivering comprehensive risk management responsibilities. Senior management is responsible for implementing risk strategies developed by the Board and organising the comprehensive risk management work across the Group.
Chief Risk Officer of the Bank assists the President with risk management work within designated responsibilities. Risk Management Department is the leading management department responsible for the Group’s comprehensive risk management, and its subordinate department, Market Risk Management Department takes the lead in market risk management. Credit Management Department is the leading management department responsible for the overall credit risk management and country risk management. Asset & Liability Management Department is the leading management department responsible for the management of liquidity risk and interest rate risk of banking book. Internal Control & Compliance Department is the leading management department responsible for operational risk and information technology risk management. Public Relations & Corporate Culture Department is in charge of reputational risk management. Strategy and Policy Coordination Department is the leading management department responsible for strategic risk management. Other specialised departments are responsible for other risks.
The Bank attached great importance to the risk management of subsidiaries, implemented management requirements of the parent bank through the corporate governance mechanism, continuously improved the quality and efficiency of the performance of the Board of Directors of the subsidiaries, and required the subsidiaries to focus on their main businesses, operate steadily, and establish a sound risk control system. It further highlighted the transmission of risk appetite at the Group level within the group risk management framework, and implemented refined and differentiated management of different types of subsidiaries. It strengthened the Group’s consolidation and credit management to avoid lending beyond credit limits. It continued to promote the establishment of risk views of subsidiaries, and effectively improved the digital level of risk early warning and risk monitoring of subsidiaries. It strengthened overall planning and coordination and improved the long-term mechanism for risk management of the asset management business at the subsidiaries.
China Construction Bank CorporationHalf-Year Report 2021 137
(Expressed in millions of RMB, unless otherwise stated)Notes to the Financial Statements
56 Risk management (continued)
(1) Credit riskCredit risk managementCredit risk represents the financial loss that arises from the failure of a debtor or counterparty to discharge its contractual obligations or commitments to the Group.
Credit businessThe Risk Management Department takes the lead in the development and implementation of the credit risk measurement tools including customers rating and facilities grading. The Credit Management Department is responsible for establishing credit risk management policies and monitoring the quality of credit assets. The Special Assets Resolution Department is responsible for the special assets resolutions. The Credit Approval Department is responsible for the Group’s comprehensive credit limits and credit approval of various credit businesses. While the Credit Management Department takes the lead, both the Credit Management Department and the Credit Approval Department will coordinate with the Corporate Banking Department, the Inclusive Finance Department, the Institutional Banking Department, the International Business Department, the Strategic Clients Department, the Housing Finance & Personal Lending Department, the Credit Card Center, and the Legal Affairs Department to implement the credit risk management policies and procedures.
With respect to the credit risk management of corporate and institutional business, the Group has accelerated the adjustment of its credit portfolio structure, enhanced post-lending monitoring, and refined the industry-specific guideline and policy baseline for credit approval. Management also fine-tuned the credit acceptance and exit policies, and optimised its economic capital and credit risk limit management. All these policies have been implemented to maintain the stability of asset quality. The Group manages credit risk throughout the entire credit process including pre-lending evaluations, credit approval and post-lending monitoring. The Group performs pre-lending evaluations by assessing the entity’s credit ratings based on internal rating criteria and assessing the risk and rewards with respect to the proposed project. Credit approvals are granted by designated Credit Approval Officers. The Group continually carries out post-lending monitoring, particularly those related to targeted industries, geographical segments, products and clients. Any adverse events that may significantly affect a borrower’s repayment ability are reported timely and measures are implemented to prevent and control risks.
With respect to the personal credit business, the Group relies on credit assessment of applicants as the basis for loan approval. Customer relationship managers are required to assess the income, credit history, and repayment ability of the applicant. The customer relationship managers then forward the application and recommendations to the loan-approval departments for consent. The Group pays great attention to post-lending monitoring of personal loans, focuses on borrowers’ repayment ability, the status of collateral and any changes to collateral value. Once a loan becomes overdue, the Group starts the recovery process according to standard recovery procedures.
To mitigate risks, the Group requests the customers to provide collateral or guarantees where appropriate. A refined management system and operating procedure for collateral have been developed, and there is a guideline to specify the suitability of accepting specific types of collateral. Collateral values, structures and legal covenants are regularly reviewed to ensure that they still serve their intended purposes and conform to market practices.
Treasury businessFor risk management purposes, credit risk arising from debt securities and derivatives exposures is managed independently and information thereon is disclosed in Notes (1)(i) and (1)(j) below. The Group sets credit limits for treasury activities and monitors them regularly with reference to the fair values of the relevant financial instruments.
Measurement of expected credit losses (ECL)(A) Segmentation of financial instruments
The Group adopts a “three-stage” model for impairment based on changes in credit risk since initial recognition or by determining whether the financial instruments are credit-impaired, to estimate the expected credit losses.
The key definition of the three stages are summarised below:
Stage 1: For financial instruments with no significant increase in credit risk after initial recognition, expected credit losses in the next 12 months are recognised.
Stage 2: For financial instruments with significant increase in credit risk since initial recognition, but with no objective evidence of impairment, lifetime expected credit losses are recognised.
Stage 3: For financial instruments with objective evidence of impairment on the balance sheet date, lifetime expected credit losses are recognised.
138 China Construction Bank Corporation Half-Year Report 2021
(Expressed in millions of RMB, unless otherwise stated)Notes to the Financial Statements
56 Risk management (continued)
(1) Credit risk (continued)
Measurement of expected credit losses (ECL) (continued)(B) Significant increase in credit risk (“SICR”)
The Group assesses at least quarterly whether the credit risk of a financial instrument has increased significantly since initial recognition. The Group compares the risk of default of financial instruments as at the balance sheet date with that as at the date of initial recognition for an individual financial instrument or a group of financial instruments with similar credit risk characteristics to determine whether the credit risk has increased significantly since initial recognition. The Group sufficiently considers all reasonable and supportable information in related assessments, including regulatory and business environment, internal and external credit rating of customer, customer repayment ability, customer operation capacity, contract terms of the loan, asset price, market interest rate, customer repayment behaviors, and forward-looking information.
The Group has set qualitative and quantitative criteria for assessing whether the credit risk of financial instruments has increased significantly since initial recognition. For example, the credit risk of corporate loans and advances whose internal credit ratings have fallen to level 15 and below, and of bond investments whose internal credit ratings have fallen by 2 and more levels, is regarded as having increased significantly.
Usually, the credit risk of loans overdue for more than 30 days is regarded as having increased significantly.
For borrowers who were eligible for temporary deferral in principal repayment and interest payment, deferred repayment and other credit support measures in the wake of COVID-19, the Group, by reference to guidelines by relevant regulators, did not consider these support measures as an automatic trigger of a significant increase in credit risk. The Group continued to make judgment based on substantive risk assessment and comprehensively considered the operations and repayment capacity of borrowers, as well as the impact of COVID-19 on these borrowers, to assess whether the credit risk of relevant financial instruments had increased significantly since initial recognition.
(C) Definition of default and credit-impaired assetsThe Group considers a financial asset as having defaulted when it is credit-impaired. Generally, financial assets overdue for more than 90 days on contractual payment terms shall be considered as having credit-impaired.
In order to evaluate whether a financial asset is impaired, the Group considers the following criteria:
– Significant financial difficulty of the borrower or issuer;
– Breach of contract terms, such as a default or delinquency in interest or principal payments;
– The Group, for economic or legal reasons, making a concession to a borrower experiencing financial difficulty that the Group would not otherwise consider;
– It is becoming probable that the borrower will enter into bankruptcy or other financial reorganisation;
– Disappearance of an active market for financial assets because of financial difficulties;
– A financial asset purchased or originated by a large discount which reflects the fact of credit-impairment having occurred;
– Observable data indicating that there is a measurable decrease in the estimated future cash flows from a group of financial assets since the initial recognition of those assets, although the decrease cannot yet be identified with the individual financial assets in the Group, including adverse changes in the payment status of borrowers in the Group, an increase in the unemployment rate in the geographical area of the borrowers, a decrease in property prices for mortgages in the relevant area, or adverse changes in industry conditions that affect the borrowers in the Group; and
– Other objective evidence indicating there is a credit impairment of the financial asset.
The Group’s definition of default has been consistently applied to the estimates of PD, LGD and EAD during the ECL measurement.
China Construction Bank CorporationHalf-Year Report 2021 139
(Expressed in millions of RMB, unless otherwise stated)Notes to the Financial Statements
56 Risk management (continued)
(1) Credit risk (continued)
Measurement of expected credit losses (ECL) (continued)(D) Explanation of parameters, assumptions and estimation techniques
The ECL is recognised on either a 12-month or lifetime basis depending on whether a significant increase in credit risk has occurred since initial recognition or whether a financial instrument is considered to be credit-impaired. Expected credit losses are the discounted product of the weighted average of PD, LGD, and EAD under the optimistic, baseline and pessimistic scenarios, defined as follows:
PD refers to the likelihood of a borrower defaulting on its financial obligation in the future, after consideration of forward-looking information. Please refer to earlier disclosure in this note for the definition of default.
LGD refers to the Group’s expected loss amount resulting from default as a proportion of total exposure, after consideration of forward-looking information.
EAD is the total amount of risk exposure on and off-balance sheet at the time of default. The exposure is determined by the repayment plan according to different types of products.
The discount rate used in the ECL measurement is the effective interest rate.
During the reporting period, based on changes in macroeconomic environment, the Group has updated forward-looking information used in the measurement of expected credit losses. Please refer to further disclosure in this note for forward-looking information which is incorporated in the measurement of expected credit losses.
The assumptions underlying the ECL measurement, such as the PDs for different maturities and how the collateral values change, are monitored and reviewed on a quarterly basis.
There have been no significant changes in estimation techniques and such assumptions made during the reporting period.
(E) Forward-looking information incorporated in the ECLThe assessment of SICR and the measurement of ECL both incorporate forward-looking information.
The Group has performed historical data analysis and identified the macroeconomic variables affecting expected credit losses, such as GDP, CPI, M2, PPI, RMB deposit reserve rate, London spot gold price, average exchange rate of US Dollar to RMB, sales price indices of second-hand residential buildings in 70 large and medium-sized cities, national real estate climate index, unemployment rate, and so on.
COVID-19 has made an unprecedented impact on the global macro economy, bringing great uncertainties and significantly increasing the difficulty of forecasting macroeconomic variables. In order to further improve the accuracy of forecasts, the Group developed scenarios specifically tailored for ECL measurement by reference to forecast results of authoritative international and domestic institutions and leveraging on the capability of internal experts.
The forecast GDP value for baseline scenario is set as the average value of forecasts released by authoritative international and domestic institutions, and the forecast 2021 GDP growth under the baseline scenario is 8.40%. For other macroeconomic variables, the Group involved internal experts and used methods such as transmission models, economic principles, and expert judgment to calculate the predicted value of each variable under each scenario.
The Group constructs empirical models to derive the relationship between historical macroeconomic variables and PD and LGD, and calculates the PD and LGD values for a given future horizon using the forecasted macroeconomic variables.
The Group constructs empirical models to determine the weightings for optimistic, baseline and pessimistic scenarios. As at 30 June 2021 and 31 December 2020, the optimistic, baseline and pessimistic scenarios are of comparable weighting.
(F) Grouping of financial instruments for losses measured on a collective basisFor expected credit loss provisions modelled on a collective basis, the Group has divided exposures with shared risk characteristics into separate groups. In performing this grouping, the Group obtained sufficient information to ensure it is statistically reliable. The Group measured expected credit losses on personal loans and advances on a collective basis by considering factors such as internal risk pool, product type and client type.
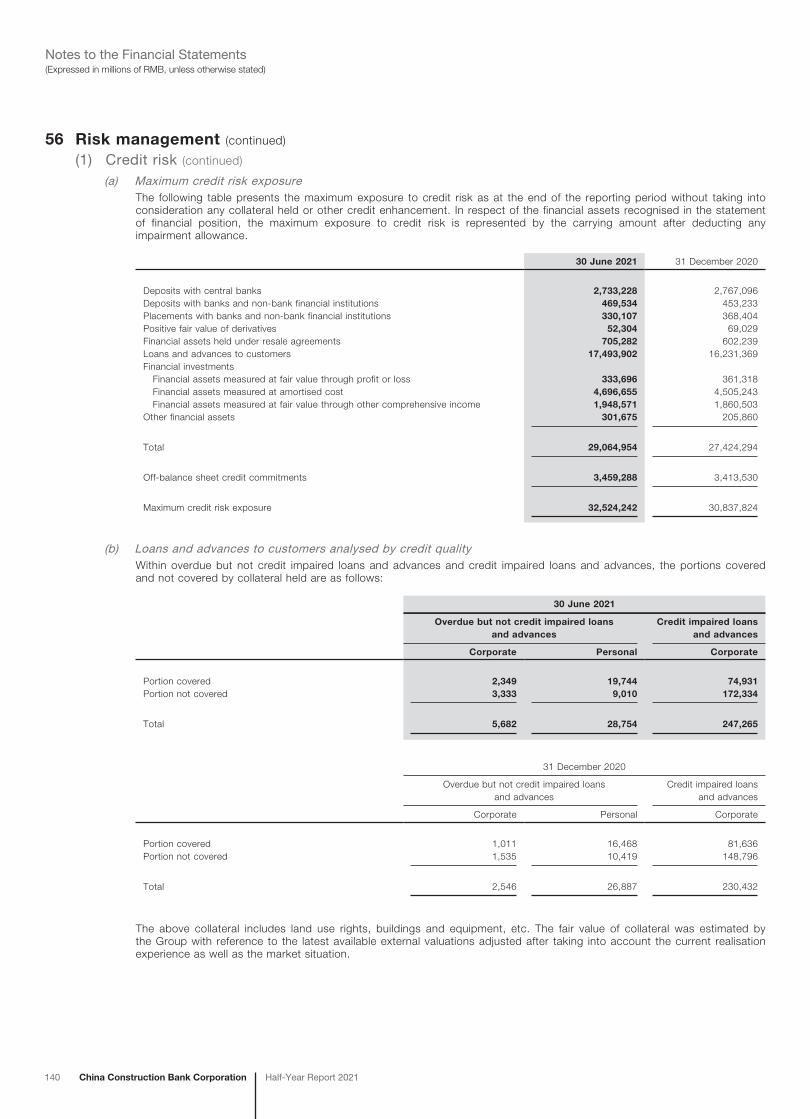
140 China Construction Bank Corporation Half-Year Report 2021
(Expressed in millions of RMB, unless otherwise stated)Notes to the Financial Statements
56 Risk management (continued)
(1) Credit risk (continued)
(a) Maximum credit risk exposureThe following table presents the maximum exposure to credit risk as at the end of the reporting period without taking into consideration any collateral held or other credit enhancement. In respect of the financial assets recognised in the statement of financial position, the maximum exposure to credit risk is represented by the carrying amount after deducting any impairment allowance.
30 June 2021 31 December 2020
Deposits with central banks 2,733,228 2,767,096Deposits with banks and non-bank financial institutions 469,534 453,233Placements with banks and non-bank financial institutions 330,107 368,404Positive fair value of derivatives 52,304 69,029Financial assets held under resale agreements 705,282 602,239Loans and advances to customers 17,493,902 16,231,369Financial investments Financial assets measured at fair value through profit or loss 333,696 361,318 Financial assets measured at amortised cost 4,696,655 4,505,243 Financial assets measured at fair value through other comprehensive income 1,948,571 1,860,503Other financial assets 301,675 205,860
Total 29,064,954 27,424,294
Off-balance sheet credit commitments 3,459,288 3,413,530
Maximum credit risk exposure 32,524,242 30,837,824
(b) Loans and advances to customers analysed by credit qualityWithin overdue but not credit impaired loans and advances and credit impaired loans and advances, the portions covered and not covered by collateral held are as follows:
30 June 2021
Overdue but not credit impaired loans and advances
Credit impaired loans and advances
Corporate Personal Corporate
Portion covered 2,349 19,744 74,931Portion not covered 3,333 9,010 172,334
Total 5,682 28,754 247,265
31 December 2020
Overdue but not credit impaired loans and advances
Credit impaired loans and advances
Corporate Personal Corporate
Portion covered 1,011 16,468 81,636Portion not covered 1,535 10,419 148,796
Total 2,546 26,887 230,432
The above collateral includes land use rights, buildings and equipment, etc. The fair value of collateral was estimated by the Group with reference to the latest available external valuations adjusted after taking into account the current realisation experience as well as the market situation.
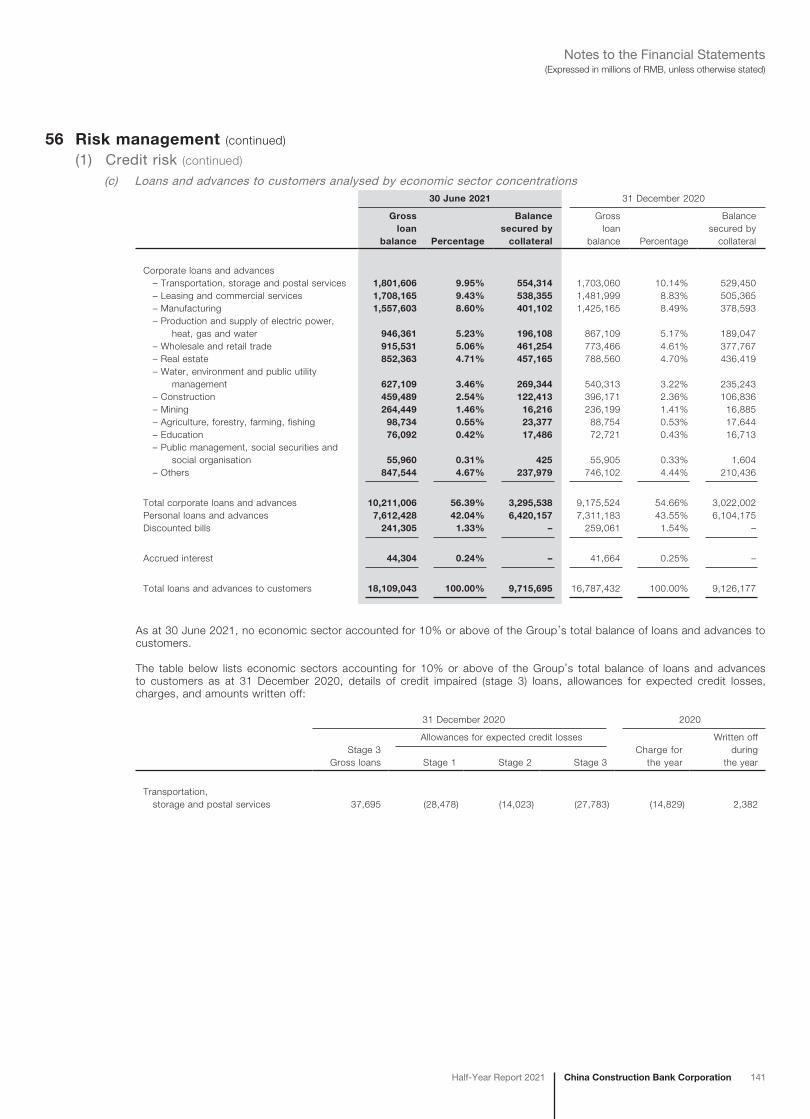
China Construction Bank CorporationHalf-Year Report 2021 141
(Expressed in millions of RMB, unless otherwise stated)Notes to the Financial Statements
56 Risk management (continued)
(1) Credit risk (continued)
(c) Loans and advances to customers analysed by economic sector concentrations30 June 2021 31 December 2020
Gross loan
balance Percentage
Balance secured by
collateral
Gross loan
balance Percentage
Balance secured by
collateral
Corporate loans and advances – Transportation, storage and postal services 1,801,606 9.95% 554,314 1,703,060 10.14% 529,450 – Leasing and commercial services 1,708,165 9.43% 538,355 1,481,999 8.83% 505,365 – Manufacturing 1,557,603 8.60% 401,102 1,425,165 8.49% 378,593 – Production and supply of electric power, heat, gas and water 946,361 5.23% 196,108 867,109 5.17% 189,047 – Wholesale and retail trade 915,531 5.06% 461,254 773,466 4.61% 377,767 – Real estate 852,363 4.71% 457,165 788,560 4.70% 436,419 – Water, environment and public utility management 627,109 3.46% 269,344 540,313 3.22% 235,243 – Construction 459,489 2.54% 122,413 396,171 2.36% 106,836 – Mining 264,449 1.46% 16,216 236,199 1.41% 16,885 – Agriculture, forestry, farming, fishing 98,734 0.55% 23,377 88,754 0.53% 17,644 – Education 76,092 0.42% 17,486 72,721 0.43% 16,713 – Public management, social securities and social organisation 55,960 0.31% 425 55,905 0.33% 1,604 – Others 847,544 4.67% 237,979 746,102 4.44% 210,436
Total corporate loans and advances 10,211,006 56.39% 3,295,538 9,175,524 54.66% 3,022,002Personal loans and advances 7,612,428 42.04% 6,420,157 7,311,183 43.55% 6,104,175Discounted bills 241,305 1.33% – 259,061 1.54% –
Accrued interest 44,304 0.24% – 41,664 0.25% –
Total loans and advances to customers 18,109,043 100.00% 9,715,695 16,787,432 100.00% 9,126,177
As at 30 June 2021, no economic sector accounted for 10% or above of the Group’s total balance of loans and advances to customers.
The table below lists economic sectors accounting for 10% or above of the Group’s total balance of loans and advances to customers as at 31 December 2020, details of credit impaired (stage 3) loans, allowances for expected credit losses, charges, and amounts written off:
31 December 2020 2020
Stage 3 Gross loans
Allowances for expected credit lossesCharge for
the year
Written off during
the yearStage 1 Stage 2 Stage 3
Transportation, storage and postal services 37,695 (28,478) (14,023) (27,783) (14,829) 2,382
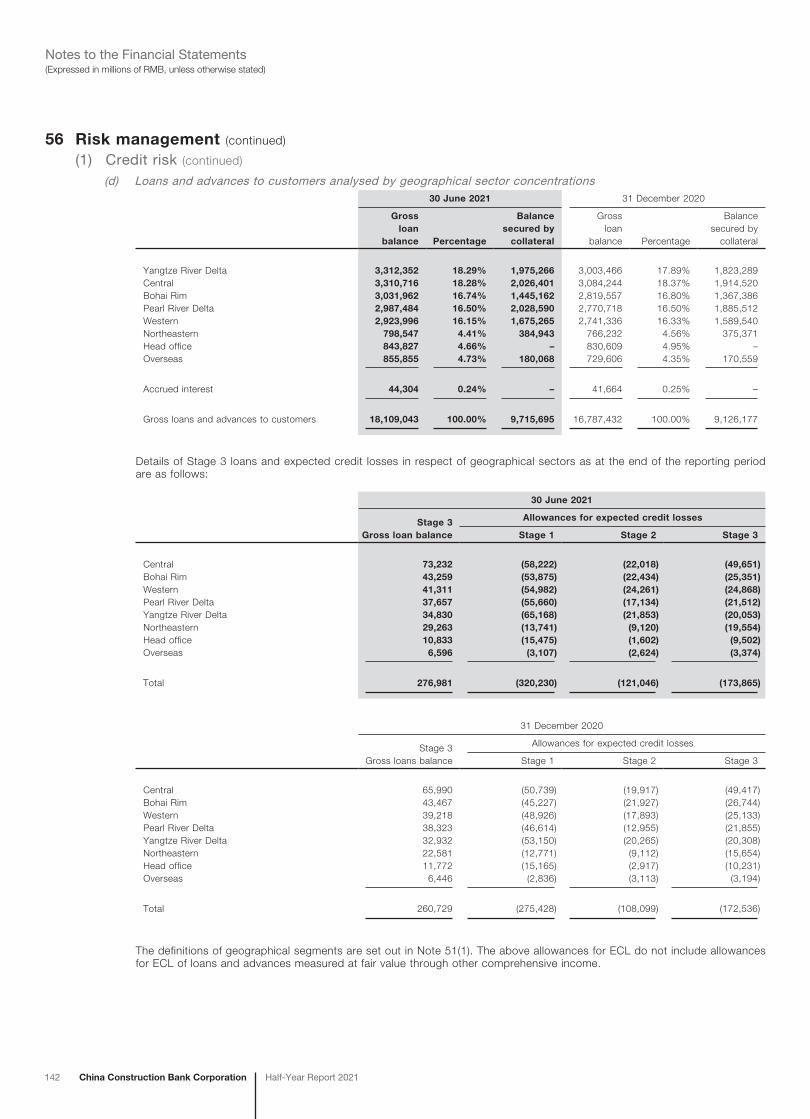
142 China Construction Bank Corporation Half-Year Report 2021
(Expressed in millions of RMB, unless otherwise stated)Notes to the Financial Statements
56 Risk management (continued)
(1) Credit risk (continued)
(d) Loans and advances to customers analysed by geographical sector concentrations30 June 2021 31 December 2020
Gross loan
balance Percentage
Balance secured by
collateral
Gross loan
balance Percentage
Balance secured by
collateral
Yangtze River Delta 3,312,352 18.29% 1,975,266 3,003,466 17.89% 1,823,289Central 3,310,716 18.28% 2,026,401 3,084,244 18.37% 1,914,520Bohai Rim 3,031,962 16.74% 1,445,162 2,819,557 16.80% 1,367,386Pearl River Delta 2,987,484 16.50% 2,028,590 2,770,718 16.50% 1,885,512Western 2,923,996 16.15% 1,675,265 2,741,336 16.33% 1,589,540Northeastern 798,547 4.41% 384,943 766,232 4.56% 375,371Head office 843,827 4.66% – 830,609 4.95% –Overseas 855,855 4.73% 180,068 729,606 4.35% 170,559
Accrued interest 44,304 0.24% – 41,664 0.25% –
Gross loans and advances to customers 18,109,043 100.00% 9,715,695 16,787,432 100.00% 9,126,177
Details of Stage 3 loans and expected credit losses in respect of geographical sectors as at the end of the reporting period are as follows:
30 June 2021
Stage 3 Gross loan balance
Allowances for expected credit losses
Stage 1 Stage 2 Stage 3
Central 73,232 (58,222) (22,018) (49,651)Bohai Rim 43,259 (53,875) (22,434) (25,351)Western 41,311 (54,982) (24,261) (24,868)Pearl River Delta 37,657 (55,660) (17,134) (21,512)Yangtze River Delta 34,830 (65,168) (21,853) (20,053)Northeastern 29,263 (13,741) (9,120) (19,554)Head office 10,833 (15,475) (1,602) (9,502)Overseas 6,596 (3,107) (2,624) (3,374)
Total 276,981 (320,230) (121,046) (173,865)
31 December 2020
Stage 3 Gross loans balance
Allowances for expected credit losses
Stage 1 Stage 2 Stage 3
Central 65,990 (50,739) (19,917) (49,417)Bohai Rim 43,467 (45,227) (21,927) (26,744)Western 39,218 (48,926) (17,893) (25,133)Pearl River Delta 38,323 (46,614) (12,955) (21,855)Yangtze River Delta 32,932 (53,150) (20,265) (20,308)Northeastern 22,581 (12,771) (9,112) (15,654)Head office 11,772 (15,165) (2,917) (10,231)Overseas 6,446 (2,836) (3,113) (3,194)
Total 260,729 (275,428) (108,099) (172,536)
The definitions of geographical segments are set out in Note 51(1). The above allowances for ECL do not include allowances for ECL of loans and advances measured at fair value through other comprehensive income.
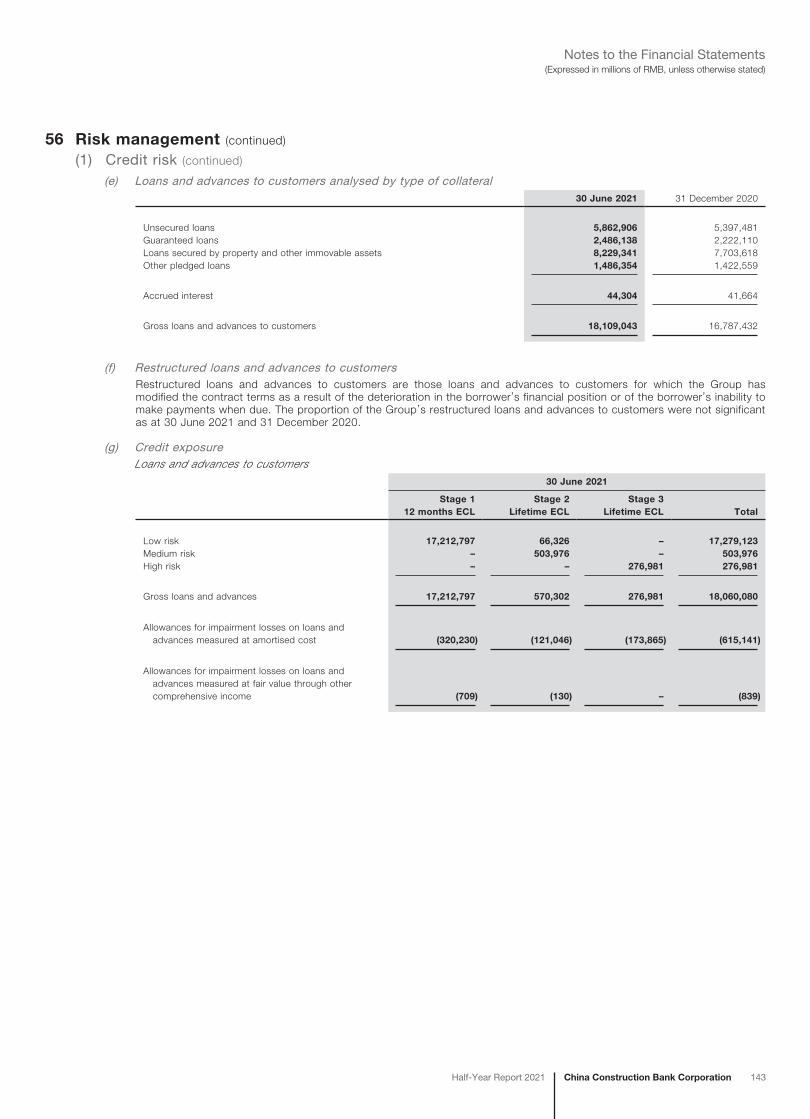
China Construction Bank CorporationHalf-Year Report 2021 143
(Expressed in millions of RMB, unless otherwise stated)Notes to the Financial Statements
56 Risk management (continued)
(1) Credit risk (continued)
(e) Loans and advances to customers analysed by type of collateral30 June 2021 31 December 2020
Unsecured loans 5,862,906 5,397,481Guaranteed loans 2,486,138 2,222,110Loans secured by property and other immovable assets 8,229,341 7,703,618Other pledged loans 1,486,354 1,422,559
Accrued interest 44,304 41,664
Gross loans and advances to customers 18,109,043 16,787,432
(f) Restructured loans and advances to customersRestructured loans and advances to customers are those loans and advances to customers for which the Group has modified the contract terms as a result of the deterioration in the borrower’s financial position or of the borrower’s inability to make payments when due. The proportion of the Group’s restructured loans and advances to customers were not significant as at 30 June 2021 and 31 December 2020.
(g) Credit exposureLoans and advances to customers
30 June 2021
Stage 1 12 months ECL
Stage 2 Lifetime ECL
Stage 3 Lifetime ECL Total
Low risk 17,212,797 66,326 – 17,279,123Medium risk – 503,976 – 503,976High risk – – 276,981 276,981
Gross loans and advances 17,212,797 570,302 276,981 18,060,080
Allowances for impairment losses on loans and advances measured at amortised cost (320,230) (121,046) (173,865) (615,141)
Allowances for impairment losses on loans and advances measured at fair value through other comprehensive income (709) (130) – (839)
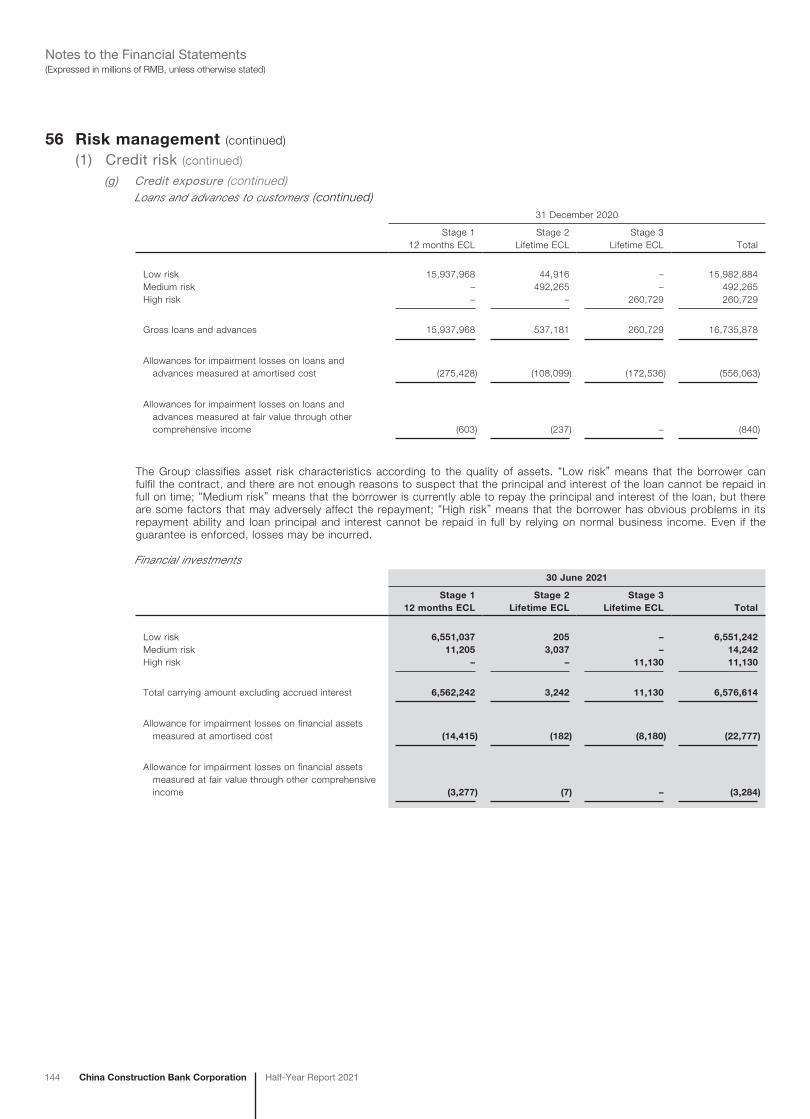
144 China Construction Bank Corporation Half-Year Report 2021
(Expressed in millions of RMB, unless otherwise stated)Notes to the Financial Statements
56 Risk management (continued)
(1) Credit risk (continued)
(g) Credit exposure (continued)Loans and advances to customers (continued)
31 December 2020
Stage 1 12 months ECL
Stage 2 Lifetime ECL
Stage 3 Lifetime ECL Total
Low risk 15,937,968 44,916 – 15,982,884Medium risk – 492,265 – 492,265High risk – – 260,729 260,729
Gross loans and advances 15,937,968 537,181 260,729 16,735,878
Allowances for impairment losses on loans and advances measured at amortised cost (275,428) (108,099) (172,536) (556,063)
Allowances for impairment losses on loans and advances measured at fair value through other comprehensive income (603) (237) – (840)
The Group classifies asset risk characteristics according to the quality of assets. “Low risk” means that the borrower can fulfil the contract, and there are not enough reasons to suspect that the principal and interest of the loan cannot be repaid in full on time; “Medium risk” means that the borrower is currently able to repay the principal and interest of the loan, but there are some factors that may adversely affect the repayment; “High risk” means that the borrower has obvious problems in its repayment ability and loan principal and interest cannot be repaid in full by relying on normal business income. Even if the guarantee is enforced, losses may be incurred.
Financial investments
30 June 2021
Stage 1 12 months ECL
Stage 2 Lifetime ECL
Stage 3 Lifetime ECL Total
Low risk 6,551,037 205 – 6,551,242Medium risk 11,205 3,037 – 14,242High risk – – 11,130 11,130
Total carrying amount excluding accrued interest 6,562,242 3,242 11,130 6,576,614
Allowance for impairment losses on financial assets measured at amortised cost (14,415) (182) (8,180) (22,777)
Allowance for impairment losses on financial assets measured at fair value through other comprehensive income (3,277) (7) – (3,284)
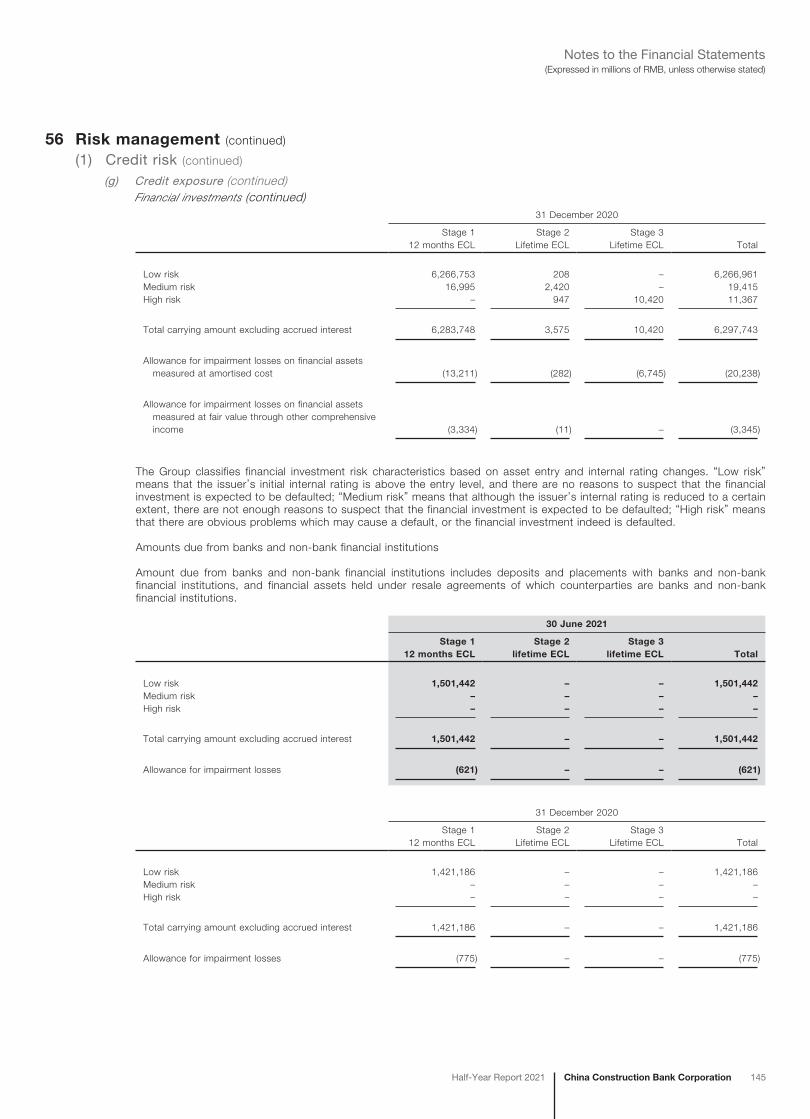
China Construction Bank CorporationHalf-Year Report 2021 145
(Expressed in millions of RMB, unless otherwise stated)Notes to the Financial Statements
56 Risk management (continued)
(1) Credit risk (continued)
(g) Credit exposure (continued)Financial investments (continued)
31 December 2020
Stage 1 12 months ECL
Stage 2 Lifetime ECL
Stage 3 Lifetime ECL Total
Low risk 6,266,753 208 – 6,266,961Medium risk 16,995 2,420 – 19,415High risk – 947 10,420 11,367
Total carrying amount excluding accrued interest 6,283,748 3,575 10,420 6,297,743
Allowance for impairment losses on financial assets measured at amortised cost (13,211) (282) (6,745) (20,238)
Allowance for impairment losses on financial assets measured at fair value through other comprehensive income (3,334) (11) – (3,345)
The Group classifies financial investment risk characteristics based on asset entry and internal rating changes. “Low risk” means that the issuer’s initial internal rating is above the entry level, and there are no reasons to suspect that the financial investment is expected to be defaulted; “Medium risk” means that although the issuer’s internal rating is reduced to a certain extent, there are not enough reasons to suspect that the financial investment is expected to be defaulted; “High risk” means that there are obvious problems which may cause a default, or the financial investment indeed is defaulted.
Amounts due from banks and non-bank financial institutions
Amount due from banks and non-bank financial institutions includes deposits and placements with banks and non-bank financial institutions, and financial assets held under resale agreements of which counterparties are banks and non-bank financial institutions.
30 June 2021
Stage 1 12 months ECL
Stage 2 lifetime ECL
Stage 3 lifetime ECL Total
Low risk 1,501,442 – – 1,501,442Medium risk – – – –High risk – – – –
Total carrying amount excluding accrued interest 1,501,442 – – 1,501,442
Allowance for impairment losses (621) – – (621)
31 December 2020
Stage 1 12 months ECL
Stage 2 Lifetime ECL
Stage 3 Lifetime ECL Total
Low risk 1,421,186 – – 1,421,186Medium risk – – – –High risk – – – –
Total carrying amount excluding accrued interest 1,421,186 – – 1,421,186
Allowance for impairment losses (775) – – (775)
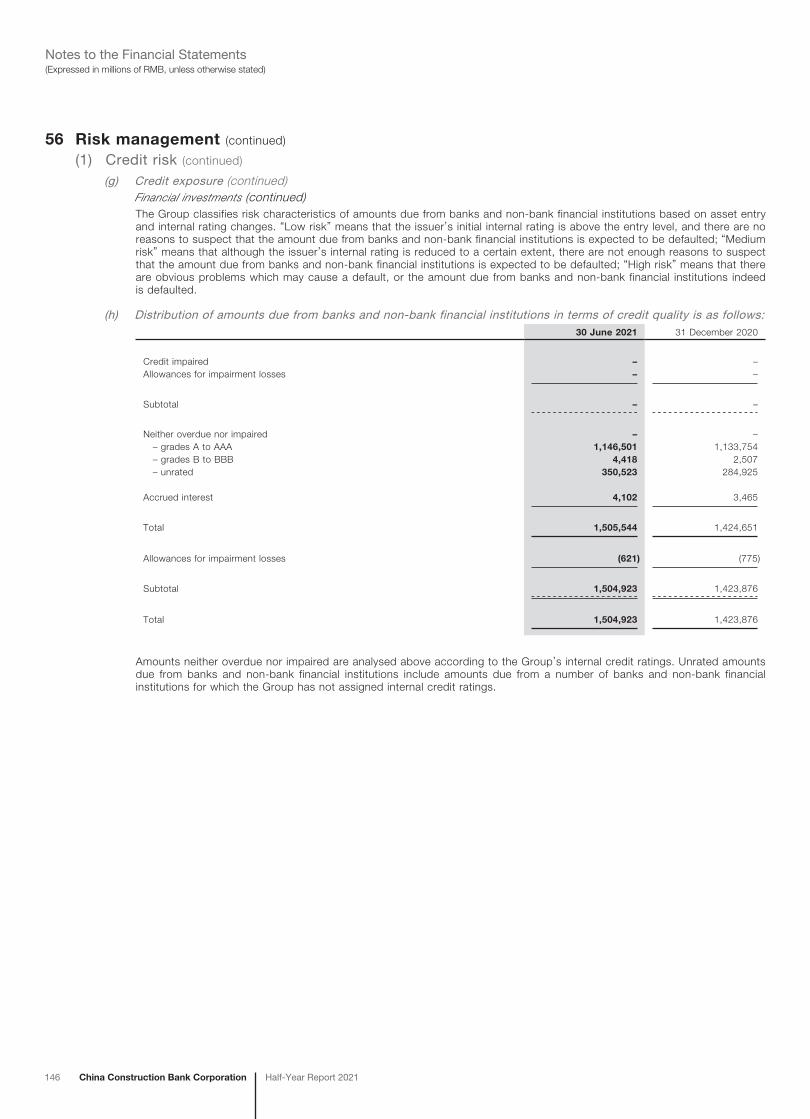
146 China Construction Bank Corporation Half-Year Report 2021
(Expressed in millions of RMB, unless otherwise stated)Notes to the Financial Statements
56 Risk management (continued)
(1) Credit risk (continued)
(g) Credit exposure (continued)Financial investments (continued)The Group classifies risk characteristics of amounts due from banks and non-bank financial institutions based on asset entry and internal rating changes. “Low risk” means that the issuer’s initial internal rating is above the entry level, and there are no reasons to suspect that the amount due from banks and non-bank financial institutions is expected to be defaulted; “Medium risk” means that although the issuer’s internal rating is reduced to a certain extent, there are not enough reasons to suspect that the amount due from banks and non-bank financial institutions is expected to be defaulted; “High risk” means that there are obvious problems which may cause a default, or the amount due from banks and non-bank financial institutions indeed is defaulted.
(h) Distribution of amounts due from banks and non-bank financial institutions in terms of credit quality is as follows:30 June 2021 31 December 2020
Credit impaired – –Allowances for impairment losses – –
Subtotal – –
Neither overdue nor impaired – – – grades A to AAA 1,146,501 1,133,754 – grades B to BBB 4,418 2,507 – unrated 350,523 284,925
Accrued interest 4,102 3,465
Total 1,505,544 1,424,651
Allowances for impairment losses (621) (775)
Subtotal 1,504,923 1,423,876
Total 1,504,923 1,423,876
Amounts neither overdue nor impaired are analysed above according to the Group’s internal credit ratings. Unrated amounts due from banks and non-bank financial institutions include amounts due from a number of banks and non-bank financial institutions for which the Group has not assigned internal credit ratings.
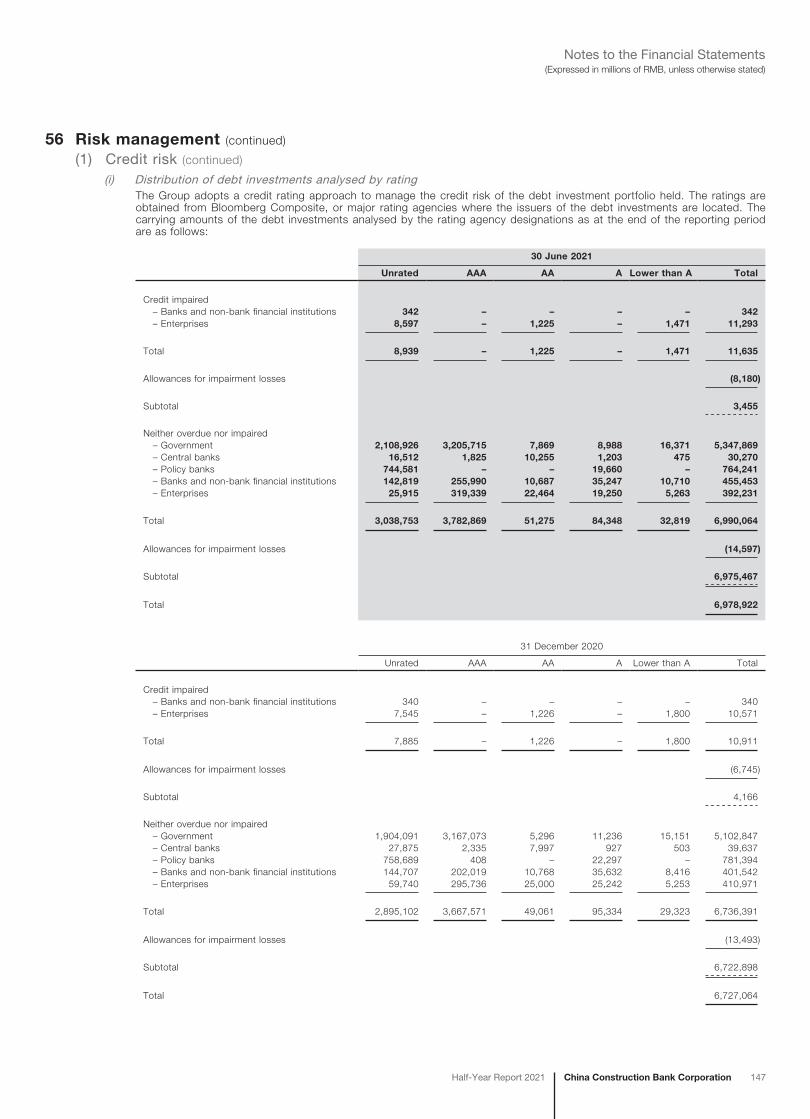
China Construction Bank CorporationHalf-Year Report 2021 147
(Expressed in millions of RMB, unless otherwise stated)Notes to the Financial Statements
56 Risk management (continued)
(1) Credit risk (continued)
(i) Distribution of debt investments analysed by ratingThe Group adopts a credit rating approach to manage the credit risk of the debt investment portfolio held. The ratings are obtained from Bloomberg Composite, or major rating agencies where the issuers of the debt investments are located. The carrying amounts of the debt investments analysed by the rating agency designations as at the end of the reporting period are as follows:
30 June 2021
Unrated AAA AA A Lower than A Total
Credit impaired – Banks and non-bank financial institutions 342 – – – – 342 – Enterprises 8,597 – 1,225 – 1,471 11,293
Total 8,939 – 1,225 – 1,471 11,635
Allowances for impairment losses (8,180)
Subtotal 3,455
Neither overdue nor impaired – Government 2,108,926 3,205,715 7,869 8,988 16,371 5,347,869 – Central banks 16,512 1,825 10,255 1,203 475 30,270 – Policy banks 744,581 – – 19,660 – 764,241 – Banks and non-bank financial institutions 142,819 255,990 10,687 35,247 10,710 455,453 – Enterprises 25,915 319,339 22,464 19,250 5,263 392,231
Total 3,038,753 3,782,869 51,275 84,348 32,819 6,990,064
Allowances for impairment losses (14,597)
Subtotal 6,975,467
Total 6,978,922
31 December 2020
Unrated AAA AA A Lower than A Total
Credit impaired – Banks and non-bank financial institutions 340 – – – – 340 – Enterprises 7,545 – 1,226 – 1,800 10,571
Total 7,885 – 1,226 – 1,800 10,911
Allowances for impairment losses (6,745)
Subtotal 4,166
Neither overdue nor impaired – Government 1,904,091 3,167,073 5,296 11,236 15,151 5,102,847 – Central banks 27,875 2,335 7,997 927 503 39,637 – Policy banks 758,689 408 – 22,297 – 781,394 – Banks and non-bank financial institutions 144,707 202,019 10,768 35,632 8,416 401,542 – Enterprises 59,740 295,736 25,000 25,242 5,253 410,971
Total 2,895,102 3,667,571 49,061 95,334 29,323 6,736,391
Allowances for impairment losses (13,493)
Subtotal 6,722,898
Total 6,727,064
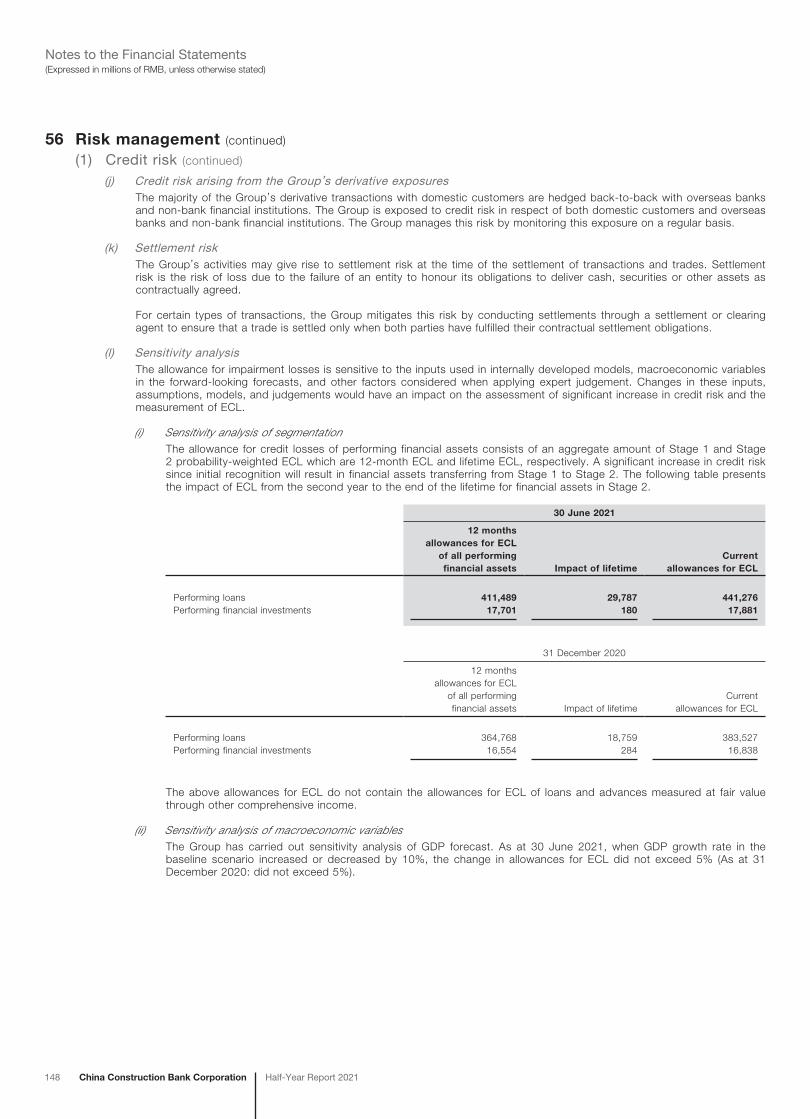
148 China Construction Bank Corporation Half-Year Report 2021
(Expressed in millions of RMB, unless otherwise stated)Notes to the Financial Statements
56 Risk management (continued)
(1) Credit risk (continued)
(j) Credit risk arising from the Group’s derivative exposuresThe majority of the Group’s derivative transactions with domestic customers are hedged back-to-back with overseas banks and non-bank financial institutions. The Group is exposed to credit risk in respect of both domestic customers and overseas banks and non-bank financial institutions. The Group manages this risk by monitoring this exposure on a regular basis.
(k) Settlement riskThe Group’s activities may give rise to settlement risk at the time of the settlement of transactions and trades. Settlement risk is the risk of loss due to the failure of an entity to honour its obligations to deliver cash, securities or other assets as contractually agreed.
For certain types of transactions, the Group mitigates this risk by conducting settlements through a settlement or clearing agent to ensure that a trade is settled only when both parties have fulfilled their contractual settlement obligations.
(l) Sensitivity analysisThe allowance for impairment losses is sensitive to the inputs used in internally developed models, macroeconomic variables in the forward-looking forecasts, and other factors considered when applying expert judgement. Changes in these inputs, assumptions, models, and judgements would have an impact on the assessment of significant increase in credit risk and the measurement of ECL.
(i) Sensitivity analysis of segmentationThe allowance for credit losses of performing financial assets consists of an aggregate amount of Stage 1 and Stage 2 probability-weighted ECL which are 12-month ECL and lifetime ECL, respectively. A significant increase in credit risk since initial recognition will result in financial assets transferring from Stage 1 to Stage 2. The following table presents the impact of ECL from the second year to the end of the lifetime for financial assets in Stage 2.
30 June 2021
12 months allowances for ECL
of all performing financial assets Impact of lifetime
Current allowances for ECL
Performing loans 411,489 29,787 441,276Performing financial investments 17,701 180 17,881
31 December 2020
12 months allowances for ECL
of all performing financial assets Impact of lifetime
Current allowances for ECL
Performing loans 364,768 18,759 383,527Performing financial investments 16,554 284 16,838
The above allowances for ECL do not contain the allowances for ECL of loans and advances measured at fair value through other comprehensive income.
(ii) Sensitivity analysis of macroeconomic variablesThe Group has carried out sensitivity analysis of GDP forecast. As at 30 June 2021, when GDP growth rate in the baseline scenario increased or decreased by 10%, the change in allowances for ECL did not exceed 5% (As at 31 December 2020: did not exceed 5%).
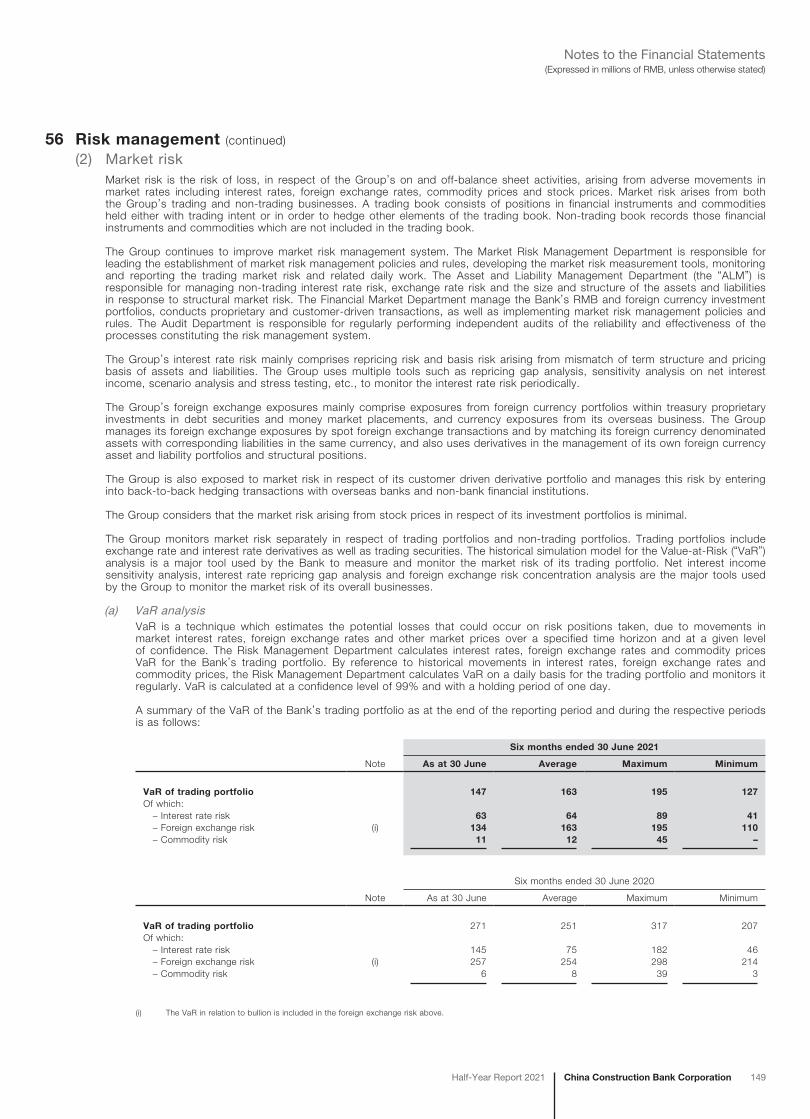
China Construction Bank CorporationHalf-Year Report 2021 149
(Expressed in millions of RMB, unless otherwise stated)Notes to the Financial Statements
56 Risk management (continued)
(2) Market riskMarket risk is the risk of loss, in respect of the Group’s on and off-balance sheet activities, arising from adverse movements in market rates including interest rates, foreign exchange rates, commodity prices and stock prices. Market risk arises from both the Group’s trading and non-trading businesses. A trading book consists of positions in financial instruments and commodities held either with trading intent or in order to hedge other elements of the trading book. Non-trading book records those financial instruments and commodities which are not included in the trading book.
The Group continues to improve market risk management system. The Market Risk Management Department is responsible for leading the establishment of market risk management policies and rules, developing the market risk measurement tools, monitoring and reporting the trading market risk and related daily work. The Asset and Liability Management Department (the “ALM”) is responsible for managing non-trading interest rate risk, exchange rate risk and the size and structure of the assets and liabilities in response to structural market risk. The Financial Market Department manage the Bank’s RMB and foreign currency investment portfolios, conducts proprietary and customer-driven transactions, as well as implementing market risk management policies and rules. The Audit Department is responsible for regularly performing independent audits of the reliability and effectiveness of the processes constituting the risk management system.
The Group’s interest rate risk mainly comprises repricing risk and basis risk arising from mismatch of term structure and pricing basis of assets and liabilities. The Group uses multiple tools such as repricing gap analysis, sensitivity analysis on net interest income, scenario analysis and stress testing, etc., to monitor the interest rate risk periodically.
The Group’s foreign exchange exposures mainly comprise exposures from foreign currency portfolios within treasury proprietary investments in debt securities and money market placements, and currency exposures from its overseas business. The Group manages its foreign exchange exposures by spot foreign exchange transactions and by matching its foreign currency denominated assets with corresponding liabilities in the same currency, and also uses derivatives in the management of its own foreign currency asset and liability portfolios and structural positions.
The Group is also exposed to market risk in respect of its customer driven derivative portfolio and manages this risk by entering into back-to-back hedging transactions with overseas banks and non-bank financial institutions.
The Group considers that the market risk arising from stock prices in respect of its investment portfolios is minimal.
The Group monitors market risk separately in respect of trading portfolios and non-trading portfolios. Trading portfolios include exchange rate and interest rate derivatives as well as trading securities. The historical simulation model for the Value-at-Risk (“VaR”) analysis is a major tool used by the Bank to measure and monitor the market risk of its trading portfolio. Net interest income sensitivity analysis, interest rate repricing gap analysis and foreign exchange risk concentration analysis are the major tools used by the Group to monitor the market risk of its overall businesses.
(a) VaR analysisVaR is a technique which estimates the potential losses that could occur on risk positions taken, due to movements in market interest rates, foreign exchange rates and other market prices over a specified time horizon and at a given level of confidence. The Risk Management Department calculates interest rates, foreign exchange rates and commodity prices VaR for the Bank’s trading portfolio. By reference to historical movements in interest rates, foreign exchange rates and commodity prices, the Risk Management Department calculates VaR on a daily basis for the trading portfolio and monitors it regularly. VaR is calculated at a confidence level of 99% and with a holding period of one day.
A summary of the VaR of the Bank’s trading portfolio as at the end of the reporting period and during the respective periods is as follows:
Six months ended 30 June 2021
Note As at 30 June Average Maximum Minimum
VaR of trading portfolio 147 163 195 127Of which: – Interest rate risk 63 64 89 41 – Foreign exchange risk (i) 134 163 195 110 – Commodity risk 11 12 45 –
Six months ended 30 June 2020
Note As at 30 June Average Maximum Minimum
VaR of trading portfolio 271 251 317 207Of which: – Interest rate risk 145 75 182 46 – Foreign exchange risk (i) 257 254 298 214 – Commodity risk 6 8 39 3
(i) The VaR in relation to bullion is included in the foreign exchange risk above.
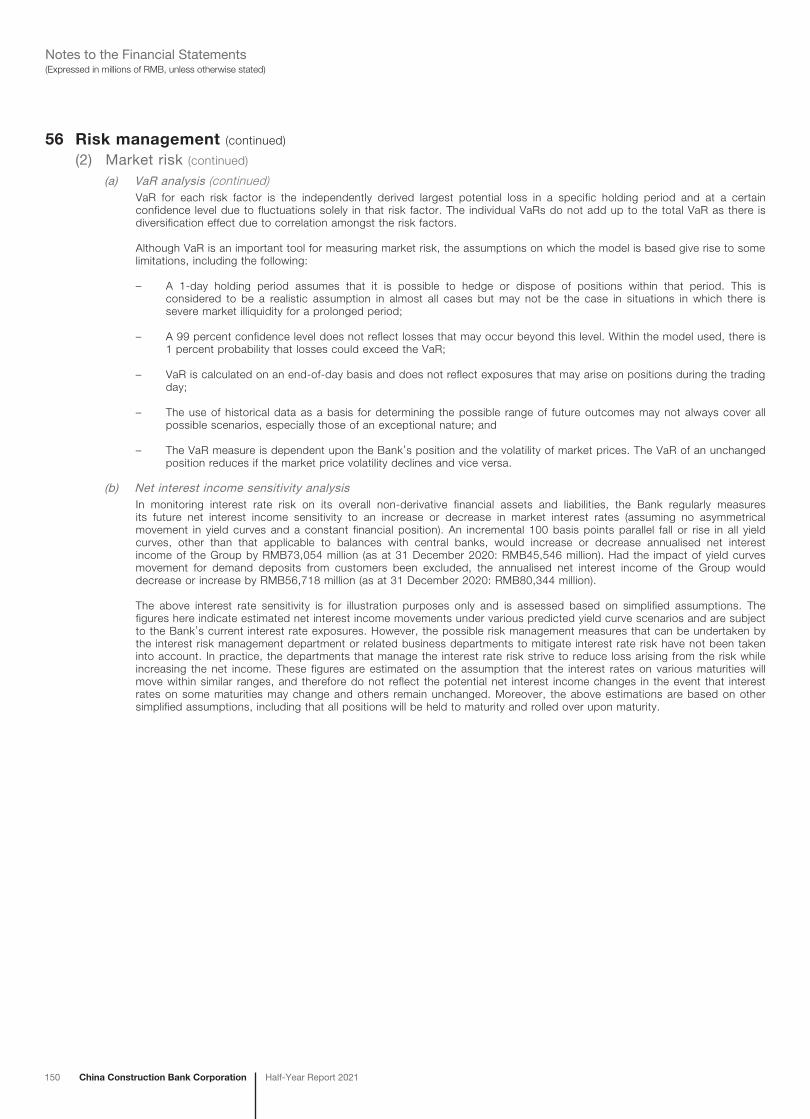
150 China Construction Bank Corporation Half-Year Report 2021
(Expressed in millions of RMB, unless otherwise stated)Notes to the Financial Statements
56 Risk management (continued)
(2) Market risk (continued)
(a) VaR analysis (continued)VaR for each risk factor is the independently derived largest potential loss in a specific holding period and at a certain confidence level due to fluctuations solely in that risk factor. The individual VaRs do not add up to the total VaR as there is diversification effect due to correlation amongst the risk factors.
Although VaR is an important tool for measuring market risk, the assumptions on which the model is based give rise to some limitations, including the following:
– A 1-day holding period assumes that it is possible to hedge or dispose of positions within that period. This is considered to be a realistic assumption in almost all cases but may not be the case in situations in which there is severe market illiquidity for a prolonged period;
– A 99 percent confidence level does not reflect losses that may occur beyond this level. Within the model used, there is 1 percent probability that losses could exceed the VaR;
– VaR is calculated on an end-of-day basis and does not reflect exposures that may arise on positions during the trading day;
– The use of historical data as a basis for determining the possible range of future outcomes may not always cover all possible scenarios, especially those of an exceptional nature; and
– The VaR measure is dependent upon the Bank’s position and the volatility of market prices. The VaR of an unchanged position reduces if the market price volatility declines and vice versa.
(b) Net interest income sensitivity analysisIn monitoring interest rate risk on its overall non-derivative financial assets and liabilities, the Bank regularly measures its future net interest income sensitivity to an increase or decrease in market interest rates (assuming no asymmetrical movement in yield curves and a constant financial position). An incremental 100 basis points parallel fall or rise in all yield curves, other than that applicable to balances with central banks, would increase or decrease annualised net interest income of the Group by RMB73,054 million (as at 31 December 2020: RMB45,546 million). Had the impact of yield curves movement for demand deposits from customers been excluded, the annualised net interest income of the Group would decrease or increase by RMB56,718 million (as at 31 December 2020: RMB80,344 million).
The above interest rate sensitivity is for illustration purposes only and is assessed based on simplified assumptions. The figures here indicate estimated net interest income movements under various predicted yield curve scenarios and are subject to the Bank’s current interest rate exposures. However, the possible risk management measures that can be undertaken by the interest risk management department or related business departments to mitigate interest rate risk have not been taken into account. In practice, the departments that manage the interest rate risk strive to reduce loss arising from the risk while increasing the net income. These figures are estimated on the assumption that the interest rates on various maturities will move within similar ranges, and therefore do not reflect the potential net interest income changes in the event that interest rates on some maturities may change and others remain unchanged. Moreover, the above estimations are based on other simplified assumptions, including that all positions will be held to maturity and rolled over upon maturity.
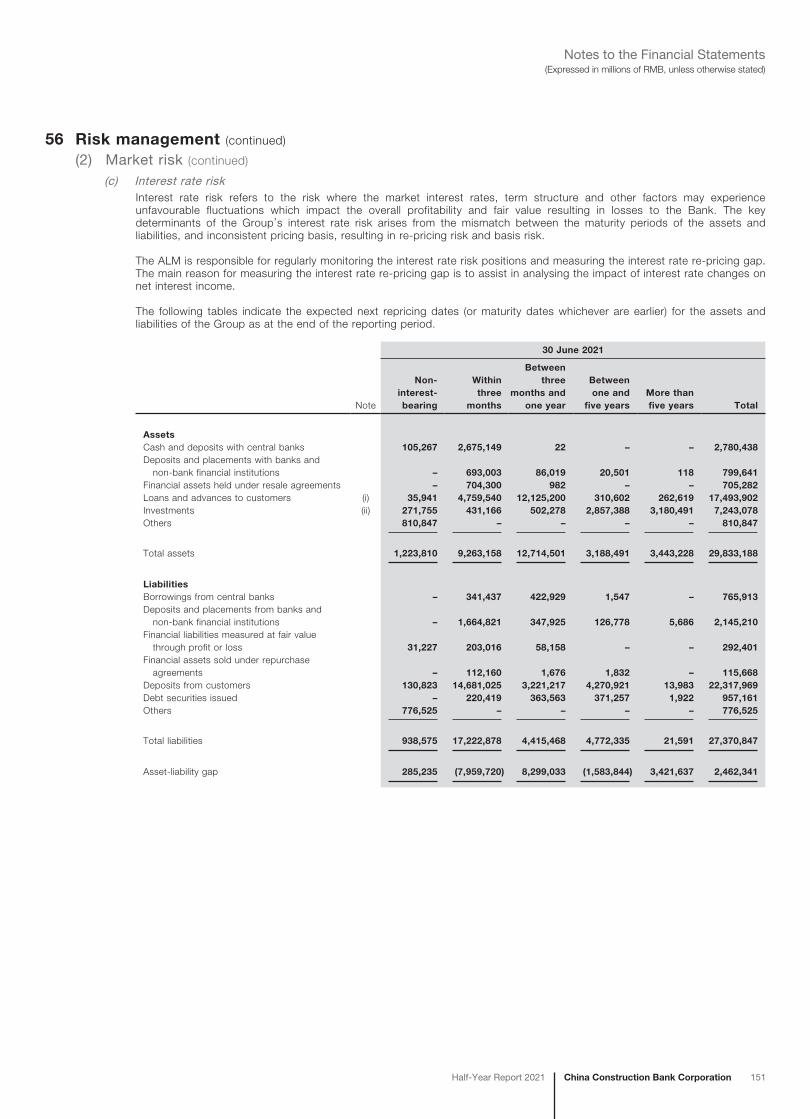
China Construction Bank CorporationHalf-Year Report 2021 151
(Expressed in millions of RMB, unless otherwise stated)Notes to the Financial Statements
56 Risk management (continued)
(2) Market risk (continued)
(c) Interest rate riskInterest rate risk refers to the risk where the market interest rates, term structure and other factors may experience unfavourable fluctuations which impact the overall profitability and fair value resulting in losses to the Bank. The key determinants of the Group’s interest rate risk arises from the mismatch between the maturity periods of the assets and liabilities, and inconsistent pricing basis, resulting in re-pricing risk and basis risk.
The ALM is responsible for regularly monitoring the interest rate risk positions and measuring the interest rate re-pricing gap. The main reason for measuring the interest rate re-pricing gap is to assist in analysing the impact of interest rate changes on net interest income.
The following tables indicate the expected next repricing dates (or maturity dates whichever are earlier) for the assets and liabilities of the Group as at the end of the reporting period.
30 June 2021
Note
Non-interest-bearing
Within three
months
Between three
months and one year
Between one and
five yearsMore than five years Total
AssetsCash and deposits with central banks 105,267 2,675,149 22 – – 2,780,438Deposits and placements with banks and non-bank financial institutions – 693,003 86,019 20,501 118 799,641Financial assets held under resale agreements – 704,300 982 – – 705,282Loans and advances to customers (i) 35,941 4,759,540 12,125,200 310,602 262,619 17,493,902Investments (ii) 271,755 431,166 502,278 2,857,388 3,180,491 7,243,078Others 810,847 – – – – 810,847
Total assets 1,223,810 9,263,158 12,714,501 3,188,491 3,443,228 29,833,188
LiabilitiesBorrowings from central banks – 341,437 422,929 1,547 – 765,913Deposits and placements from banks and non-bank financial institutions – 1,664,821 347,925 126,778 5,686 2,145,210Financial liabilities measured at fair value through profit or loss 31,227 203,016 58,158 – – 292,401Financial assets sold under repurchase agreements – 112,160 1,676 1,832 – 115,668Deposits from customers 130,823 14,681,025 3,221,217 4,270,921 13,983 22,317,969Debt securities issued – 220,419 363,563 371,257 1,922 957,161Others 776,525 – – – – 776,525
Total liabilities 938,575 17,222,878 4,415,468 4,772,335 21,591 27,370,847
Asset-liability gap 285,235 (7,959,720) 8,299,033 (1,583,844) 3,421,637 2,462,341
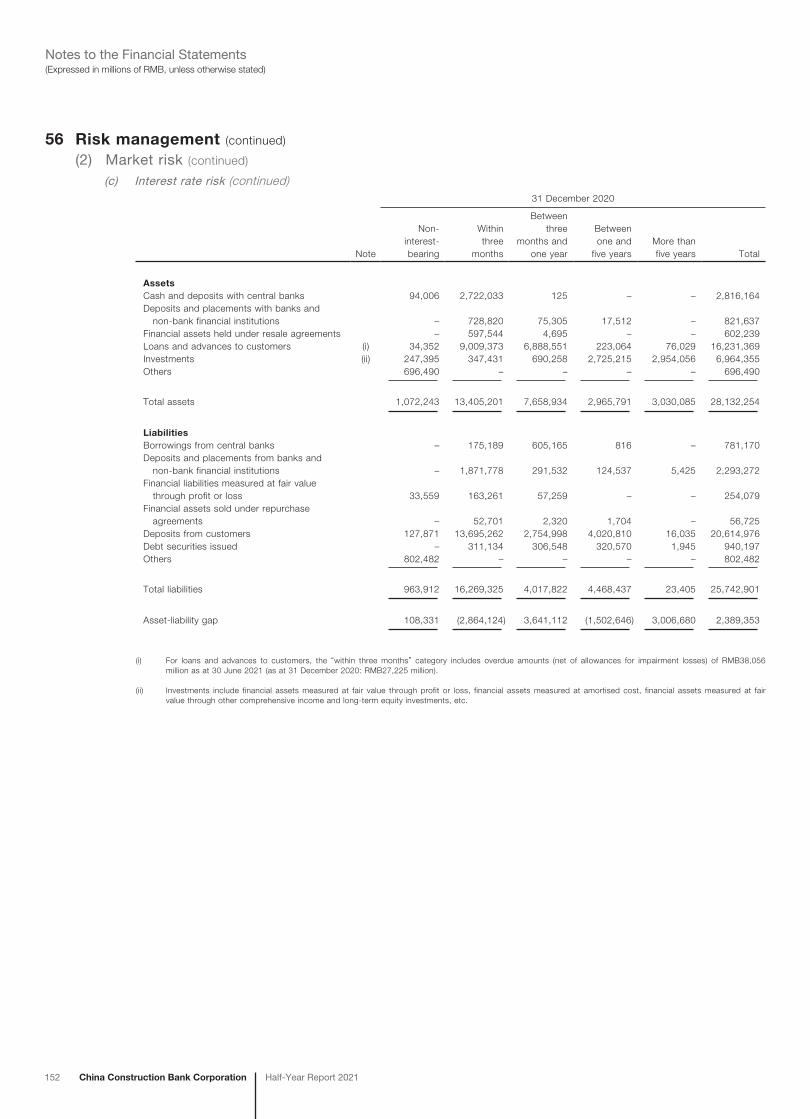
152 China Construction Bank Corporation Half-Year Report 2021
(Expressed in millions of RMB, unless otherwise stated)Notes to the Financial Statements
56 Risk management (continued)
(2) Market risk (continued)
(c) Interest rate risk (continued)31 December 2020
Note
Non-interest-bearing
Within three
months
Between three
months and one year
Between one and
five yearsMore than five years Total
AssetsCash and deposits with central banks 94,006 2,722,033 125 – – 2,816,164Deposits and placements with banks and non-bank financial institutions – 728,820 75,305 17,512 – 821,637Financial assets held under resale agreements – 597,544 4,695 – – 602,239Loans and advances to customers (i) 34,352 9,009,373 6,888,551 223,064 76,029 16,231,369Investments (ii) 247,395 347,431 690,258 2,725,215 2,954,056 6,964,355Others 696,490 – – – – 696,490
Total assets 1,072,243 13,405,201 7,658,934 2,965,791 3,030,085 28,132,254
LiabilitiesBorrowings from central banks – 175,189 605,165 816 – 781,170Deposits and placements from banks and non-bank financial institutions – 1,871,778 291,532 124,537 5,425 2,293,272Financial liabilities measured at fair value through profit or loss 33,559 163,261 57,259 – – 254,079Financial assets sold under repurchase agreements – 52,701 2,320 1,704 – 56,725Deposits from customers 127,871 13,695,262 2,754,998 4,020,810 16,035 20,614,976Debt securities issued – 311,134 306,548 320,570 1,945 940,197Others 802,482 – – – – 802,482
Total liabilities 963,912 16,269,325 4,017,822 4,468,437 23,405 25,742,901
Asset-liability gap 108,331 (2,864,124) 3,641,112 (1,502,646) 3,006,680 2,389,353
(i) For loans and advances to customers, the “within three months” category includes overdue amounts (net of allowances for impairment losses) of RMB38,056 million as at 30 June 2021 (as at 31 December 2020: RMB27,225 million).
(ii) Investments include financial assets measured at fair value through profit or loss, financial assets measured at amortised cost, financial assets measured at fair value through other comprehensive income and long-term equity investments, etc.
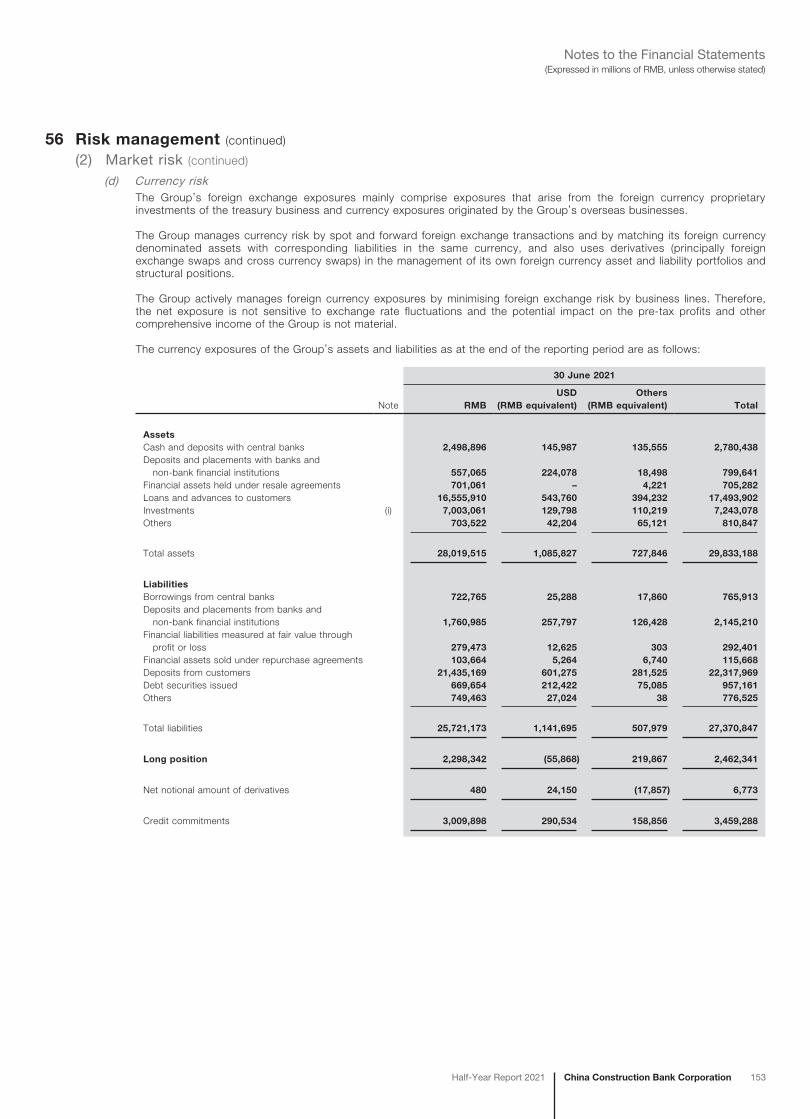
China Construction Bank CorporationHalf-Year Report 2021 153
(Expressed in millions of RMB, unless otherwise stated)Notes to the Financial Statements
56 Risk management (continued)
(2) Market risk (continued)
(d) Currency riskThe Group’s foreign exchange exposures mainly comprise exposures that arise from the foreign currency proprietary investments of the treasury business and currency exposures originated by the Group’s overseas businesses.
The Group manages currency risk by spot and forward foreign exchange transactions and by matching its foreign currency denominated assets with corresponding liabilities in the same currency, and also uses derivatives (principally foreign exchange swaps and cross currency swaps) in the management of its own foreign currency asset and liability portfolios and structural positions.
The Group actively manages foreign currency exposures by minimising foreign exchange risk by business lines. Therefore, the net exposure is not sensitive to exchange rate fluctuations and the potential impact on the pre-tax profits and other comprehensive income of the Group is not material.
The currency exposures of the Group’s assets and liabilities as at the end of the reporting period are as follows:
30 June 2021
Note RMBUSD
(RMB equivalent)Others
(RMB equivalent) Total
AssetsCash and deposits with central banks 2,498,896 145,987 135,555 2,780,438Deposits and placements with banks and non-bank financial institutions 557,065 224,078 18,498 799,641Financial assets held under resale agreements 701,061 – 4,221 705,282Loans and advances to customers 16,555,910 543,760 394,232 17,493,902Investments (i) 7,003,061 129,798 110,219 7,243,078Others 703,522 42,204 65,121 810,847
Total assets 28,019,515 1,085,827 727,846 29,833,188
LiabilitiesBorrowings from central banks 722,765 25,288 17,860 765,913Deposits and placements from banks and non-bank financial institutions 1,760,985 257,797 126,428 2,145,210Financial liabilities measured at fair value through profit or loss 279,473 12,625 303 292,401Financial assets sold under repurchase agreements 103,664 5,264 6,740 115,668Deposits from customers 21,435,169 601,275 281,525 22,317,969Debt securities issued 669,654 212,422 75,085 957,161Others 749,463 27,024 38 776,525
Total liabilities 25,721,173 1,141,695 507,979 27,370,847
Long position 2,298,342 (55,868) 219,867 2,462,341
Net notional amount of derivatives 480 24,150 (17,857) 6,773
Credit commitments 3,009,898 290,534 158,856 3,459,288
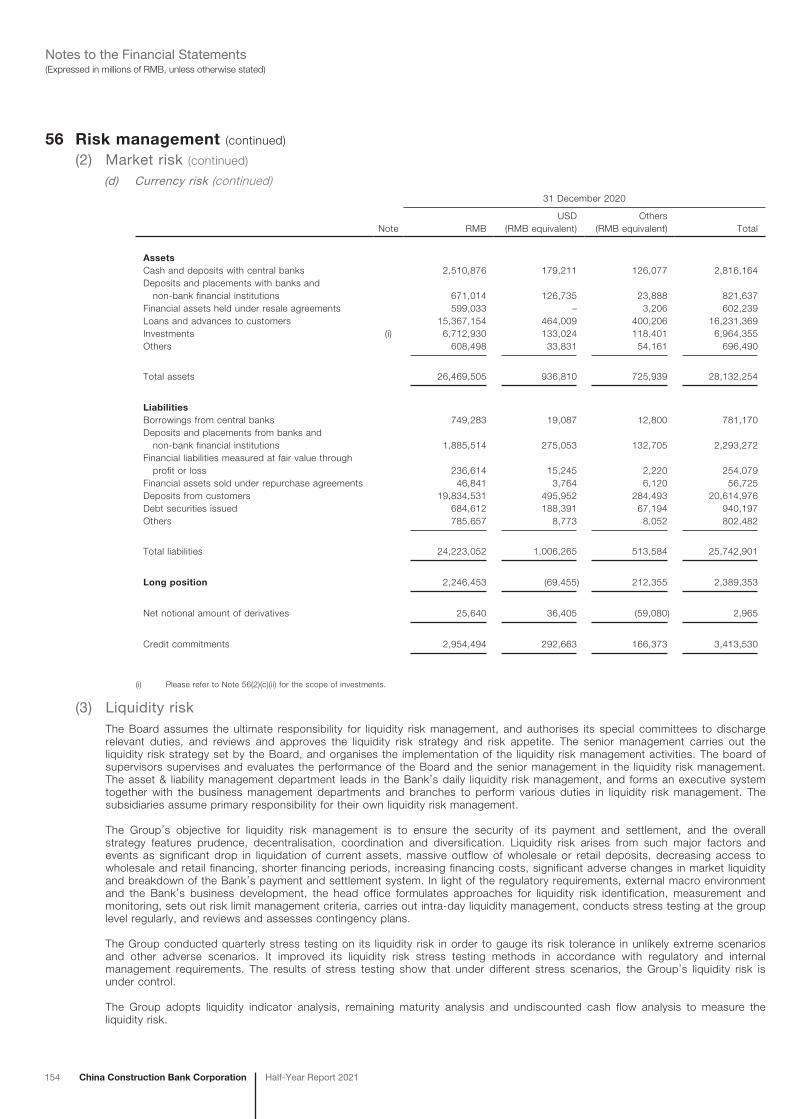
154 China Construction Bank Corporation Half-Year Report 2021
(Expressed in millions of RMB, unless otherwise stated)Notes to the Financial Statements
56 Risk management (continued)
(2) Market risk (continued)
(d) Currency risk (continued)31 December 2020
Note RMBUSD
(RMB equivalent)Others
(RMB equivalent) Total
AssetsCash and deposits with central banks 2,510,876 179,211 126,077 2,816,164Deposits and placements with banks and non-bank financial institutions 671,014 126,735 23,888 821,637Financial assets held under resale agreements 599,033 – 3,206 602,239Loans and advances to customers 15,367,154 464,009 400,206 16,231,369Investments (i) 6,712,930 133,024 118,401 6,964,355Others 608,498 33,831 54,161 696,490
Total assets 26,469,505 936,810 725,939 28,132,254
LiabilitiesBorrowings from central banks 749,283 19,087 12,800 781,170Deposits and placements from banks and non-bank financial institutions 1,885,514 275,053 132,705 2,293,272Financial liabilities measured at fair value through profit or loss 236,614 15,245 2,220 254,079Financial assets sold under repurchase agreements 46,841 3,764 6,120 56,725Deposits from customers 19,834,531 495,952 284,493 20,614,976Debt securities issued 684,612 188,391 67,194 940,197Others 785,657 8,773 8,052 802,482
Total liabilities 24,223,052 1,006,265 513,584 25,742,901
Long position 2,246,453 (69,455) 212,355 2,389,353
Net notional amount of derivatives 25,640 36,405 (59,080) 2,965
Credit commitments 2,954,494 292,663 166,373 3,413,530
(i) Please refer to Note 56(2)(c)(ii) for the scope of investments.
(3) Liquidity riskThe Board assumes the ultimate responsibility for liquidity risk management, and authorises its special committees to discharge relevant duties, and reviews and approves the liquidity risk strategy and risk appetite. The senior management carries out the liquidity risk strategy set by the Board, and organises the implementation of the liquidity risk management activities. The board of supervisors supervises and evaluates the performance of the Board and the senior management in the liquidity risk management. The asset & liability management department leads in the Bank’s daily liquidity risk management, and forms an executive system together with the business management departments and branches to perform various duties in liquidity risk management. The subsidiaries assume primary responsibility for their own liquidity risk management.
The Group’s objective for liquidity risk management is to ensure the security of its payment and settlement, and the overall strategy features prudence, decentralisation, coordination and diversification. Liquidity risk arises from such major factors and events as significant drop in liquidation of current assets, massive outflow of wholesale or retail deposits, decreasing access to wholesale and retail financing, shorter financing periods, increasing financing costs, significant adverse changes in market liquidity and breakdown of the Bank’s payment and settlement system. In light of the regulatory requirements, external macro environment and the Bank’s business development, the head office formulates approaches for liquidity risk identification, measurement and monitoring, sets out risk limit management criteria, carries out intra-day liquidity management, conducts stress testing at the group level regularly, and reviews and assesses contingency plans.
The Group conducted quarterly stress testing on its liquidity risk in order to gauge its risk tolerance in unlikely extreme scenarios and other adverse scenarios. It improved its liquidity risk stress testing methods in accordance with regulatory and internal management requirements. The results of stress testing show that under different stress scenarios, the Group’s liquidity risk is under control.
The Group adopts liquidity indicator analysis, remaining maturity analysis and undiscounted cash flow analysis to measure the liquidity risk.
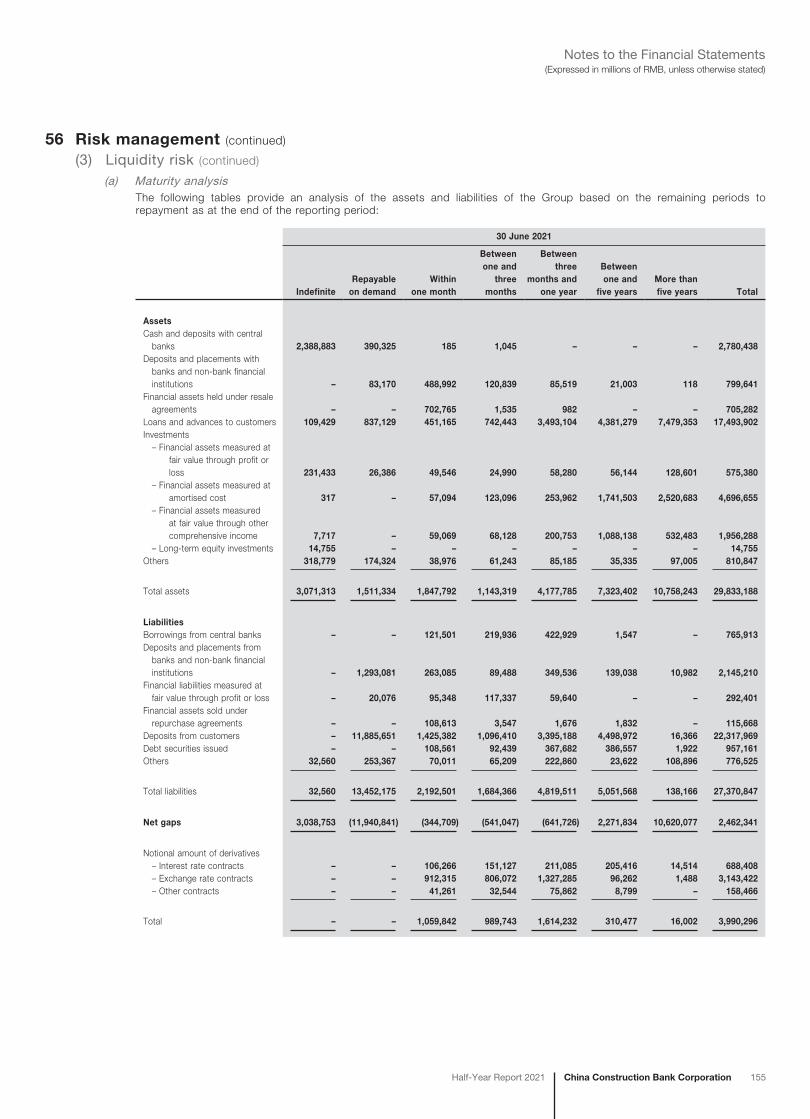
China Construction Bank CorporationHalf-Year Report 2021 155
(Expressed in millions of RMB, unless otherwise stated)Notes to the Financial Statements
56 Risk management (continued)
(3) Liquidity risk (continued)
(a) Maturity analysisThe following tables provide an analysis of the assets and liabilities of the Group based on the remaining periods to repayment as at the end of the reporting period:
30 June 2021
IndefiniteRepayable
on demandWithin
one month
Between one and
three months
Between three
months and one year
Between one and
five yearsMore than five years Total
AssetsCash and deposits with central banks 2,388,883 390,325 185 1,045 – – – 2,780,438Deposits and placements with banks and non-bank financial institutions – 83,170 488,992 120,839 85,519 21,003 118 799,641Financial assets held under resale agreements – – 702,765 1,535 982 – – 705,282Loans and advances to customers 109,429 837,129 451,165 742,443 3,493,104 4,381,279 7,479,353 17,493,902Investments – Financial assets measured at fair value through profit or loss 231,433 26,386 49,546 24,990 58,280 56,144 128,601 575,380 – Financial assets measured at amortised cost 317 – 57,094 123,096 253,962 1,741,503 2,520,683 4,696,655 – Financial assets measured at fair value through other comprehensive income 7,717 – 59,069 68,128 200,753 1,088,138 532,483 1,956,288 – Long-term equity investments 14,755 – – – – – – 14,755Others 318,779 174,324 38,976 61,243 85,185 35,335 97,005 810,847
Total assets 3,071,313 1,511,334 1,847,792 1,143,319 4,177,785 7,323,402 10,758,243 29,833,188
LiabilitiesBorrowings from central banks – – 121,501 219,936 422,929 1,547 – 765,913Deposits and placements from banks and non-bank financial institutions – 1,293,081 263,085 89,488 349,536 139,038 10,982 2,145,210Financial liabilities measured at fair value through profit or loss – 20,076 95,348 117,337 59,640 – – 292,401Financial assets sold under repurchase agreements – – 108,613 3,547 1,676 1,832 – 115,668Deposits from customers – 11,885,651 1,425,382 1,096,410 3,395,188 4,498,972 16,366 22,317,969Debt securities issued – – 108,561 92,439 367,682 386,557 1,922 957,161Others 32,560 253,367 70,011 65,209 222,860 23,622 108,896 776,525
Total liabilities 32,560 13,452,175 2,192,501 1,684,366 4,819,511 5,051,568 138,166 27,370,847
Net gaps 3,038,753 (11,940,841) (344,709) (541,047) (641,726) 2,271,834 10,620,077 2,462,341
Notional amount of derivatives – Interest rate contracts – – 106,266 151,127 211,085 205,416 14,514 688,408 – Exchange rate contracts – – 912,315 806,072 1,327,285 96,262 1,488 3,143,422 – Other contracts – – 41,261 32,544 75,862 8,799 – 158,466
Total – – 1,059,842 989,743 1,614,232 310,477 16,002 3,990,296
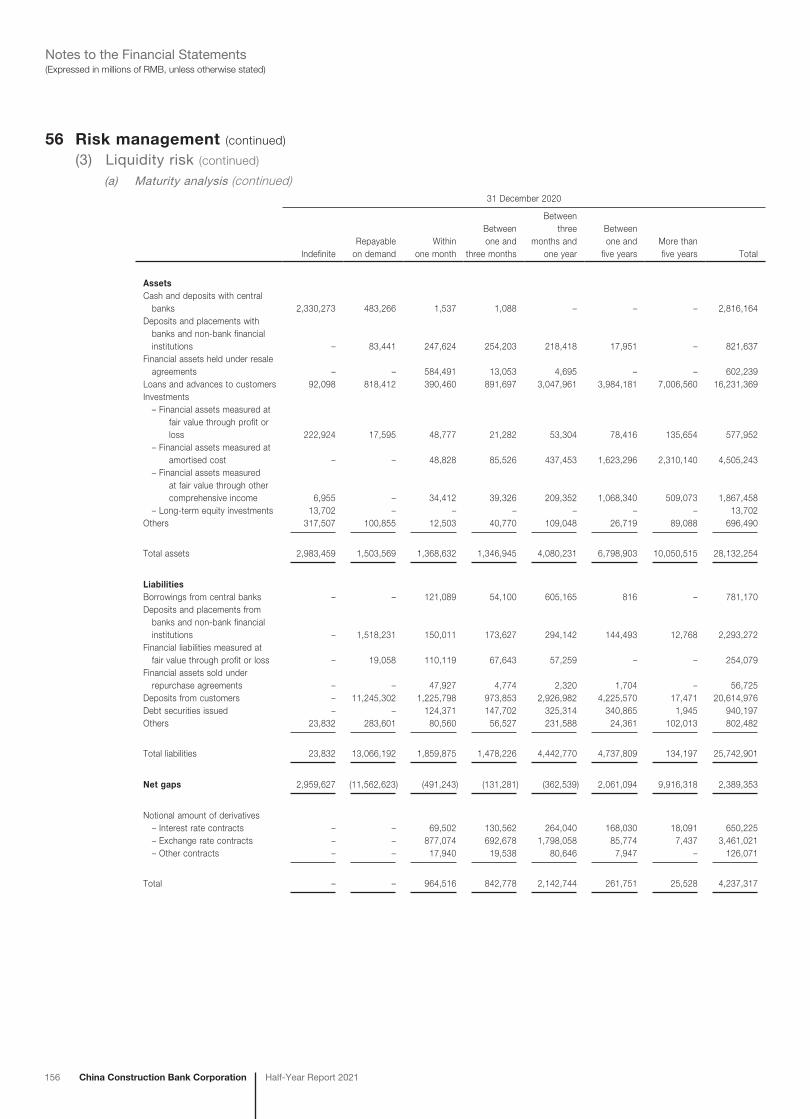
156 China Construction Bank Corporation Half-Year Report 2021
(Expressed in millions of RMB, unless otherwise stated)Notes to the Financial Statements
56 Risk management (continued)
(3) Liquidity risk (continued)
(a) Maturity analysis (continued)31 December 2020
IndefiniteRepayable
on demandWithin
one month
Between one and
three months
Between three
months and one year
Between one and
five yearsMore than five years Total
AssetsCash and deposits with central banks 2,330,273 483,266 1,537 1,088 – – – 2,816,164Deposits and placements with banks and non-bank financial institutions – 83,441 247,624 254,203 218,418 17,951 – 821,637Financial assets held under resale agreements – – 584,491 13,053 4,695 – – 602,239Loans and advances to customers 92,098 818,412 390,460 891,697 3,047,961 3,984,181 7,006,560 16,231,369Investments – Financial assets measured at fair value through profit or loss 222,924 17,595 48,777 21,282 53,304 78,416 135,654 577,952 – Financial assets measured at amortised cost – – 48,828 85,526 437,453 1,623,296 2,310,140 4,505,243 – Financial assets measured at fair value through other comprehensive income 6,955 – 34,412 39,326 209,352 1,068,340 509,073 1,867,458 – Long-term equity investments 13,702 – – – – – – 13,702Others 317,507 100,855 12,503 40,770 109,048 26,719 89,088 696,490
Total assets 2,983,459 1,503,569 1,368,632 1,346,945 4,080,231 6,798,903 10,050,515 28,132,254
LiabilitiesBorrowings from central banks – – 121,089 54,100 605,165 816 – 781,170Deposits and placements from banks and non-bank financial institutions – 1,518,231 150,011 173,627 294,142 144,493 12,768 2,293,272Financial liabilities measured at fair value through profit or loss – 19,058 110,119 67,643 57,259 – – 254,079Financial assets sold under repurchase agreements – – 47,927 4,774 2,320 1,704 – 56,725Deposits from customers – 11,245,302 1,225,798 973,853 2,926,982 4,225,570 17,471 20,614,976Debt securities issued – – 124,371 147,702 325,314 340,865 1,945 940,197Others 23,832 283,601 80,560 56,527 231,588 24,361 102,013 802,482
Total liabilities 23,832 13,066,192 1,859,875 1,478,226 4,442,770 4,737,809 134,197 25,742,901
Net gaps 2,959,627 (11,562,623) (491,243) (131,281) (362,539) 2,061,094 9,916,318 2,389,353
Notional amount of derivatives – Interest rate contracts – – 69,502 130,562 264,040 168,030 18,091 650,225 – Exchange rate contracts – – 877,074 692,678 1,798,058 85,774 7,437 3,461,021 – Other contracts – – 17,940 19,538 80,646 7,947 – 126,071
Total – – 964,516 842,778 2,142,744 261,751 25,528 4,237,317
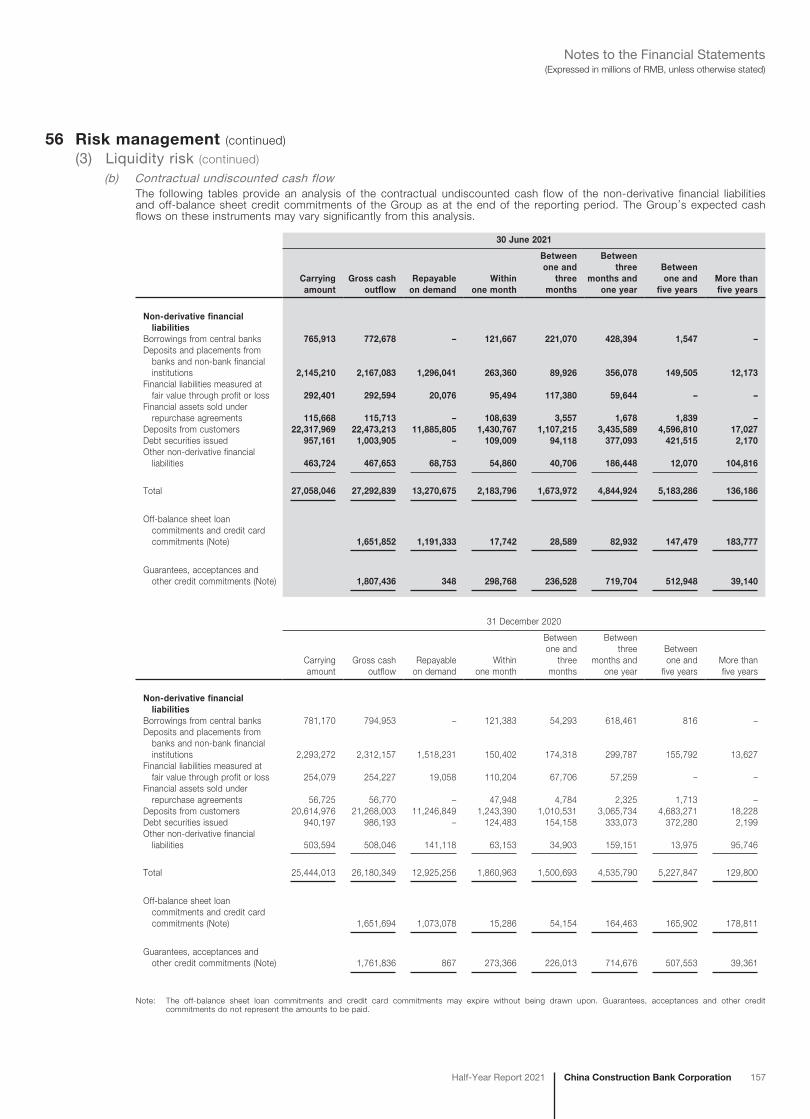
China Construction Bank CorporationHalf-Year Report 2021 157
(Expressed in millions of RMB, unless otherwise stated)Notes to the Financial Statements
56 Risk management (continued)
(3) Liquidity risk (continued)
(b) Contractual undiscounted cash flowThe following tables provide an analysis of the contractual undiscounted cash flow of the non-derivative financial liabilities and off-balance sheet credit commitments of the Group as at the end of the reporting period. The Group’s expected cash flows on these instruments may vary significantly from this analysis.
30 June 2021
Carrying amount
Gross cash outflow
Repayable on demand
Within one month
Between one and
three months
Between three
months and one year
Between one and
five yearsMore than five years
Non-derivative financial liabilitiesBorrowings from central banks 765,913 772,678 – 121,667 221,070 428,394 1,547 –Deposits and placements from banks and non-bank financial institutions 2,145,210 2,167,083 1,296,041 263,360 89,926 356,078 149,505 12,173Financial liabilities measured at fair value through profit or loss 292,401 292,594 20,076 95,494 117,380 59,644 – –Financial assets sold under repurchase agreements 115,668 115,713 – 108,639 3,557 1,678 1,839 –Deposits from customers 22,317,969 22,473,213 11,885,805 1,430,767 1,107,215 3,435,589 4,596,810 17,027Debt securities issued 957,161 1,003,905 – 109,009 94,118 377,093 421,515 2,170Other non-derivative financial liabilities 463,724 467,653 68,753 54,860 40,706 186,448 12,070 104,816
Total 27,058,046 27,292,839 13,270,675 2,183,796 1,673,972 4,844,924 5,183,286 136,186
Off-balance sheet loan commitments and credit card commitments (Note) 1,651,852 1,191,333 17,742 28,589 82,932 147,479 183,777
Guarantees, acceptances and other credit commitments (Note) 1,807,436 348 298,768 236,528 719,704 512,948 39,140
31 December 2020
Carrying amount
Gross cash outflow
Repayable on demand
Within one month
Between one and
three months
Between three
months and one year
Between one and
five yearsMore than five years
Non-derivative financial liabilitiesBorrowings from central banks 781,170 794,953 – 121,383 54,293 618,461 816 –Deposits and placements from banks and non-bank financial institutions 2,293,272 2,312,157 1,518,231 150,402 174,318 299,787 155,792 13,627Financial liabilities measured at fair value through profit or loss 254,079 254,227 19,058 110,204 67,706 57,259 – –Financial assets sold under repurchase agreements 56,725 56,770 – 47,948 4,784 2,325 1,713 –Deposits from customers 20,614,976 21,268,003 11,246,849 1,243,390 1,010,531 3,065,734 4,683,271 18,228Debt securities issued 940,197 986,193 – 124,483 154,158 333,073 372,280 2,199Other non-derivative financial liabilities 503,594 508,046 141,118 63,153 34,903 159,151 13,975 95,746
Total 25,444,013 26,180,349 12,925,256 1,860,963 1,500,693 4,535,790 5,227,847 129,800
Off-balance sheet loan commitments and credit card commitments (Note) 1,651,694 1,073,078 15,286 54,154 164,463 165,902 178,811
Guarantees, acceptances and other credit commitments (Note) 1,761,836 867 273,366 226,013 714,676 507,553 39,361
Note: The off-balance sheet loan commitments and credit card commitments may expire without being drawn upon. Guarantees, acceptances and other credit commitments do not represent the amounts to be paid.
158 China Construction Bank Corporation Half-Year Report 2021
(Expressed in millions of RMB, unless otherwise stated)Notes to the Financial Statements
56 Risk management (continued)
(4) Operational riskOperational risk refers to risk of losses resulting from inadequate or flawed internal processes, people and systems or from external events.
In the first half of 2021, the Group continuously enhanced operational risk management measures, revised operational risk management policies, improved governance structure, enriched management tools, clarified control measures and improved the mechanism of financial service in response to emergencies in combination with regulatory requirements.
– Continuously promoted the application of operational risk management tools and enhanced the operational risk assessments for new products.
– Focused on the recording, analysis and reporting of events where the Group suffered losses from non-compliance.
– Revised the manual for managing incompatible duties, key position catalogue of job rotations and mandatory leave.
– Strengthened the construction of internal control and formulated business avoidance policy.
– Based on the emergency plan in response to COVID-19, organized emergency drills, and provided guidance on emergency response to overseas institutions for the purpose of business continuity.
(5) Fair value of financial instruments(a) Valuation process, technique and input
The Board is responsible for establishing a robust internal control policy of valuation, and takes the ultimate responsibility for the adequacy and effectiveness of internal control system. The Board of Supervisors takes charge of supervising the performance of the Board and senior management. According to the requirements of the Board and the Board of Supervisors, senior management is responsible for organising and implementing the internal control system over the valuation process to ensure the effectiveness of the internal control system of valuation.
The Group has established an independent valuation process for financial assets and financial liabilities. The relevant departments are responsible for performing valuation, verifying valuation model and accounting of valuation results.
For the six months ended 30 June 2021, there was no significant change in the valuation techniques or inputs used to determine fair value as compared to those used for the year ended 31 December 2020.
(b) Fair value hierarchyThe Group measures fair values using the following fair value hierarchy that reflects the significance of the inputs used in making the measurements:
– Level 1: Fair value based on quoted prices (unadjusted) in active markets for identical assets or liabilities.
– Level 2: Fair value based on inputs other than quoted prices included within level 1 that are observable for the asset or liability, either directly (that is, as prices) or indirectly (that is, derived from prices).
– Level 3: Fair value based on inputs for the asset or liability that are not based on observable market data (that is, unobservable inputs).
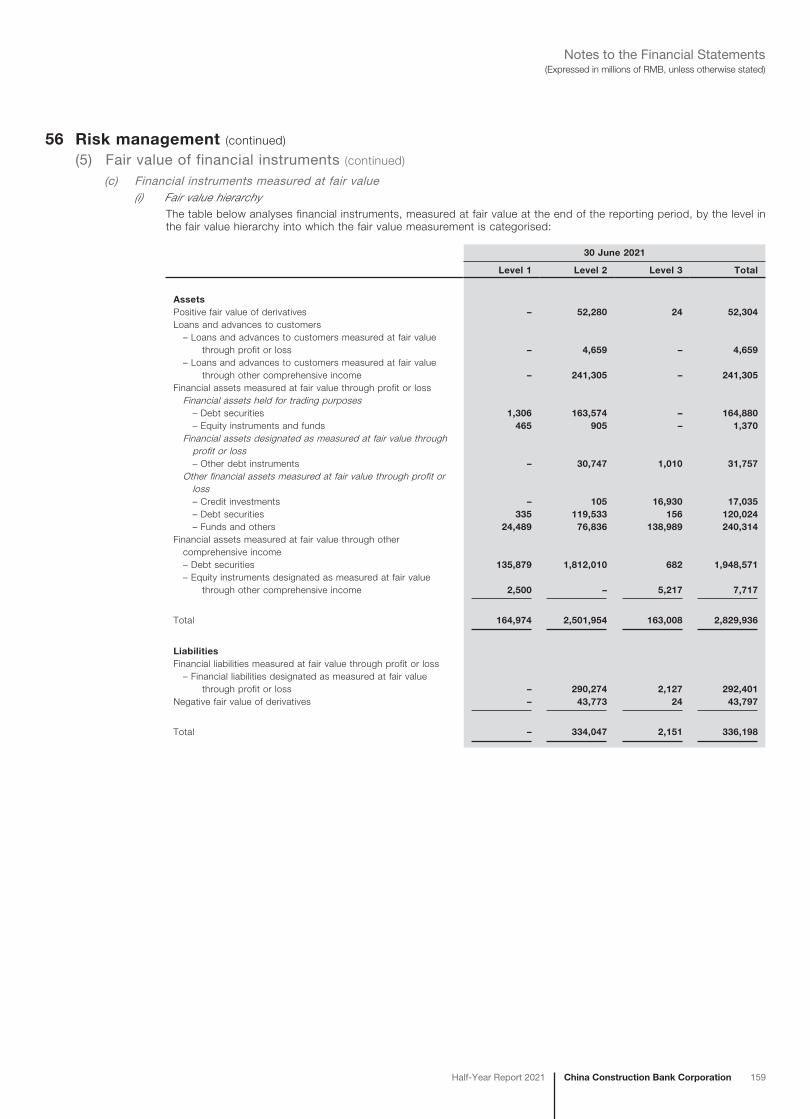
China Construction Bank CorporationHalf-Year Report 2021 159
(Expressed in millions of RMB, unless otherwise stated)Notes to the Financial Statements
56 Risk management (continued)
(5) Fair value of financial instruments (continued)
(c) Financial instruments measured at fair value(i) Fair value hierarchy
The table below analyses financial instruments, measured at fair value at the end of the reporting period, by the level in the fair value hierarchy into which the fair value measurement is categorised:
30 June 2021
Level 1 Level 2 Level 3 Total
AssetsPositive fair value of derivatives – 52,280 24 52,304Loans and advances to customers – Loans and advances to customers measured at fair value through profit or loss – 4,659 – 4,659 – Loans and advances to customers measured at fair value through other comprehensive income – 241,305 – 241,305Financial assets measured at fair value through profit or loss Financial assets held for trading purposes – Debt securities 1,306 163,574 – 164,880 – Equity instruments and funds 465 905 – 1,370 Financial assets designated as measured at fair value through profit or loss – Other debt instruments – 30,747 1,010 31,757 Other financial assets measured at fair value through profit or loss – Credit investments – 105 16,930 17,035 – Debt securities 335 119,533 156 120,024 – Funds and others 24,489 76,836 138,989 240,314Financial assets measured at fair value through other comprehensive income – Debt securities 135,879 1,812,010 682 1,948,571 – Equity instruments designated as measured at fair value through other comprehensive income 2,500 – 5,217 7,717
Total 164,974 2,501,954 163,008 2,829,936
LiabilitiesFinancial liabilities measured at fair value through profit or loss – Financial liabilities designated as measured at fair value through profit or loss – 290,274 2,127 292,401Negative fair value of derivatives – 43,773 24 43,797
Total – 334,047 2,151 336,198
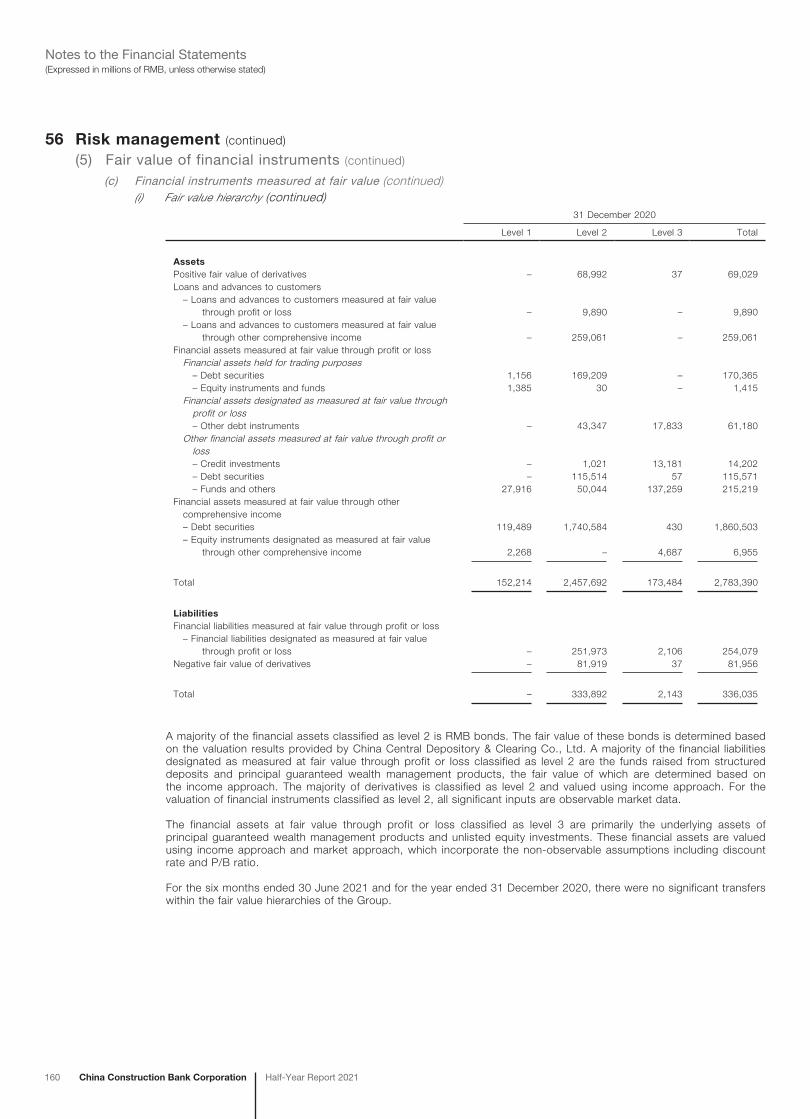
160 China Construction Bank Corporation Half-Year Report 2021
(Expressed in millions of RMB, unless otherwise stated)Notes to the Financial Statements
56 Risk management (continued)
(5) Fair value of financial instruments (continued)
(c) Financial instruments measured at fair value (continued)(i) Fair value hierarchy (continued)
31 December 2020
Level 1 Level 2 Level 3 Total
AssetsPositive fair value of derivatives – 68,992 37 69,029Loans and advances to customers – Loans and advances to customers measured at fair value through profit or loss – 9,890 – 9,890 – Loans and advances to customers measured at fair value through other comprehensive income – 259,061 – 259,061Financial assets measured at fair value through profit or loss Financial assets held for trading purposes – Debt securities 1,156 169,209 – 170,365 – Equity instruments and funds 1,385 30 – 1,415 Financial assets designated as measured at fair value through profit or loss – Other debt instruments – 43,347 17,833 61,180 Other financial assets measured at fair value through profit or loss – Credit investments – 1,021 13,181 14,202 – Debt securities – 115,514 57 115,571 – Funds and others 27,916 50,044 137,259 215,219Financial assets measured at fair value through other comprehensive income – Debt securities 119,489 1,740,584 430 1,860,503 – Equity instruments designated as measured at fair value through other comprehensive income 2,268 – 4,687 6,955
Total 152,214 2,457,692 173,484 2,783,390
LiabilitiesFinancial liabilities measured at fair value through profit or loss – Financial liabilities designated as measured at fair value through profit or loss – 251,973 2,106 254,079Negative fair value of derivatives – 81,919 37 81,956
Total – 333,892 2,143 336,035
A majority of the financial assets classified as level 2 is RMB bonds. The fair value of these bonds is determined based on the valuation results provided by China Central Depository & Clearing Co., Ltd. A majority of the financial liabilities designated as measured at fair value through profit or loss classified as level 2 are the funds raised from structured deposits and principal guaranteed wealth management products, the fair value of which are determined based on the income approach. The majority of derivatives is classified as level 2 and valued using income approach. For the valuation of financial instruments classified as level 2, all significant inputs are observable market data.
The financial assets at fair value through profit or loss classified as level 3 are primarily the underlying assets of principal guaranteed wealth management products and unlisted equity investments. These financial assets are valued using income approach and market approach, which incorporate the non-observable assumptions including discount rate and P/B ratio.
For the six months ended 30 June 2021 and for the year ended 31 December 2020, there were no significant transfers within the fair value hierarchies of the Group.
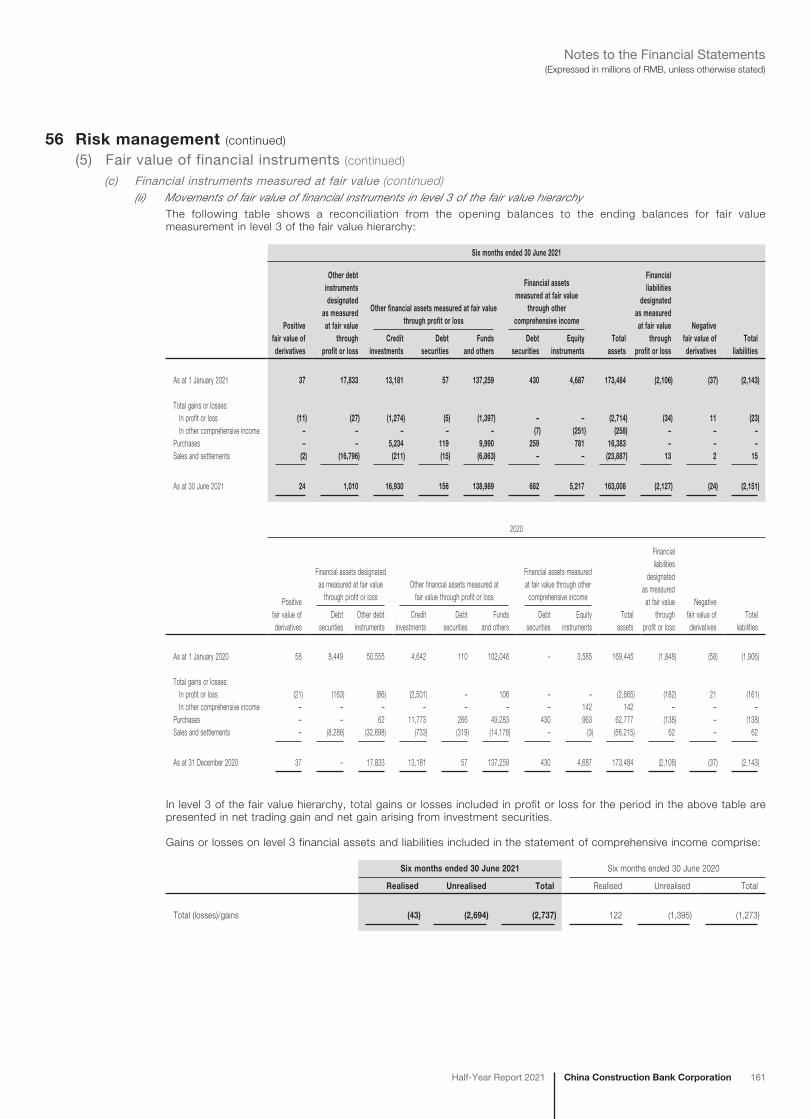
China Construction Bank CorporationHalf-Year Report 2021 161
(Expressed in millions of RMB, unless otherwise stated)Notes to the Financial Statements
56 Risk management (continued)
(5) Fair value of financial instruments (continued)
(c) Financial instruments measured at fair value (continued)(ii) Movements of fair value of financial instruments in level 3 of the fair value hierarchy
The following table shows a reconciliation from the opening balances to the ending balances for fair value measurement in level 3 of the fair value hierarchy:
Six months ended 30 June 2021
Positive fair value of derivatives
Other debt instruments designated
as measured at fair value
through profit or loss
Other financial assets measured at fair value through profit or loss
Financial assets measured at fair value
through other comprehensive income
Total assets
Financial liabilities
designated as measured at fair value
through profit or loss
Negative fair value of derivatives
Total liabilities
Credit investments
Debt securities
Funds and others
Debt securities
Equity instruments
As at 1 January 2021 37 17,833 13,181 57 137,259 430 4,687 173,484 (2,106) (37) (2,143)
Total gains or losses: In profit or loss (11) (27) (1,274) (5) (1,397) – – (2,714) (34) 11 (23) In other comprehensive income – – – – – (7) (251) (258) – – –Purchases – – 5,234 119 9,990 259 781 16,383 – – –Sales and settlements (2) (16,796) (211) (15) (6,863) – – (23,887) 13 2 15
As at 30 June 2021 24 1,010 16,930 156 138,989 682 5,217 163,008 (2,127) (24) (2,151)
2020
Positive fair value of derivatives
Financial assets designated as measured at fair value
through profit or lossOther financial assets measured at
fair value through profit or loss
Financial assets measured at fair value through other
comprehensive income
Total assets
Financial liabilities
designated as measured
at fair value through
profit or loss
Negative fair value of derivatives
Total liabilities
Debt securities
Other debtinstruments
Credit investments
Debt securities
Funds and others
Debt securities
Equity instruments
As at 1 January 2020 58 8,449 50,555 4,642 110 102,046 – 3,585 169,445 (1,848) (58) (1,906)
Total gains or losses: In profit or loss (21) (163) (86) (2,501) – 106 – – (2,665) (182) 21 (161) In other comprehensive income – – – – – – – 142 142 – – –Purchases – – 62 11,773 266 49,283 430 963 62,777 (138) – (138)Sales and settlements – (8,286) (32,698) (733) (319) (14,176) – (3) (56,215) 62 – 62
As at 31 December 2020 37 – 17,833 13,181 57 137,259 430 4,687 173,484 (2,106) (37) (2,143)
In level 3 of the fair value hierarchy, total gains or losses included in profit or loss for the period in the above table are presented in net trading gain and net gain arising from investment securities.
Gains or losses on level 3 financial assets and liabilities included in the statement of comprehensive income comprise:
Six months ended 30 June 2021 Six months ended 30 June 2020
Realised Unrealised Total Realised Unrealised Total
Total (losses)/gains (43) (2,694) (2,737) 122 (1,395) (1,273)
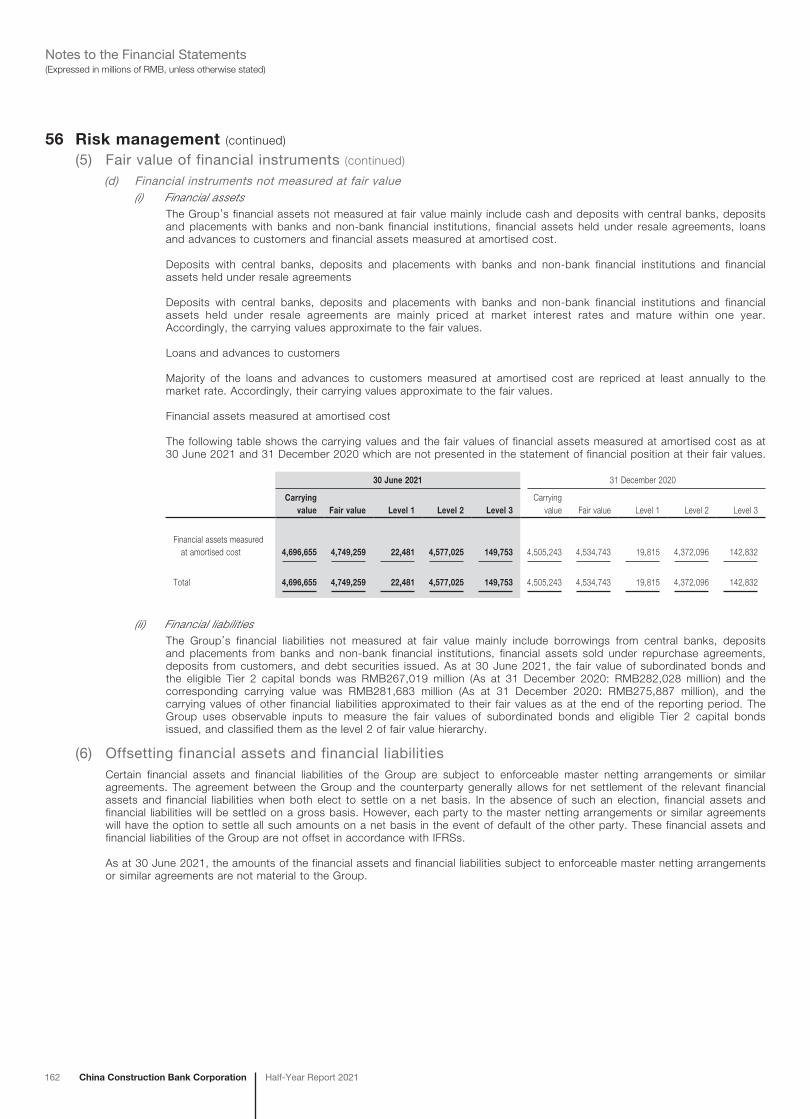
162 China Construction Bank Corporation Half-Year Report 2021
(Expressed in millions of RMB, unless otherwise stated)Notes to the Financial Statements
56 Risk management (continued)
(5) Fair value of financial instruments (continued)
(d) Financial instruments not measured at fair value(i) Financial assets
The Group’s financial assets not measured at fair value mainly include cash and deposits with central banks, deposits and placements with banks and non-bank financial institutions, financial assets held under resale agreements, loans and advances to customers and financial assets measured at amortised cost.
Deposits with central banks, deposits and placements with banks and non-bank financial institutions and financial assets held under resale agreements
Deposits with central banks, deposits and placements with banks and non-bank financial institutions and financial assets held under resale agreements are mainly priced at market interest rates and mature within one year. Accordingly, the carrying values approximate to the fair values.
Loans and advances to customers
Majority of the loans and advances to customers measured at amortised cost are repriced at least annually to the market rate. Accordingly, their carrying values approximate to the fair values.
Financial assets measured at amortised cost
The following table shows the carrying values and the fair values of financial assets measured at amortised cost as at 30 June 2021 and 31 December 2020 which are not presented in the statement of financial position at their fair values.
30 June 2021 31 December 2020
Carrying value Fair value Level 1 Level 2 Level 3
Carrying value Fair value Level 1 Level 2 Level 3
Financial assets measured at amortised cost 4,696,655 4,749,259 22,481 4,577,025 149,753 4,505,243 4,534,743 19,815 4,372,096 142,832
Total 4,696,655 4,749,259 22,481 4,577,025 149,753 4,505,243 4,534,743 19,815 4,372,096 142,832
(ii) Financial liabilitiesThe Group’s financial liabilities not measured at fair value mainly include borrowings from central banks, deposits and placements from banks and non-bank financial institutions, financial assets sold under repurchase agreements, deposits from customers, and debt securities issued. As at 30 June 2021, the fair value of subordinated bonds and the eligible Tier 2 capital bonds was RMB267,019 million (As at 31 December 2020: RMB282,028 million) and the corresponding carrying value was RMB281,683 million (As at 31 December 2020: RMB275,887 million), and the carrying values of other financial liabilities approximated to their fair values as at the end of the reporting period. The Group uses observable inputs to measure the fair values of subordinated bonds and eligible Tier 2 capital bonds issued, and classified them as the level 2 of fair value hierarchy.
(6) Offsetting financial assets and financial liabilitiesCertain financial assets and financial liabilities of the Group are subject to enforceable master netting arrangements or similar agreements. The agreement between the Group and the counterparty generally allows for net settlement of the relevant financial assets and financial liabilities when both elect to settle on a net basis. In the absence of such an election, financial assets and financial liabilities will be settled on a gross basis. However, each party to the master netting arrangements or similar agreements will have the option to settle all such amounts on a net basis in the event of default of the other party. These financial assets and financial liabilities of the Group are not offset in accordance with IFRSs.
As at 30 June 2021, the amounts of the financial assets and financial liabilities subject to enforceable master netting arrangements or similar agreements are not material to the Group.
China Construction Bank CorporationHalf-Year Report 2021 163
(Expressed in millions of RMB, unless otherwise stated)Notes to the Financial Statements
56 Risk management (continued)
(7) Insurance riskThe risk under an insurance contract is the possibility that the insured event occurs and the uncertainty in the resulting claim amount. The characteristic of an insurance contract inherently decides randomness and unpredictability of the underlying insurance risk. For insurance contracts where the theory of probability is applied to pricing and provisioning of insurance contract liabilities, the principal risk that the Group faces is that the actual claims and benefit payments exceed the carrying amount of the insurance contract liabilities.
The Group manages the uncertainty of insurance risk through its underwriting strategy and policies to diversify the underwriting risks, adequate reinsurance arrangements, and enhanced underwriting control and claim control.
The Group makes related assumptions for the insurance risks and recognises insurance contract liabilities accordingly. For long-term personal insurance contracts and short-term personal insurance contracts, insurance risk may be elevated by the uncertainty of insurance risk assumptions including assumptions on death events, relevant expenses, and interest rates. For property and casualty insurance contracts, claims are often affected by natural disasters, catastrophes, terrorist attacks and other factors. In addition, the insurance risk will be affected by the policy termination, premium reduction or policyholders’ refusal of payment, that is, the insurance risk will be affected by the policyholder’s behaviour and decision.
(8) Capital managementThe Bank has implemented comprehensive capital management, covering capital management policy design, capital projecting and planning, capital calculation, internal capital assessment, capital allocation, capital motivation, restriction and conduction, capital raising, monitoring and reporting, and applications of advanced approach of capital calculation on the management of the ordinary course of the business. General principles of capital management of the Bank is to continuously retain an adequate capital level, retain a certain margin of safety and a certain level of buffer based on that all regulatory requirements have been complied, and ensure that the capital can cover all kinds of risks adequately; exercise reasonable and effective capital allocation and strengthen capital restraint and incentive mechanism to support the strategic planning effectively and to restrict and conduct the business so as to increase the capital efficiency and return level continuously; tamp capital strength, and retain relatively high capital quality by achieving capital supplement with priority to the internal accumulation and utilising various capital instruments reasonably to optimise capital structure; continuously develop the advanced approach of capital management on the applications in the business management such as credit policies, credit approval and pricing.
Capital adequacy ratio is a reflection of the Group’s ability to maintain a stable operation and resist adverse risks. In accordance with the CBRC’s “Capital Rules for Commercial Banks (Provisional)” and relevant regulations, commercial banks should meet the minimum capital requirements from 1 January 2013. The Common Equity Tier 1 ratio should be at or above a minimum of 5%, Tier 1 ratio at or above a minimum of 6% and the total capital ratio at or above a minimum of 8%. Besides, capital conservation buffer requirements and additional buffer requirements of Global Systemically Important Banks should also be met. If a countercyclical buffer is required or the Pillar 2 capital requirement is raised by the regulator to a specific commercial bank, the minimum requirements should be met within the transitional period.
The Group timely monitors, analyses and reports capital adequacy ratios, assesses if the capital management objectives have been met and exercises effective management of capital adequacy ratio. The Group adopts various measures such as controlling asset growth, adjusting the structure of risk assets, increasing internal capital supply and raising capital through external channels, to ensure that the Common Equity Tier 1 ratio, Tier 1 ratio and total capital ratio of the Group are in full compliance with regulatory requirements and meet internal management requirements. This helps to insulate against potential risks as well as support healthy business developments. The Group now fully complies with all regulatory requirements in this respect.
The Group’s capital planning has taken the regulatory requirements, the Group’s development strategy and risk appetite into consideration, and based on those factors the Group projects the capital usage and need.
The capital raising management of the Group involves reasonable utilisation of various capital instruments to ensure that both external regulatory and internal capital management objectives are met, taking into account capital planning and operating environment. This helps to optimise the Group’s capital structure.
Based on the approval for the Group to implement the advanced capital management method in 2014, the CBIRC approved the Group to expand the implementation scope of the advanced capital management method in April 2020. The Group calculated the capital requirements for financial institution credit exposures and corporate credit risk exposures that meet regulatory requirements with the foundation internal ratings-based approach, the capital requirements for retail credit risk exposures with the internal ratings-based approach, the capital requirements for market risk with the internal models approach, and the capital requirements for operational risk with the standardised approach.
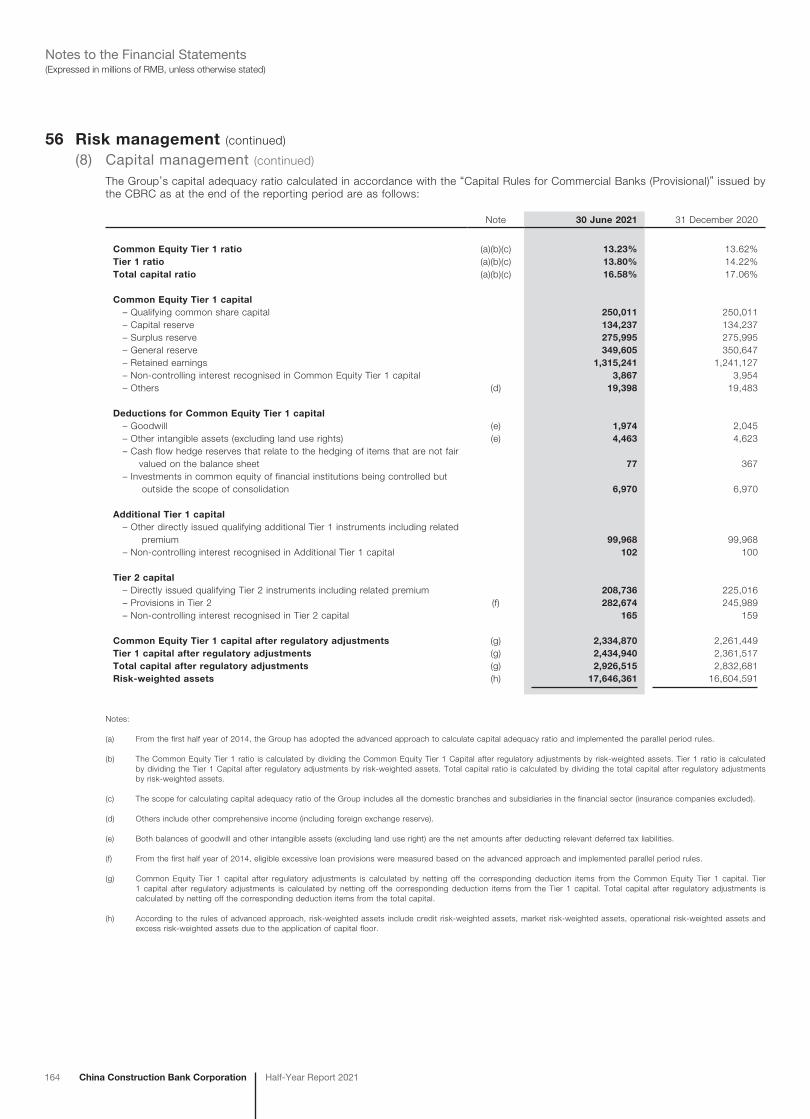
164 China Construction Bank Corporation Half-Year Report 2021
(Expressed in millions of RMB, unless otherwise stated)Notes to the Financial Statements
56 Risk management (continued)
(8) Capital management (continued)
The Group’s capital adequacy ratio calculated in accordance with the “Capital Rules for Commercial Banks (Provisional)” issued by the CBRC as at the end of the reporting period are as follows:
Note 30 June 2021 31 December 2020
Common Equity Tier 1 ratio (a)(b)(c) 13.23% 13.62%Tier 1 ratio (a)(b)(c) 13.80% 14.22%Total capital ratio (a)(b)(c) 16.58% 17.06%
Common Equity Tier 1 capital – Qualifying common share capital 250,011 250,011 – Capital reserve 134,237 134,237 – Surplus reserve 275,995 275,995 – General reserve 349,605 350,647 – Retained earnings 1,315,241 1,241,127 – Non-controlling interest recognised in Common Equity Tier 1 capital 3,867 3,954 – Others (d) 19,398 19,483
Deductions for Common Equity Tier 1 capital – Goodwill (e) 1,974 2,045 – Other intangible assets (excluding land use rights) (e) 4,463 4,623 – Cash flow hedge reserves that relate to the hedging of items that are not fair valued on the balance sheet 77 367 – Investments in common equity of financial institutions being controlled but outside the scope of consolidation 6,970 6,970
Additional Tier 1 capital – Other directly issued qualifying additional Tier 1 instruments including related premium 99,968 99,968 – Non-controlling interest recognised in Additional Tier 1 capital 102 100
Tier 2 capital – Directly issued qualifying Tier 2 instruments including related premium 208,736 225,016 – Provisions in Tier 2 (f) 282,674 245,989 – Non-controlling interest recognised in Tier 2 capital 165 159
Common Equity Tier 1 capital after regulatory adjustments (g) 2,334,870 2,261,449Tier 1 capital after regulatory adjustments (g) 2,434,940 2,361,517Total capital after regulatory adjustments (g) 2,926,515 2,832,681Risk-weighted assets (h) 17,646,361 16,604,591
Notes:
(a) From the first half year of 2014, the Group has adopted the advanced approach to calculate capital adequacy ratio and implemented the parallel period rules.
(b) The Common Equity Tier 1 ratio is calculated by dividing the Common Equity Tier 1 Capital after regulatory adjustments by risk-weighted assets. Tier 1 ratio is calculated by dividing the Tier 1 Capital after regulatory adjustments by risk-weighted assets. Total capital ratio is calculated by dividing the total capital after regulatory adjustments by risk-weighted assets.
(c) The scope for calculating capital adequacy ratio of the Group includes all the domestic branches and subsidiaries in the financial sector (insurance companies excluded).
(d) Others include other comprehensive income (including foreign exchange reserve).
(e) Both balances of goodwill and other intangible assets (excluding land use right) are the net amounts after deducting relevant deferred tax liabilities.
(f) From the first half year of 2014, eligible excessive loan provisions were measured based on the advanced approach and implemented parallel period rules.
(g) Common Equity Tier 1 capital after regulatory adjustments is calculated by netting off the corresponding deduction items from the Common Equity Tier 1 capital. Tier 1 capital after regulatory adjustments is calculated by netting off the corresponding deduction items from the Tier 1 capital. Total capital after regulatory adjustments is calculated by netting off the corresponding deduction items from the total capital.
(h) According to the rules of advanced approach, risk-weighted assets include credit risk-weighted assets, market risk-weighted assets, operational risk-weighted assets and excess risk-weighted assets due to the application of capital floor.
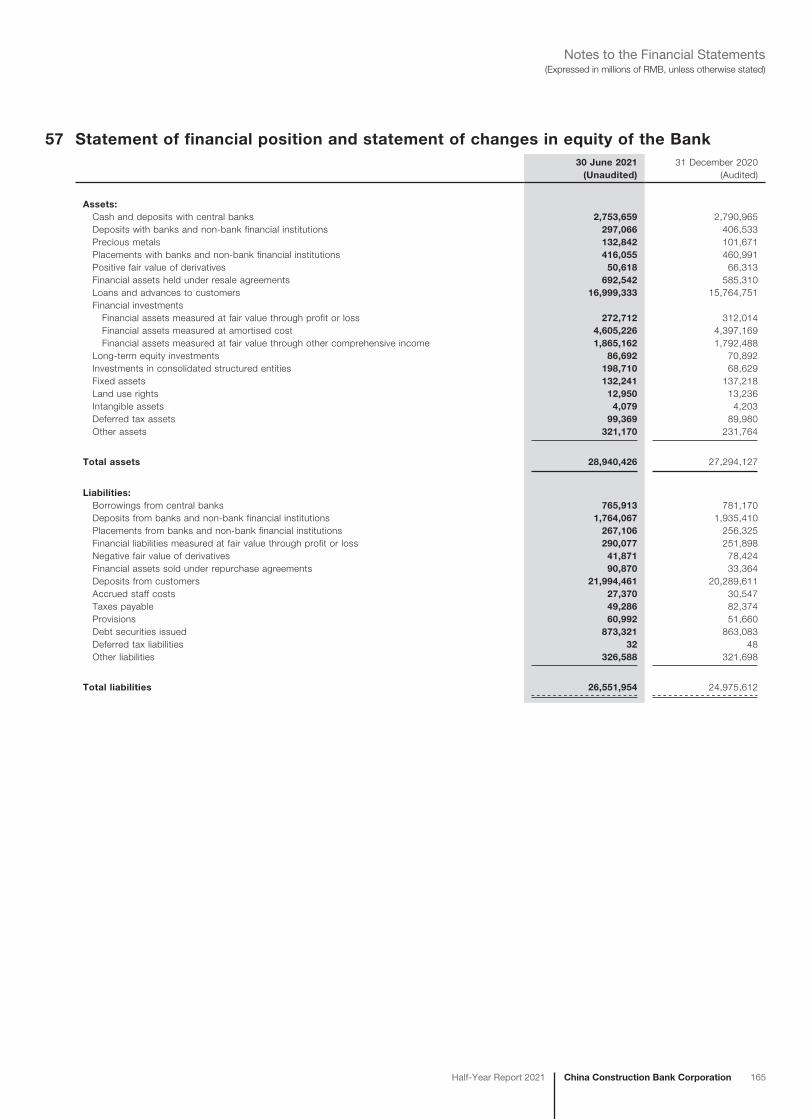
China Construction Bank CorporationHalf-Year Report 2021 165
(Expressed in millions of RMB, unless otherwise stated)Notes to the Financial Statements
57 Statement of financial position and statement of changes in equity of the Bank30 June 2021 31 December 2020
(Unaudited) (Audited)
Assets: Cash and deposits with central banks 2,753,659 2,790,965 Deposits with banks and non-bank financial institutions 297,066 406,533 Precious metals 132,842 101,671 Placements with banks and non-bank financial institutions 416,055 460,991 Positive fair value of derivatives 50,618 66,313 Financial assets held under resale agreements 692,542 585,310 Loans and advances to customers 16,999,333 15,764,751 Financial investments Financial assets measured at fair value through profit or loss 272,712 312,014 Financial assets measured at amortised cost 4,605,226 4,397,169 Financial assets measured at fair value through other comprehensive income 1,865,162 1,792,488 Long-term equity investments 86,692 70,892 Investments in consolidated structured entities 198,710 68,629 Fixed assets 132,241 137,218 Land use rights 12,950 13,236 Intangible assets 4,079 4,203 Deferred tax assets 99,369 89,980 Other assets 321,170 231,764
Total assets 28,940,426 27,294,127
Liabilities: Borrowings from central banks 765,913 781,170 Deposits from banks and non-bank financial institutions 1,764,067 1,935,410 Placements from banks and non-bank financial institutions 267,106 256,325 Financial liabilities measured at fair value through profit or loss 290,077 251,898 Negative fair value of derivatives 41,871 78,424 Financial assets sold under repurchase agreements 90,870 33,364 Deposits from customers 21,994,461 20,289,611 Accrued staff costs 27,370 30,547 Taxes payable 49,286 82,374 Provisions 60,992 51,660 Debt securities issued 873,321 863,083 Deferred tax liabilities 32 48 Other liabilities 326,588 321,698
Total liabilities 26,551,954 24,975,612
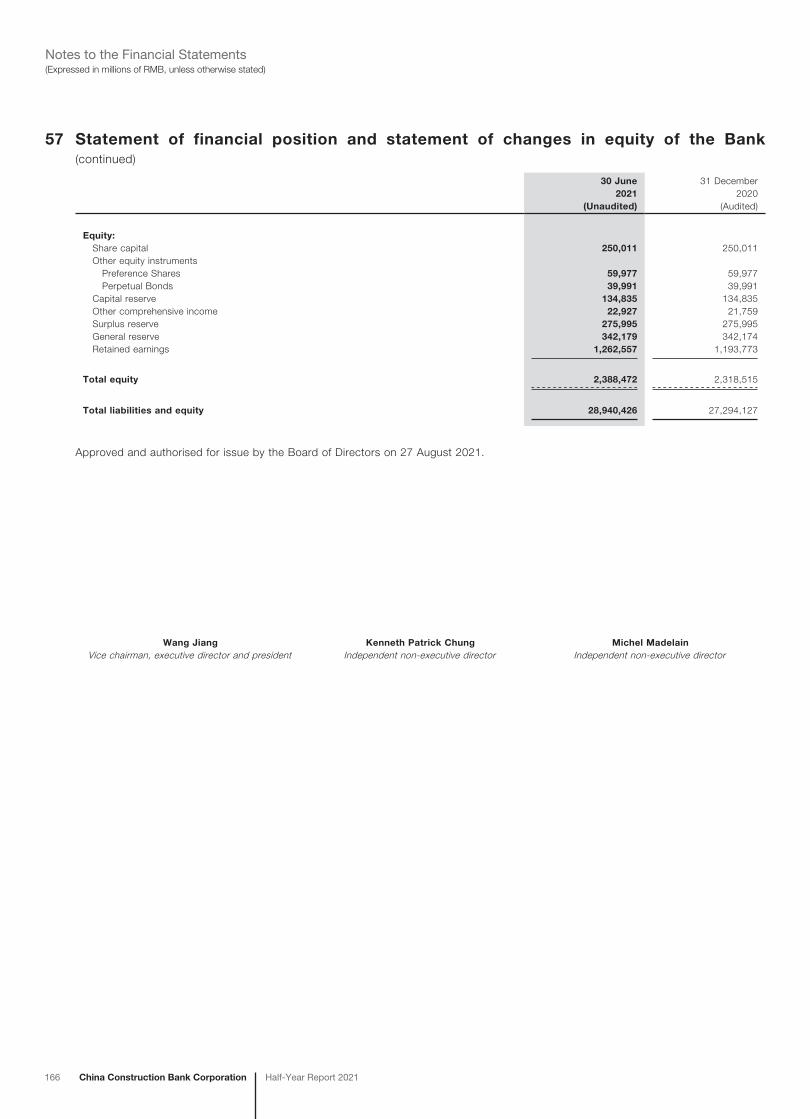
166 China Construction Bank Corporation Half-Year Report 2021
(Expressed in millions of RMB, unless otherwise stated)Notes to the Financial Statements
57 Statement of financial position and statement of changes in equity of the Bank (continued)
30 June2021
31 December2020
(Unaudited) (Audited)
Equity: Share capital 250,011 250,011 Other equity instruments Preference Shares 59,977 59,977 Perpetual Bonds 39,991 39,991 Capital reserve 134,835 134,835 Other comprehensive income 22,927 21,759 Surplus reserve 275,995 275,995 General reserve 342,179 342,174 Retained earnings 1,262,557 1,193,773
Total equity 2,388,472 2,318,515
Total liabilities and equity 28,940,426 27,294,127
Approved and authorised for issue by the Board of Directors on 27 August 2021.
Wang Jiang Kenneth Patrick Chung Michel MadelainVice chairman, executive director and president Independent non-executive director Independent non-executive director
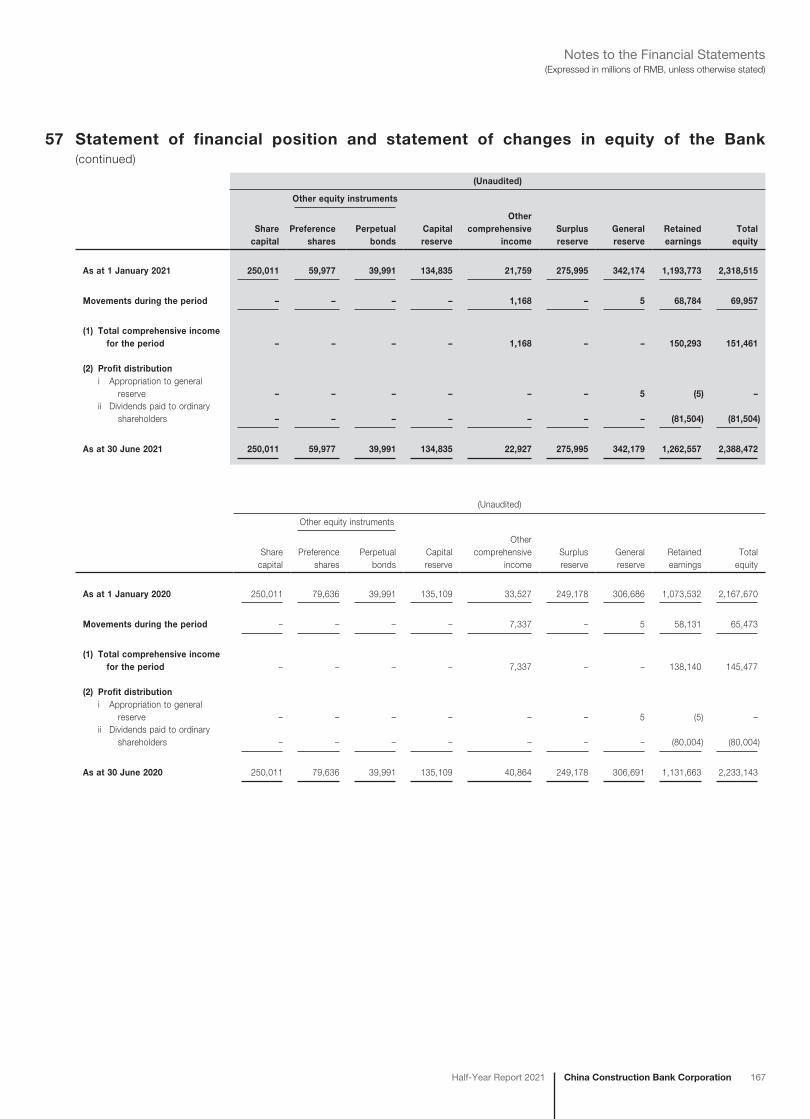
China Construction Bank CorporationHalf-Year Report 2021 167
(Expressed in millions of RMB, unless otherwise stated)Notes to the Financial Statements
57 Statement of financial position and statement of changes in equity of the Bank (continued)
(Unaudited)
Other equity instruments
Share capital
Preference shares
Perpetual bonds
Capital reserve
Other comprehensive
incomeSurplus reserve
General reserve
Retained earnings
Totalequity
As at 1 January 2021 250,011 59,977 39,991 134,835 21,759 275,995 342,174 1,193,773 2,318,515
Movements during the period – – – – 1,168 – 5 68,784 69,957
(1) Total comprehensive income for the period – – – – 1,168 – – 150,293 151,461
(2) Profit distributioni Appropriation to general
reserve – – – – – – 5 (5) –ii Dividends paid to ordinary
shareholders – – – – – – – (81,504) (81,504)
As at 30 June 2021 250,011 59,977 39,991 134,835 22,927 275,995 342,179 1,262,557 2,388,472
(Unaudited)
Other equity instruments
Share capital
Preference shares
Perpetual bonds
Capital reserve
Other comprehensive
incomeSurplus reserve
General reserve
Retained earnings
Total equity
As at 1 January 2020 250,011 79,636 39,991 135,109 33,527 249,178 306,686 1,073,532 2,167,670
Movements during the period – – – – 7,337 – 5 58,131 65,473
(1) Total comprehensive income for the period – – – – 7,337 – – 138,140 145,477
(2) Profit distributioni Appropriation to general
reserve – – – – – – 5 (5) –ii Dividends paid to ordinary
shareholders – – – – – – – (80,004) (80,004)
As at 30 June 2020 250,011 79,636 39,991 135,109 40,864 249,178 306,691 1,131,663 2,233,143
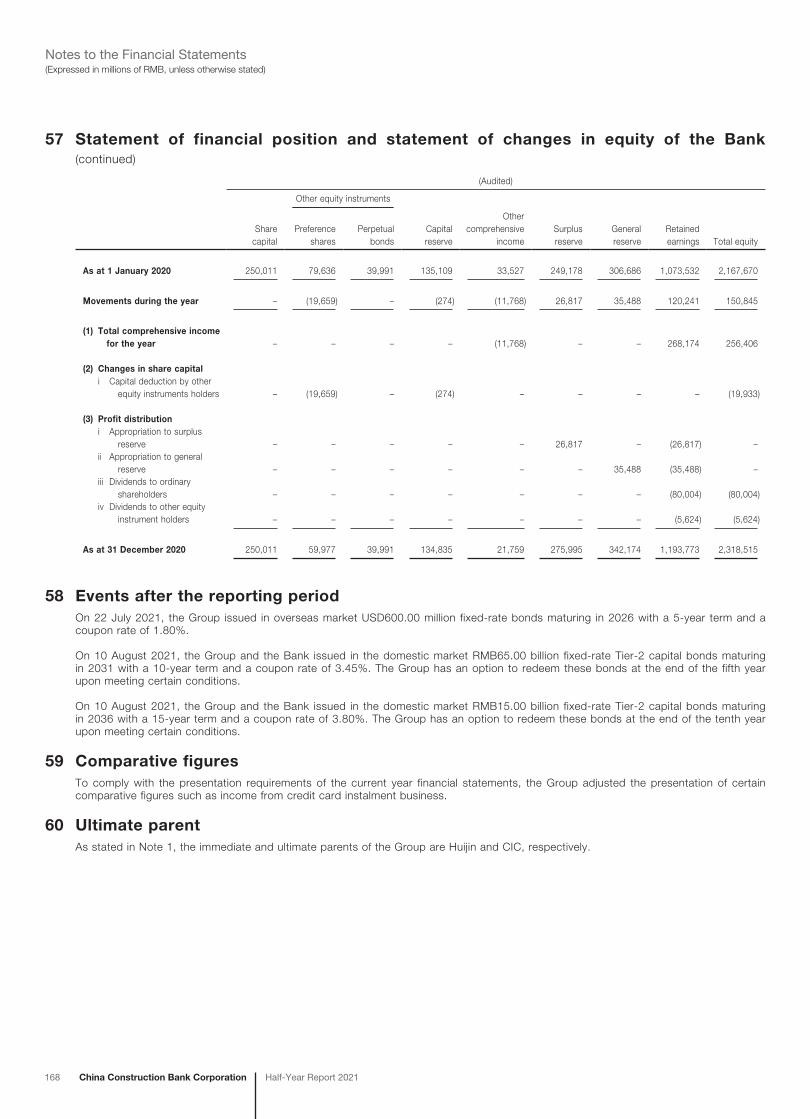
168 China Construction Bank Corporation Half-Year Report 2021
(Expressed in millions of RMB, unless otherwise stated)Notes to the Financial Statements
57 Statement of financial position and statement of changes in equity of the Bank (continued)
(Audited)
Other equity instruments
Share capital
Preference shares
Perpetual bonds
Capital reserve
Other comprehensive
incomeSurplus reserve
General reserve
Retained earnings Total equity
As at 1 January 2020 250,011 79,636 39,991 135,109 33,527 249,178 306,686 1,073,532 2,167,670
Movements during the year – (19,659) – (274) (11,768) 26,817 35,488 120,241 150,845
(1) Total comprehensive income for the year – – – – (11,768) – – 268,174 256,406
(2) Changes in share capitali Capital deduction by other
equity instruments holders – (19,659) – (274) – – – – (19,933)
(3) Profit distributioni Appropriation to surplus
reserve – – – – – 26,817 – (26,817) –ii Appropriation to general
reserve – – – – – – 35,488 (35,488) –iii Dividends to ordinary
shareholders – – – – – – – (80,004) (80,004)iv Dividends to other equity
instrument holders – – – – – – – (5,624) (5,624)
As at 31 December 2020 250,011 59,977 39,991 134,835 21,759 275,995 342,174 1,193,773 2,318,515
58 Events after the reporting periodOn 22 July 2021, the Group issued in overseas market USD600.00 million fixed-rate bonds maturing in 2026 with a 5-year term and a coupon rate of 1.80%.
On 10 August 2021, the Group and the Bank issued in the domestic market RMB65.00 billion fixed-rate Tier-2 capital bonds maturing in 2031 with a 10-year term and a coupon rate of 3.45%. The Group has an option to redeem these bonds at the end of the fifth year upon meeting certain conditions.
On 10 August 2021, the Group and the Bank issued in the domestic market RMB15.00 billion fixed-rate Tier-2 capital bonds maturing in 2036 with a 15-year term and a coupon rate of 3.80%. The Group has an option to redeem these bonds at the end of the tenth year upon meeting certain conditions.
59 Comparative figuresTo comply with the presentation requirements of the current year financial statements, the Group adjusted the presentation of certain comparative figures such as income from credit card instalment business.
60 Ultimate parentAs stated in Note 1, the immediate and ultimate parents of the Group are Huijin and CIC, respectively.
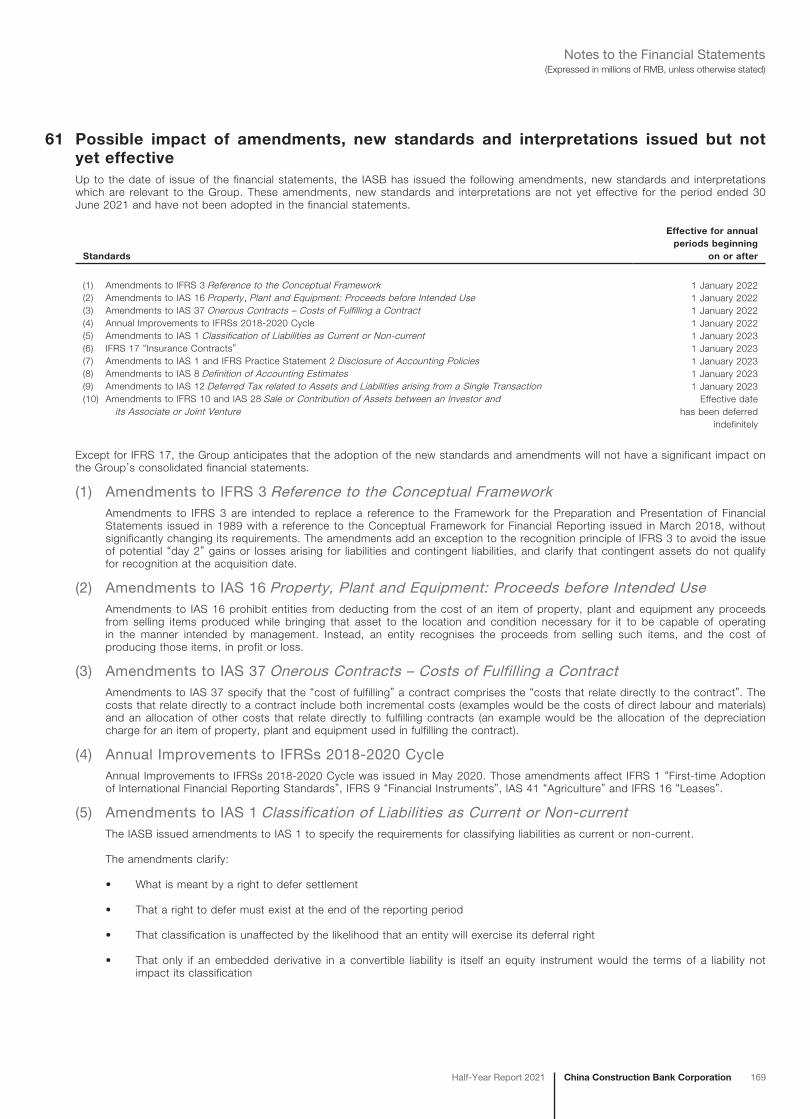
China Construction Bank CorporationHalf-Year Report 2021 169
(Expressed in millions of RMB, unless otherwise stated)Notes to the Financial Statements
61 Possible impact of amendments, new standards and interpretations issued but not yet effectiveUp to the date of issue of the financial statements, the IASB has issued the following amendments, new standards and interpretations which are relevant to the Group. These amendments, new standards and interpretations are not yet effective for the period ended 30 June 2021 and have not been adopted in the financial statements.
Standards
Effective for annual periods beginning
on or after
(1) Amendments to IFRS 3 Reference to the Conceptual Framework 1 January 2022(2) Amendments to IAS 16 Property , Plant and Equipment: Proceeds before Intended Use 1 January 2022(3) Amendments to IAS 37 Onerous Contracts – Costs of Fulfilling a Contract 1 January 2022(4) Annual Improvements to IFRSs 2018-2020 Cycle 1 January 2022(5) Amendments to IAS 1 Classification of Liabilities as Current or Non-current 1 January 2023(6) IFRS 17 “Insurance Contracts” 1 January 2023(7) Amendments to IAS 1 and IFRS Practice Statement 2 Disclosure of Accounting Policies 1 January 2023(8) Amendments to IAS 8 Definition of Accounting Estimates 1 January 2023(9) Amendments to IAS 12 Deferred Tax related to Assets and Liabilities arising from a Single Transaction 1 January 2023(10) Amendments to IFRS 10 and IAS 28 Sale or Contribution of Assets between an Investor and
its Associate or Joint VentureEffective date
has been deferred indefinitely
Except for IFRS 17, the Group anticipates that the adoption of the new standards and amendments will not have a significant impact on the Group’s consolidated financial statements.
(1) Amendments to IFRS 3 Reference to the Conceptual FrameworkAmendments to IFRS 3 are intended to replace a reference to the Framework for the Preparation and Presentation of Financial Statements issued in 1989 with a reference to the Conceptual Framework for Financial Reporting issued in March 2018, without significantly changing its requirements. The amendments add an exception to the recognition principle of IFRS 3 to avoid the issue of potential “day 2” gains or losses arising for liabilities and contingent liabilities, and clarify that contingent assets do not qualify for recognition at the acquisition date.
(2) Amendments to IAS 16 Property, Plant and Equipment: Proceeds before Intended UseAmendments to IAS 16 prohibit entities from deducting from the cost of an item of property, plant and equipment any proceeds from selling items produced while bringing that asset to the location and condition necessary for it to be capable of operating in the manner intended by management. Instead, an entity recognises the proceeds from selling such items, and the cost of producing those items, in profit or loss.
(3) Amendments to IAS 37 Onerous Contracts – Costs of Fulfilling a ContractAmendments to IAS 37 specify that the “cost of fulfilling” a contract comprises the “costs that relate directly to the contract”. The costs that relate directly to a contract include both incremental costs (examples would be the costs of direct labour and materials) and an allocation of other costs that relate directly to fulfilling contracts (an example would be the allocation of the depreciation charge for an item of property, plant and equipment used in fulfilling the contract).
(4) Annual Improvements to IFRSs 2018-2020 CycleAnnual Improvements to IFRSs 2018-2020 Cycle was issued in May 2020. Those amendments affect IFRS 1 “First-time Adoption of International Financial Reporting Standards”, IFRS 9 “Financial Instruments”, IAS 41 “Agriculture” and IFRS 16 “Leases”.
(5) Amendments to IAS 1 Classification of Liabilities as Current or Non-currentThe IASB issued amendments to IAS 1 to specify the requirements for classifying liabilities as current or non-current.
The amendments clarify:
• What is meant by a right to defer settlement
• That a right to defer must exist at the end of the reporting period
• That classification is unaffected by the likelihood that an entity will exercise its deferral right
• That only if an embedded derivative in a convertible liability is itself an equity instrument would the terms of a liability not impact its classification
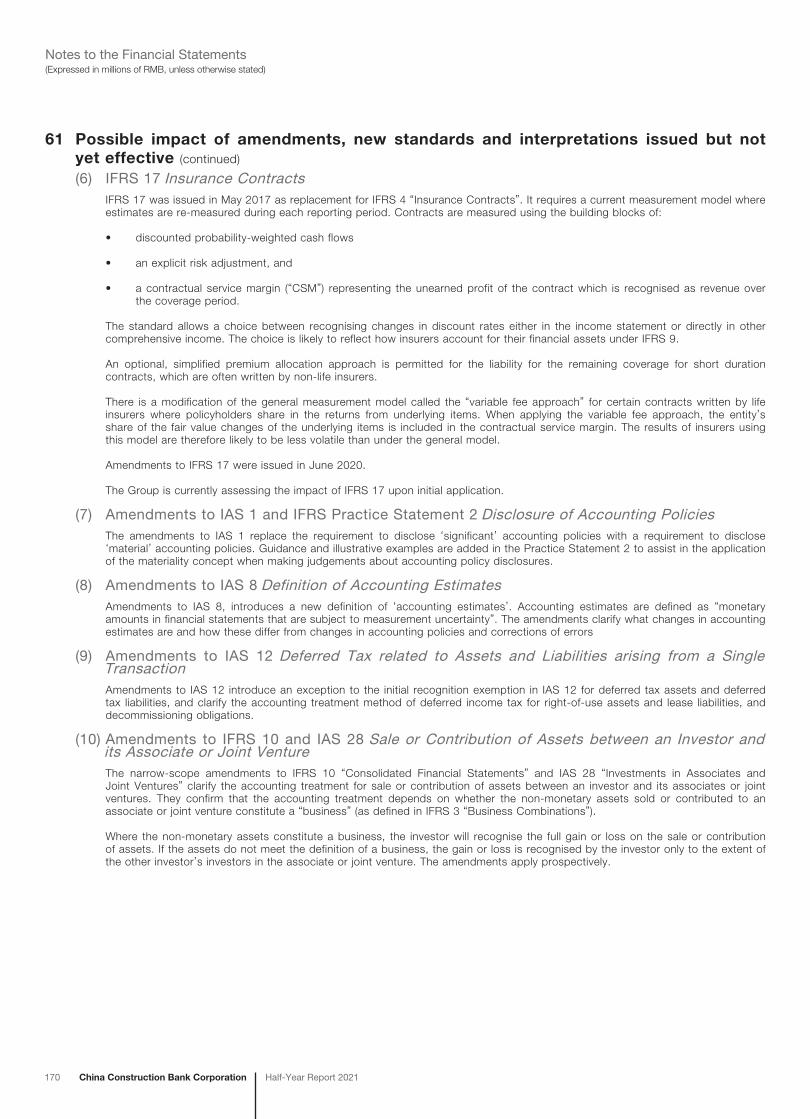
170 China Construction Bank Corporation Half-Year Report 2021
(Expressed in millions of RMB, unless otherwise stated)Notes to the Financial Statements
61 Possible impact of amendments, new standards and interpretations issued but not yet effective (continued)
(6) IFRS 17 Insurance ContractsIFRS 17 was issued in May 2017 as replacement for IFRS 4 “Insurance Contracts”. It requires a current measurement model where estimates are re-measured during each reporting period. Contracts are measured using the building blocks of:
• discounted probability-weighted cash flows
• an explicit risk adjustment, and
• a contractual service margin (“CSM”) representing the unearned profit of the contract which is recognised as revenue over the coverage period.
The standard allows a choice between recognising changes in discount rates either in the income statement or directly in other comprehensive income. The choice is likely to reflect how insurers account for their financial assets under IFRS 9.
An optional, simplified premium allocation approach is permitted for the liability for the remaining coverage for short duration contracts, which are often written by non-life insurers.
There is a modification of the general measurement model called the “variable fee approach” for certain contracts written by life insurers where policyholders share in the returns from underlying items. When applying the variable fee approach, the entity’s share of the fair value changes of the underlying items is included in the contractual service margin. The results of insurers using this model are therefore likely to be less volatile than under the general model.
Amendments to IFRS 17 were issued in June 2020.
The Group is currently assessing the impact of IFRS 17 upon initial application.
(7) Amendments to IAS 1 and IFRS Practice Statement 2 Disclosure of Accounting PoliciesThe amendments to IAS 1 replace the requirement to disclose ‘significant’ accounting policies with a requirement to disclose ‘material’ accounting policies. Guidance and illustrative examples are added in the Practice Statement 2 to assist in the application of the materiality concept when making judgements about accounting policy disclosures.
(8) Amendments to IAS 8 Definition of Accounting EstimatesAmendments to IAS 8, introduces a new definition of ‘accounting estimates’. Accounting estimates are defined as “monetary amounts in financial statements that are subject to measurement uncertainty”. The amendments clarify what changes in accounting estimates are and how these differ from changes in accounting policies and corrections of errors
(9) Amendments to IAS 12 Deferred Tax related to Assets and Liabilities arising from a Single TransactionAmendments to IAS 12 introduce an exception to the initial recognition exemption in IAS 12 for deferred tax assets and deferred tax liabilities, and clarify the accounting treatment method of deferred income tax for right-of-use assets and lease liabilities, and decommissioning obligations.
(10) Amendments to IFRS 10 and IAS 28 Sale or Contribution of Assets between an Investor and its Associate or Joint VentureThe narrow-scope amendments to IFRS 10 “Consolidated Financial Statements” and IAS 28 “Investments in Associates and Joint Ventures” clarify the accounting treatment for sale or contribution of assets between an investor and its associates or joint ventures. They confirm that the accounting treatment depends on whether the non-monetary assets sold or contributed to an associate or joint venture constitute a “business” (as defined in IFRS 3 “Business Combinations”).
Where the non-monetary assets constitute a business, the investor will recognise the full gain or loss on the sale or contribution of assets. If the assets do not meet the definition of a business, the gain or loss is recognised by the investor only to the extent of the other investor’s investors in the associate or joint venture. The amendments apply prospectively.
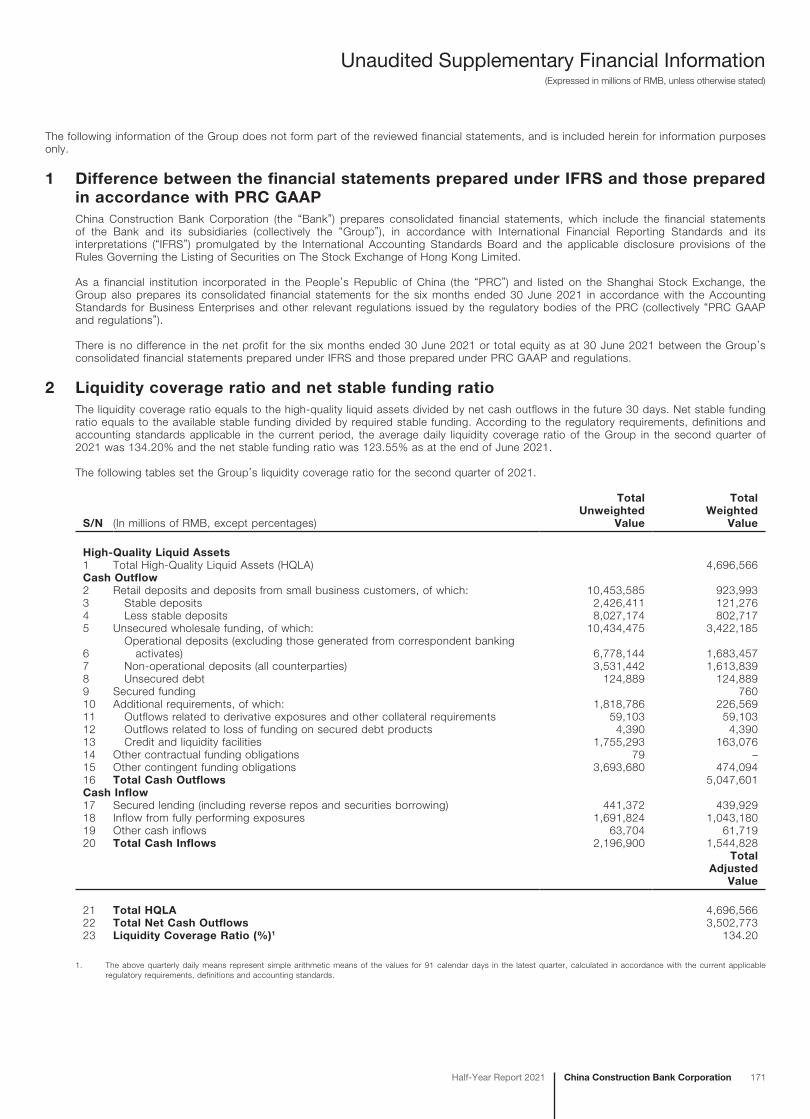
Unaudited Supplementary Financial Information(Expressed in millions of RMB, unless otherwise stated)
China Construction Bank CorporationHalf-Year Report 2021 171
The following information of the Group does not form part of the reviewed financial statements, and is included herein for information purposes only.
1 Difference between the financial statements prepared under IFRS and those prepared in accordance with PRC GAAPChina Construction Bank Corporation (the “Bank”) prepares consolidated financial statements, which include the financial statements of the Bank and its subsidiaries (collectively the “Group”), in accordance with International Financial Reporting Standards and its interpretations (“IFRS”) promulgated by the International Accounting Standards Board and the applicable disclosure provisions of the Rules Governing the Listing of Securities on The Stock Exchange of Hong Kong Limited.
As a financial institution incorporated in the People’s Republic of China (the “PRC”) and listed on the Shanghai Stock Exchange, the Group also prepares its consolidated financial statements for the six months ended 30 June 2021 in accordance with the Accounting Standards for Business Enterprises and other relevant regulations issued by the regulatory bodies of the PRC (collectively “PRC GAAP and regulations”).
There is no difference in the net profit for the six months ended 30 June 2021 or total equity as at 30 June 2021 between the Group’s consolidated financial statements prepared under IFRS and those prepared under PRC GAAP and regulations.
2 Liquidity coverage ratio and net stable funding ratioThe liquidity coverage ratio equals to the high-quality liquid assets divided by net cash outflows in the future 30 days. Net stable funding ratio equals to the available stable funding divided by required stable funding. According to the regulatory requirements, definitions and accounting standards applicable in the current period, the average daily liquidity coverage ratio of the Group in the second quarter of 2021 was 134.20% and the net stable funding ratio was 123.55% as at the end of June 2021.
The following tables set the Group’s liquidity coverage ratio for the second quarter of 2021.
S/N (In millions of RMB, except percentages)
Total Unweighted
Value
Total Weighted
Value
High-Quality Liquid Assets1 Total High-Quality Liquid Assets (HQLA) 4,696,566Cash Outflow2 Retail deposits and deposits from small business customers, of which: 10,453,585 923,9933 Stable deposits 2,426,411 121,2764 Less stable deposits 8,027,174 802,7175 Unsecured wholesale funding, of which: 10,434,475 3,422,185
6 Operational deposits (excluding those generated from correspondent banking activates) 6,778,144 1,683,457
7 Non-operational deposits (all counterparties) 3,531,442 1,613,8398 Unsecured debt 124,889 124,8899 Secured funding 76010 Additional requirements, of which: 1,818,786 226,56911 Outflows related to derivative exposures and other collateral requirements 59,103 59,10312 Outflows related to loss of funding on secured debt products 4,390 4,39013 Credit and liquidity facilities 1,755,293 163,07614 Other contractual funding obligations 79 –15 Other contingent funding obligations 3,693,680 474,09416 Total Cash Outflows 5,047,601Cash Inflow17 Secured lending (including reverse repos and securities borrowing) 441,372 439,92918 Inflow from fully performing exposures 1,691,824 1,043,18019 Other cash inflows 63,704 61,71920 Total Cash Inflows 2,196,900 1,544,828
Total Adjusted
Value
21 Total HQLA 4,696,56622 Total Net Cash Outflows 3,502,77323 Liquidity Coverage Ratio (%)1 134.20
1. The above quarterly daily means represent simple arithmetic means of the values for 91 calendar days in the latest quarter, calculated in accordance with the current applicable regulatory requirements, definitions and accounting standards.
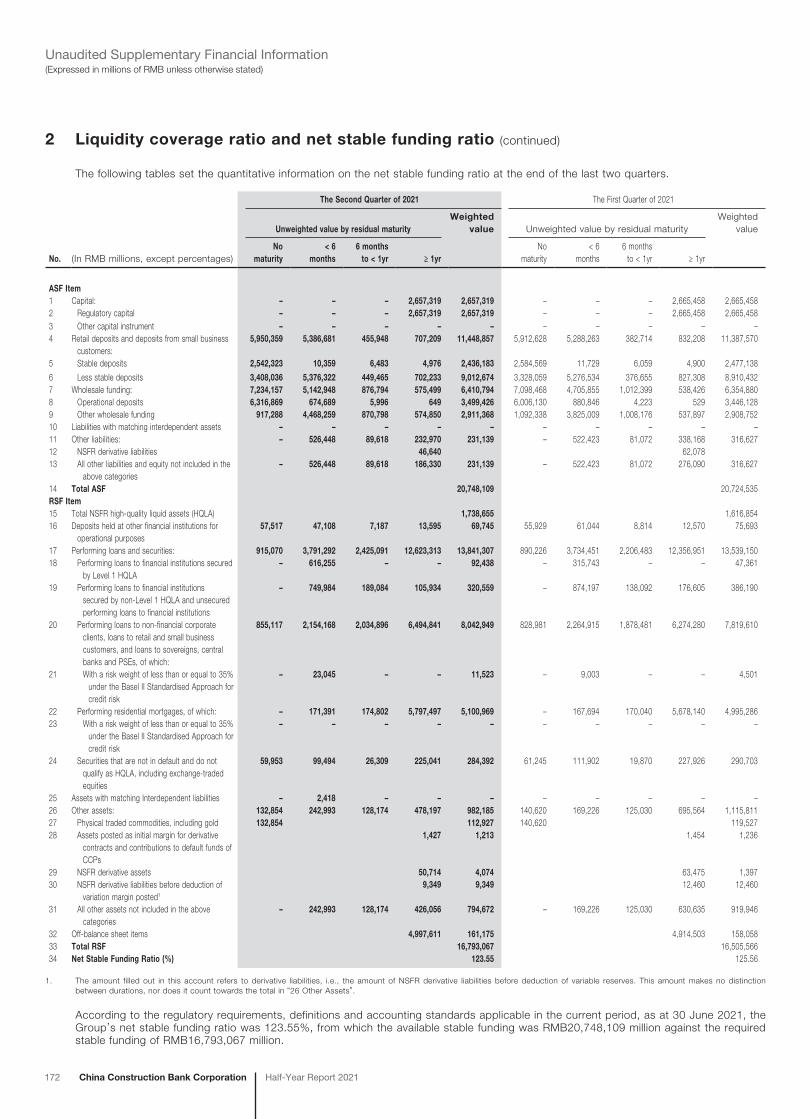
172 China Construction Bank Corporation Half-Year Report 2021
(Expressed in millions of RMB unless otherwise stated)Unaudited Supplementary Financial Information
2 Liquidity coverage ratio and net stable funding ratio (continued)
The following tables set the quantitative information on the net stable funding ratio at the end of the last two quarters.
The Second Quarter of 2021 The First Quarter of 2021
Unweighted value by residual maturityWeighted
value Unweighted value by residual maturityWeighted
value
No. (In RMB millions, except percentages)No
maturity< 6
months6 months
to < 1yr ≥ 1yr No
maturity< 6
months6 months
to < 1yr ≥ 1yr
ASF Item1 Capital: – – – 2,657,319 2,657,319 – – – 2,665,458 2,665,4582 Regulatory capital – – – 2,657,319 2,657,319 – – – 2,665,458 2,665,4583 Other capital instrument – – – – – – – – – –4 Retail deposits and deposits from small business
customers:5,950,359 5,386,681 455,948 707,209 11,448,857 5,912,628 5,288,263 382,714 832,208 11,387,570
5 Stable deposits 2,542,323 10,359 6,483 4,976 2,436,183 2,584,569 11,729 6,059 4,900 2,477,138
6 Less stable deposits 3,408,036 5,376,322 449,465 702,233 9,012,674 3,328,059 5,276,534 376,655 827,308 8,910,4327 Wholesale funding: 7,234,157 5,142,948 876,794 575,499 6,410,794 7,098,468 4,705,855 1,012,399 538,426 6,354,8808 Operational deposits 6,316,869 674,689 5,996 649 3,499,426 6,006,130 880,846 4,223 529 3,446,1289 Other wholesale funding 917,288 4,468,259 870,798 574,850 2,911,368 1,092,338 3,825,009 1,008,176 537,897 2,908,75210 Liabilities with matching interdependent assets – – – – – – – – – –11 Other liabilities: – 526,448 89,618 232,970 231,139 – 522,423 81,072 338,168 316,62712 NSFR derivative liabilities 46,640 62,07813 All other liabilities and equity not included in the
above categories– 526,448 89,618 186,330 231,139 – 522,423 81,072 276,090 316,627
14 Total ASF 20,748,109 20,724,535RSF Item15 Total NSFR high-quality liquid assets (HQLA) 1,738,655 1,616,85416 Deposits held at other financial institutions for
operational purposes57,517 47,108 7,187 13,595 69,745 55,929 61,044 8,814 12,570 75,693
17 Performing loans and securities: 915,070 3,791,292 2,425,091 12,623,313 13,841,307 890,226 3,734,451 2,206,483 12,356,951 13,539,15018 Performing loans to financial institutions secured
by Level 1 HQLA– 616,255 – – 92,438 – 315,743 – – 47,361
19 Performing loans to financial institutions secured by non-Level 1 HQLA and unsecured performing loans to financial institutions
– 749,984 189,084 105,934 320,559 – 874,197 138,092 176,605 386,190
20 Performing loans to non-financial corporate clients, loans to retail and small business customers, and loans to sovereigns, central banks and PSEs, of which:
855,117 2,154,168 2,034,896 6,494,841 8,042,949 828,981 2,264,915 1,878,481 6,274,280 7,819,610
21 With a risk weight of less than or equal to 35% under the Basel II Standardised Approach for credit risk
– 23,045 – – 11,523 – 9,003 – – 4,501
22 Performing residential mortgages, of which: – 171,391 174,802 5,797,497 5,100,969 – 167,694 170,040 5,678,140 4,995,28623 With a risk weight of less than or equal to 35%
under the Basel II Standardised Approach for credit risk
– – – – – – – – – –
24 Securities that are not in default and do not qualify as HQLA, including exchange-traded equities
59,953 99,494 26,309 225,041 284,392 61,245 111,902 19,870 227,926 290,703
25 Assets with matching Interdependent liabilities – 2,418 – – – – – – – –26 Other assets: 132,854 242,993 128,174 478,197 982,185 140,620 169,226 125,030 695,564 1,115,81127 Physical traded commodities, including gold 132,854 112,927 140,620 119,52728 Assets posted as initial margin for derivative
contracts and contributions to default funds of CCPs
1,427 1,213 1,454 1,236
29 NSFR derivative assets 50,714 4,074 63,475 1,39730 NSFR derivative liabilities before deduction of
variation margin posted1
9,349 9,349 12,460 12,460
31 All other assets not included in the above categories
– 242,993 128,174 426,056 794,672 – 169,226 125,030 630,635 919,946
32 Off-balance sheet items 4,997,611 161,175 4,914,503 158,05833 Total RSF 16,793,067 16,505,56634 Net Stable Funding Ratio (%) 123.55 125.56
1. The amount filled out in this account refers to derivative liabilities, i.e., the amount of NSFR derivative liabilities before deduction of variable reserves. This amount makes no distinction between durations, nor does it count towards the total in “26 Other Assets”.
According to the regulatory requirements, definitions and accounting standards applicable in the current period, as at 30 June 2021, the Group’s net stable funding ratio was 123.55%, from which the available stable funding was RMB20,748,109 million against the required stable funding of RMB16,793,067 million.
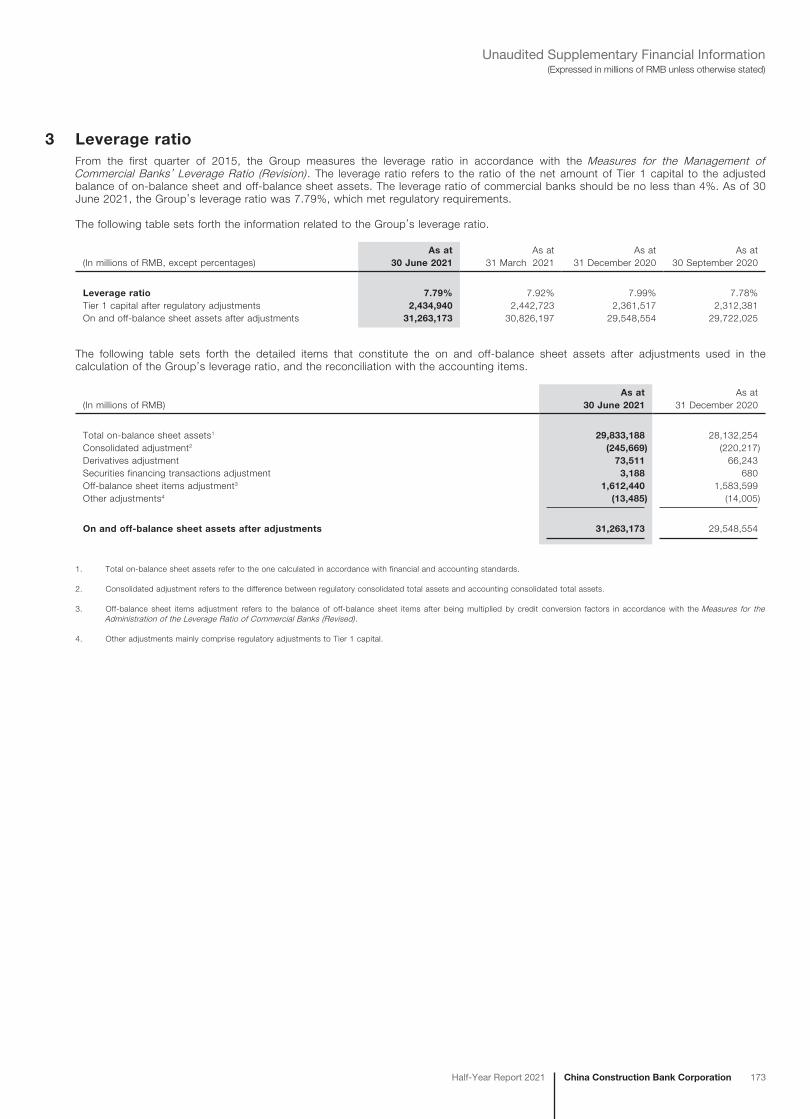
China Construction Bank CorporationHalf-Year Report 2021 173
(Expressed in millions of RMB unless otherwise stated) Unaudited Supplementary Financial Information
3 Leverage ratioFrom the first quarter of 2015, the Group measures the leverage ratio in accordance with the Measures for the Management of Commercial Banks’ Leverage Ratio (Revision) . The leverage ratio refers to the ratio of the net amount of Tier 1 capital to the adjusted balance of on-balance sheet and off-balance sheet assets. The leverage ratio of commercial banks should be no less than 4%. As of 30 June 2021, the Group’s leverage ratio was 7.79%, which met regulatory requirements.
The following table sets forth the information related to the Group’s leverage ratio.
(In millions of RMB, except percentages)As at
30 June 2021As at
31 March 2021As at
31 December 2020As at
30 September 2020
Leverage ratio 7.79% 7.92% 7.99% 7.78%Tier 1 capital after regulatory adjustments 2,434,940 2,442,723 2,361,517 2,312,381On and off-balance sheet assets after adjustments 31,263,173 30,826,197 29,548,554 29,722,025
The following table sets forth the detailed items that constitute the on and off-balance sheet assets after adjustments used in the calculation of the Group’s leverage ratio, and the reconciliation with the accounting items.
(In millions of RMB)As at
30 June 2021As at
31 December 2020
Total on-balance sheet assets1 29,833,188 28,132,254Consolidated adjustment2 (245,669) (220,217)Derivatives adjustment 73,511 66,243Securities financing transactions adjustment 3,188 680Off-balance sheet items adjustment3 1,612,440 1,583,599Other adjustments4 (13,485) (14,005)
On and off-balance sheet assets after adjustments 31,263,173 29,548,554
1. Total on-balance sheet assets refer to the one calculated in accordance with financial and accounting standards.
2. Consolidated adjustment refers to the difference between regulatory consolidated total assets and accounting consolidated total assets.
3. Off-balance sheet items adjustment refers to the balance of off-balance sheet items after being multiplied by credit conversion factors in accordance with the Measures for the Administration of the Leverage Ratio of Commercial Banks (Revised) .
4. Other adjustments mainly comprise regulatory adjustments to Tier 1 capital.
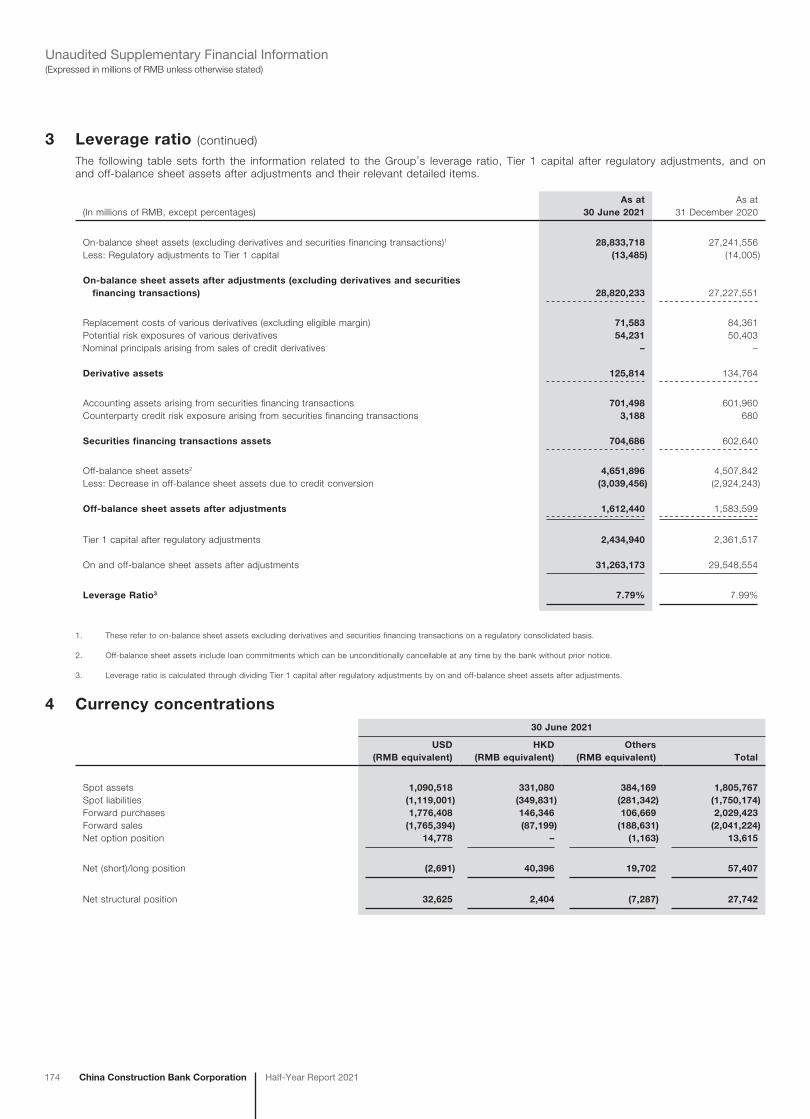
174 China Construction Bank Corporation Half-Year Report 2021
(Expressed in millions of RMB unless otherwise stated)Unaudited Supplementary Financial Information
3 Leverage ratio (continued)
The following table sets forth the information related to the Group’s leverage ratio, Tier 1 capital after regulatory adjustments, and on and off-balance sheet assets after adjustments and their relevant detailed items.
(In millions of RMB, except percentages)As at
30 June 2021As at
31 December 2020
On-balance sheet assets (excluding derivatives and securities financing transactions)1 28,833,718 27,241,556Less: Regulatory adjustments to Tier 1 capital (13,485) (14,005)
On-balance sheet assets after adjustments (excluding derivatives and securities financing transactions) 28,820,233 27,227,551
Replacement costs of various derivatives (excluding eligible margin) 71,583 84,361Potential risk exposures of various derivatives 54,231 50,403Nominal principals arising from sales of credit derivatives – –
Derivative assets 125,814 134,764
Accounting assets arising from securities financing transactions 701,498 601,960Counterparty credit risk exposure arising from securities financing transactions 3,188 680
Securities financing transactions assets 704,686 602,640
Off-balance sheet assets2 4,651,896 4,507,842Less: Decrease in off-balance sheet assets due to credit conversion (3,039,456) (2,924,243)
Off-balance sheet assets after adjustments 1,612,440 1,583,599
Tier 1 capital after regulatory adjustments 2,434,940 2,361,517
On and off-balance sheet assets after adjustments 31,263,173 29,548,554
Leverage Ratio3 7.79% 7.99%
1. These refer to on-balance sheet assets excluding derivatives and securities financing transactions on a regulatory consolidated basis.
2. Off-balance sheet assets include loan commitments which can be unconditionally cancellable at any time by the bank without prior notice.
3. Leverage ratio is calculated through dividing Tier 1 capital after regulatory adjustments by on and off-balance sheet assets after adjustments.
4 Currency concentrations30 June 2021
USD (RMB equivalent)
HKD (RMB equivalent)
Others (RMB equivalent) Total
Spot assets 1,090,518 331,080 384,169 1,805,767Spot liabilities (1,119,001) (349,831) (281,342) (1,750,174)Forward purchases 1,776,408 146,346 106,669 2,029,423Forward sales (1,765,394) (87,199) (188,631) (2,041,224)Net option position 14,778 – (1,163) 13,615
Net (short)/long position (2,691) 40,396 19,702 57,407
Net structural position 32,625 2,404 (7,287) 27,742
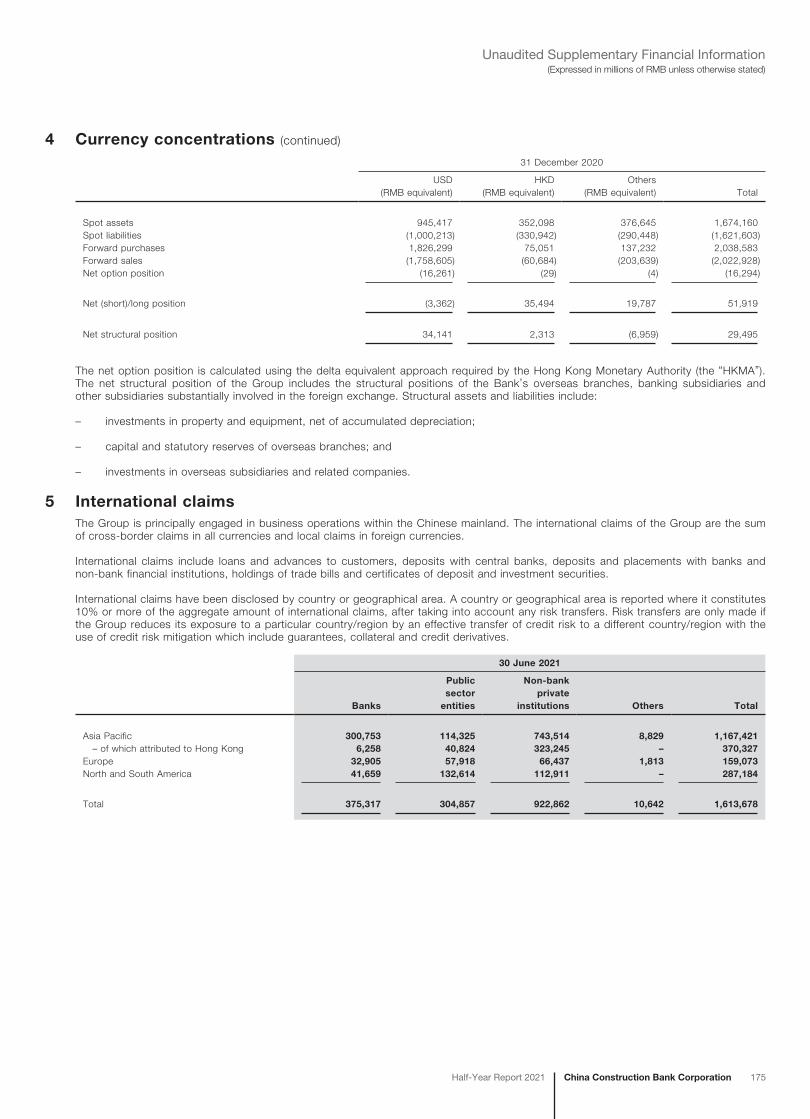
China Construction Bank CorporationHalf-Year Report 2021 175
(Expressed in millions of RMB unless otherwise stated) Unaudited Supplementary Financial Information
4 Currency concentrations (continued)
31 December 2020
USD (RMB equivalent)
HKD (RMB equivalent)
Others (RMB equivalent) Total
Spot assets 945,417 352,098 376,645 1,674,160Spot liabilities (1,000,213) (330,942) (290,448) (1,621,603)Forward purchases 1,826,299 75,051 137,232 2,038,583Forward sales (1,758,605) (60,684) (203,639) (2,022,928)Net option position (16,261) (29) (4) (16,294)
Net (short)/long position (3,362) 35,494 19,787 51,919
Net structural position 34,141 2,313 (6,959) 29,495
The net option position is calculated using the delta equivalent approach required by the Hong Kong Monetary Authority (the “HKMA”). The net structural position of the Group includes the structural positions of the Bank’s overseas branches, banking subsidiaries and other subsidiaries substantially involved in the foreign exchange. Structural assets and liabilities include:
– investments in property and equipment, net of accumulated depreciation;
– capital and statutory reserves of overseas branches; and
– investments in overseas subsidiaries and related companies.
5 International claimsThe Group is principally engaged in business operations within the Chinese mainland. The international claims of the Group are the sum of cross-border claims in all currencies and local claims in foreign currencies.
International claims include loans and advances to customers, deposits with central banks, deposits and placements with banks and non-bank financial institutions, holdings of trade bills and certificates of deposit and investment securities.
International claims have been disclosed by country or geographical area. A country or geographical area is reported where it constitutes 10% or more of the aggregate amount of international claims, after taking into account any risk transfers. Risk transfers are only made if the Group reduces its exposure to a particular country/region by an effective transfer of credit risk to a different country/region with the use of credit risk mitigation which include guarantees, collateral and credit derivatives.
30 June 2021
Banks
Public sector
entities
Non-bank private
institutions Others Total
Asia Pacific 300,753 114,325 743,514 8,829 1,167,421 – of which attributed to Hong Kong 6,258 40,824 323,245 – 370,327Europe 32,905 57,918 66,437 1,813 159,073North and South America 41,659 132,614 112,911 – 287,184
Total 375,317 304,857 922,862 10,642 1,613,678
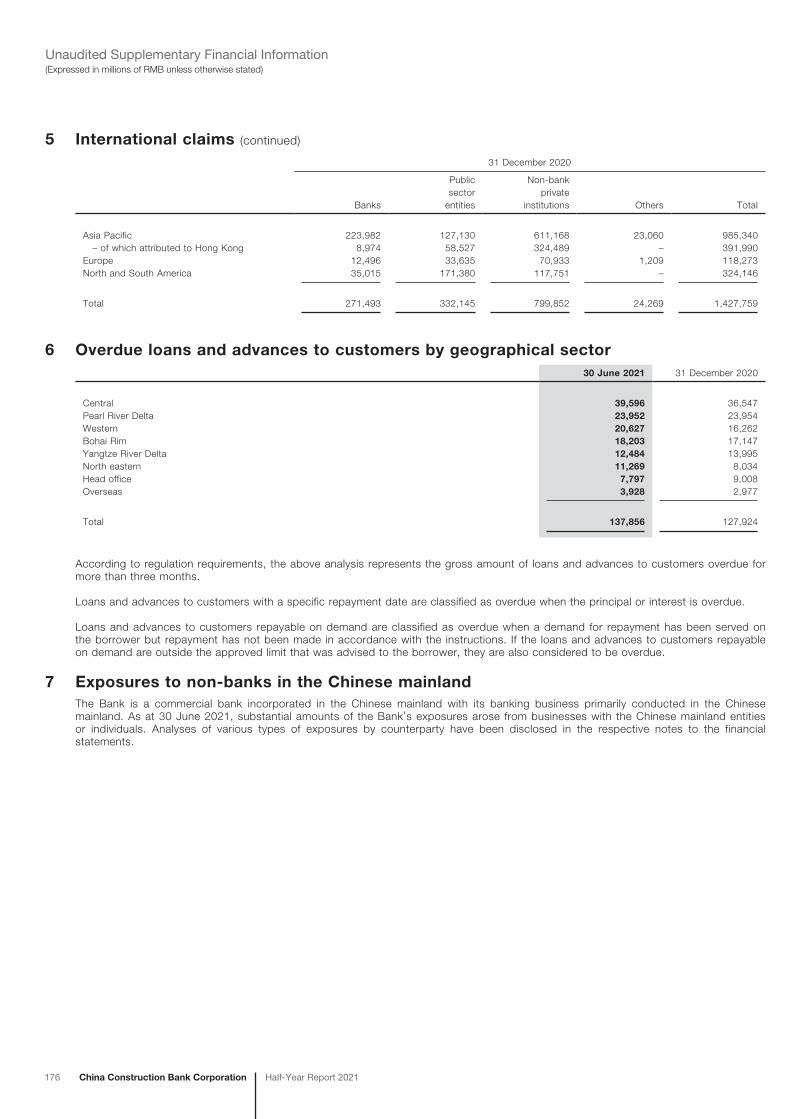
176 China Construction Bank Corporation Half-Year Report 2021
(Expressed in millions of RMB unless otherwise stated)Unaudited Supplementary Financial Information
5 International claims (continued)
31 December 2020
Banks
Public sector
entities
Non-bank private
institutions Others Total
Asia Pacific 223,982 127,130 611,168 23,060 985,340 – of which attributed to Hong Kong 8,974 58,527 324,489 – 391,990Europe 12,496 33,635 70,933 1,209 118,273North and South America 35,015 171,380 117,751 – 324,146
Total 271,493 332,145 799,852 24,269 1,427,759
6 Overdue loans and advances to customers by geographical sector30 June 2021 31 December 2020
Central 39,596 36,547Pearl River Delta 23,952 23,954Western 20,627 16,262Bohai Rim 18,203 17,147Yangtze River Delta 12,484 13,995North eastern 11,269 8,034Head office 7,797 9,008Overseas 3,928 2,977
Total 137,856 127,924
According to regulation requirements, the above analysis represents the gross amount of loans and advances to customers overdue for more than three months.
Loans and advances to customers with a specific repayment date are classified as overdue when the principal or interest is overdue.
Loans and advances to customers repayable on demand are classified as overdue when a demand for repayment has been served on the borrower but repayment has not been made in accordance with the instructions. If the loans and advances to customers repayable on demand are outside the approved limit that was advised to the borrower, they are also considered to be overdue.
7 Exposures to non-banks in the Chinese mainlandThe Bank is a commercial bank incorporated in the Chinese mainland with its banking business primarily conducted in the Chinese mainland. As at 30 June 2021, substantial amounts of the Bank’s exposures arose from businesses with the Chinese mainland entities or individuals. Analyses of various types of exposures by counterparty have been disclosed in the respective notes to the financial statements.
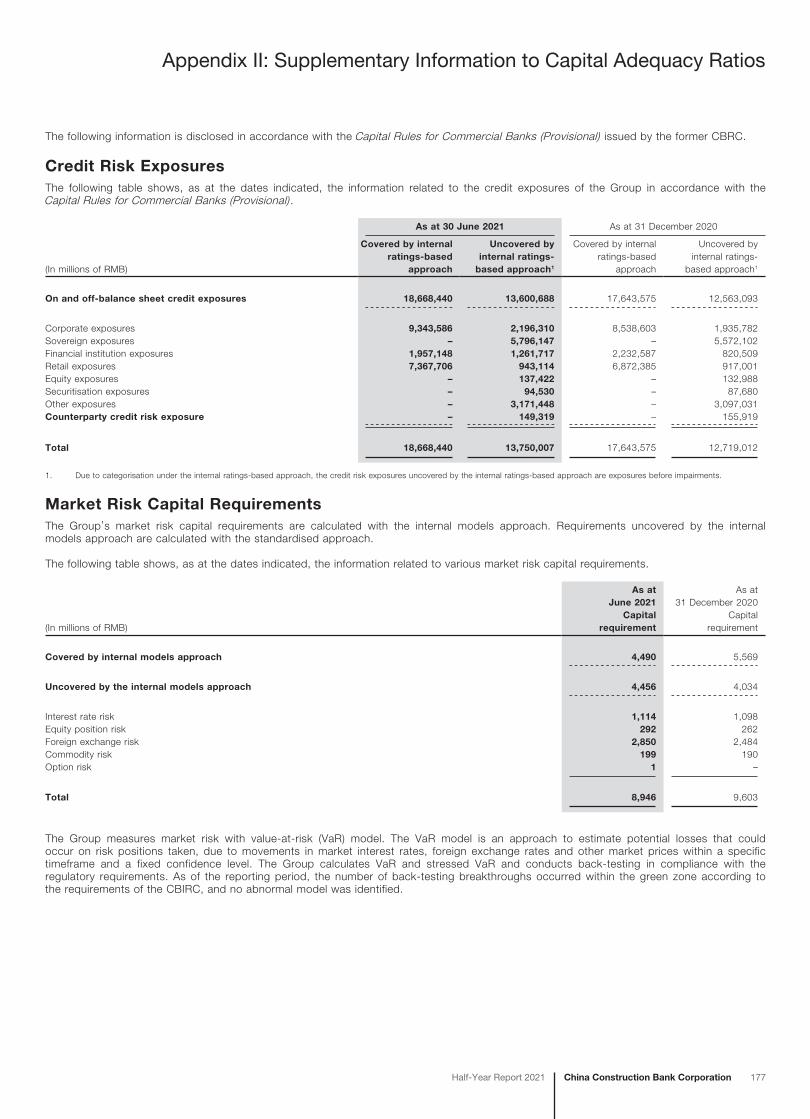
Appendix II: Supplementary Information to Capital Adequacy Ratios
China Construction Bank CorporationHalf-Year Report 2021 177
The following information is disclosed in accordance with the Capital Rules for Commercial Banks (Provisional) issued by the former CBRC.
Credit Risk ExposuresThe following table shows, as at the dates indicated, the information related to the credit exposures of the Group in accordance with the Capital Rules for Commercial Banks (Provisional) .
As at 30 June 2021 As at 31 December 2020
(In millions of RMB)
Covered by internal ratings-based
approach
Uncovered by internal ratings-
based approach1
Covered by internal ratings-based
approach
Uncovered by internal ratings-
based approach1
On and off-balance sheet credit exposures 18,668,440 13,600,688 17,643,575 12,563,093
Corporate exposures 9,343,586 2,196,310 8,538,603 1,935,782Sovereign exposures – 5,796,147 – 5,572,102Financial institution exposures 1,957,148 1,261,717 2,232,587 820,509Retail exposures 7,367,706 943,114 6,872,385 917,001Equity exposures – 137,422 – 132,988Securitisation exposures – 94,530 – 87,680Other exposures – 3,171,448 – 3,097,031Counterparty credit risk exposure – 149,319 – 155,919
Total 18,668,440 13,750,007 17,643,575 12,719,012
1. Due to categorisation under the internal ratings-based approach, the credit risk exposures uncovered by the internal ratings-based approach are exposures before impairments.
Market Risk Capital RequirementsThe Group’s market risk capital requirements are calculated with the internal models approach. Requirements uncovered by the internal models approach are calculated with the standardised approach.
The following table shows, as at the dates indicated, the information related to various market risk capital requirements.
As at June 2021
As at 31 December 2020
(In millions of RMB)Capital
requirementCapital
requirement
Covered by internal models approach 4,490 5,569
Uncovered by the internal models approach 4,456 4,034
Interest rate risk 1,114 1,098Equity position risk 292 262Foreign exchange risk 2,850 2,484Commodity risk 199 190Option risk 1 –
Total 8,946 9,603
The Group measures market risk with value-at-risk (VaR) model. The VaR model is an approach to estimate potential losses that could occur on risk positions taken, due to movements in market interest rates, foreign exchange rates and other market prices within a specific timeframe and a fixed confidence level. The Group calculates VaR and stressed VaR and conducts back-testing in compliance with the regulatory requirements. As of the reporting period, the number of back-testing breakthroughs occurred within the green zone according to the requirements of the CBIRC, and no abnormal model was identified.
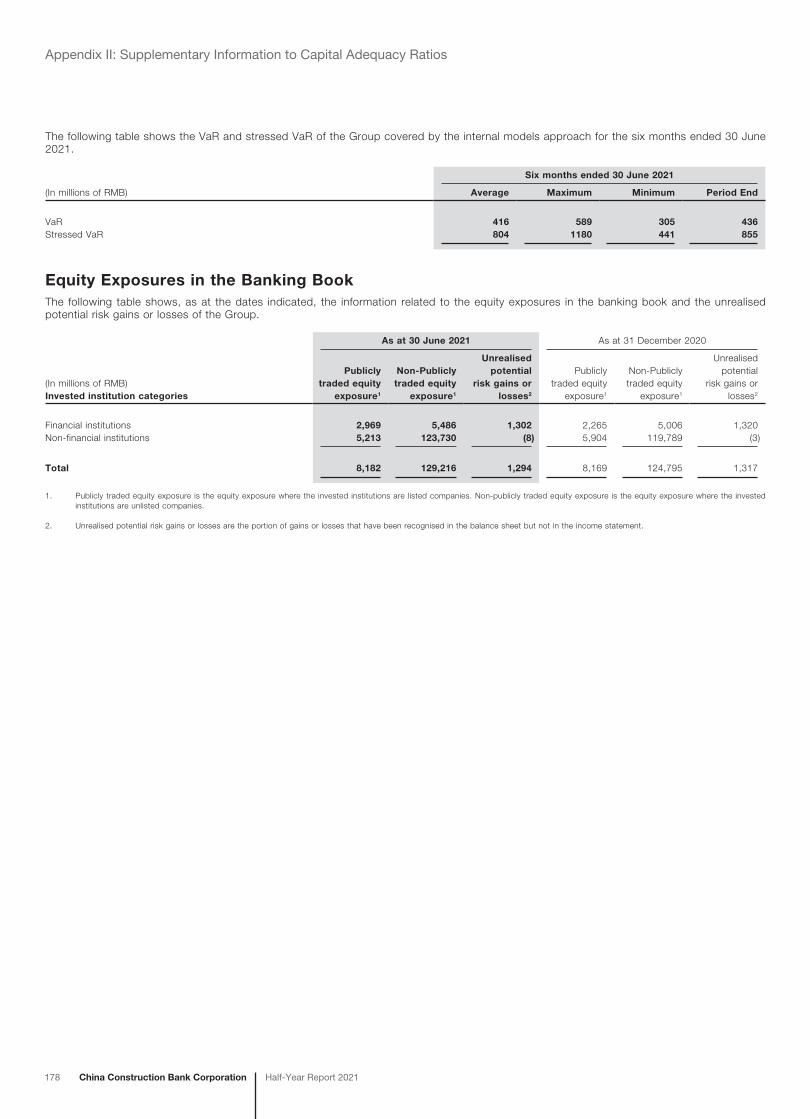
178 China Construction Bank Corporation Half-Year Report 2021
Appendix II: Supplementary Information to Capital Adequacy Ratios
The following table shows the VaR and stressed VaR of the Group covered by the internal models approach for the six months ended 30 June 2021.
Six months ended 30 June 2021
(In millions of RMB) Average Maximum Minimum Period End
VaR 416 589 305 436Stressed VaR 804 1180 441 855
Equity Exposures in the Banking BookThe following table shows, as at the dates indicated, the information related to the equity exposures in the banking book and the unrealised potential risk gains or losses of the Group.
As at 30 June 2021 As at 31 December 2020
(In millions of RMB)Invested institution categories
Publicly traded equity
exposure1
Non-Publicly traded equity
exposure1
Unrealised potential
risk gains or losses2
Publicly traded equity
exposure1
Non-Publicly traded equity
exposure1
Unrealised potential
risk gains or losses2
Financial institutions 2,969 5,486 1,302 2,265 5,006 1,320Non-financial institutions 5,213 123,730 (8) 5,904 119,789 (3)
Total 8,182 129,216 1,294 8,169 124,795 1,317
1. Publicly traded equity exposure is the equity exposure where the invested institutions are listed companies. Non-publicly traded equity exposure is the equity exposure where the invested institutions are unlisted companies.
2. Unrealised potential risk gains or losses are the portion of gains or losses that have been recognised in the balance sheet but not in the income statement.
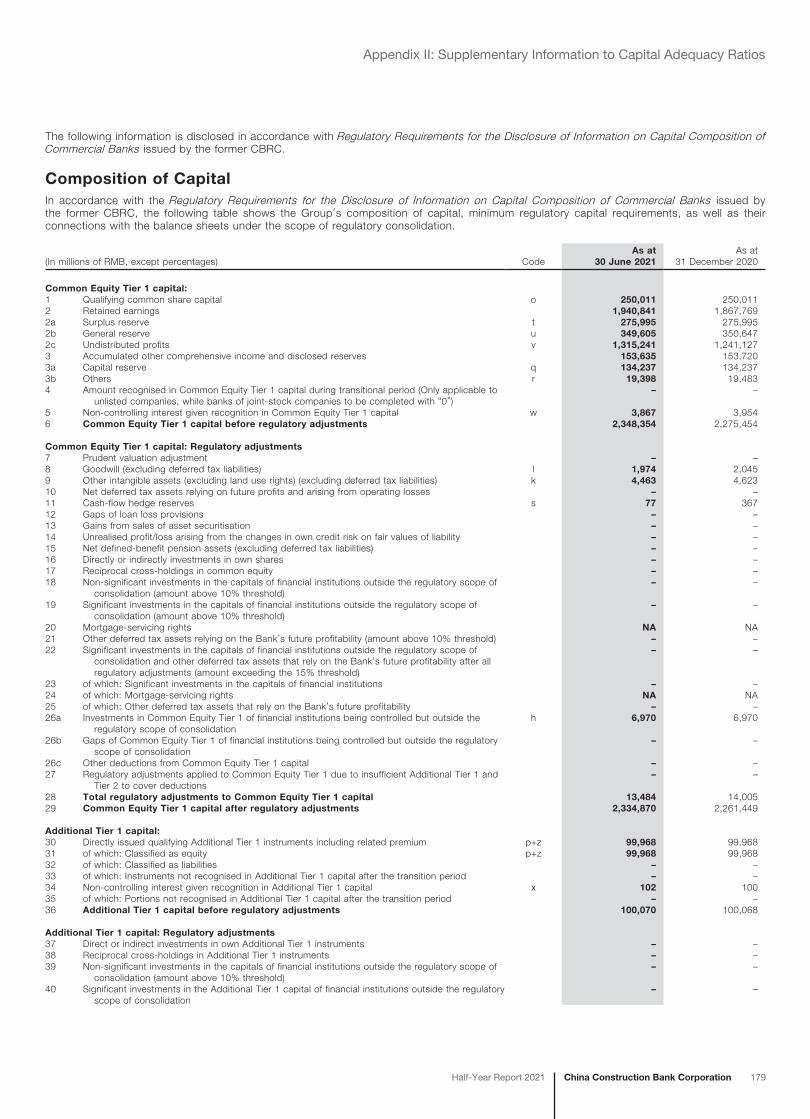
China Construction Bank CorporationHalf-Year Report 2021 179
Appendix II: Supplementary Information to Capital Adequacy Ratios
The following information is disclosed in accordance with Regulatory Requirements for the Disclosure of Information on Capital Composition of Commercial Banks issued by the former CBRC.
Composition of CapitalIn accordance with the Regulatory Requirements for the Disclosure of Information on Capital Composition of Commercial Banks issued by the former CBRC, the following table shows the Group’s composition of capital, minimum regulatory capital requirements, as well as their connections with the balance sheets under the scope of regulatory consolidation.
(In millions of RMB, except percentages) CodeAs at
30 June 2021As at
31 December 2020
Common Equity Tier 1 capital:1 Qualifying common share capital o 250,011 250,0112 Retained earnings 1,940,841 1,867,7692a Surplus reserve t 275,995 275,9952b General reserve u 349,605 350,6472c Undistributed profits v 1,315,241 1,241,1273 Accumulated other comprehensive income and disclosed reserves 153,635 153,7203a Capital reserve q 134,237 134,2373b Others r 19,398 19,4834 Amount recognised in Common Equity Tier 1 capital during transitional period (Only applicable to
unlisted companies, while banks of joint-stock companies to be completed with “0”) – –
5 Non-controlling interest given recognition in Common Equity Tier 1 capital w 3,867 3,9546 Common Equity Tier 1 capital before regulatory adjustments 2,348,354 2,275,454
Common Equity Tier 1 capital: Regulatory adjustments7 Prudent valuation adjustment – –8 Goodwill (excluding deferred tax liabilities) l 1,974 2,0459 Other intangible assets (excluding land use rights) (excluding deferred tax liabilities) k 4,463 4,62310 Net deferred tax assets relying on future profits and arising from operating losses – –11 Cash-flow hedge reserves s 77 36712 Gaps of loan loss provisions – –13 Gains from sales of asset securitisation – –14 Unrealised profit/loss arising from the changes in own credit risk on fair values of liability – –15 Net defined-benefit pension assets (excluding deferred tax liabilities) – –16 Directly or indirectly investments in own shares – –17 Reciprocal cross-holdings in common equity – –18 Non-significant investments in the capitals of financial institutions outside the regulatory scope of
consolidation (amount above 10% threshold) – –
19 Significant investments in the capitals of financial institutions outside the regulatory scope of consolidation (amount above 10% threshold)
– –
20 Mortgage-servicing rights NA NA21 Other deferred tax assets relying on the Bank’s future profitability (amount above 10% threshold) – –22 Significant investments in the capitals of financial institutions outside the regulatory scope of
consolidation and other deferred tax assets that rely on the Bank’s future profitability after all regulatory adjustments (amount exceeding the 15% threshold)
– –
23 of which: Significant investments in the capitals of financial institutions – –24 of which: Mortgage-servicing rights NA NA25 of which: Other deferred tax assets that rely on the Bank’s future profitability – –26a Investments in Common Equity Tier 1 of financial institutions being controlled but outside the
regulatory scope of consolidationh 6,970 6,970
26b Gaps of Common Equity Tier 1 of financial institutions being controlled but outside the regulatory scope of consolidation
– –
26c Other deductions from Common Equity Tier 1 capital – –27 Regulatory adjustments applied to Common Equity Tier 1 due to insufficient Additional Tier 1 and
Tier 2 to cover deductions – –
28 Total regulatory adjustments to Common Equity Tier 1 capital 13,484 14,00529 Common Equity Tier 1 capital after regulatory adjustments 2,334,870 2,261,449
Additional Tier 1 capital:30 Directly issued qualifying Additional Tier 1 instruments including related premium p+z 99,968 99,96831 of which: Classified as equity p+z 99,968 99,96832 of which: Classified as liabilities – –33 of which: Instruments not recognised in Additional Tier 1 capital after the transition period – –34 Non-controlling interest given recognition in Additional Tier 1 capital x 102 10035 of which: Portions not recognised in Additional Tier 1 capital after the transition period – –36 Additional Tier 1 capital before regulatory adjustments 100,070 100,068
Additional Tier 1 capital: Regulatory adjustments37 Direct or indirect investments in own Additional Tier 1 instruments – –38 Reciprocal cross-holdings in Additional Tier 1 instruments – –39 Non-significant investments in the capitals of financial institutions outside the regulatory scope of
consolidation (amount above 10% threshold) – –
40 Significant investments in the Additional Tier 1 capital of financial institutions outside the regulatory scope of consolidation
– –
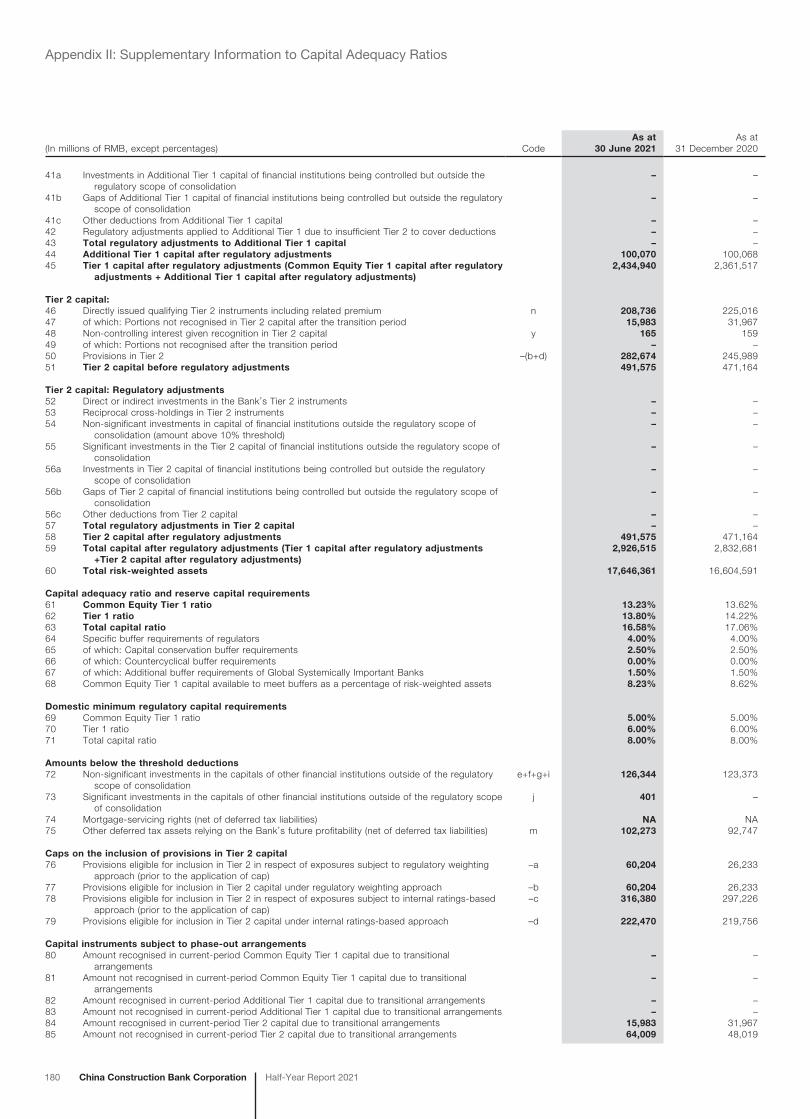
180 China Construction Bank Corporation Half-Year Report 2021
Appendix II: Supplementary Information to Capital Adequacy Ratios
(In millions of RMB, except percentages) CodeAs at
30 June 2021As at
31 December 2020
41a Investments in Additional Tier 1 capital of financial institutions being controlled but outside the regulatory scope of consolidation
– –
41b Gaps of Additional Tier 1 capital of financial institutions being controlled but outside the regulatory scope of consolidation
– –
41c Other deductions from Additional Tier 1 capital – –42 Regulatory adjustments applied to Additional Tier 1 due to insufficient Tier 2 to cover deductions – –43 Total regulatory adjustments to Additional Tier 1 capital – –44 Additional Tier 1 capital after regulatory adjustments 100,070 100,06845 Tier 1 capital after regulatory adjustments (Common Equity Tier 1 capital after regulatory
adjustments + Additional Tier 1 capital after regulatory adjustments) 2,434,940 2,361,517
Tier 2 capital:46 Directly issued qualifying Tier 2 instruments including related premium n 208,736 225,01647 of which: Portions not recognised in Tier 2 capital after the transition period 15,983 31,96748 Non-controlling interest given recognition in Tier 2 capital y 165 15949 of which: Portions not recognised after the transition period – –50 Provisions in Tier 2 –(b+d) 282,674 245,98951 Tier 2 capital before regulatory adjustments 491,575 471,164
Tier 2 capital: Regulatory adjustments52 Direct or indirect investments in the Bank’s Tier 2 instruments – –53 Reciprocal cross-holdings in Tier 2 instruments – –54 Non-significant investments in capital of financial institutions outside the regulatory scope of
consolidation (amount above 10% threshold) – –
55 Significant investments in the Tier 2 capital of financial institutions outside the regulatory scope of consolidation
– –
56a Investments in Tier 2 capital of financial institutions being controlled but outside the regulatory scope of consolidation
– –
56b Gaps of Tier 2 capital of financial institutions being controlled but outside the regulatory scope of consolidation
– –
56c Other deductions from Tier 2 capital – –57 Total regulatory adjustments in Tier 2 capital – –58 Tier 2 capital after regulatory adjustments 491,575 471,16459 Total capital after regulatory adjustments (Tier 1 capital after regulatory adjustments
+Tier 2 capital after regulatory adjustments) 2,926,515 2,832,681
60 Total risk-weighted assets 17,646,361 16,604,591
Capital adequacy ratio and reserve capital requirements61 Common Equity Tier 1 ratio 13.23% 13.62%62 Tier 1 ratio 13.80% 14.22%63 Total capital ratio 16.58% 17.06%64 Specific buffer requirements of regulators 4.00% 4.00%65 of which: Capital conservation buffer requirements 2.50% 2.50%66 of which: Countercyclical buffer requirements 0.00% 0.00%67 of which: Additional buffer requirements of Global Systemically Important Banks 1.50% 1.50%68 Common Equity Tier 1 capital available to meet buffers as a percentage of risk-weighted assets 8.23% 8.62%
Domestic minimum regulatory capital requirements69 Common Equity Tier 1 ratio 5.00% 5.00%70 Tier 1 ratio 6.00% 6.00%71 Total capital ratio 8.00% 8.00%
Amounts below the threshold deductions72 Non-significant investments in the capitals of other financial institutions outside of the regulatory
scope of consolidatione+f+g+i 126,344 123,373
73 Significant investments in the capitals of other financial institutions outside of the regulatory scope of consolidation
j 401 –
74 Mortgage-servicing rights (net of deferred tax liabilities) NA NA75 Other deferred tax assets relying on the Bank’s future profitability (net of deferred tax liabilities) m 102,273 92,747
Caps on the inclusion of provisions in Tier 2 capital76 Provisions eligible for inclusion in Tier 2 in respect of exposures subject to regulatory weighting
approach (prior to the application of cap)–a 60,204 26,233
77 Provisions eligible for inclusion in Tier 2 capital under regulatory weighting approach –b 60,204 26,23378 Provisions eligible for inclusion in Tier 2 in respect of exposures subject to internal ratings-based
approach (prior to the application of cap)–c 316,380 297,226
79 Provisions eligible for inclusion in Tier 2 capital under internal ratings-based approach –d 222,470 219,756
Capital instruments subject to phase-out arrangements80 Amount recognised in current-period Common Equity Tier 1 capital due to transitional
arrangements – –
81 Amount not recognised in current-period Common Equity Tier 1 capital due to transitional arrangements
– –
82 Amount recognised in current-period Additional Tier 1 capital due to transitional arrangements – –83 Amount not recognised in current-period Additional Tier 1 capital due to transitional arrangements – –84 Amount recognised in current-period Tier 2 capital due to transitional arrangements 15,983 31,96785 Amount not recognised in current-period Tier 2 capital due to transitional arrangements 64,009 48,019
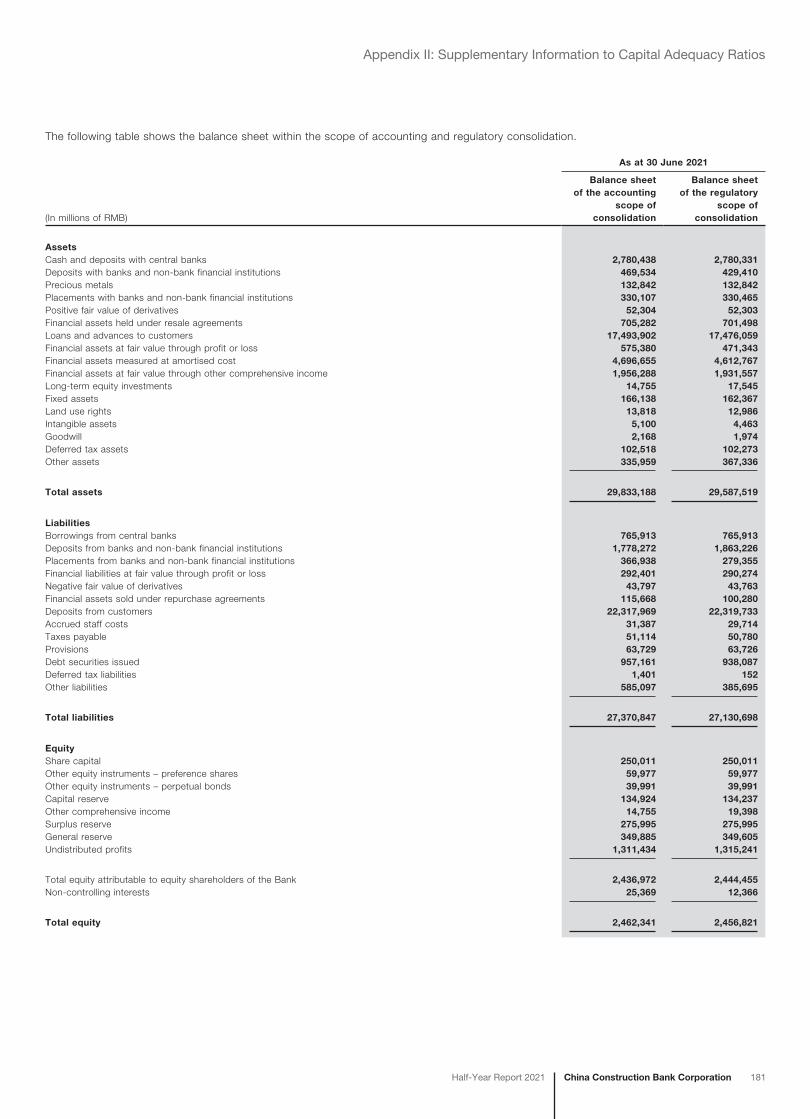
China Construction Bank CorporationHalf-Year Report 2021 181
Appendix II: Supplementary Information to Capital Adequacy Ratios
The following table shows the balance sheet within the scope of accounting and regulatory consolidation.
As at 30 June 2021
(In millions of RMB)
Balance sheet of the accounting
scope of consolidation
Balance sheet of the regulatory
scope of consolidation
AssetsCash and deposits with central banks 2,780,438 2,780,331Deposits with banks and non-bank financial institutions 469,534 429,410Precious metals 132,842 132,842Placements with banks and non-bank financial institutions 330,107 330,465Positive fair value of derivatives 52,304 52,303Financial assets held under resale agreements 705,282 701,498Loans and advances to customers 17,493,902 17,476,059Financial assets at fair value through profit or loss 575,380 471,343Financial assets measured at amortised cost 4,696,655 4,612,767Financial assets at fair value through other comprehensive income 1,956,288 1,931,557Long-term equity investments 14,755 17,545Fixed assets 166,138 162,367Land use rights 13,818 12,986Intangible assets 5,100 4,463Goodwill 2,168 1,974Deferred tax assets 102,518 102,273Other assets 335,959 367,336
Total assets 29,833,188 29,587,519
LiabilitiesBorrowings from central banks 765,913 765,913Deposits from banks and non-bank financial institutions 1,778,272 1,863,226Placements from banks and non-bank financial institutions 366,938 279,355Financial liabilities at fair value through profit or loss 292,401 290,274Negative fair value of derivatives 43,797 43,763Financial assets sold under repurchase agreements 115,668 100,280Deposits from customers 22,317,969 22,319,733Accrued staff costs 31,387 29,714Taxes payable 51,114 50,780Provisions 63,729 63,726Debt securities issued 957,161 938,087Deferred tax liabilities 1,401 152Other liabilities 585,097 385,695
Total liabilities 27,370,847 27,130,698
EquityShare capital 250,011 250,011Other equity instruments – preference shares 59,977 59,977Other equity instruments – perpetual bonds 39,991 39,991Capital reserve 134,924 134,237Other comprehensive income 14,755 19,398Surplus reserve 275,995 275,995General reserve 349,885 349,605Undistributed profits 1,311,434 1,315,241
Total equity attributable to equity shareholders of the Bank 2,436,972 2,444,455Non-controlling interests 25,369 12,366
Total equity 2,462,341 2,456,821
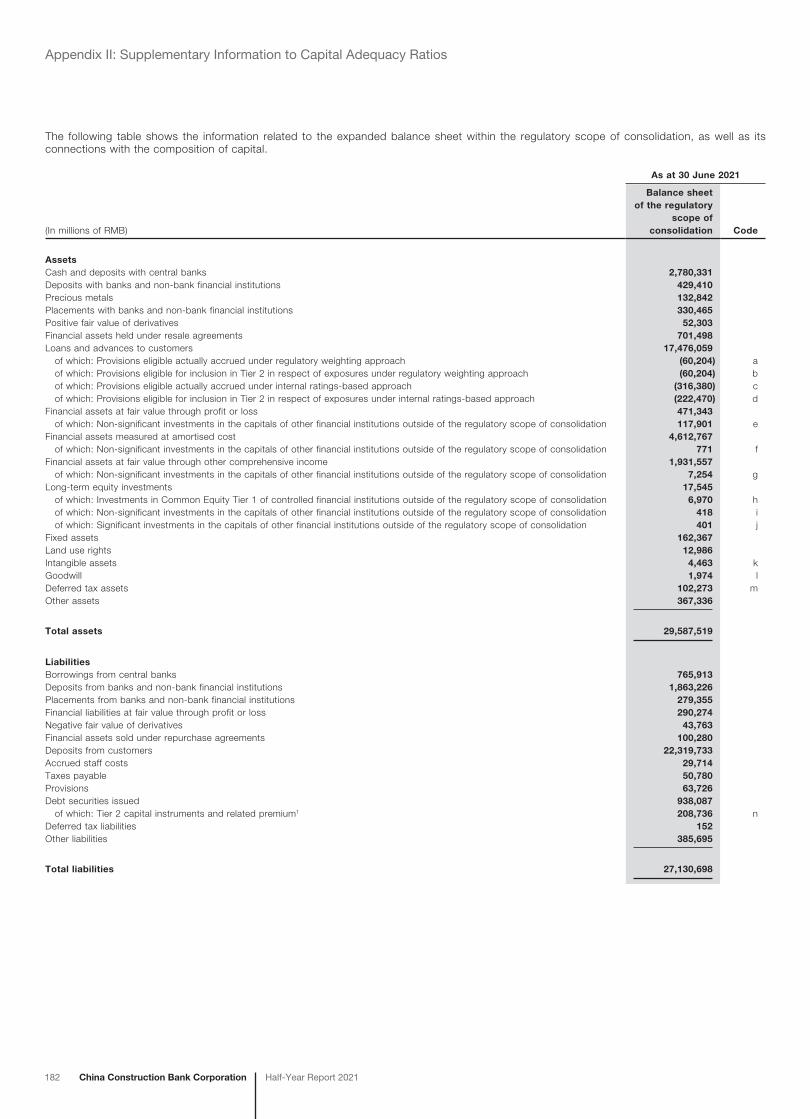
182 China Construction Bank Corporation Half-Year Report 2021
Appendix II: Supplementary Information to Capital Adequacy Ratios
The following table shows the information related to the expanded balance sheet within the regulatory scope of consolidation, as well as its connections with the composition of capital.
As at 30 June 2021
(In millions of RMB)
Balance sheet of the regulatory
scope of consolidation Code
AssetsCash and deposits with central banks 2,780,331Deposits with banks and non-bank financial institutions 429,410Precious metals 132,842Placements with banks and non-bank financial institutions 330,465Positive fair value of derivatives 52,303Financial assets held under resale agreements 701,498Loans and advances to customers 17,476,059 of which: Provisions eligible actually accrued under regulatory weighting approach (60,204) a of which: Provisions eligible for inclusion in Tier 2 in respect of exposures under regulatory weighting approach (60,204) b of which: Provisions eligible actually accrued under internal ratings-based approach (316,380) c of which: Provisions eligible for inclusion in Tier 2 in respect of exposures under internal ratings-based approach (222,470) dFinancial assets at fair value through profit or loss 471,343 of which: Non-significant investments in the capitals of other financial institutions outside of the regulatory scope of consolidation 117,901 eFinancial assets measured at amortised cost 4,612,767 of which: Non-significant investments in the capitals of other financial institutions outside of the regulatory scope of consolidation 771 fFinancial assets at fair value through other comprehensive income 1,931,557 of which: Non-significant investments in the capitals of other financial institutions outside of the regulatory scope of consolidation 7,254 gLong-term equity investments 17,545 of which: Investments in Common Equity Tier 1 of controlled financial institutions outside of the regulatory scope of consolidation 6,970 h of which: Non-significant investments in the capitals of other financial institutions outside of the regulatory scope of consolidation 418 i of which: Significant investments in the capitals of other financial institutions outside of the regulatory scope of consolidation 401 jFixed assets 162,367Land use rights 12,986Intangible assets 4,463 kGoodwill 1,974 lDeferred tax assets 102,273 mOther assets 367,336
Total assets 29,587,519
LiabilitiesBorrowings from central banks 765,913Deposits from banks and non-bank financial institutions 1,863,226Placements from banks and non-bank financial institutions 279,355Financial liabilities at fair value through profit or loss 290,274Negative fair value of derivatives 43,763Financial assets sold under repurchase agreements 100,280Deposits from customers 22,319,733Accrued staff costs 29,714Taxes payable 50,780Provisions 63,726Debt securities issued 938,087 of which: Tier 2 capital instruments and related premium1 208,736 nDeferred tax liabilities 152Other liabilities 385,695
Total liabilities 27,130,698
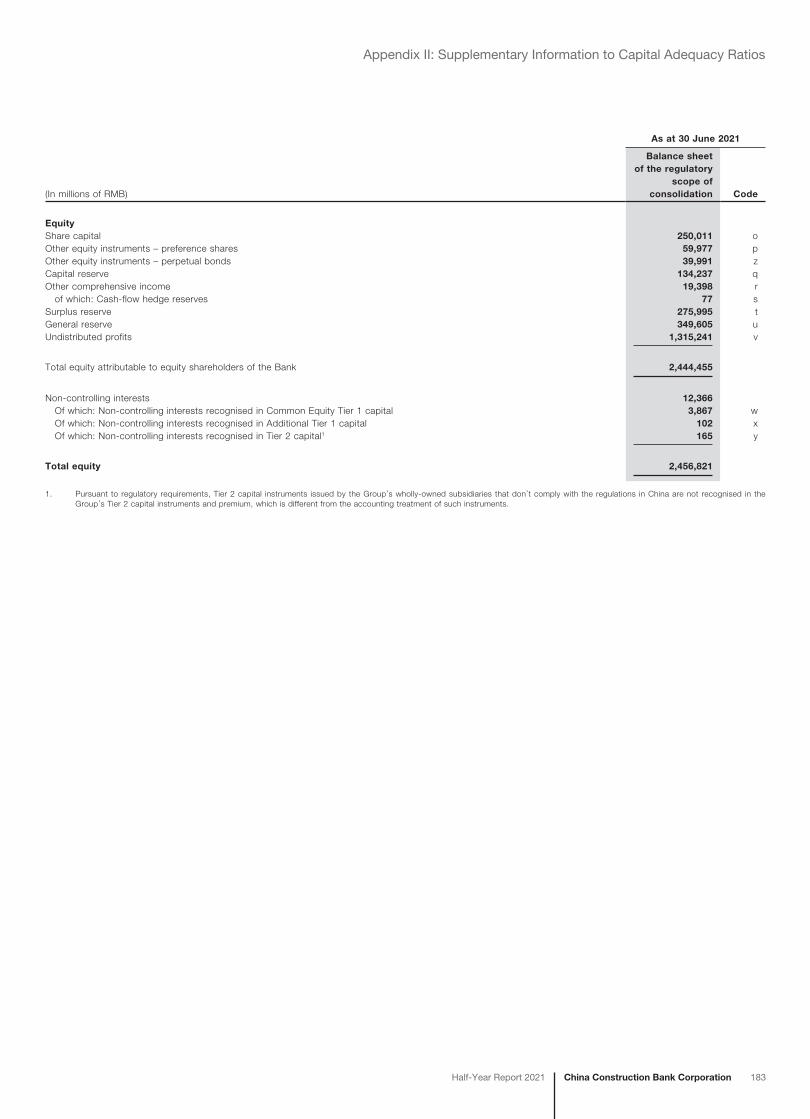
China Construction Bank CorporationHalf-Year Report 2021 183
Appendix II: Supplementary Information to Capital Adequacy Ratios
As at 30 June 2021
(In millions of RMB)
Balance sheet of the regulatory
scope of consolidation Code
EquityShare capital 250,011 oOther equity instruments – preference shares 59,977 pOther equity instruments – perpetual bonds 39,991 zCapital reserve 134,237 qOther comprehensive income 19,398 r of which: Cash-flow hedge reserves 77 sSurplus reserve 275,995 tGeneral reserve 349,605 uUndistributed profits 1,315,241 v
Total equity attributable to equity shareholders of the Bank 2,444,455
Non-controlling interests 12,366 Of which: Non-controlling interests recognised in Common Equity Tier 1 capital 3,867 w Of which: Non-controlling interests recognised in Additional Tier 1 capital 102 x Of which: Non-controlling interests recognised in Tier 2 capital1 165 y
Total equity 2,456,821
1. Pursuant to regulatory requirements, Tier 2 capital instruments issued by the Group’s wholly-owned subsidiaries that don’t comply with the regulations in China are not recognised in the Group’s Tier 2 capital instruments and premium, which is different from the accounting treatment of such instruments.
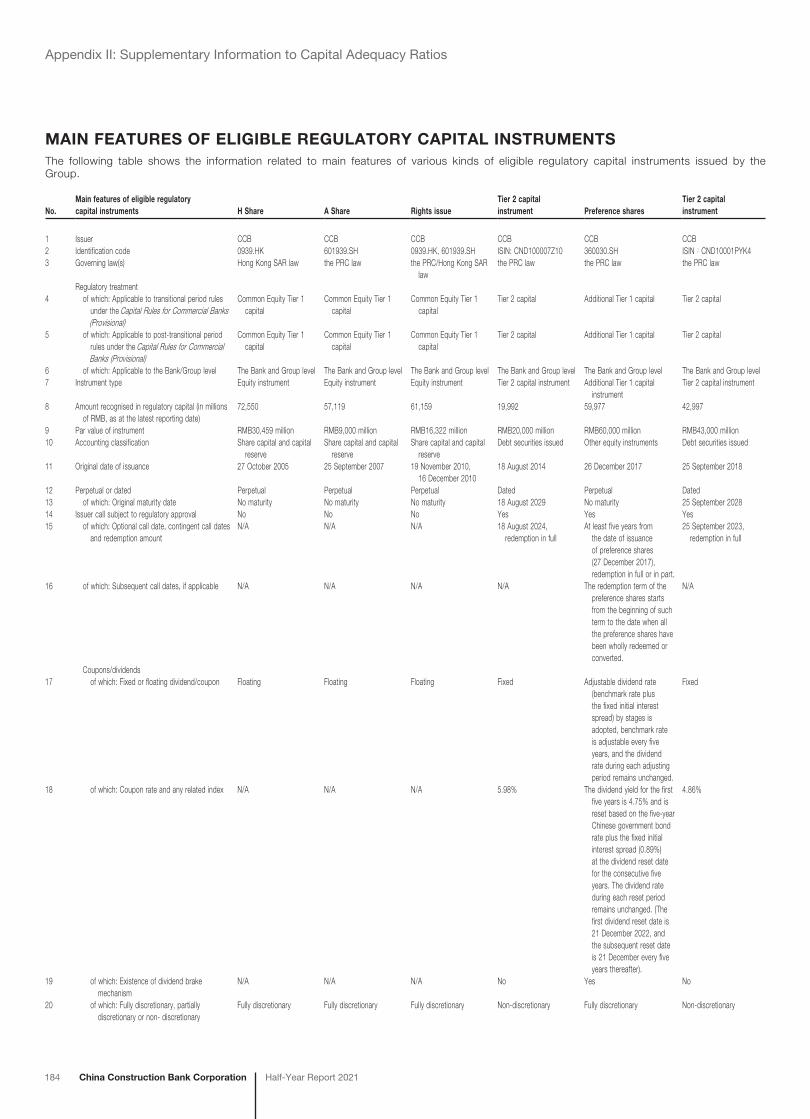
184 China Construction Bank Corporation Half-Year Report 2021
Appendix II: Supplementary Information to Capital Adequacy Ratios
MAIN FEATURES OF ELIGIBLE REGULATORY CAPITAL INSTRUMENTSThe following table shows the information related to main features of various kinds of eligible regulatory capital instruments issued by the Group.
No.Main features of eligible regulatory capital instruments H Share A Share Rights issue
Tier 2 capital instrument Preference shares
Tier 2 capital instrument
1 Issuer CCB CCB CCB CCB CCB CCB2 Identification code 0939.HK 601939.SH 0939.HK, 601939.SH ISIN: CND100007Z10 360030.SH ISIN:CND10001PYK43 Governing law(s) Hong Kong SAR law the PRC law the PRC/Hong Kong SAR
lawthe PRC law the PRC law the PRC law
Regulatory treatment4 of which: Applicable to transitional period rules
under the Capital Rules for Commercial Banks (Provisional)
Common Equity Tier 1 capital
Common Equity Tier 1 capital
Common Equity Tier 1 capital
Tier 2 capital Additional Tier 1 capital Tier 2 capital
5 of which: Applicable to post-transitional period rules under the Capital Rules for Commercial Banks (Provisional)
Common Equity Tier 1 capital
Common Equity Tier 1 capital
Common Equity Tier 1 capital
Tier 2 capital Additional Tier 1 capital Tier 2 capital
6 of which: Applicable to the Bank/Group level The Bank and Group level The Bank and Group level The Bank and Group level The Bank and Group level The Bank and Group level The Bank and Group level7 Instrument type Equity instrument Equity instrument Equity instrument Tier 2 capital instrument Additional Tier 1 capital
instrumentTier 2 capital instrument
8 Amount recognised in regulatory capital (in millions of RMB, as at the latest reporting date)
72,550 57,119 61,159 19,992 59,977 42,997
9 Par value of instrument RMB30,459 million RMB9,000 million RMB16,322 million RMB20,000 million RMB60,000 million RMB43,000 million10 Accounting classification Share capital and capital
reserveShare capital and capital
reserveShare capital and capital
reserveDebt securities issued Other equity instruments Debt securities issued
11 Original date of issuance 27 October 2005 25 September 2007 19 November 2010, 16 December 2010
18 August 2014 26 December 2017 25 September 2018
12 Perpetual or dated Perpetual Perpetual Perpetual Dated Perpetual Dated13 of which: Original maturity date No maturity No maturity No maturity 18 August 2029 No maturity 25 September 202814 Issuer call subject to regulatory approval No No No Yes Yes Yes15 of which: Optional call date, contingent call dates
and redemption amountN/A N/A N/A 18 August 2024,
redemption in fullAt least five years from
the date of issuance of preference shares (27 December 2017), redemption in full or in part.
25 September 2023, redemption in full
16 of which: Subsequent call dates, if applicable N/A N/A N/A N/A The redemption term of the preference shares starts from the beginning of such term to the date when all the preference shares have been wholly redeemed or converted.
N/A
Coupons/dividends17 of which: Fixed or floating dividend/coupon Floating Floating Floating Fixed Adjustable dividend rate
(benchmark rate plus the fixed initial interest spread) by stages is adopted, benchmark rate is adjustable every five years, and the dividend rate during each adjusting period remains unchanged.
Fixed
18 of which: Coupon rate and any related index N/A N/A N/A 5.98% The dividend yield for the first five years is 4.75% and is reset based on the five-year Chinese government bond rate plus the fixed initial interest spread (0.89%) at the dividend reset date for the consecutive five years. The dividend rate during each reset period remains unchanged. (The first dividend reset date is 21 December 2022, and the subsequent reset date is 21 December every five years thereafter).
4.86%
19 of which: Existence of dividend brake mechanism
N/A N/A N/A No Yes No
20 of which: Fully discretionary, partially discretionary or non- discretionary
Fully discretionary Fully discretionary Fully discretionary Non-discretionary Fully discretionary Non-discretionary
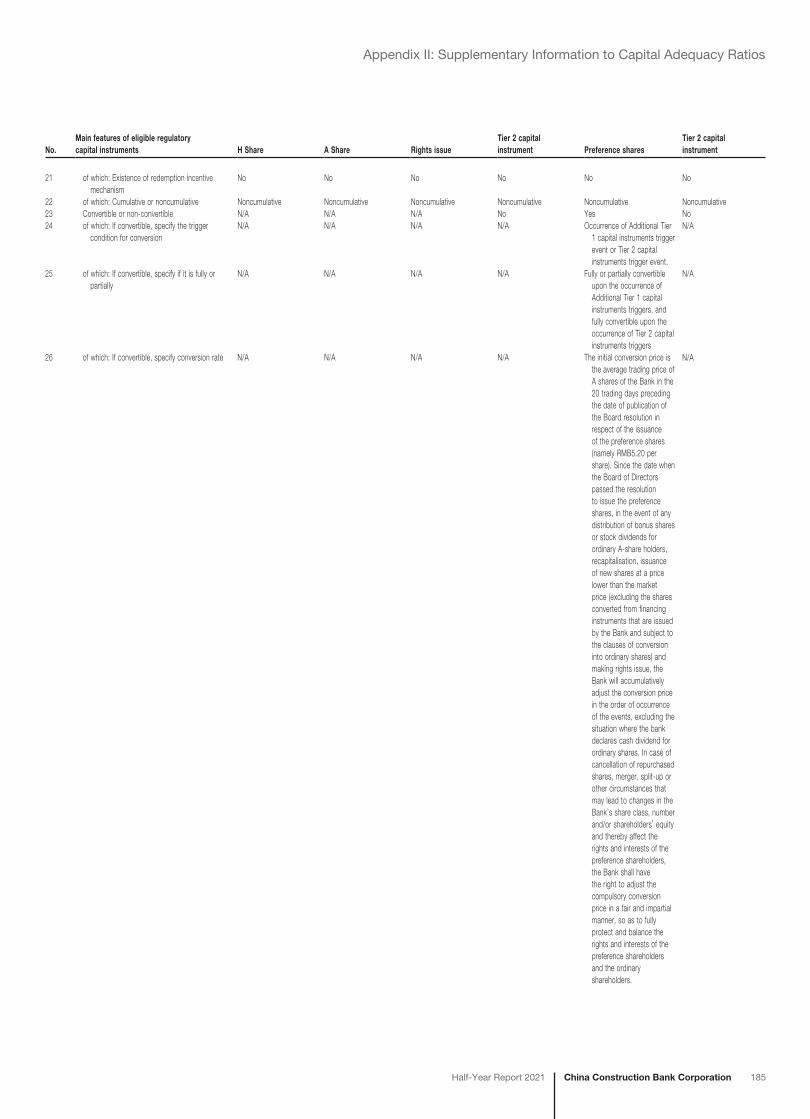
China Construction Bank CorporationHalf-Year Report 2021 185
Appendix II: Supplementary Information to Capital Adequacy Ratios
No.Main features of eligible regulatory capital instruments H Share A Share Rights issue
Tier 2 capital instrument Preference shares
Tier 2 capital instrument
21 of which: Existence of redemption incentive mechanism
No No No No No No
22 of which: Cumulative or noncumulative Noncumulative Noncumulative Noncumulative Noncumulative Noncumulative Noncumulative23 Convertible or non-convertible N/A N/A N/A No Yes No24 of which: If convertible, specify the trigger
condition for conversionN/A N/A N/A N/A Occurrence of Additional Tier
1 capital instruments trigger event or Tier 2 capital instruments trigger event.
N/A
25 of which: If convertible, specify if it is fully or partially
N/A N/A N/A N/A Fully or partially convertible upon the occurrence of Additional Tier 1 capital instruments triggers, and fully convertible upon the occurrence of Tier 2 capital instruments triggers
N/A
26 of which: If convertible, specify conversion rate N/A N/A N/A N/A The initial conversion price is the average trading price of A shares of the Bank in the 20 trading days preceding the date of publication of the Board resolution in respect of the issuance of the preference shares (namely RMB5.20 per share). Since the date when the Board of Directors passed the resolution to issue the preference shares, in the event of any distribution of bonus shares or stock dividends for ordinary A-share holders, recapitalisation, issuance of new shares at a price lower than the market price (excluding the shares converted from financing instruments that are issued by the Bank and subject to the clauses of conversion into ordinary shares) and making rights issue, the Bank will accumulatively adjust the conversion price in the order of occurrence of the events, excluding the situation where the bank declares cash dividend for ordinary shares. In case of cancellation of repurchased shares, merger, split-up or other circumstances that may lead to changes in the Bank’s share class, number and/or shareholders’ equity and thereby affect the rights and interests of the preference shareholders, the Bank shall have the right to adjust the compulsory conversion price in a fair and impartial manner, so as to fully protect and balance the rights and interests of the preference shareholders and the ordinary shareholders.
N/A
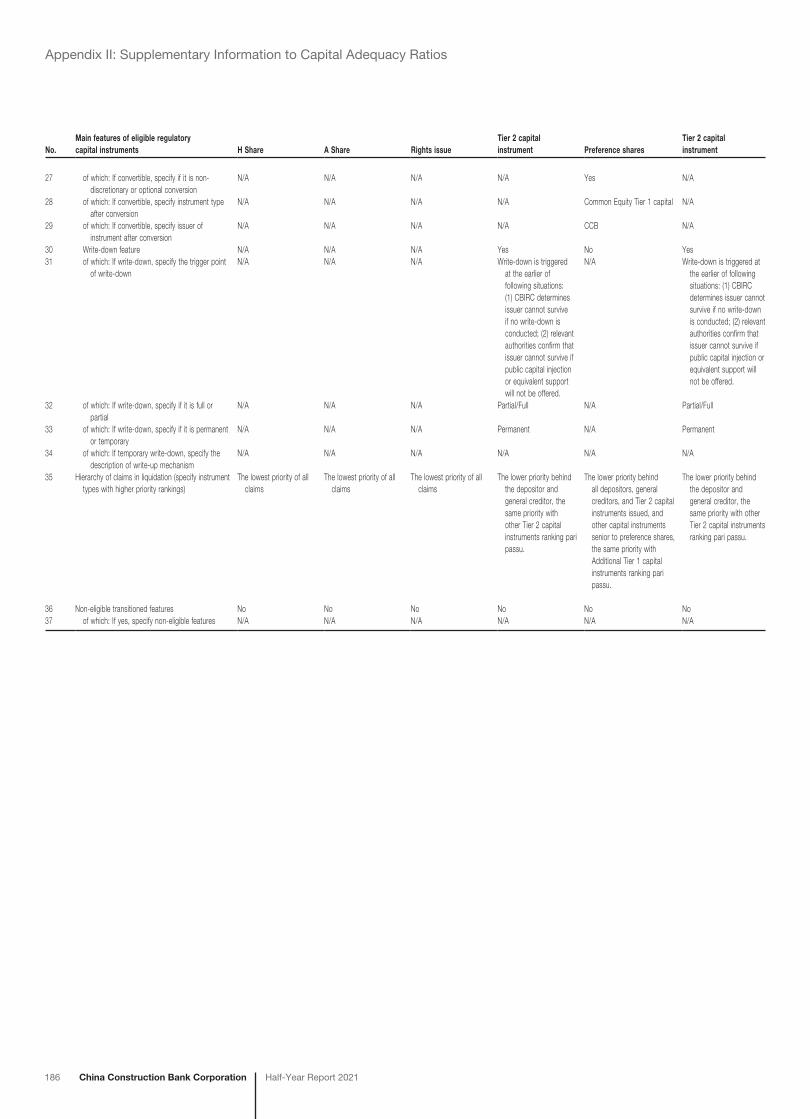
186 China Construction Bank Corporation Half-Year Report 2021
Appendix II: Supplementary Information to Capital Adequacy Ratios
No.Main features of eligible regulatory capital instruments H Share A Share Rights issue
Tier 2 capital instrument Preference shares
Tier 2 capital instrument
27 of which: If convertible, specify if it is non-discretionary or optional conversion
N/A N/A N/A N/A Yes N/A
28 of which: If convertible, specify instrument type after conversion
N/A N/A N/A N/A Common Equity Tier 1 capital N/A
29 of which: If convertible, specify issuer of instrument after conversion
N/A N/A N/A N/A CCB N/A
30 Write-down feature N/A N/A N/A Yes No Yes31 of which: If write-down, specify the trigger point
of write-downN/A N/A N/A Write-down is triggered
at the earlier of following situations: (1) CBIRC determines issuer cannot survive if no write-down is conducted; (2) relevant authorities confirm that issuer cannot survive if public capital injection or equivalent support will not be offered.
N/A Write-down is triggered at the earlier of following situations: (1) CBIRC determines issuer cannot survive if no write-down is conducted; (2) relevant authorities confirm that issuer cannot survive if public capital injection or equivalent support will not be offered.
32 of which: If write-down, specify if it is full or partial
N/A N/A N/A Partial/Full N/A Partial/Full
33 of which: If write-down, specify if it is permanent or temporary
N/A N/A N/A Permanent N/A Permanent
34 of which: If temporary write-down, specify the description of write-up mechanism
N/A N/A N/A N/A N/A N/A
35 Hierarchy of claims in liquidation (specify instrument types with higher priority rankings)
The lowest priority of all claims
The lowest priority of all claims
The lowest priority of all claims
The lower priority behind the depositor and general creditor, the same priority with other Tier 2 capital instruments ranking pari passu.
The lower priority behind all depositors, general creditors, and Tier 2 capital instruments issued, and other capital instruments senior to preference shares, the same priority with Additional Tier 1 capital instruments ranking pari passu.
The lower priority behind the depositor and general creditor, the same priority with other Tier 2 capital instruments ranking pari passu.
36 Non-eligible transitioned features No No No No No No37 of which: If yes, specify non-eligible features N/A N/A N/A N/A N/A N/A
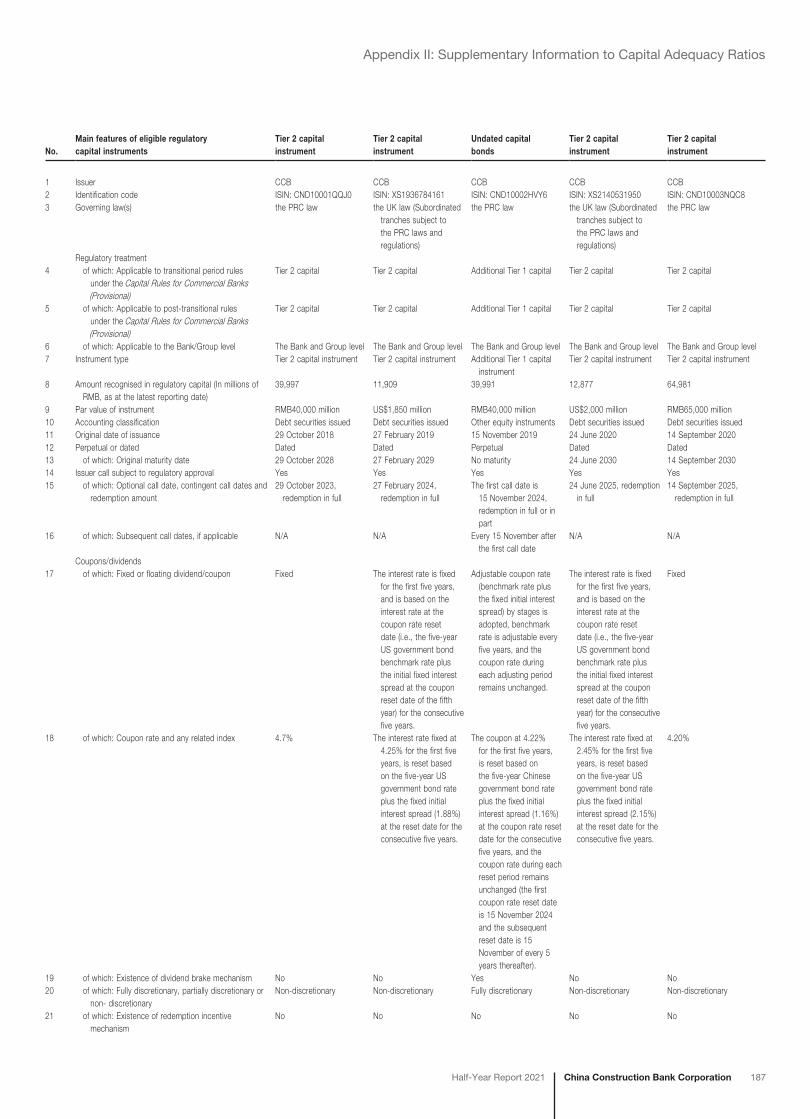
China Construction Bank CorporationHalf-Year Report 2021 187
Appendix II: Supplementary Information to Capital Adequacy Ratios
No.Main features of eligible regulatory capital instruments
Tier 2 capital instrument
Tier 2 capital instrument
Undated capital bonds
Tier 2 capital instrument
Tier 2 capital instrument
1 Issuer CCB CCB CCB CCB CCB2 Identification code ISIN: CND10001QQJ0 ISIN: XS1936784161 ISIN: CND10002HVY6 ISIN: XS2140531950 ISIN: CND10003NQC83 Governing law(s) the PRC law the UK law (Subordinated
tranches subject to the PRC laws and regulations)
the PRC law the UK law (Subordinated tranches subject to the PRC laws and regulations)
the PRC law
Regulatory treatment4 of which: Applicable to transitional period rules
under the Capital Rules for Commercial Banks (Provisional)
Tier 2 capital Tier 2 capital Additional Tier 1 capital Tier 2 capital Tier 2 capital
5 of which: Applicable to post-transitional rules under the Capital Rules for Commercial Banks (Provisional)
Tier 2 capital Tier 2 capital Additional Tier 1 capital Tier 2 capital Tier 2 capital
6 of which: Applicable to the Bank/Group level The Bank and Group level The Bank and Group level The Bank and Group level The Bank and Group level The Bank and Group level7 Instrument type Tier 2 capital instrument Tier 2 capital instrument Additional Tier 1 capital
instrumentTier 2 capital instrument Tier 2 capital instrument
8 Amount recognised in regulatory capital (In millions of RMB, as at the latest reporting date)
39,997 11,909 39,991 12,877 64,981
9 Par value of instrument RMB40,000 million US$1,850 million RMB40,000 million US$2,000 million RMB65,000 million10 Accounting classification Debt securities issued Debt securities issued Other equity instruments Debt securities issued Debt securities issued11 Original date of issuance 29 October 2018 27 February 2019 15 November 2019 24 June 2020 14 September 202012 Perpetual or dated Dated Dated Perpetual Dated Dated13 of which: Original maturity date 29 October 2028 27 February 2029 No maturity 24 June 2030 14 September 203014 Issuer call subject to regulatory approval Yes Yes Yes Yes Yes15 of which: Optional call date, contingent call dates and
redemption amount29 October 2023,
redemption in full27 February 2024,
redemption in fullThe first call date is
15 November 2024, redemption in full or in part
24 June 2025, redemption in full
14 September 2025, redemption in full
16 of which: Subsequent call dates, if applicable N/A N/A Every 15 November after the first call date
N/A N/A
Coupons/dividends17 of which: Fixed or floating dividend/coupon Fixed The interest rate is fixed
for the first five years, and is based on the interest rate at the coupon rate reset date (i.e., the five-year US government bond benchmark rate plus the initial fixed interest spread at the coupon reset date of the fifth year) for the consecutive five years.
Adjustable coupon rate (benchmark rate plus the fixed initial interest spread) by stages is adopted, benchmark rate is adjustable every five years, and the coupon rate during each adjusting period remains unchanged.
The interest rate is fixed for the first five years, and is based on the interest rate at the coupon rate reset date (i.e., the five-year US government bond benchmark rate plus the initial fixed interest spread at the coupon reset date of the fifth year) for the consecutive five years.
Fixed
18 of which: Coupon rate and any related index 4.7% The interest rate fixed at 4.25% for the first five years, is reset based on the five-year US government bond rate plus the fixed initial interest spread (1.88%) at the reset date for the consecutive five years.
The coupon at 4.22% for the first five years, is reset based on the five-year Chinese government bond rate plus the fixed initial interest spread (1.16%) at the coupon rate reset date for the consecutive five years, and the coupon rate during each reset period remains unchanged (the first coupon rate reset date is 15 November 2024 and the subsequent reset date is 15 November of every 5 years thereafter).
The interest rate fixed at 2.45% for the first five years, is reset based on the five-year US government bond rate plus the fixed initial interest spread (2.15%) at the reset date for the consecutive five years.
4.20%
19 of which: Existence of dividend brake mechanism No No Yes No No20 of which: Fully discretionary, partially discretionary or
non- discretionaryNon-discretionary Non-discretionary Fully discretionary Non-discretionary Non-discretionary
21 of which: Existence of redemption incentive mechanism
No No No No No
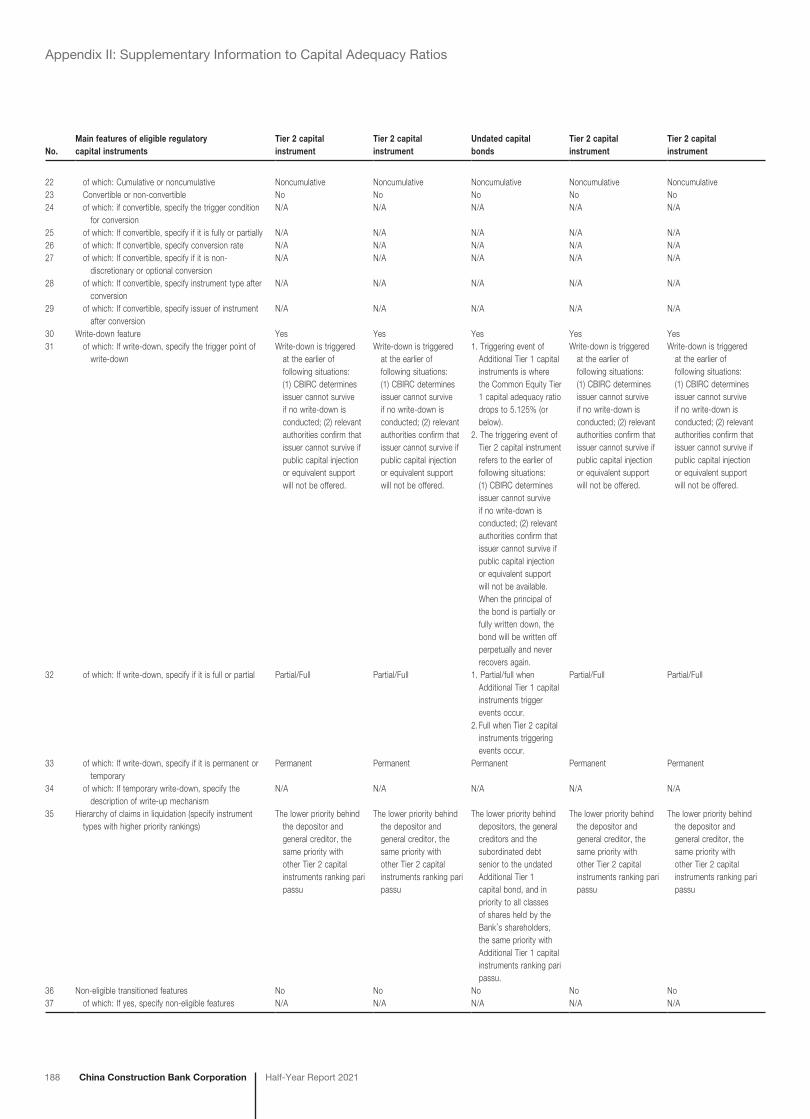
188 China Construction Bank Corporation Half-Year Report 2021
Appendix II: Supplementary Information to Capital Adequacy Ratios
No.Main features of eligible regulatory capital instruments
Tier 2 capital instrument
Tier 2 capital instrument
Undated capital bonds
Tier 2 capital instrument
Tier 2 capital instrument
22 of which: Cumulative or noncumulative Noncumulative Noncumulative Noncumulative Noncumulative Noncumulative23 Convertible or non-convertible No No No No No24 of which: if convertible, specify the trigger condition
for conversionN/A N/A N/A N/A N/A
25 of which: If convertible, specify if it is fully or partially N/A N/A N/A N/A N/A26 of which: If convertible, specify conversion rate N/A N/A N/A N/A N/A27 of which: If convertible, specify if it is non-
discretionary or optional conversionN/A N/A N/A N/A N/A
28 of which: If convertible, specify instrument type after conversion
N/A N/A N/A N/A N/A
29 of which: If convertible, specify issuer of instrument after conversion
N/A N/A N/A N/A N/A
30 Write-down feature Yes Yes Yes Yes Yes31 of which: If write-down, specify the trigger point of
write-downWrite-down is triggered
at the earlier of following situations: (1) CBIRC determines issuer cannot survive if no write-down is conducted; (2) relevant authorities confirm that issuer cannot survive if public capital injection or equivalent support will not be offered.
Write-down is triggered at the earlier of following situations: (1) CBIRC determines issuer cannot survive if no write-down is conducted; (2) relevant authorities confirm that issuer cannot survive if public capital injection or equivalent support will not be offered.
1. Triggering event of Additional Tier 1 capital instruments is where the Common Equity Tier 1 capital adequacy ratio drops to 5.125% (or below).
2. The triggering event of Tier 2 capital instrument refers to the earlier of following situations: (1) CBIRC determines issuer cannot survive if no write-down is conducted; (2) relevant authorities confirm that issuer cannot survive if public capital injection or equivalent support will not be available. When the principal of the bond is partially or fully written down, the bond will be written off perpetually and never recovers again.
Write-down is triggered at the earlier of following situations: (1) CBIRC determines issuer cannot survive if no write-down is conducted; (2) relevant authorities confirm that issuer cannot survive if public capital injection or equivalent support will not be offered.
Write-down is triggered at the earlier of following situations: (1) CBIRC determines issuer cannot survive if no write-down is conducted; (2) relevant authorities confirm that issuer cannot survive if public capital injection or equivalent support will not be offered.
32 of which: If write-down, specify if it is full or partial Partial/Full Partial/Full 1. Partial/full when Additional Tier 1 capital instruments trigger events occur.
Partial/Full Partial/Full
2. Full when Tier 2 capital instruments triggering events occur.
33 of which: If write-down, specify if it is permanent or temporary
Permanent Permanent Permanent Permanent Permanent
34 of which: If temporary write-down, specify the description of write-up mechanism
N/A N/A N/A N/A N/A
35 Hierarchy of claims in liquidation (specify instrument types with higher priority rankings)
The lower priority behind the depositor and general creditor, the same priority with other Tier 2 capital instruments ranking pari passu
The lower priority behind the depositor and general creditor, the same priority with other Tier 2 capital instruments ranking pari passu
The lower priority behind depositors, the general creditors and the subordinated debt senior to the undated Additional Tier 1 capital bond, and in priority to all classes of shares held by the Bank’s shareholders, the same priority with Additional Tier 1 capital instruments ranking pari passu.
The lower priority behind the depositor and general creditor, the same priority with other Tier 2 capital instruments ranking pari passu
The lower priority behind the depositor and general creditor, the same priority with other Tier 2 capital instruments ranking pari passu
36 Non-eligible transitioned features No No No No No37 of which: If yes, specify non-eligible features N/A N/A N/A N/A N/A


