Embed Size (px)
Citation preview
sustainability
Article
Green Supplier Selection in the Agro-Food Industrywith Contract Farming: A Multi-ObjectiveOptimization Approach
Marco A. Miranda-Ackerman 1,* , Catherine Azzaro-Pantel 2,*, Alberto A. Aguilar-Lasserre 3 ,Alfredo Bueno-Solano 4 and Karina C. Arredondo-Soto 1
1 Facultad de Ciencias Químicas e Ingeniería, Universidad Autónoma de Baja California, Tijuana,Baja California 22390, Mexico; [email protected]
2 Laboratoire de Génie Chimique, Université de Toulouse, CNRS, INPT, UPS, 31432 Toulouse, France3 Division of Research and Postgraduate Studies, Tecnológico Nacional de México/Instituto Tecnológico de
Orizaba, Orizaba 94320, Veracruz, Mexico; [email protected] Department of Industrial Engineering, Instituto Tecnológico de Sonora, Cd. Obregon 85000, Sonora, Mexico;
[email protected]* Correspondence: [email protected] (M.A.M.-A.); [email protected] (C.A.-P.)
Received: 31 October 2019; Accepted: 4 December 2019; Published: 9 December 2019�����������������
Abstract: An important contribution to the environmental impact of agro-food supply chains isrelated to the agricultural technology and practices used in the fields during raw material production.This problem can be framed from the point of view of the Focal Company (FC) as a raw materialGreen Supplier Selection Problem (GSSP). This paper describes an extension of the GSSP methodologythat integrates life cycle assessment, environmental collaborations, and contract farming in order togain social and environmental benefits. In this approach, risk and gains are shared by both parties,as well as information related to agricultural practices through which the FC can optimize globalperformance by deciding which suppliers to contract, capacity and which practices to use at eachsupplying field in order to optimize economic performance and environmental impact. The FCprovides the knowledge and technology needed by the supplier to reach these objectives via a contractfarming scheme. A case study is developed in order to illustrate and a step-by-step methodology isdescribed. A multi-objective optimization strategy based on Genetic Algorithms linked to a MCDMapproach to the solution selection step is proposed. Scenarios of optimization of the selection processare studied to demonstrate the potential improvement gains in performance.
Keywords: green supplier selection; contract farming; life cycle assessment; environmentalcollaboration; multi-objective optimization; agro-food supply chain
1. Introduction
Environmental awareness has shifted consumer behavior towards more efficient andenvironmentally-friendly products, including processed foods. This has led food manufacturersto find opportunities by developing strategies targeting eco-friendly consumers and markets, throughthe use of eco-labelling [1,2]. In order to satisfy these niche markets and continue developing thisbranding strategy, a shift from conventional food production to a more sustainable one has beenprogressively pursued. The transformation is that consumer awareness about the “greenness” ofproducts is incentivizing a change towards alternative practices and technologies that may affect theentire agro-food supply chain (ASC).
One of the most important links in the ASC lies in the interface between farms and manufacturers,given that the raw materials needed to produce the current selection of food products at retail stores
Sustainability 2019, 11, 7017; doi:10.3390/su11247017 www.mdpi.com/journal/sustainability
Sustainability 2019, 11, 7017 2 of 19
and markets are sourced. An important part of the environmental impact located at this point is due toagrochemical, water, land and energy use related to farming [3,4]. This is why there is an interest inboth sustainable agricultural practices as well as green process design steps further downstream, inorder to look at the sustainability of ASC, which leads to the potential improvements that could lie atthe interface between farmers and manufacturers.
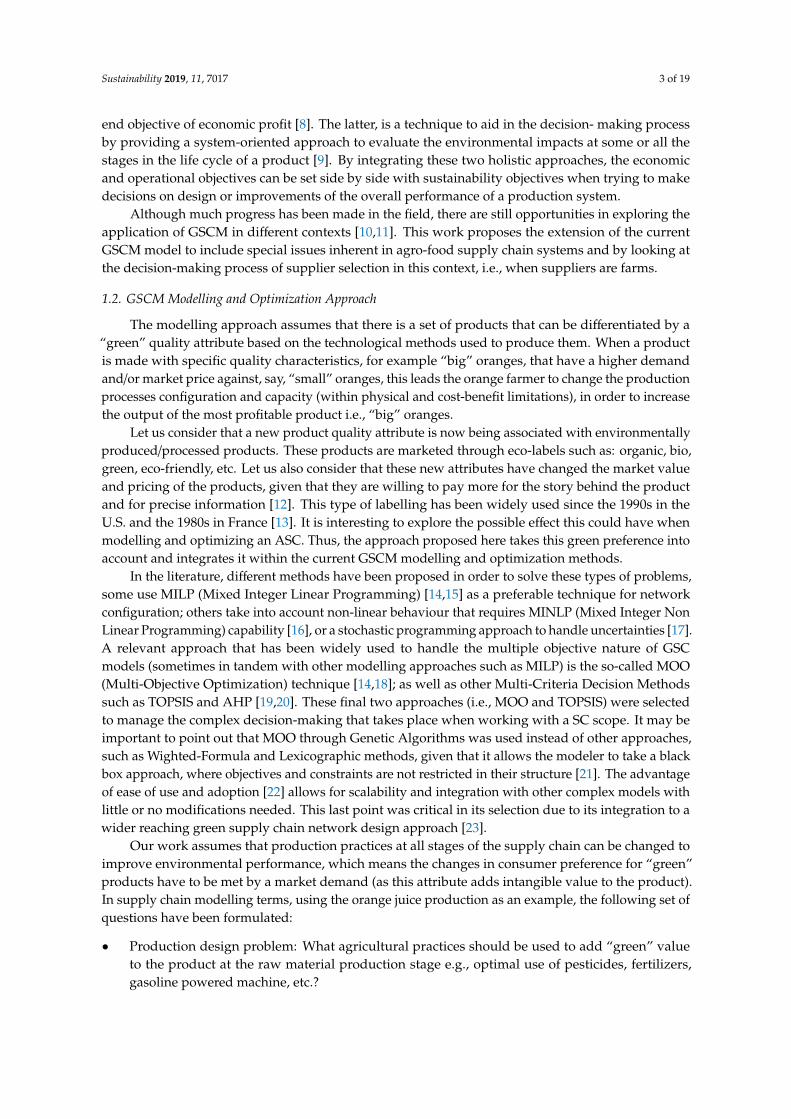
The study of this interface is sometimes referred to as the supplier selection problem (SSP).This subfield of supply chain management (SCM) has been tackled largely in the dedicated literature,where it is mostly described by taking into consideration a set of criteria, traditionally based on cost,delivery time and quality among many other components [5], to then classify and rank suppliers [6,7].This paper looks at the SSP of an orange juice producing company that uses suppliers in a collaborativescheme, that additionally includes in their supplier roster, small and medium farmers, under a contractfarming model. Furthermore, it proposes the use of the green supplier selection paradigm thatincorporates environmental performance of suppliers in the selection process. The objective of thispaper is then to show how with synergy made through collaboration, contract farming and a greensupplier selection perspective, improvements in the performance of the food supply chain can beachieved in economic, social and environmental terms. It answers the specific research question: Whatis the result of including partnerships in a supplier selection decision modeling approach in terms ofselection criteria within the green supply chain paradigm? This approach will be referred to in whatfollows as Partnership for Sustainability (PfS) (see Figure 1).
Sustainability 2019, 11, x FOR PEER REVIEW 2 of 20
products at retail stores and markets are sourced. An important part of the environmental impact
located at this point is due to agrochemical, water, land and energy use related to farming [3,4]. This
is why there is an interest in both sustainable agricultural practices as well as green process design
steps further downstream, in order to look at the sustainability of ASC, which leads to the potential
improvements that could lie at the interface between farmers and manufacturers.
The study of this interface is sometimes referred to as the supplier selection problem (SSP). This
subfield of supply chain management (SCM) has been tackled largely in the dedicated literature,
where it is mostly described by taking into consideration a set of criteria, traditionally based on cost,
delivery time and quality among many other components [5], to then classify and rank suppliers
[6,7]. This paper looks at the SSP of an orange juice producing company that uses suppliers in a
collaborative scheme, that additionally includes in their supplier roster, small and medium farmers,
under a contract farming model. Furthermore, it proposes the use of the green supplier selection
paradigm that incorporates environmental performance of suppliers in the selection process. The
objective of this paper is then to show how with synergy made through collaboration, contract
farming and a green supplier selection perspective, improvements in the performance of the food
supply chain can be achieved in economic, social and environmental terms. It answers the specific
research question: What is the result of including partnerships in a supplier selection decision
modeling approach in terms of selection criteria within the green supply chain paradigm? This
approach will be referred to in what follows as Partnership for Sustainability (PfS) (see Figure 1).
Figure 1. Partnership for sustainability method integration diagram.
In order to illustrate the approach and proposed solution methodology, a case study is
developed focusing on the production and supplying of oranges produced in Mexico used for juice
production. This case study is based on the locally available technological alternatives which are
used at each supplying orchard, taking into account the local technological package and their
corresponding production yields and related environmental impacts for the specific citrus fruit
producing region. The methodological framework for the solution of this problem is based on the
use of a multi-objective optimization strategy through genetic algorithms followed by a
multi-criteria decision-making method in order to select a solution.
1.1. Green Supply Chain Management
The backdrop of the proposed approach lies in a promising and somewhat recent paradigm to
evaluate and improve the environmental and overall performance of production systems called
Green Supply Chain Management (GSCM). This approach integrates two conceptual scopes: Supply
Chain Management (SCM) and Life Cycle Assessment (LCA). The former provides a framework to
visualize and improve the economic and operational performance of productive systems by
modelling the flow of materials, information and money, throughout the links in the production
chain, with the end objective of economic profit [8]. The latter, is a technique to aid in the decision-
Figure 1. Partnership for sustainability method integration diagram.
In order to illustrate the approach and proposed solution methodology, a case study is developedfocusing on the production and supplying of oranges produced in Mexico used for juice production.This case study is based on the locally available technological alternatives which are used at eachsupplying orchard, taking into account the local technological package and their correspondingproduction yields and related environmental impacts for the specific citrus fruit producing region.The methodological framework for the solution of this problem is based on the use of a multi-objectiveoptimization strategy through genetic algorithms followed by a multi-criteria decision-making methodin order to select a solution.
1.1. Green Supply Chain Management
The backdrop of the proposed approach lies in a promising and somewhat recent paradigmto evaluate and improve the environmental and overall performance of production systems calledGreen Supply Chain Management (GSCM). This approach integrates two conceptual scopes: SupplyChain Management (SCM) and Life Cycle Assessment (LCA). The former provides a framework tovisualize and improve the economic and operational performance of productive systems by modellingthe flow of materials, information and money, throughout the links in the production chain, with the
Sustainability 2019, 11, 7017 3 of 19
end objective of economic profit [8]. The latter, is a technique to aid in the decision- making processby providing a system-oriented approach to evaluate the environmental impacts at some or all thestages in the life cycle of a product [9]. By integrating these two holistic approaches, the economicand operational objectives can be set side by side with sustainability objectives when trying to makedecisions on design or improvements of the overall performance of a production system.
Although much progress has been made in the field, there are still opportunities in exploring theapplication of GSCM in different contexts [10,11]. This work proposes the extension of the currentGSCM model to include special issues inherent in agro-food supply chain systems and by looking atthe decision-making process of supplier selection in this context, i.e., when suppliers are farms.
1.2. GSCM Modelling and Optimization Approach
The modelling approach assumes that there is a set of products that can be differentiated by a“green” quality attribute based on the technological methods used to produce them. When a productis made with specific quality characteristics, for example “big” oranges, that have a higher demandand/or market price against, say, “small” oranges, this leads the orange farmer to change the productionprocesses configuration and capacity (within physical and cost-benefit limitations), in order to increasethe output of the most profitable product i.e., “big” oranges.
Let us consider that a new product quality attribute is now being associated with environmentallyproduced/processed products. These products are marketed through eco-labels such as: organic, bio,green, eco-friendly, etc. Let us also consider that these new attributes have changed the market valueand pricing of the products, given that they are willing to pay more for the story behind the productand for precise information [12]. This type of labelling has been widely used since the 1990s in theU.S. and the 1980s in France [13]. It is interesting to explore the possible effect this could have whenmodelling and optimizing an ASC. Thus, the approach proposed here takes this green preference intoaccount and integrates it within the current GSCM modelling and optimization methods.
In the literature, different methods have been proposed in order to solve these types of problems,some use MILP (Mixed Integer Linear Programming) [14,15] as a preferable technique for networkconfiguration; others take into account non-linear behaviour that requires MINLP (Mixed Integer NonLinear Programming) capability [16], or a stochastic programming approach to handle uncertainties [17].A relevant approach that has been widely used to handle the multiple objective nature of GSCmodels (sometimes in tandem with other modelling approaches such as MILP) is the so-called MOO(Multi-Objective Optimization) technique [14,18]; as well as other Multi-Criteria Decision Methodssuch as TOPSIS and AHP [19,20]. These final two approaches (i.e., MOO and TOPSIS) were selectedto manage the complex decision-making that takes place when working with a SC scope. It may beimportant to point out that MOO through Genetic Algorithms was used instead of other approaches,such as Wighted-Formula and Lexicographic methods, given that it allows the modeler to take a blackbox approach, where objectives and constraints are not restricted in their structure [21]. The advantageof ease of use and adoption [22] allows for scalability and integration with other complex models withlittle or no modifications needed. This last point was critical in its selection due to its integration to awider reaching green supply chain network design approach [23].
Our work assumes that production practices at all stages of the supply chain can be changed toimprove environmental performance, which means the changes in consumer preference for “green”products have to be met by a market demand (as this attribute adds intangible value to the product).In supply chain modelling terms, using the orange juice production as an example, the following set ofquestions have been formulated:
• Production design problem: What agricultural practices should be used to add “green” valueto the product at the raw material production stage e.g., optimal use of pesticides, fertilizers,gasoline powered machine, etc.?
Sustainability 2019, 11, 7017 4 of 19
• Product mix problem: What quantity of each quality-type orange should be produced to obtainthe desired orange juice quality mix (e.g., “organic”, “environmentally-friendly” or “30% lessenvironmental impact”)?
• Location-allocation problem: Which and how many orchards should produce environmentally-friendly oranges; which and how many should use intensive agricultural, in order to satisfy demand?
• Supplier selection problem: Which supplier to buy from? How much to buy? Which criteria touse to evaluate supplier performance?
In order to answer these questions, the Partnership for Sustainability approach takes the greensupplier selection problem and integrates the benefits from contract farming and an environmentalcollaborative approach described in the following sections.
1.3. Green Supplier Selection Problem
In the field of supplier selection, there is a wide body of publications looking at many differentaspects such as formulation, method and application [24]. These include recent works on green orsustainable supplier selection. Although Green Supplier Selection (GSS) has been named in differentways such as Green Vender, Green Purchasing, and Environmental Purchasing, most definitionscoincide in its reach. We consider [25], and define Green Supplier Selection as “the set of purchasingpolicies held, actions taken and relationships formed in response to concerns associated with the naturalenvironment.” It goes on to clarify that “These concerns relate to the acquisition of raw materials,including supplier selection, evaluation and development.” This integration is promoted because of thebenefits that interaction of the different members of the supply chain produce, not only on sustainabilityissues, but also on economic and operations performance [26]. A review on Green Supplier Selectionhas highlighted some interesting research challenges [27]. According to these authors, the integrationof Life Cycle Assessment (LCA) in the definition and measurement of environmental criteria offers aninteresting methodological framework, since it involves a system-wide approach for environmentalimpact evaluation. Some other examples of GSS have been published for industries such as electronicand consumer goods [28,29]. A study on the effectiveness of a large-scale Sustainable Supplier programin Mexico was published. Among its conclusions, it suggests that a need to focus on micro and smallbusinesses must be considered as an important objective in further research within the field [30].
This paper locates itself in these groups of research that support the use of LCA as a decisionsupport tool for the supplier selection process and develops the case study in the context of an agro-foodchain in order to contribute to the current body of research in the field. It also contributes to thepotential improvement from contract farming and its derived environmental collaboration that isfurther discussed in the following section.
1.4. Contract Farming
In the SCM paradigm as in the GSCM, a central or focal company (FC), as proposed by Seuring andMuller [10], is characterized by being the designer or owner of the product or service offered, governingthe supply chain, and having contact with all SC stakeholders including the customers. The FC canalso sometimes be the processing or manufacturing company, as is the case of our case study.
We proposed that the FC be the integrator firm within the context of contract farming as describedby Rehber [31], under a Management and Income Guaranteeing contract [32], also known as aProduction Management Contract (PMC) [33]. They describe the PMC type of contract model as onethat both specifies product quality measures that are acceptable to the integrator, and the integratorproviding production resources, takes on substantial managerial responsibilities, and supervisesthe supply chain activities. This form matches well with the green supplier development aspectof the GSCM approach, given that green supplier development draws its importance from the factthat suppliers are often small and do not have the knowhow or resource necessaries to face theenvironmental issues related to their business process [10,34]. This is why some research has been
Sustainability 2019, 11, 7017 5 of 19
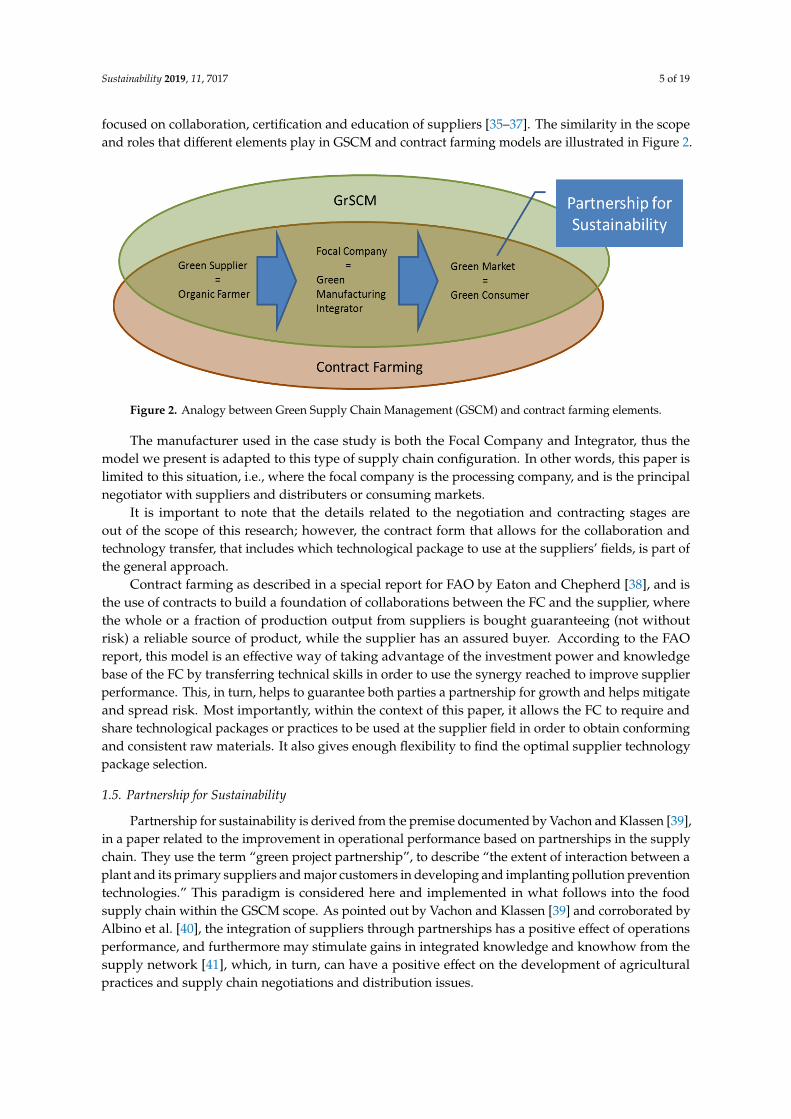
focused on collaboration, certification and education of suppliers [35–37]. The similarity in the scopeand roles that different elements play in GSCM and contract farming models are illustrated in Figure 2.
Sustainability 2019, 11, x FOR PEER REVIEW 5 of 20
fact that suppliers are often small and do not have the knowhow or resource necessaries to face the
environmental issues related to their business process [10,34]. This is why some research has been
focused on collaboration, certification and education of suppliers [35–37]. The similarity in the scope
and roles that different elements play in GSCM and contract farming models are illustrated in Figure
2.
Figure 2. Analogy between Green Supply Chain Management (GSCM) and contract farming
elements.
The manufacturer used in the case study is both the Focal Company and Integrator, thus the
model we present is adapted to this type of supply chain configuration. In other words, this paper is
limited to this situation, i.e., where the focal company is the processing company, and is the
principal negotiator with suppliers and distributers or consuming markets.
It is important to note that the details related to the negotiation and contracting stages are out of
the scope of this research; however, the contract form that allows for the collaboration and
technology transfer, that includes which technological package to use at the suppliers’ fields, is part
of the general approach.
Contract farming as described in a special report for FAO by Eaton and Chepherd [38], and is
the use of contracts to build a foundation of collaborations between the FC and the supplier, where
the whole or a fraction of production output from suppliers is bought guaranteeing (not without
risk) a reliable source of product, while the supplier has an assured buyer. According to the FAO
report, this model is an effective way of taking advantage of the investment power and knowledge
base of the FC by transferring technical skills in order to use the synergy reached to improve
supplier performance. This, in turn, helps to guarantee both parties a partnership for growth and
helps mitigate and spread risk. Most importantly, within the context of this paper, it allows the FC to
require and share technological packages or practices to be used at the supplier field in order to
obtain conforming and consistent raw materials. It also gives enough flexibility to find the optimal
supplier technology package selection.
1.5. Partnership for Sustainability
Partnership for sustainability is derived from the premise documented by Vachon and Klassen
[39], in a paper related to the improvement in operational performance based on partnerships in the
supply chain. They use the term “green project partnership”, to describe “the extent of interaction
between a plant and its primary suppliers and major customers in developing and implanting
pollution prevention technologies.” This paradigm is considered here and implemented in what
follows into the food supply chain within the GSCM scope. As pointed out by Vachon and Klassen
[39] and corroborated by Albino et al. [40], the integration of suppliers through partnerships has a
positive effect of operations performance, and furthermore may stimulate gains in integrated
knowledge and knowhow from the supply network [41], which, in turn, can have a positive effect on
the development of agricultural practices and supply chain negotiations and distribution issues.
Figure 2. Analogy between Green Supply Chain Management (GSCM) and contract farming elements.
The manufacturer used in the case study is both the Focal Company and Integrator, thus themodel we present is adapted to this type of supply chain configuration. In other words, this paper islimited to this situation, i.e., where the focal company is the processing company, and is the principalnegotiator with suppliers and distributers or consuming markets.
It is important to note that the details related to the negotiation and contracting stages areout of the scope of this research; however, the contract form that allows for the collaboration andtechnology transfer, that includes which technological package to use at the suppliers’ fields, is part ofthe general approach.
Contract farming as described in a special report for FAO by Eaton and Chepherd [38], and isthe use of contracts to build a foundation of collaborations between the FC and the supplier, wherethe whole or a fraction of production output from suppliers is bought guaranteeing (not withoutrisk) a reliable source of product, while the supplier has an assured buyer. According to the FAOreport, this model is an effective way of taking advantage of the investment power and knowledgebase of the FC by transferring technical skills in order to use the synergy reached to improve supplierperformance. This, in turn, helps to guarantee both parties a partnership for growth and helps mitigateand spread risk. Most importantly, within the context of this paper, it allows the FC to require andshare technological packages or practices to be used at the supplier field in order to obtain conformingand consistent raw materials. It also gives enough flexibility to find the optimal supplier technologypackage selection.
1.5. Partnership for Sustainability
Partnership for sustainability is derived from the premise documented by Vachon and Klassen [39],in a paper related to the improvement in operational performance based on partnerships in the supplychain. They use the term “green project partnership”, to describe “the extent of interaction between aplant and its primary suppliers and major customers in developing and implanting pollution preventiontechnologies.” This paradigm is considered here and implemented in what follows into the foodsupply chain within the GSCM scope. As pointed out by Vachon and Klassen [39] and corroborated byAlbino et al. [40], the integration of suppliers through partnerships has a positive effect of operationsperformance, and furthermore may stimulate gains in integrated knowledge and knowhow from thesupply network [41], which, in turn, can have a positive effect on the development of agriculturalpractices and supply chain negotiations and distribution issues.
Sustainability 2019, 11, 7017 6 of 19
This paper outlines a framework to apply this type of partnership as a step-by-step methodology,to distinguish from green project partnership as a general term that describes partnerships both withsuppliers and customers. It will be referred to in the following as Partnership for Sustainability.
2. Materials and Methods
The general approach to solve the SSP consists of implementing a set of steps, where after scoutinga list of potential suppliers, a discrimination process is made through basic common sense judgements;this is followed by a measurement and characterization step based on requirements and desirableattributes. Then, a classification or ranking is done in order to target negotiations and contracting(Table 1).
Although this can be a dynamic process, meaning that there are new suppliers being added andold suppliers eliminated from the approved supplier catalogue, it can also be part of the strategic andtactical planning stages for long-term improvements that can be reviewed periodically. This research issituated in the latter approach.
The steps in Table 1 extend from the conventional supplier selection process to form part of aholistic approach to characterize the potential partners in addition to modelling, optimization andselection steps, to end with the execution of a contractual negotiation and agreement. This last step isnot yet described in detail since it falls outside of the scope of this paper; steps 3 to 6 are described indetail in this section.
Table 1. Partnership for Sustainability Supplier Selection processes.
No. Description
1 Pre-selection or scouting of suppliers2 Short listing based on common sense judgment3 Supplier characterization4 Supplier network model5 Supplier network optimization6 Supplier network selection7 Supplier negotiation and contracting
2.1. Partner for Sustainability: Supplier Characterization
The current SSP is framed by looking at a set of characteristics required by the productionplant being supplied. The most common characteristics evaluated include quality, cost and deliveryperformance; although some efforts have been made to include environmental criteria in the supplierselection process, this kind of approach gaining traction in becoming the norm.
It must be also highlighted that the evaluation methods found in the domain literature describethe supplier selection process as a search for the most competitive vender without looking necessarilyat the potential benefit of a long-term partnership, although there are some instances. In this approach,the characterization process itself consists of looking at the requirements or criteria most valued by theFC and implementing scoring or measurement systems in order to allocate a value to each supplierbased on observed or estimated performance. For this purpose, the Partnership for Sustainabilitytakes the potential capability of the supplier given the field or region characteristics (i.e., land andenvironment), and the technological package that can be used into account. This means that thequestion is not only which supplier to choose but also what technology should be matched to obtainthe best criteria measurements.
The justification of this approach is also made given that many of the sustainability leaders, atleast in the chemical industry, that manage ecology and social sustainability beyond their companyboundary and view managing supplier relations as part of their fundamental strategy [35].
The output from each region, from each orchard and even with the same technology, can differ.This is why an initial estimation of the output and cost from each orchard or the regional location
Sustainability 2019, 11, 7017 7 of 19
of the supplying orchards must be made. This information is then analyzed and processed in orderto have useful operational information. This may be difficult for some agro-food products but isalready used in orange production in many regions of Mexico. These types of characterizations can bemade by collaboration through a confederation of growers, trade group, sponsorship of the FC or bygovernment and independent research bodies.
The characterization of the performance of the fields can be either an internal exercise of thedifferent production fields or it can be an experimental one carried out by expert bodies. In the secondalternative, a third body has to collect and integrate data into information that can be used by allstakeholders. This can be carried out by the use of experimental fields in order to characterize thesurrounding environment and local soil production.
The information that is necessary to apply this methodology is: field production yield (expressedin tons per hectare per year) and operations cost (energy cost, agrochemicals input cost, etc.). Otherimportant indicators may also be considered such as land and irrigation cost, but are not included inthe scope of the case study of this investigation.
The most widely used technique to measure the environmental impact in the current literatureon GSCM is using LCA, which matches well with the holistic systems approach of SCM. LCA canprovide information on the effect of each step depending on the depth of the analysis, from processand product design to industrial systems design and even at more strategic scales, such as GSCM.For the SSP, a collaborative scenario is investigated in which information and knowhow are sharedbetween the Focal Company and the suppliers, this is also known as Supplier Development [34]; theobjective is to use the synergy created through the flow of information that helps the Focal Companymake better decisions. This explains why the FC has the insight to perform a system-wide analysissuch as LCA. To collect and analyze the potential data, suppliers must be willing to share informationon field, plants and management practices; in turn, the centralized manager must be transparent in itsmeasurement and evaluation techniques. This process can be divided into three steps as explained inthe two following sections.
In this step, a characterization of regionally used technological packages has to be evaluated,this can be based or made at the same time as the Yield and Cost characterization process; thesepackages may consist of agrochemicals used, soil treatment, physical manipulation (e.g., hedging,pruning, shaping, etc.), and machinery used, among other things. During this phase, experts areneeded not only to characterize the production systems at field, but also to help classify them bylevel of sophistication. The result should be a manageable set of categories in which an average isused as a typical example per category that describes how production systems work (e.g., “organic”production, average production and intensive production system). Although it is important to have awell-developed approach in order to classify, this falls out of the scope of this research. It is assumedthat this step is performed through expert opinion; for the case study, information from a regionalgovernment-funded agricultural research center is used.
Once the categories are developed, a systematic evaluation is achieved to define the basic indicatorsthat will be used in the modelling and optimization process. These indicators may consist of operationalfunctions such as the average yield obtained per area, plant or tree. It can also include economicfunctions such as average cost per unit of product given a technological package used, which aredeveloped during the Yield and Cost characterization; in addition, environmental impact indicatorssuch as CO2 emissions or eutrophication are calculated per area, plant or tree in a given timeframe, e.g.,per year. The environmental impacts are evaluated by LCA. This analysis requires different levels ofinformation provided by field and literature research, expert collaborators and dedicated LCA softwaretools that are commercially available.
The environmental impact assessment is then integrated in the model as well as the other indicators.The model is useful to predict the impact that a decision alternative has not only towards operationaland economic performance, but also towards environmental aspects given a set of decision variables.
Sustainability 2019, 11, 7017 8 of 19
2.2. Partner for Sustainability: Supplier Network Model
In order to directly improve the overall performance of the Supplier Network (SN) by incorporatinga long-term partnership in which an interchange of technological knowledge and risk sharing is madeby contract, a multi-objective optimization formulation is proposed. This approach allows theconsideration of multiple and possibly antagonistic objectives to be concurrently optimized [23,42].
The general model is described below:
Index and Sets
i Supplier index of a set Ig Technology package of a set G
Variables
bi Binary variable used to select a supplier (i)si Production capacity to be contracted per supplier (i) as a continuous measurement of land area (ha)Yi,g Production yield estimated per technology package (g) used at each supplier (i) (ton/ha/yr)CTi,g Production cost estimated per technology package (g) used at each supplier (i) ($/ha)EI Environmental impact measurement of the full set of suppliers (i) (EI unit e.g., KgCO2-eq)EIsi Environmental impact estimation for each supplier (i) (EI unit/supplier)COi Cost incurred for operations for each supplier (i) ($/yr)CEg Environmental cost estimated per unit of production based on technology (g) (EI unit/kg)Cost Cost incurred of the full set of suppliers ($/yr)LLCi Lowest value of land capacity to be contracted of each supplier (i) (ha)P Total raw material produced (ton/yr)PCap Processing plant raw material requirement (ton/yr)
Objective functions
Z1 = min (Costs)Z2 = min (Environmental Impacts)
The cost variable represents the cumulative cost of all orchards; this is to say the sum of the cost ofeach supplier given the technology package used and the capacity contracted represented by COi (seeEquation (1)):
Cost =n∑
i=1
COi. (1)
The COi expression in Equation (2) is calculated considering the selection of a supplier, thecapacity that is contracted multiplied by the cost per hectare given a given technological package, hererepresented by the (g) index, all of this calculated per supplier (i):
COi = bisi ×CTi,g f rom i = 1, 2, . . . , n. (2)
The global impact generated by all suppliers can be evaluated by Equation (3):
EI =n∑
i=1
EIsi. (3)
In Expression (4), the environmental impact based on selection variable (b), capacity to becontracted (s) and technology package selected (g) is expressed by:
EIsi = bisiYi,gCEg f or all i = 1, 2, . . . , n (4)
subject to, raw material requirement of the processing plant (FC) expressed in Equation (5):
P ≤ PCap. (5)
Sustainability 2019, 11, 7017 9 of 19
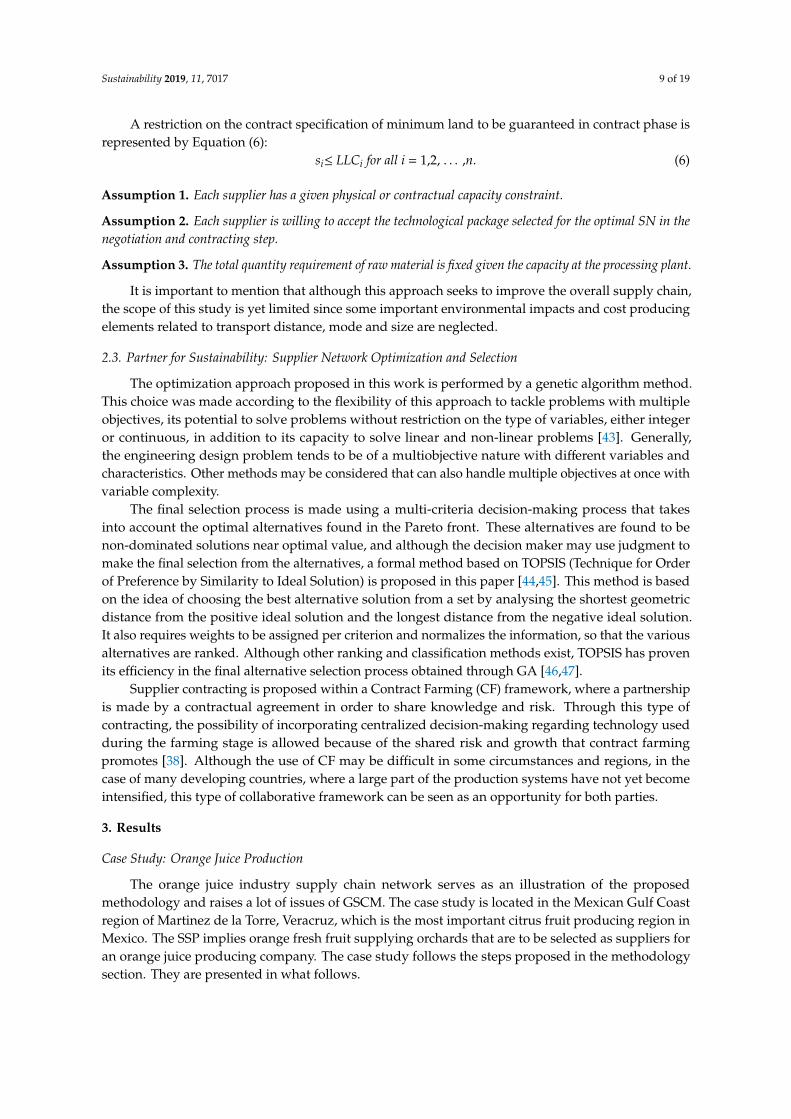
A restriction on the contract specification of minimum land to be guaranteed in contract phase isrepresented by Equation (6):
si≤ LLCi for all i = 1,2, . . . ,n. (6)
Assumption 1. Each supplier has a given physical or contractual capacity constraint.
Assumption 2. Each supplier is willing to accept the technological package selected for the optimal SN in thenegotiation and contracting step.
Assumption 3. The total quantity requirement of raw material is fixed given the capacity at the processing plant.
It is important to mention that although this approach seeks to improve the overall supply chain,the scope of this study is yet limited since some important environmental impacts and cost producingelements related to transport distance, mode and size are neglected.
2.3. Partner for Sustainability: Supplier Network Optimization and Selection
The optimization approach proposed in this work is performed by a genetic algorithm method.This choice was made according to the flexibility of this approach to tackle problems with multipleobjectives, its potential to solve problems without restriction on the type of variables, either integeror continuous, in addition to its capacity to solve linear and non-linear problems [43]. Generally,the engineering design problem tends to be of a multiobjective nature with different variables andcharacteristics. Other methods may be considered that can also handle multiple objectives at once withvariable complexity.
The final selection process is made using a multi-criteria decision-making process that takesinto account the optimal alternatives found in the Pareto front. These alternatives are found to benon-dominated solutions near optimal value, and although the decision maker may use judgment tomake the final selection from the alternatives, a formal method based on TOPSIS (Technique for Orderof Preference by Similarity to Ideal Solution) is proposed in this paper [44,45]. This method is basedon the idea of choosing the best alternative solution from a set by analysing the shortest geometricdistance from the positive ideal solution and the longest distance from the negative ideal solution.It also requires weights to be assigned per criterion and normalizes the information, so that the variousalternatives are ranked. Although other ranking and classification methods exist, TOPSIS has provenits efficiency in the final alternative selection process obtained through GA [46,47].
Supplier contracting is proposed within a Contract Farming (CF) framework, where a partnershipis made by a contractual agreement in order to share knowledge and risk. Through this type ofcontracting, the possibility of incorporating centralized decision-making regarding technology usedduring the farming stage is allowed because of the shared risk and growth that contract farmingpromotes [38]. Although the use of CF may be difficult in some circumstances and regions, in thecase of many developing countries, where a large part of the production systems have not yet becomeintensified, this type of collaborative framework can be seen as an opportunity for both parties.
3. Results
Case Study: Orange Juice Production
The orange juice industry supply chain network serves as an illustration of the proposedmethodology and raises a lot of issues of GSCM. The case study is located in the Mexican Gulf Coastregion of Martinez de la Torre, Veracruz, which is the most important citrus fruit producing region inMexico. The SSP implies orange fresh fruit supplying orchards that are to be selected as suppliers foran orange juice producing company. The case study follows the steps proposed in the methodologysection. They are presented in what follows.
Sustainability 2019, 11, 7017 10 of 19
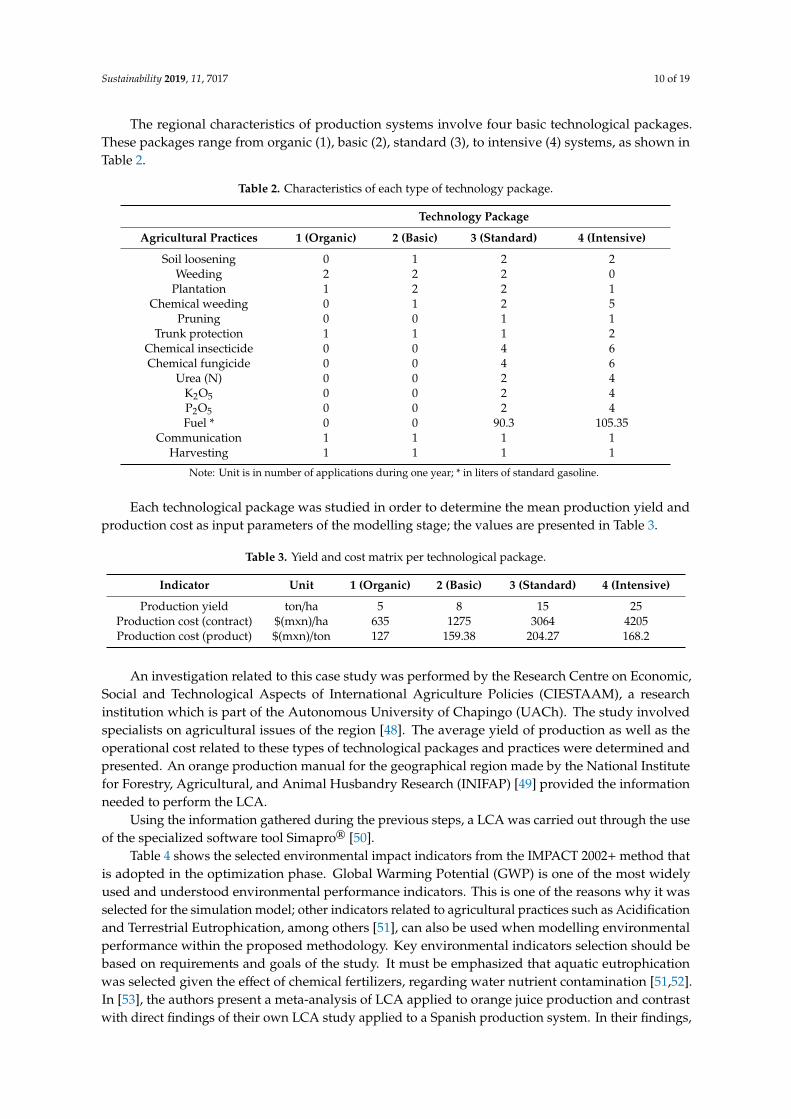
The regional characteristics of production systems involve four basic technological packages.These packages range from organic (1), basic (2), standard (3), to intensive (4) systems, as shown inTable 2.
Table 2. Characteristics of each type of technology package.
Technology Package
Agricultural Practices 1 (Organic) 2 (Basic) 3 (Standard) 4 (Intensive)
Soil loosening 0 1 2 2Weeding 2 2 2 0
Plantation 1 2 2 1Chemical weeding 0 1 2 5
Pruning 0 0 1 1Trunk protection 1 1 1 2
Chemical insecticide 0 0 4 6Chemical fungicide 0 0 4 6
Urea (N) 0 0 2 4K2O5 0 0 2 4P2O5 0 0 2 4Fuel * 0 0 90.3 105.35
Communication 1 1 1 1Harvesting 1 1 1 1
Note: Unit is in number of applications during one year; * in liters of standard gasoline.
Each technological package was studied in order to determine the mean production yield andproduction cost as input parameters of the modelling stage; the values are presented in Table 3.
Table 3. Yield and cost matrix per technological package.
Indicator Unit 1 (Organic) 2 (Basic) 3 (Standard) 4 (Intensive)
Production yield ton/ha 5 8 15 25Production cost (contract) $(mxn)/ha 635 1275 3064 4205Production cost (product) $(mxn)/ton 127 159.38 204.27 168.2
An investigation related to this case study was performed by the Research Centre on Economic,Social and Technological Aspects of International Agriculture Policies (CIESTAAM), a researchinstitution which is part of the Autonomous University of Chapingo (UACh). The study involvedspecialists on agricultural issues of the region [48]. The average yield of production as well as theoperational cost related to these types of technological packages and practices were determined andpresented. An orange production manual for the geographical region made by the National Institutefor Forestry, Agricultural, and Animal Husbandry Research (INIFAP) [49] provided the informationneeded to perform the LCA.
Using the information gathered during the previous steps, a LCA was carried out through the useof the specialized software tool Simapro® [50].
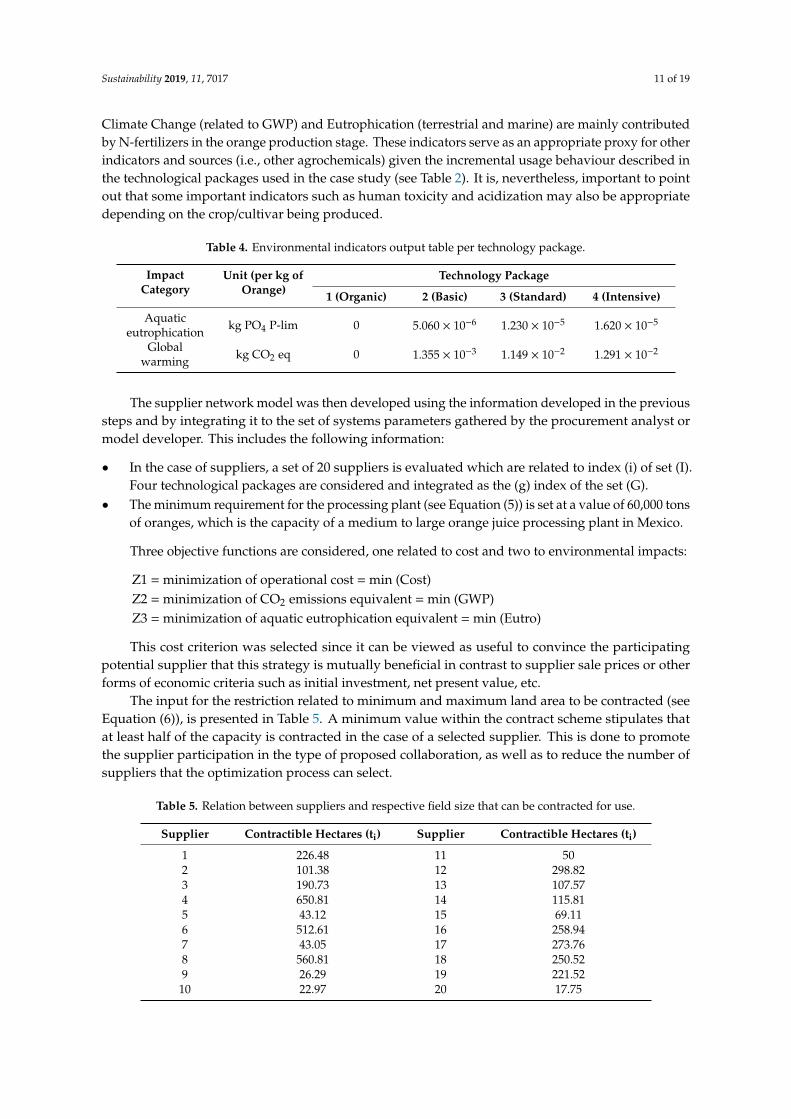
Table 4 shows the selected environmental impact indicators from the IMPACT 2002+ method thatis adopted in the optimization phase. Global Warming Potential (GWP) is one of the most widelyused and understood environmental performance indicators. This is one of the reasons why it wasselected for the simulation model; other indicators related to agricultural practices such as Acidificationand Terrestrial Eutrophication, among others [51], can also be used when modelling environmentalperformance within the proposed methodology. Key environmental indicators selection should bebased on requirements and goals of the study. It must be emphasized that aquatic eutrophicationwas selected given the effect of chemical fertilizers, regarding water nutrient contamination [51,52].In [53], the authors present a meta-analysis of LCA applied to orange juice production and contrastwith direct findings of their own LCA study applied to a Spanish production system. In their findings,
Sustainability 2019, 11, 7017 11 of 19
Climate Change (related to GWP) and Eutrophication (terrestrial and marine) are mainly contributedby N-fertilizers in the orange production stage. These indicators serve as an appropriate proxy for otherindicators and sources (i.e., other agrochemicals) given the incremental usage behaviour described inthe technological packages used in the case study (see Table 2). It is, nevertheless, important to pointout that some important indicators such as human toxicity and acidization may also be appropriatedepending on the crop/cultivar being produced.
Table 4. Environmental indicators output table per technology package.
ImpactCategory
Unit (per kg ofOrange)
Technology Package
1 (Organic) 2 (Basic) 3 (Standard) 4 (Intensive)
Aquaticeutrophication kg PO4 P-lim 0 5.060 × 10⁻⁶ 1.230 × 10⁻⁵ 1.620 × 10⁻⁵
Globalwarming kg CO2 eq 0 1.355 × 10⁻³ 1.149 × 10⁻² 1.291 × 10⁻²
The supplier network model was then developed using the information developed in the previoussteps and by integrating it to the set of systems parameters gathered by the procurement analyst ormodel developer. This includes the following information:
• In the case of suppliers, a set of 20 suppliers is evaluated which are related to index (i) of set (I).Four technological packages are considered and integrated as the (g) index of the set (G).
• The minimum requirement for the processing plant (see Equation (5)) is set at a value of 60,000 tonsof oranges, which is the capacity of a medium to large orange juice processing plant in Mexico.
Three objective functions are considered, one related to cost and two to environmental impacts:
Z1 = minimization of operational cost = min (Cost)Z2 = minimization of CO2 emissions equivalent = min (GWP)Z3 = minimization of aquatic eutrophication equivalent = min (Eutro)
This cost criterion was selected since it can be viewed as useful to convince the participatingpotential supplier that this strategy is mutually beneficial in contrast to supplier sale prices or otherforms of economic criteria such as initial investment, net present value, etc.
The input for the restriction related to minimum and maximum land area to be contracted (seeEquation (6)), is presented in Table 5. A minimum value within the contract scheme stipulates thatat least half of the capacity is contracted in the case of a selected supplier. This is done to promotethe supplier participation in the type of proposed collaboration, as well as to reduce the number ofsuppliers that the optimization process can select.
Table 5. Relation between suppliers and respective field size that can be contracted for use.
Supplier Contractible Hectares (ti) Supplier Contractible Hectares (ti)
1 226.48 11 502 101.38 12 298.823 190.73 13 107.574 650.81 14 115.815 43.12 15 69.116 512.61 16 258.947 43.05 17 273.768 560.81 18 250.529 26.29 19 221.52
10 22.97 20 17.75
Sustainability 2019, 11, 7017 12 of 19
Optimization is then carried out using the MULTIGEN®genetic algorithm extension library [54].The optimization simulations parameters used are shown in Table 6. The population size and numberof generations was empirically evaluated by a preliminary analysis showing that a ratio roughly setat 20 individuals per variable, and doubling of population size is effective within the MULTIGENenvironment. The crossover and mutation rates were set at default values as suggested in [54]. The useof the NSGA II optimization algorithm is selected given its capacity to find a non-dominated set ofalternatives to develop the Pareto fronts needed [55].
Table 6. Optimization run parameters.
Parameters Values
Population size 400Number of generations 800
Algorithm NSGA IICrossover rate 0.9Mutation rate 0.5
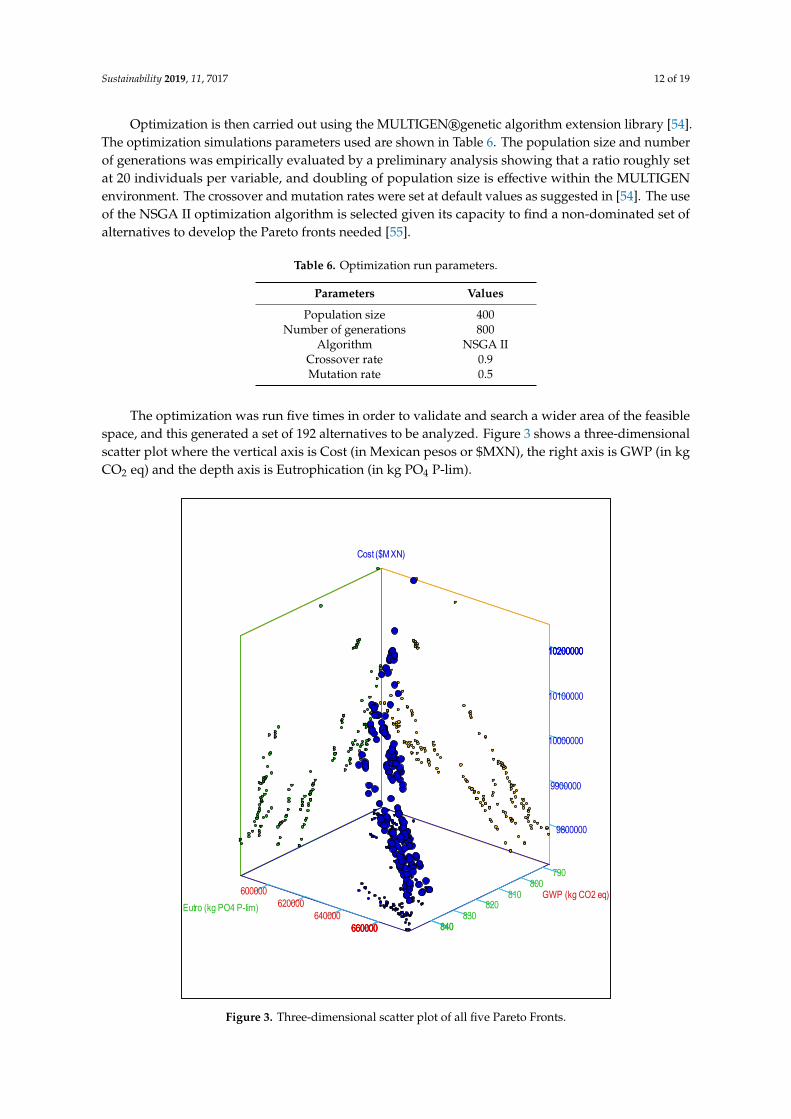
The optimization was run five times in order to validate and search a wider area of the feasiblespace, and this generated a set of 192 alternatives to be analyzed. Figure 3 shows a three-dimensionalscatter plot where the vertical axis is Cost (in Mexican pesos or $MXN), the right axis is GWP (in kgCO2 eq) and the depth axis is Eutrophication (in kg PO4 P-lim).Sustainability 2019, 11, x FOR PEER REVIEW 13 of 20
Figure 3. Three-dimensional scatter plot of all five Pareto Fronts.
Given that the resulting set of five Pareto fronts does not show a clear optimal decision
alternative or region, the use of a decision-making tool becomes even more necessary. This final
selection process is carried out through the use of a modified TOPSIS method proposed by Ren et al.
[45] that consists of ranking the alternatives through a comparison with the values of the “ideal”
curve. Before applying the TOPSIS method, a selection is made in order to keep only non-dominated
alternatives from the five Pareto fronts. This series of steps is described below:
U{Pareto Front runs i = 1,…,5} → Pareto {U} →TOPSIS {Pareto}. (7)
By applying steps 1 and 2 of the abovementioned procedure, leading to the Pareto of the
Paretos (i.e. Pareto {U}), a lower number of 46 non-dominated alternative solutions is obtained. From
them, the TOPSIS method [45] is applied in order to find the best ranked values. Figure 4 shows the
resulting values with the location of special TOPSIS values called 1, 13 and 45, that correspond to the
overall top-ranked one, the best TOPSIS value in relation to GWP and the best TOPSIS value in
relation to Eutrophication, respectively.
Eutro (kg PO4 P-lim)
GWP (kg CO2 eq)
Cost ($MXN)
790800
810820
830840840
600000
620000
640000
660000660000660000660000
9800000
9900000
10000000
10100000
102000001020000010200000
Figure 3. Three-dimensional scatter plot of all five Pareto Fronts.
Sustainability 2019, 11, 7017 13 of 19
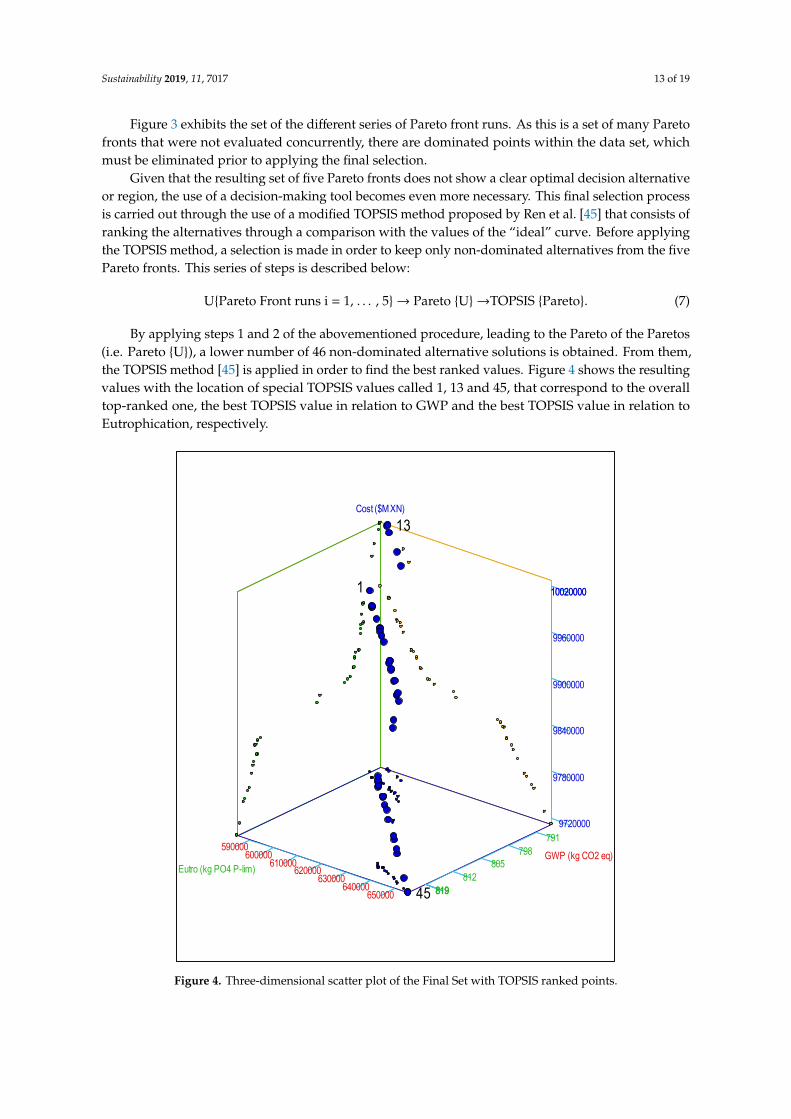
Figure 3 exhibits the set of the different series of Pareto front runs. As this is a set of many Paretofronts that were not evaluated concurrently, there are dominated points within the data set, whichmust be eliminated prior to applying the final selection.
Given that the resulting set of five Pareto fronts does not show a clear optimal decision alternativeor region, the use of a decision-making tool becomes even more necessary. This final selection processis carried out through the use of a modified TOPSIS method proposed by Ren et al. [45] that consists ofranking the alternatives through a comparison with the values of the “ideal” curve. Before applyingthe TOPSIS method, a selection is made in order to keep only non-dominated alternatives from the fivePareto fronts. This series of steps is described below:
U{Pareto Front runs i = 1, . . . , 5}→ Pareto {U}→TOPSIS {Pareto}. (7)
By applying steps 1 and 2 of the abovementioned procedure, leading to the Pareto of the Paretos(i.e. Pareto {U}), a lower number of 46 non-dominated alternative solutions is obtained. From them,the TOPSIS method [45] is applied in order to find the best ranked values. Figure 4 shows the resultingvalues with the location of special TOPSIS values called 1, 13 and 45, that correspond to the overalltop-ranked one, the best TOPSIS value in relation to GWP and the best TOPSIS value in relation toEutrophication, respectively.Sustainability 2019, 11, x FOR PEER REVIEW 14 of 20
Figure 4. Three-dimensional scatter plot of the Final Set with TOPSIS ranked points.
Figure 4 shows that the top-ranked TOPSIS value is in the higher cost range. This solution is yet
selected due to the trade-off against the environmental criteria. The improvement of cost is low,
relative to the gains in environmental performance.
Table 7 presents the values for each criterion for some significant TOPSIS ranked alternative:
number 1 (TOPSIS 1), the 13th (TOPSIS 13) and 45th (TOPSIS 45) values. TOPSIS 1 has the best
compromise since it provides the best value for GWP and only differs from the best value for
Eutrophication criteria by 0.33% (TOPSIS 13). Its cost is slightly higher of 2.35% of the best cost
criterion performing alternative (TOPSIS 45). The three points can also be visualized in Figure 4
where TOPSIS 13 and 45 are at the extremes, whereas TOPSIS 1 is located at the upper part of the
scatter plot.
Table 7. TOPSIS evaluation per criterion.
Criterion TOPSIS
1
TOPSIS
13
TOPSIS
45
Discrepancy 1 vs.
13
Discrepancy 1 vs.
45
Cost ($MXN) 9,945,457 10,027,688 9,712,002 0.83% 2.35%
GWP (kg CO2 eq) 585,024 587,981.24 655,538 0.51% 12.05%
Eutro (kg 789 787.09 823 0.33% 4.26%
Eutro (kg PO4 P-lim)
GWP (kg CO2 eq)
Cost ($MXN)
791
798
805
812
819819819
590000600000
610000620000
630000640000
650000
9720000
9780000
9840000
9900000
9960000
1002000010020000
45
1
13
Figure 4. Three-dimensional scatter plot of the Final Set with TOPSIS ranked points.
Sustainability 2019, 11, 7017 14 of 19
Figure 4 shows that the top-ranked TOPSIS value is in the higher cost range. This solution isyet selected due to the trade-off against the environmental criteria. The improvement of cost is low,relative to the gains in environmental performance.
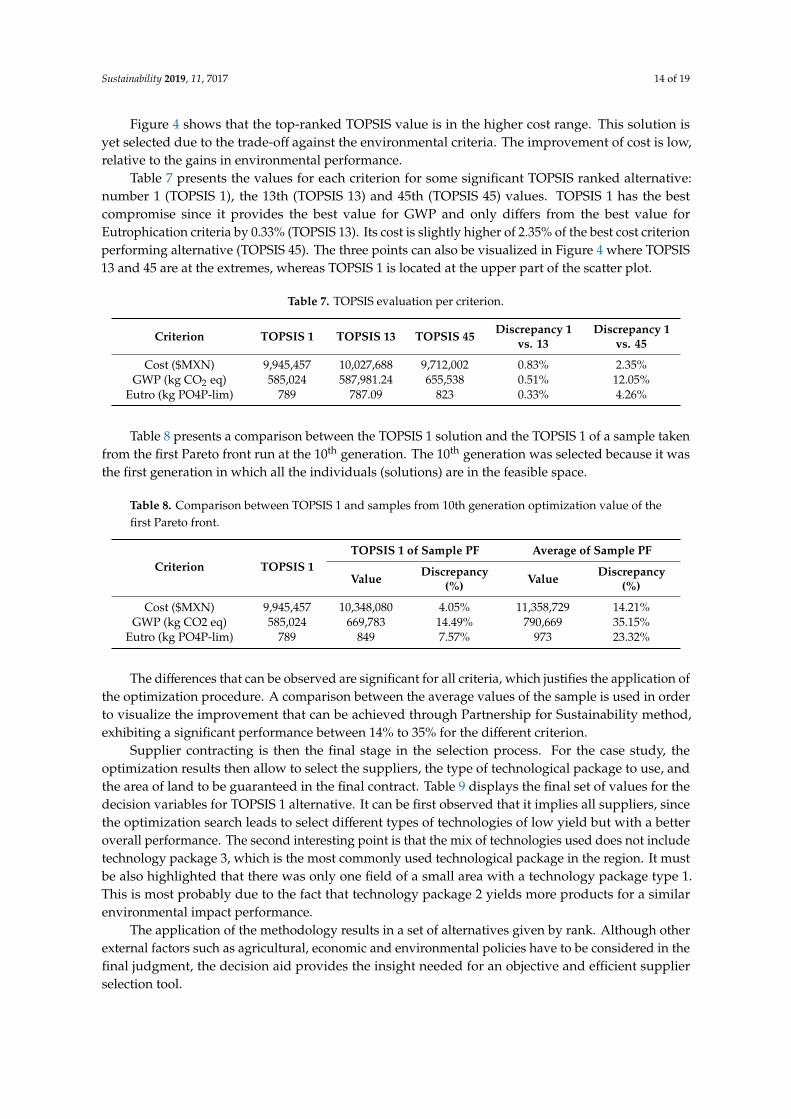
Table 7 presents the values for each criterion for some significant TOPSIS ranked alternative:number 1 (TOPSIS 1), the 13th (TOPSIS 13) and 45th (TOPSIS 45) values. TOPSIS 1 has the bestcompromise since it provides the best value for GWP and only differs from the best value forEutrophication criteria by 0.33% (TOPSIS 13). Its cost is slightly higher of 2.35% of the best cost criterionperforming alternative (TOPSIS 45). The three points can also be visualized in Figure 4 where TOPSIS13 and 45 are at the extremes, whereas TOPSIS 1 is located at the upper part of the scatter plot.
Table 7. TOPSIS evaluation per criterion.
Criterion TOPSIS 1 TOPSIS 13 TOPSIS 45 Discrepancy 1vs. 13
Discrepancy 1vs. 45
Cost ($MXN) 9,945,457 10,027,688 9,712,002 0.83% 2.35%GWP (kg CO2 eq) 585,024 587,981.24 655,538 0.51% 12.05%
Eutro (kg PO4P-lim) 789 787.09 823 0.33% 4.26%
Table 8 presents a comparison between the TOPSIS 1 solution and the TOPSIS 1 of a sample takenfrom the first Pareto front run at the 10th generation. The 10th generation was selected because it wasthe first generation in which all the individuals (solutions) are in the feasible space.
Table 8. Comparison between TOPSIS 1 and samples from 10th generation optimization value of thefirst Pareto front.
Criterion TOPSIS 1TOPSIS 1 of Sample PF Average of Sample PF
Value Discrepancy(%) Value Discrepancy
(%)
Cost ($MXN) 9,945,457 10,348,080 4.05% 11,358,729 14.21%GWP (kg CO2 eq) 585,024 669,783 14.49% 790,669 35.15%
Eutro (kg PO4P-lim) 789 849 7.57% 973 23.32%
The differences that can be observed are significant for all criteria, which justifies the application ofthe optimization procedure. A comparison between the average values of the sample is used in orderto visualize the improvement that can be achieved through Partnership for Sustainability method,exhibiting a significant performance between 14% to 35% for the different criterion.
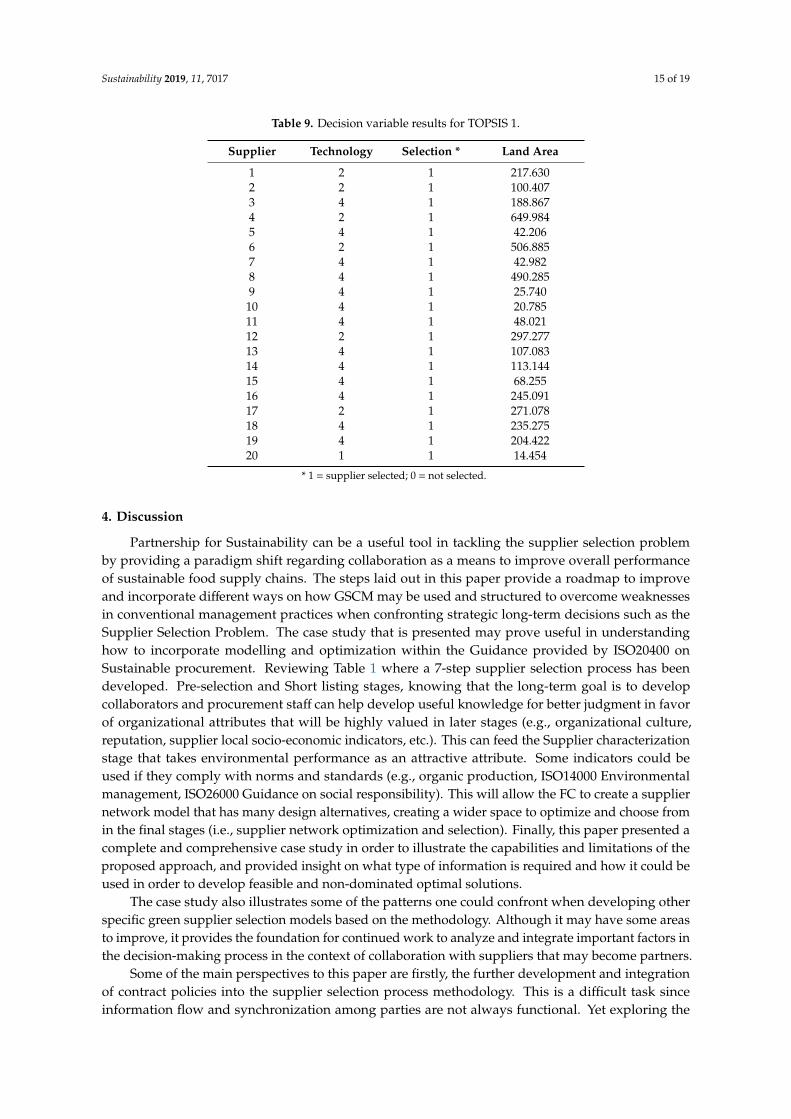
Supplier contracting is then the final stage in the selection process. For the case study, theoptimization results then allow to select the suppliers, the type of technological package to use, andthe area of land to be guaranteed in the final contract. Table 9 displays the final set of values for thedecision variables for TOPSIS 1 alternative. It can be first observed that it implies all suppliers, sincethe optimization search leads to select different types of technologies of low yield but with a betteroverall performance. The second interesting point is that the mix of technologies used does not includetechnology package 3, which is the most commonly used technological package in the region. It mustbe also highlighted that there was only one field of a small area with a technology package type 1.This is most probably due to the fact that technology package 2 yields more products for a similarenvironmental impact performance.
The application of the methodology results in a set of alternatives given by rank. Although otherexternal factors such as agricultural, economic and environmental policies have to be considered in thefinal judgment, the decision aid provides the insight needed for an objective and efficient supplierselection tool.
Sustainability 2019, 11, 7017 15 of 19
Table 9. Decision variable results for TOPSIS 1.
Supplier Technology Selection * Land Area
1 2 1 217.6302 2 1 100.4073 4 1 188.8674 2 1 649.9845 4 1 42.2066 2 1 506.8857 4 1 42.9828 4 1 490.2859 4 1 25.740
10 4 1 20.78511 4 1 48.02112 2 1 297.27713 4 1 107.08314 4 1 113.14415 4 1 68.25516 4 1 245.09117 2 1 271.07818 4 1 235.27519 4 1 204.42220 1 1 14.454
* 1 = supplier selected; 0 = not selected.
4. Discussion
Partnership for Sustainability can be a useful tool in tackling the supplier selection problemby providing a paradigm shift regarding collaboration as a means to improve overall performanceof sustainable food supply chains. The steps laid out in this paper provide a roadmap to improveand incorporate different ways on how GSCM may be used and structured to overcome weaknessesin conventional management practices when confronting strategic long-term decisions such as theSupplier Selection Problem. The case study that is presented may prove useful in understandinghow to incorporate modelling and optimization within the Guidance provided by ISO20400 onSustainable procurement. Reviewing Table 1 where a 7-step supplier selection process has beendeveloped. Pre-selection and Short listing stages, knowing that the long-term goal is to developcollaborators and procurement staff can help develop useful knowledge for better judgment in favorof organizational attributes that will be highly valued in later stages (e.g., organizational culture,reputation, supplier local socio-economic indicators, etc.). This can feed the Supplier characterizationstage that takes environmental performance as an attractive attribute. Some indicators could beused if they comply with norms and standards (e.g., organic production, ISO14000 Environmentalmanagement, ISO26000 Guidance on social responsibility). This will allow the FC to create a suppliernetwork model that has many design alternatives, creating a wider space to optimize and choose fromin the final stages (i.e., supplier network optimization and selection). Finally, this paper presented acomplete and comprehensive case study in order to illustrate the capabilities and limitations of theproposed approach, and provided insight on what type of information is required and how it could beused in order to develop feasible and non-dominated optimal solutions.
The case study also illustrates some of the patterns one could confront when developing otherspecific green supplier selection models based on the methodology. Although it may have some areasto improve, it provides the foundation for continued work to analyze and integrate important factors inthe decision-making process in the context of collaboration with suppliers that may become partners.
Some of the main perspectives to this paper are firstly, the further development and integrationof contract policies into the supplier selection process methodology. This is a difficult task sinceinformation flow and synchronization among parties are not always functional. Yet exploring the
Sustainability 2019, 11, 7017 16 of 19
potential of Contract Farming and collaborative farming in the context of the SSP may be valuable insome organizations. A second opportunity is to target the information collection, in the sense of betterestablishing which type of information a buyer requires from its potential and current suppliers, inorder to make the best decision and to continuously maintain an effective supplier network.
Finally, an important perspective is to integrate the results of this model into a global greensupply chain optimization model that may use a similar approach for visualizing and solving the otherlarge-scale strategic challenges of GSCM.
Author Contributions: Conceptualization, C.A.-P. and M.A.M.-A.; investigation, A.A.A.-L.; data curation,K.C.A.-S.; writing—original draft preparation, M.A.M.-A.; writing—review and editing, C.A.-P.; visualization,A.B.-S.
Funding: This research received no external funding.
Conflicts of Interest: The authors declare no conflicts of interest.
Abbreviations
ASC Agro-food Supply ChainCF Contract FarmingEI Focal CompanyGSCM Green Supply Chain ManagementLCA Life Cycle AssessmentLCI Life Cycle InventoryMCDM Multiple Criteria Decision MakingMOO Multi-Objective OptimizationMS Multiple StrengthM-TOPSIS Modified Technique for Order of Preference by Similarity To Ideal SolutionNSGA Non-Dominated Sorting Genetic AlgorithmsPfS Partnership for SustainabilitySC Supply ChainSCM Supply Chain ManagementSCND Supply Chain Network DesignSN Supplier NetworkSS Single StrengthSSP Supplier Selection ProblemTOPSIS Technique for Order of Preference by Similarity to Ideal Solution
References
1. Bougherara, D.; Combris, P. Eco-labelled food products: What are consumers paying for? Eur. Rev.Agric. Econ. 2009, 36, 321–341. [CrossRef]
2. Roheim, C.A.; Asche, F.; Santos, J.I. The Elusive Price Premium for Ecolabelled Products: Evidence fromSeafood in the UK Market. J. Agric. Econ. 2011, 62, 655–668. [CrossRef]
3. Marsden, T.; Murdoch, J.; Morgan, K. Sustainable agriculture, food supply chains and regional development:Editorial introduction. Int. Plan. Stud. 1999, 4, 295–301. [CrossRef]
4. Van der Werf, H.M.; Petit, J. Evaluation of the environmental impact of agriculture at the farm level: Acomparison and analysis of 12 indicator-based methods. Agric. Ecosyst. Environ. 2002, 93, 131–145. [CrossRef]
5. García-Alcaraz, J.L.; Alvarado-Iniesta, A.; Blanco-Fernández, J.; Maldonado-Macías, A.A.; Jiménez-Macías, E.;Saenz-Díez Muro, J.C. The Impact of Demand and Supplier Relationship. J. Food Process Eng. 2016, 39,645–658. [CrossRef]
6. De Boer, L.; Labro, E.; Morlacchi, P. A review of methods supporting supplier selection. Eur. J. Purch.Supply Manag. 2001, 7, 75–89. [CrossRef]
7. Abdallah, T.; Farhat, A.; Diabat, A.; Kennedy, S. Green Supply Chains with Carbon Trading and EnvironmentalSourcing: Formulation and Life Cycle Assessment. Appl. Math. Model. 2012, 36, 4271–4285. [CrossRef]
Sustainability 2019, 11, 7017 17 of 19
8. Hugo, A.; Pistikopoulos, E.N. Environmentally conscious long-range planning and design of supply chainnetworks. J. Clean. Prod. 2005, 13, 1471–1491. [CrossRef]
9. Jolliet, O.; Saadé, M.; Crettaz, P. Analyse Du Cycle De Vie: Comprendre Et Réaliser Un Écobilan; PressesPolytechniques Et Universitaires Romandes: Lausanne, Switzerland, 2010.
10. Seuring, S.; Muller, M. From a literature review to a conceptual framework for sustainable supply chainmanagement. J. Clean. Prod. 2008, 16, 1699–1710. [CrossRef]
11. Srivastava, S.K. Green supply-chain management: A state-of-the-art literature review. Int. J. Manag. Rev.2007, 9, 53–80. [CrossRef]
12. Mittal, A.; Krejci, C.C.; Craven, T.J. Logistics Best Practices for Regional Food Systems: A Review. Sustainability2018, 10, 168. [CrossRef]
13. Bertramsen, S.; Nquyen, G.; Dobbs, T. Quality and Eco-Labeling of Food Products in France and the United States;Department of Economics, South Dakota State University: Brookings, SD, USA, 2002.
14. Amin, S.H.; Zhang, G. An integrated model for closed-loop supply chain configuration and supplier selection:Multi-objective approach. Expert Syst. Appl. 2012, 39, 6782–6791. [CrossRef]
15. Ramudhin, A.; Chaabane, A.; Kharoune, M.; Paquet, M. Carbon Market Sensitive Green Supply ChainNetwork Design. In Proceedings of the 2008 IEEE International Conference on Industrial Engineering andEngineering Management, Singapore, 8–11 December 2008; pp. 1093–1097.
16. Corsano, G.; Vecchietti, A.R.; Montagna, J.M. Optimal design for sustainable bioethanol supply chainconsidering detailed plant performance model. Comput. Chem. Eng. 2011, 35, 1384–1398. [CrossRef]
17. Guillén-Gosálbez, G.; Grossmann, I.E. Optimal design and planning of sustainable chemical supply chainsunder uncertainty. AIChE J. 2009, 55, 99–121. [CrossRef]
18. Bouzembrak, Y.; Allaoui, H.; Goncalves, G.; Bouchriha, H. A multi-objective green supply chain networkdesign. In Proceedings of the 2011 4th International Conference on Logistics (LOGISTIQUA), Hammamet,Tunisia, 20 May 2011; pp. 357–361.
19. Cao, S.; Zhang, K. Optimization of the flow distribution of e-waste reverse logistics network based on NSGAII and TOPSIS. In Proceedings of the 2011 International Conference on E-Business and E-Government (ICEE),Potomac, MD, USA, 21–26 August 2011; pp. 1–5.
20. Lin, S.-S.; Juang, Y.-S. Selecting green suppliers with analytic hierarchy process for biotechnology industry.J. Oper. Supply Chain Manag. 2008, 1, 115–129. [CrossRef]
21. Collette, Y.; Siarry, P. Multiobjective Optimization: Principles and Case Studies; Springer Science & BusinessMedia: New York, NY, USA, 2003. Available online: https://books.google.fr/books?hl=en&lr=&id=
XNYF4hltoF0C&oi=fnd&pg=PA1&dq=optimisation+multi+objective+yann+siarry&ots=K1C-say5RE&sig=5OJ6Dg6yuBaG2Z1tC7eSk1nB6Nw (accessed on 20 March 2015).
22. Freitas, A.A. A Critical Review of Multi-objective Optimization in Data Mining: A Position Paper. SIGKDDExplor. Newsl. 2004, 6, 77–86. [CrossRef]
23. Miranda-Ackerman, M.A.; Azzaro-Pantel, C.; Aguilar-Lasserre, A.A. A green supply chain network designframework for the processed food industry: Application to the orange juice agrofood cluster. Comput. Ind. Eng.2017, 109, 369–389. [CrossRef]
24. Ware, N.R.; Singh, S.P.; Banwet, D.K. Supplier selection problem: A state-of-the-art review. Manag. Sci. Lett.2012, 2, 1465–1490. [CrossRef]
25. Zsidisin, G.A.; Siferd, S.P. Environmental purchasing: A framework for theory development. Eur. J. Purch.Supply Manag. 2001, 7, 61–73. [CrossRef]
26. Walton, S.V.; Handfield, R.B.; Melnyk, S.A. The Green Supply Chain: Integrating Suppliers into EnvironmentalManagement Processes. Int. J. Purch. Mater. Manag. 1998, 34, 2–11. [CrossRef]
27. Tate, W.L.; Ellram, L.M.; Dooley, K.J. Environmental purchasing and supplier management (EPSM): Theoryand practice. J. Purch. Supply Manag. 2012, 18, 173–188. [CrossRef]
28. Humphreys, P.K.; Wong, Y.K.; Chan, F.T.S. Integrating environmental criteria into the supplier selectionprocess. J. Mater. Process. Technol. 2003, 138, 349–356. [CrossRef]
29. Lee, A.H.; Kang, H.Y.; Hsu, C.F.; Hung, H.C. A green supplier selection model for high-tech industry.Expert Syst. Appl. 2009, 36, 7917–7927. [CrossRef]
30. Van Hoof, B.; Lyon, T.P. Cleaner Production in Small Firms taking part in Mexico’s Sustainable SupplierProgram. J. Clean. Prod. 2013, 41, 270–282. Available online: http://www.sciencedirect.com/science/article/
pii/S095965261200488X (accessed on 29 October 2013). [CrossRef]
Sustainability 2019, 11, 7017 18 of 19
31. Rehber, E. Vertical Coordination in the Agro-Food Industry And Contract Farming: A Comparative Studyof Turkey and the USA. In Food Marketing Policy Center Research Reports 052; Department of Agriculturaland Resource Economics, Charles J. Zwick Center for Food and Resource Policy, University of Connecticut:Mansfield, CT, USA, 2000. Available online: http://ideas.repec.org/p/zwi/fpcrep/052.html (accessed on15 October 2013).
32. Richard, L.; Kohls, J.N.U. Marketing of Agricultural Products; Prentice Hall: Upper Saddle River, NJ, USA, 1998.33. Minot, N. Contract Farming and Its Effect on Small Farmers in Less Developed Countries; Michigan State University,
Department of Agricultural, Food, and Resource Economics: East Lansing, MI, USA, 1986. Available online:http://ideas.repec.org/p/ags/midiwp/54740.html (accessed on 23 October 2013).
34. Bai, C.; Sarkis, J. Green supplier development: Analytical evaluation using rough set theory. J. Clean. Prod.2010, 18, 1200–1210. [CrossRef]
35. Leppelt, T.; Foerstl, K.; Reuter, C.; Hartmann, E. Sustainability management beyond organizationalboundaries–sustainable supplier relationship management in the chemical industry. J. Clean. Prod. 2013, 56,94–102. [CrossRef]
36. Rao, P.; Holt, D. Do green supply chains lead to competitiveness and economic performance? Int. J. Oper.Prod. Manag. 2005, 25, 898–916. [CrossRef]
37. Zhu, Q.; Sarkis, J. Relationships between operational practices and performance among early adopters ofgreen supply chain management practices in Chinese manufacturing enterprises. J. Oper. Manag. 2004, 22,265–289. [CrossRef]
38. Eaton, C.; Shepherd, A.W. Contract Farming—Partnerships for Growt; Food & Agriculture Organization: Rome,Italy, 2001.
39. Vachon, S.; Klassen, R.D. Green project partnership in the supply chain: The case of the package printingindustry. J. Clean. Prod. 2006, 14, 661–671. [CrossRef]
40. Albino, V.; Dangelico, R.M.; Pontrandolfo, P. Do inter-organizational collaborations enhance a firm’senvironmental performance? A study of the largest US companies. J. Clean. Prod. 2012, 37, 304–315. Availableonline: http://www.sciencedirect.com/science/article/pii/S095965261200371X (accessed on 15 October 2013).[CrossRef]
41. Bowen, F.E.; Cousins, P.D.; Lamming, R.C.; Farukt, A.C. The Role of Supply Management Capabilities inGreen Supply. Prod. Oper. Manag. 2001, 10, 174–189. [CrossRef]
42. Azzaro-Pantel, C.; Ouattara, A.; Pibouleau, L. Ecodesign of Chemical Processes with Multi-Objective GeneticAlgorithms. In Multi-Objective Optimization in Chemical Engineering; Rangaiah, G.P., Bonilla-Petriciolet, A.,Eds.; John Wiley & Sons Ltd.: Hoboken, NJ, USA, 2013; pp. 335–367.
43. Dietz, A.; Azzaro-Pantel, C.; Pibouleau, L.; Domenech, S. Multiobjective optimization for multiproduct batchplant design under economic and environmental considerations. Comput. Chem. Eng. 2006, 30, 599–613.[CrossRef]
44. Lai, Y.-J.; Liu, T.-Y.; Hwang, C.-L. TOPSIS for MODM. Eur. J. Oper. Res. 1994, 76, 486–500. [CrossRef]45. Ren, L.; Zhang, Y.; Wang, Y.; Sun, Z. Comparative Analysis of a Novel M-TOPSIS Method and TOPSIS.
Appl. Math. Res. Express 2007, 2007, abm005. [CrossRef]46. Gen, M.; Cheng, R. Genetic Algorithms and Engineering Optimization; John Wiley & Sons, Inc.: Hoboken, NJ,
USA, 1999. Available online: https://www.google.fr/search?q=Genetic+Algorithms+and+Engineering+
Optimization&oq=Genetic+Algorithms+and+Engineering+Optimization&aqs=chrome.0.57j61j62l2.265&sugexp=chrome,mod=8&sourceid=chrome&ie=UTF-8 (accessed on 17 December 2012).
47. Gen, M.; Kumar, A.; Ryul Kim, J. Recent network design techniques using evolutionary algorithms. Int. J.Prod. Econ. 2005, 98, 251–261. [CrossRef]
48. Gomez Cruz, M.; Schwentesius Rindermann, R. La Agroindustria De Naranja En Mexico; Ciestaam: Estado deMéxico, México, 1997.
49. Curti-Díaz, S.A.; Diaz-Zorrilla, U.; Loredo-Salazar, X. Manual De Produccion De Naranja ParaVeracruz Y TABASCO. Available online: http://www.concitver.com/archivosenpdf/MANUAL%20DE%20PRODUCCION%20DE%20NARANJA%20PARA%20VERACRUZ%20Y%20TABASCO.pdf (accessed on10 January 2015).
50. Goedkoop, M.; De Schryver, A.; Oele, M. Introduction to LCA with SimaPro 7; PRé Consultants Report 4;PRé Consultants: Amersfoort, The Netherlands, 2008.

Sustainability 2019, 11, 7017 19 of 19
51. Brentrup, F. Life Cycle assessment to evaluate the environmental impact of arable crop production. Int. J. LCA2003, 8, 156. [CrossRef]
52. Huijbregts, M.A.; Seppälä, J. Life Cycle Impact assessment of pollutants causing aquatic eutrophication.Int. J. Life Cycle Assess. 2001, 6, 339–343. [CrossRef]
53. Doublet, G.; Jungbluth, N.; Flury, K.; Stucki, M.; Schori, S. Life cycle assessment of orange juice.In SENSE-Harmonised Environmental Sustainability in the European Food and Drink Chain, Seventh FrameworkProgramme: Project No. 288974; Funded by EC; Deliverable D 2.1 ESU-services Ltd.: Zürich, Switzerland, 2013.
54. Gomez, A.; Pibouleau, L.; Azzaro-Pantel, C.; Domenech, S.; Latgé, C.; Haubensack, D. Multiobjective geneticalgorithm strategies for electricity production from generation IV nuclear technology. Energy Convers. Manag.2010, 51, 859–871. [CrossRef]
55. Deb, K.; Pratap, A.; Agarwal, S.; Meyarivan, T.A. A fast and elitist multiobjective genetic algorithm: NSGA-II.IEEE Trans. Evol. Comput. 2002, 6, 182–197. [CrossRef]
© 2019 by the authors. Licensee MDPI, Basel, Switzerland. This article is an open accessarticle distributed under the terms and conditions of the Creative Commons Attribution(CC BY) license (http://creativecommons.org/licenses/by/4.0/).


