Embed Size (px)
Citation preview

Journal ofMaterials Chemistry A
PAPER
Publ
ishe
d on
02
May
201
3. D
ownl
oade
d by
Tri
nity
Col
lege
Dub
lin o
n 13
/03/
2015
11:
49:2
0.
View Article OnlineView Journal | View Issue
School of Chemistry and CRANN, Trinity C
[email protected]; Tel: +353 1 8963543
Cite this: J. Mater. Chem. A, 2013, 1,8379
Received 23rd April 2013Accepted 2nd May 2013
DOI: 10.1039/c3ta11609c
www.rsc.org/MaterialsA
This journal is ª The Royal Society of
Graphene–ionic liquid electrolytes for dye sensitisedsolar cells
Lorcan J. Brennan, Sebastian T. Barwich, Amro Satti, Adeline Faureand Yurii K. Gun'ko*
In this work two dimensional graphene flakes were used to prepare new electrolytes for dye sensitized
solar cells (DSSCs). Small amounts (up to 3 wt%) of graphene nanoflakes were suspended into the ionic
liquid (IL) 1-propyl-3-methyl imidazolium iodide (PMII) to produce new electrolytes. The use of these
electrolytes in DSSCs resulted in more than twenty five times improvement of the solar cell efficiency.
The increase in efficiency can be attributed to two primary reasons. Graphene can act as an efficient
charge transfer agent in the viscous IL and also as a catalyst for the electrochemical reduction of I3� in
the electrolyte layer. In addition interactions between the graphene and the IL system lead to the
formation of self-organised assemblies or networks. These factors not only provide an efficient electron
transfer network through the electrolyte but also allow for the formation of quasi-solid electrolytes, at
higher graphene concentrations. These electrolytes may find applications in advanced DSSC
architectures, where a quasi-solid based system could eliminate problems associated with electrolyte
leakage and solvent related degradation of materials.
1 Introduction
With the decline in the earth's natural energy resources and theincreasing cost associated with the supply of fossil fuel basedenergy much research has focused on the generation of elec-tricity from alternative ‘green’ energy sources. Such sourcesinclude wind, hydro and solar energies. Of all these types, solarenergy provides by far the most abundant and practical energysource which may have the potential to reduce the need forfossil fuel associated energy. Silicon based solar technologiescurrently dominate the market. However, the purication andfabrication process which requires high temperature and highvacuum conditions as well as many lithographic steps is quiteexpensive. This is a barrier which impedes large scale, afford-able electricity generation from sunlight. In light of this there isgreat demand for new and affordable solar cells which cangenerate electricity from light.
The dye-sensitized solar cell (DSSC) offers a potentially cheapand sustainable solution to this problem. The DSSC wasdeveloped by Gratzel and O'Regan in 1991.1 Since that time theresearch into DSSCs has progressed rapidly, offering cheaperand easier solutions than conventional Si cells.2,3 Despite thepower conversion efficiency of the DSSC being lower than Si,DSSCs offer some key advantages to Si based technologies.4
DSSCs can operate under diffuse lighting conditions and canthus generate electricity indoors or on a cloudy day, these cells
ollege Dublin, Dublin 2, Ireland. E-mail:
Chemistry 2013
also show increased efficiency with increasing temperaturewhich is unlike semiconducting Si based devices.
The electrolyte is one of the key components of DSSCs. Thefunction of the electrolyte is to transfer charge from the counterelectrode (CE) to the dye which is anchored onto the mesoporousTiO2 charge collection layer. In order to work effectively theelectrolyte must full some key characteristics including thermalstability, high diffusion coefficient and suitable viscosity whichwill allow for ease of sealing without impeding the transfer ofcharge.5,6 Traditional DSSC technology has focused on the useof organic solvent based electrolytes which cause a number ofproblems duringmanufacturing. These problems include leakageof the electrolyte, degradation of the polymer seal and evaporationof the solvent which all limit cell lifetime and hence long-termapplications. These disadvantages are serious obstacles that facethe successful commercialization of DSSC technology, in partic-ular the large scale development of exible modules.
Ionic liquids (ILs) have received much attention in recentyears as a potential substitute to the organic solvent basedelectrolytes currently employed in DSSCs. Room temperatureILs are molten salts with characteristics highly suitable forDSSC electrolytes. Some of these characteristics include tune-able viscosity, non-volatility, ionic conductivity, excellentthermal stability, a broad electrochemical potential window andnegligible vapour pressure.7–9 Unfortunately the conversionefficiencies achieved with ILs at full air mass (AM 1.5) do notmatch those of solvent electrolytes. This is due to the fact thatthe diffusion coefficient of the redox pair in the viscous moltensalt is generally 1–2 orders of magnitude lower than that of ionic
J. Mater. Chem. A, 2013, 1, 8379–8384 | 8379
Journal of Materials Chemistry A Paper
Publ
ishe
d on
02
May
201
3. D
ownl
oade
d by
Tri
nity
Col
lege
Dub
lin o
n 13
/03/
2015
11:
49:2
0.
View Article Online
diffusion in an organic solvent.10 Several approaches have beeninvestigated towards designing an IL electrolyte which retainsthe characteristics of the IL but yet achieves conversion effi-ciency closer to that of the solvent based electrolytes. Suchapproaches have included the incorporation of various nano-components,11–13 the use of polymer IL composites,14,15 organic/inorganic gel electrolytes,13 hole conducting materials16 andcarbon nanomaterials.17
Graphene is the basic building block for graphitic materialsof all other dimensions. Graphene, a two-dimensional carbonsheet, consists of sp2 hybridised carbon atoms which arearranged into a honeycomb lattice. The current interest ingraphene is attributed to its excellent electronic and thermalconductivity, transparency, exibility and remarkable mechan-ical and chemical stability.18 All of these properties make gra-phene an excellent prospective material for the future withapplications in technologies such as transparent conductingexible materials,19–21 ultra-strong and stable graphene polymercomposites22–25 and photovoltaic cells.19,26–28
Previously we have demonstrated that very viscous quasi-solid state electrolytes can be prepared by the incorporation ofgraphene or carbon nanotubes into ionic liquids.17 Using thesenew electrolytes, signicant increases in light conversion effi-ciencies of DSSCs have been achieved. In the present work theIL 1-propyl-3-methyl imidazolium iodide (PMII) with addition ofsmall amounts of dispersed graphene sheets was employed as aDSSC electrolyte. Work by Fukushima et al. has shown thatcarbon nanomaterials can be readily exfoliated in imidazoliumbased ILs due to the p–p interaction that exists between theimidazolium ring and the extended delocalised ring structure ofthe graphene.9,29 Graphene was expected to serve as an extendedelectron transfer surface (EETS) in the electrolyte which canprovide an augmented electron transfer from the CE to thePMII,17 thus resulting in a reduced charge diffusion length.Graphene has been shown to be electro-catalytically activetowards reduction of I3
�,30 hence it was expected that graphenenanosheets suspended in the IL medium would act as an elec-tro-catalyst for the reduction of I3
� in the electrolyte.
2 Experimental2.1 Materials
Graphite powder was obtained from Alfa Aesar; 1-propyl-3-methyl imidazolium iodide (PMII) was supplied by Iolitec andused as received. TiO2 working electrodes and Pt counter elec-trodes were fabricated on FTO glass (12 U ,�1, Sigma Aldrich,NSG TEC12). TiO2 powder (P25) was received from Degussa.Sensitizing ruthenium dye (RuLL0(NCS)2 (L ¼ 2,20-bipyridyl-4,40-dicarboxylic acid; L0 ¼ 4,40-dinonyl-2,20-bipyridine) (Z907)) waspurchased from Dyesol limited. Chloroform (HPLC grade) waspurchased from Fisher scientic. tert-Butanol, acetonitrile, tet-raethylammonium tetrauoroborate and chloroplatinic acidwere purchased from Sigma-Aldrich. All materials were used asreceived unless otherwise stated.
TiO2 electrodes were prepared on FTO coated glass substrates.Glass substrates were cleaned in a detergent solution withultrasonication for 15 minutes followed by sonication in ethanol
8380 | J. Mater. Chem. A, 2013, 1, 8379–8384
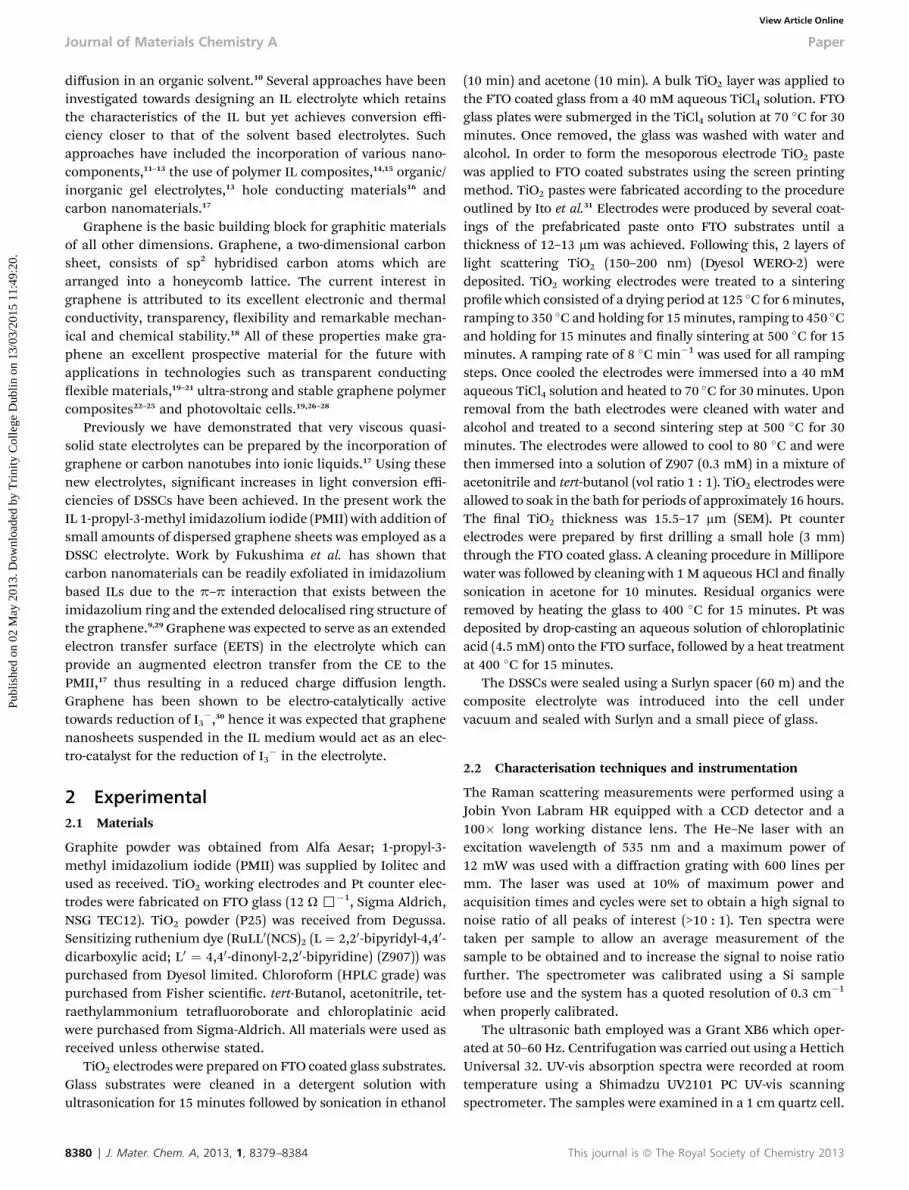
(10 min) and acetone (10 min). A bulk TiO2 layer was applied tothe FTO coated glass from a 40 mM aqueous TiCl4 solution. FTOglass plates were submerged in the TiCl4 solution at 70 �C for 30minutes. Once removed, the glass was washed with water andalcohol. In order to form the mesoporous electrode TiO2 pastewas applied to FTO coated substrates using the screen printingmethod. TiO2 pastes were fabricated according to the procedureoutlined by Ito et al.31 Electrodes were produced by several coat-ings of the prefabricated paste onto FTO substrates until athickness of 12–13 mm was achieved. Following this, 2 layers oflight scattering TiO2 (150–200 nm) (Dyesol WERO-2) weredeposited. TiO2 working electrodes were treated to a sinteringprole which consisted of a drying period at 125 �C for 6minutes,ramping to 350 �C and holding for 15minutes, ramping to 450 �Cand holding for 15 minutes and nally sintering at 500 �C for 15minutes. A ramping rate of 8 �C min�1 was used for all rampingsteps. Once cooled the electrodes were immersed into a 40 mMaqueous TiCl4 solution and heated to 70 �C for 30 minutes. Uponremoval from the bath electrodes were cleaned with water andalcohol and treated to a second sintering step at 500 �C for 30minutes. The electrodes were allowed to cool to 80 �C and werethen immersed into a solution of Z907 (0.3 mM) in a mixture ofacetonitrile and tert-butanol (vol ratio 1 : 1). TiO2 electrodes wereallowed to soak in the bath for periods of approximately 16 hours.The nal TiO2 thickness was 15.5–17 mm (SEM). Pt counterelectrodes were prepared by rst drilling a small hole (3 mm)through the FTO coated glass. A cleaning procedure in Milliporewater was followed by cleaning with 1 M aqueous HCl and nallysonication in acetone for 10 minutes. Residual organics wereremoved by heating the glass to 400 �C for 15 minutes. Pt wasdeposited by drop-casting an aqueous solution of chloroplatinicacid (4.5 mM) onto the FTO surface, followed by a heat treatmentat 400 �C for 15 minutes.
The DSSCs were sealed using a Surlyn spacer (60 m) and thecomposite electrolyte was introduced into the cell undervacuum and sealed with Surlyn and a small piece of glass.
2.2 Characterisation techniques and instrumentation
The Raman scattering measurements were performed using aJobin Yvon Labram HR equipped with a CCD detector and a100� long working distance lens. The He–Ne laser with anexcitation wavelength of 535 nm and a maximum power of12 mW was used with a diffraction grating with 600 lines permm. The laser was used at 10% of maximum power andacquisition times and cycles were set to obtain a high signal tonoise ratio of all peaks of interest (>10 : 1). Ten spectra weretaken per sample to allow an average measurement of thesample to be obtained and to increase the signal to noise ratiofurther. The spectrometer was calibrated using a Si samplebefore use and the system has a quoted resolution of 0.3 cm�1
when properly calibrated.The ultrasonic bath employed was a Grant XB6 which oper-
ated at 50–60 Hz. Centrifugation was carried out using a HettichUniversal 32. UV-vis absorption spectra were recorded at roomtemperature using a Shimadzu UV2101 PC UV-vis scanningspectrometer. The samples were examined in a 1 cm quartz cell.
This journal is ª The Royal Society of Chemistry 2013
Paper Journal of Materials Chemistry A
Publ
ishe
d on
02
May
201
3. D
ownl
oade
d by
Tri
nity
Col
lege
Dub
lin o
n 13
/03/
2015
11:
49:2
0.
View Article Online
TEM images were taken using a Joel 2100 electron microscope.The TEM operated at a beam voltage of 200 kV. The samples beinganalysed were diluted by a factor of ten and drop casted onto holeycarbon grids at ambient temperature and allowed to dry.
Cyclic voltammetry was performed on a computer controlledm-autolab type III potentiostat controlled by autolab 1.4 soware.
I–V measurements were performed using a digital sourcemeter (Keithley 2400) and a full spectrum solar simulator(Newport 96000), tted with a Xe arc discharge lamp operated at150 W which was equipped with a 1.5D air mass lter andcalibrated with a silicon-based reference cell before testing. Allcells were tested at 1000 W m�2, with an active area of0.17 cm�2, dened by a mask.
3 Results and discussion3.1 Graphene preparation and characterisation
Exfoliation of the graphite to prepare graphene followed theprocedure similar to that outlined by O'Neill et al.32 Briey thegraphite was dispersed in chloroform at a concentration of1 mg ml�1. The solution was then placed in an ultrasonic bathand ultrasonicated for a period of �100 hours to ensuremaximum exfoliation of the graphite. Aer this process thesolution was centrifuged at 500 RPM for 1 hour. Following thisthe supernatant was decanted off leaving the unexfoliatedgraphite in precipitate. The resulting dark coloured suspensionwas deposited onto holey carbon grids for TEM analysis (seebelow). The graphene solutions were vacuum ltered ontoDurapore (0.2 mm) membranes. The graphene dispersions werethen added to PMII at various concentrations ranging from0.125 wt% to 3 wt% and the residual chloroform was removedwith vacuum assisted heating in a Schlenk vessel. The resultingPMII graphene composites were utilized as electrolytes in DSSCs.
The formation of the resulting graphene was conrmed byboth TEM and Raman spectroscopy.
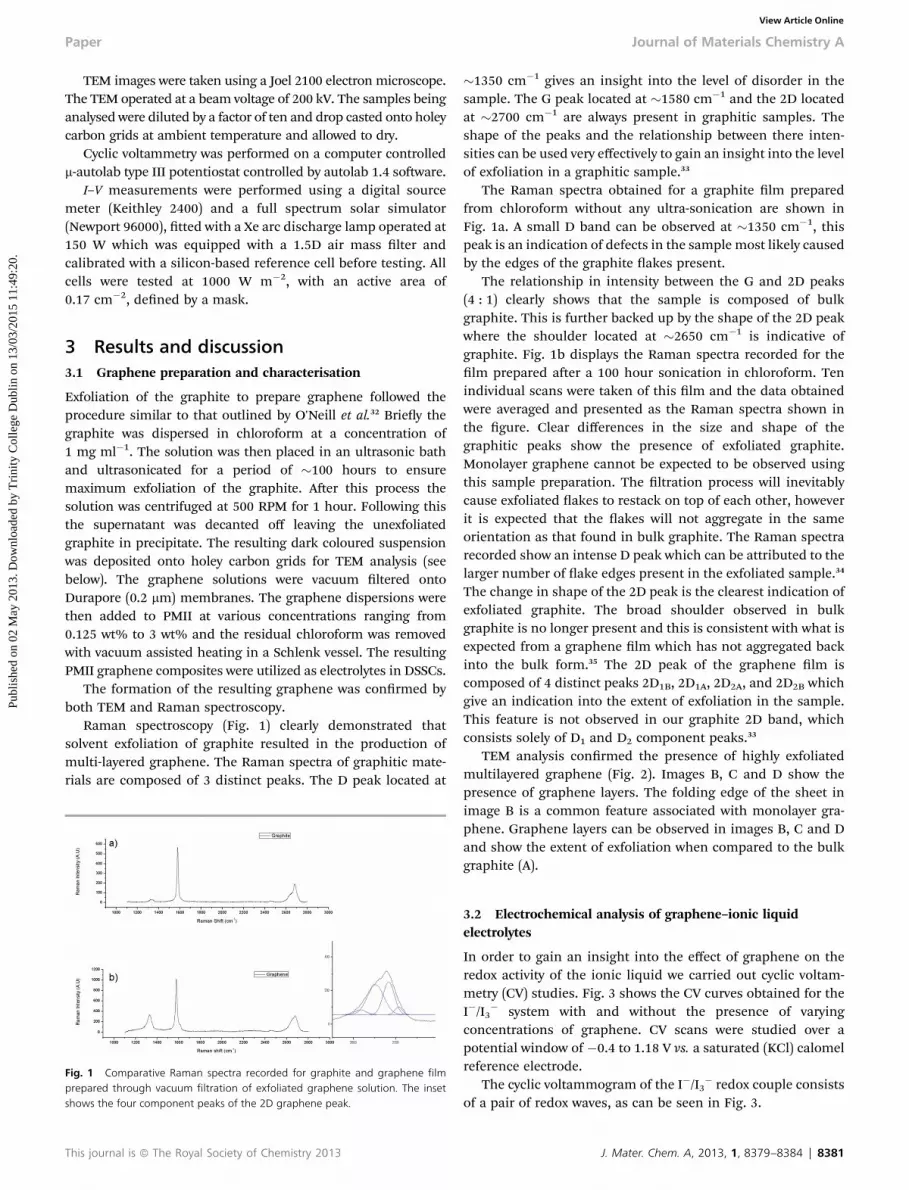
Raman spectroscopy (Fig. 1) clearly demonstrated thatsolvent exfoliation of graphite resulted in the production ofmulti-layered graphene. The Raman spectra of graphitic mate-rials are composed of 3 distinct peaks. The D peak located at
Fig. 1 Comparative Raman spectra recorded for graphite and graphene filmprepared through vacuum filtration of exfoliated graphene solution. The insetshows the four component peaks of the 2D graphene peak.
This journal is ª The Royal Society of Chemistry 2013
�1350 cm�1 gives an insight into the level of disorder in thesample. The G peak located at �1580 cm�1 and the 2D locatedat �2700 cm�1 are always present in graphitic samples. Theshape of the peaks and the relationship between there inten-sities can be used very effectively to gain an insight into the levelof exfoliation in a graphitic sample.33
The Raman spectra obtained for a graphite lm preparedfrom chloroform without any ultra-sonication are shown inFig. 1a. A small D band can be observed at �1350 cm�1, thispeak is an indication of defects in the sample most likely causedby the edges of the graphite akes present.
The relationship in intensity between the G and 2D peaks(4 : 1) clearly shows that the sample is composed of bulkgraphite. This is further backed up by the shape of the 2D peakwhere the shoulder located at �2650 cm�1 is indicative ofgraphite. Fig. 1b displays the Raman spectra recorded for thelm prepared aer a 100 hour sonication in chloroform. Tenindividual scans were taken of this lm and the data obtainedwere averaged and presented as the Raman spectra shown inthe gure. Clear differences in the size and shape of thegraphitic peaks show the presence of exfoliated graphite.Monolayer graphene cannot be expected to be observed usingthis sample preparation. The ltration process will inevitablycause exfoliated akes to restack on top of each other, howeverit is expected that the akes will not aggregate in the sameorientation as that found in bulk graphite. The Raman spectrarecorded show an intense D peak which can be attributed to thelarger number of ake edges present in the exfoliated sample.34
The change in shape of the 2D peak is the clearest indication ofexfoliated graphite. The broad shoulder observed in bulkgraphite is no longer present and this is consistent with what isexpected from a graphene lm which has not aggregated backinto the bulk form.35 The 2D peak of the graphene lm iscomposed of 4 distinct peaks 2D1B, 2D1A, 2D2A, and 2D2B whichgive an indication into the extent of exfoliation in the sample.This feature is not observed in our graphite 2D band, whichconsists solely of D1 and D2 component peaks.33
TEM analysis conrmed the presence of highly exfoliatedmultilayered graphene (Fig. 2). Images B, C and D show thepresence of graphene layers. The folding edge of the sheet inimage B is a common feature associated with monolayer gra-phene. Graphene layers can be observed in images B, C and Dand show the extent of exfoliation when compared to the bulkgraphite (A).
3.2 Electrochemical analysis of graphene–ionic liquidelectrolytes
In order to gain an insight into the effect of graphene on theredox activity of the ionic liquid we carried out cyclic voltam-metry (CV) studies. Fig. 3 shows the CV curves obtained for theI�/I3
� system with and without the presence of varyingconcentrations of graphene. CV scans were studied over apotential window of �0.4 to 1.18 V vs. a saturated (KCl) calomelreference electrode.
The cyclic voltammogram of the I�/I3� redox couple consists
of a pair of redox waves, as can be seen in Fig. 3.
J. Mater. Chem. A, 2013, 1, 8379–8384 | 8381

Fig. 2 Transmission electron microscope images of (A) graphite and (B–D) gra-phene exfoliated in chloroform at a concentration of 1 mg ml�1. Scale bar reads500 nm for all of the images.
Fig. 3 Cyclic voltammograms recorded for PMII (black line) and PMII withincreasing graphene concentration (red-blue-green). CV curves were obtained ata scan rate of 75 mV s�1. The electrochemical cell consisted of a gold workingelectrode (3 mm2) and a Pt wire counter electrode. A saturated calomel (KCl)reference electrode was employed for all scans. The stock electrolyte consisted ofa 0.1 M tetraethylammonium tetrafluoroborate (supporting electrolyte) and 1.0mM PMII in acetonitrile. Graphene was added incrementally from 1 mg to 3 mg.
Fig. 4 Photographic image of graphene–ionic liquid electrolytes showingincreasing graphene concentration.
Journal of Materials Chemistry A Paper
Publ
ishe
d on
02
May
201
3. D
ownl
oade
d by
Tri
nity
Col
lege
Dub
lin o
n 13
/03/
2015
11:
49:2
0.
View Article Online
The rst redox wave, which is located at lower potential,holds most interest for studying electron transfer mechanismsin DSSCs, as it corresponds to the oxidation (anodic peak) andreduction (cathodic peak) of I3
� via the following electrontransfer reaction:
I3� + 2e� 4 3I� (A)
The second redox peak (higher potential) is attributed to theelectron transfer mechanism below:
3I2 + 2e� 4 2I3� (B)
8382 | J. Mater. Chem. A, 2013, 1, 8379–8384
One proposed mechanism for our observed increase in solarcell efficiency is the development of an extended electrontransfer surface which allows for tri-iodide reduction to occuron graphene sheets which are located in the electrolyte. Webelieve that the presence of graphene reduces the diffusionlength of the species in the viscous ionic liquid and thus resultsin an increase in solar cell efficiency. The CV results show aclear increase in the current–response obtained in the presenceof graphene located in the electrolyte. Examination of the rstredox wave (A) demonstrates an obvious rise in both theoxidation current–response and the reduction current–responsewhen graphene is added to the system. This would suggest thatthe graphene is serving as a catalyst for this redox reaction inthe liquid phase and allows for an increase in current–response.The inset in Fig. 3 shows the extent of the current–response forredox reaction (A) in the presence of increasing grapheneconcentrations.
3.3 Electrolyte preparation and fabrication and testing ofDSSCs
Graphene dispersions in CHCl3 were added to PMII at variousconcentrations ranging from 0.125 wt% to 3 wt%. The chloro-form was allowed to evaporate from the IL over a period of 4–5hours under Schlenk conditions. The photograph of ionicliquids with various concentrations of graphene is shown inFig. 4. The graphene–ionic liquid composite electrolytes werethen utilized to fabricate DSSCs.
The prepared graphene–ionic liquid composite electrolyteshave been tested at a range of graphene concentrations. Thepresence of graphene in any concentration led to an increase inthe efficiency of the DSSC when compared to the results obtainedfor PMII alone. PMMI showed an efficiency of 0.10% whichagrees well with that found in the literature. The highest effi-ciency achieved for the composite electrolytes was 2.60% whichwas observed when an electrolyte was prepared at a concentra-tion of 1.0 wt%. At graphene concentrations greater than 3 wt%the electrolyte begins to show behaviour similar to that of a quasi-solid based system. It is interesting to note that as the viscosity ofthese electrolytes increases they can still outperform theunmodied electrolyte. It was found that at graphene concen-trations greater than 1.0 wt% excess amounts of graphene beginto impede the transfer of ions through the electrolyte and thus adrop in cell efficiency is noted (1.74% at 3 wt%). Analysis of the Jscobtained from these devices shows that upon addition of gra-phene an increase in the Jsc can be observed, when compared to
This journal is ª The Royal Society of Chemistry 2013

Fig. 5 I–V curve obtained for PMII and graphene–IL composite electrolyte.
Paper Journal of Materials Chemistry A
Publ
ishe
d on
02
May
201
3. D
ownl
oade
d by
Tri
nity
Col
lege
Dub
lin o
n 13
/03/
2015
11:
49:2
0.
View Article Online
PMII. The increase in Jsc can be attributed to the increasedconductivity of the electrolyte. The Jsc for the highest efficiencycell (1.0 wt% graphene added) was found to be 8.58 mA cm�2.The Jsc was observed to fall at graphene concentrations higherthan 1 wt% and this can be attributed to the development ofquasi-solid based systems at this concentration whichimpede the transport of ions through the electrolyte layer.Fig. 5 displays I–V curves showing a peak efficiency of 2.60% at1000 W m�2.
These results are rather different from our previous work onionic liquids with a very high graphene content17 and here wedemonstrate that an increased efficiency can be achieved withmuch lower graphene concentrations. We believe that this isdue to the electrolyte preparation and cell fabrication proce-dures. In the present work graphene is added to the IL in theliquid phase (dispersed in CHCl3) rather than as a solid addi-tive. In contrast to our previous work, where a very viscous gel-like electrolyte (with up to 40 wt% of graphene) was depositedon one of the electrodes in open air before the cell was sealed,17
in our current work we use a liquid graphene–IL based elec-trolyte having a maximum 0.125–3.0 wt% of graphene and weemployed a “closed cell” approach, where the cell was initiallysealed and then the electrolyte was introduced into the cellunder vacuum and then sealed with Surlyn. This approachenabled us to achieve much better efficiencies at low concen-tration of graphene (up to 2.6% at 1 wt% of graphene content)(Table 1).
Table 1 Photovoltaic parameters obtained for DSSCs using graphene–ionicliquid composite electrolytes (Voc – open-circuit voltage; Jsc – short-circuit currentdensity; FF – fill factor and h – efficiency)
Graphene conc. (wt%) Voc (V) Jsc (mA cm�2) FF h (%)
0 0.57 0.59 0.31 0.100.125 0.52 2.41 0.25 0.310.25 0.55 4.11 0.28 0.640.50 0.60 3.85 0.44 1.031.0 0.61 8.58 0.49 2.603.0 0.61 4.47 0.63 1.74
This journal is ª The Royal Society of Chemistry 2013
4 Conclusions
In conclusion, we have demonstrated that the addition of smallamounts (1.0 wt%) of graphene into ionic liquid based elec-trolytes results in a signicant improvement of DSSC efficiency.The presence of graphene in the liquid electrolyte allows for agreater interaction between the IL and the graphene sheets. Theincreased level of interaction can facilitate a facile p–p networkto develop between the graphene and the IL. This enabled us toperform the preparation of highly uniform and stable disper-sion of graphene in the IL, upon removal of chloroform. Theresulting electrolyte can be considered as a composite liquidrather than an IL modied with solidifying agents.
We believe that the addition of graphene nanosheets alsoallows for an augmented electron pathway through the viscousIL electrolyte, owing primarily to the remarkable electronicproperties of graphene. It is also expected that the grapheneaffords an EETS in the electrolyte, which facilitates the elec-trochemical reduction of I3
� in the electrolyte and thus lowersthe diffusion length of the redox couple through the electrolyte.These results show that the addition of small amounts of gra-phene offers a viable route towards the preparation of ionicliquid composite electrolytes, which are more advanced thanconventional solvent based systems.
Acknowledgements
We thank IRCSET, EU FP7 (SMARTOP) programme and Solar-print Ltd for nancial support.
References
1 B. Oregan and M. Gratzel, Nature, 1991, 353, 737–740.2 M. Gratzel, Inorg. Chem., 2005, 44, 6841–6851.3 M. Gratzel, Nature, 2001, 414, 338–344.4 M. K. Nazeeruddin, F. De Angelis, S. Fantacci, A. Selloni,G. Viscardi, P. Liska, S. Ito, B. Takeru and M. Gratzel,J. Am. Chem. Soc., 2005, 127, 16835–16847.
5 J. Wu, Z. Lan, J. Lin, M. Huang and P. Li, J. Power Sources,2007, 173, 585–591.
6 D. Wei, Int. J. Mol. Sci., 2010, 11, 1103–1113.7 R. D. Rogers and K. R. Seddon, Science, 2003, 302, 792–793.8 J. Earle Martyn and R. Seddon Kenneth, in Clean Solvents,American Chemical Society, 2002, pp. 10–25.
9 T. Fukushima and T. Aida, Chem.–Eur. J., 2007, 13, 5048–5058.
10 M. Gorlov and L. Kloo, Dalton Trans., 2008, 2655–2666.11 P. Wang, S. M. Zakeeruddin, P. Comte, I. Exnar and
M. Gratzel, J. Am. Chem. Soc., 2003, 125, 1166–1167.12 H. Usui, H. Matsui, N. Tanabe and S. Yanagida, J. Photochem.
Photobiol., A, 2004, 164, 97–101.13 E. Stathatos, P. Lianos, S. M. Zakeeruddin, P. Liska and
M. Gratzel, Chem. Mater., 2003, 15, 1825–1829.14 P. Wang, S. M. Zakeeruddin and M. Gratzel, J. Fluorine
Chem., 2004, 125, 1241–1245.15 P. Wang, S. M. Zakeeruddin, J. E. Moser, M. K. Nazeeruddin,
T. Sekiguchi and M. Gratzel, Nat. Mater., 2003, 2, 402–407.
J. Mater. Chem. A, 2013, 1, 8379–8384 | 8383

Journal of Materials Chemistry A Paper
Publ
ishe
d on
02
May
201
3. D
ownl
oade
d by
Tri
nity
Col
lege
Dub
lin o
n 13
/03/
2015
11:
49:2
0.
View Article Online
16 U. Bach, D. Lupo, P. Comte, J. E. Moser, F. Weissortel,J. Salbeck, H. Spreitzer and M. Gratzel, Nature, 1998, 395,583–585.
17 I. Ahmad, U. Khan and Y. K. Gun'ko, J. Mater. Chem., 2011,21, 16990–16996.
18 A. K. Geim and K. S. Novoselov, Nat. Mater., 2007, 6, 183–191.19 X. Wang, L. Zhi and K. Mullen, Nano Lett., 2007, 8, 323–327.20 S. Bae, H. Kim, Y. Lee, X. F. Xu, J. S. Park, Y. Zheng,
J. Balakrishnan, T. Lei, H. R. Kim, Y. I. Song, Y. J. Kim,K. S. Kim, B. Ozyilmaz, J. H. Ahn, B. H. Hong andS. Iijima, Nat. Nanotechnol., 2010, 5, 574–578.
21 G. Eda, G. Fanchini and M. Chhowalla, Nat. Nanotechnol.,2008, 3, 270–274.
22 S. Stankovich, D. A. Dikin, G. H. B. Dommett,K. M. Kohlhaas, E. J. Zimney, E. A. Stach, R. D. Piner,S. T. Nguyen and R. S. Ruoff, Nature, 2006, 442, 282–286.
23 T. Ramanathan, A. A. Abdala, S. Stankovich, D. A. Dikin,M. Herrera Alonso, R. D. Piner, D. H. Adamson,H. C. Schniepp, X. Chen, R. S. Ruoff, S. T. Nguyen,I. A. Aksay, R. K. Prud'Homme and L. C. Brinson, Nat.Nanotechnol., 2008, 3, 327–331.
24 T. Kuilla, S. Bhadra, D. Yao, N. H. Kim, S. Bose and J. H. Lee,Prog. Polym. Sci., 2010, 35, 1350–1375.
25 S. Villar-Rodil, J. I. Paredes, A. Martinez-Alonso andJ. M. D. Tascon, J. Mater. Chem., 2009, 19, 3591–3593.
8384 | J. Mater. Chem. A, 2013, 1, 8379–8384
26 L. J. Brennan, M. T. Byrne, M. Bari and Y. K. Gun'ko, Adv.Energy Mater., 2011, 1, 472–485.
27 W. Hong, Y. Xu, G. Lu, C. Li and G. Shi, Electrochem.Commun., 2008, 10, 1555–1558.
28 X. Wang, L. Zhi, N. Tsao, Z. Tomovic, J. Li and K. Mullen,Angew. Chem., 2008, 120, 3032–3034.
29 T. Fukushima, A. Kosaka, Y. Ishimura, T. Yamamoto,T. Takigawa, N. Ishii and T. Aida, Science, 2003, 300, 2072–2074.
30 P. Hasin, M. A. Alpuche-Aviles and Y. Wu, J. Phys. Chem. C,2010, 114, 15857–15861.
31 S. Ito, P. Chen, P. Comte, M. K. Nazeeruddin, P. Liska,P. Pechy and M. Gratzel, Progr. Photovolt.: Res. Appl., 2007,15, 603–612.
32 A. O'Neill, U. Khan, P. N. Nirmalraj, J. Boland andJ. N. Coleman, J. Phys. Chem. C, 2011, 115, 5422–5428.
33 A. C. Ferrari, J. C. Meyer, V. Scardaci, C. Casiraghi,M. Lazzeri, F. Mauri, S. Piscanec, D. Jiang, K. S. Novoselov,S. Roth and A. K. Geim, Phys. Rev. Lett., 2006, 97, 187401.
34 M. S. Dresselhaus, A. Jorio and R. Saito, Annu. Rev. Condens.Matter Phys., 2010, 1, 89–108.
35 Y. Hernandez, V. Nicolosi, M. Lotya, F. M. Blighe, Z. Sun,S. De, I. T. McGovern, B. Holland, M. Byrne, Y. K. Gun'Ko,J. J. Boland, P. Niraj, G. Duesberg, S. Krishnamurthy,R. Goodhue, J. Hutchison, V. Scardaci, A. C. Ferrari andJ. N. Coleman, Nat. Nanotechnol., 2008, 3, 563–568.
This journal is ª The Royal Society of Chemistry 2013


