Embed Size (px)
Citation preview
Biological Conservation 190 (2015) 14–22
Contents lists available at ScienceDirect
Biological Conservation
journal homepage: www.elsevier .com/locate /b iocon
Going the extra mile: Ground-based monitoring of olive ridley turtlesreveals Gabon hosts the largest rookery in the Atlantic
http://dx.doi.org/10.1016/j.biocon.2015.05.0080006-3207/� 2015 Published by Elsevier Ltd.
⇑ Corresponding author. Tel.: +44 (0) 1326 371861.E-mail address: [email protected] (B.J. Godley).
Kristian Metcalfe a,b, Pierre Didier Agamboué c,d, Eric Augowet e, Francois Boussamba f, Floriane Cardiec c,J. Michael Fay c, Angela Formia c,d, Judicael Régis Kema Kema g, Carmen Kouerey c,d,Brice Didier Koumba Mabert h, Sara M. Maxwell i, Gianna Minton g,Gil Avery Mounguengui Mounguengui j, Carine Moussounda h, Narcisse Moukoumou c,Jean Churley Manfoumbi j, Anicet Megne Nguema e, Jacob Nzegoue c,d, Richard J. Parnell c,Philippe du Plessis k, Guy-Philippe Sounguet e,f, Dominic Tilley a, Sebastian Verhage g, Wynand Viljoen c,e,Lee White e, Matthew J. Witt b, Brendan J. Godley a,⇑a Centre for Ecology and Conservation, College of Life and Environmental Sciences, University of Exeter, Penryn Campus, Cornwall TR10 9FE, UKb Environment and Sustainability Institute, University of Exeter, Penryn Campus, Cornwall TR10 9FE, UKc Wildlife Conservation Society (WCS), Gabon Program, B.P. 7847 Libreville, Gabond Partenariat pour les Tortues Marines du Gabon (PTMG), B.P. 7847 Libreville, Gabone Agence Nationale des Parcs Nationaux (ANPN), B.P. 546 Libreville, Gabonf Aventures Sans Frontières (ASF), B.P. 7248 Libreville, Gabong Worldwide Fund for Nature (WWF), B.P. 9144 Libreville, Gabonh Centre National des Données et de l’Information Océanographiques (CNDIO), BP 10961 Libreville, Gaboni Stanford University, Hopkins Marine Station, 120 Oceanview Boulevard, Pacific Grove, CA 93950, USAj Ibonga-ACPE, B.P. 148 Gamba, Gabonk Fondation Liambissi, B.P. 2924 Port Gentil, Gabon
a r t i c l e i n f o
Article history:Received 1 February 2015Received in revised form 13 May 2015Accepted 18 May 2015
Keywords:AtlanticPopulation assessmentLepidochelys olivaceaNest countsProtected areasSeasonal effort
a b s t r a c t
The management of widely dispersed marine vertebrates can be facilitated by better understanding theirdistribution, density, population trends and threats. Unfortunately, for some populations of sea turtlespatial and temporal data are often lacking, particularly along the Atlantic coast of Africa, a region whichis considered globally important. Here we combined spatially limited monitoring data from four nestingbeaches over seven seasons with an extensive ground-based coastal survey that covered 585 km ofGabon’s Atlantic coast, to provide the first population assessment for the olive ridley turtleLepidochelys olivacea. This species is currently classified as data deficient by the IUCN in the easternAtlantic and so is considered a regional conservation priority. Whilst the logistics required to undertakesuch a comprehensive ground-based census were complicated, the method proved extremely effective inproviding population estimates for a widely dispersed marine vertebrate and demonstrates the impor-tance of focusing beyond intensively monitored beaches. In particular, our findings reveal that the pres-ence of nesting activity spans almost the entirety of Gabon’s coast, the density of which subsequentlyreveals that Gabon hosts one of the most important olive ridley rookeries in the Atlantic (2370–9814clutches, approximating to 948–5452 breeding females per annum and a total estimate of 1422–8178breeding females), with a significant proportion, 81 ± 3.5% (mean ± 1 S.D.) of total nesting effort occurringwithin protected areas. These findings thus complement our existing knowledge base and furtheremphasise the regional and global importance of Gabon’s nesting sea turtle populations.
� 2015 Published by Elsevier Ltd.
1. Introduction
Many large marine species including sharks, sea turtles andcetaceans are considered to be of conservation concern throughouttheir range due to a long history of human exploitation (Jackson
K. Metcalfe et al. / Biological Conservation 190 (2015) 14–22 15
et al., 2001). Conservation efforts for such species can, however, becomplicated by life history characteristics such as extended lifespans and highly migratory life cycles that carry them across juris-dictional boundaries and international waters (Kappes et al., 2010;Luschi et al., 2003; Robinson et al., 2012; Shaffer et al., 2006).Effective management thus requires a greater understanding ofthe seasonality of life history characteristics and their distributionand spatial ecology (Maxwell et al., 2013; Rosenbaum et al., 2014;Wallace et al., 2010; Young et al., 2015).
Sea turtles have been subject to multiple anthropogenic pres-sures, such as direct and indirect take in fisheries and habitatdegradation that have resulted in a reduction of global populationsto a fraction of their former size (McClenachan et al., 2006).However, some populations are now recovering, raising hopes thatrelatively simple but sustained conservation measures such as pro-tection of females and eggs at nesting beaches and changes in fish-ing practices can be effective (Godgenger et al., 2009; Gratiot et al.,2006; Weber et al., 2014; Witt et al., 2011). Whilst in non-breedingyears adult sea turtles can disperse over large oceanic areas, a pro-portion of adults seasonally aggregate at a small number of majorrookeries (Luschi et al., 2003) where nesting can be enumerated asan index of population size using a range of methods (Gerrodetteand Taylor, 1999; Whiting et al., 2014). Annual breeding numbersfluctuate over time and individual monitoring sites may vary sig-nificantly among years due to environmental factors (Brodericket al., 2001). Long-term monitoring is therefore essential to estab-lish population trends (Jackson et al., 2008) and to provide detailedknowledge on the relative density of nesting and habitat use thatcan aid targeted conservation efforts (Mazaris et al., 2014), suchas the designation of marine protected areas (MPAs).
The most common method to enumerate nesting sea turtles isusing ground-derived counts of the number of nests laid in a par-ticular season (e.g. Stewart et al., 2011; Weber et al., 2014;Witherington et al., 2009), though aerial surveys are increasinglybeing employed to monitor sea turtle populations (e.g. McGowanet al., 2008; Troëng et al., 2004; Witt et al., 2009). Both approacheshave their advantages and disadvantages (Schroeder and Murphy,1999). The former approach in particular is often labour intensive,as the nesting season for most species of sea turtle can last formany months (Miller, 1997). In addition, efforts can often be hin-dered by the distant and dispersed nature of nesting beaches(e.g. located in remote and inaccessible areas), leading to anapproach where only a limited number of nesting beaches aremonitored in detail and/or consistently each season. In contrast,aerial surveys allow for data collection over considerable spatialscales (i.e. 100’s of kilometres) and so can facilitate more meaning-ful estimates of population size and trends, as well as increasingour understanding and knowledge of nesting habitat preference,threats, and the efficacy of protected areas (Witt et al., 2009).
Indeed, aerial surveys have proved highly effective for monitor-ing the status of leatherback turtles (Dermochelys coriacea) inGabon, identifying its coastline as the world’s largest rookery forthe species, with an estimated 5865–20,499 nesting females perannum (Witt et al., 2009). However, aerial surveys are unlikely toproduce such reliable estimates for Gabon’s second most numer-ous nesting sea turtle, the olive ridley (Lepidochelys olivacea), asits smaller body size and mass mean it leaves smaller, faintertracks that are more difficult to spot from the air. In addition, sim-ilar habitat preferences, overlapping nesting seasons, and the den-sity of leatherback turtles in some regions often result in oliveridley tracks being covered, hampering our ability to generaterobust nesting estimates from aerial surveys. As such, the currentstatus of this rookery is less certain.
Consequently, given the limitations of aerial survey data andevidence that ground-based surveys are better able to detect evi-dence of olive ridley nesting activity, we conducted an extensive
coastal survey along 585 km of Gabon’s coast. This represents thefirst ground-based national survey to cover extensive areas of thecoast beyond intensively monitored beaches. The specific aims ofthe survey were to: (1) establish whether such a coastal surveywould be feasible and describe the overall spatial patterns of nest-ing; (2) estimate the number of nests laid each season by combin-ing monitoring data collected from four sites over seven seasonswith the coastal survey to identify temporal trends, and so deter-mine the number of nesting females to derive a population esti-mate for the Gabon rookery; and (3) provide a preliminaryoverview of the spatial adequacy of Gabon’s existing protected areanetwork for this species.
2. Material and methods
2.1. Ground-based coastal surveys
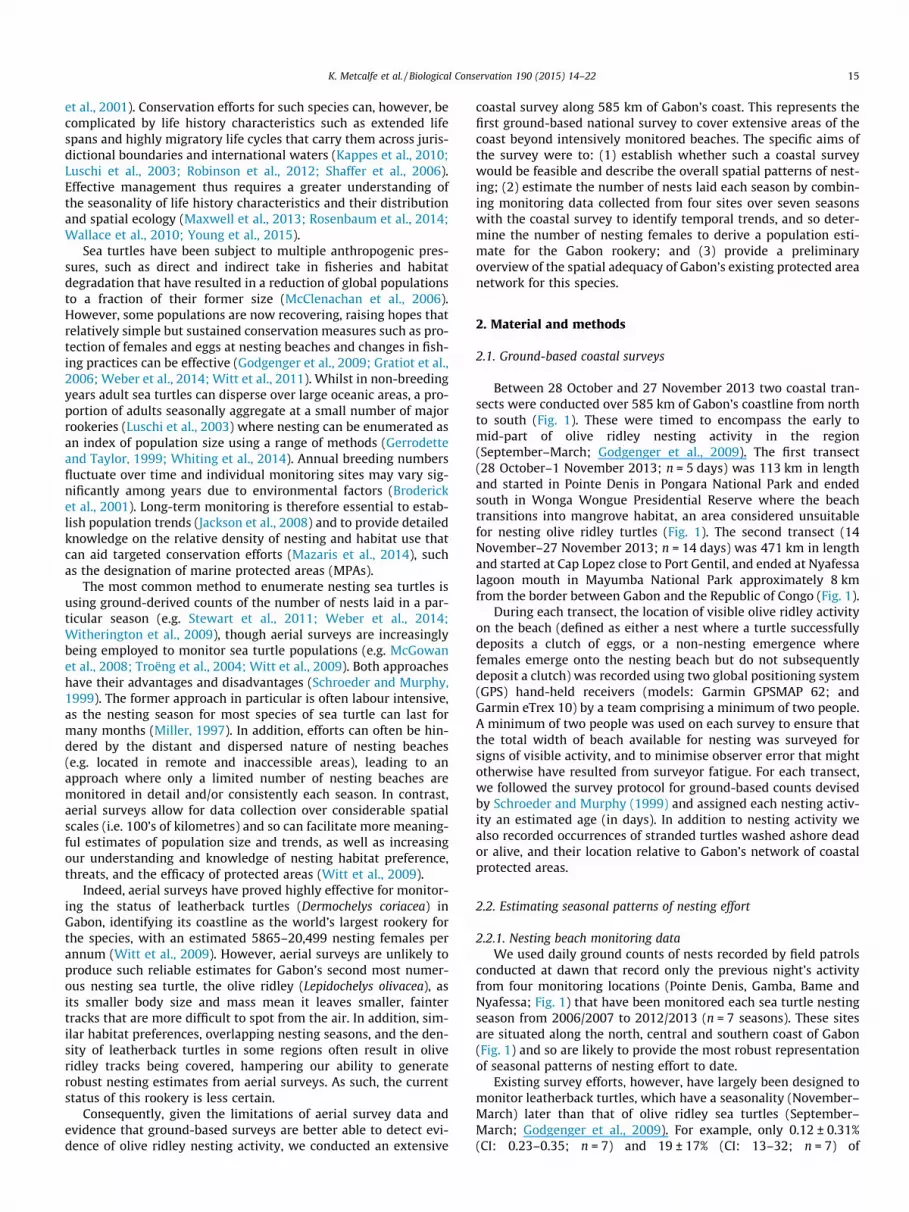
Between 28 October and 27 November 2013 two coastal tran-sects were conducted over 585 km of Gabon’s coastline from northto south (Fig. 1). These were timed to encompass the early tomid-part of olive ridley nesting activity in the region(September–March; Godgenger et al., 2009). The first transect(28 October–1 November 2013; n = 5 days) was 113 km in lengthand started in Pointe Denis in Pongara National Park and endedsouth in Wonga Wongue Presidential Reserve where the beachtransitions into mangrove habitat, an area considered unsuitablefor nesting olive ridley turtles (Fig. 1). The second transect (14November–27 November 2013; n = 14 days) was 471 km in lengthand started at Cap Lopez close to Port Gentil, and ended at Nyafessalagoon mouth in Mayumba National Park approximately 8 kmfrom the border between Gabon and the Republic of Congo (Fig. 1).
During each transect, the location of visible olive ridley activityon the beach (defined as either a nest where a turtle successfullydeposits a clutch of eggs, or a non-nesting emergence wherefemales emerge onto the nesting beach but do not subsequentlydeposit a clutch) was recorded using two global positioning system(GPS) hand-held receivers (models: Garmin GPSMAP 62; andGarmin eTrex 10) by a team comprising a minimum of two people.A minimum of two people was used on each survey to ensure thatthe total width of beach available for nesting was surveyed forsigns of visible activity, and to minimise observer error that mightotherwise have resulted from surveyor fatigue. For each transect,we followed the survey protocol for ground-based counts devisedby Schroeder and Murphy (1999) and assigned each nesting activ-ity an estimated age (in days). In addition to nesting activity wealso recorded occurrences of stranded turtles washed ashore deador alive, and their location relative to Gabon’s network of coastalprotected areas.
2.2. Estimating seasonal patterns of nesting effort
2.2.1. Nesting beach monitoring dataWe used daily ground counts of nests recorded by field patrols
conducted at dawn that record only the previous night’s activityfrom four monitoring locations (Pointe Denis, Gamba, Bame andNyafessa; Fig. 1) that have been monitored each sea turtle nestingseason from 2006/2007 to 2012/2013 (n = 7 seasons). These sitesare situated along the north, central and southern coast of Gabon(Fig. 1) and so are likely to provide the most robust representationof seasonal patterns of nesting effort to date.
Existing survey efforts, however, have largely been designed tomonitor leatherback turtles, which have a seasonality (November–March) later than that of olive ridley sea turtles (September–March; Godgenger et al., 2009). For example, only 0.12 ± 0.31%(CI: 0.23–0.35; n = 7) and 19 ± 17% (CI: 13–32; n = 7) of
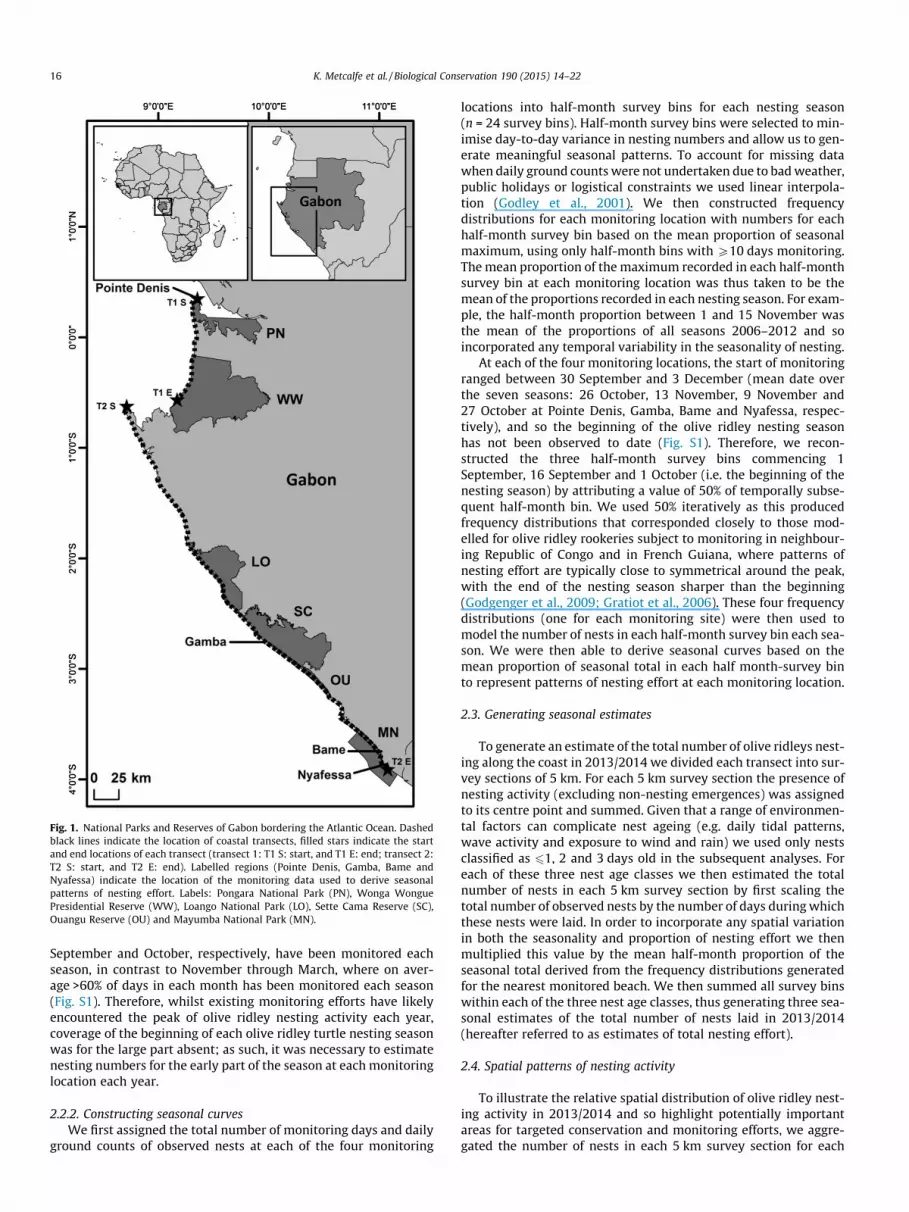
Fig. 1. National Parks and Reserves of Gabon bordering the Atlantic Ocean. Dashedblack lines indicate the location of coastal transects, filled stars indicate the startand end locations of each transect (transect 1: T1 S: start, and T1 E: end; transect 2:T2 S: start, and T2 E: end). Labelled regions (Pointe Denis, Gamba, Bame andNyafessa) indicate the location of the monitoring data used to derive seasonalpatterns of nesting effort. Labels: Pongara National Park (PN), Wonga WonguePresidential Reserve (WW), Loango National Park (LO), Sette Cama Reserve (SC),Ouangu Reserve (OU) and Mayumba National Park (MN).
16 K. Metcalfe et al. / Biological Conservation 190 (2015) 14–22
September and October, respectively, have been monitored eachseason, in contrast to November through March, where on aver-age >60% of days in each month has been monitored each season(Fig. S1). Therefore, whilst existing monitoring efforts have likelyencountered the peak of olive ridley nesting activity each year,coverage of the beginning of each olive ridley turtle nesting seasonwas for the large part absent; as such, it was necessary to estimatenesting numbers for the early part of the season at each monitoringlocation each year.
2.2.2. Constructing seasonal curvesWe first assigned the total number of monitoring days and daily
ground counts of observed nests at each of the four monitoring
locations into half-month survey bins for each nesting season(n = 24 survey bins). Half-month survey bins were selected to min-imise day-to-day variance in nesting numbers and allow us to gen-erate meaningful seasonal patterns. To account for missing datawhen daily ground counts were not undertaken due to bad weather,public holidays or logistical constraints we used linear interpola-tion (Godley et al., 2001). We then constructed frequencydistributions for each monitoring location with numbers for eachhalf-month survey bin based on the mean proportion of seasonalmaximum, using only half-month bins with P10 days monitoring.The mean proportion of the maximum recorded in each half-monthsurvey bin at each monitoring location was thus taken to be themean of the proportions recorded in each nesting season. For exam-ple, the half-month proportion between 1 and 15 November wasthe mean of the proportions of all seasons 2006–2012 and soincorporated any temporal variability in the seasonality of nesting.
At each of the four monitoring locations, the start of monitoringranged between 30 September and 3 December (mean date overthe seven seasons: 26 October, 13 November, 9 November and27 October at Pointe Denis, Gamba, Bame and Nyafessa, respec-tively), and so the beginning of the olive ridley nesting seasonhas not been observed to date (Fig. S1). Therefore, we recon-structed the three half-month survey bins commencing 1September, 16 September and 1 October (i.e. the beginning of thenesting season) by attributing a value of 50% of temporally subse-quent half-month bin. We used 50% iteratively as this producedfrequency distributions that corresponded closely to those mod-elled for olive ridley rookeries subject to monitoring in neighbour-ing Republic of Congo and in French Guiana, where patterns ofnesting effort are typically close to symmetrical around the peak,with the end of the nesting season sharper than the beginning(Godgenger et al., 2009; Gratiot et al., 2006). These four frequencydistributions (one for each monitoring site) were then used tomodel the number of nests in each half-month survey bin each sea-son. We were then able to derive seasonal curves based on themean proportion of seasonal total in each half month-survey binto represent patterns of nesting effort at each monitoring location.
2.3. Generating seasonal estimates
To generate an estimate of the total number of olive ridleys nest-ing along the coast in 2013/2014 we divided each transect into sur-vey sections of 5 km. For each 5 km survey section the presence ofnesting activity (excluding non-nesting emergences) was assignedto its centre point and summed. Given that a range of environmen-tal factors can complicate nest ageing (e.g. daily tidal patterns,wave activity and exposure to wind and rain) we used only nestsclassified as 61, 2 and 3 days old in the subsequent analyses. Foreach of these three nest age classes we then estimated the totalnumber of nests in each 5 km survey section by first scaling thetotal number of observed nests by the number of days during whichthese nests were laid. In order to incorporate any spatial variationin both the seasonality and proportion of nesting effort we thenmultiplied this value by the mean half-month proportion of theseasonal total derived from the frequency distributions generatedfor the nearest monitored beach. We then summed all survey binswithin each of the three nest age classes, thus generating three sea-sonal estimates of the total number of nests laid in 2013/2014(hereafter referred to as estimates of total nesting effort).
2.4. Spatial patterns of nesting activity
To illustrate the relative spatial distribution of olive ridley nest-ing activity in 2013/2014 and so highlight potentially importantareas for targeted conservation and monitoring efforts, we aggre-gated the number of nests in each 5 km survey section for each
Table 1Total number of observed, interpolated and modelled nests for each of the fourmonitoring locations each season.
Season Pointe Denis Gamba Bame Nyafessa Total
2006/2007Observed 22 56 28 71 177Interpolated 23 62 41 112 238Modelled 44 115 80 183 421
2007/2008Observed 68 57 36 165 326Interpolated 85 129 48 214 477Modelled 93 214 85 232 624
2008/2009Observed 41 11 12 57 121Interpolated 50 12 14 92 168Modelled 58 22 42 93 215
2009/2010Observed 51 32 42 160 285Interpolated 54 42 48 180 324Modelled 64 53 66 208 391
2010/2011Observed 30 55 89 218 392Interpolated 33 59 99 254 445Modelled 38 61 112 278 489
2011/2012Observed 120 32 60 320 532Interpolated 133 39 62 335 569Modelled 141 52 69 358 620
2012/2013Observed 43 28 88 372 531Interpolated 53 30 101 435 619Modelled 101 60 126 526 813
Notes: Observed nests are based on the number of nests recorded from daily groundcounts, interpolated nests (rounded to nearest whole nest) are based on linearinterpolation to account for days when daily ground counts were not undertaken,and modelled nests (rounded to nearest whole nest) represent the total number ofestimated nesting activities corrected to account for the beginning of each nestingseason when daily ground counts were not undertaken.
K. Metcalfe et al. / Biological Conservation 190 (2015) 14–22 17
of the three estimates of total nesting effort to a 0.1 degree latitu-dinal resolution, equivalent to approximately 11 km at the equator(which divides Gabon). We then used waveform repeatability anal-ysis (Lee, 2006) to determine the spatial consistency of olive ridleyactivity along the Gabon coast across each of the three estimates(Witt et al., 2009). Each waveform repeatability analysis calculatesthe correlation of multiple coefficients (CMC). CMC may be inter-preted in the same manner as Pearson and Spearman correlationcoefficients (Lee, 2006) where 1.0 represents a perfect significantpositive correlation, �1.0 represents a perfect negative correlation,and values tending towards 0 suggest no linear relationship (Lee,2006). For each of the three estimates of total nesting effort we alsocalculated the proportion of nests occurring within National Parksand Reserves (i.e. protected areas) by identifying the 5 km surveybins that overlap with these areas. We used only survey bins occur-ring completely within protected areas and so provide a conserva-tive estimate of nesting within each of the protected areas (Fig. 1),thus complementing our knowledge base on the efficacy of thisnetwork for sea turtles in the region.
2.5. Annual trends in nesting effort
Given that the coastal transect provides an overview of the spa-tial patterns of nesting in 2013/2014, we scaled up olive ridley tur-tle nesting to produce a Gabon-wide estimate of nesting for eachseason between 2006/2007 and 2012/2013. To do this we calcu-lated the proportion of nesting activity each monitoring locationreceived in 2013/2014 for each of the three estimates of total nest-ing effort, using only survey bins occurring completely within thefour monitored areas. From these values we then derived mini-mum and maximum estimates of total nesting effort for the entirecoastline each season by dividing the total number of nests at mon-itored sites each season by the sum total of the proportion of nest-ing activity at monitored locations generated for each of the threeestimates of total nesting effort.
3. Results
3.1. Ground-based coastal surveys
Of the 786 activities recorded during the coastal transects, 30(4%) were assigned as non-nesting emergences, and 756 (96%)were assigned as emergences that resulted in the deposition of aclutch. Additionally, a total of 23 strandings (n = 21 dead, n = 2alive) were observed along the entire coastal transect, the majorityof which were observed between �0.5�S and �3.5�S (Fig. S2).
3.2. Seasonal patterns of nesting effort
Reconstruction of nesting effort each season (Table 1) indicatesthat September and October account for approximately 5 ± 1.6%(CI: 4.3–5.4; n = 28) and 21 ± 7.8% (CI: 18.2–23.9; n = 28) of totalnesting effort respectively (mean proportion over seven seasons:7%, 5%, 5%, and 3% in September, and 29%, 21%, 19%, and 15% inOctober for Pointe Denis, Gamba, Bame and Nyafessa respectively).Thus, based on these reconstructed nesting data, nesting occursapproximately between 1 September and 16 March across all fourmonitoring locations (Fig. 2). There was, however, a slight shiftwith latitude in both the peak date, and proportion of nesting effortacross all four monitoring locations; from the week commencing16 October for Pointe Denis in the north (mean proportion:17 ± 3.9% CI: 14.6–20.5; n = 7), 1 November for Gamba locatedalong the central coast (mean proportion: 19 ± 10.7% CI: 11–26.9;n = 7), to the 16 November for Bame (mean proportion: 21 ± 5.7%CI: 16.6–25.1; n = 7) and Nyafessa (mean proportion: 22 ± 6.0%
CI:17.3–26.3; n = 7) located in the south (Figs. 1 and 2). By extract-ing the mean date of peak nesting from each half month binassigned as the seasonal peak for each monitoring location eachseason we confirmed that there was a correlation between peakdate of nesting and latitude (Fig. 3).
3.3. Seasonal estimates
Extrapolation of ground counts derived from the coastal tran-sect resulted in estimates for the total number of nests laid inGabon in 2013/2014 that ranged between 8662 and 14,033 nests.Of the three estimates of total nesting effort, including only 5 kmsurvey bins with nests classified as 61 day old produced higherestimates (14,033 nests; n = 52 survey bins) compared to estimatesbased on survey bins including nests classified as 62 days (9814nests; n = 57 survey bins) and 63 days old (8662 nests; n = 68 sur-vey bins). Comparisons of the mean number of estimated nests ateach monitoring location each season derived using this extrapola-tion method on raw data from daily ground counts collected inOctober–November (coastal survey transect period) revealed thatthis approach was generally robust, with a positive linear relation-ship between the actual and estimated number of nests across thefour monitoring locations (R2 0.68–0.98; Fig. S3).
3.4. Spatial patterns of nesting activity
The coastal transects revealed that olive ridley nesting activityspanned almost the entire coast with only a few survey bins wherenests were not observed during the survey period (Fig. 4a).
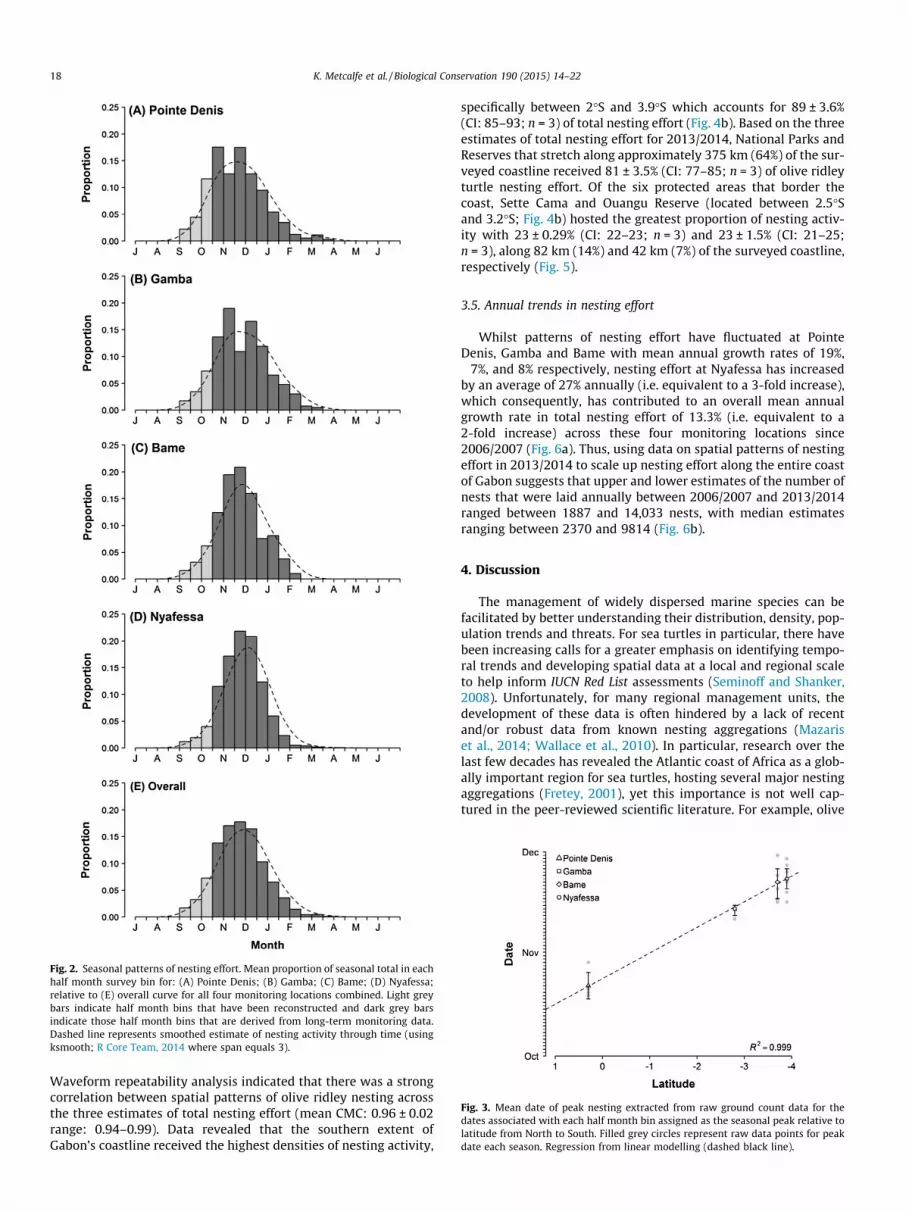
Fig. 2. Seasonal patterns of nesting effort. Mean proportion of seasonal total in eachhalf month survey bin for: (A) Pointe Denis; (B) Gamba; (C) Bame; (D) Nyafessa;relative to (E) overall curve for all four monitoring locations combined. Light greybars indicate half month bins that have been reconstructed and dark grey barsindicate those half month bins that are derived from long-term monitoring data.Dashed line represents smoothed estimate of nesting activity through time (usingksmooth; R Core Team, 2014 where span equals 3).
Fig. 3. Mean date of peak nesting extracted from raw ground count data for thedates associated with each half month bin assigned as the seasonal peak relative tolatitude from North to South. Filled grey circles represent raw data points for peakdate each season. Regression from linear modelling (dashed black line).
18 K. Metcalfe et al. / Biological Conservation 190 (2015) 14–22
Waveform repeatability analysis indicated that there was a strongcorrelation between spatial patterns of olive ridley nesting acrossthe three estimates of total nesting effort (mean CMC: 0.96 ± 0.02range: 0.94–0.99). Data revealed that the southern extent ofGabon’s coastline received the highest densities of nesting activity,
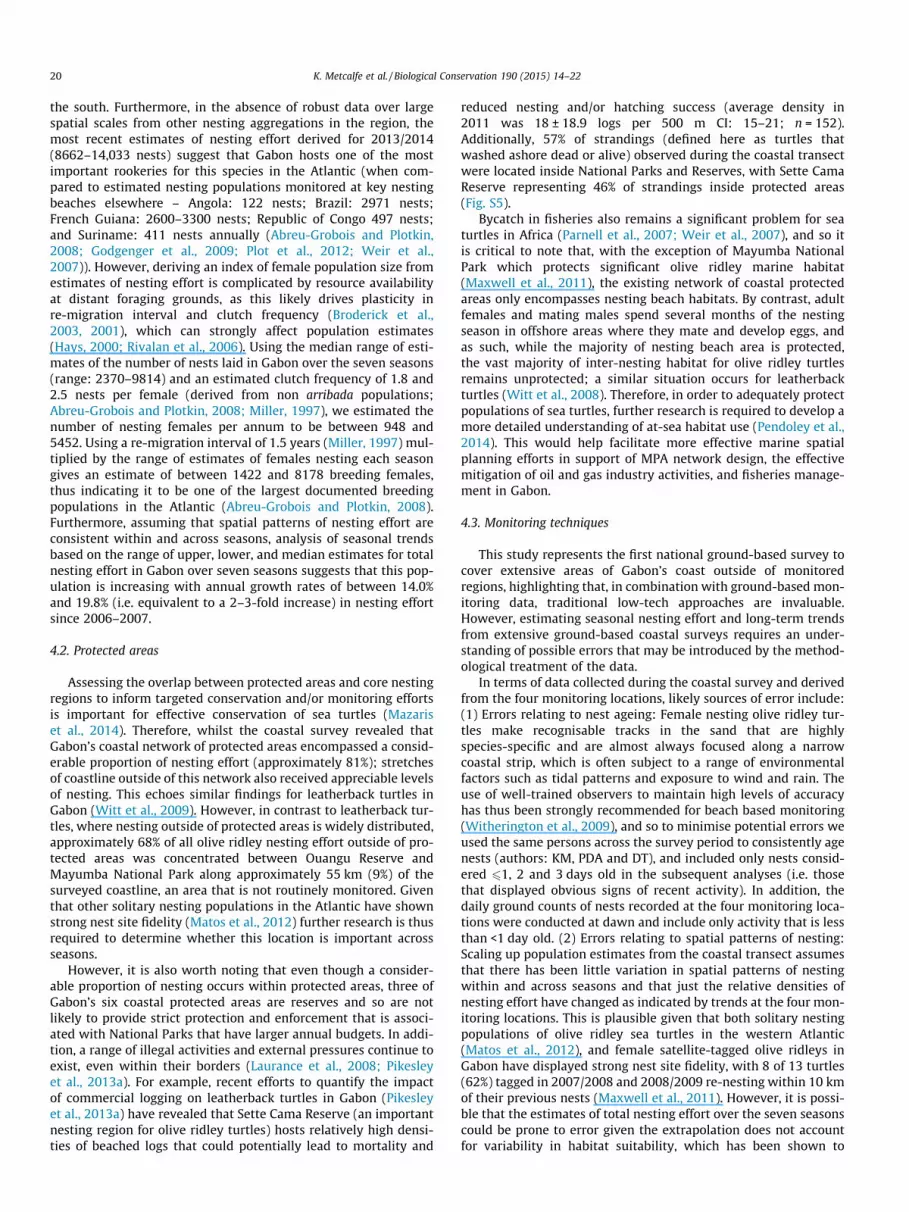
specifically between 2�S and 3.9�S which accounts for 89 ± 3.6%(CI: 85–93; n = 3) of total nesting effort (Fig. 4b). Based on the threeestimates of total nesting effort for 2013/2014, National Parks andReserves that stretch along approximately 375 km (64%) of the sur-veyed coastline received 81 ± 3.5% (CI: 77–85; n = 3) of olive ridleyturtle nesting effort. Of the six protected areas that border thecoast, Sette Cama and Ouangu Reserve (located between 2.5�Sand 3.2�S; Fig. 4b) hosted the greatest proportion of nesting activ-ity with 23 ± 0.29% (CI: 22–23; n = 3) and 23 ± 1.5% (CI: 21–25;n = 3), along 82 km (14%) and 42 km (7%) of the surveyed coastline,respectively (Fig. 5).
3.5. Annual trends in nesting effort
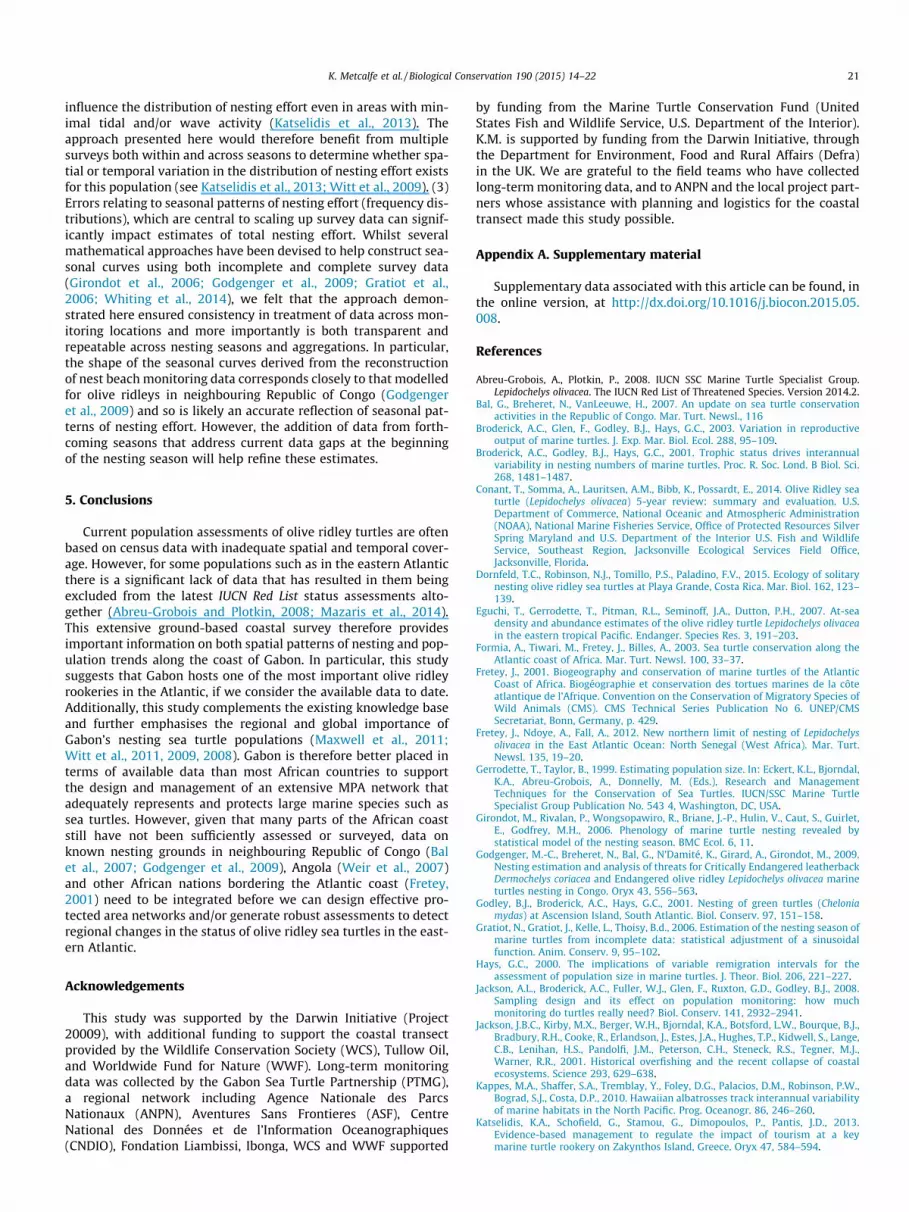
Whilst patterns of nesting effort have fluctuated at PointeDenis, Gamba and Bame with mean annual growth rates of 19%,�7%, and 8% respectively, nesting effort at Nyafessa has increasedby an average of 27% annually (i.e. equivalent to a 3-fold increase),which consequently, has contributed to an overall mean annualgrowth rate in total nesting effort of 13.3% (i.e. equivalent to a2-fold increase) across these four monitoring locations since2006/2007 (Fig. 6a). Thus, using data on spatial patterns of nestingeffort in 2013/2014 to scale up nesting effort along the entire coastof Gabon suggests that upper and lower estimates of the number ofnests that were laid annually between 2006/2007 and 2013/2014ranged between 1887 and 14,033 nests, with median estimatesranging between 2370 and 9814 (Fig. 6b).
4. Discussion
The management of widely dispersed marine species can befacilitated by better understanding their distribution, density, pop-ulation trends and threats. For sea turtles in particular, there havebeen increasing calls for a greater emphasis on identifying tempo-ral trends and developing spatial data at a local and regional scaleto help inform IUCN Red List assessments (Seminoff and Shanker,2008). Unfortunately, for many regional management units, thedevelopment of these data is often hindered by a lack of recentand/or robust data from known nesting aggregations (Mazariset al., 2014; Wallace et al., 2010). In particular, research over thelast few decades has revealed the Atlantic coast of Africa as a glob-ally important region for sea turtles, hosting several major nestingaggregations (Fretey, 2001), yet this importance is not well cap-tured in the peer-reviewed scientific literature. For example, olive
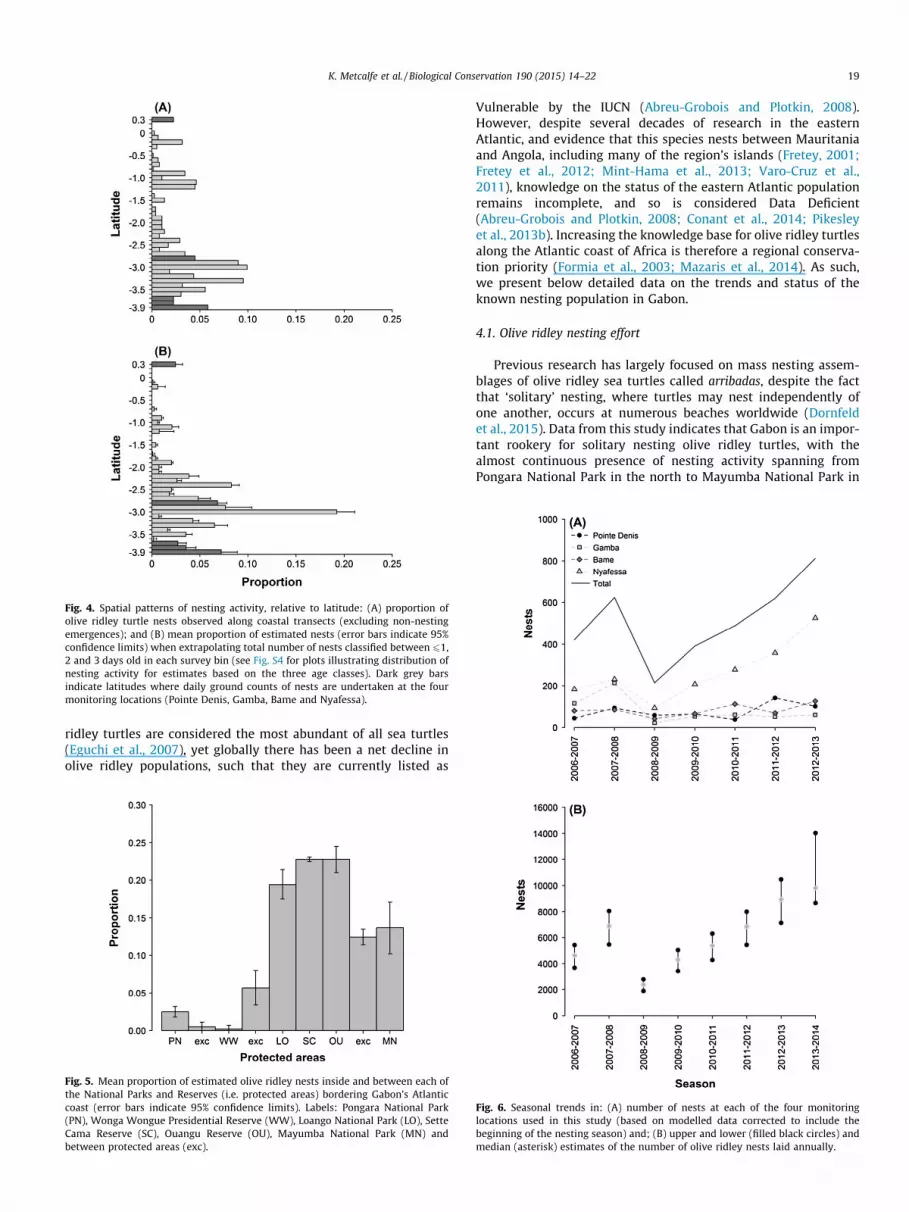
Fig. 4. Spatial patterns of nesting activity, relative to latitude: (A) proportion ofolive ridley turtle nests observed along coastal transects (excluding non-nestingemergences); and (B) mean proportion of estimated nests (error bars indicate 95%confidence limits) when extrapolating total number of nests classified between 61,2 and 3 days old in each survey bin (see Fig. S4 for plots illustrating distribution ofnesting activity for estimates based on the three age classes). Dark grey barsindicate latitudes where daily ground counts of nests are undertaken at the fourmonitoring locations (Pointe Denis, Gamba, Bame and Nyafessa).
K. Metcalfe et al. / Biological Conservation 190 (2015) 14–22 19
ridley turtles are considered the most abundant of all sea turtles(Eguchi et al., 2007), yet globally there has been a net decline inolive ridley populations, such that they are currently listed as
Fig. 5. Mean proportion of estimated olive ridley nests inside and between each ofthe National Parks and Reserves (i.e. protected areas) bordering Gabon’s Atlanticcoast (error bars indicate 95% confidence limits). Labels: Pongara National Park(PN), Wonga Wongue Presidential Reserve (WW), Loango National Park (LO), SetteCama Reserve (SC), Ouangu Reserve (OU), Mayumba National Park (MN) andbetween protected areas (exc).
Vulnerable by the IUCN (Abreu-Grobois and Plotkin, 2008).However, despite several decades of research in the easternAtlantic, and evidence that this species nests between Mauritaniaand Angola, including many of the region’s islands (Fretey, 2001;Fretey et al., 2012; Mint-Hama et al., 2013; Varo-Cruz et al.,2011), knowledge on the status of the eastern Atlantic populationremains incomplete, and so is considered Data Deficient(Abreu-Grobois and Plotkin, 2008; Conant et al., 2014; Pikesleyet al., 2013b). Increasing the knowledge base for olive ridley turtlesalong the Atlantic coast of Africa is therefore a regional conserva-tion priority (Formia et al., 2003; Mazaris et al., 2014). As such,we present below detailed data on the trends and status of theknown nesting population in Gabon.
4.1. Olive ridley nesting effort
Previous research has largely focused on mass nesting assem-blages of olive ridley sea turtles called arribadas, despite the factthat ‘solitary’ nesting, where turtles may nest independently ofone another, occurs at numerous beaches worldwide (Dornfeldet al., 2015). Data from this study indicates that Gabon is an impor-tant rookery for solitary nesting olive ridley turtles, with thealmost continuous presence of nesting activity spanning fromPongara National Park in the north to Mayumba National Park in
Fig. 6. Seasonal trends in: (A) number of nests at each of the four monitoringlocations used in this study (based on modelled data corrected to include thebeginning of the nesting season) and; (B) upper and lower (filled black circles) andmedian (asterisk) estimates of the number of olive ridley nests laid annually.
20 K. Metcalfe et al. / Biological Conservation 190 (2015) 14–22
the south. Furthermore, in the absence of robust data over largespatial scales from other nesting aggregations in the region, themost recent estimates of nesting effort derived for 2013/2014(8662–14,033 nests) suggest that Gabon hosts one of the mostimportant rookeries for this species in the Atlantic (when com-pared to estimated nesting populations monitored at key nestingbeaches elsewhere – Angola: 122 nests; Brazil: 2971 nests;French Guiana: 2600–3300 nests; Republic of Congo 497 nests;and Suriname: 411 nests annually (Abreu-Grobois and Plotkin,2008; Godgenger et al., 2009; Plot et al., 2012; Weir et al.,2007)). However, deriving an index of female population size fromestimates of nesting effort is complicated by resource availabilityat distant foraging grounds, as this likely drives plasticity inre-migration interval and clutch frequency (Broderick et al.,2003, 2001), which can strongly affect population estimates(Hays, 2000; Rivalan et al., 2006). Using the median range of esti-mates of the number of nests laid in Gabon over the seven seasons(range: 2370–9814) and an estimated clutch frequency of 1.8 and2.5 nests per female (derived from non arribada populations;Abreu-Grobois and Plotkin, 2008; Miller, 1997), we estimated thenumber of nesting females per annum to be between 948 and5452. Using a re-migration interval of 1.5 years (Miller, 1997) mul-tiplied by the range of estimates of females nesting each seasongives an estimate of between 1422 and 8178 breeding females,thus indicating it to be one of the largest documented breedingpopulations in the Atlantic (Abreu-Grobois and Plotkin, 2008).Furthermore, assuming that spatial patterns of nesting effort areconsistent within and across seasons, analysis of seasonal trendsbased on the range of upper, lower, and median estimates for totalnesting effort in Gabon over seven seasons suggests that this pop-ulation is increasing with annual growth rates of between 14.0%and 19.8% (i.e. equivalent to a 2–3-fold increase) in nesting effortsince 2006–2007.
4.2. Protected areas
Assessing the overlap between protected areas and core nestingregions to inform targeted conservation and/or monitoring effortsis important for effective conservation of sea turtles (Mazariset al., 2014). Therefore, whilst the coastal survey revealed thatGabon’s coastal network of protected areas encompassed a consid-erable proportion of nesting effort (approximately 81%); stretchesof coastline outside of this network also received appreciable levelsof nesting. This echoes similar findings for leatherback turtles inGabon (Witt et al., 2009). However, in contrast to leatherback tur-tles, where nesting outside of protected areas is widely distributed,approximately 68% of all olive ridley nesting effort outside of pro-tected areas was concentrated between Ouangu Reserve andMayumba National Park along approximately 55 km (9%) of thesurveyed coastline, an area that is not routinely monitored. Giventhat other solitary nesting populations in the Atlantic have shownstrong nest site fidelity (Matos et al., 2012) further research is thusrequired to determine whether this location is important acrossseasons.
However, it is also worth noting that even though a consider-able proportion of nesting occurs within protected areas, three ofGabon’s six coastal protected areas are reserves and so are notlikely to provide strict protection and enforcement that is associ-ated with National Parks that have larger annual budgets. In addi-tion, a range of illegal activities and external pressures continue toexist, even within their borders (Laurance et al., 2008; Pikesleyet al., 2013a). For example, recent efforts to quantify the impactof commercial logging on leatherback turtles in Gabon (Pikesleyet al., 2013a) have revealed that Sette Cama Reserve (an importantnesting region for olive ridley turtles) hosts relatively high densi-ties of beached logs that could potentially lead to mortality and
reduced nesting and/or hatching success (average density in2011 was 18 ± 18.9 logs per 500 m CI: 15–21; n = 152).Additionally, 57% of strandings (defined here as turtles thatwashed ashore dead or alive) observed during the coastal transectwere located inside National Parks and Reserves, with Sette CamaReserve representing 46% of strandings inside protected areas(Fig. S5).
Bycatch in fisheries also remains a significant problem for seaturtles in Africa (Parnell et al., 2007; Weir et al., 2007), and so itis critical to note that, with the exception of Mayumba NationalPark which protects significant olive ridley marine habitat(Maxwell et al., 2011), the existing network of coastal protectedareas only encompasses nesting beach habitats. By contrast, adultfemales and mating males spend several months of the nestingseason in offshore areas where they mate and develop eggs, andas such, while the majority of nesting beach area is protected,the vast majority of inter-nesting habitat for olive ridley turtlesremains unprotected; a similar situation occurs for leatherbackturtles (Witt et al., 2008). Therefore, in order to adequately protectpopulations of sea turtles, further research is required to develop amore detailed understanding of at-sea habitat use (Pendoley et al.,2014). This would help facilitate more effective marine spatialplanning efforts in support of MPA network design, the effectivemitigation of oil and gas industry activities, and fisheries manage-ment in Gabon.
4.3. Monitoring techniques
This study represents the first national ground-based survey tocover extensive areas of Gabon’s coast outside of monitoredregions, highlighting that, in combination with ground-based mon-itoring data, traditional low-tech approaches are invaluable.However, estimating seasonal nesting effort and long-term trendsfrom extensive ground-based coastal surveys requires an under-standing of possible errors that may be introduced by the method-ological treatment of the data.
In terms of data collected during the coastal survey and derivedfrom the four monitoring locations, likely sources of error include:(1) Errors relating to nest ageing: Female nesting olive ridley tur-tles make recognisable tracks in the sand that are highlyspecies-specific and are almost always focused along a narrowcoastal strip, which is often subject to a range of environmentalfactors such as tidal patterns and exposure to wind and rain. Theuse of well-trained observers to maintain high levels of accuracyhas thus been strongly recommended for beach based monitoring(Witherington et al., 2009), and so to minimise potential errors weused the same persons across the survey period to consistently agenests (authors: KM, PDA and DT), and included only nests consid-ered 61, 2 and 3 days old in the subsequent analyses (i.e. thosethat displayed obvious signs of recent activity). In addition, thedaily ground counts of nests recorded at the four monitoring loca-tions were conducted at dawn and include only activity that is lessthan <1 day old. (2) Errors relating to spatial patterns of nesting:Scaling up population estimates from the coastal transect assumesthat there has been little variation in spatial patterns of nestingwithin and across seasons and that just the relative densities ofnesting effort have changed as indicated by trends at the four mon-itoring locations. This is plausible given that both solitary nestingpopulations of olive ridley sea turtles in the western Atlantic(Matos et al., 2012), and female satellite-tagged olive ridleys inGabon have displayed strong nest site fidelity, with 8 of 13 turtles(62%) tagged in 2007/2008 and 2008/2009 re-nesting within 10 kmof their previous nests (Maxwell et al., 2011). However, it is possi-ble that the estimates of total nesting effort over the seven seasonscould be prone to error given the extrapolation does not accountfor variability in habitat suitability, which has been shown to
K. Metcalfe et al. / Biological Conservation 190 (2015) 14–22 21
influence the distribution of nesting effort even in areas with min-imal tidal and/or wave activity (Katselidis et al., 2013). Theapproach presented here would therefore benefit from multiplesurveys both within and across seasons to determine whether spa-tial or temporal variation in the distribution of nesting effort existsfor this population (see Katselidis et al., 2013; Witt et al., 2009). (3)Errors relating to seasonal patterns of nesting effort (frequency dis-tributions), which are central to scaling up survey data can signif-icantly impact estimates of total nesting effort. Whilst severalmathematical approaches have been devised to help construct sea-sonal curves using both incomplete and complete survey data(Girondot et al., 2006; Godgenger et al., 2009; Gratiot et al.,2006; Whiting et al., 2014), we felt that the approach demon-strated here ensured consistency in treatment of data across mon-itoring locations and more importantly is both transparent andrepeatable across nesting seasons and aggregations. In particular,the shape of the seasonal curves derived from the reconstructionof nest beach monitoring data corresponds closely to that modelledfor olive ridleys in neighbouring Republic of Congo (Godgengeret al., 2009) and so is likely an accurate reflection of seasonal pat-terns of nesting effort. However, the addition of data from forth-coming seasons that address current data gaps at the beginningof the nesting season will help refine these estimates.
5. Conclusions
Current population assessments of olive ridley turtles are oftenbased on census data with inadequate spatial and temporal cover-age. However, for some populations such as in the eastern Atlanticthere is a significant lack of data that has resulted in them beingexcluded from the latest IUCN Red List status assessments alto-gether (Abreu-Grobois and Plotkin, 2008; Mazaris et al., 2014).This extensive ground-based coastal survey therefore providesimportant information on both spatial patterns of nesting and pop-ulation trends along the coast of Gabon. In particular, this studysuggests that Gabon hosts one of the most important olive ridleyrookeries in the Atlantic, if we consider the available data to date.Additionally, this study complements the existing knowledge baseand further emphasises the regional and global importance ofGabon’s nesting sea turtle populations (Maxwell et al., 2011;Witt et al., 2011, 2009, 2008). Gabon is therefore better placed interms of available data than most African countries to supportthe design and management of an extensive MPA network thatadequately represents and protects large marine species such assea turtles. However, given that many parts of the African coaststill have not been sufficiently assessed or surveyed, data onknown nesting grounds in neighbouring Republic of Congo (Balet al., 2007; Godgenger et al., 2009), Angola (Weir et al., 2007)and other African nations bordering the Atlantic coast (Fretey,2001) need to be integrated before we can design effective pro-tected area networks and/or generate robust assessments to detectregional changes in the status of olive ridley sea turtles in the east-ern Atlantic.
Acknowledgements
This study was supported by the Darwin Initiative (Project20009), with additional funding to support the coastal transectprovided by the Wildlife Conservation Society (WCS), Tullow Oil,and Worldwide Fund for Nature (WWF). Long-term monitoringdata was collected by the Gabon Sea Turtle Partnership (PTMG),a regional network including Agence Nationale des ParcsNationaux (ANPN), Aventures Sans Frontieres (ASF), CentreNational des Données et de l’Information Oceanographiques(CNDIO), Fondation Liambissi, Ibonga, WCS and WWF supported
by funding from the Marine Turtle Conservation Fund (UnitedStates Fish and Wildlife Service, U.S. Department of the Interior).K.M. is supported by funding from the Darwin Initiative, throughthe Department for Environment, Food and Rural Affairs (Defra)in the UK. We are grateful to the field teams who have collectedlong-term monitoring data, and to ANPN and the local project part-ners whose assistance with planning and logistics for the coastaltransect made this study possible.
Appendix A. Supplementary material
Supplementary data associated with this article can be found, inthe online version, at http://dx.doi.org/10.1016/j.biocon.2015.05.008.
References
Abreu-Grobois, A., Plotkin, P., 2008. IUCN SSC Marine Turtle Specialist Group.Lepidochelys olivacea. The IUCN Red List of Threatened Species. Version 2014.2.
Bal, G., Breheret, N., VanLeeuwe, H., 2007. An update on sea turtle conservationactivities in the Republic of Congo. Mar. Turt. Newsl., 116
Broderick, A.C., Glen, F., Godley, B.J., Hays, G.C., 2003. Variation in reproductiveoutput of marine turtles. J. Exp. Mar. Biol. Ecol. 288, 95–109.
Broderick, A.C., Godley, B.J., Hays, G.C., 2001. Trophic status drives interannualvariability in nesting numbers of marine turtles. Proc. R. Soc. Lond. B Biol. Sci.268, 1481–1487.
Conant, T., Somma, A., Lauritsen, A.M., Bibb, K., Possardt, E., 2014. Olive Ridley seaturtle (Lepidochelys olivacea) 5-year review: summary and evaluation. U.S.Department of Commerce, National Oceanic and Atmospheric Administration(NOAA), National Marine Fisheries Service, Office of Protected Resources SilverSpring Maryland and U.S. Department of the Interior U.S. Fish and WildlifeService, Southeast Region, Jacksonville Ecological Services Field Office,Jacksonville, Florida.
Dornfeld, T.C., Robinson, N.J., Tomillo, P.S., Paladino, F.V., 2015. Ecology of solitarynesting olive ridley sea turtles at Playa Grande, Costa Rica. Mar. Biol. 162, 123–139.
Eguchi, T., Gerrodette, T., Pitman, R.L., Seminoff, J.A., Dutton, P.H., 2007. At-seadensity and abundance estimates of the olive ridley turtle Lepidochelys olivaceain the eastern tropical Pacific. Endanger. Species Res. 3, 191–203.
Formia, A., Tiwari, M., Fretey, J., Billes, A., 2003. Sea turtle conservation along theAtlantic coast of Africa. Mar. Turt. Newsl. 100, 33–37.
Fretey, J., 2001. Biogeography and conservation of marine turtles of the AtlanticCoast of Africa. Biogéographie et conservation des tortues marines de la côteatlantique de l’Afrique. Convention on the Conservation of Migratory Species ofWild Animals (CMS). CMS Technical Series Publication No 6. UNEP/CMSSecretariat, Bonn, Germany, p. 429.
Fretey, J., Ndoye, A., Fall, A., 2012. New northern limit of nesting of Lepidochelysolivacea in the East Atlantic Ocean: North Senegal (West Africa). Mar. Turt.Newsl. 135, 19–20.
Gerrodette, T., Taylor, B., 1999. Estimating population size. In: Eckert, K.L., Bjorndal,K.A., Abreu-Grobois, A., Donnelly, M. (Eds.), Research and ManagementTechniques for the Conservation of Sea Turtles. IUCN/SSC Marine TurtleSpecialist Group Publication No. 543 4, Washington, DC, USA.
Girondot, M., Rivalan, P., Wongsopawiro, R., Briane, J.-P., Hulin, V., Caut, S., Guirlet,E., Godfrey, M.H., 2006. Phenology of marine turtle nesting revealed bystatistical model of the nesting season. BMC Ecol. 6, 11.
Godgenger, M.-C., Breheret, N., Bal, G., N’Damité, K., Girard, A., Girondot, M., 2009.Nesting estimation and analysis of threats for Critically Endangered leatherbackDermochelys coriacea and Endangered olive ridley Lepidochelys olivacea marineturtles nesting in Congo. Oryx 43, 556–563.
Godley, B.J., Broderick, A.C., Hays, G.C., 2001. Nesting of green turtles (Cheloniamydas) at Ascension Island, South Atlantic. Biol. Conserv. 97, 151–158.
Gratiot, N., Gratiot, J., Kelle, L., Thoisy, B.d., 2006. Estimation of the nesting season ofmarine turtles from incomplete data: statistical adjustment of a sinusoidalfunction. Anim. Conserv. 9, 95–102.
Hays, G.C., 2000. The implications of variable remigration intervals for theassessment of population size in marine turtles. J. Theor. Biol. 206, 221–227.
Jackson, A.L., Broderick, A.C., Fuller, W.J., Glen, F., Ruxton, G.D., Godley, B.J., 2008.Sampling design and its effect on population monitoring: how muchmonitoring do turtles really need? Biol. Conserv. 141, 2932–2941.
Jackson, J.B.C., Kirby, M.X., Berger, W.H., Bjorndal, K.A., Botsford, L.W., Bourque, B.J.,Bradbury, R.H., Cooke, R., Erlandson, J., Estes, J.A., Hughes, T.P., Kidwell, S., Lange,C.B., Lenihan, H.S., Pandolfi, J.M., Peterson, C.H., Steneck, R.S., Tegner, M.J.,Warner, R.R., 2001. Historical overfishing and the recent collapse of coastalecosystems. Science 293, 629–638.
Kappes, M.A., Shaffer, S.A., Tremblay, Y., Foley, D.G., Palacios, D.M., Robinson, P.W.,Bograd, S.J., Costa, D.P., 2010. Hawaiian albatrosses track interannual variabilityof marine habitats in the North Pacific. Prog. Oceanogr. 86, 246–260.
Katselidis, K.A., Schofield, G., Stamou, G., Dimopoulos, P., Pantis, J.D., 2013.Evidence-based management to regulate the impact of tourism at a keymarine turtle rookery on Zakynthos Island, Greece. Oryx 47, 584–594.

22 K. Metcalfe et al. / Biological Conservation 190 (2015) 14–22
Laurance, W.F., Fay, J.M., Parnell, R.J., Sounguet, G.-P., Formia, A., Lee, M.E., 2008.Does rainforest logging threaten marine turtles? Oryx 42, 246–251.
Lee, R., 2006. Matlab Program for Repeatability Analysis of Waveform Data[Computer Software].
Luschi, P., Hays, G.C., Papi, F., 2003. A review of long-distance movementsby marine turtles, and the possible role of ocean currents. Oikos 103, 293–302.
Matos, L., Silva, A.C., Castilhos, J.C., Weber, M.I., Soares, L.S., Vicente, L., 2012. Strongsite fidelity and longer internesting interval for solitary nesting olive ridley seaturtles in Brazil. Mar. Biol. 159, 1011–1019.
Maxwell, S.M., Breed, G., Nickel, B., Makanga-Bahouna, J., Pemo-Makaya, E., Parnell,R., Formia, A., Ngouessono, S., Godley, B.J., Costa, D., Coyne, M., 2011. Usingsatellite tracking to optimize protection of long-lived marine species: OliveRidley Sea turtle conservation in Central Africa. PLoS ONE 6, e19905.
Maxwell, S.M., Hazen, E.L., Bograd, S.J., Halpern, B.S., Breed, G.A., Nickel, B.,Teutschel, N.M., Crowder, L.B., Benson, S., Dutton, P.H., Bailey, H., Kappes,M.A., Kuhn, C.E., Weise, M.J., Mate, B., Shaffer, S.A., Hassrick, J.L., Henry, R.W.,Irvine, L., McDonald, B.I., Robinson, P.W., Block, B.A., Costa, D.P., 2013.Cumulative human impacts on marine predators. Nat. Commun., 4
Mazaris, A.D., Almpanidou, V., Wallace, B.P., Pantis, J.D., Schofield, G., 2014. A globalgap analysis of sea turtle protection coverage. Biol. Conserv. 173, 17–23.
McClenachan, L., Jackson, J.B., Newman, M.J., 2006. Conservation implications ofhistoric sea turtle nesting beach loss. Front. Ecol. Environ. 4, 290–296.
McGowan, A., Broderick, A., Frett, G., Gore, S., Hastings, M., Pickering, A., Wheatley,D., White, J., Witt, M., Godley, B., 2008. Down but not out: marine turtles of theBritish Virgin Islands. Anim. Conserv. 11, 92–103.
Miller, J.D., 1997. Reproduction in sea turtles. In: Lutz, P.L., Musick, J.A. (Eds.), TheBiology of Sea Turtles. CRC Press, Boca Raton, USA, p. 432.
Mint-Hama, L., Fretey, J., Aksissou, M., 2013. Nouvelles données sur le statut destortues marines en Mauritanie. Bulletin de la Société Herpétologique de France145–146, 127–142.
Parnell, R., Verhage, B., Deem, S.J., VanLeeuwe, H., Nishihara, T., Moukoula, C.,Gibudi, A., 2007. Marine turtle mortality in southern Gabon and northernCongo. Mar. Turt. Newsl. 116, 12–14.
Pendoley, K.L., Schofield, G., Whittock, P.A., Ierodiaconou, D., Hays, G.C., 2014.Protected species use of a coastal marine migratory corridor connecting marineprotected areas. Mar. Biol. 161, 1455–1466.
Pikesley, S.K., Agamboue, P.D., Bonguno, E.A., Boussamba, F., Cardiec, F., Michael Fay,J., Formia, A., Godley, B.J., Laurance, W.F., Mabert, B.D.K., 2013a. Here today, heretomorrow: beached timber in Gabon, a persistent threat to nesting sea turtles.Biol. Conserv. 162, 127–132.
Pikesley, S.K., Maxwell, S.M., Pendoley, K., Costa, D.P., Coyne, M.S., Formia, A.,Godley, B.J., Klein, W., Makanga-Bahouna, J., Maruca, S., Ngouessono, S., Parnell,R.J., Pemo-Makaya, E., Witt, M.J., 2013b. On the front line: integrated habitatmapping for olive ridley sea turtles in the southeast Atlantic. Divers. Distrib. 19,1518–1530.
Plot, V., De Thoisy, B., Blanc, S., Kelle, L., Lavergne, A., Roger-Bérubet, H., Tremblay,Y., Fossette, S., Georges, J.Y., 2012. Reproductive synchrony in a recoveringbottlenecked sea turtle population. J. Anim. Ecol. 81, 341–351.
R Core Team, 2014. R: A language and environment for statistical computing. RFoundation for Statistical Computing, Vienna, Austria. ISBN 3-900051-07-0<http://www.R-project.org/>.
Rivalan, P., Pradel, R., Choquet, R., Girondot, M., Prévot-Julliard, A.-C., 2006.Estimating clutch frequency in the sea turtle Dermochelys coriacea usingstopover duration. Mar. Ecol. Prog. Ser. 317, 285.
Robinson, P.W., Costa, D.P., Crocker, D.E., Gallo-Reynoso, J.P., Champagne, C.D.,Fowler, M.A., Goetsch, C., Goetz, K.T., Hassrick, J.L., Hückstädt, L.A., Kuhn, C.E.,Maresh, J.L., Maxwell, S.M., McDonald, B.I., Peterson, S.H., Simmons, S.E.,Teutschel, N.M., Villegas-Amtmann, S., Yoda, K., 2012. Foraging behavior and
success of a mesopelagic predator in the Northeast Pacific Ocean: insights froma data-rich species, the Northern Elephant Seal. PLoS ONE 7, e36728.
Rosenbaum, H.C., Maxwell, S.M., Kershaw, F., Mate, B., 2014. Long-range movementof humpback whales and their overlap with anthropogenic activity in the SouthAtlantic Ocean. Conserv. Biol. 28, 604–615.
Schroeder, B.A., Murphy, S., 1999. Population surveys (ground and aerial) on nestingbeaches. In: Eckert, K., Bjorndal, K., Abreu-Grobois, F., Donnelly, M. (Eds.),Research and Management Techniques for the Conservation of Sea Turtles.IUCN/SSC Marine Turtle Specialist Group Publication, pp. 45–55.
Seminoff, J.A., Shanker, K., 2008. Marine turtles and IUCN Red Listing: a review ofthe process, the pitfalls, and novel assessment approaches. J. Exp. Mar. Biol.Ecol. 356, 52–68.
Shaffer, S.A., Tremblay, Y., Weimerskirch, H., Scott, D., Thompson, D.R., Sagar, P.M.,Moller, H., Taylor, G.A., Foley, D.G., Block, B.A., 2006. Migratory shearwatersintegrate oceanic resources across the Pacific Ocean in an endless summer. Proc.Natl. Acad. Sci. 103, 12799–12802.
Stewart, K., Sims, M., Meylan, A., Witherington, B., Brost, B., Crowder, L.B., 2011.Leatherback nests increasing significantly in Florida, USA; trends assessed over30 years using multilevel modeling. Ecol. Appl. 21, 263–273.
Troëng, S., Chacón, D., Dick, B., 2004. Possible decline in leatherback turtleDermochelys coriacea nesting along the coast of Caribbean Central America.Oryx 38, 395–403.
Varo-Cruz, N., López-Suárez, P., Cozens, J., Liria-Loza, A., Fretey, J., López-Jurado, L.F.,2011. New Records of the Olive Ridley Sea Turtle Lepidochelys olivacea(Eschscholtz, 1829) from the Cape Verde Islands.
Wallace, B.P., DiMatteo, A.D., Hurley, B.J., Finkbeiner, E.M., Bolten, A.B., Chaloupka,M.Y., Hutchinson, B.J., Abreu-Grobois, F.A., Amorocho, D., Bjorndal, K.A., 2010.Regional management units for marine turtles: a novel framework forprioritizing conservation and research across multiple scales. PLoS ONE 5,e15465.
Weber, S.B., Weber, N., Ellick, J., Avery, A., Frauenstein, R., Godley, B.J., Sim, J.,Williams, N., Broderick, A.C., 2014. Recovery of the South Atlantic’s largest greenturtle nesting population. Biodivers. Conserv., 1–14
Weir, C.R., Ron, T., Morais, M., Duarte, A.D.C., 2007. Nesting and at-sea distributionof marine turtles in Angola, West Africa, 2000–2006: occurrence, threats andconservation implications. Oryx 41, 224–231.
Whiting, A.U., Chaloupka, M., Pilcher, N., Basintal, P., Limpus, C.J., 2014. Comparisonand review of models describing sea turtle nesting abundance. Mar. Ecol. Prog.Ser. 508, 233–246.
Witherington, B., Kubilis, P., Brost, B., Meylan, A., 2009. Decreasing annual nestcounts in a globally important loggerhead sea turtle population. Ecol. Appl. 19,30–54.
Witt, M.J., Augowet Bonguno, E., Broderick, A.C., Coyne, M.S., Formia, A., Gibudi, A.,Mounguengui Mounguengui, G.A., Moussounda, C., NSafou, M., Nougessono, S.,Parnell, R.J., Sounguet, G.-P., Verhage, S., Godley, B.J., 2011. Tracking leatherbackturtles from the world’s largest rookery: assessing threats across the SouthAtlantic. Proc. R. Soc. B: Biol. Sci.
Witt, M.J., Baert, B., Broderick, A.C., Formia, A., Fretey, J., Gibudi, A., Mounguengui,G.A.M., Moussounda, C., Ngouessono, S., Parnell, R.J., Roumet, D., Sounguet, G.-P., Verhage, B., Zogo, A., Godley, B.J., 2009. Aerial surveying of the world’s largestleatherback turtle rookery: a more effective methodology for large-scalemonitoring. Biol. Conserv. 142, 1719–1727.
Witt, M.J., Broderick, A.C., Coyne, M., Formia, A., Ngouessono, S., Parnell, R.J.,Sounguet, G.P., Godley, B.J., 2008. Satellite tracking highlights difficulties in thedesign of effective protected areas for leatherback turtles during theinternesting period. Oryx 42, 296–300.
Young, H.S., Maxwell, S.M., Conners, M.G., Shaffer, S.A., 2015. Pelagic marineprotected areas protect foraging habitat for multiple breeding seabirds in thecentral Pacific. Biol. Conserv. 181, 226–235.


