Embed Size (px)
Citation preview

Global 5002016The annual report on the world’s most valuable brandsFebruary 2016

Brand Finance Global 500 February 2016 3.Brand Finance Global 500 February 2016 2. Brand Finance Airlines 30 30 February 2015 2. Brand Finance Global 500 February 2016 2.
Foreword.
In recent years there has been a growing controversy over the validity of brand valuations in general and brand valuation league tables in particular, so with my foreword this year I want to address the issue head-on.
The primary point of contention rests on the significant variation in the published values of brands by the major brand valuation agencies. However, we view these variations as a sign of healthy debate rather than as a source of weakness.
Just as equity analysts differ significantly in their target share prices for companies, so too can those in our industry differ in valuations of brands. The main reasons for differences of opinion are: brand asset definition, date of the valuation, approach adopted, financial forecasts, income attributed to the brand, weighted average cost of capital applied, growth, tax and inflation rates and the expected useful life of the brand.
Taking Apple as an example, it is quite possible for one serious valuer to take the view that Apple’s dominance in smart phones is coming to an end, that volumes and margins will start
dropping, that there is higher risk and therefore lower expected income, over a shorter life, with a higher cost of capital. This would tend to result in a lower brand valuation.
By contrast another valuer might believe the opposite. Some take the view that Apple will go from strength to strength in watches, televisions, finance and the auto industry and believe that it will shape all our lives for generations. This would obviously tend to result in a higher brand valuation.
There is now a widely accepted global brand valuation standard (ISO 10668) and the International Valuation Standards Council has produced a broader standard on the valuation of Intangible Assets including brands. Brand valuations are regularly relied upon by accountants, auditors, tax specialists, lawyers, licensing managers, lenders and investors who are always financially literate and enquiring.
Based on the results of this year’s Brand Finance Global 500, 18% of all quoted company enterprise value, is made up of brands. What this points to is a renewed need to educate and explain how brand valuations are conducted and how critical an understanding of brand value is to marketers, finance teams and CEOs alike. At Brand Finance, we pride ourselves on our independence of thought, clarity and transparency and welcome the chance to explain how we produce our valuations to you, so please get in touch!
David Haigh, CEO, Brand Finance
Foreword 2
Methodology 4
Executive Summary - Brand Value 6
Executive Summary - Brand Strength 11
Brand Value and Share Price 14
About Brand Finance and Contact Details 15
Understand Your Brand’s Value 16
How We Can Help 17
Full Table 18
Contents

Brand Finance Global 500 February 2016 5.Brand Finance Global 500 February 2016 4.
Brand Finance calculates the values of the brands in its league tables using the ‘Royalty Relief approach’. This approach involves estimating the likely future sales that are attributable to a brand and calculating a royalty rate that would be charged for the use of the brand, i.e. what the owner would have to pay for the use of the brand—assuming it were not already owned.
Methodology
Brand strength expressed as a BSI score out of 100.
BSI score applied to an appropriate sector royalty rate range.
Royalty rate applied to forecast revenues to derive brand values.
Post-tax brand revenues are discounted to a net present value (NPV) which equals the brand value.
The steps in this process are as follows:
1 Calculate brand strength on a scale of 0 to 100 based on a number of attributes such as emotional connection, financial performance and sustainability, among others. This score is known as the Brand Strength Index.
2 Determine the royalty rate range for the respective brand sectors. This is done by reviewing comparable licensing agreements
Definition of ‘Brand’
Brand Finance helped to craft the internationally recognised standard on Brand Valuation, ISO 10668. That defines a brand as “a marketing-related intangible asset including, but not limited to, names, terms, signs, symbols, logos and designs, or a combination of these, intended to identify goods, services or entities, or a combination of these, creating distinctive images and associations in the minds of stakeholders, thereby generating economic benefits/value.”
However, a brand makes a contribution to a company beyond that which can be sold to a third party. ‘Brand Contribution’ refers to the total economic benefit that a business derives from its brand, from volume and price premiums over generic products to cost savings over less well-branded competitors.
Strong brand
Weak brand
Brand strength index(BSI)
Brand‘Royalty rate’
Brand revenues Brand value
Forecast revenues
Brand investment
Brand equity
Brand performance
Brand Strength
Brand Strength is the part of our analysis most directly and easily influenced by those responsible for marketing and brand management. In order to determine the strength of a brand we have developed the Brand Strength Index (BSI). We analyse marketing investment, brand equity (the goodwill accumulated with customers, staff and other stakeholders) and finally the impact of those on business performance. Following this analysis, each brand is assigned a BSI score out of 100, which is fed into the brand value calculation. Based on the score, each brand in the league table is assigned a rating between AAA+ and D in a format similar to a credit rating. AAA+ brands are exceptionally strong and well managed while a failing brand would be assigned a D grade.
sourced from Brand Finance’s extensive database of license agreements and other online databases.
3 Calculate royalty rate. The brand strength score is applied to the royalty rate range to arrive at a royalty rate. For example, if the royalty rate range in a brand’s sector is 0-5% and a brand has a brand strength score of 80 out of 100, then an appropriate royalty rate for the use of this brand in the given sector will be 4%.
4 Determine brand specific revenues estimating a proportion of parent company revenues attributable to a specific brand.
5 Determine forecast brand specific revenues using a function of historic revenues, equity analyst forecasts and economic growth rates.
6 Apply the royalty rate to the forecast revenues to derive brand revenues.
7 Brand revenues are discounted post tax to a net present value which equals the brand value.
Definitions+ Enterprise Value – the value of
the entire enterprise, made up of multiple branded businesses
What do we mean by ‘brand’?
E.g.Volkswagen
AG
E.g. Bentley Trademark
+ Branded Business Value – the value of a single branded business operating under the subject brand
+ Brand Value – the value of the trade marks (and relating marketing IP and ‘goodwill’ attached to it) within the branded business
+ Brand Contribution– The total economic benefit derived by a business from its brand
E.g. Bentley Trademark
Contribution
E.g.Bentley
‘Brand’
‘Branded Business’
‘Branded Enterprise’
‘Brand’ Contribution’

Brand Finance Global 500 February 2016 7Brand Finance Global 500 February 2016 6
Rank 2016: 1 2015: 1 BV 2016: $145,918m BV 2015: $128,303mBrand Rating: AAA
Rank 2016: 2 2015: 3 BV 2016: $94,184m BV 2015: $76,683mBrand Rating: AAA+
Rank 2016: 3 2015: 2 BV 2016: $83,185m BV 2015: $81,716mBrand Rating: AAA
Rank 2016: 4 2015: 8 BV 2016: $69,642m BV 2015: $56,124mBrand Rating: AA+
Rank 2016: 5 2015: 4 BV 2016: $67,258m BV 2015: $67,060mBrand Rating: AAA
1
2
3
4
5
+14%
+23%
+2%
+24%
+0%
Rank 2016: 6 2015: 5 BV 2016: $63,116m BV 2015: $59,843mBrand Rating: AAA-
Rank 2016: 7 2015: 6 BV 2016: $59,904m BV 2015: $58,820mBrand Rating: AA+
Rank 2016: 8 2015: 7 BV 2016: $ 53,657m BV 2015: $56,705mBrand Rating: AA
Rank 2016: 9 2015: 11 BV 2016: $49,810m BV 2015: $47,916mBrand Rating: AAA-
6
7
8
9
10
+5%
+2%
-5%
+4%
Apple maintains its dominance at the summit of the Brand Finance Global 500. Despite annual predictions of a plateau or fall from grace, it has proved a continuous source of success with 2015/16 proving no exception. Brand value is up 14%, thanks to the huge success of the iPhone 6 and recently released iPhone 6s. Revenue for Q4 of the fiscal year 2015 was a record-breaking US$51.5 billion with profits at US$11.1 billion while revenues for the year were US$233.7 billion. This huge surge is partly responsible for recent disappointing sales growth (the slowest since the iPhone was launched in 2007). However, with 74.8 million handsets sold in the last quarter in a saturated market, assertions that Apple has gone rotten are premature. Apple Pay is beginning to generate traction, potentially heralding the brand’s long-anticipated expansion into the broader arena of financial services, to say nothing of its rumoured foray into the auto industry.
The most notable changes in the top ten are the jumps in rank of Google and Amazon. Google had been held down in 3rd place by Samsung since 2012. New parent company Alphabet announced revenue growth of 13% this year, due to increasing mobile search revenue. There has also been a 3 point improvement in brand strength which together have seen brand value rise 27% to US$94.2 billion. Clearly the organisation’s new brand architecture is showing positive early signs. Amazon continues its ascent of the rankings, jumping ahead of Microsoft, Verizon and AT&T to place 4th. Amazon has been confounding analysts of late, beating expectations in three of the last four quarters. Revenue growth from its ‘Prime’ next-day delivery services have been a significant driving force. It has supported Prime by developing original content under the same brand and following a trail blazed by Netflix (another strong performer
Global 500
this year, having risen 51%) Amazon is winning plaudits for the quality and popularity of programs such as Mozart in the Jungle and The Man in the High Castle. Amazon’s Fire smartphone was far less successful than Amazon would have hoped, however the tablet version has been much better received.
Facebook is another tech brand continuing to make major strides. It has been one of the fastest rising brands over the last three years, increasing in brand value from US$5.57 billion in 2013 to US$9.82 billion in 2014, US$24.18 billion in 2015 and US$34 billion today an increase over the period of over 500%. Facebook is now the world’s 18th most valuable brand, up from 30th in 2015, a position that better reflects the cultural influence it has come to exert over the past decade. The firm has been able to monetize its offering much more effectively of late, finally
harnessing the potential of mobile advertising. Revenue in Q3 2015 was up 41% on the previous year, driven almost entirely by mobile advertising growth.
Tech brands as a whole have performed well and those from China in particular. Many of these Chinese tech titans were virtually unknown just a few years ago and some are barely known outside their home market today but are making waves financially and building brands that are rapidly gaining traction outside China. WeChat is a good example. Its user base grew over 40% between late 2014 and late 2015 and is now over 650 million, with 70 million outside China. It is often compared to the more familiar (at least in the West) Whatsapp, however, WeChat is much more than a messaging app and offers video-gaming and payment services. These additional services are helping to drive WeChat’s brand
Rank 2016: 10 2015: 15 BV 2016: $44,170m BV 2015: $34,925mBrand Rating: AAA-
+26%
Executive Summary - Brand Value
Executive Summary - Brand Value

Brand Finance Global 500 February 2016 9Brand Finance Global 500 February 20168
value, which is up 83% to US$6.5 billion.
NetEase has been even more successful, with approximately 800 million registered users of its games, which include Fantasy Westward Journey, Heroes of Tang Dynasty and World of Warcraft (licensed). It recently established a North American office, focussed on western-orientated mobile games rather than the massively multiplayer online role playing games for which NetEase is better known, which is responsible for the hugely popular Speedy Ninja. Brand value has more than doubled (from US$1.7 billion to US$3.6 billion) in response to the same trend in revenue growth, enabling NetEase to make its debut in the Brand Finance Global 500 this year.
Hikvision, another Chinese tech giant, is also a new entrant. Its focus is more on hardware than
software, producing video-surveillance equipment. Its brand value is US$3.3 billion, up 65% on 2015.
Chinese firms are among the top performing from any sector; four of the top ten are Chinese including all four of the top performing brands. Evergrande Real is the fastest growing brand this year, having added 112% to its brand value between 2015 and 2016. While the continued rapid growth of Chinese firms is to be welcomed and lauded, the presence of a real estate brand at the top of the list could be grist to the mill of those claiming that China’s property market is overheated and its economy as a whole set for a shock.
At the lower end of the table, this year’s two worst performing brands are both Brazilian banks, Itau is down 59% and Banco de Brasil
45%. They have been hit hard by the country’s ailing economy and weakened exchange rate. Brazil’s economic position is bleak, with recent forecasts suggesting a 2.95% contraction over the course of 2016. Dilma Rousseff scraped back into office in late 2014 and her failure to either control public spending, improve the economy or placate the domestic audience (riots erupted in 2015) is seriously undermining international confidence in Brazil and its brands. Ms Rousseff and several high-profile figures in politics and industry have been tainted by the Petrobras bribery scandal, compounding the problem. Between 2014 and 2015 Brazil lost 17% of its nation brand value according to the latest Brand Finance Nation Brands report and Standard & Poors downgraded the country’s credit rating to BBB-. Low commodity prices have been a contributory factor to Brazil’s economic woes for several years but the
plunging oil price is only making matters worse. With oil prices below US$40 a barrel, 80% of Petrobras operations are loss-making. Petrobras, hit by both this and the continuing fallout from the corruption scandal, has seen brand value fall 14%.
Volkswagen is also amongst this year’s worst performing brands. This may come as little surprise given the scale of the scandal that has engulfed the brand, following revelations that it programmed its diesel vehicles to activate their optimal emission-reduction settings only when being tested and that, driven under normal conditions, they would emit up to 40 times the more nitrogen oxide. In December Brand Finance estimated that VW may see brand value fall by as much as $10 billion. In fact the affair has turned out to be even more damaging than that. Brand value is down by US$12 billion to US$18.9 billion
Executive Summary - Brand Value
Executive Summary - Brand Value Brand Value Over Time
0
30
60
90
120
150
2016201520142013201220112010200920082007
Bra
nd
val
ue
(US
$bn
)
Brand Value Change 2015-2016 ($m) Brand Value Change 2015-2016 (%)
-7000.000000-2571.4285711857.1428576285.71428610714.28571415142.85714319571.428571
Volkswagen
General Electric
McDonald's
ING
Itaú
IBM
China Unicom
HSBC
Honda
American Express
ICBC
China Construction Bank
Wells Fargo
CSCEC
Agricultural Bank Of China
Engie
Amazon.com
Apple
$-3,085
$-3,091
$-3,106
$-3,376
$-3,641
$-5,309
$-5,608
$-9,972
$-10,803
$-12,102
$17,614
$17,501
$13,518
$11,443
$9,822
$9,550
$9,408
$9,244
$8,976
$8,875
-50 -25 0 25 50 75 100 125 150 175 200
Discover
Chow Tai Fook
Thermo Fisher Scientific
ING
Volkswagen
BNY Mellon
Neutrogena
Infosys
Dove
Virgin Media
Capita
American Airlines
Huawei
DBS
BD
Tim Horton's
CSCEC
GS Group
Evergrande Real
-30%
-30%
-31%
-35%
-38%
-39%
-42%
-45%
-59%
-68%
112%
111%
87%
83%
78%
76%
70%
70%
69%
65%
-6000-4000-2000 0 2000 4000 6000 8000
Bradesco
Itaú
HSBC
Santander
Banco do Brasil
UBS
Royal Bank Of Canada
Deutsche Bank
Caixa
Credit Suisse
Shanghai Pudong Development Bank
China Minsheng Bank
Bank of Communications
China Merchants Bank
Chase
Bank of China
ICBC
China Construction Bank
Wells Fargo
Agricultural Bank Of China
$-1,867
$-1,956
$-2,537
$-2,592
$-2,643
$-2,970
$-3,012
$-3,106
$-5,309
$-9,221
$9,550
$9,244
$8,976
$8,875
$7,343
$7,211
$4,358
$3,362
$2,619
$2,361
-100-75 -50 -25 0 25 50 75 100 125 150
Itaú
Banco do Brasil
ING
Volkswagen
Tim Horton's
Neutrogena
Gazprom
Dove
UniCredit
Michael Kors
Hikvision
American Airlines
Huawei
Ping An Bank
BD
Dollar Tree
CSCEC
NetEase
Evergrande Real
-28%
-30%
-30%
-31%
-35%
-38%
-39%
-42%
-45%
-59%
112%
111%
87%
83%
78%
76%
70%
70%
69%
65%
GE

Brand Finance Global 500 February 2016 11Brand Finance Global 500 February 201610
Executive Summary - Brand Value
At the core of Brand Finance’s brand valuation calculation is brand strength. To calculate this we have developed the Brand Strength Index (BSI). Each brand is awarded a score out of 100 based on factors such as familiarity, loyalty, promotion, marketing investment, staff satisfaction and corporate reputation. Based on this score, brands are allocated a letter grade, similar to a credit rating, from D to AAA+.
Disney is this year’s strongest (most powerful) brand. Though it has long been present amongst the elite group of powerful ‘AAA+’ brands, this year is the first time it has claimed the top spot. Lego was first last year thanks in part to the success of the Lego Movie. Disney’s success this year is testament to the enduring power of the silver screen as both a source of and support for the world’s most powerful brands.
Disney’s brand strength is founded on its rich history and original IP, the classic characters of Mickey Mouse and friends (Minnie, Donald, Goofy), Disney princesses, etc. However its now dominant position is the result of its many acquisitions and the powerful brands it has brought under its roof.
The purchase of ABC, including sports network ESPN, took place in 1995. ESPN has been somewhat troubled of late, as cable TV is increasingly threatened by online media, but it remains an integral part of the Walt Disney Company. The program of acquisitions was stepped up from 2005 under the tenure of Robert Iger. Disney acquired Pixar and its huge array of film franchises, characters and other IP for US$7.4 billion. The next major target was Marvel, acquired in 2009 for US$4.24 billion. The pervasiveness of the action hero genre underlines both the strategic importance of this purchase as well as the degree to which Disney is leveraging its asset. Perhaps the most important of all however was the acquisition of Lucasfilm, and the Star Wars franchise in 2012.
BSI Score
91.8BSI Score
91.6BSI Score
91.5BSI Score
91.5BSI Score
91.4BSI Score
90.7BSI Score
90.7BSI Score
90.4BSI Score
89.7BSI Score
89.5
The World’s 10 Most Powerful Brands.These are the world’s most powerful brands, all awarded the top AAA+ brand rating based on Brand Finance’s Brand Strength Index (BSI).
leading to a fall in rank from 18th to 57th.
Coca-Cola is another iconic brand that is beginning to falter. Its problems are by no means as severe as VW’s; brand value is down 5% (by US$1.6 billion) to US$34.2 billion. This has seen its rank fall from 11th last year to 17th today. This position is more remarkable given Coca-Cola’s past performance. Coca-Cola was the world’s most valuable brand across all industries in 2007, with a brand value of $43.1bn. Increasing concerns over the links between carbonated drinks and obesity have begun to undermine what the Coca-Cola brand has represented for over one hundred years. The low calorie, naturally-sweetened ‘Coke Life’, is Coke’s response to the challenge. Rather than relying only on the acquisition or development of new brands, a strategy that Pepsico has employed, there was clearly a belief at the Coca-Cola Company that the master brand could stretch beyond its traditional values of fun, friendship and refreshment to health and sustainability.
Unfortunately however Coke Life sales have been disappointing to say the least. UK sales peaked in October 2014 at £4.1 million but fell every month thereafter, having dropped 71% by November 2015. The problem lies with its positioning. It is marketed as a more natural, low sugar version of Coke however, though lower in
sugar than Coke, with 89 calories per can it is still very sweet and as Mark Ritson, a long-time critic of Coke Life, has observed, “consumers who opt for a more natural beverage are, by definition, going to switch categories to find it” (Marketing Week, August 2015).
Coca-Cola remain committed to the core brand however. So much so that they have decided to roll out their ‘one-brand’ strategy internationally. The intention is to communicate the idea that Coke Light (Diet Coke), Coke Zero and Coke Life are simply different ways of enjoying Coke as well as a way to achieve marketing efficiencies by reducing the need for sub-brand-specific campaigns. Whether the approach, directed by CMO Marcos de Quinto, will reverse or at least slow Coca-Cola’s brand value decline will be carefully scrutinized.
Above: Coca-Cola’s underperforming Coke Life
Above: Coca-Cola’s new “One-Brand” strategy has seen it bring
all Coke brands under one master brand.
Executive Summary - Brand Strength

Brand Finance Global 500 February 2016 13Brand Finance Global 500 February 201612
Star Wars Episode VII ‘The Force Awakens’, the first film under Disney’s aegis, launched in December following unparalleled publicity and anticipation. It has more than matched the hype and has been the crucial factor in helping Disney become the world’s most powerful brand this year.
It has broken countless box office records, becoming the fastest to gross US$1 billion, enjoying the most successful opening weekend ($529 million) and based on its total box office gross of nearly US$2 billion it is not just Disney’s most successful film but the most successful film in the US and Canada ever. Merchandise has formed a hugely important component; in 2015 Star Wars toys generated over $700 million, more than the combined totals for three other hugely popular franchises (the Avengers, Jurassic World and ‘Minions’).
Based on these impressive figures and Disney’s commercial stewardship, Brand Finance has estimated the value of the Star Wars brand to be US$10 billion, dwarfing the sum Disney paid little over three years ago. Though Disney appears to have engineered a very favourable deal, the value of the Star Wars brand lies as much in Disney’s unparalleled expertise in the entertainment sector as with the inherent strength of Star Wars as a brand. Disney is managing to exploit the Star Wars concept both rapidly and sensitively, a difficult feat to pull off. The scale of Star Wars’ success was by no means assured but by securing JJ Abrams as director, Disney has demonstrated an appreciation of how to both appease existing fans and appeal to a new generation. Annual film releases are planned for the foreseeable future, with spin offs such as ‘Rogue One’ (to be released this year) complementing the central trilogy and providing greater volume and consistency of revenues and
it is difficult to imagine another businesses with the capacity to develop the merchandising opportunities more effectively.
Disney’s resorts are marketed as ‘the happiest place on Earth’. That has proved true not just for its customers but for investors too.
Lego has lost its position at the top of the table. It remains a very powerful brand for many of the same reasons identified last year. Lego’s appeal spans generations; as well as the creative freedom it gives children, the brand appeals to the nostalgia of adults. It generally avoids gendered marketing, by appealing to boys and girls equally Lego maximises the size of its target demographic. That approach also pleases parents, as concerns mount over the effect toys may have on the outlook.
The Danish company has been beset by a series of controversies of late though which threaten to affect its wholesome image and may have contributed to the loss of its position at the top of Brand Finance’s brand strength table. 2014 saw a brush with controversy when Greenpeace protesters challenged Lego over its partnership with Shell. Greenpeace created its own Lego video, with a mournful version of the Lego Movie theme song played over scenes of Shell’s alleged destruction of the arctic. More recently it has been fined by German regulators for attempting to prevent retailers from discounting its products, souring relationships with many stakeholders at once; government, commercial partners and customers alike. It has also been forced into a U turn on its policy to quiz customers who wish to buy in bulk about the intended use of the product and to prevent those planning to use it for ‘political’ purposes. Chinese artist Ai Weiwei fell foul of the policy, leading to accusations that Lego was in some way colluding with the Chinese state in censorship.
L’Oréal is 5th on the list, with sub-brand L’Oréal Paris 6th. L’Oréal has pulled off the trick of simultaneously capturing the mass market while maintaining an air of exclusivity. It is a powerhouse of brand creation. The key to its success is its unrivalled marketing focus and investment. All L’Oréal brands, and L’Oréal Paris in particular, have benefitted from the Bettencourt family’s constructive approach to reinvestment. They have always prioritized long term value over short term profits and are just as likely to channel profits into marketing as they are to pay a dividend. Sales in the first half of 2015 grew 5.3% and while Brazil has proved a challenging market this year (as it has for many brands), growth in China is more than compensating.
Above: A selection of Disney owned brands
Executive Summary - Brand Strength
Executive Summary - Brand Strength

Brand Finance Global 500 February 2016 15Brand Finance Global 500 February 201614
It has long been acknowledged that powerful brands drive stakeholder preference, improving business performance and ultimately increasing shareholder value. However, for the first time the extent of this effect has been quantified.
In December of 2015 we took a retrospective look at the share price of the brands we have valued and their subsequent stock market performance, revealing compelling evidence to suggest that highly branded businesses and those with strong brands can outperform the market.
The most striking finding is that an investment strategy based on the most highly branded companies (those where brand value makes up a high proportion of overall enterprise value) would have led to a return almost double that of the average for the S&P 500 as a whole.
Between 2007 and 2015, the average return across the S&P was 49%. However, by using Brand Finance’s data, investors could have generated returns of up to 97%. Investing in companies with a brand value to enterprise value (BV/EV) ratio of greater than 30% would have generated returns of 94%. Investing exclusively in the 10 companies with the highest BV/EV ratios
would have resulted in a 96% return.
115 of the top 500 brands in the 2016 list fall into this category. The group includes luxury goods businesses that one might expect to be highly branded such as Burberry, Gucci and Ralph Lauren, well-known consumer brands such as Audi, Land Rover, Dove, Ikea and Nestle, but also financial and B2B brands such as Shinhan, Fujitsu and Allstate.
There was a similar effect for brands rated as AAA or AAA+ according to Brand Finance’s Brand Strength Index. A strategy based on investment in all AAA and AAA+ rated brands would have led to a return of 54% over the eight years from 2007. However, if only top-rated US brands were targeted, the return would have been 87%.
There are just 42 brands in this year’s top 500 with a brand rating of AAA or better and just a handful that have this rating as well as a BV/EV of greater than 30%. This elite group includes L’Oréal, Nike, Marriot, Hilton, Ferrari and Porsche. It will be interesting to see whether these brands deliver similarly impressive investor returns over the coming years.
Brand Value and Share Price About Brand Finance
Brand Finance is the world’s leading independent brand valuation and strategy consultancy.
Brand Finance was set up in 1996 with the aim of ‘bridging the gap between marketing and finance’. For almost 20 years we have helped companies to connect their brands to the bottom line, building robust business cases for brand decisions, strategies and investments. In doing so, we have helped finance people to evaluate marketing programmes and marketing people to present their case in the Board Room.
IndependenceBrand Finance is impartial and independent.
Technical credibility Brand Finance has high technical standards. Transparency There are no black boxes.
ExpertiseWe possess a unique combination of skills and experience.
Long Term Value Growth of Highly Branded Companies and the S&P AverageDisclaimer.
Brand Finance has produced this study with an independent and unbiased analysis. The values derived and opinions produced in this study are based only on publicly available information and certain assumptions that Brand Finance used where such data was deficient or unclear . Brand Finance accepts no responsibility and will not be liable in the event that the publicly available information relied upon is subsequently found to be inaccurate.
The opinions and financial analysis expressed in the report are not to be construed as providing investment or business advice. Brand Finance does not intend the report to be relied upon for any reason and excludes all liability to any body, government or organisation.
For media enquiries, please contact:Robert HaighMarketing & Communications Director Brand Finance [email protected]
For all other enquiries, please contact:[email protected]+44 (0)207 389 9400
Contact us.For further information on Brand Finance®’s services and valuation experience, please contact your local representative:
Country Contact Email addressAustralia Mark Crowe [email protected] Geoffrey Hamilton-Jones [email protected] Bryn Anderson [email protected] Nigel Cooper [email protected] Africa Jawad Jaffer [email protected] Luc Bardin [email protected] Tobias Bielenstein [email protected] Ioannis Lionis [email protected] Marc Cloosterman [email protected] Ajimon Francis [email protected] Jimmy Halim [email protected] Massimo Pizzo [email protected] East Andrew Campbell [email protected] Nigeria Babatunde Odumeru [email protected] Pedro Taveres [email protected] Alexander Eremenko [email protected] Samir Dixit [email protected] Africa Oliver Schmitz [email protected] Jaime Alvarez [email protected] Lanka Ruchi Gunewardene [email protected] Muhterem Ilgüner [email protected] Bryn Anderson [email protected] Laurence Newell [email protected] Region Alexander Todoran [email protected]
Our offices.
Brand Finance Global 500 February 2016 17Brand Finance Global 500 February 201616
Understand Your Brand’s Value
A League Table Report provides a complete breakdown of the assumptions, data sources and calculations used to arrive at your brand’s value. Each report includes expert recommendations for growing brand value to drive business performance and offers a cost-effective way to gaining a better understanding of your position against competitors.
A full report includes the following sections which can also be purchased individually.
Brand Valuation SummaryOverview of the brand valuation including executive summary, explanation of changes in brand value and historic and peer group comparisons.
Brand Strength IndexA breakdown of how the brand performed on various metrics of brand strength, benchmarked against competitor brands in a balanced scorecard framework.
Royalty RatesAnalysis of competitor royalty rates, industry royalty rate ranges and margin analysis used to determine brand specific royalty rate.
Cost of CapitalA breakdown of the cost of capital calculation, including risk free rates, brand debt risk premiums and the cost of equity through CAPM. Trademark Audit Analysis of the current level of protection for the brands word marks and trademark iconography highlighting areas where the marks are in need of protection.
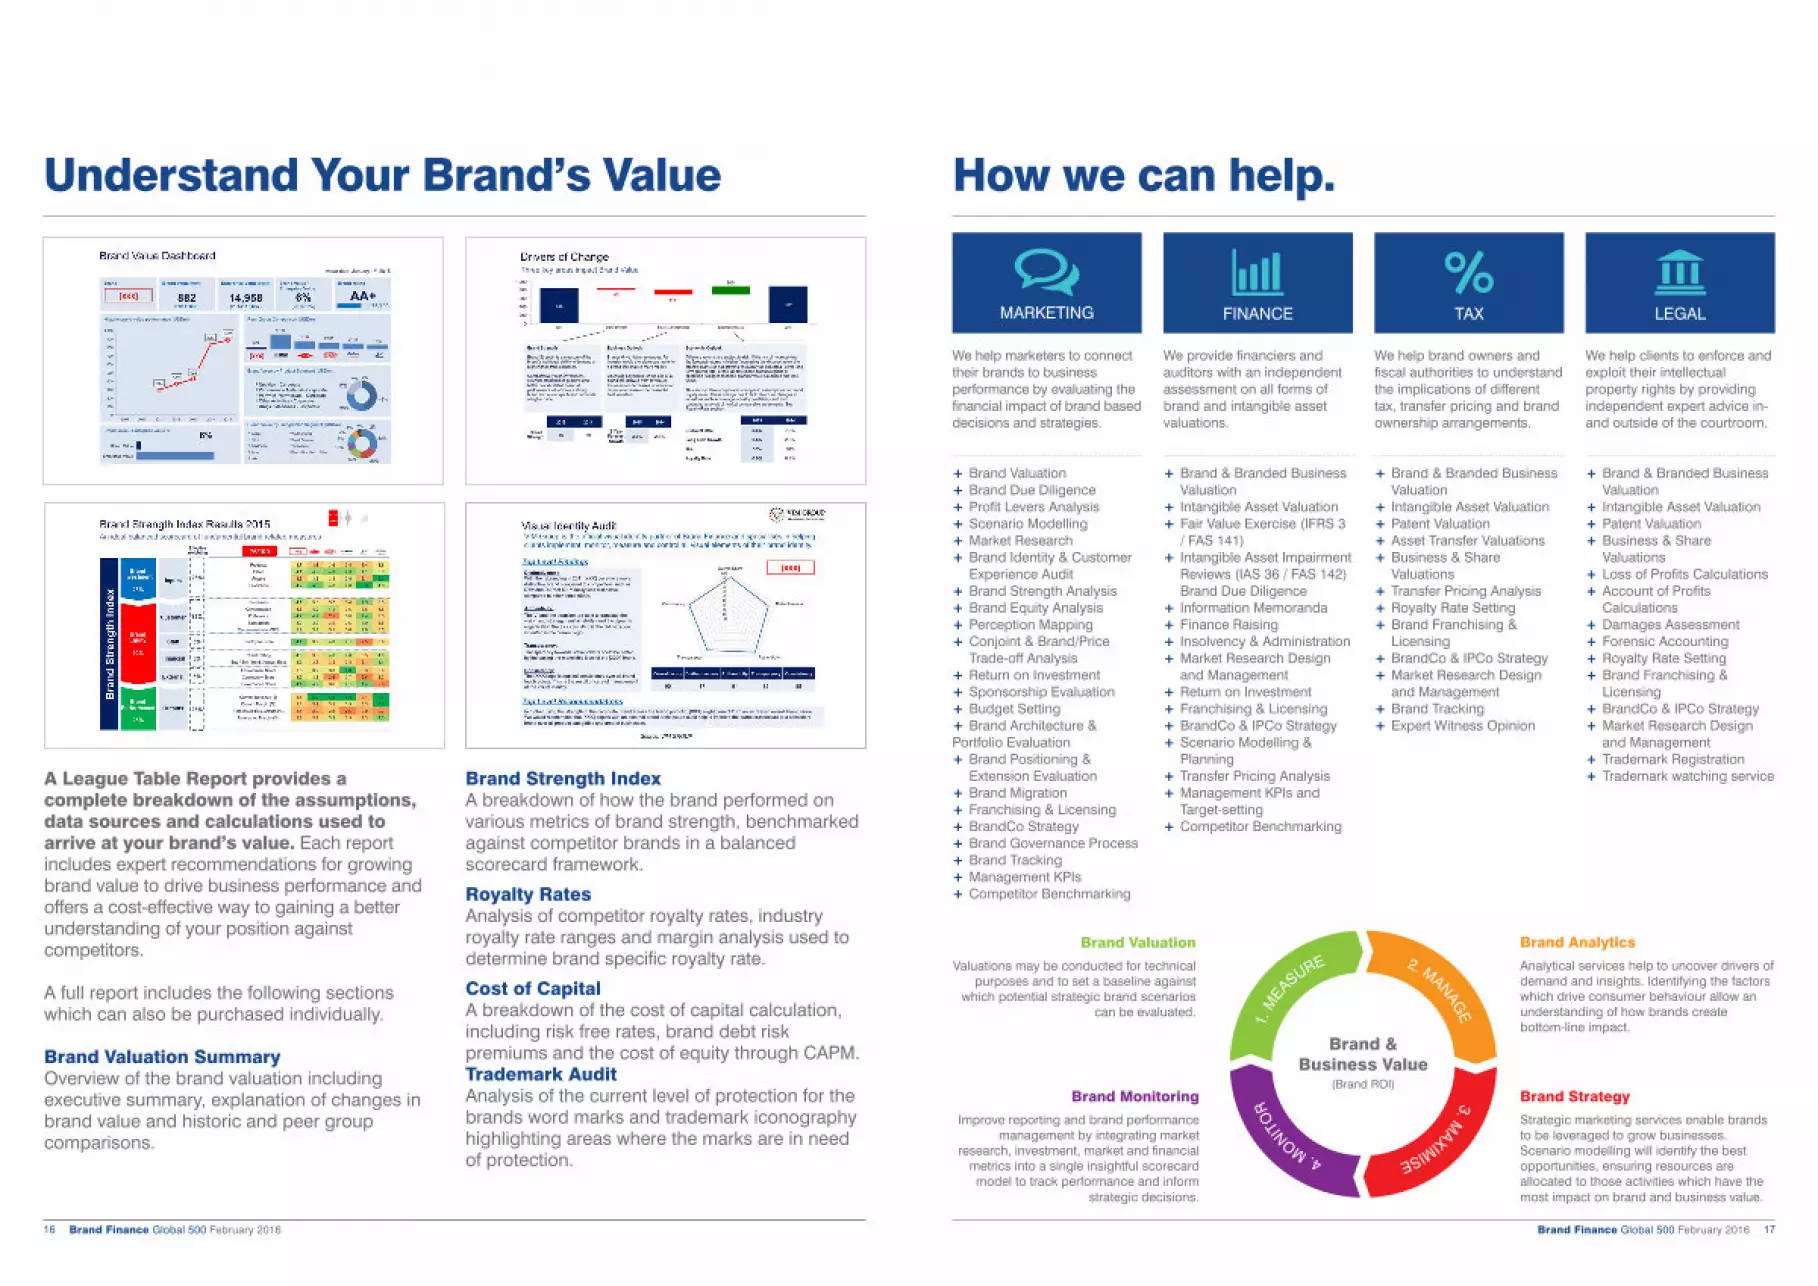
How we can help.
MARKETING FINANCE TAX LEGAL
We help marketers to connect their brands to business performance by evaluating the financial impact of brand based decisions and strategies.
+ Brand Valuation+ Brand Due Diligence+ Profit Levers Analysis+ Scenario Modelling+ Market Research+ Brand Identity & Customer
Experience Audit+ Brand Strength Analysis+ Brand Equity Analysis+ Perception Mapping+ Conjoint & Brand/Price
Trade-off Analysis+ Return on Investment+ Sponsorship Evaluation+ Budget Setting+ Brand Architecture &Portfolio Evaluation+ Brand Positioning &
Extension Evaluation+ Brand Migration+ Franchising & Licensing+ BrandCo Strategy+ Brand Governance Process+ Brand Tracking+ Management KPIs+ Competitor Benchmarking
We provide financiers and auditors with an independent assessment on all forms of brand and intangible asset valuations.
+ Brand & Branded Business Valuation
+ Intangible Asset Valuation+ Fair Value Exercise (IFRS 3
/ FAS 141)+ Intangible Asset Impairment
Reviews (IAS 36 / FAS 142) Brand Due Diligence
+ Information Memoranda+ Finance Raising+ Insolvency & Administration+ Market Research Design
and Management+ Return on Investment+ Franchising & Licensing+ BrandCo & IPCo Strategy+ Scenario Modelling &
Planning+ Transfer Pricing Analysis+ Management KPIs and
Target-setting+ Competitor Benchmarking
We help brand owners and fiscal authorities to understand the implications of different tax, transfer pricing and brand ownership arrangements.
+ Brand & Branded Business Valuation+ Intangible Asset Valuation+ Patent Valuation+ Asset Transfer Valuations+ Business & Share Valuations + Transfer Pricing Analysis + Royalty Rate Setting+ Brand Franchising & Licensing+ BrandCo & IPCo Strategy+ Market Research Design and Management+ Brand Tracking+ Expert Witness Opinion
We help clients to enforce and exploit their intellectual property rights by providing independent expert advice in- and outside of the courtroom.
+ Brand & Branded Business Valuation+ Intangible Asset Valuation+ Patent Valuation+ Business & Share Valuations + Loss of Profits Calculations+ Account of Profits Calculations + Damages Assessment+ Forensic Accounting+ Royalty Rate Setting+ Brand Franchising & Licensing+ BrandCo & IPCo Strategy+ Market Research Design and Management+ Trademark Registration+ Trademark watching service
2. MANAGE
3. MAXIMISE 4. M
ONITO
R1.
MEA
SURE
Brand Monitoring
Improve reporting and brand performance management by integrating market
research, investment, market and financial metrics into a single insightful scorecard model to track performance and inform
strategic decisions.
Brand Valuation
Valuations may be conducted for technical purposes and to set a baseline against
which potential strategic brand scenarios can be evaluated.
Brand Analytics
Analytical services help to uncover drivers of demand and insights. Identifying the factors which drive consumer behaviour allow an understanding of how brands create bottom-line impact.
Brand Strategy
Strategic marketing services enable brands to be leveraged to grow businesses. Scenario modelling will identify the best opportunities, ensuring resources are allocated to those activities which have the most impact on brand and business value.
Brand & Business Value
(Brand ROI)

Brand Finance Global 500 February 2016 19Brand Finance Global 500 February 201618
Brand Finance Global 500 – Top 100Top 500 most valuable brands 1-50. Top 500 most valuable brands 51-100.
Rank2016
Rank2015
Brand name Industry Group
Domicile Brandvalue ($m)2016
%change
Brandvalue ($m) 2015
Brandrating2016
Brandrating2015
1 1 Apple Technology US 145,918 14% 128,303 AAA AAA2 3 Google Technology US 94,184 23% 76,683 AAA+ AAA3 2 Samsung Conglomerate SOUTH KOREA 83,185 2% 81,716 AAA AAA-4 8 Amazon.com Technology Retail US 69,642 24% 56,124 AA+ AAA-5 4 Microsoft Technology US 67,258 0% 67,060 AAA AAA6 5 Verizon Telecoms US 63,116 5% 59,843 AAA- AAA-7 6 AT&T Telecoms US 59,904 2% 58,820 AA+ AA+8 7 Walmart Retail US 53,657 -5% 56,705 AA AA+9 11 China Mobile Telecoms CHINA 49,810 4% 47,916 AAA- AAA-10 15 Wells Fargo Banks US 44,170 26% 34,925 AAA- AAA-11 14 Toyota Automobiles JAPAN 43,064 23% 35,017 AAA- AAA-12 9 McDonald's Restaurants US 42,937 -19% 52,909 AAA AAA-13 10 GE Technology US 37,216 -22% 48,019 AA+ AA+14 22 ICBC Banks CHINA 36,334 32% 27,459 AA+ AA+15 27 China Construction Bank Banks CHINA 35,394 34% 26,417 AAA AAA-16 16 BMW Automobiles GERMANY 34,968 6% 33,079 AAA AAA17 12 Coca-Cola Soft Drinks US 34,180 -5% 35,797 AAA+ AAA+18 32 Facebook Technology US 34,002 41% 24,180 AAA- AAA-19 17 T (Deutsche Telekom in Germany) Telecoms GERMANY 33,194 7% 31,108 AA+ AA+20 37 Agricultural Bank Of China Banks CHINA 32,264 42% 22,714 AAA AA+21 24 Mercedes-Benz Automobiles GERMANY 32,049 17% 27,328 AAA AAA22 13 IBM Technology US 31,786 -10% 35,428 AA AA+23 23 NTT Group Conglomerate JAPAN 31,678 16% 27,376 AA AA24 20 Walt Disney Media US 31,674 3% 30,698 AAA+ AAA+25 19 Shell Oil & Gas NETHERLANDS 31,665 3% 30,716 AA+ AAA-26 34 Chase Banks US 30,603 31% 23,392 AAA- AA27 21 Marlboro Tobacco US 29,935 5% 28,608 AAA- AAA-28 31 Home Depot Retail US 28,798 18% 24,471 AAA- AA+29 33 Nike Apparel US 28,041 16% 24,138 AAA+ AAA+30 25 Vodafone Telecoms UK 27,820 2% 27,287 AA+ AA+31 46 Bank of China Banks CHINA 27,735 36% 20,392 AAA AAA-32 29 Bank of America Banks US 26,928 5% 25,713 AA AA+33 28 Citi Banks US 26,031 -1% 26,210 AA+ AA+34 38 Mitsubishi Conglomerate JAPAN 24,461 8% 22,679 AA AA35 26 HSBC Banks UK 24,174 -11% 27,280 AAA- AAA36 53 Hyundai Conglomerate SOUTH KOREA 23,691 22% 19,357 AA+ AAA-37 43 Nestlé Food SWITZERLAND 23,395 10% 21,225 AAA AAA38 50 Starbucks Restaurants US 23,185 17% 19,762 AAA- AA+39 48 CVS Caremark Retail US 22,891 13% 20,267 AA+ AA+40 30 Intel Technology US 22,845 -9% 25,011 AA+ AAA-41 36 Oracle Technology US 22,136 -3% 22,888 AA AA+42 35 PetroChina Oil & Gas CHINA 20,318 -13% 23,317 AA AA43 44 Allianz Insurance GERMANY 20,264 -3% 20,937 AA AA+44 115 CSCEC Engineering CHINA 20,214 87% 10,806 AA- AA-45 42 Sinopec Oil & Gas CHINA 20,156 -5% 21,278 AA AA46 47 Ford Automobiles US 19,771 -3% 20,315 AAA- AA+47 104 Huawei Technology CHINA 19,743 70% 11,621 AA AA48 51 UPS Logistics US 19,565 0% 19,537 AA+ AA+49 39 Honda Automobiles JAPAN 19,332 -14% 22,424 AAA- AAA-50 59 HP Technology US 19,305 7% 18,068 AA AA-
Rank2016
Rank2015
Brand name Industry Group
Domicile Brandvalue ($m)2016
%change
Brandvalue ($m) 2015
Brandrating2016
Brandrating2015
51 56 ExxonMobil Oil & Gas US 19,227 5% 18,242 AA AA+52 64 Cisco Telecoms Infrastructure US 19,162 17% 16,339 AAA- AAA-53 66 SoftBank Telecoms JAPAN 19,135 19% 16,039 AA AA54 49 Orange Telecoms FRANCE 19,096 -4% 19,867 AA+ AA+55 45 Siemens Electrical Equipment GERMANY 19,002 -7% 20,508 AA+ AA+56 41 Pepsi Soft Drinks US 18,947 -11% 21,379 AAA AAA-57 18 Volkswagen Automobiles GERMANY 18,923 -39% 31,025 AA+ AAA-58 63 PWC Commercial Services US 18,569 7% 17,330 AAA+ AAA+59 40 American Express Credit Cards US 18,483 -14% 21,567 AA+ AAA-60 65 BT Telecoms UK 18,442 14% 16,175 AAA- AAA-61 52 Axa Insurance FRANCE 18,280 -6% 19,529 AA AA62 108 Alibaba Technology / Retail CHINA 17,968 58% 11,377 AA+ AA+63 57 Chevron Oil & Gas US 17,822 -2% 18,163 AA+ AA+64 58 Nissan Automobiles JAPAN 17,785 -2% 18,085 AAA- AA+65 New Xfinity Telecoms / Media US 17,186 AA+66 55 IKEA Retail SWEDEN 17,009 -8% 18,540 AA AA-67 73 BP Oil & Gas UK 16,962 15% 14,743 AA AA68 86 Baidu Technology CHINA 16,418 24% 13,284 AAA- AA+69 81 Barclays Banks UK 16,236 14% 14,206 AA AA70 61 Mitsui Conglomerate JAPAN 16,183 -8% 17,596 AA- AA-71 75 Deloitte Commercial Services US 16,160 10% 14,694 AAA AAA72 100 NBC Media US 16,103 34% 12,004 AAA+ AAA-73 54 Santander Banks SPAIN 15,689 -16% 18,700 AA+ AAA-74 96 Bosch Engineering GERMANY 15,612 26% 12,384 AAA- AA+75 77 Fox Media US 15,541 7% 14,503 AAA- AAA-76 72 BNP Paribas Banks FRANCE 15,531 4% 14,939 AA+ AA77 74 H&M Apparel SWEDEN 15,510 5% 14,715 AA+ AA78 67 Target Retail US 15,331 0% 15,381 AA AA79 60 Johnson's Consumer Products US 15,115 -15% 17,742 AAA+ AAA+80 93 L'Oréal Conglomerate FRANCE 14,990 20% 12,480 AAA+ AAA+81 123 UnitedHealth Group Healthcare Services US 14,934 46% 10,231 AA AA82 120 China Life Insurance CHINA 14,796 43% 10,380 AAA- AA83 70 Total Oil & Gas FRANCE 14,737 -3% 15,203 AA AA84 80 ALDI Retail GERMANY 14,552 2% 14,301 AA- AA-85 69 Walgreens Health Care Facilities & US 14,315 -7% 15,345 AA AA+86 90 au Telecoms JAPAN 14,209 12% 12,677 AA AA+87 71 Boeing Aerospace & Defence US 13,956 -8% 15,199 AAA AAA88 92 Hitachi Conglomerate JAPAN 13,697 9% 12,612 A+ AA-89 68 Tata Conglomerate INDIA 13,688 -11% 15,378 A+ AA90 82 China Telecom Telecoms CHINA 13,684 -3% 14,064 AA AA+91 142 China Merchants Bank Banks CHINA 13,239 49% 8,880 AAA AAA-92 84 FedEx Logistics US 13,079 -4% 13,672 AA AA+93 101 J.P. Morgan Banks US 12,948 8% 11,958 AA- AA94 88 Lowe's Retail US 12,717 -1% 12,790 AA AA
95 110 Accenture Technology / IT Services IRELAND 12,687 14% 11,087 AA+ AA96 122 Sumitomo Conglomerate JAPAN 12,678 23% 10,269 AA- AA97 112 EY Commercial Services US 12,672 15% 10,994 AAA AAA-98 76 MUFG Banks JAPAN 12,651 -13% 14,511 AA AA99 111 Tesco Retail UK 12,499 13% 11,052 AA AA100 106 Ping An Insurance CHINA 12,428 8% 11,513 AAA- AA+
For access to all 500 brands, please get in touch:[email protected]
Brand Finance Global 500 – Top 100 For access to all 500 brands, please get in touch:

Contact us.
The World’s Leading Independent Brand Valuation and Strategy ConsultancyT: +44 (0)20 7389 9400E: [email protected] www.brandfinance.com
Bridging the gap between marketing and finance