Embed Size (px)
Citation preview
ARTICLE
Ghost of land-use past in the context of current land cover:evidence from salamander communities in streams of BlueRidge and Piedmont ecoregionsThilina Surasinghe and Robert F. Baldwin
Abstract: The Blue Ridge and Piedmont of the southeastern United States are rich in biodiversity and have undergone centuriesof extensive deforestation and subsequent urbanization resulting in geomorphic landscape changes. To investigate the impactsof past and present land uses on stream salamander communities across both ecoregions, we surveyed streams associated withdifferent land uses at the riparian zone and watershed. Using the USGS land-cover data set (2006) and aerial photographs (1940),we assessed the current and historical percent land cover (urban, agriculture, and forests) at local and landscape scales for eachsampling site. Using percent land cover as predictors and diversity indices (species richness, Simpson’s index, and relativeabundance) as response variables, we developed a stepwise multiple regression model and a redundancy analysis. Both analysesindicated the negative impacts of historical land uses, particularly row-crop agriculture, on stream salamander diversity andcommunity structure rendering streams unsuitable for all but the most tolerant species. Legacy effects were prominent in thePiedmont where protected areas with agricultural history were species-deprived (70% decline) compared with stream habitatsthat had sustained a continuous forest cover through time. Our findings suggested that landscape processes resulting inhistorical forest cover loss may persist over 50 years during forest recovery.
Key words: historical land use, amphibians, land-use legacies, urbanization, farming, stream ecosystems.
Résumé : Les régions du Blue Ridge et du Piedmont du sud-est des États-Unis ont une riche biodiversité et ont connu des sièclesde déforestation extensive suivie d’une urbanisation qui ont entraîné des modifications au paysage géomorphologique. Pourétudier les impacts des utilisations passées et actuelles des sols sur les communautés de salamandres de cours d’eau dans les deuxécorégions, nous avons examiné des cours d’eau associés a différentes utilisations des sols a l’échelle de la zone riveraine et dubassin versant. À l’aide de l’ensemble de données sur la couverture du territoire du USGS (2006) et de photographies aériennes(1940), nous avons évalué les pourcentages actuels et passés de couverture du territoire (urbaine, agricole et forestière) a l’échellelocale et du paysage pour chaque site d’échantillonnage. En utilisant les pourcentages de couverture du territoire commevariables prédictives et des indices de diversité (richesse spécifique, indice de Simpson et abondance relative) comme variablesdépendantes, nous avons mis au point un modèle de régression multiple pas a pas et procédé a une analyse de redondance. Lesdeux analyses ont fait ressortir les impacts négatifs des utilisations historiques des sols, en particulier la culture en rangs, sur ladiversité et la structure des communautés de salamandres de cours d’eau, qui rendent les cours d’eau impropres a presque toutesles espèces a l’exception des plus tolérantes. Des effets hérités étaient importants dans le Piedmont, où des zones protégées ayantdes antécédents agricoles étaient appauvries en espèces (baisse de 70 %) par rapport a des habitats lotiques qui avaient bénéficiéd’une couverture forestière continue dans le temps. Nos résultats donnent a penser que des processus géomorphologiquesdécoulant de pertes de couverture forestière par le passé pourraient persister pendant plus de 50 ans durant le rétablissementde la forêt. [Traduit par la Rédaction]
Mots-clés : utilisation passée des sols, amphibiens, caractères hérités de l’utilisation des sols, urbanisation, agriculture, écosys-tèmes lotiques.
IntroductionIncreasing human populations and their demand for natural
resources have resulted in a diverse array of transient and perma-nent land-cover transformations including farming, timber harvest,and settlements (Ellis et al. 2010). Geoclimatic processes and otherdisturbances (erosion, channel shifts, flooding, wildfire, insects anddisease, and wind storms) have substantial negative impacts on com-munity composition (Dayton 1971; Foster et al. 2003). Yet, anthropo-genic disturbances are characterized by higher recurrence intervalsand intensity, persistence, and spatial extensiveness; hence, theirimpacts compound and surpass those of “natural” disturbances(Theobald et al. 1997; Foster et al. 2003). Land-use change is a leading
cause of habitat loss and of drastic modifications in the landscapestructure of terrestrial and aquatic biomes (Ramankutty and Foley1999). Landscape alterations change habitat complexity, habitatavailability, resource distribution, microclimate, and disturbance re-gimes (Brown et al. 2005; Turner 2005). Distributions of many specieshave been shown to be influenced by both current and historicalland-cover change (Foster et al. 2002; Scott 2006). Understandingthese effects and how such effects vary in different biodiversity-richecosystems can inform conservation and restoration strategies, par-ticularly for taxa in global decline (Dobson et al. 1997).
Intensive agriculture, real-estate development, urbanization,and timber harvest are widespread land-use types that have
Received 4 January 2014. Accepted 23 April 2014.
T. Surasinghe and R.F. Baldwin. School of Agricultural, Forest, and Environmental Sciences, 261 Lehotsky Hall, Clemson University, SC 29634-0317, USA.Corresponding author: Thilina Surasinghe (e-mail: [email protected]).
527
Can. J. Zool. 92: 527–536 (2014) dx.doi.org/10.1139/cjz-2013-0307 Published at www.nrcresearchpress.com/cjz on 24 April 2014.
Can
. J. Z
ool.
Dow
nloa
ded
from
ww
w.n
rcre
sear
chpr
ess.
com
by
CL
EM
SON
UN
IVE
RSI
TY
on
05/2
7/14
For
pers
onal
use
onl
y.
resulted major changes in landscape structure and patterns ofbiodiversity in temperate deciduous North America (Houghton1994; McKinney 2002, 2008; Trombulak and Baldwin 2010). Easterntemperate mixed-deciduous forests are among the most alteredbiomes due to their suitability for agriculture, forestry, and develop-ment (Ellis et al. 2010). Many studies have shown adverse impacts ofcurrent and recent land uses on biodiversity and ecosystem services:impeded dispersal and migration, species extinctions and popula-tion declines, biotic homogenization and invasions by weedy andcosmopolitan species, reduced habitat heterogeneity, suppression ofhistorical disturbances, and low resilience and resistance to pertur-bations (Wilson 1988; McKinney and Lockwood 2001; Soberón andPeterson 2009). Further, anthropogenic land-cover types of the land-scape may impede habitat connectivity, which is a crucial element inmetacommunity and metapopulation dynamics among the regionalbiota (Watling et al. 2011; Biswas and Wagner 2012). Therefore, thelandscape matrix is critical for persistence of native biodiversity inprotected areas because habitat transformations surrounding theprotected areas could limit source–sink dynamics (DeFries et al.2010). Some research has emphasized influences of historical land-use changes on current habitat and landscape structures, soil qual-ity, vegetation dynamics, and current population status (Delcourtand Delcourt 1998; Foster et al. 1998; Harding et al. 1998; Scott et al.2002; Hicks and Pearson 2003; Brown et al. 2005; Theobald 2005;Foster 2006; Price et al. 2006; Theobald and Romme 2007). Studiespoint to effects of urbanization on stream salamanders in recentdecades, but little is known about “deeper” history, notably the pro-found agricultural transformations of the American south and itsinfluence on contemporary stream biota (Price et al. 2012).
Species responses to land uses depend on their adaptive traits,as well as dimensions of fundamental and realized niches. Varioustypes of historical land uses may induce differential environmen-tal selection forces (McKinney 2002; Vellend 2004). North Americahas a spatially diverse land-use history, with different land usesdominating at different periods of history. In the southeasternUnited States, Blue Ridge was heavily deforested in the late-19thand early-20th centuries and today has largely redeveloped treecover (Bolgiano 1998). Piedmont areas were intensively farmedwith row crops during the same period and now are dominated byurban and exurban development (Brown et al. 2005; Turner 2005).These land-cover modifications combined with high biodiversityin the southeastern United States provide an excellent opportu-nity to comparatively analyze influences of current and historicalland uses as causes of species loss and population decline (Bruce2007). Investigating the effects of land-use history on communitycomposition and regional biodiversity will yield information re-garding critical landscape factors that govern species distributionand their life and natural histories, which then can be used todefine goals for habitat management and restoration (Black et al.1998; Foster et al. 2003).
Our goal was to investigate distribution and diversity of stream-associated plethodontids (family Plethodontidae) at different his-torical and current land uses in the watershed (landscape scale)and riparian zone (local scale) across the Blue Ridge and Piedmontecoregions. Studying landscape-scale species distributions acrossdifferent ecoregions while accounting for potential environmen-tal filters that determine species distribution and abundance mayreveal impacts of land uses at different spatial and temporal scales(Olson et al. 2001; Abell et al. 2008). We focused our research onstream-dwelling plethodontids, a regionally diverse amphibiantaxon (Mitchell and Gibbons 2010). A number of studies indicatethat on-going and recent habitat transformations such as urban-ization, fragmentation, and current agriculture are responsiblefor population declines, local extinctions, limited dispersion, im-peded migration, and growth and developmental abnormalitiesamong aquatic salamanders (Barrett and Guyer 2008; Price et al.2012). However, there is a need for better understanding of currentand historical land uses on the community organization of aquatic
salamanders at a broader spatial context and a longer temporal scale.Because of the contrasting spatial and temporal land-use patterns offocal ecoregions, we hypothesized historical land uses at bothriparian and watershed scales would have a strong influence onplethodontid diversity of the Piedmont, while current land uses be-ing most substantial in the Blue Ridge at both spatial scales. We alsopredicted that agriculture and urban development would be themost influential historical and current land-cover types, respectively,whereas forest cover would be an equally important determinant inboth historical and current land uses. Our specific objectives were to(1) comparatively assess the impacts of historical and current land-use conditions at riparian (local) and watershed (landscape) scales onplethodontid diversity and (2) determine different current and his-torical land-cover features that elicit species-specific responses andinfluence community structure of stream salamanders.
Materials and methods
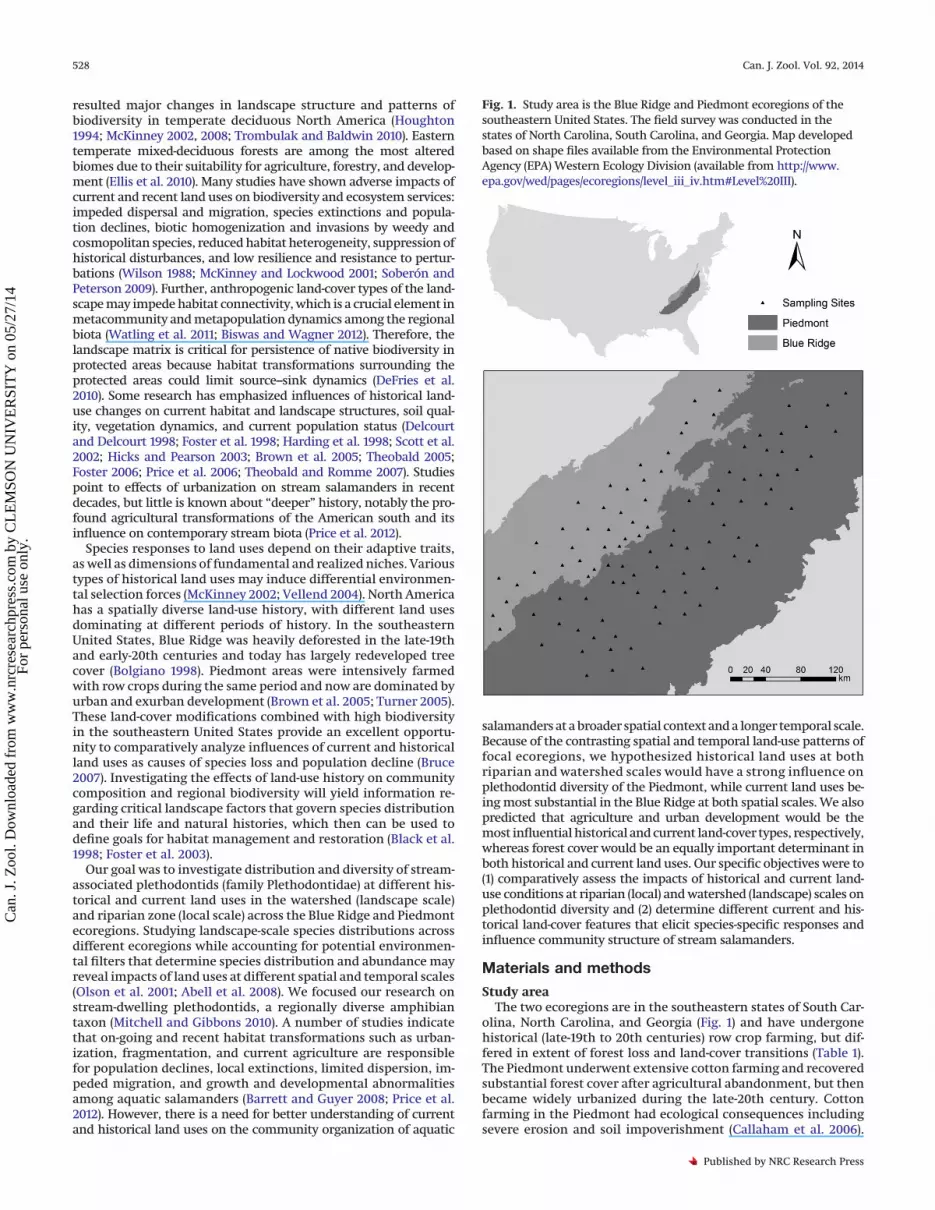
Study areaThe two ecoregions are in the southeastern states of South Car-
olina, North Carolina, and Georgia (Fig. 1) and have undergonehistorical (late-19th to 20th centuries) row crop farming, but dif-fered in extent of forest loss and land-cover transitions (Table 1).The Piedmont underwent extensive cotton farming and recoveredsubstantial forest cover after agricultural abandonment, but thenbecame widely urbanized during the late-20th century. Cottonfarming in the Piedmont had ecological consequences includingsevere erosion and soil impoverishment (Callaham et al. 2006).
Fig. 1. Study area is the Blue Ridge and Piedmont ecoregions of thesoutheastern United States. The field survey was conducted in thestates of North Carolina, South Carolina, and Georgia. Map developedbased on shape files available from the Environmental ProtectionAgency (EPA) Western Ecology Division (available from http://www.epa.gov/wed/pages/ecoregions/level_iii_iv.htm#Level%20III).
528 Can. J. Zool. Vol. 92, 2014
Published by NRC Research Press
Can
. J. Z
ool.
Dow
nloa
ded
from
ww
w.n
rcre
sear
chpr
ess.
com
by
CL
EM
SON
UN
IVE
RSI
TY
on
05/2
7/14
For
pers
onal
use
onl
y.
The Blue Ridge was widely deforested for timber harvest and lo-calized farming during the late-19th and early-20th centuries;row-crop agriculture was most common in coves, with slopes re-maining forested or with partially open rough pasture. Followingthe abandonment of many farms and institution of rigorous for-est management, the Blue Ridge largely regained forest cover(Wear 2002; Jackson et al. 2005; Galang et al. 2007). The Piedmont(elevation 300–600 m; annual rainfall 1300 mm; winter and sum-mer temperatures 4 and 25 °C, respectively) consists of irregularplains and low hills; mixed mesic – dry deciduous – evergreenforests dominated by oak–hickory–pine forests; and moderate-gradient streams with cobble–gravel substrates (US EnvironmentalProtection Agency 2002). The Blue Ridge (elevation 600–1600 m; an-nual rainfall 1600 mm; winter and summer temperatures 0.56 and22 °C, respectively) is characterized by steep slopes and narrow val-leys; enriched headwater streams with a high channel gradient andbedrock and boulder-laden substrates; and montane mesic forests dom-inated by oak–hickory communities (US Environmental ProtectionAgency 2002). Both ecoregions have a rich diversity of amphibians(≈100 species of salamanders and ≈40 species of anurans), particu-larly aquatic and semiaquatic salamanders (Dorcas and Gibbons2008; Mitchell and Gibbons 2010).
Field surveyWe surveyed 35 and 66 stream reaches within the Blue Ridge
and Piedmont, respectively. Sampling reaches were randomly dis-tributed and stratified by ecoregion area. Since Piedmont is approx-imately 2.5 times more spatially extensive than the Blue Ridge, wesurveyed more sites at the former. We sampled watersheds <25 km2.We used a VisualBasic query to select spatially independent sam-pling points (South Carolina Department of Natural Resources; Arc-GIS version 10, ESRI (Environmental Systems Research Institute),Inc., Redlands, California, USA). The algorithm cross-examined allpotential sampling sites located within the same drainage for spatialautocorrelation (Mitchell and Gibbons 2010). At all sites, we surveyeda 100 m stream segment including the channel and 1 m of the streambanks. All surveys were diurnal (0800–1800) and conducted duringmid-spring to mid-summer (April–July) for two consecutive years(2010–2011). We actively searched the stream channel, undercutbanks, and stream banks; overturned movable rocks and woody de-bris; searched through gravel, cobbles, pebbles, and leaf litter; andcaptured salamanders using bottom set-nets and aquarium nets. Ateach site, we did three passes during each visit to increase detectabil-ity of salamanders (Heyer et al. 1994; Dodd 2010). All captured sala-manders were identified to species level using field guides and keys(Petranka 1998; Mitchell and Gibbons 2010), and released back to thesite of capture. The relative abundance of all captured species wasalso recorded as the total number of individuals caught at each site.We excluded point endemics from analyses because distribution ofthese species might be limited by biophysical filters.
Statistical and geospatial analysesWe assessed current land-use status from the “National Land
Cover Database 2006” (US Geological Survey (USGS) Land CoverInstitute; available from http://landcover.usgs.gov) and historicalland use from aerial photographs from the year 1940 (USGS EarthResources Observation and Science Center), which we georefer-enced and joined in mosaics. We used a total of ≈600 photographs;5–6 images were used per sampling location to increase the accu-racy of historical land-cover classification. Historical images var-ied in quality, and by using several per site, we were able toimprove the validity of our classifications. Photos were inter-preted manually for land uses, based on Anderson Level I system(urban, agriculture including rangelands, forests, open water,wetlands, and barren lands) (Anderson 1976). ArcEditor was usedto delineate land-use polygons that were converted to raster for-mat for subsequent analysis. We quantified percentage of eachland-use type at two spatial scales: (1) local scale (i.e., 500 m ripar-ian zone from the wet channel) and (2) landscape scale (i.e., wa-tershed area delineated based on the USGS National ElevationDataset (1/3 arc-seconds; available from http://ned.usgs.gov/), us-ing the hydrology toolbox). We calculated Simpson’s index (SI)and species richness as indicators of species diversity for the sam-pling sites. SI combines number of species present with relativeabundance, indicates evenness of species distribution, and is leastsensitive to sample size and variability of species richness acrossdifferent communities (Krebs 1999).
We ran factor analyses (FA) with Varimax rotation via the prin-cipal component method for percent land uses separately at eachspatial and temporal scale (Table 2). FA is an eigenvector-basedmultivariate technique that reduces interrelated predictor vari-ables into fundamental variables (i.e., factors) that concentratethe dispersed information of the original data set into an under-lying pattern (McCune et al. 2002). Based on a total of six originalland-use variables, we derived five factors from which we ex-tracted factors that explain more than 80% of the variability inpercent historical and current land uses within watersheds andriparian zones. Depending on the eigenvalues, we named eachfactor with respect to the land-use variables that best representedeach factor. Afterward, we ran a stepwise multiple regression (� =0.05, mixed model method of forward selection and backwardelimination) where species richness and SI were considered re-sponse variables and factors selected (a total of eight) were con-sidered predictor variables. A total of 56 models were tested withmaximum of eight predictor variables in each model. The predic-tor variables of the optimal model that carried the lowest Akaike’sinformation criterion (AIC) score and underscored all the othermodels (�AIC > 10) were chosen to explain the mechanisms driv-ing the diversity of salamanders with respect to historical andcurrent land uses.
To assess how individual species respond to different historicaland current land uses, we ran a redundancy analysis (RDA). RDA isan ordination technique based on a direct gradient analysis that
Table 1. Historical (1940) and current (2006) land-use and land-cover status of the Blue Ridgeand Piedmont ecoregions of three state of the southeastern United States (North Carolina,South Carolina, and Georgia).
Blue Ridge Piedmont
TypeCurrent landuse (%)
Historical landuse (%)
Current landuse (%)
Historical landuse (%)
Developed 6.57 2.3 14.36 10Barren land 0.12 0 0.43 0Forests 83.50 72 56.01 20Grasslands 1.28 0.1 6.72 0Croplands and pastures 7.53 25 17.77 70Wetlands 0.12 0.1 2.25 0Open water 0.88 0.5 2.46 2
Surasinghe and Baldwin 529
Published by NRC Research Press
Can
. J. Z
ool.
Dow
nloa
ded
from
ww
w.n
rcre
sear
chpr
ess.
com
by
CL
EM
SON
UN
IVE
RSI
TY
on
05/2
7/14
For
pers
onal
use
onl
y.
relate community composition to environmental or other explan-atory variables (Llopiz and Cowen 2009). We adopted this multi-variate statistical approach to include relative abundance ofeach species as multiple response variables elicited by landuses. Furthermore, use of original land-use variables enabled usto develop an ecologically meaningful correspondence be-tween individual land-use and land-cover types and the habitatassociation of individual species. Using Pearson’s correlation, wetested for assumption of linear relationship between response andpredictor variables, as well as the multicollinearity among land-usedata. Only the land-use variables with low multicollinearity (R2 ≤0.5) were used for the RDA. Abundance data were square-root-transformed to reach multivariate normality. We ordinated thespecies matrix by reciprocal averaging, and constrained the speciesmatrix by multiple linear regressions on the land-use variables. Wecentered axis scores and standardized them to unit variance andoptimized species scores for axis scaling. We constructed separateordination plots for each ecoregion using the two constrained RDAaxes that accounted for the greatest variability based on the eigen-values, and we used percent current and historical land uses asenvironmental vectors. We performed a Monte Carlo permuta-tion test (500 iterations, � = 0.05) to assess whether the relationshipsderived between land-use factors and abundance of individual spe-cies were random. We used JMP Pro version 10.0 (SAS Institute Inc.,Cary, North Carolina, USA) and R version 3.0 (R Core Team, Vienna,Austria; available from http://www.r-project.org/) for statistical anal-yses and ArcGIS version 10.0 for geospatial analyses.
We employed a multivariate approach in our analyses becausethese tests enable the optimal usage of the original data set. Forinstance, FA investigates the joint relationships among intercorre-lated variables, whereas RDA analyzes and ordinates the relationshipbetween multiple response and predictor variables simultaneously(McCune et al. 2002). The factors derived through FA represents bothcommunalities and uniqueness among the original variables, andhence, can be interpreted as ecologically meaningful compoundvariables with respect to the original variables and can be used toconstruct descriptive models (James and McCulloch 1990; Riitterset al. 1995; Wayland et al. 2003). The RDA is an ordination methodused to interpret the association between species abundance andcommunity assembly composition with environmental variables(Allen et al. 2006; Llopiz and Cowen 2009; Howard et al. 2012) wherethe species data are analyzed as a multivariate regression-typefunction of the ordination axes that are linearly constrained by
the environmental predictor variables. Being a canonical ordinationmethod, RDA underscores the predictor variables that influence spe-cies data while neglecting other variables that do not affect speciesdata (ter Braak 1986, 1994; ter Braak and Verdonschot 1995).
ResultsWe found 11 species (four genera) of stream-associated plethodon-
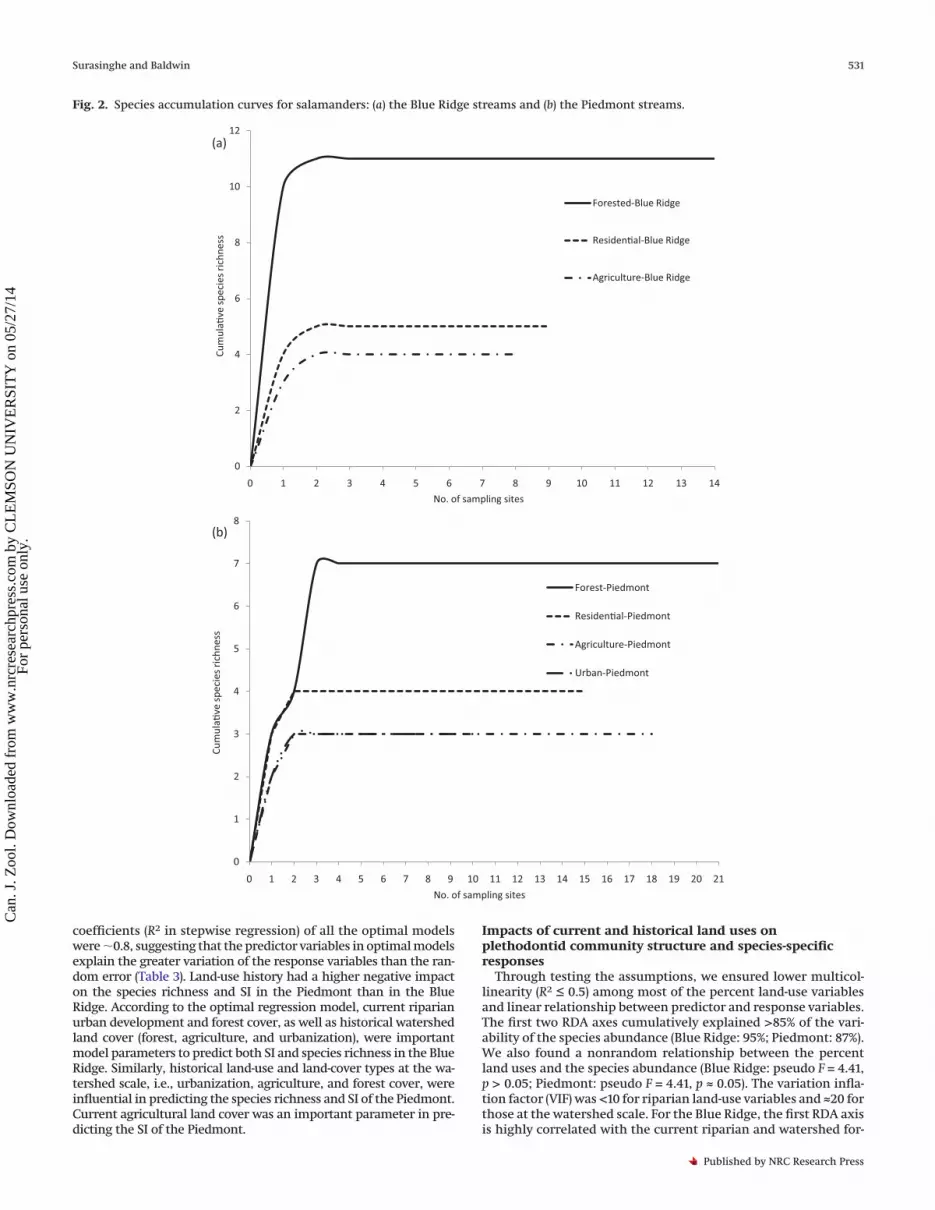
tids in our field survey: Desmognathus fuscus (Rafinesque, 1820) (North-ern Dusky Salamander), Desmognathus marmoratus (Moore, 1899)(Shovel-nosed Salamander), Desmognathus monticola Dunn, 1916 (SealSalamander), Desmognathus ocoee Nicholls, 1949 (Ocoee Salamander),Desmognathus quadramaculatus (Holbrook, 1840) (Black-bellied Sala-mander), Eurycea cirrigera (Green, 1831) (Southern Two-lined Salaman-der), Eurycea guttolineata (Holbrook, 1838) (Three-lined Salamander),Eurycea wilderae Dunn, 1920 (Blue Ridge Two-lined Salamander),Pseudotriton ruber (Sonnini de Manoncourt and Latreille, 1801) (RedSalamander), Pseudotriton montanus Baird, 1850 (Mud Salamander),and Gyrinophilus porphyriticus (Green, 1827) (Spring Salamander). Allthe above species were recorded in the Blue Ridge, whereas onlyseven were found in the Piedmont (D. fuscus, D. quadramaculatus,E. cirrigera, E. guttolineata, P. ruber, P. montanus, and G. porphyriticus).Species accumulation curves (Figs. 2a, 2b) suggested high detectabil-ity of species across multiple sites.
Impacts of current and historical land uses on the diversityof plethodontids
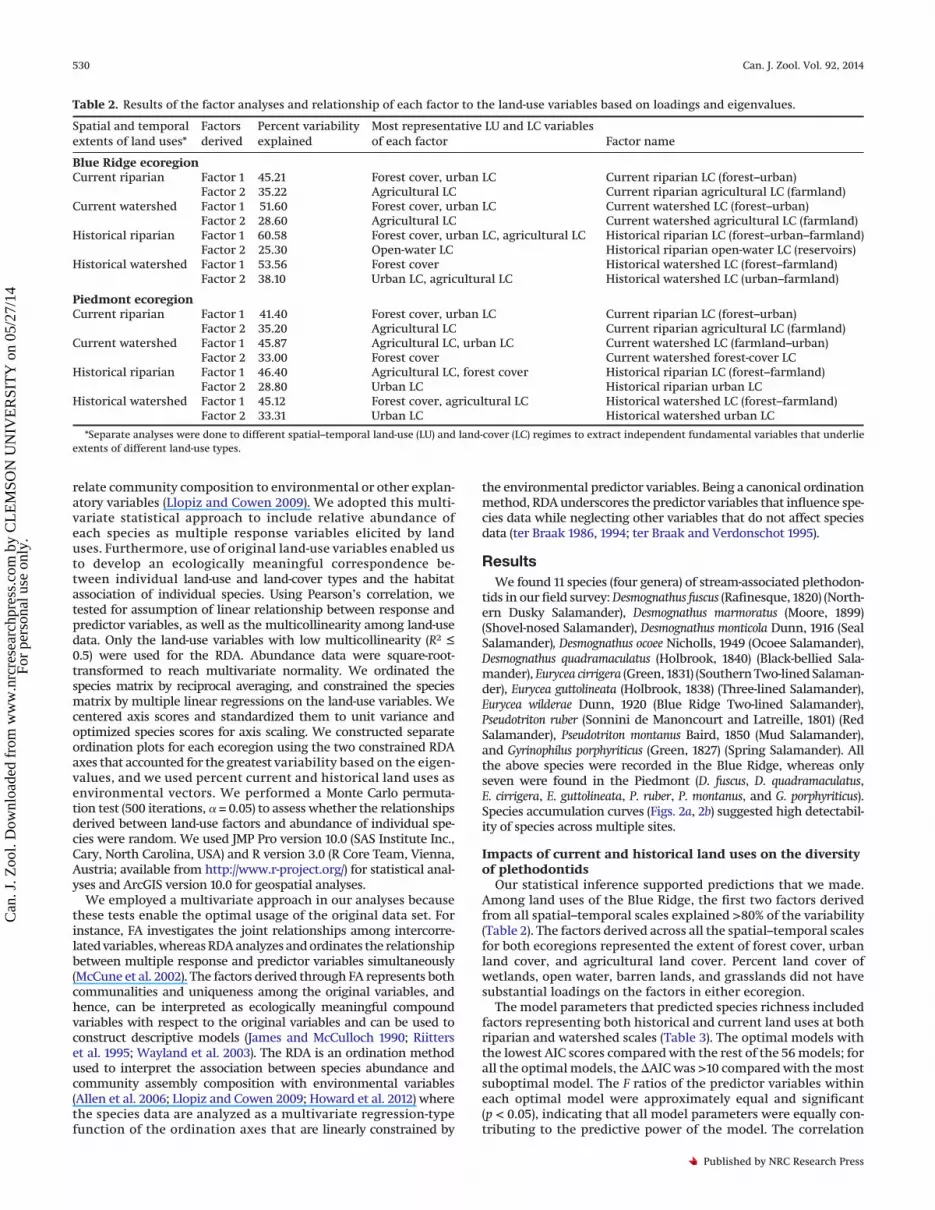
Our statistical inference supported predictions that we made.Among land uses of the Blue Ridge, the first two factors derivedfrom all spatial–temporal scales explained >80% of the variability(Table 2). The factors derived across all the spatial–temporal scalesfor both ecoregions represented the extent of forest cover, urbanland cover, and agricultural land cover. Percent land cover ofwetlands, open water, barren lands, and grasslands did not havesubstantial loadings on the factors in either ecoregion.
The model parameters that predicted species richness includedfactors representing both historical and current land uses at bothriparian and watershed scales (Table 3). The optimal models withthe lowest AIC scores compared with the rest of the 56 models; forall the optimal models, the �AIC was >10 compared with the mostsuboptimal model. The F ratios of the predictor variables withineach optimal model were approximately equal and significant(p < 0.05), indicating that all model parameters were equally con-tributing to the predictive power of the model. The correlation
Table 2. Results of the factor analyses and relationship of each factor to the land-use variables based on loadings and eigenvalues.
Spatial and temporalextents of land uses*
Factorsderived
Percent variabilityexplained
Most representative LU and LC variablesof each factor Factor name
Blue Ridge ecoregionCurrent riparian Factor 1 45.21 Forest cover, urban LC Current riparian LC (forest–urban)
Factor 2 35.22 Agricultural LC Current riparian agricultural LC (farmland)Current watershed Factor 1 51.60 Forest cover, urban LC Current watershed LC (forest–urban)
Factor 2 28.60 Agricultural LC Current watershed agricultural LC (farmland)Historical riparian Factor 1 60.58 Forest cover, urban LC, agricultural LC Historical riparian LC (forest–urban–farmland)
Factor 2 25.30 Open-water LC Historical riparian open-water LC (reservoirs)Historical watershed Factor 1 53.56 Forest cover Historical watershed LC (forest–farmland)
Factor 2 38.10 Urban LC, agricultural LC Historical watershed LC (urban–farmland)
Piedmont ecoregionCurrent riparian Factor 1 41.40 Forest cover, urban LC Current riparian LC (forest–urban)
Factor 2 35.20 Agricultural LC Current riparian agricultural LC (farmland)Current watershed Factor 1 45.87 Agricultural LC, urban LC Current watershed LC (farmland–urban)
Factor 2 33.00 Forest cover Current watershed forest-cover LCHistorical riparian Factor 1 46.40 Agricultural LC, forest cover Historical riparian LC (forest–farmland)
Factor 2 28.80 Urban LC Historical riparian urban LCHistorical watershed Factor 1 45.12 Forest cover, agricultural LC Historical watershed LC (forest–farmland)
Factor 2 33.31 Urban LC Historical watershed urban LC
*Separate analyses were done to different spatial–temporal land-use (LU) and land-cover (LC) regimes to extract independent fundamental variables that underlieextents of different land-use types.
530 Can. J. Zool. Vol. 92, 2014
Published by NRC Research Press
Can
. J. Z
ool.
Dow
nloa
ded
from
ww
w.n
rcre
sear
chpr
ess.
com
by
CL
EM
SON
UN
IVE
RSI
TY
on
05/2
7/14
For
pers
onal
use
onl
y.
coefficients (R2 in stepwise regression) of all the optimal modelswere �0.8, suggesting that the predictor variables in optimal modelsexplain the greater variation of the response variables than the ran-dom error (Table 3). Land-use history had a higher negative impacton the species richness and SI in the Piedmont than in the BlueRidge. According to the optimal regression model, current riparianurban development and forest cover, as well as historical watershedland cover (forest, agriculture, and urbanization), were importantmodel parameters to predict both SI and species richness in the BlueRidge. Similarly, historical land-use and land-cover types at the wa-tershed scale, i.e., urbanization, agriculture, and forest cover, wereinfluential in predicting the species richness and SI of the Piedmont.Current agricultural land cover was an important parameter in pre-dicting the SI of the Piedmont.
Impacts of current and historical land uses onplethodontid community structure and species-specificresponses
Through testing the assumptions, we ensured lower multicol-linearity (R2 ≤ 0.5) among most of the percent land-use variablesand linear relationship between predictor and response variables.The first two RDA axes cumulatively explained >85% of the vari-ability of the species abundance (Blue Ridge: 95%; Piedmont: 87%).We also found a nonrandom relationship between the percentland uses and the species abundance (Blue Ridge: pseudo F = 4.41,p > 0.05; Piedmont: pseudo F = 4.41, p ≈ 0.05). The variation infla-tion factor (VIF) was <10 for riparian land-use variables and ≈20 forthose at the watershed scale. For the Blue Ridge, the first RDA axisis highly correlated with the current riparian and watershed for-
Fig. 2. Species accumulation curves for salamanders: (a) the Blue Ridge streams and (b) the Piedmont streams.
0
2
4
6
8
10
12
0 1 2 3 4 5 6 7 8 9 10 11 12 13 14
Cum
ula�
ve s
peci
es ri
chne
ss
No. of sampling sites
Forested-Blue Ridge
Residen�al-Blue Ridge
Agriculture-Blue Ridge
(a)
0
1
2
3
4
5
6
7
8
0 1 2 3 4 5 6 7 8 9 10 11 12 13 14 15 16 17 18 19 20 21
Cum
ula�
ve s
peci
es ri
chne
ss
No. of sampling sites
Forest-Piedmont
Residen�al-Piedmont
Agriculture-Piedmont
Urban-Piedmont
(b)
Surasinghe and Baldwin 531
Published by NRC Research Press
Can
. J. Z
ool.
Dow
nloa
ded
from
ww
w.n
rcre
sear
chpr
ess.
com
by
CL
EM
SON
UN
IVE
RSI
TY
on
05/2
7/14
For
pers
onal
use
onl
y.
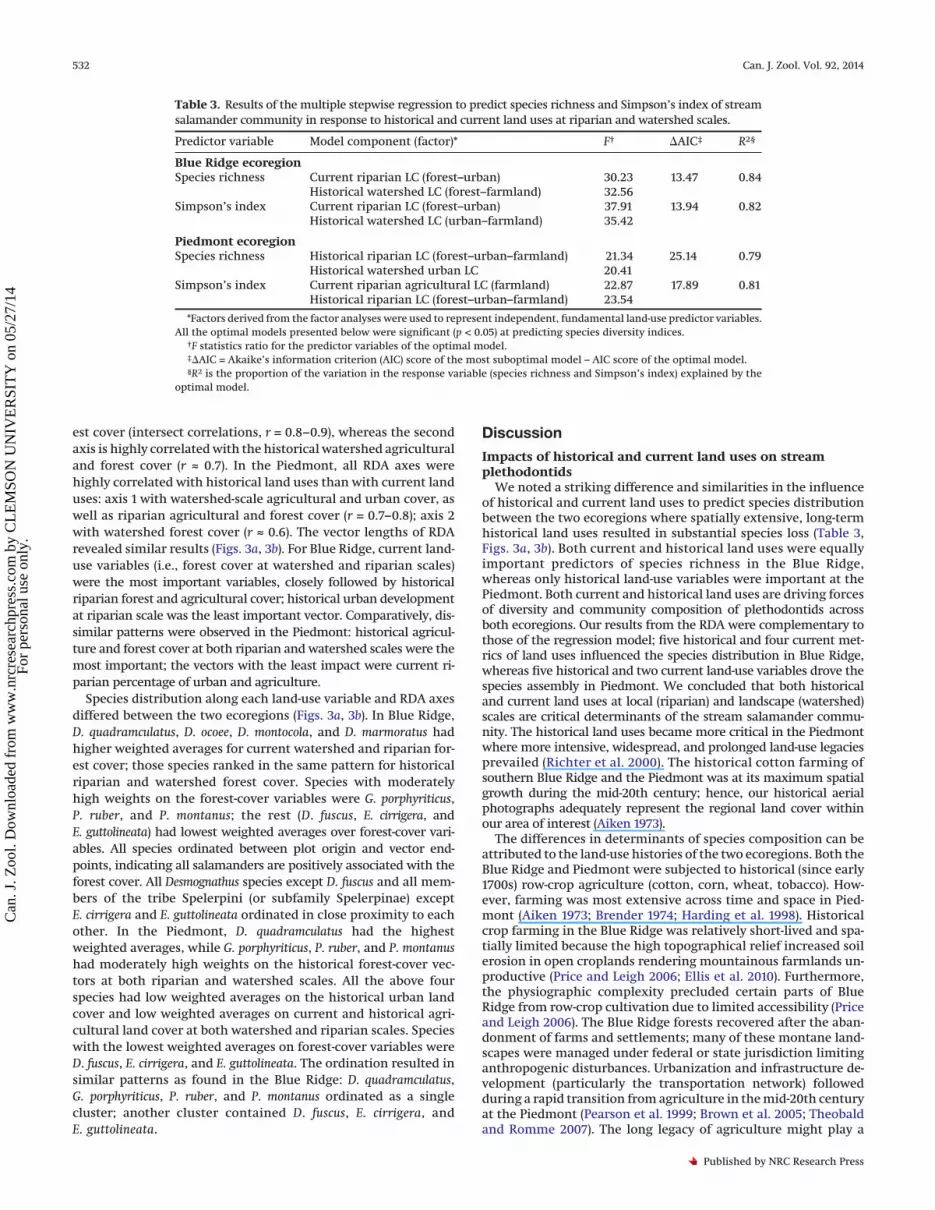
est cover (intersect correlations, r = 0.8–0.9), whereas the secondaxis is highly correlated with the historical watershed agriculturaland forest cover (r ≈ 0.7). In the Piedmont, all RDA axes werehighly correlated with historical land uses than with current landuses: axis 1 with watershed-scale agricultural and urban cover, aswell as riparian agricultural and forest cover (r = 0.7–0.8); axis 2with watershed forest cover (r ≈ 0.6). The vector lengths of RDArevealed similar results (Figs. 3a, 3b). For Blue Ridge, current land-use variables (i.e., forest cover at watershed and riparian scales)were the most important variables, closely followed by historicalriparian forest and agricultural cover; historical urban developmentat riparian scale was the least important vector. Comparatively, dis-similar patterns were observed in the Piedmont: historical agricul-ture and forest cover at both riparian and watershed scales were themost important; the vectors with the least impact were current ri-parian percentage of urban and agriculture.
Species distribution along each land-use variable and RDA axesdiffered between the two ecoregions (Figs. 3a, 3b). In Blue Ridge,D. quadramculatus, D. ocoee, D. montocola, and D. marmoratus hadhigher weighted averages for current watershed and riparian for-est cover; those species ranked in the same pattern for historicalriparian and watershed forest cover. Species with moderatelyhigh weights on the forest-cover variables were G. porphyriticus,P. ruber, and P. montanus; the rest (D. fuscus, E. cirrigera, andE. guttolineata) had lowest weighted averages over forest-cover vari-ables. All species ordinated between plot origin and vector end-points, indicating all salamanders are positively associated with theforest cover. All Desmognathus species except D. fuscus and all mem-bers of the tribe Spelerpini (or subfamily Spelerpinae) exceptE. cirrigera and E. guttolineata ordinated in close proximity to eachother. In the Piedmont, D. quadramculatus had the highestweighted averages, while G. porphyriticus, P. ruber, and P. montanushad moderately high weights on the historical forest-cover vec-tors at both riparian and watershed scales. All the above fourspecies had low weighted averages on the historical urban landcover and low weighted averages on current and historical agri-cultural land cover at both watershed and riparian scales. Specieswith the lowest weighted averages on forest-cover variables wereD. fuscus, E. cirrigera, and E. guttolineata. The ordination resulted insimilar patterns as found in the Blue Ridge: D. quadramculatus,G. porphyriticus, P. ruber, and P. montanus ordinated as a singlecluster; another cluster contained D. fuscus, E. cirrigera, andE. guttolineata.
Discussion
Impacts of historical and current land uses on streamplethodontids
We noted a striking difference and similarities in the influenceof historical and current land uses to predict species distributionbetween the two ecoregions where spatially extensive, long-termhistorical land uses resulted in substantial species loss (Table 3,Figs. 3a, 3b). Both current and historical land uses were equallyimportant predictors of species richness in the Blue Ridge,whereas only historical land-use variables were important at thePiedmont. Both current and historical land uses are driving forcesof diversity and community composition of plethodontids acrossboth ecoregions. Our results from the RDA were complementary tothose of the regression model; five historical and four current met-rics of land uses influenced the species distribution in Blue Ridge,whereas five historical and two current land-use variables drove thespecies assembly in Piedmont. We concluded that both historicaland current land uses at local (riparian) and landscape (watershed)scales are critical determinants of the stream salamander commu-nity. The historical land uses became more critical in the Piedmontwhere more intensive, widespread, and prolonged land-use legaciesprevailed (Richter et al. 2000). The historical cotton farming ofsouthern Blue Ridge and the Piedmont was at its maximum spatialgrowth during the mid-20th century; hence, our historical aerialphotographs adequately represent the regional land cover withinour area of interest (Aiken 1973).
The differences in determinants of species composition can beattributed to the land-use histories of the two ecoregions. Both theBlue Ridge and Piedmont were subjected to historical (since early1700s) row-crop agriculture (cotton, corn, wheat, tobacco). How-ever, farming was most extensive across time and space in Pied-mont (Aiken 1973; Brender 1974; Harding et al. 1998). Historicalcrop farming in the Blue Ridge was relatively short-lived and spa-tially limited because the high topographical relief increased soilerosion in open croplands rendering mountainous farmlands un-productive (Price and Leigh 2006; Ellis et al. 2010). Furthermore,the physiographic complexity precluded certain parts of BlueRidge from row-crop cultivation due to limited accessibility (Priceand Leigh 2006). The Blue Ridge forests recovered after the aban-donment of farms and settlements; many of these montane land-scapes were managed under federal or state jurisdiction limitinganthropogenic disturbances. Urbanization and infrastructure de-velopment (particularly the transportation network) followedduring a rapid transition from agriculture in the mid-20th centuryat the Piedmont (Pearson et al. 1999; Brown et al. 2005; Theobaldand Romme 2007). The long legacy of agriculture might play a
Table 3. Results of the multiple stepwise regression to predict species richness and Simpson’s index of streamsalamander community in response to historical and current land uses at riparian and watershed scales.
Predictor variable Model component (factor)* F† �AIC‡ R2§
Blue Ridge ecoregionSpecies richness Current riparian LC (forest–urban) 30.23 13.47 0.84
Historical watershed LC (forest–farmland) 32.56Simpson’s index Current riparian LC (forest–urban) 37.91 13.94 0.82
Historical watershed LC (urban–farmland) 35.42
Piedmont ecoregionSpecies richness Historical riparian LC (forest–urban–farmland) 21.34 25.14 0.79
Historical watershed urban LC 20.41Simpson’s index Current riparian agricultural LC (farmland) 22.87 17.89 0.81
Historical riparian LC (forest–urban–farmland) 23.54
*Factors derived from the factor analyses were used to represent independent, fundamental land-use predictor variables.All the optimal models presented below were significant (p < 0.05) at predicting species diversity indices.
†F statistics ratio for the predictor variables of the optimal model.‡�AIC = Akaike’s information criterion (AIC) score of the most suboptimal model – AIC score of the optimal model.§R2 is the proportion of the variation in the response variable (species richness and Simpson’s index) explained by the
optimal model.
532 Can. J. Zool. Vol. 92, 2014
Published by NRC Research Press
Can
. J. Z
ool.
Dow
nloa
ded
from
ww
w.n
rcre
sear
chpr
ess.
com
by
CL
EM
SON
UN
IVE
RSI
TY
on
05/2
7/14
For
pers
onal
use
onl
y.
larger role in structuring the current species richness and com-munity composition of stream salamanders in the Piedmont. Spe-cies richness in Blue Ridge streams were driven by both currentand historical land uses, probably indicating the mixed effects of
relatively brief episodic disturbances, fast rebound of forests, andconservation efforts (Boring et al. 1981; Price and Leigh 2006). Wenoted that predictors of Piedmont SI were limited to riparian landuses. This shows that riparian land uses can result in a greater nega-
Fig. 3. Ordination plots for redundancy analyses (RDA) for (a) Blue Ridge and (b) Piedmont. Vectors represent percent historical andcurrent land use and land cover at riparian and watershed scales. The name of the vector is labelled at the arrowhead. Species scores arelabeled with species names. Legend for adult salamander species: Ecirr, E. cirrigera; Eglut, E. guttolineata; Ewildr, E. wilderae; Dfus, D. fuscus;Dmont, D. monticola; Dmarm, D. marmoratus; Doco, D. ocoee; Dquad, D. quadramaculatus; Purub, P. ruber; Pmon, P. montanus; Gprop: G. porphyriticus.Land-use legend: Hist, historical; Cur, current; rip, riparian; whd, watershed; for, forested; ag, agricultural; for, forest; ubn, urban.
Surasinghe and Baldwin 533
Published by NRC Research Press
Can
. J. Z
ool.
Dow
nloa
ded
from
ww
w.n
rcre
sear
chpr
ess.
com
by
CL
EM
SON
UN
IVE
RSI
TY
on
05/2
7/14
For
pers
onal
use
onl
y.
tive impact than those at the watershed scale. Furthermore, buffer-ing functions of riparian forests could mitigate disturbances inducedby watershed-wide deforestation. High diversity of aquatic faunahave been observed in stream habitats receiving protection fromriparian forests despite high extents of surface imperviousness andoverall deforestation in the watershed (Semlitsch and Bodie 2003;Moore and Palmer 2005; Crawford and Semlitsch 2007).
Our observations on altered community composition amongstream salamanders in response to reduced forest cover can beattributed to lasting aftermaths of land transformations. Agricul-ture and urbanization across local and landscape scales result inloss of forest cover and vegetation complexity, increased impervi-ous surfaces, channelization, impoundments, and altered matterand energy dynamics; such adverse impacts ultimately lead tomodifications in biological, chemical, and physical processes instream ecosystems (Angermeier 2000; Baron et al. 2002; Scott et al.2002). Deforestation in the riparian zone leads to upland erosionand sedimentation that reduce the interstitial habitats due tosubstrate embedment (Baron et al. 2002). In addition, loss of ripar-ian canopy intersection modifies the thermal regimes endanger-ing temperature-sensitive stream biota (Barrett and Guyer 2008).Landscape modifications, such as increased urban imperviouscover, result in increased overland flow and consequent heighteningin the stream discharge leading to channel incision and streamaggradation (Ambers et al. 2006; Gardiner et al. 2009). Riparian for-ests serve as the immediate source of allochthonous organic matteras woody debris while regulating the flux of nutrients and organicpollutants through surface runoff; therefore, loss of streamside veg-etation can imperil the stream productivity and increase nonpointsource pollution (Moore and Palmer 2005; Dudgeon et al. 2006).
Impacts arising from local- and landscape-scale land uses can lastin stream habitats even after the recovery of natural land cover lead-ing to biotic homogenization (Scott et al. 2002; Scott 2006). Species-poor streams that are currently forested with agriculture-basedland-use legacies, particularly those of Piedmont, may be still recov-ering in terms of microhabitat structure and stream geomorphology.Historically impacted watersheds in the southeastern United Statesshowing fine streambed sediments, higher bank-full discharge alter-nating with lowered baseflow, and presence of eroded gullies vali-date our assertion of lasting land-use legacies (Jackson et al. 2005;Ambers et al. 2006; Price and Leigh 2006). It may take 75–100 years forPiedmont watersheds to stabilize soil erosion and to export the cur-rent sediment load (Trimble 1974; Ambers et al. 2006) and muchlonger for species to recolonize and reach stable populations(Detenbeck et al. 1992; Petranka et al. 1993; Hicks and Pearson 2003).Furthermore, current urban development in the Piedmont has re-sulted in multiple stressors across watersheds including nonpoint-source pollution, modified flow regimes, and reduced channelheterogeneity, all of which may aggravate the repercussions of land-use past, including impeded colonization of stream salamanders andtheir long-term stabilization in Piedmont streams (Paul and Meyer2001; Doody et al. 2010).
Current percent coverage of forests and urban lands at the ri-parian scale was the common denominator for models predictingspecies richness and SI at Blue Ridge. Despite limited land devel-opment, current urbanization appeared to have a significant neg-ative impact in the Blue Ridge, indicating that ecological adversityof urbanization can be disproportionately large to its spatial ex-tent. The high geomorphic gradient of the Blue Ridge may makethat ecoregion highly sensitive to urbanization through high ero-sivity and erodibility (Junior et al. 2010). Unsustainable land usesare the primary causes of biodiversity loss worldwide, includingthe southeastern United States where a multitude of aquatic eco-systems are endangered because of land development and otheranthropocentric activities (Noss et al. 1995; Ellis et al. 2010).
Our inferences are similar to many studies on impacts of currentland uses on native wildlife. For instance, low diversity of macro-invertebrates and lower index of biotic integrity (Lammert and Allan
1999), declining stream fish diversity, increased similarity of func-tional traits (Helms et al. 2005), and biotic homogenization amongterrestrial- and wetland-breeding anurans along agroforestry andurban–rural gradients (Wanger et al. 2010; Howard et al. 2012) areindications of negative ecological aftermath of watershed and ripar-ian urbanizations. Research focusing on temporal scale of land use islimited. Harding et al. (1998) attributed declining stream fish andaquatic macroinvertebrate diversity in streams fed by forested Appa-lachian watersheds to historical agriculture. Similarly, reduction indistribution and abundance has been documented among regionallycommon species of stream salamanders as a result of multidecadewatershed urbanization in the southern Piedmont ecoregion (Priceet al. 2006, 2012). Analogous observations were noted among othernative taxa such as avifauna and forest-floor arthropods in Europe asconsequences of historical intensive agriculture (Benton et al. 2002).
Species clustering (Figs. 3a, 3b) in the ordination plots corre-sponded to their natural and life histories (Martof et al. 1989; Conantand Collins 1998; Petranka 1998; Lannoo 2005; Mitchell and Gibbons2010). Desmognathus fuscus, E. cirrigera, and E. glutolineata ordinatedtogether and are small-bodied (snout–vent length ≈ 40–50 mm), withshorter aquatic larval periods and semiaquatic short-lived adultstages. Adults occupy a range of microhabitats within the riparianzone, undercut banks, and the wetted channel, and associate manysubstrate types as refugia. These species showed the lowest associa-tion with current and historical forest cover. The rest of the species(except D. ocoee) are medium-sized to large-bodied (snout–ventlength ≈ 80–100 mm), with prolonged larval stages and long-livedlargely aquatic adult stages that have narrow microhabitat prefer-ences. These species ordinated together and showed relatively highaffinity with current and historical forest cover and negatively asso-ciated with streams with historic and current nonforest land-covertypes. The land-use associations for these species were consistentacross both ecoregions. The larger body size, longevity, and narrowhabitat preference might be a liability at changing habitat conditions(Bruce 1996, 2009, 2011). On the other hand, small-bodied habitatgeneralists have lower energy requirements, are adapted for a rangeof stream-associated refugia, and have shorter generation times en-abling evolution of adaptations for changing habitats (Bruce 1982,2005, 2007). Consequently, land uses may have relieved small-bodiedplethodontids from competition with large-bodied species; previousstudies have shown that the large-bodied salamanders are competi-tively dominant over small-bodied salamanders in forested streams.Analogous evidence for amphibians and other taxa indicates thatlarge-bodied, long-lived, habitat specialists with longer generationtimes might be more susceptible to anthropogenic disturbances(Rabinowitz et al. 1986; Gaston and Blackburn 1995; Lips et al. 2003;Cooper et al. 2008).
ConclusionOur study indicates the importance of both historical and cur-
rent land uses at local and landscape scales in shaping communitystructure of stream-dwelling salamanders. Ecological interpreta-tion of mechanisms driving species assembly should be under-taken with caution because land-use legacies could be responsiblefor current patterns of species distribution that cannot be attrib-uted to other biogeographic filters. Our study adds to the growingunderstanding that conservation and restoration actions shouldconsider land-use past as well as present. Of particular interest forstream systems and amphibians are restoration efforts and spe-cies reintroductions. Such actions may require restoration effortsto mitigate legacy impacts including soil erosion, river-bank de-stabilization, channel incision, and loss of topsoil. We emphasisthe necessity for policy actions to sustainably manage the water-sheds and riparian zones to safeguard future stream biodiversityfrom the “ghost of the land-use past” (Harding et al. 1998).
534 Can. J. Zool. Vol. 92, 2014
Published by NRC Research Press
Can
. J. Z
ool.
Dow
nloa
ded
from
ww
w.n
rcre
sear
chpr
ess.
com
by
CL
EM
SON
UN
IVE
RSI
TY
on
05/2
7/14
For
pers
onal
use
onl
y.
AcknowledgementWe thank B. Brown (Virginia Tech) for his statistical advice. We
greatly appreciate the comments of two anonymous reviewers.Thanks go to numerous research undergraduates of Clemson Uni-versity for their field support. This research was funded by theDepartment of Biological Sciences of Clemson University, High-lands Biological Station (North Carolina), Riverbanks Zoo (SouthCarolina), and the Creative Inquiry and Undergraduate Researchprogram of Clemson University.
ReferencesAbell, R., Thieme, M.L., Revenga, C., Bryer, M., Kottelat, M., Bogutskaya, N.,
Coad, B., Mandrak, N., Balderas, S.C., Bussing, W., Stiassny, M.L.J., Skelton, P.,Allen, G.R., Unmack, P., Naseka, A., Ng, R., Sindorf, N., Robertson, J.,Armijo, E., Higgins, J.V., Heibel, T.J., Wikramanayake, E., Olson, D.,López, H.L., Reis, R.E., Lundberg, J.G., Sabaj Pérez, M.H., and Petry, P. 2008.Freshwater ecoregions of the world: a new map of biogeographic units forfreshwater biodiversity conservation. Bioscience, 58(5): 403–414. doi:10.1641/B580507.
Aiken, C.S. 1973. The evolution of cotton ginning in the southeastern UnitedStates. Geogr. Rev. 63: 196–224. doi:10.2307/213411.
Allen, J.C., Krieger, S.M., Walters, J.R., and Collazo, J.A. 2006. Associations ofbreeding birds with fire-influenced and riparian–upland gradients in a lon-gleaf pine ecosystem. Auk, 123(4): 1110–1128. doi:10.2307/25150224.
Ambers, R.K.R., Druckenbrod, D.L., and Ambers, C.P. 2006. Geomorphic re-sponse to historical agriculture at Monument Hill in the Blue Ridge foothillsof central Virginia. Catena, 65(1): 49–60. doi:10.1016/j.catena.2005.09.002.
Anderson, J.R. 1976. A land use and land cover classification system for use withremote sensor data. US Government Printing Office, Washington, D.C.
Angermeier, P.L. 2000. The natural imperative for biological conservation.Conserv. Biol. 14(2): 373–381. doi:10.1046/j.1523-1739.2000.98362.x.
Baron, J.S., Poff, N.L., Angermeier, P.L., Dahm, C.N., Gleick, P.H., Hairston, N.G., Jr.,Jackson, R.B., Johnston, C.A., Richter, B.D., and Steinman, A.D. 2002. Meetingecological and societal needs for freshwater. Ecol. Appl. 12(5): 1247–1260.doi:10.1890/1051-0761(2002)012[1247:MEASNF]2.0.CO;2.
Barrett, K., and Guyer, C. 2008. Differential responses of amphibians and reptilesin riparian and stream habitats to land use disturbances in western Georgia,USA. Biol. Conserv. 141(9): 2290–2300. doi:10.1016/j.biocon.2008.06.019.
Benton, T.G., Bryant, D.M., Cole, L., and Crick, H.Q.P. 2002. Linking agriculturalpractice to insect and bird populations: a historical study over three decades.J. Appl. Ecol. 39(4): 673–687. doi:10.1046/j.1365-2664.2002.00745.x.
Biswas, S.R., and Wagner, H.H. 2012. Landscape contrast: a solution to hiddenassumptions in the metacommunity concept? Landsc. Ecol. 27(5): 621–631.doi:10.1007/s10980-012-9732-5.
Black, A.E., Strand, E., Wright, R.G., Scott, J.M., Morgan, P., and Watson, C. 1998.Land use history at multiple scales: implications for conservation planning.Landsc. Urban Plann. 43(1–3): 49–63. http://dx.doi.org/10.1016/S0169-2046(98)00096-6. doi:10.1016/S0169-2046(98)00096-6.
Bolgiano, C. 1998. The Appalachian Forest: a search for roots and renewal. Stack-pole Books, Mechanicsburg, Pa.
Boring, L.R., Monk, C.D., and Swank, W.T. 1981. Early regeneration of a clear-cutsouthern Appalachian forest. Ecology, 62(5): 1244–1253. doi:10.2307/1937289.
Brender, E. 1974. Impact of past land use on the lower Piedmont forest. J. For.72(1): 34–36.
Brown, D.G., Johnson, K.M., Loveland, T.R., and Theobald, D.M. 2005. Ruralland-use trends in the conterminous United States, 1950–2000. Ecol. Appl.15(6): 1851–1863. doi:10.1890/03-5220.
Bruce, R.C. 1982. Size displacement in salamanders: a criticism of the concept ofa developmental constant. Am. Nat. 119(6): 872–874. doi:10.1086/283961.
Bruce, R.C. 1996. Life-history perspective of adaptive radiation in desmog-nathine salamanders. Copeia, 1996(4): 783–790. doi:10.2307/1447639.
Bruce, R.C. 2005. Theory of complex life cycles: application in plethodontid sala-manders. Herpetol. Monogr. 19: 180–207. doi:10.1655/0733-1347(2005)019[0180:TOCLCA]2.0.CO;2.
Bruce, R.C. 2007. Out of the frying pan into the fire: an ecological perspective onevolutionary reversal in life history in plethodontid salamanders (Amphibia:Plethodontidae). Evol. Ecol. 21: 703–726. doi:10.1007/s10682-006-9140-x.
Bruce, R.C. 2009. Life-history contributions to miniaturization in the salaman-der genus Desmognathus (Urodela: Plethodontidae). Copeia, 2009(4): 714–723.doi:10.1643/CH-08-234.
Bruce, R.C. 2011. Community assembly in the salamander genus Desmognathus.Herpetol. Monogr. 25(1): 1–24. doi:10.1655/HERPMONOGRAPHS-D-10-00012.1.
Callaham, M.A., Jr., Richter, D.D., Jr., Coleman, D.C., and Hofmockel, M. 2006.Long-term land-use effects on soil invertebrate communities in southernPiedmont soils, USA. Eur. J. Soil. Biol. 42: S150–S156. doi:10.1016/j.ejsobi.2006.06.001.
Conant, R., and Collins, J.T. 1998. A field guide to reptiles and amphibians:eastern and central North America. Peterson Field Guide Series. Vol. 12.Houghton Mifflin Harcourt, Boston, Mass. pp. i–xviii, 1–616.
Cooper, N., Bielby, J., Thomas, G.H., and Purvis, A. 2008. Macroecology and
extinction risk correlates of frogs. Global Ecol. Biogeogr. 17(2): 211–221. doi:10.1111/j.1466-8238.2007.00355.x.
Crawford, J.A., and Semlitsch, R.D. 2007. Estimation of core terrestrial habitatfor stream-breeding salamanders and delineation of riparian buffers for pro-tection of biodiversity. Conserv. Biol. 21(1): 152–158. doi:10.1111/j.1523-1739.2006.00556.x. PMID:17298521.
Dayton, P.K. 1971. Competition, disturbance, and community organization: pro-vision and subsequent utilization of space in a rocky intertidal community.Ecol. Monogr. 41(4): 351–389. doi:10.2307/1948498.
DeFries, R., Karanth, K.K., and Pareeth, S. 2010. Interactions between protectedareas and their surroundings in human-dominated tropical landscapes. Biol.Conserv. 143(12): 2870–2880. doi:10.1016/j.biocon.2010.02.010.
Delcourt, P.A., and Delcourt, H.R. 1998. Paleoecological insights on conservationof biodiversity: a focus on species, ecosystems, and landscapes. Ecol. Appl.8(4): 921–934. doi:10.1890/1051-0761(1998)008[0921:PIOCOB]2.0.CO;2.
Detenbeck, N.E., DeVore, P.W., Niemi, G.J., and Lima, A. 1992. Recovery oftemperate-stream fish communities from disturbance: a review of case studiesand synthesis of theory. Environ. Manage. 16(1): 33–53. doi:10.1007/BF02393907.
Dobson, A.P., Bradshaw, A., and Baker, A.J.M. 1997. Hopes for the future: resto-ration ecology and conservation biology. Science, 277(5325): 515–522. doi:10.1126/science.277.5325.515.
Dodd, C.K. 2010. Amphibian ecology and conservation: a handbook of tech-niques. Oxford University Press, Oxford.
Doody, B.J., Sullivan, J.J., Meurk, C.D., Stewart, G.H., and Perkins, H.C. 2010.Urban realities: the contribution of residential gardens to the conservationof urban forest remnants. Biodivers. Conserv. 19(5): 1385–1400. doi:10.1007/s10531-009-9768-2.
Dorcas, M.E., and Gibbons, J.W. 2008. Frogs and toads of the southeast. Univer-sity of Georgia Press, Athens.
Dudgeon, D., Arthington, A.H., Gessner, M.O., Kawabata, Z., Knowler, D.J.,Lévêque, C., Naiman, R.J., Prieur-Richard, A.H., Soto, D., Stiassny, M.L.J., andSullivan, C.A. 2006. Freshwater biodiversity: importance, threats, status andconservation challenges. Biol. Rev. Camb. Philos. Soc. 81(2): 163–182. doi:10.1017/S1464793105006950. PMID:16336747.
Ellis, E.C., Klein Goldewijk, K., Siebert, S., Lightman, D., and Ramankutty, N.2010. Anthropogenic transformation of the biomes, 1700 to 2000. Global Ecol.Biogeogr. 19(5): 589–606. doi:10.1111/j.1466-8238.2010.00540.x.
Foster, D.R., and Aber, J.D. (Editors). 2006. Forests in time: the environmentalconsequences of 1,000 years of change in New England. Yale University Press,New Haven, Conn.
Foster, D.R., Motzkin, G., and Slater, B. 1998. Land-use history as long-termbroad-scale disturbance: regional forest dynamics in central New England.Ecosystems, 1(1): 96–119. doi:10.1007/s100219900008.
Foster, D.R., Motzkin, G., Bernardos, D., and Cardoza, J. 2002. Wildlife dynamicsin the changing New England landscape. J. Biogeogr. 29(10–11): 1337–1357.doi:10.1046/j.1365-2699.2002.00759.x.
Foster, D., Swanson, F., Aber, J., Burke, I., Brokaw, N., Tilman, D., and Knapp, A.2003. The importance of land-use legacies to ecology and conservation.Bioscience, 53(1): 77–88. doi:10.1641/0006-3568(2003)053[0077:TIOLUL]2.0.CO;2.
Galang, M., Markewitz, D., Morris, L., and Bussell, P. 2007. Land use change andgully erosion in the Piedmont region of South Carolina. J. Soil Water Conserv.62(3): 122–129.
Gardiner, E.P., Sutherland, A.B., Bixby, R.J., Scott, M.C., Meyer, J.L.,Helfman, G.S., Benfield, E.F., Pringle, C.M., Bolstad, P.V., and Wear, D.N. 2009.Linking stream and landscape trajectories in the southern Appalachians.Environ. Monit. Assess. 156(1–4): 17–36. doi:10.1007/s10661-008-0460-x. PMID:18704730.
Gaston, K.J., and Blackburn, T.M. 1995. Birds, body size and the threat of extinc-tion. Philos. Trans. R. Soc. B Biol. Sci. 347(1320): 205–212. doi:10.1098/rstb.1995.0022.
Harding, J.S., Benfield, E.F., Bolstad, P.V., Helfman, G.S., and Jones, E.B.D., III.1998. Stream biodiversity: the ghost of land use past. Proc. Natl. Acad. Sci.U.S.A. 95(25): 14843–14847. doi:10.1073/pnas.95.25.14843. PMID:9843977.
Helms, B.S., Feminella, J.W., and Pan, S. 2005. Detection of biotic responses tourbanization using fish assemblages from small streams of western Georgia,USA. Urban Ecosyst. 8(1): 39–57. doi:10.1007/s11252-005-1418-1.
Heyer, W.R., Donnelly, M.A., McDiamid, R.W., Hayek, L.-A.C., and Foster, M.S.1994. Measuring and monitoring biodiversity standard methods for amphib-ians. Smithsonian Institution Press, Washington, D.C.
Hicks, N.G., and Pearson, S.M. 2003. Salamander diversity and abundance inforests with alternative land use histories in the southern Blue Ridge Moun-tains. For. Ecol. Manage. 177(1–3): 117–130. doi:10.1016/S0378-1127(02)00319-5.
Houghton, R. 1994. The worldwide extent of land-use change. Bioscience, 44(5):305–313. doi:10.2307/1312380.
Howard, J.H., Baldwin, R.F., and Brown, B.L. 2012. Exploratory analysis forcomplex-life-cycle amphibians: revealing complex forest–reproductive effortrelationships using redundancy analysis. For. Ecol. Manage. 270: 175–182.doi:10.1016/j.foreco.2012.01.021.
Jackson, C., Martin, J., Leigh, D., and West, L. 2005. A southeastern Piedmontwatershed sediment budget: evidence for a multi-millennial agricultural leg-acy. J. Soil Water Conserv. 60(6): 298–310.
James, F.C., and McCulloch, C.E. 1990. Multivariate analysis in ecology and sys-
Surasinghe and Baldwin 535
Published by NRC Research Press
Can
. J. Z
ool.
Dow
nloa
ded
from
ww
w.n
rcre
sear
chpr
ess.
com
by
CL
EM
SON
UN
IVE
RSI
TY
on
05/2
7/14
For
pers
onal
use
onl
y.
tematics: panacea or Pandora’s box? Annu. Rev. Ecol. Syst. 21: 129–166. doi:10.1146/annurev.es.21.110190.001021.
Junior, O.C., Guimaraes, R., Freitas, L., Gomes-Loebmann, D., Gomes, R.A.,Martins, E., and Montgomery, D.R. 2010. Urbanization impacts upon catch-ment hydrology and gully development using mutli-temporal digital eleva-tion data analysis. Earth Surf. Process. Landf. 35(5): 611–617.
Krebs, C.J. 1999. Ecological methodology. Addison Wesley Longman Inc., MenloPark, Calif.
Lammert, M., and Allan, J.D. 1999. Assessing biotic integrity of streams: effects ofscale in measuring the influence of land use/cover and habitat structure onfish and macroinvertebrates. Environ. Manage. 23(2): 257–270. doi:10.1007/s002679900184. PMID:9852191.
Lannoo, M.J. (Editor). 2005. Amphibian declines: the conservation status of UnitedStates species. University of California Press, Berkeley and Los Angeles, Calif.
Lips, K.R., Reeve, J.D., and Witters, L.R. 2003. Ecological traits predicting amphib-ian population declines in Central America. Conserv. Biol. 17(4): 1078–1088.doi:10.1046/j.1523-1739.2003.01623.x.
Llopiz, J.K., and Cowen, R.K. 2009. Variability in the trophic role of coral reef fishlarvae in the oceanic plankton. Mar. Ecol. Prog. Ser. 381: 259–272. doi:10.3354/meps07957.
Martof, B.S., Palmer, W.M., Bailey, J.R., Harrison, J.R., III, Martof, B.S., Palmer,W.M., Bailey, J.R., and Harrison, J.R., III. 1989. Amphibians and reptiles of theCarolinas and Virginia. The University of North Carolina Press, Chapel Hill.
McCune, B., Grace, J.B., and Urban, D.L. 2002. Analysis of ecological communi-ties. MjM Software Design, Gleneden Beach, Oreg.
McKinney, M.L. 2002. Urbanization, biodiversity, and conservation. Bioscience,52(10): 883–890. doi:10.1641/0006-3568(2002)052[0883:UBAC]2.0.CO;2.
McKinney, M.L. 2008. Effects of urbanization on species richness: a review ofplants and animals. Urban Ecosyst. 11(2): 161–176. doi:10.1007/s11252-007-0045-4.
McKinney, M.L., and Lockwood, J.L. (Editors). 2001. Biotic homogenization: asequential and selective process. In Biotic homogenization. Kluwer AcademicPublishers, New York. pp. 1–17.
Mitchell, J., and Gibbons, J.W. 2010. Salamanders of the southeast. University ofGeorgia Press, Atlanta.
Moore, A.A., and Palmer, M.A. 2005. Invertebrate biodiversity in agricultural andurban headwater streams: implications for conservation and management.Ecol. Appl. 15(4): 1169–1177. doi:10.1890/04-1484.
Noss, R.F., LaRoe, E.T., and Scott, J.M. 1995. Endangered ecosystems of the UnitedStates: a preliminary assessment of loss and degradation. US Department ofthe Interior, National Biological Service, Washington, D.C.
Olson, D.M., Dinerstein, E., Wikramanayake, E.D., Burgess, N.D., Powell, G.V.N.,Underwood, E.C., D’amico, J.A., Itoua, I., Strand, H.E., and Morrison, J.C. 2001.Terrestrial ecoregions of the world: a new map of life on earth. Bioscience,51(11): 933–938. doi:10.1641/0006-3568(2001)051[0933:TEOTWA]2.0.CO;2.
Paul, M.J., and Meyer, J.L. 2001. Streams in the urban landscape. Annu. Rev. Ecol.Syst. 32: 333–365. doi:10.1146/annurev.ecolsys.32.081501.114040.
Pearson, S.M., Turner, M.G., and Drake, J.B. 1999. Landscape change and habitatavailability in the Southern Appalachian Highlands and Olympic Peninsula.Ecol. Appl. 9(4): 1288–1304. doi:10.1890/1051-0761(1999)009[1288:LCAHAI]2.0.CO;2.
Petranka, J.W. 1998. Salamanders of the United States and Canada. SmithsonianInstitution Press, Washington, D.C.
Petranka, J.W., Eldridge, M.E., and Haley, K.E. 1993. Effects of timber harvestingon southern Appalachian salamanders. Conserv. Biol. 7(2): 363–370. doi:10.1046/j.1523-1739.1993.07020363.x.
Price, K., and Leigh, D.S. 2006. Morphological and sedimentological responses ofstreams to human impact in the southern Blue Ridge Mountains, USA.Geomorphology, 78(1): 142–160.
Price, S.J., Dorcas, M.E., Gallant, A.L., Klaver, R.W., and Willson, J.D. 2006. Threedecades of urbanization: estimating the impact of land-cover change onstream salamander populations. Biol. Conserv. 133(4): 436–441. doi:10.1016/j.biocon.2006.07.005.
Price, S.J., Browne, R.A., and Dorcas, M.E. 2012. Evaluating the effects of urbani-sation on salamander abundances using a before–after control–impact de-sign. Freshw. Biol. 57(1): 193–203. doi:10.1111/j.1365-2427.2011.02699.x.
Rabinowitz, D., Cairns, S., and Dillon, T. 1986. Seven forms of rarity and theirfrequency in the flora of the British Isles. In Conservation biology: the scienceof scarcity and diversity. Edited by M.E. Soule. Sinauer Associates, Inc., Sun-derland, Mass. pp. 182–204.
Ramankutty, N., and Foley, J.A. 1999. Estimating historical changes in land
cover: North American croplands from 1850 to 1992. Global Ecol. Biogeogr.8(5): 381–396. doi:10.1046/j.1365-2699.1999.00141.x.
Richter, D.D., Markewitz, D., Heine, P.R., Jin, V., Raikes, J., Tian, K., andWells, C.G. 2000. Legacies of agriculture and forest regrowth in the nitrogenof old-field soils. For. Ecol. Manage. 138(1–3): 233–248. doi:10.1016/S0378-1127(00)00399-6.
Riitters, K.H., O’Neill, R., Hunsaker, C., Wickham, J.D., Yankee, D., Timmins, S.,Jones, K., and Jackson, B. 1995. A factor analysis of landscape pattern andstructure metrics. Landsc. Ecol. 10(1): 23–39. doi:10.1007/BF00158551.
Scott, M.C. 2006. Winners and losers among stream fishes in relation to land uselegacies and urban development in the southeastern US. Biol. Conserv.127(3): 301–309. doi:10.1016/j.biocon.2005.07.020.
Scott, M.C., Helfman, G.S., McTammany, M.E., Benfield, E.F., and Bolstad, P.V.2002. Multiscale influences on physical and chemical stream conditionsacross Blue Ridge landscapes. J. Am. Water Resour. Assoc. 38(5): 1379–1392.doi:10.1111/j.1752-1688.2002.tb04353.x.
Semlitsch, R.D., and Bodie, J.R. 2003. Biological criteria for buffer zones aroundwetlands and riparian habitats for amphibians and reptiles. Conserv. Biol.17(5): 1219–1228. doi:10.1046/j.1523-1739.2003.02177.x.
Soberón, J., and Peterson, A.T. 2009. Monitoring biodiversity loss with primaryspecies-occurrence data: toward national-level indicators for the 2010 targetof the convention on biological diversity. Ambio, 38(1): 29–34. doi:10.1579/0044-7447-38.1.29. PMID:19260344.
ter Braak, C.J. 1986. Canonical correspondence analysis: a new eigenvector tech-nique for multivariate direct gradient analysis. Ecology, 67(5): 1167–1179.doi:10.2307/1938672.
ter Braak, C.J. 1994. Canonical community ordination. Part I: Basic theory andlinear methods. Ecoscience, 1: 127–140.
ter Braak, C.J., and Verdonschot, P.F. 1995. Canonical correspondence analysisand related multivariate methods in aquatic ecology. Aquat. Sci. 57(3): 255–289. doi:10.1007/BF00877430.
Theobald, D.M. 2005. Landscape patterns of exurban growth in the USA from1980 to 2020. Ecol. Soc. 10(1): 32.
Theobald, D.M., and Romme, W.H. 2007. Expansion of the US wildland–urbaninterface. Landsc. Urban Plann. 83(4): 340–354. doi:10.1016/j.landurbplan.2007.06.002.
Theobald, D.M., Miller, J.R., and Hobbs, N.T. 1997. Estimating the cumulativeeffects of development on wildlife habitat. Landsc. Urban Plann. 39(1): 25–36.doi:10.1016/S0169-2046(97)00041-8.
Trimble, S.W. 1974. Man-induced soil erosion on the southern Piedmont,1700–1970. Soil Conservation Society of America, Ankeny, Iowa.
Trombulak, S.C., and Baldwin, R.F. (Editors). 2010. Landscape-scale conservationplanning. Springer Science + Business Media B.V., Dordrecht, the Nether-lands.
Turner, M.G. 2005. Landscape ecology in North America: past, present, andfuture. Ecology, 86(8): 1967–1974. doi:10.1890/04-0890.
US Environmental Protection Agency. 2002. Level III ecoregions of the continen-tal United States (revision of Omernik, 1987). In Map M-1. US EnvironmentalProtection Agency, National Health and Environmental Effects Research Lab-oratory, Corvallis, Oreg.
Vellend, M. 2004. Parallel effects of land-use history on species diversity andgenetic diversity of forest herbs. Ecology, 85(11): 3043–3055. doi:10.1890/04-0435.
Wanger, T.C., Iskandar, D.T., Motzke, I., Brook, B.W., Sodhi, N.S., Clough, Y., andTscharntke, T. 2010. Effects of land-use change on community composition oftropical amphibians and reptiles in Sulawesi, Indonesia. Conserv. Biol. 24(3):795–802. doi:10.1111/j.1523-1739.2009.01434.x. PMID:20151989.
Watling, J.I., Nowakowski, A.J., Donnelly, M.A., and Orrock, J.L. 2011. Meta-analysis reveals the importance of matrix composition for animals in frag-mented habitat. Global Ecol. Biogeogr. 20(2): 209–217. doi:10.1111/j.1466-8238.2010.00586.x.
Wayland, K.G., Long, D.T., Hyndman, D.W., Pijanowski, B.C., Woodhams, S.M.,and Haack, S.K. 2003. Identifying relationships between baseflow geochem-istry and land use with synoptic sampling and R-mode factor analysis.J. Environ. Qual. 32(1): 180–190. doi:10.2134/jeq2003.0180. PMID:12549557.
Wear, D. 2002. Focus on southern forests: evaluating the forces of change. J. For.100(2): 7–7.
Wilson, E.O. 1988. The current state of biological diversity. In Biodiversity. Editedby E.O. Wilson and F.M. Peter. National Academy Press, Washington, D.C.pp. 3–18.
536 Can. J. Zool. Vol. 92, 2014
Published by NRC Research Press
Can
. J. Z
ool.
Dow
nloa
ded
from
ww
w.n
rcre
sear
chpr
ess.
com
by
CL
EM
SON
UN
IVE
RSI
TY
on
05/2
7/14
For
pers
onal
use
onl
y.


