Embed Size (px)
Citation preview
R E S E A R C H A R T I C L E bpa_356 1..12
Genomic Landscape of MeningiomasYohan Lee1*; Jason Liu1†; Shilpa Patel1†; Timothy Cloughesy2‡; Albert Lai2‡; Haumith Farooqi3§;David Seligson4¶; Jun Dong5**; Linda Liau3††; Donald Becker3††; Paul Mischel4††; Soheil Shams6‡‡;Stanley Nelson1§§1 Department of Human Genetics.2 Department of Neurology.3 Department of Neurosurgery.4 Department of Pathology & Laboratory Medicine.5 Department of Biostatistics, David Geffen School of Medicine, University of California Los Angeles, Los Angeles, Calif.6 BioDiscovery Inc., El Segundo, Calif.* Performed all analyses within the manuscript and drafted the manuscript.† Performed the molecular assays.‡ Collected all clinical covariates.§ Performed all the tissue biopsy collection and microdissection.¶ Performed and evaluated the Ki-67 staining on the meningioma samples by tissue microarray.** Provided statistical input.†† Participated in the design of the study, surgical resection and critical review and editing of the manuscript.‡‡ Provided the Nexus 3.0™ software training and analysis assistance.§§ Conceived the study and participated in its design, coordination and analysis, and drafted the manuscript. However, all authors read and approvedthe final manuscript.
AbstractMeningiomas are one of the most common adult brain tumors. For most patients, surgicalexcision is curative. However, up to 20% recur. Currently, the molecular determinantspredicting recurrence and malignant transformation are lacking. We performed retrospec-tive global genetic and genomic analysis of 85 meningioma samples of various grades. Copynumber alterations were assessed by 100K single-nucleotide polymorphism arrays andcorrelated with gene expression, proliferation indices and clinical outcome. In addition tochromosome 22q loss, which was detected in the majority of clinical samples, chromosome6q and 14q loss was significantly more common in recurrent tumors and was associatedwith anaplastic histology. Five “classes” of meningiomas were detected by gene expressionanalysis that correlated with copy number alterations, recurrent status and malignant histol-ogy. These classes more accurately identified recurrent tumors relative to Ki-67 index andextent of surgical resection, and highlight substantial expression heterogeneity betweenmeningiomas. These data offer the most complete description of the genomic landscape ofmeningiomas, and provide broad genomic information that may be used to further stratifymeningioma patients into prognostic risk groups.
Keywords
Affymetrix, BioDiscovery, brain tumor, dChip,GeneChip Human Mapping 100K Array,genomics, Human Genome U133 Plus 2.0Array, meningioma, microarray, Nexus, SNP.
Corresponding author:
Stanley F. Nelson, MD, 695 Charles E. YoungDrive South, Bldg. Gonda, Rm. 5506A,Department of Human Genetics, UCLA Schoolof Medicine, Los Angeles, CA 90095-7088(E-mail: [email protected])
Received 21 October 2009; accepted 28October 2009.
doi:10.1111/j.1750-3639.2009.00356.x
INTRODUCTIONMeningiomas are solid tumors of the central nervous system thatoriginate from the arachnoidal cap cells, which cover the brain andspinal cord. Meningeal tumors represent 25% to 30% of all primarybrain tumors with estimated annual incidence ranging between fourand six per 100 000 individuals (29, 36). The current World HealthOrganization (WHO) classifications for meningiomas specify threegrades in the following proportions: 80% are benign (grade I), 15%are atypical (grade II) and 5% are anaplastic (grade III) (23). Histo-logical grade and extent of surgical resection serve as the two mostimportant prognostic variables (23). Among WHO I meningiomas,
5% recur within 5 years of gross total resection, while 40% ofWHO II meningiomas have recently been reported to recur within5 years (29).
The current standard of care for meningioma are surgical resec-tion and postsurgical radiation for anaplastic meningiomas and/orunresectable high-grade recurrent tumors (17, 19). Chemotherapyhas been largely ineffective despite clinical trials involving temo-zolomide (5), hydroxyurea (16) and RU-486 (35). Limited prog-nostic tools for predicting relapse exist, and for unresectabletumors no effective therapies exist. Genomic characterization ofmeningiomas may lead to improved prognostic markers and is anefficient route to improved understanding of the underlying causes
Brain Pathology ISSN 1015-6305
1Brain Pathology (2009)
© 2009 The Authors; Journal Compilation © 2009 International Society of Neuropathology
that are a necessary step in the design of rational treatments. Theapplications of microsatellite, cytogenetic fluorescence in situhybridization, comparative genomic hybridization (CGH) andarray-based CGH (aCGH) methods have allowed numerous inves-tigators to report deletions of various genetic regions in differentgrades of meningiomas. The most common genetic aberration ofmeningiomas is the monosomic loss of chromosome 22, whichoccurs in the majority of tumors (27). However, a broad array ofchromosome losses have been reported on 1p, 3q, 6q, 9p, 10q, 14q,17p, 18p, 18q and 22q (13), and are correlated with higher gradesof meningiomas. The loss of 1p in particular has been suggested asa decisive step for meningioma progression (33). At the gene level,the mutational profile of meningiomas has been dominated byreports of inactivating NF2 mutations which occur in 33% to 50%of monosomic 22 tumors (27) on the retained allele. Three percentof meningiomas appear to harbor the identical mutation in exon 9of INI1 (2). Candidate tumor suppressor genes have been studiedincluding DAL-1, BAM22, MN1 and LARGE (29), but no muta-tions have been identified (9, 14, 24, 25, 30).
Meningioma classification is based on histological criteria, andpredicting which tumors may recur after surgery from those that donot remains difficult. Initial genomic characterizations of menin-giomas have been performed which indicate heterogeneity of geneexpression and substantial genomic aberrations (4, 36). Because ofthe large heterogeneity between meningiomas, we have sought togenerate a larger data set to permit the identification of cryptic geneexpression or chromosome aberration-based groupings to furthercorrelate findings between chromosomal loss patterns and geneexpression. To accomplish this, we have generated the largest andmost comprehensively analyzed meningioma data set to date,which is made public to permit downstream multigroup meta-analyses to dissect meningiomas. In this process, we note severalnovel features of the molecular landscape of meningiomas, includ-ing chromosomal aberration correlates with sex of the affected,chromosomal loss hierarchies, identification of gene expression-based subgroups of meningioma and delineation of meningiomaoverexpressed genes, and we apply the data to highlight candidatetumor suppressor genes. Further, the data are used to identifymolecular gene expression correlates and chromosomal loss corre-lates of recurrence.
MATERIALS AND METHODS
Tumor and patient clinical characteristics
Tumor biopsies from 53 female and 32 male subjects with sporadicmeningioma were identified from the UCLA Neuro-oncologyProgram Tissue Bank through institutional review board-approvedprotocols. The 85 tumors were selected on the basis of sufficientlylarge tissue available for DNA and RNA extraction that yieldedclean RNA and DNA. All grade I, II and III samples availablewithin the UCLA brain tumor bank at the time of initiation wereincluded. Time of survival, sex, age, recurrence and positive meanKi-67 levels were recorded (see Supporting Information Table S1).Subject age at time of diagnosis ranged from 31 to 89 years. Noneof the patients had neurofibromatosis. Pathological assessment ofWHO grading was determined clinically with the UCLA Neuropa-thology service. Fifty-seven tumors were designated “benign”
WHO I, 20 tumors were “atypical” WHO II and eight were “ana-plastic” WHO III.
Single-nucleotide polymorphism (SNP) analysis
DNA extraction was performed from 10 to 20 mg of tumor piecesusing the Gentra Puregene™ Tissue kit from Qiagen (Valencia,CA) according to the supplied protocol. Genomic DNA (250 ng)was used for each of the microarray assays of the Affymetrix (SantaClara, CA) GeneChip® Human Mapping 100K Arrays. All assayswere performed per the Affymetrix GeneChip® Mapping 100KAssay Manual using the resources of the UCLA DNA Microarrayfacility (http://microarray.genetics.ucla.edu/). All microarrayswere scanned using the Affymetrix GeneChip® 3000 scanner. Allimages were manually examined to determine that none hadsurface defects and all had proper grid placement. Of 88 tumorsample hybridizations, three were removed from analysis becauseof low call rate. Raw probe intensity values in a .CEL format weregenerated for analysis using the Affymetrix GenoType (GTYPE)calling algorithm. All SNP .CEL files are available for retrievalfrom the Gene Expression Omnibus (accession no. GSE16584).
Gene expression analysis
RNA was extracted from 20 to 50 mg tumor pieces using QiagenRNA easy mini kits per manufacturer’s protocols. Of 85 total biop-sies, 71 samples had a 28s/18s ratio of 1.0 to 2.0 with minimalevidence of degradation or contamination, and were selected forgene expression analysis. The extracted total RNA was assessedfor integrity using the 2100 Bioanalyzer by Agilent Technologies(Santa Clara, CA).
Total RNA (1 mg) was used for single-round biotinylated probesynthesis using the Affymetrix Array Station device made byCaliper Life Sciences (Hopkinton, MA) according to the manufac-turer’s protocols. Labeled and sheared cRNA was manuallyapplied to Affymetrix Human Genome U133 Plus 2.0 Arrays. Allmicroarrays were scanned using the Affymetrix GeneChip® 3000scanner. Images were manually examined to determine that nonehad surface defects and all had proper grid alignment. Of 71 tumorsample hybridizations, three were removed from analysis becauseof artificially high overall array brightness. Raw probe intensityvalues in a .CEL format were generated for analysis using theAffymetrix Gene Chip Operating System. Generated .CEL fileswere deposited into the Celsius microarray database (6) (http://celsius.genomics.ctrl.ucla.edu/), and this system was used to nor-malize relative to other microarrays of the same Affymetrix plat-form using RMA with default settings from the Bioconductor Rlibrary (3, 8). All expression .CEL files are available for retrievalfrom the Gene Expression Omnibus (accession no. GSE16584).
To validate the presence of our gene expression-based classifier,additional meningioma microarray samples available on theAffymetrix U133 Plus 2.0 platform were collected from GEO.Fifty-six meningioma microarrays (grade I: n = 32, grade II: n = 20,grade III: n = 3, grade unknown: n = 1) were collected from GEOaccession series GSE4780. Of these 56 microarrays, 46 werederived from primary meningiomas (grade I: n = 26, II: n = 19, III:n = 1, unknown: n = 1), and nine were derived from recurrentmeningiomas (grade I: n = 6, II: n = 1 and III: n = 2) (SupportingInformation Table S1). Finally, a set of 31 meningioma microarrays
Genomic Landscape of Meningiomas Lee et al
2 Brain Pathology (2009)
© 2009 The Authors; Journal Compilation © 2009 International Society of Neuropathology
(grade unknown) were collected from GEO accession seriesGSE9438. All 31 of these microarrays were derived from primarymeningioma tumors.
Copy number analysis
Copy number calls were generated using the Affymetrix GTYPECNAT version 3.0 algorithm using default manufacturer-recommended standard parameters. CNAT version 3.0 comparedthe tumor arrays against the proprietary embedded reference datafile based on 100 normal reference individuals that produced copynumber calls in resulting .CNT files (32). .CNT files were alsoanalyzed by BioDiscovery Nexus 3.0™ professional edition (ElSegundo, CA) for copy number and LOH analysis using defaultparameters to define and visualize chromosome gains or losseswith the BioDiscovery “rank segmentation” algorithm (http://www.biodiscovery.com). All copy number analyses were refer-enced to Human Genome build 36.1. Evaluation of large-scalechromosomal loss events was performed by analyzing the fre-quency plot output from the Nexus “rank segmentation” algorithmvisualization with the percent threshold of one group of tumorswith aberrations set to at least 35%, and t-test P value threshold setat 0.05 in the Nexus 3.0 software. The 100K SNP arrays have anaverage mean inter-SNP distance of 23.6 kb and median inter-SNPdistance of 8.5 kb which can typically provide sub-megabase reso-lution of chromosomal deletions. By default, five probes wererequired for a minimum call as published studies demonstrated thatfive consecutive SNPs on the 100K platform were required to callwith 95% confidence (10). This results in an average minimal dele-tion detection size of 120 kb on average throughout the genome.The default number of probes was duly required to exceed a “ranksegmentation” significance threshold of 1.0 ¥ 106 based on Bio-Discovery’s Nexus program. The minimum copy number/log2 ratiochange required for a call was 0.2. Supervised comparisons inves-tigating chromosomal aberrations between the different menin-gioma grades or their five group memberships were executedthrough selected pair-wise comparisons with the difference inpercent between the two groups being compared set at 25% and theP value set at 0.05. Significant regions of chromosomal lossesdefined by Nexus 3.0’s Fisher’s exact test statistical comparisonwere subsequently tallied and computed for minimal overlapdetermination.
Expression analysis
Gene expression data were analyzed with DNA-Chip Analyzer(dChip) (http://www.dchip.org). Briefly, unsupervised clusteringof samples and genes was performed on a filtered gene list. Filter-ing consisted of selecting those genes with coefficient of variation(CV) greater than 1.0, and with expression values greater than 20 inat least 20% or more of the total microarrays. This filtering gener-ated a list of 1747 probe sets corresponding to 1316 unique geneswhich defined three differentially expressed groups by unsuper-vised hierarchical agglomerative clustering. The meningiomaswithin the first two of three sample branches revealed highly cohe-sive and intense expression clusters, while the third cluster ofsamples contained tumors that exhibited an independent clusteringsignature with less intense, but distinct expression across the 1747probe sets. To identify the underlying genetic signature of this third
sample cluster, we applied an ad hoc secondary filtering CV greaterthan 0.8 to these samples, and identified 3237 probe sets (2299genes) identifying three child subgroups within this third branch bysupervised hierarchical agglomerative clustering. These methodsidentified a total of five gene expression subgroups based on dis-tinct gene expression profiles. Analysis settings were set at defaultunless otherwise specified. Distances were set to be “precalcu-lated,” and a “1-correlation” distance metric was employed using“centroid” as the linkage method. Expression data from samplesthat demonstrated chromosomal loss or retention over minimal lossregions according to Nexus 3.0 analyses were subsequently ana-lyzed by dChip software using two group comparisons over thegenomic areas of interest. Common losses observed only in a spe-cific grade of tumors were determined; subsequently, the expres-sion of the genes within these regions was compared betweentumors of matched grade with and without the deletion of thespecified region. The identical analysis method was repeated forcommon losses observed only in grade III and grade II tumors, andfinally repeated for common losses observed only in grade II andgrade I tumors. “Lower expressing genes” were identified as thosedemonstrating greater than a 1.2 decrease in expression differencewith t-test P value thresholds �0.05 and false discovery rate(FDR) �10% after 100 permutations. Pearson correlation coeffi-cients were calculated using chromosome retention/loss calls gen-erated by Nexus 3.0 in conjunction with the expression valuesexported from dChip. Gene lists were tested for enriched functionaland biological themes using the MetaCore pathway web applica-tion by GeneGO, Inc. (http://www.genego.com/). The most signifi-cant biological gene network themes were calculated by identifyingnode genes present from our differential expression analysesuploaded to MetaCore pathway analysis. Returned network themeswere rank ordered by their hypergeometric P values calculatedduring output list production. The resulting data with significancevalues and enrichment ratios are included in file Supporting Infor-mation Table S3.
Ki-67 labeling
Ki-67 expression was determined by examining 379 samples ofhuman meningioma applied onto tissue microarrays from 125cases of 106 patients. Seventy-two cases were WHO grade I(benign), 35 were grade II (atypical) and 18 were grade III(malignant–anaplastic). Two duplicate arrays were stained forKi-67. Three hundred seventy of 379 spots were informative for themarker on both slides. There was good agreement across bothslides (Pearson correlation = 0.93). Scores for both were averagedfor analysis. Using the mean percent of positive nuclear Ki-67staining, 18% of cases were totally negative. While 82% of caseswere positive, most of these had very low, but detectable, staining.Further, 18% had negative staining in all observed cells, 64% hadstaining between 0 and 1% and 18% had Ki-67 staining in >1% ofthe tumor cells.
Comparison group data
A panel of U133A and U133 Plus 2.0 .CEL files were availablewithin the Celsius database (6). These were collected using RNAfrom normal body tissues (n = 144: adult tissue n = 88, fetal tissuen = 14, adult brain n = 30, fetal brain n = 12), and other brain
Lee et al Genomic Landscape of Meningiomas
3Brain Pathology (2009)
© 2009 The Authors; Journal Compilation © 2009 International Society of Neuropathology

tumors [n = 454: medulloblastomas n = 5, schwannomas n = 5,ependymomas n = 3, grade II gliomas n = 16, pilocytic tumorsn = 2, grade III gliomas n = 69 (AA n = 34, AMG n = 19, AOn = 16), gliosarcomas n = 5, glioblastomas n = 284, meningiomasn = 65) (Supporting Information Table S5). These samples wereselected as a comparison group to identify meningioma-specificgenes. All comparisons were performed on probe sets sharedbetween the U133A and U133 Plus 2.0 arrays for these analyses.Meningioma-specific genes were stringently identified based on10-fold or higher expression in the meningioma group relative tothe comparison of all normal body tissues and other brain tumorswith a pair-wise t-test P value less than 0.01. FDR was estimated indChip by permuting the sample names 100 times.
RESULTSEighty-five meningiomas were successfully analyzed using theAffymetrix Human Mapping 100K SNP arrays, and 68 meningio-mas were successfully hybridized independently onto U133 Plus2.0 expression arrays. Sixty-five meningiomas had data generatedfrom both assays.
Chromosomal abnormalities are more commonin higher-grade meningiomas
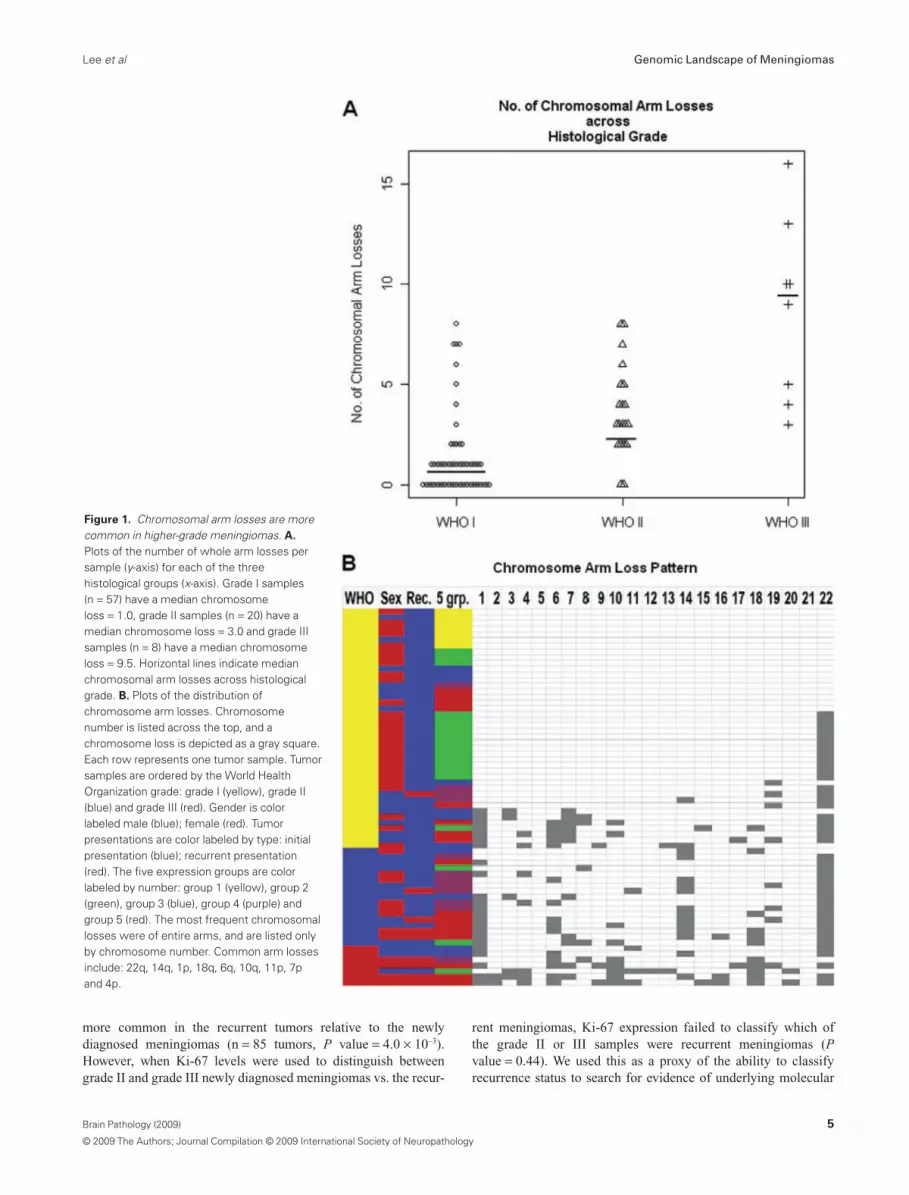
The vast majority of chromosomal aberrations consisted of wholechromosome arm losses. Of the 85 tumors, 32% (27/85) had noobserved chromosomal arm losses, and 68% (58/85) of these men-ingiomas revealed significant genomic abnormalities of one ormore whole chromosomal arm losses. Consistent with previousdescriptions, there was a strong association of increasing fre-quency of chromosomal losses with increasing histological grade(Figure 1A) (22). Of grade I meningiomas, 44% had no evidence ofany chromosomal arm loss, while 56% (32/57) had at least onewhole arm loss. Among the grade I tumors, 33% (19/57) had asingle chromosome arm loss, 9% (5/57) had two losses and 14%(8/57) had three losses or more. In contrast, only 10% of grade IImeningiomas had no detectable losses (2/20). Further, if a grade IItumor had a chromosomal loss (18/20), all had more than onechromosomal arm loss: 25% (5/20) had two chromosomal armlosses, while 65% (13/20) of the grade II tumors had three chromo-somal arm losses or more. All of the grade III meningiomas hadthree or more whole chromosomal arm losses. In aggregate, grade Imeningiomas had a median of 1.0 chromosomal arm loss pertumor, grade II tumors had 3.0 chromosomal arm losses and gradeIII tumors had a median of 9.5 chromosomal arm losses per sampledemonstrating a strong correlation of genomic losses with increas-ing grade. Pair-wise Kruskal–Wallis rank sum tests confirmed sig-nificant differences in chromosomal arm losses between grade I vs.II (P value = 1.36 ¥ 10–5), grade II vs. III (P value = 4.07 ¥ 10–3)and grade I vs. III (P value = 1.39 ¥ 10–5).
From these data, a pattern of molecular hierarchy is suggested inwhich increased aggressiveness of the meningiomas is caused byyet undetermined genes within the large chromosomal losses. Thepattern of loss while not uniform reveals general patterns, andreveals the relative importance of specific chromosomal lossevents. Of the grade I tumors, the only recurring chromosome losswas the loss of chromosome 22q that was detected in 49%(Figure 1B). Grade II meningiomas displayed a higher frequency
of chromosome 22q monosomy (85%), but additionally accumu-lated frequently recurring losses on 14q (60%) and 1p (55%).Grade III meningiomas acquired a much more diverse chromo-some arm loss pattern, but retained the core features of grade IItumors with frequent losses on 22q (75%), 1p (75%) and 14q(38%). Moreover, frequent losses of 18q (75%), 6q (63%), 10q(63%), 11p (50%), 7p (38%) and 4p (38%) were observed whichwere either not observed among the lower grades or were substan-tially more frequently appearing in the grade III tumors. The non-random nature of the chromosomal losses highlights these chromo-somes for further genetic analysis in meningiomas, and impliesthat multiple genetic events are necessary in the generation ofgrade III meningiomas. Further, a common mutational mechanismis whole chromosomal arm loss implying the sequential loss offunction of specific genes. Unfortunately, insufficient smaller chro-mosomal arm losses were observed to resolve the location of thesegenes. Moreover, there were no statistically significant associationsdetected between genetics and location (frontal, parietal, occipital,et al, etc.) or side (left, right, bottom). In aggregate, these observa-tions indicate a mutational hierarchy with chromosome 22q lossoccurring as the primary event followed by chromosome 1p and/or14q loss, and then mutations of genes on 18q, 6q, 10q, 11p, 7p and4p. The cumulative genetic mutations that lead to grade IIIhistological features and higher propensity for recurrence are thusmultiple.
Molecular correlates of recurrent meningiomas
Given the retrospective nature of the current study and insufficientlength of follow-up of individual patients (post-gross or subtotalresections), we are not able to comment meaningfully on true pre-dictors of recurrence. However, we were able to compare tumorsobserved to be recurrent to those tumors at first presentation whichidentified a higher number of total chromosomal arm losses amongrecurrent tumors relative to newly diagnosed tumors (Kruskal–Wallis P value = 7.7 ¥ 10–3). Only eight primary samples analyzedin this data set were sampled from patients who had a later recur-rence. None of the recurrent biopsies were available for analysis.After comparing these eight primary samples with the remainingset of primary tumors that did not yet relapse, none of the specificchromosomal losses that we found among our recurrent tumorswere determined to be significantly enriched among these eightprimary tumors over the 17 primary tumors that did not recur(Fisher’s exact test P value > 0.05). These results suggest that chro-mosomal losses observed to be more common in the recurrenttumors may be acquired during disease progression rather thanbeing present at the time of initial diagnosis.
Within our data set and as expected, Ki-67 labeling was highlyrelated to the WHO grade. Ki-67 expression is defined as percent-age of positive cells. The mean and median expressions of Ki-67 inWHO grade I were 0.27 and 0.17, respectively. The mean andmedian expressions of Ki-67 in WHO grade II were 1.19 and 0.53,respectively. The mean and median expressions of Ki-67 inWHO grade III were 5.21 and 3.25, respectively. There was astatistically significant difference between the Ki-67 expressionacross the three meningioma grades. Also as expected, there was asignificant correlation between Ki-67 positivity and recurrence[n = 85 tumors, Kruskal–Wallis (c2 = 11.9256, d.f. = 1, P value =5.5 ¥ 10–4)]. High or medium Ki-67 expression was significantly
Genomic Landscape of Meningiomas Lee et al
4 Brain Pathology (2009)
© 2009 The Authors; Journal Compilation © 2009 International Society of Neuropathology
more common in the recurrent tumors relative to the newlydiagnosed meningiomas (n = 85 tumors, P value = 4.0 ¥ 10–3).However, when Ki-67 levels were used to distinguish betweengrade II and grade III newly diagnosed meningiomas vs. the recur-
rent meningiomas, Ki-67 expression failed to classify which ofthe grade II or III samples were recurrent meningiomas (Pvalue = 0.44). We used this as a proxy of the ability to classifyrecurrence status to search for evidence of underlying molecular
Figure 1. Chromosomal arm losses are morecommon in higher-grade meningiomas. A.
Plots of the number of whole arm losses persample (y-axis) for each of the threehistological groups (x-axis). Grade I samples(n = 57) have a median chromosomeloss = 1.0, grade II samples (n = 20) have amedian chromosome loss = 3.0 and grade IIIsamples (n = 8) have a median chromosomeloss = 9.5. Horizontal lines indicate medianchromosomal arm losses across histologicalgrade. B. Plots of the distribution ofchromosome arm losses. Chromosomenumber is listed across the top, and achromosome loss is depicted as a gray square.Each row represents one tumor sample. Tumorsamples are ordered by the World HealthOrganization grade: grade I (yellow), grade II(blue) and grade III (red). Gender is colorlabeled male (blue); female (red). Tumorpresentations are color labeled by type: initialpresentation (blue); recurrent presentation(red). The five expression groups are colorlabeled by number: group 1 (yellow), group 2(green), group 3 (blue), group 4 (purple) andgroup 5 (red). The most frequent chromosomallosses were of entire arms, and are listed onlyby chromosome number. Common arm lossesinclude: 22q, 14q, 1p, 18q, 6q, 10q, 11p, 7pand 4p.
Lee et al Genomic Landscape of Meningiomas
5Brain Pathology (2009)
© 2009 The Authors; Journal Compilation © 2009 International Society of Neuropathology
mutations with recurrence. Based on chromosomal loss patterns,recurrent grade II and III meningiomas had an average of 8.3chromosomal arm losses vs. 3.9 chromosomal losses observedamong grade II and III newly resected meningiomas (Kruskal–Wallis P value = 0.0077). Seven chromosomal arm losses weresignificantly more common in the recurrent meningiomas:18q (Fisher’s exact two-tailed P value = 0.0002), 6q (Pvalue = 0.0021), 10q (P value = 0.0099), 16q (P value = 0.017), 2p(P value = 0.017), 14q (P value = 0.017) and 18p (P value = 0.03).In order to assess if the great increase in chromosomal anomalies inthe recurrent samples was potentially caused by artifacts of brainirradiation-induced chromosomal loss, we compared recurrenttumors that had not received radiation with nonrecurrent tumorsnot treated with radiation, and identified that 6q loss was enrichedin recurrent samples (P value = 8.0 ¥ 10–4), and 14q loss wasenriched in recurrent samples (P value = 2.8 ¥ 10–3). This indicatesthat some of the genetic abnormalities in the recurrent tumors arenot artifacts introduced by radiation. These data suggest that chro-mosomal arm loss of a series of specific chromosomes is a morereliable indicator of recurrence than Ki-67 staining.
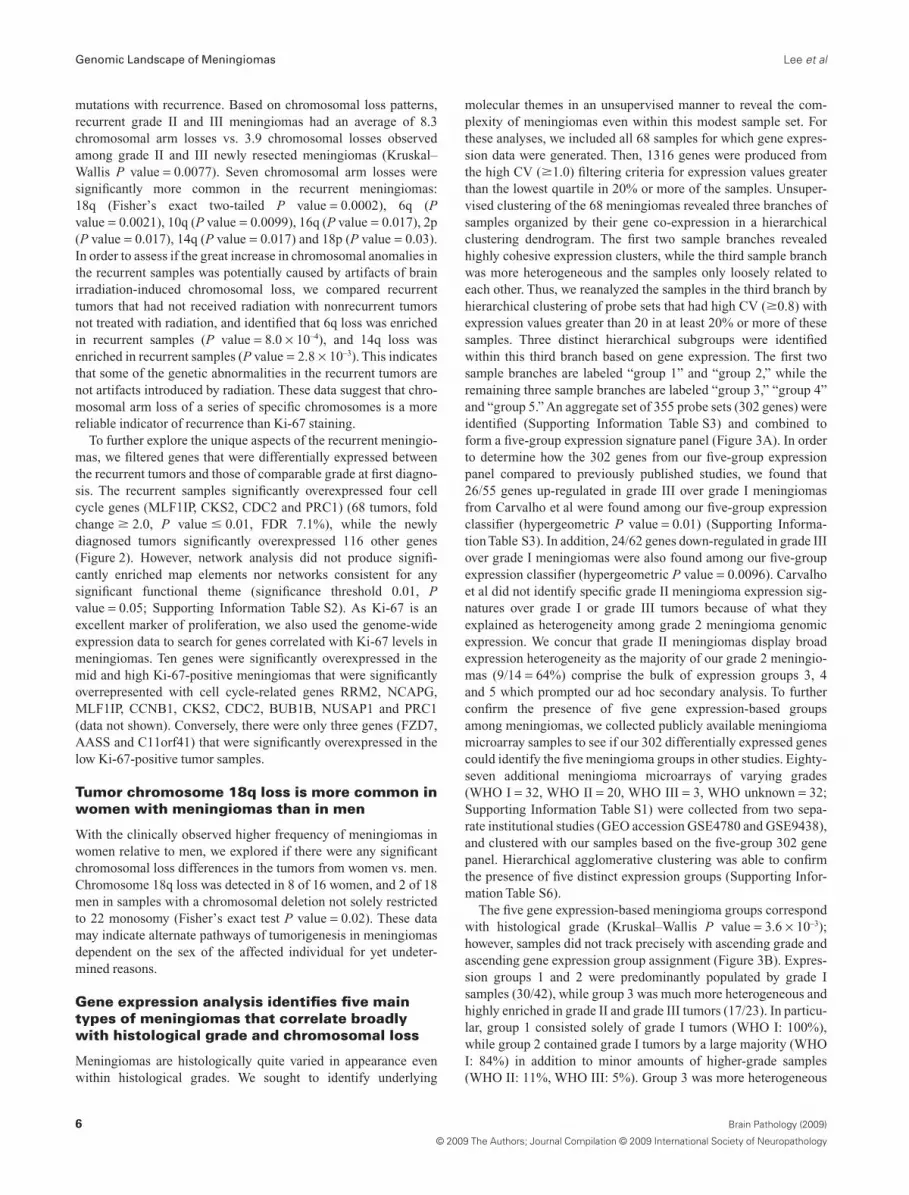
To further explore the unique aspects of the recurrent meningio-mas, we filtered genes that were differentially expressed betweenthe recurrent tumors and those of comparable grade at first diagno-sis. The recurrent samples significantly overexpressed four cellcycle genes (MLF1IP, CKS2, CDC2 and PRC1) (68 tumors, foldchange � 2.0, P value � 0.01, FDR 7.1%), while the newlydiagnosed tumors significantly overexpressed 116 other genes(Figure 2). However, network analysis did not produce signifi-cantly enriched map elements nor networks consistent for anysignificant functional theme (significance threshold 0.01, Pvalue = 0.05; Supporting Information Table S2). As Ki-67 is anexcellent marker of proliferation, we also used the genome-wideexpression data to search for genes correlated with Ki-67 levels inmeningiomas. Ten genes were significantly overexpressed in themid and high Ki-67-positive meningiomas that were significantlyoverrepresented with cell cycle-related genes RRM2, NCAPG,MLF1IP, CCNB1, CKS2, CDC2, BUB1B, NUSAP1 and PRC1(data not shown). Conversely, there were only three genes (FZD7,AASS and C11orf41) that were significantly overexpressed in thelow Ki-67-positive tumor samples.
Tumor chromosome 18q loss is more common inwomen with meningiomas than in men
With the clinically observed higher frequency of meningiomas inwomen relative to men, we explored if there were any significantchromosomal loss differences in the tumors from women vs. men.Chromosome 18q loss was detected in 8 of 16 women, and 2 of 18men in samples with a chromosomal deletion not solely restrictedto 22 monosomy (Fisher’s exact test P value = 0.02). These datamay indicate alternate pathways of tumorigenesis in meningiomasdependent on the sex of the affected individual for yet undeter-mined reasons.
Gene expression analysis identifies five maintypes of meningiomas that correlate broadlywith histological grade and chromosomal loss
Meningiomas are histologically quite varied in appearance evenwithin histological grades. We sought to identify underlying
molecular themes in an unsupervised manner to reveal the com-plexity of meningiomas even within this modest sample set. Forthese analyses, we included all 68 samples for which gene expres-sion data were generated. Then, 1316 genes were produced fromthe high CV (�1.0) filtering criteria for expression values greaterthan the lowest quartile in 20% or more of the samples. Unsuper-vised clustering of the 68 meningiomas revealed three branches ofsamples organized by their gene co-expression in a hierarchicalclustering dendrogram. The first two sample branches revealedhighly cohesive expression clusters, while the third sample branchwas more heterogeneous and the samples only loosely related toeach other. Thus, we reanalyzed the samples in the third branch byhierarchical clustering of probe sets that had high CV (�0.8) withexpression values greater than 20 in at least 20% or more of thesesamples. Three distinct hierarchical subgroups were identifiedwithin this third branch based on gene expression. The first twosample branches are labeled “group 1” and “group 2,” while theremaining three sample branches are labeled “group 3,” “group 4”and “group 5.” An aggregate set of 355 probe sets (302 genes) wereidentified (Supporting Information Table S3) and combined toform a five-group expression signature panel (Figure 3A). In orderto determine how the 302 genes from our five-group expressionpanel compared to previously published studies, we found that26/55 genes up-regulated in grade III over grade I meningiomasfrom Carvalho et al were found among our five-group expressionclassifier (hypergeometric P value = 0.01) (Supporting Informa-tion Table S3). In addition, 24/62 genes down-regulated in grade IIIover grade I meningiomas were also found among our five-groupexpression classifier (hypergeometric P value = 0.0096). Carvalhoet al did not identify specific grade II meningioma expression sig-natures over grade I or grade III tumors because of what theyexplained as heterogeneity among grade 2 meningioma genomicexpression. We concur that grade II meningiomas display broadexpression heterogeneity as the majority of our grade 2 meningio-mas (9/14 = 64%) comprise the bulk of expression groups 3, 4and 5 which prompted our ad hoc secondary analysis. To furtherconfirm the presence of five gene expression-based groupsamong meningiomas, we collected publicly available meningiomamicroarray samples to see if our 302 differentially expressed genescould identify the five meningioma groups in other studies. Eighty-seven additional meningioma microarrays of varying grades(WHO I = 32, WHO II = 20, WHO III = 3, WHO unknown = 32;Supporting Information Table S1) were collected from two sepa-rate institutional studies (GEO accession GSE4780 and GSE9438),and clustered with our samples based on the five-group 302 genepanel. Hierarchical agglomerative clustering was able to confirmthe presence of five distinct expression groups (Supporting Infor-mation Table S6).
The five gene expression-based meningioma groups correspondwith histological grade (Kruskal–Wallis P value = 3.6 ¥ 10–3);however, samples did not track precisely with ascending grade andascending gene expression group assignment (Figure 3B). Expres-sion groups 1 and 2 were predominantly populated by grade Isamples (30/42), while group 3 was much more heterogeneous andhighly enriched in grade II and grade III tumors (17/23). In particu-lar, group 1 consisted solely of grade I tumors (WHO I: 100%),while group 2 contained grade I tumors by a large majority (WHOI: 84%) in addition to minor amounts of higher-grade samples(WHO II: 11%, WHO III: 5%). Group 3 was more heterogeneous
Genomic Landscape of Meningiomas Lee et al
6 Brain Pathology (2009)
© 2009 The Authors; Journal Compilation © 2009 International Society of Neuropathology
with respect to histological grade as it contained fewer grade Itumors than in groups 1 and 2 (70% vs. 100% and 84%, respec-tively), and more grade II (20%) and grade III (10%) meningiomas.Group 4 predominantly contained grade II meningiomas (58%),and minor populations of grade I (33%) and grade III (8%) tumors.Finally, group 5 had the largest proportion of grade III meningio-mas (18%), and a substantial number of grade I (47%) and grade II
(35%) tumors. Thus, while a trend was evident, there wasno perfect correspondence of higher-grade tumors with thegene expression categories (Supporting Information Table S1).However, while there existed no significant correlation betweenascending gene expression categories with age (Kendall’s rankcorrelation P value = 0.86), a significant correlation was foundwith ascending gene expression categories and gender. Lower gene
Figure 2. Identification of gene expression correlated with recurrentmeningioma. Recurrent meningiomas (n = 8) were compared againstnewly diagnosed meningiomas with a twofold difference and a signifi-cance threshold of P value = 0.01, which found 120 unique genes with afalse discovery rate of 6.9%. Genes and samples were hierarchicallyclustered, and the relative gene expression values were plotted in color.Red is increased expression relative to the overall set of samples, andgreen is lower expression relative to all of the samples. Header tracks:
World Health Organization grade I (yellow), grade II (blue) and grade III(red). Meningioma five groups: 1 (yellow), 2 (green), 3 (blue), 4 (purple)and 5 (red). Recurrence status: newly diagnosed meningioma (codifiedvalue = 0), recurrent meningioma (codified value = 1). Ki-67 mean: lowKi-67 labeling (codified value = L), midrange (codified value = M) andhigh (codified value = H). The color bar below maps the relative differ-ences in expression converted to log base 2 values.
Lee et al Genomic Landscape of Meningiomas
7Brain Pathology (2009)
© 2009 The Authors; Journal Compilation © 2009 International Society of Neuropathology

Figure 3. Five-group gene expression-based categorization of menin-giomas. A. Five group meningioma profiles identified by whole-genomeexpression comparisons. The five-group expression classifier is com-posed of 302 unique genes that classify each meningioma (N = 68) intoone of the five groups. Header tracks: World Health Organization grade I(yellow), grade II (blue) and grade III (red). Meningioma five groups: 1(yellow), 2 (green), 3 (blue), 4 (purple) and 5 (red). Recurrence status:
newly diagnosed meningioma: (codified value = 0); recurrent menin-gioma: (codified value = 1). B. Top pie charts indicate the relative portionof each of the three histological grades in each of the five geneexpression-based groups, and the bottom pie charts illustrate the distri-bution of the five different gene expression-based groups within thethree histological grades.
Genomic Landscape of Meningiomas Lee et al
8 Brain Pathology (2009)
© 2009 The Authors; Journal Compilation © 2009 International Society of Neuropathology
expression categories appeared to demonstrate bias toward femaletumor enrichment, while male tumors appeared more frequently inhigher gene expression categories after controlling for initialgender selection bias [group 1 (female : male ratio = 2:1), group 2(female : male ratio = 3:1), group 3 (female : male ratio = 1:1.6),Kendall’s rank correlation P value = 0. 01].
MetaCore network pathway analysis identified 30 significantnetworks among the 168 genes distinctly expressed in groups 1 and2, with the 129 genes distinctly expressed in group 3 (hypergeo-metric P value range: 2.04 ¥ 10–39 to 9.69 ¥ 10–4; Supporting Infor-mation Table S3). Almost one quarter of these networks (23%)were found to involve a kinase signaling pathway where group 1and 2 meningiomas were found to express a different set of kinasepathway members (MYLK, PRKD1, NTRK2, ROR1, TNIK andPRKG1) than those expressed by group 3 meningiomas (EPHA3,DCLK1, PDK1, MET, EPHA7, INSR and ABP1). Moreover,the remaining 23 networks demonstrated GO processes spanningcancer-related themes: regulation of cell death (11/50, hypergeo-metric P value = 8.7 ¥ 10–8) and regulation of cell proliferation(20/50, P value = 3.5 ¥ 10–15); developmental regulation: anatomi-cal structure morphogenesis (11/50, P value = 1.5 ¥ 10–11),nervous system development (22/50, P value = 1.2 ¥ 10–6) andorgan development (8/50, P value = 8.8 ¥ 10–19); and several meta-bolic processes: protein amino acid O-linked glycosylation viathreonine (7/50, P value = 1.8 ¥ 10–3), regulation of adenylatecyclase activity (14/50, P value = 1.7 ¥ 10–10) and fatty acid bio-synthetic process (11/50, P value = 2.6 ¥ 10–8).
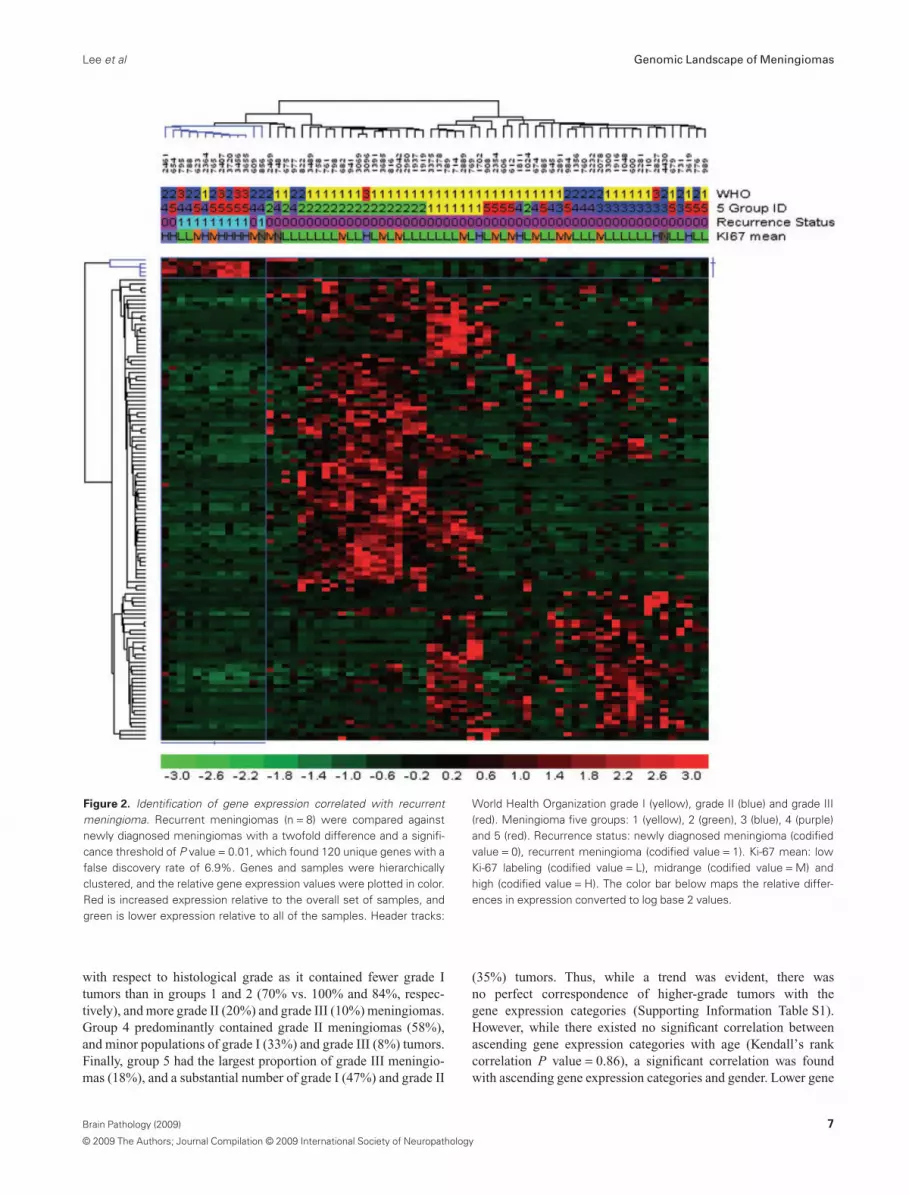
The expression-based groups also clustered all of the recurrentmeningiomas among group 3 (Fisher’s exact P value = 3.0 ¥ 10–4);however, this is likely caused by the preponderance of higher-gradetumors clustering among this expression group as 8/9 recurrenttumors were grade II or grade III from the outset. Among the fivegene expression-based groups, the chromosomal loss patternsobserved across the groups were strikingly different (Figure 4). Inaggregate, the median number of chromosome arms lost per groupwas significantly smaller in group 1, and significantly higher ingroup 3 than the others (group 1 = 0, group 2 = 1.0, group 3 = 2.5,group 4 = 2.5 and group 5 = 6.0; Kruskal–Wallis rank sum test Pvalue = 1.2 ¥ 10–3).
Combined use of gene expression data andchromosomal loss data to identify potentialtumor suppressors
We attempted to use the combined SNP/gene expression data tosuggest candidate tumor suppressor genes within the more com-monly deleted chromosomes other than chromosome 22. First, wedetermined the minimal regions of common loss on the commonlydeleted chromosomal regions among the grade III samples, thegrade III and II samples and grade II and grade I samples using the“minimal loss rank ordering” and “drill down” features systemati-cally with Nexus copy number analysis software. Shared minimalloss regions were easily identified through Nexus’s output files(Supporting Information Table S4). We then hypothesized that thecausative genes that are mutational targets are more likely to bedown-regulated in expression either by mutations on the nonde-leted chromosome (that would lead to a premature stop and lowerthe mRNA abundance through nonsense mediated decay) or bysmaller-scale deletions/mutations invisible by the SNP arrays that
lead to complete lack of the mRNA. Using this combinationapproach, we highlight a series of genes within the chromosomalregions more frequently deleted in the grade III tumors (SupportingInformation Table S4). As an example, the minimal region of losson 11q (11q23.1-q23.2) contains 42 genes. However, only one ofthese genes, TIMM8B, was lower in expression in the three deletedsamples than in the other nondeleted grade III tumors. No muta-tions of this gene in meningioma have yet been described. Simi-larly, 20p was deleted in three of the grade III tumors and contained21 genes, but only one, C20orf7, was down-regulated in thegrade III samples relative to the lower-grade samples. Using thisapproach to search for mutated genes, we looked at genes that maybe highlighted by comparing chromosome losses between expres-sion group profiles which highlighted CDC14A at 1p21 in adeleted interval between 1p36.13 and 1p36.11. Decreased expres-sion of CDC14A was identified from comparing expression differ-ences among the 44 genes at this locus between group 4 and 5samples carrying the deletion (12/17), and group 4 and 5 samples(5/17) lacking the deletion. This is an attractive candidate tumorsuppressor in meningiomas based on previously published func-tional data (18).
Identification of meningioma-specific genes
The determination of five separate expression-based subclassesand the tremendous variability of chromosomal losses betweenmeningiomas analyzed here highlight the diversity of moleculartypes of meningiomas, and prompted us to determine if there were
Figure 4. Median number of chromosome losses varies by geneexpression-based group. The y-axis plots the number of whole armlosses per sample for each of the five gene expression-based groups.Group 1 samples (n = 7) have median chromosome loss = 0, group 2samples (n = 19) have median chromosome loss = 1.0, group 3 samples(n = 10) have median chromosome loss = 2.5, group 4 samples (n = 13)have median chromosome loss = 2.5 and group 5 samples (n = 17) havemedian chromosome loss = 6.0.
Lee et al Genomic Landscape of Meningiomas
9Brain Pathology (2009)
© 2009 The Authors; Journal Compilation © 2009 International Society of Neuropathology
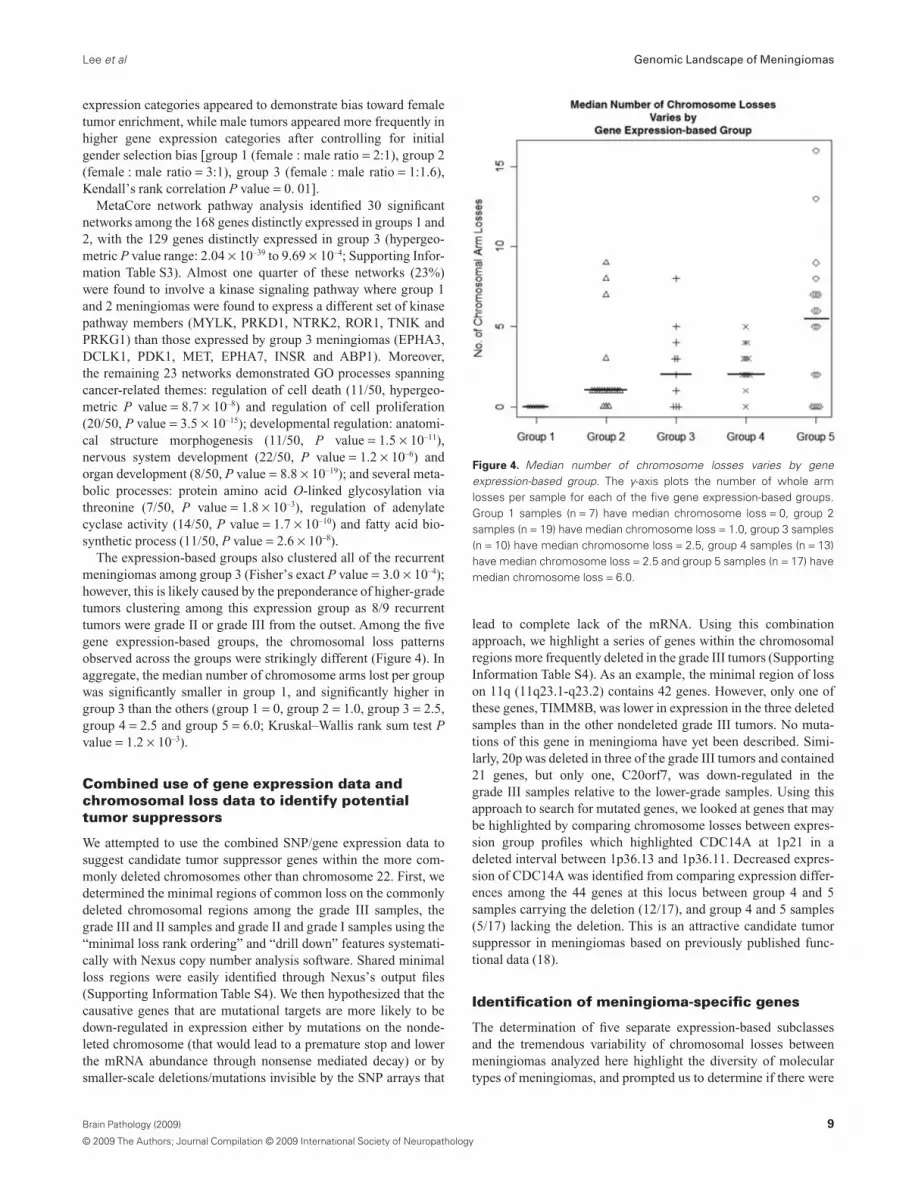
features shared in common across all meningiomas relative to otherbrain cancer types and normal brain and nonbrain tissues. We thuscompared the 65 meningioma expression samples to available datafrom 533 other expression samples that consisted of various gliomasamples from prior published work of ours and other colleagues (7,20, 21, 26, 28, 31), which are available and co-normalized withinthe Celsius database. Comparing meningiomas to this panel of 389gliomas and 144 normal tissues revealed a large set of genes, whichcan robustly differentiate all of the meningiomas from any of theother neoplastic and non-neoplastic tissues. There are a surpris-ingly large number of genes (n = 4912) that were identified ashigher expressed in meningiomas than in normal tissues andgliomas (fold change = 2.0, P value = 0.05) with an overall FDR of0.1%. In order to identify genes strongly and specifically correlatedwith meningiomas, regardless of grade, genes were filtered basedon a fold increased expression in meningiomas of at least 10 andP value less than 0.001. These criteria identified 130 highlymeningioma-specific genes (FDR 0%) relative to all of the othertissues (Supporting Information Table S5). These genes were con-sistently expressed across all 65 meningiomas indicating manycommon features of the histologically and genetically diverse panelof meningiomas (Figure 5). To better characterize this observation,these genes were analyzed to identify enriched biological themesusing the network analysis mining tool available through Meta-Core. One hundred thirty MetaCore objects were recognized, and13 annotated map themes contained statistically significant onto-logical terms among these genes. Prominent themes consisted ofdevelopment: WNT signaling pathway (5/53 map objects; hyper-geometric P value = 1.69 ¥ 10–2); cytoskeleton remodeling: role ofPDGFs in cell migration (3/21 map objects; P value = 2.12 ¥ 10–2)and GTP metabolism (4/40 map objects; P value = 2.66 ¥ 10–2).Finally, transcripts that encoded known secreted proteins wereidentified as potential targets for blood-based diagnostics and arelisted in Supporting Information Table S5.
DISCUSSIONMeningiomas, like many histologically defined tumors, are not ahomogeneous set of cancers. Meningiomas vary in histologicalcharacteristics, chromosomal aberration profiles and gene expres-sion programs. Histologically, while meningioma lesions are cat-egorized into threeWHO grades, there are 15 histological variants ofmeningiomas spread across the three grades (WHO I: nine sub-classes; WHO II: three subclasses; WHO III: three subclasses) (29).By our molecular analyses, it is evident that there are three to foursubpopulations of WHO I meningiomas based on their variouschromosomal loss profiles: a majority that does not experiencechromosome deletions by the time of surgical resection, a secondarypopulation with 22 monosomy alone, a group that loses 22q in
conjunction with 1p and a group that loses chromosome 1p but not22q. Karyotypic abnormalities are also known to be more extensivein atypical and anaplastic meningiomas, and this is supported by ourdata (1). For instance, only 10% of the grade II meningiomas had nodetectable aneuploidy, while 44% of the grade I samples had noaneuploidy. All grade III tumors had multiple whole chromosomearm losses. The genome-wide SNP assessment is generally concor-dant with previous reports which indicate that the most frequentlosses in grade II tumors are 22q, 1p, 6q and 18, followed by 6p and14q in that order (12, 22). However, in our data set of grade II tumors,we observed a different rank order where 22q deletions remain themost frequent genetic aberration (85%), followed by 14q (60%), 1p(55%), 6q (25%) and 18q (20%). Thus, chromosomal-scale abnor-malities are a major mechanism of mutation in meningiomas, butwith unclear basis at the individual gene level at this time.
To provide insight at the individual gene level, we used thewhole-genome expression data to identify expression patterns inmeningiomas of different grade and with different chromosomalloss patterns, and note that these categories correspond well withrecurrent or nonrecurrent meningioma, and thus we propose that anexpression-based classifier may ultimately be able to better identifywhich meningiomas are more likely to recur, but these studies willrequire prospective analysis of individual patient samples at thetime of initial diagnosis with sufficient follow-up such that theobserved chromosomal losses would be detected at recurrence.
The integration of high-resolution chromosome loss data withwhole-genome expression data provides the opportunity to explorethese joint data sets to highlight potential tumor suppressor genesin loss regions in which the candidate genes on the remaining allelehave been silenced either through inactivating mutations, epige-netic silencing or nonsense mutations that lead to lower mRNAabundance. We suggest a series of genes that may act as tumorsuppressors based on their location within commonly lost genomicintervals and decreased expression in subsets of the meningiomas.For instance, within the common loss regions in the grade IIItumors, two of the down-regulated genes TRIB2 (2p25.1-p24.3)and ADI1 (2p25.3) may contribute to the malignancy of gradeIII meningiomas by evading apoptosis. TRIB2 and ADI1 arepro-apoptotic molecules whose normal expression induces apopto-sis (15). However, ADI1 is an invasion suppressor that hasbeen seen to be down-regulated in tumors (34). Further, cyclin-dependent kinase inhibitor 1C (CDKN1C) (p57, Kip2) (11p15.5 )is a noteworthy tumor suppressor candidate in meningioma basedon the genetic experiments performed here. Decreased expressionof CDKN1C has been associated with the occurrence and progres-sion of pancreatic cancer (37). However, the mechanism fordecreased expression detected in the meningiomas warrants furtherstudy as decreased expression has been reported because of aber-rant methylation in lung, breast and malignant mesotheliomas
Figure 5. Directed comparison of all meningioma samples relative tocombined glioma and normal tissues identifies meningioma-specificgenes. Normal tissues (n = 144) and gliomas (n = 389) were comparedagainst meningiomas (n = 65) with a 10.0-fold and significance threshold
P value = 0.01, which found 130 unique genes expressed in meningio-mas with a false discovery rate of 0.0%. Header track: normal tissue(green), gliomas (blue) and meningiomas (red).
Genomic Landscape of Meningiomas Lee et al
10 Brain Pathology (2009)
© 2009 The Authors; Journal Compilation © 2009 International Society of Neuropathology
(11), and de novo mutations in sporadic cancers in Beckwith–Wiedemann syndrome.
CONCLUSIONSOur analysis assembled the largest set of biopsied meningiomas forcombined whole-genome copy number and expression studies todate. Whole-genome copy number arrays with over 100 000 SNPsper microarray on 85 patient unique biopsies identified a compre-hensive series of large-scale chromosomal deletions that occurredincreasingly in higher-grade samples with varying profiles. Thecombination of these data highlights various genes of interest,and provides a clearer picture of the molecular landscape ofmeningiomas.
ACKNOWLEDGMENTSThe authors wish to thank the UCLA subjects for their participa-tion in this study. The work was supported by the NIH Neuro-science Microarray Consortium UCLA Site (U24NS052108), theUCLA Gene Expression Shared Resource of the Jonsson Compre-hensive Cancer Center, the Singleton Brain Tumor Program and theWilson Meningioma Fund.
REFERENCES1. Al-Mefty O, Kadri PA, Pravdenkova S, Sawyer JR, Stangeby C,
Husain M (2004) Malignant progression in meningioma:documentation of a series and analysis of cytogenetic findings. JNeurosurg 101:210–218.
2. Ammerlaan A, Houben M, Tijssen CC, Wesseling P, Hulsebos TJ(2008) Secondary meningioma in a long-term survivor of atypicalteratoid/rhabdoid tumour with a germline INI1 mutation. Childs NervSyst 24:855–857.
3. Bolstad BM, Irizarry RA, Astrand M, Speed TP (2003) A comparisonof normalization methods for high density oligonucleotide array databased on variance and bias. Bioinformatics 19:185–193.
4. Carvalho LH, Smirnov I, Baia GS, Modrusan Z, Smith JS, Jun P et al(2007) Molecular signatures define two main classes of meningiomas.Mol Cancer 6:64.
5. Chamberlain MC, Tsao-Wei DD, Groshen S (2004) Temozolomidefor treatment-resistant recurrent meningioma. Neurology62:1210–1212.
6. Day A, Carlson MR, Dong J, O’Connor BD, Nelson SF (2007)Celsius: a community resource for Affymetrix microarray data.Genome Biol 8:R112.
7. Freije WA, Castro-Vargas FE, Fang Z, Horvath S, Cloughesy T, LiauLM et al (2004) Gene expression profiling of gliomas stronglypredicts survival. Cancer Res 64:6503–6510.
8. Gentleman RC, Carey VJ, Bates DM, Bolstad B, Dettling M, DudoitS et al (2004) Bioconductor: open software development forcomputational biology and bioinformatics. Genome Biol 5:R80.
9. Gutmann DH, Donahoe J, Perry A, Lemke N, Gorse K, Kittiniyom Ket al (2000) Loss of DAL-1, a protein 4.1-related tumor suppressor, isan important early event in the pathogenesis of meningiomas. HumMol Genet 9:1495–1500.
10. Hehir-Kwa JY, Egmont-Petersen M, Janssen IM, Smeets D, vanKessel AG, Veltman JA (2007) Genome-wide copy numberprofiling on high-density bacterial artificial chromosomes,single-nucleotide polymorphisms, and oligonucleotide
microarrays: a platform comparison based on statistical poweranalysis. DNA Res 14:1–11.
11. Kobatake T, Yano M, Toyooka S, Tsukuda K, Dote H, Kikuchi T et al(2004) Aberrant methylation of p57KIP2 gene in lung and breastcancers and malignant mesotheliomas. Oncol Rep 12:1087–1092.
12. Lamszus K, Kluwe L, Matschke J, Meissner H, Laas R, Westphal M(1999) Allelic losses at 1p, 9q, 10q, 14q, and 22q in the progression ofaggressive meningiomas and undifferentiated meningeal sarcomas.Cancer Genet Cytogenet 110:103–110.
13. Lee JY, Finkelstein S, Hamilton RL, Rekha R, King JT, Jr, Omalu B(2004) Loss of heterozygosity analysis of benign, atypical, andanaplastic meningiomas. Neurosurgery 55:1163–1173.
14. Lekanne Deprez RH, Riegman PH, Groen NA, Warringa UL, vanBiezen NA, Molijn AC et al (1995) Cloning and characterization ofMN1, a gene from chromosome 22q11, which is disrupted by abalanced translocation in a meningioma. Oncogene 10:1521–1528.
15. Lin KR, Lee SF, Hung CM, Li CL, Yang-Yen HF, Yen JJ (2007)Survival factor withdrawal-induced apoptosis of TF-1 cells involves aTRB2-Mcl-1 axis-dependent pathway. J Biol Chem282:21962–21972.
16. Loven D, Hardoff R, Sever ZB, Steinmetz AP, Gornish M, RappaportZH et al (2004) Non-resectable slow-growing meningiomas treated byhydroxyurea. J Neurooncol 67:221–226.
17. Lusis E, Gutmann DH (2004) Meningioma: an update. Curr OpinNeurol 17:687–692.
18. Mailand N, Lukas C, Kaiser BK, Jackson PK, Bartek J, Lukas J(2002) Deregulated human Cdc14A phosphatase disrupts centrosomeseparation and chromosome segregation. Nat Cell Biol 4:317–322.
19. McMullen KP, Stieber VW (2004) Meningioma: current treatmentoptions and future directions. Curr Treat Options Oncol 5:499–450.
20. Mischel PS, Shai R, Shi T, Horvath S, Lu KV, Choe G et al (2003)Identification of molecular subtypes of glioblastoma by geneexpression profiling. Oncogene 22:2361–2373.
21. Nutt CL, Mani DR, Betensky RA, Tamayo P, Cairncross JG, Ladd Cet al (2003) Gene expression-based classification of malignantgliomas correlates better with survival than histological classification.Cancer Res 63:1602–1607.
22. Ozaki S, Nishizaki T, Ito H, Sasaki K (1999) Comparative genomichybridization analysis of genetic alterations associated with malignantprogression of meningioma. J Neurooncol 41:167–174.
23. Perry A, Gutmann DH, Reifenberger G (2004) Molecularpathogenesis of meningiomas. J Neurooncol 70:183–202.
24. Peyrard M, Pan HQ, Kedra D, Fransson I, Swahn S, Hartman K et al(1996) Structure of the promoter and genomic organization of thehuman beta′-adaptin gene (BAM22) from chromosome 22q12.Genomics 36:112–117.
25. Peyrard M, Seroussi E, Sandberg-Nordqvist AC, Xie YG, Han FY,Fransson I et al (1999) The human LARGE gene from 22q12.3-q13.1is a new, distinct member of the glycosyltransferase gene family. ProcNatl Acad Sci U S A 96:598–603.
26. Phillips HS, Kharbanda S, Chen R, Forrest WF, Soriano RH, Wu TDet al (2006) Molecular subclasses of high-grade glioma predictprognosis, delineate a pattern of disease progression, and resemblestages in neurogenesis. Cancer Cell 9:157–173.
27. Ragel BT, Jensen RL (2005) Molecular genetics of meningiomas.Neurosurg Focus 19:E9.
28. Rich JN, Hans C, Jones B, Iversen ES, McLendon RE, Rasheed BKet al (2005) Gene expression profiling and genetic markers inglioblastoma survival. Cancer Res 65:4051–4058.
29. Riemenschneider MJ, Perry A, Reifenberger G (2006) Histologicalclassification and molecular genetics of meningiomas. Lancet Neurol5:1045–1054.
Lee et al Genomic Landscape of Meningiomas
11Brain Pathology (2009)
© 2009 The Authors; Journal Compilation © 2009 International Society of Neuropathology

30. Schmitz U, Mueller W, Weber M, Sévenet N, Delattre O, vonDeimling A (2001) INI1 mutations in meningiomas at a potentialhotspot in exon 9. Br J Cancer 84:199–201.
31. Shai R, Shi T, Kremen TJ, Horvath S, Liau LM, Cloughesy TF et al(2003) Gene expression profiling identifies molecular subtypes ofgliomas. Oncogene 22:4918–4923.
32. Slater HR, Bailey DK, Ren H, Cao M, Bell K, Nasioulas S et al(2005) High-resolution identification of chromosomal abnormalitiesusing oligonucleotide arrays containing 116,204 SNPs. Am J HumGenet 77:709–726.
33. Sulman EP, White PS, Brodeur GM (2004) Genomic annotation ofthe meningioma tumor suppressor locus on chromosome 1p34.Oncogene 23:1014–1020.
34. Uekita T, Gotoh I, Kinoshita T, Itoh Y, Sato H, Shiomi T et al (2004)Membrane-type 1 matrix metalloproteinase cytoplasmic tail-bindingprotein-1 is a new member of the cupin superfamily. A possiblemultifunctional protein acting as an invasion suppressordown-regulated in tumors. J Biol Chem 279:12734–12743.
35. Ware ML, Larson DA, Sneed PK, Wara WW, McDermott MW (2004)Surgical resection and permanent brachytherapy for recurrent atypicaland malignant meningioma. Neurosurgery 54:55–63; discussion 4.
36. Wrobel G, Roerig P, Kokocinski F, Neben K, Hahn M, ReifenbergerG, Lichter P (2005) Microarray-based gene expression profiling ofbenign, atypical and anaplastic meningiomas identifies novel genesassociated with meningioma progression. Int J Cancer 114:249–256.
37. Yue H, Jiang HY (2005) Expression of cell cycle regulator p57kip2,cyclinE protein and proliferating cell nuclear antigen in humanpancreatic cancer: an immunohistochemical study. World JGastroenterol 11:5057–5060.
SUPPORTING INFORMATIONAdditional Supporting Information may be found in the onlineversion of this article:
Table S1. Patient and biopsy information: time of survival (days),sex, age, recurrence, Ki-67, etc. Additionally collected menin-gioma microarray samples GSE4780 and GSE9438.Table S2. Recurrent vs. newly diagnosed meningioma differen-tially expressed genes. Grade-based loss regions.Table S3. Five group expression gene list tables. MetaCore genelist map elements. Differentially expressed kinase lists. Carvalhoet al shared genes.Table S4. Minimal overlap loss regions and down-regulated genesby grade. Minimal overlap loss regions and down-regulated genesby expression group.Table S5. Meningioma-specific gene lists. MetaCore gene list mapelements. Secreted protein transcript list.Table S6. Combined UCLA and publicly collected microarraysclustered by five-group gene expression classifier. Header tracks:World Health Organization grade I (yellow), grade II (blue), gradeIII (red) and unknown (codified = N, sample numbers highlightedin blue). Meningioma five groups: 1 (yellow), 2 (green), 3 (blue),4 (purple) and 5 (red). Recurrence status: newly diagnosedmeningioma: (codified value = 0), recurrent meningioma: (codi-fied value = 1), unknown status (codified = N). GEO accessionsource: UCLA (n = 68, GSE16584, orange), (n = 56, GSE4780,gray), (n = 31, GSE9438, dark blue).
Please note: Wiley-Blackwell are not responsible for the content orfunctionality of any supporting materials supplied by the authors.Any queries (other than missing material) should be directed to thecorresponding author for the article.
Genomic Landscape of Meningiomas Lee et al
12 Brain Pathology (2009)
© 2009 The Authors; Journal Compilation © 2009 International Society of Neuropathology


