Embed Size (px)
Citation preview
Genetic Variability, Differentiation, and FounderEffect in Golden Jackals (Canis aureus) from Serbiaas Revealed by Mitochondrial DNA and NuclearMicrosatellite Loci
Frank E. Zachos Æ Dusko Cirovic Æ Julia Kirschning ÆMarthe Otto Æ Gunther B. Hartl Æ Britt Petersen ÆAnn-Christin Honnen
Received: 8 April 2008 / Accepted: 8 September 2008 / Published online: 24 January 2009
� Springer Science+Business Media, LLC 2009
Abstract We analyzed 121 golden jackals (Canis aureus) from six sample sites in
Serbia with regard to genetic variability and differentiation as revealed by mito-
chondrial control region sequences and eight nuclear microsatellite loci. There was
no variation at all in the mtDNA sequences, and nuclear variability was very low
(average observed and expected heterozygosity of 0.29 and 0.34, respectively). This
is in line with the considerable recent range expansion of this species in the Balkans
and indicates a strong founder effect in the recently established Serbian population.
We did not find evidence of differentiation between the northeastern jackals and
those from the plain of Srem or those in between. F-statistics and Bayesian
Structure analyses, however, were indicative of a low degree of overall differenti-
ation in the Serbian population. A vagrant Austrian jackal that was also analyzed
was genetically indistinguishable from its Serbian conspecifics.
Keywords Canis aureus � Serbia � Founder effect � Microsatellites �Mitochondrial DNA
Introduction
The golden jackal (Canis aureus Linnaeus 1758) is one of the most widespread
canid species, occurring in southeastern Europe, northern and eastern Africa, and in
large parts of Asia eastward to Thailand (Demeter and Spassov 1993). The northern
F. E. Zachos (&) � J. Kirschning � M. Otto � G. B. Hartl � B. Petersen � A.-C. Honnen
Zoological Institute, Christian-Albrechts-University, Olshausenstrasse 40, Kiel 24118, Germany
e-mail: [email protected]
D. Cirovic
Faculty of Biology, University of Belgrade, Belgrade, Serbia
123
Biochem Genet (2009) 47:241–250
DOI 10.1007/s10528-009-9221-y
border of the European resident population is along the Danube in Romania and
former Yugoslavia (Krystufek et al. 1997). Golden jackals are found in the
Caucasus, Turkish Thrace, Greece, Bulgaria, Albania, along the eastern Adriatic
coast, and in Romania; Serbia has recently been recolonized (Mitchell-Jones et al.
1999). Apart from Greece, where the jackals are on the decline and listed as
vulnerable in the national Red List (Giannatos et al. 2005), the species has expanded
its European distribution range, most notably in Bulgaria, where there was a 33-fold
increase in the area inhabited by jackals between the 1960s and the 1980s and which
now supports the largest jackal population in Europe (Genov and Wassilev 1989;
Krystufek and Tvrtkovic 1990; Krystufek et al. 1997). Vagrant animals have
repeatedly been recorded from northeastern Italy, Slovenia, Hungary, Austria,
Slovakia, and Macedonia (Krystufek et al. 1997; Bauer and Suchentrunk 1995). The
golden jackal generally seems to benefit from the extinction of local wolf
populations, although in eastern Serbia both species occur sympatrically (Milenko-
vic 1987).
In Serbia, Milenkovic (1987) and Krystufek et al. (1997) reported two permanent
populations, one in the plain of Srem and one in the northeastern part of the country
(Negotin). From the Srem population, which probably established itself in the
1980s, vagrant jackals reached Hungary and Slovakia. The northeastern population
is probably an offshoot of the Bulgarian range expansion (Krystufek et al. 1997; see
also Milenkovic 1987). At present, however, these two populations cannot be
considered disjunct (see also map in Mitchell-Jones et al. 1999), and it is possible
that one gave rise to the other.
From the Late Pleistocene, there are no records of the golden jackal in Europe,
and the only subfossil European jackals are four records from the Neolithic in
Greece (Kitsos and Delphi) (Sommer and Benecke 2005). The jackal is thus a very
young European element, but the hypothesis that the European population goes back
to the introduction of jackals from northern Africa in the 15th century (Kuhn 1935)
is now generally rejected (Demeter and Spassov 1993).
Despite the widespread occurrence of the golden jackal, as yet no population
genetic study has been carried out on this species, except for the analysis of 18
specimens from Kenya, which, however, were used only as a comparison sample in
a study on North American canids by Roy et al. (1994).
This study represents, to our knowledge, the first thorough analysis of
genetic variability and differentiation in the golden jackal, aiming at (a)
genetically characterizing the Serbian population and looking for a signature of
the recent range expansion, which is expected to have resulted in low genetic
diversity, and (b) looking for potential differentiation between Negotin
(representing the northeastern population) and the plain of Srem or other
Serbian jackals. The markers chosen, sequences of the mitochondrial control
region and nuclear microsatellite loci, are known for their high intraspecific
variability and have been used successfully in population and conservation
genetic studies before (e.g., Hajji et al. 2007; Ben Slimen et al. 2007; Zachos
et al. 2006, 2007a, b).
242 Biochem Genet (2009) 47:241–250
123
Materials and Methods
Sampling
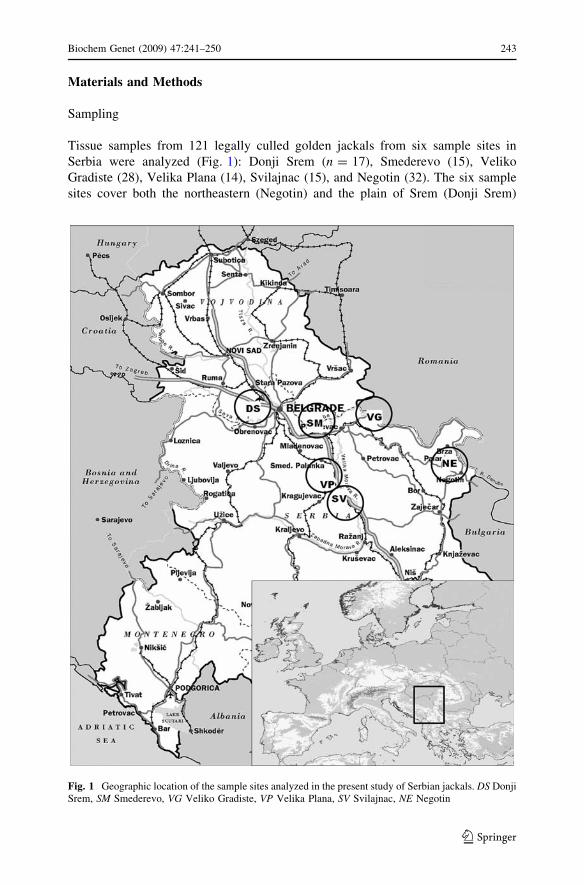
Tissue samples from 121 legally culled golden jackals from six sample sites in
Serbia were analyzed (Fig. 1): Donji Srem (n = 17), Smederevo (15), Veliko
Gradiste (28), Velika Plana (14), Svilajnac (15), and Negotin (32). The six sample
sites cover both the northeastern (Negotin) and the plain of Srem (Donji Srem)
Fig. 1 Geographic location of the sample sites analyzed in the present study of Serbian jackals. DS DonjiSrem, SM Smederevo, VG Veliko Gradiste, VP Velika Plana, SV Svilajnac, NE Negotin
Biochem Genet (2009) 47:241–250 243
123
populations as mentioned by Milenkovic (1987) and Krystufek et al. (1997), as well
as locations between the two sites. In addition, we had a tissue sample from a
vagrant golden jackal from Scheiblingkirchen, about 60 km south of Vienna,
Austria, which was also analyzed.
Mitochondrial DNA
DNA was extracted from tissue samples using the Qiagen DNeasy Tissue Kit.
Control region amplification was carried out with the H-primer DLH (50-CCT
GAAGTAAGAACCAGATG-30) and a modified L-primer LF15926F (50-ATATA
AAATACTTTGGTCTTGTAAACC-30) (see Kirschning et al. 2007). PCR condi-
tions were as described in Zachos et al. (2003), with a total reaction volume of 75 ll
MgCl2 buffer, 3 ll template DNA, and an annealing temperature of 55�C. In order
to better cope with ambiguous sites, both strands were sequenced on an automated
sequencer, and the control region sequences were aligned using the BioEdit 7.0
software (Hall 1999). Since we found only a single haplotype in all animals, no
further statistical analyses were carried out.
Microsatellites
Individual genotypes were established through amplification of eight polymorphic
canine loci: 109, 123, 204, 225 (Ostrander et al. 1993), 374, 468, 502, and 622
(Ostrander et al. 1995). PCR conditions were as described in Zachos et al. (2003),
using the annealing temperatures given by Ostrander et al. (1993, 1995). Length
determination of the microsatellite alleles was conducted with an automated
sequencer (MegaBace 1000) and the Genetic Profiler software. Since allelic
diversity was generally rather low by usual microsatellite standards, we repeated the
PCR and fragment length analysis each time we found a rare new allele, in order not
to increase the number of alleles due to artifacts.
The eight loci were tested for pairwise linkage disequilibrium using the Genepop
software (Raymond and Rousset 1995). We tested our data for the occurrence of
null alleles, large allele dropout, and stutter bands with the Micro-Checker program
(van Oosterhout et al. 2004) because these potential error sources are known to
distort allele frequencies and estimates of heterozygosity (Pemberton et al. 1995;
Wattier et al. 1998; Ewen et al. 2000). Allelic richness was calculated with the Fstat
software (Goudet 1995) as a measure of allele diversity corrected for differences in
sample sizes among populations. Observed and expected heterozygosity as well as
deviations from Hardy–Weinberg expectation were calculated with Arlequin 3.0
(Excoffier et al. 2005). Arlequin was also used for the analysis of molecular
variance (AMOVA). We calculated the overall fixation indices FST and RST (the
latter being a microsatellite-specific analog of FST based on the stepwise mutation
model), yielding the proportion of the total genetic diversity accounted for by the
differentiation among (as opposed to variation within) populations. Pairwise
population differentiation was calculated on the basis of pairwise FST and RST
values. Pairwise genetic distances between populations were quantified with Nei’s
(1972) standard distances and the Cavalli-Sforza and Edwards (1967) chord
244 Biochem Genet (2009) 47:241–250
123

distances, both calculated with the Genetix program (Belkhir 2000). Finally, the
genetic structure of the jackals was analyzed using two kinds of assignment
procedures. First, we used the GeneClass2 software (Piry et al. 2004) to conduct
classical assignment tests on individual genotypes, where individuals are assigned to
the population of which their genotype is most typical. A large proportion of
incorrect assignments thus indicates little genetic differentiation between the
respective populations. Second, the Structure software (Pritchard et al. 2000) was
used to infer the most probable number of genetic clusters without a priori definition
of populations. This particularly suits our sampling scheme, as it is improbable that
our sampling sites represent distinct populations. Therefore, classical population
structure analysis using F-statistics might not be sufficient. We used the batch-run
function to carry out a total of 80 runs, 10 each for one to eight clusters (i.e., K = 1
to K = 8). The repetitions were run to see if there were deviations among the
different runs for a fixed K and to calculate means and standard deviations. For each
run the burn-in and simulation length was 250,000 and 1,000,000, respectively, and
the admixture model and the option of correlated allele frequencies were chosen, as
this configuration is most suitable in cases of subtle population structure (Falush
et al. 2003). Since the log probability values for the different K values have been
shown to be of little reliability in some cases, the more refined ad hoc statistic DKwas used to infer the real number of populations. Based on the rate of change in the
log probability of data between successive K values (Evanno et al. 2005), DK has
been shown to be better at unveiling the correct number of genetic clusters. It
is calculated as DK = (|mL(K ? 1) - 2mL(K) ? mL(K - 1)|)/sdL(K), where L(K)
is the natural logarithm of the probability that K is the correct number of clusters, m is
the mean, and sd is the standard deviation of the replicate runs for the same K value.
The significance level of 0.05 was adjusted using Bonferroni corrections (Rice
1989) whenever multiple tests were carried out.
Results
The Serbian jackals were completely monomorphic for the mitochondrial control
region sequences based on an alignment of 392 bp (which in some individuals had
to be shortened to 326 bp), so both haplotype and nucleotide variability were zero.
The same haplotype was also found in the Austrian jackal.
There was no significant linkage disequilibrium between any two of the eight
loci; consequently, they were all included in subsequent multilocus analyses.
The Micro-Checker analysis yielded no signs of large allele dropout and only
occasional hints at misidentification of alleles due to stutter bands (at locus 468 in
Svilajnac, Negotin, and Veliko Gradiste, and at locus 123 in Negotin). Careful re-
examinations of our electropherograms, however, made it obvious that no
heterozygotes went unnoticed in these cases. A positive result for null alleles was
found in the above mentioned cases with a positive signal for stutter bands and at
locus 204 in Donji Srem. On the whole, these results make it improbable that our
data have been distorted by one of these error sources.
Biochem Genet (2009) 47:241–250 245
123
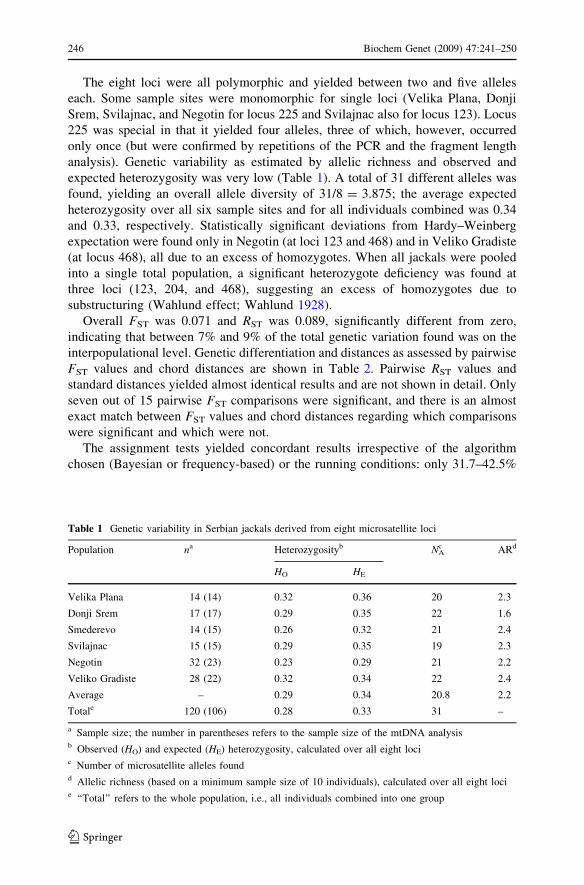
The eight loci were all polymorphic and yielded between two and five alleles
each. Some sample sites were monomorphic for single loci (Velika Plana, Donji
Srem, Svilajnac, and Negotin for locus 225 and Svilajnac also for locus 123). Locus
225 was special in that it yielded four alleles, three of which, however, occurred
only once (but were confirmed by repetitions of the PCR and the fragment length
analysis). Genetic variability as estimated by allelic richness and observed and
expected heterozygosity was very low (Table 1). A total of 31 different alleles was
found, yielding an overall allele diversity of 31/8 = 3.875; the average expected
heterozygosity over all six sample sites and for all individuals combined was 0.34
and 0.33, respectively. Statistically significant deviations from Hardy–Weinberg
expectation were found only in Negotin (at loci 123 and 468) and in Veliko Gradiste
(at locus 468), all due to an excess of homozygotes. When all jackals were pooled
into a single total population, a significant heterozygote deficiency was found at
three loci (123, 204, and 468), suggesting an excess of homozygotes due to
substructuring (Wahlund effect; Wahlund 1928).
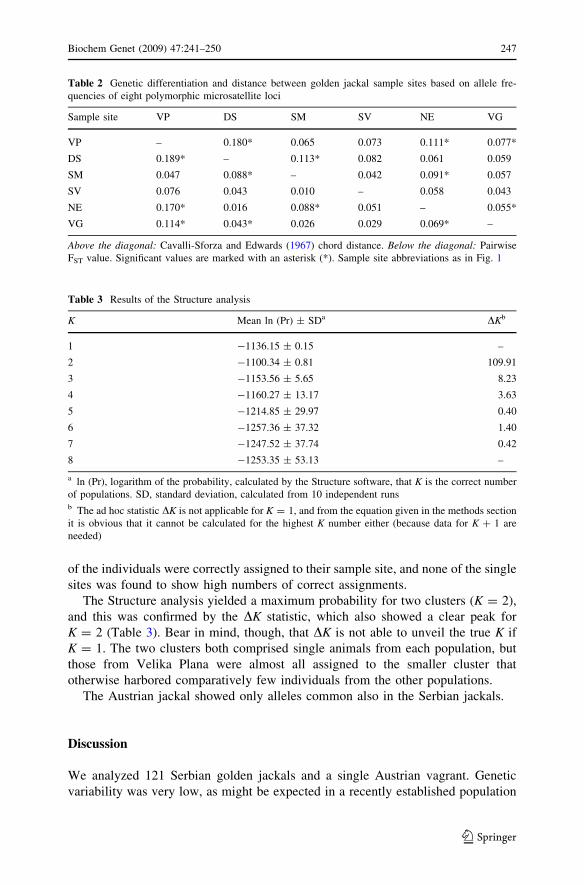
Overall FST was 0.071 and RST was 0.089, significantly different from zero,
indicating that between 7% and 9% of the total genetic variation found was on the
interpopulational level. Genetic differentiation and distances as assessed by pairwise
FST values and chord distances are shown in Table 2. Pairwise RST values and
standard distances yielded almost identical results and are not shown in detail. Only
seven out of 15 pairwise FST comparisons were significant, and there is an almost
exact match between FST values and chord distances regarding which comparisons
were significant and which were not.
The assignment tests yielded concordant results irrespective of the algorithm
chosen (Bayesian or frequency-based) or the running conditions: only 31.7–42.5%
Table 1 Genetic variability in Serbian jackals derived from eight microsatellite loci
Population na Heterozygosityb NAc ARd
HO HE
Velika Plana 14 (14) 0.32 0.36 20 2.3
Donji Srem 17 (17) 0.29 0.35 22 1.6
Smederevo 14 (15) 0.26 0.32 21 2.4
Svilajnac 15 (15) 0.29 0.35 19 2.3
Negotin 32 (23) 0.23 0.29 21 2.2
Veliko Gradiste 28 (22) 0.32 0.34 22 2.4
Average – 0.29 0.34 20.8 2.2
Totale 120 (106) 0.28 0.33 31 –
a Sample size; the number in parentheses refers to the sample size of the mtDNA analysisb Observed (HO) and expected (HE) heterozygosity, calculated over all eight locic Number of microsatellite alleles foundd Allelic richness (based on a minimum sample size of 10 individuals), calculated over all eight locie ‘‘Total’’ refers to the whole population, i.e., all individuals combined into one group
246 Biochem Genet (2009) 47:241–250
123
of the individuals were correctly assigned to their sample site, and none of the single
sites was found to show high numbers of correct assignments.
The Structure analysis yielded a maximum probability for two clusters (K = 2),
and this was confirmed by the DK statistic, which also showed a clear peak for
K = 2 (Table 3). Bear in mind, though, that DK is not able to unveil the true K if
K = 1. The two clusters both comprised single animals from each population, but
those from Velika Plana were almost all assigned to the smaller cluster that
otherwise harbored comparatively few individuals from the other populations.
The Austrian jackal showed only alleles common also in the Serbian jackals.
Discussion
We analyzed 121 Serbian golden jackals and a single Austrian vagrant. Genetic
variability was very low, as might be expected in a recently established population
Table 2 Genetic differentiation and distance between golden jackal sample sites based on allele fre-
quencies of eight polymorphic microsatellite loci
Sample site VP DS SM SV NE VG
VP – 0.180* 0.065 0.073 0.111* 0.077*
DS 0.189* – 0.113* 0.082 0.061 0.059
SM 0.047 0.088* – 0.042 0.091* 0.057
SV 0.076 0.043 0.010 – 0.058 0.043
NE 0.170* 0.016 0.088* 0.051 – 0.055*
VG 0.114* 0.043* 0.026 0.029 0.069* –
Above the diagonal: Cavalli-Sforza and Edwards (1967) chord distance. Below the diagonal: Pairwise
FST value. Significant values are marked with an asterisk (*). Sample site abbreviations as in Fig. 1
Table 3 Results of the Structure analysis
K Mean ln (Pr) ± SDa DKb
1 -1136.15 ± 0.15 –
2 -1100.34 ± 0.81 109.91
3 -1153.56 ± 5.65 8.23
4 -1160.27 ± 13.17 3.63
5 -1214.85 ± 29.97 0.40
6 -1257.36 ± 37.32 1.40
7 -1247.52 ± 37.74 0.42
8 -1253.35 ± 53.13 –
a ln (Pr), logarithm of the probability, calculated by the Structure software, that K is the correct number
of populations. SD, standard deviation, calculated from 10 independent runsb The ad hoc statistic DK is not applicable for K = 1, and from the equation given in the methods section
it is obvious that it cannot be calculated for the highest K number either (because data for K ? 1 are
needed)
Biochem Genet (2009) 47:241–250 247
123
at the margin of a species’ distribution range. Unfortunately, very few data are
available for direct comparison with our results. To our knowledge, the only study
that includes golden jackals in a population genetic analysis is the one by Roy et al.
(1994), who genotyped 18 golden jackals from Kenya at 10 microsatellite loci as an
outgroup for comparison with North American canids. Four of these 10 loci were
also used in the present study, and although we found fewer alleles at loci 123 (2 vs.
5) and 204 (4 vs. 6), the loci 109 and 225 yielded more alleles in Serbia than in
Kenya (3 vs. 2 and 4 vs. 1, respectively), but three of our four alleles at locus 225
occurred only once. Given that our sample size was more than six times that of Roy
et al. (1994), it becomes clear that Serbia is considerably less diverse than Kenya.
Since the number of alleles found in the different Serbian populations varied only
between 19 and 22, although sample sizes varied by a factor of more than two, it
seems very likely that we did not miss any alleles in our sample.
In line with this picture, the Kenyan jackals yielded observed and expected
heterozygosities much higher than those of their Serbian conspecifics (HO 0.41 vs.
0.29; HE 0.52 vs. 0.34). Still, the Kenyan jackals were less diverse than the North
American gray wolves and coyotes analyzed in the same study, so golden jackals
might generally harbor less genetic variability than other canids. In a recent study,
Kirschning et al. (2007) analyzed mitochondrial control region sequences in a
similarly large sample of Serbian red foxes (n = 110). This study also had a similar
geographic scope, but the foxes yielded nine different haplotypes, in contrast to only
one found in the jackals, which, of course, also reflects the much longer history and
the larger effective population size of the fox in this region. European gray wolves,
although having undergone severe persecution, also show considerably higher
genetic variability, and this also holds for the strongly bottlenecked Italian
population, which, based on 18 microsatellite loci, still yielded observed and
expected heterozygosities of 0.44 and 0.49, respectively (Lucchini et al. 2004).
Lack of mtDNA control region variability has been observed in a range of
populations from different taxa, among them Italian wolves (Lucchini et al. 2004),
brown bears from the Apennines (Zachos et al. 2008), and the relict red deer from
Mesola in Italy (Hmwe et al. 2006), but in all these cases nuclear diversity as
assessed by microsatellites was considerably higher than in the jackals of the present
study. Yet, interspecific comparisons of genetic diversity have to be viewed with
caution, on account of possible species-specific differences. With regard to genetic
variability in golden jackals, it can be summarized that the Serbian jackals showed
very low diversity, but this may be due partly to a generally low level of variability
in this species.
With regard to differentiation, we did not find evidence of significant differences
between the Srem and the northeastern populations (represented by Negotin). On the
whole, there was very little differentiation among the Serbian jackals. Still, the
jackals were not completely homogeneous genetically, as evidenced by the
significant overall and some pairwise FST and RST values (see Table 2, in particular,
comparisons involving Velika Plana), as well as the Wahlund effect in the combined
sample and the Structure and DK results, which both favored two genetic groups
over one. It is interesting that Velika Plana, and not Negotin in the northeast, was
most differentiated from the other samples in the Structure analysis. Knowledge
248 Biochem Genet (2009) 47:241–250
123
about the golden jackal in Serbia does not offer a straightforward explanation for
this, but since the degree of differentiation was low, a random effect based on
sampling error cannot be excluded.
The analysis of the Austrian vagrant jackal showed that it was genetically
indistinguishable from the Serbian animals with respect to both mtDNA and
microsatellites. This is interesting because it has been assumed that the golden
jackals found in Italy, Slovenia, and Austria came from Istria in northwestern
Croatia (Krystufek et al. 1997). Either this does not hold for the Austrian specimen
that we analyzed (in this case, it most likely immigrated from Serbia, perhaps via
Hungary), or our results indicate that golden jackals across the whole northern
Balkans display a high amount of genetic uniformity. Further analyses of jackals
from other countries in southeastern Europe are needed to answer this question.
Acknowledgments The authors wish to express their gratitude to all persons involved in the collection
of samples: Zoran Gubin (Smederevo), Borko Dimitrijevic (Svilajnac), Zivorad Pavlovic (Velika Plana),
Sladan Markovic and Nenad Mirkovic (Veliko Gradiste), and Franz Suchentrunk (Austria).
References
Bauer K, Suchentrunk F (1995) Weitere Ausbreitung des Goldschakals Canis aureus L., 1758 in
Osterreich. Z Saugetierkd 60:307–309
Belkhir K (2000) Genetix v. 4.01. Laboratoire Genome et Populations, CNRS UPR 9060, Universite de
Montpellier
Ben Slimen H, Suchentrunk F, Shahin AB, Ben Ammar Elgaaied A (2007) Phylogenetic analysis of
mtCR-1 sequences of Tunisian and Egyptian hares (Lepus sp. or spp., Lagomorpha) with different
coat colours. Mamm Biol 72:224–239
Cavalli-Sforza LL, Edwards AWF (1967) Phylogenetic analysis: models and estimation procedures. Am J
Hum Genet 19:233–257
Demeter A, Spassov N (1993) Canis aureus Linnaeus, 1758–Schakal, Goldschakal. In: Niethammer J,
Krapp F (eds) Handbuch der Saugetiere Europas, vol 5/I Raubsauger (Part I). AULA-Verlag,
Wiesbaden, Germany, pp 107–138
Evanno G, Regnaut S, Goudet J (2005) Detecting the number of clusters of individuals using the software
structure: a simulation study. Mol Ecol 14:2611–2620
Ewen KR, Bahlo M, Treloar SA, Levinson DF, Mowry B, Barlow JW, Foote SJ (2000) Identification and
analysis of error types in high-throughput genotyping. Am J Hum Genet 67:727–736
Excoffier L, Laval G, Schneider S (2005) Arlequin ver. 3.0: an integrated software package for population
genetics data analysis. Evol Bioinform Online 1:47–50
Falush D, Stephens M, Pritchard JK (2003) Inference of population structure using multilocus genotype
data: linked loci and correlated allele frequencies. Genetics 164:1567–1587
Genov P, Wassilev S (1989) Der Schakal (Canis aureus L.) in Bulgarien. Ein Beitrag zu seiner
Verbreitung und Biologie. Z Jagdwiss 35:145–150
Giannatos G, Marinos Y, Maragou P, Catsadorakis G (2005) The status of the Golden Jackal (Canisaureus L.). Belg J Zool 135:145–149 (in Greece)
Goudet J (1995) FStat (Version 1.2): a computer program to calculate F-statistics. J Hered 86:485–486
Hall TA (1999) BioEdit: a user-friendly biological sequence alignment editor and analysis program for
Windows 95/98/NT. Nucleic Acids Symp Ser 41:95–98
Hajji GM, Zachos FE, Charfi-Cheikrouha F, Hartl GB (2007) Conservation genetics of the imperilled
Barbary red deer in Tunisia. Anim Conserv 10:229–235
Hmwe SS, Zachos FE, Eckert I, Lorenzini R, Fico R, Hartl GB (2006) Conservation genetics of the
endangered red deer from Sardinia and Mesola with further remarks on the phylogeography of
Cervus elaphus corsicanus. Biol J Linn Soc 88:691–701
Biochem Genet (2009) 47:241–250 249
123
Kirschning J, Zachos FE, Cirovic D, Radovic IT, Hmwe SS, Hartl GB (2007) Population genetic analysis
of Serbian red foxes (Vulpes vulpes) by means of mitochondrial control region sequences. Biochem
Genet 45:409–420
Krystufek B, Tvrtkovic N (1990) Range expansion by Dalmation jackal population in the 20th century
(Canis aureus Linnaeus, 1758). Folia Zool 39:291–296
Krystufek B, Murariu D, Kurtonur C (1997) Present distribution of the Golden Jackal Canis aureus in the
Balkans and adjacent regions. Mammal Rev 27:109–114
Kuhn W (1935) Die dalmatinischen Schakale. Z Saugetierkd 10:144–146
Lucchini V, Galov A, Randi E (2004) Evidence of genetic distinction and long-term population decline in
wolves (Canis lupus) in the Italian Apennines. Mol Ecol 13:523–536
Milenkovic M (1987) The distribution of the jackal, Canis aureus Linnaeus, 1758 (Mammalia, Canidae)
in Yugoslavia. In: Proceeding on the Fauna of SR Serbia, 4:233–248 (in Serbian with an English
summary)
Mitchell-Jones AJ, Amori G, Bogdanowicz W, Krystufek B, Reijnders PJH, Spitzenberger F, Stubbe M,
Thissen JBM, Vohralık V, Zima J (1999) The atlas of European mammals. T. & A. D. Poyser,
London, England
Nei M (1972) Genetic distance between populations. Am Nat 106:283–292
Ostrander EA, Sprague GF, Rine J (1993) Identification and characterization of dinucleotide repeat (CA)n
markers for genetic mapping in dog. Genomics 16:207–213
Ostrander EA, Mapa FA, Yee M, Rine J (1995) One hundred and one new simple sequence repeat-based
markers for the canine genome. Mamm Genome 6:192–195
Pemberton JM, Slate J, Bancroft DR, Barrett JA (1995) Nonamplifying alleles at microsatellite loci: a
caution for parentage and population studies. Mol Ecol 4:249–252
Piry S, Alapetite A, Cornuet J-M, Paetkau D, Baudouin L, Estoup A (2004) GeneClass2: a software for
genetic assignment and first-generation migrant detection. J Hered 95:536–539
Pritchard JK, Stephens M, Donnelly P (2000) Inference of population structure using multilocus genotype
data. Genetics 155:945–959
Raymond M, Rousset F (1995) Genepop (version 1.2): population genetics software for exact tests and
ecumenicism. J Hered 86:248–249
Rice WR (1989) Analyzing tables of statistical tests. Evolution 43:223–225
Roy MS, Geffen E, Smith D, Ostrander EA, Wayne RK (1994) Patterns of differentiation and
hybridization in North American wolflike canids, revealed by analysis of microsatellite loci. Mol
Biol Evol 11:553–570
Sommer R, Benecke N (2005) Late-Pleistocene and early Holocene history of the canid fauna of Europe
(Canidae). Mamm Biol 70:227–241
van Oosterhout C, Hutchinson WF, Wills DPM, Shipley P (2004) Micro-Checker (version 2.2.3):
software for identifying and correcting genotyping errors in microsatellite data. Mol Ecol Notes
4:535–538
Wahlund S (1928) Zusammensetzung von Populationen und Korrelationserscheinungen vom Standpunkt
der Vererbungslehre aus betrachtet. Hereditas 11:65–106
Wattier R, Engel CR, Saumitou-Laprade P, Valero M (1998) Short allele dominance as a source of
heterozygote deficiency at microsatellite loci: experimental evidence at the dinucleotide locus
Gv1CT in Gracilaria gracilis (Rhodophyta). Mol Ecol 7:1569–1573
Zachos F, Hartl GB, Apollonio M, Reutershan T (2003) On the phylogeographic origin of the Corsican
red deer (Cervus elaphus corsicanus): evidence from microsatellites and mitochondrial DNA.
Mamm Biol 68:284–298
Zachos FE, Hmwe SS, Hartl GB (2006) Biochemical and DNA markers yield strikingly different results
regarding variability and differentiation of roe deer (Capreolus capreolus, Artiodactyla: Cervidae)
populations from northern Germany. J Zool Syst Evol Res 44:167–174
Zachos FE, Althoff C, v Steynitz Y, Eckert I, Hartl GB (2007a) Genetic analysis of an isolated red deer
(Cervus elaphus) population showing signs of inbreeding depression. Eur J Wildl Res 53:61–67
Zachos FE, Cirovic D, Rottgardt I, Seiffert B, Oeking S, Eckert I, Hartl GB (2007b) Geographically large-
scale genetic monomorphism in a highly successful introduced species: the case of the muskrat
(Ondatra zibethicus) in Europe. Mamm Biol 72:123–126
Zachos FE, Otto M, Unici R, Lorenzini R, Hartl GB (2008) Evidence of a phylogeographic break in the
Romanian brown bear (Ursus arctos) population from the Carpathians. Mamm Biol 73:93–101
250 Biochem Genet (2009) 47:241–250
123


