Embed Size (px)
Citation preview

Plant Tissue Cult. & Biotech. 23(2): 189‐199, 2013 (December)
PTC&B Genetic Diversity Analysis of Eighteen Tea (Camellia sinensis L.) Clones of Bangladesh Through RAPD
Shefali Boonerjee, M. Nurul Islam, M. I. Hoque and R.H. Sarker Department of Botany, University of Dhaka, Dhaka‐1000, Bangladesh
Key words: Camellia sinensis, RAPD, Genetic diversity, Cluster analysis, Dendrogram
Abstract Using 20 decamer random primers molecular characterization of 18 tea (Camellia sinensis L.) clones of Bangladesh was made. All the primers showed significant amplification in PCR analysis. A total of 755 bands was produced in all the 18 tea clones with an average of 37.75 RAPD bands per primer. Among all the bands 97.41% were polymorphic in nature. The molecular size of the amplified DNA fragments ranged from 250 to 5000 bp. Ten unique bands were amplified from the genome of the 18 tea clones. The values of pairwise genetic distance ranged from 24.0 to 59.0 indicating the presence of a wide range of genetic diversity. The highest genetic distance 59 was found between the clone BT16 and BT2, whereas the lowest (24.0) between BT18 and BT5. The dendrogram based on Nei’s genetic distance was constructed using un‐weighted Pair Group of Arithmetic Mean (UPGMA) segregating the 18 tea clones into two major clusters: BT9 and BT13 in cluster 1 and the remainder of 16 clones in cluster 2. Cluster 2 is further sub‐divided into many sub‐clusters. Cluster analysis revealed that while the genotype BT5 is closely related to BT18, BT1 and BT2 showed similarity with BT8. Genotypes BT1 and BT13 were widely diverse genetically.
Introduction Tea (Camellia sinensis L.) is the oldest mild stimulating drink containing caffeine used worldwide. Tea leaves have more than 700 chemical constituents; among them flavanoides, amino acids, vitamins (B, C, E, K), caffeine and polysaccha‐rides are important to human health (Mondal et al. 2004). It is being used as an important health drink from the ancient time and recent literature strongly emphasizes its value in disease prevention and as a key component of daily diets (Muktar and Ahmad 1999, 2000 and Weisburger 1997). Bangladesh is a tea‐exporting country and the tea industry is one of the most important labor and export oriented industries in Bangladesh. Bangladesh earns a substantial amount
190 Boonerjee et al.
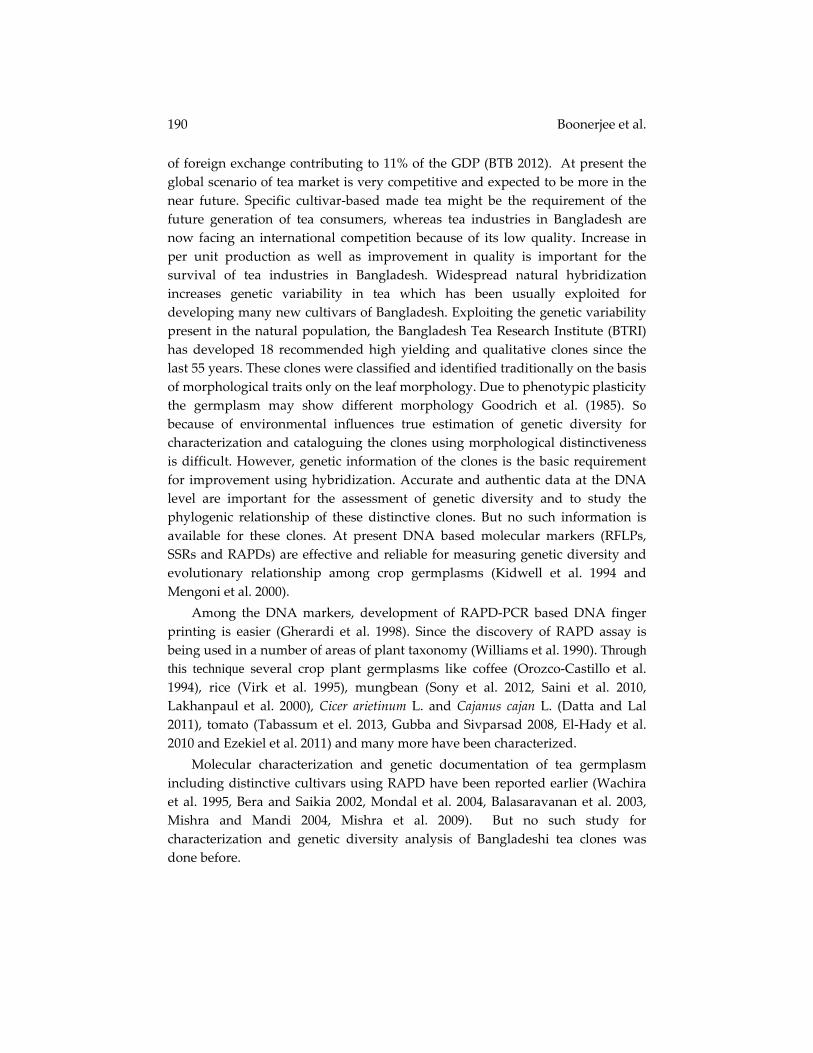
of foreign exchange contributing to 11% of the GDP (BTB 2012). At present the global scenario of tea market is very competitive and expected to be more in the near future. Specific cultivar‐based made tea might be the requirement of the future generation of tea consumers, whereas tea industries in Bangladesh are now facing an international competition because of its low quality. Increase in per unit production as well as improvement in quality is important for the survival of tea industries in Bangladesh. Widespread natural hybridization increases genetic variability in tea which has been usually exploited for developing many new cultivars of Bangladesh. Exploiting the genetic variability present in the natural population, the Bangladesh Tea Research Institute (BTRI) has developed 18 recommended high yielding and qualitative clones since the last 55 years. These clones were classified and identified traditionally on the basis of morphological traits only on the leaf morphology. Due to phenotypic plasticity the germplasm may show different morphology Goodrich et al. (1985). So because of environmental influences true estimation of genetic diversity for characterization and cataloguing the clones using morphological distinctiveness is difficult. However, genetic information of the clones is the basic requirement for improvement using hybridization. Accurate and authentic data at the DNA level are important for the assessment of genetic diversity and to study the phylogenic relationship of these distinctive clones. But no such information is available for these clones. At present DNA based molecular markers (RFLPs, SSRs and RAPDs) are effective and reliable for measuring genetic diversity and evolutionary relationship among crop germplasms (Kidwell et al. 1994 and Mengoni et al. 2000). Among the DNA markers, development of RAPD‐PCR based DNA finger printing is easier (Gherardi et al. 1998). Since the discovery of RAPD assay is being used in a number of areas of plant taxonomy (Williams et al. 1990). Through this technique several crop plant germplasms like coffee (Orozco‐Castillo et al. 1994), rice (Virk et al. 1995), mungbean (Sony et al. 2012, Saini et al. 2010, Lakhanpaul et al. 2000), Cicer arietinum L. and Cajanus cajan L. (Datta and Lal 2011), tomato (Tabassum et el. 2013, Gubba and Sivparsad 2008, El‐Hady et al. 2010 and Ezekiel et al. 2011) and many more have been characterized. Molecular characterization and genetic documentation of tea germplasm including distinctive cultivars using RAPD have been reported earlier (Wachira et al. 1995, Bera and Saikia 2002, Mondal et al. 2004, Balasaravanan et al. 2003, Mishra and Mandi 2004, Mishra et al. 2009). But no such study for characterization and genetic diversity analysis of Bangladeshi tea clones was done before.
Genetic Diversity Analysis of Eighteen Tea Clones 191
Therefore, the objective of the present study was to investigate and compare the RAPD fingerprinting‐based genetic diversity among 18 tea clones released from the Bangladesh Tea Research Institute (BTRI).
Materials and Methods Leaf samples of 18 Bangladesh Tea (BT) clones, namely, BT1 ‐ 18 were collected from the nucleus clone plot (NCP) of BTRI, Srimangal. Information about the clones used in this study is shown in Table 1.
Table 1. Basic information regarding the 18 tea clones used for estimation of genetic diversity.
SI. No. Name of the accessions Name of the clones Type
1 2 3 4 5 6 7 8 9 10 11 12 13 14 15 16 17 18
B201/39 R5/8 U16/21 B24/44 BS1/2 BS1/1 Br/2/99 B90/44 Balu 2/4 D/13/25 TV/E H1/15 SH/D/11/333 B/HB/6/4 BS1/1/111 SH/D/11/313 T1B2 A/22/39
BT1 BT2 BT3 BT4 BT5 BT6 BT7 BT8 BT9 BT10 BT11 BT12 BT13 BT14 BT15 BT16 BT17 BT18
Hybrid 2 Hybrid 2 Hybrid 3 Manipuri Hybrid Hybrid‐3 Hybrid 3 Manipuri Manipuri Hybrid Hybrid 2 Assam Hybrid‐3 Manipuri Assam Manipuri‐Hybrid Hybrid‐3 Assam Hybrid 2 Assam
Total genomic DNA was extracted by using modified CTAB method (Doyle and Doyle 1987). DNA concentration was quantified through spectrophotometer (Simadzu Corp. Japan). The A260/280 readings for DNA samples were 1.6‐1.8. The PCR reaction mixture was prepared for 25 μl containing template DNA (25 ng) 2 μl, de‐ionized distilled water 18.8 μl , Taq buffer A 10x (10 mM Tris‐HCl with1.5 mM MgCl2) 2.5 μl, primer (10 μM) 1.0 μl, dNTP mix (10 mM) 0.5 μl, Taq DNA polymerase (5 U/μl) 0.2 μl. PCR amplification was done in an oil‐free thermal cycler (Biometra UNOII, Germany) for 46 cycles after initial denaturation at 94ºC for 5 min and at 94ºC for 1 min, annealing at 36ºC for 30 sec. extension at 72ºC for 3 min and final extension at 72ºC for 5 min. Twenty random decamer primers were used in the present study which showed reproducible results (Table 2). The amplified products were separated by horizontal electrophoresis using 1% agarose gel containing 0.5 μg/ml ethidum
192 Boonerjee et al.
bromide in TAE buffer at 50 volts and 100 mA for 1.5 h. A 1.0 kb ladder was electrophorised alongside RAPD analysis as a marker. The gel was visualized by UV‐transilluminator to examine the banding patterns and photographed by gel documentation system (CSL‐Microdoc System, Cleaver Scientific Ltd. USA). For analysis of genetic diversity the photographs of RAPD gel were critically examined on the basis of presence (1) or absence (0) of bands, size of bands and overall polymorphism of bands. The scores obtained using all primers in the RAPD analysis were then pooled for constructing a single data matrix. This was used for estimating polymorphic loci, genetic diversity, genetic distance (D) and constructing UPGMA (Sneath and Sokal 1973) dendrogram among the clones using computer program “Statistica”.
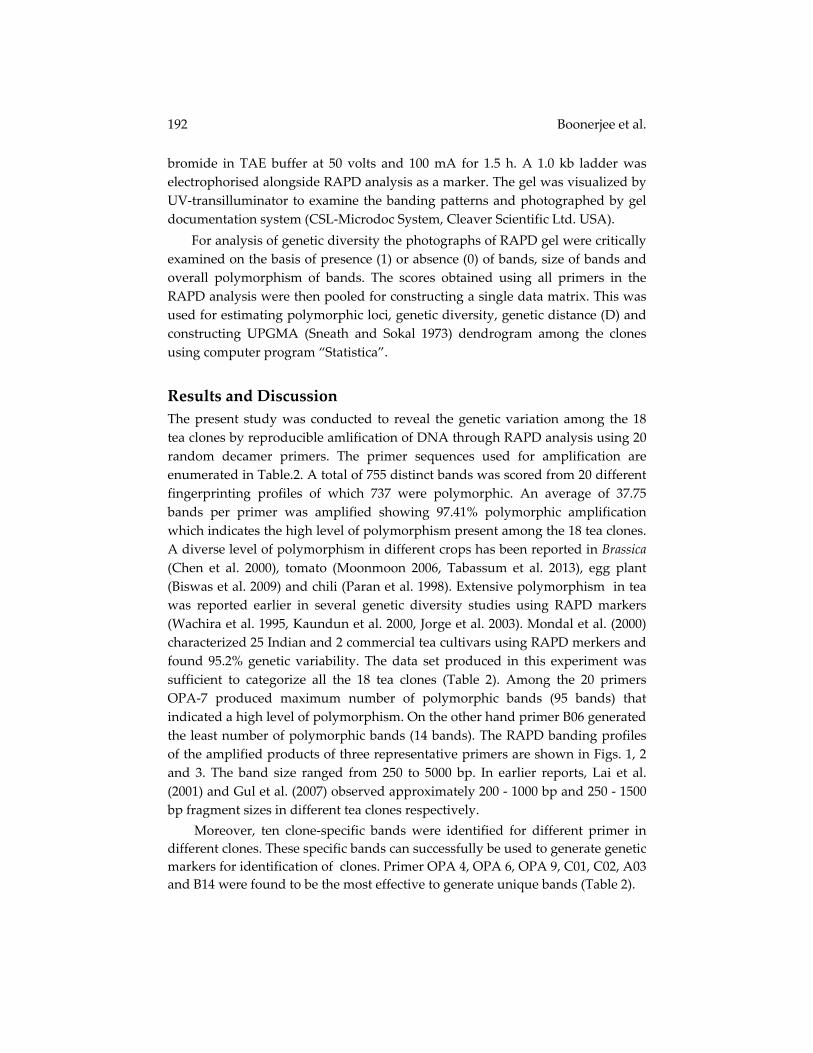
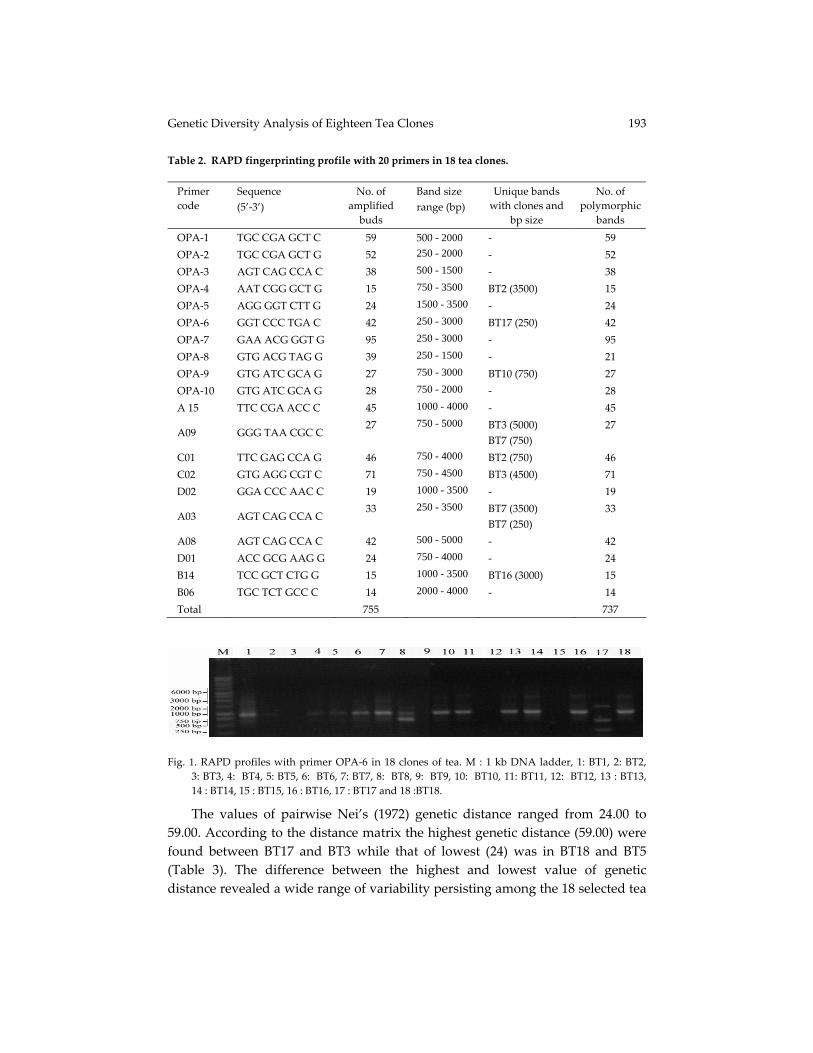
Results and Discussion The present study was conducted to reveal the genetic variation among the 18 tea clones by reproducible amlification of DNA through RAPD analysis using 20 random decamer primers. The primer sequences used for amplification are enumerated in Table.2. A total of 755 distinct bands was scored from 20 different fingerprinting profiles of which 737 were polymorphic. An average of 37.75 bands per primer was amplified showing 97.41% polymorphic amplification which indicates the high level of polymorphism present among the 18 tea clones. A diverse level of polymorphism in different crops has been reported in Brassica (Chen et al. 2000), tomato (Moonmoon 2006, Tabassum et al. 2013), egg plant (Biswas et al. 2009) and chili (Paran et al. 1998). Extensive polymorphism in tea was reported earlier in several genetic diversity studies using RAPD markers (Wachira et al. 1995, Kaundun et al. 2000, Jorge et al. 2003). Mondal et al. (2000) characterized 25 Indian and 2 commercial tea cultivars using RAPD merkers and found 95.2% genetic variability. The data set produced in this experiment was sufficient to categorize all the 18 tea clones (Table 2). Among the 20 primers OPA‐7 produced maximum number of polymorphic bands (95 bands) that indicated a high level of polymorphism. On the other hand primer B06 generated the least number of polymorphic bands (14 bands). The RAPD banding profiles of the amplified products of three representative primers are shown in Figs. 1, 2 and 3. The band size ranged from 250 to 5000 bp. In earlier reports, Lai et al. (2001) and Gul et al. (2007) observed approximately 200 ‐ 1000 bp and 250 ‐ 1500 bp fragment sizes in different tea clones respectively. Moreover, ten clone‐specific bands were identified for different primer in different clones. These specific bands can successfully be used to generate genetic markers for identification of clones. Primer OPA 4, OPA 6, OPA 9, C01, C02, A03 and B14 were found to be the most effective to generate unique bands (Table 2).
Genetic Diversity Analysis of Eighteen Tea Clones 193
Table 2. RAPD fingerprinting profile with 20 primers in 18 tea clones. Primer code
Sequence (5’‐3’)
No. of amplified buds
Band size range (bp)
Unique bands with clones and
bp size
No. of polymorphic
bands OPA‐1 TGC CGA GCT C 59 500 ‐ 2000 ‐ 59 OPA‐2 TGC CGA GCT G 52 250 - 2000 ‐ 52 OPA‐3 AGT CAG CCA C 38 500 - 1500 ‐ 38 OPA‐4 AAT CGG GCT G 15 750 - 3500 BT2 (3500) 15 OPA‐5 AGG GGT CTT G 24 1500 - 3500 ‐ 24 OPA‐6 GGT CCC TGA C 42 250 - 3000 BT17 (250) 42 OPA‐7 GAA ACG GGT G 95 250 - 3000 ‐ 95 OPA‐8 GTG ACG TAG G 39 250 - 1500 ‐ 21 OPA‐9 GTG ATC GCA G 27 750 - 3000 BT10 (750) 27 OPA‐10 GTG ATC GCA G 28 750 - 2000 ‐ 28 A 15 TTC CGA ACC C 45 1000 - 4000 ‐ 45
A09 GGG TAA CGC C 27 750 - 5000 BT3 (5000)
BT7 (750) 27
C01 TTC GAG CCA G 46 750 - 4000 BT2 (750) 46 C02 GTG AGG CGT C 71 750 - 4500 BT3 (4500) 71 D02 GGA CCC AAC C 19 1000 - 3500 ‐ 19
A03 AGT CAG CCA C 33 250 - 3500 BT7 (3500)
BT7 (250) 33
A08 AGT CAG CCA C 42 500 - 5000 ‐ 42 D01 ACC GCG AAG G 24 750 - 4000 ‐ 24 B14 TCC GCT CTG G 15 1000 - 3500 BT16 (3000) 15 B06 TGC TCT GCC C 14 2000 - 4000 ‐ 14 Total 755 737
Fig. 1. RAPD profiles with primer OPA‐6 in 18 clones of tea. M : 1 kb DNA ladder, 1: BT1, 2: BT2,
3: BT3, 4: BT4, 5: BT5, 6: BT6, 7: BT7, 8: BT8, 9: BT9, 10: BT10, 11: BT11, 12: BT12, 13 : BT13, 14 : BT14, 15 : BT15, 16 : BT16, 17 : BT17 and 18 :BT18.
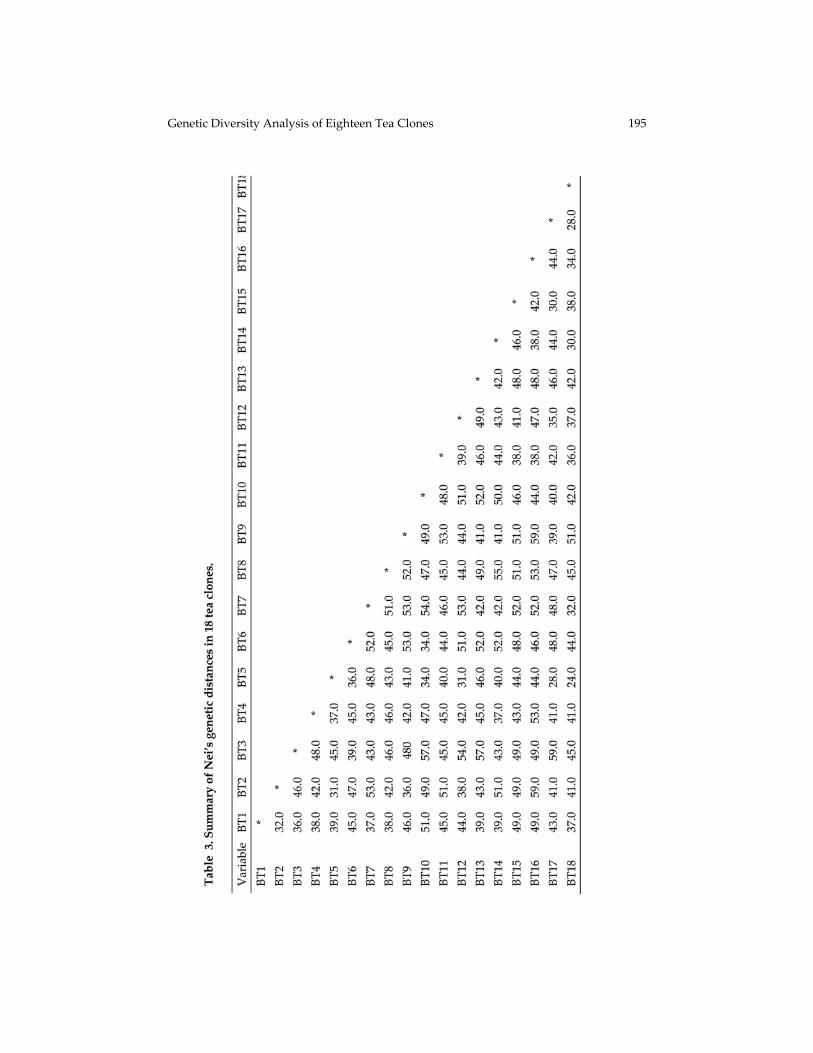
The values of pairwise Nei’s (1972) genetic distance ranged from 24.00 to 59.00. According to the distance matrix the highest genetic distance (59.00) were found between BT17 and BT3 while that of lowest (24) was in BT18 and BT5 (Table 3). The difference between the highest and lowest value of genetic distance revealed a wide range of variability persisting among the 18 selected tea

194 Boonerjee et al.
clones. From the result of genetic dissimilarity analysis using UPGMA method Gul et al. (2007) reported an extensive genetic diversity in the 24 tea genotypes. Welsh and MaClelland (1990) and Dos Santos et al. (1994) also confirmed the wide range of genetic diversity among the tea genotypes from their study through RAPD analysis.
Fig. 2. RAPD profiles with primer OPA‐7 in the 18 clones of tea. M : 1 kb DNA ladder on the extreme left, 1: BT1, 2: BT2, 3: BT3, 4: BT4, 5: BT5, 6: BT6, 7: BT7, 8: BT8, 9: BT9, 10: BT10, 11: BT11, 12: BT12, 13 : BT13, 14 : BT14, 15 : BT15, 16 : BT16, 17 : BT17 and 18 :BT18.
Fig 3. RAPD profiles with primer C02 in the 18 clones of tea. M : 1 kb DNA ladder, on the extreme
left 1: BT1, 2: BT2, 3: BT3, 4: BT4, 5: BT5, 6: BT6, 7: BT7, 8: BT8, 9: BT9, 10: BT10, 11: BT11, 12: BT12, 13 : BT13, 14 : BT14, 15 : BT15, 16 : BT16, 17 : BT17 and 18 :BT18.
Fig. 4. UPGMA dendrogram based on Nei’s genetic distance summarizing the data on differentiation
among 18 tea clones as revealed by RAPD analysis.
Genetic Diversity Analysis of Eighteen Tea Clones 195
196 Boonerjee et al.
The dendrogram constructed based on Nei’s (1972) genetic distance separated out the 18 clones into two major clusters (Fig. 2). Cluster 1 contained 2 clones and the remainder 16 in cluster 2. BT9 and BT13 formed cluster 1 showing the close relatedness between them. Cluster 2 was further sub‐divided into 2 sub‐clusters forming more sub‐sub clusters. BT1, BT2, BT8, BT3 and BT7 were separately grouped in sub‐cluster 1. On the other hand, sub‐cluster 2 comprises four separate groups. BT6 and BT10 made group 1 in this sub‐cluster, while BT16 alone made an individual group 2. In group 3, clone BT15, BT11, BT12, BT17, BT18 and BT5 were included, whereas BT4 and BT14 in group 4. On the basis of cluster analysis it was observed that clone BT5 was closely related to BT18 according to the phylogenetic relationship as they maintained lowest genetic distances (24.00) among the 18 members. BT1 and BT2 were closely related showing similarity with BT8. Close relationship was observed among the pair of BT18 and BT17, BT12 and BT17, BT6 and BT10. Placing in the same cluster BT5 and BT10 maintained distant relationship. Though the clones were grouped in the same cluster, they were distantly related with each other. From this investigation it is clearly indicating that each of the 18 tea clones possessed specific fingerprinting profile which could be used for their authentic identification. The detection of high level of genetic variabilty also supports the findings of Lai et al. ( 2001), Chen et al. (2000), and further strengthens the reports of Welsh and MacClelland (1990) and Dos Santos et al. (1994) who concluded that RAPD markers are effective for visualizing high level of genetic polymorhism in plant species.
Acknowledgements The study is a part of the NATP phase-1 Ph.D. research program funded by Bangladesh Agricultural Research Council (BARC). The authors are grateful to Professor M. Mozammel Haque of the Department of Botany, University of Dhaka for his kind help during the preparation of this manuscript.
References Balasaravanan T, Pius PK, Rajkumar R, Muraleedharan N and Shasany AK (2003)
Genetic diversity among South Indian tea germplasm (Camellia sinensis, C. assamica and C. assamica spp. lasicalyx) using ALFP markers. Plant Science 165: 365‐375.
Bangladesh Tea Board (2012) Statistics on tea. Bangladesh Tea Board, Nasirabud, Chittagong.
Bera B and Saikia H (2002) Randomly amplified polymorphic DNA (RAPD) marker analysis in tea (Camellia sinensis L.) generative clones. In: Proc. Plantation Crops Symposium‐XV on ʺSustainability of Plantation Crops through Integrated Approaches for Crop Production and Product Diversificationʺ held at the Central Coffee Research Institute during 10‐13 December, 2002, Mysore, Karnataka, pp. 235‐238.
Genetic Diversity Analysis of Eighteen Tea Clones 197
Biswas MS, Akhond AAY, Alamin M, Khatun M and Kabir MR (2009) Genetic relationship among ten promising eggplant varieties using RAPD markers. Plant Tissue Cult. & Biotech. 19(2): 119-126.
Chen YP, Cao-Jia S, Miao Y, Cao JS and Ye WZ (2000) Analysis of genetic polymorphisms in vegetable crops of Brassica campestris by RAPD markers. J. Zhejiang University. Agric. Life Sci. 26: 131-136.
Datta J and Lal N (2011) Characterization of genetic diversity in Cicer arietinum L. and Cajanus cajan L. Millspaugh using random amplified polymorphic DNA and simple sequence repeat markers. Genom. and Quant. Genet. 3: 30‐41.
Dos Santos JB, Nienhuis J, Skroch P, Tivang J and Slocam (1994) Comparison of RAPD and RELP genetic markers in determining genetic similarity in Brassica oleracea L. genotypes. TAG. 87: 909‐915.
Doyle JJ and Doyle JL (1987) A rapid DNA isolation procedure from small quantities of fresh leaf tissues. Phytochem. Bull. 96: 11‐15.
El‐Hady EAAA, Haiba AAA, EL‐Hamid NRA and Rizkalla AA (2010) Phylogenetic diversity and relationships of some tomato varieties by electrophoretic protein and RAPD analysis. J. Amer. Sci. 6(11): 434‐441.
Ezekiel CN, Nwangburuka CC, Ajibade OA and Odebode AC (2011) Genetic diversity in 14 tomato (Lycopersicon esculentum Mill.) varieties in Nigerian markets by RAPD‐PCR technique. Afr. J. Biotechnol. 10(25): 4961‐4967.
Gherardi M, Mangin B, Goffinate B, Bonnet D and Huguet T (1998) A method to measure genetic distance between allogamous population of alfalfa (Medicago sativa) using RAPD molecular markers. TAG 96: 406‐412.
Goodrich WJ, Cook RJ and Morgan AG (1985) The application of electrophoresis to the charecterization of cultivars Vicia faba L. Fabis Newsletter 13:8.
Gubba A and Sivparsad BJ (2008) Isolation and molecular characterization of tomato spotted wilt virus (TSWV) isolates occurring in South Africa. Afr. J. Agri. Res. 3(6): 428 ‐ 434.
Gul S, Ahmed H, Khan IA and Alam M (2007) Assessment of genetic diversity in tea genotypes through RAPD primers. Pakistan J. Biol. Science. 10(15): 2609‐2611.
Jorge S and Pedroso MC (2003) Genetic Differentiation of Portuguese Tea Plant using RAPD Markers. Hort Science 38(6): 1191-1197.
Kaundan SS, Zhyvoloup A and Park Y (2000) Evaluation of the genetic diversity among elite tea accessions using RAPD markers. Euphytica. 115: 7-16.
Kidwell KK, Austinand DF and Osborn TC (1994) RFLP evaluation of nine Medicago accessions representing the original germplasm source of North American alfalfa cultivars. Crop Sci. 34: 230‐236.
Lai J, Yang W and Hisao J (2001) An assessment of genetic relationship in cultivated tea clones and native wild tea in Taiwan using RAPD and ISSR markers. Bot. Bull. Acad. Sin. 42: 93‐100.
198 Boonerjee et al.
Lakhanpaul S, Chanda S and Bhat KV (2000) Random amplified polymorphic DNA (RAPD) analysis in Indian mungbean (Vigna radiata (L.) Wilczek) cultivars. Genetica 109: 227‐234.
Mengoni A, Goriand A and Bazzicalupo M (2000) Use of RAPD and microsatellite (SSR) variation to assess genetic relationships among population of tetraploid alfalfa, Medicago sativa. Pl. Breed. 119: 311‐317.
Mishra RK, Chaudhury S, Ahmad A, Pradhan M and Siddiqi TO (2009) Molecular analysis of tea clones (Camellia sinensis)using AFLP markers. International Journal of Integrative Biology. 5(2): 130-136.
Mishra RK and Mandi SS (2004) Molecular profiling and developement of DNA marker associated with drought tolerance in tea clones growing in Darjeeling. Curr. Sci. 87(1): 60-66.
Mondal TK, Singh HP and Ahuja PS (2000) Isolation of genomic DNA from tea and other phenolic rich plants. J. Planta Crops. 28(1): 30‐34.
Mondal TK, Bhattacharya A, Lakshmikumaran M and Ahuja PS (2004) Recent advances of tea (Camellia sinensis) biotechnology. Plant Cell Tissue and Organ Culture. 76: 195‐254.
Moonmoon S (2006) Random amplified polymorphic DNA (RAPD) markers for genetic variation study among tomato varieties. MS Thesis. Dept. of Biotechnology. Bangladesh Agricultural University, Mymenshing. pp. 34-51.
Mukhtar H and Ahmad N (1999) Green tea in chemoprevention of cancer. Toxicol. Sci. 52: 111-117.
Mukhtar H and Ahmad N (2000) Tea polyphenols-Prevention of cancer and optimizing health. Amer. J. Clin. Nutr. 71: 1698S-1702S.
Nei M (1972) Genetic distance between populations. American Nat. 106: 283‐292.
Orozco‐Castillo C, KJ Chalmers, R Waugh and W Powell (1994) Detection of genetic diversity and selective gene integration in coffee using RAPD markers. TAG 97: 934‐940.
Paran I, Aftergoot E and Shifriss C (1998) Variation in Capsicum annum revealed by RAPD and AFLP markers. Euphytica 9(3): 167-173.
Saini M, Singh S, Hussain Z and Yadav A (2010) RAPD analysis in Mungbean (Vigna radiate (L.) Wilczek). Assessment of genetic diversity. Indian J. Biotech. 9: 137‐140.
Sony SK, Habib MA and Islam MN (2012) Genetic diversity anlysis of thirteen mungbean (Vigna radiate (L.) Wilczek) cultivers using RAPD markers. Bangladesh J. Bot. 41(2): 169‐175.
Sneath PHA and Sokal RR (1973) Numerical taxonomy: Priciples and Practice. Freeman, San Fransisco, pp. 21‐28.
Tabassum N, Sony SK, bhajan SK and Islam MN (2013) Analysis of genetic diversity in eleven tomato (Lycopersicon esculentum Mill.) varieties using RAPD markers. Plant Tissue Cult. & Biotech. 23(1): 49‐57.
Virk PS, HJ Newbury, MT Jackson and BV Ford‐Lioyd (1995) The identification of duplicate accessions within Thirteen rice germplasm collection using RAPD analysis. TAG 90: 1094‐1055
Genetic Diversity Analysis of Eighteen Tea Clones 199
Wachira FN, Waugh R, Hackett CA and Powell W (1995) Detection of genetic diversity in tea (Camellia sinensis) using RAPD markers. Genome 38: 201‐210.
Weisburger JH (1997) Tea and health: A historical perspective. Cancer Lett. 114: 315-317. Welsh J and McCleland M (1990) Fingerprinting genome using PCR with arbitrary
primers. Nucleic Acids Res. 18: 7213‐7218.
Williams JGK, Kubelik AR, Livak KJ Rafaliski JA and Tingey SV (1990) DNA polymorphism amplified by arbitrary primers are useful as genetic markers. Nucleic Acids Res. 18: 6531‐6535.