Embed Size (px)
Citation preview

NUREG-1437 Supplement 58
Generic Environmental Impact Statement for License Renewal of Nuclear Plants
Supplement 58
Regarding River Bend Station, Unit 1
Final Report
Office of Nuclear Reactor Regulation
AVAILABILITY OF REFERENCE MATERIALSIN NRC PUBLICATIONS
NRC Reference Material
As of November 1999, you may electronically access NUREG-series publications and other NRC records at NRC’s Library at www.nrc.gov/reading-rm.html. Publicly released records include, to name a few, NUREG-series publications; Federal Register notices; applicant, licensee, and vendor documents and correspondence; NRC correspondence and internal memoranda; bulletins and information notices; inspection and investigative reports; licensee event reports; and Commission papers and their attachments.
NRC publications in the NUREG series, NRC regulations, and Title 10, “Energy,” in the Code of Federal Regulations may also be purchased from one of these two sources.
1. The Superintendent of DocumentsU.S. Government Publishing OfficeWashington, DC 20402-0001Internet: bookstore.gpo.govTelephone: (202) 512-1800Fax: (202) 512-2104
2. The National Technical Information Service5301 Shawnee RoadAlexandria, VA 22312-0002www.ntis.gov1-800-553-6847 or, locally, (703) 605-6000
A single copy of each NRC draft report for comment isavailable free, to the extent of supply, upon writtenrequest as follows:
Address: U.S. Nuclear Regulatory Commission Office of Administration Multimedia, Graphics, and Storage & Distribution Branch Washington, DC 20555-0001 E-mail: [email protected]: (301) 415-2289
Some publications in the NUREG series that are posted at NRC’s Web site address www.nrc.gov/reading-rm/doc-collections/nuregs are updated periodically and may differ from the last printed version. Although references to material found on a Web site bear the date the material was accessed, the material available on the date cited may subsequently be removed from the site.
Non-NRC Reference Material
Documents available from public and special technical libraries include all open literature items, such as books, journal articles, transactions, Federal Register notices, Federal and State legislation, and congressional reports. Such documents as theses, dissertations, foreign reports and translations, and non-NRC conference proceedings may be purchased from their sponsoring organization.
Copies of industry codes and standards used in asubstantive manner in the NRC regulatory process are maintained at—
The NRC Technical Library Two White Flint North 11545 Rockville Pike Rockville, MD 20852-2738
These standards are available in the library for reference use by the public. Codes and standards are usually copyrighted and may be purchased from the originating organization or, if they are American National Standards, from—
American National Standards Institute11 West 42nd StreetNew York, NY 10036-8002www.ansi.org(212) 642-4900
Legally binding regulatory requirements are stated only in laws; NRC regulations; licenses, including technical speci-fications; or orders, not in NUREG-series publications. The views expressed in contractorprepared publications in this series are not necessarily those of the NRC.
The NUREG series comprises (1) technical and adminis-trative reports and books prepared by the staff (NUREG–XXXX) or agency contractors (NUREG/CR–XXXX), (2)proceedings of conferences (NUREG/CP–XXXX), (3) reportsresulting from international agreements (NUREG/IA–XXXX),(4) brochures (NUREG/BR–XXXX), and (5) compilations oflegal decisions and orders of the Commission and Atomicand Safety Licensing Boards and of Directors’ decisionsunder Section 2.206 of NRC’s regulations (NUREG–0750).
DISCLAIMER: This report was prepared as an account of work sponsored by an agency of the U.S. Government. Neither the U.S. Government nor any agency thereof, nor any employee, makes any warranty, expressed or implied, or assumes any legal liability or responsibility for any third party’s use, or the results of such use, of any information, apparatus, product, or process disclosed in this publication, or represents that its use by such third party would not infringe privately owned rights.

NUREG-1437 Supplement 58
Generic Environmental Impact Statement for License Renewal of Nuclear Plants
Supplement 58
Regarding River Bend Station, Unit 1
Final Report
Manuscript Completed: October 2018 Date Published: November 2018
Office of Nuclear Reactor Regulation


iii
COVER SHEET
Responsible Agency: U.S. Nuclear Regulatory Commission, Office of Nuclear Reactor Regulation. There are no cooperating agencies involved in the preparation of this document.
Title: Generic Environmental Impact Statement for License Renewal of Nuclear Plants, Supplement 58, Regarding River Bend Station, Unit 1, Final Report (NUREG–1437). River Bend Station is located near St. Francisville, LA.
For additional information or copies of this document contact:
U.S. Nuclear Regulatory Commission ATTN: David Drucker, Mail Stop O-11F1 11555 Rockville Pike Rockville, MD 20852 Phone: 1-800-368-5642, extension 6223, email: [email protected]
ABSTRACT
The U.S. Nuclear Regulatory Commission (NRC) staff prepared this supplemental environmental impact statement (SEIS) in response to Entergy Louisiana, LLC and Entergy Operations, Inc.’s application to renew the operating license for River Bend Station, Unit 1 (RBS) for an additional 20 years. This SEIS includes the NRC staff’s analysis that evaluates the environmental impacts of the proposed action and alternatives to the proposed action. Alternatives considered include: (1) new nuclear power generation, (2) supercritical pulverized coal, (3) natural gas combined-cycle, (4) a combination of natural gas combined-cycle, biomass, and demand-side management, and (5) no renewal of the license (the no-action alternative). The NRC staff’s recommendation is that the adverse environmental impacts of license renewal for RBS are not so great that preserving the option of license renewal for energy-planning decisionmakers would be unreasonable. The NRC staff based its recommendation on the following factors:
• the analysis and findings in NUREG–1437, “Generic Environmental Impact Statement for License Renewal of Nuclear Plants”
• the environmental report submitted by Entergy • the NRC staff’s consultation with Federal, State, Tribal, and local agencies • the NRC staff’s independent environmental review • the NRC staff’s consideration of public comments


v
TABLE OF CONTENTS
ABSTRACT ............................................................................................................................... iii TABLE OF CONTENTS ............................................................................................................. v LIST OF FIGURES .................................................................................................................... xi LIST OF TABLES .................................................................................................................... xiii EXECUTIVE SUMMARY ........................................................................................................ xvii ABBREVIATIONS AND ACRONYMS ................................................................................... xxiii 1 INTRODUCTION .................................................................................................................1-1
1.1 Proposed Federal Action ............................................................................................... 1-1 1.2 Purpose and Need for the Proposed Federal Action .................................................... 1-1 1.3 Major Environmental Review Milestones ...................................................................... 1-1 1.4 Generic Environmental Impact Statement .................................................................... 1-3 1.5 Supplemental Environmental Impact Statement .......................................................... 1-5 1.6 Decisions to be Supported by the SEIS ........................................................................ 1-6 1.7 Cooperating Agencies ................................................................................................... 1-6 1.8 Consultations ................................................................................................................. 1-6 1.9 Correspondence ............................................................................................................ 1-7 1.10 Status of Compliance .................................................................................................... 1-7 1.11 Related State and Federal Activities ............................................................................. 1-7
2 ALTERNATIVES INCLUDING THE PROPOSED ACTION .................................................2-1 2.1 Proposed Action ............................................................................................................ 2-1
2.1.1 Plant Operations during the License Renewal Term ...................................... 2-1 2.1.2 Refurbishment and Other Activities Associated with License Renewal ......... 2-2 2.1.3 Termination of Nuclear Power Plant Operations and Decommissioning
after the License Renewal Term ..................................................................... 2-2 2.2 Alternatives .................................................................................................................... 2-3
2.2.1 No-Action Alternative ...................................................................................... 2-3 2.2.2 Replacement Power Alternatives.................................................................... 2-4
2.3 Alternatives Considered but Eliminated ...................................................................... 2-13 2.3.1 Solar Power ................................................................................................... 2-13 2.3.2 Wind Power ................................................................................................... 2-14 2.3.3 Biomass Power ............................................................................................. 2-15 2.3.4 Demand-Side Management .......................................................................... 2-15 2.3.5 Hydroelectric Power ...................................................................................... 2-16 2.3.6 Geothermal Power ........................................................................................ 2-16 2.3.7 Wave and Ocean Energy .............................................................................. 2-17 2.3.8 Municipal Solid Waste ................................................................................... 2-17 2.3.9 Petroleum-Fired Power ................................................................................. 2-18 2.3.10 Coal—Integrated Gasification Combined Cycle ........................................... 2-18

vi
2.3.11 Fuel Cells ................................................................................................... 2-18 2.3.12 Purchased Power ....................................................................................... 2-19 2.3.13 Delayed Retirement .................................................................................... 2-19
2.4 Comparison of Alternatives ...................................................................................... 2-20 3 AFFECTED ENVIRONMENT ..............................................................................................3-1
3.1 Description of Nuclear Power Plant Facility and Operation .........................................3-1 3.1.1 External Appearance and Setting .................................................................3-1 3.1.2 Nuclear Reactor Systems .............................................................................3-3 3.1.3 Cooling and Auxiliary Water Systems ...........................................................3-3 3.1.4 Radioactive Waste Management Systems ...................................................3-8 3.1.5 Nonradioactive Waste Management Systems ............................................ 3-14 3.1.6 Utility and Transportation Infrastructure ...................................................... 3-14 3.1.7 Nuclear Power Plant Operations and Maintenance .................................... 3-17
3.2 Land Use and Visual Resources .............................................................................. 3-18 3.2.1 Land Use .................................................................................................... 3-18 3.2.2 Visual Resources ....................................................................................... 3-23
3.3 Meteorology, Air Quality, and Noise ......................................................................... 3-24 3.3.1 Meteorology and Climatology ..................................................................... 3-25 3.3.2 Air Quality .................................................................................................. 3-26 3.3.3 Noise .......................................................................................................... 3-28
3.4 Geologic Environment .............................................................................................. 3-30 3.4.1 Physiography and Geology ........................................................................ 3-30 3.4.2 Economic Resources ................................................................................. 3-31 3.4.3 Soils ........................................................................................................... 3-33 3.4.4 Land Subsidence ....................................................................................... 3-34 3.4.5 Seismic Setting .......................................................................................... 3-34
3.5 Water Resources ..................................................................................................... 3-35 3.5.1 Surface Water Resources .......................................................................... 3-35 3.5.2 Groundwater Resources............................................................................. 3-49
3.6 Terrestrial Resources ............................................................................................... 3-68 3.6.1 River Bend Station Ecoregion..................................................................... 3-68 3.6.2 River Bend Station Site Surveys, Studies, and Reports .............................. 3-69 3.6.3 River Bend Station Site .............................................................................. 3-70 3.6.4 Important Species and Habitats .................................................................. 3-74 3.6.5 Invasive and Non-Native Species ............................................................... 3-78
3.7 Aquatic Resources ................................................................................................... 3-80 3.7.1 Environmental Changes in the Lower Mississippi River .............................. 3-80 3.7.2 Lower Mississippi River .............................................................................. 3-81 3.7.3 Other Onsite Aquatic Resources ................................................................ 3-87 3.7.4 State-Ranked Species ................................................................................ 3-88 3.7.5 Non-Native and Nuisance Species ............................................................. 3-89

vii
3.8 Special Status Species and Habitats ........................................................................ 3-90 3.8.1 Species and Habitats Protected Under the Endangered Species Act ......... 3-90 3.8.2 Species and Habitats Protected under the Magnuson–Stevens Act ........... 3-93
3.9 Historic and Cultural Resources ............................................................................... 3-93 3.9.1 Cultural Background ................................................................................... 3-94 3.9.2 Historic and Cultural Resources at River Bend Station ............................... 3-96
3.10 Socioeconomics ....................................................................................................... 3-96 3.10.1 Power Plant Employment ........................................................................... 3-97 3.10.2 Regional Economic Characteristics ............................................................ 3-98 3.10.3 Demographic Characteristics ..................................................................... 3-99 3.10.4 Housing and Community Services ............................................................ 3-104 3.10.5 Tax Revenues .......................................................................................... 3-106 3.10.6 Local Transportation ................................................................................. 3-107
3.11 Human Health ........................................................................................................ 3-108 3.11.1 Radiological Exposure and Risk ............................................................... 3-108 3.11.2 Chemical Hazards .................................................................................... 3-110 3.11.3 Microbiological Hazards ........................................................................... 3-110 3.11.4 Electromagnetic Fields ............................................................................. 3-112 3.11.5 Other Hazards .......................................................................................... 3-112
3.12 Environmental Justice ............................................................................................ 3-113 3.13 Waste Management and Pollution Prevention ........................................................ 3-118
3.13.1 Radioactive Waste ................................................................................... 3-118 3.13.2 Nonradioactive Waste .............................................................................. 3-118
4 ENVIRONMENTAL CONSEQUENCES AND MITIGATING ACTIONS ...............................4-1 4.1 Introduction ................................................................................................................4-1 4.2 Land Use and Visual Resources ................................................................................4-5
4.2.1 Proposed Action ...........................................................................................4-5 4.2.2 No-Action Alternative ....................................................................................4-5 4.2.3 Replacement Power Alternatives: Common Impacts ....................................4-6 4.2.4 New Nuclear Alternative ...............................................................................4-7 4.2.5 Supercritical Pulverized Coal Alternative ......................................................4-7 4.2.6 Natural Gas Combined-Cycle Alternative .....................................................4-8 4.2.7 Combination Alternative (Natural Gas Combined-Cycle, Biomass, and
Demand-Side Management) ........................................................................4-8 4.3 Air Quality and Noise .................................................................................................4-9
4.3.1 Proposed Action ...........................................................................................4-9 4.3.2 No-Action Alternative ....................................................................................4-9 4.3.3 Replacement Power Alternatives: Air Quality and Noise Common
Impacts ........................................................................................................4-9 4.3.4 New Nuclear Alternative ............................................................................. 4-10 4.3.5 Supercritical Pulverized Coal Alternative .................................................... 4-11

viii
4.3.6 Natural Gas Combined-Cycle Alternative ................................................... 4-12 4.3.7 Combination Alternative (Natural Gas Combined-Cycle, Biomass, and
Demand-Side Management) ...................................................................... 4-14 4.4 Geologic Environment .............................................................................................. 4-15
4.4.1 Proposed Action ......................................................................................... 4-15 4.4.2 No-Action Alternative .................................................................................. 4-15 4.4.3 Replacement Power Alternatives: Common Impacts .................................. 4-15 4.4.4 New Nuclear Alternative ............................................................................. 4-16 4.4.5 Supercritical Pulverized Coal Alternative .................................................... 4-16 4.4.6 Natural Gas Combined-Cycle Alternative ................................................... 4-16 4.4.7 Combination Alternative (Natural Gas Combined-Cycle, Biomass, and
Demand-Side Management) ...................................................................... 4-16 4.5 Water Resources ..................................................................................................... 4-16
4.5.1 Proposed Action ......................................................................................... 4-16 4.5.2 No-Action Alternative .................................................................................. 4-20 4.5.3 Replacement Power Alternatives: Common Impacts .................................. 4-20 4.5.4 New Nuclear Alternative ............................................................................. 4-22 4.5.5 Supercritical Pulverized Coal Alternative .................................................... 4-23 4.5.6 Natural Gas Combined-Cycle Alternative ................................................... 4-23 4.5.7 Combination Alternative (Natural Gas Combined-Cycle, Biomass, and
Demand-Side Management) ...................................................................... 4-24 4.6 Terrestrial Resources ............................................................................................... 4-25
4.6.1 Proposed Action ......................................................................................... 4-25 4.6.2 No-Action Alternative .................................................................................. 4-27 4.6.3 Replacement Power Alternatives: Common Impacts .................................. 4-27
4.7 Aquatic Resources ................................................................................................... 4-29 4.7.1 Proposed Action ......................................................................................... 4-29 4.7.2 No-Action Alternative .................................................................................. 4-30 4.7.3 Replacement Power Alternatives: Common Impacts .................................. 4-30
4.8 Special Status Species............................................................................................. 4-32 4.8.1 Proposed Action ......................................................................................... 4-32 4.8.2 No-Action Alternative .................................................................................. 4-39 4.8.3 Replacement Power Alternatives: Common Impacts .................................. 4-40
4.9 Historic and Cultural Resources ............................................................................... 4-41 4.9.1 Proposed Action ......................................................................................... 4-41 4.9.2 No-Action Alternative .................................................................................. 4-44 4.9.3 Replacement Power Alternatives: Common Impacts .................................. 4-44
4.10 Socioeconomics ....................................................................................................... 4-46 4.10.1 Proposed Action ......................................................................................... 4-46 4.10.2 No-Action Alternative .................................................................................. 4-46 4.10.3 Replacement Power Alternatives: Common Impacts .................................. 4-47
4.11 Human Health .......................................................................................................... 4-49

ix
4.11.1 Proposed Action ......................................................................................... 4-49 4.11.2 No-Action Alternative .................................................................................. 4-58 4.11.3 Replacement Power Alternatives: Common Impacts .................................. 4-58
4.12 Environmental Justice .............................................................................................. 4-60 4.12.1 Proposed Action ......................................................................................... 4-60 4.12.2 No-Action Alternative .................................................................................. 4-62 4.12.3 Replacement Power Alternatives: Common Impacts .................................. 4-63
4.13 Waste Management ................................................................................................. 4-64 4.13.1 Proposed Action ......................................................................................... 4-64 4.13.2 No-Action Alternative .................................................................................. 4-64 4.13.3 Replacement Power Alternatives: Common Impacts .................................. 4-65
4.14 Evaluation of New and Significant Information ......................................................... 4-66 4.15 Impacts Common to All Alternatives ......................................................................... 4-67
4.15.1 Fuel Cycle .................................................................................................. 4-67 4.15.2 Terminating Power Plant Operations and Decommissioning ...................... 4-69 4.15.3 Greenhouse Gas Emissions and Climate Change ...................................... 4-70
4.16 Cumulative Impacts .................................................................................................. 4-75 4.16.1 Air Quality .................................................................................................. 4-76 4.16.2 Water Resources........................................................................................ 4-77 4.16.3 Aquatic Resources ..................................................................................... 4-85 4.16.4 Historic and Cultural Resources ................................................................. 4-88 4.16.5 Socioeconomics ......................................................................................... 4-88 4.16.6 Human Health ............................................................................................ 4-89 4.16.7 Environmental Justice ................................................................................ 4-90 4.16.8 Waste Management and Pollution Prevention ............................................ 4-91 4.16.9 Global Greenhouse Gas Emissions ............................................................ 4-91
4.17 Resource Commitments Associated with the Proposed Action ................................. 4-93 4.17.1 Unavoidable Adverse Environmental Impacts ............................................ 4-93 4.17.2 Relationship between Short-Term Use of the Environment and
Long-Term Productivity .............................................................................. 4-94 4.17.3 Irreversible and Irretrievable Commitment of Resources ............................ 4-94
5 CONCLUSION ....................................................................................................................5-1 5.1 Environmental Impacts of License Renewal ...............................................................5-1 5.2 Comparison of Alternatives ........................................................................................5-1 5.3 Recommendation .......................................................................................................5-2

x
6 REFERENCES ....................................................................................................................6-1 7 LIST OF PREPARERS .......................................................................................................7-1 8 LIST OF AGENCIES, ORGANIZATIONS, AND PERSONS TO WHOM COPIES OF
THIS SEIS ARE SENT ........................................................................................................8-1 9 INDEX .................................................................................................................................9-1 APPENDIX A COMMENTS RECEIVED ON THE RIVER BEND STATION, UNIT 1
ENVIRONMENTAL REVIEW ........................................................................ A-1 APPENDIX B APPLICABLE LAWS, REGULATIONS, AND OTHER
REQUIREMENTS ......................................................................................... B-1 APPENDIX C CONSULTATION CORRESPONDENCE REVIEW ....................................... C-1 APPENDIX D CHRONOLOGY OF ENVIRONMENTAL REVIEW
CORRESPONDENCE .................................................................................. D-1 APPENDIX E PROJECTS AND ACTIONS CONSIDERED IN THE CUMULATIVE
IMPACTS ANALYSIS REVIEW .................................................................... E-1 APPENDIX F U.S. NUCLEAR REGULATORY COMMISSION STAFF EVALUATION
OF SEVERE ACCIDENT MITIGATION ALTERNATIVES FOR RIVER BEND STATION, UNIT 1, IN SUPPORT OF LICENSE RENEWAL APPLICATION REVIEW ............................................................................... F-1

xi
LIST OF FIGURES
Figure 1-1. Environmental Review Process .........................................................................1-3
Figure 1-2. Environmental Issues Evaluated for License Renewal ......................................1-5
Figure 3-1. River Bend Station 50-mi (80-km) Radius Map .................................................3-2
Figure 3-2. Closed-Cycle Cooling System with Mechanical Draft Cooling Towers ...............3-4
Figure 3-3. River Bend Station Cooling Water Intake and River Discharge Facilities ..........3-5
Figure 3-4. River Bend Station In-Scope Transmission Lines............................................ 3-17
Figure 3-5. River Bend Station Plant Layout ..................................................................... 3-19
Figure 3-6. River Bend Station Site Land Use/Land Cover ................................................ 3-20
Figure 3-7. Federal, State, and Local Lands Within a 6-Mi (10-Km) Radius of River Bend Station ................................................................................................... 3-24
Figure 3-8. River Bend Site Topography ........................................................................... 3-32
Figure 3-9. River Bend Alluvial Stream Deposits ............................................................... 3-33
Figure 3-10. Hydrologic Features of the Lower Mississippi River Basin Near River Bend Station ................................................................................................... 3-37
Figure 3-11. Louisiana Pollutant Discharge Elimination System Permitted Outfalls, River Bend Station .......................................................................................... 3-46
Figure 3-12. West Feliciana Parish Generalized North-to-South Hydrogeologic Cross Section ............................................................................................................ 3-50
Figure 3-13. West-East Cross Section of Upland Terrace and Mississippi River Aquifers at River Bend Site ............................................................................. 3-53
Figure 3-14. Aquifers Beneath the Power Block Area That Contain Freshwater .................. 3-54
Figure 3-15. Direction of Groundwater Flow in the Upland Terrace Aquifer at the River Bend Site ........................................................................................................ 3-56
Figure 3-16. Cross Section Depicting Groundwater Flow through the Upland Terrace Aquifer into the Mississippi River Aquifer and then into the Mississippi River ............................................................................................................... 3-57
Figure 3-17. Registered Water Wells Within a 2-Mile Band Around River Bend Station Property Boundary .......................................................................................... 3-59
Figure 3-18. Areal Extent of Southern Hills Regional Aquifer System .................................. 3-60
Figure 3-19. Wells Used to Monitor the Groundwater at the River Bend Site ...................... 3-63
Figure 3-20. Groundwater Tritium Concentrations as of November 2015 at the River Bend Site ........................................................................................................ 3-66
Figure 3-21. RBS Site Natural Areas................................................................................... 3-79
Figure 3-22. 2010 Census—Minority Block Groups Within a 50-mi (80-km) Radius of River Bend Station ........................................................................................ 3-116

xii
Figure 3-23. 2011–2015, American Community Survey 5-Year Estimates—Low-Income Block Groups Within a 50-mi (80 km) Radius of River Bend Station .......................................................................................................... 3-117
Figure 4-1. Salt Water Intrusion into Aquifers Beneath Baton Rouge, LA .......................... 4-83
Figure 4-2. Groundwater Level Drop in "2,800-Foot" Sand Aquifer Beneath River Bend Station ................................................................................................... 4-84

xiii
LIST OF TABLES
Table 2-1. Summary and Key Characteristics of Replacement Power Alternatives Considered In Depth .........................................................................................2-7
Table 2-2. Summary of Environmental Impacts of the Proposed Action and Alternatives ..................................................................................................... 2-21
Table 3-1. River Bend Station Site Land Use/Land Cover by Area................................... 3-21
Table 3-2. Land Use/Land Cover within a 6-mi (10-km) Radius of River Bend Station ..... 3-22
Table 3-3. Ambient Air Quality Standards ........................................................................ 3-26
Table 3-4. Permitted Air Emission Sources at River Bend Station ................................... 3-27
Table 3-5. Estimated Air Pollutant Emissions ................................................................... 3-28
Table 3-6. Common Noise Sources and Noise Levels ..................................................... 3-29
Table 3-7. Annual River Bend Station Surface Water Withdrawals and Return Discharges to the Mississippi River ................................................................. 3-40
Table 3-8. Louisiana Pollutant Discharge Elimination System Permitted Outfalls, River Bend Station .......................................................................................... 3-43
Table 3-9. Common Wildlife Occurring on or in the Vicinity of the River Bend Station Site ................................................................................................................. 3-72
Table 3-10. Important Terrestrial Species and Habitats in West Feliciana Parish............... 3-75
Table 3-11. Historical and Recent Fish Species Recorded near River Bend Station .......... 3-84
Table 3-12. State-Ranked and Protected Species in West Feliciana Parish....................... 3-88
Table 3-13. Residence of Entergy Employees by Parish or County ................................... 3-97
Table 3-14. Employment by Industry in the River Bend Station Region of Influence (2011–2015, 5-Year Estimates) ...................................................................... 3-98
Table 3-15. Estimated Income Information for the River Bend Station Socioeconomic Region of Influence (2011–2015, 5-Year Estimates) ....................................... 3-99
Table 3-16. Population and Percent Growth in River Bend Station Socioeconomic Region of Interest Parishes 1980–2010, 2015 (Estimated), and 2020–2060 (Projected) ................................................................................. 3-100
Table 3-17. Demographic Profile of the Population in the River Bend Station Region of Influence in 2010 ....................................................................................... 3-100
Table 3-18. Demographic Profile of the Population in the River Bend Station Region of Influence, 2011–2015, 5-Year Estimates................................................... 3-101
Table 3-19. 2011–2015 5-Year Estimated Seasonal Housing in Parishes or Counties Located Within 50 mi (80 km) of River Bend Station ..................................... 3-102
Table 3-20. Migrant Farm Workers and Temporary Farm Labor in Parishes or Counties Located Within 50 mi (80 km) of RBS (2012) ................................. 3-103
Table 3-21. Housing in the River Bend Station Region of Influence (2011–2015, 5-Year Estimate) ........................................................................................... 3-105

xiv
Table 3-22. Public Water Supply Systems in East Baton Rouge Parish and West Feliciana Parish ............................................................................................ 3-106
Table 3-23. Entergy Louisiana, LLC Property Tax Payments, 2011–2016 ....................... 3-107
Table 3-24. Entergy Louisiana, LLC Annual Support Payments to Agencies and Parishes ........................................................................................................ 3-107
Table 3-25. Louisiana State Routes in the Vicinity of River Bend Station: 2016 Average Annual Daily Traffic Count .............................................................. 3-108
Table 4-1. Applicable Category 1 (Generic ) Issues for River Bend Station ........................4-2
Table 4-2. Applicable Category 2 (Site-Specific) Issues for the River Bend Station Site ...................................................................................................................4-4
Table 4-3. Effect Determinations for Federally Listed Species Under U.S. Fish and Wildlife Service Jurisdiction ............................................................................. 4-33
Table 4-4. Socioeconomic and Transportation Impacts of Replacement Power Alternatives ..................................................................................................... 4-48
Table 4-5. River Bend Station Core Damage Frequency for Internal Events .................... 4-54
Table 4-6. Breakdown of Population Dose and Offsite Economic Cost by Containment Release Mode ............................................................................ 4-55
Table 4-7. Estimated Greenhouse Gas Emissions(a) from Operation at River Bend Station ............................................................................................................ 4-71
Table 4-8. Direct Greenhouse Gas Emissions from Facility Operations Under the Proposed Action and Alternatives ................................................................... 4-73
Table 4-9. Cumulative Surface Water Withdrawals from the Lower Mississippi River, St. Francisville Reach, 2014 ........................................................................... 4-78
Table 4-10. Comparison of Greenhouse Gas Emission Inventories ................................... 4-93
Table 7-1. List of Preparers ...............................................................................................7-1
Table 8-1. List of Agencies, Organizations, and Persons to Whom Copies of this SEIS Are Sent ...................................................................................................8-1
Table B-1. Federal and State Requirements ..................................................................... B-2
Table B-2. Operating Permits and Other Requirements .................................................... B-5
Table C-1. Endangered Species Act Section 7 Consultation Correspondence with the U.S. Fish and Wildlife Service .......................................................................... C-3
Table C-2. National Historic Preservation Act Correspondence ......................................... C-4
Table D-1. Environmental Review Correspondence .......................................................... D-1
Table E-1. Projects and Actions NRC Staff Considered in the Cumulative Impacts Analysis ........................................................................................................... E-1
Table F-1. RBS CDF For Internal Events .......................................................................... F-3
Table F-2. Base Case Mean Population Dose Risk and Offsite Economic Cost Risk for Internal Events ............................................................................................ F-4

xv
Table F-3. Summary of Major PRA Models and Corresponding CDF and LERF Results ............................................................................................................. F-5
Table F-4. Fire Areas Included in Final Phase of IPEEE Screening ................................ F-12
Table F-5. Internal Flooding CDF by Building .................................................................. F-13
Table F-6. SAMA Cost/Benefit Analysis for River Bend Station Unit 1 ............................ F-35
Table F-7. Estimated Cost Ranges for SAMA Applications ............................................. F-43


xvii
EXECUTIVE SUMMARY
Background
By letter dated May 25, 2017, Entergy Louisiana, LLC and Entergy Operations, Inc., (Entergy) submitted an application to the U.S. Nuclear Regulatory Commission (NRC) to issue a renewed operating license for River Bend Station, Unit 1 (RBS) for an additional 20-year period.
Pursuant to Title 10 of the Code of Federal Regulations (10 CFR) 51.20(b)(2), the renewal of a power reactor operating license requires preparation of an environmental impact statement (EIS) or a supplement to an existing EIS. In addition, 10 CFR 51.95(c) states that, in connection with the renewal of an operating license, the NRC shall prepare an EIS, which is a supplement to the Commission’s NUREG–1437, “Generic Environmental Impact Statement (GEIS) for License Renewal of Nuclear Plants.”
Upon acceptance of Entergy’s application, the NRC staff began the environmental review process described in 10 CFR Part 51, “Environmental Protection Regulations for Domestic Licensing and Related Regulatory Functions,” by publishing a notice of intent to prepare a supplemental environmental impact statement (SEIS) and to conduct scoping for RBS. To prepare this SEIS, the NRC staff performed the following:
• conducted a public scoping meeting on September 19, 2017, in St. Francisville, LAand solicited public comments on scoping (NRC 2018a)
• conducted a severe accident mitigation alternatives audit at RBS fromOctober 23–25, 2017, and an environmental audit at RBS from October 24–26, 2017
• reviewed Entergy’s environmental report (ER) and compared it to the NRC’s licenserenewal GEIS
• consulted with Federal, State, Tribal, and local agencies
• conducted a review of the issues following the guidance set forth inNUREG–1555, Supplement 1, Revision 1, “Standard Review Plans forEnvironmental Reviews for Nuclear Power Plants: Supplement 1: Operating LicenseRenewal,” Final Report
• published a draft SEIS for public comment on May 31, 2018, as noticed in theFederal Register (83 FR 26310). The draft SEIS was available for public commentfrom June 8, 2018, through July 23, 2018 (83 FR 26665)
• considered public comments received during the scoping process and on the draftSEIS.
Proposed Action
Entergy initiated the proposed Federal action (i.e., issuance of a renewed power reactor operating license) by submitting an application for license renewal of RBS. The existing RBS operating license (NPF-47) expires on August 29, 2025. The NRC’s Federal action is to decide whether to issue a renewed license for an additional 20 years of operations. The regulation at 10 CFR 2.109, “Effect of Timely Renewal Application,” states that if a licensee of a nuclear power plant files an application to renew an operating license at least 5 years before the expiration date of that license, the existing license will not be deemed to have expired until the

xviii
NRC staff completes safety and environmental reviews of the application, and the NRC makes a final decision on whether to issue a renewed license for the additional 20 years.
Purpose and Need for Action
The purpose and need for the proposed action (issuance of a renewed license) is to provide an option that allows for power generation capability beyond the term of the current nuclear power plant operating license to meet future system generating needs. Such needs may be determined by other energy-planning decisionmakers, such as states, operators, and, where authorized, Federal agencies (other than the NRC). This definition of purpose and need reflects the NRC’s recognition that, unless there are findings in the safety review required by the Atomic Energy Act of 1954, as amended, or findings in the National Environmental Policy Act of 1969, as amended, environmental analysis that would lead the NRC to reject a license renewal application, the NRC does not have a role in the energy-planning decisions as to whether a particular nuclear power plant should continue to operate.
Environmental Impacts of License Renewal
The SEIS evaluates the potential environmental impacts of the proposed action. The environmental impacts from the proposed action are designated as SMALL, MODERATE, or LARGE. As established in the GEIS, Category 1 issues are those that meet all of the following criteria:
• The environmental impacts associated with the issueare determined to apply either to all plants or, forsome issues, to plants having a specific type ofcooling system or other specified plant or sitecharacteristics.
• A single significance level (i.e., SMALL, MODERATE,or LARGE) has been assigned to the impacts exceptfor collective offsite radiological impacts from the fuelcycle and from high-level waste and spent fueldisposal.
• Mitigation of adverse impacts associated with theissue is considered in the analysis, and it has beendetermined that additional plant-specific mitigationmeasures are likely not to be sufficiently beneficial towarrant implementation.
For Category 1 issues, no additional site-specific analysis is required in this SEIS unless new and significant information is identified. Chapter 4 of this SEIS presents the process for identifying new and significant information. Site-specific issues (Category 2) are those that do not meet one or more of the criteria for Category 1 issues; therefore, an additional site-specific review for these non-generic issues is required, and the results are documented in the SEIS.
Neither Entergy nor the NRC identified information that is both new and significant related to Category 1 issues that would call into question the conclusions in the GEIS. This conclusion is supported by the NRC staff’s review of the applicant’s ER and other documentation relevant to the applicant’s activities, the public scoping process, and the findings from the site audits
SMALL: Environmental effects are not detectable or are so minor that they will neither destabilize nor noticeably alter any important attribute of the resource.
MODERATE: Environmental effects are sufficient to alter noticeably, but not to destabilize, important attributes of the resource.
LARGE: Environmental effects are clearly noticeable and are sufficient to destabilize important attributes of the resource.

xix
conducted by the NRC staff. Therefore, the NRC staff relied upon the conclusions of the GEIS for all Category 1 issues applicable to RBS.
Table ES-1 summarizes the Category 2 issues relevant to RBS and the NRC staff’s findings related to those issues. If the NRC staff determined that there were no Category 2 issues applicable for a particular resource area, the findings of the GEIS, as documented in Appendix B to Subpart A of 10 CFR Part 51, are incorporated for that resource area.
Table ES-1. Summary of NRC Conclusions Relating to Site-Specific Impacts of License Renewal at RBS
Resource Area Relevant Category 2 Issues Impacts Surface Water Resources Surface water use conflicts (plants with
cooling ponds or cooling towers using makeup water from a river)
SMALL
Groundwater Resources Groundwater use conflicts (plants with closed-cycle cooling systems that withdraw makeup water from a river) Radionuclides released to groundwater
SMALL
SMALL to MODERATE Terrestrial Resources Effects on terrestrial resources (non-cooling
system impacts) Water use conflicts with terrestrial resources (plants with cooling ponds or cooling towers using makeup water from a river)
SMALL
SMALL
Aquatic Resources Water use conflicts with aquatic resources (plants with cooling ponds or cooling towers using makeup water from a river)
SMALL
Special Status Species and Habitats
Threatened, endangered, and protected species, critical habitat, and essential fish habitat
may affect, but is not likely to adversely affect the pallid sturgeon
Historic and Cultural Resources
Historic and cultural resources would not adversely affect known historic properties
Human Health Microbiological hazards to the public Electric shock hazards
SMALL SMALL
Environmental Justice Minority and low-income populations no disproportionately high and adverse human health and environmental effects
Severe Accident Mitigation Alternatives
Since severe accident mitigation alternatives (SAMAs) have not been previously considered in an environmental impact statement or environmental assessment for RBS, 10 CFR 51.53(c)(3)(ii)(L) requires Entergy to submit, with the ER, a consideration of alternatives to mitigate severe accidents. SAMAs are potential ways to reduce the risk or potential impacts of uncommon but potentially severe accidents. SAMAs may include changes to plant components, systems, procedures, and training.

xx
The NRC staff reviewed Entergy’s ER evaluation of potential SAMAs and concluded that none of the potentially cost-beneficial SAMAs relate to adequately managing the effects of aging during the extended period of operation. Therefore, the potentially cost-beneficial SAMAs identified need not be implemented as part of the license renewal, pursuant to 10 CFR Part 54.
Alternatives
The NRC staff considered the environmental impacts associated with alternatives to license renewal. These alternatives include other methods of power generation, as well as not renewing the RBS operating license (the no-action alternative). The NRC staff considered the following feasible and commercially viable replacement power alternatives:
• new nuclear power• supercritical pulverized coal• natural gas combined-cycle• combination alternative: natural gas combined-cycle, biomass, and
demand-side management
The NRC staff initially considered a number of additional alternatives for analysis as alternatives to the license renewal of RBS. The NRC staff later dismissed these alternatives because of technical, resource availability, or commercial limitations that currently exist and that the NRC staff believes are likely to continue to exist when the current RBS license expires. The no-action alternative and the effects it would have were also considered by the NRC staff.
Where possible, the NRC staff evaluated potential environmental impacts for these alternatives located at both the RBS site and some other unspecified alternate location. The NRC staff considered the following alternatives, but dismissed them:
• solar power• wind power• biomass• demand-side management• hydroelectric power• geothermal power• wave and ocean energy• municipal solid waste• petroleum-fired power• coal—integrated gasification combined-cycle• fuel cells• purchased power• delayed retirement of nearby generating facilities
The NRC staff evaluated each alternative using the same resource areas that were used in evaluating impacts from license renewal.

xxi
Recommendation
The NRC staff’s recommendation is that the adverse environmental impacts of license renewal for RBS are not so great that preserving the option of license renewal for energy-planning decisionmakers would be unreasonable. The NRC staff based its recommendation on the following:
• the analysis and findings in NUREG–1437, “Generic Environmental ImpactStatement for License Renewal of Nuclear Plants”
• the environmental report submitted by Entergy
• the NRC staff’s consultation with Federal, State, Tribal, and local agencies
• the NRC staff’s independent environmental review
• the NRC staff’s consideration of public comments during the scoping process and onthe draft SEIS


xxiii
ABBREVIATIONS AND ACRONYMS
ac acre(s) AC alternating current ACC averted cleanup and decontamination costs ACHP Advisory Council on Historic Preservation ADAMS Agencywide Documents Access and Management System AEA Atomic Energy Act of 1954 (as amended) AFW auxiliary feedwater ANL Argonne National Laboratory ANS American Nuclear Society AOC averted offsite property damage costs AOE averted occupational exposure AOSC averted onsite costs AP auxiliary power APE averted public exposure AQCR Air Quality Control Region ASLB Atomic Safety and Licensing Board (NRC) ASME American Society of Mechanical Engineers ATWS anticipated transient(s) without scram BLS Bureau of Labor Statistics BOEM Bureau of Ocean Energy Management BTU/ft3 British thermal unit(s) per cubic foot BWR boiling-water reactor CAA Clean Air Act CCS carbon capture and storage CCW component cooling water CDF core damage frequency CEQ Council on Environmental Quality CET containment event tree CFE early containment failure CFR Code of Federal Regulations cfs cubic foot (feet) per second CLB current licensing basis/bases CO carbon monoxide CO2 carbon dioxide CO2/MWh carbon dioxide per megawatt hour CO2eq carbon dioxide equivalents COL combined license CSP concentrating solar power CWA Clean Water Act dBA A-weighted decibels DOE U.S. Department of Energy DSIRE Database of State Incentives for Renewables and Efficiency DSM demand-side management ECCS emergency core cooling system

xxiv
EFH essential fish habitat EIA Energy Information Administration EIS environmental impact statement Elv. elevation EMF electromagnetic field EPA U.S. Environmental Protection Agency EPRI Electric Power Research Institute EPZ emergency planning zone ER Environmental Report ESA Endangered Species Act of 1973, as amended ESF engineered safety feature ESP early site permit ESW emergency service water F&O fact and observation FEIS final environmental impact statement FERC Federal Energy Regulatory Commission FESOP Federally Enforceable State Operating Permit FIVE fire-induced vulnerability evaluation FR Federal Register FRN Federal Register notice ft3 cubic foot (feet) FW feedwater FWCA Fish and Wildlife Coordination Act of 1934, as amended FWS U.S. Fish and Wildlife Service GEIS generic environmental impact statement GHG greenhouse gases GI generic issue GL generic letter gpd gallon(s) per day gpm gallon(s) per minute ha hectare(s) HAP Hazardous Air Pollutant HCLPF high confidence in low probability of failure HEP human error probability HFE human failure event HFO high winds, floods, and other HRA human reliability analysis HX heat exchanger IEA International Energy Agency IGCC integrated gasification combined-cycle INEEL Idaho National Engineering and Environmental Laboratory IPE individual plant examination IPEEE individual plant examination(s) of external events ISLOCA interfacing-systems loss-of-coolant accident km kilometer(s) kW kilowatt(s)

xxv
kWe kilowatt(s) electric kWh/m2/d kilowatt hours per square meter per day lb pound(s) LDEQ Louisiana Department of Environmental Quality LER large early release LERF large early release frequency LMFW loss of main feedwater LOCA loss-of-coolant accident LOOP loss(es) of offsite power Lpd liters per day LRA license renewal application µg/m3 micrograms per cubic meter m/s meter(s) per second m3 cubic meter(s) MAAP Modular Accident Analysis Program MACCS2 MELCOR Accident Consequence Code System 2 MACR maximum averted cost risk MATS Mercury and Air Toxics Standards MCR main control room mgd million gallons per day mi mile(s) MISO Midcontinent Independent System Operator MMPA Marine Mammal Protection Act MOV motor-operated valve mph mile(s) per hour MSA Magnuson–Stevens Fishery Conservation and Management Act MUR measurement uncertainty recapture MW megawatt(s) MWe megawatt(s) electric MWh megawatt hour(s) MWt megawatt(s) thermal NAAQS National Ambient Air Quality Standards NEIS National Energy Information Service NEPA National Environmental Policy Act of 1969, as amended NETL National Energy Technology Laboratory NGCC natural gas combined-cycle NHPA National Historic Preservation Act of 1966, as amended NMFS National Marine Fisheries Service NO2 nitrogen dioxide NOx nitrogen oxide(s) NPDES National Pollutant Discharge Elimination System NRC U.S. Nuclear Regulatory Commission NREL National Renewable Energy Laboratory NRR Nuclear Reactor Regulation, Office of (NRC) O3 ozone OECR offsite economic cost risk ORNL Oak Ridge National Laboratory

xxvi
Pb lead ppm parts per million ppb parts per billion PDR population dose risk PDS plant damage state PEIS programmatic environmental impact statement PL public law PM particulate matter PNNL Pacific Northwest National Laboratory PORV power-operated relief valve PRA probabilistic risk assessment PV photovoltaic PWR pressurized-water reactor RAI request(s) for additional information RBS River Bend Station, Unit 1 RCP reactor coolant pump RCRA Resource Conservation and Recovery Act of 1976, as amended rem roentgen equivalent(s) man RHR residual heat removal ROI region(s) of influence RPC replacement power cost RPS reactor protection system RPV reactor pressure vessel RRW risk reduction worth SAMA severe accident mitigation alternative SAT system auxiliary transformer SBO station blackout SCPC supercritical pulverized coal SEIS supplemental environmental impact statement SER safety evaluation report SG steam generator SI safety injection SIP State Implementation Plan SMA seismic margin assessment SO2 sulfur dioxide SR supporting requirement SSC structure, system, and component SSEL safe shutdown equipment list Sv sievert(s) SW service water syngas synthesis gas TEEIC Tribal Energy and Environmental Information Clearinghouse TS technical specification U.S. United States U.S.C. United States Code UFSAR updated final safety analysis report

xxvii
USDA U.S. Department of Agriculture USGS U.S. Geological Survey VOC volatile organic compound yd3 cubic yard(s) W/m2 watt(s) per square meter


1-1
1 INTRODUCTION
The U.S. Nuclear Regulatory Commission’s (NRC’s) environmental protection regulations in Title 10 of the Code of Federal Regulations (10 CFR) Part 51, “Environmental Protection Regulations for Domestic Licensing and Related Regulatory Functions,” implement the National Environmental Policy Act of 1969, as amended (42 U.S.C. 4321 et seq.). This Act is commonly referred to as NEPA. The regulations at 10 CFR Part 51 require the NRC to prepare an environmental impact statement (EIS) before making a decision on whether to issue an operating license or renewed operating license for a nuclear power plant.
The Atomic Energy Act of 1954, as amended (42 U.S.C. 2011 et seq.), specifies that licenses for commercial power reactors can be granted for up to 40 years. The initial 40-year licensing period was based on economic and antitrust considerations rather than on technical limitations of the nuclear facility. NRC regulations in 10 CFR 54.31, “Issuance of a Renewed License,” allow the NRC to renew a license for up to an additional 20 years beyond the expiration of the current operating license.
The decision to seek a renewed license rests entirely with nuclear power facility owners and typically is based on the facility’s economic viability and the investment necessary to continue to meet NRC safety and environmental requirements. The NRC makes the decision to grant or deny a renewed license based on whether the applicant has demonstrated reasonable assurance that the environmental and safety requirements in the agency’s regulations can be met during the period of extended operation.
1.1 Proposed Federal Action
Entergy Louisiana, LLC and Entergy Operations, Inc. (collectively referred to as Entergy) initiated the proposed Federal action by submitting an application for a renewed license for River Bend Station, Unit 1 (RBS), for which the existing license (NPF-47) expires on August 29, 2025. The NRC’s Federal action is to decide whether to renew the license for an additional 20 years.
1.2 Purpose and Need for the Proposed Federal Action
The purpose and need for the proposed Federal action (issuance of a renewed license) is to provide an option that allows for power generation capability beyond the term of a current nuclear power plant operating license to meet future system generating needs as such needs may be determined by other energy-planning decisionmakers. This definition of purpose and need reflects the NRC’s recognition that, unless there are findings in the safety review required by the Atomic Energy Act or findings in the NEPA environmental analysis that would lead the NRC to reject a license renewal application (LRA), the NRC does not have a role in the energy-planning decisions of state regulators and utility officials as to whether a particular nuclear power plant should continue to operate.
1.3 Major Environmental Review Milestones
Entergy submitted an environmental report (ER) (Entergy 2017h) as an appendix to its license renewal application in May 2017 (Entergy 2017g). In a letter dated July 10, 2017 (NRC 2017h), the NRC staff informed Entergy that its LRA was insufficient and requested additional information. Entergy submitted the requested additional information in a letter dated

1-2
August 1, 2017 (Entergy 2017c). After reviewing the additional information, the NRC staff found the license renewal application (including the environmental report) to be sufficient to proceed with the staff’s review. On August 14, 2017, the NRC staff published a Federal Register notice of acceptability and opportunity for hearing (Volume 82 of the Federal Register (FR), page 37908 (82 FR 37908)). Then, on September 20, 2017, the NRC published another notice in the Federal Register (82 FR 44004) informing members of the public of the staff’s intent to conduct an environmental scoping process, thereby beginning a 30-day scoping comment period.
The NRC staff held a public scoping meeting on September 19, 2017, in St. Francisville, LA. In April 2018, the NRC issued its “Environmental Impact Statement Scoping Process Summary Report, River Bend Station, Unit 1, St. Francisville, Louisiana,” which includes the comments received during the scoping process and the NRC staff’s responses to those comments (NRC 2018a).
To independently verify information that Entergy provided in its environmental report, the NRC staff conducted two site audits at RBS in October 2017. The NRC staff conducted a severe accident mitigation alternatives audit from October 23–25, 2017. In a letter dated December 6, 2017, the staff summarized that site audit and listed the attendees (NRC 2017f). The NRC staff conducted an environmental audit from October 24–26, 2017. In a letter dated November 27, 2017, the staff summarized that site audit and listed the attendees (NRC 2017g). During these audits, the NRC staff met with plant personnel, reviewed site-specific documentation, toured the facility, and met with representatives of the Louisiana Office of Cultural Development.
Upon completion of the scoping period and site audits, and completion of its review of the applicant’s environmental report and related documents, the NRC staff compiled its findings in a draft supplemental environmental impact statement (SEIS) on May 31, 2018 (83 FR 26310). The NRC staff made the draft SEIS available for public comment for from June 8, 2018, through July 23, 2018 (83 FR 26665). The draft SEIS was available for public comment for 45 days. Based on the comments and new information received, the NRC staff amended the draft SEIS, as necessary, and published this final SEIS. Changes made to the draft SEIS in response to comments as well as changes to include updated information, and minor corrective and editorial revisions are marked with a change bar (vertical lines) on the side margin of the page where the changes were made. Figure 1-1 shows the major milestones of the environmental review portion of the NRC’s license renewal application review process.

1-3
Figure 1-1. Environmental Review Process
The NRC has established a license renewal process that can be completed in a reasonable period of time with clear requirements to assure safe plant operation for up to an additional 20 years of plant life. This process consists of separate environmental and safety reviews, which the NRC staff conducts simultaneously and documents in two reports: (1) the supplemental environmental impact statement (SEIS) documents the environmental review and (2) the safety evaluation report (SER) documents the safety review. The findings in the SEIS and the SER are both factors in the NRC’s decision to issue or deny a renewed license.
1.4 Generic Environmental Impact Statement
The NRC staff performed a generic assessment of the environmental impacts associated with license renewal to improve the efficiency of its license renewal review. NUREG–1437, “Generic Environmental Impact Statement for License Renewal of Nuclear Power Plants,” (GEIS) (NRC 1996, 1999, 2013b), documented the results of the staff’s systematic approach to evaluate the environmental consequences of renewing the licenses of individual nuclear power plants and operating them for an additional 20 years. The staff analyzed in detail and resolved those environmental issues that could be resolved generically in the GEIS. The GEIS originally was issued in 1996, Addendum 1 to the GEIS was issued in 1999, and Revision 1 to the GEIS was issued in 2013. Unless otherwise noted, all references to the GEIS include the GEIS, Addendum 1, and Revision 1.
The GEIS establishes separate environmental impact issues for the NRC staff to independently evaluate. Appendix B to Subpart A of 10 CFR Part 51, “Environmental Effect of Renewing the

1-4
Operating License of a Nuclear Power Plant,” provides a summary of the staff’s findings in the GEIS. For each environmental issue addressed in the GEIS, the NRC staff:
• describes the activity that affects the environment • identifies the population or resource that is affected • assesses the nature and magnitude of the impact on the affected population or
resource • characterizes the significance of the effect for both beneficial and adverse effects • determines whether the results of the analysis apply to all plants • considers whether additional mitigation measures would be warranted for impacts
that would have the same significance level for all plants
The NRC’s standard of significance for impacts was established using the Council on Environmental Quality terminology for “significant.” The NRC established three levels of significance for potential impacts—SMALL, MODERATE, and LARGE—as defined below.
SMALL: Environmental effects are not detectable or are so minor that they will neither destabilize nor noticeably alter any important attribute of the resource.
MODERATE: Environmental effects are sufficient to alter noticeably, but not to destabilize, important attributes of the resource.
LARGE: Environmental effects are clearly noticeable and are sufficient to destabilize important attributes of the resource.
The GEIS includes a determination of whether the analysis of the environmental issue could be applied to all plants and whether additional mitigation measures would be warranted. Issues are assigned a Category 1 or Category 2 designation. As established in the GEIS, Category 1 issues are those that meet the following criteria:
• The environmental impacts associated with the issue have been determined to apply either to all plants or, for some issues, to plants that have a specific type of cooling system or other specified plant or site characteristics.
• A single significance level (i.e., SMALL, MODERATE, or LARGE) has been assigned to the impacts (except for collective offsite radiological impacts from the fuel cycle and from high-level waste and spent fuel disposal).
• Mitigation of adverse impacts associated with the issue has been considered in the analysis, and it has been determined that additional plant-specific mitigation measures are likely not to be sufficiently beneficial to warrant implementation.
For generic issues (Category 1), no additional site-specific analysis is required in the SEIS unless new and significant information is identified. The process for identifying new and significant information for site-specific analysis is presented in Chapter 4. Site-specific issues (Category 2) are those that do not meet one or more of the criteria of Category 1 issues; therefore, additional site-specific review for these issues is required. The GEIS evaluates 78 environmental issues, provides generically applicable findings for numerous issues (subject to the consideration of any new and significant information on a site-specific basis), and
Significance indicates the importance of likely environmental impacts and is determined by considering two variables: context and intensity.
Context is the geographic, biophysical, and social context in which the effects will occur.
Intensity refers to the severity of the impact in whatever context it occurs.

1-5
concludes that a site-specific analysis is required for 17 of the 78 issues. Figure 1-2 illustrates this process. The results of that site-specific review are documented in the SEIS.
Figure 1-2. Environmental Issues Evaluated for License Renewal
1.5 Supplemental Environmental Impact Statement
This SEIS presents the NRC staff’s final analysis of the environmental effects of the continued operation of RBS through the license renewal period, alternatives to license renewal, and mitigation measures for minimizing adverse environmental impacts. Chapter 4 contains analysis and comparison of the potential environmental impacts from license renewal and alternatives thereto. Chapter 5 presents the NRC’s recommendation on whether the environmental impacts of license renewal are so great that preserving the option of license renewal would be unreasonable. In issuing this final SEIS, the NRC staff considered the comments it had received on the previously published draft SEIS. The NRC staff will make its final recommendation to the Commission on RBS license renewal in the record of decision to be issued following issuance of this final SEIS.
In the preparation of the RBS SEIS, the NRC staff carried out the following activities:
• reviewed the information provided in Entergy’s ER • consulted with Federal agencies, State and local agencies, and Tribal Nations

1-6
• conducted an independent review of the issues during the environmental and severeaccident management analysis site audits
• considered public comments received during the environmental scoping process andon the draft SEIS
New information can be identified from many sources, including the applicant, the NRC, other agencies, or public comments. If a new issue is revealed, it is first analyzed to determine whether it is within the scope of the license renewal environmental evaluation. If the new issue bears on the proposed action, the NRC staff would determine the significance of the issue for the plant and document the analysis in the SEIS.
1.6 Decisions to be Supported by the SEIS
The decision to be supported by the SEIS is whether to renew the operating license for RBS for an additional 20 years. The regulation at 10 CFR 51.103(a)(5) specifies the NRC’s decision standard as follows:
In making a final decision on a license renewal action pursuant to Part 54 of this chapter, the Commission shall determine whether or not the adverse environmental impacts of license renewal are so great that preserving the option of license renewal for energy planning decisionmakers would be unreasonable.
There are many factors that the NRC takes into consideration when deciding whether to renew the operating license of a nuclear power plant. The analyses of environmental impacts evaluated in this SEIS will provide the NRC’s decisionmaker (in this case, the Commission) with important environmental information for use in the overall decisionmaking process. There are also decisions that are made outside the regulatory scope of license renewal. These include decisions related to: (1) changes to plant cooling systems, (2) disposition of spent nuclear fuel, (3) emergency preparedness, (4) safeguards and security, (5) need for power, and(6) seismicity and flooding (NRC 2013b).
1.7 Cooperating Agencies
During the scoping process, the NRC staff identified no Federal, State, or local agencies as cooperating agencies in the preparation of this SEIS.
1.8 Consultations
The Endangered Species Act of 1973, as amended (16 U.S.C. 1531 et seq.); the Magnuson-Stevens Fisheries Conservation and Management Act of 1996, as amended (16 U.S.C. 1801 et seq.); and the National Historic Preservation Act of 1966, as amended (54 U.S.C. 300101 et seq.), require Federal agencies to consult with applicable State and Federal agencies and groups before taking an action that may affect endangered species, fisheries, or historic and archaeological resources, respectively. The NRC staff consulted with the following agencies and groups during this environmental review:
• U.S. Fish and Wildlife Service• Chitimacha Tribe of Louisiana• Coushatta Tribe of Louisiana
New and significant information. To merit additional review, information must be both “new” and “significant,” and it must bear on the proposed action or its impacts.

1-7
• Jena Band of Choctaw Indians • Tunica-Biloxi Tribe of Louisiana • Alabama Coushatta Tribe of Texas • The Choctaw Nation of Oklahoma • Mississippi Band of Choctaw Indians • The Seminole Nation of Oklahoma • Seminole Tribe of Florida • Louisiana Office of Cultural Development, State Historic Preservation Office • Federal Advisory Council on Historic Preservation
Appendix C of this SEIS discusses the consultations conducted in support of this environmental review.
1.9 Correspondence
During the course of the environmental review, the NRC staff contacted Federal, State, regional, local, and Tribal agencies listed in Section 1.8. Appendices C and D contain a chronological list of all documents sent and received during the environmental review. Appendix C lists the correspondence associated with the Endangered Species Act, the Magnuson–Stevens Fisheries Conservation and Management Act, and the National Historic Preservation Act. Appendix D lists all other correspondence.
1.10 Status of Compliance
Entergy is responsible for complying with all NRC regulations and other applicable Federal, State, and local requirements. Appendix F of the GEIS describes some of the major applicable Federal statutes. Numerous permits and licenses are issued by Federal, State, and local authorities for activities at RBS. Appendix B of this SEIS contains further information about Entergy’s status of compliance.
1.11 Related State and Federal Activities
The NRC reviewed the possibility that activities of other Federal agencies might affect the renewal of the operating license for RBS. There are no Federal projects that would make it necessary for another Federal agency to become a cooperating agency in the preparation of this SEIS.
The Tunica-Biloxi Reservation is the only known Native American Reservation or Trust Land within 50 miles (mi) (80 kilometers (km)) of RBS. The area surrounding the RBS site is predominantly rural. A number of parks, historic sites, preserves, and refuges are located near RBS. Approximately 6 mi (10 km) west of the RBS site, Cat Island National Wildlife Refuge consists of cypress-tupelo swamp and bottomland hardwood forests. The refuge is one of the few remaining unleveed sections of floodplain along the Lower Mississippi River and, therefore, is subject to regular inundation by the river. Nine parks and State-managed historic sites lie within 6 mi (10 km) of the site: St. Francisville Recreational Park, Parker Memorial Park, Garden Symposium Park, West Feliciana Sports and Recreational Park, West Feliciana Parish Railroad Park, Audubon State Historic Site, Rosedown Plantation State Historic Site, Port Hudson State Historic Site, and Locust Grove State Historic Site.

1-8
The NRC is required under Section 102(2)(C) of NEPA to consult with and obtain comments from any Federal agency that has jurisdiction by law or special expertise with respect to any environmental impact involved in the subject matter of the SEIS. For example, during the course of preparing the SEIS, the NRC consulted with the U.S. Fish and Wildlife Service. Appendix C provides a complete list of consultation correspondence.

2-1
2 ALTERNATIVES INCLUDING THE PROPOSED ACTION
The U.S. Nuclear Regulatory Commission’s (NRC’s) decisionmaking authority in license renewal focuses on deciding whether or not to renew a nuclear power plant’s operating license. The agency’s implementation of the National Environmental Policy Act of 1969, as amended (NEPA) (42 U.S.C. 4321 et seq.), requires the NRC to consider potential alternatives to renewing a plant’s operating license as well as the environmental impacts of these alternatives. Considering the environmental impacts of renewing the operating license and comparing those impacts to the environmental impacts of alternatives allows the NRC to determine whether the environmental impacts of license renewal are so great that it would be unreasonable for the agency to preserve the option of license renewal for energy-planning decisionmakers (Title 10 of the Code of Federal Regulations (10 CFR) 51.95(c)(4)). Ultimately, decisionmakers such as the plant operator, State, or other non-NRC Federal officials will decide whether to carry out the proposed action (if the NRC renews the license) or shut down the plant and choose an alternative power generation source. Economic and environmental considerations play important roles in these other decisionmakers’ decisions.
In general, the NRC’s responsibility is to ensure the safe operation of nuclear power facilities, not to formulate energy policy, promote nuclear power, or encourage or discourage the development of alternative power generation sources. The NRC does not engage in energy-planning decisions, and it makes no judgment as to which energy alternatives evaluated would be the most likely alternative to be selected in any given case.
This chapter provides (1) a description of the proposed action (i.e., NRC renewal of the operating license for River Bend Station, Unit 1 (RBS)), (2) an in-depth evaluation of reasonable alternatives to the proposed action (including the no-action alternative), and (3) a brief description of alternatives to the proposed action that the NRC staff considered but then eliminated from in-depth evaluation. The reasonably foreseeable impacts of the proposed action (license renewal) are described in Chapter 4 of this plant-specific supplemental environmental impact statement (SEIS). Chapter 4 also compares the impacts of renewing the RBS operating license and continued plant operations to the environmental impacts of the alternatives.
2.1 Proposed Action
As stated in Section 1.1 of this document, the NRC’s proposed Federal action is the decision of whether to renew the RBS operating license for an additional 20 years. An evaluation of the impacts from continued operation of RBS commences with an overview of the facility and the facility’s operations, and then considers the affected environment and potential impacts thereto.
A description of normal power plant operations during the license renewal term is provided in Section 2.1.1. In brief, RBS is a single-unit, nuclear-powered, steam-electric generating facility that began commercial operation in June 1986. The nuclear reactor is a General Electric boiling-water reactor (BWR) that produces 967 megawatts electric (MWe) (Entergy 2017h).
2.1.1 Plant Operations during the License Renewal Term
Most plant operation activities during license renewal would be the same as, or similar to, those occurring during the current license term. NUREG–1437, Volume 1, Revision 1, “Generic Environmental Impact Statement for License Renewal of Nuclear Power Plants,” (NRC 2013b)

2-2
(also known as the GEIS) describes the issues that would have the same impact at all nuclear power plants (generically applicable issues) as well as those issues which would have different impact levels at different nuclear power plants. The impacts of generically applicable issues are described in NUREG-1437 as Category 1 issues; those impacts are set out in NUREG-1437 and Table B-1 of 10 CFR Part 51, Appendix B, and those determinations apply to each license renewal application, subject to the consideration of any new and significant information on a plant-specific basis. A second group of issues (Category 2) was identified in NUREG-1437 as having potentially different impacts at each plant, on a site-specific basis; those issues with plant-specific impact levels need to be discussed in a plant-specific supplemental environmental impact statement (SEIS) like this one.
Section 2.1.1 of the GEIS, “Plant Operations during the License Renewal Term,” describes the general types of activities that are carried out during the operation of all nuclear power plants. These general types of activities include the following:
• reactor operation• waste management• security• office and clerical work• surveillance, monitoring, and maintenance• refueling and other outages
As stated in Entergy’s environmental report (ER), RBS will continue to operate during the license renewal term in the same manner as it would during the current license term except for, as appropriate, additional aging management programs to address structure and component aging in accordance with 10 CFR Part 54, “Requirements for Renewal of Operating Licenses for Nuclear Power Plants.”
2.1.2 Refurbishment and Other Activities Associated with License Renewal
Refurbishment activities include replacement and repair of major structures, systems, and components (SSCs). The major refurbishment class of activities characterized in the GEIS is intended to encompass actions that typically take place only once in the life of a nuclear plant, if at all (NRC 2013b). For example, replacement of boiling-water reactor recirculation piping systems is a refurbishment activity. Refurbishment activities may have an impact on the environment beyond those that occur during normal operations and may require evaluation, depending on the type of action and the plant-specific design.
In preparation for its license renewal application, Entergy evaluated major structures, systems, and components in accordance with 10 CFR 54.21, “Contents of Application—Technical Information,” to identify major refurbishment activities necessary for the continued operation of RBS during the proposed 20-year period of extended operation (Entergy 2017h).
Entergy did not identify any major refurbishment activities necessary for the continued operation of RBS beyond the end of the existing operating license (Entergy 2017h).
2.1.3 Termination of Nuclear Power Plant Operations and Decommissioning after the License Renewal Term
NUREG–0586, Supplement 1, Volumes 1 and 2, “Generic Environmental Impact Statement on Decommissioning of Nuclear Facilities: Regarding the Decommissioning of Nuclear Power

2-3
Reactors” (NRC 2002), describes the impacts of decommissioning. The majority of plant operations activities would cease with reactor shutdown. However, some activities (e.g., security and oversight of spent nuclear fuel) would remain unchanged, whereas others (e.g., waste management; office and clerical work; laboratory analysis; and surveillance, monitoring, and maintenance) would continue at reduced or altered levels. Systems dedicated to reactor operations would cease operations; however, if these systems are not removed from the site after reactor shutdown, their physical presence may continue to impact the environment. Impacts associated with dedicated systems that remain in place or with shared systems that continue to operate at normal capacities could remain unchanged.
Decommissioning will occur whether RBS is shut down at the end of its current operating license or at the end of the period of extended operation 20 years later. There are no site-specific issues related to decommissioning. The GEIS concludes that license renewal would have a negligible (SMALL) effect on the impacts of terminating operations and decommissioning on all resources (NRC 2013b).
2.2 Alternatives
As stated above, the National Environmental Policy Act of 1969, as amended (NEPA), requires the NRC staff to consider reasonable alternatives to the proposed action of renewing the RBS operating license. For a replacement power alternative to be reasonable it must be both (1) commercially viable on a utility scale and (2) operational before the reactor’s operating license expires or (3) expected to become commercially viable on a utility scale and operational before the expiration of the reactor’s operating license (NRC 2013b). The 2013 GEIS update incorporated the latest information on replacement power alternatives; however, rapidly evolving technologies are likely to outpace the information in the GEIS. As such, for each SEIS, the NRC staff must perform a site-specific analysis of alternatives that accounts for changes in technology and science since the preparation of the most recent GEIS update.
The first alternative to the proposed action of NRC issuing a 20-year operating license renewal to RBS is the NRC simply not issuing that license renewal. This is called the no-action alternative. Section 2.2.1 below describes the no-action alternative. In addition to the no-action alternative, this chapter discusses four reasonable replacement power alternatives. These alternatives seek to replace RBS’s generating capacity and meet the region’s energy needs through other means or sources. Sections 2.2.2.1 through 2.2.2.4 describe replacement power alternatives for RBS.
2.2.1 No-Action Alternative
At some point, all operating nuclear power plants will terminate operations and undergo decommissioning. The no-action alternative represents a decision by the NRC to not renew the operating license of a nuclear power plant beyond the current operating license term. Under the no-action alternative, the NRC does not renew the operating license, and RBS shuts down at or before the expiration of the current license in 2025. The GEIS describes impacts that arise directly from plant shutdown. The NRC expects shutdown impacts to be relatively similar whether they occur at the end of the current license (i.e., after 40 years of operation) or at the end of a renewed license (i.e., after 60 years of operation).
After shutdown, plant operators will initiate decommissioning in accordance with 10 CFR 50.82, “Termination of License.” Supplement 1 to NUREG–0586 (NRC 2002) describes the environmental impacts from decommissioning a nuclear power plant and related activities.

2-4
The analysis in NUREG-0586 bounds the environmental impacts of decommissioning at such time as Entergy terminates reactor operations at RBS. Chapter 4 of the GEIS (NRC 2013b) and Section 4.15.2 of this SEIS describe the incremental environmental impacts of license renewal on decommissioning activities.
Termination of operations at RBS would result in the total cessation of electrical power production by the plant. Unlike the alternatives described below in Section 2.2.2, the no-action alternative does not expressly meet the purpose and need of the proposed action, as described in Section 1.2, because it does not provide a means of delivering baseload power to meet future electric system needs. Assuming that a need currently exists for the power generated by RBS, the no-action alternative would likely create a need for a replacement power alternative. The following section describes a wide range of replacement power alternatives, and Chapter 4 assesses their potential impacts. Although the NRC’s authority only extends to deciding whether to renew the RBS operating license, the replacement power alternatives described in the following sections represent possible options for energy-planning decisionmakers if the NRC decides not to renew the RBS operating license.
2.2.2 Replacement Power Alternatives
Alternatives Evaluated in Depth:
• new nuclear
• supercritical pulverized coal (SCPC)
• natural gas combined-cycle (NGCC)
• combination alternative (NGCC, biomass,and demand-side management (DSM))
Other Alternatives Considered but Eliminated:
• solar power
• wind power
• biomass
• demand-side management
• hydroelectric power
• geothermal power
• wave and ocean energy
• municipal solid waste
• petroleum-fired power
• coal-integrated gasification combined-cycle (IGCC)
• fuel cells
• purchased power
In evaluating alternatives to license renewal, • delayed retirement the NRC considered energy technologies or options currently in commercial operation, as well as technologies not currently in commercial operation but likely to be commercially available by the time the current RBS operating license expires on August 29, 2025.
The GEIS presents an overview of some energy technologies, but does not reach conclusions about which alternatives are most appropriate. Because many energy technologies are continually evolving in capability and cost and because regulatory structures have changed to either promote or impede development of particular alternatives, the analyses in this chapter rely on a variety of sources of information to determine which alternatives would be available and commercially viable. In accordance with the NRC’s regulations at 10 CFR 51.45(b)(3), the NRC staff determined that Entergy’s ER provided a discussion of alternatives that was “sufficiently complete to aid the Commission in developing and exploring, pursuant to section 102(2)(E) of NEPA, ‘appropriate alternatives to recommended courses of action in any proposal which involves unresolved conflicts concerning alternative uses of available resources.’”

2-5
In addition to the information Entergy provided in its environmental report, the NRC staff’s analyses in this chapter includes updated information from the following sources:
• U.S. Department of Energy’s (DOE’s), U.S. Energy Information Administration (EIA)• other offices within DOE• U.S. Environmental Protection Agency (EPA)• industry sources and publications
In total, the NRC staff considered 17 alternatives to the proposed action (see text box) and then narrowed these to four reasonable replacement power alternatives. Sections 2.2.2.1 through 2.2.2.4 contain staff’s in-depth evaluation of these four alternatives.
The staff did not perform in-depth evaluations of alternatives that cannot provide the equivalent of RBS’s current generating capacity, as those alternatives would not be able to satisfy the objective of replacing the power generated by RBS. Also, in some cases, the staff eliminated those alternatives whose costs or benefits do not justify inclusion in the range of reasonable alternatives. Further, the staff eliminated, as unfeasible, those alternatives not likely to be constructed and operational by the time the RBS license expires in 2025. Section 2.3 of this report contains a brief discussion of each eliminated alternative and provides the basis for its elimination. To ensure that the alternatives considered in the SEIS are consistent with State or regional energy policies, the NRC staff reviewed energy-related statutes, regulations, and policies within the RBS region.
The evaluation of each alternative considers the environmental impacts across the following impact categories:
• land use and visual resources• air quality and noise• geologic environment• water resources• ecological resources• historic and cultural resources• socioeconomics, human health, environmental justice• waste management
The GEIS assigns most site-specific issues (called Category 2 issues) a significance level of SMALL, MODERATE, or LARGE. For ecological resources subject to the Endangered Species Act of 1973, as amended (16 U.S.C. 1531 et seq.); and the Magnuson-Stevens Fishery Conservation and Management Reauthorization Act of 2006, as amended (16 U.S.C. 1801–1884 et seq.); and historic and cultural resources subject to the National Historic Preservation Act of 1966, as amended (54 U.S.C. 300101 et seq.), the impact significance determination language is specific to the authorizing legislation. The order in which this SEIS presents the different alternatives does not imply increasing or decreasing level of impact; nor does the order presented imply that an energy-planning decisionmaker would be more (or less) likely to select any given alternative.
Region of Influence
If the NRC does not issue a renewed license, procurement of replacement power for RBS may be necessary. RBS is owned by Entergy Louisiana, LLC and operated by Entergy Operations, Inc.;
2-6
together, these companies (both of which are subsidiaries of Entergy Corporation) hold the RBS operating license. RBS provides electricity through the Midcontinent Independent System Operator (MISO) to the SERC Reliability Corporation (SERC). SERC serves a region that includes all or portions of 16 States in the southeastern and central United States (SERC 2016). The SERC region within Louisiana covers approximately two-thirds of the State and constitutes the region of influence for the NRC’s analysis of RBS replacement power alternatives.
In 2015, electric generators in Louisiana had a net summer generating capacity of approximately 26,000 megawatts (MW). This capacity included units fueled by natural gas (72 percent), coal (11 percent), nuclear power (8 percent), petroleum (4 percent), and biomass (2 percent). Lesser amounts associated with several other miscellaneous energy sources comprised the balance of generating capacity in the State (EIA 2017d).
The electric industry in Louisiana provided approximately 108 million megawatt hours (MWh) of electricity in 2015. This electrical production was dominated by natural gas (61 percent), nuclear (14 percent), coal (14 percent), petroleum (4 percent), and biomass (3 percent). Hydroelectric and other miscellaneous energy sources collectively produced the other 4 percent of the electricity in Louisiana (EIA 2017d).
Nationwide in the United States, natural gas generation rose from 16 percent of electricity generated in 2000 to 27 percent in 2013. Given known technological and demographic trends, the U.S. Energy Information Administration predicts that by 2040, natural gas will account for 34 percent of electricity generated in the United States (EIA 2013a, 2016a). Electricity generated from renewable energy is expected to grow from 13 percent of total generation in 2015 to 24 percent in 2040 (EIA 2016a). However, Louisiana’s renewable energy growth may not follow nationwide forecasts. The State does not have a mandatory renewable portfolio standard, and there are other uncertainties that could affect forecasts. In particular, the implementation of policies aimed at reducing greenhouse gas (GHG) emissions could have a direct effect on fossil fuel-based generation technologies (DSIRE 2016).
The remainder of this section describes replacement power alternatives to RBS license renewal that the NRC staff considered in depth. These include a new nuclear alternative in Section 2.2.2.1; a supercritical pulverized coal alternative in Section 2.2.2.2; a natural gas combined-cycle alternative in Section 2.2.2.3; and a combination of natural gas combined cycle, biomass, and demand-side management (DSM) in Section 2.2.2.4. Table 2–1 summarizes key design characteristics of these four alternative power replacement technologies.

2-7
Table 2-1. Summary and Key Characteristics of Replacement Power Alternatives Considered In Depth
New Nuclear Alternative
Supercritical Pulverized Coal Alternative
Natural Gas Combined-Cycle Alternative
Combination Alternative
Summary of Alternative
One 1,080-MWe single-unit nuclear plant
Two 510-MWe units for a total of approximately 1,020 MWe
Three 348-MWe units for a total of approximately 1,040 MWe
Approximately 700 MWe from natural gas combined cycle (two units), 160 MWe from biomass (four units), and 110 MWe from demand-side management energy savings
Location On previously disturbed land within the Entergy Louisiana, LLC site. The Entergy Louisiana, LLC property could be developed for the new nuclear plant alternative. Uses RBS transmission lines and some existing RBS infrastructure (Entergy 2017h).
On previously disturbed land within the Entergy Louisiana, LLC site. Uses the Mississippi River for coal delivery to the facility. Assumes nearby geological formation capable of storing carbon emissions (Entergy 2017h).
On previously disturbed land within the Entergy Louisiana, LLC site. May require some infrastructure upgrades as well as construction of a new or upgraded pipeline. Uses RBS transmission lines and some existing RBS infrastructure (Entergy 2017h).
The natural gas combined-cycle and biomass units would be located on previously disturbed land within the Entergy Louisiana, LLC site. Assumes demand-side management energy savings within the Entergy Louisiana, LLC service territory (Entergy 2017h).
Cooling System
Closed cycle with mechanical draft cooling towers. Cooling water withdrawal—25 mgd; consumptive water use—22 mgd (NRC 2014c).
Closed cycle with mechanical draft cooling towers. Cooling water withdrawal—27 mgd; consumptive water use—20 mgd (NETL 2013).
Closed-cycle with mechanical draft cooling towers. Cooling water withdrawal—7.2 mgd; consumptive water use—5.7 mgd (NETL 2013).
Natural gas combined-cycle and biomass units would use closed-cycle cooling systems with mechanical draft cooling towers. Collectively, cooling water withdrawal for these units would be 8.9 mgd; consumptive water use would be 5.8 mgd (NREL 2011, NETL 2013). No cooling system requirements required for demand-side management.

2-8
New Nuclear Alternative
Supercritical Pulverized Coal Alternative
Natural Gas Combined-Cycle Alternative
Combination Alternative
Land Requirements
Approximately 250 ac (101 ha) of previously disturbed land (Entergy 2008a, Entergy 2017h).
Approximately 100 ac (40 ha) for major permanent facilities and up to 26,000 ac (10,500 ha) for coal mining and waste disposal (Entergy 2016a, 2017h; NRC 1996).
Approximately 50 ac (20 ha) for the plant, with up to an additional 25 ac (10 ha) for right-of-way to connect with existing natural gas supply lines east of the site. In addition, up to 4,300 ac (1,700 ha) could be needed for wells, collection stations, and associated pipelines (Entergy 2017h, NRC 1996).
Approximately 95 ac (38 ha) for the natural gas combined-cycle and biomass units, with up to an additional 25 ac (10 ha) for right-of-way to connect with existing natural gas supply lines east of the site. In addition, up to 4,300 ac (1,700 ha) could be needed for wells, collection stations, and associated pipelines. Demand-side management requires no land (Entergy 2017h, NRC 1996).
Work Force 3,500 workers during peak construction and 680 workers during operations (Entergy 2017h, Times-Free Press 2015).
2,200 workers during peak construction and 300 workers during operations (Entergy 2017h, NRC 1996).
1,450 workers during peak construction and 180 workers during operations (Entergy 2017h, NRC 1996).
Natural gas combined-cycle and biomass units would collectively require 1,160 workers during peak construction and 210 workers during operations. Demand-side management requires no facility construction or operations workers. (Entergy 2017h, NRC 2013a).
Key: ac = acres, DSM = demand-side management, ha = hectares, mgd = million gallons per day, MWe = megawatts electric, NGCC = natural gas combined-cycle (alternative), ROI = region of influence, and SCPC = supercritical pulverized coal.
2.2.2.1 New Nuclear Alternative
The NRC staff considers the construction of a new nuclear plant to be a reasonable alternative to RBS license renewal. Nuclear generation currently provides approximately 14 percent of electricity in Louisiana (EIA 2017d). Two nuclear power plants operate in the region of influence: Waterford Steam Electric Station, Unit 3, is approximately 50 miles south-southeast

2-9
of RBS and Grand Gulf Nuclear Station is approximately 100 miles north of RBS. The NRC staff determined that there may be sufficient time for Entergy to prepare and submit an application, build, and operate a new nuclear unit using a certified design before the RBS license expires in August 2025.
In evaluating the new nuclear alternative, the NRC staff assumed that one new nuclear reactor would be built on a portion of the approximately 3,300 ac (1,300 ha) of Entergy Louisiana, LLC property. The construction would allow for the maximum use of existing ancillary facilities (e.g., support buildings and transmission infrastructure at location). The Entergy Louisiana, LLC property currently encompasses RBS Unit 1, as well as a large excavated area originally planned to support a second unit (planned RBS Unit 2) that Entergy never built. Entergy later submitted to the NRC a license application for constructing RBS Unit 3 in this excavated area, but withdrew the application in 2016 (Entergy 2017h; NRC 2017m).
Entergy identified several activities that would need to occur onsite to accommodate replacement power alternatives. These include modification to portions of West Creek, a man-made drainage ditch, and relocating portions of the ditch west of its current location to allow space for construction of replacement power buildings. The three abandoned RBS Unit 1 standby service water chemical cleaning waste storage tanks currently in the former planned RBS Unit 2 excavation area would also be removed, and several buildings in the immediate area would be rearranged to allow space for the new unit construction (Entergy 2017c).
For the purposes of this analysis, the NRC staff assumed a Westinghouse AP1000 reactor would replace RBS Unit 1. The AP1000 reactor would have an approximate net electrical output of 1,080 MWe. The heat rejection demands of a new nuclear reactor would be similar to those of RBS. In its environmental report, Entergy states that the new reactor could use RBS’s existing mechanical draft closed-cycle cooling water intake and discharge structures with some modifications (Entergy 2017h).
The NRC staff also considered the installation of multiple small modular reactors as a new nuclear alternative to renewing the RBS license. The NRC established the Advanced Reactor Program in the Office of New Reactors because of considerable interest in small modular reactors along with anticipated license applications by vendors. Small modular reactors are approximately 300 MW or less, so they have lower initial capacity than that of large-scale units. However, they have greater siting flexibility because they can fit in locations not large enough to accommodate traditional nuclear reactors (DOE undated). The NRC received the first design certification application for a small modular reactor in December 2016 (NRC 2017b). Following certification, this design could potentially achieve operation on a commercial scale by 2026 (NuScale 2018). Because commercial-scale operation of small modular reactors is not expected until after RBS’s license expires in 2025, the NRC staff eliminated this technology as a reasonable option under the new nuclear alternative.
2.2.2.2 Supercritical Pulverized Coal Alternative
In 2015, coal-fired generation accounted for approximately 14 percent of all electricity generated in Louisiana, a 44 percent decrease from 2000 levels (EIA 2017d). Although coal has historically been the largest source of electricity in the United States, the U.S. Energy Information Administration expects natural gas generation—and potentially even renewable energy generation—to surpass coal generation by 2040 (EIA 2017d). Nonetheless, coal provides the third-greatest share of electrical power in Louisiana, and coal-fired plants represent a feasible, commercially available option for providing electrical generating capacity beyond

2-10
RBS’s current license expiration. Therefore, the NRC staff considered supercritical coal-fired generation equipped with carbon capture and storage technology to be a reasonable alternative to RBS license renewal.
Baseload coal units have proven their reliability and can routinely sustain capacity factors as high as 85 percent. Among the technologies available, pulverized coal boilers producing supercritical steam (supercritical pulverized coal or SCPC boilers) are increasingly common for new coal-fired plants given their generally high thermal efficiencies and overall reliability. Supercritical pulverized coal facilities are more expensive than subcritical coal-fired plants to construct, but they consume less fuel per unit output, reducing environmental impacts. In a supercritical coal-fired power plant, burning coal heats pressurized water. As the supercritical steam and water mixture moves through plant pipes to a turbine generator, the pressure drops and the mixture flashes to steam. The heated steam expands across the turbine stages, which then spin and turn the generator to produce electricity. After passing through the turbine, any remaining steam is condensed back to water in the plant’s condenser.
To replace the 967 MWe that RBS generates, the NRC staff considered two hypothetical supercritical pulverized coal units, each with a net capacity of approximately 510 MWe. These coal units would be located at the same general location as described in the new nuclear alternative in Section 2.2.2.1. The NRC staff also assumes the plant would be located on previously disturbed land, and that the large excavated area originally planned to support RBS Unit 2 would be backfilled and the existing chemical waste storage tanks removed. (Entergy 2017h; 2017c). Most of the coal consumed in Louisiana is subbituminous coal shipped by rail from Wyoming, with a limited amount coming by barge from Illinois, Indiana, and Kentucky (EIA 2016c). The NRC staff assumes that the Mississippi River would be used to deliver coal to the facility, and that a geological formation capable of storing carbon emissions would be available near the site (Entergy 2017h). The supercritical pulverized coal alternative’s closed-cycle cooling system would use mechanical draft cooling towers and similar amounts of water from the Mississippi River as compared to what RBS currently draws. The NRC staff assumes that the supercritical pulverized coal plant could use the existing intake and discharge structures at RBS with some modifications (Entergy 2017h).
The supercritical pulverized coal alternative would require approximately 100 ac (40 ha) of land for major permanent facilities as well as the development of dock facilities at the river to support coal deliveries. To build the supercritical pulverized coal alternative, site crews would clear the plant site of vegetation, prepare the site surface, and begin excavation. Other crews would then construct the plant and associated infrastructure. Construction materials would be delivered by truck or barge. In addition, the NRC staff estimates that the supercritical pulverized coal plant could require up to 26,000 ac (10,500 ha) of land to support coal mining and waste disposal during the plant’s operational life (Entergy 2016a, Entergy 2017h, NRC 1996).
2.2.2.3 Natural Gas Combined-Cycle Alternative
As discussed earlier, natural gas represents approximately 72 percent of the installed generation capacity and electrical power generated in Louisiana (EIA 2017d). The NRC staff considers the construction of a natural gas combined-cycle power plant to be a reasonable alternative to RBS license renewal because natural gas is a feasible, commercially available option for providing baseload electrical-generating capacity beyond the expiration of RBS’s current license.

2-11
Baseload natural gas combined-cycle power plants have proven their reliability and can have capacity factors as high as 87 percent (EIA 2015b). In a natural gas combined-cycle system, electricity is generated using a gas turbine that burns natural gas. A steam turbine uses the heat from gas turbine exhaust through a heat recovery steam generator to produce additional electricity. This two-cycle process has a high rate of efficiency because the natural gas combined-cycle system captures the exhaust heat that otherwise would be lost and reuses it. Similar to other fossil fuel sources, natural gas combined-cycle power plants are a source of greenhouse gases, including CO2. However, a natural gas combined-cycle power plant produces significantly fewer greenhouse gases per unit of electrical output than conventional coal-powered plants (NRC 2013b).
For this alternative, the NRC staff assumes that three natural gas combined-cycle units, each with a net capacity of 348 MWe, would replace RBS’s 967 MWe generating capacity. Each plant configuration would consist of two combustion turbine generators, two heat recovery steam generators, and one steam turbine generator with mechanical draft cooling towers for heat rejection. The NRC staff assumes the power plant incorporates a selective catalytic reduction system to minimize the plant’s nitrogen oxide emissions (NETL 2007). This natural gas combined-cycle plant would consume approximately 47 billion cubic feet (1,200 million cubic meters) of natural gas annually (EIA 2013c). Natural gas would be extracted from the ground through wells, treated to remove impurities, and then blended to meet pipeline gas standards before being piped through the State’s pipeline system to the RBS site. The natural gas combined-cycle alternative would produce waste, primarily in the form of spent catalysts used for control of nitrogen oxide emissions.
Similar to the new nuclear alternative (Section 2.2.2.1), the NRC staff assumes that the natural gas combined-cycle replacement power facility would be built on a portion of the approximately 3,300 ac (1,300 ha) Entergy Louisiana, LLC property, and would allow for the maximum use of the location’s existing ancillary facilities (e.g., support buildings and transmission infrastructure). Approximately 50 ac (20 ha) of previously disturbed land would be used to construct and operate the natural gas combined-cycle plant (Entergy 2016a). Depending on the specific site location and proximity of existing natural gas pipelines, the natural gas alternative may also require up to 25 ac (10 ha) of land for right-of-way to connect with existing natural gas supply lines east of the site. In addition, the plant could need up to 4,300 acres (1,700 ha) of land for wells, collection stations, and associated pipelines (Entergy 2017h).
The NRC staff assumes that the natural gas combined-cycle plant would use a closed-cycle cooling system with mechanical draft cooling towers. To support the plant’s cooling needs, this cooling system would withdraw approximately 7.2 million gallons per day (28,000 cubic meters per day (m3/day)) of water and consume 5.7 million gallons per day (21,000 m3/day) (NETL 2013). Because of the high overall thermal efficiency of this type of plant, the natural gas combined-cycle alternative would require less cooling water than RBS. Onsite visible structures could include the cooling towers, exhaust stacks, intake and discharge structures, transmission lines, natural gas pipelines, and an electrical switchyard. Construction materials could be delivered by a combination of rail spur, truck, and barge.
2.2.2.4 Combination Alternative (Natural Gas Combined Cycle, Biomass, and Demand-Side Management)
This alternative combines natural gas and biomass replacement power generation with energy efficiency measures to meet the needs and purpose of the RBS license renewal. For the purpose of this evaluation, the NRC staff assumes that this combination alternative would be

2-12
composed of approximately 700 MWe from a natural gas combined-cycle facility, 160 MWe from biomass-fired units, and 110 MWe of energy savings from energy efficiency initiatives (i.e., demand-side management) within the region of influence. The NRC staff assumes that both the natural gas combined-cycle and biomass-fired portions of this alternative would be located on previously disturbed land within Entergy Louisiana, LLC property, and would use existing available site infrastructure to the extent practicable.
Natural Gas Combined-Cycle Portion of Combination Alternative
To produce its required share of power as part of the combination alternative, the natural gas plant, operating at an expected capacity factor of 87 percent (EIA 2015b), would need to have a collective nameplate rating of approximately 800 MWe.
The NRC staff assumes that a new natural gas combined-cycle plant as described in Section 2.2.2.3 would be constructed and operated with a total net capacity of 700 MWe. The appearance of the natural gas plant under the combination alternative would be similar to the appearance of the plant for full natural gas combined-cycle alternative. However, in the combination alternative, only two natural gas combined-cycle units would be built instead of three units.
Approximately 35 ac (14 ha) of land would be required to construct and operate the two natural gas combined-cycle units (Entergy 2017h). Depending on the specific site location and proximity of existing natural gas pipelines, the two natural gas units may also require up to 25 ac (10 ha) of land for right-of-way to connect with existing natural gas supply lines east of the site. In addition, the plant could need up to 4,300 acres (1,700 ha) of land for wells, collection stations, and associated pipelines (Entergy 2017h).
The NRC staff assumes that the natural gas combined-cycle plant would use a closed-cycle cooling system with mechanical draft cooling towers. To support the plant’s cooling needs, this system would withdraw approximately 4.9 million gallons per day (18,000 m3/day) of water and consume 3.8 million gallons per day (14,000 m3/day) of water (NETL 2013).
Biomass Portion of Combination Alternative
The 160-MWe biomass-fired portion of the combination alternative would be generated using four 40-MWe units. Assuming a capacity factor of 83 percent (EIA 2015b), these biomass facilities would need a collective nameplate rating of approximately 192 MWe.
Biomass fuels are abundant in Louisiana. From 2005 to 2015, Louisiana and other southern states with ample forest resources led U.S. growth in biomass electricity generation (EIA 2016e). Electricity generated using biomass fuels, particularly wood and wood wastes, accounts for more than two-thirds of the State’s renewable energy production (EIA 2017c). Other resources used for biomass-fired generation could include agricultural residues, animal manure, residues from food and paper industries, municipal green wastes, dedicated energy crops, and methane from landfills (IEA 2007). With a 2015 installed capacity of nearly 500 MWe, biomass-fired facilities are the primary renewable energy source in operation in Louisiana (EIA 2017d).
Collectively, the four biomass units would require a total of approximately 60 ac (24 ha) of land for construction and operation (Entergy 2017h, NRC 2014b). Fuel feedstock for the biomass units would include energy crops, forest and crop residue, wood waste, and municipal solid

2-13
waste. It is assumed that land use impacts associated with the production of this feedstock would be the same regardless of whether or not the feedstock is used for electricity generation. However, additional land could be required for storing, loading, and transporting fuel feedstock.
The NRC staff assumes that the biomass units would use a closed-cycle cooling system with mechanical draft cooling towers. Total cooling needs of the four proposed units would withdraw approximately 4.0 million gallons per day (15,000 m3/day) of water and consume 2.0 million gallons per day (7,500 m3/day) of water (NREL 2011).
Demand-Side Management Portion of Combination Alternative
Demand-side management includes programs designed to improve the energy efficiency of facilities and equipment, reduce energy demand through behavioral changes (energy conservation), and demand response initiatives aimed to lessen customer usage or change energy use patterns during peak periods. These programs and initiatives do not require the construction and operation of new electrical generating capacity. Although Louisiana does not have a mandatory energy efficiency resource standard, demand-side management programs represent a fundamental component of Entergy’s, “2015 Integrated Resource Plan” (Entergy 2015a, CNEE 2017).
Under the combination alternative, demand-side management programs deployed across the Entergy Louisiana, LLC service area would replace approximately 110 MWe of the electrical generating capacity that RBS currently provides.
A 2015 study of existing and potentially deployable demand-side management programs across Entergy’s residential, commercial, and industrial sectors projected that demand-side management programs could compensate for 457 MWe of electrical demand by 2025, and as much as 673 MWe by 2034 (Entergy 2015a, ICF 2015, Entergy 2017h). Therefore, the NRC staff determined that replacement of 110 MW of RBS output through demand-side management programs to be a reasonable assumption supporting the combination alternative.
2.3 Alternatives Considered but Eliminated
The NRC staff considered, but then ultimately eliminated for detailed study, a number of alternatives to the RBS license renewal. The staff eliminated these alternatives because of technical reasons, resource availability, or current commercial or regulatory limitations. Many of these limitations will likely still exist when the current RBS license expires in 2025.
2.3.1 Solar Power
Solar power, including solar photovoltaic (PV) and concentrating solar power (CSP) technologies, produce power generated from sunlight. Solar photovoltaic components convert sunlight directly into electricity using solar cells made from silicon or cadmium telluride. Concentrating solar power uses heat from the sun to boil water and produce steam that drives a turbine connected to a generator to ultimately produce electricity (NREL 2014). To be considered a viable alternative, a solar alternative must replace the amount of electricity that RBS provides. Assuming capacity factors of 25 to 50 percent (DOE 2011), approximately 2,380 to 4,750 MWe of additional solar energy capacity would need to be installed in the region of influence.

2-14
Solar generators are considered an intermittent resource because their availability depends on ambient exposure to the sun, also known as solar insolation (EIA 2017e). Insolation rates of solar photovoltaic resources in Louisiana range from 4.5 to 5.5 kilowatt hours per square meter per day (kWh/m2/day) (NREL 2017). Due to higher solar insolation requirements associated with concentrating solar power, utility-scale application of this technology has only occurred in western States with high solar thermal resources (i.e., California, Arizona, and Nevada) (EIA 2016d).
Nationwide, rapid growth in large solar photovoltaic facilities (greater than 5 MW) has resulted in an increase from 70 MW in 2009 to over 9,000 MW fully online at the end of 2015 (Mendelsohn et al. 2012, Bolinger and Seel 2016). However, Louisiana is one of only a few States having no utility-scale solar generating capacity (EIA 2017e). In 2015, the State’s small amount of solar generation was limited to small-scale solar photovoltaic units distributed at customer sites. Further, Louisiana does not have a mandatory renewable portfolio standard that would require generators to consider solar power, nor does the state offer tax incentives that would encourage commercial or residential rooftop solar development (EIA 2016b, DSIRE 2016). Considering the above factors, the NRC staff concludes that solar power energy facilities would not be a reasonable alternative to RBS license renewal.
2.3.2 Wind Power
As is the case with other renewable energy sources, the feasibility of wind power serving as alternative baseload power is dependent on the location (relative to expected load centers), value, accessibility, and constancy of the resource. Wind energy must be converted to electricity at or near the point where it is extracted, and currently there are limited energy storage opportunities available to overcome the intermittency and variability of wind resources.
To be considered a reasonable alternative to RBS license renewal, the wind power alternative must replace the amount of electricity that RBS provides. Assuming a capacity factor of 35 percent for land-based wind and 40 percent for offshore wind, a range of 2,970 to 3,395 MWe of electricity would have to be generated by some combination of land-based and offshore wind energy facilities in the region of influence.
The American Wind Energy Association reports a total of more than 84,000 MW of installed wind energy capacity nationwide as of March 31, 2017 (DOE 2017). Texas leads all other States in installed land-based capacity with over 21,000 MW. In contrast, Louisiana, which shares its western border with Texas, currently has no installed land-based wind power capacity. The U.S. Energy Information Administration indicates that Louisiana has little overall wind potential, and that in 2013, the State legislature repealed State tax credits for the development of future wind systems (EIA 2017c).
Similarly, Louisiana does not have any utility-scale offshore wind farms in operation. In 2016, a 30 MW project off the coast of Rhode Island became the first operating offshore wind farm in the United States (Energy Daily 2016). Although approximately 20 offshore wind projects representing more than15,000 MW of capacity were in the planning and permitting process as of 2015, most of these projects are concentrated along the Nation’s North Atlantic coast, and none are currently planned off the shores of Louisiana (EIA 2015c, NREL 2015).
Given the amount of wind capacity necessary to replace RBS, the intermittency of the resource, the current lack of any installed wind capacity in the State, and the limited potential for any new
2-15
development in the region of influence, the NRC staff finds a wind based alternative—eitheronshore, offshore, or some combination of both—to be an unreasonable alternative to RBS license renewal.
2.3.3 Biomass Power
As described in Section 2.2.2.4, biomass fuels are abundant in Louisiana. Using biomass-fired generation for baseload power depends on the geographic distribution, available quantities, constancy of supply, and energy content of biomass resources. For this analysis, the NRC staff assumed that biomass would be combusted for power generation in the electricity sector. Biomass is also used for space heating in residential and commercial buildings and can be converted to a liquid form for use in transportation fuels.
In 2015, Louisiana had an installed capacity of approximately 500 MW, and approximately 2 percent of the State’s total system power was produced from biomass (EIA 2016b, EIA 2017d).
For utility-scale biomass electricity generation, the NRC staff assumes that the technologies used for biomass conversion would be similar to fossil fuel plants, including the direct combustion of biomass in a boiler to produce steam (NRC 2013b). Biomass generation is generally more cost effective when co-fired with coal plants (IEA 2007). Biomass-fired generation plants generally are small and can reach capacities of 50 MWe, which means that 20 new facilities would be required to replace the generating capacity of RBS. Sufficiently increasing biomass-fired generation capacity by expanding existing biomass units or constructing new biomass units by the time RBS’s license expires in 2025, is unlikely. For this reason, the NRC staff does not consider using biomass-fired generation alone to be a reasonable alternative to RBS license renewal. However, the NRC staff does consider an alternative using biomass-fired power in combination with natural gas combined-cycle and demand-side management measures, as described above in Section 2.2.2.4.
2.3.4 Demand-Side Management
Energy conservation can include reducing energy demand through behavioral changes or altering the shape of the electricity load and usually does not require the addition of new generating capacity. Conservation and energy efficiency programs are more broadly referred to as demand-side management.
Conservation and energy efficiency programs can be initiated by a utility, transmission operators, the State, or other load-serving entities. In general, residential electricity consumers have been responsible for the majority of peak load reductions and participation in most programs is voluntary. Therefore, the existence of a program does not guarantee that reductions in electricity demand would occur. The GEIS concludes that, although the energy conservation or energy efficiency potential in the United States is substantial, there are likely no cases where an energy efficiency or conservation program has been implemented expressly to replace or offset a large baseload generation station (NRC 2013b). A 2015 study of existing and potentially deployable demand-side management programs across Entergy’s residential, commercial, and industrial sectors projected that demand-side management programs could only compensate for 457 MWe of electrical demand by 2025 (Entergy 2015a, ICF 2015, Entergy 2017h). Therefore, although significant energy savings are possible in the region of influence through demand-side management and energy efficiency programs, such programs are not sufficient to replace RBS as a standalone alternative. However, the NRC staff concludes that, when used in conjunction with other sources of generating capacity,

2-16
demand-side management can provide a potentially viable alternative to license renewal. The NRC staff considers such a possible combination alternative as described above in Section 2.2.2.4.
2.3.5 Hydroelectric Power
Currently, approximately 2,000 hydroelectric facilities operate in the United States. Hydroelectric technology captures flowing water and directs it to a turbine and generator to produce electricity (NRC 2013b). There are three variants of hydroelectric power: (1) run-of-the-river (diversion) facilities that redirect the natural flow of a river, stream, or canal through a hydroelectric facility, (2) store-and-release facilities that block the flow of the river by using dams that cause water to accumulate in an upstream reservoir, and (3) pumped storage facilities that use electricity from other power sources to pump water to higher elevations during off-peak load periods to be released during peak load periods through the turbines to generate additional electricity.
A comprehensive survey of hydropower resources, completed in 1997, identified Louisiana as having 200 MWe of hydroelectric capacity when adjusted for environmental, legal, and institutional constraints (Conner et al., 1998). These constraints could include (1) scenic, cultural, historical, and geological values, (2) Federal and State land use, and (3) legal protection issues, such as wild and scenic legislation and threatened or endangered fish and wildlife legislative protection. A separate DOE assessment of non-powered dams (dams that do not produce electricity) concluded that there is potential for 857 MW of electricity in Louisiana (ORNL 2012). These non-powered dams serve various purposes, such as providing water supply to inland navigation. Aside from biomass power, hydroelectric is the only other significant source of renewable power generation deployed in Louisiana, producing approximately 1,000,000 MWh of electricity in 2015, or 1 percent of the State’s electric power production. Although the U.S. Energy Information Administration projects that hydropower will remain a leading source of renewable generation in the United States through 2040, there is little expected growth in hydropower capacity (EIA 2017d). The potential for future construction of large hydropower facilities has diminished because of increased public concerns over flooding, habitat alteration and loss, and destruction of natural river courses (NRC 2013b).
Given the projected lack of growth in hydroelectric power production, the competing demands for water resources, and the expected public opposition to the large environmental impacts and significant changes in land use that would result from the construction of hydroelectric facilities, the NRC staff concludes that the expansion of hydroelectric power is not a reasonable alternative to RBS.
2.3.6 Geothermal Power
Geothermal technologies extract the heat contained in geologic formations to produce steam to drive a conventional steam turbine generator. Facilities producing electricity from geothermal energy have demonstrated capacity factors of 95 percent or greater, making geothermal energy a potential source of baseload electric power. However, the feasibility of geothermal power generation to provide baseload power depends on the regional quality and accessibility of geothermal resources. Utility-scale geothermal energy generation requires geothermal reservoirs with a temperature above 200 °F (93 °C). Utility-scale power plants range from small 300 kilowatts electric to 50 MWe and greater (TEEIC undated). Known geothermal resources are concentrated in the western United States, specifically Alaska, Arizona, California, Colorado, Hawaii, Idaho, Montana, Nevada, New Mexico, Oregon, Utah, Washington, and

2-17
Wyoming. In general, most assessments of geothermal resources have been concentrated on these western states (DOE 2013b, USGS 2008). Geothermal resources are used in the region of influence for heating and cooling purposes, but no electricity is currently being produced from geothermal resources in the region of influence (EIA 2017b). Given the low resource potential in the region of influence, the NRC staff does not consider geothermal to be a reasonable alternative to license renewal.
2.3.7 Wave and Ocean Energy
Waves, currents, and tides are often predictable and reliable, making them attractive candidates for potential renewable energy generation. Four major technologies may be suitable to harness wave energy: (1) terminator devices that range from 500 kilowatts to 2 MW, (2) attenuators, (3) point absorbers, and (4) overtopping devices (BOEM undated). Point absorbers and attenuators use floating buoys to convert wave motion into mechanical energy, driving a generator to produce electricity. Overtopping devices trap a portion of a wave at a higher elevation than the sea surface; waves then enter a tube and compress air that is used to drive a generator that produces electricity (NRC 2013b). Some of these technologies are undergoing demonstration testing at commercial scales, but none are currently used to provide baseload power (BOEM undated).
The Electric Power Research Institute (EPRI) conducted a 2011 assessment that identified the Gulf Coast of Louisiana as having modest potential ocean wave energy resources (EPRI 2011). However, the infancy of the technologies and the current lack of commercial application support the conclusion that wave and ocean energy technologies are not reasonable alternatives to RBS license renewal. Accordingly, the NRC staff does not consider wave and ocean energy to be a reasonable alternative to RBS license renewal.
2.3.8 Municipal Solid Waste
Energy recovery from municipal solid waste converts non-recyclable waste materials into usable heat, electricity, or fuel through combustion (EPA 2014d). The three types of combustion technologies include mass burning, modular systems, and refuse-derived fuel systems (EPA 2014c). Mass burning is the method used most frequently in the United States. The heat released from combustion is used to convert water to steam, which is used to drive a turbine generator to produce electricity. Ash is collected and taken to a landfill, and particulates are captured through a filtering system (EPA 2014c). As of 2016, 77 waste-to-energy plants are in operation in 22 States, processing approximately 30 million tons of waste per year. These waste-to-energy plants have an aggregate capacity of 2,547 MWe. Although some plants have expanded to handle additional waste and to produce more energy, no new plants have been built in the United States since 1995 (EPA 2014d, Michaels 2016). The average waste-to-energy plant produces about 50 MWe, with some reaching 77 MWe, and can operate at capacity factors greater than 90 percent (Michaels 2010). Although Louisiana recognizes waste-to-energy facilities as a potential renewable energy resource, none of these facilities are currently planned or are in operation in the State (Michaels 2014). Approximately 20 average-sized plants would be necessary to provide the same level of output as RBS.
The decision to burn municipal waste to generate energy is usually driven by the need for an alternative to landfills rather than a need for energy. Given the improbability that additional stable supplies of municipal solid waste would be available to support 20 new facilities and given that no such plants currently operate in the Louisiana, the NRC staff does not consider municipal solid waste combustion to be a reasonable alternative to RBS license renewal.

2-18
2.3.9 Petroleum-Fired Power
Petroleum-fired electricity generation accounted for approximately 4 percent of Louisiana’s statewide total in 2015 (EIA 2017a). However, the variable costs and environmental impacts of petroleum-fired generation tend to be greater than those of natural gas-fired generation. The historically higher cost of oil has also resulted in a steady decline in its use for electricity generation, and no growth in capacity using petroleum-fired power plants is forecast through 2040 (EIA 2013a, 2015a). Therefore, the NRC does not consider petroleum-fired generation to be a reasonable alternative to RBS license renewal.
2.3.10 Coal—Integrated Gasification Combined Cycle
Integrated gasification combined cycle is a technology that generates electricity from coal. It combines modern coal gasification technology with both gas-turbine and steam-turbine power generation. The technology is cleaner than conventional pulverized coal plants because some of the major pollutants are removed from the gas stream before combustion. An integrated gasification combined-cycle power plant consists of coal gasification and combined-cycle power generation. Coal gasifiers convert coal into a gas (synthesis gas, also referred to as syngas), which fuels the combined-cycle power generating units. Nearly 100 percent of the nitrogen from the syngas would be removed before combustion in the gas turbines and would result in lower nitrogen oxide emissions as compared to conventional coal-fired power plants (DOE 2010).
Although several smaller integrated gasification combined-cycle power plants have been in operation since the mid-1990s, more recent large-scale projects using this technology have experienced a number of setbacks and opposition that have hindered the technology from fully integrating into the energy market. The most significant roadblock has been the high capital cost of an integrated gasification combined-cycle power plant as compared to conventional coal-fired power plants. Both the Duke Energy Edwardsport Generation Station project in Indiana and the Kemper County integrated gasification combined-cycle project in east-central Mississippi have experienced cost and schedule overruns. The Kemper County project suspended work towards startup of the gasifier component in June 2017 (Energy Daily 2017). Other issues associated with integrated gasification combined cycle include a limited track record for reliable performance and opposition based on environmental concerns. Based upon these developments, the NRC staff determined that this technology would not be a reasonable source of baseload power to replace RBS by the time its license expires in 2025.
2.3.11 Fuel Cells
Fuel cells oxidize fuels without combustion and therefore without the environmental side effects of combustion. Fuel cells use a fuel (e.g., hydrogen) and oxygen to create electricity through an electrochemical process. The only byproducts are heat, water, and carbon dioxide (depending on the hydrogen fuel type) (DOE 2013a). Hydrogen fuel can come from a variety of hydrocarbon resources. Natural gas is a typical hydrogen source.
Fuel cells are not economically or technologically competitive with other alternatives for electricity generation. The U.S. Energy Information Administration estimates that fuel cells may cost $7,108 per installed kilowatt (total overnight capital costs in 2012 dollars), which is high compared to other alternative technologies analyzed in this section (EIA 2013b). More importantly, fuel cell units are likely to be small in size (approximately 10 MW). The world’s largest fuel cell facility is a 59 MWe plant that came online in South Korea in 2014 (Entergy 2017h, PEI 2017). Using fuel cells to replace the power that RBS provides would be

2-19
extremely costly. It would require the construction of approximately 100 average-sized units and modifications to the existing transmission system. Given the immature status and high cost of fuel cell technology, the NRC staff does not consider fuel cells to be a reasonable alternative to RBS license renewal.
2.3.12 Purchased Power
It is possible that replacement power may be imported from outside the RBS region of influence. Although purchased power would likely have little or no measurable environmental impact in the vicinity of RBS, impacts could occur where the power is generated or anywhere along the transmission route, depending on the generation technologies used to supply the purchased power (NRC 2013b).
As discussed in its report, “2015 Integrated Resource Plan,” Entergy is a member of a regional transmission organization called MISO (Midcontinent Independent System Operator, Inc.) which manages the flow of power on a grid which stretches from Canada to the Gulf of Mexico. Entergy controls approximately 10,600 MW of generating capacity in Louisiana, either through ownership or long-term purchase power contracts (Entergy 2015a). However, Entergy projects generating capacity shortfalls of approximately 14,000 MW to occur across the MISO region by 2024. In addition, Entergy does not anticipate that excess power will be available for purchase to replace RBS’s generating capacity (Entergy 2017h).
Additionally, purchased power is generally economically adverse because the cost of generated power historically has been less than the cost of the same power provided by a third party (NRC 2013b). Power purchase agreements also carry the inherent risk that the contracted power will not be delivered.
Based on these considerations, the NRC staff determined that purchased power would not be a reasonable alternative to RBS license renewal.
2.3.13 Delayed Retirement
The retirement of a power plant ends its ability to supply electricity. Delaying the retirement of a power plant enables it to continue supplying electricity. A delayed retirement alternative would consider deferring the retirement of generating facilities within or near the region of influence.
Because generators are required to adhere to additional regulations that will require significant reductions in plant emissions, some power plants may similarly opt for early retirement of older units rather than incur the cost for compliance. Additional retirements may be driven by low natural gas prices, slow growth in electricity demand, and requirements of the Mercury and Air Toxics Standards (EIA 2015a, EPA 2015).
Entergy’s, “2015 Integrated Resource Plan,” describes the company’s fleet of power plants as aging and increasingly susceptible to accelerated deactivation for economic reasons. Accordingly, Entergy assumes that it will retire nearly 6,000 MWe of its older, gas-fired generating units within the region of influence by the end of the current planning horizon in 2034. Over this same period, Entergy is projecting it will need to add at least another 8,000 MWe of generating capacity across its service area (Entergy 2017h, 2015a). Therefore, even if Entergy could delay some of these retirements through maintenance and refurbishments, it would still be necessary to add additional generating capacity just to meet projected load growth over this period, and any system capacity retained through delayed

2-20
retirements would likely not be available to replace RBS’s baseload generation. Because of these conditions, the NRC staff determined that delayed retirement would not be a reasonable alternative to RBS license renewal.
2.4 Comparison of Alternatives
In this chapter, the NRC staff considered in depth one alternative to RBS license renewal that does not replace the plant’s energy generation (the no-action alternative) and four alternatives to license renewal that may reasonably replace RBS’s energy generation. These four power generation alternatives are (1) new nuclear generation, (2) supercritical pulverized coal generation, (3) natural gas combined-cycle generation, and (4) a combination of natural gas combined-cycle generation, biomass generation, and demand-side management. Table 2-2 summarizes the environmental impacts of these five alternatives to RBS license renewal. Chapter 4 discusses in greater detail the environmental impacts of each alternative.
The environmental impacts of the proposed action (issuing a renewed RBS operating license) would be SMALL for all impact categories except for groundwater resources. Due to radionuclides released to groundwater, the environmental impact of RBS license renewal to groundwater resources would be SMALL to MODERATE.
Based on the review presented in this SEIS, the NRC staff concludes that the environmentally preferred alternative is the proposed action, recommending that the RBS operating license be renewed. All other power generation alternatives have impacts in at least two resource areas that are greater than license renewal, in addition to the environmental impacts inherent in new construction projects. To make up the lost power generation if the NRC does not issue a renewed license for RBS (i.e., the NRC takes the no-action alternative), energy decisionmakers would likely implement one of the four power replacement alternatives discussed in this chapter.

2-21
Tabl
e 2-
2. S
umm
ary
of E
nviro
nmen
tal I
mpa
cts
of th
e Pr
opos
ed A
ctio
n an
d Al
tern
ativ
es
Impa
ct A
rea
(Res
ourc
e)
RB
S Li
cens
e R
enew
al
(Pro
pose
d A
ctio
n)
No-
Act
ion
Alte
rnat
ive
New
N
ucle
ar
Alte
rnat
ive
Supe
rcrit
ical
Pu
lver
ized
C
oal
Alte
rnat
ive
Nat
ural
Gas
C
ombi
ned-
Cyc
le
Alte
rnat
ive
Com
bina
tion
Alte
rnat
ive
(Nat
ural
Gas
, B
iom
ass,
and
D
eman
d-Si
de
Man
agem
ent)
Land
Use
SM
ALL
SMAL
L SM
ALL
SMAL
L to
M
OD
ERAT
E SM
ALL
SMAL
L
Visu
al R
esou
rces
SM
ALL
SMAL
L SM
ALL
SMAL
L SM
ALL
SMAL
L Ai
r Qua
lity
SMAL
L SM
ALL
SMAL
L M
OD
ERAT
E SM
ALL
to
MO
DER
ATE
MO
DER
ATE
Noi
se
SMAL
L SM
ALL
SMAL
L SM
ALL
SMAL
L SM
ALL
Geo
logi
c En
viro
nmen
t SM
ALL
SMAL
L SM
ALL
SMAL
L SM
ALL
SMAL
L Su
rface
Wat
er R
esou
rces
SM
ALL
SMAL
L SM
ALL
SMAL
L to
M
OD
ERAT
E SM
ALL
SMAL
L
Gro
undw
ater
Res
ourc
es
SMAL
L to
M
OD
ERAT
E SM
ALL
SMAL
L SM
ALL
to
MO
DER
ATE
SMAL
L SM
AL L
Terr
estri
al R
esou
rces
SM
ALL
SMAL
L SM
ALL
SMAL
L to
M
OD
ERAT
E SM
ALL
to
MO
DER
ATE
SMAL
L to
M
OD
ERAT
E Aq
uatic
Res
ourc
es
SMAL
L SM
ALL
SMAL
L SM
ALL
SMAL
L SM
ALL
Spec
ial S
tatu
s S
peci
es
and
Hab
itats
SE
E N
OTE
(a)
SEE
NO
TE(b
) SE
E N
OTE
(b)
SEE
NO
TE(b
) SE
E N
OTE
(b)
SEE
NO
TE(b
)
His
toric
and
Cul
tura
l R
esou
rces
SE
E N
OTE
(c)
SEE
NO
TE(d
) SE
E N
OTE
(e)
SEE
NO
TE(e
) SE
E N
OTE
(e)
SEE
NO
TE(e
)
Soci
oeco
nom
ics
SMAL
L SM
ALL
to
MO
DER
ATE
SMAL
L to
LA
RG
E
SMAL
L to
LA
RG
E
SMAL
L to
LA
RG
E
SMAL
L to
M
OD
ERAT
E Tr
ansp
orta
tion
SMAL
L SM
ALL
SMAL
L to
LA
RG
E
SMAL
L to
LA
RG
E
SMAL
L to
LA
RG
E
SMAL
L to
M
OD
ERAT
E H
uman
Hea
lth
SMAL
L(f)
SMAL
L(f)
SMAL
L(f)
SMAL
L(f)
SMAL
L(f)
SMAL
L(f)
Envi
ronm
enta
l Jus
tice
SEE
NO
TE(g
) SE
E N
OTE
(h)
SEE
NO
TE(i)
SE
E N
OTE
(i)
SEE
NO
TE(i)
SE
E N
OTE
(i)
Was
te M
anag
emen
t and
Po
llutio
n Pr
even
tion
SMAL
L(j)
SMAL
L(j)
SMAL
L (j)
M
OD
ERAT
E SM
ALL
SMAL
L

2-22
Impa
ct A
rea
(Res
ourc
e)
RB
S Li
cens
e R
enew
al
(Pro
pose
d A
ctio
n)
No-
Act
ion
Alte
rnat
ive
New
N
ucle
ar
Alte
rnat
ive
Supe
rcrit
ical
Pu
lver
ized
C
oal
Alte
rnat
ive
Nat
ural
Gas
C
ombi
ned-
Cyc
le
Alte
rnat
ive
Com
bina
tion
Alte
rnat
ive
(Nat
ural
Gas
, B
iom
ass,
and
D
eman
d-Si
de
Man
agem
ent)
(a)T
he N
RC
sta
ff co
nclu
des
that
the
prop
osed
RB
S li
cens
e re
new
al m
ay a
ffect
, but
is n
ot li
kely
to a
dver
sely
affe
ct, t
he p
allid
stu
rgeo
n. T
hepr
opos
ed a
ctio
n w
ould
hav
e no
effe
ct o
n es
sent
ial f
ish
habi
tat.
(b)T
he ty
pes
and
mag
nitu
des
of a
dver
se im
pact
s to
spe
cies
list
ed in
the
End
ange
red
Spe
cies
Act
of 1
973,
as
amen
ded
(16
U.S
.C. 1
531
etse
q.);
desi
gnat
ed c
ritic
al h
abita
t; an
d es
sent
ial f
ish
habi
tat w
ould
dep
end
on s
hutd
own
activ
ities
, the
pro
pose
d si
te, p
lant
des
ign,
and
ope
ratio
n,as
app
licab
le, a
nd o
n lis
ted
spec
ies
and
habi
tats
pre
sent
whe
n th
e al
tern
ativ
e is
impl
emen
ted.
The
refo
re, t
he N
RC
sta
ff ca
nnot
fore
cast
apa
rticu
lar l
evel
of i
mpa
ct fo
r thi
s al
tern
ativ
e.(c
)Bas
ed o
n (1
) the
loca
tion
of N
atio
nal R
egis
ter o
f His
toric
Pla
ces-
elig
ible
his
toric
pro
perti
es w
ithin
the
area
of p
oten
tial e
ffect
, (2)
trib
al in
put,
(3)E
nter
gy’s
cul
tura
l res
ourc
e pr
otec
tion
plan
s, (4
) the
fact
that
no
licen
se re
new
al-r
elat
ed p
hysi
cal c
hang
es o
r gro
und-
dist
urbi
ng a
ctiv
ities
wou
ld o
ccur
, (5)
Sta
te H
isto
ric P
rese
rvat
ion
Offi
ce in
put,
and
(6) c
ultu
ral r
esou
rce
asse
ssm
ent,
licen
se re
new
al w
ould
not
adv
erse
ly a
ffect
any
know
n hi
stor
ic p
rope
rties
(Titl
e 36
of t
he C
ode
of F
eder
al R
egul
atio
ns 8
00.4
(d)(
1), “
No
His
toric
Pro
perti
es A
ffect
ed”).
(d)U
ntil
the
Post
-Shu
tdow
n D
ecom
mis
sion
ing
Activ
ities
Rep
ort i
s su
bmitt
ed, t
he N
RC
sta
ff ca
nnot
det
erm
ine
whe
ther
land
dis
turb
ance
wou
ldoc
cur o
utsi
de th
e ex
istin
g op
erat
iona
l are
as a
fter t
he n
ucle
ar p
lant
is s
hut d
own.
(e)T
his
alte
rnat
ive
wou
ld n
ot a
dver
sely
affe
ct k
now
n hi
stor
ic p
rope
rties
.(f)
The
chro
nic
effe
cts
of e
lect
rom
agne
tic fi
elds
on
hum
an h
ealth
ass
ocia
ted
with
ope
ratin
g nu
clea
r pow
er a
nd o
ther
ele
ctric
ity g
ener
atin
g pl
ants
are
unce
rtain
.(g
)The
re w
ould
be
no d
ispr
opor
tiona
tely
hig
h an
d ad
vers
e im
pact
s to
min
ority
and
low
-inco
me
popu
latio
ns.
(h)A
redu
ctio
n in
tax
reve
nue
resu
lting
from
the
shut
dow
n of
RB
S c
ould
dec
reas
e th
e av
aila
bilit
y of
pub
lic s
ervi
ces
in W
est F
elic
iana
Par
ish.
Min
ority
and
low
-inco
me
popu
latio
ns d
epen
dent
on
thes
e se
rvic
es c
ould
be
disp
ropo
rtion
atel
y af
fect
ed.
(i)B
ased
on
the
anal
ysis
of h
uman
hea
lth a
nd e
nviro
nmen
tal i
mpa
cts
pres
ente
d in
this
SE
IS, t
his
alte
rnat
ive
wou
ld n
ot li
kely
hav
edi
spro
porti
onat
ely
high
and
adv
erse
hum
an h
ealth
and
env
ironm
enta
l effe
cts
on m
inor
ity a
nd lo
w-in
com
e po
pula
tions
. H
owev
er, t
his
dete
rmin
atio
n w
ould
dep
end
on th
e pl
ant d
esig
n, a
nd o
pera
tiona
l cha
ract
eris
tics
of th
e al
tern
ativ
e. T
here
fore
, the
NR
C s
taff
cann
ot d
eter
min
ew
heth
er th
is a
ltern
ativ
e w
ould
resu
lt in
dis
prop
ortio
nate
ly h
igh
and
adve
rse
hum
an h
ealth
and
env
ironm
enta
l effe
cts
on m
inor
ity a
nd lo
w-
inco
me
popu
latio
ns.
(j)N
UR
EG
–215
7, “G
ener
ic E
nviro
nmen
tal I
mpa
ct S
tate
men
t for
Con
tinue
d S
tora
ge o
f Spe
nt N
ucle
ar F
uel,”
(NR
C 2
014a
) dis
cuss
es th
een
viro
nmen
tal i
mpa
ct o
f spe
nt fu
el s
tora
ge fo
r the
tim
efra
me
beyo
nd th
e lic
ense
d lif
e fo
r rea
ctor
ope
ratio
ns.

3-1
3 AFFECTED ENVIRONMENT
To conduct an environmental review of River Bend Station, Unit 1 (RBS), the U.S. Nuclear Regulatory Commission (NRC) must first define and describe the environment that could be affected by the proposed action. For this review, the NRC staff defines the affected environment as the environment that currently exists at and around RBS. Because existing conditions are at least partially the result of past construction and operations at the plant, this chapter presents the nature and impacts of these past and ongoing actions and how they have shaped the current environment. The effects of ongoing reactor operations at RBS have become well established, as environmental conditions have adjusted to the presence of the nuclear power plant. The affected environment for each resource area is presented in Sections 3.2 to 3.13.
3.1 Description of Nuclear Power Plant Facility and Operation
The physical presence of RBS buildings and facilities, as well as the plant’s operations, are integral to creating the environment that currently exists at and around the site. This section describes RBS buildings; certain nuclear power plant operating systems; and certain plant infrastructure, operations, and maintenance.
3.1.1 External Appearance and Setting
RBS is located approximately 24 miles (mi) (39 kilometers (km)) north-northwest of Baton Rouge, LA. Baton Rouge, with approximately 228,000 persons, is the largest population center within a 50-mi radius of RBS. RBS is approximately 3 mi (5 km) south-southeast of St. Francisville, LA. St. Francisville, with approximately 1,700 persons, is the nearest town to RBS. RBS is located in the southern portion of West Feliciana Parish on the east bank of the Mississippi River. Figure 3-1 presents the 50-mi (80-km) area around RBS. The land within a 6-mi radius of the site is primarily rural. (Entergy 2017h)
RBS is situated on approximately 3,342 acres (ac) (1,353 hectares (ha)) of Entergy Louisiana, LLC-owned property. The primary buildings and structures at RBS include the primary containment structure, the shield building, the auxiliary building, the fuel building, the control building, the diesel generator building, the auxiliary control building, the radwaste building, the turbine building, the water treatment building, the condensate demineralizer regeneration building, the makeup water pump structure, the circulating water pump structure, the normal service water cooling towers, the ultimate heat sink, the instrument air/service air building, and four mechanical-draft cooling towers. These buildings and structures lie approximately 2 mi (3.2 km) from the bank of the Mississippi River at an elevation of approximately 100 feet (ft) (30 meters (m)) above mean sea level. The station’s four mechanical draft cooling towers rise 56 ft (17 m) above grade elevation, but these towers are not visible above the trees to an offsite viewer. The tallest building at the RBS site is the approximately 270-ft-high (82-m-high) reactor building. A forested areas acts as a visual buffer between the reactor building and U.S. Highway 61, which passes less than 1 mi (1.6 km) away from RBS. For that reason, the reactor building is not visible from U.S. Highway 61 (Entergy 2017h).

3-2
Source: Entergy 2017h
Figure 3-1. River Bend Station 50-mi (80-km) Radius Map

3-3
3.1.2 Nuclear Reactor Systems
RBS is a General Electric Type 6 boiling-water reactor (BWR) with a Mark III containment. The NRC issued the RBS operating license on November 20, 1985, for a reactor core power level of 3,039 megawatts thermal (MWt). In January 2003, the NRC amended the RBS operating license to increase the reactor core power level to 3,091 MWt (Agencywide Documents Access and Management System (ADAMS) Accession No. ML030340294).
RBS fuel is low-enriched uranium dioxide (less than 5 percent by weight uranium-235) ceramic pellets. The pellets are sealed in tubes made of standard Zircaloy-2TM. RBS refueling occurs on a 2-year cycle.
3.1.3 Cooling and Auxiliary Water Systems
RBS uses a closed-cycle (cooling-tower based) heat dissipation system. During normal plant operations, this heat dissipation system withdraws makeup water from, and discharges cooling water back to, the Lower Mississippi River (LMR). RBS uses four mechanical draft cooling towers for condenser cooling.
A boiling-water reactor, like the one used at RBS, generates steam directly in the reactor vessel. The steam passes through moisture separators and steam dryers and then flows to the turbine. Such systems typically contain only two heat transfer (exchange) loops (NRC 2013b). The primary loop transports the steam from the reactor vessel directly to the turbine, which generates electricity. The secondary cooling water loop removes excess heat from the primary loop in the main condenser. From the condenser, the primary condensate is returned as feedwater to the reactor; the secondary cooling water loop removes the excess heat and then routes it to the cooling towers. The cooling towers dissipate the excess heat to the atmosphere. Water that is not lost to evaporation is either recirculated through the system or discharged as blowdown (i.e., water that is periodically rinsed from the cooling system to remove impurities and sediment that may degrade plant performance) to a receiving water body. Water that is lost to evaporation or that is discharged as blowdown must be replaced with fresh water; this fresh replacement water is called makeup water (NRC 2013b). Figure 3-2 provides a basic schematic diagram of a closed-cycle cooling system with mechanical draft cooling towers.
RBS uses both public water and onsite groundwater sources. West Feliciana Parish Consolidated Water District No. 13 supplies water for drinking and other uses at RBS, as further discussed below. For a more detailed discussion on RBS groundwater use, see Section 3.5.2.2 of this SEIS.
Unless otherwise cited for clarity, the NRC drew information about RBS’s cooling and auxiliary water systems from Entergy’s environmental report (Entergy 2017h) and from the RBS updated final safety analysis report (UFSAR) (Entergy 2015d). The NRC staff visited RBS in October 2017 to conduct an environmental site audit (NRC 2017g). Individual plant systems that interact with the environment are discussed further below.

3-4
Source: Modified from NRC 2013b
Figure 3-2. Closed-Cycle Cooling System with Mechanical Draft Cooling Towers
3.1.3.1 Cooling Tower Makeup Water Supply and Treatment Systems
The plant’s cooling tower makeup water system supplies water from the Lower Mississippi River to the circulating water system (CWS) and to the service water cooling system (SWCS). This makeup water is necessary to compensate for losses resulting from evaporation and drift from each system’s cooling towers (Entergy 2017h).
The cooling tower makeup water system is composed of three subsystems: (1) two river intake screens and suction pipelines, (2) the makeup water pump house, and (3) piping from the pump house to the clarifiers at the plant site. The pump house contains two makeup water pumps, each with a capacity of 16,000 gallons per minute (gpm) (35.6 cubic feet per second (cfs) or about 1.0 cubic meters per second (m3/s)).
Water is withdrawn from the Lower Mississippi River through two 36-in. (91-cm) diameter suction pipelines and associated intake screens. These submerged intakes are located in a man-made recession (embayment) on the east bank of the Lower Mississippi River near Mississippi River Mile (RM) 262 (River Kilometer (RKm) 421.6). The river bank in the embayment area is also protected against erosion by riprap stone armoring. Figure 3-3 shows that the two pipelines are about 400 ft (112 m) in length and carry makeup water from the river intakes to the makeup water pump house. The pipelines are mounted on steel beams atop steel pilings driven into the stiff clay layer of the river bottom. A covering of riprap and gravel helps to protect the pipelines from erosion on the upslope portion of the river. The neck-shaped configuration of the river bank upstream of the man-made embayment serves to minimize sediment deposition and debris in the vicinity of the intakes.
The octagon-shaped river intake screens are 11 ft (3.4 m) wide diagonally and 4 ft (1.2 m) high. The openings of the wedge-wire-type screens measure 0.75 by 1.5 in. (1.9 by 3.8 cm) resulting in an average intake flow velocity of less than 0.5 feet per second (fps) (0.15 m/s) (Entergy 2016d, 2017h).

3-5
Source: Modified from Entergy 2017h
Figure 3-3. River Bend Station Cooling Water Intake and River Discharge Facilities
Each screen is also equipped with a hinged panel that operates on differential pressure. This ensures that debris fouling has no immediate effect on operations as water can flow to the

3-6
makeup water pumps at all times. Additionally, the screens can be backwashed by operating the second makeup water pump and directing a portion of the combined flow through the desired intake screen. Backwashing of the screens is normally performed once each day for 30 minutes, but backwashing frequency can vary based on operational needs (Entergy 2015d).
Water withdrawn from the river travels through the intake pipelines to the makeup water pump house where the pipelines converge into a common header into two 24-in. (9.4-cm) diameter pipelines. Each of these smaller pipelines is connected to a makeup water pump.
One makeup water pump is operated under normal conditions with the other in reserve, with each pump capable of supplying RBS’s total cooling tower makeup water requirement of 15,300 gpm (34.1 cfs; 0.96 m3/s), or about 22 million gallons per day (mgd) (83,300 m3/day). In turn, the makeup water pumps discharge through one 36-in. (91-cm) diameter pipeline that runs for approximately 2.6 mi (4.2 km) to the RBS facility complex to a splitter box that supplies each of the two makeup water clarifiers. There, the clarifiers remove suspended solids from the river water. Each 100-percent capacity clarifier can treat the entire makeup demand for the plant cooling towers in the event that one clarifier is out of service. A clarifying agent (polyelectrolyte) is added to the raw water to enhance the removal of suspended sediment.
The polyelectrolyte is stored in a 5,000 gal (19 m3) storage tank and fed by three metering pumps. An additional 5,000 gal (19 m3) storage tank and metering system is used to feed sodium hypochlorite to control biofouling. The clarified and treated makeup water is discharged over a weir into the circulating water flume that serves the circulating water system, as further discussed in Section 3.1.3.2.
Blowdown (bottom sludge) from the clarifiers enters a dilution-mixing tank near the clarifiers. In the tank, the blowdown sludge is mixed with raw water. This diluted wastewater is then pumped through the clarifier sludge blowdown pipeline (Figure 3-3), which is a Louisiana Pollutant Discharge Elimination System (LPDES) permitted outfall (Outfall 006). Section 3.5.1.3 further discusses the RBS Louisiana Pollutant Discharge Elimination System permit.
3.1.3.2 Circulating Water System
The circulating water system provides water to the main condenser to quench the steam discharged from the main turbine. Cooling occurs as heat is rejected from the circulating water to the atmosphere through the plant’s circulation water cooling towers (shown in Figure 3-5). Collectively, the circulating water system is comprised of the plant’s main condenser, four mechanical draft cooling towers, a circulating water pump structure and flume, and four 25-percent capacity circulating (wet-pit type) water pumps and associated piping. Circulatingwater is pumped from the circulating water pump structure through the main condenser shellsand then back to the top of the cooling towers. Cooled water exits the towers into the openflume that bisects the two sets of cooling towers and flows back to the circulating water pumpstructure. The flume is about 600 ft (183 m) in length and expands gradually in width from22 ft (6.7 m) at the cooling tower end of the flume to 36 ft (11 m) at the circulating water pumpstructure; it has a maximum depth of 21 ft (6.4 m) (Entergy 2015d, 2017h).
The circulating water system has a design flow rate of 565,000 gpm (1,260 cfs; 35.6 m3/s) of circulating water. At 100-percent rated power, the temperature rise in the circulating water passing through the main condenser is 27°F (15°C) and the maximum temperature of the return water from the cooling towners is 96°F (35.6°C).

3-7
Circulating water is chemically treated to minimize scaling, corrosion, and biological fouling. A sodium hypochlorite and sodium bromide solution is periodically injected into the circulating water flume to inhibit biological growth in the circulating water system. Alternatively, biofouling treatment occurs by injecting treatment granules into the flume water using the Towerbrom® subsystem. Entergy uses sulfuric acid injection to manage the pH of the circulating water so that scaling and corrosion in the system are minimized. Along with the sulfuric acid injection, Entergy also uses a corrosion inhibitor and a dispersant to maintain proper water quality. The Louisiana Department of Environmental Quality (LDEQ) approves all treatment chemicals at RBS and the State regulates these chemicals under the plant’s Louisiana Pollutant Discharge Elimination System permit (Permit No. LA0042731). (Entergy 2017h)
3.1.3.3 Normal Service Water System
Separate from the circulating water system, the normal service water system (NSWS) provides cooling water to plant auxiliary system components (such as heat exchangers, chillers, and coolers) during all modes of plant operation including systems in the turbine, radwaste, auxiliary, control, standby diesel, and reactor buildings. Section 3.1.3.4 describes how the service water cooling system cools the normal service water system.
Three 50-percent capacity pumps (rated at 31,500 gpm (70.2 cfs; 2.0 m3/s)) take suction from the service water heat exchanger common discharge header/pump suction header and discharge into the common system supply header. From that point, the header is routed to a point outside the turbine building where it branches into two supply headers, one to the turbine building and the second to the other facilities served by the normal service water system. The nominal flow rate within the system is approximately 50 gpm (189 liters per minute (L/min). Scaling, corrosion, and biological fouling are controlled in the system through the addition of various treatment chemicals to the service water (Entergy 2015d, 2017h).
3.1.3.4 Service Water Cooling System
The service water cooling system provides cooling water to remove heat from the normal service water system, described above, during normal plant operation and planned unit outages. In turn, the service water cooling system is cooled by the service water cooling tower. The service water cooling system uses three pumps with a rated capacity of 31,500 gpm (70.2 cfs; 2.0 m3/s) each. Water is pumped from the service water cooling system cooling tower pump pit. This water is then ultimately conveyed into the system’s heat exchanger supply header). The common heat exchanger outlet/cooling tower supply header is routed to the service water cooling system cooling tower. Five risers carry heated water to the top of the cooling tower where it is cooled before being recirculated. Operation of two pumps is normally sufficient to handle the heat load with the third pump maintained as a spare. Cooling tower operation results in water losses of about 0.38 mgd (1,440 m3/day). Chemical additives are periodically injected into the service water cooling system cooling tower basin to minimize scaling, corrosion, and biological fouling within the system (Entergy 2015d, 2017h).
3.1.3.5 Standby Service Water System and Ultimate Heat Sink
The normal service water system operates during normal plant operation. In emergencies, the safety-related standby service water system, in conjunction with the ultimate heat sink, functions to remove heat from critical plant components to assure safe shutdown and cooldown of the plant and maintenance of the safe shutdown condition. These components include residual

3-8
heat removal heat exchangers, standby diesel generators, containment unit coolers, main control room air conditioning chillers, auxiliary building unit coolers, control building unit coolers, and fuel pool coolers.
Primary components of the safety-related standby service water system include two redundant piping systems, four 50-percent capacity standby pumps, and the standby cooling tower and associated water storage basin that serves as the ultimate heat sink for RBS (shown in Figure 3-5). The standby cooling tower is of the counter-flow, induced mechanical draft design. The basin holds approximately 6.6 million gallons (25,000 m3) of usable water, which is sufficient to provide makeup water for 30 days of post-shutdown operation. Biofouling of the basin is controlled by a hypochlorite feed system; other biocides and corrosion control agents may be added to the basin as needed. Makeup water for the ultimate heat sink basin is supplied by the RBS’s deep groundwater wells. These wells are described in Section 3.5.2.2 of this SEIS (Entergy 2015d, 2017h).
3.1.3.6 Other Water Systems
Makeup Water Treatment System
Certain in-plant uses and systems at RBS require demineralized (pure) makeup water including the power conversion system, turbine, reactor plant component cooling systems, the reactor suppression and spent fuel pools, and other miscellaneous uses. Demineralized water is produced from raw well water in two treatment trains each comprised of a cation exchange unit, one vacuum deaerator, two demineralizer forwarding pumps (one for standby operation), one anion exchange unit, and one mixed bed exchange unit. Each train can produce 150 gpm (570 L/min) of pure water, which is sufficient to meet plant needs.
The plant’s two deep wells (i.e., P-1A and P-1B) provide source water for the treatment units. Well water is stored in a 100,000-gal (380-m3) tank. Transfer pumps convey the raw water from the storage tank to the treatment units. Demineralized water is conveyed to two 350,000-gal (1,320-m3) demineralized water storage tanks, located adjacent to the RBS Unit 1 turbine building. From there, demineralized water is fed to supply in-plant uses. (Entergy 2015d, 2017h)
Potable Water System
Potable water is supplied to the RBS site by the West Feliciana Parish Consolidated Water District No. 13, which uses groundwater as its source. Onsite, potable water is furnished to various areas and buildings for use in bathroom facilities, decontamination showers, emergency showers, and plant yard fire hydrants (Entergy 2017h).
Fire Protection Water System
Fire protection water is stored in two storage tanks, each with a working capacity of 265,000 gal (1,000 m3). These tanks are filled automatically by the plant’s shallow well (P-05) at a rate of 800 gpm (3,030 L/min) when water level in the tanks falls 2 ft (0.6 m) below the overflow level. The plant’s two deep wells can also fill the tanks (Section 3.5.2.2). (Entergy 2015d, 2017h)
3.1.4 Radioactive Waste Management Systems
As a result of normal operations, equipment repairs and replacements, and normal maintenance activities, nuclear power plants routinely generate both radioactive and nonradioactive wastes.

3-9
Nonradioactive wastes include hazardous and nonhazardous wastes. There is also a class of waste, called mixed waste, which is both radioactive and hazardous. This section describes the systems that RBS uses to manage (i.e., treat, store, and dispose of) these wastes. This section also discusses other waste minimization and pollution prevention measures commonly employed at nuclear power plants.
All nuclear plants were licensed with the expectation that they would release radioactive material to both the air and water during normal operation. However, NRC regulations require that gaseous and liquid radioactive releases from nuclear power plants must meet radiation dose-based limits specified in Title 10 of Code of Federal Regulations (10 CFR) Part 20, “Standards for Protection Against Radiation,” and the as low as is reasonably achievable (ALARA) criteria in 10 CFR Part 50, Appendix I, “Numerical Guides for Design Objectives and Limiting Conditions for Operation to Meet the Criterion ‘As Low as is Reasonably Achievable’ for Radioactive Material in Light-Water-Cooled Nuclear Power Reactor Effluents.” In other words, the NRC places regulatory limits on the radiation dose that members of the public can receive from a nuclear power plant’s radioactive effluents. For this reason, all nuclear power plants use radioactive waste management systems to control and monitor radioactive wastes.
RBS uses liquid, gaseous, and solid waste processing systems to collect and process, as needed, radioactive materials produced as a byproduct of plant operations. The liquid and gaseous radioactive effluents are processed to reduce the levels of radioactive material prior to discharge into the environment. This is done to assure that the dose to members of the public from radioactive effluents is reduced to levels that are ALARA in accordance with NRC’s regulations. The radioactive material removed from the effluents is converted into a solid form for eventual disposal at a licensed radioactive disposal facility.
Entergy has a radiological environmental monitoring program (REMP) to assess the radiological impact, if any, to the public and the environment from radioactive effluents released during operations at RBS. The REMP is discussed in Section 3.1.4.5 below.
RBS has an Offsite Dose Calculation Manual (ODCM) that contains the methods and parameters used to calculate offsite doses resulting from liquid and gaseous radioactive effluents. These methods are used to assure that radioactive material discharges from the plant meet NRC and U.S. Environmental Protection Agency regulatory dose standards. The ODCM also contains the requirements for the REMP (Entergy 2005).
3.1.4.1 Radioactive Liquid Waste Management
Radioactive liquid wastes at RBS are processed through two subsystems: (1) the major one being the waste and floor drain collector and (2) the minor one being the phase separator/backwash subsystem. Both subsystems contain pumps and tanks for collection and storage of liquid radwaste. However, the major subsystem (the waste and floor drain collector subsystem) also uses filtration and chemical treatment units. The NRC requires any liquids discharged from RBS to meet the regulatory requirements found in 10 CFR Part 20 and Appendix I to 10 CFR Part 50. RBS monitors radioactive liquid discharge from both systems to assure that activity concentrations do not exceed those regulatory limits.
Radioactive liquid wastes entering the waste and floor drain collector subsystem include influents from the reactor coolant; condensate and feedwater systems; decontamination and chemistry drains; ultrasonic resin cleaners; the radwaste, reactor, auxiliary, fuel, and turbine building and shop floor drain sumps; and the decant from the phase separator tanks.

3-10
Radioactivity is removed from the influents by both filtration and ion exchange. Treated liquid radwaste is then transferred to the recovery sample tanks, where, depending on activity, it is sent for further reprocessing through the treatment system, storage in the condensate storage tanks, or discharge through the cooling tower blowdown line. (Entergy 2017h)
The phase separator/backwash tank subsystem collects, decants, and sends filter sludges, slurries, and spent resins to the radioactive solid waste management system. The system has two phase separator tanks, and normal operations consist of one tank being in service to allow settling of the waste before being decanted and sent to the waste and floor drain collector subsystem. The solids that settle to the bottom of the tank are directly transferred to the radioactive solid waste management system for processing. The backwash tank collects backwash from various resin filtration mechanisms at the plant. The filter backwash can be diverted to the phase separator tanks or is allowed to settle in the backwash tank. Liquid decanted from the backwash tank is sent to the waste and floor drain collector subsystem, and any solids that settle to the bottom are sent directly to the radioactive solid waste system for processing. (Entergy 2017h)
The use of these radioactive waste systems and the procedural requirements in the ODCM assure that the dose from radioactive liquid effluents complies with NRC and EPA regulatory dose standards.
Entergy calculates dose estimates for members of the public using radioactive liquid effluent release data and aquatic transport models. Entergy’s annual radiological effluent release report contains a detailed presentation of the radioactive liquid effluents released from RBS and the resultant calculated doses. The NRC staff reviewed 5 years of radioactive effluent release data from 2012 through 2016 (Entergy 2013b, 2014a, 2015b, 2016g, 2017e). A 5-year period provides a dataset that covers a broad range of activities that occur at a nuclear power plant, such as refueling outages, routine operation, and maintenance that can affect the generation of radioactive effluents. The NRC staff compared the data against NRC dose limits and looked for indications of adverse trends (i.e., increasing dose levels) over the period of 2012 through 2016. The following summarizes the calculated doses from radioactive liquid effluents released from RBS during 2016:
• The total-body dose to an offsite member of the public from RBS radioactive liquideffluents was 1.60×10⁻⁴ millirem (mrem) (1.60×10⁻⁶ millisievert (mSv)), which is wellbelow the 3 mrem (0.03 mSv) dose criterion in Appendix I to 10 CFR Part 50.
• The organ dose (gastrointestinal tract) to an offsite member of the public from RBSradioactive liquid effluents was 6.32×10⁻⁴ mrem (6.32×10⁻⁶ mSv), which is well belowthe 10 mrem (0.1 mSv) dose criterion in Appendix I to 10 CFR Part 50.
The NRC staff’s review of RBS’s radioactive liquid effluent control program showed that radiation doses to members of the public were controlled within NRC’s and EPA’s radiation protection standards contained in Appendix I to 10 CFR Part 50, 10 CFR Part 20, and Title 40, “Protection of Environment,” of the Code of Federal Regulations (40 CFR) Part 190, “Environmental Radiation Protection Standards for Nuclear Power Operations.” The NRC staff observed no adverse trends in the dose levels.
Routine plant refueling and maintenance activities currently performed will continue during the license renewal term. Based on Entergy’s past performance in operating a radioactive waste system that maintains ALARA doses from radioactive liquid effluents, the NRC staff expects similar performance during the license renewal term.

3-11
3.1.4.2 Radioactive Gaseous Waste Management
Radioactive wastes generated at RBS are collected and processed through the gaseous waste management system. The gaseous waste management system has two trains (A and B) which consist of a preheater and its associated recombiner, an off-gas condenser and water separator, a cooler condenser and its associated moisture separator, a pre-filter, a desiccant dryer, adsorber beds, and an after filter. During normal operations, only one train is in service.
Off-gasses containing radiation traveling through the train undergo total volume reduction, are held up at various points to allow short-lived radionuclides to decay, are sent through a high-efficiency particulate absorption (HEPA) filter for some radionuclide removal, and passed through the adsorption beds where radionuclides such as iodine, xenon, krypton, and their associated daughter products are captured and allowed to decay. Once past the adsorber beds, the off-gasses are monitored and sampled for any remaining radioactivity, sent through a set of HEPA post-filters, and finally exhausted to the atmosphere through the plant exhaust. (Entergy 2017h).
The use of this gaseous radioactive waste system and the procedural requirements in the ODCM assure that the dose from radioactive gaseous effluents complies with NRC and EPA regulatory dose standards.
Entergy calculates dose estimates for members of the public based on radioactive gaseous effluent release data and atmospheric transport models. Entergy’s annual radioactive effluent release report contains a detailed presentation of the radioactive gaseous effluents released from RBS and the resultant calculated doses. The NRC staff reviewed 5 years of radioactive effluent release data from 2012 through 2016 (Entergy 2013b, 2014a, 2015b, 2016g, 2017e). A 5-year period provides a dataset that covers a broad range of activities that occur at a nuclearpower plant such as refueling outages, non-refueling outage years, routine operation, andmaintenance activities that can affect the generation of radioactive effluents. The NRC staffcompared the data against NRC dose limits and looked for indications of adverse trends(i.e., increasing dose levels) over the period of 2012 through 2016. The following summarizesthe calculated doses from radioactive gaseous effluents released from RBS during 2016:
• The air dose at the site boundary from gamma radiation in gaseous effluents fromRBS was 2.66×10⁻¹ millirad (mrad) (2.66×10⁻³ milligray (mGy), which is well belowthe 10 mrad (0.1 mGy) dose criterion in Appendix I to 10 CFR Part 50.
• The air dose at the site boundary from beta radiation in gaseous effluents from RBSwas 2.17×10⁻¹ mrad (2.17×10⁻³ mGy), which is well below the 20 mrad (0.2 mGy)dose criterion in Appendix I to 10 CFR Part 50.
• The dose to an organ (child bone) from radioactive iodine, radioactive particulates,and carbon 14 from RBS was 4.70 mrem (4.70×10⁻² mSv), which is below the 15mrem (0.15 mSv) dose criterion in Appendix I to 10 CFR Part 50.
The NRC staff’s review of RBS’s radioactive gaseous effluent control program showed radiation doses to members of the public that were well below the NRC’s and EPA’s radiation protection standards contained in Appendix I to 10 CFR Part 50, 10 CFR Part 20, and 40 CFR Part 190. NRC staff observed no adverse trends in the dose levels.
Routine plant refueling and maintenance activities currently performed will continue during the license renewal term. Based on Entergy’s past performance operating the radioactive waste

3-12
system to maintain ALARA doses from radioactive gaseous effluents, the NRC staff expects similar performance during the license renewal term.
3.1.4.3 Radioactive Solid Waste Management
Low-level solid radioactive wastes (LLRW) are processed, packaged, and stored for subsequent shipment and offsite burial by the solid radwaste system, which is composed of a waste sludge tank, a waste sludge pump, a waste compactor, and an overhead crane. Solid radioactive wastes and potentially radioactive wastes include spent resin beads, resin fines, filter sludges, and other processing media from the liquid radwaste system.
The waste sludge tank is used to hold and transfer solids from the liquid radwaste system for dewatering, processing, and compaction. The overhead crane is used to move waste containers from the fill area to the storage area. The compactor is used to reduce the volume of any compressible dry radioactive wastes. Non-compressible wastes are manually packaged into appropriate containers. Radioactive solid wastes are stored onsite in the radwaste building, the low-level radwaste storage facility, or in approved temporary storage facilities. (Entergy 2017h)
RBS sends LLRW to four licensed processing and disposal sites: (1) EnergySolutions in Clive, UT, (2) EnergySolutions Bear Creek facility in Oak Ridge, TN, (3) Erwin ResinSolutions in Erwin, TN, and (4) Waste Control Specialists in Andrews, TX.
In 2016, a total of eight LLRW shipments were made from RBS to the above-listed processing and disposal sites. The total volume and radioactivity of LLRW shipped offsite in 2016 was 7.84×10² cubic meters (m3) (2.77×10⁴ cubic feet (ft3)) and 7.12×10³ curies (Ci) (2.63×10⁸ megabecquerels (MBq)), respectively (Entergy 2017e). Routine plant operation, refueling outages, and maintenance activities that generate radioactive solid waste will continue during the license renewal term. The NRC also expects Entergy to continue to generate radioactive solid waste and ship it offsite for disposal during the license renewal term.
3.1.4.4 Radioactive Waste Storage
At RBS, low-level radioactive waste is stored temporarily onsite before being shipped offsite for treatment or disposal at licensed LLRW treatment and disposal facilities. In its environmental report for its RBS license renewal application, Entergy stated that it also has sufficient existing capability to store LLRW onsite. Further, Entergy also stated that its long-term needs for generated LLRW storage (including during the license renewal term) do not require constructing additional onsite storage facilities. (Entergy 2017h)
RBS stores its spent fuel in a spent fuel pool and also in an onsite independent spent fuel storage installation (ISFSI). The ISFSI is used to safely store spent fuel in licensed and approved dry cask storage containers onsite. Entergy plans to expand the existing capacity of the ISFSI by adding an additional concrete pad for dry cask storage. Construction of the new ISFSI pad is scheduled for 2020 (Entergy 2017c). The installation and monitoring of this facility is governed by NRC requirements in 10 CFR Part 72, “Licensing Requirements for the Independent Storage of Spent Nuclear Fuel, High-Level Radioactive Waste, and Reactor-Related Greater Than Class C Waste.” The River Bend ISFSI will remain in place until the U.S. Department of Energy (DOE) takes possession of the spent fuel and removes it from the site for permanent disposal or processing. (Entergy 2017h)

3-13
3.1.4.5 Radiological Environmental Monitoring Program
Entergy conducts a REMP to assess the radiological impact, if any, to the public and the environment from the operations at RBS.
The REMP measures the aquatic, terrestrial, and atmospheric environment for ambient radiation and radioactivity. Monitoring is conducted for the following: direct radiation, air, water, groundwater, milk, local agricultural crops, fish, and sediment. The REMP also measures background radiation (i.e., cosmic sources, global fallout, and naturally occurring radioactive material, including radon).
In addition to the REMP, RBS has an onsite groundwater protection program designed to monitor the onsite plant environment for detection of leaks from plant systems and pipes containing radioactive liquid (Entergy 2017h). Information on the groundwater protection program is contained in Section 3.5.2 of this SEIS.
The NRC staff reviewed 5 years of annual radiological environmental monitoring data from 2012 through 2016 (Entergy 2013c, 2014b, 2015c, 2016h, 2017f). A 5-year period provides a dataset that covers a broad range of activities that occur at a nuclear power plant, such as refueling outages, routine operation, and maintenance that can affect the generation and release of radioactive effluents into the environment. The NRC staff looked for indications of adverse trends (i.e., increasing radioactivity levels) over the period of 2012 through 2016.
As discussed in Section 3.5.2, spills of water containing tritium have been detected in the groundwater on the RBS site in recent years. Entergy monitors the tritium in the groundwater and continues to define the extent and potential sources of the tritium contamination. Entergy believes that all detectable tritium contamination is the result of liquid spills within the turbine building and it has resealed the turbine building floor joints to stop any future leaks. The direction of groundwater flow will cause tritium in the groundwater to leave the site where the site boundary meets the Mississippi River. RBS obtains its potable drinking water from the West Feliciana Parish Consolidated Water District No. 13 Water Supply System, and there are no offsite, public wells located along the direction of groundwater flow. Therefore, neither RBS drinking water nor offsite groundwater should come in contact with the tritium contamination in the groundwater caused by RBS activities. As the groundwater moves towards the Mississippi River, natural attenuation processes should readily reduce the concentration of tritium within the groundwater. In addition, because of the river’s large volume, the Mississippi River will greatly dilute any tritium that reaches the river. Entergy estimates that it is unlikely tritium from these releases could be detected in the Mississippi River above minimum detection levels.
The groundwater monitoring program at RBS is robust and any future leaks that might occur during the period of license renewal should be readily detected. If leaks to the groundwater are stopped before or during the period of license renewal, either active remediation or monitored natural attenuation could continue to restore onsite groundwater quality. Also, if tritium in the groundwater should reach the Mississippi River during the period of license renewal above detectable levels, the river would rapidly dilute those concentrations below detectable levels.
The NRC staff’s review of Entergy’s data showed no indication of an adverse trend in radioactivity levels in the environment. All spills are well monitored, characterized, and actively remediated. The data showed that there were no significant impacts to the environment from operations at RBS.

3-14
3.1.5 Nonradioactive Waste Management Systems
Nuclear power plants generate some wastes that are not contaminated with radionuclides and may or may not contain hazardous chemicals.
RBS has a nonradioactive waste management program to handle its nonradioactive hazardous and nonhazardous wastes. The waste is managed in accordance with Entergy’s procedures. RBS has vendor contracts in place to transfer nonradioactive hazardous and nonhazardous wastes to licensed offsite treatment and disposal facilities. Listed below is a summary of the types of waste materials generated and managed at RBS.
• RBS is classified as a small quantity hazardous waste generator. The amounts ofhazardous wastes generated are only a small percentage of the total wastesgenerated. These wastes consist of paint wastes; spent, off-specification, andshelf-life expired chemicals; and occasional project-specific wastes. (Entergy 2017h).
• RBS’s nonhazardous wastes include plant trash and small quantities of medicalwastes generated at an onsite medical clinic. Medical wastes generated at theonsite clinic are considered a special classification of wastes and are regulatedunder the Louisiana Administrative Code (LAC) Title 51, “Public Health—SanitaryCode,” Part XXVII, “Management of Refuse, Infectious Waste, Medical Waste, andPotentially Infectious Biomedical Waste” (LAC 51:XXVII).
• Universal wastes include fluorescent lamps, batteries, antifreeze, and devicescontaining mercury and electronics. Universal wastes are managed in accordancewith Entergy procedures and LAC, Title 33, “Environmental Quality,” Part V,“Hazardous Waste and Hazardous Materials,” standards. Recycled wastes, such asscrap metals, used oils, and certain battery types are managed according to Entergyprocedures and Louisiana regulations in LAC 33 Part VII, “Solid Waste.”
Entergy operates an onsite sewage treatment plant. The onsite sewage treatment plant treats sanitary wastewater from all plant locations. Discharge of sanitary wastewater to the Mississippi River (Outfall 001) or Grant’s Bayou (Outfall 002) is done under Louisiana Pollutant Discharge Elimination System Permit LA0042731. Since sanitary wastewater is managed onsite, RBS is required to have personnel certified to do so under LAC, Title 48, “Public Health—General,” Part V.7303. (Entergy 2017h)
3.1.6 Utility and Transportation Infrastructure
The utility and transportation infrastructure at nuclear power plants typically interfaces with public infrastructure systems available in the region. Such infrastructure includes utilities, such as suppliers of electricity, fuel, and water, as well as roads and railroads that provide access to the site. The following sections briefly describe the existing utility and transportation infrastructure at RBS. Site-specific information in this section is derived from the environmental report (Entergy 2017h) unless otherwise cited.
3.1.6.1 Electricity
Nuclear power plants generate electricity for other users; however, they also use electricity to operate. Offsite power sources provide power to engineered safety features and emergency equipment in the event of a malfunction or interruption of power generation at the plant. Independent backup power sources provide power in the event that power is interrupted from both the plant itself and offsite power sources. At RBS, one 230-kilovolt (kV) transmission line

3-15
delivers the electrical output of RBS to the regional electric grid at the Fancy Point Substation, which is on the RBS site. Two 230-kV transmission lines from the same substation supply offsite power to RBS for normal operation and safe shutdown of the plant.
3.1.6.2 Fuel
Low-enriched uranium dioxide (UO2) fuel with enrichment not exceeding 5 percent by weight of uranium-235 (235U) fuels the RBS nuclear unit. RBS burns fuel at an average of rate of 47,000 megawatt-days per metric ton of uranium (MWD/MTU), and refueling occurs on a 2-year cycle. New (i.e., unirradiated) fuel arrives onsite in shipping containers. Upon arrival, RBS personnel use the fuel handling crane to move the new fuel to fuel storage racks until installation in the reactor core (Entergy 2015d). Entergy stores spent fuel in a spent fuel pool and an independent spent fuel storage installation (ISFSI). The ISFSI is designed to store 2,720 spent fuel assemblies in 40 casks, and Entergy operates the ISFSI under the conditions of a general license in accordance with 10 CFR Part 72 regulations.
In addition to nuclear fuel, RBS requires diesel fuel to operate emergency diesel generators. Entergy stores diesel fuel for the emergency diesel generators in three diesel fuel oil storage tanks, each of which has a 50,000-gal (189,000-L) capacity.
3.1.6.3 Water
In addition to cooling and auxiliary water (described in detail in Section 3.1.3), nuclear power plants require potable water for sanitary and everyday uses by personnel (e.g., drinking, showering, cleaning, laundry, toilets, and eye washes). At RBS, the West Feliciana Parish Consolidated Water District No. 13 Water Supply System supplies potable water to the site through municipal water main lines.
3.1.6.4 Transportation Systems
All nuclear power plants are served by controlled access roads. In addition to roads, many plants also have railroad connections for moving heavy equipment and other materials. Plants located on navigable waters, such as the Mississippi River, may have facilities to receive and ship loads on barges.
At RBS, the north-south highway US-61 provides primary access to the site via the North Access Road. Southwest of the RBS site, Louisiana Route 10 (LA-10) Audubon Bridge crosses the Mississippi River and links Pointe Coupee Parish with West Feliciana Parish. However, no roads within the RBS site directly connect to LA-10. Section 3.10.6 describes local transportation systems in more detail.
The Illinois Central Gulf Railroad’s branch from Slaughter to the Kraft Paper Mill north of RBS and Power Station Road is the closest rail line to the RBS site. It runs approximately 0.5 mi (0.7 km) southwest of the RBS site boundary line (Entergy 2015d). During RBS construction, a 1.2-mi (1.9-km) rail line spur was constructed to connect RBS to the rail line, but the spur has since been abandoned, and Entergy has no current plans to reestablish its use.
The Mississippi River, upon which RBS is located, is one of the major inland waterway shipping routes in the United States. The Port of Greater Baton Rouge is the most important regional

3-16
shipping port and lies approximately 32 mi (52 km) downstream of RBS. Entergy maintains a barge slip in a man-made recession on the east bank of the river near Mississippi River Mile (RM) 262.
Within 10 mi (16 km) of the RBS site, air traffic relies on six private heliports, three private airfields, and one general aviation airport (False River Regional Airport). The Baton Rouge Metropolitan Airport, a full-service commercial airport, lies 19 mi (31 km) southeast of RBS.
3.1.6.5 Power Transmission Systems
One 230-kV transmission line delivers the electrical output of RBS to the regional electric grid. This line extends from Transformer Yard 1 to the Fancy Point Substation. Two 230-kV transmission lines supply offsite power to RBS through the same substation for normal operation and safe shutdown of the plant. These lines connect to RBS through Transformer Yard 1 and 2A. For license renewal, the NRC (2013b) evaluates as part of the proposed action the continued operation of those transmission lines that connect the nuclear power plant to the substation where electricity is fed into the regional power distribution system and the transmission lines that supply power to the nuclear plant from the grid. In its environmental report, Entergy states that the lines described above are the only transmission lines that fit this description. Accordingly, all of the in-scope portions of the transmission lines lie within the RBS site boundary. Figure 3-4 illustrates the location of the lines.

3-17
Source: Entergy 2017h, Figure 2.2-4
Figure 3-4. River Bend Station In-Scope Transmission Lines
3.1.7 Nuclear Power Plant Operations and Maintenance
Maintenance activities conducted at RBS include inspection, testing, and surveillance to maintain the current licensing basis of the facility and to ensure compliance with environmental and safety requirements. Various programs and activities are currently in place at RBS to maintain, inspect, and monitor the performance of facility structures, components, and systems. These activities include in-service inspections of safety-related structures, systems, and

3-18
components, quality assurance and fire protection programs, and radioactive and nonradioactive water chemistry monitoring.
Additional programs include those implemented to meet technical specification surveillance requirements and those implemented in response to NRC generic communications. Such additional programs include various periodic maintenance, testing, and inspection procedures necessary to manage the effects of aging on structures and components. Certain program activities are performed during the operation of the units, whereas others are performed during scheduled refueling outages. Reactor refueling occurs on a 2-year cycle (Entergy 2017h).
3.2 Land Use and Visual Resources
RBS lies within a 3,342 ac (1,353 ha) Entergy-owned property in southern West Feliciana Parish, LA. The site borders the east bank of the Mississippi River and lies 3 mi (5 km) east-southeast of St. Francisville, LA, and 24 mi (39 km) north-northeast of the city of Baton Rouge, LA. This section describes land use and visual resources in the affected environment.
3.2.1 Land Use
Land uses in the affected area are described below in terms of onsite or offsite land uses. Onsite land uses are described for the RBS site, and offsite land uses are described within a 6-mi (10-km) radius of the RBS site. The Louisiana coastal zone is also briefly described, although as discussed below, the coastal zone is not affected by the proposed RBS license renewal.
3.2.1.1 Onsite Land Use
Entergy currently controls the entirety of the RBS site for power generation; however, areas of the site are also used for other purposes, including an employee sportsman’s club, recreational fishing, selective timber harvesting, and occasional ecological studies by State agencies or other parties. Entergy owns the entire site with the exception of a 1.7-ac (0.7-ha) parcel of land outside the exclusion area boundary and occupied by the Starhill Microwave Radio Tower. West Feliciana Parish has zoned the RBS site for industrial use and regulates it as an M-2 General Industry District, a designation applicable to energy generating facilities. (Entergy 2017h)
The principal buildings and structures within the main plant area are located within the northern portion of the site and include the reactor building, auxiliary building, turbine building, radwaste building, water treatment facility, site administrative building, circulating water cooling towers, standby service water cooling tower, ultimate heat sink, and generation support building. The site also houses an ISFSI adjacent to and immediately south of the previously listed buildings. A meteorological tower lies to the west, and 230-kV and 500-kV switchyards lie to the south. The cooling water intake and discharge structures are located in the southeast corner of the property along the eastern shore of the Mississippi River. Figure 3-5 depicts the layout of the RBS plant area.
Developed land of various use intensities occupies 12.7 percent of the RBS site. Undeveloped lands on the RBS site fall primarily into four land use/land cover categories: deciduous forest (24.2 percent of total site area), woody wetlands (22.5 percent), mixed forest (18.6 percent), and shrub/scrub (13.1 percent) (Entergy 2017h). Table 3-1 lists site land uses and associated
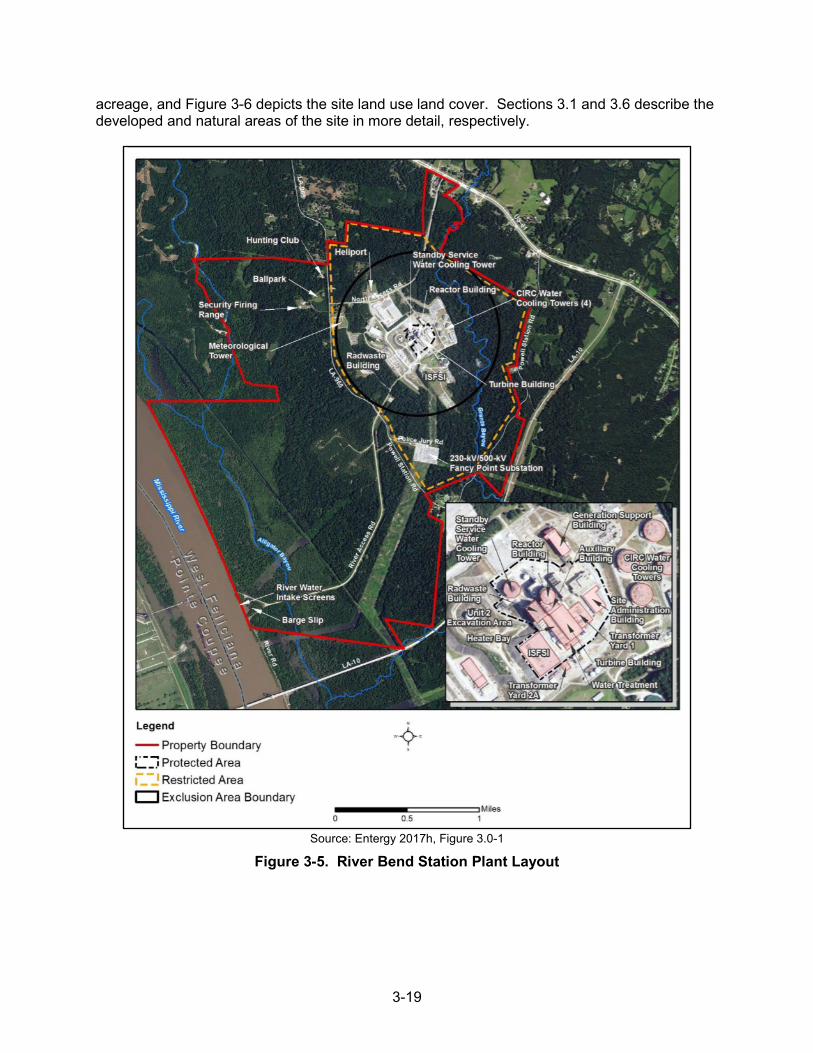
3-19
acreage, and Figure 3-6 depicts the site land use land cover. Sections 3.1 and 3.6 describe the developed and natural areas of the site in more detail, respectively.
Source: Entergy 2017h, Figure 3.0-1
Figure 3-5. River Bend Station Plant Layout

3-20
Source: Entergy 2017h, Figure 3.1-1
Figure 3-6. River Bend Station Site Land Use/Land Cover

3-21
Table 3-1. River Bend Station Site Land Use/Land Cover by Area
Land Use/Land Cover Area (in acres)(a) Percent Deciduous forest 796.6 24.2
Woody wetlands 738.6 22.5
Mixed forest 611.6 18.6
Shrub/scrub 430.6 13.1
Developed Land 417.2 12.7
Developed, Open Space 184.1 5.6
Developed, Low Intensity 81.8 2.5
Developed, Medium Intensity 97.2 3.0
Developed, High Intensity 54.0 1.6
Evergreen forest 150.6 4.6
Grassland / herbaceous 43.1 1.3
Pasture / hay 41.4 1.3
Emergent herbaceous wetlands 27.6 0.8
Open water 25.1 0.8
Barren land (rock / sand / clay) 3.8 0.1
Total 3,286.2(b) 100
(a) To convert acres to hectares, divide by 2.4711. (b) The acreages presented in this table are based on the Multi-Resolution Land
Characteristic Consortium land use/land cover data. Because these data are presented in pixel format, acreages do not exactly match the RBS site boundary, and thus, the total acreage presented in this table is slightly different than the property acreage presented elsewhere in this SEIS.
Source: Entergy 2017h
3.2.1.2 Coastal Zone
In 1972, Congress promulgated the Coastal Zone Management Act (16 USC 1451 et seq.; CZMA) to encourage and assist States and territories in developing management programs that preserve, protect, develop, and, where possible, restore the resources of the coastal zone (i.e., the coastal waters and the adjacent shore lands strongly influenced by one another, which may include islands, transitional and intertidal areas, salt marshes, wetlands, beaches, and Great Lakes waters). Section 307(c)(3)(A) of the Coastal Zone Management Act requires that applicants for Federal permits whose proposed activities could affect coastal zones certify to the licensing agency (here, the NRC) that the proposed activity would be consistent with the State’s coastal management program. The regulations that implement the Coastal Zone Management Act indicate that this requirement is applicable to renewal of Federal licenses for actions not previously reviewed by the State (15 CFR 930.51(b)(1)). However, West Feliciana Parish, in which RBS is located, is not within Louisiana’s designated coastal zone (LDNR 2012); therefore, a consistency determination is not required for RBS license renewal.

3-22
3.2.1.3 Offsite Land Use
The area surrounding the RBS site is predominantly rural. Within a 6-mi (10-km) radius of the site, most land lies within West Feliciana Parish; however, this radius also includes small portions of East Baton Rouge, East Feliciana, and Pointe Coupee Parishes. The predominant land use/land cover categories within the radius are wetlands (19.6 percent of land area), deciduous forest (16.5 percent), pasture/hay (12.1 percent), and shrub/scrub (11.9 percent) (Entergy 2017h). Developed land of various use intensities accounts for 6.5 percent of land use/land cover (Entergy 2017h). Table 3-2 characterizes the land uses within a 10-km (6-mi) radius of RBS.
Table 3-2. Land Use/Land Cover within a 6-mi (10-km) Radius of River Bend Station
Land Use/Land Cover Area
(in acres)(a) Percent Woody wetlands 14,142.3 19.6
Deciduous forest 11,902.6 16.5
Pasture/hay 8,727.7 12.1
Shrub/scrub 8,634.7 11.9
Mixed forest 7,854.8 10.9
Cultivated crops 4,827.3 6.7
Open water 4,786.4 6.6
Developed 4,729.0 6.5
Open space 2,938.5 4.0
Low intensity 989.2 1.4
Medium intensity 422.1 0.6
High intensity 379.2 0.5
Evergreen forest 3,585.5 5.0
Grassland/herbaceous 1,633.3 2.3
Barren land (rock/sand/clay) 928.7 1.3
Emergent herbaceous wetlands 534.4 0.7
Total 72,286.5 100.0
(a) To convert acres to hectares, divide by 2.4711.
Source: Entergy 2017h
West Feliciana Parish, in which RBS is located, includes 273,000 ac (110,000 ha) of land. The Mississippi River forms the parish’s western boundary. According to the West Feliciana Parish Comprehensive Plan (WFPZC 2008), approximately 9 percent of parish land is developed, 15 percent is in agricultural use, and almost a third is forested. The remaining acreage is comprised of parks, wetlands, water, brush, and grasslands (WFPZC 2008). The parish’s agricultural lands are comprised of 93 farms, whose primary agricultural products include corn, wheat, soybeans, forage, and beef and milk cows (USDA 2012). West Feliciana Parish is one of the fastest growing parishes in Louisiana (WFPZC 2008). The parish’s Comprehensive Plan

3-23
includes policies and actions aimed at developing mixed use sustainable housing and commercial areas, emphasizing tourism and ecotourism, attracting new economic development to the parish in targeted areas, and developing conservation practices to preserve the parish’s natural resources (WFPZC 2008).
A number of parks, historic sites, preserves, and refuges are located near RBS. Approximately 6 mi (10 km) west of the RBS site, Cat Island National Wildlife Refuge consists of 10,473 ac (4,238 ha) of cypress-tupelo swamp and bottomland hardwood forests (FWS 2014a). Both hunting and fishing are permitted within the refuge, although the refuge is currently closed to the public due to major flooding in the Baton Rouge area in August 2016 that washed out several of the refuge’s access roads (FWS 2014a). The refuge is one of the few remaining un-leveed sections of floodplain along the Lower Mississippi River and, therefore, is subject to regular inundation by the river. The Mary Ann Brown Preserve lies 6 mi (10 km) northeast of the RBS site. The preserve contains 100 ac (45 ha) of high-quality, mixed pine and hardwood forest on the fringes of the Tunica Hills Wildlife Management Area (Nature Conservancy 2017). Nine parks and State-managed historic sites lie within 6 mi (10 km) of the site: St. Francisville Recreational Park, Parker Memorial Park, Garden Symposium Park, West Feliciana Sports and Recreational Park, West Feliciana Parish Railroad Park, Audubon State Historic Site, Rosedown Plantation State Historic Site, Port Hudson State Historic Site, and Locust Grove State Historic Site. Figure 3-7 depicts these and other Federal, State, and local lands within a 6-mi (10-km) radius of the RBS site.
3.2.2 Visual Resources
As described in the previous section, the RBS site is located on the east bank of the Mississippi River within a rural area of southern Louisiana 24 mi (39 km) north-northeast of the city of Baton Rouge. The RBS site is heavily wooded and contains several unnamed, intermittent streams that cross and drain to either Grants Bayou to the east or Alligator Bayou to the west. Several wooded natural areas lie within a 6-mi (10-km) radius of the site as previously described in Section 3.2.1.3. Natural features near the site include Thompson Creek to the east and southeast; the Mississippi River and Bayou Sara to the west and northwest; False River to the southwest; Wickliffe Creek, Alexander Creek, and Alligator Bayou in the western portion of the RBS site; Grants Bayou East Fork in the southern part of the RBS property; and oxbow lake remnants to the south. (Entergy 2017h)
RBS lies approximately 2 mi (3.2 km) from the bank of the Mississippi River at an elevation of approximately 100 ft (30 km) above mean sea level. The station’s four mechanical-draft cooling towers rise 56 ft (17 m) above grade elevation but are not visible above the trees to an offsite viewer. From U.S. Route 61 (US-61), neither the power block nor cooling towers are visible due to the forested areas, which act as a visual buffer to separate the RBS site from nearby roads. From the highway entrance, only the RBS Training Center Building, which looks like a typical office building, is visible. The in-scope transmission lines are contained within the RBS site boundary and are also not visible to an offsite viewer.
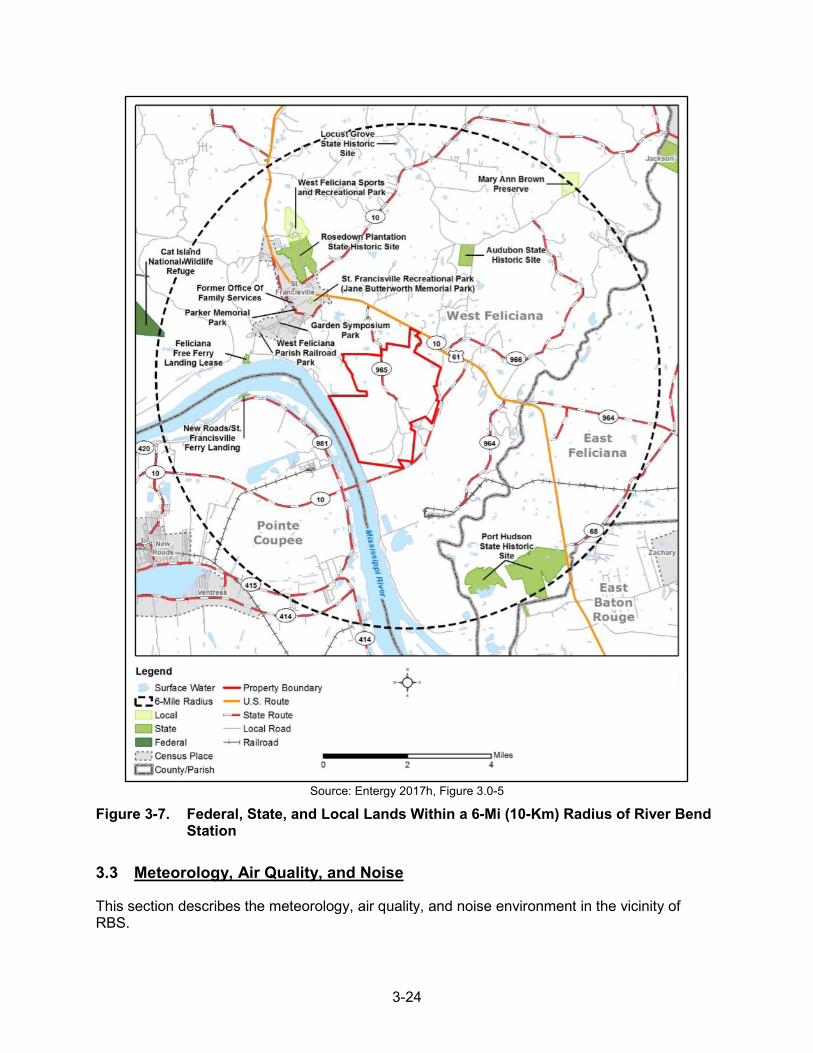
3-24
Source: Entergy 2017h, Figure 3.0-5
Figure 3-7. Federal, State, and Local Lands Within a 6-Mi (10-Km) Radius of River Bend Station
3.3 Meteorology, Air Quality, and Noise
This section describes the meteorology, air quality, and noise environment in the vicinity of RBS.

3-25
3.3.1 Meteorology and Climatology
The state of Louisiana is characterized by a humid subtropical climate, with long, hot summers and short, mild winters. The climate of Louisiana is primarily influenced by the Gulf of Mexico. The warm water temperatures of the Gulf provide warm, moist air particularly to the southern and coastal regions. In general, temperature and precipitation are more stable in southern Louisiana as a result of the moderating effect of the Gulf of Mexico. The northern regions of Louisiana experience more variable changes in temperature and precipitation because of stronger continental influences. During summer months, rainfall decreases with distance from the Gulf Coast and during the winter months, this pattern is reversed. RBS is located approximately 75 miles (120 km) from the Gulf coast. The general climate in this area is humid subtropical, but is subject to polar influences during the winter (NCDC 2016). Air from the Gulf of Mexico moderates summer heat, shortens winter cold spells, and provides moisture and heavy rainfall during all seasons. Thunderstorms are common during the summer months and hailstorms, tornadoes, and wind storms are common during the spring months. Louisiana is vulnerable to tropical cyclones (tropical storms and hurricanes) that develop in the Gulf of Mexico. Tropical cyclones make landfall once every 3 years along southeastern Louisiana, and the Louisiana coast is vulnerable to severe flooding from these storms (NOAA 2013b; Frankson et al. 2017).
The staff obtained climatological data from the Baton Rouge Ryan Field Airport (KBTR) weather station. This station is approximately 19 mi (30 km) from RBS and is used to characterize the region’s climate because of its nearby location and long period of record. Entergy maintains a meteorological monitoring system composed of a meteorological tower with wind speed, wind direction, and ambient temperature sensors. Entergy provided meteorological observations from the RBS site in response to the NRC staff’s request for additional information (Entergy 2017c). The staff evaluated these data in context with the climatological record from the Ryan Airport National Weather Service station.
The mean annual wind speed during a 33-year period of record at the KBTR station is 6.3 mph (10.1 km/h) and the prevailing wind is from the northeast (NCDC 2012, 2013, 2014, 2015 2016). The mean annual wind speed from RBS’s onsite meteorological tower from 2012–2016 for the 30-foot elevation and 150-foot level sensors are 3.4 mph (5.5 km/h) and 6.9 mph (11.1 km/h), respectively. Annual prevailing wind direction from RBS’s onsite meteorological tower from 2012–2016 for the 30-foot elevation and 150-foot level sensors are from the southeast and east-southeast, respectively (Entergy 2017c). Entergy has noted the differences in wind direction between the RBS’s onsite meteorological tower and Ryan Field airport and is in the process of assessing if trees in the vicinity of RBS’s onsite meteorological tower could potentially be blocking winds from reaching the tower (Entergy 2017c).
The mean annual temperature for a 30-year period of record (1987–2016) at the KBTR station is 70.2 °F (21.2 °C) with a mean monthly temperature ranging from a low of 51.9 °C (11.1 °C) in January to a high of 82.8 °F (28.2 °C) in July (NCDC 2016). The mean annual temperature from RBS’s onsite meteorological tower for the 2002–2016 timeframe is 66.1 °F (18.9 °C) with a mean monthly temperature ranging from a low of 48.5 °F in January to a high of 81.3 °F (27.4 °C) in August (Entergy 2017c).
Mean total annual precipitation for a 30-year period of record (1987–2016) at the KBTR station is 61.2 in (115.4 cm) and mean monthly precipitation range is 4.1–6.7 in (10.4–17.0 cm). Mean

3-26
total annual precipitation from RBS’s onsite meteorological tower for the 2002–2016 timeframe is 64.6 in (164.0 cm) and mean monthly precipitation range is 3.9–6.6 in (9.8–16.8 cm) (Entergy 2017c).
In the past 65 years (1950–2016), the following number of severe weather events have been reported in West Feliciana Parish (NCDC 2017):
• Hurricane: four events• Tornado: five events• Flood: three events
3.3.2 Air Quality
Under the Clean Air Act (CAA) of 1963, as amended, 42 U.S.C 7401, et seq., the EPA has set primary and secondary National Ambient Air Quality Standards (NAAQS, 40 CFR Part 50, “National Primary and Secondary Ambient Air Quality Standards”) for six common criteria pollutants to protect sensitive populations and the environment. The National Ambient Air Quality Standards criteria pollutants include carbon monoxide (CO), lead (Pb), nitrogen dioxide (NO2), ozone (O3), sulfur dioxide (SO2), and particulate matter (PM). PM is further categorized by size—PM10 (diameter between 2.5 and 10 micrometers) and PM2.5 (diameter of 2.5 micrometers or less). Table 3-3 presents the National Ambient Air Quality Standards for the six criteria pollutants.
Table 3-3. Ambient Air Quality Standards
Pollutant Averaging Time National Standard Concentration Carbon Monoxide (CO) 8-hr 9 ppm (primary standard)
1-hr 35 ppm (primary standard) Lead (Pb) Rolling 3-month average 0.15 µg/m3 Nitrogen Dioxide (NO2) 1-hr 100 ppb (primary standard)
Annual 53 ppb (primary and secondary standard)
Ozone (O3) 8-hr 0.075 ppm (primary and secondary standard)
Particulate matter less than 2.5 µm (PM2.5)
Annual 12 µg/m3 (secondary) 15 µg/m3 (secondary)
24-hr 35 µg/m3 (primary and secondary standard)
Particulate matter less than 10 µm (PM10)
24-hr 150 µg/m3 (primary and secondary standard)
Sulfur Dioxide (SO2) 1-hr 75 ppb (primary standard) 3-hr 0.5 ppm (secondary standard)
Key: ppb = parts per billion; ppm = parts per million; µg/m3 = micrograms per cubic meter. To convert ppb to ppm, divide by 1000.
Primary standards provide public health protection, including the health of sensitive populations such as asthmatics, children, and the elderly. Secondary standards provide public welfare protection, including protection against decreased visibility and damage to animals, crops, vegetation, and buildings.
Source: EPA 2017d

3-27
The EPA designates areas of attainment and nonattainment with respect to meeting National Ambient Air Quality Standards. Areas for which there is insufficient data to determine attainment or nonattainment are designated as unclassifiable. Areas that were once in nonattainment, but are now in attainment, are called maintenance areas; these areas are under a 10-year monitoring plan to maintain the attainment designation status. States have primary responsibility for ensuring attainment and maintenance of the National Ambient Air Quality Standards. Under Section 110 of the Clean Air Act (42 U.S.C. 7410) and related provisions, States are to submit, for EPA approval, State implementation plans (SIPs) that provide for the timely attainment and maintenance of the National Ambient Air Quality Standards.
In Louisiana, air quality designations are made at the parish level. For the purpose of planning and maintaining ambient air quality with respect to the National Ambient Air Quality Standards, EPA has developed air quality control regions. Air quality control regions are intrastate or interstate areas that share a common airshed. RBS is located in West Feliciana Parish, which is part of the Southern Louisiana Texas Interstate Air Quality Control Region (40 CFR 81.53, “Southern Louisiana-Southeast Texas Interstate Air Quality Control Region”). This air quality control region consists of 36 parishes in Louisiana and 15 counties in Texas. With regard to National Ambient Air Quality Standards, EPA designates the West Feliciana Parish as unclassifiable/attainment for all criteria pollutants (40 CFR 81.319, “Louisiana”). The nearest designated nonattainment area for ozone (8-hr National Ambient Air Quality Standards) is East Baton Rouge and West Baton Rouge, approximately 24 mi (39 km) from RBS.
The Louisiana Department of Environmental Quality regulates air emissions at RBS under a minor source air permit (Air Permit 3160-00009-04) (LDEQ 2009). The Louisiana Department of Environmental Quality issued this air permit in July 2009, and the permit will expire in 2019 (Entergy 2017h). Table 3-4 lists permitted air pollutant emission sources and air permit-specified conditions. Entergy is in compliance with RBS’s minor air source permit, and RBS has not received any notices of violation pertaining to the air permit for the 2011–2015 period (Entergy 2017h, 2017c).
Table 3-4. Permitted Air Emission Sources at River Bend Station
Equipment Air Permit Condition Standby Diesel Generators (2) High Pressure Core Spray Diesel Engine Portable Outage/Maintenance Diesel Engines
Opacity <= 20 percent PM, NOx, CO, SO2, VOC emission limit
Diesel Oil Storage Tanks (3) Gasoline Fuel Storage Tank
VOC emission limit
Mechanical Draft Cooling Towers (4) Service Water Cooling Tower Standby Cooling Tower
PM10 emission limit
Air Compressor Station Blackout Diesel Generator Emergency Operations Facility Emergency Generator
Opacity <= 20 percent PM, NOx, CO, SO2, VOC emission limit
Key: PM = particulate matter, NOx = nitrogen oxides, CO = carbon monoxide, SO2 = sulfur dioxide, VOC = volatile organic compounds, VOC limit
Sources: Entergy 2017h and LDEQ 2009
Table 3-5 shows annual emissions from permitted sources at RBS. Diesel generators/engines and the natural gas emergency generator at RBS are operated intermittently during testing or

3-28
during outages as these are intended to be used to supply backup emergency power. According to the 2014 National Emissions Inventory, estimated annual emissions for West Feliciana Parish are 29; 1,060; 5,063; 2,933; and 19,732 tons for sulfur dioxide, nitrogen dioxide, carbon monoxide, particulate matter less than 10 microns, and volatile organic compounds, respectively (EPA 2017a). RBS air emissions from permitted sources make up 2.0 percent or less of West Feliciana Parish’s total annual emissions. Greenhouse gas emissions from operation of RBS are discussed in Section 4.15.3 and Section 4.16.8 of this SEIS.
Table 3-5. Estimated Air Pollutant Emissions
Emissions (tons/year) Year SOx NOx CO PM10 VOCs HAPs 2011 0.4 16 4.0 4.0 2.0 0.01 2012 0.1 9.0 2.4 3.1 1.2 0.01 2013 0.3 14.9 3.8 3.4 1.6 0.01 2014 0.2 2.9 2.3 3.3 1.3 0.01 2015 0.6 20.5 5.1 3.8 1.9 0.02
Key: CO = carbon monoxide, NOx = nitrogen oxides, HAPs = hazardous air pollutants, SOx = sulfur dioxides, PM10 = particulate matter less than 10 micrometers, VOC = volatile organic compounds
To convert tons per year to metric tons per year, multiply by 0.90718.
Sources: Entergy 2017h, 2016e
The EPA promulgated the Regional Haze Rule to improve and protect visibility in national parks and wilderness areas from haze, which is caused by numerous, diverse air pollutant sources located across a broad region (40 CFR 51.308–309). Specifically, 40 CFR 81 Subpart D, “Identification of Mandatory Class I Federal Areas Where Visibility Is an Important Value,” lists mandatory Federal areas where visibility is an important value. The Regional Haze Rule requires States to develop State Implementation Plans to reduce visibility impairment at Class I Federal Areas. The nearest Class 1 Federal Area is Breton Wilderness Area, approximately 180 miles (290 km), southeast of RBS. Federal land management agencies that administer Federal Class I areas consider an air pollutant source that is located greater than 50 km (289 miles) from a Class I area to have negligible impacts with respect to Class I areas if the total SO2, NOX, PM10, and sulfuric acid annual emissions from the source are less than 500 tons per year (70 FR 39104, NRR 2010). Given the distance of the Class I area to RBS and the air emissions as presented in Table 3-5, there is little likelihood that ongoing activities at RBS adversely affect air quality and air quality-related values (e.g., visibility or acid deposition) in any of the Class I areas.
3.3.3 Noise
Noise is unwanted sound and can be generated by many sources. Sound intensity is measured in logarithmic units called decibels (dB). A dB is the ratio of the measured sound pressure level to a reference level equal to a normal person’s threshold of hearing. Most people barely notice a difference of 3 dB or less. Another characteristic of sound is frequency or pitch. Noise may be composed of many frequencies, but the human ear does not hear very low or very high frequencies. To represent noise as closely as possible to the noise levels people experience, sounds are measured using a frequency-weighting scheme known as the A-scale. Sound levels

3-29
measured on this A-scale are given in units of A-weighted decibels (dBA). Table 3-6 presents common noise sources and their respective noise levels. Noise levels can become annoying at 80 dBA and very annoying at 90 dBA. To the human ear, each increase of 10 dBA sounds twice as loud (EPA 1981).
Table 3-6. Common Noise Sources and Noise Levels
Noise Source Noise Level (dBA) Human hearing threshold 0 Soft whisper 30 Quiet residential area 40 Dishwasher 55–70 Lawn mower 65–95 Blender 80–90 Ambulance siren, jet plane 120
Source: CHC undated
Several different terms are commonly used to describe sounds that vary in intensity over time. The equivalent sound intensity level (Leq) represents the average sound intensity level over a specified interval, often 1 hour. The day-night sound intensity level (LDN) is a single value calculated from hourly Leq over a 24-hour period, with the addition of 10 dBA to sound levels from 10 p.m. to 7 a.m. This addition accounts for the greater sensitivity of most people to nighttime noise. Statistical sound level (Ln) is the sound level that is exceeded ‘n’ percent of the time during a given period. For example, L90, is the sound level exceeded 90 percent of time and is considered the background level.
There are no Federal regulations1 for public exposures to noise. The EPA recommends day-night average sounds levels (LDN) of 55 dBA as guidelines or goals for outdoors in residential areas (EPA 1974). However, these are not standards. The Federal Housing Administration (FHA) has established noise assessment guidelines for housing projects and finds that day-night average sound levels (LDN) of 65 dBA or less are acceptable (HUD 2014). West Feliciana Parish Code of Ordinances declared unnecessary noises a nuisance; however, the West Feliciana Parish Code of Ordinances does not set maximum permissible sound levels.
As discussed in Section 3.2.1, the vicinity of the RBS site is rural, sparsely populated, and heavily wooded. The primary noise source in the vicinity of RBS is vehicular traffic along U.S. Highway 61. Common noise sources from nuclear power plant operations include transformers, loudspeakers, auxiliary equipment, and worker vehicles (NRC 2013b). Major noise sources at RBS include transformers, turbine, mechanical draft cooling towers, and the gun range (Entergy 2017h). The nearest residents are approximately 0.85 miles (1.4 mi) away from the RBS reactor building.
1 In 1972, Congress passed the Noise Control Act of 1972 establishing a national policy to promote an environment free of noise that impacts the health and welfare of the public. However, in 1982 there was a shift in Federal noise control policy to transfer the responsibility of regulation of noise to State and local governments. The Noise Control Act of 1972 was never rescinded by Congress but remains unfunded (EPA 2017h).

3-30
Ambient sound level surveys were conducted prior to construction (June 1972), during construction (January 1980), and during the first year (July/August 1986 and February 1987) of operation of RBS (GSUC 1984b, 1987). Residual sounds levels (L90) at 8 nearby noise-sensitive receptors in the vicinity of RBS prior to construction in 1972 ranged from 49 to 56 (dBA) (GSUC 1984b); significant noise sources identified included insect noise. During construction of RBS, residual sounds levels (L90) at seven noise-sensitive receptors in the vicinity of RBS ranged from 34 to 41 dBA; significant noise sources identified included a paper mill and highway traffic. Insect noise, unlike the 1972 survey, was absent due to the winter season.
Daytime and nighttime measurements during the first summer and winter of full-power operations at RBS were taken at six nearby noise sensitive receptors and two control stations farther away from RBS; four of the six noise sensitive receptor locations were comparable to locations at which preoperational measurements were taken. Prevalent noise sources observed included vehicular traffic, cooling tower fans, river towboat engines, aircraft traffic, and transformers. Control station sound levels were lower than the noise-sensitive receptor measurements and sound levels were higher in the summer than in the winter (due to insects) and higher at night than during the day in the summer (GSUC 1987):
• Day noise levels (L90) at the six noise-sensitive receptor locations ranged from 34 to50 dBA and at the two control stations ranged from 32 to 39 dBA;
• Night noise levels (L90) at the six noise-sensitive receptor locations ranged from 39 to51 dBA and at the two control stations ranged from 27 to 43 dBA.
A comparison of operational sound level measurements to preoperation and construction measurements found both increases and decreases in overall noise levels relative to the preoperational period. The highest overall increase was 11 dBA and the largest decrease was 8 dBA (GSUC 1987).
RBS received a noise complaint pertaining to nighttime training activities at the RBS firing range during the 2011–2016 timeframe. However, upon further investigation, Entergy determined that the nighttime firing range activities were not being conducted during the time specified in the local resident’s complaint. Therefore, Entergy concluded that the complaint was not related to RBS operation and related activities (Entergy 2017h, 2017g). Other than this dispositioned complaint, Entergy has not received noise complaints during the 2011–2016 time period (Entergy 2017h, 2017c).
3.4 Geologic Environment
This section describes the geologic environment of the RBS site and vicinity, including landforms, geology, soils, and seismic conditions.
3.4.1 Physiography and Geology
The RBS site is located east of the Mississippi River on an upland area. It rises to an average elevation of approximately 125 ft (38 m) mean sea level (MSL). The upland area is cut by dry swales and intermittent stream channels (see Figure 3-8). Major drainage features include Alligator Bayou and Grants Bayou. The main plant buildings are located in an area at an elevation approximately 95 to 100 ft (29 to 30 m) mean sea level (Entergy 2017h).

3-31
The rest of the site is located on the flood plain of the Mississippi River, where the elevation of land surface is approximately 30 to 40 ft (9 to 12 m) mean sea level. This area is located along the western boundary of RBS (Entergy 2008b, 2017h).
The RBS site is built on the Mississippi Delta. This delta is made up of an enormous thickness of sediment. These sediments occur in layers that dip and thicken toward the Gulf of Mexico. At the site, these sediments are more than 20,000 ft (6,096 m) thick. (Entergy 2008b)
At RBS, the Mississippi River and its flood plain are underlain by alluvial deposits of sand, silt, and clay deposited by the Mississippi River. Alluvial deposits of sand, silt, and clay also underlie the stream channels. The rest of the site is underlain by terrace deposits that formed during the Pleistocene Epoch (2.5 million to 11,700 years ago, often colloquially known as the Ice Age). The terrace deposits formed on the flood plain of the ancient Mississippi River. They occupy upland areas of the site (see Figure 3-9) and are composed of layers of clay, silt, sand, and gravel.
Two main terraces are identified at the RBS site: the Prairie Allogroup and the Citronelle Formation. They are similar in makeup and differ primarily in age and areal extent. The Prairie Allogroup is the younger terrace and was deposited on top of the Citronelle Formation. However, the Prairie Allogroup is not found in the higher elevations of the site. In these areas, the Citronelle Formation forms the uppermost terrace unit (Entergy 2008b, 2017h).
Most of the terrace deposits are covered by a layer of loess (silt deposited by winds during the Pleistocene Epoch (last ice age)). At the RBS site, the loess layers are less than 10 ft (3 m) thick and are found on top of the terrace deposits in the upland areas. The loess is absent on the Mississippi flood plain and over the alluvial deposits of the stream channels, as in these areas it has been removed by erosion (Entergy 2008b, 2017h).
In the power block area, during plant construction, the terrace deposits were excavated to a depth of 75 ft (22m). The excavations were partially backfilled with clayey sand engineered fill. The buildings in the power block area were built into and on the engineered fill (Entergy 2008b).
3.4.2 Economic Resources
RBS site activities do not significantly prevent access to economically important minerals and geologic resources in West Feliciana Parish. Economically significant deposits of sand, gravel, and other mineable resources are not known to exist at the site. No mining or quarrying operations occur within 5 mi (8 km) of the site (Entergy 2008b). Oil and gas production and exploration has occurred and may continue to occur across West Feliciana Parish (LDNR 2017b, USGS 2012). However, there are no active oil or gas wells within 5 mi (8 km) of the RBS site (Entergy 2008b).
The Tuscaloosa Marine Shale underlies the southern half of Louisiana. It underlies West Feliciana Parish at depths greater than 10,000 ft (3,048 m). Oil and gas has been extracted from sandstone beds in this shale using conventional technology. However, in West Feliciana Parish, the shale itself is also being explored to determine if oil and gas can be extracted using fracking and horizontal drilling technology (GBRBR 2013, Pair 2017, USGS 2017g). While conducting the environmental review for the RBS license renewal, the NRC staff identified no fracking or horizontal drilling and exploration activities of the Tuscaloosa Marine Shale within 5 mi (8 km) of RBS (GBRBR 2013).

3-32
Source: Modified from Entergy 2017h
Figure 3-8. River Bend Site Topography

3-33
Source: Modified from Entergy 2008b
Figure 3-9. River Bend Alluvial Stream Deposits
3.4.3 Soils
Most of the soils at the RBS site can be characterized as silty loams or silty clay loams. Soils near the Mississippi River are frequently flooded. Soils along the shoreline of the Mississippi

3-34
River are fine sandy loams, while those a little farther away from the river contain more clay and are either silty clay loams, clay loams, or mucky clay (Entergy 2017h, USDA 2017).
Within the site boundary, only one soil type can be classified as prime farmland. However, this soil type only occurs in small isolated patches. No significant construction activities are planned for the site over the license renewal period. Should soil disturbing activities take place at the site, Entergy will manage the potential for soil erosion by following the site’s Storm Water Pollution Prevention Plan (Entergy 2017h, USDA 2017).
3.4.4 Land Subsidence
Land subsidence or the gradual sinking of land is a significant issue in southern Louisiana. Over the millennia, land subsidence was countered by the addition of sediments from the Mississippi River (Reed and Wilson 2004; Van Kooten 2005; Yuill et al 2009). However, since the mid-to late 20th century, human activities have impacted natural processes to favor land subsidence. Processes contributing to land subsidence include aquifer and reservoir compaction from the extraction of groundwater, oil, and gas and reduced sediment deposition on the land by the Mississippi River (Reed and Wilson 2004, Van Kooten 2005). The RBS site is located in an area with a relatively low subsidence rate of 0.07 inch/yr (1.7 mm/yr) (Zou et al. 2015). Future activities at the site are not expected to increase the current rate of land subsidence.
3.4.5 Seismic Setting
The RBS site lies within a region of infrequent and minor seismic activity. There are no major seismic zones within the state of Louisiana (Entergy 2017h). The State of Louisiana is located within the geologic tectonic province known as the Gulf Coast Basin. This basin contains shallow growth faults (normal faults) with decreasing dip with depth. These growth faults trend for considerable distances and roughly parallel the Louisiana coastline. Fault movement along these growth faults is driven by a process of gradual creep, as opposed to the sudden breaking of rock that is associated with earthquakes. As a result, Louisiana is not considered to be seismically active. Historical earthquakes within Louisiana have occurred infrequently, have been of low magnitude, and have produced little damage (LGS 2001).
The New Madrid Seismic Zone is the most likely area where earthquakes might occur that could affect southern Louisiana (LGS 2001). This 150-mile (240 km) long seismic zone covers parts of Arkansas, Illinois, Kentucky, Missouri, and Tennessee (MODNR 2014). Historically, some mild ground shaking in southern Louisiana was reported from large earthquakes originating in this area (LGS 2001).
The NRC evaluates the potential effects of seismic activity on a nuclear power plant in an ongoing process that is separate from the license renewal process. The NRC requires every nuclear plant to be designed for site-specific ground motions that are appropriate for its location. Nuclear power plants, including RBS, are designed and built to withstand site-specific ground motion based on their location and the potential for nearby earthquake activity. The seismic design basis is established during the initial siting process, using site-specific seismic hazard assessments. For each nuclear power plant site, applicants estimate a design-basis ground motion based on potential earthquake sources, seismic wave propagations, and site responses, and then account for these factors in the plant’s design. In this way, nuclear power plants are designed to safely withstand the potential effects of large earthquakes. Over time, the NRC’s understanding of the seismic hazard for a given nuclear power plant may change as methods of

3-35
assessing seismic hazards evolve and the scientific understanding of earthquake hazards improves (NRC 2014d). As new seismic information becomes available, the NRC expects that licensees will evaluate the new information to determine if changes are needed to safety systems at a plant. The NRC also evaluates new seismic information and independently confirms that licensee’s actions appropriately consider potential changes in seismic hazards at the site.
3.5 Water Resources
This section describes surface water and groundwater resources at and around the RBS site.
3.5.1 Surface Water Resources
Surface water encompasses all water bodies that occur above the ground surface, including rivers, streams, lakes, ponds, and man-made reservoirs or impoundments.
3.5.1.1 Surface Water Hydrology
Local and Regional Hydrology
The Entergy property comprising the RBS plant site is located on the east (left descending) bank of the Lower Mississippi River centered near Mississippi River River Mile (RM) 262 (River Kilometer (RKm) 421.6) above Head of Passes2 (as shown in Figures 3-1, 3-3 and 3-10). This segment of the river is known as the St. Francisville reach (Entergy 2017h). Figure 3-3 shows that there are only two RBS support structures located in close proximity to the riverbank, the blowdown control structure and makeup water pump house. All other major plant structures, including the nuclear island, are located within the RBS facility complex that lies approximately 2 mi (3.2 km) from the river (Figure 3-5).
The Lower Mississippi River–Baton Rouge watershed (hydrologic unit 08070100) encompasses the RBS property; this watershed is part of the Lower Mississippi River Basin (EPA 2017i, Entergy 2017h). The Lower Mississippi River–Baton Rouge watershed comprises several smaller drainages that cross the RBS property, including Alligator Bayou and Grants Bayou (which is a tributary to Alligator Bayou). As shown in Figure 3-5, Alligator Bayou traverses the river floodplain and is just to the west of the river’s natural levee. In general, Grants Bayou drains the greater RBS property on the east and Alligator Bayou drains the RBS property on the west.
RBS’s plant drainage ditch system collects runoff and other drainage waters from the RBS plant site. Most of this collected drainage is then discharged through monitored outfalls to two south-flowing ditches (known as East and West Creek) (see Section 3.5.1.3). In turn, these ditches drain toward Grants Bayou, which flows to Alligator Bayou in the river floodplain just south of the RBS facility complex. Alligator Bayou then flows to Thompson Creek which has a confluence with the Lower Mississippi River at a point about 7 mi (11 km) downstream of the RBS embayment area (Entergy 2015d, 2017h).
2 The Head of Passes marks the location of the mouth of the Mississippi River. Locations along the main river channel are specified in units of river miles, starting with Mississippi River RM 0.0 at Head of Passes and Mississippi River RM 953.8 (RKm 1,535) at the mouth of the Ohio River.

3-36
Other than the drainage systems and tributary streams referenced above, there are no ponds or lakes within the RBS facility complex, but there are about 7.3 ac (3 ha) of freshwater ponds elsewhere on the RBS property (Entergy 2017h). Otherwise, the only other water bodies on the RBS site include the 600-ft-long (183-m) circulating water flume (see Section 3.1.3.2) and two sets of open aeration and sedimentation lagoons located at the sanitary wastewater treatment plant in the southeastern corner of the RBS facility complex.
The Mississippi River is most relevant to RBS operations. It comprises the largest river system in the United States. The mainstem of the river runs for 2,340 mi (3,766 km) from its headwaters in northern Minnesota to the Gulf of Mexico, and drains a total area of about 1,250,000 square miles (3,240,000 square kilometers) (Kammerer 1990; Entergy 2017h). The Lower Mississippi River encompasses the approximately 980-mi (1,600-km) long segment of the river that flows south from the confluence of the Ohio River in Illinois to Head of Passes in Louisiana, where the mainstem of the river branches off into the Gulf of Mexico (Alexander et al. 2012; Entergy 2017h).
Along the St. Francisville reach of the Lower Mississippi River adjoining the RBS property, the width of the river ranges from approximately 1,700 ft (520 m) at the downstream edge of the property at Mississippi River RM 260 (RKm 418) (near LA Route 10 and the Audubon Bridge) to approximately 4,300 ft (1,300 m) at the northwest edge near Mississippi River RM 264 (RKm 425). The maximum depth of the river along the reach is about 100 ft (30 m) based on an average annual water level elevation of 20.4 ft (6.2 m) MSL (Entergy 2017h).
River flow and water level varies substantially throughout the year. Previous studies indicate that the flow velocity averages 3.88 fps (1.18 m/s) in the St. Francisville reach (Entergy 2017h).

3-37
Source: Modified from Entergy 2017h
Figure 3-10. Hydrologic Features of the Lower Mississippi River Basin Near River Bend Station

3-38
River System Management and Flood Control
The Mississippi River System is closely managed and heavily engineered for flood control and navigation. Federal authority for coordinating the management of the river system lies with the Mississippi River Commission (MRC). Six districts of the U.S. Army Corps of Engineers implement the Mississippi River Commission’s plans (Alexander et al. 2012).
Engineered features in the Lower Mississippi River basin include a levee system along the mainstem of the river and its tributaries in the alluvial plain, floodways to divert excess flow from the river, and channel improvements such as revetments and dikes to direct channel flow and to prevent migration of channels (Entergy 2017h; USACE 2017b). In total, the Lower Mississippi River has over 3,500 mi (5,630 km) of levees to prevent flooding during times of high discharge. Levee construction has reduced the river’s natural floodplain by approximately 90 percent (Alexander et al. 2012). Additional engineered features include cutoffs to shorten the river and to reduce flood heights and various other flood control structures. Specifically, excess river flow in the St. Francisville reach of the Lower Mississippi River is managed by flow diversions into the Atchafalaya River through the Old River Control Structure located upstream of the site (Figure 3-10). The USACE also performs dredging to increase the flow capacity of river channels to reduce flood potential (Entergy 2015d, 2017h; USACE 2017b).
In relation to the RBS site, man-made levees are nearly continuous on the west bank of the Lower Mississippi River, and on the east bank the levees alternate with high bluffs from Cairo, IL to Baton Rouge, LA (see Figure 3-10). A low-water navigation channel measuring 9 ft (2.7 m) deep and 300 ft (91 m) wide is maintained by dredging and dikes between Cairo and Baton Rouge (Entergy 2017h).
The location of the RBS plant site on elevated ground northeast of the Lower Mississippi River lower floodplain reduces the potential for riverine or stream flooding of the plant site. The USACE has established the Mississippi River Project Design Flood level at the site as 54.5 ft (16.6 m) mean sea level (MSL). The estimated recurrence interval for this flood is greater than 100 years (i.e., less than 1 percent chance per year) (Entergy 2015d, 2017h). The postulated probable maximum flood (PMF) elevation of the Lower Mississippi River is 60 ft (18.3 m) MSL (Entergy 2015d).
The RBS facility is located at a higher elevation than these flood levels. At the RBS facility complex, grade elevation averages 95 ft (30 m) MSL. RBS safety-related equipment lies at a minimum elevation of 98ft (29.9m) MSL, or is otherwise located in buildings protected from floodwaters.
The Federal Emergency Management Agency (FEMA) has delineated the flood hazard areas along the Lower Mississippi River and near the RBS site. The RBS facility complex and associated power block is located more than 1 mi (1.6 km) from areas mapped as Zone A (areas of 100-year flood) associated with the Lower Mississippi River floodplain. FEMA designates the RBS complex as lying in Zone C, which represents areas of minimal flooding. East of the river, the only other areas mapped as lying within the 100-year floodplain are associated with the drainage ways and tributaries to local streams including Grants Bayou just to the east of the RBS site area (Entergy 2017h; FEMA 1979). Within the RBS facility complex, a tributary to Grants Bayou on the west side of the plant complex (known as West Creek), has been reconfigured and channelized to confine it within a 2,850-ft (870-m) long geotextile and

3-39
concrete-lined (i.e., Fabriform™) channel. This modification was performed to minimize potential flooding during extreme rainfall events, including the probable maximum flood (Entergy 2015d, 2017h).
As shown in Figure 3-3, there are only two RBS support structures located within the lower floodplain of the Lower Mississippi River (i.e., the blowdown control structure and makeup water pump house), neither of which is a safety-related structure. Nevertheless, in order to protect the pumps and motors from floodwaters, the structure is built to withstand flooding. The entrance to the pump house lies above the surface of the ground at an elevation of 60.5 ft (18.4 m) (Entergy 2015d). This is about the same elevation as the probable maximum flood and higher than the Mississippi River Project Design Flood Level.
Flow Characteristics of the Lower Mississippi River
In its environmental report, Entergy states that the annual mean flow of the Lower Mississippi River near the RBS site is 514,080 cfs (14,520 m3/s) for the period of record 1965–2015. This estimate is based on data from the Tarbert Landing, MS station (Entergy 2017h). The ER also reports that the lowest recorded flow for the Lower Mississippi River was 111,000 cfs (3,140 m3/s) for the period of record. This station (USGS station no. 07295100) is operated jointly by the U.S. Geological Survey and the U.S. Army Corps of Engineers and is located near Mississippi River RM 306.3 (RKm 492.9), approximately 44 RM (71 RKm) upstream of RBS (USGS 2014a). The available flow data is based on daily, instantaneous discharge and river stage measurements.
The U.S. Geological Survey also operates a gauging station at Baton Rouge (Gauging Station No. 07374000) at Mississippi River RM 229.6 (RKm 369.5), approximately 32 RM (51 RKm) downstream of RBS. Flows measured at this gauging station are generally representative of surface water withdrawals that RBS and other facilities make from the St. Francisville reach of the Lower Mississippi River. For water years 2005 through 2016, the mean annual discharge at Baton Rouge is 547,373 cfs (15,463 m3/s). For water year 2016, the mean discharge was 654,100 cfs (18,477 m3/s) (USGS 2017i). The lowest daily mean flow is 141,000 cfs (3,980 m3/s), and the 90 percent exceedance flow is 235,500 cfs (6,650 m3/s) for the period of record (USGS 2016). The 90 percent exceedance flow is an indicator value of hydrologic drought. It signifies a streamflow that is equaled or exceeded 90 percent of the time as compared to the average flow for the period of record.
Due to the operation of the Old River Control Structure, river flow-by at the RBS site would not be expected to fall below 100,000 cfs (2,800 m3/s) (Entergy 2015d, 2017h). Based on average monthly flow over the relatively short period of record at the station, October is the low-flow month and May is the high-flow month (USGS 2016).
3.5.1.2 Surface Water Use
As described in Section 3.1.3, RBS withdraws surface water from the Lower Mississippi River for the plant circulating water system and service water cooling system. Heated cooling water from the main condenser along with other comingled effluents from auxiliary systems are discharged back to the river principally through RBS Outfall 001 in accordance with Entergy’s Louisiana Pollutant Discharge Elimination System permit (LDEQ 2017f) (see Figure 3-3).
RBS’s maximum (hypothetical) surface water withdrawal rate from the Lower Mississippi River is 32,000 gpm (71.3 cfs; 2.0 m3/s). This rate is equivalent to about 46.1 mgd (174,500 m3/day) and assumes two-pump operation with valves open at 100 percent. However, current (nominal)

3-40
plant operation only requires one pump with the second makeup pump serving as a backup (see Section 3.1.3.1). Thus, RBS’s design intake flow is defined as 23 mgd (87,100 m3/day). Consumptive use due to drift and evaporation from the circulating water system and service water cooling system cooling towers is about 17.7 mgd (67,000 m3/day) based on design maximum (Entergy 2017h). This reflects a design consumptive use rate of approximately 77 percent.
Table 3-7 summarizes RBS’s surface water withdrawals for the period 2012–2016. Based on the NRC staff’s review of Entergy’s reported surface water withdrawals, RBS withdraws an average of 17.7 mgd (67,000 m3/day) of water. This is equivalent to an average withdrawal rate of approximately 27.4 cfs (0.77 m3/s). Return discharges (mainly consisting of cooling tower blowdown) to the river have averaged 3.9 mgd (14,800 m3/day), which is equivalent to an average discharge rate of about 6 cfs (0.17 m3/s). The difference between withdraw and discharge (i.e., 21.4 cfs (0.6 m3/s); approximately 13.8 mgd (52,200 m3/day)) generally reflects consumptive use through cooling tower evaporation, drift, and other losses. In total, these operational data indicate a consumptive use rate averaging 78 percent.
Table 3-7. Annual River Bend Station Surface Water Withdrawals and Return Discharges to the Mississippi River
Year Withdrawals (mgd)(a) Discharges (mgd)(a,b) Consumptive Use (mgd)(c) 2012 17.3 3.9 13.4 2013 17.8 4.0 13.8 2014 18.0 4.0 14.0 2015 17.2 3.8 13.4 2016 18.1 3.9 14.2 Average 17.7 3.9 13.8
Note: All reported values are rounded. To convert million gallons per day (mgd) to cubic feet per second (cfs), multiply by 1.547.
(a) Values are the mean of monthly surface water withdrawals and monitored discharges, based on circulating waterflow metering and discharge recorder measurements or estimating methods.
(b) Based on monitored effluent from Outfall 001 including contributions from other previously monitored sources viainternal outfalls.
(c) Calculated as the difference between withdrawal and discharge.
Source: Entergy 2017b
RBS surface water withdrawals are not currently subject to any water appropriation, allocation, or related permitting requirements, and no general permitting system exists for surface water withdrawals from the Mississippi River (Entergy 2017h). The Louisiana Department of Natural Resources does coordinate a surface water resources management program that includes the establishment of cooperative agreements with water users for the withdrawal of surface water from the State's water bodies (LDNR 2017a). Nevertheless, Entergy’s Louisiana Pollutant Discharge Elimination System permit (LDEQ 2017f) for RBS does limit the maximum design capacity of the cooling water intake to no greater than 46 mgd (174,000 m3/day).

3-41
3.5.1.3 Surface Water Quality and Effluents
Water Quality Assessment and Regulation
In accordance with Section 303(c) of the Federal Water Pollution Control Act (i.e., Clean Water Act of 1972, as amended (CWA) (33 U.S.C. 1251 et seq.), States have the primary responsibility for establishing, reviewing, and revising water quality standards for the Nation’s navigable waters. Such standards include the designated uses of a water body or water body segment, the water quality criteria necessary to protect those designated uses, and an anti-degradation policy with respect to ambient water quality. As set forth under Section 101(a) of the Clean Water Act, water quality standards are intended to restore and maintain the chemical, physical, and biological integrity of the Nation’s waters and to attain a level of water quality that provides for the protection and propagation of fish, shellfish, and wildlife and provides for human recreation in and on the water. The Federal EPA reviews state promulgated water quality standards to ensure they meet the goals of the Clean Water Act and Federal water quality standards regulations (40 CFR Part 131, “Water Quality Standards”).
The Louisiana Department of Environmental Quality (LDEQ) promulgates surface water quality standards in Louisiana. Designated use categories include: (1) agriculture, (2) drinking water supply, (3) fish and wildlife propagation, (4) outstanding natural resource waters, (5) oyster propagation, (6) primary contact recreation, and (7) secondary contact recreation. All surface waters of the State are designated and protected for recreational uses and for the preservation and propagation of desirable species of aquatic biota (i.e., aquatic animal or plant life) and indigenous species of wildlife. The State also considers the use and value of water for public water supplies, agriculture, industry, and other purposes, as well as navigation, in setting standards (LAC 33:IX.1111).
The mainstem of the Lower Mississippi River from the Old River Control Structure to Monte Sano Bayou near Baton Rouge (Lower Mississippi River segment 070201), that encompasses the shoreline of Entergy’s property and RBS, is designated for the following uses: primary contact recreation, secondary contact recreation, fish and wildlife propagation, and drinking water supply (Entergy 2017h; LAC 33:IX.1111). River waters must normally meet the specified numeric criteria for chlorides (75 mg/L), sulfate (120 mg/L), dissolved oxygen (5 mg/L), pH range (6 to 9 units), bacteria (not to exceed a fecal coliform density of 400/100 mL), maximum temperature (32 °C (90 °F)), and total dissolved solids (400 mg/L) (LAC 33:IX.1111).
Section 303(d) of the Federal Clean Water Act requires states to identify all “impaired” waters for which effluent limitations and pollution control activities are not sufficient to attain water quality standards in such waters. Similarly, Clean Water Act Section 305(b) requires states to assess and report on the overall quality of waters in their State. States prepare a Clean Water Act Section 303(d) list that comprises those water quality limited stream segments that require the development of total maximum daily loads (TMDLs) to assure future compliance with water quality standards. The list also identifies the pollutant or stressor causing the impairment, and establishes a priority for developing a control plan to address the impairment. The total maximum daily loads specify the maximum amount of a pollutant that a waterbody can receive and still meet water quality standards. Once established, total maximum daily loads are often implemented through watershed-based programs administered by the State, primarily through the National Pollutant Discharge Elimination System (NPDES) permit program, pursuant to Section 402 of the Clean Water Act, and associated point and nonpoint source water quality improvement plans and associated best management practices (BMPs). States are required to

3-42
update and resubmit their impaired waters list every 2 years. This process ensures that impaired waters continue to be monitored and assessed by the State until applicable water quality standards are met.
The 2016 Louisiana Water Quality Integrated Report includes Louisiana’s Clean Water Act Section 303(d) list, which the EPA approved on February 10, 2017 (LDEQ 2017g). According to the State’s revised 2016 report, the 85-RM (137-RKm) long Lower Mississippi River segment (water body segment LA070301) that adjoins the RBS site property fully supports the designated uses for secondary contact recreation, fish and wildlife propagation, and drinking water supply. However, this river segment is impaired for primary contact recreation due to fecal coliform bacteria. Similarly, Thompson Creek (water body segment 20202), which may receive stormwater runoff and other effluents from RBS, is also impaired for primary contact recreation due to fecal coliform bacteria (LDEQ 2017a).
National Pollutant Discharge Eliminating System Permitting Status and Plant Effluents
To operate a nuclear power plant, NRC licensees must comply with the Clean Water Act, including associated requirements imposed by EPA or the State, as part of the National Pollutant Discharge Elimination System (NPDES) permitting system under Section 402 of the Clean Water Act. The Federal National Pollutant Discharge Elimination System permit program addresses water pollution by regulating point sources (i.e., pipes, ditches) that discharge pollutants to waters of the United States. NRC licensees must also meet state water quality certification requirements under Section 401 of the Clean Water Act. The EPA or the State, not the NRC, sets the limits for effluents and operational parameters in plant-specific NPDES permits. Nuclear power plants require a valid NPDES permit and a current Section 401 Water Quality Certification. NRC operating licenses are subject to conditions deemed imposed by the Clean Water Act as a matter of law. The NRC does not duplicate the EPA’s or a delegated State agency’s water quality reviews.
In August 1996, the EPA authorized the State of Louisiana to assume NPDES program responsibility and general permit authority in Louisiana (EPA 2017e). The LDEQ administers the NPDES program as the Louisiana Pollutant Discharge Elimination System (LPDES). The State’s regulations for administering the NPDES program are contained in Louisiana Administrative Code (LAC), Title 33, IX., Chapter 23 (LAC 33:IX.23). Like NPDES permits, Louisiana Pollutant Discharge Elimination System (LPDES) permits (called water discharge permits in Louisiana) are generally issued on a 5-year cycle.
RBS is authorized to discharge various wastewater (effluent) streams consisting of cooling tower blowdown, site stormwater, and miscellaneous process flows under LPDES Permit No. LA0042731) (LDEQ 2017f). The LDEQ renewed Entergy’s permit on September 15, 2017, based on Entergy’s submittal of a renewal application in May 2016 (Entergy 2016d). The permit is valid until October 31, 2022.
RBS’s LPDES permit specifies the monitoring requirements for effluent chemical and thermal quality and for stormwater discharges. The plant’s LPDES permit authorizes discharge from 15 outfalls for effluents to primary Outfall 001 and one internal outfall (No. 104) to stormwater Outfall 004. Table 3-8 summarizes the contributing industrial processes and associated effluent (wastewater) streams, including stormwater runoff, discharged through RBS’s outfalls. Where appropriate, Table 3-8 identifies relevant information or notable changes in RBS’s permitted wastewater and stormwater discharges or proposed permit modifications observed by the NRC staff based on a review of Entergy’s 2016 LPDES permit renewal application.

3-43
Table 3-8. Louisiana Pollutant Discharge Elimination System Permitted Outfalls, River Bend Station (a)
Outfall Average Flow
(mgd) Description(a,b) 001(c) 3.88 Continuous discharge of cooling tower blowdown and previously monitored
effluent from internal outfalls. Discharge to Mississippi River 101(c,d) 0.020 Intermittent discharge of low-level radioactive low-volume wastewater from the
liquid radwaste wastewater treatment system and maintenance wastewaters; during maintenance activities, discharge may occur to Outfall 001 via the cooling tower flume rather than the common discharge header.
201(c,d) 0.020 Intermittent discharge of treated sanitary wastewater, low volume wastewaters, and maintenance wastewaters. During maintenance activities on the common discharge header, previously monitored effluent from Outfall 201 may be routed to Outfall 002
301(c) 0(e) Intermittent discharge of mobile metal (chemical and nonchemical) cleaning wastewater generated from cleaning of internal components of plant equipment
401(c,d) 0 Intermittent discharge of low-volume wastewater treatment systems; during maintenance activities, outfall may discharge via the cooling tower flume rather than the common discharge header. During maintenance, reverse osmosis reject from the makeup water polishing system may be discharged via Outfall 401 rather than Outfall 003
501(c,d) 0.104 Intermittent discharge of low-volume wastewaters, including but not limited to, wastewaters from the mobile standby service water reverse osmosis filtration unit, standby cooling tower reject, and other low-volume wastewaters
601(c,d) 0 Intermittent discharge of low-volume wastewater, including but not limited to, wastewaters from the filter backwash from service water polishing and feed-and-bleed from the service water system and other low-volume wastewaters
701(c) NA(f) Intermittent discharge of low-level radioactive water from the groundwater remediation project. During maintenance, outfall may discharge to Outfall 001 via the cooling tower flume
002(c) 0.096 Stormwater runoff from the industrial materials storage area, the low-level waste storage building area, the clarifier area, and the sanitary wastewater treatment plant area; intermittent discharge of air conditioning condensate, potable water, clarified river water, well water, and maintenance wastewaters; low volume wastewaters including but not limited to bearing cooling water. Discharge to Grant’s Bayou via plant drainage system
003(c) 0.127 Stormwater runoff from the reactor building, turbine building, services building, clarifiers, cooling tower area, main transformer yard, and auxiliary transformer yards; intermittent discharge of maintenance wastewaters including but not limited to flushing of piping systems and vessels (including Fire Protection Water Supply System and Automatic Sprinkler System); low volume wastewaters; air conditioning condensate; de minimis quantities of cooling tower drift/mist. Discharge to East Creek and then to Grant’s Bayou
004(c) 0.467 Stormwater runoff from the office areas, warehouse areas, materials storage areas, and equipment/vehicle maintenance areas; intermittent discharge of maintenance wastewaters including flushing of piping systems and vessels, air conditioning condensate, and potable water. Discharge to West Creek and then to Grant’s Bayou
104 0(e) Intermittent discharge of exterior vehicle washwater to Outfall 004

3-44
Outfall Average Flow
(mgd) Description(a,b) 005(c) 0.074 Stormwater runoff from the cooling tower yard and intermittent discharge of air
conditioning condensate, and de minimis quantities of cooling tower drift/mist; discharge to Grant’s Bayou via plant drainage system
006 0.085 Intermittent discharge of clarifier underflow; discharge to Mississippi River via the clarifier sludge blowdown pipeline
007 0 Intermittent discharge of hydrostatic test wastewater. No discharge has occurred since 2011 (Entergy 2016d)
Note: To convert million gallons per day (mgd) to cubic feet per second (cfs), multiply by 1.547.
(a) Summarized from LPDES Permit No. LA0042731 (LDEQ 2017f), except as noted.(b) Based on flow for 2014–2015 as cited in Entergy’s LPDES renewal application (Entergy 2016d).(c) Outfall also permitted to receive hydrostatic test wastewater from a mobile unit (designated as Outfall 007).(d) NPDES permit internal monitoring point prior to Outfall 001.(e) There have been no discharges from this outfall since 1999 (Entergy 2016d).(f) Temporary groundwater remediation skid has been abandoned but Internal Outfall 701 has been retained
(LDEQ 2017f).
Source: Entergy 2016d; LDEQ 2017f.
The location of RBS’s outfalls are shown in Figure 3-11; Figure 3-3 also provides a more detailed view of Outfall 001 at the discharge location to the Lower Mississippi River.
As specified in the LPDES permit for each RBS outfall, Entergy is required to perform effluent monitoring and report measurement and analytical sampling results to the LDEQ for various parameters such as flow rate, discharge temperature, available chlorine, total organic carbon (TOC), chemical oxygen demand (COD), total suspended solids (TSS), fecal coliform, oil and grease, pH, and various metals. The LDEQ requires that effluent monitoring results for RBS’s LPDES-permitted outfalls be reported in discharge monitoring reports (DMRs) submitted through an electronic portal, generally on a monthly basis (Entergy 2017h; LDEQ 2017f).
For the primary plant outfall to the Lower Mississippi River (Outfall 001), Entergy conducts compliance monitoring at an aboveground vacuum-breaker (air-relief valve) chamber along the buried blowdown pipeline prior to discharge to the Lower Mississippi River (Figure 3-3). As observed by the NRC staff, the monitoring location is equipped with continuous flow and temperature recorders (Entergy 2016d).
The RBS LPDES permit allows for the use of water treatment chemicals including those used for raw water treatment in the clarifiers and in other plant subsystems (Section 3.1.3). These include flocculants, biocides, corrosion inhibitors, and other compounds that are added to maintain acceptable water and component quality. The LPDES permit includes a condition requiring Entergy to notify the LDEQ of any proposed changes to the water treatment chemicals used at RBS. Additionally, the permit requires Entergy to perform routine whole effluent aquatic toxicity testing during periods when chlorination is being conducted or when biocide or other potentially toxic substances may be present in plant effluents. At a minimum, the LPDES permit requires Entergy to perform annual toxicity testing on the discharge from Outfall 001 (LDEQ 2017f).

3-45
Entergy also maintains a zebra mussel monitoring and control program for monitoring the occurrence and relative densities of zebra mussels in the Lower Mississippi River, raw water influent to the RBS clarifier system and effluent, and the clarifier internals. When zebra mussels are suspected or confirmed, Entergy conducts inspection and sampling, as appropriate, of adult populations in the Lower Mississippi River near the intake piping. Entergy then performs cleaning of intake screens and piping as necessary (Entergy 2017h). For control of biofouling and specifically for the use of chlorine in controlling zebra mussels, RBS’s LPDES permit imposes an effluent limit on Outfall 001 for total residual (free available) chlorine (LDEQ 2017f).

3-46
Source: Modified from Entergy 2017h
Figure 3-11. Louisiana Pollutant Discharge Elimination System Permitted Outfalls, River Bend Station

3-47
As for thermal discharge regulation, Entergy’s LPDES permit imposes a monthly average temperature limit of 105 °F (40.6 °F) and a daily maximum temperature of 110 °F (43.3 °F) on the combined effluent from Outfall 001 to the Lower Mississippi River. As previously described in Section 3.1.3.2, the maximum temperature rise of the circulating water passing through the RBS main condenser is 27 °F (15 °C) and the maximum temperature of the return water from the cooling towers is 96 °F (35.6 °C). Discharge temperature is continuously monitored by a recorder and plant monitoring computer located in the RBS control room. As the monitoring location for Outfall 001 on the blowdown pipeline is more than 1 mi (1.6 Km) from the discharge point, the effluent temperature would likely be less before reaching the river. There have been no exceedances of LPDES thermal limits at RBS over the last 5 years (2012–2016) (Entergy 2017h).
Outfalls 002, 003, 004, and 005 at RBS predominantly receive stormwater runoff collected by the plant drainage system (Table 3-8). As specified in the LPDES permit, Entergy collects and analyzes samples for such parameters as total organic carbon, chemical oxygen demand, total suspended solids, oil and grease, and pH level. The results are reported on discharge monitoring reports submitted to the LDEQ (Entergy 2017h; LDEQ 2017f).
As also required by the LPDES permit, Entergy is required to develop, maintain, and implement a Storm Water Pollution Prevention Plan (SWPPP) for RBS that identifies potential sources of pollution reasonably expected to affect the quality of stormwater, and best management practices that will be used to prevent or reduce pollutants in stormwater discharges. Entergy’s Storm Water Pollution Prevention Plan for RBS identifies potential sources of pollution that could affect stormwater, groundwater, or surface water quality. The plan also includes procedural practices, controls, and inspections for preventing or reducing pollutants in stormwater discharges (Entergy 2013a). The LDEQ found during its March 2016 compliance review relating to Entergy’s LPDES renewal application that Entergy was performing annual stormwater inspections at RBS as required (LDEQ 2017e).
There is no direct discharge of sanitary effluent to surface waters from RBS. Sanitary drains collect waste from across the RBS facility complex via gravity feed and lifting stations before being conveyed to the onsite sanitary wastewater treatment plant. The facility has a total treatment capacity of 65,000 gallons (250 m3) per day and is located in the southeastern corner of the RBS facility complex and south of the clarifiers.
Two parallel treatment trains process the incoming waste via aeration lagoons, sedimentation ponds, rock filter basins, a gravity sand filter, and an ultraviolet disinfection unit for final treatment. Train 1 is dedicated to the radiologically active portion of the plant inside the protected area. Sludge from this system may need to be dried, compressed, and stored as low-level waste (Entergy 2015d, 2017h). As a safeguard, waste from sinks and drains within the plant containing waste that is known to be or is potentially contaminated with chemicals or radioactivity are physically separated from the sanitary drains. Such drains are piped directly to the liquid radwaste system rather than to the sanitary system (Entergy 2015d).
Train 2 provides treatment of the larger demands of the outlying plant support structures. Sludge from this system can be disposed of in any permitted municipal landfill. In total, the facility can accommodate 20 years of sludge accumulation in the sedimentation ponds (Entergy 2015d, 2017h). To date, Entergy has not needed to perform any sludge removal. As required by State regulation, Entergy has certified wastewater plant operators (Entergy 2017h).

3-48
Treated effluent from the sanitary plant is normally pumped to Outfall 001 via a common discharge header. This discharge point is regulated and monitored as Internal Outfall 201 under the RBS LPDES permit (Figure 3-11).
RBS is also subject to the requirements of EPA’s oil pollution prevention regulation (40 CFR 112, “Oil Pollution Prevention”), and Entergy has developed and implemented a Spill Prevention, Control, and Countermeasure (SPCC) Plan. The SPCC Plan for RBS (Entergy 2016f) identifies and describes the procedures, materials, equipment, and facilities that are utilized at the site to minimize the frequency and severity of oil spills as required by the regulation.
With respect to potential impacts to water resources from ongoing RBS operations, Entergy reports that it has received no Federal or State notices of violation associated with RBS activities during the period 2012 through October 2017, including any associated with the plant’s LPDES permit (Entergy 2017h, 2017c). The NRC staff’s review of records maintained by the LDEQ through its Electronic Document Management System also revealed no notices of violation over the last 5-year period. However, the NRC staff did find Entergy was the subject of a LDEQ Administrative Order issued in February 2013 for RBS’s tritium-contaminated groundwater remediation project (LDEQ 2013). This order established interim effluent limitations and monitoring requirements (pending issuance of RBS’s renewed LPDES permit) and authorized the discharge of contaminated groundwater to Internal Outfall 101 after being sampled for radioactivity in a temporary storage tank. Section 3.5.2.3 details groundwater quality and ongoing remediation activities at RBS.
In addition, the NRC staff reviewed LPDES permit discharge monitoring reports records submitted to the LDEQ, compliance summaries contained in Entergy’s ER, and compliance documentation provided by Entergy in response to the NRC’s requests for additional information (Entergy 2017h, 2017c). While Entergy has had a number of LPDES permit noncompliance or exceedance events over the last 5 years, the NRC staff found that they have generally been of minor significance and/or procedural or administrative in nature. One apparent trend is that a majority of the events are attributable to operations at the sanitary wastewater treatment plant.
Other Surface Water Resources Permits and Approvals
Section 401 of the Clean Water Act (33 U.S.C. 1251 et seq.) requires an applicant for a Federal license to conduct activities that may cause a discharge of regulated pollutants into navigable waters to provide the licensing agency with water quality certification from the State. This certification implies that discharges from the project or facility to be licensed will comply with Clean Water Act requirements and will not cause or contribute to a violation of State water quality standards. If the applicant has not received Section 401 certification, the NRC cannot issue a license unless that State has waived the requirement. The NRC recognizes that some NPDES-delegated states explicitly integrate their Section 401 certification process with NPDES permit issuance.
On October 25, 1974, the State of Louisiana issued its opinion that operational discharges from RBS would not violate state water quality standards and certified that the operation complied with Section 21(b) of the Federal Water Quality Improvement Act of 1970. Gulf States Utilities Company, the original owner and operator of RBS, also requested Section 401 certification for RBS from the State. On December 13, 1974, the Louisiana Stream Control Commission informed Gulf States that the State intended to take no action on Gulf States’ request. The NRC

3-49
deemed this inaction to constitute a waiver of the certification requirements under the provisions of Section 401 of the Clean Water Act (NRC 1985).
RBS’s current LPDES permit does not explicitly convey water quality certification under Section 401 of the Clean Water Act for ongoing operations. In support of license renewal, Entergy requested that the State provide documentation of continued certification and compliance with respect to Section 401 of the Clean Water Act. LDEQ responded to Entergy’s request by letter dated September 8, 2017. In summary, LDEQ informed Entergy that: (1) no new or additional water quality certification is necessary in support of Entergy’s license renewal application; (2) LDEQ deems that the certification issued by the Louisiana Stream Control Commission on October 25, 1974, is valid for RBS license renewal; and (3) LDEQ deems the currently issued LPDES permit for RBS to be a certification obtained pursuant to paragraph (1) of 33 U.S.C. Section 1341(a) (i.e., the Clean Water Act) with respect to the operation of RBS, Unit 1 (LDEQ 2017c). The NRC staff concludes that the LDEQ’s letter to Entergy provides the necessary certification to support operating license renewal.
The discharge of dredged or fill material to surface waters or wetlands is regulated under Section 404 of the Clean Water Act. Entergy performs annual maintenance dredging of a portion of the Lower Mississippi River to remove accumulated sediments from the vicinity of RBS’s submerged intake screens. The dredged material is deposited back into the deeper portions of the river. Entergy and its contractors conduct all dredging activities in accordance with the provisions of a U.S. Army Corp of Engineers, New Orleans District general permit for maintenance dredging (Entergy 2017h). This general permit (GP-23) is issued pursuant to Section 404 of the Clean Water Act and Section 10 permit of the Rivers and Harbors Appropriation Act of 1899. The Army Corps of Engineers issued a new permit to Entergy in August 2017. Special conditions attached to the permit include a number of measures to reduce environmental impacts to waterways, historic properties, and endangered species that may occur in the project area. The new permit is valid through April 2022 (USACE 2017a).
3.5.2 Groundwater Resources
This section describes the current groundwater resources at the RBS site and in the site vicinity.
3.5.2.1 Aquifer Descriptions
In West Feliciana Parish, fresh water is found in aquifers (water with a chloride concentration of 250 mg/L or less) at depths to about 300 to 600 ft (91-183 m) mean sea level. As the aquifers dip to the south, near the southern boundary of the parish, fresh water can be found as deep at 2,000 ft (610 m) mean sea level (Figure 3-12). Below these depths, aquifers generally contain saltwater (i.e., water with a chloride concentration greater than 250 mg/L) (USGS 2014b).
The source of groundwater in the aquifers of West Feliciana Parish is primarily from precipitation with some aquifers obtaining water from overlying aquifers or from rivers. Water is removed (discharged) from the aquifers by wells, evapotranspiration, and by discharge into rivers, or into underlying aquifers (USGS 2014b). These aquifers primarily consist of beds of unconsolidated sand, which generally thicken and dip to the south (Figure 3-12). Individual aquifers generally are at least 75 ft (23 m) thick and can be more than 200 ft (61 m) thick. They are commonly separated by confining beds primarily made of clay and silt that have low permeability and do not readily transmit groundwater. Their thickness ranges from 100 ft to much as 500 ft (152 m) (USGS 2014b).

3-50
In West Feliciana Parish, the Mississippi River Alluvial Aquifer occurs within the Mississippi River flood plain. The land surface forms its upper surface. It is generally flat, with no discernible dip (USGS 2014b).
Source: Modified from USGS 2014b
Figure 3-12. West Feliciana Parish Generalized North-to-South Hydrogeologic Cross Section
Outside of the flood plain, beds of sand and gravel within terrace deposits form another surficial aquifer (USGS 2014b). This aquifer is the Upland Terrace aquifer. Layers of loess (wind-deposited silt) blanket the top of the aquifer. The loess deposits in West Feliciana Parish extend 30 to 40 mi (48 to 64 km) east of the Mississippi River (Entergy 2008b). The aquifer dips

3-51
and thickens to the south (Figure 3-12) (USGS 2014b). It is approximately 75 ft (23 m) thick in West Feliciana Parish and increases to about 400 ft (129 m) at Baton Rouge, LA (Entergy 2008b).
The Upland Terrace Aquifer is underlain by the Evangeline and Jasper equivalent aquifer systems (Figure 3-12). Aquifers within the Evangeline and Jasper equivalent systems have been named for the depths at which they are found in the Baton Rouge area. The Evangeline equivalent aquifer system that underlies West Feliciana Parish consists of from shallowest to deepest, the “800-foot,” “1,000-foot,” “1,200-foot,” “1,500-foot,” and “1,700-foot” sands of the Baton Rouge area (USGS 2014b). The Evangeline equivalent aquifer system is underlain by the Jasper equivalent aquifer system. This system is made up of the “2,000-foot,” “2,400-foot,” and “2,800-foot” sands of the Baton Rouge area.
This naming convention represents the approximate depths these aquifers are found in the Baton Rouge area. Since the aquifers dip towards the south, north of Baton Rouge these aquifers occur at shallower and shallower depths. Therefore, beneath RBS, they are found at shallower depths than their names suggest.
The Baton Rouge area represents the approximate downgradient extent of the Upland Terrace Aquifer and the Evangeline and Jasper equivalent aquifers that contain freshwater. This is because an east-west trending fault (called the Baton Rouge fault) acts as a barrier to groundwater flow. Prior to groundwater development in the 1940s, freshwater in the aquifers flowed southward toward the fault. It then flowed upward and discharged at the land surface in springs in Baton Rouge. As a result, aquifers located north of the fault contain freshwater, while the same aquifers located south of the fault contain saltwater (Entergy 2008b, USGS 2013).
At RBS, the Mississippi River Alluvial Aquifer is within the Mississippi River flood plain. It is made up of alluvial deposits of sand, silt, clay and gravel that were deposited by the Mississippi River. The aquifer is approximately 150 ft (46 m) thick and is found beneath and on both sides of the river.
The Upland Terrace Aquifer occurs adjacent to and east of the Mississippi River Alluvial Aquifer. It is overlain by loess over most of the site. The Upland Terrace Aquifer is composed of layers of clay, silt, sand, and gravel. In the area of the RBS power block, the Upland Terrace Aquifer is about 100 ft (30 m) thick and about 200 ft (61 m) thick where it comes into contact with the Mississippi River Alluvial Aquifer. While not an aquifer, the structural fill in the power block area is capable of holding and acting as a pathway for groundwater. It is composed of clayey sand and is surrounded by and underlain by the Upland Terrace Aquifer (Entergy 2008b, 2017h). Figure 3-13 contains a west-east cross section across RBS that shows the Mississippi River Alluvial Aquifer, the Upland Terrace Aquifer, and the structural fill.
In the RBS power block area, the Upland Terrace Aquifer is underlain by a thick clay unit that is more than 200 ft (61 m) thick. Beneath this clay unit are four sand units that taken together total 270 ft (82 m) in thickness. These sands are the “1000-Foot,” “1,200-Foot,” and “1,500-Foot” sand aquifers of the Evangeline equivalent aquifer (Entergy 2008b) (Figures 3-12 and 3-14). These sands are hydraulically isolated from the Upland Terrace Aquifer by the thick overlying clay unit. However, in some areas near the Mississippi River Alluvial Aquifer at RBS, this overlying clay unit might be thin or absent (Entergy 2008b).
At RBS, the “1000-Foot,” “1,200-foot,” and “1,500 foot” sand aquifers are underlain by approximately 300 ft (92 m) of clay. Two sand aquifers underlie this clay. The total thickness of the two sands is approximately 90 ft (27 m). One of these sands is the “1,700-foot” sand of the

3-52
Evangeline equivalent aquifer system and the other is the “2,000-foot” sand of the Jasper equivalent aquifer system (Entergy 2008b) (Figures 3-12 and 3-14).
These two sands are underlain by 270 ft (83 m) of clay, which is underlain by the “2,400-foot” and “2,800-foot” sands of the Jasper equivalent aquifer. The combined thickness of the two sands is 210 ft (64 m). At RBS these are the deepest aquifers that contain fresh water, as deeper aquifers contain salt water (Entergy 2008b) (Figures 3-12 and 3-14).

3-53
Source: Modified from Entergy 2008b and 2017h
Figure 3-13. West-East Cross Section of Upland Terrace and Mississippi River Aquifers at River Bend Site

3-54
Source: Modified from Entergy 2008b
Figure 3-14. Aquifers Beneath the Power Block Area That Contain Freshwater

3-55
3.5.2.2 Groundwater Movement
Beneath the flood plain of the Mississippi River at RBS, the Mississippi River Alluvial Aquifer and the Upland Terrace Aquifer are hydrologically connected. In the power block area, the structural fill is surrounded by and hydrologically connected to the Upland Terrace Aquifer (see Figure 3-13). Near the Mississippi River, where the overlying clay units are thin or absent; the “1000-foot,” “1,200-foot,” and “1,500-foot” sand aquifers of the Evangeline equivalent aquifer may also be hydrologically connected to the Mississippi River Alluvial Aquifer (Entergy 2008b, 2017h).
At RBS, the water table is found in both the Mississippi River Alluvial Aquifer and the Upland Terrace Aquifer. It is also found in the structural fill material that surrounds and underlies structures in the power block. The groundwater in the Mississippi River Alluvial Aquifer and the structural fill is found under unconfined conditions. Groundwater in the Upland Terrace Aquifer is also unconfined except beneath discontinuous clay layers at depth or beneath thick surficial deposits of silt and clay close to its contact with the Mississippi River Alluvial Aquifer. The groundwater in all deeper aquifers exists under confined conditions (Entergy 2008b, 2017h).
Changes in the water levels of the Mississippi River can cause corresponding changes in Mississippi River Alluvial Aquifer groundwater levels. Water level changes in the Mississippi River can also cause changes in water levels in the Upland Terrace Aquifer and the “1000-foot,” “1,200-foot,” and “1,500-foot” sand aquifers of the Evangeline equivalent aquifer system where they are hydraulically connected to the Mississippi River Alluvial Aquifer.
As the Mississippi River Alluvial Aquifer is found both beneath and on both sides of the Mississippi River, regional groundwater flow in the Mississippi River Alluvial Aquifer is generally southward, in line with the flow direction of the river. In addition, when the height of river water levels cause the head of the Mississippi River to exceed the head in the Mississippi River Alluvial Aquifer, or in any other aquifers hydrologically connected to the river; water from the river would flow into those aquifers. Conversely, when the opposite occurs, groundwater would flow into the river. It is under these conditions, when the head in aquifers that are hydrologically connected to the river exceed river heads, that groundwater from RBS would leave the site and enter the river.
At RBS, groundwater flow in the Upland Terrace Aquifer is southwestward from the power block area and towards the Mississippi River where it flows into the Mississippi River Alluvial Aquifer (Figures 3-15 and 3-16). The Mississippi River is so large that it is very unlikely groundwater in the Mississippi River Alluvial Aquifer on one side of the river would reach the other side of the river. In effect, the Mississippi River itself would act as a boundary preventing groundwater flowing out of the Upland Terrace Aquifer and the Mississippi River Alluvial Aquifer at RBS from reaching groundwater on the other side of the river.

3-56
Source: Modified from Entergy 2017h
Figure 3-15. Direction of Groundwater Flow in the Upland Terrace Aquifer at the River Bend Site

3-57
Source: Modified from Entergy 2008b and 2017h
Figure 3-16. Cross Section Depicting Groundwater Flow through the Upland Terrace Aquifer into the Mississippi River Aquifer and then into the Mississippi River
3-58
Beneath RBS, groundwater in the Evangeline and Jasper equivalent aquifers flows south or southwest towards water wells in the Baton Rouge area. Withdrawal of groundwater from wells in the Baton Rouge area is large enough that it is lowering water levels in the Evangeline and Jasper equivalent aquifers over a large area of West and East Feliciana Parish. (Entergy 2008b, 2017h, USGS 2004, 2014b, 2015, 2017k, 2017h).
3.5.2.3 Groundwater Use
Potable water (i.e., drinking water) is supplied to RBS by the West Feliciana Parish Consolidated Water District No. 13 Water Supply System (Entergy 2017h). While many of the neighbors that surround RBS have wells, they also primarily obtain their drinking water from the same parish water supply system (Entergy 2017h).
Other than RBS-owned water wells, there are no water wells within the RBS site boundary. Outside of the site boundary and east of the Mississippi River, 46 wells are located within a 2-mile band around the RBS property boundary. Of these wells, one well is screened into the Mississippi River Alluvial Aquifer, 21 wells are screened into the Upland Terrace Aquifer, and 24 wells are screened into the Evangeline and Jasper equivalent aquifers (Entergy 2017h) (Figure 3-17).
Five onsite wells extract groundwater at RBS (Figure 3-17). Four wells produce water for use by RBS operations and one well extracts water for the cleanup of groundwater contamination. Two wells (wells P-1A and P-1B) are screened within the “2,800-foot” sand at a total depth of approximately 1,800 ft (549 m). These two wells are used to supply water for general site purposes, including plant makeup water. A third well (Well BP-1) is screened in the “1,200-foot” sand and is 500 ft (152 m) deep. Groundwater from this well is used for various maintenance and construction activities and dust suppression. The fourth well (Well P-05) is screened within the Upland Terrace Aquifer at depths of 84 to 124 ft (26 to 38 m). This well is capable of pumping 800 gpm (3,028 L/m). Water from this well is used for fire protection. The fifth well is a monitoring well (MW-125) screened within the Upland Terrace Aquifer. This well is periodically pumped to remediate tritium-contaminated water. Based on 5 years of data (2011–2015), annual average water withdrawals from the five wells listed above was 9.9 mgy (37 million L/yr), equivalent to a rate of 18.8 gpm (71 L/min). Of this volume, the two wells completed in the “2,800-foot” sand of the Jasper equivalent aquifer system produced 83 percent of the site’s well water (Entergy 2017h).
3.5.2.4 Groundwater Quality at RBS
The Mississippi River Alluvial Aquifer, the Upland Terrace Aquifer, and the Evangeline and Jasper equivalent aquifer systems are all part of the Southern Hills Regional Aquifer System. The EPA designated this system as a sole source aquifer. It encompasses a large area in the States of Louisiana and Mississippi (Figure 3-18). A sole source aquifer, as defined by the EPA, is an aquifer that supplies at least 50 percent of the drinking water for its service area. Further, it is an aquifer where no reasonably available alternative drinking water sources exist should the aquifer become contaminated. Under the EPA Sole Source Aquifer program, EPA can designate an aquifer as a sole source of drinking water and establish a review area for it. Within the review area, EPA evaluates proposed projects that will receive Federal funding. The purpose of EPA's evaluation is to ensure that these proposed projects do not contaminate the sole source aquifer. Proposed projects that are funded entirely by State, local, or private concerns are not subject to EPA review (Entergy 2008b, 2017h; EPA 2017f, 2017g).

3-59
Source: Modified from Entergy 2017h
Figure 3-17. Registered Water Wells Within a 2-Mile Band Around River Bend Station Property Boundary

3-60
Source: Modified from Entergy 2017h
Figure 3-18. Areal Extent of Southern Hills Regional Aquifer System
The water quality in the Mississippi River Alluvial Aquifer is very hard and exceeds the EPA Secondary Maximum Contaminant Levels for drinking water for iron and manganese. Water in the Upland Terrace Aquifer is generally soft and low in dissolved solids. Water in the Evangeline equivalent aquifer system is soft and generally does not exceed the EPA Secondary

3-61
Maximum Contaminant Levels for drinking water for pH and chloride, iron, and dissolved solids concentrations. Water in the Jasper equivalent aquifer system is soft and generally does not exceed the EPA Secondary Maximum Contaminant Levels for drinking water for color, pH, and iron, manganese, and dissolved solids concentrations (USGS 2014b).
Activities at RBS that involve the use of chemicals are typically associated with painting, cleaning parts/equipment, refueling onsite vehicles/generators, fuel oil and gasoline storage, and the storage and use of water-treatment additives. Chemical spills at RBS have been minor in nature and have been remediated. No chemical spills have required a regulatory agency to issue a notice of violation (Entergy 2017h).
All radionuclides in surface water bodies at RBS are below minimum detectible levels. Other than tritium, concentrations of all other radionuclides in groundwater beneath RBS are below minimum detectable levels (Entergy 2017a). Tritium is a hydrogen atom with an atomic mass of three (NRC 2006) that usually binds with oxygen to form a water molecule. A water molecule that contains tritium will behave in the environment just like a water molecule that does not contain tritium (NRC 2006).
Tritium emits a weak form of radiation—a low-energy beta particle similar to an electron. This radiation does not travel very far in air and cannot penetrate the skin. If tritium enters the body, it disperses quickly and is uniformly distributed throughout the soft tissues. If ingested, the human body excretes half of tritium ingested within approximately 10 days (NRC 2006). Additional information is available in NRC 2006 on tritium and radiation protection limits, and drinking water standards.
Nuclear power plants routinely and safely release dilute concentrations of water containing tritium. These authorized releases are closely monitored by the plant operator, reported to the NRC, and made available to the public on the NRC’s Web site (NRC 2017k). At RBS, water containing tritium is diluted to authorized levels and then released to the Mississippi River. The large volume of water in the river further dilutes the concentration of tritium in the river water to very low concentrations.
In recent years, spills of water containing tritium have made it into the groundwater within the structural fill that surrounds and underlies structures in the power block. From there it has moved into the Upland Terrace Aquifer. No tritium above minimum detectable activities has been found in any surface water bodies or offsite wells. In addition, no tritium above minimum detectable activities has been found in any deeper aquifers. This is likely to remain the case for any deeper aquifers beneath the Upland Terrace Aquifer, as the Upland Terrace Aquifer is underlain by thick clay units that act as barriers to the vertical movement of groundwater (Figures 3-13 and 3-14) (Entergy 2017h, 2017g).
It is important to note that while the structural fill around the power block buildings has been contaminated with tritium, the structural fill is not an aquifer. The Upland Terrace Aquifer is the only known aquifer to have been contaminated with tritium at the RBS site.
The following is a list of RBS spills and associated actions relating to the release of radioactive materials to groundwater. The radiological impacts resulting from the release of radionuclides into groundwater at the RBS site are described in Section 4.5.1.2 of this SEIS.
• In 2008, a break in a blowdown pipe from the cooling towers resulted in the release of water to the ground and the nearby stormwater drainage system. The water

3-62
potentially reached the Mississippi River and Grant’s Bayou via the stormwater drainage system and through Outfall 003. No tritium was detected above minimum detectible activity in Grant’s Bayou or in groundwater. However, tritium was detected at a concentration of 28,043 pCi/l in Outfall 003. Any tritium that made it to the Mississippi River would have been greatly diluted to very low levels (Entergy 2017h).
• In 2011 and 2012, a plume of tritium in the power block area was discovered and theextent of contamination was investigated and defined. The plume is located in thestructural fill and the underlying Upland Terrace Aquifer. The source of thecontamination is currently believed to be from equipment leaks and previous spillswithin the turbine building seeping through degraded floor joints. These joints wereresealed in 2016 (Entergy 2017h).
• In 2012, an equipment failure caused water containing low concentrations of tritium(4,260 pCi/L)) to leak into the ground near the wastewater treatment plant(Entergy 2017h).
• In 2013, an estimated 380 gallons (1,438 L) of water overflowed from a condensatestorage tank sump in the power block area. Tritium concentrations in the overflowwere 1,135,000 pCi/L (Entergy 2017h).
• In 2014, an equipment failure caused water containing low concentrations of tritium(4,580 pCi/L)) to leak into the ground near a temporary blowdown pipeline gate valve(Entergy 2017h).
• In 2014, water containing tritium was determined to be leaking from the liquidradwaste system pipeline that conveyed liquid to the circulating water blowdown pitsouth of the nuclear island. Entergy abandoned the line in 2012 and replaced it witha temporary aboveground line, but the abandoned line still contained some water.Groundwater samples contained tritium at concentrations of 28,270 pCi/L(Entergy 2017h, 2017c). A corrective action plan was instituted that included (1)filling the abandoned buried portion of the pipeline with a solid material topermanently seal it and (2) installing a new liquid radwaste pipeline; including a newengineered trench for the buried portion to facilitate future maintenance andinspection. Entergy plans to complete the project by the end of 2017(Entergy 2017c).
• In 2015, 60,000 gallons (227,125 L) of water containing tritium spilled from thecondensate demineralizer system inside the turbine building. As may havehappened in 2011 and 2012, some of this water may have seeped through degradedfloor joints in the turbine building and into the underlying structural fill material. Aspreviously mentioned, to prevent the possibility of future leaks the turbine building,floor joints were resealed in 2016 (Entergy 2017h).
In response to these releases, in 2016, the NRC issued Entergy a non-cited violation for violation of 10 CFR 20.1406(c) because between 2013 through 2015, the licensee failed to conduct operations to minimize the introduction of residual radioactivity into the groundwater at the site. The NRC determined the finding to be of very low safety significance because while the issue involved radioactive material control, it did not involve transportation or public exposure in excess of 0.005 rem. The licensee has documented this finding in its corrective action program (NRC 2016c). The extent of groundwater contamination from these releases and the corrective actions taken are described in the following discussion.

3-63
Source: Modified from Entergy 2017h
Figure 3-19. Wells Used to Monitor the Groundwater at the River Bend Site
The groundwater monitoring program at RBS includes 95 monitoring wells (Entergy 2017h) (Figure 3-19). With the exception of a few wells installed in the Mississippi Alluvial Aquifer, all of them are completed either in the structural fill of the power block or the Upland Terrace Aquifer.

3-64
Deeper aquifers are monitored via the onsite production wells (Entergy 2017h, 2017g). Entergy participates in an equivalent program to the Industry Ground Water Protection Initiative NEI-07-07 (NEI 2007). Since 2008, the NRC staff has been monitoring implementation of this initiative at licensed nuclear reactor sites. The initiative identifies actions to improve management and response to instances in which the inadvertent release of radioactive substances may result in low but detectible levels of nuclear power plant-related radioactive materials in subsurface soils and water. The initiative identifies those actions necessary for the implementation of a timely and effective groundwater protection program along with acceptance criteria to demonstrate that the objectives have been met.
Seventy-three onsite monitoring wells were sampled in 2017. With few exceptions, all of these wells were sampled quarterly for tritium concentrations. Of these wells, 66 were also sampled quarterly for the following radioactive isotopes: Mn-54, Co-58, Fe-59, Co-60, Zn-65, Nb-95, Zr-95, I-131, Cs-137, Ba-140, La-140. Except for tritium, all of the samples were below background concentrations (Entergy 2018a). In addition, the Mississippi River was sampled for both tritium and the following radioactive isotopes; Mn-54, Co-58, Fe-59, Co-60, Zn-65, Nb-95, Zr-95, I-131, Cs-137, Ba-140, La-140. Samples of Mississippi River water were obtained quarterly upstream and downstream of RBS. All of the river water samples were below background concentrations, including tritium (Entergy 2018a, 2018b).
Tritium has been detected in the groundwater in a small area within the power block area located just west of and next to the radwaste and turbine buildings (Figure 3-20). Tritium in this area has been detected both in the groundwater of the structural fill and in the underlying Upland Terrace Aquifer. In Quarter 3 of 2017, the maximum value reported for tritium in the fill was 740,000 pCi/L (monitor well MW-158). In the same quarter, beneath the fill within the Upland Terrace Aquifer, the maximum reported value was 223,000 pCi/L (monitor well MW-155, Quarter 3, 2017) (Entergy 2017h, 2017g, 2017c).
Tritium has also been detected within the Upland Terrace Aquifer, a short distance west of the power block area (Entergy 2017h, 2017g). Tritium concentrations in this area are much lower than the values found in the fill and Upland Terrace Aquifer near the radwaste and turbine buildings. In Quarter 3 of 2017, the maximum value reported in this area was 54,900 pCi/L (monitor well MW-110) (Entergy 2017h, 2017g, 2017c).
To better characterize the impacts on the groundwater as a resource, it is helpful to compare the concentrations of the radionuclides in the groundwater of the Upland Terrace Aquifer to EPA maximum contaminant levels (MCL). For tritium, EPA has established a maximum contaminant level of 20,000 pCi/L (EPA 2002b, NRC 2006). Spills into the groundwater within the Upland Terrace Aquifer have exceeded the maximum contaminant level for tritium. In November 2016, the highest tritium concentration within the Upland Terrace Aquifer in the area directly beneath the power block area exceeded the maximum contaminant level by a factor of 11. At the same time, the highest concentration within the Upland Terrace Aquifer in the area just west of the power block area exceeded the maximum contaminant levels by a factor of 2.8. Although the MCLs were exceeded, there was no impact to drinking water due to the absence of any drinking water wells down-gradient of the spills. This is discussed further in Chapter 4 of this SEIS.
Entergy monitors the tritium in the groundwater and continues to define the extent of groundwater contamination and any potential sources of contamination. Entergy believes that all detectable tritium contamination within the fill and Upland Terrace Aquifer is the result of liquid spills within the turbine building. As previously mentioned, in 2016, Entergy resealed the

3-65
turbine building floor joints to stop any future leaks. However, it is too early to conclude that Entergy has identified and stopped all sources of tritium contamination.
Entergy has actively remediated contaminated groundwater by periodically pumping groundwater from the area next to the radwaste building. The contaminated water was then placed into storage tanks. When the water in the tanks was within acceptable Louisiana Department of Environmental Quality and NRC regulatory limits, it was discharged to the Mississippi River (Entergy 2017h; LDEQ 2013). Once in the river, the tritium concentrations were further diluted by the water in the river to extremely low levels that were very likely below laboratory detection limits (Entergy 2017h).

3-66
Source: Modified from Entergy 2017h
Figure 3-20. Groundwater Tritium Concentrations as of November 2015 at the River Bend Site

3-67
Entergy is also mitigating the contaminated groundwater by using monitored natural attenuation (Entergy 2017h). Monitored natural attenuation is a methodology endorsed by EPA that, depending on site-specific circumstances, is used to reduce or attenuate the concentration of contaminates in groundwater (EPA 1999b). Natural attenuation relies on natural processes such as dilution, sorption, evaporation, radioactive decay, and chemical reactions with natural substances. The natural attenuation processes that will reduce tritium concentrations in groundwater are most likely to be the processes of dilution and radioactive decay.
The direction of groundwater flow in the structural fill and the Upland Terrace Aquifer is southwestward toward the Mississippi River Aquifer and from there into the Mississippi River. Following this direction of flow, groundwater only leaves the RBS property when it flows into the Mississippi River. Using monitored natural attenuation, the tritium in the groundwater near the power block would move with the groundwater over the approximately 2-mile distance until it exits the site boundary at the Mississippi River.
Tritium has a half-life of 12.3 years. This means that after 12.3 years, half of the tritium will be gone. Radioactive decay will decrease the concentration of tritium in the groundwater. Within the Upland Terrace Aquifer, the distance along the groundwater path from the power block area to the Mississippi River is approximately 2 miles. It is estimated that it would take 8.9 to 12.5 years for the tritium in the Upland Terrace Aquifer to reach the Mississippi River (Entergy 2017c), by which time approximately 39 to 50 percent of the tritium will have decayed away.
As tritium in the groundwater moves away from the power block area, its concentration in the Upland Terrace Aquifer will decrease. The Upland Terrace Aquifer is a water table aquifer. When precipitation events occur, some of the water from the rain or from runoff, will seep into the underlying aquifer and make its way down to the water table. The addition of this water will dilute the concentration of tritium in the groundwater. In addition, as individual water molecules move between the clay, silt, and sand particles that make up the Upland Terrace Aquifer, water molecules containing tritium will spread through the aquifer and mix with water molecules that do not contain tritium. This will cause the concentration of the tritium in the groundwater to decrease as the tritium-containing water mixes with water that does not contain tritium.
As the groundwater in the Upland Terrace Aquifer moves towards the river, biological processes are also likely to reduce the concentration of tritium in the aquifer. The land between the power block and the river is largely made up of a dense forest. Trees in this forest will withdraw groundwater from the Upland Terrace Aquifer. Tree roots cannot distinguish between a water molecule containing tritium and one that does not. Therefore, it is likely that some of the tritium in the groundwater will be removed by the trees. Tritium removed by the trees will likely be incorporated into the tree for a while before it is lost to atmosphere, with a small fraction organically bound to the structure of the tree until the tritium decays away.
As groundwater containing tritium flows beneath the flood plain of the Mississippi River, occasional flooding of the land surface by the river would add additional water to the underlying aquifer. This in turn would dilute and reduce tritium concentrations in the aquifer.
When the height of the water in the Mississippi River causes the river head to exceed the head in adjacent aquifers, river water would very likely move into the Upland Terrace and Mississippi River aquifers. This would dilute the tritium in the groundwater, reducing its concentrations in these aquifers near the river.

3-68
All of the processes described above will reduce the concentration of tritium in the groundwater before it moves into the Mississippi River. After it moves into the river, its concentration would be greatly reduced by the large volume of water flowing in the river. The impacts from groundwater consumption and from the releases of radionuclides into the groundwater are described in Section 4.5.1.2 of this SEIS.
3.6 Terrestrial Resources
This section describes the terrestrial resources of the affected environment, including the surrounding ecoregion, species, and vegetative communities present on the RBS site, and important species and habitats potentially present on or near the RBS site.
3.6.1 River Bend Station Ecoregion
The RBS site overlaps with the edges of two ecoregions: the Mississippi Alluvial Plains ecoregion and Mississippi Valley Loess ecoregion (NHEERL 2011). The Mississippi Alluvial Plain ecoregion consists of a long thin band that begins in southern Illinois (at the confluence of the Ohio River with the Mississippi River); extends south through parts of Missouri, Tennessee, Arkansas, Mississippi, and Louisiana; and ends at the Gulf of Mexico (Wiken et al. 2011). The Mississippi Valley Loess ecoregion stretches from the Ohio River in western Kentucky, extends south to Louisiana, and ends just east of the Mississippi River (Wiken et al. 2011).
The climate of both ecoregions is mild, humid subtropical, and the terrain is mostly broad, flat alluvial plain with river terraces, swales, and levees (Wiken et al. 2011). In the Mississippi Valley Loess ecoregion, thick deposits of loess sediment (wind-blown silt) in hills and ridges is a distinguishing feature (Wiken et al. 2011). Prior to European settlement, both ecoregions were dominated by bottomland deciduous forest; however, much of the forested habitat has been cleared for agricultural use. Virgin cypress stands were typically 400 to 600 years old at the time of European settlement, but over the last century, most of these trees have been logged, and few individual trees over 200 years old remain in either ecoregion (Sharitz and Mitsch 1993). Wiken et al. (2011) reports that the Mississippi Alluvial Plain is one of the most altered ecoregions in the United States. Today, over 90 percent of the landscape has been converted to cropland (Weakley et al. 2016). Primary crops include soybeans, cotton, corn, rice, wheat, pasture, and sugarcane (Wiken et al. 2011). Of the two ecoregions, the Mississippi Valley Loess ecoregion has seen less development and remains a mosaic of forest, pine plantations, pasture, and cropland (Wiken et al. 2011).
Existing forests communities are distinctly segregated by the extent of the hydroperiod, or seasonal pattern of water inundation. The hydroperiod determines the amount of oxygen and moisture available to a given forest community. The most intact habitats are confined to the wettest areas, which are difficult to cultivate or alter for other economic purposes (Weakley et al. 2016). Common forest communities include (in decreasing flood duration) river swamp forest, lower hardwood swamp forest, backwater and flats forest, and upland transitional forest (Weakley et al. 2016). River swamp forests contain bald cypress (Taxodium distichum) and water tupelo (Nyssa aquatica) (Wiken et al. 2011). Hardwood swamp forests include water hickory (Carya aquatic), red maple (Acer rubrum), green ash (Faxinus pennsylvanica), and river birch (Betula nigra) (Wiken et al. 2011). Seasonally flooded areas of higher elevation contain these species as well as sweetgum (Liquidambar styraciflua), sycamore (Platanus occidentalis), laurel oak (Quercus laurifolia), Nuttall oak (Q. texana), and willow oak (Q. phellos) (Wiken et al. 2011). Common herbs include butterweed (Senecio glabellus), jewelweed

3-69
(Impatiens capensis), and royal fern (Osmunda regalis), and woody vines include poison ivy (Toxicodendron radicans), greenbriers (Smilax spp.), and trumpet-creeper (Campsis radicans) (Weakley et al. 2016).
Common wildlife include white-tailed deer (Odocoileus virginianus), black bear (Ursus americanus), bobcat (Lynx rufus), coyote (Canis latrans), gray fox (Urocyon cinereoargenteus), northern raccoon (Procyon lotor), eastern fox squirrel (Sciurus niger), eastern cottontail (Sylvilagus floridanus), swamp rabbit (Sylvilagus aquaticus), American beaver (Castor canadensis), wild turkey (Meleagris gallopavo), cormorants (Phalacrocorax spp.), egrets (Egretta spp.), herons, mourning dove (Zenaida macroura), wood thrush (Hylocichla mustelina), yellow-throated vireo (Vireo flavifrons), various migratory waterfowl, and American alligators (Alligator mississippiensis).
3.6.2 River Bend Station Site Surveys, Studies, and Reports
This section summarizes the wildlife and vegetation surveys, studies, and reports that have been conducted on and near the RBS site in chronological order.
Preoperational Wildlife and Habitat Surveys (1972–1977)
In the 1970s, Gulf States Utilities Company commissioned several wildlife and habitat surveys of the RBS site prior to construction and operation of the nuclear power plant. In 1972, a vegetative survey of the site identified 16 distinct forest communities and 34 meadows and pastures. Small mammal trappings were conducted between the summer of 1974 through the summer of 1977 within several of the site’s natural habitats, including upland mixed shrub-grasslands, upland hardwood forests, disturbed upland areas, and mature bottomland hardwood forest. Avian surveys were conducted in 1972, 1973, and 1974 and included a mist net survey in bottomland hardwood forest areas, a breeding bird census in the loess bluff forest region of the site, and a winter bird census in meadows and more open-type habitats. Methodology and results of these surveys are described in the environmental report for RBS operation (GSUC 1984a).
Ecological Asset Value Development Report (2002)
In 2002, the Electric Power Research Institute team performed a site-specific assessment of ecological asset development opportunities on the RBS site. During the assessment, the team considered the ecological assets that are present or could potentially be developed on the RBS site, evaluated how the current regulatory and market climate would affect development of the identified ecological assets, and recommended specific ecological asset projects for Entergy to consider pursuing further. As part of the assessment, the team collected soil samples, conducted vegetation surveys, and evaluated the potential for the site to provide habitat for threatened, endangered, or rare species.
Vegetation Surveys (2006–2007)
Between December 2006 and November 2007, Entergy commissioned vegetation surveys of the RBS site in connection with the River Bend Station, Unit 3 combined license application. Entergy documented the results of these vegetation surveys in its environmental report for the combined license application (Entergy 2008a). Surveyors identified seven vegetative communities within the site’s natural areas, including upland palustrine wetlands and four types of bottomland forest. Additionally, surveyors documented wildlife present on the site through direct observation and indirect evidence (e.g., scat and tracks).

3-70
3.6.3 River Bend Station Site
As described in Section 3.2, RBS lies within a 3,342-ac (1,353-ha) Entergy-owned property on the east bank of the Mississippi River within a rural area of southern Louisiana 24 mi (39 km) north-northeast of the city of Baton Rouge. Site-specific information in this section is derived from the environmental report (Entergy 2017h) unless otherwise cited.
The site primarily consists of two basic forest types: bottomland hardwood and swamp/cypress. Upland bluffs on the site are part of the Tunica Hills region and represent the southernmost reaches of the loess bluffs. A natural levee lies along the bank of the Mississippi River that has been hardened with riprap partially colonized by trees and shrubs. Between the natural levee and upland bluffs lies bottomland forest and alluvial floodplain habitat of variable drainage. This area of the site also contains a large bird rookery used by snowy egret (Egretta thula), blue heron (Ardea herodias), night heron (Nycticorax nyticorax), and other wading and water birds.
The RBS site contains approximately 2,869 ac (1,161 ha) (87 percent) of undeveloped natural areas consisting of the following land use/land cover types: deciduous forest, woody wetlands, mixed forest, shrub/scrub, evergreen forest, grasslands, pasture, emergent herbaceous wetlands, open water, and barren land (see Table 3-1 and Figure 3-6). Most of the RBS site has been logged or cultivated in the past, which accounts for the lack of mature trees and the overall reduced plant diversity found throughout the site. Logging likely begun on the site as early as the 1820s and continued through the 1950s. The non-forested areas have all been previously disturbed and include mowed lawns, maintained transmission line corridors, and a few areas that were previously cleared and are now in the early stages of succession and dominated by planted grasses and invasive shrubs. The principal plant communities on the site include several types of bottomland forest communities, upland forest, upland forest palustrine wetland, and upland fields. The following subsections describe these communities in more detail. Unless otherwise noted, the descriptions of these vegetative communities that follow are derived from Entergy’s environmental report (2017h).
Bottomland Forest
Bottomland forest occupies approximately 19 percent of the RBS site and is primarily composed of three community types: bald cypress/tupelo gum bottomland forest, tupelo gum/hackberry bottomland forest, and hachberry/boxelder/ash bottomland forest.
Areas of bald cypress/tupelo gum bottomland forest are regularly inundated. Bald cypress and tupelo (Nyssa spp.) are the dominant species, and some red maple (Acer rubrum) and green ash (Fraxinus pennsylvanica) are also present. Buttonbush (Cephalanthus spp.) is a fairly common shrub in open canopy areas, and watermeal (Wolffia spp.) and duckweed (Lemna spp.) occur in areas where there are permanent stands of water.
Tupelo gum/hackberry bottomland forest occurs in low-lying, poorly drained flats in close proximity to bald cypress. Tupelo gum and sugarberry (Celtis laevigata) are the dominant species, but red maple, green ash, and oaks (Quercus spp.) are also present. The herbaceous layer varies depending on how recently an area has been subject to inundation, scouring, or prolonged drought.
Hackberry/boxelder/ash bottomland forest occurs in areas of slightly higher elevation with better drainage, although this community is also subject to periodic flooding. The canopy in these areas is dominated by sugarberry, box elder (Acer negundo), and green ash, but a number of

3-71
other species are present as well including cottonwood (Populus deltoides), black willow (Salix nigra), oak, and sweetgum. The understory is brushy and includes tree saplings, grapes (Vitis spp.), and briars (Smilax spp.).
Upland Forest
Upland forests dominate the loess plain areas of the RBS site. These areas include a mixture of species such as tulip tree (Liriodendron tulipifera), water oak (Quercus nigra), Shumard's oak (Q. shumardii), red mulberry (Morus rubra), sweetgum, and pines (Pinus spp.). The understory varies widely depending on the level of previous disturbance and how recently disturbance occurred. Areas to the east of Powell Station Road have little ground cover or support non-native shrubs and vines, such as privet (Ligustrum spp.), barberry (Berberis thunbergii), and Japanese honeysuckle (Lonicera japonica). Upland forests west of Powell Station Road are slightly more mature and denser ground cover is more common. In these areas, non-native shrubs and vines as well as Christmas fern (Polystichum acrostichoides), may-apple (Podophyllum peltatum), snakeroot (Sanicula spp.), Virginia snakeroot (Aristolochia serpentaria), and rattlesnake fern (Botrychium virginianum) form the understory.
Upland Forest Palustrine Wetland
Approximately 4 ac (1.6 ha) of wetlands lie immediately west of Powell Station Road. The area is primarily composed of inundated emergent wetlands with rushes, sedges, and forbs surrounded by wetland forest with scattered bald cypress, sweetgum, and water oak.
Upland Fields
Much of the upland fields on the site were upland forest prior to being cleared for RBS construction in the mid-1980s for equipment laydown. These areas are now dominated by broomsedge bluestem (Andropogon virginicus), Bermuda grass (Cynodon dactylon), panic grasses (Dichanthelium spp.), and weedy forbs such as hop-clover (Trifolium dubium). Many of the uplands fields are occasionally or regularly mowed.
Wildlife at the RBS Site
As described in Section 3.6.2, the RBS site was surveyed for wildlife prior to construction and again in 2006 and 2007 during preparation of the RBS Unit 3 combined license application. The site supports a wide variety of amphibians, reptiles, birds, and mammals due to its diversity of habitats.
Entergy (2017h) reports that the site supports as many as 79 amphibians and reptiles (26 frogs and salamanders, 9 lizards, 29 snakes, and 15 turtles), including the American alligator, bullfrog (Rana catesbeiana), eastern spadefood toad (Scaphiopus holbrookii), southern leopard frog (R. sphenocephala), eastern garter snake (Thamnophis scripta elegans), southern copperhead (Agkistrodon contortrix contortrix), and western cottonmouth (A. piscivorus leucostoma).
The Lower Mississippi River is part of the Mississippi Flyway, a major bird migratory route that extends from the Gulf of Mexico across the continental United States and into Canada. Thus, the RBS region is a pass over area for semiannual migrations of neotropical birds as well as seasonal migrations of waterfowl. Additionally, the site provides permanent and winter habitat for a number of waterfowl. Based on preconstruction surveys, approximately 177 bird species occur on the RBS site. Forest community birds include year round and seasonal residents such

3-72
as the American robin (Turdus migratorius), blue jay (Cyanocitta cristata), white-eyed vireo (Vireo griseus), red-bellied woodpecker (Sphyrapicus thyriideus), and Carolina wren (Thryomanes ludovicianus). Bottomland forest and wetland areas support water-dependent birds, including the great blue heron (Ardea herodias), belted kingfisher (Ceryle alcyon), redwinged blackbird (Agelaius phoeniceus), and great egret (Ardea alba). Birds of prey include turkey vulture (Cathartes aura), Cooper's hawk (Accipiter cooperii), great horned owl (Bubo virginianus), red-tailed hawk (Buteo jamaicensis), and short-eared owl (Asio flammeus). Additionally, the bald eagle (Haliaeetus leucocephalus) occasionally transits the site. Game birds include the mourning dove, northern bobwhite (Colinus virginianus), wild turkey (Meleagris gallopavo), and wood duck (Aix sponsa), all of which are year-round residents.
As many as 44 mammal species are likely to occur on the RBS site, and these include white-tailed deer, coyote, northern raccoon, eastern cottontail, eastern fox squirrel, gray fox, and American beaver.
Table 3-9 includes a more comprehensive list of common wildlife that likely occur on or near the RBS site.
Table 3-9. Common Wildlife Occurring on or in the Vicinity of the River Bend Station Site
Species(a) Common Name Amphibians
Bufo woodhousei Woodhouse’s toad Hyla crucifer peeper Pseudacris nigrita southern chorus frog Rana catesbeiana bullfrog Rana sphenocephala southern leopard frog Scaphiopus holbrookii eastern spadefoot toad
Birds(b)
Accipiter cooperii cooper’s hawk Anas americana American wigeon Anas crecca green-winged teal Anas discors blue-winged teal Anas platyrhynchos mallard Anas strepera gadwall Ardea alba great egret Ardea herodias great blue heron Bubo virginianus great horned owl Bubulcus ibis cattle egret Bucephala albeola bufflehead Butorides virescens green heron Cardinalis cardinal Ceryle alcyon belted kingfisher Charadrius vociferus killdeer
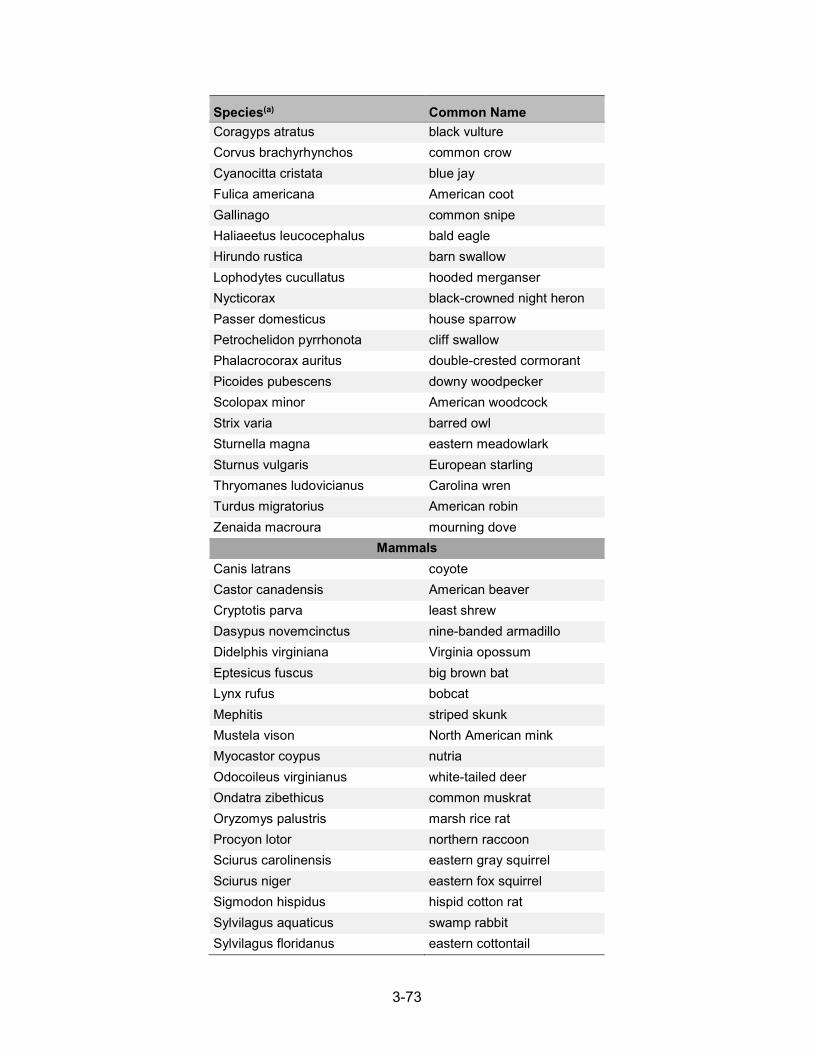
3-73
Species(a) Common Name Coragyps atratus black vulture Corvus brachyrhynchos common crow Cyanocitta cristata blue jay Fulica americana American coot Gallinago common snipe Haliaeetus leucocephalus bald eagle Hirundo rustica barn swallow Lophodytes cucullatus hooded merganser Nycticorax black-crowned night heron Passer domesticus house sparrow Petrochelidon pyrrhonota cliff swallow Phalacrocorax auritus double-crested cormorant Picoides pubescens downy woodpecker Scolopax minor American woodcock Strix varia barred owl Sturnella magna eastern meadowlark Sturnus vulgaris European starling Thryomanes ludovicianus Carolina wren Turdus migratorius American robin Zenaida macroura mourning dove
Mammals Canis latrans coyote Castor canadensis American beaver Cryptotis parva least shrew Dasypus novemcinctus nine-banded armadillo Didelphis virginiana Virginia opossum Eptesicus fuscus big brown bat Lynx rufus bobcat Mephitis striped skunk Mustela vison North American mink Myocastor coypus nutria Odocoileus virginianus white-tailed deer Ondatra zibethicus common muskrat Oryzomys palustris marsh rice rat Procyon lotor northern raccoon Sciurus carolinensis eastern gray squirrel Sciurus niger eastern fox squirrel Sigmodon hispidus hispid cotton rat Sylvilagus aquaticus swamp rabbit Sylvilagus floridanus eastern cottontail

3-74
Species(a) Common Name Urocyon cinereoargenteus gray fox Vulpes red fox
Reptiles Agkistrodon contortriix southern copperhead Agkistrodon piscivorus leucostoma western cottonmouth Alligator mississippiensis American alligator Crotalus horridus canebrake rattlesnake Elaphe guttata corn snake Nerodia erythrogaster flavigaster yellow-bellied water snake Sternotherus odoratus stinkpot Thamnophis scripta elegans eastern garter snake (a) Table adapted from Entergy 2017h, Table 3.6-1.(b) With the exception of the European starling, house sparrow, northern
bobwhite, and wild turkey, all bird species listed in this table areprotected under the Migratory Bird Treaty Act of 1918, as amended(16 U.S.C. §§ 703–712).
Source: Entergy 2017h
3.6.4 Important Species and Habitats
The Louisiana Natural Heritage Program (LNHP) within the Louisiana Department of Wildlife and Fisheries (LDWF) oversees the State’s Threatened and Endangered Species Conservation Program as described in Part IV, “Threatened and Endangered Species,” of Title 56 of the Louisiana Revised Statutes. The Revised Statutes give the Louisiana Natural Heritage Program the authority to list species as State-threatened or endangered; to issue regulations necessary and advisable to provide for conservation of such species; and to prohibit the export, take, possession, sale, or transport of such species.
As part of the Threatened and Endangered Species Conservation Program, the Louisiana Natural Heritage Program maintains a database of rare, threatened, and endangered species of plants and animals and natural communities in the State. Table 3-10 identifies the plants, animals, and natural communities listed in the Louisiana Natural Heritage Program’s database as occurring in West Feliciana Parish. The table also includes habitat associations for each species. Entergy (2008a, 2017h) reports that none of the species identified in Table 3-10 have been identified as occurring on the RBS site.
The Louisiana Department of Wildlife and Fisheries also oversees Louisiana’s Natural Areas Registry Program, a voluntary program that encourages private landowners to conserve biologically unique lands. For an area to qualify for the registry, it must contain one or more of the following: habitat for native plants or animals with rare or declining populations within Louisiana, plant communities that are characteristic of the native vegetation of Louisiana, or outstanding natural features such as old growth forests or wetlands. By joining the registry, landowners commit to protect the area and its unique natural elements to the best of their abilities, notify the program representative of any threats to the area or the plants and animals within, and notify the program representative of an intent to sell or transfer ownership of the area (LDWF 2017c). In 2004, the Louisiana Department of Wildlife and Fisheries designated

3-75
the River Bend Natural Area, a 550-ac (223-ha) portion of the RBS site, as a Louisiana Natural Area because it contains very species-rich, upland hardwood forests (Entergy 2017h, 2017c; LDWF 2006) (see Figure 3-21). The site was eligible for registry as a natural area due to its unusual topography, which includes deep, fertile, wind-blown loessial deposits that have eroded over thousands of years to form a characteristic highly dissected landscape of high, narrow ridges, steep slopes, deep ravines, and intermittent-to-permanent streams (LDWF 2006). Relic populations of numerous species more common in the Appalachian Mountains, Ozarks, and areas northward may still occur in the natural area and in the broader Tunica Hills region today (LDWF 2006).
Table 3-10. Important Terrestrial Species and Habitats in West Feliciana Parish
Species(a) Common Name State Rank(b)
Global Rank(c)
State Status(d)
Federal Status(e) Habitat Associations
Important Animals
Brachycerus flavus yellow brachycercus mayfly
S2 G4 — — Clear creeks and medium rivers.
Haliaeetus leucocephalus
bald eagle S3 G5 SE FD Cypress trees near open water; open lakes and rivers.
Helmitheros vermivorus
worm-eating warbler S3 G5 — — Steep slopes of eastern deciduous forests with dense understories.
Mustela frenata long-tail weasel S3 G5 — — Brushland, and open areas such as woodlands, marshes, swamps, field edges and riparian grasslands near water.
Plethodon websteri Webster's salamander S1 G3 SP — Moist hardwood forest bordering rocky streams.
Seiurus motacilla Louisiana waterthrush S3–S4 G5 — — Open-banked, fast- or slow-moving streams with steep to moderate gradients, in forested watersheds or swampy areas with standing water.
Setophaga ruticilla American redstart S3 G5 — — Open wooded habitats dominated by deciduous trees.
Sorex longirostris southeastern shrew S2 G5 — — Moist or wet areas in damp forests or bordering swamps, marshes and rivers as well as upland shrubby or wooded habitats.
Spilogale putorius eastern spotted skunk S1 G5 — — Forested and well covered brushy areas and prairie outcrops.

3-76
Species(a) Common Name State Rank(b)
Global Rank(c)
State Status(d)
Federal Status(e) Habitat Associations
Ursus americanus luteolus
Louisiana black bear S3 G5 ST FD Large tracts of heavily wooded bottomland hardwoods and swamps.
Important Plants Actaea pachypoda white baneberry S2 G5 — — Partially shaded areas of
deciduous and mixed forests with dense thickets and well-drained, acidic soil.
Asarum canadense Canada wild-ginger S1 G5 — — Shaded areas of deciduous forest with rich, mesic soils.
Celastrus scandens climbing bittersweet S1 G5 — — Full sun to shade in rich, mesic soils of southern mesophytic forests, salt dome hardwood forests, and high sites in bottomland hardwoods.
Chamaelirium luteum
fairy wand S2–S3 G5 — — Shady sesic acidic sandy loam soils in hardwood slope and mixed hardwood-loblolly pine forests.
Circaea lutetiana spp. canadensis
Enchanter's nightshade
S2 G5 — — Areas of dappled sun to medium shade, mesic conditions, and rich loamy soil with abundant organic matter.
Deparia acrostichoides
silvery glade fern S2 G5 — — Shaded, moist areas of mesic wooded valleys, rocky canyon bottoms, and wooded ravine slopes.
Diplazium pycnocarpon
glade fern S2 G5 — — Shady, rich wooded ravines.
Dryopteris ludoviciana
south shield wood-fern S2 G4 — — Shady bottomland hardwood forests, rich ravines in loess hills, prairie terrace loess flatwoods, and forested seeps.
Frasera caroliniensis
Carolina gentian SH G5 — — Upland savannas, upland woodlands, wooded slopes, limestone and sandstone glades, woodland openings, and small meadows in upland wooded areas.
Heuchera americana
American alumroot S2 G5 — — Partial shade to full sun in rich woods and rocky outcrops.

3-77
Species(a) Common Name State Rank(b)
Global Rank(c)
State Status(d)
Federal Status(e) Habitat Associations
Hexalectris spicata crested coral-root S2 G5 — — Partial shade in mesic to dry soils of forests over sandstone or limestone substrate.
Magnolia pyramidata
pyramid magnolia S2 G4 — — Partial shade in dense, rich wooded bluffs and ravines on the edges of water bodies and swamps.
Pachysandra procumbens
Allegheny-spurge S2 G4–G5 — — Shady areas in rich woods with limestone substrate.
Panax quinquefolius
American ginseng S1 G3–G4 — — Cool areas of rich woods with alkaline loessial deposits.
Physalis carpenteri Carpenter's ground-cherry
S1 G3 — — Loess bluffs of the Tunica Hills region.
Platythelys querceticola
low erythrodes S1 G3–G5 — — Shady areas of mesic hardwood forests, floodplains, and swamps.
Ponthieva racemosa
shadow-witch orchid S2 G4–G5 — — Shady swamps and moist woodlands.
Saxifraga virginiensis
Virginia saxifrage SH G5 — — Sunny cliffs, ledges, and rocky talus areas and slopes.
Schisandra glabra scarlet woodbine S3 G3 — — Shady areas of southern mesophytic forests, hardwood slope forests, and mixed hardwood-loblolly pine forests.
Silphium perforliatum
Carpenter's square S1 G5 — — Sunny areas of wet to mesic woods and prairies.
Triphora trianthophora
nodding pogonia S2 G3–G4 — — Rich humus, leaf mold, and rotten logs of hardwood and coniferous forests, rich woods along streams, edges of swamps, floodplain forests, and mountain slopes.
Important Natural Communities batture S3 G4–G5 — — Slopes between natural
levee crests and major streams or rivers with semi-permanently inundated soils.

3-78
Species(a) Common Name State Rank(b)
Global Rank(c)
State Status(d)
Federal Status(e) Habitat Associations
cypress-tupelo swamp
S4 G3–G5 — — In regularly to permanently
inundated areas along rivers and streams and in blackswamp depressions and swales.
hackberry-American elm-green ash forest
S4 G4–G5 — — Along upper floodplain terraces of large and small alluvial rivers; on ridges, flats, and sloughs; and in upland ravine bottoms.
overcup oak-water hickory forest
S4 G4 — — On the edges of swamps
and bayous in poorly drained areas and within silty-clay flats in first bottoms and terraces of larger streams and rivers.
small stream forest S2 G3
Along small river and large creeks with silt-loam soils and brief periods of seasonal flooding.
southern mesophytic forest
S2 G1–G2 — — In the Tunica Hills region of Louisiana in areas with deep, fertile, alkaline loessial deposits and streams with intermittent to continuous flow.
(a) Entergy (2008a, 2017h) reports that none of these species were recorded as present on the RBS site during surveys performed in conjunction with the proposed River Bend Station, Unit 3 combined license application. (b) S1 = critically imperiled in Louisiana because of extreme rarity (5 or fewer known extant populations); S2 = imperiled in Louisiana because of rarity (6 to 20 known extant populations); S3 = rare and local throughout the state or found locally in a restricted region of the state (21 to 100 known extant populations); S4 = apparently secure in Louisiana with many occurrences (100 to 1000 known extant populations); SH = historical occurrence in Louisiana but no recent records verified within the last 20 years; a range in state rank (e.g., S2-S3) indicates the limits of uncertainty. (c) G1 = critically imperiled globally because of extreme rarity (5 or fewer known extant populations); G2 = imperiled globally because of rarity (6 to 20 known extant populations); G3 = either very rare and local throughout its range or found locally in a restricted (21 to 100 known extant populations); G4 = apparently secure globally, though it may be quite rare in parts of its range, especially at the periphery (100 to 1000 known extant populations); a range in global rank (e.g., G3–G5) indicates the limits of uncertainty. (d) SE = State-endangered, taking or harassment of these species is a violation of State law; ST = State-threatened, taking or harassment of these species is a violation of State law; SP = possession of species prohibited; — = not State-listed. (e) FE = Federally endangered under the Endangered Species Act of 1973, as amended (ESA); FT = Federally threatened under the ESA; FD = Previously listed, but delisted from the ESA; — = not Federally listed under the ESA.
Sources: Entergy 2008a, 2017h; FWS 2017a; LNHP 2017
3.6.5 Invasive and Non-Native Species
The University of Georgia Center for Invasive Species and Ecosystem Health reports 209 invasive species in West Feliciana Parish (UGA 2016). Entergy (2017h) describes the prominent terrestrial invasive species on or near the RBS site to likely include broomsedge bluestem (Andropogon virginicus), Chinese privet (Ligustrum sinense), bigleaf periwinkle (Vinca major), eastern saltbush (Baccharis halimifolia), Japanese honeysuckle (Lonicera japonica),

3-79
kudzu (Pueraria montana var. lobata), McCartney rose (Rosa bracteata), poison ivy (Toxicodendron radicans), sweet joe-pye weed (Eutrochium purpureum), and feral hogs (Sus scrofa). Entergy (2017h) has not implemented any management programs or procedures specifically related to invasive species because no invasive species have interfered with plant operation.
Source: Entergy 2017h, Figure 3.1-3
Figure 3-21. RBS Site Natural Areas
3-80
3.7 Aquatic Resources
The aquatic communities of interest for the RBS site occur in the Lower Mississippi River. The Mississippi River makes up the southwest boundary of the RBS site, and it supplies makeup water to RBS’s cooling system. The Mississippi River also receives the plant’s cooling system blowdown. Earlier in this chapter, Section 3.1.3 describes the cooling system in detail, and Section 3.5.1 describes the surface water characteristics of the Mississippi River and other onsite waterbodies.
The sections below describe the environmental changes within the Lower Mississippi River, the aquatic habitats and species within the Lower Mississippi River near RBS, the aquatic habitats and species of other onsite aquatic resources, State-listed aquatic species near RBS, and non-native species that occur near RBS.
3.7.1 Environmental Changes in the Lower Mississippi River
The Mississippi River has historically fluctuated between a meandering river that erodes sediments on the river bank to create curves or bends, to a braided river that consists of several river channels separated by small islands. During the most recent glacial retreat, the Lower Mississippi River returned to a meandering river. A rivers meanders as it erodes the outer bank and then deposits the sediment on the inner bank, which results in a diverse set of habitats such as extensive floodplains, deep backwaters, oxbow lakes, and other shallow-water habitats. These waterbody features often provide high-quality habitats for aquatic biota (animal and plant life) due to the structural complexity and low flows that support spawning, feeding, and refuge from large predators. These diverse habitats support high biological richness with an abundance of fish and invertebrate species that occur within the Mississippi River. (Baker et al. 1991)
The Mississippi River has a long history of humans using the river as a mode of transportation and subsequently modifying much of the high-quality, shallow-water habitats associated with a meandering river (Baker et al. 1991). For example, beginning in the 1800s, human modifications to allow for ship traffic along the Mississippi River and to minimize flooding events changed the relative abundance and types of habitats, access to fish migratory routes, flow patterns, and river channelization. For over 300 years, humans have built levees along the Mississippi River to control flooding. By 1844, levees were nearly continuous along the Mississippi River up to its confluence with the Arkansas River (Baker et al. 1991). As of 2005, nearly 3,000 km (1,864 mi) of levees lined the Lower Mississippi River, and an additional 1,000 km (621 mi) of levees lined its tributaries (Brown et al. 2005). Levees decrease the frequency of flooding events, during which aquatic biota can move between the Mississippi River and floodplain habitats. The flow of aquatic resources from floodplain habitats into the river is one reason that the Lower Mississippi is so rich in species diversity.
Beginning in 1824, the U.S. Government removed snags, such as trees or tree roots, from the river. Snags provide natural habitat for invertebrates that require a firm attachment site and offer fish and other aquatic biota places to hide. In addition, revetments, which are fortifications built to prevent erosion and river meandering, have increased the availability of hard-surface habitats but decreased the availability of soft-surface river bank habitats. Approximately 50 percent of the banks of the Lower Mississippi River are covered by revetments, such as timber, wooden or wire fences, rocks, and tires (Baker et al. 1991; Brown et al. 2005). However, such revetments do not provide as high a quality structure for aquatic organisms as naturally occurring tree roots.

3-81
In addition, the U.S. Army Corps of Engineers (USACE) has artificially created cutoffs that shortened the length of the river by cutting across a point bar or neck of a meander. Baker et al. (1991) estimates that artificially created cutoffs have shortened the length of the Lower Mississippi River by 25 to 30 percent, or approximately 500 km (310 mi). Cutoffs can also increase the river speed and erosion of river banks (Baker et al. 1991).
In addition to physical changes, runoff from over 40 percent of the conterminous 48 States drains into the Mississippi River. Land use changes over time have increased the concentration of industrial, chemical, and sediment inputs into the river. Farming practices currently include the use of fertilizers, pesticides, and herbicides, which wash into the Mississippi River, especially after large rain events (Brown et al. 2005). Plowed fields, as compared to forested areas, also increase the amount of sediments entering the Mississippi River.
Currently, the USACE continues to dredge, install river bank revetments and levees, and regulate upstream reservoirs to minimize the historical movements of the river and create a relatively stable channel.
3.7.2 Lower Mississippi River
The Lower Mississippi River can be divided into two distinct sections: (1) the upper section ranging from Cairo, IL to Baton Rouge, LA and (2) the lower section from Baton Rouge, LA to the Gulf of Mexico. The lower section of the Lower Mississippi River has been more heavily modified by human activity. For example, a 12-m (39-ft) channel is maintained in the lower section to promote navigation, levees occur along both sides of the rivers, revetments have replaced natural habitats along much of the riverside, large meander loops are infrequent, and floodplains are rare (Baker et al. 1991). Similarly, deep channels, which do not provide high-quality habitat, comprise 85 percent of the lower section’s aquatic habitat as compared to 55 percent of the upper section’s aquatic habitat (Baker et al. 1991). The aquatic habitats and biota in the Lower Mississippi River near RBS are discussed below.
3.7.2.1 Aquatic Habitats near RBS
Four types of aquatic habitats occur near RBS: the channel, revetments, natural steep river banks, and seasonally inundated floodplains along the river levee.
The Channel
The channel near RBS is characterized by deep water, high current speeds, high levels of suspended solids, high turbidity, high levels of nutrients, low-algal biomass, and uniform bottom habitat consisting of sand and/or gravel (Baker et al. 1991; Entergy 2008a, 2017h). The channel typically supports the lowest amount of biological richness because of the lack of structure to hide from predators and high levels of suspended solids that prevents primary producers at the base of the food chain from having access to sunlight in order to make food, develop, and grow. In addition, high current speeds limit biological productivity because mobile organisms must expend additional energy to move, hover feeding is not possible, and sessile organisms (those that are attached to a base and generally immobile) may not be able to stay attached to hard surfaces. Furthermore, these conditions do not provide suitable habitat for spawning.
The intake structure and barge slip are located within a man-made, shallow-cut embayment that is most similar to a lotic sandbar (a sandbar surrounded by fast moving water), or channel

3-82
habitat. The bottom substrate primarily consists of coarse sand and sandy mud. The area is regularly disturbed due to maintenance dredging and high turbidity levels, which prohibit the growth of high-quality benthic habitats such as mussel beds or submerged aquatic vegetation. (Entergy 2008a, 2017h).
Revetments
Revetments are river banks that are usually cleared and lined with human-modified materials to prevent erosion (Baker et al. 1991). Within the vicinity of RBS, revetments made of rocks and concrete structures line most of the banks on the outer bends of the river, and wings or dikes line the inside bends to prevent erosion. Near the discharge structure, riprap (rocks piled on top of one another) and small boulders line parts of the man-made embayment (Entergy 2008a). Revetments provide a hard substance that support the growth of macroinvertebrates. However, for fish, revetments provide a lower habitat quality than natural river banks because revetments lack the structure and refuges provided by fallen trees and brush typically found along river banks.
Steep River Banks
Steep river banks occur on the sides of river bends where the main channel current flows against them (Baker et al. 1991). The fast flow of the Lower Mississippi River often increases erosion along the river bank. Areas of upstream flow, or eddies, are common along the river bank and may provide an important refuge of slower-moving water for some fish species. Near RBS, fallen trees and brush, such as willow seedlings (Salix spp.) and cockleburs (Xanthium strumarium), alongside the river provide an important high-quality habitat for fish and substrate for macroinvertebrates to attach to and grow (Entergy 2008a, 2017h). Some vegetation is only covered by water intermittently, and therefore, only provides refuge during periods of flooding. The closest natural steep bank to the intake embayment is approximately 70 feet (21 meters) away. (Entergy 2008a, 2017h).
Floodplains
Floodplains are one of the most biologically important habitats in the Lower Mississippi River as the shallow water and habitat structure from trees and plants support use as spawning grounds, nursery habitats, refuges from predators, and foraging grounds. Seasonally inundated floodplains near RBS contain some areas of forested wetlands and isolated sloughs. Alligator and Grants bayous also regularly flood into the forested wetlands and isolated sloughs (Entergy 2008a).
3.7.2.2 Aquatic Communities in the Lower Mississippi River
Human activities, such as river channelization, artificial revetments, levee construction, polluted land runoff, and the influx of municipal and industrial water effluents, have degraded the quality of the aquatic habitat surrounding RBS. These modifications have resulted in poor spawning habitats, high turbidity, high concentrations of total suspended solids, high current velocities, and fluctuating water levels near RBS, and therefore, have influenced the relatively low biological productivity, as described below (Baker et al. 1991, Entergy 2008a, 2017h).

3-83
Plankton
Plankton are small organisms that float or drift in rivers and other water bodies. Plankton are a primary food source for many fish, and other animals, and consist of bacteria, protozoans, certain algae, tiny crustaceans such as copepods, and many other organisms. High turbidity (small suspended particles that make the water murky) and fluctuating water levels near RBS limit primary production for plankton that are dependent upon light for growth, such as phytoplankton and periphyton (GSUC 1984a, Entergy 2008a, 2017h). Low levels of primary production may also limit the growth of zooplankton and other organisms that feed upon phytoplankton and periphyton. Therefore, the Lower Mississippi River is considered a detritus-based system, which is typical for large rivers.
Phytoplankton. Phytoplankton are microscopic floating photosynthetic organisms that form the base of aquatic food webs by producing biomass from inorganic compounds and sunlight. As primary producers, phytoplankton play key ecosystem roles in the distribution, transfer, and recycling of nutrients and minerals.
Studies conducted in the 1970s before RBS began operations documented extremely low concentrations of phytoplankton near RBS, likely due to the high suspended sediment load which blocks light from entering the water and prevents photosynthesis, and therefore growth, of phytoplankton (GSUC 1984a, Entergy 2008a). Phytoplankton density was highest in areas of slower river currents, such as along the western riverbank, as compared to the main channel (Entergy 2008a). Diatoms dominated collections (GSUC 1984a, Entergy 2008a).
Periphyton. Periphyton includes a mixture of algae, cyanobacteria (in the past, often called blue-green algae), heterotrophic microbes, other small organisms, and detritus that attach to submerged surfaces. Like phytoplankton, periphyton are primary producers and provide a source of nutrients to many bottom-feeding organisms.
Preoperational studies in the 1970s documented more than 115 taxa of planktonic algae (NRC 1985). Cynobacteria were most dominant during summer months (GSUC 1984a, Entergy 2008a).
Zooplankton. Zooplankton are small animals that float, drift, or weakly swim in the water column. They include small invertebrates (e.g. copepods) and ichthyoplankton (fish eggs and larvae). Zooplankton are important trophic links between primary producers (e.g., phytoplankton and periphyton) and carnivores (e.g., fish). In the Lower Mississippi River, most fish spawn in backwaters with slower currents, and few spawn within the rapidly flowing channel portions of the river.
Preoperational studies from 1974–1977 documented 140 invertebrate taxa and 45 species of larval fish near RBS (GSUC 1984a, Entergy 2008a). For invertebrates, rotifers (a phylum of mostly microscopic, wheel-shaped animals) dominated collections from the main channel and river banks, whereas copepods, water fleas, and hydroid fragments (fragments of class Hydrozoa animals in their hydroid life stage) dominated collections near the intake and discharge structures (GSUC 1984a, Entergy 2008a). In general, rotifers dominated most collections and organism density was higher along the shoreline as compared to the main channel.
For larval fish, preoperational studies showed that species diversity peaked in late spring and early summer, which corresponds to the spawning period for common fish within the Lower

3-84
Mississippi River. The most commonly collected larval fish species included freshwater drum (Aplodinotus grunniens), gizzard shad (Dorosoma cepedianum), and threadfin shad (D. petenense) (GSUC 1984a, Entergy 2008a). Entergy (2017h) suggested that most zooplankton originated in backwaters or shallow habitats and then drifted towards the RBS site. Similar to other types of taxa, larval fish were denser along the river banks as compared to the river channel.
Fish
Between 100 to 200 fish species are known to occur within the Lower Mississippi River (Baker et al. 1991). Prior to RBS operations, Gulf States Utilities Company documented 88 fish species in surveys conducted near RBS from 1972–1977 (GSUC 1984a, Entergy 2008a). Entergy has not conducted fish surveys near RBS since operations began. In order to gather additional data regarding fish populations near RBS since 1977, the NRC staff reviewed survey data that was recorded in the online database, FishNet (2014). This database is a collaborative effort by natural history museums and biodiversity institutions to compile fish survey data. The database included fish surveys within the vicinity of RBS from 1973, 1976, 1978, 1979, 2000, and 2001. The NRC staff notes that the surveys used different methodologies, sampling locations, sampling protocols, and equipment. Therefore, additional species may occur near RBS that have not been captured in a survey due to the various survey methods and sampling regimes. Table 3-11 describes fish species that have been observed during two time periods: 1970–1980 and 2000–2017.
The fish survey data indicate that a variety of fish occur near RBS, with species diversity highest during spring and summer, especially during high-flow periods. Flooding events likely provide a hydrological connection for species that occur in backwaters and floodplains to migrate into the Mississippi River. Common fish species near RBS include gizzard shad, threadfin shad, blacktail shiner (Cyprinella venusta), river shiner (Notropis blennius), white crappie (Pomoxis annularis), river carpsucker (Carpiodes carpio), goldeye (Hiodon alosoides), common carp (Cyprinus carpio), Mississippi silverside (Menidia audens), inland silverside (Menidia beryllina), and silver chub (Macrhybopsis storeriana) (Table 3-11). Common commercially important fish species include blue catfish (Ictalurus furcatus), channel catfish (Ictalurus punctatus), flathead catfish (Pylodictis olivaris), bigmouth buffalo (Ictiobus cyprinellus), smallmouth buffalo (Ictiobus bubalus), and freshwater drum (LDWF 2017a; Entergy 2008a, 2017g).
Table 3-11. Historical and Recent Fish Species Recorded near River Bend Station
Species Common Name Survey Year(s)
1970–1980(a) 2000–2017(b) Acipenseridae Scaphirhynchus platorynchus shovelnose sturgeon X X Amiidae Amia calva bowfin X Anguillidae Anguilla rostrata American eel X Atherinidae Labidesthes sicculus brook silverside X Menidia audens Mississippi silverside X

3-85
Species Common Name Survey Year(s)
1970–1980(a) 2000–2017(b) Menidia beryllina inland silverside X Menidia peninsulae tidewater silverside X X Catostomidae Carpiodes carpio river carpsucker X X Ictiobus bubalus smallmouth buffalo X Centrarchidae Lepomis cyanellus green sunfish X Lepomis humilis orangespotted sunfish X X Lepomis macrochirus bluegill X X Lepomis megalotis longear sunfish X X Micropterus punctulatus spotted bass X Micropterus salmoides largemouth bass X X Pomoxis annularis white crappie X X Pomoxis nigromaculatus black crappie X X Clupeidae Alosa chrysochloris skipjack herring X Dorosoma cepedianum gizzard shad X X Dorosoma petenense threadfin shad X X Cyprinidae
Cyprinella lutrensis red shiner X X Cyprinella venusta blacktail shiner X X Cyprinus carpio common carp X X Hybognathus argyritis Western silvery minnow X Hybognathus nuchalis Mississippi silvery
minnow X X
Luxilus chrysocephalus striped shiner X Macrhybopsis aestivalis speckled chub X Macrhybopsis hyostoma shoal chub X X Macrhybopsis storeriana silver chub X X Notemigonus crysoleucas golden shiner Notropis atherinoides emerald shiner X X Notropis blennius river shiner X X Notropis buchanani ghost shiner X Notropis longirostris longnose shiner X Notropis lutrensis red shiner X Notropis shumardi silverband shiner X X Notropis texanus weed shiner X
Notropis volucellus mimic shiner X X Opsopoeodus emiliae pugnose minnow X Pimephales vigilax bullhead minnow X X Fundulidae Fundulus blairae lowland topminnow X

3-86
Species Common Name Survey Year(s)
1970–1980(a) 2000–2017(b) Hiodontidae Hiodon alosoides goldeye X X Hiodon tergisus mooneye X Ictaluridae Ameiurus melas black bullhead X
Ictalurus furcatus blue catfish X X Ictalurus punctatus channel catfish X X Pylodictis olivaris flatheaded catfish X
Lepisosteidae Lepisosteus oculatus spotted gar X Lepisosteus platostomus shortnose gar X Moronidae Morone chrysops white bass X X Morone mississippiensis yellow bass X X Morone saxatilis striped bass X Muglildae Mugil cephalus striped mullet X X Percidae Percina caprodes common logperch
X
Percina shuamardi river darter X Percina vigil saddleback darter X Stizostedion canadense sauger X Poeciliidae Gambusia affinis mosquitofish X X Sciaenidae Aplodinotus grunniens freshwater drum X X Syngnathidae Syngnathus scovelli Gulf pipefish X (a) GSUC 1984a FishNet 2014: Surveys conducted by the following:
• J.V. Conner, Sabins & DeMont in 1973 along bank of the Mississippi River at River Mile 263; • Suttkus, Beckham, Conner, Heath & Levine in 1976 along bank of the Mississippi River at River Mile 263.7; • R.D. Suttkus, Conner & Rohmann in 1978 along bank of the Mississippi River at River Mile 262.5; • R.D. Suttkus & Conner in 1978 and 1979 along bank of the Mississippi River at River Miles 262.6, 262.8,
263, 264, 264.8; (b) Entergy 2008a FishNet 2014: Surveys conducted by the following:
• Bart, Rios, Coste & Galloway in 2000 at St. Francisville on the west bank across from boat launch and on the east bank across from an industrial plant;
• Rios, Todaro & Coste in 2000 and 2001 at St. Francisville on the west bank across from boat launch and the east bank across from an industrial plant,
• Todaro, Rios, Coste, & Marik in 2001 at St. Francisville on the east bank across from an industrial plant
Sources: GSUC 1984a; Entergy 2008a; FishNet 2014
3-87
Invertebrates
Preoperational studies identified more than 70 taxa of benthic (bottom dwelling) invertebrates at the RBS site (GSUC 1984a, Entergy 2008a). Density of benthic invertebrates near RBS was highest along the shoreline portions of the river where their preferred habitat (e.g., soft organic mud and low flows) often occurs. Density of benthic invertebrates was lowest along the channel where fast currents, scouring, and shifting bottom surfaces prevent sessile macroinvertebrates from attaching to hard surfaces in order to grow. Similarly, density was generally lowest in the spring, when flows were highest and mostly likely to disturb bottom habitats, causing some organisms to detach from hard surfaces or become exposed or smothered.
At least 200 macroinvertebrate species occur in the Lower Mississippi River (Harrison and Morse 2012). In preoperational surveys, the most common benthic taxa near RBS were aquatic worms (Oligochaetes) and mayfly larvae: oligochaetes or worms comprised 58 percent of the total number of organisms in benthic samples and mayfly larvae comprised 30 percent of the benthic samples near RBS (GSUC 1984a, Entergy 2008a). The three most common genera of macroinvertebrates included river shrimp (Macrobrachium sp.), crayfish (Procambarus spp.), and grass shrimp (Palaemonetes spp.).
Ohio River shrimp (Macrobrachium ohione) commonly occur near RBS. This species is often used as bait for recreational fisheries and is an important prey species for many larger, predatory fish in the Lower Mississippi River (Entergy 2008a, 2017g). Ohio River shrimp often depend upon submerged aquatic vegetation or other submerged structures as habitat to provide refuge from predators.
3.7.3 Other Onsite Aquatic Resources
3.7.3.1 Alligator Bayou
Alligator Bayou is a small intermittent stream that flows through the western portion of the RBS property. The Mississippi River and Thompson Creek periodically flood into Alligator Bayou, providing the bayou with additional water flow and nutrients. Productivity, or the density and diversity of aquatic fish and invertebrates, peaks in the bayou after flooding events. Alligator Bayou is an important habitat for aquatic fish and invertebrates due to the availability of slower currents and natural substrates. For example, woody debris (e.g., woody stumps and roots) provide a source of refuge for mobile organisms to hide and a hard surface for some immobile organisms to attach and grow. Similarly, dense stands of rooted, aquatic vegetation grow in the bayou and are an important refuge for juvenile salamanders, fish, crayfish, and a variety of other aquatic species. Alligator Bayou is also an important spawning ground and nursery area for fish eggs and larvae (Entergy 2008a).
Gulf States Utilities Company identified more than 150 taxa of invertebrates and 64 species of fish in Alligator Bayou from 1972 through 1977 (GSUC 1984a). Dominant benthic organisms in the bayou included aquatic oligochaetes and dipteran (mainly midge and phantom midge) larvae. Crayfish were the most abundant macrocrustacean and are an important prey item for reptiles, amphibians, fish, birds, and mammals. (GSUC 1984a; Entergy 2008a)
3.7.3.2 Grants Bayou
Grants Bayou is an intermittent stream and a tributary of Alligator Bayou. Flows tend to be continuous in the winter and spring, but aquatic life is limited due to the intermittent flow and

3-88
lack of ability to maintain populations during dry periods. Historical studies documented 23 fish species within Grants Bayou. Studies conducted before RBS began operations indicated that the most common species included gizzard shad, shiners, minnows, mosquitofish, sunfish, bluegill, and largemouth bass (GSUC 1984a; Entergy 2008a).
3.7.3.3 Onsite Ponds
In addition to these streams, 19 small ponds exist on the RBS site. Three of the ponds naturally occurred on site prior to RBS construction, although the rest were man made. Aquatic biota within the ponds are limited and dominated by submerged, emergent, and floating plants.
3.7.4 State-Ranked Species
Four aquatic State-ranked species occur within West Feliciana Parish (Table 3-12; LDFW 2017b). Louisiana’s Natural Heritage Program ranked three of the species, central stoneroller (Campostoma anomalum), bluntface shiner (Cyprinella camura), and rainbow darter Etheostoma caeruleum, as “S2,” which indicates that these species are imperiled in Louisiana due to rarity (6 to 20 known extant populations) or because these species are very vulnerable to extirpation. State-ranked species are not afforded protection under Title 56 of the Louisiana Revised Statutes or relevant rules and regulations adopted by the Louisiana Wildlife and Fisheries Commission and the Secretary of the Department of Wildlife and Fisheries (LDFW 2017b). Pallid sturgeon (Scaphirhynchus albus) is a Federally listed endangered species and is discussed further in Section 3.8.
Table 3-12. State-Ranked and Protected Species in West Feliciana Parish
Species Common Name(a) Designation
State Rank State Status Federal Status Campostoma anomalum central stoneroller S2
Cyprinella camura bluntface shiner S2 Etheostoma caeruleum rainbow darter S2
Scaphirhynchus albus pallid sturgeon S1 E E
S2= imperiled in Louisiana because of rarity (6 to 20 known extant populations) or because of some factor(s) making it very vulnerable to extirpation.
S1= critically imperiled in Louisiana because of extreme rarity (5 or fewer known extant populations) or because of some factor(s) making it especially vulnerable to extirpation.
E= Endangered
Source: LDWF 2017b, 2017d
Central stoneroller is a relatively widespread freshwater fish that occurs in rivers and streams with riffles, runs, or pools with gravel or rubble substrates. This species has a large range within central and eastern North America, including the Great Lakes basin, Mississippi River watershed, and the Hudson Bay rivershed. Although this species is considered imperiled in Louisiana, NatureServe (2016) did not identify any major threats to populations within North America. Central stoneroller is often used as a bait fish and it has been introduced and is considered invasive in parts of Connecticut, New York, and New Mexico (USGS 2017a). Adult central stoneroller fish consume a relatively large amount of prey items, including detritus, filamentous algae, diatoms, and small aquatic insects (Gagnon 2011).
3-89
Bluntface shiner is a relatively widespread freshwater fish that occurs in clear streams with moderate-to-fast currents over sand or gravel substrates. This species has a large range within central and eastern North America, including the Great Lakes, Mississippi River, and the Hudson River basins. Although this species is considered imperiled in Louisiana, NatureServe (2016) does not identify any major threats to populations within North America. Prey items include detritus, diatoms, inorganic material, and green and blue-green algae that are often found on the surfaces of rocks on the river or stream bed (NatureServe 2016).
Rainbow darter is a relatively widespread freshwater fish that occurs in creeks, streams, and small-to-medium rivers with riffles and gravel or rubble substrates. This species has a large range within central and eastern North America, including the Great Lakes and Mississippi River basins. Although this species is considered imperiled in Louisiana, NatureServe (2016) does not identify any major threats to populations within North America. Rainbow darter is considered invasive in parts of the Hudson River drainage area in New York (USGS 2017d). Adults and juveniles prey on aquatic insects, especially aquatic insect larvae (USGS 2017d; NatureServe 2016).
Entergy (2017h; 2008a) was not aware of any known occurrences of State-listed or State-ranked fish or mussel species at or near the RBS site. The NRC staff reviewed the Fishnet database, which as described above, is a collaborative effort by natural history museums and biodiversity institutions to compile fish survey data. The NRC did not identify any known occurrence of State-listed or State-ranked fish species on or near the RBS site and the adjacent portion of the Mississippi River (Fishnet 2014).
3.7.5 Non-Native and Nuisance Species
Several species of aquatic plants, fish, and invertebrates have been introduced within the Lower Mississippi River. Many of these species become an ecological concern if they outcompete native species for space, prey, or other limited resources. Water hyacinth (Eichhornia crassipes) are invasive aquatic plants that grow rapidly on the surface of the Mississippi River, especially in backwater areas (USGS 2017c). These plants can outcompete native species by fundamentally changing water quality parameters and habitat structure as they reduce available space on the surface of the river and reduce the available oxygen and light levels for native species within the Mississippi River (Toft et al. 2003; McFarland et al. 2004). These physical effects can lead to a decline in oxygen and light-sensitive species, as well as trophic-level cascades where by the decline of a predator may increase the population of its prey or vice versa. For example, Toft et al. (2003) documented trophic level changes after the introduction of water hyacinth whereby predators of oxygen and light-sensitive species decreased and prey of oxygen and light-sensitive species increased.
Common carp, which come from coastal areas of the Caspian and Aral Seas, inhabit the Mississippi River near RBS (Entergy 2017h; USGS 2017b). Common carp tend to grow quickly and outcompete native fish species in consuming prey items such as aquatic plants, plankton, and benthic invertebrates. Common carp also degrade water-quality conditions by increasing turbidity and uprooting submerged aquatic vegetation during active feeding sessions (USGS 2017b).
In addition to fish, non-native invertebrate species have been introduced and have established substantial populations within the Mississippi River. Asian clams (Corbicula manilensis) and zebra mussels (Dreissena polymorpha) occur near RBS (Entergy 2008a). Asian clams are native to western Asia, parts of Africa, and the Mediterranean. Entergy (2008a; 2017h) has

3-90
documented a limited number of Asian clams near RBS. Zebra mussels are native to the Black and Caspian seas and were introduced into the Great Lakes within the ballast water of freighters around 1988. Since that time, zebra mussels have spread throughout the Great Lakes and Mississippi River. Zebra mussels attach to hard surfaces in order to grow. When attached to underwater piping or other structures related to the intake system, these organisms can cause biofouling. Due to the regular occurrence of zebra mussels near RBS, Entergy (2008a; 2017h) has implemented a zebra mussel monitoring and control program that includes inspecting and/or sampling adult populations near the intake, and cleaning the intake screens and adjacent piping when necessary.
3.8 Special Status Species and Habitats
This section addresses species and habitats that are federally protected under the Endangered Species Act of 1973 (16 U.S.C. § 1531 et seq.) (ESA) and the Magnuson–Stevens Fishery Conservation and Management Reauthorization Act, as amended (16 U.S.C. §§ 1801–1884) (MSA). The NRC has direct responsibilities under the Endangered Species Act and Magnuson–Stevens prior to taking a Federal action such as the proposed RBS license renewal. The terrestrial and aquatic resource sections of this report (Sections 3.6 and 3.7, respectively) discuss species and habitats protected by other Federal acts and the State of Louisiana under which the NRC does not have direct responsibilities.
3.8.1 Species and Habitats Protected Under the Endangered Species Act
The U.S. Fish and Wildlife Service and the National Marine Fisheries Service jointly administer the Endangered Species Act. The U.S. Fish and Wildlife Service manages the protection of, and recovery effort for, listed terrestrial and freshwater species, and the National Marine Fisheries Service manages the protection of and recovery effort for listed marine and anadromous species. This section describes the action area and considers separately those species that could occur in the action area under the jurisdictions of each Service.
3.8.1.1 Action Area
The implementing regulations for Section 7(a)(2) of the Endangered Species Act define “action area” as all areas affected directly or indirectly by the Federal action and not merely the immediate area involved in the action (50 CFR 402.02, “Definitions”). The action area effectively bounds the analysis of federally listed species and critical habitats because only species and habitats that occur within the action area may be affected by the Federal action.
For the purposes of the Endangered Species Act analysis in this SEIS, the NRC staff considers the action area to be the 3,342-ac (1,353-ha) RBS site and the Mississippi River from the RBS intake at Mississippi River Mile (RM) 262 downstream to the region where Outfall 001 discharges to the Mississippi River at RM 262.4. Outfall 001 continuously discharges cooling tower blowdown at an average rate of 3.88 million gallons per day (MGD) (0.17 cubic meters per second (m3/s)) (LDEQ 2017f). The action area also encompasses the relatively small area of the thermal plume. Entergy (2008a) has estimated that the Mississippi River would experience temperatures elevated above 90 °F (32 °C) over a surface area of approximately 54 ft by 5 ft (16.5 m by 1.5 m) during summer months at worst-case scenario operational conditions from the combined operation of RBS and the previously proposed River Bend Station, Unit 3 had it been built. Sections 3.2 and 3.6 describe the RBS site land use and terrestrial resources, and Section 3.7 describes aquatic resources. Section 4.7.1.3 describes the RBS thermal plume and associated Louisiana Pollutant Discharge Elimination System

3-91
(LPDES) permit limitations on thermal effluent in more detail. Section 3.1.3 describes the RBS intake and discharge, and Section 3.5.1 describes the characteristics of the Mississippi River within the vicinity of RBS.
The NRC staff recognizes that while the action area is stationary, federally listed species can move in and out of the action area. For instance, a migratory fish species could occur in the action area seasonally as it travels up or down the Mississippi River past RBS. Thus, in its analysis, the NRC staff considers not only those species known to occur directly within the action area, but those species that may passively or actively move into the action area. The staff then considers whether the life history of each species makes the species likely to move into the action area where it could be affected by the proposed RBS license renewal.
The following sections first discuss species under U.S. Fish and Wildlife Service’s jurisdiction followed by those under the National Marine Fisheries Service’s jurisdiction.
3.8.1.2 Species and Habitats Under U.S. Fish and Wildlife Service’s Jurisdiction
The NRC staff used U.S. Fish and Wildlife Service’s Environmental Conservation Online System (ECOS) Information for Planning and Conservation (IPaC) tool to determine species that may be present in the RBS action area. The ECOS IPaC tool identified one federally listed species under U.S. Fish and Wildlife Service’s (2017a) jurisdiction as potentially occurring in the action area: the pallid sturgeon (Scaphirhynchus albus). No proposed species, candidate species, or proposed or designated critical habitat occurs within the action area (FWS 2017a).
Pallid Sturgeon (Scaphirhynchus albus)
On September 6, 1990, U.S. Fish and Wildlife Service listed the pallid sturgeon as endangered wherever found (55 FR 36641). The U.S. Fish and Wildlife Service has not designated critical habitat for the species. Overfishing, curtailment of range, habitat destruction and modification, altered flow regimes, water quality issues, and lack of recruitment are the primary factors that have contributed to this species’ decline (55 FR 36641; FWS 2014c). Unless otherwise noted, information about this species is derived from the U.S. Fish and Wildlife Service’s (2014c) revised recovery plan.
The pallid sturgeon is a benthic, riverine fish with a flattened shovel-shaped snout and a long, slender, and armored peduncle (the tapered portion of the body that terminates at the tail). Adults can reach lengths of 1.8 m (6 ft). The species is similar in appearance to the more common shovelnose sturgeon (Scaphirhynchus platorynchus), which is federally listed as threatened due its similarity of appearance to the pallid sturgeon.
The pallid sturgeon is native to the Mississippi River Basin, including the Mississippi River, Missouri River, and their major tributaries (i.e., the Platte, Yellowstone, and Atchafalaya Rivers). Historically, the range of the species encompassed about 3,515 continuous river miles in these rivers and its tributaries within Montana, North Dakota, South Dakota, Nebraska, Iowa, Kansas, Missouri, Kentucky, Tennessee, Arkansas, Louisiana, and Mississippi. The present known range spans the length of the historical range but consists of disconnected reaches of these rivers as a result of damming and other obstructions to fish passage.
Pallid sturgeon can reach ages of 60 years or more. Females reach maturity at 15 to 20 years, and males reach maturity at approximately 5 years. Females spawn at intervals of every 2 to 3 years. Mature females in the upper reaches of the Missouri River produce 150,000 to

3-92
170,000 eggs, while females in the southern extent of the range typically produce significantly fewer eggs (43,000 to 58,000 eggs). Females spawn adjacent to or over coarse substrate such as boulder, gravel, or cobble or in bedrock within deeper water with relatively fast, converging flows. Incubation is approximately 5 to 7 days, and newly hatched larvae are pelagic and drift downstream in currents for 11 to 13 days.
Habitat requirements for pallid sturgeon larvae and young-of-the-year are unknown due to low populations of spawning adults and poor recruitment across the species’ range. However, requirements may be similar to other Scaphirhynchus species. Scaphirhynchus young-of-the-year in the Middle Mississippi River are often found in channel border and island-side channel habitats with low velocities (1 m/s or 0.33 feet per second), moderate depths (2 to 5 m or 6.6 to 16.4 ft), and sand substrate.
Adults prefer bottom habitats of large river systems. Juveniles and adults are almost always observed in flowing portions of main channels in the upper reaches of the specie’s range, in channel border habitats, and in inundated floodplain habitats with flowing water in the more channelized Lower Mississippi River. Pallid sturgeon are most often associated with sandy and fine bottom substrates, and individuals exhibit a selection propensity for sand over mud, silt, or vegetation. Across their range, individuals have been documented in waters of varying depths and velocities that range from 0.58 m to greater than 20 m (1.9 to greater than 65 ft) and velocities of less than 1.5 m/s (less than 4.9 feet per second (fps)) and an average of 0.58 m/s to 0.88 m/s (1.9 fps to 2.9 fps). Pallid sturgeon have been collected from a variety of turbidity conditions, including highly altered systems with low turbidity and relatively natural systems with seasonally high turbidity.
In their first year of life (Age-0), pallid sturgeon eat zooplankton, larvae of mayflies (Ephemeroptera) and midge (Chironomidae), and small invertebrates. Juveniles and adults eat fish and aquatic insect larvae. As the pallid sturgeon increases in size, its diet trends toward piscivory. The majority of the pallid sturgeon’s adult diet consists of fish from the Cyprinidae, Sciaenidae, and Clupeidae families, although diet varies by season and location (Hoover et al. 2007). Pallid sturgeon in the Lower Mississippi River belong to the Coastal Plain Management Unit (CPMU), which includes the Lower Mississippi River from the confluence of the Ohio River (in Illinois) to the Gulf of Mexico in Louisiana. Prior to 1990, when the U.S. Fish and Wildlife Service listed it under the Endangered Species Act, pallid sturgeon collections on the Lower Mississippi River were rare, so the historical baseline population size is undocumented (FWS 2013). From 1990 to 2013, over 1,100 pallid sturgeon have been captured in the Coastal Plain Management Unit, of which 500 were collected from the Lower Mississippi River (FWS 2013). Although there remains no estimate of the Lower Mississippi River population size, current data suggest a substantial population when compared to fishing effort, fish species composition, and rarity of marked recaptures (FWS 2013). The International Union for Conservation of Nature and Natural Resources estimates the total population of pallid sturgeon throughout its entire range to be as few as 6,000 to as many as 21,000 individuals (Krentz 2004).
Pallid sturgeon are not currently known to spawn in the Mississippi River main channel (FWS and NMFS 2009) and, therefore, eggs and larvae would not occur in the RBS action area. Researchers have captured larval pallid sturgeon at several locations well upstream of RBS between the confluence of the Ohio River (Ohio River RM 0) and Vicksburg, MS (Mississippi River RM 437) (FWS 2013). However, the NRC staff did not identify any studies or reports that indicate the occurrence of pallid sturgeon larvae as far downstream as the RBS action area.

3-93
As reported in NRC’s (2017a) biological evaluation for the proposed license renewal of Waterford Steam Electric Station, Unit 3, juvenile pallid sturgeon were collected in the 1970s during impingement and entrainment studies associated with energy-generating facilities downstream of RBS. Between January 1976 and January 1977, one juvenile was impinged over the course of a Clean Water Act (CWA) Sections 316(a) and 316(b) impingement and entrainment study associated with Willow Glen Power Station, which lies approximately 61 RM downstream of RBS at Mississippi River RM 201 (ENSR 2007). Adult pallid sturgeon have been captured in the Mississippi River throughout Louisiana according to capture and telemetry records by the U.S. Army Engineer Research and Development Center, the U.S. Army Corps of Engineers, and the U.S. Fish and Wildlife Service (2013). The southernmost collection of pallid sturgeon has been at Mississippi River RM 95.5 (FWS 2013).
In order to gather additional data regarding the occurrence of pallid sturgeon in the RBS action area, the NRC staff reviewed survey data recorded within FishNet, a collaborative online database that includes data from natural history museums and biodiversity institutions, as described in Section 3.7.2 of this report. The database includes 78 recorded collections of pallid sturgeon in Louisiana from 1973, 1991, 1998, 2001, 2002, 2004, and 2005 (MMNS 2017). However, all collections were within Concordia, Tensas, and Madison Parishes, all of which are well upstream (roughly 150 RM or more) of RBS.
Based on the limited data available on pallid sturgeon occurrences in the Lower Mississippi River discussed above, the NRC conservatively assumes that pallid sturgeon juveniles and adults may occur in the RBS action area, although such occurrences are likely occasional to rare. Larval pallid sturgeon and eggs, however, are unlikely to occur in the RBS action area based on available capture and spawning records, all of which are well upstream of RBS.
3.8.1.3 Species and Habitats under National Marine Fisheries Service’s Jurisdiction
The NRC staff did not identify any federally listed, proposed, or candidate species or critical habitats (proposed or designated) under National Marine Fisheries Service’s jurisdiction with the potential to occur in the action area.
3.8.2 Species and Habitats Protected under the Magnuson–Stevens Act
The National Marine Fisheries Service has not designated essential fish habitat within the Mississippi River. Therefore, this section does not contain a discussion of any species or habitats protected under the Magnuson–Stevens Act.
3.9 Historic and Cultural Resources
This section describes the cultural background and the historic and cultural resources found at RBS and in the surrounding area. The National Historic Preservation Act of 1966, as amended (NHPA) (54 U.S.C. 300101 et seq.), requires Federal agencies to consider the effects of their undertakings on historic properties. Renewing the operating license of a nuclear power plant is an undertaking that could potentially affect historic properties. Historic properties are defined as resources included on, or eligible for inclusion on, the National Register of Historic Places (NRHP). The criteria for eligibility are listed in the Title 36, “Parks, Forest, and Public Property,” of the Code of Federal Regulations (36 CFR) 60.4, “Criteria for Evaluation,” and include (1) association with significant events in history, (2) association with the lives of persons

3-94
significant in the past, (3) embodiment of distinctive characteristics of type, period, or construction, and (4) sites or places that have yielded, or are likely to yield, important information.
In accordance with 36 CFR 800.8(c), “Use of the NEPA Process for Section 106 Purposes,” the NRC complies with the obligations required under National Historic Preservation Act Section 106 through its process under the National Environmental Policy Act of 1969, as amended (NEPA) (42 U.S.C. 4321 et seq.). In the context of National Historic Preservation Act, the area of potential effect for a license renewal action is the RBS site and its immediate environs. RBS is located within the 3,300-acre (1,350-ha) Entergy Louisiana, LLC property. This property constitutes the area of potential effect and consists primarily of wetlands, agriculture, and developed areas. These land areas may be impacted by maintenance and operations activities during the license renewal term. The area of potential effect may extend beyond the immediate RBS environs if Entergy’s maintenance and operations activities affect offsite historic properties. This is irrespective of land ownership or control.
In accordance with the provisions of the National Historic Preservation Act, the NRC is required to make a reasonable effort to identify historic properties within the area of potential effect. If the NRC finds that either there are no historic properties within the area of potential effect or the undertaking (license renewal) would have no effect on historic properties, the NRC provides documentation of this finding to the State historic preservation officer. In addition, the NRC notifies all consulting parties, including Indian tribes, and makes this finding public (through the NEPA process) prior to issuing the renewed operating license. Similarly, if historic properties are present and could be affected by the undertaking, the NRC is required to assess and resolve any adverse effects in consultation with the State historic preservation officer and any Indian Tribe that attaches religious and cultural significance to identified historic properties. The Louisiana Office of Cultural Development is responsible for administering Federal and State-mandated historic preservation programs to identify, evaluate, register, and protect Louisiana’s archaeological and historical resources. Within this office, the Division of Historic Preservation and the Division of Archaeology jointly comprise the State historic preservation officer (LOCD 2011, 2017).
3.9.1 Cultural Background
This section contains a brief description of the history of human occupation of the RBS area using the following chronologic cultural sequence (Entergy 2017h):
• Paleo-Indian Period (8,000+ years before present)• Archaic Period (8,000 years before present to 3,500 years before present)• Woodland Period (3,500 years before present to AD 1,200)• Mississippi Period (AD 1200 to 1450)• Protohistoric and European Contact (AD 1450 to 1700)• Historic Era (AD 1700 to present)
The Paleo-Indian Period is generally characterized by highly mobile bands of hunters and gatherers hunting small and large game animals (e.g., giant armadillo, mammoth, and dire wolf) and gathering plants. Paleo-Indian sites are not common in Louisiana because these nomadic people left very few artifacts at any one location. Paleo-Indian groups who may have been living near RBS would have exploited the rich riverine resources. However, because over time the sea level has risen and the course of the Mississippi River has shifted, many Paleo-Indian coastal remains are now either submerged, washed away, or deeply buried under silt. A typical Paleo-Indian archaeological site might consist of an isolated Clovis stone point (a distinctive

3-95
fluted spearhead) or knife characteristic of the period. A few such points have been found in the parishes north of Lake Pontchartrain (Neuman and Hawkins 1993; Entergy 2017h).
The Archaic Period represents a continuation of the hunter and gatherer subsistence economy practiced during the Paleo-Indian Period. In contrast to their predecessors, these groups generally remained longer in each camp and limited their roaming to several favored campsites within a smaller geographical range. Archaeological sites in southeast Louisiana from this period tend to be located predominantly along coastal and inland waters, and they are characterized by well-developed shell middens (refuse heaps), large numbers of milling implements and fishing tools, and evidence of earthen mounds (Neuman and Hawkins 1993; Entergy 2017h).
The Woodland Period experienced a transition from earlier hunting and gathering cultures to one characterized by village settlements, food production, pottery manufacturing, and shell and earthen mound building. The Woodland Period in Louisiana lasted from approximately 3,500 years before present to AD 1200, and included several distinct occupancies, including the Poverty Point, Tchefuncte, Marksville, Troyville, and Coles Creek cultures. During the Woodland Period, Louisiana Indians likely traded with members of the highly influential Hopewell Culture that was centered in the Ohio and Illinois river valleys, as evidenced by their use of similarly-fashioned burial mounds, pottery, pipes, and ornamental objects. Archaeological sites from this period indicate an increased use of habitation areas for longer periods of time than those that predate this period, but they are not considered to have been permanently occupied. (Neuman and Hawkins 1993, Entergy 2017h)
The Mississippi Period is characterized by major changes in settlement, subsistence patterns, and social structure. Large, highly centralized chiefdoms with permanent settlement sites supported by numerous satellite villages emerged during this period. The platform mound, a new ceremonial earthen mound, appeared in association with these permanent settlements. Platform mounds, burial mounds, and fortified defensive structures were often constructed in clusters in settlements of this period. Mississippian Period subsistence relied heavily on maize agriculture, as well as on hunting and gathering. Long-distance trading increased and craft specialists produced highly specialized lithic (stone or chipped stone) and ceramic artifacts, beadwork, and shell pendants. Mississippian Culture spread rapidly through the major river valleys of the Southeast. In the Lower Mississippi Valley of Louisiana, the Mississippian culture is believed to have encountered and merged with the resident Plaquemine Culture, thought to be descendants of the earlier Troyville/Coles Creek occupations. Over time, the Plaquemine adopted distinctive Mississippian customs and techniques for making pottery and other ceremonial objects. Louisiana peoples that may have descended from the Mississippian Culture include those who speak the Tunican, Chitimachan, and Muskogean languages, whereas those that may have descended from the Plaquemine Culture include the Taensa and Natchez (Neuman and Hawkins 1993; Entergy 2017h).
In 1682, French explorers—led by Robert de La Salle—travelling downriver on the Mississippi River were the first Europeans to lay claim to southeast Louisiana. These European explorers encountered several native villages established along the Mississippi River, including the Bayagoula/Mugulasha, Ouacha, Chaouacha, Chitimacha, Ofogula, Okelousa, Tunica and Houma. Diseases carried by the European explorers spread rapidly through these native groups and killed many of their members, resulting in significant changes to their way of life. Attempts at colonization of the area by the French were unsuccessful until 1699. (Neuman and Hawkins 1993; Entergy 2016a, 2017h)

3-96
The Historic Era in Louisiana can be characterized by three major settlement periods, each under different sovereign rule. During the French Colonial Period (AD 1700 to 1763), most settlers in the French colony of Louisiana were of French or French-Canadian descent, although large numbers of Germans and Swiss also settled along the Mississippi River. In 1762, France secretly ceded Louisiana to Spain as part of the Treaty of Fontainebleau, leading to the Spanish Colonial Period (AD 1763 to 1803). Spain saw the colony as a means to limit British expansionism in the area, and it was during this time that vegetable and indigo production came to prominence in the region, to be eventually replaced by sugarcane and cotton production.
Control over Louisiana was transferred back to France by way of treaty in 1800, who in turn sold the territory to the United States in 1803 as part of the Louisiana Purchase. Early in the ensuing American Period (AD 1803 to present), plantations harvesting sugarcane, rice, and cypress timber dominated the economy and culture of the area. Following the Civil War and the abolition of slavery, sugar production fell dramatically as plantations struggled to maintain sufficient labor supplies. Chinese, Portuguese, Italian, and German immigrant labor was used to augment the African-American workers who chose to remain.
During the 20th century, agricultural cultivation and timbering enterprises began to give way to the establishment of large petrochemical industrial complexes and marine terminals along both banks of the Mississippi River (Entergy 2016a, 2017h).
3.9.2 Historic and Cultural Resources at River Bend Station
Historic and cultural resources in the vicinity of RBS include prehistoric era and historic era archaeological sites, historic districts, and buildings, as well as any site, structure, or object that may be considered eligible for listing on the National Register of Historic Places. Historic and cultural resources also include traditional cultural properties that are important to a living community of people for maintaining their culture. “Historic property” is the legal term for a historic or cultural resource that is included on, or eligible for inclusion on, the National Register of Historic Places.
Construction of the existing RBS facility likely disturbed any historic and archaeological resources that may have been located within its footprint. However, much of the surrounding area remains largely undisturbed. Although no comprehensive Phase I cultural resources survey has been completed for the entire 3,300-acre Entergy Louisiana, LLC property, several cultural resources studies of the RBS site were conducted between 1971 and 2007 (Entergy 2017h). In addition, Entergy conducted a literature review of archaeological sites in the vicinity of RBS in 2015. The results of these studies indicate that there are more than 100 known historic and cultural resources within a 6-mi (10-km) radius of RBS. Twenty-five of these resources are either National Register of Historic Places-listed, eligible for listing on the register, or have the equivalent eligibility or potential eligibility under national heritage or legacy commission designations, and are therefore considered historic properties within the context of National Historic Preservation Act (DOI 2017; Entergy 2017h). These include 14 aboveground properties, the nearest of which is Star Hill Plantation located approximately 1 mi (1.6 km) northeast of RBS (Entergy 2017h).
3.10 Socioeconomics
This section describes current socioeconomic factors that have the potential to be directly or indirectly affected by changes in operations at RBS. RBS and the communities that support it can be described as a dynamic socioeconomic system. The communities supply the people,

3-97
goods, and services required to operate the nuclear power plant. Power plant operations, in turn, supply wages and benefits for people and dollar expenditures for goods and services. The measure of a community’s ability to support RBS operations depends on its ability to respond to changing environmental, social, economic, and demographic conditions.
3.10.1 Power Plant Employment
The socioeconomic region of influence (ROI) is defined by the areas where RBS workers and their families reside, spend their income, and use their benefits, thus affecting the economic conditions of the region. Entergy employs a permanent workforce of approximately 680 workers (Entergy 2017h). Approximately 90 percent of RBS workers reside in five Louisiana parishes and one county in Mississippi (see Table 3-13). The remaining workers are spread among 25 parishes and counties in Louisiana and 9 other States, with numbers ranging from 1 to 17 workers per parish or county (Entergy 2017h). Table 3-13 presents geographic distribution of the Entergy workforce at RBS across five parishes and one county. Because approximately 69 percent of RBS workers reside in East Baton Rouge and West Feliciana parishes, the most significant socioeconomic effects of plant operations are likely to occur in those two parishes. The focus of the impact analysis, therefore, is on the socioeconomic impacts of continued RBS operations on East Baton Rouge and West Feliciana parishes.
Table 3-13. Residence of Entergy Employees by Parish or County
Parish or County Number of Employees Percentage of Total Total 680 100.00
Louisiana East Baton Rouge 339 49.85 East Feliciana 38 5.59 Livingston 47 6.91 Pointe Coupee 20 2.94 West Feliciana 127 18.68
Mississippi Wilkinson 42 6.18 Other parishes and counties 67 9.85
Source: Entergy 2017h
Entergy purchases goods and services to facilitate RBS operations. Although Entergy procures specialized equipment and services from a wider region, it acquires some proportion of the goods and services used in plant operations from within the socioeconomic region of influence. These transactions fuel a portion of the local economy by sustaining jobs and generating income from the purchases of goods and services.
Refueling outages occur on a 2-year cycle and historically have lasted approximately 25 to 30 days. During refueling outages, site employment typically increases by an additional 700 to 900 temporary workers (Entergy 2017h). Outage workers come from all regions of the country; however, for the purpose of analysis, the majority of outage workers are expected to come from Louisiana.

3-98
3.10.2 Regional Economic Characteristics
This section presents information on employment and income in the RBS socioeconomic region of influence.
3.10.2.1 Regional Employment and Income
From 2010 to 2016, the labor force in the RBS region of influence increased 5.2 percent to just over 239,000 persons. In addition, the number of employed persons increased by 7.9 percent, to approximately 227,000 persons. Consequently, from 2010–2016, the number of unemployed people in the region of influence decreased by nearly 29 percent to just over 12,000 persons, or about 5.0 percent of the total 2016 workforce—down from 7.6 percent in 2010 (BLS 2017).
According to the U.S. Census Bureau’s (USCB’s) 2011–2015 American Community Survey 5-Year Estimates, the educational, health, and social services industry represented the largest employment sector in the socioeconomic region of influence (approximately 25 percent) followed by retail trade (approximately 12 percent). These are followed by the arts, entertainment, recreation, accommodation, and food services industry and the professional, scientific, management, administrative, and waste management services industry at approximately 11 percent each. A list of employment by industry in each parish of the region of influence is provided in Table 3-14.
Table 3-14. Employment by Industry in the River Bend Station Region of Influence (2011–2015, 5-Year Estimates)
Industry
East Baton Rouge Parish
West Feliciana
Parish Total Percent Agriculture, forestry, fishing, hunting, and mining 2,486 162 2,648 1.2 Construction 16,024 570 16,594 7.5 Manufacturing 15,812 448 16,260 7.4 Wholesale Trade 4,640 22 4,662 2.1 Retail Trade 25,758 381 26,139 11.9 Transportation, warehousing, and utilities 9,028 342 9,370 4.2 Information 4,072 80 4,152 1.9 Finance, insurance, real estate, rental, and leasing 12,332 170 12,502 5.7
Professional, scientific, management, administrative, and waste management services 22,898 351 23,249 10.5
Educational, health, and social services 54,772 1,198 55,970 25.4 Arts, entertainment, recreation, accommodation, and food services 23,154 283 23,437 10.6
Other services (except public administration) 11,535 174 11,709 5.3 Public administration 13,002 840 13,842 6.3 Total Employed Civilian Workers 215,513 5,021 220,534 -
Source: USCB 2017c

3-99
Estimated income information for the RBS socioeconomic region of influence (USCB 2011–2015 American Community Survey 5-Year Estimates) is presented in Table 3-15.
Table 3-15. Estimated Income Information for the River Bend Station Socioeconomic Region of Influence (2011–2015, 5-Year Estimates)
East Baton
Rouge Parish West Feliciana
Parish Louisiana Median household income (dollars)(a) 49,285 56,685 45,047 Per capita income (dollars)(a) 27,944 22,122 24,981 Families living below the poverty level (percent) 13.3 12.4 15.2 People living below the poverty level (percent) 19.6 16.0 19.8 (a) In 2015 inflation-adjusted dollars
Source: USCB 2017c
3.10.2.2 Unemployment
According to the USCB’s 2011–2015 American Community Survey 5-Year Estimates, the unemployment rates in East Baton Rouge Parish and West Feliciana Parish were 7.6 and 8.5 percent, respectively. Comparatively, the unemployment rate in the State of Louisiana during this same time period was 8.1 percent (USCB 2017c).
3.10.3 Demographic Characteristics
According to the 2010 Census, an estimated 126,900 people lived within 20 mi (32 km) of RBS, which equates to a population density of 101 persons per square mile (Entergy 2017h). This translates to a Category 3 population density using the license renewal GEIS (NRC 1996) measure of sparseness which is defined as “60 to 120 persons per square mile within 20 miles.” An estimated 953,086 people live within 50 miles (80 kilometers) of RBS with a population density of 121 persons per square mile (Entergy 2017h). With two cities within a 50-mile radius having populations greater than 100,000 persons, this translates to a Category 3 density, using the license renewal GEIS (NRC 1996) measure of proximity (one or more cities with 100,000 persons within 50 miles). Therefore, RBS is located in a “medium” population area based on the license renewal GEIS sparseness and proximity matrix.
Table 3-16 shows population projections and percent growth from 1980 to 2060 in the two-parish RBS region of influence. Over the last several decades, East Baton Rouge Parish has experienced an increasing population yet declining growth rate. In contrast, West Feliciana Parish has experienced widely fluctuating growth rates. Based on State of Louisiana and estimated forecasts, the population in East Baton Rouge Parish is projected to decrease at a moderate rate while the population of West Feliciana Parish is projected to decrease at a high rate. These projections reflect a trend of population decline that began in the aftermath of Hurricane Katrina in late 2005.

3-100
Table 3-16. Population and Percent Growth in River Bend Station Socioeconomic Region of Interest Parishes 1980–2010, 2015 (Estimated), and 2020–2060 (Projected)
Year
East Baton Rouge Parish West Feliciana Parish
Population Percent Change Population
Percent Change
Recorded
1980 366,191 – 12,186 – 1990 380,105 3.8 12,915 6.0 2000 412,852 8.6 15,111 17.0 2010 440,171 6.6 15,625 3.4
Estimated 2015 444,690 1.0 15,415 -1.3 Projected
2020 426,380 -3.1 15,120 -3.2 2030 421,500 -1.1 14,260 -5.7
2040 416,620 -1.2 13,400 -6.0 2050 411,740 -1.2 12,540 -6.4
2060 406,860 -1.2 11,680 -6.9
Sources: Decennial population data for 1970–2010 and estimated 2015 (USCB 2017a); projections for 2020–2030 by State of Louisiana, Division of Administration (No Date); 2040–2060 calculated.
The 2010 Census demographic profile of the two-parish ROI population is presented in Table 3-17. According to the 2010 Census, minorities (race and ethnicity combined) comprised approximately 53 percent of the total two-parish population. The largest minority populations in the region of influence were Black or African American (approximately 45 percent) followed by Hispanic, Latino, or Spanish origin of any race (approximately 4 percent).
Table 3-17. Demographic Profile of the Population in the River Bend Station Region of Influence in 2010
East Baton Rouge Parish
West Feliciana Parish
Region of Influence
Total Population 440,171 15,622 455,796 Race (Percent of Total Population, Not Hispanic or Latino)
White 47.0 51.2 47.1 Black or African American 45.1 46.3 45.2 American Indian and Alaska Native 0.2 0.1 0.2 Asian 2.8 0.2 2.7 Native Hawaiian and Other Pacific Islander 0.0 0.0 0.0 Some other race 0.1 0.0 0.1 Two or more races 1.1 0.5 1.1
Hispanic, Latino, or Spanish Ethnicity of Any Race Hispanic or Latino 16,274 251 16,525 Percent of total population 3.7 1.6 3.6
Minority Population (Including Hispanic or Latino Ethnicity) Total minority population 233,507 7,623 241,130

3-101
East Baton Rouge Parish
West Feliciana Parish
Region of Influence
Percent minority 53.0 48.8 52.9
Source: USCB 2017a
According to the Census Bureau’s 2011–2015 American Community Survey 5-Year Estimates, minority populations in the region of influence have increased by approximately 7,000 persons since 2010 and now comprise approximately 54 percent of the population (see Table 3-18). The largest increase occurred in the Black or African American population (which grew by nearly 3,000 persons since 2010, an increase of approximately 1.4 percent). The next largest increase in minority population was in the Asian population, which grew by approximately 1,900 persons, or approximately 16 percent, since 2010.
Table 3-18. Demographic Profile of the Population in the River Bend Station Region of Influence, 2011–2015, 5-Year Estimates
East Baton Rouge Parish
West Feliciana Parish ROI
Total Population 444,690 15,415 460,105 Race (percent of total population, Not-Hispanic or Latino)
White 45.9 51.7 46.1 Black or African American 45.3 45.7 45.4 American Indian and Alaska Native 0.1 0.3 0.1 Asian 3.2 0.0 3.8 Native Hawaiian and Other Pacific Islander
0.0 0.0 0.0
Some other race 0.2 0.0 0.2 Two or more races 1.4 0.7 1.4
Hispanic, Latino, or Spanish Ethnicity of Any Race Hispanic or Latino 17,142 232 17,374 Percent of total population 3.9 1.5 3.8
Minority Population (Including Hispanic or Latino Ethnicity) Total minority population 240,645 7,443 248,088 Percent minority 54.1 48.3 53.9
Source: USCB 2017e
3.10.3.1 Transient Population
Within 50 mi (80 km) of RBS, colleges, tourism and recreational opportunities attract daily and seasonal visitors who create a demand for temporary housing and services. In 2017, approximately 39,000 students attended colleges and universities within 50 mi (80 km) of RBS (NCES 2018a).

3-102
Based on the Census Bureau’s 2011–2015 American Community Survey 5-Year Estimates (USCB 2017b), approximately 21,100 seasonal housing units are located within 50 mi (80 km) of RBS. Of those, 3,850 housing units are located in the socioeconomic region of influence. Table 3-19 presents information about seasonal housing for the parishes located all or partly within 50 mi (80 km) of RBS.
Table 3-19. 2011–2015 5-Year Estimated Seasonal Housing in Parishes or Counties Located Within 50 mi (80 km) of River Bend Station
Parish or County Total Housing Units
Vacant Housing Units: for Seasonal, Recreation, or Occasional Use Percent
Total 667,196 21,115 3.2 Louisiana
Ascension 43,255 468 1.1 Assumption 10,470 634 6.1 Avoyelles 18,157 1,054 5.8 Catahoula 4,901 674 13.8 Concordia 9,418 756 8.0 East Baton Rouge 190,343 3,197 1.7 East Feliciana 8,138 404 5.0 Iberia 30,002 345 1.1 Iberville 12,914 461 3.6 Lafayette 96,468 947 1.0 Livingston 52,888 1,146 2.2 Pointe Coupee 11,257 1,244 11.1 St. Helena 5,163 431 8.3 St. Landry 36,047 1,611 4.5 St. Martin 22,390 1,109 5.0 Tangipahoa 51,938 1,096 2.1 West Baton Rouge 9,873 30 0.3 West Feliciana 5,214 653 12.5 Mississippi Adams 14,622 951 6.5 Amite 6,636 854 12.9 Franklin 4,157 452 10.9 Pike 17,898 1,194 6.7 Wilkinson 5,047 1,404 27.8
Parishes within 50 mi (80 km) of RBS with at least one block group located within the 50-mi (80-km) radius. Note: ROI parishes are in bold italics.
Source: USCB 2017b

3-103
3.10.3.2 Migrant Farm Workers
Migrant farm workers are individuals whose employment requires travel to harvest agricultural crops. These workers may or may not have a permanent residence. Some migrant workers follow the harvesting of crops, particularly fruit, throughout rural areas of the United States. Others may be permanent residents living near RBS who travel from farm to farm harvesting crops.
Migrant workers may be members of minority or low-income populations. Because they travel and can spend a significant amount of time in an area without being actual residents, migrant workers may be unavailable for counting by census takers. If uncounted, these minority and low-income workers would be underrepresented in the decennial Census population counts.
The U.S. Department of Agriculture’s National Agricultural Statistics Survey conducts the Census of Agriculture every 5 years. This results in a comprehensive compilation of agricultural production data for every county and parish in the Nation. Beginning with the 2002 Census of Agriculture, farm operators were asked whether or not they hired migrant workers—defined as a farm worker whose employment required travel—to do work that prevented the workers from returning to their permanent place of residence the same day.
Information about both migrant and temporary farm labor (working less than 150 days) can be found in the 2012 Census of Agriculture. Table 3-20 presents information on migrant and temporary farm labor within 50 mi (80 km) of RBS.
Table 3-20. Migrant Farm Workers and Temporary Farm Labor in Parishes or Counties Located Within 50 mi (80 km) of RBS (2012)
County or Parish(a)
Number of Farms with Hired Farm
Labor(b)
Number of Farms Hiring Workers for
Less Than 150 Days(b)
Number of Farm Workers Working
for Less Than 150 Days(b)
Number of Farms Reporting
Migrant Farm Labor(b)
Total 2,915 2,175 6,108 187 Louisiana
Ascension 49 34 158 6 Assumption 51 34 182 14 Avoyelles 346 274 604 19 Catahoula 150 100 250 1 Concordia 172 118 352 5 East Baton Rouge 101 82 167 0 East Feliciana 122 98 241 2 Iberia 108 75 482 20 Iberville 69 37 216 13 Lafayette 148 99 299 7 Livingston 82 74 (c) 3 Pointe Coupee 152 113 447 21 St. Helena 92 76 190 1 St. Landry 348 245 596 31 St. Martin 100 72 235 22

3-104
County or Parish(a)
Number of Farms with Hired Farm
Labor(b)
Number of Farms Hiring Workers for
Less Than 150 Days(b)
Number of Farm Workers Working
for Less Than 150 Days(b)
Number of Farms Reporting
Migrant Farm Labor(b)
Tangipahoa 257 195 561 9 West Baton Rouge 37 23 104 5 West Feliciana 60 37 103 3 Mississippi Adams 48 33 74 0 Amite 145 131 590 3 Franklin 38 31 (c) 0 Pike 156 127 257 2 Wilkinson 84 67 (c) 0 (a) Parishes within 50 mi (80 km) of RBS with at least one block group located within the 50-mi (80-km) radius. (b) Table 7 (NASS 2014). Hired farm Labor – Workers and Payroll: 2012. (c) Withheld to avoid disclosing data for individual farms. Note: ROI parishes are in bold italics.
Source: 2012 Census of Agriculture – Parish Data (NASS 2014)
According to the 2012 Census of Agriculture, approximately 6,110 farm workers were hired to work for less than 150 days and were employed on 2,175 farms within 50 mi (80 km) of RBS. The parish with the highest number of temporary farm workers (604 workers on 274 farms) was Avoyelles Parish, LA (NASS 2014). Approximately 187 farms, in the 50-mi (80-km) radius of RBS reported hiring approximately 1,300 migrant workers in the 2012 Census of Agriculture. St. Landry Parish had the highest number of farms (31) reporting migrant farm labor (NASS 2014).
3.10.4 Housing and Community Services
This section presents information regarding housing and local public services, including education and water supply.
3.10.4.1 Housing
Table 3-21 lists the total number of occupied and vacant housing units, vacancy rates, and median values of housing units in the region of influence. Based on the Census Bureau’s 2011–2015 American Community Survey 5-year estimates (USCB 2017d), there were approximately 196,000 housing units in the region of influence, of which over 173,000 were occupied. The median values of owner-occupied housing units in the region of influence range from $170,500 in East Baton Rouge Parish to $188,200 in West Feliciana Parish. The vacancy rate also varied slightly between the two parishes, from 2.0 percent in East Baton Rouge Parish to 2.6 percent in West Feliciana Parish (USCB 2017d).

3-105
Table 3-21. Housing in the River Bend Station Region of Influence (2011–2015, 5-Year Estimate)
East Baton Rouge Parish
West Feliciana Parish
Region of Influence
Total housing units 190,343 5,214 195,557 Occupied housing units 169,120 3,911 173,031 Total vacant housing units 21,223 1,303 22,526 Percent total vacant 11.1 25.0 11.5 Owner occupied units 100,963 2,974 103,937 Median value (dollars) 170,500 188,200 171,006 Owner vacancy rate (percent) 2.0 2.6 2.0 Renter occupied units 68,157 937 69,094 Median rent (dollars/month) 842 822 842 Rental vacancy rate (percent) 8.8 12.7 8.9
Source: USCB 2017d
3.10.4.2 Education
West Feliciana Parish has one public school district in which there are a total of four schools. During the 2014–2015 school year, the district enrolled approximately 2,100 students (NCES 2018b).
3.10.4.3 Public Water Supply
West Feliciana Parish Water District 13 is the main public water service provider for parish residents and relies on groundwater as its source. It also provides potable water to RBS. Table 3-22 shows that demand on the West Feliciana Parish Water District 13 is approximately at 35.0 percent capacity. West Feliciana Parish has sufficient water service capabilities to meet the needs of the public. (Entergy 2017h)
Baton Rouge Water Company is the main public water provider in East Baton Rouge Parish and relies on groundwater as its source and serves a population of over 500,000. The system is at approximately 68 percent capacity. The Baton Rouge Water Company has plans to add an additional well and is investigating drilling additional wells to increase capacity. (Entergy 2017h)
Table 3-22 lists the largest public water suppliers in East Baton Rouge Parish and West Feliciana Parish and provides information regarding the water source and population served for those suppliers. Currently, there is excess capacity in the major public water systems.

3-106
Table 3-22. Public Water Supply Systems in East Baton Rouge Parish and West Feliciana Parish
Public Water System Source
Design Capacity
(mgd)
Average Production
(mgd)
Demand (percent of capacity)
Population Served(a)
East Baton Rouge Parish Baton Rouge Water Company Groundwater 98.38 66.54 67.6 526,710 City of Baker Groundwater 5.8 1.54 26.6 13,855 City of Zachary Groundwater 9 2.5 27.8 22,728
West Feliciana Parish West Feliciana Consolidated Waterworks (Water District 13)
Groundwater 3.25 1.14 35.0 10,956
Town of St. Francisville Groundwater 4 0.1 2.5 2,304 (a) Safe Drinking Water Search for the State of Louisiana (EPA 2018).
Sources: Entergy 2017h, EPA 2018
3.10.5 Tax Revenues
Entergy pays annual property taxes to West Feliciana Parish based on the assessed value of RBS. The State of Louisiana calculates a total entity or unit value for regulated utilities in the state, including Entergy Louisiana, LLC, and does not value RBS separately. The total assessment of Entergy Louisiana, Inc.-owned property in Louisiana in 2016 was approximately $1,122 million (LTC 2017, page 9). The taxable assessed value of Entergy Louisiana, LLC property in West Feliciana Parish in 2015 was approximately $180 million (WFP 2016, page 59). Entergy Louisiana, LLC does not receive separate tax invoices from West Feliciana Parish for power plants. In 2016, Entergy Louisiana, LLC paid approximately $14.2 million in property taxes to West Feliciana Parish (see Table 3-23).
Total property tax revenues for West Feliciana Parish, including parish and local taxes, were approximately $22.5 million in 2016. The two largest programs receiving parish funds were schools (which received approximately $9.9 million) and law enforcement (which received approximately $4 million). This was followed by the parish improvement funds program, which received about $2.5 million (LTC 2017, page 106). In 2016, Entergy Louisiana, LLC payments to West Feliciana Parish in property taxes represented roughly 63 percent of the total parish property tax revenues. Entergy anticipates that the company's assessed value and tax rates will continue to fluctuate; however, Entergy does not expect there to be notable or significant changes to future property tax payments during the license renewal period.
Other significant payments made by Entergy Louisiana, LLC to agencies and parishes for RBS are listed in Table 3-24.

Table 3-23. Entergy Louisiana, LLC Property Tax Payments, 2011–2016
Year
Entergy Louisiana, LLC Property Taxes
(in millions of dollars)
West Feliciana Parish Revenues
(in millions of dollars) Percent of Parish
Revenue 2011 15.6 21.5 73 2012 15.4 21.7 71 2013 14.3 21.4 67 2014 14.6 21.6 68 2015 14.4 21.8 66 2016 14.2 22.5 63
Source: Entergy 2017h, Entergy 2017c
Table 3-24. Entergy Louisiana, LLC Annual Support Payments to Agencies and Parishes
Agency Payment
(in dollars) Purpose Federal Emergency Management Agency 524,814 Federal Radiological Emergency
Preparedness program fee East Feliciana, West Feliciana, East Baton Rouge, West Baton Rouge, and Pointe Coupee Emergency Management Offices
215,000 Radiological emergency preparedness program support fees, with East Baton Rouge Parish receiving $15,000 for maintaining the RBS reception centers
Louisiana Department of Environmental Quality 432,696 Radiological emergency preparedness fees
Governor’s Office of HomelandSecurity & Emergency Management 62,158
Radiological emergency preparedness program support fee including radiological instrument calibration
Mississippi Emergency Management Agency 46,200
Operation and support of 24 hour radiological emergency preparedness hotline fee, and some limited radiological emergency preparedness support
Source: Entergy 2017c
3.10.6 Local Transportation
The primary access to RBS is from US-61 via the North Access Road. At the North Access Road plant entrance, a dedicated turn lane was included in construction of the northbound portion of US-61, along with the installation of traffic lights for controlling traffic flow. A second road with access to the plant from US-61 is the two-lane paved highway LA-965, located northwest of RBS in West Feliciana Parish. Transportation studies show that use of this road is minimal in comparison to US-61, and traffic volume has fluctuated very little over the years. The most recent traffic volume recorded for LA-965 west of US-61 was an average annual daily traffic count of 545 vehicles. Southwest of the RBS property boundary, the recently completed LA-10 Audubon Bridge crosses the Mississippi River and links Pointe Coupee Parish with West Feliciana Parish. No roads within RBS directly access LA-10. An average annual daily traffic
3-107

3-108
count of 3,066 was taken in 2012 on LA-10 east of the bridge. No average annual daily traffic counts of a later date were available for West Feliciana Parish recorded mile-point locations. (Entergy 2017h)
Table 3-25 lists one US highway (US-61) and three State roads (LA-10, LA-965, and LA-966) near RBS. The table also shows Louisiana Department of Transportation & Development (LaDOTD) average annual daily traffic volumes recorded at several mile marker points for each highway or road. The average annual daily traffic values represent traffic volumes for a 24-hour period factored by both day of week and month of year.
Table 3-25. Louisiana State Routes in the Vicinity of River Bend Station: 2016 Average Annual Daily Traffic Count
Roadway and Location Mile Marker Average Annual Daily Traffic
and Average Daily Traffic US-61
Northwest of RBS (West Feliciana) 105.72 15,628 Southeast of RBS (East Feliciana) 99.08 13,236(a)
LA-10 Northwest of RBS (West Feliciana) 150.44 2,729 Northwest of RBS (West Feliciana) 149.62 3,478 Southwest of RBS (West Feliciana) 140.15 3,066(b) LA-965 Northwest of RBS (West Feliciana) 2.06 675 Northwest of RBS (West Feliciana) 2.65 2,311 East of RBS (West Feliciana) 16.201 2,624 LA-966 Northeast of RBS (West Feliciana) 0.34 852 (a) AADT represents traffic volume in 2015(b) AADT represents traffic volume in 2012
Source: LaDOTD 2018
3.11 Human Health
Like any industrial facility or nuclear power plant, operations at RBS produce human health risks for both workers and members of the public. This section describes human health risks from the operation of RBS.
3.11.1 Radiological Exposure and Risk
Operation of a nuclear power plant involves the use of nuclear fuel to generate electricity through the fission process through which uranium atoms are split, resulting in the production of heat which is used to produce steam to drive the plant’s turbines and the creation of radioactive byproducts. As required by NRC regulations at 10 CFR 20.1101,”Radiation Protection Programs,” Entergy has a radiation protection program designed to protect onsite personnel (including employees and contractor employees), visitors, and offsite members of the public from radiation and radioactive material at RBS.

3-109
The radiation protection program is extensive and includes, but is not limited to the following:
• Organization and Administration (e.g., a radiation protection manager who isresponsible for the program and who ensures trained and qualified workers for theprogram)
• Implementing Procedures• ALARA Program to minimize dose to workers and members of the public• Dosimetry Program (i.e., measure radiation dose of plant workers)• Radiological Controls (e.g., protective clothing, shielding, filters, respiratory
equipment, and individual work permits with specific radiological requirements)• Radiation Area Entry and Exit Controls (e.g., locked or barricaded doors, interlocks,
local and remote alarms, personnel contamination monitoring stations)• Posting of Radiation Hazards (i.e., signs and notices alerting plant personnel of
potential hazards)• Recordkeeping and Reporting (e.g., documentation of worker dose and radiation
survey data)• Radiation Safety Training (e.g., classroom training and use of mockups to simulate
complex work assignments)• Radioactive Effluent Monitoring Management (i.e., controlling and monitoring
radioactive liquid and gaseous effluents released into the environment)• Radioactive Environmental Monitoring (e.g., sampling and analysis of environmental
media, such as air, water, vegetation, food crops, direct radiation, and milk tomeasure the levels of radioactive material in the environment that may impact humanhealth)
• Radiological Waste Management (i.e., controlling, monitoring, processing, anddisposing of radioactive solid waste)
Regarding radiation exposure to RBS personnel, the NRC staff reviewed the data contained in NUREG–0713, Volume 37, “Occupational Radiation Exposure at Commercial Nuclear Power Reactors and Other Facilities 2015: Forty-Eighth Annual Report” (NRC 2017i). The forty-eighth annual report was the most recent annual report available at the time of this environmental review. It summarizes the NRC’s Radiation Exposure Information and Reporting System database’s occupational exposure data through 2015. Nuclear power plants are required by 10 CFR 20.2206, “Reports of Individual Monitoring,” to report their occupational exposure data to the NRC annually. Radiological doses associated with RBS license renewal are discussed further in Chapter 4 of this SEIS.
NUREG–0713 calculates a 3-year average collective dose per reactor for workers at all nuclear power reactors licensed by the NRC. The 3-year average collective dose is one of the metrics that the NRC uses in the Reactor Oversight Program to evaluate the applicant’s ALARA program. Collective dose is the sum of the individual doses received by workers at a facility licensed to use radioactive material over a 1-year time period. There are no NRC or EPA standards for collective dose. Based on the data for operating boiling-water reactors like the one at RBS, the average annual collective dose per reactor was 120 person-rem. In comparison, RBS had a reported annual collective dose per reactor of 111 person-rem.
In addition, as reported in NUREG–0713, for 2015, no worker at RBS received an annual dose greater than 2.0 rem (0.02 sievert (Sv)), which is less than half of the NRC occupational dose limit of 5.0 rem (0.05 Sv) in 10 CFR 20.1201, “Occupational Dose Limits for Adults.” Offsite dose to members of the public is discussed in Section 3.1.4 of this SEIS.

3-110
3.11.2 Chemical Hazards
State and Federal environmental agencies regulate the use, storage, and discharge of chemicals, biocides, and sanitary wastes. Such environmental agencies also regulate how facilities like RBS manage minor chemical spills. Chemical and hazardous wastes can potentially impact workers, members of the public, and the environment.
Entergy currently controls the use, storage, and discharge of chemicals and sanitary wastes at RBS in accordance with its chemical control procedures, waste-management procedures, and RBS site-specific chemical spill prevention plans. Entergy monitors and controls discharges of chemical and sanitary wastes through RBS’s Louisiana Pollutant Discharge Elimination System permit process. These plant procedures, plans, and processes are designed to prevent and minimize the potential for a chemical or hazardous waste release and, in the event of such a release, minimize impact to workers, members of the public, and the environment (Entergy 2017h).
During the period of extended operation, the NRC staff expects that Entergy will minimize chemical hazard impact by implementing good industrial hygiene practices as required by permits and Federal and State regulations.
3.11.3 Microbiological Hazards
Large nuclear power plants are usually built next to a body of water such as a lake, river, or ocean, which provides a source of cooling water and accepts heat discharge from the plant. For RBS, that body of water is the Mississippi River. The thermal effluents, or heated discharge, of nuclear power plants (like RBS) that discharge into a river can potentially promote the growth of certain thermophilic, or heat-loving, microorganisms that are linked to adverse human health effects. Microorganisms of particular concern include several types of bacteria (Legionella spp., Salmonella spp., Shigella spp., and Pseudomonas aeruginosa) and the free-living amoeba Naegleria fowleri.
The public can be exposed to the thermophilic microorganisms like Salmonella, Shigella, P. aeruginosa, and N. fowleri during swimming, boating, or other recreational uses offreshwater. If a nuclear power plant’s thermal effluent enhances the growth of thermophilicmicroorganisms, recreational water users near the plant’s discharge could experience anelevated risk of exposure to these microorganisms. In addition, nuclear plant workers can beexposed to the bacteria Legionella spp. when performing maintenance activities on plant coolingsystems by inhaling cooling water vapors (because these vapors are often within the optimumtemperature range for Legionella growth).
3.11.3.1 Thermophilic Microorganisms of Concern
Salmonella typhimurium and S. enteritidis
These are two species of enteric bacteria (bacteria that live in human or animal intestines) that cause salmonellosis, an infection that can cause diarrhea, vomiting, fever, and abdominal cramps. This disease is more common in summer than winter (CDC 2015b). Salmonellosis is transmitted through contact with contaminated human or animal feces, contact with contaminated water, contact with food or infected animals, or contamination in laboratory settings (CDC 2015b). These bacteria grow at temperatures ranging from 77 to 113 °F (25 to 45 °C), have an optimal growth temperature around the human body temperature of 98.6 °F

3-111
(37 °C), and can survive extreme temperatures as low as 41 °F (5 °C) and as high as 122 °F (50 °C) (Oscar 2009). Research studies examining the persistence of Salmonella spp. outside of a host found that the bacteria can survive for several months in water and in aquatic sediments (Moore et al. 2003). From 1990–2016, the annual number of reported Salmonella spp. cases within the State of Louisiana has ranged from 531 to 1,548 cases, for an average of 1,000 cases per year (LDH 2016b). CDC data indicate that no outbreaks or cases of waterborne Salmonella infection from recreational waters have occurred in the United States from 2006 through 2017 (CDC 2017d). During that time period, all CDC-reported Salmonella outbreaks were caused by consumption of contaminated produce, meats, or prepared foods; contact with contaminated animals; or exposure in a laboratory (CDC 2017d).
Shigella spp
Shigellosis infections are caused by the transmission of Shigella spp. from person to person through contaminated feces and unhygienic handling of food. Those infected may experience diarrhea, fever, and stomach cramps. Like salmonellosis, infections are more common in summer than in winter (CDC 2017e). The bacteria grow at temperatures between 77 and 99 °F (25 and 37 °C) and can survive temperatures as low as 41 °F (5 °C) (PHAC 2010). From 1990–2016, the annual number of reported Shigella spp. cases within the State of Louisiana has ranged from 128 to 645, for an average of 367 cases per year (LDH 2016c). CDC reports (2004, 2006, 2008, 2011, 2014b, 2015a) indicate that less than a dozen shigellosis outbreaks have been attributed to lakes, reservoirs, and other recreational waters in the past 10 available data years (2001 through 2012).
Pseudomonas aeruginosa
Pseudomonas aeruginosa can be found in soil, hospital respirators, water, and sewage and on the skin of healthy individuals. It is most commonly linked to infections transmitted in healthcare settings. Infections from exposure to P. aeruginosa in water can lead to development of mild respiratory illnesses in healthy people (CDC 2014a). These bacteria have an optimal growth temperature of 98.6 °F (37 °C) and can survive in temperatures as high as 107.6 °F (42 °C) (Todar 2004). The Louisiana Department of Health (undated) reported no cases of Pseudomonas aeruginosa from 1990 through 2017.
Naegleria fowleri
The free-living amoeba Naegleria fowleri prefers warm freshwater habitats. This microorganism can cause human primary amoebic meningoencephalitis—an almost always fatal brain infection. The infection occurs when N. fowleri penetrates the nasal tissue through direct contact with contaminated water from warm lakes, rivers, hot springs, or municipal sources (i.e., tap water) and migrates to the brain tissues (CDC 2017c). This free-swimming amoeba species is rarely found in water temperatures below 95 °F (35 °C), and infections rarely occur at those temperatures (Tyndall et al. 1989). The N. fowleri-caused disease, primary amoebic meningoencephalitis, is rare in the United States. During the 53-year period from 1962 through 2015, the CDC (2017b) confirmed an average of seven cases each year of primary amoebic meningoencephalitis. Of all cases recorded over that same period, the CDC reports that four cases occurred in Louisiana (CDC 2017b). The Louisiana Office of Public Health (2013) determined that the three most recent cases, two cases in 2011 and one case in 2013, were not attributed to rivers, lakes, and other recreational waters. No cases of primary amoebic meningoencephalitis in Louisiana have ever been attributed to the Mississippi River or recreational surface water use (Entergy 2017d).

3-112
Legionella spp.
Legionella spp. infections result in legionellosis (commonly called Legionnaires’ disease), which manifests as a dangerous form of pneumonia or an influenza-like illness. Legionellosis outbreaks are often associated with complex water systems housed inside buildings or structures, such as cooling towers (CDC 2017a). Legionella spp. thrive in aquatic environments as intracellular parasites of protozoa and are only infectious in humans through inhalation contact from an environmental source (CDC 2017a). Stagnant water between 95 and 115 °F (35 and 46 °C) tends to promote growth in Legionella spp., although the bacteria can grow at temperatures as low as 68 °F (20 °C) and as high as 122 °F (50 °C) (OSHA 1999). From 1990–2016, the annual number of reported Legionella spp. cases within the State of Louisiana has ranged from 1 to 61, for an average of 15 cases per year (LDH 2016a).
3.11.4 Electromagnetic Fields
Based on its evaluation in the GEIS for license renewal (NUREG-1437), the NRC has not found electric shock resulting from direct access to energized conductors or from induced charges in metallic structures to be a problem at most operating plants. Generally, the NRC staff also does not expect electric shock from such sources to be a human health hazard during the license renewal term. However, a site-specific review is required to determine the significance of the electric shock potential along the portions of the transmission lines that are within the scope of this SEIS. Transmission lines that are within the scope of the NRC’s license renewal environmental review are limited to: (1) those transmission lines that connect the nuclear plant to the substation where electricity is fed into the regional distribution system and (2) those transmission lines that supply power to the nuclear plant from the grid (NRC 2013b).
As discussed in Section 3.1.6.5 of this SEIS, the only transmission lines that are in scope for RBS license renewal are onsite. Specifically, these onsite, in-scope transmission lines are (1) a line to the on-site Fancy Point Substation that delivers the electrical output of the plant, and (2) two lines from the Fancy Point Substation to the plant that deliver offsite power for normal operation and safe shutdown of the plant (Entergy 2017h). Therefore, there is no potential shock hazard to offsite members of the public from these on-site transmission lines. As discussed in Section 3.11.5 of this SEIS, RBS maintains an occupational safety program, which includes protection from acute electrical shock, and is in accordance with Occupational Safety and Health Administration regulations.
3.11.5 Other Hazards
This section addresses two additional human health hazards: (1) physical occupational hazards and (2) electric shock hazards.
Nuclear power plants are industrial facilities that have many of the typical occupational hazards found at any other electric power generation utility. Nuclear power plant workers may perform electrical work, electric power line maintenance, repair work, and maintenance activities and may be exposed to some potentially hazardous physical conditions (e.g., falls, excessive heat, cold, noise, electric shock, and pressure).
The Occupational Safety and Health Administration (OSHA) is responsible for developing and enforcing workplace safety regulations. Congress created OSHA by enacting the Occupational Safety and Health Act of 1970, as amended (29 U.S.C. 651 et seq.) to safeguard the health of workers. With specific regard to nuclear power plants, plant conditions that result in an

3-113
occupational risk, but do not affect the safety of licensed radioactive materials, are under the statutory authority of OSHA rather than the NRC as set forth in a memorandum of understanding (53 FR 43950) between the NRC and OSHA. Occupational hazards are reduced when workers adhere to safety standards and use appropriate protective equipment; however, fatalities and injuries from accidents may still occur. RBS maintains an occupational safety program for its workers in accordance with OSHA regulations (Entergy 2017h).
3.12 Environmental Justice
Under Executive Order (EO) 12898 (59 FR 7629), Federal agencies are responsible for identifying and addressing, as appropriate, disproportionately high and adverse human health and environmental impacts on minority and low-income populations. Independent agencies, such as the NRC, are not bound by the terms of EO 12898 but are, as stated in paragraph 6-604 of the executive order, “requested to comply with the provisions of [the] order.”In 2004, the Commission issued the agency’s “Policy Statement on the Treatment of Environmental Justice Matters in NRC Regulatory and Licensing Actions” (69 FR 52040), which states, "The Commission is committed to the general goals set forth in EO 12898, and strives to meet those goals as part of its NEPA review process."
The Council on Environmental Quality (CEQ) provides the following information in Environmental Justice: Guidance Under the National Environmental Policy Act (CEQ 1997):
Disproportionately High and Adverse Human Health Effects.
Adverse health effects are measured in risks and rates that could result in latent cancer fatalities, as well as other fatal or nonfatal adverse impacts on human health. Adverse health effects may include bodily impairment, infirmity, illness, or death. Disproportionately high and adverse human health effects occur when the risk or rate of exposure to an environmental hazard for a minority or low-income population is significant (as employed by NEPA) and appreciably exceeds the risk or exposure rate for the general population or for another appropriate comparison group (CEQ 1997).
Disproportionately High and Adverse Environmental Effects.
A disproportionately high environmental impact that is significant (as employed by NEPA) refers to an impact or risk of an impact on the natural or physical environment in a low-income or minority community that appreciably exceeds the environmental impact on the larger community. Such effects may include ecological, cultural, human health, economic, or social impacts. An adverse environmental impact is an impact that is determined to be both harmful and significant (as employed by NEPA). In assessing cultural and aesthetic environmental impacts, impacts that uniquely affect geographically dislocated or dispersed minority or low-income populations or American Indian tribes are considered (CEQ 1997).
This environmental justice analysis assesses the potential for disproportionately high and adverse human health or environmental effects on minority and low-income populations that could result from the operation of RBS during the period of extended operation. In assessing

Minority Individuals
Individuals who identify themselves as members of the following population groups: Hispanic or Latino, American Indian or Alaska Native, Asian, Black or African American, Native Hawaiian or Other Pacific Islander, or two or more races, meaning individuals who identified themselves on a Census form as being a member of two or more races, for example, White and Asian.
Minority Populations
Minority populations are identified when (1) the minority population of an affected area exceeds 50 percent or (2) the minority population percentage of the affected area is meaningfully greater than the minority population percentage in the general population or other appropriate unit of geographic analysis.
Low-income Population
Low-income populations in an affected area are identified with the annual statistical poverty thresholds from the Census Bureau’s Current Population Reports, Series P60, on Income and Poverty.
Minority Population
According to the Census Bureau’s 2010 Census data, approximately 42 percent of the population residing within a 50-mi (80-km) radius of RBS identified themselves as minority individuals. The largest minority populations were Black or African American (approximately 37 percent) and Hispanic, Latino, or Spanish origin of any race (approximately 3 percent) (USCB 2017a).
According to the CEQ definition, a minority population exists if the percentage of the minority population of an area (e.g., census block group) exceeds 50 percent or is meaningfully greater than the minority population percentage in the general population. Therefore, census block groups within the 50 mi (80 km) radius of RBS were considered minority population block groups if the percentage of the minority population in the block group exceeded 42 percent, the percent of the minority population within the 50-mi (80-km) radius of RBS.
As shown in Figure 3-22, minority population block groups (race and ethnicity) are clustered north around Woodville, MS, east around Jackson, LA; west around New Roads, LA; and southeast of RBS in Baton Rouge, LA. Based on this analysis, RBS is not located in a minority population block group.
According to 2010 Census data, minority populations in the socioeconomic region of influence (East Baton Rouge and West Feliciana parishes) comprised approximately 53 percent of the total two-parish population (see Table 3-17). Figure 3-22 shows predominantly minority population block groups, using 2010 Census data for race and ethnicity, within a 50-mile (80-kilometer) radius of RBS. According to the Census Bureau’s 2011–2015 American Community Survey 5-Year Estimates (USCB 2017e), since 2010, minority populations in the region of influence increased by approximately 7,000 persons and now comprise 54 percent of the population (see Table 3-18).
3-114
the impacts, the following definitions of minority individuals, minority populations, and low-income population were used (CEQ 1997):

3-115
Low-Income Population
The Census Bureau’s 2011–2015 American Community Survey (ACS) data identifies approximately 19 percent of individuals residing within a 50-mi (80-km) radius of RBS as living below the Federal poverty threshold in 2015 (USCB 2017c). The 2015 Federal poverty threshold was $24,257 for a family of four.
Figure 3-23 shows the location of predominantly low-income population block groups within a 50-mile (80-kilometer) radius of RBS. Census block groups were considered low-incomepopulation block groups if the percentage of individuals living below the Federal povertythreshold within the block group exceeded 19 percent, the percent of the individuals living belowthe Federal poverty threshold within the 50-mi (80-km) radius of RBS.
As shown in Figure 3-23, low-income population block groups are clustered north around Woodville, MS, east around Jackson, LA; west around New Roads, LA; and southeast of RBS in Baton Rouge, LA. Based on this analysis, RBS is not located in a low-income population block group.
According to the Census Bureau’s 2011–2015 American Community Survey 5-Year Estimates, 15.2 percent of families and 19.8 percent of people in Louisiana were living below the Federal poverty threshold and the median household and per capita incomes for Louisiana were $45,047 and $24,981, respectively (USCB 2017c). In the socioeconomic region of influence (East Baton Rouge and West Feliciana parishes), people living in East Baton Rouge Parish have higher median household and per capita incomes ($49,285 and $27,944, respectively) than the State averages, with fewer families and people (13.3 percent and 19.6 percent, respectively) living below the poverty level. In addition, people living in West Feliciana Parish also have higher median household and per capita incomes ($56,685 and $22,122, respectively) than the State averages, with 12.4 percent of families and 16.0 percent of persons living below the official poverty level (USCB 2017c).

3-116
Source: USCB 2017a
Figure 3-22. 2010 Census—Minority Block Groups Within a 50-mi (80-km) Radius of River Bend Station

3-117
Source: USCB 2017c
Figure 3-23. 2011–2015, American Community Survey 5-Year Estimates—Low-Income Block Groups Within a 50-mi (80 km) Radius of River Bend Station

3-118
3.13 Waste Management and Pollution Prevention
Like any nuclear power plant, RBS produces both radioactive and nonradioactive waste. This section describes waste management and pollution prevention at RBS.
3.13.1 Radioactive Waste
As discussed in Section 3.1.4 of this SEIS, RBS uses liquid, gaseous, and solid waste processing systems to collect and treat, as needed, radioactive materials produced as a byproduct of plant operations. Radioactive materials in liquid and gaseous effluents are reduced prior to being released into the environment so that the resultant dose to members of the public from these effluents is well within NRC and EPA dose standards. Radionuclides that can be efficiently removed from the liquid and gaseous effluents prior to release are converted to a solid waste form for disposal in a licensed disposal facility.
3.13.2 Nonradioactive Waste
Waste minimization and pollution prevention are important elements of operations at all nuclear power plants. Licensees are required to consider pollution prevention measures as dictated by the Pollution Prevention Act (Public Law 101-508) and the Resource Conservation and Recovery Act of 1976, as amended (Public Law 94-580) (NRC 2013b).
As described in Section 3.1.5, RBS has a nonradioactive waste management program to handle nonradioactive waste in accordance with Federal, State, and corporate regulations and procedures. RBS maintains a waste minimization program that uses material control, process control, waste management, recycling, and feedback to reduce waste.
RBS has a Stormwater Pollution Prevention Plan (SWPPP) that identifies potential sources of pollution that may affect the quality of stormwater discharges from permitted outfalls. The SWPPP also describes best management practices for reducing pollutants in stormwater discharges and assure compliance with the site’s Louisiana Pollutant Discharge Elimination System permit.
RBS also has a Spill Prevention, Control and Countermeasure (SPCC) plan (Entergy 2016f) to monitor areas within the site that have the potential to discharge oil into or upon navigable waters, as per regulations in 40 CFR Part 112, “Oil Pollution Prevention.” The SPCC plan identifies and describes the procedures, materials, equipment, and facilities that Entergy uses to minimize the frequency and severity of oil spills.
RBS is subject to EPA reporting requirements in 40 CFR 110, “Discharge of Oil,” pursuant to Section 311(b)(4) of the Federal Water Pollution Control Act. Under these regulations, RBS must report to the National Response Center any discharges of oil if the quantity may be harmful to the public health or welfare or the environment. From 2011 through mid-2017, RBS reported no oil discharges that triggered the reporting requirements in 40 CFR 110. RBS is also subject to the reporting provisions of the Louisiana Administrative Code, Title 33, Part I, Chapter 39, “Notification Regulations and Procedures for Unauthorized Discharges.” This reporting provision requires RBS to report the release to the environment of 42 gallons (1 barrel or 159 liters) of oil or more to the Louisiana Department of Public Safety and the Louisiana Department of Environmental Quality. From 2012 through mid-2017, RBS reported one spill that triggered this 42-gallon notification requirement. In October 2016, an estimated 60 gallons (227 liters) of hydraulic fluid from a service truck's hydraulic oil reservoir

3-119
leaked onto the ground. Entergy used sorbents (insoluble materials for picking up and retaining liquid) to absorb visible puddles, cleaned the area, and placed the fluid in drums for disposal. (Entergy 2017h, Entergy 2017c)


4-1
4 ENVIRONMENTAL CONSEQUENCES AND MITIGATING ACTIONS
4.1 Introduction
In this chapter, the NRC staff evaluates the environmental consequences of issuing a renewed license authorizing an additional 20 years of operation for River Bend Station, Unit 1 (RBS). The NRC staff’s evaluation of environmental consequences will include the following:
1) impacts associated with continued operations similar to those that have occurredduring the current license term
2) impacts of various alternatives to the proposed action, including a no-actionalternative (not issuing the renewed license) and replacement power alternatives(new nuclear, supercritical pulverized coal, natural gas combined-cycle, and acombination of natural gas, biomass, and energy conservation programs)
3) impacts from the termination of nuclear power plant operations and decommissioningafter the license renewal term (with emphasis on the incremental effect caused by anadditional 20 years of reactor operation)
4) impacts associated with the uranium fuel cycle5) impacts of postulated accidents (design-basis accidents and severe accidents)6) cumulative impacts of the proposed action of issuing a renewed license for RBS7) resource commitments associated with the proposed action, including unavoidable
adverse impacts, the relationship between short-term use and long-term productivity,and irreversible and irretrievable commitment of resources
8) new and potentially significant information on environmental issues related to theimpacts of operation during the renewal term
In this chapter, the NRC staff also compares the environmental impacts of license renewal with those of the no-action alternative and replacement power alternatives to determine whether the adverse environmental impacts of license renewal are so great that it would be unreasonable to preserve the option of license renewal for energy-planning decisionmakers. Chapter 2 of this supplemental environmental impact statement (SEIS) describes in detail the attributes of the agency’s proposed action (i.e., license renewal of River Bend Station, Unit 1) and the no-action alternative. Chapter 2, Section 2.2.2 further describes the NRC staff’s process for developing a range of reasonable alternatives to the proposed action including the replacement power alternatives that the staff selected for detailed analysis in this chapter, including supporting assumptions and data relied upon. As noted in Chapter 2, Table 2-1, the site location for various replacement power alternatives would be adjacent to RBS. Chapter 2, Table 2-2, summarizes the environmental impacts of the proposed action and alternatives to the proposed action.
The affected environment (i.e., environmental baseline) for each resource area considered, and against which the potential environmental impacts of the alternatives are measured, is described in Chapter 3. As documented in Chapter 3, the effects of ongoing reactor operations at RBS have become well established as environmental conditions have adjusted to and reflect the presence of the nuclear power plant.
As stated in sections 1.4 and 1.5, this SEIS documents the NRC staff’s environmental review of the RBS license renewal application and supplements the information provided in NUREG–1437, “Generic Environmental Impact Statement for License Renewal of Nuclear Plants” (GEIS) (NRC 2013b). The GEIS identifies 78 issues (divided into Category 1 and Category 2 issues) to

4-2
be evaluated for the proposed action in the license renewal environmental review process. Section 1.4 of this SEIS provides an explanation of the criteria for Category 1 issues (generic to all nuclear power plants) and Category 2 issues (specific to individual nuclear power plants) as well as the definitions of SMALL, MODERATE, and LARGE impact significance.
For Category 1 issues, the NRC staff can rely on the analysis in the GEIS unless otherwise noted. Table 4-1 lists the Category 1 (generic) issues that apply to River Bend Station, Unit 1 (RBS) during the proposed license renewal period. For these issues, the NRC staff did not identify any new and significant information during its review of the applicant’s environmental report, the site audits, or the scoping period that would change the conclusions presented in the GEIS. Therefore, there are no impacts related to these issues beyond those already discussed in the GEIS, and accordingly, these issues are not addressed further in this SEIS. The staff’s process for evaluating new and significant information is described in Section 4.14.
Table 4-1. Applicable Category 1 (Generic ) Issues for River Bend Station
Issue GEIS Section Impact Land-Use Onsite land use 4.2.1.1 SMALL Offsite land use 4.2.1.1 SMALL Visual Resources Aesthetic Impacts 4.2.1.2 SMALL Air Quality Air quality impacts (all plants) 4.3.1.1 SMALL Air quality effects of transmission lines 4.3.1.1 SMALL Noise Noise Impacts 4.3.1.2 SMALL Geologic Environment Geology and soils 4.4.1 SMALL Surface Water Resources Surface water use and quality (non-cooling system impacts) 4.5.1.1 SMALL Altered current patterns at intake and discharge structures 4.5.1.1 SMALL Altered salinity gradients 4.5.1.1 SMALL Scouring caused by discharged cooling water 4.5.1.1 SMALL Discharge of metals in cooling system effluent 4.5.1.1 SMALL Discharge of biocides, sanitary wastes, and minor chemical spills
4.5.1.1 SMALL
Effects of dredging on surface water quality 4.5.1.1 SMALL Temperature effects on sediment transport capacity 4.5.1.1 SMALL Groundwater Resources Groundwater contamination and use (non-cooling system impacts)
4.5.1.2 SMALL
Groundwater use conflicts (plants that withdraw less than 100 gallons per minute [gpm])
4.5.1.2 SMALL
Groundwater quality degradation resulting from water withdrawals
4.5.1.2 SMALL

4-3
Issue GEIS Section Impact Terrestrial Resources Exposure of terrestrial organisms to radionuclides 4.6.1.1 SMALL Cooling tower impacts on vegetation (plants with cooling towers)
4.6.1.1 SMALL
Bird collisions with plant structures and transmission lines 4.6.1.1 SMALL Transmission line ROW management impacts on terrestrial resources
4.6.1.1 SMALL
Electromagnetic fields on flora and fauna (plants, agricultural crops, honeybees, wildlife, livestock)
4.6.1.1 SMALL
Aquatic Resources Impingement and entrainment of aquatic organisms (plants with cooling towers)
4.6.1.2 SMALL
Entrainment of phytoplankton and zooplankton (all plants) 4.6.1.2 SMALL Thermal impacts on aquatic organisms (plants with cooling towers)
4.6.1.2 SMALL
Infrequently reported thermal impacts (all plants) 4.6.1.2 SMALL Effects of cooling water discharge on dissolved oxygen, gas supersaturation, and eutrophication
4.6.1.2 SMALL
Effects of nonradiological contaminants on aquatic organisms 4.6.1.2 SMALL Exposure of aquatic organisms to radionuclides 4.6.1.2 SMALL Effects of dredging on aquatic resources 4.6.1.2 SMALL Effects on aquatic resources (non-cooling system impacts) 4.6.1.2 SMALL Impacts of transmission line ROW management on aquatic resources
4.6.1.2 SMALL
Losses from predation, parasitism, and disease among organisms exposed to sublethal stresses
4.6.1.2 SMALL
Socioeconomics Employment and income, recreation and tourism 4.8.1.1 SMALL Tax Revenues 4.8.1.2 SMALL Community services and education 4.8.1.3 SMALL Population and housing 4.8.1.4 SMALL Transportation 4.8.1.5 SMALL Human Health Radiation exposures to the public 4.9.1.1.1 SMALL Radiation exposures to plant workers 4.9.1.1.1 SMALL Human health impact from chemicals 4.9.1.1.2 SMALL Microbiological hazards to plant workers 4.9.1.1.3 SMALL Physical occupational hazards 4.9.4.1.5 SMALL Postulated accidents Design-basis accidents 4.9.1.2 SMALL Waste Management Low-level waste storage and disposal 4.11.1.1 SMALL Onsite storage of spent nuclear fuel 4.11.1.2 SMALL Offsite radiological impacts of spent nuclear fuel and high-level waste disposal
4.11.1.3 (a)

4-4
Issue GEIS Section Impact Mixed waste storage and disposal 4.11.1.4 SMALL Nonradioactive waste storage and disposal 4.11.1.4 SMALL Uranium Fuel Cycle Offsite radiological impacts—individual impacts from other than the disposal of spent fuel and high-level waste
4.12.1.1 SMALL
Offsite radiological impacts—collective impacts from other than the disposal of spent fuel and high-level waste
4.12.1.1 (b)
Nonradiological impacts of the uranium fuel cycle 4.12.1.1 SMALL Transportation 4.12.1.1 SMALL Termination of Nuclear Power Plant Operations and Decommissioning Termination of plant operations and decommissioning 4.12.2.1 SMALL
(a) The environmental impact of this issue for the time frame beyond the licensed life for reactor operations is contained in NUREG–2157 (NRC 2014a).
(b) There are no regulatory limits applicable to collective doses to the general public from fuel cycle facilities. The practice of estimating health effects on the basis of collective doses may not be meaningful. All fuel cycle facilities are designed and operated to meet the applicable regulatory limits and standards. The Commission concludes that the collective impacts are acceptable.
The Commission concludes that the impacts would not be sufficiently large to require the NEPA) conclusion, for any plant, that the option of extended operation under 10 CFR part 54 should be eliminated. Accordingly, while the Commission has not assigned a single level of significance for the collective impacts of the uranium fuel cycle, this issue is considered Category 1.
Source: Table B-1 in Appendix B, Subpart A, to 10 CFR Part 51 and NRC 2013b
The NRC staff analyzed the Category 2 (site-specific) issues applicable to RBS during the proposed license renewal period and assigned impacts to these issues as shown in Table 4-2.
Table 4-2. Applicable Category 2 (Site-Specific) Issues for the River Bend Station Site
Issue GEIS Section Impact(a) Surface Water Resources Surface water use conflicts (plants with cooling ponds or cooling towers using makeup water from a river)
4.5.1.1 SMALL
Groundwater Resources Groundwater use conflicts (plants with closed-cycle cooling systems that withdraw makeup water from a river)
4.5.1.2 SMALL
Radionuclides released to groundwater 4.5.1.2 SMALL to MODERATE Terrestrial Resources Effects on terrestrial resources (noncooling system impacts) 4.6.1.1 SMALL Water use conflicts with terrestrial resources (plants with cooling ponds or cooling towers using makeup water from a river)
4.6.1.1 SMALL
Aquatic Resources Water use conflicts with aquatic resources (plants with cooling ponds or cooling towers using makeup water from a river)
4.6.1.2 SMALL

4-5
Issue GEIS Section Impact(a) Special Status Species and Habitats Threatened, endangered, and protected species and essential fish habitat
4.6.1.3 may affect, but is not likely to adversely affect
the pallid sturgeon Historic and Cultural Resources Historic and cultural resources 4.7.1 would not adversely
affect known historic properties
Human Health Microbiological hazards to the public (plants with cooling ponds or canals or cooling towers that discharge to a river)
4.9.1.1.1 SMALL
Chronic effects of electromagnetic fields(b) 4.9.1.1.1 Uncertain Impact Electric shock hazards 4.9.1.1.1 SMALL Postulated Accidents Severe accidents 4.9.1.2 SMALL Environmental Justice Minority and low-income populations 4.10.1 no disproportionately
high and adverse human health and
environmental effects Cumulative Impacts Cumulative Impacts 4.13 Not applicable (a) Impact determinations for Category 2 issues based on findings described in Sections 4.2 through 4.13 for the
proposed action.(b) This issue was not designated as Category 1 or 2 and is discussed in Section 4.11.1 below.
Source: Table B-1 in Appendix B, Subpart A, to 10 CFR Part 51 and NRC 2013b
4.2 Land Use and Visual Resources
This section describes the potential land use and visual resources impacts of the proposed action (license renewal) and alternatives to the proposed action.
4.2.1 Proposed Action
As identified in Table 4-1, the impacts of all generic land use or visual resource issues would be SMALL. Table 4-2 does not identify any site-specific (Category 2) land use or visual resource issues.
4.2.2 No-Action Alternative
4.2.2.1 Land Use
Under the no-action alternative, the NRC would not issue a renewed license, and RBS would shut down on or before the expiration of the current facility operating license (August 29, 2025). Under this alternative, land uses would remain similar to those that would occur under the proposed license renewal except that land could be converted to other uses sooner if RBS were to shut down in 2025 instead of operating for an additional 20 years. The GEIS (NRC 2013b)

4-6
notes that land use impacts could occur in other areas beyond the immediate nuclear plant site as a result of the no-action alternative if new power plants are built to replace lost power generating capacity. However, such impacts would likely be experienced no matter which alternative occurs. The NRC staff concludes that the no-action alternative is unlikely to noticeably alter or have more than minor effects on land use. Thus, the NRC staff concludes that the impacts of the no-action alternative on land use during the proposed license renewal term would be SMALL.
4.2.2.2 Visual Resources
Shutdown of RBS would not significantly change the visual appearance of the site. The most notable visual change would be the elimination of condensate plumes that, under certain meteorological conditions, are visible emerging from RBS’s mechanical draft cooling towers. The NRC staff concludes that the impacts of the no-action alternative on visual resources would be SMALL.
4.2.3 Replacement Power Alternatives: Common Impacts
4.2.3.1 Land Use
Each replacement power alternative would entail construction and operation of a new energy generating facility on the existing Entergy property and would result in qualitatively similar impacts to land use. Construction would require the permanent commitment of land for the new plant, plant intake and discharge structures, water treatment facilities, and cooling towers. Other construction-related land use impacts would include land clearing, excavations, drilling of monitoring wells, and the installation of temporary support facilities. Material laydown areas and onsite concrete batch plants could also result in temporary land use changes. Entergy would site any new plant on an area of the RBS site that it had previously excavated to support a planned second nuclear unit (the second unit was never built). Using this previously excavated land would minimize land use changes. The existing RBS transmission lines and structures would adequately support each replacement power alternative, and the existing RBS intake and discharge structures could also support these alternatives with some modifications, all of which would minimize land use impacts. Clearing and conversion of some land could occur depending on the specific siting of buildings and infrastructure within the site footprint.
Operation of any new plant would not result in additional land use impacts on the site beyond those identified during construction. However, replacement power alternatives could alter offsite land uses during the operational period as a result of mining, extraction, or waste disposal activities associated with each plant’s particular type of fuel.
4.2.3.2 Visual Resources
Construction of any of the replacement power alternatives would require clearing, excavation, and the use of construction equipment. Because the Entergy property is situated such that trees hide it from view from offsite, these temporary visual impacts would be minimal in the context of the area’s existing aesthetics, and construction machinery and activities would blend into the adjacent skyline. Additionally, a tree buffer lies between the RBS site and U.S. Highway 61 (US-61) such that construction activities are unlikely to be visible to travelers on nearby roads. Construction of any new plant would not be visible from any sensitive viewing areas, such as cultural resources or historic properties. Painting structures, ducts, pipes, and tanks a blue-gray color, as Entergy has done at RBS, would allow these features to blend into the

4-7
concrete of the existing site structures and further reduce any visual impacts. For offsite infrastructure associated with a new plant, such as pipelines, use of construction equipment may create short-term visual impacts during the construction period depending on the location of the infrastructure and visibility in the context of the surrounding landscape.
During operation, visual impacts of any of the replacement power alternatives would be similar in type and magnitude to those assessed for the proposed RBS license renewal, which would be SMALL as identified in Table 4-1. New cooling towers and their associated plumes would be the most obvious visual impact and would likely be visible farther from the site than other buildings and infrastructure. A new coal plant would visibly emit smoke from smoke stacks when operating. However, as previously discussed, any new plant would be located on the RBS site, where tall structures and plumes are not visible offsite due to the continuous tree line surrounding the site. Therefore, any changes would blend in with the existing viewshed.
4.2.4 New Nuclear Alternative
4.2.4.1 Land Use
The NRC staff did not identify any impacts for the new nuclear alternative beyond those discussed in the impacts common to all replacement power alternatives. However, the impacts to land use could be slightly more intense for the new nuclear alternative compared to RBS license renewal due to the larger land area requirement. Thus, there is more potential for this alternative to require the conversion of land from nonindustrial uses to industrial use. For instance, under a new nuclear alternative, landscaped or natural areas adjacent to currently developed areas may be cleared and permanently occupied by plant buildings and infrastructure. Nevertheless, such impacts would be minimal given that Entergy previously cleared an area of the site for an additional nuclear unit that it did not build. Also, Entergy would use some existing buildings and infrastructure for the new nuclear plant. The NRC staff concludes that the impacts to land use from construction and operation of a new nuclear alternative would be SMALL.
4.2.4.2 Visual Resources
The NRC staff did not identify any impacts for the new nuclear alternative beyond those discussed in the impacts common to all alternatives. The NRC staff concludes that impacts of constructing and operating a new nuclear alternative on visual resources would be SMALL.
4.2.5 Supercritical Pulverized Coal Alternative
4.2.5.1 Land Use
In addition to the impacts common to all replacement power alternatives, the supercritical pulverized coal alternative (coal alternative) would require a significant amount of land for coal mining. Such impacts would be partially offset by the elimination of land used for uranium mining to supply fuel to RBS but would still likely result in noticeable impacts to land use during the coal plant’s operational period. The NRC staff concludes that the impacts of constructing and operating a coal alternative on land use would be SMALL during construction and SMALL to MODERATE during operation.

4-8
4.2.5.2 Visual Resources
The NRC staff did not identify any impacts for the new coal plant beyond those discussed in the impacts common to all replacement power alternatives given the current industrial nature of the RBS site. The NRC staff concludes that impacts of constructing and operating a coal alternative on visual resources would be SMALL.
4.2.6 Natural Gas Combined-Cycle Alternative
4.2.6.1 Land Use
In addition to the impacts common to all replacement power alternatives, the natural gas combined-cycle alternative (natural gas alternative) would require the construction a new gas pipeline to connect the plant to an existing pipeline that lies approximately 2 mi (3.2 km) east of the site. An area of 25 ac (10 ha) of land would be required to create the right-of-way for this pipeline, which would create minor land use impacts. Because of the abundance of natural gas being transported through a nearby pipeline, the use of additional offsite land during the operational period for gas extraction is unlikely. The NRC staff concludes that impacts of constructing and operating a natural gas alternative on land use would be SMALL.
4.2.6.2 Visual Resources
The NRC staff did not identify any impacts for the natural gas alternative beyond those discussed in the impacts common to all replacement power alternatives. The NRC staff concludes that impacts of constructing and operating a natural gas alternative on visual resources would be SMALL.
4.2.7 Combination Alternative (Natural Gas Combined-Cycle, Biomass, and Demand-Side Management)
4.2.7.1 Land Use
The NRC staff did not identify any impacts for the natural gas and biomass portions of the combination alternative beyond those discussed in the impacts common to all replacement power alternatives and those described for the natural gas alternative. The demand-side management portion of the combination alternative, which would account for approximately 11 percent of the combination alternative’s power generation, would not require any new construction or otherwise result in land use changes. Thus, there would be no land use impacts associated with this portion of the alternative. Although the biomass component would require offsite land use for the cultivation of energy crops (fuel), land use impacts associated with the production of crops is already occurring and would be the same regardless of whether crops are used as feedstock for electricity generation, for food, or for some other purpose. The NRC staff concludes that the overall impacts of implementing the combination alternative on land use would be SMALL.
4.2.7.2 Visual Resources
The NRC staff did not identify any impacts for the natural gas and biomass portions of the combination alternative beyond those discussed in the impacts common to all replacement power alternatives and those described for the natural gas alternative. The demand-side management portion of the combination alternative would not result in any visual impacts.

4-9
The NRC staff concludes that impacts of implementing the combination alternative on visual resources would be SMALL.
4.3 Air Quality and Noise
This section describes the potential air quality and noise impacts of the proposed action (license renewal) and alternatives to the proposed action.
4.3.1 Proposed Action
4.3.1.1 Air Quality
As identified in Table 4-1, the impacts of all generic air quality issues would be SMALL. Table 4-2 does not identify any site-specific (Category 2) air quality issues for RBS.
4.3.1.2 Noise
As identified in Table 4-1, the impacts of all generic noise issues would be SMALL. Table 4-2 does not identify any site-specific (Category 2) noise issues for RBS.
4.3.2 No-Action Alternative
4.3.2.1 Air Quality
Under the no-action alternative, the NRC would not issue a renewed license, and RBS would shut down on or before the expiration of the current facility operating license. When the plant stops operating, there would be a reduction in air pollutant emissions from activities related to plant operation, such as use of combustion sources (diesel generators, engines), use of cooling towers, and vehicle traffic. Activity from these air emission sources would not cease, but emissions would be lower. Therefore, the NRC staff concludes that if emissions decrease, the impact on air quality from shutdown of RBS would be SMALL.
4.3.2.2 Noise
When the plant stops operating, there will be a reduction in noise from activities related to plant operation, including noise from the turbine generator, onsite gun range, and vehicle traffic (e.g., workers, deliveries). As activity from noise sources is reduced, NRC staff expects the impact on ambient noise levels is expected to be less than current operations of RBS; therefore, the NRC staff concludes that the impacts of the no-action alternative on noise would be SMALL.
4.3.3 Replacement Power Alternatives: Air Quality and Noise Common Impacts
4.3.3.1 Air Quality
Construction of a power station would result in temporary impacts on local air quality. Air emissions would be intermittent and would vary based on the level and duration of specific activities throughout the construction phase. During the construction phase, the primary sources of air emissions would consist of engine exhaust and fugitive dust emissions. Engine exhaust emissions would be from heavy construction equipment and commuter, delivery, and support vehicular traffic traveling to and from the facility as well as within the site. Fugitive dust emissions would be from soil disturbances by heavy construction equipment (e.g., earthmoving,

4-10
excavating, and bulldozing); vehicle traffic on unpaved surfaces; concrete batch plant operations; and wind erosion to a lesser extent. Various mitigation techniques and best management practices (BMPs) (e.g., watering disturbed areas, reducing equipment idle times, and using ultra-low sulfur diesel fuel) could be used to minimize air emissions and to reduce fugitive dust. Air emissions include criteria pollutants (particulate matter, nitrogen oxides, carbon monoxide, and sulfur dioxide), volatile organic compounds (VOCs), hazardous air pollutants (HAPs), and greenhouse gases (GHGs). Small quantities of volatile organic compounds and hazardous air pollutants would be released from equipment refueling, onsite maintenance of the heavy construction equipment, and other construction-finishing activities as well as from cleaning products, petroleum-based fuels, and certain paints.
The impacts on air quality as a result of operation of a power station will depend on the energy technology (i.e., fossil-fuel based or nuclear). Fossil-fuel based power plants result in larger amounts of air emissions than nuclear power plants. Worker vehicles, auxiliary power equipment, and mechanical draft cooling tower operation will result in additional emissions.
4.3.3.2 Noise
Construction of a power station is similar to construction of any large industrial project in that all involve many noise-generating activities. In general, noise emissions vary with each phase of construction, depending on the level of activity, the mix of construction equipment for each phase, and site-specific conditions. Several factors, including source-receptor configuration, land cover, meteorological conditions (e.g., temperature, relative humidity, and vertical profiles of wind and temperature), and screening (e.g., topography, and natural or man-made barriers), affect noise propagation to receptors. Typical construction equipment, such as dump trucks, loaders, bulldozers, graders, scrapers, air compressors, generators, and mobile cranes, would be used, and pile-driving and blasting activities would take place. Other noise sources include commuter, delivery, and support vehicular traffic traveling to and from the facility and within the site. However, noise from vehicular traffic related to constructing a replacement power alternative would be intermittent and similar to current RBS noise levels from vehicular traffic. During the construction phase, a variety of construction equipment would be used for varying durations. Noise levels from construction equipment at 50 ft (15 m) distance are typically in the 85- to 100-dBA range (DoT 2006); however, noise levels attenuate rapidly with distance. For instance, at a 0.9 mi (1.4-km) distance from construction equipment with a sound strength of 85 dBA, noise levels drop to 45 dBA (GSU 2016). Given the approximate distance of noise sensitive receptors to the site of the replacement power alternatives (0.85 mi (1.4 km)), the NRC staff does not expect noise to be noticeable from construction equipment.
Noise from replacement power alternative plant operation will result from both continuous onsite sources, such as mechanical draft cooling towers, transformers, turbines, and other auxiliary equipment, as well as offsite sources, such as vehicular traffic (e.g., employee commuting, delivery, and support). Offsite noise as a result of vehicles would be intermittent and similar to current RBS noise levels from vehicular traffic. Similarly, noise sources and levels during operation of replacement power alternatives would be similar to existing RBS conditions.

4.3.4 New Nuclear Alternative
4.3.4.1 Air Quality
Air emissions and sources would include those identified in Section 4.3.3.1. Because air emissions from construction activities would be limited, local, and temporary, the NRC staff concludes that the associated air quality impacts from construction of a new nuclear alternative would be SMALL.
Operation of a new nuclear generating plant would result in air emissions similar in magnitude to those of RBS. Sources of air emissions will include stationary combustion sources (e.g., diesel generators and auxiliary boilers), mechanical draft cooling towers, and mobile sources (e.g., worker vehicles, onsite heavy equipment, and support vehicles). In general, most stationary combustion sources at a nuclear power plant would operate only for limited periods, often during periodic maintenance testing. A new nuclear power plant would need to secure a permit from the Louisiana Department of Environmental Quality for air pollutants associated with its operations (e.g., criteria pollutants, volatile organic compounds, hazardous air pollutants, and greenhouse gases). The NRC staff expects the air emissions for combustion sources from a new nuclear plant to be similar to those currently being emitted from RBS (see Section 3.2.1). Therefore, NRC staff expects emissions to fall far below the threshold for major sources (100 tons (91 MT) per year) and the threshold for mandatory greenhouse gas reporting (27,558 tons (25,000 MT) per year of carbon dioxide equivalents (CO2eq)). Additional air emissions would result from the 680 employees commuting to and from the new nuclear facility. The NRC staff does not expect air emissions from operation of a new nuclear alternative to contribute to National Ambient Air Quality Standard violations. The NRC staff concludes that the impacts of operation of a new nuclear alternative on air quality would be SMALL.
4.3.4.2 Noise
Noise sources for a new nuclear alternative would include those identified above under Section 4.3.3.2. Based on the temporary nature of construction activities, distance of noise-sensitive receptors from the site, consideration of noise attenuation from the construction site, and good noise control practices, the NRC staff concludes that the potential noise impacts of construction activities from a new nuclear alternative would be SMALL. Noise sources and levels during operation of a new nuclear alternative would be similar to existing RBS conditions. Therefore, the NRC staff concludes that noise impacts from operation of a new nuclear alternative would be SMALL.
4.3.5 Supercritical Pulverized Coal Alternative
4.3.5.1 Air Quality
Air emissions and sources for construction of the coal alternative would include those identified above under Section 4.3.3.1. Since air emissions from construction activities would be limited, local, and temporary, the NRC staff concludes that the associated air quality impacts from construction would be SMALL.
The staff estimated air emissions for operating the coal alternative using air emission factors developed by the U.S. Department of Energy’s (DOE’s) National Energy Technology Laboratory (NETL 2010a) for a supercritical pulverized coal power plant that is equipped with low nitrogen oxide burners and over-fire air to control nitrogen oxides, wet limestone forced-oxidation scrubbers to control sulfur dioxide, and a monoethanolamine (MEA)-based solvent process to
4-11

4-12
• sulfur dioxide (SO2)—140 tons (127 MT) per year• nitrogen oxides (NOx)—4,030 tons (3,655 MT) per year• particulate matter (PM10)—770 tons (698 MT) per year• carbon monoxide (CO)—90 tons (81 MT) per year• mercury (Hg)—0.07 tons (0.06 MT) per year• carbon dioxide equivalent (CO2eq)—1.30 million tons (1.18 million MT) per year
Operation of the mechanical draft cooling tower would result in additional particulate matter emissions over the values presented above. Indirect criteria emission sources will include up to 300 worker vehicles commuting to and from the coal facility and particulate matter as result of coal mining. A new coal plant would qualify as a major-emitting industrial facility and would be subject to a New Source Review (NSR) and Title V, “Permits,” permitting requirements under the Clean Air Act of 1970, as amended (CAA) (42 U.S.C. 7651 et seq.). These permitting requirements ensure that the plant operator minimizes air emissions and does not substantially degrade the local air quality. Additionally, various Federal and State regulations aimed at controlling air pollution would affect a coal plant.
Based on the NRC staff’s air emission estimates listed above, criteria pollutant emissions and greenhouse gas emissions from a coal alternative would be noticeable and significant. Carbon dioxide emissions would be much larger than the threshold in the U.S. Environmental Protection Agency’s Greenhouse Gas Tailoring Rule, and nitrogen oxide and particulate matter emissions would exceed the threshold for major sources. As a result of the significant criteria air emissions (nitrogen oxides and particulate matter) and greenhouse gas emissions, the NRC staff concludes that the air quality impacts associated with operation of a coal alternative would be MODERATE.
4.3.5.2 Noise
Noise sources would include those identified above under Section 4.3.3.2. Both onsite and offsite noise sources would be intermittent and short term, lasting only through the duration of plant construction. Based on the temporary nature of construction activities, distance of noise sensitive receptors from the site, consideration of noise attenuation from the construction site, and good noise control practices, the NRC staff concludes that the potential noise impacts of construction activities from a coal alternative would be SMALL.
In addition to the onsite and offsite noise sources discussed above under Section 4.3.3.2 as common to all replacement power alternatives, intermittent noise would result from delivery of coal via the Mississippi River to the facility to support operation of a coal power plant. However, noise levels from onsite and offsite sources would be similar to existing conditions since noise sources would be similar to those resulting from operation of RBS and waterborne commerce on the Mississippi River. Therefore, the NRC staff concludes that noise impacts from operation of a coal alternative would be SMALL.
4.3.6 Natural Gas Combined-Cycle Alternative
4.3.6.1 Air Quality
Air emissions and sources for construction of the natural gas alternative would include those identified above under Section 4.3.3.1. There would also be additional air emissions resulting from construction of a new or upgraded pipeline that will connect to existing natural gas supply
remove carbon dioxide from the flue gas. Assuming a total gross capacity of 1,200 MW and capacity factor of 0.85, the NRC staff estimate following air emissions for the coal units:

4-13
lines east of the site. Air emissions would be localized, intermittent, and short lived, and adherence to well-developed and well-understood construction best management practices would mitigate air quality impacts. Therefore, the NRC staff concludes that construction-related impacts on air quality from a natural gas alternative would be of relatively short duration and would be SMALL.
Operation of a natural gas plant would result in emissions of criteria pollutants and greenhouse gases. The sources of air emissions during operation include gas turbines through heat recovery steam generator stacks. The staff estimated air emissions for the natural gas alternative using emission factors developed by the U.S. Department of Energy’s National Energy Technology Laboratory (NETL 2010a). Assuming a total gross capacity of 1,200 MW and capacity factor of 0.87, the NRC staff estimates the following air emissions for the natural gas units:
• sulfur oxides—14 tons (12 metric tons (MT)) per year• nitrogen oxides—305 tons (277 MT) per year• carbon monoxide—30 tons (27 MT) per year• PM10—22 tons (20 MT) per year• carbon dioxide equivalents (CO2eq)—3.9 million tons (3.6 million MT) per year
Operation of the mechanical draft cooling towers and up to 180-worker vehicles would also result in additional criteria emissions above those presented in the list. Operation of a new natural gas plant would qualify as a major-emitting industrial facility and would be subject to a New Source Review and Title V air permitting requirements under the Clean Air Act of 1970, as amended (42 U.S.C. 7651 et seq.), to ensure that air emissions are minimized and that the local air quality is not substantially degraded. Additionally, various Federal and State regulations aimed at controlling air pollution would affect a natural gas alternative.
Based on the NRC staff’s air emission estimates, nitrogen oxide and greenhouse gas emissions from a natural gas plant would be noticeable and significant. Carbon dioxide emissions would be much larger than the threshold in EPA’s Greenhouse Gas Tailoring Rule, and nitrogen oxide emissions would exceed the threshold for major sources. The NRC staff concludes that the overall air quality impacts associated with operation of a natural gas alternative would be SMALL to MODERATE.
4.3.6.2 Noise
In addition to the onsite and offsite noise sources discussed above under Section 4.3.3.2, construction of pipelines to support operation of a natural gas alternative would result in additional offsite noise. However, construction activities would be temporary and intermittent. In consideration of noise attenuation with distance and good noise control practices, the NRC staff concludes that the potential noise impacts of construction activities from a natural gas alternative would be SMALL. During the operation phase, noise sources from a natural gas alternative would include those discussed above as well as offsite mechanical noise from compressor stations and pipeline blowdowns. The majority of noise-producing equipment (e.g., mechanical draft cooling towers, turbines, pumps) would be located inside the power block, and the NRC staff does not anticipate noise levels to be significantly greater than noise levels at RBS. Therefore, the NRC staff concludes that operation-related noise impacts from the natural gas alternative would be SMALL.

4-14
4.3.7 Combination Alternative (Natural Gas Combined-Cycle, Biomass, and Demand-Side Management)
4.3.7.1 Air Quality
Air quality impacts would result primarily from construction and operation of natural gas and biomass-fired portions of this combination alternative. The NRC staff does not anticipate air quality impacts from the demand-side management component of the combination alternative. Air emissions and sources for construction of the natural gas and biomass-fired portions of this combination alternative would include those identified above under Section 4.3.3.1. Air emissions from construction would be localized and intermittent, and well-understood construction best management practices would mitigate air quality impacts. Therefore, the NRC staff concludes that construction-related impacts on air quality from the natural gas and biomass-fired portions of the combination alternative would be SMALL.
Air emissions associated with the operation of the natural gas portion of the combination alternative are similar to those associated with the natural gas alternative. However, emissions associated with the natural gas portion of the combination alternative are reduced proportionally because the electricity output of the natural gas unit under the combination alternative is 66 percent of that of the natural gas only alternative. Operation of the four biomass-fired units would result in emissions from the conversion of the fuel feedstock (crops, forest and crop residue, wood waste, and municipal solid waste) into a gas that will primarily consist of carbon monoxide and carbon dioxide. Emissions from biomass-fired plants depend on the type of biomass feedstock and gasification technology (Ciferno and Marano 2002; NREL 2003).
The NRC staff estimates the following air emissions for the natural gas and biomass-fired portions of the combination alternative based on emission factors developed by the U.S. Department of Energy’s National Energy Technology Laboratory and the National Renewal Energy Laboratory (NETL 2010a; NREL 1997):
• sulfur oxides—80 tons (73 metric tons (MT)) per year• nitrogen oxides—1,600 tons (1,450 MT) per year• carbon monoxide—7,240 tons (6,570 MT) per year• PM10—365 tons (332 MT) per year• carbon dioxide equivalents (CO2eq)—4.7 million tons (4.2 million MT) per year
Operation of the mechanical draft cooling towers and up to 210-worker vehicles would also result in additional criteria emissions above those presented in the list. New natural gas and biomass-fired units would qualify as major-emitting industrial facilities and would be subject to a New Source Review and the Federal and State regulations aimed at controlling air pollution. Based on the air emission estimates shown above, the NRC staff expects that nitrogen oxide, carbon monoxide, and greenhouse gas emissions from the natural gas and biomass portions of the combination alternative would be noticeable and significant. Carbon dioxide emissions would be much larger than the threshold in EPA’s Greenhouse Gas Tailoring Rule, and nitrogen oxide and carbon monoxide emissions would exceed the threshold for major sources. The NRC staff concludes that the overall air quality impacts associated with operation of the combination alternative would be MODERATE.
4-15
4.3.7.2 Noise
The onsite and offsite construction-related noise sources for the natural gas portion of the combination alternative would be similar to those for construction of the natural gas alternative discussed above under Section 4.3.6.2. The construction-related noise sources for the biomass portion of the combination alternative would include those discussed above and would be intermittent and temporary. Given the distance of noise sensitive receptors from the site, the NRC staff concludes that the potential noise impacts of construction activities from the biomass portion of this alternative would be SMALL. Therefore, the NRC staff concludes that construction impacts from the combination alternative would be SMALL.
The NRC staff does not anticipate noise impacts from the demand-side management component of the combination alternative. Offsite and onsite noise sources from operation of the natural gas and biomass portions of the combination alternative would include those identified above. Noise levels during operation of the natural gas and biomass portions of this combination alternative would be similar to existing conditions associated with noise from RBS operations since the noise sources are similar. Therefore, noise impacts from operation of the combination alternative would not be noticeable and would be SMALL.
4.4 Geologic Environment
This section describes the potential geology and soils impacts of the proposed action (license renewal) and alternatives to the proposed action.
4.4.1 Proposed Action
As identified in Table 4-1, the impacts of the single geologic environment issue (geology and soils) would be SMALL. Table 4-2 does not identify any site-specific (Category 2) geologic environment issues.
4.4.2 No-Action Alternative
Under the no-action alternative, the NRC would not issue a renewed license, and RBS would shut down on or before the expiration of the current facility operating license. There would not be any impacts to the geology and soils at the RBS site with shutdown of the facility. With the shutdown of the facility, no additional land would be disturbed. Therefore, impacts on geology and soil resources from the no-action alternative would be SMALL.
4.4.3 Replacement Power Alternatives: Common Impacts
During construction for all the replacement power alternatives, sources of aggregate material, (such as crushed stone, sand, and gravel) would be required to construct buildings, foundations, roads, and parking lots. The NRC staff presumes that these resources would likely be obtained from commercial suppliers using local or regional sources. Land clearing during construction and installation of power plant structures and impervious surfaces would expose soils to erosion and alter surface drainage. Best management practices would be implemented in accordance with applicable permitting requirements so as to reduce soil erosion. These practices would include the use of sediment fencing, staked hay bales, check dams, sediment ponds, and riprap aprons at construction and laydown yard entrances; mulching and geotextile matting of disturbed areas; and rapid reseeding of temporarily disturbed areas. Removed soils and any excavated materials would be stored onsite for redistribution such as for backfill at the end of

4-16
construction. Construction impacts would be temporary and localized. Therefore, the common impacts of construction on geology and soil resources would be SMALL.
During operations for all the replacement power alternatives, no additional land would be disturbed. Therefore, the NRC staff concludes that the common impacts of operations on geology and soil resources would be SMALL.
4.4.4 New Nuclear Alternative
The NRC staff did not identify any impacts to the geologic environment for the new nuclear alternative beyond those discussed above as common to all replacement power alternatives. Therefore, NRC staff concludes that the impacts to geology and soil resources from construction and operation of a new nuclear alternative would be SMALL.
4.4.5 Supercritical Pulverized Coal Alternative
The NRC staff did not identify any impacts to the geologic environment for the coal alternative beyond those discussed above as common to all replacement power alternatives. Therefore, NRC staff concludes that the impacts to geology and soil resources from construction and operation of a coal alternative would be SMALL.
4.4.6 Natural Gas Combined-Cycle Alternative
The NRC staff did not identify any impacts to the geologic environment for the natural gas alternative beyond those discussed above as common to all replacement power alternatives. Therefore, NRC staff concludes that the impacts to geology and soil resources from construction and operation of a natural gas alternative would be SMALL.
4.4.7 Combination Alternative (Natural Gas Combined-Cycle, Biomass, and Demand-Side Management)
The NRC staff did not identify any geologic impacts for the combination alternative beyond those discussed above. Therefore, NRC staff concludes that the impacts to geology and soil resources from construction and operation of a combination alternative would be SMALL.
4.5 Water Resources
This section describes the potential surface water and groundwater resources impacts of the proposed action (license renewal) and alternatives to the proposed action.
4.5.1 Proposed Action
4.5.1.1 Surface Water Resources
As identified in Table 4-1, the impacts of all generic surface water resources issues would be SMALL. Table 4-2 identifies the one site-specific (Category 2) issue related to surface water resources applicable to RBS during the license renewal term. This issue is analyzed below.
4-17
Category 2 Issue Related to Surface Water Resources: Surface Water Use Conflicts (Plants with Cooling Ponds or Cooling Towers Using Makeup Water from a River)
For nuclear power plants using cooling towers or cooling ponds supplied with makeup water from a river, the potential impact on the flow of the river and water availability to meet the demands of other users is a Category 2 issue. Category 2 issues require a plant-specific assessment.
In evaluating the potential impacts resulting from surface water use conflicts associated with license renewal, the NRC staff uses as its baseline the resource conditions described in Section 3.5.1. These baseline conditions encompass the defined hydrologic (flow) regime of the surface water(s) that are potentially affected by continued operations, as well as the magnitude of surface water withdrawals for cooling and other purposes (as compared to any applicable appropriation and permitting standards). The baseline also considers other downstream uses and users of surface water.
The mean annual discharge of the Lower Mississippi River measured at the U.S. Geological Survey (USGS) gage at Baton Rouge, LA, is 547,373 cubic feet per second (cfs) (15,463 cubic meters per second (m3/s)). RBS withdraws an average of 27.4 cfs (0.77 m3/s), equivalent to 17.7 mgd (67,000 m3/day), of water from the St. Francisville reach of the Lower Mississippi River. Consumptive use averages 21.4 cfs (0.6 m3/s), or about 13.8 mgd (52,200 m3/day). This consumptive use is equivalent to about 0.004 percent of the Lower Mississippi River’s mean annual discharge (flow).
In addition to considering average flow conditions, the NRC staff also evaluated the impacts of continued RBS operations on low-flow conditions in the Mississippi River Basin and the Lower Mississippi River. At the Baton Rouge gaging station, the lowest daily mean flow observed to date is 141,000 cfs (3,980 m3/s) recorded on October 31, 2012, and the 90 percent exceedance flow is approximately 235,500 cfs (6,650 m3/s) for the station’s period of record. The 90 percent exceedance flow is an indicator value for hydrologic drought.
Due to the operation of the Old River Control Structure, river flow past the RBS site would not be expected to fall below 100,000 cfs (2,800 m3/s) in the future given current hydrologic conditions in the river basin.
Compared to the established indicators of low-flow conditions as recorded at Baton Rouge (i.e., lowest daily mean and 90-percent exceedance flows), RBS’s current consumptive water use (i.e., 21.4 cfs (0.6 m3/s)) represents a 0.015 and a 0.009-percent reduction, respectively, in the flow of the river downstream of the RBS property. The NRC staff finds these hydrologic effects to be negligible. Further, Entergy states that RBS’s consumptive water use would not be expected to increase during the license renewal term (Entergy 2017h).
In conclusion, the NRC staff’s review indicates that consumptive water use associated with RBS operations would continue to have no substantial impact on downstream water availability. RBS’s surface water withdrawals and relatively low rate of consumptive use of river flow from the Lower Mississippi River are unlikely to measurably impact downstream water availability or instream uses of surface water within the St. Francisville reach of the river during the license renewal term. Thus, operation of RBS during the license renewal term is not expected to result in a water use conflict on the Lower Mississippi River. In total, the NRC staff concludes that the

4-18
potential impacts on surface water resources and downstream water availability from RBS’s continued withdrawals and consumptive water use during the license renewal term would be SMALL.
4.5.1.2 Groundwater Resources
As identified in Table 4-1, the impacts of all generic groundwater resources issues would be SMALL. Table 4-2 identifies two site-specific (Category 2) issues related to groundwater resources applicable to RBS during the license renewal term. These issues are analyzed below.
Groundwater Use Conflicts (Plants with Closed-Cycle Cooling Systems That Withdraw Makeup Water from a River)
This issue evaluates the potential for water withdrawals from a river to cause groundwater use conflicts with other users. It is concerned with the potential for the consumptive use of river to lower the water level in aquifers hydrologically connected to the river. If water levels in aquifers hydrologically connected to the river decrease, this could reduce the availability of water in the aquifers. This issue is most concerned with impacts during low flows when the extraction of river water could have a more noticeable impact on water levels in aquifers hydrologically connected to the river.
The consumption of Mississippi River water by RBS should have no discernible impact on the availability of groundwater supplies. Dewatering of aquifers hydrologically connected to the Mississippi River would occur if the head in the river dropped below the heads in aquifers hydrologically connected to the river. As described in Section 4.5.1.1, the probable minimum flow rate of the Mississippi River at RBS during the operating life of the station is not anticipated to be less than 100,000 cfs (2,800 m3/s). During this low flow period, RBS would consume 0.02 percent of the flow in the Mississippi River (Entergy 2017h). This would have little if any effect on river water levels and therefore significant dewatering of connected aquifers as a result of river water consumption should not occur. Therefore, the NRC staff concludes that the impact on groundwater resources as a result of Mississippi River water consumption is SMALL.
Radionuclides Released to Groundwater
The issue of “radionuclides released to groundwater” looks at the potential contamination of groundwater from the release of radioactive liquids from plant systems into the environment. Section 3.5.2.4 of this SEIS contains a description of RBS groundwater quality and radionuclides RBS has released into groundwater.
As discussed in Section 3.5.2.4, the quality of offsite groundwater and surface water supplies has not been impacted by radiological contamination of onsite groundwater and should continue to be unaffected over the period of license renewal. The NRC staff has concluded that over the period of extended operation, groundwater contamination will likely remain onsite.
Tritium contamination exists in the Upland Terrace Aquifer beneath and immediately to the west of the RBS power block area. Thick clay units beneath the Upland Terrace Aquifer keep any radiological contamination within the Upland Terrace Aquifer from moving deeper into underlying aquifers.
Entergy believes all of the tritium contamination currently found within the Upland Terrace Aquifer is the result of liquid spills that occurred within the turbine building. Entergy has taken

4-19
corrective actions and resealed turbine building floor joints to stop any future leaks. However, the area beneath the turbine building, which is believed to be the source of the tritium cannot be directly observed and wells cannot be placed directly below it. Instead, monitoring wells have been installed at multiple depths adjacent to and down gradient from the turbine building. The effectiveness of sealing the turbine building joints cannot be determined until a consistent trend (either up or down) is observed in the tritium data obtained from monitoring wells installed close to the turbine building.
Monitoring wells are installed at various depths within the structural fill and the Upland Terrace Aquifer. These wells are close to and down gradient from the turbine building. However, as of the end of 2017, a consistent trend has not been observed in these wells (Entergy 2018a). Therefore, it is too soon to conclude that sealing the floor joints in the turbine building has been successful in stopping tritium leaks or that the floor joints were the sole source of the leaks.
If it is determined sealing of the joints was not successful, the licensee will need to continue to identify and minimize the occurrence of any leaks and spills. This process will continue to be subject to NRC oversight.
Potable water at RBS is supplied by the West Feliciana Parish Consolidated Water District No. 13 Water Supply System. The direction of groundwater flow within the Upland Terrace Aquifer will cause tritium in the groundwater to leave the site where the site boundary meets the Mississippi River. No offsite, private or public wells are located along the direction of groundwater flow. Therefore, neither RBS drinking water nor offsite groundwater should come in contact with the tritium contamination in the groundwater caused by RBS activities. All of the land along the groundwater flow paths transporting tritium contamination to the Mississippi River is within the site boundary and controlled by the licensee. This control, along with NRC oversight, will prevent the establishment of drinking water wells within the groundwater flow zone.
As groundwater moves through the Upland Terrace Aquifer towards the Mississippi River, natural attenuation processes should readily reduce the concentration of tritium within the groundwater. Any tritium-containing groundwater moving into the Mississippi River will be diluted and reduced in concentration by the large volume of water in the river. In addition, Entergy estimates that it is unlikely that the concentration of tritium from RBS releases would be above minimum detection levels in the river (Entergy 2017h).
The groundwater monitoring program at RBS is robust and has detected radionuclide leaks into the groundwater. Any large leaks that might occur during the period of license renewal should be readily detected. If leaks to the groundwater are stopped before or during the period of license renewal, onsite groundwater quality could be restored through either active remediation or monitored natural attenuation. NRC oversight will continue to ensure that workers and the public are safe from contaminated groundwater.
The onsite impacts on groundwater quality at RBS are currently detectible within the Upland Terrace Aquifer and are sufficient to alter noticeably, but not to destabilize, important attributes of this resource. If Entergy has not identified and stopped all of the sources of the tritium leaks, and if tritium continues to leak into the groundwater during the period of license renewal, the impact on groundwater quality in this aquifer during the license renewal period could be MODERATE. However, with the elimination of radionuclide leaks to groundwater, either through active remediation activities or monitored natural attenuation, the impact on groundwater quality could be SMALL. Based on this information, the NRC staff concludes that
4-20
the impact of radionuclides released to groundwater at RBS during the license renewal term could range from SMALL to MODERATE.
4.5.2 No-Action Alternative
4.5.2.1 Surface Water Resources
Surface water withdrawals and the rate of consumptive water use would greatly decrease and would eventually cease after RBS is shut down. Wastewater discharges would be reduced considerably. As a result, shutdown would reduce the overall impacts on surface water use and quality. Stormwater runoff would continue to be discharged from the plant site to ditches and receiving waters. Overall, the impact of the no-action alternative on surface water resources would remain SMALL.
4.5.2.2 Groundwater Resources
With the cessation of operations, there should be a reduction in onsite groundwater consumption and little or no additional impacts on groundwater quality. Therefore, the NRC staff concludes that the impact of the no-action alternative on groundwater resources would be SMALL.
4.5.3 Replacement Power Alternatives: Common Impacts
4.5.3.1 Surface Water Resources
Construction
Construction activities associated with replacement power alternatives may cause temporary impacts to surface water quality by increasing sediment loading to waterways. Construction activities may also impact surface water quality through pollutants in stormwater runoff from disturbed areas and excavations, spills and leaks from construction equipment, and any dredge and fill activities. These sources could potentially affect downstream surface water quality. Potential hydrologic impacts would vary depending on the nature and acreage of land area disturbed and the intensity of excavation work.
Nevertheless, all site construction activities would have to be conducted under a Louisiana Department of Environmental Quality-issued Louisiana Pollutant Discharge Elimination System (LPDES) general permit for stormwater discharges from large construction sites (i.e., 5 ac (2 ha) or more) (LAC 33:IX.2515; LDEQ 2017d). This general permit requires the development and implementation of a stormwater pollution prevention plan including use of appropriate best management practices for waste management, water discharge, stormwater pollution prevention, soil erosion control, site stabilization techniques, and spill prevention practices to prevent or minimize any surface water quality impacts during construction.
In addition, to minimize hydrologic impacts and to maximize the use of existing infrastructure, Entergy (2017h) assumes that thermoelectric power generating replacement power alternatives (i.e., new nuclear, coal, natural gas, and biomass-fired units) would use the existing RBS surface water intake and discharge infrastructure (after making necessary modifications and refurbishment). The NRC further assumes that the builders of these facilities would use the existing RBS mechanical draft cooling towers or construct new cooling towers as necessary on previously disturbed land. Any necessary dredge-and-fill operations in waterways or wetlands

4-21
would be conducted under a permit from the U.S. Army Corps of Engineers (USACE) and State-equivalent permits requiring the implementation of applicable best management practices to minimize associated impacts.
For all replacement power alternatives, water would be required for potable and sanitary use by the construction workforce and for concrete production, equipment cleaning, dust suppression, soil compaction, and other miscellaneous uses depending on the replacement power alternative. In its environmental report, Entergy (2017h) assumes that there would be no direct use of surface water during construction. The project builder could obtain construction water from the municipal water utility (i.e., West Feliciana Parish Consolidated Water District No. 13) via a service connection or possibly truck the water to the point of use from the local utility. Alternatively, the builder could also use onsite groundwater to support construction.
Operation
The thermoelectric power generating components of the replacement power alternatives would use mechanical draft cooling towers operating in a closed-cycle configuration. Makeup water would be obtained from the Lower Mississippi River. Power plants using closed-cycle cooling systems with cooling towers withdraw substantially less water for condenser cooling than a thermoelectric power plant using a once-through system. However, the relative percentage of consumptive water use is greater in closed-cycle plants because of evaporative and drift losses during cooling tower operation (NRC 2013b). Any surface water withdrawals would be subject to applicable State water appropriation and registration requirements (see Section 3.5.1.2). In addition, closed-cycle cooling systems typically require chemical treatment. Specifically, cooling towers commonly require biocide injections to control biofouling and other chemical additives for corrosion control in plant systems (NRC 2013b). For example, RBS currently requires such additives for proper operation. Residual concentrations of these chemical additives would be present in the cooling tower blowdown discharged to receiving waters, such as the Lower Mississippi River, under all thermoelectric power alternatives.
Nevertheless, any chemical additions would be accounted for in the operation and permitting of liquid effluents. All effluent discharges from the thermoelectric power generating components under these replacement power alternatives would be subject to Louisiana Pollutant Discharge Elimination System permit requirements for the discharge of wastewater and industrial stormwater to waters of the United States. Effluent limitations and monitoring requirements imposed under the permits would ensure compliance with applicable State ambient water quality standards.
To prevent and respond to accidental non-nuclear releases to surface waters, facility operations under all alternatives would be conducted in accordance with a spill prevention, control, and countermeasures plan; stormwater pollution prevention plan; or equivalent plans and associated best management practices and procedures.
4.5.3.2 Groundwater Resources
Construction
During construction for all the replacement power alternatives, construction water might be obtained from onsite groundwater or from the local water utility. There is also likely to be a need for groundwater dewatering during excavation and construction. Pumped groundwater removed from excavations would be discharged in accordance with appropriate State and local permits.

4-22
The application of best management practices in accordance with a State-issued Louisiana Pollutant Discharge Elimination System general permit, including an appropriate waste management, water discharge, and stormwater pollution prevention plan as well as spill prevention practices, would prevent or minimize groundwater quality impacts during construction. These groundwater impacts would be short lived. Therefore, the NRC staff concludes that the common impacts from construction on groundwater resources would be SMALL.
Operation
During operations for all the replacement power alternatives, the NRC staff assumes that potable water would be obtained from a local water service company rather than from onsite groundwater. Any groundwater withdrawals would be subject to applicable State water appropriation and registration requirements. Effluent discharges would be subject to Louisiana Pollutant Discharge Elimination System permit requirements for the discharge of wastewater and industrial stormwater as described in Section 4.5.3.1. Therefore, the NRC staff concludes that the common impacts from operations on groundwater resources would be SMALL.
4.5.4 New Nuclear Alternative
4.5.4.1 Surface Water Resources
The hydrologic and water quality assumptions and implications for construction and operations as described in Sections 4.5.3.1 as common to all replacement power alternatives also apply to this alternative, except as noted below.
Potential surface water resources impacts could be greatest under the new nuclear alternative due to the larger land area required for construction of the new nuclear unit and deep excavation work required for the nuclear island. The NRC staff also estimates that groundwater dewatering of deep excavations could be necessary. Nevertheless, the dewatering would not be expected to impact offsite surface water bodies, and water pumped from excavations would be managed and discharged in accordance with Louisiana Department of Environmental Quality requirements and would not be expected to affect offsite surface water quality.
Operation of a single AP1000 pressurized-water reactor using closed-cycle cooling would require approximately 25 mgd (38.7 cfs; 1.09 m3/s) of surface water, with consumptive use of 22 mgd (34 cfs; 0.96 m3/s). This would be comparable to RBS’s design withdrawal and consumptive use rates of 23 mgd (35.6 cfs; 1.0 m3/s) and 17.7 mgd (27.4 cfs; 0.77 m3/s), respectively. Thus, consumptive water use under the new nuclear alternative would be negligible compared to the mean annual flow of the Lower Mississippi River. It would similarly represent a very small percentage (i.e., 0.02 percent or less) of potential low-flow conditions, as discussed in Section 4.5.1.1.
Based on this analysis, the NRC staff concludes that the overall impacts on surface water resources from construction and operations under the new nuclear alternative would be SMALL.
4.5.4.2 Groundwater Resources
The NRC staff did not identify any impacts on groundwater resources for the new nuclear alternative beyond those discussed above as common to all replacement power alternatives.

4-23
Therefore, the NRC staff concludes that the impacts on groundwater resources from construction and operation of a new nuclear power plant would be SMALL.
4.5.5 Supercritical Pulverized Coal Alternative
4.5.5.1 Surface Water Resources
Impacts on surface water resources associated with this alternative would be similar to but potentially more than those under the new nuclear alternative. This is attributable to the smaller amount of land required for construction of the coal plant’s power block, but increased potential for runoff and leachate from onsite coal and ash piles. Otherwise, the same hydrologic and water quality assumptions and implications for construction and operations as described in Section 4.5.3.1 also apply to this alternative, except as noted.
Under the coal alternative, there would be the potential for hydrologic and water quality impacts to occur from the construction or refurbishment of the barge facilities that would be used to transport coal to the site location. Management of runoff and leachate from coal and ash storage facilities would require additional regulatory oversight and would present an additional risk to surface water resources during operations. Nevertheless, as described in Section 4.5.3.1, water quality impacts would be regulated under appropriate Louisiana Department of Environmental Quality-issued Louisiana Pollutant Discharge Elimination System permits, both for construction and operational impacts. U.S. Army Corps of Engineers permits would regulate construction in waterways and wetlands.
The coal facility would require more makeup water for operations than the new nuclear alternative but maintain similar consumptive water use, estimated at 20 mgd (30.9 cfs; 0.87 m3/s). Consumptive water use for coal facility operations would constitute a very small percentage (i.e., about 0.02 percent) of river flow under potential low-flow conditions, as referenced in Section 4.5.1.1. The potential for water use conflicts would be negligible.
Based on the potential for additional hydrologic alteration and potential water quality impacts from new construction and coal and ash handling and management, the NRC staff concludes that impacts on surface water resources from construction and operations of a coal alternative would range from SMALL to MODERATE.
4.5.5.2 Groundwater Resources
With the exception of an increased potential for runoff and leachate from onsite coal and ash piles to degrade groundwater resources, the NRC staff did not identify any impacts on groundwater resources for the coal alternative beyond those discussed above as common to all replacement power alternatives. Therefore, the NRC staff concludes that the impacts from construction and operation of a coal alternative on groundwater resources would be SMALL to MODERATE.
4.5.6 Natural Gas Combined-Cycle Alternative
4.5.6.1 Surface Water Resources
The NRC staff expects that direct impacts on surface water resources from constructing a natural gas alternative would be much smaller than those from constructing either a new nuclear or coal facility because the natural gas facility requires less extensive excavation and

4-24
earthwork. Otherwise, the same hydrologic and water quality assumptions and implications for construction and operations described in Sections 4.5.3.1 as common to all replacement power alternatives also apply to the natural gas alternative, except as noted below.
Construction of a natural gas facility may result in some additional, temporary impacts to surface water quality due to the need to construct new gas pipelines to service the facility. Some stream or wetlands crossings or subcrossings could be necessary. However, water quality impacts would be regulated under a Louisiana Department of Environmental Quality-issued LPDES general permit and the U.S. Army Corps of Engineers permits regulate construction in waterways and wetlands. The use of modern pipeline construction techniques, such as horizontal directional drilling, would further minimize the potential for hydrologic and water quality impacts.
For natural gas facility operations, cooling-water demand and consumptive water use would be substantially less than for new nuclear and coal plants. Consumptive water use under the natural gas alternative (estimated at 5.7 mgd (8.8 cfs; 0.25 m3/s)) would be negligible compared to potential low-flow conditions of the Lower Mississippi River, as referenced in Section 4.5.1.1. The potential for water use conflicts would also be negligible.
For the natural gas alternative, the NRC staff concludes that the overall impacts on surface water resources from construction and operations would be SMALL.
4.5.6.2 Groundwater Resources
The NRC staff did not identify any impacts on groundwater resources for the natural gas alternative beyond those discussed above as common to all replacement power alternatives. Therefore, the NRC staff concludes that the impacts from natural gas alternative construction and operation on groundwater resources would be SMALL.
4.5.7 Combination Alternative (Natural Gas Combined-Cycle, Biomass, and Demand-Side Management)
4.5.7.1 Surface Water Resources
Construction of a natural gas plant and four biomass-fired units would have similar but somewhat greater potential water resources impacts than construction of a natural gas facility alone because the combination facilities would disturb a larger combined land area. Otherwise, the same hydrologic and water quality assumptions and implications for construction and operations described in Sections 4.5.3.1 as common to all replacement power alternatives also apply to the combination alternative, except as noted below.
Makeup water demand and consumptive water use for operation of the combination facility units would be similar to but somewhat greater than that for the natural gas alternative alone. However, the consumptive water use for the natural gas and biomass components of the combination alternative (estimated at 5.8 mgd (9.0 cfs; 0.25 m3/s)) would still be negligible compared to potential low-flow conditions of the Lower Mississippi River, as referenced in Section 4.5.1.1.
The NRC staff does not expect implementation of the demand-side management component of this combination alternative to result in incremental impacts on surface water use and quality.

4-25
In consideration of this information, the NRC staff concludes that the overall impacts on surface water resources from construction and operation of a combination alternative would be SMALL.
4.5.7.2 Groundwater Resources
The NRC staff did not identify any impacts for the combination alternative beyond those discussed above as common to all replacement power alternatives. Therefore, the NRC staff concludes that the impacts to groundwater resources from construction and operation of a combination alternative would be SMALL.
4.6 Terrestrial Resources
This section describes the potential terrestrial resources impacts of the proposed action (license renewal) and alternatives to the proposed action.
4.6.1 Proposed Action
As identified in Table 4-1, the impacts of all generic terrestrial resource issues would be SMALL. Table 4-2 identifies two RBS site-specific (Category 2) issues related to terrestrial resources during the license renewal term. These issues are analyzed below.
4.6.1.1 Category 2 Issue Related to Terrestrial Resources: Effects on Terrestrial Resources (Non-cooling System Impacts)
According to the GEIS, non-cooling system impacts on terrestrial resources can include those impacts that result from landscape maintenance activities, stormwater management, elevated noise levels, and other ongoing operations and maintenance activities that would occur during the renewal period on and near a plant site.
Landscape Maintenance Activities
Entergy’s (2017h) landscape maintenance practices primarily consist of grass cutting and weed control within developed or previously disturbed areas of the site. Transmission line rights-of-way cover approximately 8 ac (3.2 ha) of the Entergy property. Although vegetation is sparse in these areas because the lines cross the RBS industrial area, Entergy applies herbicide spot treatments on a 2-year cycle to control undesirable brush and woody vegetation. Herbicide application volumes typically range from 10 to 25 gallons per brush acre, and all chemicals are applied according to label directions and manufacturer recommendations by licensed companies with qualified applicators. Approximately 87 percent (2,869 ac (1,161 ha)) of the RBS site remains as undeveloped, uncultivated natural areas (see Table 3-1 in Section 3.2.1.1). Entergy does not actively maintain these areas and has no plans to disturb any undeveloped areas as part of the proposed license renewal.
Stormwater Management
Stormwater runoff from impervious surfaces can change the frequency or duration of inundation and soil infiltration within neighboring terrestrial habitats. Effects may include erosion, altered hydrology, sedimentation, and other changes to plant community characteristics. Runoff may contain sediments, contaminants from road or parking surfaces, or herbicides. RBS’s Louisiana Pollutant Discharge Elimination System permit allows Entergy to discharge stormwater from four outfalls. Collection and discharge of excess stormwater to the Mississippi River minimizes the

4-26
amount of excess runoff that terrestrial habitats would receive and the associated effects. Additionally, the Louisiana Pollutant Discharge Elimination System permit requires Entergy to maintain a stormwater pollution prevention plan (SWPPP), which identifies potential sources of pollutants that could affect stormwater discharges and identifies best management practices that Entergy uses to reduce pollutants in stormwater discharges to ensure compliance with applicable conditions of the permit. The best management practices include procedures to minimize and respond to spills and leaks, handle industrial materials and wastes that can be readily mobilized by contact with stormwater, and minimize erosion and sedimentation, among other activities. Entergy further monitors areas with potential for spills of oil or other regulated substances under its Spill Prevention Control and Countermeasures Plan. Collectively, these measures ensure that the effects to terrestrial resources from pollutants carried by stormwater would be minimized during the proposed license renewal term.
Noise
The GEIS (NRC 2013b) indicates that elevated noise levels from transformers and cooling towers could disrupt wildlife behavioral patterns or cause animals to avoid such areas. However, limited wildlife occurs in areas of the site with elevated noise levels due to the developed nature of the site, associated lack of high-quality habitat, and regular presence of human activity. Wildlife that does occur in developed areas has already adapted to the conditions of the site and is tolerant of disturbance. Therefore, noise associated with the continued operation of transformers and cooling towers during the proposed license renewal term is unlikely to create noticeable impacts on terrestrial resources.
Other Operations and Maintenance Activities
Operational and maintenance activities that Entergy (2017h) might undertake during the license renewal term include maintenance and repair of plant infrastructure such as roadways, piping installations, fencing, and security-related structures. These activities would likely be confined to previously disturbed areas of the site. Entergy anticipates performing no refurbishment during the license renewal period.
Entergy (2017h) maintains procedures to ensure that environmentally sensitive areas are adequately accounted for and protected during operational and maintenance activities and project planning. The procedures direct Entergy personnel to obtain appropriate local, State, or Federal permits (or some combination of the three) prior to beginning work; implement best management practices to protect wetlands, natural heritage areas, and sensitive ecosystems; and consult the appropriate agencies wherever federally or State-listed species may be affected. Additionally, RBS’s Environmental Protection Plan contained in Appendix B of the facility operating license requires Entergy to prepare an environmental evaluation for any construction or operational activities which may significantly affect the environment (excluding activities for which all measurable non-radiological environmental effects are confined to onsite areas previously disturbed during site preparation and plant construction) (NRC 1985). If such an evaluation indicates than an activity involves an unreviewed environmental question, the RBS Environmental Protection Plan requires that Entergy obtain approval from the NRC prior to performing the activity (NRC 1985). The renewed license, if issued, would include an environmental protection plan with identical or similar requirements.

4-27
Conclusion
Based on the NRC staff’s independent review, the staff concludes that the landscape maintenance activities, stormwater management, elevated noise levels, and other ongoing operations and maintenance activities that Entergy might undertake during the renewal term would primarily be confined to already disturbed areas of the RBS site. These activities would neither have noticeable effects on terrestrial resources nor would they destabilize any important attribute of the terrestrial resources on or in the vicinity of the RBS site. Accordingly, the NRC staff concludes that non-cooling system impacts on terrestrial resources during the license renewal term would be SMALL.
4.6.1.2 Water Use Conflicts with Terrestrial Resources (Plants with Cooling Ponds or Cooling Towers Using Makeup Water from a River)
Water use conflicts occur when the amount of water needed to support terrestrial resources is diminished as a result of agricultural, municipal, or industrial uses; droughts; or a combination of these factors.
Section 4.5.1.1 addresses surface water use conflicts and concludes that the potential impacts on surface water resources and downriver water availability from RBS’s consumptive water use during the license renewal term would be SMALL because of RBS’s very low consumptive use relative to river flow. The State of Louisiana also imposes water withdrawal restrictions through the Louisiana Pollutant Discharge Elimination System permit to further ensure adequate instream and downstream flows. Section 4.7.1.1 addresses water use conflicts with aquatic resources and determines that RBS consumes a very small amount of the Mississippi River’s flow each year (about 0.004 percent of the Lower Mississippi River’s mean annual discharge) and that the impacts of water use conflicts would be SMALL for aquatic resources. The NRC staff finds no other impacts that terrestrial or riparian habitats or species would experience beyond those discussed in Sections 4.5.1 or 4.7.1. Accordingly, the NRC staff concludes that the impacts of water use conflicts on terrestrial resources from the proposed license renewal would be SMALL.
4.6.2 No-Action Alternative
Under the no-action alternative, the NRC would not issue a renewed license, and RBS would shut down on or before the expiration of the current facility operating license. Some impacts on terrestrial resources, such as cooling tower drift, would cease following reactor shutdown. Some impacts may continue to exist at a reduced level, for example impacts on noise and impacts associated with herbicide application and landscape maintenance depending on the level at which Entergy continues to maintain landscaped areas. Other impacts on terrestrial resources would be the same as if the plant were operating, such as the potential for bird collisions with plant structures and transmission lines. Thus, shutdown itself is unlikely to noticeably alter or have more than minor effects on terrestrial resources. The NRC staff concludes that the impacts of the no-action alternative on terrestrial resources during the proposed license renewal term would be SMALL.
4.6.3 Replacement Power Alternatives: Common Impacts
Each replacement power alternative would entail construction and operation of a new energy generating facility on Entergy’s existing RBS site and would result in qualitatively similar impacts to terrestrial resources. During construction, the use of the existing site would allow Entergy to

4-28
maximize existing buildings and infrastructure. Entergy would site any new plant on an area of the RBS site that Entergy previously excavated for a planned second nuclear unit that was never built. Reusing this excavated site would minimize impacts to wetlands and other terrestrial habitats. However, the exact level of disturbance to terrestrial habitats and biota would depend on the amount of land required for each alternative and the specific siting of buildings and infrastructure within the site footprint. The existing transmission lines and structures would be adequate to support each alternative, and the existing RBS intake and discharge structures could be used with some modifications, all of which would minimize terrestrial habitat disturbances. Clearing of some plant communities within the construction footprint would likely occur. Wildlife in these areas would be displaced but could relocate to neighboring natural areas. Some habitat loss or fragmentation, loss of food resources, and altered behavior due to noise and other construction-related disturbances would be possible. Erosion and sedimentation from clearing, leveling, and excavating land could affect adjacent riparian and wetland habitats. Implementation of appropriate best management practices and revegetation following construction would minimize such impacts.
In the GEIS (NRC 2013b), the NRC staff concludes that impacts to terrestrial resources from operation of nuclear and fossil-fueled plants would be similar and would include cooling tower salt drift, noise, bird collisions with plant structures and transmission lines, impacts connected with herbicide application and landscape management, and potential water use conflicts connected with cooling-water withdrawals. The fossil-fueled alternatives would generate air emissions of greenhouse gases, such as nitrogen oxides and carbon dioxide, all of which would contribute cumulatively to climate change. Climate change is associated with migratory mis-synchronizations; loss of coastal, riparian, and wetland terrestrial habitats to sea level rise and storm surges; and increased susceptibility to insect infestations and pathogens, among other effects. Additional impacts to terrestrial resources during the operational period could occur as a result of offsite mining, extraction, or waste disposal activities associated with each plant’s particular type of fuel.
4.6.3.1 New Nuclear Alternative
The NRC staff did not identify any impacts on terrestrial resources from the new nuclear alternative beyond those discussed in the impacts common to all replacement power alternatives. However, the common impacts could be slightly more intense for the new nuclear alternative compared to RBS license renewal due to the larger land area requirement that could result in increased erosion and potential introduction of sediments to riparian habitats. Nonetheless, because of the short-term nature of the construction activities, use of existing infrastructure, and implementation of best management practices, the direct impacts to terrestrial resources would be minimal. Therefore, the NRC staff concludes that the impacts to terrestrial resources from construction and operation of a new nuclear alternative would be SMALL.
4.6.3.2 Supercritical Pulverized Coal Alternative
In addition to the impacts to terrestrial resources common to all alternatives, operation of the coal alternative would require coal deliveries, cleaning, and storage, which would create noise, dust, and loss of habitat. Limestone preparation and storage would create dust and runoff that could affect soil and vegetation. Air emissions from the coal plant could create acid precipitation, which can injure foliage, leach nutrients from the soil, and contribute to decreased biodiversity over time. Disposal of combustion wastes could result in habitat loss and potential seepage of trace and other elements into soils. The NRC staff concludes that impacts on

4-29
terrestrial resources of constructing and operating a coal alternative would be SMALL during construction and SMALL to MODERATE during operation. The anticipated range in impacts during the operational period is due to the variable impacts that air emissions and coal mining could have on terrestrial resources.
4.6.3.3 Natural Gas Combined-Cycle Alternative
The impacts on terrestrial resources common to all alternatives would be less intense for the natural gas alternative as compared to the new nuclear, coal, and combination alternatives because the natural gas alternative would disturb the least amount of land. However, the natural gas alternative would require construction of a gas pipeline, which could result in the loss, modification, or fragmentation of terrestrial habitat. The natural gas alternative would require 25 ac (10 ha) of land for a right-of-way to connect the new plant to an existing gas pipeline approximately 2 mi (3.2 km) east of the site. The NRC staff concludes that impacts of constructing and operating a natural gas alternative on terrestrial resources would be SMALL to MODERATE during both construction and operation. The anticipated range in impacts is due to the variable impacts that gas pipeline construction could have on sensitive habitats (if those habitats are in or near the pipeline’s right-of-way) as well as the variable impacts of air emissions during the operational period.
4.6.3.4 Combination Alternative (Natural Gas Combined-Cycle, Biomass, and Demand-Side Management)
The NRC staff did not identify any impacts to terrestrial resources for the natural gas and biomass portions of the combination alternative beyond those discussed in the impacts common to all replacement power alternatives and those described for the natural gas only alternative. The demand-side management portion of the combination alternative, which would account for approximately 11 percent of the combination alternative’s power generation, would not require any new construction or otherwise result in impacts to terrestrial resources. Thus, impacts to terrestrial resources from the demand-side management portion of the alternative would be negligible. The NRC staff concludes that impacts of implementing the combination alternative on terrestrial resources would be SMALL to MODERATE during construction and operation. The anticipated range in impacts is due to the variable impacts that gas pipeline construction could have on sensitive habitats (if the habitat is in or near the right-of-way) as well as the variable impacts of air emissions during the operational period.
4.7 Aquatic Resources
This section describes the potential aquatic resources impacts of the proposed action (license renewal) and alternatives to the proposed action.
4.7.1 Proposed Action
As identified in Table 4-1, the impacts of all generic aquatic resource issues would be SMALL. Table 4-2 identifies one aquatic resource site-specific (Category 2) issue applicable to RBS during the license renewal term. This issue is analyzed below.

4-30
4.7.1.1 Water Use Conflicts with Aquatic Resources (Plants with Cooling Ponds or Cooling Towers Using Makeup Water from a River)
Water use conflicts occur when the amount of water needed to support aquatic resources is diminished as a result of demand for agricultural, municipal, or industrial use or decreased water availability due to droughts, or a combination of these factors.
The mean annual discharge of the Lower Mississippi River measured at the U.S. Geological Survey (USGS) gage at Baton Rouge, LA, is 547,373 cubic feet per second (cfs) (15,463 cubic meters per second (m3/s)), as described in Section 4.5.1.1. RBS withdraws an average of 27.4 cfs (0.77 m3/s), equivalent to 17.7 mgd (67,000 m3/day), of water from the St. Francisville reach of the Lower Mississippi River. Consumptive use averages 21.4 cfs (0.6 m3/s), or about 13.8 mgd (52,200 m3/day). This consumptive use is equivalent to about 0.004 percent of the Lower Mississippi River’s mean annual discharge (flow).
The amount of Mississippi River water RBS consumes is minor in comparison to the flow of water past the plant (0.004 percent), and therefore RBS does not consume an amount that would be harmful to aquatic biota during low flow conditions. The NRC staff did not identify any information that indicates that the Mississippi River biota are affected by the loss of river water consumed by RBS’s makeup water withdrawals. The NRC staff concludes that water use conflicts would not occur from the proposed license renewal or would be so minor that the effects on aquatic resources would be undetectable. Thus, the NRC staff concludes that the impacts of water use conflicts on aquatic resources during the license renewal term would be SMALL.
4.7.2 No-Action Alternative
If RBS were to cease operating, impacts to aquatic ecology would decrease or stop following reactor shutdown. Some withdrawal of water from the Mississippi River would continue during the shutdown period as the fuel is cooled, although the amount of water withdrawn would decrease over time. The reduced demand for cooling water would substantially decrease the effects of impingement, entrainment, thermal effluents, and other impacts to aquatic biota. These effects likely would stop following the removal of fuel from the reactor core and shutdown of the spent fuel pool. Given the small area of the thermal plume in the Mississippi River under normal operating conditions, effects from cold shock are unlikely.
Thus, the NRC staff concludes that the impacts of the no-action alternative on aquatic resources during the proposed license renewal term would be SMALL.
4.7.3 Replacement Power Alternatives: Common Impacts
Construction:
Construction activities for a new replacement power plant and mechanical draft cooling tower could degrade water quality of nearby waterbodies, such as bayous, streams, or the Mississippi River, through erosion and sedimentation; result in loss of habitat through wetland
Impingement is the entrapment of all life stages of fish and shellfish on the outer part of an intake structure or against a screening device during periods of water withdrawal (40 CFR 125.83). Entrainment is the incorporation of all life stages of fish and shellfish with intake water flow entering and passing through a cooling-water intake structure and into a circulating water system (40 CFR 125.83).

4-31
filling; or result in direct mortality of aquatic organisms from dredging or other in-water work. Because of the short-term nature of construction activities, degradation of habitat quality would be relatively localized and temporary. Loss of habitat could be minimized by siting a plant far from bayous, streams, and other onsite aquatic resources, as well as using the existing RBS intake and discharge structures, transmission lines, roads, parking areas, and other infrastructure. Appropriate permits would ensure that water quality impacts would be addressed through mitigation or best management practices, as stipulated in the permits. The U.S. Army Corps of Engineers and/or the Louisiana Department of Environmental Quality would oversee applicable permitting, including the Clean Water Act Section 404 permit, Section 401 certification, and Section 402(p) National Pollutant Discharge Elimination System (NPDES) general stormwater permit. Because of the short-term nature of the construction activities, use of existing infrastructure, and use of required best management practices, the NRC staff concludes that hydrological alterations to aquatic habitats and impacts to aquatic resources from construction of replacement power alternatives would be minimal.
Operation:
The NRC staff analyzed the operational impacts to aquatic biota in the GEIS (NRC 2013b) for a power plant using cooling towers. Based on the relatively slow withdrawal and discharge rates, the NRC staff determined that impacts to aquatic biota from replacement power alternatives at the RBS site, such as impingement, entrainment, and thermal effects, would be minimal. In addition, water use conflicts with aquatic resources would not be likely given that the new unit would withdraw less than 0.004 percent of the flow in the Mississippi River.
4.7.3.1 New Nuclear Alternative
The NRC staff did not identify any impacts on aquatic resources for the new nuclear alternative beyond those discussed in the impacts common to all replacement power alternatives. However, the common impact could be slightly more intense for the new nuclear alternative as compared to coal or gas alternatives, due to the larger land area requirement that could result in increased erosion and potential introduction of sediments to aquatic habitats. Nonetheless, because of the short-term nature of the construction activities, use of existing infrastructure, and required best management practices, the hydrological alterations to aquatic habitats and direct impacts to aquatic resources would be minimal. Therefore, the NRC staff concludes that the impacts to aquatic resources from construction and operation of a new nuclear alternative would be SMALL.
4.7.3.2 Supercritical Pulverized Coal Alternative
In addition to the impacts to aquatic resources common to all alternatives, operation of the coal alternative could impact aquatic resources with additional activities. A coal plant would require coal deliveries, cleaning, and storage, which would require periodic dredging (if coal is delivered by barge). These activities would create dust, sedimentation, and turbidity and introduce trace elements and minerals into the water. Air emissions from the coal units would include sulfur dioxide, particulates, and mercury that would settle on water bodies or be introduced into the water from soil erosion. However, given the relatively fast flow of the Mississippi River, these contaminants would quickly dissipate from the area surrounding RBS. Therefore, the NRC staff concludes that the impacts to aquatic resources from construction and operation of the coal alternative would be SMALL.

4-32
4.7.3.3 Natural Gas Combined-Cycle Alternative
The impacts on aquatic resources common to all alternatives would be less intense for the natural gas alternative as compared to the new nuclear, coal, and combination alternatives because the natural gas alternative would disturb the least amount of land—likely resulting in less erosion and less potential for introducing sediments into aquatic habitats. The natural gas alternative would also withdraw and discharge the least amount of water from the Mississippi River, which would reduce the level of impingement and entrainment of aquatic biota as well as reduce the size and intensity of the thermal plume.
In addition to the impacts on aquatic resources common to all replacement power alternatives, the natural gas alternative may create additional impacts because the natural gas plant would require construction of new pipelines, which could impact previously undisturbed habitats. This impact would vary depending on the route of the pipeline and would be more likely to impact terrestrial resources than aquatic resources. Because the natural gas alternative would be built at the RBS site, new pipelines could be collocated in existing corridors and existing infrastructure could be used to reduce impacts. During operations, air emissions from the natural gas units would include nitrogen oxide, carbon dioxide, and particulates that would settle on water bodies or be introduced into the water from soil erosion. However, given the relatively fast flow of the Mississippi River, these contaminants would quickly dissipate from the area surrounding RBS. The NRC staff concludes that the impacts to aquatic resources from construction and operation of a natural gas plant would be SMALL.
4.7.3.4 Combination Alternative (Natural Gas Combined-Cycle, Biomass, and Demand Side Management)
The NRC staff did not identify any impacts for the natural gas and biomass portions of the combination alternative beyond those discussed in the impacts common to all replacement power alternatives and those described for the natural gas alternative. The demand-side management portion of the combination alternative, which would account for approximately 11 percent of the alternative’s power generation, would neither require new construction nor require additional cooling or consumptive water use during operation. Thus, impacts to aquatic resources from the demand-side management portion of the combination alternative would be negligible.
Based on the minimal impacts to aquatic resources, the NRC staff concludes that the impacts on aquatic resources from the combination alternative would be SMALL.
4.8 Special Status Species
This section describes the potential special status species impacts of the proposed action (license renewal) and alternatives to the proposed action.
4.8.1 Proposed Action
Table 4-2 identifies the one RBS site-specific (Category 2) issue related to special status species and habitats applicable to the area during the license renewal term. This issue is analyzed below.

4-33
4.8.1.1 Category 2 Issue Related to Special Status Species: Species and Habitats Protected Under the Endangered Species Act
Species and Habitats under U.S. Fish and Wildlife Service Jurisdiction
Section 3.8 considers whether one federally listed species, the pallid sturgeon (Scaphirhynchus albus), under the U.S. Fish and Wildlife Service’s (FWS’s) jurisdiction occurs in the action area based on the pallid sturgeon’s habitat requirements, life history, occurrence records, and other available information. In that section, the NRC staff concludes that this species may occur in the action area. The NRC staff also determines in Section 3.8 that no proposed species, candidate species, or critical habitats (proposed or designated) occur in the action area. Therefore, the proposed action (license renewal for an additional 20 years of operations at RBS) would have no effect on proposed species, candidate species, or critical habitats. The NRC staff analyzes the potential impacts of the proposed RBS license renewal on the pallid sturgeon below. The NRC staff’s Endangered Species Act (ESA) effect determination for this species is summarized in Table 4-3.
Table 4-3. Effect Determinations for Federally Listed Species Under U.S. Fish and Wildlife Service Jurisdiction
Species Common Name Federal Status Effect Determination
Scaphirhynchus albus pallid sturgeon Federally endangered
may affect, but is not likely to adversely affect
Pallid Sturgeon (Scaphirhynchus albus)
In Section 3.8, the NRC staff concludes that pallid sturgeon juveniles and adults may occur in the action area based on occurrence data from the Lower Mississippi River, although such occurrences would be occasional to rare. Larval pallid sturgeon and eggs, however, are unlikely to occur in the RBS action area based on available capture and spawning records, all of which were recorded well upstream of RBS.
During the proposed license renewal term (2025–2045), pallid sturgeon in the action area could experience the following effects from continued operation of RBS: (1) impingement and entrainment, (2) thermal effects, (3) exposure to radionuclides and other contaminants, and (4) reduction in available prey due to impingement and entrainment or thermal impacts to prey species. These impacts are described below in terms of direct, indirect, interrelated, and interdependent effects.
Direct Effects
Impingement and Entrainment
Impingement is the entrapment of all life stages of fish and shellfish on the outer part of an intake structure or against a screening device during periods of water withdrawal (Title 40, “Protection of Environment” of the Code of Federal Regulations (40 CFR) 125.83, “What Special Definitions Apply to This Subpart”). Entrainment is the incorporation of all life stages of fish and shellfish with intake water flow entering and passing through a cooling-water intake structure and into a circulating water intake structure (40 CFR 125.83). As indicated in

4-34
Table 4-1 of this SEIS, the collective effects of impingement and entrainment for all Lower Mississippi River aquatic organisms would be SMALL over the course of the proposed license renewal term.
An important factor that influences a species’ ability to avoid impingement into a cooling-water intake structure is its swimming speed. Impingement of healthy juvenile pallid sturgeon can reasonably be assumed to occur in situations where a facility’s intake velocity is higher than juvenile burst swimming speeds. An individual would naturally exhibit burst swimming behavior when navigating short-term fast currents, capturing prey, and avoiding predators. Burst swimming behavior would also help an individual avoid the draw of water into a cooling-water intake system.
In swimming stamina tests of hatchery-reared juvenile pallid sturgeon at Gavins Point National Fish Hatchery in South Dakota, Adams et al. (1999) observed maximum sustained swimming speed with no fatigue after 480 minutes of 25 cm/sec (9.8 in./sec) for juveniles of 17.0 to 20.5 cm (6.7 to 8.1 in.) fork length and 10 cm/sec (3.9 in./sec) for juveniles of 13.0 to 16.8 cm (5.1 to 6.6 in.) fork length. Burst speeds were measured for the two groups at 55 to 70 cm/sec and 40 to 70 cm/sec (22 to 28 in./sec and 16 to 28 in./sec), respectively. Notably, juvenile pallid sturgeon in this study demonstrated a higher capacity for burst swimming than had been demonstrated in studies of other sturgeon species. Because of the various swimming behaviors observed during the study, Adams et al. (1999) concluded that observed swimming speeds do not solely represent steady-state swimming speeds. Similar to other lotic, benthic fish, pallid sturgeon juveniles were able to use their pectoral fins and overall body morphology to maintain station against velocity without swimming (Adams et al. 1999). Based on the results of these studies, the NRC staff assumes that juvenile pallid sturgeon are most likely to be susceptible to impingement at facilities with intake velocities greater than 2.3 fps (70 cm/sec; 28 in./sec). Smaller or weaker individuals would also be susceptible to impingement at facilities with intake velocities as low as 1.3 fps (40 cm/sec; 22 in./sec).
The approach velocity of RBS’s cooling-water intake structure averages less than 0.5 fps (15 cm/sec; 6 in./sec) (Entergy 2017g). At low, medium, and high river flows, water flows past the intake structure at approximately 0.1, 0.2, and 0.7 fps (3, 6, and 21 cm/sec; 1.2, 2.4, and 8.4 in./sec), respectively (Entergy 2017g). At these approach velocities, pallid sturgeon juveniles would be able to avoid impingement into the RBS cooling-water intake system even at high river flow based on observed burst speeds in Adams et al.’s (1999) study. The U.S. Fish and Wildlife Service (2017c) notes that juvenile pallid sturgeon exhibit a variety of complex swimming behaviors that increase their ability to resist strong flows, such as flows associated with cooling-water intake structures. Similarly, adult pallid sturgeon are expected to have sufficient swimming ability to avoid impingement. Further, these velocities are lower than average river flow near RBS, which was observed to be 3.88 fps (118 cm/sec; 46.6 in./sec) in the Lower Mississippi River main channel during studies associated with Entergy’s combined license (COL) application for a second reactor, River Bend Station, Unit 3 (RBS3) (Entergy 2008a). (Entergy ultimately withdrew the RBS3 application and the planned COL unit was never constructed.) Therefore, pallid sturgeon that may occur in the RBS action area would already be strong enough to navigate waters of significantly higher velocity than the RBS intake, and thus, impingement of these individuals during the proposed license renewal term is highly unlikely.
Another factor that makes impingement highly unlikely is the location of the RBS intake. The river screens of the intake are located in a man-made recession on the east bank of the Mississippi River. Pallid sturgeon is a deep water, channel-dwelling species. Individuals are

4-35
typically found in areas where relative depths are 75 percent or higher than the maximum channel cross-section depth (FWS 2014c). Thus, individuals would be unlikely to occur in shallower waters near the RBS intake where they could be susceptible to impingement.
Pallid sturgeon are also unlikely to be subject to entrainment at RBS. Organisms susceptible to entrainment generally include ichthyoplankton (fish eggs and larvae), larval stages of shellfish and other macroinvertebrates, zooplankton, and phytoplankton. As described in Section 3.8.1.1, pallid sturgeon eggs and larvae do not occur in the action area because pallid sturgeon are not currently known to spawn in the Mississippi River main channel (FWS 2017c; FWS and NMFS 2009). Additionally, pallid sturgeon eggs are demersal and adhesive, and would therefore not be expected to drift downstream from spawning grounds in upstream tributaries. For these reasons, the NRC staff does not expect pallid sturgeon eggs and larvae to be entrained into the RBS cooling-water intake system. Therefore, no entrainment of pallid sturgeon would occur during the proposed license renewal term.
Based on the above review of pallid sturgeon swimming speeds and the RBS cooling-water intake system design and operation, the NRC staff concludes that the risk of pallid sturgeon impingement and entrainment at RBS during the license renewal term is a discountable impact because it is extremely unlikely to occur. Further, in 2017, the U.S. Fish and Wildlife Service (2017b) determined that renewal of the RBS Louisiana Pollutant Discharge Elimination System permit, which authorizes cooling-water intake, is not likely to adversely affect pallid sturgeon. The Fish and Wildlife Service’s review associated with the RBS Louisiana Pollutant Discharge Elimination System permit supports the NRC staff’s conclusion and is discussed in more detail below.
Thermal Effects
North American sturgeon species generally prefer cooler waters and most prefer and perform optimally at water temperatures of 25 °C (77 °F) or less (Blevins 2011). Activity and growth of young sturgeon generally increases with temperature until an optimal temperature, usually below 25 °C (77 °F), is reached (Blevins 2011). Eggs and larval stages are likely more sensitive to high temperatures than juveniles and adults, which can find refuge in microhabitats with cooler water. In a study of 1,000 juvenile shovelnose sturgeon in the upper Missouri River, Kapperman et al. (2009) found that temperature tolerances range from 10.0 to 30.0 °C (50 to 86°F) with optimal growth occurring at 22.0 °C (71.6 °F). However, available literature suggests that pallid sturgeon likely tolerate higher water temperatures than shovelnose and other sturgeon species. For instance, data from a small bioenergetics model study of pallid sturgeon on the Lower Missouri River indicate that 25 to 28 °C (77 to 82.4 °F) is the optimal temperature range for feeding and growth (Chipps et al. 2010). Temperatures from 30 to 33 °C (86 to 91.4 °F) appear to be stressful, while temperatures above 33 °C (91.4 °F) begin to result in death (Chipps et al. 2010). At 33 °C (91.4 °F), 4-day survival of pallid sturgeon individuals was 83 percent, whereas at 35 °C (95 °F), all fish lost equilibrium within 30 seconds, and all individuals died within 2 hours (Chipps et al. 2010).
Within the action area, Mississippi River surface water temperatures fluctuate seasonally with lowest temperatures typically occurring in January and highest temperatures typically occurring in August. Temperatures in the Lower Mississippi River generally fluctuate between 64.6 °F (18.1 °C) to 88.7 °F (31.5 °C) in habitats near the RBS site (Entergy 2017g). Discharge of RBS cooling tower blowdown to the Mississippi River creates a small thermal plume at the discharge point, which lies about 1 mi (1.6 km) downstream of the plant near the east bank of the river (Entergy 2017g). The thermal plume is described in detail in Section 3.8.1.1.

4-36
While the RBS thermal plume may reach temperatures that fall within the stressful range for pallid sturgeon during summer months, the plume is unlikely to result in measurable or detectable impacts on any sturgeon individuals that may occur in the action area. Because the thermal plume extends over a small area, pallid sturgeon could easily avoid the plume and swim through the large zone of passage. Additionally, swim time through the plume would be of short duration, the plume would not exceed pallid sturgeon thermal tolerances during cooler portions of the year, and the plume would only have the potential to exceed thermal tolerances during limited periods of time during the certain portions of the year (i.e., in summer months). While individuals may exhibit altered behavior to avoid the thermal plume, such behavioral changes would not affect fitness, would not result in other measurable effects, and would not reach the scale of a take. Further, because RBS discharges its thermal effluent along the riverbank, pallid sturgeon individuals are less likely to transit the river in or near the thermal plume due to the species’ previously discussed preference for deeper water. Pallid sturgeon eggs and larvae do not occur in the action area, and would, therefore, be unaffected by thermal effluent.
Based on the above review of pallid sturgeon thermal tolerances and the RBS thermal plume, the NRC staff concludes that potential for thermal effects on pallid sturgeon during the license renewal term is an insignificant impact because such impacts would not be able to be meaningfully measured or detected and would not reach the scale of a take. Further, in 2017, the U.S. Fish and Wildlife Service (2017b) determined that renewal of the RBS Louisiana Pollutant Discharge Elimination System permit, which authorizes heated discharge and sets corresponding temperature limitations, is not likely to adversely affect pallid sturgeon. The Fish and Wildlife Service review associated with the RBS Louisiana Pollutant Discharge Elimination System permit supports the NRC staff’s conclusion and is discussed in more detail below.
Exposure to Radionuclides and Other Contaminants
The NRC (2013b) determined in the GEIS that exposure to radionuclides would be of SMALL significance for aquatic resources because exposure would be well below EPA guidelines developed to protect aquatic biota. The GEIS also concludes that effects of nonradiological contaminants on aquatic organisms would be SMALL because best management practices and discharge limitations contained in applicable State-issued National Pollutant Discharge Elimination System permits would minimize the potential for impacts to aquatic resources. In Section 4.7 of this SEIS, the NRC staff did not identify any new and significant information that would call into question these conclusions’ applicability to the proposed RBS license renewal. Therefore, exposure of aquatic organisms to radionuclides and nonradiological contaminants during the license renewal term would not be detectable or would be so minor as to neither destabilize nor noticeably alter any important attribute of the aquatic environment.
In 2017, the U.S. Fish and Wildlife Service (2017c) determined that exposure to radionuclides and other contaminants at Waterford Steam Electric Station, Unit 3, a nuclear power plant that lies approximately 75 mi (120 km) southeast and downriver of RBS, is not likely to adversely affect the pallid sturgeon. Additionally, in biological opinions associated with the continued operation of three other nuclear power plants that draw cooling water from water bodies with Federally listed sturgeon populations, the National Marine Fisheries Service (2013, 2014) determined that measurable exposure of Atlantic sturgeon (Acipenser oxyrinchus oxyrinchus) and shortnose sturgeon (A. brevirostrum) to radionuclides and other contaminants resulting from continued operation of a nuclear power plant would be extremely unlikely and, therefore, represented an insignificant and discountable impact.

4-37
The NRC staff did not identify any scientific studies or other information indicating that pallid sturgeon could experience measurable adverse effects from the minimal discharges of radionuclides and other contaminants that would occur during the proposed RBS license renewal period. Based on the above information, the NRC staff finds that exposure to radionuclides and other contaminants during the proposed license renewal period represents a discountable impact because it would not be able to be meaningfully detected, measured, or evaluated and insignificant because exposure would never reach the scale where a take would occur.
Reduction in Available Prey Due to Impingement and Entrainment or Thermal Impacts
The diet of pallid sturgeon changes with age and is described in Section 3.8. As shown in Table 4-1, impingement and entrainment of aquatic resources would be SMALL during the proposed license renewal period, and thus, would not be detectable or would be so minor as to neither destabilize nor noticeably alter the aquatic community during the proposed license renewal term. Thermal impacts on aquatic resources would also be SMALL during the proposed license renewal term. Accordingly, because RBS operations do not result in detectable impingement and entrainment or thermal impacts on the aquatic community, any small reductions in available prey that could result in effects on pallid sturgeon through the food web would not be able to be meaningfully measured, detected, or evaluated, and would, therefore, be a discountable impact.
Indirect Effects
Under the Endangered Species Act, indirect effects are those that are caused by the proposed action that do not occur until later in time, but are still reasonably certain to occur (Title 50, “Wildlife and Fisheries,” of the Code of Federal Regulations (50 CFR), Section 402.02, “Definitions”). The NRC did not identify any indirect effects associated with the proposed action that could affect the pallid sturgeon. Termination of RBS operations and associated decommissioning of the reactor would occur eventually regardless of license renewal. While the proposed license renewal would delay the date of reactor shutdown, it would not significantly alter decommissioning impacts.
Interrelated and Interdependent Effects
Interrelated actions are those actions that are part of a larger action and depend on the larger action for their justification (50 CFR 402.02). Interdependent actions are those actions having no independent utility apart from the proposed action (50 CFR 402.02). The NRC staff has not identified any information that would indicate that there would be any interrelated or interdependent actions associated with the proposed license renewal that might affect the pallid sturgeon.
Past U.S. Fish and Wildlife Service Reviews
In 2016 and 2017, the U.S. Fish and Wildlife Service reviewed the potential impacts of continued operation of the RBS cooling-water intake system upon two occasions: following Entergy’s request for comments on the RBS license renewal application and during the Louisiana Department of Environmental Quality’s (LDEQ) review of Entergy’s Louisiana Pollutant Discharge Elimination System permit renewal application.

4-38
• License Renewal Application Review: On July 25, 2016, Entergy (2016c) requested U.S. Fish and Wildlife Service review of the RBS license renewal application prior to finalizing and submitting the application to the NRC. The Fish and Wildlife Service (2016) replied on August 26, 2016. The reply stated that the Fish and Wildlife Service had reviewed the project for effects to federally listed species under its jurisdiction and currently protected by the Endangered Species Act and that the proposed license renewal was not likely to adversely affect the pallid sturgeon.
• LPDES Permit Renewal Review: On June 15, 2017, the Louisiana Department of Environmental Quality (2017b) submitted a copy of Entergy’s Louisiana Pollutant Discharge Elimination System (LPDES) permit renewal application to the U.S. Fish and Wildlife Service for its review in accordance with the terms of a memorandum of agreement between the Louisiana Department of Environmental Quality and Region 6 of the U.S. Environmental Protection Agency. The Fish and Wildlife Service (2017b) replied on July 7, 2017. The reply stated that the Fish and Wildlife Service had reviewed the project for effects to federally listed species under its jurisdiction and currently protected by the Endangered Species Act and that the renewal of the LPDES permit was not likely to adversely affect the pallid sturgeon.
The U.S. Fish and Wildlife Service’s conclusions during its license renewal application review and Louisiana Pollutant Discharge Elimination System permit renewal review further support the staff’s above conclusions that impingement and entrainment, thermal effects, exposure to radionuclides and other contaminants, and reduction in available prey due to impingement and entrainment or thermal impacts to prey species represent insignificant or discountable impacts.
Conclusion Regarding Pallid Sturgeon
Based on the foregoing assessment, the NRC staff concludes that the proposed RBS license renewal may affect, but is not likely to adversely affect the pallid sturgeon.
The FWS (2018) concurred with this determination in a letter dated August 29, 2018. The FWS’s concurrence concluded the ESA Section 7 consultation for the proposed RBS license renewal and documents that the NRC staff has fulfilled its ESA Section 7(a)(2) obligations with respect to the proposed RBS license renewal. The NRC staff’s consultation with the FWS is further described in Appendix C.1.
Species and Habitats under National Marine Fisheries Service Jurisdiction
As discussed in Section 3.8, no federally listed, proposed, or candidate species or critical habitats (proposed or designated) under National Marine Fisheries Service jurisdiction occur within the action area. Thus, the NRC staff concludes that the proposed action would have no effect on federally listed, proposed, and candidate species or critical habitats under National Marine Fisheries Service jurisdiction.
Cumulative Effects
The Endangered Species Act regulations at 50 CFR 402.12(f)(4) direct Federal agencies to consider cumulative effects as part of the proposed action effects analysis. Under the Endangered Species Act, cumulative effects are defined as “those effects of future State or private activities, not involving Federal activities, that are reasonably certain to occur within the action area of the Federal action subject to consultation” (50 CFR 402.02). Unlike the National

4-39
Environmental Policy Act (NEPA) definition of cumulative impacts (see Section 4.16), cumulative effects under the Endangered Species Act do not include past actions or other Federal actions requiring separate Endangered Species Act Section 7 consultation. When formulating biological opinions under formal Endangered Species Act Section 7 consultation, the U.S. Fish and Wildlife Service and National Marine Fisheries Service (1998) consider cumulative effects when determining the likelihood of jeopardy or adverse modification. Therefore, cumulative effects need only be considered under the Endangered Species Act if listed species will be adversely affected by the proposed action and formal Section 7 consultation is necessary (FWS 2014b). Because the NRC staff concluded earlier in this section that the proposed license renewal is not likely to adversely affect the pallid sturgeon, consideration of cumulative effects is not necessary. Further, the NRC staff did not identify any actions within the action area that meet the definition of cumulative effects under the Endangered Species Act.
Reporting Requirements
If in the future a federally listed species is observed on the RBS site, the NRC has measures in place to ensure that NRC staff would be appropriately notified so that the staff could determine the appropriate course of action. RBS’s operating license, Appendix B, “Environmental Protection Plan,” Section 4.1, “Unusual or Important Environmental Events” (NRC 1985) requires Entergy to report to the NRC within 24 hours any mortality or unusual occurrence of a species protected by the Endangered Species Act on the RBS site. This reporting requirement would remain in effect in a renewed license for RBS. Additionally, the NRC’s regulations containing notification requirements require that operating nuclear power reactors report to the NRC within 4 hours “any event or situation, related to…protection of the environment, for which a news release is planned or notification to other government agencies has been or will be made” (10 CFR 50.72(b)(2)(xi)). Such notifications include reports regarding federally listed species, as described in Section 3.2.12 of NUREG–1022, “Event Report Guidelines: 10 CFR 50.72 and 50.73” (NRC 2013a).
4.8.1.2 Species and Habitats Protected Under the Magnuson–Stevens Act
As discussed in Section 3.8, the National Marine Fisheries Service has not designated essential fish habitat (EFH) in the Mississippi River pursuant to the Magnuson–Stevens Fishery Conservation and Management Act, as amended (16 U.S.C. §§ 1801–1884) (MSA). During its environmental review for the proposed license renewal of Waterford Steam Electric Station, Unit 3, the NRC staff contacted the National Marine Fisheries Service to discuss essential fish habitat, such as effects of the proposed license renewal on essential fish habitat prey species (NRC 2016a, 2016b). The National Marine Fisheries Service confirmed that the NRC is not required to consult under the Magnuson–Stevens Act because there is no essential fish habitat in the Mississippi River. Regarding prey species, the National Marine Fisheries Service stated that although some essential fish habitat prey species occur in the Mississippi River, the level of impingement and entrainment of these species is not expected to be of concern. The NRC staff finds these conclusions to be valid for RBS, which lies further upriver from the Gulf of Mexico than Waterford Steam Electric Station. Thus, the NRC staff concludes that the proposed action would have no effect on essential fish habitat.
4.8.2 No-Action Alternative
Under the no-action alternative, the NRC would not issue a renewed license, and RBS would shut down before the expiration of the current facility operating license. The Endangered

4-40
Species Act action area for the no-action alternative would most likely be the same or similar to the action area described in Section 3.8 for the proposed license renewal. The plant would require substantially less cooling water and would produce less thermal effluent, and thus, the potential for impacts to aquatic species and habitats related to cooling system operation would be significantly reduced. Overall, the effects on federally listed species and critical habitats would likely be smaller than the effects under continued operation but would depend on the action area associated with shutdown activities as well as the listed species and critical habitats present when the no-action alternative is implemented.
The National Marine Fisheries Service has not designated essential fish habitat in the Mississippi River, and thus the no-action alternative would not affect essential fish habitat.
4.8.3 Replacement Power Alternatives: Common Impacts
All the replacement power alternatives would entail construction and operation of a new energy generating facility on the existing Entergy property. The Endangered Species Act action area associated with any new plant would be similar to the license renewal action area because all of the replacement power alternatives would be sited on the existing site. However, specifically defining the action area would depend on the planned construction activities, temporary and permanent structure locations, and timeline of the alternative. Similarly, the listed species and habitats potentially affected by a particular alternative would depend on the boundaries of that alternative’s action area and the species that are listed under the Endangered Species Act at the time that alternative is implemented. For instance, if RBS continues to operate until the end of its current license term (2025) and the replacement power alternative is then implemented at that time, the U.S. Fish and Wildlife and National Marine Fisheries Services may have listed new species or delisted currently listed species whose populations may have recovered. These listing activities would change the potential impacts to Endangered Species Act species and habitats. While the types of impacts on Endangered Species Act species and habitats would likely be similar to those described for terrestrial and aquatic resources in Sections 4.6 and 4.7, respectively, the magnitude of such impacts could be larger than for terrestrial and aquatic resources because Endangered Species Act-listed species are rare and more sensitive to environmental stressors.
The National Marine Fisheries Service has not designated essential fish habitat in the Mississippi River. Given that the replacement power alternatives would be built on the RBS site, the NRC staff expects no impacts on essential fish habitat.
4.8.3.1 New Nuclear Alternative
The NRC staff did not identify any impacts for the new nuclear alternative beyond those discussed in the impacts common to all replacement power alternatives. Because the NRC would remain the licensing agency under this alternative, the Endangered Species Act would require the NRC to consult with the U.S. Fish and Wildlife Service, as applicable, prior to issuing a license for construction and operation of the new plant to consider whether the plant would affect any federally listed species or adversely modify or destroy designated critical habitat, if present. The magnitude of adverse impacts to Endangered Species Act-listed species would depend on the site layout, plant design, plant operations, and the listed species and habitats potentially present in the action area when the alternative is implemented. As described in the impacts common to all alternatives, the NRC staff expects no impacts to essential fish habitat from implementing the new nuclear alternative.

4-41
4.8.3.2 Supercritical Pulverized Coal Alternative
The NRC staff did not identify any impacts for the coal alternative beyond those discussed in the impacts common to all replacement power alternatives. Unlike RBS license renewal or the licensing of a new nuclear alternative, the NRC does not license coal facilities; therefore, the NRC would not be responsible for initiating Endangered Species Act Section 7 consultation if listed species or habitats might be adversely affected under this alternative. The companies or entities implementing this alternative would be responsible for ensuring that their actions do not jeopardize the continued existence of listed species because the Endangered Species Act Section 9 take prohibitions apply to both Federal and non-Federal entities. The magnitude of adverse impacts to Endangered Species Act-listed species would depend on the site layout, plant design, operation, and the listed species and habitats potentially present in the action area when the alternative is implemented. As described in the impacts common to all alternatives, the NRC staff expects no impacts to essential fish habitat from implementing the coal alternative.
4.8.3.3 Natural Gas Combined-Cycle Alternative
The NRC staff did not identify any impacts for the natural gas alternative beyond those discussed in the impacts common to all alternatives. As previously described for the coal alternative, the companies or entities implementing this alternative would be responsible for ensuring that their actions to not jeopardize the continued existence of any listed species. The magnitude of adverse impacts to Endangered Species Act-listed species would depend on the site layout, plant design, plant operation, and the listed species and habitats potentially present in the action area when the alternative is implemented. As described in the impacts common to all alternatives, the NRC staff expects no impacts to essential fish habitat from implementation of the natural gas alternative.
4.8.3.4 Combination Alternative (Natural Gas Combined Cycle, Biomass, and Demand Side Management)
The NRC staff did not identify any impacts for the combination alternative beyond those discussed in the impacts common to all replacement power alternatives. As previously described for the coal alternative, the companies or entities implementing this alternative would be responsible for ensuring that their actions to not jeopardize the continued existence of any listed species. The magnitude of adverse impacts to Endangered Species Act-listed species would depend on the site layout, plant design, plant operations, and the listed species and habitats potentially present in the action area when the alternative is implemented. As described in the impacts common to all alternatives, the NRC staff expects no impacts to essential fish habitat from implementation of the combination alternative.
4.9 Historic and Cultural Resources
This section describes the potential historic and cultural resources impacts of the proposed action (license renewal) and alternatives to the proposed action.
4.9.1 Proposed Action
Table 4-2 identifies one site-specific (Category 2) issue related to historic and cultural resources applicable to RBS during the license renewal term. This issue is analyzed below.

4-42
4.9.1.1 Category 2 Issue Related to Historic and Cultural Resources: Historic and Cultural Resources
The National Historic Preservation Act of 1966, as amended (NHPA) (54 U.S.C. 300101 et seq.), requires Federal agencies to consider the effects of their undertakings on historic properties. Issuing a renewed operating license to a nuclear power plant is an undertaking that could potentially affect historic properties. Historic properties are defined as resources included on, or eligible for inclusion on, the National Register of Historic Places (NRHP). The criteria for eligibility are listed in Title 36, “Parks, Forests, and Public Property” of the Code of Federal Regulations (36 CFR) 60.4 “Criteria for Evaluation,” and include (1) association with significant events in history, (2) association with the lives of persons significant in the past, (3) embodiment of distinctive characteristics of type, period, or construction, and (4) sites or places that have yielded, or are likely to yield, important information.
The historic preservation review process (Section 106 of the National Historic Preservation Act) is outlined in regulations issued by the Advisory Council on Historic Preservation (ACHP) in 36 CFR Part 800, “Protection of Historic Properties.”
In accordance with National Historic Preservation Act provisions, the NRC is required to make a reasonable effort to identify historic properties included in, or eligible for inclusion in, the National Register of Historic Places in the area of potential effect (APE). The area of potential effect for a license renewal action includes the power plant site, the transmission lines up to the first substation, and immediate environs that may be affected by the license renewal decision and land disturbing activities associated with continued reactor operations during the license renewal term.
If historic properties are present within the area of potential effect, the NRC is required to contact the State historic preservation officer (SHPO), assess the potential impact, and resolve any possible adverse effects of the undertaking (license renewal) on historic properties. In addition, the NRC is required to notify the State historic preservation officer if historic properties would not be affected by license renewal or if no historic properties are present. In Louisiana, State historic preservation officer responsibilities are shared between the Division of Historic Preservation and the Division of Archaeology (LOCD 2011, 2017).
4.9.1.2 Consultation
In accordance with 36 CFR 800.8(c), “Coordination with the National Environmental Policy Act,” on September 15, 2017, the NRC initiated written consultations with the Advisory Council on Historic Preservation and the Louisiana State historic preservation officer (NRC 2017c, 2017d). Also on September 15, 2017, the NRC initiated consultation with the following Federally-recognized Tribes (NRC 2017e, see Appendix C.):
• Chitimacha Tribe of Louisiana • Coushatta Tribe of Louisiana • Jena Band of Choctaw Indians • Tunica-Biloxi Tribe of Louisiana • Alabama Coushatta Tribe of Texas • The Choctaw Nation of Oklahoma

4-43
• Mississippi Band of Choctaw Indians • The Seminole Nation of Oklahoma • Seminole Tribe of Florida
In these letters, the NRC provided information about the proposed action, defined the area of potential effect, and indicated that the National Historic Preservation Act review would be integrated with the National Environmental Policy Act process, in accordance with 36 CFR 800.8(c). The NRC invited participation in the identification and possible decisions concerning historic properties and also invited participation in the scoping process. Previously, the Coushatta Tribe of Louisiana and the Choctaw Nation of Oklahoma indicated in correspondence to Entergy that the proposed action would result in “no historical properties affected” and “no effect on known historical or archaeological properties,” respectively (Entergy 2017h). Similarly, the Louisiana State Historic Preservation Officer previously reviewed the draft Phase 1A Literature Review and Archeological Sensitivity Assessment commissioned by Entergy in support of its license renewal application, and concurred that operation of RBS during the license renewal term would have no effect on known historic properties (Entergy 2017h). The NRC met with the Louisiana State historic preservation officer in October 2017. The Louisiana State historic preservation officer did not express any concerns about the proposed RBS license renewal during the meeting. Following issuance of the DSEIS in May 2018, the NRC received comments from two Federally-recognized Tribes with historic ties to West Feliciana Parish: the Choctaw Nation of Oklahoma concurred with the finding of “no adverse effect”; the Seminole Nation of Oklahoma did not provide substantive comments, but requested information regarding natural and cultural surveys conducted in the vicinity of RBS. The most recent surveys were conducted in 2007 and 2015, and the NRC staff and the applicant provided the requested information to the Seminole Nation of Oklahoma.
4.9.1.3 Findings
As described in Section 3.9, there are more than 100 known historic and cultural resources located within the RBS area of potential effect, including 25 properties that are either listed on, or are considered eligible for listing on, the National Register of Historic Places. Entergy has both fleet-wide and site-specific administrative controls in place to manage and protect cultural resources. Entergy’s fleet-wide cultural resource protection plan requires that appropriate reviews, investigations, and consultations are completed before performing ground-disturbing activities in undisturbed or cultural resource-sensitive areas. Although training on this plan is not compulsory, all Entergy employees are required to adhere to the instructions contained in the procedure. However, Entergy does not anticipate that any physical changes or ground-disturbing activities would be required to support license renewal of RBS (Entergy 2017h).
Based on (1) the location of National Register of Historic Places-eligible historic properties within the area of potential effect, (2) tribal input, (3) Entergy’s cultural resource protection plans, (4) the fact that no license renewal-related physical changes or ground-disturbing activities would occur, (5) State historic preservation officer input, and (6) a cultural resource assessment, the NRC staff concludes that license renewal would not adversely affect any known historic properties (36 CFR 800.4(d)(1)). However, Entergy could reduce the risk of potential impacts to historic and cultural resources located on or near the RBS site by ensuring workers engaged in planning and executing ground-disturbing activities are trained on the applicable cultural resource protection plans.

4-44
4.9.2 No-Action Alternative
If the NRC does not issue a renewed operating license, and Entergy terminates reactor operations, this would have no immediate effect on historic properties and cultural resources at RBS. As stated in the decommissioning GEIS, the NRC concluded that impacts to cultural resources would be SMALL at nuclear plants where decommissioning activities would only occur within existing industrial site boundaries. Impacts cannot be predicted generically if decommissioning activities would occur outside of the previously disturbed industrial site boundaries, because impacts depend on site-specific conditions. In these instances, impacts could only be determined through site-specific analysis (NRC 2002).
In addition, 10 CFR 50.82, “Termination of License,” requires power reactor licensees to submit a post-shutdown decommissioning activities report (PSDAR) to the NRC. The post-shutdown decommissioning activities report provides a description of planned decommissioning activities at the nuclear plant. Until the post-shutdown decommissioning activities report is submitted, the NRC cannot determine whether land disturbance would occur outside the existing industrial site boundary after the nuclear plant is shut down.
4.9.3 Replacement Power Alternatives: Common Impacts
Construction
The potential for impacts on historic and cultural resources from the construction of replacement power alternatives would vary depending on the degree of ground disturbance within the Entergy Louisiana, LLC property. For each replacement power alternative, this environmental review assumes that new facilities would be built on the RBS site on land adjacent to the existing RBS Unit 1. Use of previously disturbed areas of the Entergy property known to not contain historic and cultural resources would be maximized, and areas of greatest cultural sensitivity avoided. Undisturbed areas of the property that could potentially be affected by the construction of replacement power alternatives would need to be surveyed to identify and record historic and cultural resources. Any resources found in these surveys would need to be evaluated for eligibility on the National Register of Historic Places, and mitigation of adverse effects would need to be addressed if eligible resources were encountered.
Operation
The potential for impacts on historic and cultural resources from the operation of replacement power alternatives would vary with plant heights and associated exhaust stack or cooling tower plumes. These replacement power facilities would be located in an industrialized area where tall structures and visible plumes already exist. The nearest National Register of Historic Places site, the Star Hill Plantation, is about 1 mi (1.6 km) away to the northeast. The NRC staff does not expect Impacts on significant cultural resources, such as to viewsheds of historic properties near the proposed plant site, due to the presence of tree buffers and changes in elevation.
4.9.3.1 New Nuclear Alternative
Impacts on historic and cultural resources from the construction and operation of a new nuclear unit would include those common to all replacement power alternatives. The new nuclear alternative would require an estimated 250 ac (101 ha) of land for the power plant. Given the preference to site the power plant on previously disturbed land and given that no major infrastructure upgrades would be necessary, avoidance of significant historic and cultural

4-45
resources would be possible and could be managed effectively. Therefore, the NRC staff concludes that construction and operation of a new nuclear power plant on the Entergy property would not adversely affect known historic and cultural resources.
4.9.3.2 Supercritical Pulverized Coal Alternative
Impacts on historic and cultural resources from the construction and operation of a new coal power plant would include those common to all replacement power alternatives. The coal facility would require an estimated 100 ac (40 ha) of land for major permanent facilities, as well as additional land for coal mining and waste disposal. Impacts from the construction and operation of a new coal plant would be similar to the impacts described for the new nuclear alternative. Given the preference to site the power plant on previously disturbed land and given that no major infrastructure upgrades would be necessary, avoidance of significant historic and cultural resources would be possible and could be managed effectively. Therefore, the NRC staff concludes that construction and operation of a new coal power plant on the Entergy property would not adversely affect known historic and cultural resources.
4.9.3.3 Natural Gas Combined-Cycle Alternative
Impacts on historic and cultural resources from the construction and operation of a new natural gas alternative would include those common to all replacement power alternatives. The natural gas facility would require an estimated 50 ac (20 ha) of land for the power plant, as well as up to 25 ac (10 ha) for gas pipeline rights of way. Some infrastructure upgrades could be required, as well as construction of a new or upgraded pipeline. Impacts from the construction and operation of a new natural gas alternative would be similar to, but less than, the impacts described for the new nuclear and coal alternatives. Given the preference to site the power plant on previously disturbed land and given that no major infrastructure upgrades would be necessary, avoidance of significant historic and cultural resources would be possible and could be managed effectively. Therefore, the NRC staff concludes that construction and operation of a new natural gas power plant on the Entergy property would not adversely affect known historic and cultural resources.
4.9.3.4 Combination Alternative (Natural Gas Combined Cycle, Biomass, and Demand Side Management)
The combination alternative assumes that Entergy would build a new natural gas plant and four new biomass units on its existing property. Impacts on historic and cultural resources from the construction and operation of this facilities would include those common to all replacement power alternatives. The combination alternative would require a total of 120 ac (49 ha) of land for the natural gas and biomass components. Some infrastructure upgrades could be required, as well as construction of a new or upgraded natural gas pipeline. Additional offsite land for the biomass component is not anticipated for fuel feedstock but could be required for storing, loading, and transporting biomass fuel materials. The demand-side management component would be implemented through energy efficiency and demand-side management programs across the Entergy service area.
Impacts from the construction and operation of the natural gas and biomass components of the combination alternative would be similar to the new nuclear, coal and natural gas only alternatives. Given the preference to site the power plant on previously disturbed land and given that no major infrastructure upgrades would be necessary, avoidance of significant historic and cultural resources would be possible and could be managed effectively. Activities

4-46
associated with the demand-side management component of this alternative would not have any direct impact on historic and cultural resources. Therefore, the NRC staff concludes that construction and operation of the combination alternative on the Entergy property would not adversely affect known historic and cultural resources.
4.10 Socioeconomics
This section describes the potential socioeconomic impacts of the proposed action (license renewal) and alternatives to the proposed action.
4.10.1 Proposed Action
Socioeconomic effects of ongoing reactor operations at RBS have become well established as regional socioeconomic conditions have adjusted to the presence of the nuclear power plant. Any changes in employment and tax revenue caused by license renewal and any associated refurbishment activities could have a direct and indirect impact on community services and housing demand, as well as traffic volumes in the communities around the nuclear power plant.
Entergy indicated in its environmental report that it has no plans to add non-outage workers during the license renewal term and that increased maintenance and inspection activities could be managed using the current workforce (Entergy 2017h). Consequently, people living in the vicinity of RBS would not experience any changes in socioeconomic conditions during the license renewal term beyond what is currently being experienced. Therefore, the impact of continued reactor operations during the license renewal term would not exceed the socioeconomic impacts predicted in the GEIS. For these issues, the GEIS predicted that socioeconomic impacts would be SMALL for all nuclear plants.
4.10.2 No-Action Alternative
4.10.2.1 Socioeconomics
Under the no-action alternative, the NRC would not issue a renewed license, and RBS would shut down on or before the expiration of the current facility operating license. This would have a noticeable impact on socioeconomic conditions in the parishes and communities near RBS. The loss of jobs, income, and tax revenue would have an immediate socioeconomic impact. As jobs are eliminated, some, but not all, of the 680 RBS workers would begin to leave the region. Employment and income from the buying and selling of goods and services needed to operate and maintain the nuclear power plant would also be reduced. The loss of tax revenue could result in the reduction or elimination of some public and educational services.
If RBS workers and their families move out of the region, increased housing vacancies and decreased demand would likely cause housing prices to fall. Socioeconomic impacts from the termination of reactor operations would be concentrated in East Baton Rouge and West Feliciana parishes. These are the communities most reliant on income from nuclear plant operations at RBS because the majority of RBS workers reside in these two parishes. However, the socioeconomic impact from the loss of jobs, income, and tax revenue, may be less noticeable in some communities because of the amount of time required for decommissioning. The socioeconomic impacts from not renewing the operating license and terminating reactor operations at RBS would, depending on the jurisdiction, range from SMALL to MODERATE.

4-47
4.10.2.2 Transportation
Traffic congestion caused by commuting workers and truck deliveries on roads in the vicinity of RBS would be reduced after power plant shutdown. Most of the reduction in traffic volume would be associated with the loss of jobs. The number of truck deliveries to RBS would also be reduced until decommissioning. Traffic-related transportation impacts would be SMALL at RBS as a result of power plant shutdown.
4.10.3 Replacement Power Alternatives: Common Impacts
Workforce requirements for replacement power alternatives were evaluated to measure their possible effects on current socioeconomic and transportation conditions. Table 4-4 summarizes socioeconomic and transportation impacts of replacement power alternatives. The following provides a discussion of the common socioeconomic and transportation impacts during construction and operation of replacement power generating facilities.
4.10.3.1 Socioeconomics
Socioeconomic impacts are defined in terms of changes in the social and economic conditions of a region. For example, the creation of jobs and the purchase of goods and services during the construction and operation of a replacement power plant could affect regional employment, income, and tax revenue. For each alternative, two types of jobs would be created: (1) construction jobs, which are transient, short in duration, and less likely to have a long-term socioeconomic impact, and (2) operations jobs, which have the greater potential for permanent, long-term socioeconomic impacts.
While the selection of a replacement power alternative would result in the creation of new jobs, income, spending, and tax revenues, it would also result in the loss of jobs at RBS and a corresponding reduction in income and tax revenue in local parishes and communities. These impacts are described in the no-action alternative (Section 4.10.2).
Construction
The relative economic effect of an influx of workers on the local economy and tax base would vary, with the greatest impacts occurring in the communities where the majority of construction workers would reside and spend their incomes. As a result, some local communities could experience an economic boom during construction from increased tax revenue and income generated by expenditures for goods and services and the increased demand for temporary (rental) housing. After construction, local communities would likely experience a return to preconstruction economic conditions.
Operation
Prior to the commencement of startup and operations, local communities would see an influx of operations workers and their families and the increased demand for permanent housing and public services. These communities would also experience the economic benefits from increased income and tax revenue generated by the purchase of goods and services needed to operate a new replacement power plant. Consequently, power plant operations would have a greater potential for effecting permanent, long-term socioeconomic impacts on the region.

4-49
Alternative Resource Requirements Impacts Discussion Operations: 120 (NGCC) and 88 (Biomass) workers(C)
SMALL be few and scattered throughout the region, and would not have a noticeable effect on the local economy. The demand-side management component would not cause an increase traffic volumes on local roads and would therefore have no transportation impacts.
(a) Entergy 2017h, Times-Free Press 2015. (b) Entergy 2017h, NRC 1996. (c) Entergy 2017h, NRC 2013b.
Source: Entergy 2017h, NRC 1996, NRC 2013b, Times-Free Press 2015.
4.11 Human Health
This section describes the potential human health impacts of the proposed action (license renewal) and alternatives to the proposed action.
4.11.1 Proposed Action
As identified in Table 4-1, the impacts of all generic human health issues would be SMALL. Table 4-2 identifies two site-specific (Category 2) issues (microbiological hazards and electric shock hazards) and one uncategorized issue (chronic exposure to electromagnetic fields) related to human health applicable to RBS during the license renewal term. These issues are analyzed below.
4.11.1.1 Category 2 Issue Related to Human Health: Microbiological Hazards to the Public
In the GEIS (NRC 2013b), the NRC determined that the effects of thermophilic microorganisms on the public for plants using cooling ponds, lakes, or canals or cooling towers or that discharge to a river is a Category 2 issue (see Table 4-12) that requires site-specific evaluation during each license renewal review.
In order to determine whether the continued operations of RBS could promote increased growth of thermophilic microorganisms and thus have an adverse health effect on the public, the NRC staff considered several factors: the thermophilic microorganisms of concern, RBS’s thermal effluent characteristics, recreational use of the Mississippi River, and reports and input from the Louisiana Department of Health (LDH) and the Louisiana Office of Public Health (LOPH).
Section 3.11.3 describes the thermophilic microorganisms that the GEIS identified to be of potential concern at nuclear power plants and summarizes data from the Centers for Disease Control and Prevention (CDC), the Louisiana Office of Public Health, and the Louisiana Department of Health on the prevalence of waterborne diseases associated with these microorganisms. Data from the three organizations indicate that no outbreaks or cases of waterborne Salmonella, Pseudomonas aeruginosa, or Naegleria fowleri infection from the Mississippi River or recreational waters have occurred in Louisiana in the past 10 years of available data (CDC 2017d; LDH undated; LOPH 2013). Based on the information presented in Section 3.11.3, the thermophilic organisms most likely to be of potential concern at or near RBS are Shigella and Legionella.

4-48
4.10.3.2 Transportation
Transportation impacts are defined in terms of changes in level of service conditions on local roads in the region. Additional vehicles on local roadways during construction and operations could lead to traffic congestion, level of service impacts, and delays at intersections.
Construction
Transportation impacts during the construction of a replacement power plant would consist of commuting workers and truck deliveries of equipment and material to the construction site. Workers would arrive via site access roads and the volume of traffic would increase substantially during shift changes. In addition, trucks would transport equipment and material to the construction site, thus increasing the amount of traffic on local roads. The increase in traffic volumes could result in levels of service impacts and delays at intersections during certain hours of the day. In some instances, construction material could also be delivered by rail or barge.
Operation
Traffic-related transportation impacts would be greatly reduced after construction has been completed. Transportation impacts would include daily commuting by the operations workforce and deliveries of material, and the removal of commercial waste material by truck.
Table 4-4. Socioeconomic and Transportation Impacts of Replacement Power Alternatives
Alternative Resource Requirements Impacts Discussion New Nuclear Construction: 3,500
workers(a) MODERATE to LARGE
Some nuclear workers could transfer from RBS to the new nuclear power plant. Operations: 680 workers(a) SMALL to
MODERATE Supercritical Pulverized Coal
Construction: 2,200 workers(b)
MODERATE to LARGE
Onsite coal storage would make it possible to receive several trains per day at a site with rail access. Coal and limestone delivery and ash removal via rail would cause levels of service impacts due to delays at railroad crossings. Coal and other materials could be delivered by barge.
Operations: 300 workers(b) SMALL to MODERATE
Natural Gas Combined-Cycle
Construction: 1,450 workers(b)
MODERATE to LARGE
Because natural gas fuel is transported by pipeline, local roads would experience little to no increased traffic during power plant operations.
Operations: 180 workers(b) SMALL to MODERATE
Combination, NGCC, Biomass and Demand-Side Management
Construction: 960 (NGCC) and 200 (Biomass) workers(c)
SMALL to MODERATE
The demand-side management component could generate additional employment, depending on the nature of the conservation and energy efficiency programs and the need for direct measure installations in homes and office buildings. Jobs would likely

4-50
Shigellosis infections have been reported in the United States due to exposure in lakes, reservoirs, and other recreational waters (CDC 2004, 2006, 2008, 2011, 2014b, 2015a). RBS continuously discharges thermal effluent to the Mississippi River, creating a thermal plume with temperatures elevated above 90°F that is generally smaller than 54 ft by 5 ft (16.5 m by 1.5 m) (Entergy 2008a and 2017h). While the thermal discharge may occasionally be within the range of the optimal growth temperature for Shigella (95 °F (35 °C)), the thermal discharge is not likely to increase the rate of Shigellosis infections because the size of the thermal plume is relatively small compared to the width and depth of the Mississippi River, and the thermal effluent quickly dissipates given the fast flow of the Mississippi River near the discharge structure (Entergy 2017h). In addition, human contact with the thermal discharge is unlikely because recreational activities, such as swimming or boating, do not typically occur near the RBS discharge structure or near the thermal plume because of dangerous strong, swift currents (Entergy 2017h). The Louisiana Department of Health did not identify any concerns regarding any thermophilic organisms as result of RBS’s thermal effluent discharged into the Mississippi River (Entergy 2017d; NRC 2018b). Given the small area of thermally heated waters, the unlikelihood of the water to create conditions favorable to thermophilic microorganisms, and the lack of recreational activities that occur near the RBS thermal plume, infections are unlikely.
Legionellosis outbreaks are often associated with complex water systems housed inside buildings or structures, such as cooling towers (CDC 2017a). RBS has cooling towers as part of the cooling-water system. Public exposure to aerosolized Legionella would not be likely because such exposure would be confined to a small area of the site that is restricted to public access. Plant workers would be the most likely to be exposed when cleaning or providing other maintenance services that involve the cooling-water system, including cooling towers and condensers. Entergy (2017g) stated that several procedural measures would minimize the likelihood of exposure, such as conducting a standard methodology for identifying industrial hazards prior to performance of such jobs, and implementing worker protection measures. For example, because respiratory or nasal infectivity routes are of primary concern with legionellosis, workers performing underwater activities should wear protective gear to prevent oral or nasal exposure to amoebae or other pathogenic bacteria (NRC 2013b).
Conclusion
CDC, Louisiana Office of Public Health, and Louisiana Department of Health data indicate that no outbreaks or cases of waterborne Salmonella, Pseudomonas aeruginosa, or Naegleria fowleri infection from the Mississippi River or other recreational waters have occurred in Louisiana (CDC 2017d; LDH undated; LOPH 2013). Although the thermophilic microorganism Shigella has been linked to waterborne outbreaks in Louisiana, Shigella infections are unlikely given the small area of thermally heated waters, the unlikelihood of the water to create conditions favorable to thermophilic microorganisms, and the lack of recreational water use near the RBS thermal plume. In addition, the Louisiana Department of Health did not identify any concerns regarding thermophilic organisms as result of RBS’s thermal effluent (Entergy 2017d; NRC 2018b). Although Legionella has the potential to occur within cooling towers and condensers at RBS, infection is not likely given that these areas are restricted to the public and Entergy has procedures to help ensure that plant workers take protective measures to minimize exposure to biological hazards. Based on the above information, the NRC staff concludes that the impacts of thermophilic microorganisms to the public are SMALL for RBS license renewal.

4-51
4.11.1.2 Uncategorized Issue Relating to Human Health: Chronic Effects of Electromagnetic Fields (EMFs)
The GEIS (NRC 2013b) does not designate the chronic effects of 60-Hz electromagnetic fields (EMFs) from power lines as either a Category 1 or Category 2 issue. Until a scientific consensus is reached on the health implications of electromagnetic fields, the NRC will not include them as Category 1 or 2 issues.
The potential for chronic effects from these fields continues to be studied and is not known at this time. The National Institute of Environmental Health Sciences (NIEHS) directs related research through the U.S. Department of Energy (DOE).
The report by the National Institute of Environmental Health Sciences (NIEHS 1999) contains the following conclusion:
The NIEHS concludes that ELF-EMF (extremely low frequency-electromagnetic field) exposure cannot be recognized as entirely safe because of weak scientific evidence that exposure may pose a leukemia hazard. In our opinion, this finding is insufficient to warrant aggressive regulatory concern. However, because virtually everyone in the United States uses electricity and therefore is routinely exposed to ELF-EMF, passive regulatory action is warranted such as continued emphasis on educating both the public and the regulated community on means aimed at reducing exposures. The NIEHS does not believe that other cancers or non-cancer health outcomes provide sufficient evidence of a risk to currently warrant concern.
This statement was not sufficient to cause the NRC to change its position with respect to the chronic effects of electromagnetic fields. The NRC staff considers the GEIS finding of “UNCERTAIN” still appropriate and will continue to follow developments on this issue.
4.11.1.3 Category 2 Issue Related to Human Health: Electric Shock Hazards
Based on the GEIS, the Commission found that electric shock resulting from direct access to energized conductors or from induced charges in metallic structures has not been identified to be a problem at most operating plants and generally is not expected to be a problem during the license renewal term. However, a site-specific review is required to determine the significance of the electric shock potential along the portions of the transmission lines that are within the scope of RBS license renewal review.
As discussed in Section 3.11.4, there are no offsite transmission lines that are in scope for this SEIS. Therefore, there are no potential impacts to members of the public.
As discussed in Section 3.11.5, RBS maintains an occupational safety program in accordance with the Occupational Safety & Health Administration regulations for its workers, which includes protection from acute electric shock. Therefore, the NRC staff concludes that the potential impacts from acute electric shock during the license renewal term would be SMALL.
4.11.1.4 Severe Accidents
As shown in Table 4-1, design-basis accidents are addressed in the GEIS (NRC 2013b) as a Category 1 issue. Severe nuclear accidents are those that are more severe than design-basis

4-52
accidents because they could result in substantial damage to the reactor core, whether or not there are serious offsite consequences. In the GEIS, the NRC staff assessed the effects of severe accidents during the period of extended operation, using the results of existing analyses and site-specific information to conservatively predict the environmental impacts of severe accidents for each plant during the period of extended operation.
Severe accidents initiated by external phenomena such as tornadoes, floods, earthquakes, fires, and sabotage have not traditionally been discussed in quantitative terms in final environmental statements and were not specifically considered for the RBS site in the GEIS (NRC 1996). However, the GEIS did evaluate existing impact assessments performed by the NRC and by the industry at 44 nuclear plants in the United States and concluded that the risk from beyond-design-basis earthquakes at existing nuclear power plants is SMALL. The GEIS for license renewal performed a discretionary analysis of terrorist acts in connection with license renewal, and concluded that the core damage and radiological release from such acts would be no worse than the damage and release expected from internally initiated events. In the GEIS, the Commission concludes that the risk from sabotage and beyond-design-basis earthquakes at existing nuclear power plants is small and additionally, that the risks from other external events are adequately addressed by a generic consideration of internally initiated severe accidents (NRC 2013b).
Based on information in the 1996 GEIS, the staff found the following to be true:
The probability weighted consequences of atmospheric releases, fallout onto open bodies of water, releases to ground water, and societal and economic impacts from severe accidents are small for all plants. However, alternatives to mitigate severe accidents must be considered for all plants that have not considered such alternatives.
The NRC staff identified no new and significant information related to severe accidents during its review of Entergy’s environmental report for RBS (Entergy 2017h), the site audit, the scoping process, or the evaluation of other available information. Therefore, there are no impacts related to these issues for RBS beyond those discussed in the GEIS. However, in accordance with 10 CFR 51.53(c)(3)(ii)(L), the staff has reviewed severe accident mitigation alternatives (SAMAs) for RBS.
Severe Accident Mitigation Alternatives
Section 51.53(c)(3)(ii)(L) of 10 CFR Part 51 requires that license renewal applicants consider alternatives to mitigate severe accidents if the staff has not previously evaluated SAMAs for the applicant's plant in an EIS or related supplement or in an environmental assessment. The purpose of this consideration is to assure that plant changes (i.e., hardware, procedures, and training) with the potential for improving severe accident safety performance are identified and evaluated. SAMAs have not been previously considered for RBS; therefore, SAMAs are addressed in the following discussion and in Appendix F to this SEIS.
Overview of SAMA Process
This section presents a summary of Entergy’s SAMA evaluation for RBS and the NRC staff’s review of that evaluation. The NRC staff performed its review with contract assistance from Pacific Northwest National Laboratory. The NRC staff's review is available in greater detail in Appendix F to this SEIS; the applicant’s SAMA analysis is described in Section 4.15.1 and

4-53
Attachment D (Severe Accident Mitigation Alternatives Analysis) in Entergy’s environmental report for the RBS license renewal application.
Entergy conducted its River Bend SAMA evaluation using a four-step approach. In the first step, Entergy quantified the level of risk associated with potential reactor accidents using the plant-specific probabilistic risk assessment (PRA) and other risk models.
In the second step, Entergy examined the major risk contributors and identified possible ways (SAMAs) of reducing that risk. Common ways of reducing risk are changes to components, systems, procedures, and training. Entergy initially identified 206 potential SAMAs for RBS. Entergy performed an initial screening to eliminate any SAMAs that were not applicable to RBS due to design differences, had already been implemented at RBS, or were combined into a more comprehensive or plant-specific SAMA. As a result of this initial screening, 50 unique SAMAs remained for further evaluation.
In the third step, Entergy estimated the benefits and the costs associated with each of the SAMAs. Estimates were made of how much each SAMA could reduce risk. Those estimates were developed in terms of dollars in accordance with NRC guidance for performing regulatory analyses (NRC 1997). A more conservative monetary equivalent of unit dose of $5,500 per person-rem was used in the benefit calculations using the methodology in NUREG-1530, Rev. 1 (NRC 2015). The cost of implementing the proposed SAMAs was also estimated.
Finally, in the fourth step, Entergy compared the costs and benefits of each of the remaining SAMAs to determine whether each SAMA was cost beneficial, meaning the benefits of the SAMA were greater than the cost (a positive cost benefit). Entergy concluded in its environmental report that several of the SAMAs it evaluated are potentially cost beneficial (Entergy 2017h, Entergy 2017g).
The potentially cost-beneficial SAMAs do not relate to adequately managing the effects of aging during the period of extended operation; therefore, they need not be implemented as part of license renewal pursuant to 10 CFR Part 54, “Requirements for Renewal of Operating Licenses for Nuclear Power Plants.” Entergy did, however, enter the 10 potentially cost beneficial SAMAs into the action tracking process to further evaluate their implementation (Entergy 2017b, 2017g, 2017h), and the NRC staff has referred those SAMAs to appropriate members of the NRC’s operating reactor staff in the Office of Nuclear Reactor Regulation (NRR) for follow-up consideration. Entergy’s SAMA analyses and the NRC staff's review are discussed in more detail below.
Estimate of Risk
Entergy submitted an assessment of SAMAs for RBS as part of its environmental report (Entergy 2017h). Entergy based this assessment on the most recent revision of the River Bend PRA; an internal events model and plant-specific offsite consequence analysis performed using the MELCOR Accident Consequence Code System 2 (MACCS) computer program; and insights from the RBS individual plant examination (IPE) (Entergy 1993), individual plant examination of external events (IPEEE) (Entergy 1995), and the RBS internal flooding PRA.
Entergy combined two distinct analyses to form the basis for the risk estimates it used in the SAMA analysis: (i) the RBS Level 1 and 2 PRA model, which is an updated version of the IPE (Entergy 1993), and (ii) a supplemental analysis of offsite consequences and economic impacts

4-54
(essentially a Level 3 PRA model) developed specifically for the SAMA analysis. The scope of the models does not include external events or internal flooding events.
The RBS core damage frequency (CDF) for internal events is approximately 2.8 × 10⁻⁶ per year. Table 4-5 provides the breakdown of CDF by initiating event for RBS for internal events. Entergy used the PRA model for RBS in determining the potential risk reduction benefits of each SAMA. Entergy accounted for the potential risk reduction benefits associated with external events (e.g., fire, seismic, high wind and other events) and internal flooding events by multiplying the estimated benefits obtained from the River Bend PRA by a factor of seven.
Table 4-5. River Bend Station Core Damage Frequency for Internal Events
Initiating Event CDF
(per reactor-year) % CDF
Contribution Loss of Offsite Power 1.9 × 10⁻⁶ 69
Reactor Trip/Turbine Trip 2.8 × 10⁻⁷ 10
Inadvertent Opening of Safety Relief Valve (SRV) 1.5 × 10⁻⁷ 6
Failure of the Normal Service Water (NSW)/ Service Water Cooling (SWC) System
1.2 × 10⁻⁷ 4
Loss of Condenser Heat Sink 7.3 × 10⁻⁸ 3
Loss of the Feedwater/Condensate System 6.8 × 10⁻⁸ 2
Loss of Offsite Power Lead RSS1 5.0 × 10⁻⁸ 2
Loss of Offsite Power Lead RSS2 5.0 × 10⁻⁸ 2
Other Initiating Eventsa 8.0 × 10⁻⁸ 3
Total CDF (Internal Events) 2.8 × 10⁻⁶ 100b (a) Multiple initiating events with each contributing less than 1 percent (b) Sum of contributors does not add up to 100 percent due to round off error.
Source: Derived from Entergy 2017h
Entergy estimated the dose to the population within 50 mi (80 km) of the RBS site to be approximately 0.0121 person-Sievert (Sv) (1.21 person-rem) per year (Entergy 2017h). The breakdown of the total population dose and offsite economic cost risk by containment release mode is summarized in Table 4-6. Containment penetration failures in which the containment fails prior to core damage and debris cooling is unsuccessful (Source Term Category (STC) 9 and STC10) are the dominant contributors to population dose risk.

4-55
Table 4-6. Breakdown of Population Dose and Offsite Economic Cost by Containment Release Mode
Containment Release Modeb
Population Dose Riska Offsite Economic Cost Risk person- rem/yr
% Contribution
$/yr % Contribution
STC1 (Intact) 1.0 × 10⁻² 1 3.6 <1
STC4 2.1 × 10⁻² 2 1.3 × 10² 2
STC7 7.8 × 10⁻³ 1 5.8 <1
STC8 1.2 × 10⁻² 1 1.8 × 101 <1
STC9 4.7 × 10⁻¹ 39 2.5 × 10³ 34
STC10 5.5 × 10⁻¹ 46 3.9 × 10³ 53
STC13 6.1 × 10⁻² 5 2.9 × 10² 4
STC14 6.9 × 10⁻² 6 4.7 × 10² 6
Otherc 4.7 × 10⁻³ <1 3.0 × 101 <1
Total 1.21 100d 7.3 × 10³ 100
(a) Unit Conversion Factor: 1 Sv = 100 rem(b) Release Mode descriptions provided in Section D.1.2.3.1 of the ER (Entergy 2017h)
(c) Multiple release categories with each contributing less than 1 percent to frequency, populationdose, and offsite economic cost risk
(d) Sum of contributors does not add up to 100 percent due to round off error
Source: Derived from Entergy 2017h.
The NRC staff has reviewed Entergy's data and evaluation methods and concludes that the quality of the risk analyses is adequate to support an assessment of the risk reduction potential for candidate SAMAs. Accordingly, the staff based its assessment of offsite risk on the CDFs, offsite doses, and offsite economic costs reported by Entergy.
Potential Plant Improvements
Once Entergy identified the dominant contributors to plant risk, it searched for ways to reduce that risk. In identifying potential SAMAs, Entergy considered SAMAs identified in industry documents including the SAMA analyses performed for other operating plants, insights from the plant-specific PRA models, plant improvements identified in the River Bend IPE, and plant improvements identified in the IPEEE. Entergy identified 206 potential risk-reducing improvements (SAMAs) to plant components, systems, procedures, and training.
In evaluating potential SAMAs, Entergy performed a qualitative screening and eliminated 158 SAMAs from further consideration because they were not applicable to RBS due to design differences, they had already been implemented at RBS, they were similar in nature or could be combined with another SAMA, they had excessive implementation costs, or they were expected to have very low benefits. Entergy then performed a detailed cost-benefit analysis for each of the 50 remaining SAMAs.

4-56
The staff concludes that Entergy used a systematic and comprehensive process for identifying potential plant improvements for RBS, and that the set of SAMAs Entergy evaluated in its environmental report, together with those it evaluated in response to NRC staff inquiries, is reasonably comprehensive and, therefore, acceptable.
Evaluation of Risk Reduction and Costs of Improvements
Entergy evaluated the risk reduction potential of the 50 candidate SAMAs in addition to other SAMAs identified in response to NRC staff inquiries. Entergy performed SAMA evaluations using generally conservative assumptions. Entergy used PRA model requantification to determine the potential benefits for each SAMA, except for those SAMAs that specifically address internal floods and internal fires. The CDF, population dose, and offsite economic cost reductions for internal events were estimated using the River Bend PRA models (Entergy 2017h). For the internal flooding-related SAMA, Entergy used the RBS flooding analysis to estimate the reduction in CDF. The ratio of this CDF reduction to the total CDF for internal events was multiplied by the total present dollar value equivalent associated with completely eliminating severe accidents from internal events at RBS. For the two internal fire related SAMAs, Entergy used the fire analysis results to estimate the reduction in CDF. For each of these SAMA candidates, the ratio of the internal fire CDF reduction from implementing the SAMA to the total internal events CDF was multiplied by the total present dollar value equivalent associated with completely eliminating severe accidents from internal events at RBS to obtain the benefit for the reduction in the internal fire CDF.
The NRC staff reviewed the assumptions Entergy used to evaluate the benefit or risk reduction estimate for each of the plant improvements. The NRC staff concludes that the rationale and assumptions for estimating risk reduction are sufficient and appropriate for use in the SAMA evaluation because they are technically sufficient and meet the guidance provided in NEI 05-01A.
Entergy estimated the costs of implementing each of the candidate SAMAs through the development of RBS-specific cost estimates or with cost estimates developed by other NRC licensees for similar improvements at other nuclear power plants. The cost estimates conservatively did not account for inflation.
The NRC staff reviewed the bases for the applicant's cost estimates. For certain improvements, the staff also compared the cost estimates to estimates developed elsewhere for similar improvements, including estimates developed as part of other licensees' analyses of SAMAs for operating reactors. The NRC staff also reviewed the basis for the cost estimates during the NRC audit of the SAMA analysis. The NRC staff concludes that the cost estimates Entergy provided are sufficient and appropriate for use in the SAMA evaluation.
Cost-Benefit Comparison
Entergy based its cost-benefit analysis primarily on NUREG/BR-0184 (NRC 1997) and executed its analysis consistent with this guidance. A more conservative monetary equivalent of unit dose of $5,500 per person-rem was used in the benefit calculations using the methodology in NUREG-1530, Rev. 1 (NRC 2015). Entergy also followed NEI 05-01A, “Severe Accident Mitigation Alternatives (SAMA) Guidance Document” (NEI 2005), which was endorsed in NRC Regulatory Guide 4.2, Supplement 1 (NRC 2013). NEI 05-01A states that two sets of estimates should be developed—one using a 3 percent discount rate and one using a 7 percent discount rate (NEI 2005). Entergy provided a base set of results for a 29-year license renewal period

4-57
with a 3 percent and 7 percent discount rate sensitivity and based its decisions regarding potentially cost-beneficial SAMAs on these values. Entergy also performed sensitivity analyses involving two of the MACCS offsite contamination inputs, in accordance with the Commission’s decision in the Indian Point license renewal proceeding (CLI-16-07) (NRC 2016d).
In Entergy’s analysis, if the implementation costs for a candidate SAMA exceeded the calculated benefit, Entergy determined that the SAMA was not cost beneficial. If the SAMA benefit exceeded the estimated cost, then Entergy considered the SAMA candidate potentially cost beneficial. Considering the results from the baseline and sensitivity analyses, the full set of potentially cost-beneficial SAMAs that Entergy identified in its environmental report and in response to NRC staff inquiries are:
• SAMA No. 94a—Enhance procedures for actions on loss of heating, ventilation and air conditioning (HVAC) to the high pressure core spray (HPCS) pump room
• SAMA No. 94b—Enhance procedures for actions on loss of HVAC to the residual heat removal (RHR) B and C (B/C) pump rooms
• SAMA No. 94c—Enhance procedures for actions on loss of HVAC to the low pressure core spray (LPCS) and RHR A pump rooms
• SAMA No. 97—Perform study and analysis to add steps to trip unneeded emergency core cooling system (ECCS) pumps on loss of HVAC
• SAMA No. 102—Operator procedure revisions to provide additional space cooling to the emergency diesel generator (EDG) room via the use of portable equipment
• SAMA No. 169—Improve internal flooding procedures • SAMA No. 185—Upgrade the alternate shutdown system (ASDS) panel to include
additional system controls for opposite division • SAMA No. 198—Develop a procedure for alternating operation of low pressure
ECCS pumps for loss of standby service water (SSW) • SAMA No. 205—Revise flexible coping strategies (FLEX) procedures to allow use of
FLEX equipment in non-extended loss of alternating current power (ELAP) conditions
• SAMA No. 5.b.ii—Improve procedures and training on injection with the fire water system
Entergy entered the 10 potentially cost-beneficial SAMAs into the action tracking process to further evaluate their implementation (Entergy 2017g, 2017h, 2017i). The NRC staff reviewed Entergy’s cost-benefit evaluations of each SAMA and concludes that, with the exception of the 10 potentially cost-beneficial SAMAs discussed above; the costs of the SAMAs evaluated would be higher than the associated benefits.
Conclusions
The NRC staff reviewed Entergy's analysis and concludes that Entergy’s methods and the implementation of those methods were sound. The treatment of SAMA benefits and costs support the general conclusion that Entergy’s SAMA evaluations are reasonable and sufficient for the license renewal application submittal.
The staff agrees with Entergy’s conclusion that the 10 candidate SAMAs discussed in this section are potentially cost beneficial, which was based on generally conservative treatment of costs, benefits, and uncertainties. This conclusion of a small number of potentially cost beneficial SAMAs is consistent with the low residual level of risk indicated in the River Bend

4-58
PRA and the fact that Entergy has already implemented the plant improvements identified from the IPE and IPEEE. Because the potentially cost beneficial SAMAs do not relate to aging management during the period of extended operation, Entergy does not need to implement them as part of license renewal in accordance with Title 10 of the Code of Federal Regulations, Part 54. Nevertheless, Entergy stated that it has entered each of these potentially cost beneficial SAMAs into the RBS action tracking system to further evaluate their implementation, and the NRC staff has referred those SAMAs to appropriate staff members for follow-up consideration.
4.11.2 No-Action Alternative
Under the no-action alternative, the NRC would not issue a renewed license, and RBS would shut down on or before the expiration of the current facility operating license. Human health risks would be smaller following plant shutdown. The reactor unit, which currently operates within regulatory limits, would emit less radioactive gaseous, liquid, and solid material to the environment. In addition, following shutdown, the variety of potential accidents at the plant (radiological or industrial) would be reduced to a limited set associated with shutdown events and fuel handling and storage. In Section 4.11.1, the NRC staff concluded that the impacts of continued plant operation on human health would be SMALL, except for “Chronic effects of electromagnetic fields (EMFs),” for which the impacts are UNCERTAIN. In Section 4.12, the NRC staff concluded that the impacts of accidents during operation are SMALL. Therefore, as radioactive emissions to the environment decrease, and as the likelihood and types of accidents decrease following shutdown, the NRC staff concludes that the risk to human health following plant shutdown would be SMALL.
4.11.3 Replacement Power Alternatives: Common Impacts
Impacts on human health from construction of a power station would be similar to impacts associated with the construction of any major industrial facility. Compliance with worker protection rules, the use of personal protective equipment, training, and placement of engineered barriers would control those impacts on workers at acceptable levels.
The human health impacts from the operation of a power station include public risk from inhalation of gaseous emissions. Regulatory agencies, including the U.S. Environmental Protection Agency and State agencies, base air emission standards and requirements on human health impacts. These agencies also impose site-specific emission limits to protect human health.
4.11.3.1 New Nuclear Alternative
The construction impacts of one new nuclear unit would include those identified in Section 4.11.3. Since the NRC staff expects the licensee would limit access to active construction areas to only authorized individuals, the impacts on human health from the construction of one new nuclear unit would be SMALL.
The human health effects from the operation of one new nuclear unit would be similar to those of operating the existing RBS unit. As presented in Section 4.11.1, impacts on human health from the operation of RBS would be SMALL, except for “chronic effects of electromagnetic fields (EMFs),” for which the impacts are UNCERTAIN. Therefore, the NRC staff concludes that the impacts on human health from the operation of one new nuclear unit would be SMALL.

4-59
4.11.3.2 Supercritical Pulverized Coal Alternative
The construction impacts of a coal power plant would include those identified in Section 4.11.3 as common to all replacement power alternatives. Since limiting the active construction area access to only authorized individuals is expected, the impacts on human health from the construction of a coal power plant would be SMALL.
The human health effects from the operation of a coal power plant would include those identified in Section 4.11.3 as common to all power replacement alternatives. Coal-fired power generation introduces worker risks from coal and limestone mining; worker and public risk from coal, lime, and limestone transportation; and public risk from inhalation of stack emissions. In addition, human health risks are associated with the management and disposal of coal combustion waste. Coal combustion generates waste in the form of ash; equipment for controlling air pollution generates additional ash and scrubber sludge. Human health risks may extend beyond the facility workforce to the public depending on the public’s proximity to the coal combustion waste disposal facility. The character and the constituents of coal combustion waste depend on both the chemical composition of the source coal and the technology used to combust it. Generally, the primary sources of adverse consequences from coal combustion waste are from exposure to sulfur oxide and nitrogen oxide in air emissions, radioactive elements such as uranium and thorium, and heavy metals and hydrocarbon compounds contained in fly ash, bottom ash, and scrubber sludge (NRC 2013b). Regulatory agencies, including the U.S. Environmental Protection Agency (EPA) and state agencies, base air emission standards and requirements on human health impacts. These agencies also impose site-specific emission limits as needed to protect human health. Given the regulatory oversight exercised by the EPA and State agencies, the NRC staff concludes that the human health impacts from radiological doses, inhaled toxins, and particulates generated from the operation of a coal alternative would be SMALL.
4.11.3.3 Natural Gas Combined Cycle Alternative
The construction impacts of a natural gas alternative would include those identified in Section 4.11.3 as common to the construction of all replacement power alternatives. Since the NRC staff expects the builder will limit access to the active construction area to only authorized individuals, the impacts on human health from the construction of a natural gas alternative would be SMALL.
The human health effects from the operation of a natural gas alternative would include those identified in Section 4.11.3 as common to the operation of all replacement power alternatives. The risk may be attributable to nitrogen oxide emissions that contribute to ozone formation, which in turn contribute to health risk (NRC 2013b). Given the regulatory oversight exercised by EPA and State agencies, the NRC staff concludes that the human health impacts from the natural gas alternative would be SMALL.
4.11.3.4 Combination Alternative (Natural Gas Combined Cycle, Biomass, and Demand Side Management)
Impacts on human health from construction of a combination of natural gas, biomass, and demand-side management alternative would include those identified in Section 4.11.3 as common to the construction of all replacement power alternatives. Since the NRC staff expects the builder will limit access to the active construction area to only authorized individuals, the

4-60
impacts on human health from the construction of a natural gas, biomass, and demand-side management combination alternative would be SMALL.
Operational hazards at a natural gas facility are discussed in Section 4.11.3.3.
Operational hazards for biomass energy consists of the direct burning of forest residue/wood waste, which would likely include forest residue, primary mill residues, secondary mill residues, or urban wood residues. Given this method of fuel for power generation, the health impacts would be similar to those found in a comparably sized fossil-fuel power generation facility, and less for the biomass plants evaluated in this SEIS given the smaller total output (160 MWe) of the biomass plants included in this combination alternative,
Operational hazards impacts for the demand-side management portion of this alternative would be minimal and localized to activities such as weatherization efficiency of an end-user’s home or facility. The GEIS notes that the environmental impacts are likely to center on indoor air quality (NRC 2013b). This is because of increased weatherization of the home in the form of extra insulation and reduced air turnover rates from the reduction in air leaks. However, the actual impact is highly site specific and not yet well established.
Therefore, given the expected compliance with worker and environmental protection rules and the use of personal protective equipment, training, and engineered barriers, the NRC staff concludes that the potential human health impacts for the natural gas, biomass, and demand-side management alternative would be SMALL.
4.12 Environmental Justice
In Section 3.12 of this SEIS, the NRC staff explains the basis for its consideration of environmental justice impacts in an EIS and identifies environmental justice populations (i.e., minority and low-income populations) within a 50-mi (80-km) radius of RBS. In this section, the staff describes the potential human health and environmental effects of the proposed action (license renewal) and alternatives to the proposed action on minority and low-income populations.
4.12.1 Proposed Action
The NRC addresses environmental justice matters for license renewal by (1) identifying the location of minority and low-income populations that may be affected by the continued operation of the nuclear power plant during the license renewal term, (2) determining whether there would be any potential human health or environmental effects to these populations and special pathway receptors (groups or individuals with unique consumption practices and interactions with the environment), and (3) determining whether any of the effects may be disproportionately high and adverse. Adverse health effects are measured in terms of the risk and rate of fatal or nonfatal adverse impacts on human health. Disproportionately high and adverse human health effects occur when the risk or rate of exposure to an environmental hazard for a minority or low-income population is significant and exceeds the risk or exposure rate for the general population or for another appropriate comparison group. Disproportionately high environmental effects refer to impacts or risks of impacts on the natural or physical environment in a minority or low-income community that are significant and appreciably exceed the environmental impact on the larger community. Such effects may include biological, cultural, economic, or social impacts.

4-61
Figures 3-22 and 3-23 show the location of predominantly minority and low-income population block groups residing within a 50-mi (80-km) radius of RBS. This area of impact is consistent with the 50-mi (80-km) impact analysis for public and occupational health and safety. This chapter (Chapter 4) of the SEIS presents the assessment of environmental and human health impacts for each resource area. With the exception of groundwater resources, which would have SMALL to MODERATE impacts, the NRC staff’s analyses of impacts for all other environmental resource areas indicated that the impact from license renewal would be SMALL.
Potential impacts on minority and low-income populations (including migrant workers or Native Americans) would mostly consist of socioeconomic and radiological effects; however, radiation doses from continued operations during the license renewal term are expected to continue at current levels, and they would remain within regulatory limits. Section 4.11.1.4 discusses the environmental impacts from severe accidents that might occur during the license renewal term. The Commission has determined that the probability-weighted consequences of severe accidents are small.
Therefore, based on this information and the analysis of human health and environmental impacts presented in Chapter 4 of this SEIS, there would be no disproportionately high and adverse human health and environmental effects on minority and low-income populations from the continued operation of RBS during the license renewal term.
Subsistence Consumption of Fish and Wildlife
As part of addressing environmental justice concerns associated with license renewal, the NRC also assessed the potential radiological risk to special population groups (such as migrant workers or Native Americans) from exposure to radioactive material received through their unique consumption practices and interactions with the environment, including the subsistence consumption of fish, wildlife, and native vegetation; contact with surface waters, sediments, and local produce; absorption of contaminants in sediments through the skin; and inhalation of airborne radioactive material released from the plant during routine operation. The special pathway receptors analysis is an important part of the environmental justice analysis because consumption patterns may reflect the traditional or cultural practices of minority and low-income populations in the area, such as migrant workers or Native Americans. The results of this analysis is presented here.
Section 4-4 of Executive Order 12898, “Federal Actions to Address Environmental Justice in Minority Populations and Low-Income Populations,” (1994) (59 FR 7629) directs Federal agencies, whenever practical and appropriate, to collect and analyze information about the consumption patterns of populations that rely principally on fish and wildlife for subsistence and to communicate the risks of these consumption patterns to the public. In this SEIS, the NRC considered whether there were any means for minority or low-income populations to be disproportionately affected by examining impacts on American Indian, Hispanics, migrant workers, and other traditional lifestyle special pathway receptors. The assessment of special pathways considered the levels of radiological and nonradiological contaminants in fish, sediments, water, milk, and food products on or near RBS.
Radionuclides released to the atmosphere may deposit on soil and vegetation, and may therefore eventually be incorporated into the human food chain. To assess the impact of RBS operations to humans from the ingestion pathway, Entergy collects and analyzes samples of air, water, sediment, fish, food products, and milk, if available, for radioactivity as part of its ongoing, comprehensive Radiological Environmental Monitoring Program.

4-62
To assess the impact of nuclear power plant operations on the environment, samples are collected annually from the environment and analyzes them for radioactivity. A plant effect would be indicated if the radioactive material detected in a sample was larger or higher than background levels. Two types of samples are collected. The first type, a control sample, is collected from areas that are beyond the influence of the nuclear power plant or any other nuclear facility. These control samples are used as reference data to determine normal background levels of radiation in the environment. The second type of samples, indicator samples, are collected near the nuclear power plant from areas where any radioactivity contribution from the nuclear power plant will be at its highest concentration. These indicator samples are then compared to the control samples, to evaluate the contribution of nuclear power plant operations to radiation or radioactivity levels in the environment. An effect would be indicated if the radioactivity levels detected in an indicator sample was larger or higher than the control sample or background levels.
Entergy collected samples from the aquatic and terrestrial environment in the vicinity of RBS in 2016. The aquatic environment includes surface water, groundwater, fish, and shoreline sediment. Aquatic monitoring results for 2016 of water, sediment, and fish showed only naturally occurring radioactivity and radioactivity associated with fallout from past atmospheric nuclear weapons testing and were consistent with levels measured before the operation of RBS. Entergy detected no radioactivity greater than the minimum detectable activity in any aquatic sample during 2016, and identified no adverse long-term trends in aquatic monitoring data (Entergy 2017f).
The terrestrial environment includes airborne particulates, milk, and broad leaf vegetation. Terrestrial monitoring results for 2016 of broad leaf garden vegetable samples showed only naturally occurring radioactivity. Since milk samples were unavailable, Entergy collected vegetation samples to monitor the ingestion pathway. The radioactivity levels detected were consistent with levels measured prior to the operation of RBS. Entergy detected no radioactivity greater than the minimum detectable activity in any terrestrial samples during 2016. The terrestrial monitoring data also showed no adverse trends in the terrestrial environment (Entergy 2017f).
Analyses performed on all samples collected from the environment at RBS in 2016 showed no significant measurable radiological constituent above background levels. Overall, radioactivity levels detected in 2016 were consistent with previous levels as well as radioactivity levels measured prior to the operation of RBS. Radiological environmental monitoring program (REMP) sampling in 2016 did not identify any radioactivity above the minimum detectable activity (Entergy 2017f).
Based on the radiological environmental monitoring data from RBS, the NRC staff finds that no disproportionately high and adverse human health impacts would be expected in special pathway receptor populations in the region as a result of subsistence consumption of water, local food, fish, and wildlife. In addition, the continued operation of RBS would not have disproportionately high and adverse human health and environmental effects on these populations.
4.12.2 No-Action Alternative
Under the no-action alternative, the NRC would not issue a renewed license, and RBS would shut down on or before the expiration of the current facility operating license. Impacts on minority and low-income populations would depend on the number of jobs and the amount of

4-63
tax revenues lost by communities in the immediate vicinity of the power plant after RBS ceases operations. Not renewing the operating licenses and terminating reactor operations could have a noticeable impact on socioeconomic conditions in the communities located near RBS. The loss of jobs and income could have an immediate socioeconomic impact. Some, but not all, of the 680 employees would begin to leave after reactor operations are terminated. In addition, the plant would generate less tax revenue, which could reduce the availability of public services in West Feliciana Parish. This could disproportionately affect minority and low-income populations that may have become dependent on these services. See also Appendix J, “Socioeconomics and Environmental Justice Impacts Related to the Decision to Permanently Cease Operations,” of NUREG-0586, Supplement 1, Volume 1, “Final Generic Environmental Impact Statement on Decommissioning of Nuclear Facilities: Regarding the Decommissioning of Nuclear Power Reactors” (the Decommissioning GEIS, NRC 2002), for additional discussion of these impacts.
4.12.3 Replacement Power Alternatives: Common Impacts
Construction
Potential impacts to minority and low-income populations from the construction of a new replacement power plant would mostly consist of environmental and socioeconomic effects (e.g., noise, dust, traffic, employment, and housing impacts). The extent of effect experienced by these populations is difficult to determine since it would depend on the location of the power plant and transportation routes. Noise and dust impacts from construction would be short term and primarily limited to onsite activities. Minority and low-income populations residing along site access roads would be affected by increased truck traffic and increased commuter vehicle traffic, especially during shift changes. However, these effects would be temporary, would be limited to certain hours of the day, and would not likely be high and adverse. Increased demand for rental housing during construction could disproportionately affect low-income populations. However, given the proximity of RBS to the New Orleans metropolitan areas, construction workers could commute to the site, thereby reducing the potential demand for rental housing.
Operation
Low-income populations living near the power plant that rely on subsistence consumption of fish and wildlife could be disproportionately affected. Emissions during power plant operations could disproportionately affect nearby minority and low income populations, depending on the type of replacement power. However, permitted air emissions would remain within regulatory standards during operations.
Conclusion
Based on this information and the analysis of human health and environmental impacts presented in this SEIS, it is not likely that the construction and operation of a new replacement power plant and demand-side management would have disproportionately high and adverse human health and environmental effects on minority and low-income populations. However, this determination would depend on the location, plant design, and operational characteristics of the new power plant. Therefore, the NRC staff cannot determine whether any of the replacement power alternatives would result in disproportionately high and adverse human health and environmental effects on minority and low-income populations.

4-64
4.12.3.1 New Nuclear Alternative
Potential impacts to minority and low-income populations from the construction and operation of a new nuclear power plant would be the similar to the construction impacts described above. Potential impacts would mostly consist of radiological effects during operations; however, the NRC staff expects radiation doses to be well within regulatory limits.
4.12.3.2 Supercritical Pulverized Coal and Natural Gas Combined-Cycle Alternatives
Potential impacts to minority and low-income populations from the construction and operation of a new power plant would be the similar to the construction and operation impacts described above.
4.12.3.3 Combination Alternative (Natural Gas Combined-Cycle, Biomass, and Demand-Side Management)
Potential impacts to minority and low-income populations from the construction and operation of new natural gas and biomass power plants would be the similar to the construction and operation impacts described above. Low-income populations could benefit from weatherization and insulation programs in a demand-side management energy conservation program. This could have a greater effect on low-income populations than the general population, as low-income households generally experience greater home energy burdens than the average household. Increased utility bills due to increasing power costs could also disproportionately affect low-income populations. However, programs, such as the Louisiana Low Income Home Energy Assistance Program, are available to assist low-income families in paying for electricity.
4.13 Waste Management
This section describes the potential waste management impacts of the proposed action (license renewal) and alternatives to the proposed action.
4.13.1 Proposed Action
As identified in Table 4-1, the impacts of all generic waste management resource issues would be SMALL. Table 4-2 does not identify any RBS site-specific (Category 2) waste management issues resulting from issuing a renewed license for an additional 20 years of operations.
4.13.2 No-Action Alternative
If the NRC chooses the no-action alternative, it would not issue a renewed license, and RBS would cease operation at the end of the term of the initial operating license or sooner and enter decommissioning. The plant, which is currently operating within regulatory limits, would generate less spent nuclear fuel, emit less gaseous and liquid radioactive effluents into the environment, and generate less low-level radioactive and nonradioactive wastes. In addition, following shutdown, the variety of potential accidents at the plant (radiological and industrial) would be reduced to a limited set associated with shutdown events and fuel handling and storage. Therefore, as radioactive emissions to the environment decrease, and the likelihood and variety of accidents decrease following shutdown and decommissioning, the NRC staff concludes that impacts resulting from waste management from implementation of the no-action alternative would be SMALL.

4-65
4.13.3 Replacement Power Alternatives: Common Impacts
Impacts from waste management common to all analyzed replacement power alternatives would be from construction-related debris generated during construction activities, and this waste would be recycled or disposed of in approved landfills.
4.13.3.1 New Nuclear Alternative
Impacts from the waste generated during the construction of a new nuclear unit would include those identified in Section 4.13.3 as common to all replacement power alternatives.
During normal plant operations, routine plant maintenance and cleaning activities would generate radioactive low-level waste, spent nuclear fuel, and high-level waste, as well as nonradioactive waste. Sections 3.1.4 and 3.1.5 discuss radioactive and nonradioactive waste management at RBS. Quantities of radioactive and nonradioactive waste generated by RBS would be comparable to that generated by the new nuclear plant.
According to the GEIS (NRC 2013b), the NRC does not expect the generation and management of solid radioactive and nonradioactive waste during the license renewal term to result in significant environmental impacts.
Based on this information, the waste impacts would be SMALL for the new nuclear alternative.
4.13.3.2 Supercritical Pulverized Coal Alternative
Impacts from the waste generated during the construction of a coal power plant would include those identified in Section 4.13.3 as common to all replacement power alternatives.
Coal combustion generates waste in the form of fly ash and bottom ash. In addition, equipment for controlling air pollution generates additional ash, spent selective catalytic reduction catalyst, and scrubber sludge. The management and disposal of the large amounts of coal combustion waste is a significant part of the operation of a coal-fired power generating facility.
Although a coal-fired power generating facility is likely to use offsite disposal of coal combustion waste, some short-term storage of coal combustion waste (either in open piles or in surface impoundments) is likely to take place on site, thus establishing the potential for leaching of toxic chemicals into the local environment (NRC 2013b).
Based on the large volume and high toxicity of waste generated by coal combustion, the NRC staff concludes that the impacts from waste generated at a coal-fired plant would be MODERATE.
4.13.3.3 Natural Gas Combined-Cycle Alternative
Impacts from the waste generated during the construction of a natural gas power plant would include those identified in Section 4.13.3 as common to all replacement power alternatives.
Waste generation from natural gas technology would be minimal. The only significant waste generated at a natural gas combined-cycle power plant would be spent selective catalytic reduction catalyst (plants use selective catalytic reduction catalyst to control nitrogen oxide emissions).

4-66
The spent catalyst would be regenerated or disposed of offsite. Other than the spent selective catalytic reduction catalyst, waste generation at an operating natural gas fired plant would be limited largely to typical operations and maintenance of nonhazardous waste (NRC 2013b). Overall, the NRC staff concludes that waste impacts from the natural gas alternative would be SMALL.
4.13.3.4 Combination Alternative (Natural Gas Combined Cycle, Biomass, and Demand Side Management)
Impacts from the waste generated during the construction of a natural gas, biomass, and demand-side management alternative would include those identified in Section 4.13.3 as common to all replacement power alternatives.
During construction of the biomass-fired plants, land clearing and other construction activities would generate waste that could be recycled, disposed of onsite, or shipped to an offsite waste disposal facility. For operations, a wood biomass-fired plant may use as fuel the residues from forest clear cut and thinning operations, noncommercial species, or harvests of forests for energy purposes. In addition to the gaseous emissions, wood ash is the primary waste product of wood combustion (NRC 2013b). Given the regulatory oversight exercised by EPA and state agencies, the NRC staff concludes that the waste impacts from the biomass-fired plants considered as part of the combination alternative would be SMALL.
For demand-side management, there may be an increase in wastes generated during installation or implementation of energy conservation measures, such as appropriate disposal of old appliances, installation of control devices, and building modifications. New and existing recycling programs would help minimize the amount of generated waste (NRC 2013b).
Overall, the NRC staff concludes that waste impacts for the natural gas, biomass, and demand-side management combination alternative would be SMALL.
4.14 Evaluation of New and Significant Information
As stated in Section 4.1 of this SEIS, for Category 1 (generic) issues, the NRC staff can rely on the analysis in the GEIS (NRC 2013b) unless otherwise noted. Table 4-1 lists the Category 1 issues that apply to RBS during the proposed license renewal period. For these issues, the NRC staff did not identify any new and significant information during its review of the applicant’s environmental report, the site audits, or the scoping period that would change the conclusions presented in the GEIS.
New and significant information must be new based on a review of the GEIS (NRC 2013b) as codified in Table B-1 of Appendix B to Subpart A of 10 CFR Part 51. Such information must also bear on the proposed action or its impacts, presenting a seriously different picture of the impacts from those envisioned in the GEIS (i.e., impacts of greater severity than impacts considered in the GEIS, considering their intensity and context).
In accordance with 10 CFR 51.53(c), “Operating License Renewal Stage,” the applicant’s environmental report must analyze the Category 2 (site specific) issues in Table B-1 of
Please note: Chapter 2, Table 2-2, summarizes the environmental impacts of the proposed action and alternatives to the proposed action.

4-67
10 CFR Part 51, Subpart A, Appendix B. Additionally, the applicant’s environmental report must discuss actions to mitigate any adverse impacts associated with the proposed action and environmental impacts of alternatives to the proposed action. In accordance with 10 CFR 51.53(c)(3), the applicant’s environmental report does not need to analyze any Category 1 issue unless there is new and significant information on a specific issue.
NUREG-1555, Supplement 1, Revision 1, “Standard Review Plans for Environmental Reviews for Nuclear Power Plants for Operating License Renewal” describes the NRC process for identifying new and significant information (NRC 2013c). The search for new information includes:
• review of an applicant’s environmental report (Entergy 2017h) and the process for discovering and evaluating the significance of new information
• review of public comments • review of environmental quality standards and regulations • coordination with Federal, State, and local environmental protection and resource
agencies • review of technical literature as documented through this SEIS
New information that the staff discovers is evaluated for significance using the criteria set forth in the GEIS. For Category 1 issues in which new and significant information is identified, reconsideration of the conclusions for those issues is limited in scope to assessment of the relevant new and significant information; the scope of the assessment does not include other facets of an issue that the new information does not affect.
The NRC staff reviewed the discussion of environmental impacts associated with operation during the renewal term in the GElS and has conducted its own independent review, including a public involvement process (e.g., public meetings and comments) to identify new and significant issues for the RBS license renewal application environmental review. The NRC staff has not identified new and significant information on environmental issues related to operation of RBS during the renewal term. The NRC staff also determined that information provided during the public comment period did not identify any new issue that requires site-specific assessment.
4.15 Impacts Common to All Alternatives
This section describes the impacts that the NRC staff considers common to all alternatives discussed in this SEIS, including the proposed action and replacement power alternatives. The continued operation of a nuclear power plant and replacement fossil fuel power plants both involve mining, processing, and the consumption of fuel that result in comparative impacts (NRC 2013b). In addition, the following sections discuss termination of operations and the decommissioning of both a nuclear power plant and replacement fossil fuel power plants and greenhouse gas emissions.
4.15.1 Fuel Cycle
This section describes the environmental impacts associated with the fuel cycles of both the proposed action and all replacement power alternatives. Most replacement power alternatives employ a set of steps in the use of their fuel sources, which can include extraction, transformation, transportation, and combustion. Emissions generally occur at each stage of the fuel cycle (NRC 2013b).

4-68
4.15.1.1 Uranium Fuel Cycle
The uranium fuel cycle includes uranium mining and milling, the production of uranium hexafluoride, isotopic enrichment, fuel fabrication, reprocessing of irradiated fuel, transportation of radioactive materials, and management of low-level wastes and high-level wastes related to uranium fuel cycle activities. The GEIS describes in detail the generic potential impacts of the radiological and nonradiological environmental impacts of the uranium fuel cycle and transportation of nuclear fuel and wastes (NRC 1996, 1999, 2013b). The GEIS does not identify any site-specific (Category 2) uranium fuel cycle issues. Table 4-1 lists applicable Category 1 issues.
4.15.1.2 Replacement Power Plant Fuel Cycles
Fossil Fuel Energy Alternatives
Fuel cycle impacts for a fossil fuel-fired plant result from the initial extraction of fuel, cleaning and processing of fuel, transport of fuel to the facility, and management and ultimate disposal of solid wastes from fuel combustion. These impacts are discussed in more detail in Section 4.12.1.2 of the GEIS (NRC 2013b) and can generally include:
• significant changes to land use and visual resources • impacts to air quality, including release of criteria pollutants, fugitive dust, volatile
organic compounds, and coalbed methane into the atmosphere • noise impacts • geology and soil impacts due to land disturbances and mining • water resource impacts, including degradation of surface water and groundwater
quality • ecological impacts, including loss of habitat and wildlife disturbances • historic and cultural resources impacts within the mine or pipeline footprint • socioeconomic impacts from employment of both the mining workforce and service
and support industries • environmental justice impacts • health impacts to workers from exposure to airborne dust and methane gases • generation of coal and industrial wastes
New Nuclear Energy Alternatives
Uranium fuel cycle impacts for a nuclear plant result from the initial extraction of fuel, transport of fuel to the facility, and management and ultimate disposal of spent fuel. The environmental impacts of the uranium fuel cycle are discussed above in Section 4.15.1.1.
Renewable Energy Alternatives
The fuel cycle for renewable energy facilities is difficult to define for different technologies because these natural resources exist regardless of any effort to harvest them for electricity production. Impacts from the presence or absence of these renewable energy technologies are often difficult to determine (NRC 2013b).

4-69
4.15.2 Terminating Power Plant Operations and Decommissioning
This section describes the environmental impacts associated with the termination of operations and the decommissioning of a nuclear power plant and replacement power alternatives. All operating power plants will terminate operations and be decommissioned at some point after the end of their operating life or after a decision is made to cease operations. For the proposed action at RBS, license renewal would delay this eventuality for an additional 20 years beyond the current license period, which ends in 2025.
4.15.2.1 Existing Nuclear Power Plant
Decommissioning would occur whether RBS is shut down at the end of its current operating license or at the end of the license renewal term. NUREG-0586, Supplement 1, “Final Generic Environmental Impact Statement on Decommissioning of Nuclear Facilities: Regarding the Decommissioning of Nuclear Power Reactors” (the Decommissioning GEIS), evaluates the environmental impacts from the activities associated with the decommissioning of any reactor before or at the end of an initial or renewed license (NRC 2002). Additionally, the License Renewal GEIS (NRC 2013b) discusses the incremental environmental impacts associated with decommissioning activities resulting from continued plant operation during the renewal term. As noted in Table 4-1, there is one Category 1 issue applicable to RBS decommissioning following the license renewal term. The License Renewal GEIS did not identify any site-specific (Category 2) decommissioning issues.
4.15.2.2 Replacement Power Plants
Fossil Fuel Energy Alternatives
The environmental impacts from the termination of power plant operations and decommissioning of a fossil fuel-fired plant are dependent on the facility’s decommissioning plan. General elements and requirements for a fossil fuel plant decommissioning plan are discussed in Section 4.12.2.2 of the License Renewal GEIS and can include the removal of structures to at least 3 ft (1 m) below grade; removal of all coal, combustion waste, and accumulated sludge; removal of intake and discharge structures; and the cleanup and remediation of incidental spills and leaks at the facility. The decommissioning plan outlines the actions necessary to restore the site to a condition equivalent in character and value to the site on which the facility was first constructed (NRC 2013b).
The environmental consequences of decommissioning are discussed in Section 4.12.2.2 of the License Renewal GEIS and can generally include the following:
• short-term impacts on air quality and noise from the deconstruction of facility structures
• short-term impacts on land use and visual resources • long-term reestablishment of vegetation and wildlife communities • socioeconomic impacts due to decommissioning the workforce and the long-term
loss of jobs • elimination of health and safety impacts on operating personnel and general public
New Nuclear Alternatives
Termination of operations and decommissioning impacts for a nuclear plant include all activities related to the safe removal of the facility from service and the reduction of residual radioactivity

4-70
to a level that permits release of the property under restricted conditions or unrestricted use and termination of a license (NRC 2013b). The environmental impacts of the uranium fuel cycle are discussed in Section 4.15.1.1.
Renewable Alternatives
Termination of power plant operation and decommissioning for renewable energy facilities would be similar to the impacts discussed for fossil fuel-fired plants above. Decommissioning would involve the removal of facility components and operational wastes and residues to restore the site to a condition equivalent in character and value to the site on which the facility was first constructed (NRC 2013b).
4.15.3 Greenhouse Gas Emissions and Climate Change
The following sections discuss greenhouse gas emissions and climate change impacts. Section 4.15.3.1 evaluates greenhouse gas emissions associated with operation of RBS and replacement power alternatives. Section 4.15.3.2 discusses the observed changes in climate and the potential future climate change during the license renewal term based on climate model simulations under future global greenhouse gas emission scenarios. The cumulative impacts of global greenhouse gas emissions on climate are discussed in Section 4.16.9, “Global Greenhouse Gas Emissions.”
4.15.3.1 Greenhouse Gas Emissions from the Proposed Project and Alternatives
Gases found in the Earth’s atmosphere that trap heat and play a role in the Earth’s climate are collectively termed greenhouse gases. Greenhouse gases include carbon dioxide (CO2); methane (CH4); nitrous oxide (N2O); water vapor (H2O); and fluorinated gases, such as hydrofluorocarbons (HFCs), perfluorocarbons (PFCs), and sulfur hexafluoride (SF6). The Earth’s climate responds to changes in concentrations of greenhouse gases in the atmosphere because these gases affect the amount of energy absorbed and heat trapped by the atmosphere. Increasing greenhouse gas concentrations in the atmosphere generally increase the Earth’s surface temperature. Atmospheric concentrations of carbon dioxide, methane, and nitrous oxide have significantly increased since 1750 (IPCC 2007, 2013). Carbon dioxide, methane, nitrous oxide, water vapor, and fluorinated gases (termed long-lived greenhouse gases) are well mixed throughout the Earth’s atmosphere, and their impact on climate is long lasting as a result of their long atmospheric lifetime (EPA 2009b). Carbon dioxide is of primary concern for global climate change, due to its long atmospheric lifetime, and it is the primary gas emitted as a result of human activities. Climate change research indicates that the cause of the Earth’s warming over the last 50 years is due to the buildup of greenhouse gases in the atmosphere resulting from human activities (USGCRP 2014; 2017; IPCC 2013). The EPA has determined that greenhouse gases “may reasonably be anticipated both to endanger public health and to endanger public welfare” (74 FR 66496).
Proposed Action
Operation of RBS emits greenhouse gases directly and indirectly. RBS’s direct greenhouse gas emissions result from stationary portable combustion sources (see Table 3-4) and stationary refrigeration appliances. Indirect greenhouse gas emissions originate from mobile combustion sources (e.g., employee vehicles, visitor and delivery vehicles). Table 4-7 presents quantified annual greenhouse gas emissions from sources at RBS.

4-71
Entergy does not maintain an inventory of greenhouse gas emissions resulting from visitor and delivery vehicles. Chlorofluorocarbon and hydrochlorofluorocarbon emissions from refrigerant sources can result from leakage, servicing, repair, or disposal of refrigerant sources. Chlorofluorocarbons and hydrochlorofluorocarbons are ozone-depleting substances that are regulated by the Clean Air Act under Title VI. Entergy maintains a program to manage stationary refrigeration appliances at RBS to recycle, recapture, and reduce emissions of ozone-depleting substances (Entergy 2017h). Estimating greenhouse gas emissions from refrigerant sources is complicated due to their ability to deplete ozone, which is also a greenhouse gas, making their global warming potentials difficult to quantify. Consequently, greenhouse gas emissions from refrigerant sources are commonly excluded from greenhouse gas inventories (EPA 2014b). Therefore, Table 4-7 does not account for potential greenhouse gas emissions from stationary refrigeration appliances or visitor and delivery vehicles.
Table 4-7. Estimated Greenhouse Gas Emissions(a) from Operation at River Bend Station
Year RBS Combustion Sources(b)
(tons/year)
Workforce Commuting(c)
(tons/year) Total (tons/year) 2011 650 2,900 3,550 2012 400 2,900 3,300 2013 620 2,900 3,520 2014 360 2,900 3,260 2015 820 2,900 3,720 (a) Emissions are rounded up. (b) Includes stationary and portable diesel and gasoline engines described in Table 3-4. (c) Emissions consider RBS full-time employees and does not include 700-900 contractor workers during refueling
outages that occur on a 2-year cycle and last approximately 25-30 days.
Sources: Entergy 2017h, 2016e
No-Action Alternative
As discussed in previous no-action alternative sections, the no-action alternative represents a decision by the NRC not to renew the operating license of a nuclear power plant beyond the current operating license term. At some point, all nuclear plants will terminate operations and undergo decommissioning. The impacts from decommissioning are considered in the Decommissioning GEIS (NUREG–0586, NRC 2002). Therefore, the scope of impacts considered under the no-action alternative includes the immediate impacts resulting from activities at RBS that would occur between plant shutdown and the beginning of decommissioning (i.e., activities and actions necessary to cease operation of RBS). RBS operations would terminate at or before the end of the current license term. When the plant stops operating, a reduction in greenhouse gas emissions from activities related to plant operation, such as use of diesel generators and employee vehicles, would occur. The NRC staff anticipates that greenhouse gas emissions for the no-action alternative would be less than those presented in Table 4-7, “Estimated Greenhouse Gas Emissions from Operation at River Bend Station.”

4-72
Since the no-action alternative will result in a loss of power generating capacity due to shutdown, greenhouse gas emissions associated with replacement baseload power generation are discussed below for each replacement power alternative analyzed.
New Nuclear Alternative
The GEIS presents life-cycle greenhouse gas emissions associated with nuclear power generation. As presented in Tables 4.12-4 through 4.12-6 of the GEIS (NRC 2013b), life-cycle greenhouse gas emissions from nuclear power generation can range from 1 to 288 grams carbon equivalent per kilowatt-hour (g Ceq/kWh). Nuclear power plants do not burn fossil fuels to generate electricity and do not directly emit greenhouse gases. Sources of greenhouse gas emissions from the new nuclear alternative would include stationary combustion sources such as diesel generators, boilers, and pumps similar to existing sources at RBS (see Section 3.2.1). The NRC staff estimates that greenhouse gas emissions from a new nuclear alternative would be similar to greenhouse gas emissions from RBS.
Supercritical Pulverized Coal Alternative
The GEIS (NRC 2013b) presents lifecycle greenhouse gas emissions associated with coal power generation. As presented in Table 4.12-4 of the GEIS, lifecycle greenhouse gas emissions from coal power generation can range from 264 to 1,689 g Ceq/kWh. The NRC staff estimates that direct emissions from operation of two 600-MWe units equipped with carbon capture and storage would total 1.30 million tons (1.18 million MT) of carbon dioxide equivalents per year.
Natural Gas Combined-Cycle Alternative
The GEIS (NRC 2013b) presents life-cycle greenhouse gas emissions associated with natural gas power generation. As presented in Table 4.12-5 of the GEIS, life-cycle greenhouse gas emissions from natural gas can range from 120 to 930 g Ceq/kWh. The NRC staff estimates that direct emissions from operation of three 400 MWe natural gas combined-cycle units would total 3.9 million tons (3.6 million MT) of carbon dioxide equivalents per year.
Combination Alternative
For the combination alternative, greenhouse gases would primarily be emitted from the natural gas and biomass-fired portions of this combination alternative. The NRC staff estimates that operation of the natural gas and biomass-fired units would emit a total of 4.7 million tons (4.2 million MT) of carbon dioxide equivalents per year.
Summary of Greenhouse Gas emissions from the Proposed Action and Alternatives
Table 4-8 presents the direct greenhouse gas emissions from facility operations under the proposed action and alternatives. Greenhouse gas emissions from the proposed action (license renewal), no-action alternative, and new nuclear alternative would be the lowest. Greenhouse gas emissions from the natural gas, coal, and combination alternatives are several orders of magnitude greater than those from the continued operation of RBS. Therefore, if RBS generating capacity were to be replaced by any of these three alternatives, there would be an increase in greenhouse gas emissions. Consequently, continued operation of RBS (the proposed action) results in greenhouse gas emissions avoidance.

4-73
Table 4-8. Direct Greenhouse Gas Emissions from Facility Operations Under the Proposed Action and Alternatives
Technology/Alternative CO2eq (tons/year) Proposed Action (RBS license renewal)(a) 820 No-Action Alternative(b) 820 New Nuclear(c) 820 Supercritical Pulverized Coal(d) 1.3 x 10⁶ Natural Gas Combined-Cycle(e) 3.9 x 10⁶ Combination Alternative(f) 4.7 x 10⁶
(a) Greenhouse gas emissions include only direct emissions from combustion sources for the year 2013 presented in Table 4-7 (Source: Entergy 2017h).
(b) Emissions resulting from activities at RBS that would occur between plant shutdown and the beginning of decommissioning and assumed not to be greater than greenhouse gas emissions from operation of RBS.
(c) Emissions assumed to be similar to RBS operation. (d) Emissions from direct combustion of coal and assumes 90 percent removal of the carbon dioxide produced
by facility power generation. Greenhouse gas emissions estimated using emission factors developed by the U.S. Department of Energy’s (DOE’s) National Energy Technology Laboratory (NETL 2010b).
(e) Emissions from direct combustion of natural gas. Greenhouse gas emissions estimated using emission factors developed by DOE’s National Energy Technology Laboratory (NETL 2010a).
(f) Emissions from the natural gas combined-cycle and Biomass components of the alternative. Biomass greenhouse gas emissions estimated using emission factors developed by DOE’s National Renewable Energy Laboratory (NREL 1997).
4.15.3.2 Climate Change
Climate change is the decades or longer change in climate measurements (e.g., temperature and precipitation) that has been observed on a global, national, and regional level (IPCC 2007; EPA 2016a; USGCRP 2014). Climate change can vary regionally, spatially, and seasonally, depending on local, regional, and global factors. Just as regional climate differs throughout the world, the impacts of climate change can vary between locations.
On a global level, from 1901 to 2015, average surface temperatures rose at a rate of 0.15 ˚F (0.08 ˚C) per decade, and total annual precipitation increased at an average rate of 0.8 in. (2 cm) per decade (EPA 2016a). The year 2016 was the warmest on record globally (NASA 2017). The observed global change in average surface temperature and precipitation has been accompanied by an increase in sea surface temperatures, a decrease in global glacier ice, an increase in sea level, and changes in extreme weather events. Such extreme events include an increase in the frequency of heat waves, heavy precipitation, and recorded maximum daily high temperatures (IPCC 2007; USGCRP 2009, 2014; EPA 2016a).
In the United States, the U.S. Global Change Research Program (USGCRP) reports that, from 1895 to 2016, average surface temperature increased by 1.8 °F (1.0 °C) and, since 1901, average annual precipitation has increased by 4 percent (USGCRP 2017). On a seasonal basis, warming has been the greatest in winter. Since the 1980s, an increase in the length of the frost-free season, the period between the last occurrence of 32 ˚F (0 °C) in the spring and first occurrence of 32 ˚F (0 °C) in the fall, has been observed for the contiguous United States; between 1991 and 2011, the average frost-free season was 10 days longer than between 1901 and 1960 (USGCRP 2014). Observed climate-related changes in the United States include increases in the frequency and intensity of heavy precipitation, earlier onset of spring snowmelt

4-74
and runoff, rise of sea level in coastal areas, increase in occurrence of heat waves, and a decrease in occurrence of cold waves (USGCRP 2014). Since the 1980s, the intensity, frequency, and duration of North Atlantic hurricanes has increased; however, there is no trend in landfall frequency along the U.S. eastern and Gulf coasts (USGCRP 2014).
Temperature data indicate that the Southeast region of the United States, where RBS is located, did not experience significant warming overall for the time period from 1900 to 2012 (USGCRP 2014). The lack of warming in the Southeast has been termed “the warming hole” (NOAA 2013b). Annual and seasonal temperatures across the Southeast have exhibited variability during the 20th century. However, since 1970, average annual temperatures have steadily increased and have been accompanied by an increase in the number of days with daytime maximum temperatures above 90 °F (32.2 °C) and nights above 75 °F (23.9 °C) (USGCRP 2009, NOAA 2013a, IPCC 2007, USGCRP 2014). Average annual precipitation data for the Southeast does not exhibit an increasing or decreasing trend for the long-term period (1895–2011) (NOAA 2013b). However, precipitation in the Southeast region varies considerably throughout the seasons and average precipitation has increased in the fall and decreased in the summer (NOAA 2013b and USGCRP 2009). The average number of frost-free days increased by 4 days in the Southeast region during the 1986–2015 time frame relative to 1901–1960 (USGCRP 2017).
The NRC staff analyzed temperature and precipitation trends for the period of 1865 to 2016 in the east central region of Louisiana (NOAA 2017). Average annual temperatures show large year-to-year variations and no clear trend is observed (NOAA 2017). Average annual precipitation also displays year-to-year variations; however, precipitation has increased at a rate of 0.39 in. (1.0 cm) per decade. No trends in the number of extreme precipitation events (defined as precipitation greater than 4 inches, averaged over 5-year periods) since 1900 have been observed for Louisiana (Frankson et al., 2017). Relative sea level along the southeastern Louisiana coast has increased by more than 8 in. (20 cm) between 1960 and 2015 (EPA 2016a). Sea level rise in coastal Louisiana is partially driven by land subsidence, which occurs as a result of both natural and anthropogenic processes (Jones et al. 2016).
Future global greenhouse gas emission concentrations (emission scenarios) and climate models are commonly used to project possible climate change. Climate models indicate that over the next few decades, temperature increases will continue due to current greenhouse gas emission concentrations in the atmosphere (USGCRP 2014). Over the longer term, the magnitude of temperature increases and climate change effects will depend on both past and future global greenhouse gas emissions (IPCC 2007, 2013; USGCRP 2009, 2014). Climate model simulations often use greenhouse gas emission scenarios to represent possible future social, economic, technological, and demographic development that, in turn, drive future emissions. The Intergovernmental Panel on Climate Change (IPCC) has generated various climate scenarios commonly used by climate-modeling groups (IPCC 2000). For instance, the A2 scenario is representative of a high-emission scenario in which greenhouse gas emissions continue to rise during the 21st century from 40 gigatons (GT) of CO2eq per year in 2000 to 140 GT of CO2eq per year by 2100. The B1 scenario, on the other hand, is representative of a low-emission scenario in which emissions rise from 40 GT of CO2eq per year in 2000 to 50 GT of CO2eq per year midcentury before falling to 30 GT of CO2eq per year by 2100. Therefore, climate model simulations identify how climate may change in response to the Earth’s atmospheric greenhouse gas composition.
For the license renewal period of RBS (2025–2045), climate model simulations (between 2021 and 2050 relative to the reference period (1971–1999)) indicate an increase in
4-75
annual mean temperature in the Southeast region from 1.5–3.5 °F (0.83–1.9 °C), with larger temperature increases for the northwest part of the region, for both a low- and high-emission-modeled scenario (NOAA 2013b). Increases in temperature during this time period are projected to occur for all seasons with the largest increase occurring in the summertime (June, July, and August). Climate model simulations (for the time period 2021–2050) suggest spatial differences in annual mean precipitation changes for the Southeast with some areas experiencing an increase and others a decrease in precipitation. On a seasonal basis, climate models are not in agreement on the sign (increases or decreases) of precipitation changes. For Louisiana, a 0 to 3 percent decrease in annual mean precipitation is predicted under both a low- and high-emission-modeled scenario; however, these changes in precipitation were not significant and the models indicate changes that are less than normal year-to-year variations (NOAA 2013b). Climate models are not in agreement when projecting changes in Atlantic hurricane activity; however, models agree that under a warmer climate, hurricane-associated rainfall rates and wind speed will increase (USGCRP 2014; EPA 2016a).
Changes in climate have broader implications for public health, water resources, land use and development, and ecosystems. For instance, changes in precipitation patterns and increase in air temperature can affect water availability and quality, distribution of plant and animal species, land use patterns, and land cover, which can in turn affect terrestrial and aquatic habitats. In the next section of this SEIS, the NRC staff considers the potential cumulative, or overlapping, impacts from climate change on environmental resources that could be impacted by the proposed action. In accordance with 10 CFR Part 51, Appendix A to Subpart A, “Format for Presentation of Material in Environmental Impact Statements,” the level of detail on climate change impacts that the NRC staff provides within the cumulative discussions in this SEIS are commensurate with the potential for adverse or significant impacts to a specific resource area.
4.16 Cumulative Impacts
Cumulative impacts may result when the environmental effects associated with the proposed action (license renewal) are added to the effects from other past, present, and reasonably foreseeable future actions. Cumulative impacts can result from individually minor, but collectively significant, actions taking place over a period of time. An impact that may be SMALL by itself could result in a greater impact when combined with the impacts of other actions. As further described in the GEIS (NRC 2013b), both the license renewal and other actions (related and nonrelated, including trends such as urbanization and global climate change) will generate effects that could contribute to cumulative impacts on a number of resources. Cumulative impacts represent the total impacts on a given resource.
This section also describes the impact contributors from other actions for each resource area for which a cumulative impacts analysis has been performed. However, the NRC staff no longer assigns a significance level (i.e., SMALL, MODERATE, or LARGE) for the total cumulative impact on a resource. This is because it is usually not meaningful or possible to attribute the relative contribution to the total impact on a resource that results from individual actions. In addition, the NRC’s regulations for implementing the National Environmental Policy Act in 10 CFR Part 51, “Environmental Protection Regulations for Domestic Licensing and Related Regulatory Functions,” do not require that the staff make a determination of significance for each cumulative impact resource area.
For the purposes of this analysis, past actions are those that occurred prior to the receipt of the license renewal application, present actions are those that are occurring during current power plant operations, and future actions are those that are reasonably foreseeable to occur through

4-76
the end of power plant operation, including the period of extended operation. Therefore, the analysis considers potential cumulative impacts through the end of the current license term, as well as through the 20-year renewal license term.
To evaluate cumulative impacts, the NRC staff combines the incremental impacts of the proposed action, as described in Sections 4.2 to 4.13, with the impacts of other past, present, and reasonably foreseeable future actions regardless of which agency (Federal or non-Federal) or person undertakes such actions. A cumulative impacts analysis accounts for both geographic (spatial) and time (temporal) considerations of past, present, and reasonably foreseeable future actions to determine whether other potential actions are likely to contribute to the total impact. In addition, because cumulative impacts accrue to resources and focus on overlapping impacts with the proposed action, the NRC staff performs no cumulative impacts analysis for resource areas where the proposed action is unlikely to have any incremental impacts on that resource. Consequently, the NRC staff did not perform a cumulative impacts analysis for the following resource areas: land use, noise, terrestrial resources, and geology and soils.
In performing this cumulative impacts analysis, the NRC staff used the information provided in Entergy’s environmental report; Entergy’s responses to requests for additional information; information from other Federal, State, and local agencies; scoping comments; and information the staff gathered during a visit to RBS to identify past, present, and reasonably foreseeable future actions. In general, the effects of past actions are described in Chapter 3, the affected environment, which serves as the environmental baseline for the cumulative impacts analysis.
Appendix E of this SEIS describes other actions and projects that the NRC staff identified during this review and considered in its analysis of the potential cumulative effects.
4.16.1 Air Quality
The region of influence (ROI) considered in the cumulative air quality analysis is the West Feliciana Parish because air quality designations in Louisiana are made at the parish level. No refurbishment-related activities are proposed during the license renewal period. As a result, the NRC staff expects similar emissions during the license renewal period, as presented in Section 3.3.2, from operation of RBS. Appendix E provides a list of present and reasonably foreseeable projects that could contribute to cumulative impacts to air quality. Current air emission sources operating in West Feliciana Parish have not resulted in long-term National Ambient Air Quality Standards (NAAQS) violations given the designated unclassifiable/attainment status for all National Ambient Air Quality Standards in West Feliciana Parish. Consequently, cumulative changes to air quality in West Feliciana Parish would be the result of future projects and actions that change present-day emissions within the parish.
Development and construction activities identified in Appendix E (e.g., River Bend Station Demolition Activities and ISFSI installation) can increase air emissions during their respective construction period, but those air emissions would be temporary and localized. However, future operation of new commercial and industrial facilities and increases in vehicular traffic can result in overall long-term air emissions that contribute to cumulative air quality impacts. Any new stationary sources of emissions that would be established in the region would be required to apply for an air permit from the Louisiana Department of Environmental Quality and be operated in accordance with regulatory requirements. However, as noted in Appendix E, there are few reasonably foreseeable actions.

4-77
Climate change can impact air quality as a result of changes in meteorological conditions. The formation, transport, dispersion, and deposition of air pollutants depend, in part, on weather conditions (IPCC 2007). Ozone has been found to be particularly sensitive to climate change (IPCC 2007; EPA 2009a). Ozone is formed, in part, as a result of the chemical reaction of nitrogen oxides and volatile organic compounds in the presence of heat and sunlight. Sunshine, high temperatures, and air stagnation are favorable meteorological conditions to higher levels of ozone (IPCC 2007; EPA 2009b). The emission of ozone precursors also depends on temperature, wind, and solar radiation (IPCC 2007). Both nitrogen oxide and biogenic volatile organic compound emissions are expected to be higher in a warmer climate (EPA 2009a). Although surface temperatures are expected to increase in the Southeast region, this may not necessarily result in an increase in ozone concentrations (Diem et al., 2017). For instance, during the fall in the Southeast, ozone concentrations correlate with humidity (Zhang et al., 2016). Wu et al. (2008) modeled changes in ozone levels in response to climate change and found negligible climate change-driven ozone concentrations for the Southeast region. Tao et al. (2007) found differences in future changes in ozone for the Southeast with decreases in ozone concentrations under a low-emission modelled scenario and increases under a high-emission modelled scenario. Among modelled studies of climate-related ozone changes, model simulations for the Southeast region have the least consensus.
In summary, given the few number of reasonably foreseeable projects that may increase air emissions in the region and combined with present-day emissions from various facilities, the NRC staff concludes that the cumulative impacts on air quality would not be significant.
4.16.2 Water Resources
4.16.2.1 Surface Water Resources
The description of the affected environment in Section 3.5.1 serves as the baseline for the cumulative impacts assessment for surface water resources. The geographic area considered for the surface water resources component of this analysis comprises the Lower Mississippi-Baton Rouge watershed, with a detailed focus on the St. Francisville reach of the Lower Mississippi River centered on a 5-mi (8-km) radius of the RBS river intake and discharge structures. The St. Francisville reach traverses three Louisiana parishes (i.e., West Feliciana, East Feliciana, and Point Coupee) that are applicable to this analysis. As such, this review centered on those projects and activities that would withdraw water from, or discharge effluents to, the cited segment of the Lower Mississippi River or to contributing water bodies.
Water Use Considerations
In support of this cumulative impacts analysis, the NRC staff obtained and evaluated the best available data on projected trends in water use, as compiled by water resources management agencies. The U.S. Geological Survey, in cooperation with the Louisiana Department of Transportation and Development, maintains water withdrawal and use information for the State of Louisiana. Every 5 years, the U.S. Geological Survey publishes a water use report that presents data by category of use (public supply, industrial, power generation, livestock, irrigation, and aquaculture) for each parish and surface water basin (Sargent 2012). Since 2012, the U.S. Geological Survey has been estimating withdrawals in Louisiana on an annual basis (USGS 2017h). Data that the U.S. Geological Survey collects include water withdrawals, but the data do not quantify consumptive water use (i.e., water that is withdrawn but not returned to its source).

4-78
Table 4-9 presents cumulative surface water withdrawals from the Lower Mississippi River and tributaries relative to the three parishes that bound the St. Francisville reach of the Lower Mississippi River. As shown in the table, major surface water usage is for thermoelectric power generation and industrial use (e.g., paper products), with relatively minor volumes for other uses (Sargent 2012).
Entities withdrew a total of about 372 mgd (575 cfs; 16.2 m3/s) of surface water within the three parishes in 2014, with the majority withdrawn from the mainstem of the Lower Mississippi River. As shown in Table 4-9, withdrawals for thermoelectric power generation account for more than 90 percent of the total volume withdrawn. In addition to RBS, this volume reflects total withdrawals for such power generation and industrial facilities as the Big Cajun II Power Plant and Hood Container of Louisiana, as described in Table E-1 in Appendix E. RBS withdraws an average of 17.7 mgd (27.4 cfs; 0.77 m3/s) of water from the Lower Mississippi River. Thus, RBS accounts for about 5 percent of the total withdrawals from the St. Francisville reach of the river.
Table 4-9. Cumulative Surface Water Withdrawals from the Lower Mississippi River, St. Francisville Reach, 2014
Water Use Sector Volume (mgd)(a) Thermoelectric Power Generation 340.11 Aquaculture 16.1 Industrial 14.51 General Irrigation 1.03 Livestock 0.27 Total 372.02
Note: To convert million gallons per day (mgd) to cubic feet per second (cfs), multiply by 1.547. (a) Reported values include withdrawals by users in Pointe Coupee, West Feliciana, and East Feliciana parishes.
Source: USGS 2017k
The mean annual discharge (flow) of the Lower Mississippi River through the St. Francisville reach is 547,373 cfs (15,463 m3/s). This is equivalent to approximately 354,000 mgd. Total surface water withdrawals from the St. Francisville reach are currently equivalent to approximately 0.11 percent of the mean annual flow of the river. Conservatively assuming that all the water withdrawn is for consumptive use and not returned to the river, this volume has a negligible impact on downstream and instream water availability.
In predicting future surface water demands and cumulative impacts on surface waters, the NRC staff considered past, present, and reasonably foreseeable future actions as well as available data on water use trends. Between 2012 and 2014, total surface water withdrawals within the three-parish region increased by about 10 percent, primarily due to withdrawals for power generation in Point Coupee Parish. For the entire Mississippi Basin, however, surface water withdrawals only increased by about 1 percent (0.5 percent per year) over the same timeframe (USGS 2017f).
Using a growth rate of 0.5 percent per year for the whole of the river basin, the NRC staff projected potential surface water demand in the St. Francisville reach of the Lower Mississippi River. Accordingly, total annual surface water withdrawals along the reach could increase from

4-79
372 mgd (575 cfs; 16.2 m3/s) to as much as 434 mgd (671 cfs; 18.9 m3/s) by the end of the period of extended operation in 2045, should RBS receive a renewed operating license. This total projected increase is equivalent to approximately 0.12 percent of the mean annual flow of the Lower Mississippi River through the St. Francisville reach. The NRC staff finds that this very small cumulative increase would be negligible compared to the range of flow conditions through the St. Francisville reach and would have no appreciable impact on instream uses or downstream water availability.
Water Quality Considerations
Water quality along the Mississippi River varies due to environmental changes along the river and within its basin, hydrologic modifications (e.g., locks, dams, levees), and point and nonpoint pollutant sources (Alexander 2012; National Research Council 2008). Because of the regulatory and infrastructure improvement mechanisms afforded under the Federal Water Pollution Control Act (i.e., Clean Water Act of 1972, as amended (CWA)) (33 U.S.C. 1251 et seq.) that focused on industrial wastewater and public sewage discharges, the water quality of the Mississippi River has improved dramatically over the last several decades. Nonpoint source pollution remains a problem, however, and the potential for continued increases in agricultural production in the Midwest region of the United States is likely to increase sediment- and nutrient-laden runoff to the Mississippi River (National Research Council 2008).
As discussed in Section 3.5.1.3 of this SEIS, the St. Francisville reach of the Lower Mississippi River supports its designated water uses for secondary contact recreation, fish and wildlife propagation, and drinking water supply. However, the river segment encompassing the St. Francisville reach is impaired for primary contact recreation due to fecal coliform bacteria.
Wastewater discharges from existing and new and modified industrial manufacturing, power generation, wastewater treatment, and large commercial facilities would be subject to regulation under the Federal Clean Water Act. Across a particular watershed, Section 303(d) of the Federal Clean Water Act requires states to identify all “impaired” waters for which effluent limitations and pollution control activities are not sufficient to attain water quality standards and to establish total maximum daily loads (TMDLs) to ensure future compliance with water quality standards. On an individual facility basis, State-administered National Pollutant Discharge Elimination System (LPDES in Louisiana) permits issued under Section 402 of the Clean Water Act set limits on wastewater, stormwater, and other point source discharges to surface waters, including runoff from construction sites. Closed-cycle cooling water, industrial effluents, and stormwater discharged from the RBS site are subject to effluent limitations and monitoring imposed under Entergy’s State-issued Louisiana Pollutant Discharge Elimination System permit for the site. RBS is only one of several large industrial facilities that contribute effluents to the St. Francisville reach of the Lower Mississippi River.
Future development projects can result in water quality degradation if those projects increase sediment loading and the discharge of other pollutants to nearby surface water bodies. The magnitude of cumulative impacts would depend on the nature and location of the actions relative to surface water bodies; the number of actions (e.g., facilities or projects); and whether facilities comply with regulating agency requirements (e.g., land use restrictions, habitat avoidance and restoration requirements, stormwater management, and wastewater discharge limits).
Furthermore, Section 404 of the Clean Water Act governs the discharge of dredge and fill materials to navigable waters, including wetlands, primarily through permits issued by the

4-80
U.S. Army Corps of Engineers. The U.S. Army Corps of Engineers also regulates construction affecting navigable waterways, such as for flood control, under Section 10 of the Rivers and Harbors Act of 1899 (33 U.S.C. 403 et seq.).
Consequently, a substantial regulatory framework exists to address current and potential future sources of water quality degradation within the mainstem of the Lower Mississippi River with respect to potential cumulative impacts on surface water quality.
Climate Change and Related Considerations
The NRC staff also considered the best available information regarding the potential impacts of climate change at a regional and local scale, including the U.S. Global Change Research Program’s (USGCRP’s) most recent compilations of the state of knowledge relative to global climate change effects (USGCRP 2014, 2017).
Climate change can impact surface water resources as a result of changes in temperature and precipitation. Given the size of the Mississippi River Basin, contributions to river flow and downstream discharge are affected by precipitation changes beyond the Southeast region.
Runoff and streamflow have increased in the Mississippi River Basin over time (USGCRP 2014). However, increased evapotranspiration, as a result of higher temperatures in the future, could reduce the volume of water available for surface runoff and streamflow. Changes in runoff in a watershed along with reduced stream flows and higher air temperatures all contribute to an increase in the ambient temperature of receiving waters. For instance, when considering the effects of climate change (increasing temperatures and evapotranspiration), total water demand for Louisiana is projected to increase by an additional 10 to 15 percent by 2060 (USGCRP 2014). Meanwhile, an increase in heavy precipitation events has been observed, and is expected to persist, for the Southeast. Such a trend toward heavy precipitation increases the rate of runoff from the land surface and the transport of pollutants to surface waters such as the Lower Mississippi River.
Elevated surface water temperature, along with degraded surface water quality, also can decrease the cooling efficiency of thermoelectric power generating facilities and plant capacity. As intake water temperatures warm, cooling water makeup requirements increase (USCRP 2014). Degraded surface water quality also increases the costs of water treatment for both industrial cooling water and potable water. Power plants, other industrial interests, and public water supply facilities would have to account for any changes in water temperature and quality in operational practices and procedures, and perhaps would be required to invest in additional infrastructure and capacity.
In summary, no substantial adverse changes in surface water availability or ambient water quality are expected during the license renewal term. The NRC staff expects that the existing regulatory framework will be sufficient to effectively manage effluent discharges and stormwater runoff from existing and proposed facilities. Surface water withdrawals from the St. Francisville reach of the Lower Mississippi River would be unlikely to result in any water use conflicts during the RBS license renewal term. Climate change could result in minor incremental changes in the hydrology and ambient water quality of the Lower Mississippi River.

4-81
4.16.2.2 Groundwater Resources
The regional groundwater and surface water systems, including West Feliciana Parish, the Mississippi River and the groundwater discharge area at Baton Rouge, LA are described in Section 3.5.
In 2014, groundwater withdrawals in West Feliciana Parish were reported as 5.71 million gpd (21.6 million L/d). Of that volume, 74 percent or 4.22 million gpd (16 million L/d) was for public water supply (drinking water) use (USGS 2017h). Although the Mississippi River Alluvial Aquifer constitutes a large fresh groundwater resource in Louisiana, State well-registration records listed only 10 wells screened in the aquifer in West Feliciana Parish in 2009. For the same year, State well-registration records listed 64 active water wells screened in the Upland Terrace Aquifer, 128 active water wells screened in the Evangeline equivalent aquifer system, and 46 active water wells screened in the Jasper equivalent aquifer system (USGS 2014b). This is a very small portion of the total volume of groundwater consumed annually in West Feliciana Parish (USGS 2017h).
Beneath RBS, groundwater in the Evangeline and Jasper equivalent aquifers flows south or southwest towards water wells in the Baton Rouge area. Withdrawal of groundwater from wells in the Baton Rouge area is large enough that it is lowering water levels in the Evangeline and Jasper equivalent aquifers over a large area of West and East Feliciana Parish. (Entergy 2008b, 2017h, USGS 2004, 2014b, 2015, 2017k, 2017h).
Regionally, the largest groundwater declines are in the area of Baton Rouge. For example, in Baton Rouge, water level declines as much as 365 ft (111 m) have been experienced in the “2,000-foot” sand of the Jasper equivalent aquifer system. Another side effect of this decline is that groundwater withdrawal in the Baton Rouge area has caused saltwater to move northward across the Baton Rouge Fault and threaten some of the groundwater resources in the Baton Rouge area (USGS 2013) (Figure 4-1).
From 1960–2012, water level declines in the sand aquifers of the Evangeline and Jasper equivalent aquifer systems have been greater in the southern areas of West Feliciana Parish than in the northern areas of the parish. In the northern part of the parish, from 1960 to 2017 groundwater level declines of approximately 28 ft (8.5 m) in the 2,400-foot” sand have been recorded (USGS 2017e). In contrast, in an area in the southern part of the parish, between 1960 and 2017, water levels in“2,400-foot” sand declined by 75 ft (23 m) (USGS 2014b).
RBS is located between these two areas. As previously discussed in Section 3.5.2.3, 83 percent of the groundwater consumed at RBS is produced from two wells completed in the “2,800-foot” sand of the Jasper equivalent aquifer system. From 1985 to 2005, these two wells experienced a water level decline of approximately 25 to 30 ft (7.6 to 9.1 m) (Figure 4-2).
The “2,800-foot” sand of the Jasper equivalent aquifer system is also a major source of industrial and public water in the Baton Rouge area (Nashreen 2003, USGS 2013, 2015). While withdrawal of groundwater from the Evangeline and Jasper equivalent aquifer systems at RBS must have contributed to the decline in water levels in these two wells, like the other sands in the Evangeline and Jasper equivalent aquifer systems in West Feliciana Parish, much of this decline is likely in response to regional pumping (Entergy 2008b).
Climate change over the period of license renewal may result in increased precipitation. This could increase the volume of water recharging aquifers in the region (EPA 2016b). However,

4-82
the rate of regional groundwater consumption is likely to remain the dominant force influencing regional groundwater availability.
As described in Section 4.5.1.2, over the period of license operations, RBS’s consumption of Mississippi River water should have no discernible impact on the availability of groundwater supplies. Further, the NRC staff does not expect RBS activities to impact the quality of groundwater in any regional aquifers or indirectly impact regional surface water bodies via existing onsite groundwater contamination.
In summary, there is no significant cumulative effect from the proposed action on regional groundwater resources, and there is no significant cumulative impact on regional surface water resources from onsite groundwater contamination.

4-83
Source: Modified from Entergy 2008b
Figure 4-1. Salt Water Intrusion into Aquifers Beneath Baton Rouge, LA

4-84
Source: Modified from Entergy 2008b
Figure 4-2. Groundwater Level Drop in "2,800-Foot" Sand Aquifer Beneath River Bend Station
4-85
4.16.3 Aquatic Resources
Section 4.7 finds that the direct and indirect impacts on aquatic resources from the proposed license renewal would be SMALL for all aquatic ecology issues. The geographic area that the NRC staff considered in the cumulative aquatic resources analysis includes the vicinity of the intake and discharge structures on the Mississippi River affected by RBS water withdrawal and discharge. The baseline, or benchmark, for assessing cumulative impacts on aquatic resources takes into account the preoperational environment as recommended by EPA (1999a) for its review of National Environmental Policy Act documents.
Section 3.7 presents an overview of the current condition of the Mississippi River and the history and factors that led to current conditions. In summary, the direct and indirect impacts from human modifications in the Mississippi River has drastically changed available habitats and the biological communities that can inhabit and spawn within the river. Since the 1700s, efforts to control flooding and increase navigation along the Mississippi River have deepened the main channel and decreased the availability of high-quality shallow water habitats associated with floodplains, backwaters, and oxbow lakes. In addition to physical changes to aquatic habitat, land use changes within the Mississippi River basin have introduced new industrial and chemical inputs into the river and resulted in degraded water quality conditions (Brown et al. 2005).
Many natural and human activities can influence the current and future aquatic life in the area surrounding RBS. Potential biological stressors include operational impacts from RBS (as described in Section 4.7); modifications to the Mississippi River; runoff from industrial, agricultural, and urban areas; other water users and dischargers; and climate change.
4.16.3.1 Modifications to the Mississippi River
The relative abundance of hard substrate, deep channel, and river bank habitat has been largely influenced by human activities intended to decrease flooding events and increase navigability. The U.S. Army Corps of Engineers and the Mississippi River Commission continue to oversee a comprehensive river management program that includes:
• levees for containing flood flows • floodways for the passage of excess flows past critical reaches of the Mississippi
River • channel improvement and stabilization to provide an efficient and reliable navigation
channel, increase the flood-carrying capacity of the river, and protect the levee system
• tributary basin improvements for major drainage basins to include dams and reservoirs, pumping plants, auxiliary channels, and pumping stations (MRC 2016)
Implementing this management program will continue to affect the relative availability of aquatic habitats, resulting in, for example, a decrease in the amount of soft sediment river bank habitat and an increase in the amount of hard substrates (e.g., riprap or other materials used to line the river bank). Consequently, invertebrates that depend on a hard surface for attachment and can colonize human-made materials, such as tires, concrete, or riprap used to line river banks, likely will continue to increase in relative abundance as compared to species that require soft sediments along the river bank.

4-86
The Mississippi River Commission also implements various programs to support the sustainability of aquatic life within the Mississippi River. For example, the Davis Pond and Caernarvon freshwater diversion structures divert more than 18,000 ft3/s (510 m3/s) of fresh water to coastal marshlands. The input of freshwater helps to preserve the marsh habitat and reduce coastal land loss (MRC 2016). In addition, the Mississippi River Commission conducted research and determined that using grooved articulated concrete mattresses to line river banks can help support benthic invertebrate and fish populations. For example, such concrete mattresses increases larval insect production, which is an important source of prey for many fish (MRC 2016).
4.16.3.2 Runoff from Industrial, Agricultural, and Urban Areas
Nearly 40 percent of the land within the contiguous United States drains into the Mississippi River. Land use changes and industrial activities within this area have had a substantial impact on aquatic habitat and water quality within the Mississippi River. For example, the Mississippi River historically experienced decreased water quality as a result of industrial discharges, agricultural runoff, municipal sewage discharges, surface runoff from mining activity, and surface runoff from municipalities. However, over the past few decades, water quality within the Mississippi River has improved because of the implementation of the Clean Water Act and other environmental regulations (Caffey et al. 2002). For example, most of the older, first-generation chlorinated insecticides have been banned since the late 1970s. Similarly, the addition and upgrading of numerous municipal sewage treatment facilities, rural septic systems, and animal waste management systems have helped to significantly decrease the concentration of median fecal coliform bacteria in the Mississippi River (Caffey et al. 2002). Despite the trend of improving water quality within the Mississippi River, trace levels of some contaminants and increased nutrients from agricultural lands remain a source of concern for aquatic life (Caffey et al. 2002; Rabalais et al. 2009).
4.16.3.3 Water Users and Discharges
Several other facilities withdraw and discharge water from and to the Lower Mississippi River (e.g., see Table E-1). These facilities also may entrain and impinge aquatic organisms and add to the cumulative thermal stress to aquatic populations that inhabit waters near RBS.
One method for estimating the cumulative entrainment rate is to calculate the percent of flow that is withdrawn by all the facilities in the region (EPA 2002a, NRC 2013b). This method assumes that planktonic organisms are equally distributed throughout the waterbody, and therefore, the percent of water withdrawn is the same as the percent of planktonic organisms entrained. Table 4-9 estimates the cumulative surface water withdrawals from the Lower Mississippi River in the St. Francisville Reach in 2014. As described in Section 4.16.3, the NRC staff determined that the total surface water withdrawals from the St. Francisville reach were equivalent to approximately 0.11 percent of the mean annual flow of the river. Based on the assumption that eggs and larvae are evenly distributed, facilities in the St. Francisville Reach would entrain less than 0.5 percent of the free flowing eggs and larvae. Furthermore, most species in the portion of the Lower Mississippi River spawn in the spring, when flows are high and a smaller fraction of the river water would be withdrawn. Therefore, the impacts would likely be negligible.
Several engineered design factors and operational controls also suggest that the cumulative impacts from other water users and discharges would be minimal. For example, the location of the intake system is a design factor that can affect impingement and entrainment because

4-87
locating intake systems in areas with high biological productivity or sensitive biota can negatively affect aquatic life (EPA 2004). The location of the intake structure at RBS and several other facilities within the Lower Mississippi River is within deep, fast-flowing water, which suggests that the area immediately surrounding the intakes does not provide suitable habitat for fish eggs and larvae (Baker et al. 1991; ENSR 2007; LDEQ 2010; Entergy 2017h).
In association with Entergy’s application to build an additional unit at RBS, Entergy (2008a) evaluated the potential cumulative thermal impacts for RBS Unit 1, the proposed RBS Unit 3, and the Big Cajun plant (a coal-fired plant in New Roads, LA). Entergy (2008a) estimated the thermal plume at both RBS and Big Cajun and determined that the plumes would not come into contact with one another, thereby leaving a sufficient zone of passage for biota to avoid the thermal plume.
Climate patterns (e.g., increased droughts and saltwater intrusion) and increased water demands upstream of RBS also may increase the number of water users and rate of withdrawal from the Mississippi River (Caffey et al. 2002). Aquatic life, especially threatened and endangered species, rely on sufficient flow within streams and rivers to survive. As described in Section 4.12.3.1, continued regulation of the flow by the U.S. Army Corps of Engineers is expected to preserve the course and flow of the Mississippi River. Additionally, Entergy and other water dischargers would be required to comply with Louisiana Pollutant Discharge Elimination System permits that must be renewed every 5 years, allowing the Louisiana Department of Environmental Quality to ensure that the permit limits provide the appropriate level of environmental protection.
4.16.3.4 Climate Change
The potential effects of climate change, including increased temperatures and heavy downpours, could result in degradation to aquatic resources in the Lower Mississippi River. Increased temperature and thermal stress to aquatic biota could increase the frequency of shellfish-borne illness, alter the distribution of native fish, increase the local loss of rare species, and increase the displacement of native species by non-native species (USGCRP 2009, 2014, 2017).
More rainfall and heavy downpours can increase the rate of runoff and pollutants reaching the Mississippi River because the pollutants washed away in the high volume of runoff have less time to absorb into the soil before reaching the river. Over the past 50 years, as a result of climate change and land use changes, the Mississippi River Basin is yielding an additional 32 million acre-feet (4 million hectare meters) of nitrogen load, which is being discharged into the Gulf of Mexico. Future increases in runoff would further increase the sediment load within the Mississippi River and concurrently limit photosynthesis and growth of primary producers that provide an important food source for fish and other aquatic organisms.
The cumulative effects of increased temperatures, altered river flows, and increased sediment loading could exacerbate existing environmental stressors, such as high nutrient levels and low dissolved oxygen, both of which are associated with eutrophication (when excess nutrient levels in water lead to overgrowth of plants and algae, which may lead to oxygen depletion of the water). A decline in oxygen is especially likely within shallow aquatic habitats that provide high-quality habitat for spawning, foraging, and resting. Low oxygen also may lead to fish, shellfish, eggs, and larvae mortality.

4-88
4.16.3.5 Protected Habitats
Several wildlife management areas, parks, and recreation sites lie within the vicinity of RBS (see Table E-1). The continued preservation of these areas will protect aquatic habitats, and these areas will become ecologically more important in the future because they will provide large areas of protected aquatic habitats as other stressors increase in magnitude and intensity.
4.16.3.6 Conclusion
The direct and indirect impacts to aquatic resources from historical Mississippi River modifications, and pollutants and sediments introduced into the river, have had a substantial effect on aquatic life and their habitat. The incremental impacts from RBS would have minimal impacts on aquatic resources. The cumulative stress from the activities described above, spread across the geographic area of interest, depends on many factors that the NRC staff cannot quantify. This stress may alter some aquatic resources. For example, climate change may increase the temperature of the Mississippi River and the rate of runoff into the river. This may alter the habitat for species most sensitive to nutrient loading, high levels of contaminants, and higher temperatures.
4.16.4 Historic and Cultural Resources
As described in Section 4.9 of this SEIS, historic properties (36 CFR 800.5(b), “Finding No Adverse Effect”) at RBS are not likely to be adversely affected by license renewal-related activities because no ground-disturbing activities or physical changes would occur beyond ongoing maintenance activities during the license renewal term. As discussed in Section 4.9, Entergy has site procedures and work instructions to ensure that plant personnel consider cultural resources on RBS lands during planned maintenance activities.
The geographic area considered in this analysis is the area of potential effect associated with the proposed undertaking, as described in Section 3.9. The archaeological record for the region indicates prehistoric and historic occupation of the RBS and its immediate vicinity. The construction of RBS resulted in the destruction and loss of cultural resources within portions of the industrial site area. However, historic or cultural resources can still be found within certain portions of the RBS site. Present and reasonably foreseeable projects that could affect these resources, in addition to the effects of ongoing maintenance and operational activities during the license renewal term, are summarized in Appendix E. Direct impacts would occur if historic and cultural resources in the area of potential effect were physically removed or disturbed during maintenance activities. It is unlikely that the projects discussed in Appendix E would impact historic and cultural resources on the RBS site because those resources are not in areas which would be subject to foreseeable future development during the license renewal term.
Therefore, the NRC staff concludes that the contributory effects of continued reactor operations and maintenance at RBS, when combined with other past, present, and reasonably foreseeable future activities, would have no new or increased impact on cultural resources within the area of potential effect beyond what already has been experienced.
4.16.5 Socioeconomics
This section addresses socioeconomic factors that have the potential to be directly or indirectly affected by changes in operations at RBS in addition to the aggregate effects of other past, present, and reasonably foreseeable future actions. As discussed in Section 4.10, continued

4-89
operation of RBS during the license renewal term would have no impact on socioeconomic conditions in the region beyond what is already being experienced.
The primary geographic area of interest considered in this cumulative analysis is East Baton Rouge and West Feliciana parishes, where approximately 70 percent of RBS employees reside (see Table 3-13). This is where the economy, tax base, and infrastructure would most likely be affected because the majority of RBS workers and their families reside, spend their incomes, and use their benefits within these two parishes.
Because Entergy has no plans to hire additional workers during the license renewal term, overall expenditures and employment levels at RBS would remain relatively unchanged with no new or increased demand for housing and public services. Based on this and other information presented in Chapter 4, the NRC staff concludes there would be no contributory effect on socioeconomic conditions in the region during the license renewal term from the continued operation of RBS beyond what is currently being experienced. Therefore, the only contributory effects would come from reasonably foreseeable future planned activities at RBS, unrelated to the proposed action (license renewal), and other reasonably foreseeable planned offsite activities, such as residential development in East Baton Rouge and West Feliciana parishes. The availability of new housing could attract individuals and families from outside the region, thus increasing the local population and causing increased traffic on local roads and increased demand for public services.
Entergy has no reasonably foreseeable future planned activities at RBS beyond continued reactor operations and maintenance. When combined with other past, present, and reasonably foreseeable future activities, the NRC staff concludes that the contributory effects of continuing reactor operations and maintenance at RBS would have no new or increased socioeconomic impact in the region beyond what is currently being experienced.
4.16.6 Human Health
The NRC and EPA established radiological dose limits to protect the public and workers from both acute and long term exposure to radiation and radioactive materials. These dose limits are codified in 10 CFR Part 20, “Standards for Protection Against Radiation,” and 40 CFR Part 190, “Environmental Radiation Protection Standards for Nuclear Power Operations.” As discussed in Section 4.11, the NRC staff concluded that impacts to human health from continued plant operations are SMALL. For the purposes of this analysis, the geographical area considered is the area included within an 80 km (50 mi) radius of the RBS plant site. There are no other nuclear power plants within the 80 km (50 mi) radius of RBS, but that radius does overlap with the 80 km (50 mi) radius of Waterford Steam Electric Station, Unit 3, which is approximately 121 km (75 mi) southeast. As discussed in Section 3.1.4.4, in addition to storing its spent nuclear fuel in a storage pool, RBS stores some of its spent nuclear fuel in an onsite independent spent fuel storage installation (ISFSI).
EPA regulations in 40 CFR Part 190 limit the dose to members of the public from all sources in the nuclear fuel cycle, including nuclear power plants, fuel fabrication facilities, waste disposal facilities, and transportation of fuel and waste. As discussed in Section 3.1.4.5, RBS has a radiological environmental monitoring program (REMP) that measures radiation and radioactive materials in the environment from RBS, its ISFSI, and all other sources. The NRC staff reviewed the radiological environmental monitoring results for the 5 year period from 2012 to 2016 as part of the cumulative impacts assessment. The NRC staff’s review of Entergy’s data

4-90
showed no indication of an adverse trend in radioactivity levels in the environment from RBS or its ISFSI. The data showed that there was no measurable significant impact to the environment from operations at RBS.
In summary, the NRC staff concludes that there is no significant cumulative effect from the proposed action of license renewal on human health. The staff based this conclusion on NRC staff’s review of radiological environmental monitoring program data, radioactive effluent release data, and worker dose data; the staff’s expectation that RBS will continue to comply with Federal radiation protection standards during the period of extended operation; and the continued regulation of any future development or actions in the vicinity of the RBS site by the NRC and the State of Louisiana.
4.16.7 Environmental Justice
The environmental justice cumulative impact analysis evaluates the potential for disproportionately high and adverse human health and environmental effects on minority and low-income populations that could result from past, present, and reasonably foreseeable future actions, including the continued operational effects of RBS during the renewal term. As discussed in Section 4.12 of this SEIS, there would be no disproportionately high and adverse impacts on minority and low-income populations from the continued operation of RBS during the license renewal term.
Everyone living near RBS, including minority and low-income populations, currently experiences its operational effects. The NRC addresses environmental justice matters for license renewal by identifying the location of minority and low-income populations, determining whether there would be any potential human health or environmental effects to these populations, and determining whether any of the effects may be disproportionately high and adverse.
Adverse health effects are measured in terms of the risk and rate of fatal or nonfatal adverse impacts on human health. Disproportionately high and adverse human health effects occur when the risk or rate of exposure to an environmental hazard for a minority or low-income population is significant and exceeds the risk or exposure rate for the general population or for another appropriate comparison group. Disproportionately high environmental effects refer to impacts or risks of impacts in the natural or physical environment in a minority or low-income community that are significant and appreciably exceed the environmental impact on the larger community. Such effects may include biological, cultural, economic, or social impacts. Some of these potential effects have been identified in resource areas presented in preceding sections of this chapter of the SEIS. As previously discussed in this chapter, with the exception of radionuclides to groundwater, the impact from license renewal for all other resource areas (e.g., land, air, water, and human health) would be SMALL.
As discussed in Section 4.12 of this SEIS, there would be no disproportionately high and adverse impacts on minority and low-income populations from the continued operation of RBS during the license renewal term. Because Entergy has no plans to hire additional workers during the license renewal term, employment levels at RBS would remain relatively constant, and there would be no additional demand for housing or increase in traffic. Based on this information and the analysis of human health and environmental impacts presented in the preceding sections, it is not likely there would be any disproportionately high and adverse contributory effect on minority and low-income populations from the continued operation of RBS during the license renewal term. Therefore, the NRC staff concludes that the only contributory

4-91
effects would come from the other reasonably foreseeable future planned activities at RBS, unrelated to the proposed action (license renewal), and other reasonably foreseeable planned offsite activities.
Entergy has no reasonably foreseeable future planned activities at RBS beyond continued reactor operations and maintenance. When combined with other past, present, and reasonably foreseeable future activities, the NRC staff concludes that the contributory effects of continuing reactor operations and maintenance at RBS would not likely cause disproportionately high and adverse human health and environmental effects on minority and low-income populations residing in the vicinity of RBS beyond what those populations have already experienced.
4.16.8 Waste Management and Pollution Prevention
This section describes waste management impacts during the license renewal term when added to the aggregate effects of other past, present, and reasonably foreseeable future actions. For the purpose of this cumulative impacts analysis, the NRC staff considered the area within a 50 mi (80 km) radius of RBS. In Section 4.11, the NRC staff concluded that the potential human health impacts from RBS’s waste during the license renewal term would be SMALL.
As discussed in Sections 3.1.4 and 3.1.5, Entergy maintains waste management programs for radioactive and nonradioactive waste generated at RBS and is required to comply with Federal and State permits and other regulatory waste management requirements. The nuclear power plants and other facilities within a 50 mi (80 km) radius of RBS are also required to comply with appropriate NRC, EPA, and State requirements for the management of radioactive and nonradioactive waste. Current waste management activities at RBS would likely remain unchanged during the license renewal term, and continued compliance with Federal and State requirements for radioactive and nonradioactive waste is expected.
In summary, the NRC staff concludes that there is no significant cumulative effect from the proposed action of license renewal from radioactive and nonradioactive waste. This is based on RBS’s expected continued compliance with Federal and State of Louisiana requirements for radioactive and nonradioactive waste management and the expected regulatory compliance of other waste producers in the area.
4.16.9 Global Greenhouse Gas Emissions
The cumulative impact of a greenhouse gas emission source on climate is global. Greenhouse gas emissions are transported by wind and become well mixed in the atmosphere as a result of their long atmospheric residence time. Therefore, the extent and nature of climate change is not specific to where greenhouse gases are emitted. Due to the global significance of greenhouse gas emissions, a global climate change cumulative impacts analysis inherently considers the entire Earth’s atmosphere and therefore global emissions (as opposed to county, State, or national emissions). As discussed in Section 4.15.3.2, climate change and climate-related environmental changes have been observed on a global level, and climate models indicate that future climate change will depend on present and future global greenhouse gas emissions. Climate models indicate that short-term climate change (through the year 2030) is dependent on past greenhouse gas emissions. Therefore, climate change is projected to occur with or without present and future greenhouse gas emissions from RBS. With continued increases in global greenhouse gas emission rates, climate models project that Earth’s average surface temperature will continue to increase and climate-related changes will persist.

4-92
In April 2017, EPA published, “Inventory of U.S. Greenhouse Gas Emissions and Sinks: 1990–2015” (Greenhouse Gas Inventory). As the official U.S. inventory of greenhouse gas emissions this EPA report identifies and quantifies the primary anthropogenic sources and sinks of greenhouse gases. The EPA Greenhouse Gas Inventory is an essential tool for addressing climate change and participating with the United Nations Framework Convention on Climate Change to compare the relative global contribution of different emission sources and greenhouse gases to climate change. In 2015, the United States emitted 6,586.7 million metric tons (MMT) of carbon dioxide equivalents (CO2eq) and from 1990 to 2015, emissions increased by 3.5 percent (EPA 2017c). In 2015 and 2016, the total amount of CO2eq emissions related to electricity generation was 2,058 MMT and 1,920 MMT, respectively. The Energy Information Administration (EIA) reported that, in 2014, the electric power sector alone in Louisiana was responsible for 39.3 MMT of carbon dioxide (CO2eq) (EIA 2017a). Facilities that emit 25,000 MT CO2eq or more per year are required to annually report their greenhouse gas emissions to EPA. These facilities are known as direct emitters, and the data are publicly available in EPA’s facility-level information on greenhouse gases tool (FLIGHT). In 2015, FLIGHT-identified facilities in Louisiana emitted a total of 138 MMT of CO2eq and facilities in West Feliciana emitted a total of 0.12 MMT of CO2eq (EPA 2017c).
Appendix E provides a list of current and reasonably foreseeable future projects and actions that could contribute to greenhouse gas emissions. Permitting and licensing requirements and other mitigative measures can minimize the impacts of greenhouse gas emissions. For instance, in 2012, EPA issued a final Greenhouse Gas Tailoring Rule (77 FR 41051) to address greenhouse gas emissions from stationary sources under the Clean Air Act permitting requirements. The Greenhouse Gas Tailoring Rule establishes when an emission source will be subject to permitting requirements and control technology to reduce greenhouse gas emissions.
EPA’s Greenhouse Gas Inventory illustrates the diversity of greenhouse gas sources, such as electricity generation (including fossil fuel combustion and incineration of waste), industrial processes, and agriculture. As presented in Section 4.15.3, annual direct greenhouse gas emissions from combustion sources resulting from ancillary operations at RBS range from 3,260 to 3,720 MT of CO2eq. In comparing RBS’s greenhouse gas emission to total U.S. greenhouse gas emissions, emissions from electricity production in Louisiana, or emissions on a parish level, greenhouse gas emissions from RBS are relatively minor. When compared to global emissions, RBS greenhouse gas emission are negligible (see Table 4-10). Furthermore, as presented in Table 4-8, the coal, natural gas, and combination alternatives’ annual greenhouse gas emissions are higher by several orders of magnitude than those from the continued operation of RBS. Therefore, if RBS’s generating capacity were to be replaced by other non-nuclear power generating alternatives assessed in this SEIS, there would be an increase in greenhouse gas emissions. Consequently, the NRC staff concludes that the continued operation of RBS (the proposed action) would result in greenhouse gas emissions avoidance and would have a net, beneficial contribution to greenhouse gas emissions and climate change impacts during the license renewal term compared to alternative baseload replacement power generation sources assessed in this SEIS.

4-93
Table 4-10. Comparison of Greenhouse Gas Emission Inventories
Source CO2eq MMT/year Global Emissions (2015) (a) 33,000 U.S. Emissions (2015)(b) 6,587 Louisiana (2015)(c) 138 West Feliciana Parish, LA (2015)(c) 0.12 RBS(d) 3.4 x 10⁻³ (a) Carbon dioxide emissions obtained from GCP 2017 and converted to carbon dioxide equivalents.(b) Source: EPA 2017c(c) Greenhouse gas emissions account only for direct emitters, those facilities that emit 25,000 MT or more a year
(EPA 2017b).(d) Emissions rounded from Entergy 2017h and largest annual emission presented.
Source: GCP 2017, EPA 2017c, EPA 2017b, Entergy 2017h
4.17 Resource Commitments Associated with the Proposed Action
This section describes the NRC’s consideration of potentially unavoidable adverse environmental impacts that could result from implementation of the proposed action and alternatives; the relationship between short-term uses of the environment and the maintenance and enhancement of long-term productivity; and the irreversible and irretrievable commitments of resources.
4.17.1 Unavoidable Adverse Environmental Impacts
Unavoidable adverse environmental impacts are impacts that would occur after implementation of all workable mitigation measures. Carrying out any of the replacement energy alternatives considered in this SEIS, including the proposed action, would result in some unavoidable adverse environmental impacts.
Minor unavoidable adverse impacts on air quality would occur due to emission and release of various chemical and radiological constituents from power plant operations. Nonradiological emissions resulting from power plant operations are expected to comply with EPA emissions standards, although the alternative of operating a fossil-fueled power plant in some areas may worsen existing attainment issues. Chemical and radiological emissions would not exceed the national emission standards for hazardous air pollutants.
During nuclear power plant operations, workers and members of the public would face unavoidable exposure to minor levels of radiation as well as hazardous and toxic chemicals. Workers would be exposed to radiation and chemicals associated with routine plant operations and the handling of nuclear fuel and waste material. Workers would have higher levels of exposure than members of the public, but doses would be administratively controlled and would not exceed regulatory standards or administrative control limits. In comparison, the alternatives involving the construction and operation of a non-nuclear power generating facility would also result in unavoidable exposure to hazardous and toxic chemicals to workers and the public.
The generation of spent nuclear fuel and waste material, including low-level radioactive waste, hazardous waste, and nonhazardous waste, would be unavoidable. Hazardous and

4-94
nonhazardous wastes would be generated at non-nuclear power generating facilities. Wastes generated during plant operations would be collected, stored, and shipped for suitable treatment, recycling, or disposal in accordance with applicable Federal and State regulations. Due to the costs of handling these materials, NRC staff expects that power plant operators would optimize all waste management activities and operations in a way that generates the smallest possible amount of waste.
4.17.2 Relationship between Short-Term Use of the Environment and Long-Term Productivity
The operation of power generating facilities would result in short-term uses of the environment, as described in Chapter 4. Short term is the period of time that continued power generating activities take place.
Power plant operations require short-term use of the environment and commitment of resources (e.g., land and energy), indefinitely or permanently. Certain short-term resource commitments are substantially greater under most energy alternatives, including license renewal, than under the no-action alternative because of the continued generation of electrical power and the continued use of generating sites and associated infrastructure. During operations, all energy alternatives entail similar relationships between local short-term uses of the environment and the maintenance and enhancement of long-term productivity.
Air emissions from nuclear power plant operations introduce small amounts of radiological and nonradiological emissions to the region around the plant site. Over time, these emissions would result in increased concentrations and exposure, but the NRC staff does not expect that these emissions would impact air quality or radiation exposure to the extent that they would impair public health and long-term productivity of the environment.
Continued employment, expenditures, and tax revenues generated during power plant operations directly benefit local, regional, and State economies over the short term. Local governments investing project-generated tax revenues into infrastructure and other required services could enhance economic productivity over the long term.
The management and disposal of spent nuclear fuel, low-level radioactive waste, hazardous waste, and nonhazardous waste requires an increase in energy and consumes space at treatment, storage, or disposal facilities. Regardless of the location, the use of land to meet waste disposal needs would reduce the long-term productivity of the land.
Power plant facilities are committed to electricity production over the short term. After decommissioning these facilities and restoring the area, the land could be available for other future productive uses.
4.17.3 Irreversible and Irretrievable Commitment of Resources
Resource commitments are irreversible when primary or secondary impacts limit the future options for a resource. For example, the consumption or loss of nonrenewable resources are irreversible. An irretrievable commitment refers to the use or consumption of resources for a period of time (e.g., for the duration of the action under consideration) that are neither renewable nor recoverable for future use. Irreversible and irretrievable commitments of resources for electrical power generation include the commitment of land, water, energy, raw

4-95
materials, and other natural and man-made resources required for power plant operations. In general, the commitments of capital, energy, labor, and material resources are also irreversible.
The implementation of any of the replacement energy alternatives considered in this SEIS would entail the irreversible and irretrievable commitments of energy, water, chemicals, and—in some cases—fossil fuels. These resources would be committed during the license renewal term and over the entire life cycle of the power plant, and they would be unrecoverable.
Energy expended would be in the form of fuel for equipment, vehicles, and power plant operations and electricity for equipment and facility operations. Electricity and fuel would be purchased from offsite commercial sources. Water would be obtained from existing water supply systems. These resources are readily available, and the NRC staff does not expect that the amounts required would deplete available supplies or exceed available system capacities.


5-1
5 CONCLUSION
This supplemental environmental impact statement (SEIS) contains the NRC staff’s environmental review of Entergy Louisiana, LLC and Entergy Operations, Inc.’s (collectively referred to as Entergy) application for a renewed operating license for River Bend Station, Unit 1 (RBS), as required by Title 10 of the Code of Federal Regulations (10 CFR) Part 51, “Environmental Protection Regulations for Domestic Licensing and Related Regulatory Functions.” The regulations in 10 CFR Part 51 implement the National Environmental Policy Act of 1969, as amended (42 U.S.C. 4321 et seq.). This chapter briefly summarizes the environmental impacts of license renewal, lists and compares the environmental impacts of alternatives to license renewal, and presents the NRC staff’s conclusions and recommendation.
5.1 Environmental Impacts of License Renewal
After reviewing the site-specific (Category 2) environmental issues in this SEIS, the NRC staff concluded that issuing a renewed license for RBS would have SMALL impacts for the Category 2 issues applicable to license renewal at RBS with one exception: for groundwater issues, the impact would be SMALL to MODERATE. The NRC staff considered mitigation measures for each Category 2 issue, as applicable. The NRC staff concluded that no additional mitigation measure is warranted.
5.2 Comparison of Alternatives
In Chapter 4 of this SEIS, the staff considered the following alternatives to issuing a renewed operating license to RBS:
• no-action alternative • new nuclear alternative • supercritical pulverized coal alternative • natural gas combined-cycle alternative • combination alternative of natural gas combined-cycle, biomass, and
demand-side management
Based on the review presented in this SEIS, the NRC staff concludes that the environmentally preferred alternative is the proposed action, recommending that a renewed RBS operating license be issued. As shown in Table 2-2, all other power-generation alternatives have impacts in at least two resource areas that are greater than license renewal, in addition to the environmental impacts inherent with new construction projects. To make up the lost power generation if the NRC does not issue a renewed license for RBS (i.e., the no-action alternative), energy decisionmakers would likely implement one of the four power replacement alternatives discussed in this chapter, or a comparable alternative capable of replacing the power generated by RBS.

5-2
5.3 Recommendation
The NRC staff’s recommendation is that the adverse environmental impacts of license renewal for RBS are not so great that preserving the option of license renewal for energy-planning decisionmakers would be unreasonable. This recommendation is based on the following:
• the analysis and findings in NUREG–1437, “Generic Environmental Impact Statement for License Renewal of Nuclear Plants”
• the environmental report submitted by Entergy • the NRC staff’s consultation with Federal, State, Tribal, and local agencies • the NRC staff’s independent environmental review • the NRC staff’s consideration of public comments

6-1
6 REFERENCES
10 CFR Part 20. Code of Federal Regulations, Title 10, Energy, Part 20, “Standards for Protection against Radiation.”
10 CFR Part 50. Code of Federal Regulations, Title 10, Energy, Part 50, “Domestic Licensing of Production and Utilization Facilities.”
10 CFR Part 51. Code of Federal Regulations, Title 10, Energy, Part 51, “Environmental Protection Regulations for Domestic Licensing and Related Regulatory Functions.”
10 CFR Part 54. Code of Federal Regulations, Title 10, Energy, Part 54, “Requirements for Renewal of Operating Licenses for Nuclear Power Plants.”
10 CFR Part 61. Code of Federal Regulations, Title 10, Energy, Part 61, “Licensing Requirements for Land Disposal of Radioactive Waste.”
10 CFR Part 71. Code of Federal Regulations, Title 10, Energy, Part 71, “Packaging and Transportation of Radioactive Material.”
10 CFR Part 72. Code of Federal Regulations, Title 10, Energy, Part 72, “Licensing Requirements for the Independent Storage of Spent Nuclear Fuel, High-Level Radioactive Waste, and Reactor-Related Greater than Class C Waste.”
10 CFR Part 100. Code of Federal Regulations, Title 10, Energy, Part 100, “Reactor Site Criteria.”
15 CFR Part 930. Code of Federal Regulations, Title 15, Commerce and Foreign Trade, Part 930, “Federal Consistency with Approved Coastal Management Programs.”
40 CFR Part 50. Code of Federal Regulations, Title 40, Protection of Environment, Part 50, “National Primary and Secondary Ambient Air Quality Standards.”
40 CFR Part 51. Code of Federal Regulations, Title 40, Protection of Environment, Part 51, “Requirements for Preparation, Adoption, and Submittal of Implementation Plans.”
40 CFR Part 81. Code of Federal Regulations, Title 40, Protection of Environment, Part 81, “Designation of Areas for Air Quality Planning Purposes.”
40 CFR Part 112. Code of Federal Regulations, Title 40, Protection of Environment, Part 112, “Oil Pollution Prevention.”
40 CFR Part 125. Code of Federal Regulations, Title 40, Protection of Environment, Part 125, “Criteria and Standards for the National Pollutant Discharge Elimination System.”
40 CFR Part 131. Code of Federal Regulations, Title 40, Protection of Environment, Part 131, “Water Quality Standards.”
40 CFR Part 190. Code of Federal Regulations, Title 40, Protection of Environment, Part 190, “Environmental Radiation Protection Standards for Nuclear Power Operations.”
49 CFR Parts 171–178. Code of Federal Regulations, Title 49, Transportation, “Subchapter C—Hazardous Materials Regulations” and “Specifications for Packagings.”
50 CFR Part 402. Code of Federal Regulations, Title 50, Wildlife and Fisheries, Part 402, “Interagency Cooperation—Endangered Species Act of 1973, as Amended.”

6-2
41 FR 41914. U.S. Fish and Wildlife Service. “Endangered and threatened wildlife and plants; determination of critical habitat for American crocodile, California condor, Indiana bat, and Florida manatee.” Federal Register 41(187):41914–41916. September 24, 1976.
42 FR 47840. U.S. Fish and Wildlife Service. “Endangered and threatened wildlife and plants; final rule; correction and augmentation of published rulemaking.” Federal Register 42(184):47840–47845. September 22, 1977.
55 FR 36641. U.S. Fish and Wildlife Service. “Endangered and threatened wildlife and plants; determination of endangered status for the Pallid Sturgeon. Federal Register 55(173):36641–36647. September 6, 1990.
56 FR 49653. U.S. Fish and Wildlife Service. “Endangered and threatened wildlife and plants; threatened status for the Gulf Sturgeon.” Federal Register 56(189):49653–49658. September 30, 1991.
59 FR 7629. Executive Order No. 12898. “Federal actions to address environmental justice in minority populations and low-income populations.” Federal Register 59(32):7629–7634. February 16, 1994.
61 FR 28467. U.S. Nuclear Regulatory Commission. “Environmental review for renewal of nuclear power plant operating licenses.” Final Rule. Federal Register 61 (109):28467–28497. June 5, 1996.
61 FR 66537. U.S. Nuclear Regulatory Commission. “Environmental review for renewal of nuclear power plant operating licenses.” Federal Register 61 (244):66537–66544. December 18, 1996.
65 FR 79825. U.S. Environmental Protection Agency. “Regulatory finding on the emissions of hazardous air pollutants from electric utility steam generating units.” Federal Register 65(245):79825–79831. December 20, 2000
68 FR 13370. U.S. Fish and Wildlife Service. “Endangered and threatened wildlife and plants; designation of critical habitat for the Gulf Sturgeon.” Final rule. Federal Register 68(189):13370–13495. March 19, 2003.
69 FR 52040. U.S. Nuclear Regulatory Commission. “Policy statement on the treatment of environmental justice matters in NRC regulatory and licensing actions.” Federal Register 69(163):52040–52048. August 24, 2004.
70 FR 39104. U.S. Environmental Protection Agency. “Regional haze regulations and guidelines for best available retrofit technology (BART) determinations.” Federal Register 70(128):39104–39172. July 6, 2005.
74 FR 56260. U.S. Environmental Protection Agency. “Mandatory reporting of greenhouse gases.” Federal Register 74(209):56260–56519. October 30, 2009.
74 FR 66496. U.S. Environmental Protection Agency. “Endangerment and cause or contribute findings for greenhouse gases under section 202(a) of the Clean Air Act.” Federal Register 74(239):66496–66546. December 15, 2009.
75 FR 31514. U.S. Environmental Protection Agency. “Prevention of significant deterioration and Title V greenhouse gas tailoring rule.” Federal Register 75(106):31514–31608. June 3, 2010.
77 FR 41051. U.S. Environmental Protection Agency. “Prevention of significant deterioration and Title V greenhouse gas tailoring rule step 3 and GHG plantwide applicability limits.” Federal Register 77(134):41051–41075. July 12, 2012.

6-3
78 FR 37282. U.S. Nuclear Regulatory Commission. “Revisions to environmental review for renewal of nuclear power plant operating licenses.” Federal Register 78(119):37282–37324. June 20, 2013.
82 FR 16668. U.S. Fish and Wildlife Service. “Endangered and threatened wildlife and plants; Reclassification of the West Indian manatee from endangered to threatened.” Federal Register 82(64):16668–16704. April 5, 2017.
Adams S.R., Hoover J.J., Killgore K.J. 1999. Swimming endurance of juvenile pallid sturgeon, Scaphirhynchus albus. Copeia 3:802–807.
Alexander J.S., Wilson R.C., Green W.R. 2012. A brief History and Summary of the Effects of River Engineering and Dams on the Mississippi River System and Delta. Reston, VA: USGS. Circular 1375. Available at <http://pubs.usgs.gov/circ/1375/> (accessed October 3, 2017).
Atomic Energy Act of 1954, as amended. 42 U.S.C. § 2011 et seq.
Baker J.A., Killgore K.J., Kasul R.L. 1991. Aquatic habitats and fish communities in the lower Mississippi River. Reviews in Aquatic Science 3:313–356.
Bald and Golden Eagle Protection Act. 16 U.S.C. § 668 et seq.
Blevins D.W. 2011. Water-quality requirements, tolerances, and preferences of pallid sturgeon (Scaphirhynchus albus) in the Lower Missouri River. Reston, VA: U.S. Department of the Interior, U.S. Department of Geological Survey, and U.S. Army Corps of Engineers. USGS Scientific Investigations Report 2011–5186. 28 p. Available at <https://pubs.usgs.gov/sir/2011/5186/pdf/sir2011-5186.pdf> (accessed September 19, 2017).
[BLS] U.S. Bureau of Labor Statistics. 2017. “Local Area Unemployment Statistics.” Available at <http://www.bls.gov/data/> (accessed May 2017).
[BOEM] Bureau of Ocean Energy Management. Undated. “Ocean Wave Energy.” Available at <https://www.boem.gov/Renewable-Energy-Program/Renewable-Energy-Guide/Ocean-Wave-Energy.aspx> (accessed January 26, 2018).
Bolinger M., Seel J. 2016. Utility-Scale Solar 2015—An Empirical Analysis of Project Cost, Performance, and Pricing Trends in the United States. Berkeley, CA: Lawrence Berkeley National Laboratory. LBNL-1006037. August 2016. 55 p. Available at <https://emp.lbl.gov/sites/default/files/lbnl-1006037_report.pdf> (accessed January 3, 2018).
Brown A.V., Brown K.B., Jackson D.C., Pierson W.K. 2005. The lower Mississippi River and its tributaries. In: Benke A.C., Cushing C.E., eds. Rivers of North America. New York, Academic Press. 1168 p.
Clean Air Act of 1970. 42 U.S.C. § 7401 et seq.
Caffey R. H., Coreil P., Demcheck D. 2002. Mississippi River Water Quality: Implications for Coastal Restoration. Interpretive Topic Series on Coastal Wetland Restoration in Louisiana, Coastal Wetland Planning, Protection, and Restoration Act. National Sea Grant Library No. LSU-G-02-002. 4 p. Available at <https://lacoast.gov/new/Data/Reports/ITS/MRWQ.pdf>
[CDC] Centers for Disease Control and Prevention. 2004. “Surveillance for Waterborne-Disease Outbreaks Associated with Recreational Water—United States, 2001–2002.” Morbidity and Mortality Weekly Report Surveillance Summary 53(SS08):1–22. October 22, 2004. Available at <http://www.cdc.gov/mmwr/preview/mmwrhtml/ss5308a1.htm> (accessed December 18, 2017).

6-4
[CDC] Centers for Disease Control and Prevention. 2006. “Surveillance for Waterborne Disease and Outbreaks Associated with Recreational Water—United States, 2003–2004.” Morbidity and Mortality Weekly Report Surveillance Summary 55(SS12):1–24. December 22, 2006. Available at <http://www.cdc.gov/mmwr/preview/mmwrhtml/ss5512a1.htm> (accessed December 18, 2017).
[CDC] Centers for Disease Control and Prevention. 2008. “Surveillance for Waterborne Disease and Outbreaks Associated with Recreational Water Use and Other Aquatic Facility-Associated Health Events—United States, 2005–2006.” Morbidity and Mortality Weekly Report Surveillance Summary 57(SS09):1–29. September 12, 2008. Available at <http://www.cdc.gov/mmwr/preview/mmwrhtml/ss5709a1.htm> (accessed December 18, 2017).
[CDC] Centers for Disease Control and Prevention. 2011. “Surveillance for Waterborne Disease Outbreaks and Other Health Events Associated with Recreational Water—United States, 2007–2008.” Morbidity and Mortality Weekly Report Surveillance Summary 60(SS12):1–32. September 23, 2011. Available at <http://www.cdc.gov/mmwr/preview/mmwrhtml/ss6012a1.htm> (accessed December 18, 2017).
[CDC] Centers for Disease Control and Prevention. 2014a. “Pseudomonas aeruginosa in Healthcare Settings—HAI.” May 7, 2014. Available at <http://www.cdc.gov/hai/organisms/pseudomonas.html> (accessed December 18, 2017).
[CDC] Centers for Disease Control and Prevention. 2014b. “Recreational Water-Associated Disease Outbreaks—United States, 2009–2010.” Morbidity and Mortality Weekly Report 60(01):6–10. January 10, 2014. Available at <https://www.cdc.gov/mmwr/preview/mmwrhtml/mm6301a2.htm> (accessed December 18, 2017).
[CDC] Centers for Disease Control and Prevention. 2015a. “Outbreaks of Illness Associated with Recreational Water—United States, 2011–2012.” Morbidity and Mortality Weekly Report 64(24):668–672. June 26, 2015. Available at <https://www.cdc.gov/mmwr/preview/mmwrhtml/mm6424a4.htm> (accessed December 18, 2017).
[CDC] Centers for Disease Control and Prevention. 2015b. “Technical Information on Salmonella.” Updated March 9, 2015. Available at <http://www.cdc.gov/salmonella/general/technical.html> (accessed December 18, 2017).
[CDC] Centers for Disease Control and Prevention. 2017a. “Legionella: Home Page—Legionnaires’ Disease and Pontiac Fever.” November 8, 2017. Available at <http://www.cdc.gov/legionella/index.html> (accessed December 18, 2017).
[CDC] Centers for Disease Control and Prevention. 2017b. “Naegleria fowleri—Sources of Infection—Number of Case-reports of Primary Amebic Meningoencephalitis by State of Exposure: United States, 1962–2016.” February 28, 2017. Available at <http://www.cdc.gov/parasites/naegleria/state-map.html> (accessed December 18, 2017).
[CDC] Centers for Disease Control and Prevention. 2017c. “Naegleria fowleri—Pathogen and Environment.” February 28, 2017. Available at <http://www.cdc.gov/parasites/naegleria/pathogen.html> (accessed December 18, 2017).
[CDC] Centers for Disease Control and Prevention. 2017d. “Reports of Salmonella Outbreak Investigations from 2017.” Updated September 15, 2017. Available at <https://www.cdc.gov/salmonella/outbreaks-2017.html> (Accessed December 18, 2017).

6-5
[CDC] Centers for Disease Control and Prevention. 2017e. “Shigella – Shigellosis.” July 25, 2017. Available at <http://www.cdc.gov/shigella/index.html> (accessed December 18, 2017).
[CEQ] Council on Environmental Quality. 1997. Considering Cumulative Effects under the National Environmental Policy Act. Washington, DC. CEQ. January 1997. 122 p. Available at <https://www.energy.gov/sites/prod/files/nepapub/nepa_documents/RedDont/G-CEQ-ConsidCumulEffects.pdf> (accessed September 12, 2017).
[CEQ] Council on Environmental Quality. 1997. Environmental Justice: Guidance under the National Environmental Policy Act. Washington, DC. CEQ. December 10, 1997. 40 p. Available online at <https://www.epa.gov/sites/production/files/2015-02/documents/ej_guidance_nepa_ceq1297.pdf>
[CHC] Center for Hearing and Communication. Undated. “Common environmental noise levels.” Available at <http://chchearing.org/noise/common-environmental-noise-levels/> (accessed October 20, 2017).
Chen I.C., Hill J.K., Ohlemuller R., Roy D.B., Thomas C.D. 2011. Rapid range shifts of species associated with high levels of climate warming. Science 333(6045):1024–1026.
Chipps S.R., Klumb R.A., Wright E.B. 2010. Development and application of juvenile pallid sturgeon bioenergetics model: Final Report. Brookings, SD: Department of Wildlife and Fisheries Sciences. Study T–24–R; Study No. 2424. 40 p. Available at <http://gfp.sd.gov/images/WebMaps/Viewer/WAP/Website/SWGSummaries/Pallid%20Bioenergetics%20Report%20T-24.pdf> (accessed September 19, 2017).
Ciferno J.P., Marano J.J. 2002. Benchmarking Biomass Gasification Technologies for Fuels, Chemicals and Hydrogen Production. National Energy Technology Laboratory. June 2002. 65 p. Available at <http://citeseerx.ist.psu.edu/viewdoc/download?doi=10.1.1.140.8405&rep=rep1&type=pdf> (accessed November 21, 2017).
Clean Water Act of 1972, as amended. 33 U.S.C. § 1251 et seq.
[CNEE] Center for the New Energy Economy. 2017. Louisiana–Energy Efficiency Resource Standard. August 23, 2017. Available at <https://spotforcleanenergy.org/state/louisiana/energy-efficiency-resource-standard/> (accessed September 23, 2017).
Coastal Protection and Restoration Authority. 2012. Louisiana’s Comprehensive Master Plan for a Sustainable Coast. Available at <http://coastal.la.gov/a-common-vision/2012-coastal-master-plan/> (accessed December 1, 2017).
Conner A.M., Francfort J.E., Rinehart B.N. 1998. U.S. Hydropower Resource Assessment, Final Report. Idaho Falls, Idaho: Idaho National Engineering and Environmental Laboratory. DOE/ID-10430.2. December 1998. 49 p. Available at <https://www1.eere.energy.gov/wind/pdfs/doewater-10430.pdf> (accessed September 4, 2017).
Coastal Zone Management Act of 1972. 16 U.S.C. § 1451 et seq.
Diem J.E., Stauber C.E., Rothernberg R. 2017. Heat in the southeastern United States: Characteristics, trends, and potential health impact. PLOS ONE 12(5): e0177937. Available at <http://journals.plos.org/plosone/article?id=10.1371/journal.pone.0177937#sec009> (accessed December 5, 2017).

6-6
[DOE] U.S. Department of Energy. 2010. Kemper County Integrated Gasification Combined-Cycle (IGCC) Project, Final Environmental Impact Statement (EIS). Washington, DC: DOE. DOE/EIS-0409, Volume 1. May 2010. 671 p. Available at <http://energy.gov/sites/prod/files/nepapub/nepa_documents/RedDont/ EIS-0409-FEIS-01-2010.pdf> (accessed January 29, 2018).
[DOE] U.S. Department of Energy. 2011. 2010 Solar Technologies Market Report. Washington, DC: DOE. November 2011. 136 p. Available at <http://www.nrel.gov/docs/fy12osti/51847.pdf> (accessed January 29, 2018).
[DOE] U.S. Department of Energy. 2013a. “Fuel Cell Basics.” August 14, 2013. Available at <https://www.energy.gov/eere/fuelcells/fuel-cell-basics> (accessed August 30, 2017).
[DOE] U.S. Department of Energy. 2013b. “Geothermal Resource Basics.” August 14, 2013. Available at <https://www.energy.gov/eere/geothermal/geothermal-basics> (accessed August 30, 2017).
[DOE] U.S. Department of Energy. 2017. “WINDExchange: U.S. Installed Wind Capacity.” Available at <https://windexchange.energy.gov/maps-data/321> (accessed January 29, 2018).
[DOE] U.S. Department of Energy. Undated. “Advanced Small Modular Reactors.” Available at <http://energy.gov/ne/nuclear-reactor-technologies/small-modular-nuclear-reactors> (accessed January 29, 2018).
[DOI] U.S. Department of the Interior, National Park Service. 2017. National Register of Historic Places: Research. Available at http://www.nps.gov/nr/research/ (accessed November 10, 2017).
[DOT] U.S. Department of Transportation. 2006. Highway Construction Noise Handbook. Washington, DC: DOT. August, 2006. 185 p. Available at <https://rosap.ntl.bts.gov/view/dot/8837> (accessed November 21, 2017).
Doyle T.W., Krauss K.W., Conner W.H., From A.S. 2010. Predicting the retreat and migration of tidal forests along the northern Gulf of Mexico under sea-level rise. Forest Ecology and Management 259:770–777.
[DSIRE] Database of State Incentives for Renewable Energy. 2016. “Louisiana Renewable Energy Pilot Program.” March 24, 2016. Available at <http://programs.dsireusa.org/system/program/detail/4596> (accessed October 31, 2017).
[EIA] U.S. Energy Information Administration. 2013a. Annual Energy Outlook 2013 with Projections to 2040. DOE/EIA 0383 (2013). Washington, DC: EIA. April 26, 2013. 244 p. Available at <http://www.eia.gov/forecasts/aeo/pdf/0383(2013).pdf> (accessed January 29, 2018).
[EIA] U.S. Energy Information Administration. 2013b. Updated Capital Cost Estimates for Utility Scale Electricity Generating Plants. Washington, DC: EIA. April 2013. 201 p. Available at <http://www.eia.gov/forecasts/capitalcost/pdf/updated_capcost.pdf> (accessed January 29, 2018).
[EIA] U.S. Energy Information Administration. 2013c. “Frequently Asked Questions—How much coal, natural gas, or petroleum is used to generate a kilowatthour of electricity?” March 3, 2017. Available at <http://www.eia.gov/tools/faqs/faq.cfm?id=667&t=2> (accessed September 11, 2017).
[EIA] U.S. Energy Information Administration. 2015a. Annual Energy Outlook 2015 with Projections to 2040. DOE/EIA–0383 (2015). Washington, DC: EIA. April 14, 2015. 154 p. Available at <http://www.eia.gov/forecasts/aeo/pdf/0383(2015).pdf> (accessed August 30, 2017).

6-7
[EIA] U.S. Energy Information Administration. 2015b. Levelized Cost and Levelized Avoided Cost of New Generation Resources in the Annual Energy Outlook 2015. Washington, DC: EIA. June 2015. 12 p. Available at <https://www.eia.gov/outlooks/archive/aeo15/pdf/electricity_generation_2015.pdf> (accessed November 17, 2017).
[EIA] U.S. Energy Information Administration. 2015c. “Today in Energy—First offshore wind farm in the United States begins construction.” August 14, 2015. Available at <http://www.eia.gov/todayinenergy/detail.cfm?id=22512> (accessed August 30, 2017).
[EIA] U.S. Energy Information Administration. 2016a. Annual Energy Outlook 2016 with Projections to 2040. DOE/EIA–0383 (2016). Washington, DC: EIA. September 15, 2016. 256 p. Available at <http://www.eia.gov/outlooks/aeo/pdf/0383(2016).pdf> (accessed August 30, 2017).
[EIA] U.S. Energy Information Administration. 2016b. Electric Power Annual 2016: Table Table 4.7.B. Net Summer Capacity Using Primarily Renewable Energy Sources and by State, 2016 and 2015. Washington, DC: EIA. November 21, 2016. 231 p. Available at <https://www.eia.gov/electricity/annual/html/epa_04_07_b.html> (accessed January 26, 2018).
[EIA] U.S. Energy Information Administration. 2016c. “Louisiana State Profile and Energy Estimates—Overview.” January 21, 2016. Available at <https://www.eia.gov/state/analysis.php?sid=LA> (accessed December 20, 2017).
[EIA] U.S. Energy Information Administration. 2016d. “Today in Energy—California has nearly half of the nation’s solar electricity generating capacity.” February 5, 2016. Available at <https://www.eia.gov/todayinenergy/detail.php?id=24852#> (accessed December 20, 2017).
[EIA] U.S. Energy Information Administration. 2016e. “Today in Energy—Southern states lead growth in biomass electricity generation.” May 25, 2016. Available at <https://www.eia.gov/todayinenergy/detail.php?id=26392> (accessed October 25, 2017).
[EIA] U.S. Energy Information Administration. 2017a. Energy-Related Carbon Dioxide Emissions at the State Level, 2000–2014. Washington, DC: EIA. 30 p. Available at <https://www.eia.gov/environment/emissions/state/analysis/pdf/stateanalysis.pdf> (accessed October 13, 2017).
[EIA] U.S. Energy Information Administration. 2017b. “Geothermal Explained—State Rankings for Geothermal Electricity Generation, 2016.” May 18, 2017. Available at <https://www.eia.gov/energyexplained/index.cfm?page=geothermal_use> (accessed January 29, 2018).
[EIA] U.S. Energy Information Administration. 2017c. “Louisiana State Profile and Energy Estimates.” January 19, 2017. Available at <https://www.eia.gov/state/analysis.php?sid=LA> (accessed August 16, 2017).
[EIA] U.S. Energy Information Administration. 2017d. “State Electricity Profiles.” January 17, 2017. Available at <https://www.eia.gov/electricity/state/Louisiana/> (accessed August 16, 2017).
[EIA] U.S. Energy Information Administration. 2017e. “Today in Energy—Utility-scale solar has grown rapidly over the past five years.” May 4, 2017. Available at <https://www.eia.gov/todayinenergy/detail.php?id=31072> (accessed October 30, 2017).
Endangered Species Act of 1973, as amended. 16 U.S.C. § 1531 et seq.

6-8
[Energy Daily] IHS The Energy Daily. 2016. First U.S. Offshore Wind Farm Delivers Power to Grid. December 13, 2016. Volume 44, Number 238. Available at <http://www.theenergydaily.com> (accessed January 29, 2018).
[Energy Daily] IHS The Energy Daily. 2017. Southern Stops Work on Kemper’s Lignite Gasification Technology. June 29, 2017. Volume 45, Number 124. Available at <http://www.theenergydaily.com> (accessed January 29, 2018).
[ENSR] ENSR Corporation. 2007. Impingement Mortality and Entrainment Characterization Study (IMECS), Entergy – Waterford 3. Document No. 00970-027-300. December 2007. 241 p. ADAMS Accession No. ML12157A426.
[Entergy] Entergy Operations, Inc. 2005. Offsite Dose Calculation Manual (ODCM). Revision 13. November 2005. ADAMS Accession No. ML061420311.
[Entergy] Entergy Louisiana, LLC. 2008a. River Bend Station, Unit 3, Combined License Application, Part 3: Environmental Report. Revision 0. September 2008. ADAMS Accession No. ML082830273.
[Entergy] Entergy Louisiana, LLC. 2008b. River Bend Station Unit 3 Combined Operating License Application, Final Safety Analysis Report, Chapter 2, Site Characteristics. September 25, 2008. ADAMS Accession Nos. ML082830262, ML082830250, ML082830251, ML082830252, and ML082830253.
[Entergy] Entergy Louisiana, LLC. 2013a. River Bend Station LPDES Permit LA0042731 Stormwater Pollution Prevention Plan. Revision 3. July 24, 2013. ADAMS Accession No. ML17353A062.
[Entergy] Entergy Operations, Inc. 2013b. River Bend Station, Unit 1, Annual Radiological Effluent Release Report for 2012. May 1, 2013. ADAMS Accession No. ML13127A032.
[Entergy] Entergy Operations, Inc. 2013c. River Bend Station, Unit 1, Annual Radiological Environmental Operating Report for 2012. May 1, 2013. ADAMS Accession No. ML13127A078.
[Entergy] Entergy Operations, Inc. 2014a. River Bend Station, Unit 1, Annual Radiological Effluent Release Report for 2013. May 1, 2014. ADAMS Accession No. ML14126A087.
[Entergy] Entergy Operations, Inc. 2014b. River Bend Station, Unit 1, Annual Radiological Environmental Operating Report for 2013. May 1, 2014. ADAMS Accession No. ML14126A007.
[Entergy] Entergy Louisiana, LLC. 2015a. 2015 Integrated Resource Plan. August 3, 2015. Available at <http://www.entergy-louisiana.com/content/irp/2015_0803_Louisiana_Final_IRP_Public.pdf> (accessed September 22, 2017).
[Entergy] Entergy Operations, Inc. 2015b. River Bend Station, Unit 1, Annual Radiological Effluent Release Report for 2014. May 1, 2015. ADAMS Accession No. ML15126A098.
[Entergy] Entergy Operations, Inc. 2015c. River Bend Station, Unit 1, Annual Radiological Environmental Operating Report for 2014. May 1, 2015. ADAMS Accession No. ML15133A319.
[Entergy] Entergy Louisiana, LLC and Entergy Operations, Inc. 2015d. Updated Safety Analysis Report (USAR). Revision 24. July 28, 2015. ADAMS Accession No. ML15222A534.

6-9
[Entergy] Entergy Louisiana, LLC. 2016a. Applicant’s Environmental Report—Operating License Renewal Stage, Waterford Steam Electric Station, Unit 3. March 2016. ADAMS Accession Nos. ML16088A326, ML16088A327, ML16088A328, ML16088A329, ML16088A333, ML16088A335.
[Entergy] Entergy Louisiana, LLC. 2016b. Applicant’s Environmental Report—Operating License Renewal Stage, Waterford Steam Electric Station, Unit 3. March 2016. ADAMS Accession No. ML16088A326.
[Entergy] Entergy Louisiana, LLC. 2016c. Letter from R. Buckley, Entergy, to B. Rieck, Deputy Field Supervisor, U.S. Fish and Wildlife Service. Subject: River Bend Station Unit 1 License Renewal Application. July 25, 2016. In: Entergy 2017h, Attachment B, p. B-14. ADAMS Accession No. ML17174A531.
[Entergy] Entergy Operations, Inc. 2016d. LPDES Permit Renewal Application, Entergy Louisiana, LLC River Bend Station. April 28, 2016. Submitted May 3, 2016. Available at <http://edms.deq.louisiana.gov/app/doc/querydef.aspx> [search AI 2889.]
[Entergy] Entergy Louisiana, LLC. 2016e. River Bend Station Air Emission Calculations, Criteria Pollutants, Hazardous Air Pollutants and Greenhouse Gases. May 3, 2016. ADAMS Accession No. ML17353A054.
[Entergy] Entergy Louisiana, LLC. 2016f. River Bend Station Spill Prevention, Control and Countermeasure Plan (SPCC). Revision 17. December 12, 2016. ADAMS Accession No. ML17353A065.
[Entergy] Entergy Operations, Inc. 2016g. River Bend Station, Unit 1, Annual Radiological Effluent Release Report for 2015. May 2, 2016. ADAMS Accession No. ML16130A565.
[Entergy] Entergy Operations, Inc. 2016h. River Bend Station, Unit 1, Annual Radiological Environmental Operating Report for 2015. May 2, 2016. ADAMS Accession No. ML16130A562.
[Entergy] Entergy Operations, Inc. 2017a. 2016 Annual Radioactive Effluent Release Report, River Bend Station - Unit 1. May 1, 2017. ADAMS Accession No. ML17128A409.
[Entergy] Entergy Operations, Inc. 2017b. Letter from Steven P. Vercelli, Entergy, General Manager, Plant Operations, to NRC Document Control Desk. Subject: Supplement to license renewal application River Bend Station - Unit 1. August 1, 2017. ADAMS Accession No. ML17213A064.
[Entergy] Entergy Operations, Inc. 2017c. Letter from W.F. Maguire, Site Vice President, River Bend Station, to NRC Document Control Desk. Subject: Response to License Renewal Application (LRA) NRC Request for Additional Information (RAI) Environmental. December 5, 2017. ADAMS Accession No. ML17353A049.
[Entergy] Entergy Operations, Inc. 2017d. Letter from W.F. Maguire, Site Vice President, River Bend Station, to NRC Document Desk. Subject: Response to License Renewal Application (LRA) NRC Request for Additional Information (RAI) Environmental, Attachment, “Response to Request for Information Form for ER Section 3.9.2, Microbiological Hazards.” December 5, 2017. ADAMS Accession No. ML17353A052.
[Entergy] Entergy Operations, Inc. 2017e. River Bend Station, Unit 1, Annual Radiological Effluent Release Report for 2016. May 1, 2017. ADAMS Accession No. ML17128A409.
[Entergy] Entergy Operations, Inc. 2017f. River Bend Station, Unit 1, Annual Radiological Environmental Operating Report for 2016. May 1, 2017. ADAMS Accession No. ML17128A471.

6-10
[Entergy] Entergy Operations, Inc. 2017g. River Bend Station, Unit 1, License Renewal Application. West Feliciana Parish, LA: Entergy. May 2017. 1,301 p. ADAMS Accession Nos. ML17153A286 and ML17153A287.
[Entergy] Entergy Operations, Inc. 2017h. River Bend Station, Unit 1, License Renewal Application, Appendix E, Applicant’s Environmental Report. West Feliciana Parish, LA: Entergy. May 2017. 859 p. ADAMS Accession No. ML17174A531.
[Entergy] Entergy Operations, Inc. 2017i. Letter from William F. Maguire, Entergy, to U.S. Nuclear Regulatory Commission Document Control Desk. Subject: Response to License Renewal Application (LRA) NRC Request for Additional Information, Severe Accident Mitigation Alternatives River Bend Station, Unit 1, Docket No. 50-458, License No. NPF-47. December 5, 2017. ADAMS Accession No. ML17339A795.
[Entergy] Entergy Corp. 2018a. 2017 Annual Radioactive Effluent Release Report, River Bend Station - Unit 1, License No. NPF-47, Docket No. 50-458. May 1, 2018 ADAMS No. ML18121A093
[Entergy] Entergy Corp. 2018b. Annual Radiological Environmental Operating Report for 2017, River Bend Station - Unit 1, License No. NPF-47, Docket No. 50-458. May 1, 2018. ADAMS No. ML18121A077
[EPA] U.S. Environmental Protection Agency. 1974. Information on Levels of Environmental Noise Requisite to Protect Public Health and Welfare with an Adequate Margin of Safety. 550/9-74-004. Washington, DC.: EPA. March 1974. 242 p. Available at <https://www.epa.gov/nscep> (accessed October 20, 2017).
[EPA] U.S. Environmental Protection Agency. 1981. Noise Effects Handbook: A Desk Reference to Health and Welfare Effects of Noise. Washington, DC: EPA. October 1979, Revised July 1981. 125 p. Available at <https://www.epa.gov/nscep> (accessed October 20, 2017).
[EPA] U.S. Environmental Protection Agency. 1999a. Consideration of Cumulative Impacts in EPA Review of NEPA Documents. EPA-315-R-99-002. Washington, DC: Office of Federal Activities (2252A). May 1999. 22 p. Available at <http://www2.epa.gov/sites/production/files/2014-08/documents/cumulative.pdf> (accessed September 12, 2017).
[EPA] U.S. Environmental Protection Agency. 1999b. Use of Monitored Natural Attenuation at RCRA Corrective Action, and Underground Storage Tank Sites. April 21, 1999. Available at <https://www.epa.gov/sites/production/files/2014-02/documents/d9200.4-17.pdf> (accessed August 31, 2017).
[EPA] U.S. Environmental Protection Agency. 2002a. Case Study Analysis for the Proposed Section 316(b) Phase II Existing Facilities Rule. EPA-821-R-02-002. Washington, DC: Office of Science and Technology. May 2002. Available at <https://nepis.epa.gov> [search EPA-821-R-02-002].
[EPA] U.S. Environmental Protection Agency. 2002b. EPA Facts About Tritium. Washington, DC: EPA. July 2002. 2 p. Available at <http://www.trainex.org/web_courses/tritium/reference_pages/tritium%20EPA.pdf> (accessed December 11, 2017).

6-11
[EPA] U.S. Environmental Protection Agency. 2004. Technical Development Document for the Final Section 316(b) Phase II Existing Facilities Rule. EPA 821-R-04-007. Washington, DC: EPA Office of Water. February 12, 2004. 228 p. Available at <https://www.epa.gov/cooling-water-intakes/support-documents-phase-ii-cooling-water-intake-rule-2004-withdrawn> (accessed December 8, 2017).
[EPA] U.S. Environmental Protection Agency. 2009a. Assessment of the Impacts of Global Change on Regional U.S. Air Quality: A synthesis of Climate Change Impacts on Ground-Level Ozone. EPA/600/R-07/094F. Washington, DC: EPA. April 2009. 131 p. Available at <https://cfpub.epa.gov/ncea/risk/recordisplay.cfm?deid=203459> (accessed November 8, 2017).
[EPA] U.S. Environmental Protection Agency. 2009b. “Endangerment and Cause or Contribute Findings for Greenhouse Gases under Section 202(a) of the Clean Air Act.” July 11, 2017. Available at <https://www.epa.gov/ghgemissions/endangerment-and-cause-or-contribute-findings-greenhouse-gases-under-section-202a-clean> (accessed November 27, 2017).
[EPA] U.S. Environmental Protection Agency. 2014a. Benefits Analysis for the Final Section 316(b) Existing Facilities Rule. EPA-821-R-14-005. Washington, DC: Office of Water (4303T). May 2014. 334 p. Available at <https://www.epa.gov/sites/production/files/2015-05/documents/cooling-water_phase-4_benefits_2014.pdf> (accessed September 13, 2017).
[EPA] U.S. Environmental Protection Agency. 2014b. Greenhouse Gas Inventory Guidance: Direct Fugitive Emissions from Refrigeration, Air Conditioning, Fire Suppression, and Industrial Gases. Washington, DC: EPA. November 2014. 20 p. Available at <https://www.epa.gov/sites/production/files/2015-07/documents/fugitiveemissions.pdf> (accessed November 27, 2017).
[EPA] U.S. Environmental Protection Agency. 2014c. “Municipal Solid Waste: Basic Information about Energy Recovery from Waste.” March 29, 2016. Available at <http://www.epa.gov/osw/nonhaz/municipal/wte/basic.htm> (accessed October 2, 2017).
[EPA] U.S. Environmental Protection Agency. 2014d. “Municipal Solid Waste: Energy Recovery from Waste.” March 29, 2006. Available at <http://www.epa.gov/osw/nonhaz/municipal/wte/> (accessed October 2, 2017).
[EPA] U.S. Environmental Protection Agency. 2015. “Mercury and Air Toxics Standards.” February 13, 2018. Available at <https://www.epa.gov/mats> (accessed January 26, 2018).
[EPA] U.S. Environmental Protection Agency. 2016a. Climate Change Indicators in the United States, 2014. Fourth Edition. EPA-430-R-14-004. Washington, DC: EPA. 96 p. Available at <https://www.epa.gov/sites/production/files/2016-08/documents/climate_indicators_2016.pdf> (accessed November 27, 2017).
[EPA] U.S. Environmental Protection Agency. 2016b. What Climate Change Means for Louisiana. EPA 430-F-16-020. Washington, DC: EPA. 2 p. August 2016. Available at <https://19january2017snapshot.epa.gov/sites/production/files/2016-09/documents/climate-change-la.pdf> (accessed September 29, 2017).
[EPA] U.S. Environmental Protection Agency. 2016c. What Climate Change Means for Louisiana. EPA 430-F-16-020. Washington, DC: EPA. 2 p. August 2016. Available at <https://19january2017snapshot.epa.gov/sites/production/files/2016-09/documents/climate-change-la.pdf> (accessed November 6, 2017).
[EPA] U.S. Environmental Protection Agency. 2017a. “2014 National Emissions Inventory Data.” Available at <https://www.epa.gov/air-emissions-inventories/2014-national-emissions-inventory-nei-data> (accessed October 13, 2017).

6-12
[EPA] U.S. Environmental Protection Agency. 2017b. “Facility Level Greenhouse Gas Emissions Data.” Available at <https://ghgdata.epa.gov/ghgp/main.do> (accessed October 13, 2017).
[EPA] U.S. Environmental Protection Agency. 2017c. Inventory of U.S. Greenhouse Gas Emissions and Sinks, 1990–2015. EPA 430-P-17-001. Washington, DC: EPA. April 15, 2017. 633 p. Available at <https://www.epa.gov/sites/production/files/2017-02/documents/2017_complete_report.pdf> (accessed October 13, 2017).
[EPA] U.S. Environmental Protection Agency. 2017d. “National Ambient Air Quality Standards.” December 20, 2016. Available at <https://www.epa.gov/criteria-air-pollutants/naaqs-table> (accessed October 20, 2017).
[EPA] U.S. Environmental Protection Agency. 2017e. “NPDES State Program Information, State Program Authority.” September 27, 2017. Available at <https://www.epa.gov/npdes/npdes-state-program-information> (accessed October 20, 2017).
[EPA] U.S. Environmental Protection Agency. 2017f. “Overview of the Drinking Water Sole Source Aquifer Program.” October 27, 2016. Available at <https://www.epa.gov/dwssa/overview-drinking-water-sole-source-aquifer-program#What_Is_SSA> (accessed July 19, 2017).
[EPA] U.S. Environmental Protection Agency. 2017g. “Sole Source Aquifers in the Southeast, U.S. Environmental Protection Agency.” February 21, 2016. Available at <https://archive.epa.gov/pesticides/region4/water/groundwater/web/html/r4ssa.html> (accessed July 19, 2017).
[EPA] U.S. Environmental Protection Agency. 2017h. Summary of the Noise Control Act. December 8, 2017. Available at <https://www.epa.gov/laws-regulations/summary-noise-control-act> (accessed November 3, 2017).
[EPA] U.S. Environmental Protection Agency. 2017i. “Surf Your Watershed: Lower Mississippi-Baton Rouge Watershed -- 08070100.” October 3, 2017. Available at <https://cfpub.epa.gov/surf/huc.cfm?huc_code=08070100> (accessed October 3, 2017).
[EPA] U.S. Environmental Protection Agency. 2018. “Safe Drinking Water Information System (SDWIS).” Parish Search—East Baton Rouge and West Feliciana Parishes, Louisiana. Available at <https://ofmpub.epa.gov/apex/sfdw/f?p=108:200::::::> (accessed January 2, 2018).
[EPRI] Electric Power Research Institute. 2011. Mapping and Assessment of the United States Ocean Wave Energy Resource. Palo Alto, California: EPRI. 1024637. December 2011. 176 p. Available at <http://www1.eere.energy.gov/water//pdfs/mappingandassessment.pdf> (accessed January 29, 2018).
Endangered Species Act of 1973, as amended. 16 U.S.C. § 1531 et seq.
Fahrig L. 2003. Effects of habitat fragmentation on biodiversity. Annual Review of Ecology, Evolution, and Systematics 34:487–515.
[FEMA] Federal Emergency Management Agency. 1979. Flood Insurance Rate Map, West Feliciana Parish, Louisiana (Unincorporated Areas). Oakton, VA: FEMA Map Service Center. Map Number 220245 0007 B. February 13, 1979. Available at <https://msc.fema.gov/portal/> (accessed October 3, 2017).
Federal Water Pollution Control Act (Clean Water Act) of 1972, as amended. 33 U.S.C.§1251 et seq.

6-13
FishNet. 2014. “FishNet2, Search FishNet.” June 16, 2014. Available at <http://www.fishnet2.net> (accessed July 3, 2017).
Frankson R., Kunkel K.E., Champion S. 2017. Louisiana State Summary. NOAA Technical Report NESDIS 149-LA. 4 p. Available at <https://statesummaries.ncics.org/la> (accessed October 2, 2017).
Fraser K.C., Silverio C., Kramer P., Mickle N., Aeppli R., Stutchbury B.J.M. 2013. A trans-hemispheric migratory songbird does not advance spring schedules or increase migration rate in response to record-setting temperatures at breeding sites. PLOS ONE 8(5):e64587.
Friedenberg N.A., Powell J.A., Ayres M.P. 2007. Synchrony's double edge: transient dynamics and the Allee effect in stage structured populations. Ecology Letters 10:564–573.
[FWS] U.S. Fish and Wildlife Service. 2013. Biological Opinion: Channel Improvement Program, Mississippi River and Tributaries Project, Lower Mississippi River. Jackson, MS: FWS. December 12, 2013. 71 p. Available at <https://www.fws.gov/mississippies/_pdf/LMRBiologicalOpinion.pdf> (accessed August 30, 2017).
[FWS] U.S. Fish and Wildlife Service. 2014a. “Cat Island National Wildlife Refuge Louisiana: Wildlife and Habitat.” Janunary 27, 2017. Available at <https://www.fws.gov/refuge/Cat_Island/> (accessed August 23, 2017).
[FWS] U.S. Fish and Wildlife Service. 2014b. Guidance for Preparing a Biological Assessment. 6 p. Available at <http://www.fws.gov/midwest/endangered/section7/pdf/BAGuidance.pdf> (accessed September 8, 2017).
[FWS] U.S. Fish and Wildlife Service. 2014c. Revised Recovery Plan for the Pallid Sturgeon (Scaphirhynchus albus). Billings, MT: Pallid Sturgeon Recovery Coordinator. January 2014. 126 p. Available at <https://ecos.fws.gov/docs/recovery_plan/Pallid%20Sturgeon%20 Recovery%20Plan%20First%20Revision%20signed%20version%20012914_3.pdf> (accessed August 30, 2017).
[FWS] U.S. Fish and Wildlife Service. 2016. Letter from M. Sikes, FWS, to R. Buckley, Entergy. Reply to (via stamp of receipt/review/finding on) Entergy’s July 25, 2016, letter concerning River Bend Station Unit 1 License Renewal Application. August 26, 2016. In: Entergy 2017h, Attachment B, p. B-14.
[FWS] U.S. Fish and Wildlife Service. 2017a. Letter from FWS to NRC. Subject: List of threatened and endangered species that may occur in your proposed project location, and/or may be affected by your proposed project. Consultation Code: 04EL1000-2017-SLI-0965. August 30, 2017. ADAMS Accession No. ML17242A116.
[FWS] U.S. Fish and Wildlife Service. 2017b. Letter from J.A. Ranson to L. Kemp, LDEQ. Subject: Reply to LDEQ’s June 15, 2017, E-mail Regarding Preliminary Draft Permit for Entergy Operations, Inc./River Bend Station; AI 2889; LA0042731. July 7, 2017. LDEQ Document No. 10722559. Available at <http://edms.deq.louisiana.gov/> (accessed September 18, 2017).
[FWS] U.S. Fish and Wildlife Service. 2017c. Letter from J. Ranson, FWS, to B. Beasley, NRC. Subject: Concurrence with “not likely to adversely affect” determination for pallid sturgeon for Waterford Steam Electric Station, Unit 3, license renewal. November 20, 2017. ADAMS Accession No. ML17331A541.[FWS] U.S. Fish and Wildlife Service. 2018. Letter from J. Ranson, FWS, to B. Beasley, NRC. Subject: Concurrence with “not likely to adversely affect” determination for pallid sturgeon for River Bend Station, Unit 1, license renewal. August 29, 2018. ADAMS Accession No. ML18241A321.

6-14
[FWS and NMFS] U.S. Fish and Wildlife Service and National Marine Fisheries Service. 1998. Endangered Species Consultation Handbook: Procedures for Conducting Consultation and Conference Activities Under Section 7 of the Endangered Species Act. March 1998. 315 p. Available at <http://www.fws.gov/endangered/esa-library/pdf/esa_section7_handbook.pdf> (accessed September 8, 2017).
[FWS and NMFS] U.S. Fish and Wildlife Service and National Marine Fisheries Service. 2009. Gulf Sturgeon (Acipenser oxyrinchus desotoi) 5-Year Review: Summary and Evaluation. September 2009. 49 p. Available at <https://ecos.fws.gov/docs/five_year_review/doc2620.pdf> (accessed September 18, 2017).
Gagnon, C. 2011. "Animal Diversity Web: Campostoma anomalum.". Available at <http://animaldiversity.org/accounts/Campostoma_anomalum/> (accessed July 3, 2017)
[GBRBR] Greater Baton Rouge Business Report. 2013. “Cracking the code – 2014 may be a big year for those drilling in the Tuscaloosa Marine Shale.” November 12, 2013. Available at <https://www.businessreport.com/article/cracking-the-code-2014-may-be-a-big-year-for-those-drilling-in-the-tuscaloosa-marine-shale> (accessed September 21, 2017).
[GCP] Global Carbon Budget. 2017. 2015 Global Carbon Atlas. Available at: < http://www.globalcarbonatlas.org/en/CO2-emissions> (accessed December 12, 2017)
[GSUC] Gulf States Utilities Company. 1984a. River Bend Station Environmental Report, Operating License Stage. Volumes 1–4, Supplements 1–9. November 1984.
[GSUC] Gulf States Utilities Company. 1984b. River Bend Station, Unit 1, Environmental Report, Operating License Stage. Supplement 9. November 1984. 22 p. ADAMS Accession No. ML17353A056.
[GSUC] Gulf States Utilities Company. 1987. River Bend Station—Annual Environmental Operating Report (Non-Radiological) for Period 8/29/1986- 8/28/1987. ADAMS Accession No. ML17289A374.
[GSU] Georgia State University. 2016. “HyperPhysics, Estimating Sound Levels with the Inverse Square Law.” Available at <http://hyperphysics.phy-astr.gsu.edu/hbase/Acoustic/isprob2.html> (accessed November 21, 2017).
Herkert J.R. 1994. The effects of habitat fragmentation on Midwestern grassland bird communities. Ecological Applications 4(3):461–471.
Hoover J.J., George S.G., Killgore K.J. 2007. Diet of shovelnose sturgeon and pallid sturgeon in the free-flowing Mississippi River. Journal of Applied Ichthyology 23:494–499.
[HUD] U.S. Department of Housing and Urban Development. 2014. “Noise Abatement and Control.” Available at <https://www.hudexchange.info/programs/environmental-review/noise-abatement-and-control/> (accessed October 20, 2017).
[ICF] ICF International. 2015. Long-Term Demand Side Management Potential in the Entergy Louisiana and Entergy Gulf States Louisiana Service Territories: Summary Presentation. Fairfax, VA: ICF. February 24, 2015. 18 p. Available at <http://www.entergy-louisiana.com/content/irp/LA_2015_IRP_ICF_DSM_Potential_Study.pdf> (accessed January 28, 2018).
[IEA] International Energy Agency. 2007. Biomass for Power Generation and CHP. IEA Energy Technology Essentials ETE03. January 2007. 4 p. Available at <https://www.iea.org/publications/freepublications/publication/essentials3.pdf> (accessed January 14, 2018).

6-15
[IPCC] Intergovernmental Panel on Climate Change. 2000. IPCC Special Report: Emissions Scenarios. Geneva, Switzerland: IPCC. 570 p. Available at <http://www.ipcc.ch/ipccreports/sres/emission/index.php?idp=0> (accessed October 8, 2016).
[IPCC] Intergovermental Panel of Climate Change. 2007. Climate Change 2007: The Physical Science Basis. Contribution of Working Group I to the Fourth Assessment Report of the Intergovernmental Panel on Climate Change. Solomon, S., D. Qin, M. Manning, Z. Chen, M. Marquis, K.B. Averyt, M. Tignor, H.L. Miller (eds.). Cambridge University Press, Cambridge, United Kingdom and New York, NY, USA. 996 p. Available at <https://www.ipcc.ch/publications_and_data/publications_ipcc_fourth_assessment_report_wg1_report_the_physical_science_basis.htm>
[IPCC] Intergovermental Panel of Climate Change. 2013. Climate Change 2013: The Physical Science Basis. Contribution of Working Group I to the Fifth Assessment Report of the Intergovernmental Panel on Climate Change. Stocker T.F., Qin D., Plattner G-K., Tignor M., Allen S.K., Boschung J., Nauels A., Xia Y., Bex V., Midgley P.M. (eds.). 1535 p. Available at <http://www.climatechange2013.org/>
[IRENA] International Renewable Energy Agency. 2012. Renewable Energy Technologies: Cost Analysis Series, Biomass for Power Generation. Bonn, Germany: IRENA. June 2012. 60 p. Available at <http://www.irena.org/DocumentDownloads/Publications/RE_Technologies_Cost_Analysis-BIOMASS.pdf> (accessed November 21, 2017).
Jones C.E., An K., Blom R.G., Kent J.D., Ivins J.E.R., Bekaert D. 2016. Anthropogenic and geologic influences on subsidence in the vicinity of New Orleans, Louisiana. Journal of Geophysical Research: Solid Earth, 21:3867–3887.
Kammerer JC. 1990. Largest Rivers in the United States. Reston, VA: U.S. Department of the Interior, U.S. Geological Survey. Open File Report 87-242. Revised May 1990. Available at <https://pubs.usgs.gov/of/1987/ofr87-242/pdf/ofr87242.pdf> (accessed October 3, 2017)
Kapperman K.M., Fraser W.C., Toner M., Dean J., Webb M.A.H. 2009. Effect of temperature on growth, condition, and survival of juvenile shovelnose sturgeon. Transactions of the American Fisheries Society 138:927–937.
Krentz S. 2004. “Scaphirhynchus albus.” Missouri River Fish & Wildlife Management Assistance, IUCN Red List of Threatened Species 2004: e.T19940A9111329. Available at <http://www.iucnredlist.org/details/19940/0> (accessed September 18, 2017).
LAC 33:I.39. Louisiana Administrative Code, Title 33, Environmental Quality, Part I, Office of the Secretary, Chapter 39 Notification Regulations and Procedures for Unauthorized Discharges.
LAC 33:VII. Louisiana Administrative Code, Title 33, Environmental Quality, Part VII, Solid Waste Regulations.
LAC 48:V.73. Louisiana Administrative Code, Title 48, Public Health—General, Part V, Preventative Health Services.
LAC 51:XXVII. Louisiana Administrative Code, Title 51, Public Health—Sanitary Code, Part XXVII, Management of Refuse, Infectious Waste, Medical Waste, and Potentially Infectious Biomedial Waste.
LAC 33:IX.23. Louisiana Administrative Code, Title 33, Environmental Quality, Part IX, Water Quality, SubPart 2, The Louisiana Pollutant Discharge Elimination System (LPDES) Program, Chapter 23, Definitions and General LPDES Program Requirements.

6-16
LAC 33:IX.1111. Louisiana Administrative Code, Title 33, Environmental Quality, Part IX, Water Quality, SubPart 1, Water Pollution Control, Chapter 11, Surface Water Quality Standards, Section 1111, Water Use Designations.
LAC 33:III.23.5. Louisiana Administrative Code, Title 33, Environmental Quality, Part III, Air, Chapter 5, Permit Procedures.
LAC 33:III.23.2113. Louisiana Administrative Code, Title 33, Environmental Quality, Part III, Air, Chapter 21, Control of Emission of Organic Compounds, Subchapter A, General, Section 2113, Housekeeping.
LAC 33:III.5611. Louisiana Administrative Code, Title 33, Environmental Quality, Part III, Air, Chapter 56, Prevention of Air Pollution Emergency Episode, Section 5611, Standby Plans to be Submitted When Requested by the Administrative Authority.
[LDEQ] Louisiana Department of Environmental Quality. 2009. River Bend Station Air Permit Number 3160-00009-04. ADAMS Accession No. ML17353A061.
[LDEQ] Louisiana Department of Environmental Quality. 2010. Louisiana Pollutant Discharge Elimination System (LPDES) Permit No. LA0007374. September 7, 2010. In: Entergy 2016a, Attachment A, p. A-3. ADAMS Accession No. ML16088A335.
[LDEQ] Louisiana Department of Environmental Quality. 2011. Louisiana Pollutant Discharge Elimination System (LPDES) Permit No. LA0042731. August 30, 2011. In: Entergy 2017h, Attachment A, (p. A-7). ADAMS Accession No. ML17174A531.
[LDEQ] Louisiana Department of Environmental Quality. 2013. Entergy Operations, Inc., Administrative Order, Enforcement Tracking No. WE-A0-13-00120, Agency Interest No. 2889. Baton Rouge, LA: Office of Environmental Services. February 15, 2013. Available at <http://edms.deq.louisiana.gov/app/doc/querydef.aspx> [search document ID No. 9925763.] (accessed November 3, 2017).
[LDEQ] Louisiana Department of Environmental Quality. 2017a. 2016 Louisiana Water Quality Inventory: Integrated Report, Fulfilling Requirements of the Federal Clean Water Act, Sections 305(b) and 303(d). Baton Rouge, LA: Department of Environmental Quality. May 2016. Appendix A, Revised August 23, 2017. Available at <http://deq.louisiana.gov/page/water-quality-integrated-report-305b303d> (accessed October 27, 2017).
[LDEQ] Louisiana Department of Environmental Quality. 2017b. E-mail from L. Kemp, LDEQ, to A. Trahan and D. Walther, U.S. Fish and Wildlife Service. Subject: Preliminary Draft Permit for Entergy Operations, Inc./River Bend Station; AI 2889; LA0042731. June 15, 2017. LDEQ Document No. 10722559. Available at <http://edms.deq.louisiana.gov/> (accessed September 18, 2017).
[LDEQ] Louisiana Department of Environmental Quality. 2017c. Letter from S. Guilliams, Administrator, Water Permit Division, to R. Buckley, Entergy Services, Inc. Subject: Entergy Operations, Inc. - River Bend Unit 1 License Renewal, Section 401 Water Quality Certification. LDEQ-EDMS Document 10783866. September 8, 2017. Available at <http://edms.deq.louisiana.gov/app/doc/querydef.aspx> [search AI 2889.] (accessed November 3, 2017).
[LDEQ] Louisiana Department of Environmental Quality. 2017d. “Louisiana Pollutant Discharge Elimination System (LPDES), LPDES Permitting Information, LPDES General Permits.” No page date. Available at <http://deq.louisiana.gov/page/lpdes> (accessed November 13, 2017).

6-17
[LDEQ] Louisiana Department of Environmental Quality. 2017e. LPDES Permit No. LA0042731, Al No. 2889, LPDES Fact Sheet and Rationale for the Draft Louisiana Pollutant Discharge Elimination System (LPDES) Permit to Discharge to Waters of Louisiana. Baton Rouge, LA: Office of Environmental Services, Industrial Permits Section. July 19, 2017. Available at <http://edms.deq.louisiana.gov/app/doc/querydef.aspx> (accessed October 20, 2017).
[LDEQ] Louisiana Department of Environmental Quality. 2017f. LPDES Permit No. LA0042731. September 15, 2017. Effective date November 1, 2017. Available at <http://edms.deq.louisiana.gov/app/doc/querydef.aspx> (accessed October 20, 2017).
[LDEQ] Louisiana Department of Environmental Quality. 2017g “Water Quality Integrated Report 305(b)/303(d).” No page date. Available at <http://deq.louisiana.gov/page/water-quality-integrated-report-305b303d> (accessed October 20, 2017).
[LDH] Louisiana Department of Health. Undated. “Annual Infectious Disease Surveillance Reports.” Available at <http://new.dhh.louisiana.gov/index.cfm/page/536> (accessed December 18, 2017).
[LDH] Louisiana Department of Health. 2016a. Annual Infectious Disease Surveillance Reports: Legionellosis Annual Report 2016. Baton Rouge, LA: LDH. Undated. 7 p. Available at <http://new.dhh.louisiana.gov/assets/oph/Center-PHCH/Center-CH/infectious-epi/Annuals/Legionella_LaIDAnnual.pdf> (accessed December 18, 2017).
[LDH] Louisiana Department of Health. 2016b. Annual Infectious Disease Surveillance Reports, Salmonella Annual Report 2016. Baton Rouge, LA: LDH. Undated. 9 p. Available at <http://new.dhh.louisiana.gov/assets/oph/Center-PHCH/Center-CH/infectious-epi/Annuals/Salmonella_LaIDAnnual.pdf> (accessed December 18, 2017).
[LDH] Louisiana Department of Health. 2016c. Annual Infectious Disease Surveillance Reports, Shigella Annual Report 2016. Baton Rouge, LA: LDH. Undated. 8 p. Available at <http://new.dhh.louisiana.gov/assets/oph/Center-PHCH/Center-CH/infectious-epi/Annuals/Shigella_LaIDAnnual.pdf> (accessed December 18, 2017).
[LDNR] Louisiana Department of Natural Resources. 2012. Coastal Zone Boundary Map. Available at <http://www.dnr.louisiana.gov/assets/OCM/CoastalZoneBoundary/CZB2012/ maps/Outreach_Map.pdf> (accessed August 21, 2017).
[LDNR] Louisiana Department of Natural Resources. 2017a. “Surface Water Management Program.” No page date. Available at <http://www.dnr.louisiana.gov/index.cfm?md=pagebuilder&tmp=home&pid=92> (accessed October 20, 2017).
[LDNR] Louisiana Department of Natural Resources. 2017b. “Tuscaloosa Marine Shale.” June 20, 2017. Available at <http://www.dnr.louisiana.gov/index.cfm?md=pagebuilder&tmp=home&pid=909> (accessed September 21, 2017).
[LaDOTD] Louisiana Department of Transportation & Development. 2018. "LADOTD Estimated Annual Average Daily Traffic Routine Traffic Counts." Retrieved from <http://wwwapps.dotd.la.gov/engineering/tatv/> (accessed January 2018).
[LDWF] Louisiana Department of Wildlife and Fisheries. 2006. “LDWF and Entergy’s River Bend Station Team Up to Preserve River Bend Natural Area.” February 14, 2006. Available at <http://www.wlf.louisiana.gov/news/28921> (accessed August 30, 2017).

6-18
[LDWF] Louisiana Department of Wildlife and Fisheries. 2017a. 2015–2016 Annual Report. Baton Rouge, LA: LDWF. Undated. 144 p. Available at <http://www.wlf.louisiana.gov/sites/default/files/pdf/page/37777-annual-report/2015-2016annualreportlow-res1.pdf> (accessed December 11, 2017).
[LDWF] Louisiana Department of Wildlife and Fisheries. 2017b. “Explanation of Endangered Species Rankings.” Available at <http://www.wlf.louisiana.gov/wildlife/explanation-endangered-species-rankings> (accessed July 3, 2017).
[LDWF] Louisiana Department of Wildlife and Fisheries. 2017c. “Natural Areas Registry Program.” Available at <http://www.wlf.louisiana.gov/wildlife/natural-areas-registry-program> (accessed August 30, 2017).
[LDWF] Louisiana Department of Wildlife and Fisheries. 2017d. Species by Parish List. Available at <http://www.wlf.louisiana.gov/wildlife/species-parish-list> (accessed July 3, 2017).
Louisiana Division of Administration. Undated. Population Projections of Louisiana Parishes through 2030. 23 p. Available at <http://louisiana.gov/PopProjections/ExcelFiles/ LA%20Projections%20Technical%20Report.pdf> (accessed May 2017)
[LGS] Louisiana Geological Survey. 2001. Earthquakes in Louisiana. Public Information Series No. 7. June 2001. Available at <https://biotech.law.lsu.edu/blog/7earthquakes.pdf> (accessed September 21, 2017).
[LNHP] Louisiana Natural Heritage Program. 2017. Species by Parish List: West Feliciana Parish. Available at <http://www.wlf.louisiana.gov/wildlife/species-parish-list?tid=274&type_1=All> (accessed August 29, 2017).
[LOCD] Louisiana Office of Cultural Development. 2011. Our Places, Our Heritage: A Plan for Historic Preservation and Archaeological Conservation in Louisiana, 2011–2015. Baton Rouge, LA: LOCD. January 2011. 42 p. Available at <http://www.crt.state.la.us/Assets/OCD/hp/SHPO/SHPO_Jan_2011.pdf> (accessed November 30, 2017).
[LOCD] Louisiana Office of Cultural Development. 2017. “Division of Historic Preservation—National Register. Available at <http://www.crt.state.la.us/cultural-development/historic-preservation/national-register/index> (accessed November 30, 2017).
[LOPH] Louisiana Office of Public Health. 2013. Epidemiology Manual—Infectious Diseases—Meningo-Encephalitis Due to Free Living Amebas Annual Report. Baton Rouge, LA: LDH. 11 p. Available at <http://new.dhh.louisiana.gov/assets/oph/Center-PHCH/Center-CH/infectious-epi/Annuals/AmebaFreeLivingEncephalitis_LaIDAnnual.pdf> (accessed December 18, 2017).
[LTC] Louisiana Tax Commission. 2017. Louisiana Tax Commission Annual Report 2016. Available at <http://www.latax.state.la.us/Menu_AnnualReports/AnnualReports.aspx> (accessed May 2017).
Magnuson–Stevens Fishery Conservation and Management Act, as amended. 16 U.S.C. § 1801 et seq.
Mannouris C., Byers D.L. 2013. The impact of habitat fragmentation on fitness-related traits in a native prairie plant, Chamaecrista fasciculata (Fabaceae). Biological Journal of the Linnean Society 108(1):55–67.
6-19
McFarland D.G., Nelson L.S., Grodowitz M.J., Smart R.M., Owens C.S. 2004. Salvinia molesta D. S. Mitchell (Giant Salvinia) in the United States: A review of species ecology and approaches to management. Jacksonville, FL: U.S. Army Corps of Engineers Aquatic Plant Control Research Program. ERDC/EL SR-04-2. June 2004. 42 p. Available at <http://hdl.handle.net/11681/3301> (accessed March 22, 2018).
Mendelsohn M., Lowder T., Canavan B. 2012. Utility-Scale Concentrating Solar Power and Photovoltaics Projects: A Technology and Market Overview. Golden, CO: National Renewable Energy Laboratory. NREL/TP–6A20–51137. April 2012. 65 p. Available at <http://www.nrel.gov/docs/fy12osti/51137.pdf> (accessed January 3, 2018).
Michaels T. 2010. The 2010 ERC Directory of Waste-to-Energy Plants. Washington, DC: Energy Recovery Council. November 12, 2010. 32 p. Available at <http://www.seas.columbia.edu/earth/wtert/sofos/ERC_2010_Directory.pdf> (accessed January 26, 2018).
Michaels T. 2014. The 2014 ERC Directory of Waste-to-Energy Plants. Washington, DC: Energy Recovery Council. May 2014. 72 p. Available at <http://energyrecoverycouncil.org/wp-content/uploads/2016/01/ERC_2014_Directory.pdf> (accessed January 26, 2018).
Michaels T. 2016. Energy Recovery Council 2016 ERC Directory of Waste-to-Energy Facilities. Washington, DC: Energy Recovery Council. May 2014. 72 p. Available at <http://energyrecoverycouncil.org/wp-content/uploads/2016/06/ERC-2016-directory.pdf> (accessed January 26, 2018).
[MMNS] Mississippi Museum of Natural Science. 2017. “University of Alabama Ichthyological Collection.” Accessed through the Fishnet2 Portal. Available at <http://www.fishnet2.net/search.aspx> (accessed September 18, 2017).
Marine Mammal Protection Act of 1972, as amended. 16 U.S.C. § 1361 et seq.
[MODNR] Missouri Department of Natural Resources. 2014. The New Madrid Seismic Zone. Division of Geology and Land Survey Fact Sheet Number 26, Pub 2465. November, 2016. Available at <http://www.dnr.mo.gov/pubs/pub2465.pdf> (accessed September 21, 2017).
Moore B.C., Martinez E., Gay J.M., Rice D.H. 2003. Survival of Salmonella enterica in freshwater and sediments and transmission by the aquatic midge Chironomus tentans (Chironomidae: Diptera). Applied and Environmental Microbiology 69(8):4556–4560.
[MRC] Mississippi River Commission. 2016. “Mississippi River Commission.” Available at <http://www.mvd.usace.army.mil/About/Mississippi-River-Commission-MRC/> (accessed December 12, 2016).
[NASA] National Aeronautics and Space Administration. 2017. “NASA, NOAA Data Show 2016 Warmest Year on Record Globally.” January 18, 2017. Available at <https://www.nasa.gov/press-release/nasa-noaa-data-show-2016-warmest-year-on-record-globally> (accessed September 28, 2017).
Nasreen, M. 2003. The Effect of Faults upon Ground Water Flow in the Baton Rouge Fault System. University of New Orleans Theses and Dissertations 54. Available at <http://www.dnr.louisiana.gov/assets/OC/env_div/gw_res/ENV2012_01_01/UNO_REPORT_20031219.PDF> (accessed October 16, 2017).

6-20
[NASS] National Agricultural Statistics Service. 2014. “2012 Census of Agriculture,” Volume 1, Chapter 2, Parish and County Level, Table 7. “Hired Farm Labor – Workers and Payroll: 2012.” May 16, 2017. Available at <http://www.agcensus.usda.gov/Publications/2012/Full_Report/Census_by_State/> (accessed January 2018).
National Environmental Policy Act of 1969, as amended. 42 U.S.C. § 4321 et seq.
National Historic Preservation Act, as amended. 54 U.S.C. § 300101 et seq.
National Research Council. 2008. Mississippi River Water Quality and the Clean Water Act: Progress, Challenges, and Opportunities. Washington, DC: The National Academies Press. 252 p. Available at <https://www.nap.edu/catalog/12051/mississippi-river-water-quality-and-the-clean-water-act-progress> (accessed November 13, 2017)
[NCES] National Center for Education Statistics. 2018a. “College Navigator.” U.S. Department of Education, Washington, D.C.. Database search: College and university student population within 50 miles of ZIP code 70775. July 2017. Available at <http://nces.ed.gov/collegenavigator/default.aspx> (accessed January 2018).
[NCES] National Center for Education Statistics. 2018b. “Search for Public School Districts.” Database search: West Feliciana Parish Public School Districts; 2014–2015, 2015–2016 school years. Available at <http://nces.ed.gov/ccd/districtsearch/> (accessed January 2018).
NatureServe. 2016. “NatureServe Explorer: An online encyclopedia of life.” Version 7.1. NatureServe, Arlington, Virginia. Database search: Polyodon spathula. Updated November 2016. Available at <http://explorer.natureserve.org/servlet/NatureServe?searchName=Polyodon%20spathula> (accessed July 2, 2017).
Nature Conservancy. 2017. “Louisiana: Mary Ann Brown Preserve.” Available at <https://www.nature.org/ourinitiatives/regions/northamerica/unitedstates/louisiana/placesweprotect/mary-ann-brown-preserve.xml> (accessed August 23, 2017).
[NCDC] National Climatic Data Center. 2012. 2012 Local Climatological Data Annual Summary with Comparative Data, Baton Rouge, Louisiana (KBTR). Asheville, NC: NCDC. 8 p. Available at <https://www.ncdc.noaa.gov/IPS/lcd/lcd.html> (accessed December 7, 2017).
[NCDC] National Climatic Data Center. 2013. 2013 Local Climatological Data Annual Summary with Comparative Data, Baton Rouge, Louisiana (KBTR). Asheville, NC: NCDC. 8 p. Available at <https://www.ncdc.noaa.gov/IPS/lcd/lcd.html> (accessed December 7, 2017).
[NCDC] National Climatic Data Center. 2014. 2014 Local Climatological Data Annual Summary with Comparative Data, Baton Rouge, Louisiana (KBTR). Asheville, NC: NCDC. 8 p. Available at <https://www.ncdc.noaa.gov/IPS/lcd/lcd.html> (accessed December 7, 2017).
[NCDC] National Climatic Data Center. 2015. 2015 Local Climatological Data Annual Summary with Comparative Data, Baton Rouge, Louisiana (KBTR). Asheville, NC: NCDC. 8 p. Available at <https://www.ncdc.noaa.gov/IPS/lcd/lcd.html> (accessed December 7, 2017).
[NCDC] National Climatic Data Center. 2016. 2016 Local Climatological Data Annual Summary with Comparative Data, Baton Rouge, Louisiana (KBTR). Asheville, NC: NCDC. 8 p. Available at <https://www.ncdc.noaa.gov/IPS/lcd/lcd.html> (accessed December 7, 2017).
[NCDC] National Climatic Data Center. 2017. “Storms Events Database” Database search: Louisiana, West Feliciana Parish, 01/1950–12/2016. Available at <https://www.ncdc.noaa.gov/stormevents/choosedates.jsp?statefips=22%2CLOUISIANA> (accessed October 13, 2017).

6-21
Neuman R.W., Hawkins, N.W. 1993. Louisiana Prehistory. Louisiana Archaeological Survey and Antiquities Commission. Second Edition. Available at http://www.crt.state.la.us/dataprojects/archaeology/virtualbooks/LAPREHIS/LAPRE.HTM (accessed November 30, 2017).
[NEI] Nuclear Energy Institute. 2007. Industry Ground Water Protection Initiative—Final Guidance Document. NEI 07-07 [Final]. Washington, DC: NEI. August 2007. ADAMS Accession No. ML072610036.
[NETL] National Energy Technology Laboratory. 2007. Natural Gas Combined-Cycle Plant. 4 p. Available at <http://www.netl.doe.gov/KMD/cds/disk50/NGCC%20Plant%20Case_FClass_051607.pdf> (accessed October 1, 2017).
[NETL] National Energy Technology Laboratory. 2010a. Life Cycle Analysis: Natural Gas Combined Cycle (NGCC) Power Plant. DOE/NETL-403-110509. September 30, 2010. 151 p. Available at <https://www.netl.doe.gov/File%20Library/Research/Energy%20Analysis/Life%20Cycle%20Analysis/NGCC-LCA-Final-Report---Report---9-30-10---Final---Rev-2.pdf> (accessed November 21, 2017).
[NETL] National Energy Technology Laboratory. 2010b. Life Cycle Analysis: Supercritical Pulverized Coal (SCPC) Power Plant. DOE/NETL-403-110609. September 30, 2010. 108 p. Available at <https://www.netl.doe.gov/File%20Library/Research/Energy%20Analysis/Life%20Cycle%20Analysis/SCPC-LCA-Final-Report---Report---9-30-10---Final---Rev-1.pdf> (accessed November 21, 2017).
[NETL] National Energy Technology Laboratory. 2013. Cost and Performance Baseline for Fossil Energy Plants, Volume 1: Bituminous Coal and Natural Gas to Electricity. Revision 2a. DOE/NETL–2010/1397. September 2013. 626 p. Available at <http://www.netl.doe.gov/ File%20Library/research/energy%20analysis/publications/BitBase_FinRep_Rev2.pdf> (accessed October 2, 2017).
[NIEHS] National Institute of Environmental Health Sciences. 1999 “NIEHS Report on Health Effects from Exposure to Power Line Frequency and Electric and Magnetic Fields.” Publication Number 99-4493, Research Triangle Park, North Carolina.
[NHEERL] National Health and Environmental Effects Research Laboratory. 2011. Level III Ecoregions of the Continental United States. Washington, DC: U.S. Environmental Protection Agency. December 2011.Available at <http://training.fws.gov/courses/csp/csp3200/resources/documents/Eco_Level_III.pdf> (accessed August 23, 2017).
[NMFS] National Marine Fisheries Service. 2013. Biological Opinion for Continued Operation of Indian Point Nuclear Generating Unit Nos. 2 and 3. January 30, 2013. ADAMS Accession No. ML14202A146.
[NMFS] National Marine Fisheries Service. 2014. Biological Opinion for Continued Operation of Salem and Hope Creek Nuclear Generating Stations. July 17, 2014. ADAMS Accession No. ML13032A569.

6-22
[NOAA] National Oceanic and Atmospheric Administration. 2013a. Regional Climate Trends and Scenarios for the U.S. National Climate Assessment, Part 2. Climate of the Southeast. NOAA Technical Report NESDID 142-2. Washington, DC: NOAA. January 2013. 103 p. Available at <https://www.nesdis.noaa.gov/content/technical-reports> (accessed November 23, 2017).
[NOAA] National Oceanic and Atmospheric Administration. 2013b. Regional Climate Trends and Scenarios for the U.S. National Climate Assessment, Part 9 Climate of the Contiguous United States. NOAA Technical Report NESDID 142-9. Washington, DC: NOAA. January 2013. 85 p. Available at <https://www.nesdis.noaa.gov/content/technical-reports> (accessed November 23, 2017).
[NOAA] National Oceanic and Atmospheric Administration. 2017. “NOAA National Centers for Environmental Information, Climate at a Glance, Time Series.” Average annual temperature and precipitation, climate division 6. Available at <https://www.ncdc.noaa.gov/cag/> (accessed September 28, 2017).
[NRC] U.S. Nuclear Regulatory Commission. 1985. Entergy Louisiana, LLC, and Entergy Operations, Inc., Docket No. 50-458, River Bend Station, Unit 1, Facility Operating License. November 20, 1985. ADAMS Accession No. ML053110037.
[NRC] U.S. Nuclear Regulatory Commission. 1996. Generic Environmental Impact Statement for License Renewal of Nuclear Plants, Final Report. Washington, DC: NRC. NUREG–1437, Volumes 1 and 2. May 31, 1996. 1,204 p. ADAMS Accession Nos. ML040690705 and ML040690738.
[NRC] U.S. Nuclear Regulatory Commission. 1997. Regulatory Analysis Technical Evaluation Handbook. Washington, DC: NRC. NUREG/BR–0184. January 1997. 308 p. ADAMS Accession No. ML050190193.
[NRC] U.S. Nuclear Regulatory Commission. 1999. Section 6.3–Transportation, Table 9.1, Summary of findings on NEPA issues for license renewal of nuclear power plants. In: Generic Environmental Impact Statement for License Renewal of Nuclear Plants. Washington, DC: NRC. NUREG–1437, Volume 1, Addendum 1. August 1999. ADAMS Accession No. ML040690720.
[NRC] U.S. Nuclear Regulatory Commission. 2002. Final Generic Environmental Impact Statement on Decommissioning of Nuclear Facilities: Supplement 1, Regarding the Decommissioning of Nuclear Power Reactors. Washington, DC: NRC. NUREG–0586, Volumes 1 and 2. November 30, 2002. 516 p. ADAMS Accession Nos. ML023470327, ML023500228, and ML023500295.
[NRC] U.S. Nuclear Regulatory Commission. 2006. Backgrounder: Tritium, Radiation Protection Limits, and Drinking Water Standards. Washington, DC: NRC. July 31, 2006. 7 p. ADAMS Accession No. ML062020079. Also available on the NRC public webstie at <https://www.nrc.gov/reading-rm/doc-collections/fact-sheets/tritium-radiation-fs.html> (accessed November 6, 2017)
[NRC] U.S. Nuclear Regulatory Commission. 2013a. Event Report Guidelines: 10 CFR 50.72 and 50.73. Revision 3. Washington, DC: NRC. NUREG–1022. January 31, 2013. 107 p. ADAMS Accession No. ML13032A220.
[NRC] U.S. Nuclear Regulatory Commission. 2013b. Generic Environmental Impact Statement for License Renewal of Nuclear Plants. Revision 1. Washington, DC: NRC. NUREG–1437, Volumes 1, 2, and 3. June 30, 2013. 1,535 p. ADAMS Accession Nos. ML13106A241, ML13106A242, and ML13106A244.

6-23
[NRC] U.S. Nuclear Regulatory Commission. 2013c. Standard Review Plans for Environmental Reviews for Nuclear Power Plants, Supplement 1: Operating License Renewal. Revision 1. Washington, DC: NRC. NUREG–1555. June 30, 2013. 325 p. ADAMS Accession No. ML13106A246.
[NRC] U.S. Nuclear Regulatory Commission. 2014a. Generic Environmental Impact Statement for Continued Storage of Spent Nuclear Fuel. Washington, DC: NRC, Office of Nuclear Material Safety and Safeguards. NUREG–2157, Volumes 1 and 2. September 2014. ADAMS Accession Nos. ML14196A105 and ML14196A107.
[NRC] U.S. Nuclear Regulatory Commission. 2014b. Generic Environmental Impact Statement for License Renewal of Nuclear Plants, Supplement 50, Regarding Grand Gulf Nuclear Station, Unit 1. Final Report. Washington, DC: NRC. November 2014. 449 p. ADAMS Accession No. ML14328A171.
[NRC] U.S. Nuclear Regulatory Commission. 2014c. Generic Environmental Impact Statement for License Renewal of Nuclear Plants, Supplement 51, Regarding Callaway Plant, Unit 1. Final Report. Washington, DC: NRC. October 2014. 613 p. ADAMS Accession No. ML14289A140.
[NRC] U.S. Nuclear Regulatory Commission. 2014d. Probabilistic Seismic Hazard Analysis: Background Information. Washington, DC: NRC. May 20, 2014. 6 p. ADAMS Accession No. ML14140A648.
[NRC] U.S. Nuclear Regulatory Commission. 2015. Reassessment of NRC’s Dollar per Person-Rem Conversion Factor Policy (Draft Report for Comment). NUREG–1530, Revision 1. Washington, DC. August 2015. ADAMS Accession No. ML15237A211.
[NRC] U.S. Nuclear Regulatory Commission. 2016a. Conversation Record for July 26, 2016 Conversation Between R. Hartman, Fishery Biologist, National Marine Fisheries Service, and B. Grange, Biologist, NRC. July 27, 2016. ADAMS Accession No. ML16209A351.
[NRC] U.S. Nuclear Regulatory Commission. 2016b. Email from B. Grange, NRC, to R. Hartman, National Marine Fisheries Service. Subject: No adverse effects to EFH for Waterford Unit 3 proposed license renewal. July 26, 2016. ADAMS Accession No. ML16209A330.
[NRC] U.S. Nuclear Regulatory Commission. 2016c. River Bend Station – NRC Integrated Inspection Report 05000458/2015004. February 10, 2016. ADAMS Accession No. ML16041A493.
[NRC] U.S. Nuclear Regulatory Commission. 2016d. Memorandum and Order, Entergy Nuclear Operations, Inc. (Indian Point, Units 2 and 3), CLI-16-07, 83 NRC 293 (2016). May 4, 2016. Accessible at ADAMS No. ML16125A150.
[NRC] U.S. Nuclear Regulatory Commission. 2017a. Biological Evaluation of Impacts to Federally Listed Species under the U.S. Fish and Wildlife’s Jurisdiction, Waterford Steam Electric Station, Unit 3, Proposed License Renewal. Washington, DC: NRC. June 2017. 48 p. ADAMS Accession No. ML17163A185.
[NRC] U.S. Nuclear Regulatory Commission. 2017b. “Design Certification Application–NuScale.” Available at <https://www.nrc.gov/reactors/new-reactors/design-cert/nuscale.html> (accessed November 8, 2017).
[NRC] U.S. Nuclear Regulatory Commission. 2017c. Letter from B. Beasley to R. Nelson, Advisory Council on Historic Preservation. Subject: Request for scoping comments and notifications of Section 106 review. September 15, 2017. ADAMS Accession No. ML17255A036.

6-24
[NRC] U.S. Nuclear Regulatory Commission. 2017d. Letter from B. Beasley to P. Boggan, Louisiana Office of Cultural Development. Subject: Request for scoping comments and notifications of Section 106 review. September 15, 2017. ADAMS Accession No. ML17255A051.
[NRC] U.S. Nuclear Regulatory Commission. 2017e. Letters from B. Beasley to Federally-recognized Tribes. Subject: Request for scoping comments and notifications of Section 106 review. September 15, 2017. ADAMS Accession No. ML17255A024.
[NRC] U.S. Nuclear Regulatory Commission. 2017f. Letter from E. Oesterle to W. Maguire, Site Vice President, River Bend Station. Subject: River Bend Station, Unit 1 – Summary of the License Renewal Application Review Severe Accident Mitigation Alternative Site Audit. December 6, 2017. ADAMS Accession No. ML17324A506.
[NRC] U.S. Nuclear Regulatory Commission. 2017g. Letter from E. Oesterle to W. Maguire, Site Vice President, River Bend Station. Subject: River Bend Station, Unit 1 - Summary of the License Renewal Environmental Audit. November 27, 2017. ADAMS Accession No. ML17319A503.
[NRC] U.S. Nuclear Regulatory Commission. 2017h. Letter from G, Wilson to W. Maguire, Site Vice President, River Bend Station. Subject: River Bend Station, Unit 1 License Renewal Application – Supplemental Information Needed for Acceptance of Requested Licensing Action. July 10, 2017. ADAMS Accession No. ML17186A159.
[NRC] U.S. Nuclear Regulatory Commission. 2017i. Occupational Radiation Exposure at Commercial Nuclear Power Reactors and Other Facilities 2015: Forty Eighth Annual Report. Washington, DC: NRC. NUREG–0713, Volume 37, September 2017. ADAMS Accession No. ML17254A029.
[NRC] U.S. Nuclear Regulatory Commission. 2017k. “Radioactive Effluent and Environmental Reports.” Available at <http://www.nrc.gov/reactors/operating/ops-experience/tritium/plant-info.html> (accessed November 7, 2017).
[NRC] U.S. Nuclear Regulatory Commission. 2017m. “River Bend Station, Unit 3 Application.” Available at <https://www.nrc.gov/reactors/new-reactors/col/river-bend.html> (accessed November 6, 2017).
[NRC] U.S. Nuclear Regulatory Commission. 2018a. Letter from B. Beasley to W. Maguire, Site Vice President, River Bend Station. Subject: River Bend Station, Unit 1 – Issuance of Scoping Summary Report Associated with License Renewal Application Environmental Review. April XX, 2018. ADAMS Accession No. ML17362A554.
[NRC] U.S. Nuclear Regulatory Commission. 2018b. Teleconference Summary between Michelle Moser, NRC, and Raoult Ratard, LPH, regarding Thermophilic Organisms Related to the Operation of River Bend Station for the Environmental Review of the River Bend Station License Renewal Application. ADAMS Accession No. ML18008A076.
[NREL] National Renewal Energy Laboratory. 2003. Biopower Technical Assessment: State of the Industry and Technology. Golden, CO: NREL. NREL/TP-510-33123. March 2003. 277 p. Available at <https://www.nrel.gov/docs/fy03osti/33123.pdf> (accessed November 21, 2017).
[NREL] National Renewal Energy Laboratory. 1997. The Environmental Costs and Benefits of Biomass Energy Use in California. Berkeley, CA: NREL. NREL/SR-430-22765. May 1997. 43 p. Available at <https://www.nrel.gov/docs/legosti/old/22765.pdf> (accessed November 21, 2017).

6-25
[NREL] National Renewable Energy Laboratory. 2005. Comparing Statewide Economic Impacts of New Generation from Wind, Coal, and Natural Gas in Arizona, Colorado, and Michigan. Golden, CO: NREL. NREL/CP-500-38154. August 2005. 33 p. Available at <https://www.nrel.gov/docs/fy05osti/38154.pdf> (accessed November 21, 2017).
[NREL] National Renewable Energy Laboratory. 2011. A Review of Operational Water Consumption and Withdrawal Factors for Electricity Generating Technologies. Golden, CO: NREL. NREL/TP–6A20–50900. March 2011. 29 p. Available at <http://www.nrel.gov/docs/fy11osti/50900.pdf> (accessed November 13, 2017).
[NREL] National Renewable Energy Laboratory. 2014. “Concentrating Solar Power Projects in the United States.” Available at <http://www.nrel.gov/csp/solarpaces/by_country_detail.cfm/country=US> (accessed 24 January 2018).
[NREL] National Renewable Energy Laboratory. 2015. 2014–2015 Offshore Wind Technologies Market Report. NREL/TP–5000–64283. September 2015. Available at <http://www.nrel.gov/docs/fy15osti/64283.pdf> (accessed 30 November 2017).
[NREL] National Renewable Energy Laboratory. 2017. “Dynamic Maps, GIS Data, and Analysis Tools—Solar Maps.” February 2, 2015. Available at <http://www.nrel.gov/gis/solar.html> (accessed December 17, 2017).
[NRR] Natural Resource Report. 2010. Federal Land Managers’ Air Quality Related Values Work Group (FLAG). NPS/NRPC/NRR-2010/232. October 2010. Available at <https://www.nature.nps.gov/air/Pubs/pdf/flag/FLAG_2010.pdf> (accessed 20 October 2017).
[NuScale] NuScale Power, LLC. 2018. “NuScale FAQs.” Available at <http://www.nuscalepower.com/about-us/faqs#p1a5> (accessed February 9, 2018).
Occupational Safety and Health Act of 1970, as amended. 29 U.S.C. § 651 et seq.
[ORNL] Oak Ridge National Laboratory. 2012. An Assessment of Energy Potential at Non-Powered Dams in the United States. Oak Ridge, TN: ORNL. April 2012. 44 p. Available at <http://www1.eere.energy.gov/water/pdfs/npd_report.pdf> (accessed November 30, 2017).
Oscar T.P. 2009. Predictive model for survival and growth of Salmonella typhimurium DT104 on chicken skin during temperature abuse. Journal of Food Protection 72(2):304–314.
[OSHA] Occupational Safety and Health Administration. 1999. OSHA Technical Manual (OTM). Section III: Chapter 7, “Legionnaires’ Disease.” Available at <https://www.osha.gov/dts/osta/otm/otm_iii/otm_iii_7.html> (accessed December 18, 2017).
Pair, J.D. 2017. The Tuscaloosa Marine Shale: Geologic History, Depositional Analysis, and Exploration Potential. Electronic Theses and Dissertations 68. Available at <http://scholarworks.sfasu.edu/cgi/viewcontent.cgi?article=1074&context=etds> (accessed September 20, 2017).
[PEI] Power Engineering International. 2017. “South Korea fuel cell plant comes online”. Available at <http://www.powerengineeringint.com/articles/2017/03/south-korea-fuel-cell-chp-plant-comes-online.html> (accessed January 28, 2018).
[PHAC] Public Health Agency of Canada. 2010. “Pathogen Safety Data Sheets—Shigella spp.” September 2010. Available at <https://www.canada.ca/en/public-health/services/laboratory-biosafety-biosecurity/pathogen-safety-data-sheets-risk-assessment/shigella.html> (accessed December 18, 2017).

6-26
Rabalais N.N., Turner R.E., Díaz R.J., Justić D. 2009. Global change and eutrophication of coastal waters. ICES Journal of Marine Science, 66:1528–1537.
Reed D., Wilson L. 2004. Coast 2050: A New Approach to Restoration of Louisiana Coastal Wetlands. Physical Geography, 25(1):4–21. Available at <http://labs.uno.edu/restoration/Reed%20and%20Wilson%202050.pdf> (accessed September 20, 2017).
Rivers and Harbors Appropriation Act of 1899, as amended. 33 U.S.C. § 403 Section 10.
Sargent B.P. 2012. Water Use in Louisiana, 2010. Baton Rouge, LA: Louisiana Department of Transportation and Development and U.S. Geological Survey. Water Resources Special Report No. 17. Revised December 2012. 145 p. Available at <https://la.water.usgs.gov/publications/pdfs/WaterUse2010.pdf> (accessed November 13, 2017).
Sharitz R.R., Mitsch W.J. 1993. Southern floodplain forests, P 311–372. In: Martin W.H., Boyce S.G., Echternacht A.C. Biodiversity of the Southeastern United States, Lowland Terrestrial Communities. John Wiley and Sons: New York, NY.
[SERC] Serc Reliability Corporation. 2016. SERC 2016 Information Summary Brochure. August 2016. Available at <https://serc1.org/docs/default-source/program-areas/reliability-assessment/reliability-assessments/2016-information-summary-brochure.pdf?sfvrsn=2> (accessed January 28, 2018).
Tao Z., Williams A., Huan H.C., Caughey M., Lian X.Z. 2007. Sensitivity of U.S. surface ozone to future emissions and climate changes. Geophysical Research Letters, 34(8). Available at <http://onlinelibrary.wiley.com/doi/10.1029/2007GL029455/abstract> (accessed December 5, 2017).
[TEEIC] Tribal Energy and Environmental Information Clearinghouse. Undated. “Utility-Scale and Direct Use Geothermal Energy Generation.” Available at <http://teeic.indianaffairs.gov/er/gethermal/restech/scale/index.htm> (accessed January 6, 2018).
Thuiller W. 2007. Biodiversity: Climate change and the ecologist. Nature 448:550–552.
Times Free Press. 2015. “Regulators Complete Inspections for New TVA Nuclear Unit.” October 17. Available at <http://www.timesfreepress.com/news/business/ aroundregion/story/2015/oct/17/regulators-complete-inspections-new-tvnuclear/331011/> (accessed September 15, 2017).
Todar K. 2004. Pseudomonas. In: Todar’s Online Textbook of Bacteriology. Available at <http://textbookofbacteriology.net/pseudomonas.html> (accessed December 18, 2017).
Toft J.D., Simenstad C.A., Cordell J.R., Grimaldo L.F. 2003. The effects of introduced water hyacinth on habitat structure, invertebrate assemblages, and fish diets. Estuaries 26(3):746–758.
Tyndall R.L., Ironside K.S., Metler P.L., Tan E.L., Hazen T.C., Fliermans C.B. 1989. Effect of thermal additions on the density and distribution of thermophilic amoebae and pathogenic Naegleria fowleri in a newly created cooling lake. Applied and Environmental Microbiology 55(3):722–732.
[UGA] University of Georgia. 2017. “Status of Invasives for Louisiana.” Available at <http://www.eddmaps.org/tools/statereport.cfm?id=us_la> (accessed August 31, 2017).
6-27
[USACE] U.S. Army Corps of Engineers. 2017a. Letter from M.S. Mayer, Chief, Regulatory Branch, New Orleans District, to W.F. Maguire, Entergy. Subject: (General Permit) GP-23, Department of the Army General Permit for Silt Removal in the Mississippi River. August 10, 2017. ADAMS Accession No. ML17353A067.
[USACE] U.S. Army Corps of Engineers. 2017b. “The Mississippi River.” Flood Control Plan, New Orleans District. Available at <http://www.mvn.usace.army.mil/Missions/Mississippi-River-Flood-Control/Mississippi-River-Tributaries/> (assessed on October 3, 2017).
[USCB] U.S. Census Bureau. 2017a. American FactFinder, “1970–2010 Decennial Census: 1900 to 1990,” Table DP-1, “Profile of General Demographic Characteristics: 2000,” and Table DP-1, “Profile of General Population and Housing Characteristics: 2010, 2010 Demographic Profile Data,” for East Baton Rouge and West Feliciana Parishes. Available at <http://factfinder.census.gov/faces/nav/jsf/pages/searchresults.xhtml?refresh=t> (accessed December 2017).
[USCB] U.S. Census Bureau. 2017b. American FactFinder, “2011-2015 American Community Survey 5-Year Estimates,” Table B25001, “Housing Units” and Table B25004, “Vacancy Status,” for parishes within 50-mile radius of RBS. Available at <http://factfinder.census.gov/faces/nav/jsf/pages/searchresults.xhtml?refresh=t> (accessed December 2017).
[USCB] U.S. Census Bureau. 2017c. American FactFinder, “2011–2015 American Community Survey 5-Year Estimates,” Table DP03, “Selected Economic Characteristics,”for East Baton Rouge and West Feliciana Parishes. Available at <http://factfinder.census.gov/faces/nav/jsf/pages/searchresults.xhtml?refresh=t> (accessed December 2017).
[USCB] U.S. Census Bureau. 2017d. American FactFinder, “2011-2015 American Community Survey 5-Year Estimates,” Table DP04, “Selected Housing Characteristics” for East Baton Rouge and West Feliciana Parishes. Available at <http://factfinder.census.gov/faces/nav/jsf/pages/searchresults.xhtml?refresh=t> (accessed December 2017).
[USCB] U.S. Census Bureau. 2017e. American FactFinder, “2011-2015 American Community Survey 5-Year Estimates,” Table DP05, “ACS Demographic and Housing Estimates” for East Baton Rouge and West Feliciana Parishes. Available at <http://factfinder.census.gov/faces/nav/jsf/pages/searchresults.xhtml?refresh=t> (accessed December 2017).
[USDA] U.S. Department of Agriculture. 2012. Census of Agriculture Volume 1 - Geographic Area Series - Part 18. Washington, DC: USDA. AC-12-A-18. May 2014. 719 p. Available at <https://www.agcensus.usda.gov/Publications/2012/Full_Report/Volume_1,_Chapter_2_County_Level/Louisiana/lav1.pdf> (accessed August 22, 2017).
[USDA] U.S. Department of Agriculture. 2017. “Custom Soil Resource Report for West Feliciana Parish, Louisiana River Bend LA.” June 20, 2017. Available at <http://websoilsurvey.nrcs.usda.gov/app/WebSoilSurvey.aspx> (accessed September 12, 2017).
[USGCRP] U.S. Global Change Research Program. 2009. Global Climate Change Impacts in the United States. New York, NY: NOAA National Climatic Data Center. June 2009. 196 p. Available at <https://downloads.globalchange.gov/usimpacts/pdfs/climate-impacts-report.pdf> (accessed March 22, 2018).

6-28
[USGCRP] U.S. Global Change Research Program. 2014. Climate Change Impacts in the United States: The Third National Climate Assessment. Washington, DC: Federal National Climate Assessment and Development Advisory Committee. doi:10.7930/J0Z31WJ2. May 2014. Revised October 2014. 841 p. Available at <http://s3.amazonaws.com/nca2014/high/NCA3_Climate_Change_Impacts_in_the_United%20States_HighRes.pdf> (accessed March 22, 2018).
[USGCRP] U.S. Global Change Research Program. 2017. Climate Science Special Report: Fourth National Climate Assessment, Volume 1. Washington, DC: USGCRP. doi:10.7930/J0J964J6. 2017. 477 p. Available at <https://science2017.globalchange.gov> (accessed November 27, 2017).
[USGS] U.S. Geological Survey. 2004. Louisiana Ground-Water Map No. 20, Potentiometric Surface of the “2,000-foot” Sand of the Baton Rouge area, Louisiana, Investigations Map 2872 Plates 1 and 2. May 2002: Available at http://pubs.er.usgs.gov/publication/sim2872 (accessed September 20, 2017).
[USGS] U.S. Geological Survey. 2008. Assessment of Moderate- and High-Temperature Geothermal Resources of the United States. Menlo Park, CA: USGS. Fact Sheet 2008–3082. 2008. 4 p. Available at <http://pubs.usgs.gov/fs/2008/3082/pdf/fs2008-3082.pdf> (accessed January 13, 2018).
[USGS] U.S. Geological Survey. 2012. Assessment of Undiscovered Oil and Gas Resources in Conventional and Continuous Petroleum Systems in the Upper Cretaceous Eagle Ford Group, U.S. Gulf Coast Region, 2011. Menlo Park, CA: USGS. Fact Sheet 2012–3003. February 2012. 2 p. Available at <https://pubs.usgs.gov/fs/2012/3003/FS12-3003.pdf> (accessed September 21, 2017).
[USGS] U.S. Geological Survey. 2013. Simulation of Groundwater Flow in the “1,500-Foot” Sand and “2,000-Foot” Sand and Movement of Saltwater in the “2,000-Foot” Sand of the Baton Rouge Area, Louisiana. Reston, VA: USGS. Open-File Report 2013–1153. 2013. 79 p. Available at <https://pubs.usgs.gov/of/2013/1153/OFR_2013-1153.pdf> (accessed 17 July 2017).
[USGS] U.S. Geological Survey. 2014a. Water-Data Report 2013, 07295100 Mississippi River at Tarbert Landing, MS, Lower Mississippi-Natchez Basin Lower Mississippi-Natchez Subbasin. Available at <https://wdr.water.usgs.gov/wy2013/pdfs/07295100.2013.pdf> (accessed October 20, 2017).
[USGS] U.S. Geological Survey. 2014b. Water Resources of West Feliciana Parish, Louisiana. Fact Sheet 2014–3039. August 2014. 6 p. Available at <https://pubs.usgs.gov/fs/2014/3039/pdf/fs2014-3039.pdf> (accessed July 3, 2017).
[USGS] U.S. Geological Survey. 2015. Water Resources of East Baton Rouge Parish, Louisiana. Fact Sheet 2015–3001. May 2015. Available at <https://pubs.usgs.gov/fs/2015/3001/pdf/fs2015_3001.pdf> (accessed October 16, 2017).
[USGS] U.S. Geological Survey. 2016. “USGS Water-Year Summary 2016, 07374000 Mississippi River at Baton Rouge, LA.” Available at <http://waterdata.usgs.gov/nwis/wys_rpt/?site_no=07374000&agency_cd=USGS> (accessed October 20, 2017).
[USGS] U.S. Geological Survey. 2017a. “Campostoma anomalum.” USGS Nonindigenous Aquatic Species Database. January 26, 2017. Available at <https://nas.er.usgs.gov/queries/factsheet.aspx?SpeciesID=506> (accessed July 3, 2017).

6-29
[USGS] U.S. Geological Survey. 2017b. “Cyprinus carpio.” USGS Nonindigenous Aquatic Species Database. December 1, 2017. Available at <https://nas.er.usgs.gov/queries/FactSheet.aspx?SpeciesID=4> (accessed December 8, 2017).
[USGS] U.S. Geological Survey. 2017c. “Eichhornia crassipes.” USGS Nonindigenous Aquatic Species Database. December 1, 2017. Available at <https://nas.er.usgs.gov/queries/FactSheet.aspx?SpeciesID=1130> (accessed December 8, 2017).
[USGS] U.S. Geological Survey. 2017d. “Etheostoma caeruleum.” USGS Nonindigenous Aquatic Species Database. January 26, 2017. Available at <https://nas.er.usgs.gov/queries/FactSheet.aspx?speciesID=809> (accessed July 3, 2017).
[USGS] U.S. Geological Survey. 2017e. “Groundwater levels for Louisiana: National Water Information System Web Interface.” Monitor location USGS 305643091341201 WF-22D. August 2017. Available at <http://nwis.waterdata.usgs.gov/la/nwis/gwlevels> (accessed August 10, 2017).
[USGS] U.S. Geological Survey. 2017f. “Louisiana Water Use.” 2012–2014 Data Tables, by parish and basin. November 13, 2017. Available at <https://la.water.usgs.gov/WaterUse/data_table/parishTable.asp> (accessed November 13, 2017).
[USGS] U.S. Geological Survey. 2017g. “Tuscaloosa Marine Shale Assessment.” 2017. Available at <https://powellcenter.usgs.gov/tuscaloosa-marine-shale-assessment> (accessed September 21, 2017).
[USGS] U.S. Geological Survey. 2017h. “U.S. Geological Survey Water Resources Cooperative Program, Louisiana Water Use Program.” Available at <https://la.water.usgs.gov/WaterUse/default.asp> (accessed July 18, 2017).
[USGS] U.S. Geological Survey. 2017i. “USGS Surface-Water Annual Statistics for the Nation.” Site No. USGS 07374000 Mississippi River at Baton Rouge, LA [Discharge]. Available at <https://waterdata.usgs.gov/nwis/annual/?search_site_no=07374000&agency_cd=USGS&referred_module=sw&format=sites_selection_links> (accessed October 31, 2017).
[USGS] U.S. Geological Survey. 2017k. Water Resources of East Feliciana Parish, Louisiana. Fact Sheet 2016-3069. January 2017. Available at <https://pubs.usgs.gov/fs/2016/3069/fs20163069.pdf> (accessed October 16, 2017).
Van Kooten G. 2005. “Disturbances in the Delta: Understanding New Orleans’ Geology.” Calvin College, The Calvin Spark, Winter 2005. Available at <https://www.calvin.edu/publications/spark/2005/winter/neworleans2.htm> (accessed Setember 18, 2017).
Weakley A., Dinerstein E., Snodgrass R., Wolfe K. 2016. “Mississippi Lowland Forests.” Available at <http://www.worldwildlife.org/ecoregions/na0409> (accessed September 12, 2017).
[WFP] West Feliciana Parish Finance Department. 2016. “Adopted Budget Fiscal Year 2016–2017.” April 15, 2016. Available at <http://wfparish.org/ArchiveCenter/ViewFile/Item/49> (accessed January 2018).
[WFPZC] West Feliciana Planning and Zoning Commission. 2008. West Feliciana Parish Comprehensive Plan. Available at <http://westfelicianatogether.frego.com/documents/westfeliciana-comprehensive-plan.pdf> (accessed August 22, 2017).

6-30
Wiken E., Nava F.J., Griffith G. 2011. North American Terrestrial Ecoregions—Level III. Montreal, Canada: Commission for Environmental Cooperation. April 2011. Available at <http://www3.cec.org/islandora/en/item/10415-north-american-terrestrial-ecoregionslevel-iii-en.pdf> (accessed September 12, 2017).
Wilcove D.S., McLellan C.H., Dobson A.P. 1986. Habitat Fragmentation in the Temperate Zone. In: Soule M., ed. Conservation Biology: The Science of Scarcity and Diversity. Sunderland, MA: Sinauer Associates, Inc. 584 p.
Wu S., Mickley L.J., Leibensperger E.M., Jacob D.J., Rind D., Streets D.G. 2008. Effects of 2000–2050 global change on ozone air quality in the United States. Journal of Geophysical Research, Volume 113. Available at <http://onlinelibrary.wiley.com/doi/10.1029/2007JD008917/abstract> (accessed December 5, 2017).
Yuill B., Lavoie D., Reed D.J. 2009. Understanding subsidence processes in coastal Louisiana, Journal of Coastal Research, SI(54):23–36. Available at <http://www.jcronline.org/doi/pdf/10.2112/SI54-012.1> (accessed September 20, 2017).
Zhang Y., Wang Y. 2016. Climate-driven ground-level ozone extreme in the fall over the Southeast United States. Proceedings of the National Academy of Sciences of the United States of America, 133(36):10025–10030. Available at <http://www.pnas.org/content/113/36/10025.full> (accessed December 5, 2017).
Zou L., Kent J., Lam N., Cai H., Qiang Y., Li K. 2015. Evaluating land subsidence rates and their implications for land loss in the Lower Mississippi River Basin, Water 8(10). Available at <https://pdfs.semanticscholar.org/436a/446d9ee68dc01dc5b0694d572fca81865290.pdf> (accessed September 20, 2017).

7-1
7 LIST OF PREPARERS
Members of the U.S. Nuclear Regulatory Commission’s (NRC’s) Office of Nuclear Reactor Regulation (NRR) prepared this supplemental environmental impact statement with assistance from other NRC organizations and support from Pacific Northwest National Laboratory. Table 7-1 identifies each contributor’s name, affiliation, and function or expertise.
Table 7-1. List of Preparers
Name Education/Experience Function or Expertise NRC Staff (in alphabetical order) Benjamin Beasley M.S. Nuclear Engineering; B.S. Chemical
Engineering; 27 years of combined industry and Government experience including nuclear plant system analysis, risk analysis, and project management, with 13 years of management experience
Management Oversight
Jerry Dozier M.S. Reliability Engineering; M.B.A. Business Administration; B.S. Mechanical Engineering; 30 years of experience including operations, reliability engineering, technical reviews, and NRC branch management
Severe Accident Mitigation Alternative (SAMA)
David Drucker B.S. General Engineering M.S. Engineering Management 35 years of project and program management experience
Project Management
Kevin Folk M.S. Environmental Biology; B.A., Geoenvironmental Studies; 29 years of experience in NEPA compliance; geologic, hydrologic, and water quality impacts analysis; utility infrastructure analysis, environmental regulatory compliance; and water supply and wastewater discharge permitting
Cooling and Auxiliary Water Systems, Surface Water Resources
William Ford M.S. Geology; 46 years of combined industry and Government experience working on groundwater, surface water, and geology projects
Geology; Groundwater
Briana Grange B.S. Conservation Biology; 12 years of experience in environmental impact analysis, Section 7 consultations, and essential fish habitat consultations
Land Use and Visual Resources; Special Status Species and Habitats; Terrestrial Resources
Robert Hoffman B.S. Environmental Resource Management; 32 years of experience in NEPA compliance, environmental impact assessment, alternatives identification and development, and energy facility siting.
Alternatives; Historic and Cultural Resources; Cumulative impacts
Nancy Martinez B.S. Earth and Environmental Science; A.M. Earth and Planetary Science; 7 years of experience in environmental impact analysis
Greenhouse Gas Emissions and Climate Change; Air Quality, Meteorology, and Noise

7-2
Name Education/Experience Function or Expertise Michelle Moser M.S. Biological Sciences; B.S.
Environmental Sciences; 17 years of experience in ecological studies, environmental impact assessment, and protected resource management
Aquatic Resources and Microbiological Hazards
William Rautzen B.S. Health Physics; B.S. Industrial Hygiene; M.S. Health Physics; 8 years of experience in environmental impact analysis
Human health, radiological, and waste management
Jeffrey Rikhoff M.R.P. Regional Planning, M.S., Economic Development and Appropriate Technology; 38 years of combined industry and Government experience including 31 years of NEPA compliance, socioeconomics and environmental justice impact analyses, cultural resource impact assessments, consultations with American Indian tribes, and comprehensive land-use and development planning studies
Environmental Justice; Socioeconomics
PNNL Staff (in alphabetical order) Edward Schmidt M.S. Nuclear Engineering; B.S. Mechanical
Engineering; over 50 years of nuclear industry experience including 35 years of experience in performing, managing and reviewing Probabilistic Risk Assessments.
SAMA
Steve Short M.S. and B.S. Nuclear Engineering; MBA; over 30 years of nuclear industry experience including probabilistic risk assessment, life-cycle cost analysis, nuclear safety and accident consequence analysis, and decision analysis.
SAMA

8-1
8 LIST OF AGENCIES, ORGANIZATIONS, AND PERSONS TO WHOM COPIES OF THIS SEIS ARE SENT
Table 8-1. List of Agencies, Organizations, and Persons to Whom Copies of this SEIS Are Sent
Name and Title Affiliation and Address Mr. William Maguire, Site Vice President Entergy Operations, Inc.
River Bend Station 5485 US Highway 61N St. Francisville, LA 70775
Robert Houston, NEPA Section Chief USEPA – Region 6 Attn: Robert Houston 6EN - WS 1445 Ross Ave. Suite 1200 Dallas, TX 75202
Brad Schexnayder LA Department of Environmental Quality Office of Environmental Compliance Radiological Emergency Planning and Response P.O. Box 4312 Baton Rouge, LA 70821-4312
Ms. Melissa Darden, Chairman Chitimacha Tribe of Louisiana P.O. Box 661 Charenton, LA 70523
Kimberly Walden, THPO Chitimacha Tribe of Louisiana P.O. Box 661 Charenton, LA 70523
Mr. David Sickey, Chairman Coushatta Tribe of Louisiana P.O. Box 818 Elton, LA 70532
Linda Langley, THPO Coushatta Tribe of Louisiana P.O. Box 818 Elton, LA 70532
Ms. B. Cheryl Smith, Chief Jena Band of Choctaw Indians P.O. Box 14 Jena, LA 71342
Alina Shively, THPO Jena Band of Choctaw Indians P.O. Box 14 Jena, LA 71342
Mr. Joey P. Barbry, Chairman Tunica-Biloxi Tribe of Louisiana P.O. Box 1589 Marksville, LA 71351
Earl Barbry, Jr. THPO Tunica-Biloxi Tribe of Louisiana P.O. Box 1589 Marksville, LA 71351
Ms. Jo Ann Battise, Chairperson Alabama Coushatta Tribe of Texas 571 State Park Road 56 Livingston, TX 77351

8-2
Name and Title Affiliation and Address Bryant Celestine Alabama Coushatta Tribe of Texas
571 State Park Road 56 Livingston, TX 77351
Mr. Gary Batton, Chief The Choctaw Nation of Oklahoma P.O. Drawer 1210 Durant, OK 74702
Ian Thompson, THPO The Choctaw Nation of Oklahoma P.O. Drawer 1210 Durant, OK 74702
Ms. Phyliss J. Anderson, Chief Mississippi Band of Choctaw Indians P.O. Box 6010 Choctaw Branch Choctaw, MS 39350
Kenneth Carleton, THPO Mississippi Band of Choctaw Indians P.P. Box 6010 Choctaw Branch Choctaw, MS 39350
Mr. Gregory Chilcoat, Principal Chief The Seminole Nation of Oklahoma P.O. Box 1498 Wewoka, OK 74884
Theodore Isham The Seminole Nation of Oklahoma P.O. Box 1498 Wewoka, OK 74884
Mr. Marcellus W. Osceola, Chairman
Seminole Tribe of Florida 6300 Stirling Road Hollywood, FL 33024
Paul N. Backhouse, THPO Seminole Tribe of Florida 6300 Stirling Road Hollywood, FL 33024
Mr. Kevin Couhig, Parish President West Feliciana Parish P.O. Box 1843 St. Francisville, LA 70775 [email protected]
Mr. Phil Boggan, State Historic Preservation Officer
Louisiana Office of Cultural Development P.O. Box 44247 Baton Rouge, LA 70804-4247
Mr. Reid Nelson, Director Office of Federal Agency Programs Advisory Council on Historic Preservation 401 F Street NW, Suite 308 Washington, DC 20001-2637
Joseph Ranson, Field Supervisor U.S. Fish and Wildlife Service Louisiana Ecological Services Field Office 646 Cajundome Boulevard, Suite 400 Lafayette, LA 70506-4290 [email protected]
Amy Trahan, Fish and Wildlife Biologist U.S. Fish and Wildlife Service Louisiana Ecological Services Field Office 646 Cajundome Boulevard, Suite 400 Lafayette, LA 70506-4290 [email protected]

8-3
Name and Title Affiliation and Address Christa Clark Louisiana Department of Environmental Quality
Water Permits Division PO Box 4313 Baton Rouge, LA 70821-4313 [email protected]
Raoult Ratard MD, MPH & TM, FACPM State Epidemiologist
Louisiana Department of Health 1450 Poydras Street Suite 1652 New Orleans, LA 70112 [email protected]
JiYoung Wiley, Environmental Scientist LA Department of Environmental Quality Office of Environmental Compliance Radiological Emergency Planning and Response P.O. Box 4312 Baton Rouge, LA 70821-4312 [email protected]


9-1
9 INDEX
accidents, xxiv, xxv, 4-52, 7-2, F-3, F-5, F-7, F-11, F-14, F-15, F-17, F-18, F-19, F-29, F-31, F-39, F-42, F-45, F-46
Advisory Council on Historic Preservation (ACHP), xxiii, 1-7, 4-41, 4-42, 8-2, B-6, C-3, C-4
aesthetic, 3-115 alternatives, xix, xx, 1-5, 2-1, 2-3, 2-4, 2-5,
2-6, 2-9, 2-13, 2-17, 2-18, 2-20, 4-1, 4-5, 4-6, 4-7, 4-8, 4-9, 4-10, 4-11, 4-12, 4-15, 4-16, 4-20, 4-21, 4-22, 4-23, 4-24, 4-27, 4-28, 4-29, 4-30, 4-31, 4-32, 4-39, 4-40, 4-41, 4-43, 4-44, 4-45, 4-46, 4-49, 4-52, 4-59, 4-60, 4-64, 4-65, 4-66, 4-67, 4-68, 4-69, 4-70, 4-73, 4-92, 4-93, 4-94, 4-95, 5-1, 7-2, B-2, C-2, F-1, F-2, F-28, F-31, F-32, F-50
archaeological resources, 1-6, 3-95, 3-97, 4-42, 4-88
biocide, 3-45, 4-21 biological assessment, C-1, C-2 biota, 3-42, 3-80, 3-81, 3-89, 4-27, 4-29,
4-30, 4-31, 4-36, 4-87 boiling water reactor, xxiii, 2-1, 3-3, F-1, F-5,
F-8, F-14, F-25, F-26, F-50 chronic effects, 2-22, 4-51, 4-59 Clean Air Act (CAA), xxiii, 3-26, 3-27, 4-12,
4-13, 4-71, 4-92, B-3, B-8 closed-cycle cooling, xix, 2-7, 2-9, 2-10,
2-11, 2-12, 2-13, 3-3, 4-4, 4-20, 4-22 Coastal Zone Management Act (CZMA),
3-21, B-4, B-8 cold shock, 4-30 consumptive use, 3-41, 4-17, 4-18, 4-22,
4-26, 4-29, 4-79 cooling system, xviii, xix, xxiii, 1-4, 1-6, 2-7,
2-10, 2-11, 2-12, 2-13, 3-3, 3-4, 3-7, 3-8, 3-40, 3-41, 3-79, 3-112, 4-2, 4-3, 4-4, 4-21, 4-39, 4-57
core damage frequency (CDF), xxiii, 4-54, 4-56, F-1, F-2, F-3, F-5, F-8, F-9, F-10, F-11, F-12, F-13, F-14, F-15, F-16, F-17, F-18, F-19, F-22, F-27, F-31, F-33, F-34, F-36, F-37, F-38, F-39, F-40, F-41, F-42, F-43, F-46, F-47, F-48, F-49, F-50
Council on Environmental Quality (CEQ), xxiii, 1-4, 3-114, 3-115
critical habitat, xix, 2-22, 3-91, 3-92, 3-94, 4-32, 4-38, 4-39, 4-40, B-5, C-1, C-2, C-3
cultural resources, xix, 2-5, 2-22, 3-94, 3-97, 4-5, 4-7, 4-41, 4-42, 4-43, 4-44, 4-45, 4-68, 4-88, 7-2, B-1, B-6
design-basis accident, 4-1, 4-52 discharges, 2-9, 2-10, 2-11, 3-6, 3-7, 3-9,
3-10, 3-18, 3-39, 3-40, 3-41, 3-43, 3-44, 3-45, 3-48, 3-49, 3-50, 3-82, 3-83, 3-91, 3-111, 3-112, 3-119, 4-2, 4-3, 4-5, 4-6, 4-17, 4-20, 4-21, 4-25, 4-26, 4-27, 4-29, 4-30, 4-31, 4-35, 4-36, 4-49, 4-50, 4-69, 4-77, 4-78, 4-80, 4-81, 4-85, 4-86, 7-1, B-1, B-3, B-4
dose, xxvi, 3-9, 3-10, 3-11, 3-110, 3-111, 3-119, 4-53, 4-54, 4-55, 4-56, 4-89, 4-90, B-2, F-1, F-3, F-4, F-22, F-23, F-24, F-41, F-45, F-46
dredging, 3-39, 3-50, 3-81, 4-2, 4-3, 4-20, 4-30, 4-31, 4-80
education, 3-106, 4-3 electromagnetic fields, xxiv, 2-22, 4-5, 4-49,
4-51, 4-58, 4-59 endangered and threatened species, 1-6,
3-50, 3-74, 3-89, 4-87, B-1, B-5, C-1, C-2 Endangered Species Act (ESA), xxiv, 1-6,
1-7, 2-5, 2-22, 3-78, 3-91, 3-93, 4-32, 4-36, 4-37, 4-38, 4-39, 4-40, 4-41, 6-7, B-5, B-8, C-1, C-2, C-3, C-4, C-5
Entergy Louisiana, LLC and Entergy Operations, Inc., xvii, xviii, xix, xxi, 1-1, 1-2, 1-5, 1-7, 2-1, 2-2, 2-4, 2-5, 2-7, 2-8, 2-9, 2-10, 2-11, 2-12, 2-13, 2-15, 2-18, 2-19, 2-22, 3-1, 3-2, 3-3, 3-4, 3-5, 3-6, 3-7, 3-8, 3-9, 3-10, 3-11, 3-12, 3-13, 3-14, 3-15, 3-16, 3-17, 3-18, 3-19, 3-20, 3-21, 3-22, 3-23, 3-24, 3-25, 3-26, 3-27, 3-28, 3-30, 3-31, 3-32, 3-33, 3-34, 3-35, 3-36, 3-37, 3-38, 3-39, 3-40, 3-41, 3-42, 3-43, 3-45, 3-46, 3-47, 3-48, 3-49, 3-50, 3-51, 3-52, 3-53, 3-54, 3-55, 3-56, 3-57, 3-58, 3-59, 3-60, 3-61, 3-62, 3-63, 3-64, 3-65, 3-66, 3-67, 3-69, 3-70, 3-71, 3-74, 3-75, 3-78, 3-79, 3-81, 3-82, 3-83, 3-84, 3-87, 3-88, 3-90, 3-91, 3-95, 3-96, 3-97, 3-98, 3-100, 3-107, 3-108, 3-109, 3-110, 3-111, 3-113, 3-114, 3-119, 3-120, 4-6, 4-7,

9-2
4-17, 4-18, 4-19, 4-20, 4-25, 4-26, 4-27, 4-34, 4-35, 4-37, 4-38, 4-39, 4-42, 4-43, 4-44, 4-45, 4-49, 4-50, 4-52, 4-53, 4-54, 4-55, 4-56, 4-57, 4-58, 4-62, 4-67, 4-71, 4-73, 4-76, 4-80, 4-81, 4-82, 4-83, 4-84, 4-87, 4-88, 4-89, 4-90, 4-91, 4-93, 5-1, 5-2, 8-1, A-1, B-7, B-8, C-2, D-1, D-2, E-1, E-3, E-4, E-5, E-6, E-8, F-1, F-2, F-3, F-4, F-5, F-8, F-9, F-10, F-11, F-12, F-13, F-14, F-15, F-16, F-17, F-18, F-19, F-20, F-21, F-22, F-23, F-24, F-25, F-26, F-27, F-28, F-29, F-30, F-31, F-32, F-33, F-34, F-43, F-44, F-45, F-46, F-47, F-48, F-49, F-50, F-51, F-52, F-53, F-54
entrainment, 3-94, 4-3, 4-30, 4-31, 4-33, 4-34, 4-36, 4-37, 4-39, 4-86, F-20
environmental justice (EJ), 2-5, 3-115, 4-60, 4-61, 4-68, 4-90, 7-2
essential fish habitat (EFH), xix, xxiv, 2-22, 3-94, 4-5, 4-39, 4-40, 4-41, 7-1, B-5, C-3
eutrophication, 4-3, 4-87, 6-25 evaporative loss, 4-21 Fish and Wildlife Coordination Act (FWCA),
xxiv, B-8 Generic Environmental Impact Statement
(GEIS), xvii, xviii, xix, xxi, xxiv, 1-3, 1-4, 1-7, 2-1, 2-2, 2-3, 2-4, 2-5, 2-15, 2-22, 3-100, 3-113, 4-2, 4-4, 4-6, 4-25, 4-27, 4-30, 4-36, 4-43, 4-45, 4-49, 4-51, 4-52, 4-60, 4-63, 4-65, 4-66, 4-67, 4-68, 4-69, 4-72, 4-75, 5-2
greenhouse gases, xxiv, 2-6, 2-11, 4-10, 4-11, 4-12, 4-13, 4-14, 4-27, 4-67, 4-70, 4-71, 4-72, 4-73, 4-74, 4-91, 4-92, 6-10
groundwater, xix, 2-20, 3-3, 3-8, 3-13, 3-35, 3-36, 3-44, 3-45, 3-48, 3-49, 3-50, 3-52, 3-56, 3-59, 3-62, 3-63, 3-64, 3-65, 3-67, 3-68, 3-106, 3-107, 4-4, 4-16, 4-18, 4-19, 4-20, 4-21, 4-22, 4-23, 4-24, 4-61, 4-62, 4-68, 4-81, 4-82, 4-90, 5-1, 7-1, B-1, E-3, E-4
hazardous waste, 3-14, 3-111, 4-93, 4-94, B-5
high-level waste, xviii, 1-4, 4-4, 4-65, 4-68 impingement, 3-94, 4-30, 4-31, 4-33, 4-34,
4-36, 4-37, 4-39, 4-86 independent spent fuel storage installation
(ISFSI), 3-12, 3-15, 3-18, 4-89 Indian tribes, 1-7, 3-95, 3-115, 4-61, 7-2 invasive species, 3-78 low-level waste, 3-44, 3-48, 4-65, 4-68
Magnuson–Stevens Fishery Conservation and Management Act (MSA), xxv, 1-6, 1-7, 2-5, 3-91, 3-94, 4-39, B-5, B-8, C-3, C-5, F-15, F-52
Marine Mammal Protection Act (MMPA), xxv, B-8
mitigation, xviii, xxvi, 1-4, 1-5, 4-10, 4-30, 4-44, 4-93, 5-1, D-1, F-14, F-16, F-31, F-32
mixed waste, 3-9 National Environmental Policy Act (NEPA),
xviii, xxv, 1-1, 1-8, 2-1, 2-3, 2-4, 3-95, 3-114, 3-115, 4-4, 4-38, 4-42, 4-76, 4-85, 5-1, 7-1, 7-2, A-1, B-2, B-8, C-1, C-3, C-5
National Marine Fisheries Service (NMFS), xxv, 3-91, 3-92, 3-93, 3-94, 4-34, 4-36, 4-38, 4-39, 4-40, B-5, C-1, C-2, C-3, C-4, C-5
National Pollutant Discharge Elimination System (NPDES), xxv, 3-42, 3-43, 3-45, 3-49, 4-30, 4-36, 4-79, B-1, B-4, B-8, E-4
Native American tribes, 1-7, 4-61 no-action alternative, xx, 2-1, 2-3, 2-4, 2-20,
4-1, 4-6, 4-9, 4-15, 4-19, 4-20, 4-27, 4-30, 4-39, 4-46, 4-47, 4-58, 4-63, 4-64, 4-71, 4-72, 4-73, 4-94, 5-1
nonattainment, 3-27 once-through cooling, 4-21 postulated accidents, 4-1 pressurized water reactor, xxvi radon, 3-13 reactor, xvii, xxiii, xxvi, 2-1, 2-2, 2-3, 2-4,
2-9, 2-22, 3-1, 3-3, 3-7, 3-8, 3-9, 3-15, 3-18, 3-30, 3-44, 3-65, 3-111, 4-1, 4-4, 4-22, 4-27, 4-30, 4-34, 4-37, 4-41, 4-43, 4-45, 4-46, 4-52, 4-53, 4-54, 4-58, 4-63, 4-69, 4-88, 4-89, 4-91, 6-6, E-1, F-2, F-3, F-5, F-6, F-8, F-11, F-12, F-13, F-15, F-16, F-17, F-19, F-20, F-38, F-42, F-46, F-47
refurbishment, 2-2, 4-20, 4-22, 4-26, 4-45, 4-76, F-47
replacement power, xx, xxvi, 2-3, 2-4, 2-5, 2-6, 2-9, 2-11, 2-19, 4-1, 4-6, 4-7, 4-8, 4-9, 4-10, 4-12, 4-15, 4-16, 4-20, 4-21, 4-22, 4-23, 4-24, 4-27, 4-28, 4-30, 4-31, 4-32, 4-39, 4-40, 4-41, 4-43, 4-44, 4-45, 4-46, 4-47, 4-59, 4-60, 4-63, 4-65, 4-66, 4-67, 4-68, 4-69, 4-70, 4-72, 4-92, F-28, F-47
salinity gradients, 4-2

9-3
scoping, xvii, xviii, xxi, 1-2, 1-6, 4-2, 4-42, 4-52, 4-66, 4-76, A-1, C-3, C-4, D-1, F-22
seismic, xxvi, 3-31, 3-35, 4-54, F-10, F-11, F-12, F-16, F-27, F-31, F-32
severe accident mitigation alternative (SAMA), xvii, xix, xxvi, 1-2, 4-52, 4-53, 4-54, 4-55, 4-56, 4-57, 7-1, 7-2, D-1, D-2, F-1, F-2, F-3, F-5, F-8, F-9, F-10, F-11, F-12, F-13, F-14, F-15, F-16, F-17, F-18, F-19, F-20, F-21, F-22, F-23, F-24, F-25, F-26, F-27, F-28, F-29, F-30, F-31, F-32, F-33, F-34, F-36, F-37, F-38, F-39, F-40, F-41, F-42, F-43, F-44, F-45, F-48, F-49, F-50, F-52
severe accidents, xvii, xix, xxvi, 1-2, 1-6, 4-1, 4-52, 4-56, 4-61, D-1, F-1, F-3, F-5, F-10, F-17, F-25, F-30, F-33, F-47, F-48
solid waste, xx, 2-13, 2-17, 3-9, 3-10, 3-12, 3-110, 3-119, 4-14, 4-68, B-1, B-6, B-7
spent fuel, xviii, 1-4, 2-22, 3-8, 3-12, 3-15, 4-4, 4-30, 4-69
State Historic Preservation Office (SHPO), 1-7, 2-22, 4-42, 4-43, 8-2
stormwater, 3-43, 3-48, 3-62, 3-119, 4-20, 4-21, 4-25, 4-26, 4-30, 4-79, 4-80, 4-81, B-4
surface runoff, 3-36, 3-43, 3-44, 3-45, 3-48, 3-67, 3-81, 3-82, 4-19, 4-20, 4-22, 4-23, 4-25, 4-28, 4-74, 4-79, 4-80, 4-81, 4-85, 4-86, 4-87, 4-88, B-4
surface water, 3-36, 3-40, 3-41, 3-42, 3-48, 3-50, 3-62, 3-80, 3-113, 4-2, 4-16, 4-17, 4-18, 4-19, 4-20, 4-21, 4-22, 4-23, 4-24,
4-26, 4-35, 4-61, 4-62, 4-68, 4-77, 4-78, 4-79, 4-80, 4-81, 4-82, 4-86, 7-1, B-1, B-4
taxes, 3-107 transmission line corridors, 3-70 transmission lines, 2-7, 2-8, 2-11, 2-12,
3-15, 3-16, 3-23, 3-113, 4-2, 4-3, 4-6, 4-8, 4-27, 4-28, 4-29, 4-30, 4-41, 4-51
tritium, 3-13, 3-49, 3-59, 3-62, 3-63, 3-65, 3-67, 3-68, 4-18, 4-19, 6-10, 6-21
U.S. Army Corps of Engineers, 3-39, 3-50, 3-80, 3-81, 4-20, B-4, E-10
U.S. Department of Energy (DOE), xxiii, 2-5, 2-9, 2-13, 2-14, 2-16, 2-17, 2-18, 3-13, 4-12, 4-13, 4-14, 4-51, 4-73
U.S. Environmental Protection Agency (EPA), xxiv, 2-5, 2-17, 2-19, 3-9, 3-10, 3-11, 3-26, 3-27, 3-28, 3-29, 3-30, 3-36, 3-42, 3-43, 3-49, 3-59, 3-61, 3-65, 3-67, 3-107, 3-111, 3-119, 4-4, 4-12, 4-13, 4-14, 4-36, 4-37, 4-38, 4-58, 4-59, 4-66, 4-70, 4-71, 4-73, 4-74, 4-75, 4-77, 4-82, 4-85, 4-86, 4-87, 4-89, 4-91, 4-92, 4-93, B-1, B-2, B-3, B-4, B-5, B-8, E-2, E-3, E-4, E-8, E-9
U.S. Fish and Wildlife Service (FWS), xxiv, 1-6, 1-8, 3-23, 3-78, 3-91, 3-92, 3-93, 3-94, 4-32, 4-34, 4-35, 4-36, 4-37, 4-38, 4-40, 8-2, B-5, B-7, C-1, C-2, C-4, C-5, E-5, E-10
uranium, 3-3, 3-15, 3-110, 4-1, 4-4, 4-8, 4-59, 4-68, 4-69, 4-70
wastewater, 3-6, 3-14, 3-37, 3-43, 3-44, 3-45, 3-48, 3-49, 3-63, 4-21, 4-79, 4-80, 7-1, B-7, E-4, E-6, E-7


A-1
APPENDIX A COMMENTS RECEIVED ON THE RIVER BEND STATION, UNIT 1
ENVIRONMENTAL REVIEW
A.1 Comments Received During the Scoping Period
The scoping process for the environmental review of the River Bend Station, Unit 1 (RBS) license renewal began in September 2017, in accordance with the National Environmental Policy Act of 1969, 42 U.S.C. 4321 et seq. (NEPA). On September 14, 2017, the U.S. Nuclear Regulatory Commission (NRC) issued a notice of intent to conduct an environmental scoping process for license renewal of RBS; that notice was published in the Federal Register on September 20, 2017 (82 FR 44004). The scoping process included a public meeting held in St. Francisville, LA, on September 19, 2017. The NRC issued a press releases and purchased newspaper advertisements to advertise that meeting. In addition to participation from Entergy and local officials, several members of the public attended the meeting. After the NRC staff presented prepared statements on the license renewal process, the staff opened the meeting for public comments. Attendees were provided the opportunity to make oral statements that would be recorded and transcribed by a certified court reporter. A summary and transcript of the scoping meeting are available in NRC’s Agencywide Documents Access and Management System (ADAMS). The ADAMS Public Electronic Reading Room is accessible at http://www.nrc.gov/reading-rm/adams.html. The scoping meeting summary is available at ADAMS Accession No. ML17293A615. The transcript of the meeting is available at ADAMS Accession No. ML17293A547.
The only commenter at the public meeting was Mr. Kevin Couhig, Parish President of West Feliciana Parish. Mr. Couhig’s comments are found in the meeting transcript. In addition to Mr. Couhig’s comments, the NRC received one written comment from an unknown individual with an unknown affiliation (available at ADAMS Accession No. ML17304A065). The RBS Scoping Summary Report, dated April 24, 2018, contains the comments from Mr. Couhig and the unknown individual as well as NRC staff responses to these comments (ADAMS Accession No. ML17362A554). While none of these comments affected the scope of the license renewal environmental review, they were considered and addressed, as appropriate, in the development of this supplemental environmental impact statement (SEIS).
A.2 Comments Received on the Draft EIS
On May 15, 2018, the NRC issued NUREG-1437, “Generic Environmental Impact Statement for License Renewal of Nuclear Power Plants Regarding River Bend Station, Unit 1 (NUREG-1437, Supplement 58), Draft Report for Comment. The U.S. Environmental Protection Agency (EPA) issued its Notice of Availability regarding the draft SEIS on June 8, 2018 (83 FR 26665). The public comment period was 45 days and ended on July 23, 2018.
Table A-1 lists the commenters and their affiliation and includes the comment source, which shows how the comment was received (letter or email). The table also provides the ADAMS Accession No. for the comment received. This number can be used to locate the comment in the Agency’s electronic document retrieval system (ADAMS).

A-2
Table A-1. Comments Received on the RBS Draft SEIS
Name Affiliation Comment Type ADAMS Number Edward Festner Unknown Email ML18206A450 Comment (4) Anonymous Unknown Email ML18206A454 Comment (3) Anonymous Unknown Email ML18206A453 William F. Maguire Entergy Letter ML18193B141 Comment (2) Anonymous Unknown Email ML18206A451 Cheryl T. Seager U.S. EPA, Region 6 Letter ML18206A455
The first three comments listed in Table A-1 are general in nature and do not provide substantive information related to the NRC staff’s environmental review; therefore, they are not addressed herein.
The fourth comment listed in Table A-1 is from Entergy. This comment primarily contains technical edits and does not provide substantive information related to the NRC staff’s environmental review. The Entergy comments and the NRC staff’s responses to those comments are provided in a letter from the NRC staff to Entergy (ADAMS No. ML18261A214).
The fifth comment listed in Table A-1, from “Comment (2) Anonymous” (ADAMS Accession No. ML18206A451) is similar to a comment received during the scoping period (ADAMS Accession No. ML17304A065) which the NRC staff previously addressed in the Scoping Summary Report (ADAMS Accession No. ML17362A554); those items do not warrant any change to this SEIS. In addition, this comment identifies four new items that were not mentioned in the comment received during the scoping period. Below are the four new items and the NRC staff’s responses to those new items.
Comment from “Comment (2) Anonymous” regarding historic-cultural sites: historic-cultural sites, including the ones on the RB site: Cottonmouth American Indian Mound Complex and the Causeway American Indian Site. Entergy hid map & NRC fails to mention these 1000 yr or older sites of incredible significance, likely including American Indian and other historic burial grounds.
Response: The commenter raises concerns regarding potential impacts to cultural resources in the vicinity of RBS and asserts that this information is not sufficiently disclosed in the applicant’s Environmental Report (ER). Figures 3.7-11 and 3.7-12 of Entergy’s ER present the locations of archaeological resources on and in the vicinity of RBS; this information was withheld from public disclosure in order to protect these resources from unlawful disturbance, in accordance with Section 304 of the National Historic Preservation Act of 1966 (NHPA), 54 U.S.C. § 307103; NHPA Section 304 protects sensitive information about the location, character or ownership of historic properties from disclosure to the public, when such disclosure could cause a risk of harm to the historic property. This information was reviewed by the NRC staff during preparation of the draft SEIS and shared with the Louisiana State Historic Preservation Officer. Accordingly, the NRC staff considered these resources in evaluating potential impacts associated with continued operation of RBS. As stated in in Chapter 4, Section 4.9 of the RBS SEIS, NRC staff determined that license renewal would not adversely affect any known historic properties. The NRC staff did not revise the SEIS based on this comment.

A-3
Comment from “Comment (2) Anonymous” regarding ethnic and cultural genocide: Ethnic & Cultural Genocide: Tunica-Biloxi American Indian Reservation within 50 mi.
Response: The commenter expresses concerns regarding the proximity of RBS to the Tunica-Biloxi Tribe of Louisiana reservation. The NRC initiated written consultation with the Tunica-Biloxi Tribe of Louisiana on September 17, 2017 (ADAMS Accession No. ML17255A024) regarding Section 106 of the National Historic Preservation Act, and invited the Tribe to participate in the SEIS scoping process. This comment does not point out concerns with cultural resources within the scope of the NRC’s Section 106 consultation; rather this comment appears to express a concern regarding safe operation of the plant.
Safety considerations fall outside the scope of the NRC’s National Environmental Policy Act (NEPA) and NHPA Section 106 reviews. As part of the license renewal application review, the NRC staff rigorously reviews safety considerations attendant to a renewed license. Such considerations are assessed in the site-specific safety review that is performed for license renewal, rather than in the environmental review.
As part of the license renewal safety review, the NRC staff examined Entergy’s aging management programs to ensure that the effects of aging on structures and components will be adequately managed during the period of extended operation. This review, which is separate from the environmental review, ensures adequate protection of the public health and safety during the 20-year license renewal period. The NRC staff documents its safety review in the Safety Evaluation Report related to RBS license renewal.
Additionally, during the period of extended operation, if a renewed license is issued, RBS would be required to meet the terms of the renewed license. The NRC has many oversight mechanisms to monitor that compliance. Such mechanisms include the Reactor Oversight Program, the Resident Inspector program, license technical specifications and conditions, and the NRC’s enforcement program. If the NRC determines that a licensee is not in compliance with Commission regulations and the facility license, appropriate action would be taken to ensure adequate protection of the public health and safety and the environment.
This comment is general in nature and provides no new and significant information. No change was made to the SEIS as a result of this comment.
Comment from “Comment (2) Anonymous” regarding environmental justice: For environmental justice impacts on African Americans, the proper comparison is to the national avg - NOT the Louisiana or MS avg., nor the region. US avg. African American population is 13.3%; population in the 50 mile radius is 36.4%, meaning there is an environmental justice issue.
Response: As explained in Section 3.12 of the SEIS, under Executive Order 12898 (59 FR 7629), Federal agencies are responsible for identifying and addressing environmental justice impacts on minority and low-income populations. Therefore, the primary purpose for the NRC staff’s environmental justice review is to determine whether minority and low-income populations would experience disproportionately high or adverse human health and environmental effects from the proposed action. As explained in Section 4.12.1 of the SEIS, this evaluation occurs regardless of population percentages. The comparison of populations is used to identify the locations of high concentrations of minority and low-income populations in proximity to RBS. This comment did not provide any new and significant information; therefore, no changes were made to the SEIS.

A-4
Comment from “Comment (2) Anonymous” regarding alternatives and rooftop solar: NRC fails to properly evaluate alternatives. Renewable Alternatives must be properly evaluated, both separately and in combo. Rooftop solar could provide 25%-35% of Louisiana energy (NREL, ca 2013). Solar cells have since improved & continue to improve, in contrast to the declining Capacity Factor of RB nuclear offline for months at a time due to defects-need of repair. Insulation-new films which keep heat out must be considered in combo with renewables-other non-nuclear alternatives (natural gas and ag waste produced in Louisiana). Community; individual or utility owned rooftop solar (& PVs on parking lots) options must be considered, not only utility scale on virgin land. Even for virgin land, a 20,000 acres est. for PV solar must be compared to the 5,026,400 acres within 50 mi of RB which may become a permanent no-go zone (over 1 million acres for Chernobyl). Acres need for solar is rapidly declining, too, so 10,000 acres or less may be a better estimate. Given the socio-economic & environmental costs of major nuclear disasters, esp. the area as a permanent no-go exclusion zone, as well as accumulation of routine nuclear discharges into the environment and the lack of solution for nuclear waste, the renewable & oil-gas alternatives are clearly best. Offshore wind could more than replace all nuclear power in the USA, according to NREL estimates: 86 MILLION GW offshore wind compared to 99 GWe for all 99 US reactors. In the immediate future, pending expansion of renewables, River Bend should be shutdown and replaced by expansion of the Big Cajun site across the river with natural gas (currently produced in Louisiana) and biofuels (ag waste), unless all nuclear waste is removed from the River Bend site, or placed at an adequate distance from a natural gas facility in case of fire explosion.
Forget relicensing of River Bend nuclear. It must be shutdown now, before it's too late.
Response: The comment expresses dissatisfaction with the evaluation of energy alternatives in the SEIS. The comment also expresses a preference for replacing RBS with solar, wind, natural gas and biofuel technologies.
The NRC staff does not favor, nor does it advocate for, any particular type of power replacement when considering alternatives to the power production provided by RBS. As stated in Chapter 2 of the SEIS, the NRC’s decisionmaking authority in license renewal is limited to deciding whether to renew the nuclear power plant’s operating license for an additional 20 years. However, the NRC’s implementation of the National Environmental Policy Act (NEPA) requires consideration of the environmental impacts of potential alternatives to renewing a plant’s operating license. While the ultimate decision about which method of electricity production to employ will be made by utility, state, or other Federal officials (non-NRC), comparing the impacts of renewing the operating license to the environmental impacts of alternatives allows the NRC to determine whether the environmental impacts of license renewal are so great that preserving the option of license renewal for energy-planning decisionmakers would be unreasonable.
The NRC’s responsibility is to ensure safe operation of nuclear power facilities and not to formulate energy policy or encourage or discourage the development of specific alternative power generation resources. To be considered a reasonable alternative, a technology must be commercially viable on a utility scale and operational prior to the expiration of RBS’s operating license in 2025.
The NRC staff evaluated 17 alternatives to the proposed action in the RBS SEIS, as described in Chapter 2. These alternatives included natural gas generation and renewable energy technologies such as solar, wind, and biomass, as well as a combination alternative comprised of fossil fuel, renewable energy, and energy efficiency components. Associated resource

A-5
needs, capacity factors, and the geographical viability of these alternatives were assessed based upon published government and industry sources. Alternatives that could not provide the equivalent of RBS’s current baseload generating capacity, or those alternatives whose costs or benefits did not justify inclusion in the range of reasonable alternatives, were eliminated from detailed consideration. The NRC staff explained the reasons why each of these alternatives was eliminated from further consideration in Section 2.3 of the RBS SEIS. The 17 alternatives were narrowed to the 4 alternatives described in detail in Sections 2.2.2.1–2.2.2.4 of the RBS SEIS. The NRC staff evaluated the environmental impacts of these four alternatives and the no-action alternative in Chapter 4 of the RBS SEIS.
Chapter 2, Section 2.3 of the SEIS has been revised, in part, as a result of this comment to address the current lack of tax incentives for the development of rooftop solar generation as a replacement power alternative. No further changes to the draft SEIS discussion of solar generation have been made.
The sixth and final comment identified in Table A-1 is from U.S. EPA Region 6. The EPA comment and the NRC staff response to that comment are provided below.
Comment from U.S. EPA Region 6: The draft EIS characterizes the potential effects of radionuclides, in this case tritium, on groundwater as small to moderate. The EIS contains a good description of aquifer zones in the area, monitoring wells, the history of tritium spills and releases at River Bend Station (RBS), and mitigation efforts to limit tritium releases above MCL’s.
Most of the mitigation efforts listed in the EIS do not prevent tritium from being released into the groundwater but instead mitigate the releases after they have entered the Upland Terrace Aquifer (UTA). These mitigation measures include pumping tritium contaminated water and mixing it with uncontaminated water until it falls within acceptable Nuclear Regulatory Commission (NRC) and Louisiana Department of Environmental Quality (LDEQ) regulatory limits, and utilizing natural attenuation methods such as dilution, sorption, evaporation, and radioactive decay. In 2016, the applicant resealed the floor joints of the turbine building believed to be the source of tritium leaks. While this is a positive mitigation measure that prevents tritium from entering the UTA, NRC concludes that it is too early to determine that the applicant has identified and stopped all sources of tritium contamination. EPA recommends that a more detailed description of sampling, mitigation, and response efforts be included in the final EIS that would describe ongoing efforts to determine all sources of tritium leaks, responses to potential tritium leaks, and any additional mitigation efforts that would remediate harmful effects of tritium releases.
The EIS states that thick clay beneath the UTA prevents any radiological contamination from moving deeper into underlying aquifers. Also, no offsite private or public drinking wells exist along the direction of groundwater flow within the UTA. There are 21 wells screened into the UTA; outside of the RBS boundary, and east of the Mississippi River. The EIS concludes that no RBS or offsite groundwater should contact the tritium contaminated groundwater. EPA recommends the final EIS discuss what safeguards are in place to ensure that any future drinking water wells are not established within the groundwater flow zone of the UTA.
NRC Staff Response to EPA Region 6 comment on RBS DSEIS: Groundwater monitoring wells at RBS are shown in Figure 3-19 of Section 3.5.2.4 titled “Groundwater Quality at RBS”. As described in Section 3.5.2.4, the groundwater monitoring program at RBS includes 95 monitoring wells. With the exception of a few wells installed in the Mississippi Alluvial Aquifer,

A-6
all of the wells are completed either in the structural fill of the power block or the Upland Terrace Aquifer. Deeper aquifers are monitored via the onsite production wells.
Seventy three onsite monitoring wells were sampled in 2017. With few exceptions all of these wells were sampled quarterly for tritium concentrations. Of these wells, 66 were also sampled quarterly for the following radioactive isotopes: Mn-54, Co-58, Fe-59, Co-60, Zn-65, Nb-95, Zr-95, I-131, Cs-137, Ba-140, La-140. Except for tritium, all of the samples were below background concentrations. Tritium above background concentrations was only found in the structural fill or the Upland Terrace Aquifer. Areas of tritium contamination were as described in Section 3.5.2.4 (Entergy 2018a).
In addition, the Mississippi River was sampled for both tritium and the following radioactive isotopes; Mn-54, Co-58, Fe-59, Co-60, Zn-65, Nb-95, Zr-95, I-131, Cs-137, Ba-140, La-140. Samples were obtained quarterly upstream and downstream of RBS (Entergy 2018a, 2018b). All of the samples, including tritium, were below background concentrations.
It is anticipated that in 2018, the groundwater and surface water monitoring program will be similar to what was implemented in 2017.
The NRC’s evaluation of radiological leaks into the groundwater is an ongoing process that is separate from the license renewal application review process. When regulating nuclear power plants, the NRC seeks to keep doses to the worker and members of the public from nuclear power plants as low as reasonably achievable. First, NRC licensees are required to comply with radiological dose standards. Then they are encouraged to lower doses below those standards, until they are as low as reasonably achievable.
To further limit doses and contain the release of radionuclides, NRC has established numerical guides for design objectives and limiting conditions for operation. The objective of these guides is to ensure facilities are designed, built, and operated to contain radionuclides and keep doses to workers and the public as low as reasonably achievable.
The NRC has also established limits on the quantity of radionuclides that can be released by a facility under normal operating conditions. The tritium releases into the groundwater at RBS are inadvertent (unintended) releases (spills). All releases, including both normal and inadvertent releases are reported to the NRC.
In addition to regular inspections of nuclear power plants by the NRC staff, the NRC also has on-site inspectors at each nuclear reactor site. These inspectors are privy to real-time information on radionuclide releases and related actions taken by the licensee.
The NRC requires licensees to implement procedures and practices that minimize the occurrence of leaks and spills and identify them soon after they occur. In accordance with 10 CFR 20.1406(c), licensees are required, to the extent practical, to conduct operations to minimize the introduction of residual radioactivity into the site, including the subsurface, in accordance with the NRC radiation protection requirements in Subpart B, “Radiation Protection Programs,” and radiological criteria for license termination in Subpart E, “Radiological Criteria for License Termination,” of 10 CFR Part 20. It was under this requirement that in 2016, the NRC staff issued the inspection violation described in Section 3.5.2.4 of the SEIS titled “Groundwater Quality at RBS”.

A-7
The NRC decommissioning program regulates the decontamination and decommissioning of nuclear power plants. It involves the reduction of residual radioactivity to a level that permits the release of the property and the termination of the NRC license. NRC decommissioning rules establish site-release criteria and provide for unrestricted or (under certain conditions) restricted release of a site. These standards include groundwater contamination from radionuclides.
Furthermore, during decommissioning, when considering groundwater contamination, NRC decisions must consider EPA maximum contaminant levels. The NRC has agreed to consult with EPA at the time of license termination, if groundwater contamination is in excess of EPA's maximum contaminant levels. This process has been formalized in a memorandum of understanding between EPA and NRC (67 FR 65375, NRC 2005).
The area beneath the turbine building, which is believed to be the source of the tritium, cannot be directly observed and wells cannot be placed directly below it. Instead, monitoring wells have been installed at multiple depths adjacent to and down gradient from the turbine building. The effectiveness of sealing the turbine building joints cannot be determined until a trend (either up or down) is observed in the tritium data obtained from monitoring wells.
Monitoring wells are installed at various depths within the structural fill and the Upland Terrace Aquifer. These wells are close to and down gradient from the turbine building. However, as of the end of 2017, a consistent trend has not been observed in these wells (Entergy 2018a). Therefore, it is too soon to conclude that sealing the floor joints in the turbine building has been successful in stopping tritium leaks or that the floor joints were the sole source of the leaks.
If it is determined that sealing of the joints was not successful or that all of the leaks have not been found, the licensee will need to continue to identify and minimize the occurrence of any leaks and spills. This process will continue to be subject to NRC oversight.
All the land along the groundwater flow path in the Upland Terrace Aquifer to the Mississippi River is within the site boundary and is controlled by RBS. The public is not allowed to establish drinking water wells within this area. Drinking water at RBS is supplied by an off-site water company. When operations at RBS cease, decommissioning and the cleanup of groundwater contamination would be subject to NRC oversight and requirements.
In Section 4.5.1.2 titled “Groundwater Resources” under “Radionuclides Released to Groundwater” text has been added (1) to better describe why it is too early to conclude that the source of the tritium has been found and corrected, (2) to clarify that oversight will prevent drinking water wells from being placed into the flow paths for tritium migration, and (3) to acknowledge that inadvertent releases of radionuclides to groundwater will continue to be subject to NRC oversight. In addition, information has been added to Section 3.5.2.4, titled “Groundwater Quality at RBS,” regarding the applicant’s groundwater monitoring program and results obtained at RBS, in response to this comment.
A.3 References
10 CFR Part 20. Code of Federal Regulations, Title 10, Energy, Part 20, “Standards for Protection against Radiation.”
67 FR 65375. U.S. Environmental Protection Agency and U.S. Nuclear Regulatory Commission. “Memorandum of Understanding Between the Environmental Protection Agency and the Nuclear Regulatory Commission Consultation and Finality on Decommissioning and

A-8
Decontamination of Contaminated Sites”. Federal Register Volume 67, Issue 206. October 24, 2002.
[Entergy] Entergy Corp. 2018a. 2017 Annual Radioactive Effluent Release Report, River Bend Station - Unit 1, License No. NPF-47, Docket No. 50-458. May 1, 2018 ADAMS Accession No. ML18121A093.
[Entergy] Entergy Corp. 2018b. Annual Radiological Environmental Operating Report for 2017, River Bend Station - Unit 1, License No. NPF-47, Docket No. 50-458. May 1, 2018. ADAMS No. ML18121A077.
[NRC] U.S. Nuclear Regulatory Commission. 2005. Implementation of the NRC / EPA MOU on Decommissioning Sites. June 1, 2005. Adams Accession No. ML051380168.

B-1
APPENDIX B APPLICABLE LAWS, REGULATIONS, AND OTHER REQUIREMENTS
There are a number of Federal laws and regulations that affect environmental protection, health, safety, compliance, and consultation at every NRC-licensed nuclear power plant. Some of these laws and regulations require permits by or consultation with other Federal agencies or State, Tribal, or local governments. Certain Federal environmental requirements have been delegated to State authorities for enforcement and implementation. Furthermore, States have also enacted laws to protect public health and safety and the environment. It is the NRC’s policy to make sure nuclear power plants are operated in a manner that provides adequate protection of public health and safety and protection of the environment through compliance with applicable Federal and State laws, regulations, and other requirements, as appropriate.
The Atomic Energy Act of 1954, as amended (AEA) (42 U.S.C. 2011 et seq.), authorizes the NRC to enter into an agreement with any State that allows the State to assume regulatory authority for certain activities (see 42 U.S.C. 2021). Louisiana has been an NRC Agreement State since 1967, and the Louisiana Department of Environmental Quality (LDEQ) has regulatory responsibility over certain byproduct, source, and quantities of special nuclear materials not sufficient to form a critical mass. In addition, LDEQ maintains a Radiological Emergency Planning and Response Program to provide response capabilities to radiological accidents or emergencies at the commercial nuclear power plants in and near the State of Louisiana. (LDEQ undated).
In addition to carrying out some Federal programs, state legislatures develop their own laws. State statutes can supplement, as well as implement, Federal laws for protection of air, surface water, and groundwater. State legislation may address solid waste management programs, locally rare or endangered species, and historic and cultural resources.
The U.S. Environmental Protection Agency (EPA) has the primary responsibility to administer the Clean Water Act (33 U.S.C. 1251 et seq., herein referred to as CWA). The National Pollutant Discharge Elimination System (NPDES) program addresses water pollution by regulating the discharge of potential pollutants to waters of the United States. EPA allows for primary enforcement and administration through state agencies, as long as the state program is at least as stringent as the Federal program.
EPA has delegated the authority to issue NPDES permits to the State of Louisiana. The Louisiana Department of Environmental Quality provides oversight for public water supplies, issues permits to regulate the discharge of industrial and municipal wastewaters—including discharges to groundwater, and monitors State water resources for water quality. The Department issues Louisiana Pollutant Discharge Elimination System (LPDES) permits to regulate and control water pollutants.
B.1 Federal and State Requirements
River Bend Station, Unit 1 (RBS) is subject to various Federal and State requirements. Table B-1 lists the principal Federal and State regulations and laws that are used or mentioned in this supplemental environmental impact statement for RBS.

B-2
Table B-1. Federal and State Requirements
Law/regulation Requirements Current operating license and license renewal Atomic Energy Act, 42 U.S.C. 2011 et seq.
The Atomic Energy Act (AEA) of 1954, as amended, and the Energy Reorganization Act of 1974 (42 U.S.C. 5801 et seq.) give the NRC the licensing and regulatory authority for commercial nuclear energy use. They allow the NRC to establish dose and concentration limits for protection of workers and the public for activities under NRC jurisdiction. The NRC implements its responsibilities under the AEA through regulations set forth in Title 10, “Energy,” of the Code of Federal Regulations (CFR).
National Environmental Policy Act of 1969, 42 U.S.C. 4321 et seq.
The National Environmental Policy Act (NEPA), as amended, requires Federal agencies to integrate environmental values into their decisionmaking process by considering the environmental impacts of proposed Federal actions and reasonable alternatives to those actions. NEPA establishes policy, sets goals (in Section 101), and provides means (in Section 102) for carrying out the policy. NEPA Section 102(2) contains action-forcing provisions to ensure that Federal agencies follow the letter and spirit of the Act. For major Federal actions significantly affecting the quality of the human environment, Section 102(2)(C) of NEPA requires Federal agencies to prepare a detailed statement that includes the environmental impacts of the proposed action and other specified information.
10 CFR Part 20 Regulations in 10 CFR Part 20, “Standards for Protection Against Radiation,” establish standards for protection against ionizing radiation resulting from activities conducted under licenses issued by the NRC. These regulations are issued under the AEA of 1954, as amended, and the Energy Reorganization Act of 1974, as amended. The purpose of these regulations is to control the receipt, possession, use, transfer, and disposal of licensed material by any licensee in such a manner that the total dose to an individual (including doses resulting from licensed and unlicensed radioactive material and from radiation sources other than background radiation) does not exceed the standards for protection against radiation prescribed in the regulations in this part.
10 CFR Part 51 Regulations in 10 CFR Part 51, “Environmental Protection Regulations for Domestic Licensing and Related Regulatory Functions,” contain the NRC’s regulations that implement NEPA.
10 CFR Part 50 Regulations in 10 CFR Part 50, “Domestic Licensing of Production and Utilization Facilities,” are NRC regulations issued under the AEA, as amended (68 Stat. 919), and Title II of the Energy Reorganization Act of 1974 (88 Stat. 1242), to provide for the licensing of production and utilization facilities, including power reactors.
10 CFR Part 54 NRC regulations in 10 CFR Part 54, “Requirements for Renewal of Operating Licenses for Nuclear Power Plants,” govern the issuance of renewed operating licenses and renewed combined licenses for nuclear power plants licensed under Sections 103 or 104b of the AEA, as amended, and Title II of the Energy Reorganization Act of 1974 (88 Stat. 1242). The regulations focus on managing adverse effects of aging. The rule is intended to ensure that important systems, structures, and components will continue to perform their intended functions during the period of extended operation.

B-3
Law/regulation Requirements Air quality protection Clean Air Act, 42 U.S.C. 7401 et seq.
The Clean Air Act (CAA) is intended to “protect and enhance the quality of the nation’s air resources so as to promote the public health and welfare and the productive capacity of its population.” The CAA establishes regulations to ensure maintenance of air quality standards and authorizes individual States to manage permits. Section 118 of the CAA requires each Federal agency, with jurisdiction over properties or facilities engaged in any activity that might result in the discharge of air pollutants, to comply with all Federal, State, inter-State, and local requirements with regard to the control and abatement of air pollution. Section 109 of the CAA directs the U.S. Environmental Protection Agency (EPA) to set National Ambient Air Quality Standards (NAAQS) for criteria pollutants. The EPA has identified and set NAAQS for the following criteria pollutants: particulate matter, sulfur dioxide, carbon monoxide, ozone, nitrogen dioxide, and lead. Section 111 of the CAA requires the establishment of national performance standards for new or modified stationary sources of atmospheric pollutants. Section 160 of the CAA requires that specific emission increases must be evaluated before permit approval to prevent significant deterioration of air quality. Section 112 requires specific standards for release of hazardous air pollutants (including radionuclides). These standards are implemented through plans developed by each State and approved by the EPA. The CAA requires sources to meet standards and obtain permits to satisfy those standards. Nuclear power plants may be required to comply with the CAA Title V, Sections 501–507, for sources subject to new source performance standards or sources subject to National Emission Standards for Hazardous Air Pollutants. EPA regulates the emissions of air pollutants using 40 CFR Parts 50 to 99.
Water resources protection Clean Water Act, 33 U.S.C. 1251 et seq., and the NPDES (40 CFR 122)
The Clean Water Act (CWA) was enacted to “restore and maintain the chemical, physical, and biological integrity of the Nation’s water.” The Act requires all branches of the Federal Government with jurisdiction over properties or facilities engaged in any activity that might result in a discharge or runoff of pollutants to surface waters, to comply with Federal, State, inter-State, and local requirements. As authorized by the CWA, the National Pollutant Discharge Elimination System (NPDES) permit program controls water pollution by regulating point sources that discharge pollutants into waters of the United States. The NPDES program requires all facilities that discharge pollutants from any point source into waters of the United States to obtain an NPDES permit. A nuclear power plant may also participate in the NPDES General Permit for Industrial Stormwater due to stormwater runoff from industrial or commercial facilities to waters of the United States. EPA is authorized under the CWA to directly implement the NPDES program; however, EPA has authorized many States to implement all or parts of the national program. Section 401 of the CWA requires States to certify that the permitted discharge would comply with all limitations necessary to meet established State water quality standards, treatment standards, or schedule of compliance. The U.S. Army Corps of Engineers (USACE) is the lead agency for enforcement of CWA wetland requirements (33 CFR Part 320, “General Regulatory Policies”). Under Section 401 of the CWA, the EPA or a delegated State agency has the authority to review and approve, condition, or deny all permits or licenses that might result in a discharge to waters of the State, including wetlands.
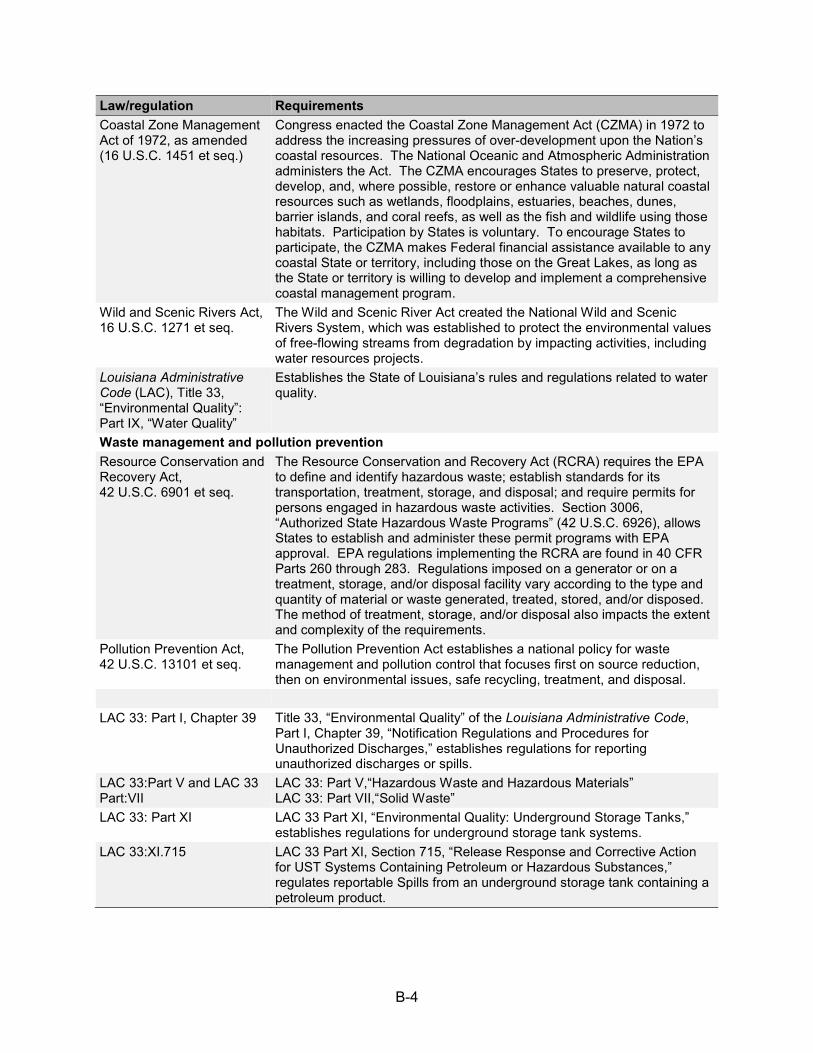
B-4
Law/regulation Requirements Coastal Zone Management Act of 1972, as amended (16 U.S.C. 1451 et seq.)
Congress enacted the Coastal Zone Management Act (CZMA) in 1972 to address the increasing pressures of over-development upon the Nation’s coastal resources. The National Oceanic and Atmospheric Administration administers the Act. The CZMA encourages States to preserve, protect, develop, and, where possible, restore or enhance valuable natural coastal resources such as wetlands, floodplains, estuaries, beaches, dunes, barrier islands, and coral reefs, as well as the fish and wildlife using those habitats. Participation by States is voluntary. To encourage States to participate, the CZMA makes Federal financial assistance available to any coastal State or territory, including those on the Great Lakes, as long as the State or territory is willing to develop and implement a comprehensive coastal management program.
Wild and Scenic Rivers Act, 16 U.S.C. 1271 et seq.
The Wild and Scenic River Act created the National Wild and Scenic Rivers System, which was established to protect the environmental values of free-flowing streams from degradation by impacting activities, including water resources projects.
Louisiana Administrative Code (LAC), Title 33, “Environmental Quality”: Part IX, “Water Quality”
Establishes the State of Louisiana’s rules and regulations related to water quality.
Waste management and pollution prevention Resource Conservation and Recovery Act, 42 U.S.C. 6901 et seq.
The Resource Conservation and Recovery Act (RCRA) requires the EPA to define and identify hazardous waste; establish standards for its transportation, treatment, storage, and disposal; and require permits for persons engaged in hazardous waste activities. Section 3006, “Authorized State Hazardous Waste Programs” (42 U.S.C. 6926), allows States to establish and administer these permit programs with EPA approval. EPA regulations implementing the RCRA are found in 40 CFR Parts 260 through 283. Regulations imposed on a generator or on a treatment, storage, and/or disposal facility vary according to the type and quantity of material or waste generated, treated, stored, and/or disposed. The method of treatment, storage, and/or disposal also impacts the extent and complexity of the requirements.
Pollution Prevention Act, 42 U.S.C. 13101 et seq.
The Pollution Prevention Act establishes a national policy for waste management and pollution control that focuses first on source reduction, then on environmental issues, safe recycling, treatment, and disposal.
LAC 33: Part I, Chapter 39 Title 33, “Environmental Quality” of the Louisiana Administrative Code,
Part I, Chapter 39, “Notification Regulations and Procedures for Unauthorized Discharges,” establishes regulations for reporting unauthorized discharges or spills.
LAC 33:Part V and LAC 33 Part:VII
LAC 33: Part V,“Hazardous Waste and Hazardous Materials” LAC 33: Part VII,“Solid Waste”
LAC 33: Part XI LAC 33 Part XI, “Environmental Quality: Underground Storage Tanks,” establishes regulations for underground storage tank systems.
LAC 33:XI.715
LAC 33 Part XI, Section 715, “Release Response and Corrective Action for UST Systems Containing Petroleum or Hazardous Substances,” regulates reportable Spills from an underground storage tank containing a petroleum product.

B-5
Law/regulation Requirements Tennessee Department of Environment and Conservation Rule 1200-2-10-32
“Licensing of Shippers of Radioactive Materials into or Within Tennesee,” establishes the requirements for the licensing of shippers of radioactive material in that State.
Protected species Endangered Species Act, 16 U.S.C. 1531 et seq.
The Endangered Species Act (ESA) was enacted to prevent the further decline of endangered and threatened species and to restore those species and their critical habitats. Section 7, “Interagency Cooperation,” of the Act requires Federal agencies to consult with the U.S. Fish and Wildlife Service (FWS) or the National Marine Fisheries Service (NMFS) on Federal actions that may affect listed species or designated critical habitats.
Magnuson–Stevens Fishery Conservation and Management Act, 16 U.S.C. 1801-1884
The Magnuson–Stevens Fishery Conservation and Management Act, as amended, governs marine fisheries management in U.S. Federal waters. The Act created eight regional fishery management councils and includes measures to rebuild overfished fisheries, protect essential fish habitat, and reduce bycatch. Under Section 305 of the Act, Federal agencies are required to consult with the National Marine Fisheries Service for any Federal actions that may adversely affect essential fish habitat.
Historic preservation and cultural resources National Historic Preservation Act, 54 U.S.C. 100101 et seq. (formerly 16 U.S.C. 470 et seq.)
The National Historic Preservation Act was enacted to create a national historic preservation program, including the National Register of Historic Places and the Advisory Council on Historic Preservation (ACHP). Section 106 of the Act requires Federal agencies to take into account the effects of their undertakings on historic properties. The Advisory Council on Historic Preservation regulations implementing Section 106 of the Act are found in 36 CFR Part 800, “Protection of Historic Properties.” The regulations call for public involvement in the Section 106 consultation process, including involvement from Indian Tribes and other interested members of the public, as applicable.
B.2 Operating Permits and Other Requirements
Table B-2 lists the permits and licenses issued by Federal, State, and local authorities for activities at RBS, as identified in Chapter 9 of the Environmental Report (ER).
Table B-2. Operating Permits and Other Requirements
Permit Responsible Agency Number Expiration Date Authorized Activity
Authorization to export waste
Central Interstate Low-Level Radioactive Waste Commission
None Updated annually Export of low-level radioactive waste outside the region
Louisiana Pollutant Discharge Elimination System permit
Louisiana Department of Environmental Quality (LDEQ)
LA0042731 November 1, 2022
Discharge of wastewaters to waters of the State

B-6
Permit Responsible Agency Number Expiration Date Authorized Activity
Air permit LDEQ 3160-00009-04 Current air permit does not include expiration date (a)
Operation of air emission sources (diesel generators, diesel pumps, portable auxiliary boiler, and portable gas/diesel generators)
Hazardous waste generator identification
LDEQ LAD070664818 None Hazardous waste generation.
Industrial solid waste site identification
LDEQ G-2104-125 None Industrial solid waste generation
Onsite wastewater treatment system
Louisiana Department of Health and Hospitals
1030185 None Mo-Dad sanitary wastewater treatment for leach field at small structure near unmanned checkpoint facility leading to the plant
Radioactive waste transport permit
Mississippi Emergency Management Agency
1511 Updated annually Transportation of radioactive waste into, within, or through the State of Mississippi
Operating license NRC NPF-47 August 29, 2025 Operation of RBS Radioactive waste license for delivery
Tennessee Department of Environment and Conservation
TLA002-Ll6 Updated annually Shipment of radioactive material into Tennessee to a disposal or processing facility
Authorization to import waste
Texas Low-Level Radioactive Waste Disposal Compact Commission
TLLRWDCC #2-0103-00
Updated annually Import low-level radioactive waste to a Texas LLRW disposal compact facility.
Generator site access permit
Utah Department of Environmental Quality
1110007082 Updated annually Site access permit for disposal of Class A wastes
General permit U.S. Army Corp of Engineers
NOD-23 April 30, 2022 Dredging activities at the intake structure
Hazardous materials certificate of registration
U.S. Department of Transportation
061616550010Y Updated annually Radioactive and hazardous materials shipments
Depredation permit U.S. Fish and Wildlife Service
MBS8598A-0 Updated annually Taking of migratory birds.
Onsite wastewater treatment system
Louisiana Department of Health and Hospitals
1089509 None Mo-Dad sanitary wastewater treatment for leach field at the auxiliary control room located in the Unit 2 excavation

B-7
Permit Responsible Agency Number Expiration Date Authorized Activity
Industrial solid waste site identification
LDEQ G-089-3276 None Industrial solid waste generation
(a) The current air permit does not contain an expiration date. However, in 2015, the LDEQ promulgated amendments to LAC 33:III.503 to establish a regulatory framework setting forth renewal procedures and maximum terms for minor source air permits of not more than 10 years. Therefore, unless extended, RBS’s air permit will expire on July 8, 2019.
Source: Entergy 2017
B.3 References
10 CFR Part 20. Code of Federal Regulations, Title 10, Energy, Part 20, “Standards for Protection Against Radiation.”
10 CFR Part 50. Code of Federal Regulations, Title 10, Energy, Part 50, “Domestic Licensing of Production and Utilization Facilities.”
10 CFR Part 51. Code of Federal Regulations, Title 10, Energy, Part 51, “Environmental protection regulations for domestic licensing and related regulatory functions.”
10 CFR Part 54. Code of Federal Regulations, Title 10, Energy, Part 54, “Requirements for renewal of operating licenses for nuclear power plants.”
40 CFR Part 122. Code of Federal Regulations, Title 40, Protection of Environment, Part 122, “EPA administered permit programs: the National Pollutant Discharge Elimination System.”
Atomic Energy Act of 1954, as amended. 42 U.S.C. §2011 et seq.
Clean Air Act of 1963, as amended. 42 U.S.C. §7401 et seq.
Clean Water Act of 1977, as amended. 33 U.S.C. §1251 et seq.
Coastal Zone Management Act of 1972, as amended. 16 U.S.C. §1451 et seq.
Endangered Species Act of 1973, as amended. 16 U.S.C. §1531 et seq.
Energy Reorganization Act of 1974. 42 U.S.C. §5801 et seq.
[Entergy] Entergy Louisiana, LLC and Entergy Operations, Inc. 2017. Appendix E, Redacted Applicant’s Environmental Report, Operating License Renewal Stage, River Bend Station. West Feliciana Parish, LA. May 2017. 859 p. ADAMS Accession No. ML17174A531.
Fish and Wildlife Coordination Act of 1934, as amended. 16 U.S.C. §661 et seq.
[LDEQ undated] Louisiana Department of Environmental Quality. The Louisiana Peacetime Radiological Response Plan. Available at: <http://deq.louisiana.gov/page/radiological-emergency-planning-and-response-repr> (accessed August 6, 2018).
Marine Mammal Protection Act of 1972, as amended. 16 U.S.C. §1361 et seq.

B-8
Magnuson–Stevens Fishery Conservation and Management Act, as amended. 16 U.S.C. §1801 et seq.
National Environmental Policy Act of 1969, as amended. 42 U.S.C. §4321 et seq.
National Historic Preservation Act of 1966, as amended. 54 U.S.C. §300101 et seq.
Pollution Prevention Act of 1990. 42 U.S.C. §13101 et seq.
Resource Conservation and Recovery Act of 1976, as amended. 42 U.S.C. §6901 et seq.
Wild and Scenic Rivers Act, as amended. 16 U.S.C. §1271 et seq.

C-1
APPENDIX C CONSULTATION CORRESPONDENCE REVIEW
C.1 Endangered Species Act Section 7 Consultation
As a Federal agency, the U.S. Nuclear Regulatory Commission (NRC) must comply with the Endangered Species Act of 1973, as amended (16 United States Code (U.S.C.) § 1531 et seq.), as part of any action authorized, funded, or carried out by the agency. In this case, the proposed agency action is whether to issue a renewed license for the continued operation of River Bend Station, Unit 1 (RBS), which would authorize operation for an additional 20 years beyond the current license term. Under section 7 of the ESA, the NRC must consult with the U.S. Fish and Wildlife Service (FWS) and the National Marine Fisheries Service (NMFS) (referred to jointly as “the Services” and individually as “Service”), as appropriate, to ensure that the proposed agency action is not likely to jeopardize the continued existence of any endangered or threatened species or result in the destruction or adverse modification of designated critical habitat.
C.1.1 Federal Agency Obligations under Section 7, “Interagency Cooperation,” of theEndangered Species Act
The Endangered Species Act and the regulations that implement Section 7 of the Act (Title 50 of the Code of Federal Regulations (50 CFR) Part 402, “Interagency Cooperation—Endangered Species Act of 1973, as Amended”) describe the consultation process that Federal agencies must follow in support of agency actions. As part of this process, the Federal agency shall either request that the Services (1) provide a list of any listed or proposed species or designated or proposed critical habitats that may be present in the action area or (2) request that the Services concur with a list of species and critical habitats that the Federal agency has created (50 CFR 402.12(c)). If any such species or critical habitats may be present, the Federal agency prepares a biological assessment to evaluate the potential effects of the action and determine whether the species or critical habitat are likely to be adversely affected by the action (50 CFR 402.12(a); 16 U.S.C. § 1536(c)). Biological assessments are required for any agency action that is a “major construction activity” (50 CFR 402.12(b)), which is defined as a construction project or other undertaking having construction-type impacts that is a major Federal action significantly affecting the quality of the human environment under the National Environmental Policy Act of 1969, as amended (42 U.S.C. § 4321 et seq.; herein referred to as NEPA) (51 FR 19926). Federal agencies may fulfill their obligations to consult with the Services under ESA Section 7 and to prepare a biological assessment, if required, in conjunction with the interagency cooperation procedures required by other statutes, including NEPA (50 CFR 402.06(a)). In such cases, the Federal agency should include the results of the ESA Section 7 consultation in the NEPA document (50 CFR 402.06(b)).
C.1.2 Biological Assessment
License renewal does not require the preparation of a biological assessment because it is not a major construction activity. However, this supplemental environmental impact statement (SEIS) includes an evaluation of the potential impacts to federally listed species and critical habitats to support the NRC’s Endangered Species Act effect determinations for listed species and critical habitats that may occur in the action area.

C-2
The NRC staff structured its evaluation in accordance with the Services’ suggested biological assessment contents described at 50 CFR 402.12(f). Section 3.8 of this report describes the action area as well as the federally listed and proposed species and designated and proposed critical habitats potentially present in the action area. This section includes information pursuant to 50 CFR 402.12(f)(1), (2), and (3). Section 4.8 of this SEIS provides an assessment of the potential effects of the proposed RBS license renewal on the species and critical habitats present. This section also contains the NRC’s effect determinations, which are consistent with those in Section 3.5 of the Endangered Species Consultation Handbook (FWS and NMFS 1998). Finally, Section 4.8 addresses cumulative effects and alternatives to the proposed action pursuant to 50 CFR 402.12(f)(4) and (5).
C.1.3 Chronology of Endangered Species Act Section 7 Consultation
Endangered Species Act Section 7 Consultation with the U.S. Fish and Wildlife Service
During its review of the Entergy Louisiana, LLC and Entergy Operations, Inc. (collectively referred to as Entergy) license renewal application, the NRC staff considered whether any federally listed, proposed, or candidate species or proposed or designated critical habitats may be present in the action area (as defined at 50 CFR 402.02) for the proposed RBS license renewal. With respect to species under the FWS’s jurisdiction, the NRC staff submitted project information to the Service’s Environmental Conservation Online System (ECOS) Information for Planning and Conservation (IPaC) system to obtain a list of species in accordance with 50 CFR 402.12(c). On August 30, 2017, the Service provided the NRC with a list of threatened and endangered species that may occur in the proposed action area. The list included one species, the pallid sturgeon (Scaphirhynchus albus), and stated that no critical habitats are within the project area under review.
The NRC staff evaluated the potential impacts to the pallid sturgeon in Section 3.8 and Section 4.8 of this SEIS. The staff concludes that the proposed license renewal may affect, but is not likely to adversely affect, the pallid sturgeon. No other listed species, proposed or candidate species, or proposed or designated critical habitats occur in the action area.
By letter dated June 5, 2018, the NRC staff submitted a copy of the draft SEIS to the FWS for review accompanied by a request for the Service to concur with the staff’s “not likely to adversely affect” determination in accordance with 50 CFR 402.12(j). By letter dated August 29, 2018, the FWS concurred with the staff’s determination. The FWS’s concurrence letter concluded consultation, and the letter documents that the NRC staff has fulfilled its ESA Section 7(a)(2) obligations with respect to the proposed RBS license renewal.
Table C-1 lists the letters and other correspondence pursuant to the NRC’s compliance with the Endangered Species Act Section 7 for RBS license renewal.

C-3
Table C-1. Endangered Species Act Section 7 Consultation Correspondence with the U.S. Fish and Wildlife Service
Date Sender and Recipient Description ADAMS Accession No.(a)
August 30, 2017 Louisiana Ecological Services Field Office (FWS) to B. Grange (NRC)
List of threatened and endangered species for the proposed RBS license renewal
ML17242A116
June 5, 2018 B. Beasley (NRC) to M. Sikes (FWS)
Request for concurrence with the NRC’s determination that license renewal of RBS is not likely to adversely affect the pallid sturgeon
ML18095A164
August 29, 2018 J. Ranson (FWS) to B. Beasley (NRC)
Concurrence with the NRC’s determination that license renewal of RBS is not likely to adversely affect the pallid sturgeon
ML18241A321
(a) Access these documents through the NRC’s Agencywide Documents Access and Management System (ADAMS) at http://adams.nrc.gov/wba/.
Endangered Species Act Section 7 Consultation with the National Marine Fisheries Service
As discussed in Section 3.8 and Section 4.8 of this report, no federally listed species or critical habitats under the NMFS’s jurisdiction occur within the action area. Therefore, the NRC did not engage the NMFS pursuant to ESA Section 7 for the proposed RBS license renewal.
C.2 Essential Fish Habitat Consultation
The NRC must comply with the Magnuson–Stevens Fishery Conservation and Management Act, as amended (16 U.S.C. § 1801 et seq.), for any actions authorized, funded, or undertaken, or proposed to be authorized, funded, or undertaken that may adversely affect any essential fish habitat (EFH) identified under the Magnuson–Stevens Act.
In Sections 3.8 and 4.8 of this SEIS, the NRC staff concludes that, under the Magnuson–Stevens Act, the NMFS has not designated any essential fish habitat in the Mississippi River and that the proposed RBS license renewal would have no effect on essential fish habitat. Thus, the Magnuson–Stevens Act does not require the NRC to consult with the NMFS for the proposed action.
C.3 National Historic Preservation Act Section 106 Consultation
The National Historic Preservation Act of 1966, as amended (NHPA), requires Federal agencies to consider the effects of their undertakings on historic properties and consult with applicable State and Federal agencies, Tribal groups, individuals, and organizations with a demonstrated interest in the undertaking before taking action. Historic properties are defined as resources that are eligible for listing on the National Register of Historic Places. The historic preservation review process (Section 106 of the NHPA) is outlined in regulations issued by the Advisory Council on Historic Preservation (ACHP) in 36 CFR Part 800, “Protection of Historic Properties.” In accordance with 36 CFR 800.8(c), “Use of the NEPA Process for Section 106 Purposes,” the NRC has elected to use the NEPA process to comply with its obligations under Section 106 of the National Historic Preservation Act.

C-4
Table C-2 lists the chronology of consultation and consultation documents related to the NRC’s National Historic Preservation Act Section 106 review of the RBS license renewal. The NRC staff is required to consult with the noted agencies and organizations in accordance with the statutes listed above.
Table C-2. National Historic Preservation Act Correspondence
Date Sender and Recipient Description ADAMS Accession No. (a)
September 15, 2017 B. Beasley (NRC) to M. Darden, Chitimacha Tribe of Louisiana
Request for scoping comments/notification of Section 106 review
ML17255A024
September 15, 2017 B. Beasley (NRC) to L. Poncho, Coushatta Tribe of Louisiana
Request for scoping comments/notification of Section 106 review
ML17255A024
September 15, 2017 B. Beasley (NRC) to B.C. Smith, Jena Band of Choctaw Indians
Request for scoping comments/notification of Section 106 review
ML17255A024
September 15, 2017 B. Beasley (NRC) to J.P. Barbry, Tunica-Biloxi Tribe of Louisiana
Request for scoping comments/notification of Section 106 review
ML17255A024
September 15, 2017 B. Beasley (NRC) to J.A. Battise, Alabama Coushatta Tribe of Texas
Request for scoping comments/notification of Section 106 review
ML17255A024
September 15, 2017 B. Beasley (NRC) to G. Batton, The Choctaw Nation of Oklahoma
Request for scoping comments/notification of Section 106 review
ML17255A024
September 15, 2017 B. Beasley (NRC) to P.J. Anderson, Mississippi Band of Choctaw Indians
Request for scoping comments/notification of Section 106 review
ML17255A024
September 15, 2017 B. Beasley (NRC) to L.M. Harjo, The Seminole Nation of Oklahoma
Request for scoping comments/notification of Section 106 review
ML17255A024
September 15, 2017 B Beasley (NRC) to M. W. Osceola, Seminole Tribe of Florida
Request for scoping comments/notification of Section 106 review
ML17255A024
September 15, 2017 B. Beasley (NRC) to P. Boggan, Louisiana Office of Cultural Development
Request for scoping comments/notification of Section 106 review
ML17255A051
September 15, 2017 B. Beasley (NRC) to R. Nelson, Advisory Council on Historic Preservation
Request for scoping comments/notification of Section 106 review
ML17255A036
(a) Access these documents through the NRC’s Agencywide Documents Access and Management System (ADAMS) at http://adams.nrc.gov/wba/.

C-5
C.4 References
36 CFR Part 800. Code of Federal Regulations, Title 36, Parks, Forests, and Public Property, Part 800, “Protection of historic properties.”
50 CFR Part 402. Code of Federal Regulations, Title 50, Wildlife and Fisheries, Part 402, “Interagency cooperation—Endangered Species Act of 1973, as amended.”
51 FR 19926. U.S. Fish and Wildlife Service and National Marine Fisheries Service. Interagency cooperation—Endangered Species Act of 1973, as amended; final rule. Federal Register 51:19926-19963. June 3, 1986.
[ESA] Endangered Species Act of 1973, as amended. 16 U.S.C. § 1531 et seq.
[FWS and NMFS] U.S. Fish and Wildlife Service and National Marine Fisheries Service. 1998. Endangered Species Consultation Handbook: Procedures for Conducting Consultation and Conference Activities Under Section 7 of the Endangered Species Act. March 1998. 315 p. Available at <http://www.fws.gov/endangered/esa-library/pdf/esa_section7_handbook.pdf> (accessed 16 January 2018).
[MSA] Magnuson–Stevens Fishery Conservation and Management Act, as amended. 16 U.S.C. § 1801 et seq.
[NEPA] National Environmental Policy Act of 1969, as amended. 42 U.S.C. § 4321 et seq.
[NHPA] National Historic Preservation Act of 1966, as amended. 54 U.S.C. § 300101 et seq.


D-1
APPENDIX D CHRONOLOGY OF ENVIRONMENTAL REVIEW CORRESPONDENCE
This appendix contains a chronological listing of correspondence between the U.S. Nuclear Regulatory Commission (NRC) and external parties as part of the agency’s environmental review of the River Bend Station, Unit 1 (RBS) license renewal application (LRA). This appendix does not include consultation correspondence or comments received during the scoping process. For a list and discussion of consultation correspondence, see Appendix C of this supplemental environmental impact statement (SEIS). For scoping comments, see Appendix A of this SEIS and the NRC’s, “Scoping Summary Report” (Agencywide Documents Access and Management System (ADAMS) Accession No. ML17362A554). All documents are available electronically from the NRC’s Public Electronic Reading Room found at: http://www.nrc.gov/reading-rm.html. From this site, the public can gain access to ADAMS, which provides text and image files of the NRC’s public documents. The ADAMS accession number for each document is included in the following table.
D.1 Environmental Review Correspondence
Table D-1 lists the environmental review correspondence, by date, beginning with the request by Entergy Louisiana, LLC and Entergy Operations, Inc. (collectively referred to as Entergy) to renew the operating license for RBS.
Table D-1. Environmental Review Correspondence
Date Correspondence Description ADAMS Accession No.
May 25, 2017 Transmittal of RBS license renewal application from Entergy to NRC
ML17153A285
June 20, 2017 Letter from NRC to Entergy regarding receipt and availability of RBS license renewal application
ML17156A093
July 10, 2017 Letter from NRC to Entergy—supplemental information needed for acceptance of requested licensing action
ML17186A159
August 1, 2017 Letter from Entergy to NRC with supplemental information ML17213A064 August 7, 2017 Determination of acceptability and sufficiency for docketing,
proposed review schedule, and opportunity for a hearing regarding the application for renewed operating licenses for RBS
ML17187A035
September 14, 2017 Notice of intent to prepare an environmental impact statement and conduct scoping for RBS license renewal
ML17223A193
September 19, 2017 Transcript from public scoping meeting ML17293A547 October 13, 2017 Letter from NRC to Entergy transmitting severe accident
mitigation alterative (SAMA) audit plan ML17284A100
October 13, 2017 Letter from NRC to Entergy transmitting environmental audit plan
ML17278A775
November 7, 2017 Letter from NRC to Entergy transmitting environmental requests for additional information (RAIs)
ML17311A422
November 8, 2017 Letter from NRC to Entergy transmitting SAMA requests for additional information (RAIs)
ML17317A002

D-2
Date Correspondence Description ADAMS Accession No.
November 27, 2017 Letter from NRC to Entergy transmitting environmental audit summary ML17319A503
December 5, 2017 Letter from Entergy to NRC transmitting SAMA RAI responses
ML17339A795
December 5, 2017 Letter from Entergy to NRC transmitting responses to environmental RAIs
ML17353A049
December 7, 2017 Letter from NRC to Entergy transmitting SAMA audit summary
ML17324A506
January 24, 2018 Letter from Entergy transmitting clarification of SAMA RAI responses
ML18025B711
April 24, 2018 Scoping Summary Report ML17362A554

E-1
APPENDIX E PROJECTS AND ACTIONS CONSIDERED IN THE CUMULATIVE
IMPACTS ANALYSIS REVIEW
Table E-1 identifies projects and actions the U.S. Nuclear Regulatory Commission (NRC) staff considered when analyzing cumulative environmental impacts related to the continued operation of River Bend Station, Unit 1 (RBS) for an additional 20-years after the current licensing period. For an analysis of the potential cumulative impacts associated with each of these projects and actions, see Chapter 4 (Section 4.16) of this report. However, please note that Chapter 4 does not consider every project and action listed in Table E-1 in each resource area because of the uniqueness of the resource and its geographic area of consideration.
Table E-1. Projects and Actions NRC Staff Considered in the Cumulative Impacts Analysis
Project Name Summary of Project
Location (Relative to RBS) Status
Onsite Facilities/Projects
River Bend Station demolition activities
Demolition of retired support facilities Onsite
Demolition of the old Maintenance Shop and ANCO building were completed in October 2017. Demolition of the Field Administration Building will occur in 2018. The Pipe Shop requires further evaluation prior to demolition and presently has no set schedule. (Entergy 2017a)
River Bend Station Independent Spent Fuel Storage Installation Expansion
Planned expansion of existing storage facility to add additional pad Onsite
Construction scheduled for 2020. (Entergy 2017a)
Nuclear Energy Facilities
Waterford Steam Electric Station, Unit 3
Nuclear power plant; one 1,188-MWe Combustion Engineering design pressurized-water reactor
St Charles Parish, LA, approximately 75 mi (121 km) southeast. The 50-mi (80-km) radius of this facility overlaps with that of River Bend Station.
Operational (Entergy 2017b; NRC 2017)

E-2
Project Name Summary of Project
Location (Relative to RBS) Status
Fossil Fuel Energy Facilities
Big Cajun I Power Plant
Natural gas-fueled plant with 430-MW generating capacity
Jarreau, LA, approximately 6 mi (10 km) south-southwest
Operational (EIA 2017a; NRG 2015a)
Big Cajun II Power Plant
Coal- and natural gas-fueled plant with 1,743-MW generating capacity (from two coal units (totaling 1,168 MW) and one natural gas unit (575 MW))
Jarreau, LA, approximately 3 mi (5 km) southwest
Operational (EIA 2017b; NRG 2015b)
New Roads Power Plant
Natural gas-fueled peaking plant with approximately 7 MW generating capacity collocated with Big Cajun II
Jarreau, LA, approximately 3 mi (5 km) southwest
Operational (EIA 2017c)
Louisiana 1 Power Plant
Industrial gas-fueled plant with approximately 382 MW generating capacity
Baton Rouge, LA, approximately 20 mi (32 km) east-southeast
Operational (EIA 2017d)
Louisiana 2 Power Plant
Natural gas-fueled plant with 138 MW generating capacity
Baton Rouge, LA, approximately 20 mi (32 km) east-southeast
Operational (EIA 2017e)
Renewable Energy Facilities FSidney A. Murray Jr., HHydroelectric Station
Hydroelectric facility with approximately 192 MW generating capacity
Concordia Parrish, LA, approximately 28 mi (46 km) northwest
Operational (EIA 2017f)
Manufacturing Facilities
Hood Container of Louisiana, St. Francisville Mill
Proposed expansion of corrugated paper plant with approximately 17 MW capacity, biomass-fueled, combined heat and power plant
West Feliciana Parish, LA, approximately 3 mi (5 km) south
Operational (CPE 2016; EIA 2017j; EPA 2017c)
Georgia Pacific
Paper manufacturing plant with approximately 128 MW capacity, biomass-fueled, combined heat and power plant
East Baton Rouge Parish, LA, approximately 8 mi (13 km) south-southeast
Operational (EIA 2017g; EPA 2017b)
ExxonMobil
Petroleum refinery with approximately 77 MW capacity, natural gas-fueled, combined heat and power plant
East Baton Rouge Parish, LA, approximately 21 mi (34 km) south-southeast
Operational (EIA 2017h; ExxonMobil 2017a)
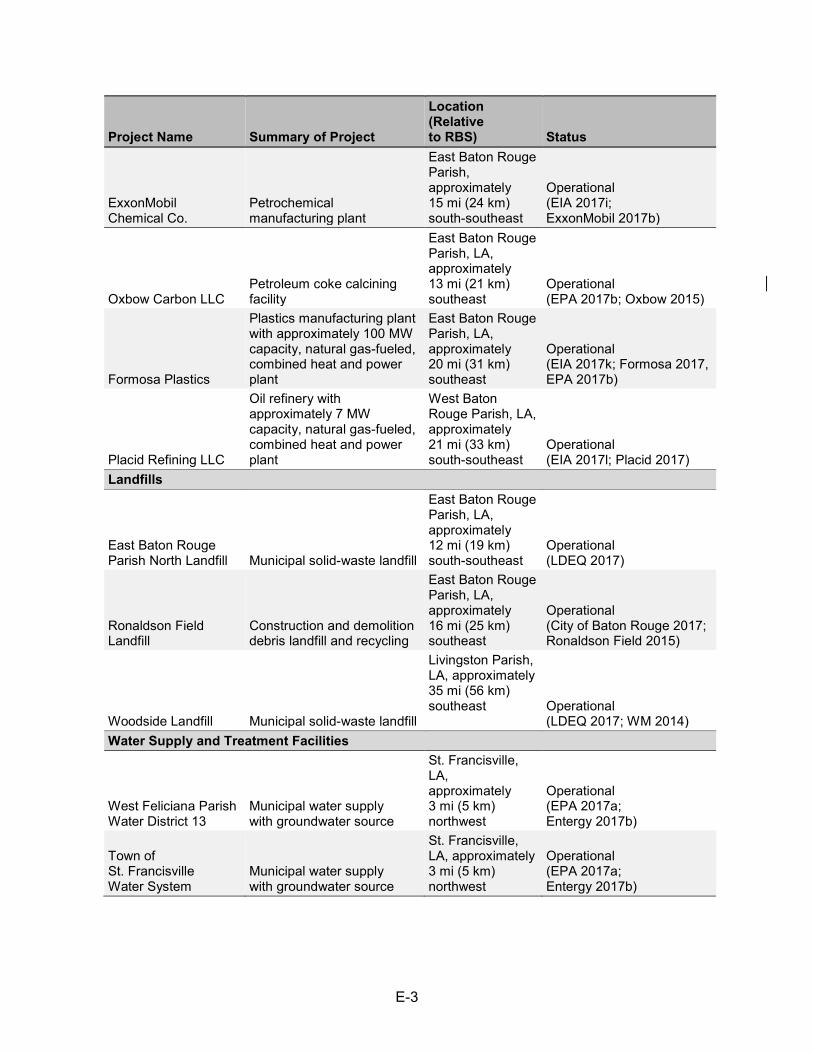
E-3
Project Name Summary of Project
Location (Relative to RBS) Status
ExxonMobil Chemical Co.
Petrochemical manufacturing plant
East Baton Rouge Parish, approximately 15 mi (24 km) south-southeast
Operational (EIA 2017i; ExxonMobil 2017b)
Oxbow Carbon LLC Petroleum coke calcining facility
East Baton Rouge Parish, LA, approximately 13 mi (21 km) southeast
Operational (EPA 2017b; Oxbow 2015)
Formosa Plastics
Plastics manufacturing plant with approximately 100 MW capacity, natural gas-fueled, combined heat and power plant
East Baton Rouge Parish, LA, approximately 20 mi (31 km) southeast
Operational (EIA 2017k; Formosa 2017, EPA 2017b)
Placid Refining LLC
Oil refinery with approximately 7 MW capacity, natural gas-fueled, combined heat and power plant
West Baton Rouge Parish, LA, approximately 21 mi (33 km) south-southeast
Operational (EIA 2017l; Placid 2017)
Landfills
East Baton Rouge Parish North Landfill Municipal solid-waste landfill
East Baton Rouge Parish, LA, approximately 12 mi (19 km) south-southeast
Operational (LDEQ 2017)
Ronaldson Field Landfill
Construction and demolition debris landfill and recycling
East Baton Rouge Parish, LA, approximately 16 mi (25 km) southeast
Operational (City of Baton Rouge 2017; Ronaldson Field 2015)
Woodside Landfill Municipal solid-waste landfill
Livingston Parish, LA, approximately 35 mi (56 km) southeast Operational
(LDEQ 2017; WM 2014) Water Supply and Treatment Facilities
West Feliciana Parish Water District 13
Municipal water supply with groundwater source
St. Francisville, LA, approximately 3 mi (5 km) northwest
Operational (EPA 2017a; Entergy 2017b)
Town of St. Francisville Water System
Municipal water supply with groundwater source
St. Francisville, LA, approximately 3 mi (5 km) northwest
Operational (EPA 2017a; Entergy 2017b)

E-4
Project Name Summary of Project
Location (Relative to RBS) Status
Baton Rouge Water Company
Municipal water supply with groundwater source
Baton Rouge, LA, approximately 26 mi (42 km) southeast
Operational (EPA 2017b; Entergy 2017b)
City of Baker Water System
Municipal water supply with groundwater source
Baker, LA, approximately 15 mi (24 km) southeast
Operational (EPA 2017b; Entergy 2017b)
Zachary Water System
Municipal water supply with groundwater source
Zachary, LA, approximately 13 mi (21 km) southeast
Operational (EPA 2017b; Entergy 2017b)
Louisiana State Penitentiary
Penitentiary water supply with groundwater source
Angola, LA, approximately 20 mi (33 km) northwest
Operational (EPA 2017a)
Town of St. Francisville Wastewater Treatment Plant Wastewater treatment plant
St. Francisville, LA, approximately 4 mi (6 km) west northwest
Operational (Entergy 2017b; EPA 2017c)
North Wastewater Treatment Plant Wastewater treatment plant
Baton Rouge, LA, approximately 17 mi (28 km) southeast
Operational (Entergy 2017b; EPA 2017d)
Central Wastewater Treatment Plant Wastewater treatment plant
Baton Rouge, LA, approximately 24 mi (39 km) southeast
Operational (Entergy 2017b; EPA 2017d)
South Wastewater Treatment Plant Wastewater treatment plant
Baton Rouge, LA, approximately 30 mi (49 km) southeast
Operational (Entergy 2017b; EPA 2017d)
Various minor National Pollutant Discharge Elimination System permitted wastewater discharges
Various businesses with smaller wastewater discharges
Within 50 mi (31 km)
Operational (EPA 2017c 2017d)
Parks and Recreation Sites
Audubon State Historic Site
100-ac (40-ha) historic site offering hiking, picnicking, and birdwatching
Approximately 3 mi (5 km) northeast
Operational; Managed by Louisiana Department of Culture, Recreation, and Tourism (Entergy 2017b; DCRT 2017a)

E-5
Project Name Summary of Project
Location (Relative to RBS) Status
Rosedown Plantation State Historic Site
370-ac (150-ha) historic site offering tours, hiking, and picnicking
Approximately 3 mi (5 km) northwest
Operational; Managed by Louisiana Department of Culture, Recreation, and Tourism (Entergy 2017b; DCRT 2017b)
Port Hudson Battlefield/Port Hudson State Historic Site
900-ac (360-ha) state historic site offering hiking, picnicking, and birdwatching
Approximately 6 mi (10 km) southeast
Operational; Managed by Louisiana Department of Culture, Recreation, and Tourism (Entergy 2017b; DCRT 2017c; NPS 2017)
Cat Island National Wildlife Refuge
10,500-ac (4,300-ha) refuge offering hunting, fishing, hiking, and canoeing
Approximately 6 mi (10 km) west-northwest
Operational; Managed by U.S. Fish and Wildlife Service (Entergy 2017b, USFWS 2017d)
Homochitto National Forest
192,000-ac (78,000-ha) recreation area offering hunting, picnicking, camping, and hiking
Extends across multiple Mississippi counties, approximately 36 mi (58 km) north-northeast
Operational; Managed by U.S. Forest Service (Entergy 2017b; USDA 2012)
Tunica Hills Wildlife Management Area
6,500-ac (2,600-ha) wildlife management area offering hunting, trapping, hiking, camping, birding, biking, and horseback riding
Approximately 15 mi (24 km) northwest
Operational; Managed by Louisiana Department of Wildlife and Fisheries (Entergy 2017b; LDWF 2017c)
Port Hudson National Cemetery
20-ac (8-ha) Civil War-era military cemetery
Approximately 7 mi (12 km) east-northeast
Operational; Managed by the U.S. Department of Veterans Affairs (Entergy 2017b; NPS 2017)
Atchafalaya National Wildlife Refuge/ Sherburne Wildlife Management Area/ Bayou Des Ourses Area
44,000-ac (18,000-ha) combined tract of Federal and state wildlands
Approximately 25 mi (40 km) southwest
Operational; Managed by as a single unit by the Louisiana Department of Wildlife and Fisheries (USFWS 2017a; Entergy 2017b)
Lake Ophelia National Wildlife Refuge
17,500-ac (7,100-ha) refuge offering hunting, fishing, boating, and hiking
Approximately 40 mi (64 km) northwest
Operational; Managed by U.S. Fish and Wildlife Service (USFWS 2017b; Entergy 2017b)
St. Catherine Creek National Wildlife Refuge
24,600-ac (10,000-ha) refuge offering hunting, fishing, hiking, and canoeing
Approximately 40 mi (64 km) north
Operational; Managed by U.S. Fish and Wildlife Service (USFWS 2017c; Entergy 2017b)

E-6
Project Name Summary of Project
Location (Relative to RBS) Status
Mary Ann Brown Nature Preserve
100-ac (40-ha) preserve offering hiking, camping picnicking, and birdwatching
Approximately 6 mi (10 km) northeast
Operational; Managed by the Nature Conservancy (TNC 2018, Entergy 2017b)
Richard K. Yancey Wildlife Management Area
70,000-ac (28,000-km) wildlife management area offering hunting, trapping, fishing, boating, and camping
Concordia Parish, LA, approximately 25 mi (40 km) northwest
Operational; Managed by Louisiana Department of Wildlife and Fisheries (Entergy 2017b; LDWF 2017a)
Thistlewaite Wildlife Management Area
11,000-ac (4,500-km) wildlife management area offering hunting, trapping, birding, and hiking
St. Landry Parish, LA, approximately 38 mi (61 km) west-southwest
Operational; Managed by Louisiana Department of Wildlife and Fisheries (Entergy 2017b; LDWF 2017b)
Recreational Areas Various parks, boat launches, and campgrounds
Within 10 mi (16 km) Operational
Transportation Projects
Baton Rouge Metropolitan Airport
Full-service commercial airport
In East Baton Rouge Parish, LA, approximately 19 mi (30 km) southeast
Operational; Environmental Assessment being prepared to address potential impacts from proposed runway expansion and improvements (BTR 2017)
Other Aviation Facilities
Six private heliports, three private airfields, and one public general aviation airport
Located within 10 mi (16 km) of River Bend Station
Operational (Entergy 2017b)
Other Facilities/Projects
West Feliciana Parish Hospital New hospital construction
Approximately 3 mi (1.2 km) west-northwest
Construction completed August 2017 (Entergy 2017a)
Bayou Sara Streambank Stabilization Project
Proposed project to address severe streambank erosion threatening St. Francisville wastewater treatment facility, levees, and road access
Approximately 4 mi (6 km) west-northwest southeast
U.S. Federal Emergency Management Agency evaluating funding request (Entergy 2017a)
Joint Emergency Services Training Center (JESTC)
Louisiana State Police Joint Emergency Services Training Center featuring emergency vehicle tracks, explosives ranges, and tactical firearm ranges
Zachery, LA, approximately 11 mi (18 km) south-southeast
Operational (JESTC 2017)
St. Francisville Army Corps of Engineers Mat Yard
210 ac (85 ha) plant and storage yard for casting concrete erosion control mats
St. Francisville, LA. approximately 3 mi (5 km) west-northwest
Operational (USACE 2017)

E-7
Project Name Summary of Project
Location (Relative to RBS) Status
Future Development
Construction of housing units and associated commercial buildings; roads, bridges, and rail; water and/or wastewater treatment and distribution facilities; and associated pipelines as described in local land-use planning documents Throughout region
Construction would occur in the future, as described in State and local land-use planning documents
E.1 References
[BTR] Baton Rouge Metropolitan Airport. 2017. Available at <https://flybtr.com/> (accessed 15 November 2017).
City of Baton Rouge. 2017. Natural Resources Recovery. Available at <http://brgov.com/recycle/natresources.htm> (accessed 12 December 2017).
[CPE] Commercial Property Executive. 2016. “Hood Container Expands Manufacturing Facility in Louisiana” November 22. Available at <https://www.cpexecutive.com/post/hood-container-expands-manufacturing-facility-in-louisiana/> (accessed 20 November 2017).
[DCRT] Louisiana Department of Culture, Recreation, and Tourism. 2017a. Audubon State Historic Site. Available at <https://www.crt.state.la.us/louisiana-state-parks/historic-sites/audubon-state-historic-site/index> (accessed 16 November 2017).
[DCRT] Louisiana Department of Culture, Recreation, and Tourism. 2017b. Rosedown Plantation State Historic Site. Available at <https://www.crt.state.la.us/louisiana-state-parks/historic-sites/rosedown-plantation-state-historic-site/index > (accessed 18 December 2017).
[DCRT] Louisiana Department of Culture, Recreation, and Tourism. 2017c. Port Hudson State Historic Site. Available at <https://www.crt.state.la.us/louisiana-state-parks/historic-sites/port-hudson-state-historic-site/index> (accessed 18 December 2017).
[EIA] U.S. Energy Information Administration. 2017a. “Louisiana State Profile and Energy Estimates, Profile Overview Interactive Map – Big Cajun I.” Available at <https://www.eia.gov/state/?sid=LA> (accessed 17 November 2017).
[EIA] U.S. Energy Information Administration. 2017b. “Louisiana State Profile and Energy Estimates, Profile Overview Interactive Map – Big Cajun II.” Available at <http://www.eia.gov/state/?sid=LA> (accessed 17 November 2017).
[EIA] U.S. Energy Information Administration. 2017c. “Louisiana State Profile and Energy Estimates, Profile Overview Interactive Map – New Roads.” Available at <http://www.eia.gov/state/?sid=LA> (accessed 17 November 2017).

E-8
[EIA] U.S. Energy Information Administration. 2017d. “Louisiana State Profile and Energy Estimates, Profile Overview Interactive Map – Louisiana 1.” Available at <http://www.eia.gov/state/?sid=LA> (accessed 17 November 2017).
[EIA] U.S. Energy Information Administration. 2017e. “Louisiana State Profile and Energy Estimates, Profile Overview Interactive Map – Louisiana 2.” Available at <http://www.eia.gov/state/?sid=LA> (accessed 17 November 2017).
[EIA] U.S. Energy Information Administration. 2017f. “Louisiana State Profile and Energy Estimates, Profile Overview Interactive Map – Sidney A Murray Jr Hydroelectric.” Available at <http://www.eia.gov/state/?sid=LA> (accessed 17 November 2017).
[EIA] U.S. Energy Information Administration. 2017g. “Louisiana State Profile and Energy Estimates, Profile Overview Interactive Map – Georgia Pacific Port Hudson.” Available at <https://www.eia.gov/state/?sid=LA> (accessed 17 November 2017).
[EIA] U.S. Energy Information Administration. 2017h. “Louisiana State Profile and Energy Estimates, Profile Overview Interactive Map – ExxonMobil Baton Rouge.” Available at <http://www.eia.gov/state/?sid=LA> (accessed 17 November 2017).
[EIA] U.S. Energy Information Administration. 2017i. “Louisiana State Profile and Energy Estimates, Profile Overview Interactive Map – ExxonMobil Chemical.” Available at <http://www.eia.gov/state/?sid=LA> (accessed 17 November 2017).
[EIA] U.S. Energy Information Administration. 2017j. “Louisiana State Profile and Energy Estimates, Profile Overview Interactive Map – Hood Container of Louisiana.” Available at <http://www.eia.gov/state/?sid=LA> (accessed 17 November 2017).
[EIA] U.S. Energy Information Administration. 2017k. “Louisiana State Profile and Energy Estimates, Profile Overview Interactive Map – Formosa Plastics.” Available at <http://www.eia.gov/state/?sid=LA> (accessed 17 November 2017).
[EIA] U.S. Energy Information Administration. 2017l. “Louisiana State Profile and Energy Estimates, Profile Overview Interactive Map – Placid Refining LLC.” Available at <http://www.eia.gov/state/?sid=LA> (accessed 17 November 2017).
[Entergy] Entergy Operations, Inc. 2017a. Letter from Maguire WF, Site Vice President, River Bend Station, to NRC Document Control Desk. Subject: Response to License Renewal Application (LRA) Request for Additional Information (RAI) Environmental River Bend Station, Unit 1. Docket No. 50-458, License No. NPF-47. December 5, 2017. ADAMS No. ML17353A048.
[Entergy] Entergy Operations, Inc. 2017b. River Bend Station, Unit 1, License Renewal Application. West Feliciana Parish, LA. May 2017. 1,301 p. ADAMS Accession Nos. ML17153A286 and ML17153A287.
[EPA] U.S. Environmental Protection Agency. 2017a. “Envirofacts Safe Drinking Water Information System (SDWIS) search results for West Feliciana Parish, Louisiana: List of Active Water Systems.” October 23, 2017. Available at <https://oaspub.epa.gov/enviro/sdw_query_ v3.get_list?wsys_name=&fac_search=fac_beginning&fac_county=WEST+FELICIANA+PARISH&fac_city=&pop_serv=500&pop_serv=3300&pop_serv=10000&pop_serv=100000&pop_serv=1

E-9
00001&sys_status=active&pop_serv=&wsys_id=&fac_state=LA&last_fac_name=&page=1&query_results=&total_rows_found=> (accessed 11 December 2017).
[EPA] U.S. Environmental Protection Agency. 2017b. “Envirofacts Safe Drinking Water Information System (SDWIS) search results for East Baton Rouge Parish, Louisiana: List of Active Water Systems.” October 23, 2017. Available at <https://oaspub.epa.gov/enviro/sdw_ query_v3.get_list?wsys_name=&fac_search=fac_beginning&fac_county=EAST+BATON+ROUGE+PARISH&fac_city=&pop_serv=500&pop_serv=3300&pop_serv=10000&pop_serv=100000&pop_serv=100001&sys_status=active&pop_serv=&wsys_id=&fac_state=LA&last_fac_name=&page=1&query_results=&total_rows_found=> (accessed 11 December 2017).
[EPA] U.S. Environmental Protection Agency. 2017c. “Envirofacts Multisystem Search – West Feliciana Parish, Louisiana”. Available at <https://iaspub.epa.gov/enviro/efsystemquery. multisystem?fac_search=primary_name&fac_value=&fac_search_type=Beginning+With&postal_code=&location_address=&add_search_type=Beginning+With&city_name=&county_name=West+Feliciana&state_code=LA&TribalLand=0&TribeType=selectTribeALL&selectTribe=noselect&selectTribe=noselect&tribedistance1=onLand&sic_type=Equal+to&sic_code_to=&naics_type=Equal+to&naics_to=&chem_name=&chem_search=Beginning+With&cas_num=&page_no=1&output_sql_switch=FALSE&report=1&database_type=Multisystem> (accessed 11 December 2017).
[EPA] U.S. Environmental Protection Agency. 2017d. “Envirofacts Multisystem Search – East Baton Rouge Parish, Louisiana”. Available at <https://iaspub.epa.gov/enviro/efsystemquery. multisystem?fac_search=primary_name&fac_value=&fac_search_type=Beginning+With&postal_code=&location_address=&add_search_type=Beginning+With&city_name=&county_name=East+Baton+Rouge&state_code=LA&TribalLand=0&TribeType=selectTribeALL&selectTribe=noselect&selectTribe=noselect&tribedistance1=onLand&sic_type=Equal+to&sic_code_to=&naics_type=Equal+to&naics_to=&chem_name=&chem_search=Beginning+With&cas_num=&page_no=1&output_sql_switch=FALSE&report=1&database_type=Multisystem> (accessed 11 December 2017).
[ExxonMobil] Exxon Mobil Corporation. 2017a. Baton Rouge Refinery Fact Sheet. Available at <http://cdn.exxonmobil.com/~/media/global/files/us-refineries/2017_brrf_fact_sheet.pdf> (accessed 4 December 2017).
[ExxonMobil] Exxon Mobil Corporation. 2017b. Baton Rouge Chemical Plant Fact Sheet. Available at <http://cdn.exxonmobil.com/~/media/global/files/us-refineries/2017_brcp_fact_sheet.pdf> (accessed 4 December 2017).
[Formosa] Formosa Plastics Corporation. 2017. Corporate Overview. Available at <http://www.fpcusa.com/company/news/company_literature/FPCUSA_CorporateOverview2017.pdf> (accessed 1 December 2017).
[JESTC] Joint Emergency Services Training Center. 2017. Available at <http://www.jestc.org/index.html> (accessed 15 November 2017).
[LDEQ] Louisiana Department of Environmental Quality. 2017. Louisiana Solid Waste Notifications. May. Available at <http://deq.louisiana.gov/assets/docs/Solid-Waste/Solid_Waste_Notification_Records.pdf> (accessed 11 December 2017).

E-10
[LDWF] Louisiana Department of Wildlife and Fisheries. 2017a. Richard K. Yancey Wildlife Management Area. Available at <http://www.wlf.louisiana.gov/wma/36994> (accessed 7 December 2017).
[LDWF] Louisiana Department of Wildlife and Fisheries. 2017b. Thistlethwaite Wildlife Management Area. Available at <http://www.wlf.louisiana.gov/wma/2755> (accessed 7 December 2017).
[LDWF] Louisiana Department of Wildlife and Fisheries. 2017c. Tunica Hills Wildlife Management Area. Available at <http://www.wlf.louisiana.gov/wma/2755> (accessed 18 December 2017).
[NPS] U.S National Park Service. 2017. Port Hudson. Available at <https://www.nps.gov/nr/travel/louisiana/por.htm> (accessed 18 December 2017).
[NRC] U.S. Nuclear Regulatory Commission. 2017. “Waterford Steam Electric Station, Unit 3.” February 10, 2017. Available at <https://www.nrc.gov/info-finder/reactors/wat3.html> (accessed 21 September 2017).
[NRG] NRG Energy, Inc. 2015a. Big Cajun I Fact Sheet. Available at <http://maps.nrg.com/media/attachments/PLA.2015_Big_Cajun_1_v4.pdf> (accessed 17 November 2017).
[NRG] NRG Energy, Inc. 2015b. Big Cajun II Fact Sheet. Available at <http://maps.nrg.com/media/attachments/PLA.2015_Big_Cajun_II_v4.pdf> (accessed 17 November 2017).
[Oxbow] Oxbow Carbon LLC. 2015. Calcining Fact Sheet. Available at <https://www.oxbow.com/Services_Value_Added_Services_Calcining.html> (accessed 18 December 2017).
[Placid] Placid Refining Company LLC. 2017. Company Overview. Available at <https://www.placidrefining.com/home.aspx> (accessed 18 December 2017).
[Ronaldson Field] Ronaldson Field Landfill. 2015. Facility Overview. Available at <http://www.ronaldsonfield.com/> (accessed 11 December 2017).
[TNC] The Nature Conservancy. 2018. “Louisiana - Mary Ann Brown Preserve.” Available at https://www.nature.org/ourinitiatives/regions/northamerica/unitedstates/louisiana/placesweprotect/mary-ann-brown-preserve.xml (accessed 8 January 2018).
[USDA] U.S. Department of Agriculture. 2012. Land Areas of the National Forest System. Available at <https://www.fs.fed.us/land/staff/lar/LAR2011/LAR2011_Book_A5.pdf> (accessed 7 December 2017).
[USACE] U. S. Army Corps of Engineers. 2017. New Orleans District – Concrete Mats. Available at <http://www.mvn.usace.army.mil/Missions/Engineering/Channel-Improvement-and-Stabilization-Program/Revetment-Types/Concrete/> (accessed 16 November 2017)
[USFWS] U.S. Fish and Wildlife Service. 2017a. Atchafalaya National Wildlife Refuge. Available at <https://www.fws.gov/refuge/atchafalaya/> (accessed 7 December 2017).

E-11
[USFWS] U.S. Fish and Wildlife Service. 2017b. Lake Ophelia National Wildlife Refuge. Available at <https://www.fws.gov/refuge/Lake_Ophelia/> (accessed 7 December 2017).
[USFWS] U.S. Fish and Wildlife Service. 2017c. St. Catherine Creek National Wildlife Refuge. Available at <https://www.fws.gov/refuge/st_catherine_creek/> (accessed 7 December 2017).
[USFWS] U.S. Fish and Wildlife Service. 2017d. Cat Island National Wildlife Refuge. Available at <https://www.fws.gov/refuge/Cat_Island/> (accessed 7 December 2017).
[WM] Waste Management. 2014. Woodside Landfill Fact Sheet. Available at <https://www.wmsolutions.com/pdf/factsheet/Woodside_Fact_Sheet.pdf> (accessed 12 December 2017).


F-1
APPENDIX F U.S. NUCLEAR REGULATORY COMMISSION STAFF EVALUATION OF SEVERE ACCIDENT MITIGATION ALTERNATIVES FOR RIVER BEND
STATION, UNIT 1, IN SUPPORT OF LICENSE RENEWAL APPLICATION REVIEW
F.1 Introduction
Entergy Louisiana, LLC and Entergy Operations, Inc. (Entergy or the applicant) submitted an assessment of severe accident mitigation alternatives (SAMAs) for River Bend Station (RBS), in Section 4.15 and Attachment D of the Environmental Report (ER) (Entergy 2017a). This assessment was based on the most recent revision to the RBS probabilistic risk assessment (PRA), including an internal events model and a plant-specific offsite consequence analysis performed using the MELCOR Accident Consequence Code System 2 (MACCS) computer code, as well as insights from the RBS individual plant examination (IPE) (Entergy 1993), the RBS individual plant examination of external events (IPEEE) (Entergy 1995), and the RBS internal flooding PRA. In identifying and evaluating potential SAMAs, Entergy considered SAMAs that addressed the major contributors to core damage frequency (CDF), population dose at RBS and offsite economic cost, as well as insights and SAMA candidates found to be potentially cost-beneficial from the analysis of other boiling water reactor (BWR) nuclear power generating stations. Entergy initially identified a list of 206 potential SAMAs. This list was reduced to 50 unique SAMA candidates by eliminating SAMAs that (a) were not applicable to RBS, (b) had already been implemented at RBS, (c) were combined with another SAMA candidate, (d) had an excessive implementation cost, or (e) were expected to have a very low benefit. Of the 50 unique SAMA candidates remaining, Entergy concluded in the ER that eight candidate SAMAs are potentially cost beneficial.
As a result of the review of the SAMA assessment, the U.S. Nuclear Regulatory Commission (NRC) staff issued a request for additional information (RAI) to Entergy by email dated November 8, 2017 (NRC 2017a). Key questions involved:
• the status of the Level 1 PRA model relative to current and planned future designand operating features,
• the modeling of containment failure in the Level 2 analysis,• the impact of Level 2 cutset truncation on the determination of Source Term
Category (STC) frequency,• selection of representative sequences for each STC in the Level 2 analysis,• clarifications of the adequacy of the treatment of external events in the SAMA
analysis,• selection of input parameters to the Level 3 analysis,• the review of the internal flood and fire PRA for identification of candidate SAMAs,• the use of the results of PRA importance analysis to identify RBS specific SAMA
candidates, and• further information on the cost-benefit analysis of several specific candidate SAMAs
and low-cost alternatives.

F-2
• the history and key changes to PRA models,• the results of an updated PRA,• the development of the Level 2 containment release model,• the modeling of containment failures,• the basis for inputs to the Level 3 analysis,• the identification and screening of SAMA candidates,• the results of an updated cost-benefit analysis for several SAMAs, and• the cost of various SAMAs and potential low-cost alternatives.
Entergy’s responses addressed the staff’s concerns and resulted in the identification of two additional potentially cost-beneficial SAMAs (RAI response to questions 5.b.ii and 6.c.i in Reference Entergy 2017b).
An assessment of the SAMAs for RBS is presented below. Guidance for the SAMA analysis submittal is provided in NEI 05-01A, “Severe Accident Mitigation Alternatives (SAMA) Guidance Document” (NEI 2005) which was endorsed in Regulatory Guide 4.2, Supplement 1 (NRC 2013).
F.2 Estimate of Risk for RBS
Section F.2.1 summarizes Entergy’s estimates of offsite risk at RBS. The summary is followed by the staff’s review of Entergy’s risk estimates in Section F.2.2.
F.2.1 Entergy’s Risk Estimates
Two distinct analyses are combined to form the basis for the risk estimates used in the RBS SAMA analysis: (1) the RBS Level 1 and 2 PRA model, which is an updated version of the RBS IPE (Entergy 1993), and (2) a supplemental analysis of offsite consequences and economic impacts (essentially a Level 3 PRA model) developed specifically for the RBS SAMA analysis. The scope of the RBS PRA used for the SAMA analysis, PRA Revision 5A (RBS R5A) does not include external events or internal flooding events.
The RBS internal events CDF is 2.79 × 10⁻⁶ per reactor-year as determined from quantification of the Level 1 PRA model. This value was used as the baseline CDF in the SAMA evaluations (Entergy 2017a). The CDF is based on the risk assessment for internally initiated events, which did not include internal flooding. Entergy did not explicitly include the contribution from external events within the RBS risk estimates; however, it did account for the potential risk reduction benefits associated with external events and internal flooding events by multiplying the estimated benefits for internal events by a factor of 7. This is discussed further in Sections F.2.2 and F.6.2.
The breakdown of CDF by initiating events is provided in Table F-1. As shown in this table, loss of offsite power (LOSP) and reactor/turbine trip are the dominant contributors to the CDF. While not listed explicitly in Table F-1 because they can occur as a result of multiple initiators, Entergy stated that station blackouts (SBO) contribute about 39 percent (1.1 × 10⁻⁶ per reactor-year) of the total internal events CDF and anticipated transients without scram (ATWS) contribute about 0.2 percent (6.6 × 10⁻⁹ per reactor-year) to the total internal events CDF (Entergy 2017a).
Entergy submitted additional information by letters dated December 5, 2017 (Entergy 2017b) and January 24, 2018 (Entergy 2018). In response to the staff RAIs, Entergy provided further information on:

F-3
Table F-1. RBS CDF For Internal Events
Initiating Event CDF (per reactor-year)
% CDF Contribution
Loss of Offsite Power 1.9 × 10⁻⁶ 69 Reactor Trip/Turbine Trip 2.8 × 10⁻⁷ 10 Inadvertent Opening of Safety Relief Valve (SRV) 1.5 × 10⁻⁷ 6 Failure of the Normal Service Water (NSW)/Service Water Cooling (SWC) System 1.2 × 10⁻⁷ 4
Loss of Condenser Heat Sink 7.3 × 10⁻⁸ 3 Loss of the Feedwater/Condensate System 6.8 × 10⁻⁸ 2 Loss of Offsite Power Lead RSS1 5.0 × 10⁻⁸ 2 Loss of Offsite Power Lead RSS2 5.0 × 10⁻⁸ 2 Other Initiating Eventsa 8.0 × 10⁻⁸ 3 Total CDF (Internal Events) 2.8 × 10⁻⁶ 100b a Multiple initiating events with each contributing less than 1 percent. b Sum of contributors does not add up to 100 percent due to round off error.
The full Level 2 RBS PRA model that forms the basis for the SAMA evaluation was developed specifically for the SAMA analysis. The RBS Level 2 model includes two types of considerations: 1) a deterministic analysis of the physical processes for a spectrum of severe accident progressions, and 2) a probabilistic analysis component in which the likelihoods of the various outcomes are assessed. The Level 2 model uses containment event trees (CETs) containing both phenomenological and systemic events. Each of the Level 1 core damage sequences is then evaluated by a CET to assess the frequency of various containment release modes based on the operational configurations of the RBS containment safeguard systems.
The CET considers the influence of physical and chemical processes on the integrity of the containment and on the release of fission products once core damage has occurred. The quantified CET sequences are binned into a set of end states that are subsequently grouped into 14 release categories (or source term categories - STCs) that provide the input to the Level 3 consequence analysis. The frequency of each STC was obtained by summing the frequency of the individual accident progression CET endpoints binned into the release category. Source terms were developed for the release categories using the results of Modular Accident Analysis Program (MAAP) Version 4.0.7 computer code calculations. From these results, source terms were chosen to be representative of the release categories. The results of this analysis for RBS are provided in Table D.1–7 of ER Attachment D (Entergy 2017a).
Entergy computed offsite consequences for potential releases of radiological material using the MACCS, Version 3.10.0 code and analyzed exposure and economic impacts from its determination of offsite and onsite risks. Inputs for these analyses include plant-specific and site-specific input values for core radionuclide inventory, source term and release characteristics, site meteorological data, projected population distribution and growth within a 50-mile (80-kilometer (km)) radius, emergency response evacuation modeling, and localeconomic data. Radionuclide inventory in the reactor core is based on a plant-specificevaluation and corresponds to 3,100 megawatts thermal (MWt), which is slightly higher than theRBS rated power Level of 3,091 MWt (Entergy 2017a, Attachment D). The estimation of onsiteimpacts (in terms of clean-up and decontamination costs and occupational dose) is based on

F-4
guidance in NUREG/BR-0184, Regulatory Analysis Technical Evaluation Handbook (NRC 1997a). Additional details on the input parameter assumptions are discussed below.
In Table D.1-22 of the ER, the applicant estimated the dose risk to the population within 80 km (50 mi) of the RBS site to be 0.0121 person-Sieverts (Sv) per year (1.21 person-rem per year) (Entergy 2017a). The population dose risk (PDR) and offsite economic cost risk (OECR) contributions by containment release mode are summarized in Table F-2. Containment penetration failures in which the containment fails prior to core damage and debris cooling is unsuccessful (STC9 and STC10) provide the greatest contribution, totaling approximately 85 percent of the PDR and 87 percent of the OECR.
Table F-2. Base Case Mean Population Dose Risk and Offsite Economic Cost Risk for Internal Events
Release Mode Population Dose Riska Offsite Economic Cost Risk
IDb Frequency (per year)
person- rem/yr
% Contribution $/yr %
Contribution STC1 (Intact) 5.6 × 10⁻⁷ 1.0 × 10⁻² 1 3.6 <1
STC4 2.0 × 10⁻⁸ 2.1 × 10⁻² 2 1.3 × 10² 2 STC7 6.4 × 10⁻⁸ 7.8 × 10⁻³ 1 5.8 <1 STC8 6.4 × 10⁻⁸ 1.2 × 10⁻² 1 1.8 × 101 <1 STC9 9.0 × 10⁻⁷ 4.7 × 10⁻¹ 39 2.5 × 10³ 34 STC10 9.0 × 10⁻⁷ 5.5 × 10⁻¹ 46 3.9 × 10³ 53 STC13 1.4 × 10⁻⁷ 6.1 × 10⁻² 5 2.9 × 10² 4 STC14 1.4 × 10⁻⁷ 6.9 × 10⁻² 6 4.7 × 10² 6 Otherc 5.6 × 10⁻⁹ 4.7 × 10⁻³ <1 3.0 × 101 <1 Total 2.8 × 10⁻⁶ 1.21 100d 7.3 × 10³ 100 a Unit Conversion Factor: 1 Sv = 100 rem. b Release Mode descriptions provided in Section D.1.2.3.1 of the ER (Entergy 2017a). c Multiple release categories with each contributing less than 1 percent to frequency, population dose,
and offsite economic cost risk. d Sum of contributors does not add up to 100 percent due to round off error.
F.2.2 Review of Entergy’s Risk Estimates
Entergy’s determination of offsite risk at RBS is based on three major elements of analysis:
• the Level 1 risk models that form the bases for the 1993 IPE submittal (Entergy 1993), and the external event analyses of the 1995 IPEEE submittal (Entergy 1995),
• the major modifications to the IPE model that have been incorporated in the 2015 RBS R5A PRA; a new full Level 2 risk model; a standalone updated 2012 internal floods model and the 1995 IPEEE fire assessment, and
• the combination of offsite consequence measures from MACCS analyses with release frequencies and radionuclide source terms from the Level 2 PRA model.

F-5
Each analysis element was reviewed to determine the acceptability of Entergy’s risk estimates for the SAMA analysis, as summarized further in this section.
F.2.2.1 Internal Events CDF Model
Section 11.2.3.1 of NUREG–1560, Volume 2, Individual Plant Examination Program: Perspectives on Reactor Safety and Plant Performance Parts 2–5, Final Report (NRC 1997b) shows that the IPE-based total internal events CDF for BWR 5/6 plants ranges from 1 × 10⁻⁵ per year to 4 × 10⁻⁵ per year, with an average CDF for the group of 2 × 10⁻⁵ per year. The internal events CDF value from the 1993 RBS IPE (1.55 × 10⁻⁵ per reactor-year) is consistent with the values reported at that time for other BWR 5 and BWR 6 units. Other plants have updated the values for CDF subsequent to the IPE submittals to reflect modeling and hardware changes, which in many cases, has resulted in substantially reduced CDFs compared to those reported in the IPE. The internal events CDF result for RBS that was used for the SAMA analysis (2.79 × 10⁻⁶ per year) is in the range reported in previous SAMA analyses for other similar plants.
From its review of the RBS IPE submittal, the NRC staff concluded that the licensee's IPE process was capable of identifying the most likely severe accidents and severe accident vulnerabilities, and therefore, the RBS IPE process met the intent of Generic Letter (GL) 88-20 (NRC 1996). Although no vulnerabilities were identified in the IPE, a number of improvements were identified by Entergy. The NRC staff’s IPE safety evaluation report (SER) indicated that seven improvements had been implemented.
There have been nine revisions to the RBS IPE Level 1 model since the 1993 IPE submittal leading up to Revision 5A that was utilized for the SAMA analysis. A listing of the changes made to the RBS PRA since the original IPE submittal, with corresponding CDF and Large Early Release Frequency (LERF) results (Entergy 2017a, Entergy 2017b), is summarized in Table F-3. A comparison of internal events CDF between the 1993 IPE and the Revision 5A PRA model indicates a significant decrease in the total CDF (from 1.6 × 10⁻⁵ per reactor-year to 2.8 × 10⁻⁶ per reactor-year).
Table F-3. Summary of Major PRA Models and Corresponding CDF and LERF Results
PRA Model Summary of Significant Changes from Prior Model CDF
(per year) LERF (per
year) IPE (1993)
• Original model developed in response to NRCGeneric Letter 88-20.
1.6 × 10⁻⁵ (Note 1)
1.8 × 10⁻⁶ (Note 2)
RBS PRA R2
• Added new SBO diesel that provides backup powerto Division 1 or 2 emergency direct current (DC)power during SBO events
• Removed check valve disk between fire protectionwater (FPW) system and the service water system
• The FPW injection path was modified from injectingthrough low pressure core injection (LPCI) line toinjecting through the shutdown cooling line
• Various enhancements to the model, includingaddition of high pressure core spray (HPCS) roomcooler as a failure of HPCS, addition of safety-related 480 volt alternating current (VAC) powermodels and additional detail to system models
3.6 × 10⁻⁶ Not Available (NA)

F-6
PRA Model Summary of Significant Changes from Prior Model CDF
(per year) LERF (per
year) RBS PRA R2A,B,C (1997)
• Modified instrument air system modeling to separate service air from instrument air and removed cooling from the instrument air compressors and aftercoolers
• Removed standby switchgear room dependence on control building heating, ventilation, and air conditioning (HVAC)
• Incorporated the new suppression pool cooling and cleanup system into the model
• Added partial loss of offsite power logic to the non-safety related systems
• The HPCS and reactor core isolation cooling (RCIC) models were updated to allow for the likelihood that the system is initially aligned to the suppression pool
• The electric power model was extended to include the 230 kilovolt (KV) system
• The reactor heat removal pump seal failure due to loss of reactor plant component cooling water (RPCCW) was removed from the suppression pool cooling fault tree
2.0 × 10⁻⁶ NA
RBS PRA R2D
• Revised RCIC modeling to reflect the re-routing of the RCIC injection from the reactor pressure vessel (RPV) spray nozzle to the feedwater A injection line and RCIC modifications that locked open the RCIC turbine lube oil cooler valve and removed the check valve internals from the turbine exhaust check valve
• Incorporated procedure changes that allow bypass of RCIC high temperature trip and swapping RCIC suction flow back to the condensate storage tank (CST) during a SBO
• Updated selected plant specific data • Added additional detail to the modeling of offsite
power supplies • Incorporated modeling of alternate power sources
for the safety-related 4160 VAC buses
2.7 × 10⁻⁶ NA
RBS PRA R3
• Model event trees were modified as a result of an analysis that shows containment failure occurs sooner on loss of all decay heat removal than previously assumed
• The probability of non-recovery of decay heat removal was revised because of the shorter containment failure time
• The probability of non-recovery of offsite power was changed to include additional industry data accumulated since Revision 2D
• A recovery action was added to the model to represent non-recovery of a diesel generator when a diesel generator failed to start, failed to run, or the auto start signal failed to start and load the diesel
• The instrument air fault tree was expanded to include the service air system as backup
9.4 × 10⁻⁶ NA

F-7
PRA Model Summary of Significant Changes from Prior Model CDF
(per year) LERF (per
year) RBS R3A (2002)
• The probability of non-recovery of offsite power wasupdated using the convolution method and theRevision 3 curve for non-recovery of offsite power
• Added recovery action to align the Division IIIemergency diesel generator (EDG) to the Division Ior II bus in accordance with a revision to the SBOprocedure
• Two new diesel recoveries were added. The twoadditional recovery actions are failure to recover adiesel in 6 hours and 12 hours.
• A human error event was added to the model torepresent the operator action for verifying the SBObypass valve opened during a SBO
3.4 × 10⁻⁶ NA
RBS R4 • Included interfacing system loss of coolant accident(ISLOCA)
• Updated ATWS modeling• Updated human reliability analysis• Updated generic and plant failure rates• Updated loss of offsite power (LOOP) analysis• Improved common cause failure analysis• Developed initiating event fault trees
1.9 × 10⁻⁶ NA
RBS R4A
• Added interim modeling of the control buildingelectrical switchgear room cooling, modeled as asingle basic event
3.6 × 10⁻⁶ 2.5 × 10⁻⁸
RBS R5 (Note 3)
• Updated plant specific failure and initiating eventdata through spring 2009
• Updated and expanded common cause analysis• Incorporated more recent industry data on
frequency and recovery from LOOP events• Updated time to core damage and suppression pool
heat up time based on extensive new MAAPanalysis
• Updated human reliability analysis to incorporaterefined time to core damage and procedure changes
• Increased level of detail in system models• Removed credit for containment venting through
3-inch vent path based on refined thermal hydrauliccalculations
• Accounted for RCIC depressurization for smallbreak loss of coolant accident (LOCA) scenarios
2.6 × 10⁻⁶ 2.5 × 10⁻⁸

F-8
PRA Model Summary of Significant Changes from Prior Model CDF
(per year) LERF (per
year) RBS R5A (Note 4)
• Enhanced and increased rigor in the modeling of long-term loss of decay heat removal recovery. This resulted in an increase in the long-term decay heat removal (DHRLT) non-recovery probability but allowed for application of procedural recoveries for certain circumstances.
• Enhanced and increased rigor in the modeling of the loss of normal service water initiating event, by crediting the fact that successful initiation of standby service water would prevent a plant scram
• Incorporated selected findings from the RBS PRA Peer Review into the model
• Captured changes to the service water cooling (SWC) fan and heat exchanger success criteria, which had previously been incorporated into the fault tree used in the online risk model
• Constructed a single fault tree for quantification of both CDF and LERF
2.8 × 10⁻⁶ 2.3 × 10⁻⁸
RBS R6 (Note 5)
• Incorporated extended loss of AC power (ELAP) procedure and diverse and flexible coping strategies (FLEX) support guidelines and FLEX equipment into the PRA model
• Incorporated a model for containment venting based on deflating containment airlock seals based on procedure enhancements made in response to PRA Revision 5 risk insights
• Updated control building cooling logic reflecting new information developed on building heatup and equipment survivability which greatly decreased the risk contribution to CDF from the control building HVAC and control building chilled water systems
• Improved RCIC heatup calculations performed in conjunction with the FLEX project which showed significantly less room heatup than previous calculations
• Credited the condensate transfer systems as an injection source for the reactor pressure vessel, per emergency operating procedures
1.1 × 10⁻⁶
(Note 6)
NA
Note 1. Truncation values varied from 1 x 10⁻⁹ per year for IPE to 1 x 10-12 per year for RBS R5A CDF. Note 2. Frequency of gross containment failure. Note 3. R5 was reviewed in the 2011 BWR Owners Group PRA peer review. Note 4. R5A is an interim revision used for the SAMA analysis. Note 5. R6 is a full revision completed after the SAMA analysis, and was used to respond to NRC staff RAIs. Note 6. The CDF (1.1x10⁻⁶/yr) reported for Revision 6 does not include the Internal Flood contribution.
The ER indicates that the PRA model used for the SAMA analysis reflects the RBS as-built, as-operated configuration as of April 30, 2009, and that no other planned major plant modifications which could adversely impact the SAMA analysis results have been identified. In NRC staff RAIs (NRC 2017a), Entergy was asked to clarify the intent of this statement relative to any changes made to plant operations, procedures and/or physical modifications in the eight years since the stated configuration date, and any planned future changes and their potential impact
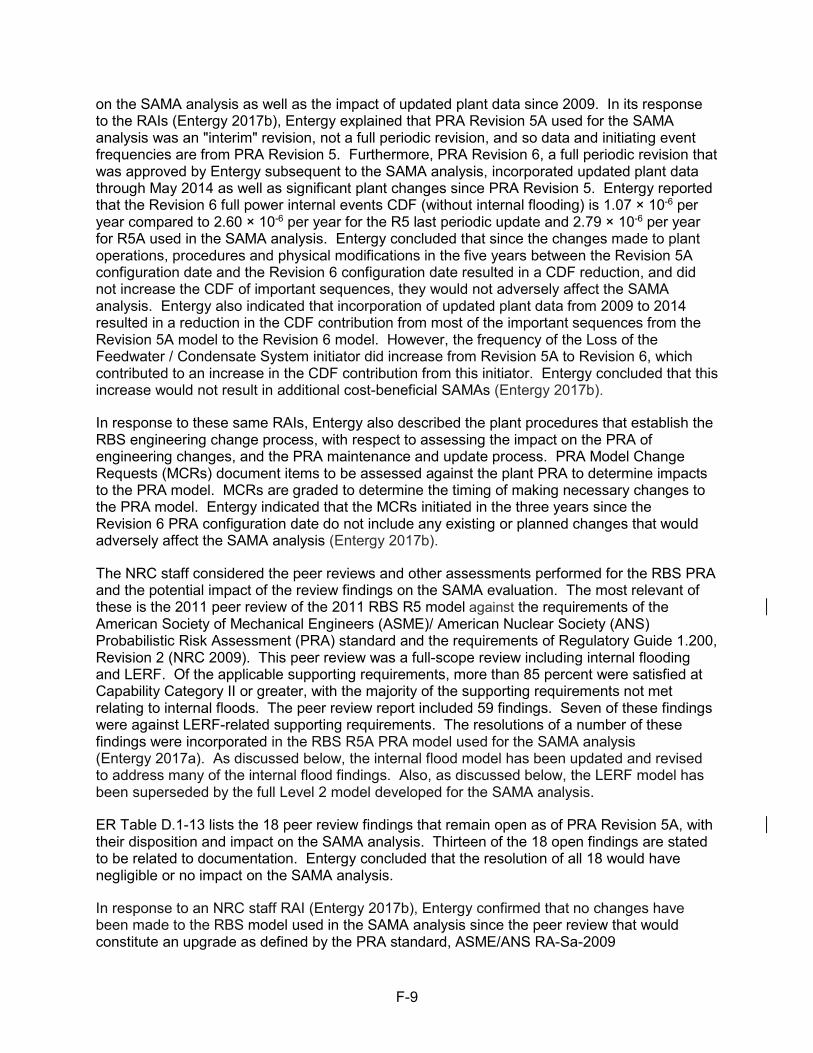
F-9
on the SAMA analysis as well as the impact of updated plant data since 2009. In its response to the RAIs (Entergy 2017b), Entergy explained that PRA Revision 5A used for the SAMA analysis was an "interim" revision, not a full periodic revision, and so data and initiating event frequencies are from PRA Revision 5. Furthermore, PRA Revision 6, a full periodic revision that was approved by Entergy subsequent to the SAMA analysis, incorporated updated plant data through May 2014 as well as significant plant changes since PRA Revision 5. Entergy reported that the Revision 6 full power internal events CDF (without internal flooding) is 1.07 × 10⁻⁶ per year compared to 2.60 × 10⁻⁶ per year for the R5 last periodic update and 2.79 × 10⁻⁶ per year for R5A used in the SAMA analysis. Entergy concluded that since the changes made to plant operations, procedures and physical modifications in the five years between the Revision 5A configuration date and the Revision 6 configuration date resulted in a CDF reduction, and did not increase the CDF of important sequences, they would not adversely affect the SAMA analysis. Entergy also indicated that incorporation of updated plant data from 2009 to 2014 resulted in a reduction in the CDF contribution from most of the important sequences from the Revision 5A model to the Revision 6 model. However, the frequency of the Loss of the Feedwater / Condensate System initiator did increase from Revision 5A to Revision 6, which contributed to an increase in the CDF contribution from this initiator. Entergy concluded that this increase would not result in additional cost-beneficial SAMAs (Entergy 2017b).
In response to these same RAIs, Entergy also described the plant procedures that establish the RBS engineering change process, with respect to assessing the impact on the PRA of engineering changes, and the PRA maintenance and update process. PRA Model Change Requests (MCRs) document items to be assessed against the plant PRA to determine impacts to the PRA model. MCRs are graded to determine the timing of making necessary changes to the PRA model. Entergy indicated that the MCRs initiated in the three years since the Revision 6 PRA configuration date do not include any existing or planned changes that would adversely affect the SAMA analysis (Entergy 2017b).
The NRC staff considered the peer reviews and other assessments performed for the RBS PRA and the potential impact of the review findings on the SAMA evaluation. The most relevant of these is the 2011 peer review of the 2011 RBS R5 model against the requirements of the American Society of Mechanical Engineers (ASME)/ American Nuclear Society (ANS) Probabilistic Risk Assessment (PRA) standard and the requirements of Regulatory Guide 1.200, Revision 2 (NRC 2009). This peer review was a full-scope review including internal flooding and LERF. Of the applicable supporting requirements, more than 85 percent were satisfied at Capability Category II or greater, with the majority of the supporting requirements not met relating to internal floods. The peer review report included 59 findings. Seven of these findings were against LERF-related supporting requirements. The resolutions of a number of these findings were incorporated in the RBS R5A PRA model used for the SAMA analysis (Entergy 2017a). As discussed below, the internal flood model has been updated and revised to address many of the internal flood findings. Also, as discussed below, the LERF model has been superseded by the full Level 2 model developed for the SAMA analysis.
ER Table D.1-13 lists the 18 peer review findings that remain open as of PRA Revision 5A, with their disposition and impact on the SAMA analysis. Thirteen of the 18 open findings are stated to be related to documentation. Entergy concluded that the resolution of all 18 would have negligible or no impact on the SAMA analysis.
In response to an NRC staff RAI (Entergy 2017b), Entergy confirmed that no changes have been made to the RBS model used in the SAMA analysis since the peer review that would constitute an upgrade as defined by the PRA standard, ASME/ANS RA-Sa-2009

F-10
(ASME/ANS 2009), as endorsed by RG 1.200, Revision 2 (NRC 2009). Entergy does indicate that the SAMA analysis utilizes a full-scope Level 2 analysis instead of the simplified LERF analysis incorporated in the Revision 5A model. This is discussed further in Section F.2.2.3.
The ER provides a brief discussion of the Entergy risk management process that ensures that the applicable PRA model is an accurate reflection of the as-built and as-operated plant as defined in the Entergy fleet procedure EN-DC-151, "PSA Maintenance and Update.” This process includes routinely performing the following activities:
• Design changes and procedure changes are reviewed for their impact on the PRA model. Potential PRA model changes resulting from these reviews are entered into the MCR database, and a determination is made regarding the significance of the change with respect to the current PRA model.
• New procedures and revisions to existing procedures that are relevant to the PRA are reviewed for their impact on the PRA model.
• New engineering calculations and revisions to existing calculations are reviewed for their impact on the PRA model.
• Plant specific initiating event frequencies, failure rates, and maintenance unavailability are updated regularly. Procedure EN-DC-151 suggests an update frequency of approximately every four years.
• Industry standards, experience, and technologies are periodically reviewed to ensure that any changes are appropriately incorporated into the models.
Given that the RBS internal events (excluding internal floods) Level 1 PRA model has been peer reviewed and the peer review findings were all addressed, that Entergy has in place procedures to assure the technical quality of the PRA, and that Entergy has satisfactorily addressed the NRC staff’s questions regarding the PRA, the NRC staff finds the RBS Level 1 PRA model to be reasonable and acceptable for the SAMA analysis and concludes that the internal events Level 1 PRA model is of sufficient quality to support the SAMA evaluation.
F.2.2.2 External Events
NEI 05-01A allows the use of an external events multiplier on the maximum benefit and on the upper bound estimated benefits for individual SAMA candidates during the Phase II screening if external events are not included in the PRA utilized for SAMA analysis (NEI 2005). As stated above, the RBS PRA that was utilized for the SAMA analysis does not include external events. The SAMA submittal cites the fire PRA developed for the RBS IPEEE to address the CDF due to fire events, a standalone analysis of internal floods to address the CDF due to internal floods, a separate estimate of seismic events CDF based on the approach used by NRC staff in its safety/risk assessment for Generic Issue (GI) 199 (NRC 2010) but with a more realistic plant specific fragility, and the RBS IPEEE to assess the impact of other (high winds, floods, and other) external events.
The final RBS IPEEE was submitted in 1995 (Entergy 1995), in response to Supplement 4 of GL 88–20 (NRC 1991a). No fundamental weaknesses or vulnerabilities to severe accident risk in regard to the external events were identified in the RBS IPEEE. However, five enhancements related to fire events were identified. All have been implemented (Entergy 2017b). In the NRC staff's safety evaluation of the RBS IPEEE (NRC 2001), the staff stated that “[o]n the basis of the IPEEE review, the NRC staff concludes that the River Bend Station IPEEE process is capable of identifying the most likely severe accidents and severe accident vulnerabilities, and therefore, that River Bend Station has met the intent of Supplement 4 to GL 88-20."

F-11
Seismic Events
As discussed in the ER, the RBS IPEEE seismic analysis was a reduced-scope seismic margins assessment (SMA) following the NRC IPEEE guidance (i.e., NRC 1991a, NRC 1991b). The SMA approach is deterministic in nature and does not result in probabilistic risk information. Based on the results of the licensee's seismic walkdown conducted for the IPEEE, the licensee found that all components, structures, and systems reviewed were seismically rugged for the design basis seismic loading.
Following the accident at the Fukushima Dai-ichi Nuclear Power Plant, Entergy conducted additional seismic walkdowns at RBS. The NRC staff concluded that the licensee had, through the implementation of the walkdown guidance activities and in accordance with plant processes and procedures, verified the plant configuration with the current seismic licensing basis; addressed degraded, nonconforming, or unanalyzed seismic conditions; and verified the adequacy of monitoring and maintenance programs for protective features. Furthermore, the NRC staff confirmed that no immediate safety concerns were identified (NRC 2014a).
In its review of Entergy's response to the Fukushima Near Term Task Force Recommendation 2.1 for a Seismic Hazard and Screening Report, the NRC staff confirmed that no further response or regulatory actions associated with the 50.54(f) letter review of Phase 1 or Phase 2 of the Near-term Task Force Recommendation 2.1 is required for RBS (NRC 2016a).
The NRC staff also notes that Entergy submitted its Seismic Mitigating Strategies Assessment Report in August 2016, which concluded that the flexible coping strategies (FLEX) developed, implemented, and maintained in accordance with NRC Order EA-12-049 can be implemented considering the impacts of the re-evaluated seismic hazard and that no further seismic evaluations were necessary (Entergy 2016a). In its review, the NRC staff concluded that sufficient information has been provided to demonstrate that the licensee's plans for the development and implementation of guidance and strategies under Order EA-12-049 appropriately address the reevaluated seismic hazard information stemming from the 50.54(f) letter (NRC 2016b).
Since RBS was a reduced-scope seismic plant, the method to address seismic risk for the IPEEE focused on walkdowns of success path equipment and systems. Thus, no seismic core damage frequency estimate was developed. Entergy previously developed a seismic CDF based on the approach in NRC’s Safety/Risk Assessment for GI-199, “Implications of Updated Probabilistic Seismic Hazard Estimated in Central and Eastern United States on Existing Plants” (NRC 2010). The NRC assessment conservatively determined that the weakest link model seismic core damage frequency (SCDF) for RBS is 2.5 × 10⁻⁵ per reactor-yr. Entergy estimated the seismic risk using the same methods and hazard curves as the NRC used, with the exception of using more realistic plant-specific fragility values instead of the more conservative values used by the NRC. Entergy’s more realistic SCDF was determined to be 2.5 × 10⁻⁶ per reactor-yr. Entergy further indicated that this estimate is also considered conservative since the SCDF would be 8.3 × 10⁻⁷ per reactor-yr if the 2010 Electric Power Research Institute (EPRI) seismic hazard curves were used. The more realistic SCDF of 2.5 × 10⁻⁶ per reactor-yr was used in the SAMA analysis (Entergy 2017a).
Entergy was asked in an NRC staff RAI to provide more information on, and support for, these more realistic fragility values (NRC 2017a). Entergy indicated that plant-specific fragilities were calculated using two different methods, the hybrid method and the separation of variables method. The results from the separation of variables method was used for the RBS SAMA

F-12
analysis because it resulted in more conservative fragilities. The factors considered in the separation of variables method included strength, inelastic energy absorption, spectral shape, damping, wave incoherence, modeling, directional components, and modal combination. Realistic (but still conservative) values were applied for each of these factors. This resulted in a more realistic plant fragility than was used by the NRC in GI-199, which utilized the Safe Shutdown Earthquake (SSE) Peak Ground Acceleration (PGA) as a measure of the high confidence of low probability of failure for determining the plant seismic fragility (Entergy 2017b). Both the hybrid method and the separation of variables methods are acceptable methods for calculating seismic fragilities per the EPRI Seismic Evaluation Guidance (EPRI 2012), which is endorsed by the NRC (NRC 2012a).
Considering that the revised seismic CDF is based on realistic seismic plant fragility estimates calculated using NRC-endorsed guidance and on conservative seismic hazard curves, the NRC staff concludes that the seismic CDF, as discussed above, is acceptable for use in the development of the external events multiplier.
Fire Events
As discussed in the ER, Entergy performed a Fire PRA to meet the objectives of the IPEEE. The methodology was based on a combination of EPRI Fire-Induced Vulnerability Evaluation (FIVE) (EPRI 1992) methods and the PRA methods in the EPRI draft “Fire Risk Implementation Guide” (EPRI 1994). Overall, the method was a progressive screening analysis. If at any time in the screening a fire area dropped below 1 × 10⁻⁶ per reactor-yr, the fire area was screened out. Areas were screened from further analysis when they could be shown to be of low risk significance. The models and methods used in the internal events IPE served as the basis for quantification of the conditional core damage probabilities (CCDPs). The CDF of the areas that did not screen totaled 2.25 × 10⁻⁵ per reactor-yr in the original IPEEE submittal (Entergy 1995).
Table D.1-10 of the ER, as shown in Table F-4, provides a listing of the fire areas and their contribution to the fire CDF for the seven areas not screened out. The dominant areas contributing to the fire CDF are the control room, Division 1 standby switchgear room and the control room ventilation room on elevation 116 feet.
Table F-4. Fire Areas Included in Final Phase of IPEEE Screening
Fire Area Description Total Compartment CDF (per reactor-yr)
C-25 Control Room 4.87 × 10⁻⁶ C-15 Division 1 Standby Switchgear Room 4.75 × 10⁻⁶ C-17 Control Room Ventilation Room EL. 116’ 4.56 × 10⁻⁶ C-4 Air Conditioning Unit (ACU) West Room 3.31 × 10⁻⁶ AB-2/Z-2 HPCS & HPCS Hatch Area 2.23 × 10⁻⁶ ET-1 B-Tunnel East 1.48 × 10⁻⁶ AB-1/Z-4 Auxiliary Building: West Side Crescent Area 1.26 × 10⁻⁶
Total Fire CDF 2.25 × 10⁻⁵
The RBS IPEEE fire analysis was reviewed by the NRC staff as part of the IPEEE review (NRC 2001). The RBS IPEEE fire analysis review concluded that two additional fire areas would not be screened out and the fire CDF would be increased to 2.5 × 10⁻⁵ per reactor-yr. The impact of this on the external event multiplier is discussed below.

F-13
While no vulnerabilities or improvements with respect to fire were identified, the IPEEE submittal identified five insights or enhancements. The insights were primarily related to improvements in fire related procedures and the selection of equipment credited in the RBS Safe Shutdown Analysis. All have been implemented (Entergy 2017b).
In the ER, Entergy indicates that since a fire risk assessment utilizes the internal events model in the determination of the fire CDF, the results are impacted by changes to the internal events model. As discussed above, the IPE model has been updated many times. The Revision 5A internal events CDF used for the SAMA analysis is 2.79 × 10⁻⁶ per reactor-yr compared to the IPE CDF, on which the IPEEE fire CDF is based, of 1.55 × 10⁻⁵ per reactor-yr. This is more than a factor of five less than the original IPE CDF and it might be reasonably assumed that an update of the fire PRA analysis with the Revision 5A internal events model would result in a fire CDF one-fifth of the original fire CDF (4.5 × 10⁻⁶ per reactor-yr). This would account for updated modeling of the internal events portion of the model that was used in the fire analysis, but would not necessarily address all of the conservatisms inherent in the FIVE methodology. Entergy concluded that even though a reduction by a factor of 5 in the fire CDF may be justifiable, the RBS fire CDF was reduced by a more conservative factor of 2.5, to 9.0 × 10⁻⁶ per reactor-yr for the SAMA analysis (Entergy 2017a).
As discussed above, in response to an NRC staff RAI, Entergy indicated that the current Revision 6 PRA has an internal events CDF of 1.07 × 10⁻⁶ per reactor-yr. This would indicate that there might be even further conservatism in the fire CDF used in the SAMA analysis (Entergy 2017b).
Considering that the RBS fire PRA model has been reviewed by the NRC staff as part of the IPEEE program, and that accounting for reductions in the internal events CDF due to plant improvements was done in a conservative manner, the staff concludes that the fire PRA model, as discussed above, is appropriate for determining the external events multiplier in the SAMA and provides an acceptable basis for identifying and evaluating the benefits of SAMAs.
Internal Floods
Since the RBS Level 1 model does not include contributions from internal flooding hazards, Entergy cited an earlier internal flooding analysis that was revised and updated in 2012 for use in the SAMA analysis. Table D.1-11 of the ER, as shown in Table F-5, provides the results of the internal flood analysis. The total internal flood CDF is 4.97 × 10⁻⁶ per reactor-yr with floods in the auxiliary building dominating the result (Entergy 2017a).
Table F-5. Internal Flooding CDF by Building
Building Building CDF (per reactor-yr)
Auxiliary Building 2.91 × 10⁻⁶ Control Building 6.34 × 10⁻⁷ Diesel Building 7.95 × 10⁻⁷ Fuel Building 4.08 × 10⁻⁸ Radwaste Building 3.65 × 10⁻¹⁰ Turbine Building 4.25 × 10⁻⁸ Tunnels 5.46 × 10⁻⁷ TOTAL 4.97 × 10⁻⁶

F-14
Entergy was asked in an RAI to identify the internal events model used in this updated flood analysis, characterize it with respect to the internal events model used in the SAMA analysis (RBS 5A), and assess the impact of any difference between the two models (NRC 2017a). Entergy responded that the 2012 internal flooding fault tree model is based on the RBS Revision 5 PRA model, that the Revision 5A model CDF is 7 percent higher than the Revision 5 CDF, and that the differences between the Revision 5 and 5A models are not expected to have significant impact on the internal flooding overall CDF (Entergy 2017b). Entergy also stated that the internal flooding initiators are mapped to transient initiators and associated logic in the Revision 5 fault tree in order to create flooding sequences, and that the transient accident logic in the Revision 5A model is essentially the same as the transient logic in Revision 5.
In addition, Entergy indicated that Revision 6 of the RBS PRA was approved on October 5, 2017, with an overall CDF of 3.03 × 10⁻⁶ per year and that the internal flooding contribution to this overall CDF is 1.96 × 10⁻⁶ per year, which is approximately 40 percent of the Revision 5 internal flooding CDF (Entergy 2017b). Based on this result, Entergy concluded that the internal flooding CDF used in the SAMA analysis is conservative.
As discussed above, the 2011 peer review of the RBS R5 PRA model was a full-scope review that included internal flooding. Entergy indicates that the majority of the supporting requirements assessed as "not met" in the peer review were related to internal flooding. Entergy was asked in an NRC staff RAI to discuss the results of the self-assessment of the 2012 internal flood model as well as the status of meeting those requirements determined to be "not met" in the 2011 peer review and, for any internal flood requirements "not met," to discuss the impact on the SAMA analysis (NRC 2017a). Entergy responded that during the 2011 peer review, 18 of the 59 Findings were related to the internal flooding PRA element and that 14 of these 18 Findings were considered closed by the update to the internal flooding analysis approved in 2012, leaving four Findings open to be resolved as part of PRA Revision 6 (Entergy 2017b).
Entergy further indicated in the RAI response that due to changes in the approach for the internal flooding analysis performed for Revision 6, and due to the number of original findings from the 2011 peer review, Entergy determined the Revision 6 internal flooding PRA should be considered an upgrade. As a result, it was the subject of a focused-scope BWR Owner’s Group (BWROG) PRA peer review conducted in September 2017. While the focused-scope peer review report has not been issued, preliminary results included one "Not Met" requirement related to documentation of sources of model uncertainty, and eight Findings related to internal flooding. Entergy concluded that none of these findings are expected to appreciably impact the results of the internal flooding PRA. Further, since the Revision 6 internal flooding model is a complete upgrade, findings from the focused-scope peer review are unrelated to the internal flooding model used in the SAMA analysis (Entergy 2017b).
Entergy states that the dominant contributors to internal flood risk in the Revision 6 model were examined for possible mitigation, but no additional SAMAs were postulated. None of the 348 individual internal flooding scenarios exceeded 1.0 x 10⁻⁶ per year for CDF or 1.0 x 10⁻⁸ per year for LERF (Entergy 2017b).
Considering that the 2012 internal flooding analysis PRA model used for the SAMA assessment has been peer reviewed, that resolution of open findings would not be expected to impact the internal flooding CDF or the SAMA analysis, that the more current Revision 6 internal flooding model yields a CDF that is 40 percent of that used in the SAMA analysis, and that an examination of the dominant contributors to internal flood risk in the Revision 6 model did not

F-15
result in the identification of additional SAMAs, the NRC staff concludes that the internal flooding analysis provides an acceptable basis for identifying and evaluating internal flooding SAMAs and that the internal flooding CDF is acceptable for use in the development of the external events multiplier.
High Winds, Floods, and Other External Events
Entergy explained in the ER that the conclusion of the RBS IPEEE was that RBS meets the applicable NRC Standard Review Plan (SRP) requirements for high winds, floods, and other external events. Based on these IPEEE results, and that no adverse findings were identified from walkdowns, Entergy concluded that the contribution to CDF from external hazards is less than 1 x 10⁻⁶ per reactor-yr and that, therefore, these events are not significant contributors to external event risk.
Following the accident at the Fukushima Dai-ichi Nuclear Power Plant, Entergy conducted additional external flood walkdowns as requested by NRC's 10 CFR 50.54(f) letter (NRC 2012b). Based on its review of Entergy's submittal, the NRC staff concluded that the licensee's implementation of the flooding walkdown methodology meets the intent of the walkdown guidance and that the licensee, through the implementation of the walkdown guidance activities and, in accordance with plant processes and procedures, verified the plant configuration with the current flooding licensing basis; addressed degraded, nonconforming, or unanalyzed flooding conditions; and verified the adequacy of monitoring and maintenance. Furthermore, the NRC staff noted that the licensee's walkdown results, which were verified by the staff's inspection, identified no immediate safety concerns (NRC 2014b).
Enclosure 2 to the NRC staff’s 10 CFR 50.54(f) request for information (NRC 2012b) requested licensees to re-evaluate flood-causing mechanisms using present-day methodologies and guidance. Concurrently with the re-evaluation of flooding hazards, licensees were required to develop and implement mitigating strategies in accordance with NRC Order EA-12-049, "Requirements for Mitigation Strategies for Beyond-Design-Basis External Events" (NRC 2012c).
Entergy submitted the RBS reevaluated flood hazard assessment on March 12, 2014 (Entergy 2014a), and the NRC staff provided its assessment of the reevaluation on August 31, 2016 (NRC 2016c). In its assessment, the NRC staff confirmed the licensee's determination that (a) the reevaluated flood hazard results for local intense precipitation (LIP) and for streams and rivers (West Creek probable maximum flood (PMF) and Mississippi River PMF) are not bounded by the current design basis flood hazard and (b) that additional assessments of plant response need to be performed for LIP and for rivers and streams flood-causing mechanisms.
Entergy submitted the flooding mitigating strategies assessment (MSA) for RBS on October 24, 2016 (Entergy 2016b), and the NRC staff provided its assessment of the Entergy submittal on May 2, 2017 (NRC 2017b). The NRC staff assessment confirmed that the licensee's flood hazard MSA was performed consistent with applicable guidance. Further, based on the licensee's appropriate hazard characterization, the methodology used in the MSA evaluation, and the description of its combination of strategies (i.e., current FLEX strategy and modified FLEX strategy), the staff concluded that the licensee has demonstrated that the mitigation strategies, if appropriately implemented, are reasonably protected from reevaluated flood hazard conditions for beyond-design-basis external events.

F-16
On June 28, 2017, Entergy submitted its focused evaluation of the external flooding mechanisms for which the reevaluated flooding hazards are not bounded by the current design basis (Entergy 2017c). Entergy's evaluation concluded that permanent passive protection is in place for the PMF on West Creek, for the PMF on the Mississippi River, and for the LIP flood-causing mechanisms. The NRC staff’s evaluation of this submittal concluded that the licensee has demonstrated that effective flood protection exists for LIP and for streams and rivers flood mechanisms during a beyond-design-basis external flooding event at RBS (NRC 2017c).
The NRC staff noted in an RAI that this focused evaluation was a deterministic (that is, not a probabilistic) evaluation and asked Entergy to provide a discussion of these external flood hazards and the associated impact on RBS to support the assertion that they would not contribute to the external events multiplier nor lead to any cost-beneficial SAMAs (NRC 2017a). Entergy responded that the RBS external flooding focused evaluation demonstrated that there was adequate physical margin for the LIP hazard and for the PMF hazards on West Creek and the Mississippi River. Entergy further noted that the analyses used several conservative inputs, assumptions, and/or methods in the reevaluation of the hazards, and that conservative assumptions concerning both the magnitude of rainfall events and the response of local RBS mitigating or aggravating site features were identified (Entergy 2017b).
Considering that permanent passive protection is in place at RBS for these conservatively analyzed floods and that the NRC staff has concluded that these protective measures provide effective measures for protection against beyond-design-basis external flooding events, that the NRC staff has concluded that flooding mitigation strategies implemented at RBS are reasonably protected from reevaluated flood hazard conditions for beyond-design-basis external events, and that the contribution to CDF from high winds and other external events is negligible, the NRC staff concludes that not including a CDF contribution for these hazards in the development of the external events multiplier is acceptable. Furthermore, the NRC staff concludes that the need for any mitigating action for external floods is being addressed by the NRC Order EA-12-049 program as a current operating issue and therefore no additional external flooding SAMAs need to be considered under license renewal.
External Events Multiplier
As stated in the ER (Entergy 2017a), a multiplier of 7 was used to adjust the internal event risk benefit associated with a SAMA to account for external events and internal flooding events. This multiplier was based on a total internal and external events CDF of 1.93 x 10⁻⁵ per reactor-yr, which is the sum of the CDF for internal events of 2.79 × 10⁻⁶ per reactor-yr, the CDF for seismic events of 2.5 × 10⁻⁶ per reactor-yr, the CDF for fire events of 9.0 × 10⁻⁶ per reactor-yr, and the CDF for internal flood events of 4.97 × 10⁻⁶ per reactor-yr. The external events multiplier was therefore calculated by Entergy to be 6.9 (1.93 × 10⁻⁵ per reactor-yr / 2.79 × 10⁻⁶ per reactor-yr). Entergy conservatively used a value of 7 in the SAMA analysis.
The sources of these external event CDF values are discussed in the previous sections. For the fire CDF, the results of the RBS fire IPEEE PRA (2.25 × 10⁻⁵ per reactor-yr) was modified by Entergy to account for the impact of the lower internal events CDF used for the SAMA analysis compared to that on which the IPEEE fire CDF was based. Entergy concluded that even though a reduction by more than a factor of 5 (actual ratio of IPE CDF to Revision 5A CDF is 1.55 × 10⁻⁵ per reactor-yr / 2.79 × 10⁻⁶ per reactor-yr = 5.55) in the fire CDF may be justifiable, the RBS fire CDF was reduced by a factor of 2.5, to 9.0 × 10⁻⁶ per reactor-yr for the SAMA analysis (Entergy 2017a).

F-17
As discussed above, the NRC staff review of the RBS IPEEE fire analysis concluded that the total fire CDF should be 2.5 × 10⁻⁵ per reactor-yr versus the IPEEE submittal value of 2.25 × 10⁻⁵ per reactor-yr. The NRC staff has evaluated the impact of this difference on the SAMA assessment. If the same methodology used by Entergy to determine the fire CDF contribution to the external events multiplier (the IPEEE fire CDF divided by 2.5) is used, the fire CDF would increase from 9.0 × 10⁻⁶ per reactor-yr to 1.0 × 10⁻⁵ per reactor-yr, or an 11 percent increase in fire CDF. If this value were used to determine the external events multiplier, the calculated value would be 7.26 versus the value used in SAMA analysis of 7.0, or only a 3.7 percent increase. Considering the assumptions and uncertainties associated with this analysis, and that the current Revision 6 internal events CDF is about 40 percent of that used for the SAMA analysis, the NRC staff considers the external events multiplier of 7.0 to be reasonable for the SAMA analysis.
F.2.2.3 Level 2 Fission Product Release Analysis
The NRC staff reviewed the general process used by Entergy to translate the results of the Level 1 PRA into containment releases, as well as the results of the Level 2 analysis, as described in the ER and in responses to staff RAIs (Entergy 2017b). Entergy indicated that the full Level 2 model used for the SAMA analysis was created specifically for the SAMA analysis since the RBS R5A included only a LERF model. As indicated in ER Table D.1-12, the full level 2 LERF result of 2.3 x 10⁻⁸ per reactor-year was very close to the simplified LERF-only model LERF result of 2.5 × 10⁻⁸ per reactor-year.
Per the ER (Entergy 2017a), the Level 2 analysis is linked to the Level 1 model by extending the model to include the CET which characterizes the post core melt accident response. The CET considers the influence of physical and chemical processes on the integrity of the containment and on the release of fission products. Each Level 1 CDF accident sequence was grouped into one of six groups for use in the Level 2 analysis. These groups provide the entry conditions for the Level 2 analysis. A Level 1 sequence group, or a combination of groups, is directly linked to the fault tree logic representing the appropriate CET Level 2 sequence for evaluation.
The top events of the CET represent events that may have a significant impact on the ability of the containment to remain intact and contain the fission products released from the core by the core damage accident. The top events describe either phenomenological events or processes of severe accident response, potential recovery or mitigating actions, or containment system responses that impact the severe accident progression. The CET events and their respective nodal equations are related to additional fault tree logic to ensure complete linking of all system-related interactions. A list of the nine CET functional events and their descriptions used for the Level 2 analysis is provided in ER Table D.1-6 (Entergy 2017a). The NRC staff notes that the CET nodes or functional events are relatively complex and may involve more than simple success or failure. A single CET is used with nodes evaluated by fault tree logic which, in some cases, are representations of decomposition event trees. SBO and non-SBO Level 1 sequences are processed by the single CET.
The CET end points represent the outcomes of possible containment accident progression sequences with each end point representing a complete sequence from initiator to release to the environment. Associated with each CET end point or end state is an atmospheric radionuclide source term including the timing, magnitude, and other conditions associated with the release. Because of the large number of CET end points, they are grouped into release categories. Entergy defined 14 release categories, labeled source term categories (STCs). One release category is for no containment failure, four represent large early releases, one

F-18
represents a large late rupture of containment due to hydrogen effects with the remaining eight representing containment penetration failures with various combinations of containment status at the time of core damage, core debris cooling successful/unsuccessful, and auxiliary building scrubbing successful/unsuccessful.
In response to NRC staff RAIs regarding containment failure modes and the definition of the STCs (NRC 2017a), Entergy indicated that a detailed, plant-specific evaluation of the RBS containment internal pressure fragility was performed in 1992 (Entergy 2018). Median and 95th percentile non-exceedance pressures were calculated for all relevant containment penetrations and for the regions of the containment structure itself. The analysis determined that as containment pressurizes, leakage failures of containment penetrations (e.g., the containment hatch, containment dome ventilation opening and drywell equipment hatch/personnel door) occur at much lower pressures than the large containment rupture failure mechanisms. STCs 7 through 14 involve sequences with gradual pressurization of containment, and the MAAP analyses predict releases from the leakage failures of containment. The pressures do not reach the level of containment rupture. STCs 5 and 6 represent large ruptures of containment due to rapid pressure loading caused by hydrogen explosions.
Entergy indicated that for gradual pressurization of the containment, the MAAP analyses showed a peak containment pressure of 63.7 psig. The fragility analysis calculated a median large containment rupture pressure of 107 psig and a 95th percentile non-exceedance large containment rupture pressure of 86 psig. Since the peak containment pressure reached in the MAAP analyses using the median pressure distribution is well below both the median and 95th percentile non-exceedance large containment rupture pressures, Entergy concluded that the MAAP analyses have appropriately considered the potential containment failure modes and that further MAAP analyses to consider additional uncertainty in the pressure distribution from the containment fragility analysis would not result in identification of additional cost-beneficial SAMAs (Entergy 2018). Based on the margin between the calculated peak containment pressure and the calculated median and 95th percentile non-exceedance large containment rupture pressures, the NRC staff concluded that the applicant’s containment failure analysis is acceptable for use in the SAMA analysis.
The 14 STCs and their frequencies are provided in ER Table D.1–8. The frequency of each STC is the sum of the frequencies of the various CET end points assigned to that CET. As discussed in the ER, the Level 2 CET analysis splits up most of the Level 1 CDF sequences into several additional sequences or endpoints. The effect of truncation performed during the quantification results in loss of some of the Level 1 sequences and therefore, at the same truncation, a lower total STC frequency compared to the CDF. Entergy assigned this unaccounted for release frequency to the intact category, STC 1.
In response to an NRC staff RAI concerning the appropriateness of this assignment (NRC 2017a), Entergy indicated that the difference between the internal events CDF (2.79 × 10⁻⁶ per year) and the total frequency of the internal events Level 2 STCs (2.58 × 10⁻⁶ per year) is 2.09 × 10⁻⁷ per year, or 8.1 percent of the CDF (Entergy 2017b). Entergy estimated that if this extra frequency were assigned to other STCs, the best estimate increase in maximum averted cost risk (MACR) would be 4.7 percent. Entergy concluded that conservatisms in assessing the benefit of each SAMA would compensate for a change of this small magnitude and that, therefore, redistribution of the truncation difference proportionally to other STCs would not change the conclusions of the SAMA analysis (Entergy 2017b). The NRC staff reviewed the

F-19
cost and benefit inputs to the assessment of any SAMAs where an increase in benefit of this magnitude would make the SAMA beneficial and concluded that no new cost-beneficial SAMAs would be identified.
Per the ER (Entergy 2017a), MAAP 4.0.7 was used to determine the progression of the various Level 2 sequences and the resulting timing and magnitude of fission product releases. Entergy stated that many different accident sequences were analyzed using MAAP, primarily focused on the significant core damage sequences. Significant sequences were defined to be those that contribute to the top 95 percent of CDF and any sequence that individually contributes at least one percent to the total CDF. A representative MAAP case was then chosen for each STC. The ER provided a discussion of the basis for the selection of the representative MAAP case for each STC. This discussion indicates that the selection was conservative. For the STCs that dominate the risk, the case with the highest Cesium Iodide (CsI) release fraction was selected from the available applicable MAAP cases.
In response to an NRC staff RAI requesting an expanded description of the MAAP cases and associated sequences (NRC 2017a), Entergy provided a description of the 11 sequences (5 for STCs 7–10 and 6 for STCs 11–14) along with their frequencies as well as the time molten core concrete interaction (MCCI) starts (Entergy 2017b). The total frequency of these sequences is approximately 95 percent of the total internal events CDF. An examination of this information indicated that for the STC 7–10 sequences, one sequence, S2-A6, had a start of MCCI of approximately 36 hours, compared to that for the representative sequence, T-14, of 64 hours. Responding to a concern that the earlier time for the start of MCCI could lead to a higher risk than that used in the analysis, Entergy indicated that T-14 had both a shorter time between the declaration of a general emergency and reactor vessel failure and a higher CsI release fraction than for S2A-6, leading to a more conservatively calculated risk (Entergy 2017b).
The NRC staff noted in an RAI that Entergy's discussion of the representative MAAP cases for STCs 7 through 10 indicates that the same MAAP case (T-14) was used both for categories without MCCI as well as for those with MCCI (NRC 2017a). Similarly, for STCs 11 through 14, the same MAAP case (T-TB-3) was used both for categories without MCCI as well as for those with MCCI. The release fractions for otherwise similar categories (STCs 7 and 9, STCs 8 and 10, STCs 11 and 13; as well as STCs 12 and 14) are however different, even though they result from the same MAAP case. From the discussion, it appears that the results prior to MCCI were used for the categories without MCCI while the results at the end of the run were used for the categories with MCCI. Entergy was asked to clarify this approach and justify the use of MAAP results prior to MCCI occurring for the categories without MCCI rather than the end-of-run result for a MAAP case without MCCI (NRC 2017a).
In response to the RAI, Entergy confirmed the above description of the approach used to evaluate the release fractions for sequences where there is no MCCI and discussed the MAAP modeling of MCCI to support this methodology (Entergy 2017b). The RBS Level 2 PRA utilizes probabilities of successful or unsuccessful debris cooling from NUREG/CR-4551 (NRC 1990). Different conditional probabilities are based on the spread of the debris, which depends on the reactor pressure at the time of vessel failure and the degree of debris entrainment. These conditional probabilities are not MAAP inputs, but are taken from NUREG/CR-4551. The MAAP code contains input parameters and assumptions that make MCCI more or less likely to occur. Due to MAAP settings in the RBS Level 2 MAAP model, MCCI occurred in nearly all cases. Therefore, to estimate the releases for cases that should not have MCCI (based on the NUREG/CR-4551 probabilities) the release fractions were taken up to the MAAP predicted time of the start of MCCI (Entergy 2017b).

F-20
Entergy further explained that for some of the STCs (STCs 7 -10, involving containment failure prior to core damage), the analysis did not predict MCCI until more than 30 hours after core damage and containment failure had both occurred. Entergy concluded that for these scenarios, the releases had stabilized, and continuing the run beyond that at which MCCI is predicted to have started would have had a negligible impact on the releases. As discussed below, this was subsequently confirmed by a MAAP run with MCCI suppressed and extending the run time to 48 hours after generation of a general emergency. This analysis resulted in a 0.1 percent increase in the base case MACR (Entergy 2017b).
Entergy also noted that, in other cases, MCCI occurred before containment failure (STCs 11–14). For the STCs with no MCCI, the fission product releases would more appropriately be represented by MAAP analyses with MCCI suppressed, but with the case continued beyond containment failure. The MAAP case (T-TB-3) result for these STCs up to the time of the onset of MCCI noticeably under-predicted the noble gas release fraction. The release categorization should have been continued past containment failure in order to observe the release fraction plateaus. In order to evaluate the impact, a new MAAP analysis was performed for Case T-TB-3, in which the MAAP inputs are identical except for modification of some internal parameters to suppress MCCI. The new analysis was run to 20 hours post-containment failure and most of the release fractions are approximately a factor of 5 higher than those previously calculated. However, other than the noble gas release fraction, they have a very low magnitude. In addition, STCs 11 and 12 each have a low frequency. Entergy concluded that due to the combination of low frequency and low consequence, the updated source term analysis for these STCs (STCs 11 and 12) continues to have a negligible impact on the SAMA analysis (Entergy 2017b).
The ER, with regard to the MAAP analysis of fission product release, states, "In general, cases were run to a minimum of 140 hours to ensure that any late MCCI effects are understood.” In an RAI, Entergy was asked to provide the MAAP run times for each STC, as well as the time of declaration of a general emergency, the time of core damage, the time of containment failure and time of the start of release, and to clarify the meaning/definitions for the plume durations and plume delays given in Table D.1-21 (NRC 2017a). Entergy provided the requested information in Table 2.f-1 of the RAI responses (Entergy 2017b). The run times for the no-MCCI STCs 7 and 8 and STCs 11 and 12, are less than 48 hours after the time of declaration of general emergency. As discussed above, the run times for these STCs was taken to be the time of the start of MCCI. For STCs 7 and 8, the run time was 63.4 hours or approximately 34 hours after the general emergency time of declaration of 29.2 hours. A MAAP run was made for these STCs with MCCI suppressed and the run time extended to 48 hours after declaration of a general emergency. This resulted in a 0.1 percent increase in the base case MACR (Entergy 2017b).
In the same RAI response, Entergy explained that for STCs 11 and 12 the run time was 17.6 hours, or less than one hour after the general emergency time of declaration of 17.2 hours. As discussed above, a new MAAP analysis was performed in which MAAP inputs were set to suppress MCCI. The new analysis was run to 20 hours post-containment failure for a total run time of 42.9 hours, which is approximately 26 hours after the declaration of general emergency. While most of the release fractions are approximately a factor of 5 higher than those previously calculated, other than the noble gas release fraction, they are all of very low magnitude. In addition, STCs 11 and 12 each have a low frequency that is more than two orders of magnitude less than the STCs that contribute significantly to the total risk. Entergy concluded that, due to the combination of low frequency and low consequence, the updated source term analysis for these STCs (STCs 11 and 12) continue to have a negligible impact on the SAMA analysis, and

F-21
extending the run times for these cases is therefore not warranted (Entergy 2017b). Based on the low frequency and low consequence contributions to risk by STCs 11 and 12, the NRC staff agrees that extending the MAAP run times for the representative cases to 48 hours is not warranted.
The ER states, with regard to the Level 2 PRA, that "It was prepared and reviewed by qualified personnel in accordance with existing industry standards" and that "...a team of RBS experts representing various site organizations (e.g. Operations, System Engineering, Mechanical/Safety Analysis, PRA, and License Renewal) performed a review of the results to confirm that the model is representative of the plant and the results are reasonable" (Entergy 2017a). Entergy was asked in an NRC staff RAI to provide more information on the compliance of the RBS Level 2 analysis with the LERF requirements of the ASME/ANS PRA standard and the conclusions of the RBS expert team review (NRC 2017a). Entergy explained in the RAI response that, as discussed above, the 2011 LERF model was updated in 2016 to develop a full Level 2 PRA to support the license renewal SAMA analysis (Entergy 2017b). The self-assessment of the 2016 Level 2 PRA found that all of the ASME/ ANS PRA Standard LERF supporting requirements were met to at least Category II except for the following:
SR LE-C13 – Met at Category I because of conservative treatment of containment bypass. Entergy concluded that this is also conservative to the SAMA analysis, as it has the potential to overestimate the benefit of some SAMAs.
Entergy noted that this supporting requirement was considered "met" by the subsequent peer review of the Revision 6 PRA, with no facts and observations (F&Os) assigned to this supporting requirement. As discussed above, changes to the LERF element of the Revision 6 PRA were based upon the Level 2 model developed for the SAMA analysis. In its RAI response, Entergy explained that these changes to the LERF model were considered an upgrade. A BWROG focused-scope peer review of the LERF elements of the Revision 6 PRA was conducted in September 2017. In this peer review, all LERF supporting requirements were considered "met.” Entergy provided the three findings from this focused-scope peer review and determined that their resolution would have no impact on the SAMA results.
Based on its review of the Level 2 methodology that is in accordance with the NEI 05-01A guidance, Entergy's responses to NRC staff RAIs, the results of a MAAP run that extended the run time to 48 hours after declaration of general emergency for STCs 7 and 8, and Entergy’s bases for determining that the resolution to internal Entergy and independent peer reviews of the Level 2 model would not impact the SAMA results, the NRC staff concludes that the Level 2 PRA, as used in the SAMA analysis, provides an acceptable basis for evaluating the benefits associated with various SAMAs.
F.2.2.4 Level 3 Consequence Analysis
Entergy used the MACCS, Version 3.10.0, code and a core inventory from a plant-specific calculation to determine the offsite consequences from potential releases of radioactive material (Entergy 2017a). Entergy calculated the core inventory for 3,100 MWt, which is slightly higher than the rated power level of 3,091 MWt for RBS (Entergy 2017a).
The NRC staff reviewed the process used by Entergy to extend the containment performance (Level 2) portion of the PRA to an assessment of offsite consequences (Level 3 PRA model). Source terms used to characterize fission product releases for the applicable containment

F-22
release categories and the major input assumptions used in the offsite consequence analyses were considered. In response to an NRC staff RAI regarding inventory used in the SAMA radiological dose calculations and the maximum inventory expected during the 20-year period of extended operation if license renewal is approved (NRC 2017a), Entergy explained that initial scoping efforts have been initiated to evaluate changing the fuel from the GNF-2 currently used, and assumed in the SAMA analysis, to GNF-3 fuel (Entergy 2017b). Entergy’s preliminary assessment is that the source terms for individual isotopes are expected to increase by about two percent by changing to GNF-3 fuel. Entergy also concluded that this small impact is bounded by the 95th percentile CDF uncertainty analysis discussed in Section F.6.2 of this appendix. The NRC staff finds the use of the source terms based on GNF-2 fuel to be acceptable for the SAMA analysis because the potential impact of using source terms for GNF-3 fuel is small and bounded by the 95th percentile CDF uncertainty analysis.
Additional plant-specific input to the Level 3 assessment includes the core release fractions and source terms for each release category, site-specific meteorological data, projected population distribution and expected growth out to the year 2045 within an 80-km (50-mi) radius, emergency evacuation modeling, and economic data. This information is provided in Section D.1.5 of Attachment D to the ER (Entergy 2017a).
According to the ER, Entergy considered site-specific meteorological data for calendar years 2008 through 2014. Entergy used meteorological data (wind speed, wind direction, atmospheric stability, accumulated precipitation) from 2013 with minimum mixing height data for 2008 and 2009 for the analysis as inputs to the MACCS code because they were the most conservative data sets (Entergy 2017a). Meteorological data were acquired from the RBS meteorological monitoring system and from the National Climatic Data Center (NCDC).
In an NRC staff RAI, Entergy was asked to explain why meteorological data for the year 2013 were the most conservative and how missing data were accounted for in the SAMA analysis (NRC 2017a). In response to the RAI, Entergy explained that all 14 release categories were evaluated using all available meteorological data sets from 2008 through 2014 to determine which data set resulted in the highest PDR and OECR, and that the 2013 data using the minimum mixing height averages from previous years resulted in the highest PDR and OECR, which were the data used in the SAMA analysis (Entergy 2017b). Temperature data from 2008 through 2014 used to develop the atmospheric stability factor were obtained from the RBS meteorological monitoring system. Over the seven-year period, 0.7 percent of temperature data were missing, with 22 hours (0.3 percent) of data missing in the year 2013 data. The hours of missing data were filled by interpolation.
Entergy further explained in response to the RAI that wind speed, wind direction, precipitation, and mixing height data were obtained from the NCDC (Entergy 2017b). Over the seven-year period, 4.2 percent of wind direction data, 0.4 percent of wind speed data, and 1.8 percent of precipitation data were missing, with 36 hours (0.4 percent) of wind data and 58 hours (0.7 percent) of precipitation data missing in the year 2013 data. Missing wind data were filled using interpolation, except that eight sequential missing hours were filled with data from 2014 for the same hours. Missing precipitation data were filled with zero. Furthermore, interpolation was used to develop wind direction data when the NCDC data contained a direction value of “variable,” which cannot be used as input to the MACCS model. There were 402 hours (4.6 percent) of wind direction data in 2013 that had a variable wind direction. In its RAI response, Entergy provided an example of how interpolation was used to develop missing data and to replace “variable” wind direction data (Entergy 2017b).

F-23
For mixing height data, Entergy explained in its RAI response that morning and afternoon values for the vicinity of RBS were obtained from NCDC for the years 2000 through 2009 because data for the years after 2009 are not available (Entergy 2017b). Seasonal mixing height averages were calculated for the years 2000 through 2009, and these average values were used for the years 2010 through 2014. For the years 2008 and 2009, the actual calculated average values for those years were used.
The sources of data and models for atmospheric dispersion used by the applicant are consistent with standard industry practice and are acceptable for calculating consequences from potential airborne releases of radioactive material. Because multiple years of meteorological data were considered by the applicant, and the annual data set that resulted in the largest total population dose and offsite economic cost was selected for the SAMA analysis, the NRC staff finds that the data selection was performed in accordance with NEI 05-01A, and thus, the meteorological data are appropriate for use in the SAMA analysis.
Entergy projected population distribution and expected growth within a radius of 80 km (50 mi) out to the year 2045 to account for an anticipated 29-year period of remaining plant life (at the time the calculation was performed), including nine years remaining on the original operating license plus a 20-year period of extended operation (Entergy 2017a). The Entergy assessment used U.S. Census 2010 data and scaled the population data to 2045 using parish-level (Louisiana) and county-level (Mississippi) projection estimates. Transient populations were included in the projections. Additionally, for parishes and counties with declining population projections, Entergy clarified that the highest estimated population for the time between 2010 and 2045 was used for the 2045 projection (Entergy 2017a). The total projected population of the 80 km (50 mi) zone of analysis is 1,475,914, and the distribution of the 2045 total population is summarized in Table D.1-14 of the ER. The NRC staff considers the methods and assumptions for estimating population to be reasonable and acceptable for purposes of the SAMA evaluation because its review of Entergy’s assessment determined that Entergy considered appropriate data sources, used a reasonable approach for applying data, followed NRC guidance (NEI 2005), and added conservatism by not crediting negative population growth.
Entergy performed a sensitivity analysis on the time to declaration of an emergency by imposing a 15-minute delay in the emergency declaration from the alarm times determined by the MAAP analyses, and reported the PDR and OECR to be unchanged (Entergy 2017a). In response to an NRC staff RAI to explain why the PDR and OECR were unchanged in this sensitivity analysis (NRC 2017a), Entergy explained that the MAAP results shown in Table D.1-21 of the ER is the earliest time an alarm would be declared resulting in the evacuation of the 10-mile emergency planning zone (EPZ), but that procedurally the assessment, classification, and declaration of an emergency condition may take up to 15 minutes after the availability of indications that an emergency action level (EAL) threshold has been exceeded (Entergy 2017b). For this reason, a sensitivity analysis was performed adding a 15-minute delay in the declaration of an emergency. The reason there was no change in the PDR from this delay is two-fold: 1) the fraction of the population that is evacuated is a small fraction, about two percent, of the total population impacted by a release and 2) the change in the alarm time did not change the relation of the alarm times for each STC to the corresponding release times. Regarding the first reason, the population within the 10-mile emergency planning zone (EPZ) that is evacuated in response to a general alarm is approximately two percent of the total impacted population that resides within the 50-mile radius of the plant. Regarding the second reason, in the baseline SAMA analysis 1) for STCs 2 through 6, 13, and 14, the alarm occurs after the initial plume but prior to subsequent plumes, 2) for STCs 7 through 10 the alarm occurs prior to the initial plume, and 3) for STCs 11

F-24
and 12 the evacuation occurs after all plume releases (the NRC notes that STC 1 is intact containment so releases to the population are minimal). This relationship did not change with a 15-minute delay in the emergency declaration. Entergy further explained that the MACCS results do show small variations in the population dose, but that they are minor and do not result in a noticeable change in the PDR (Entergy 2017b). The NRC staff concludes that the impact of a 15-minute delay in the emergency declaration is expected to be small given that the evacuating population is small relative to the total exposed population, that this delay is a relatively small incremental time compared to the general emergency declaration time, and that this delay is small compared to the duration of the plume releases.
Entergy assumed that 95 percent of the population would evacuate (Entergy 2017a). This assumption is conservative relative to the NUREG-1150 study (NRC 1990), which assumed evacuation of 99.5 percent of the population within the 10-mile EPZ. Entergy performed a sensitivity analysis on the percent of the population assumed to evacuate, reducing it to 90 percent of the 10-mile EPZ population and increasing it to 100 percent of the population. The PDR and OECR were determined to be unchanged (Entergy 2017a). The evacuated population was assumed to move at an average speed of 10 meters per second (22.4 miles per hour). This evacuation speed is lower than the average evacuation speed in 11 of 12 evacuation scenarios evaluated, with the average evacuation speed for the slowest scenario being 8.3 m/s (18.5 miles per hour) (Entergy 2017a). Entergy performed a sensitivity analysis on the evacuation speed, reducing it by half to 5 meters per second (11.2 miles per hour) and increasing it by 50 percent to 15 meters per second (33.6 miles per hour). The PDR and OECR were determined to be unchanged (Entergy 2017a). In response to an NRC staff RAI to explain why the PDR and OECR were unchanged in both of these sensitivity analyses (NRC 2017a), Entergy explained that the population within the 10-mile EPZ that is evacuated is a small fraction, approximately two percent, of the total impacted population that resides within the 50-mile radius of the plant. Since a relatively small number of people are affected by evacuation, the results of the sensitivity analysis show that the changes in the fraction of people evacuating and in the evacuation speed do not noticeably change the PDR results (Entergy 2017b). Given that Entergy performed a site-specific analysis to determine evacuation assumptions and parameters and showed radiological consequence results were insensitive to changes to certain evacuation parameters, the NRC staff concludes that the evacuation assumptions and analysis are reasonable and acceptable for the purposes of the SAMA evaluation.
The site-specific economic data were provided from the 2012 U.S. Census of Agriculture, SECPOP 2013, U.S. Bureau of Labor Statistics, and gross metropolitan product (GMP) from the U.S. Office of Management and Budget. Parish and county representation within a spatial element was based on the parish or county with the greatest area contribution. Data for certain counties and parishes were not incorporated into the analysis because of their small area contributions within a spatial element. Agricultural data were obtained from 2012 U.S. Census of Agriculture data for the 80-km (50-mi) area and applied to the MACCS crop categories. Economic costs for evacuation, relocation, and decontamination were scaled to year 2016 costs from 2006 values obtained from MACCS using the ratio of the 2016 and 2006 consumer price index (CPI) values. Using the site-specific information, Entergy determined that the non-farmland decontamination costs (CDNFRM) was $30,586/person. Entergy performed a sensitivity analysis on two of the MACCS offsite contamination inputs, increasing the decontamination time (TIMDEC) to approximately 365 days and increasing the non-farmland decontamination costs (CDNFRM) to $100,000 per person. These values bound the sensitivity analysis values recommended in the U.S. Nuclear Regulatory Commission’s decision in the Indian Point license renewal proceeding (NRC 2016d). In Entergy’s sensitivity analysis, the OECR was reported to increase by 78 percent, the PDR was reported to be unchanged, and the

F-25
maximum averted cost risk (see Section F.6.1) was reported to increase by 28 percent. This change in the maximum averted cost risk is bounded by the uncertainty analysis results discussed in Section F.6.2. Thus, the staff considers the MACCS values, adjusted to 2016 costs using the CPI, that were used by the applicant to be reasonable for the SAMA analysis.
In summary, the NRC staff reviewed Entergy’s assessments of the source term, radionuclide releases, meteorological data, projected population distribution, emergency response, and regional economic data and evaluated Entergy’s responses to the NRC staff’s RAIs, as previously described in this subsection. Based on its review, the NRC staff concludes that Entergy’s consequence analysis is acceptable and that Entergy’s methodology to estimate offsite consequences for RBS and consideration of parameter sensitivities provide an acceptable basis to assess the risk reduction potential for candidate SAMAs. Accordingly, the NRC staff based its assessment of offsite risk of severe accidents at RBS on the CDFs, population doses, and offsite economic costs reported by Entergy.
F.3 Potential Plant Improvements
Entergy’s process for identifying potential plant improvements (in the form of SAMAs), an evaluation of that process, and the improvements evaluated by Entergy are discussed in this section.
F.3.1 Process for Identifying Potential Plant Improvements
Entergy’s process for identifying potential plant improvements consisted of the following elements:
• review of SAMAs identified in industry documents, specifically NEI 05-01A(NEI 2005)
• review of SAMA analyses for other BWR plants• review of potential plant improvements identified in the RBS IPE and IPEEE• review of the risk-significant events in the current RBS PRA Level 1 and Level 2
models
Based on this process, Entergy identified an initial set of 206 candidate SAMAs, referred to as Phase I SAMAs. In Phase I of the evaluation, Entergy performed a qualitative screening of the initial list of SAMAs and eliminated various SAMAs from further consideration using the following criteria:
• the SAMA modifies features not applicable to RBS• the SAMA has already been implemented at RBS• the SAMA is similar in nature and could be combined with another SAMA candidate• the SAMA has an excessive implementation cost (in excess of the modified
maximum averted cost-risk)• the SAMA is expected to have a very low benefit (related to a non-risk-significant
system)
Based on this screening, 158 of the Phase I SAMA candidates were screened out. One of the remaining SAMA candidates was divided into three different SAMAs leaving 50 for further evaluation. These remaining SAMAs, referred to as Phase II SAMAs, are listed in Table D.2-1 of Attachment D to the applicant’s ER (Entergy 2017a). In Phase II, a detailed evaluation was

F-26
of Attachment D to the applicant’s ER (Entergy 2017a). In Phase II, a detailed evaluation was performed for each of the 50 remaining SAMA candidates, as discussed in Sections F.4 and F.6 below.
F.3.2 Review of Entergy’s Process
The initial SAMA list was developed primarily from a review of generic industry SAMAs (NEI 2005), as well as consideration of cost-beneficial SAMAs from 12 previous BWR license renewal applications3. While the RBS IPE and IPEEE did not identify any vulnerabilities requiring enhancements, two fire-related SAMA candidates that were potentially cost-beneficial at other plants were retained for further evaluation because they were applicable to fire areas identified as top contributors in the IPEEE. Finally, a review of the RBS PRA Level 1 and Level 2 LERF results was performed to identify any additional SAMAs and confirm that all important events had been addressed. Three additional SAMA candidates were added as a result of this review (Entergy 2017b).
The NRC staff reviewed the Phase I identification and screening of SAMA candidates during the November 2017 audit. This review resulted in a number of questions concerning this process.
• The discussion for two SAMAs involving heating ventilation and air conditioning(HVAC) identifies a recent analysis of the control building that shows reduced HVACimportance and that these SAMAs do not consider the control building loss of HVAC.In response to an NRC staff request to provide more information regarding thisanalysis (NRC 2017a), Entergy indicated that recent control building HVAC analysesincluded revised control building heat-up calculations as well as revised equipmentsurvivability assessments (Entergy 2017b). The studies demonstrated that the mostlimiting equipment in a specific room would function for the room temperature profilesresulting from a loss of room cooling. An interim PRA model was used to evaluatethe changes in the control building HVAC requirements. This model demonstratedsignificantly lower risk with a single division of chillers or control building HVAC out ofservice due to realistic treatment of equipment survivability and the limited actionsrequired to recover switchgear room cooling. Incorporation of the above changesinto the SAMA PRA model would result in a much lower control building HVACcontribution to risk such that any related SAMAs would not be cost beneficial(Entergy 2017b). As discussed above, incorporation of the results of these studiesinto the Revision 6 PRA is a contributor to the significant reduction in the CDF forthat model.
• The discussion of SAMA 120, to install a hardened containment vent, cites acontainment vent study. In response to a request to provide more informationregarding this study (NRC 2017a), Entergy described the study's assessment ofthree different venting strategies in the event of loss of all containment decay heatremoval (Entergy 2017b). The study indicated that use of a 3-inch containmentpurge vent would not prevent containment failure, while venting through containmentairlock deflated inner seals would be successful. These vent paths are included inthe RBS Emergency Operating Procedures (Entergy 2017b). While the Revision 5APRA used for the SAMA analysis does not take credit for containment venting, theRevision 6 update does include a model for venting through deflated containment
3 In response to an NRC staff RAI, Entergy indicated that the SAMA analysis for one of the 13 BWR plants listed in the ER had not been reviewed. Entergy concluded that since so many SAMAs had already been considered, the review of this added plant would not be expected to add a new retained SAMA (Entergy 2017b).

F-27
airlock inner door seals, which contributes to a significant reduction in CDF resulting from the loss of all containment decay heat removal.
• The discussion of SAMA 170, to increase the seismic ruggedness of plantcomponents already installed, is based on RBS having identified components whoseseismic ruggedness could be improved in the IPEEE. The NRC staff noted in an RAIthat the RBS IPEEE does not identify any such components (NRC 2017a). Inresponse to the RAI, Entergy indicated that the IPEEE concluded that the RBScomponents are seismically rugged based on reviewing design documents andperformance of a seismic walkdown (Entergy 2017b). Furthermore, Entergy’sresponse to the NRC staff’s RAI dated March 26, 2014 (Entergy 2014b) concludedthat further seismic risk evaluations were not required. As described in ERSection D.1.3.5, an external event multiplier of 7 (rounded up from the calculatedvalue of 6.9) was used in the SAMA analyses to account for the risk contribution fromexternal events in the SAMA evaluations. Given the above discussion, Entergyconcluded that improving the seismic ruggedness of selected components would notsignificantly reduce seismic risk nor change the SAMA evaluation results(Entergy 2017b).
In Table D.1-2 of the ER (Entergy 2017a), Entergy provided a tabular listing of the Level 1 PRA basic events having CDF importance down to a risk reduction worth (RRW) of 1.005. SAMAs affecting these basic events would have the greatest potential for reducing risk. An RRW of 1.005 corresponds to a reduction in CDF of approximately 0.5 percent, given 100 percent reliability of the SAMA. Based on the maximum averted cost risk including external events and uncertainty (see Section F.6.1 below), this equates to a benefit of approximately $36,000. This is below the minimum cost of a simple procedure change with associated training as given by Entergy (see Section F.5 below), and therefore SAMAs below this value may be screened out as not cost-beneficial. All basic events in the Level 1 listing were reviewed to identify potential SAMAs and the listing was then annotated to indicate which of the Phase II SAMAs mitigate the failure associated with the basic event. All basic events were addressed by one or more Phase II SAMAs from the list based on the generic industry SAMAs or RBS specific SAMAs (Entergy 2017a).
The NRC staff’s review of the information in Table D.1-2 of the ER led to a number of RAIs as follows:
• Event E12-MDP-MA-C002A, "RHR [residual heat removal] pump A is unavailabledue to maintenance," is addressed by a number of SAMAs that are either notapplicable to this event (SAMAs 79 and 198) or involve costly new systems(SAMAs 110, 115, and 120). Entergy was asked to consider other alternatives tomitigate this event such as eliminating or reducing on-line maintenance of the RHRpump (NRC 2017a). Entergy replied that reducing on-line maintenance would lowerthe risk but there are substantial costs associated with moving the requiredmaintenance to an outage, including extended outage time and cost of replacementpower (Entergy 2017b). In addition, the RRW of this event in the recently completedRevision 6 PRA (1.0009) is significantly lower than its importance in the Revision 5Amodel (1.143). The difference in importance is primarily due to the addition of aventing path (personnel air lock) for removal of decay heat from the containment inthe R6 PRA model, as well as including credit for FLEX equipment and proceduresfor suppression pool cooling under extended loss of AC power (ELAP) conditions.Thus, Entergy concluded that any potential benefit associated with SAMAs for event

F-28
E12-MDP-MA-C002A has been reduced by recent improvements in plant procedures in combination with FLEX strategies (Entergy 2017b).
• Event FPW-XHE-LO-T2SBO, "operator fails to follow attachment 2 for SBO," is addressed by several hardware modifications. Because this event is given a failure probability of 0.5 and has a fairly high RRW of 1.117, Entergy was asked to discuss the potential for a SAMA to improve the procedure or training for injection of fire water for SBO (NRC 2017a). In response to the RAI, Entergy noted that the 0.5 probability for this event is a screening value that is applied during initial quantification (Entergy 2017b). After quantification, recovery rules are applied and the actual failure probability for this event, when alone in a cutset, is 0.1. Entergy evaluated a new SAMA to improve the procedures and training on injection with the fire water system (Entergy 2017b). The evaluation of this SAMA is discussed further in Section F.6.2.
• Event IE-T3C, "Initiator, Inadvertent opening of SRV [safety relief valve]," is addressed by SAMA 108 - Improve SRV and main steam isolation valve (MSIV) pneumatic components and SAMA 160 - Increase SRV reseat reliability. Because it was not clear to the NRC staff that either of these SAMAs address this event, Entergy was asked to discuss the potential for other SAMAs that address or mitigate this event (NRC 2017a). In response to the RAI, Entergy stated that the disposition of initiator IE-T3C incorrectly referenced SAMA 108, and that SAMA 160 is applicable to IE-T3C (Entergy 2017b). The initiating event, although named "Inadvertent opening of SRV," also includes the fact that the SRV subsequently sticks open (does not reseat). Table F–6 describes the PRA model changes made to evaluate the risk reduction for this SAMA. No additional SAMAs were identified by Entergy to mitigate this initiating event (Entergy 2017b).
• Because the NRC staff noted that Table D.1-2 of the ER includes a number of standby service water (SSW) pumps B and D failure events but not any events for failure of SSW pumps A or C, Entergy was asked to explain the reasons for this difference and to discuss if the reasons suggest any potential SAMAs (NRC 2017a). In response, Entergy stated that the SSW system is divided into two trains of two pumps each wherein Train A SSW contains pumps A and C while Train B SSW contains pumps B and D (Entergy 2017b). Due to differences in flow requirements for the different trains, because of the additional Train B flow required for the component cooling water pump system, failure of either pump B or D causes failure of Train B SSW whereas failures of both pumps A and C are needed to fail Train A SSW. SAMA 80, to add a SSW pump, addresses the SSW train asymmetry. To remove the asymmetry, while ensuring redundancy and allowing for maintenance, both Train B pumps would have to be replaced with larger pumps capable of providing sufficient flow. That modification would cost more than SAMA 80 and would not be cost-beneficial. Other SAMAs, such as SAMA 21 and SAMA 22, which provide backup diesel cooling, and SAMA 17, which provides backup flow to the RHR heat exchanger, also mitigate failures of the SSW pumps. No additional SAMAs were identified by Entergy to address the asymmetry between Train A and Train B SSW (Entergy 2017b).
• Event SWP-MOV-CC-F055A, "motor operated valve 1SWP*MOV55A fails to open on demand" is stated in the ER to be addressed by SAMAs 75 and 80, both of which pertain to the service water pumps. Entergy was asked in an NRC staff RAI to discuss the potential for a SAMA for the operator to manually open the valve (NRC 2017a). In response to the RAI, Entergy explained that the RBS model includes an operator action (SWP-XHE-FO-F055A) to manually open valve

F-29
SWP-MOV55A if it fails due to loss of power (Entergy 2017b). This action is needed for SBO accident sequences because valve SWP-AOV599, which provides the initial HPCS diesel service water return path to the cooling towers, has a 4-hour air supply. The time window for completing the action (opening SWP-MOV55A) is 4 hours to ensure continued operation of the HPCS diesel. For non-SBO LOSP conditions (where random failure of valve 1SWP*MOV55A to open is important) the time window is much shorter. The operating diesels will overheat in one to three minutes on a loss of cooling. In calculating the non-recovery probability, the RBS PRA assumes a median response time of 30 minutes for the operator action to manually open SWP-MOV55A, including travel time to its location in the piping tunnels and the time to manually open this 30-inch valve. This assumed time greatly exceeds the three minutes that would be available for this action under situations in which power is available before the diesels overheat. Thus, in LOSP but non-SBO sequences, an action to manually open SWP-MOV-55A is not feasible. For non-SBO, non-LOSP sequences the risk impact of SWP-MOV-55A failing to open is very small (a Fussell Vesely importance of 4.71 × 10⁻⁴). Thus, Entergy concluded that an operator action to manually open this valve under these conditions would not be cost-beneficial (Entergy 2018).
• For Event ADS-XHE-FO-INDIV, "operator fails to start [Automatic DepressurizationSystem] ADS by opening individual ADS valves or SRVs,” Entergy was asked toconsider improvements in procedures and training (NRC 2017a). Entergy respondedto the RAI stating that a new SAMA case was performed to evaluate the potentialbenefit from improvements in procedures and training for this event. The evaluationof this SAMA is discussed further in Section F.6.2.
The NRC staff noted in an RAI that from the information in ER Tables D.1-1 and D.1-2, the frequency of initiating event IE-TNSW, “Failure of the Normal Service Water (NSW)/Service Water Cooling (SWC) System,” is input into the internal events PRA as a value rather than as a fault tree model. The basic events that contribute to this frequency will therefore not appear in the list of risk significant terms in Table D.1-2. Entergy was asked to describe NSW and SWC systems, their operation, and modeling in the PRA, particularly with respect to operation in hot weather, and to discuss the identification of candidate SAMAs, other than SAMA 197, “Generation Risk Assessment implementation into plant activities,” that would mitigate the risk of this initiator (NRC 2017a). Entergy indicated the service water system contains two interconnected subsystems, the NSW sub-system and the SSW sub-system. The modeling of the SWC system was described and it was stated that failure of the SWC system is included in the TNSW initiator frequency since failure of SWC is expected to result in a loss of NSW. The event with the highest RRW in the IE-TNSW cutsets is SWC-PHN-DN-SCHOT, "Summer Temperatures require four of five fans to run to maintain SWC temps." This is followed by mechanical failure events and maintenance events for SWC fans and NSW pumps. Entergy concluded that only large-cost SAMAs, such as adding fans or pumps, would have a significant impact on this initiator and therefore, no additional SAMAs are proposed to mitigate this initiator (Entergy 2017b).
In Tables D.1-4 and D.1-5 of the ER (Entergy 2017a), Entergy also provided and reviewed the basic events having LERF and large late release (STCs 6, 9, 10,13 and 14) frequency, respectively, down to an RRW of 1.005. All basic events were reviewed to identify potential SAMAs and all were addressed by one or more Phase II SAMAs, except those that were split fractions for which Entergy stated no SAMA needed to be correlated. The NRC staff noted in an RAI that while these split fraction events are in some cases related to deterministic phenomenological analysis or assumptions and not hardware or other failures, they do indicate

F-30
the importance of a number of these events and the associated assumptions. Also, as indicated by the base case risk results, STCs 9 and 10 dominate the risk and involve penetration failures with and without scrubbing in the auxiliary building. It therefore appeared to the staff that steps which could be taken to reduce the impact of these STCs should be considered. Entergy was asked to discuss this particular example and a more general question addressing potential SAMAs suggested by review of the Level 2 split fractions (NRC 2017a). In response to the RAI, Entergy indicated split fractions are used to represent the likelihood of various phenomenological events from the deterministic analysis of the physical processes for the spectrum of severe accident progressions (Entergy 2017b). In general, Entergy explained that SAMAs do not need to be correlated for split fractions because split fractions add up to 1.0 and result in cutsets that are duplicates except for the split fraction events themselves. Reducing one part of the fraction necessitates increasing the other part of the fraction. Therefore, to mitigate cutsets containing split fractions, other event(s) in the cutsets should be mitigated. However, these split fractions are in cutsets with hardware failures and human action failures and the dominant hardware failures and human action failures also show up in the RRW tables. Since SAMAs have been evaluated for all of the important hardware and human action failure events, there is no need to evaluate SAMAs for the split fraction events (Entergy 2017b).
In response to this same RAI, Entergy also discussed the potential for a SAMA to impact the effectiveness of auxiliary building scrubbing. In a sensitivity analysis, Entergy showed that taking additional credit for auxiliary building scrubbing has the potential to significantly reduce the large releases in the Level 2 model. However, Entergy concluded that there was no defensible basis for the credited reduction in fission produce releases and that developing a defensible basis would necessitate additional modeling or testing. Also, since the actual location of releases into the auxiliary building is unknown and there would be negative consequences from using a spray system in the auxiliary building to scrub the releases, both from spraying safety-related components at power and from flood risk, Entergy identified no potential SAMAs for evaluation (Entergy 2017b).
The NRC staff’s review of the generic list of SAMA candidates in NEI 05-01A observed that the list includes a number of potential SAMA candidates addressing external events with some included in the RBS Phase II analysis, but none of the generic list are specific to RBS. In an RAI, the NRC staff noted that based on the best available information, the CDF for each of the external events (seismic, internal fire and internal floods) is approximately equal to, or greater than, the internal events CDF, and the staff asked Entergy to discuss the steps taken to identify potential SAMAs that would mitigate the RBS specific risks due to these hazards (NRC 2017a). Entergy addressed the identification of SAMAs for each of these hazards as follows.
• The RBS IPEEE used a limited-scope seismic margins assessment, which provided neither quantitative risk information nor deterministic seismic capacities for specific RBS systems, structures, or components. The IPEEE did not identify any seismic vulnerabilities, and RBS is in a region of low seismicity. Also, as discussed above, additional reviews of the impact of seismic events to RBS were undertaken following the accident at the Fukushima Dai-ichi Nuclear Power Plant. The NRC staff concluded that the licensee, through the implementation of the walkdown guidance activities and, in accordance with plant processes and procedures, verified the plant configuration with the current seismic licensing basis; addressed degraded, nonconforming, or unanalyzed seismic conditions; and verified the adequacy of monitoring and maintenance programs for protective features (Entergy 2017b).
• The Phase I list of SAMA candidates included several that mitigate fire related risk from the generic and other SAMA analysis sources. Ten were considered, but were

F-31
either not applicable or were not judged to be necessary to mitigate fire risk at RBS. Three fire-related Phase I SAMAs were combined into one SAMA and, along with one additional SAMA, were retained for the Phase II cost-benefit evaluation. Further, the dominant contributors to fire risk were examined for possible mitigation, but no additional SAMAs were postulated (Entergy 2017b).
• Four generic SAMA candidates for mitigating internal flood risk were considered inPhase I, but were not judged to be necessary to mitigate internal flood risk. OneSAMA, to improve internal flooding procedures was retained for evaluation. Further,the dominant contributors to internal flood risk in the model used for the SAMAanalysis were examined for possible mitigation, but no additional SAMAs werepostulated (Entergy 2017b).
As discussed above in Section F.2.2.2, the RBS external flooding focused evaluation demonstrated that there was adequate physical margin for the LIP hazard and the PMF hazards on West Creek and the Mississippi River. Considering that permanent, passive protection is in place at RBS for these conservatively analyzed floods, the contribution to CDF from external flooding is negligible (Entergy 2017b). Furthermore, the NRC staff notes that the need for any mitigating action for external floods is being addressed as part of the NRC Order EA-12-049 program as a current operating issue, and no additional external flooding SAMAs need to be considered for license renewal.
The NRC staff questioned the applicant about additional potentially lower cost alternatives to a number of the SAMAs as follows:
• SAMA 34 – “Provide alternate feeds to essential loads directly from an alternateemergency bus” is evaluated using a plant-specific cost estimate of $2.3M. Case 4evaluating this SAMA is stated in ER Section D.2.3 to assume an added independentAC power source to each safety 4160VAC bus. Entergy was asked to clarify thescope of the design used for the cost estimate (NRC 2017a). Entergy stated in theRAI response that the SAMA 34 implementation cost estimate was for a powersupply from an alternate bus to a single safety-related 4160VAC bus(Entergy 2017b).
• SAMAs 80, 110, 115, and 120 all involve major new systems to mitigate loss ofcooling events and are cited for a large number of significant basic events inTable D.1-2 including, for example: SWP-XHE-FO-RETRN, "Operator fails to openSWP manual isolation valve before containment over pressurization failure,"SWP-XHE-RE-F055A, "operator fails to restore XOV downstream of F055A,” andE12-MOV-OO-F048A, "water diverted from RHR A HXS because bypass valveMOV F048A fails to close." Entergy was asked to describe these and other similarevents and to consider the possibility of lower cost alternatives such as simplerhardware changes, changes in system operation so that fewer changes in valveposition are necessary, procedure improvements, and training improvements(NRC 2017a). Entergy described the function of each of the valves in these eventsand noted that, while these valves are important for loss of decay heat scenarios inthe Revision 5A model, the core damage contribution for the valves is significantlyreduced in the Revision 6 model (by as much as two orders of magnitude)(Entergy 2017b). The difference is primarily due to addition of a venting path(personnel air lock) for removal of decay heat from containment in the Rev 6 model,as well as credit for FLEX equipment and procedures for Suppression Pool Coolingunder ELAP conditions. Based on this, Entergy concluded that lower costalternatives such as those suggested are not viable mitigation alternatives. Entergy

F-32
further explained that changes in system operation, such that fewer changes in valve position would be necessary, are not applicable since the manual valves are typically operated only for required testing and maintenance. The RHR valve is typically stroked during testing and maintenance or when the heat exchanger is needed for heat removal. Procedure and training improvements would provide very limited benefit since manual operation of valves is simple and within the skill of the personnel’s craft. Hardware modifications that would reduce the risk associated with these valve modifications are relatively complex since they would also require electrical power and control circuits in addition to the piping modifications and, therefore, would not be cost-beneficial. For the reasons cited above, less complicated hardware changes were not identified by Entergy (Entergy 2017b).
The staff notes that the set of SAMAs submitted is not necessarily all-inclusive, because additional, possibly even less expensive, alternatives can always be proposed. However, the staff concludes that the benefits of any additional modifications are unlikely to exceed the benefits of the modifications evaluated, and that the alternative improvements likely would not cost less than the least expensive alternatives evaluated when the subsidiary costs associated with maintenance, procedures, and training are considered.
The staff concludes that Entergy used a systematic and comprehensive process for identifying potential plant improvements for RBS, which included reviewing a list of generic industry SAMAs (NEI 2005), reviewing insights from the RBS plant specific risk studies, including internal initiating events as well as fire, seismic and other external initiated events, considering cost-beneficial plant improvements from previous SAMA analyses, and satisfactorily addressing the NRC staff’s questions regarding the SAMA identification process. The staff further concludes that the set of SAMAs evaluated in the ER, together with those evaluated in response to staff inquiries, is reasonably comprehensive and acceptable.
F.4 Risk Reduction Potential of Plant Improvements
In the ER, and in response to the staff’s RAIs, the applicant evaluated the risk-reduction potential of the 50 SAMAs that were not screened out in the Phase I analysis and were retained for the Phase II evaluation. The applicant’s SAMA evaluations were generally performed using conservative assumptions (e.g., the SAMA is assumed to completely eliminate the associated risk).
Table F-6 lists the assumptions considered to estimate the risk reduction for each of the evaluated SAMAs; the estimated risk reduction in terms of percent reduction in CDF, PDR, and OECR; the estimated total benefit (present value) of the averted risk, and the estimated implementation cost. The estimated benefits reported in Table F-6 reflect the combined benefit in both internal and external events. The determination of the implementation costs and benefits for the various SAMAs is further discussed in Sections F.5 and F.6, respectively. The SAMAs identified in bold in Table F-6 were found to be potentially cost-beneficial; the other listed SAMAs were determined not to be potentially cost-beneficial, which is further discussed in Section F.6.
With the exception of one SAMA associated with internal floods and two SAMAs associated with internal fires, Entergy used model re-quantification to determine the potential benefits for each SAMA. The CDF, PDR, and OECR were estimated using the RBS R5A PRA model for the non-flood and non-fire SAMAs. The changes made to the model to quantify the impact of SAMAs

F-33
are detailed in Section D.2.3 of Attachment D to the ER (Entergy 2017a). Bounding evaluations (or analysis cases) were performed to address specific SAMA candidates or groups of similar SAMA candidates.
For the internal flood related SAMA, SAMA 169 (Case 14), the benefit was determined by estimating the reduction in CDF using the 2012 internal flood analysis PRA model. Entergy assumed that this SAMA (to improve the internal flooding procedures) eliminated the CDF of the top ten internal flooding scenarios that make up 48 percent of the total internal flood CDF. The benefit of completely eliminating the internal flood CDF was then assumed to be the ratio of the total internal flooding CDF to the total internal events CDF multiplied by the total present dollar value equivalent associated with completely eliminating severe accidents from internal events at RBS, which is discussed in Section F.6.1. The benefit of SAMA 169 is then determined by completely eliminating the CDF of the top ten internal flooding scenarios, which is 48 percent of the benefit of completely eliminating the internal flood CDF.
For the internal fire related SAMAs, SAMA 183 (Case 36) and SAMA 185 (Case 37), the benefit was estimated using the results of the IPEEE fire analysis to eliminate the risk associated with the fire zone impacted by the SAMA. For SAMA 183, addition of incipient detection and suppression to the Division 1 Switchgear Room, it was assumed that the SAMA eliminated the CDF of the Division 1 Switchgear Room, which makes up 21 percent of the total fire CDF (see Table F-4 above). For SAMA 185, upgrade the Alternate Shutdown System (ASDS) panel to include additional system controls for the opposite division, it was assumed that the SAMA eliminated the CDF of the control room and (as stated in response to an NRC staff RAI (Entergy 2017b)) the control room ventilation room, which combined make up 42 percent of the total fire CDF (see Table F-4 above). The benefit resulting from complete elimination of the internal fire CDF was first calculated by multiplying the ratio of the total internal fire CDF to the total internal events CDF by the total present dollar value equivalent associated with completely eliminating severe accidents from internal events at RBS, which is discussed in Section F.6.1. The benefit of SAMAs 183 and 185 was then calculated by multiplying the benefit of completely eliminating the internal fire CDF by the percentage of the total internal fire CDF that each SAMA is assumed to eliminate. For the evaluation of these two fire-related SAMAs, the total internal fire CDF is taken to be a factor of 2.5 less than that from the IPEEE, which is the same as was used in determining the external events multiplier discussed in Section F.2.2.2 above.
Case 37, Reduce Risk from Fires That Require Control Room Evacuation, was used to evaluate the benefit for SAMA 185 by assuming this SAMA eliminated control room fires from the RBS fire CDF. The NRC staff noted in an RAI that fires other than in the control room may require control room evacuation and could benefit from the upgrade of the ASDS panel. Entergy was asked in an NRC staff RAI to identify the other control room abandonment areas and discuss the impact on the cost-benefit analysis of SAMA 185 from crediting the risk reduction benefit of this SAMA for the identified abandonment areas (NRC 2017a). In response to the RAI, Entergy indicated that, upon further review, fires in one other area in the control building have the potential to result in control room evacuation (Entergy 2017b). Smoke generated from fires in Fire Area C-17, Control Room Ventilation Room, could be transferred to the control room and ultimately require evacuation because of low visibility. A bounding analysis was performed by eliminating the CDF associated with these two rooms, which is 42 percent of the total fire CDF (see Table F-4 above). Entergy calculated a revised benefit using the same method as that described for Case 37, which is reported in Table F-6 (Entergy 2017b), and concluded that SAMA 185 is potentially cost-beneficial.
The benefit for these two fire-related cases (i.e., Cases 36 and 37) was determined based on the assumption that the percentage reduction in PDR and OECR is the same as the percentage

F-34
reduction in CDF. An examination of the results for the risk reductions given in ER Table D.2-1 indicates that this assumption is not necessarily conservative. Depending on the case, the reduction in OECR is often a factor of 1.1 to 1.4 times the CDF reduction. For Case 17, the OECR reduction is 2.4 times the CDF reduction. In response to an RAI to discuss the impact of this assumption on the cost-benefit analyses of SAMAs 183 and 185 (NRC 2017a), Entergy determined that the PDR reductions in Table D.2-1 range from 0.6 to 3.8 times the CDF reduction, with an average of 1.4 (Entergy 2017b). Also, the OECR reductions range from 0.8 to 3.7 times the CDF reduction, with an average of 1.3. If the benefit values for SAMA 183 are increased by a factor of 1.4, the 95th percentile benefit is $970,000 versus a cost of $1,100,000 and SAMA 183 remains not cost-beneficial (Entergy 2017b). As noted above, SAMA 185 was found to be cost-beneficial in a revised analysis.
The NRC staff’s review of the assumptions and risk reduction potential for the SAMAs led to an additional RAI as discussed below.
Case 19 evaluates the benefit of SAMA 87, "Install digital feedwater upgrade," by setting the loss of feedwater system initiating event (IE-T3B) to false in the base model Level 1 and Level 2 cutsets. Entergy was asked to discuss the potential for the additional benefit of the upgrade resulting from the reduction in the potential for loss of feedwater following other initiators (NRC 2017a). Entergy re-evaluated Case 19 assuming that feedwater also does not fail following other initiators, and concluded that SAMA 87 remains not cost-beneficial (Entergy 2017b).
The NRC staff has reviewed Entergy’s bases for calculating the risk reduction for the various plant improvements and finds that the rationale and assumptions for estimating risk reduction are reasonable, generally conservative (i.e., the estimated risk reduction is higher than what would actually be realized), and acceptable for the SAMA analysis. The staff concludes that, with the above clarifications, the consideration of risk reduction potential of plant improvements by Entergy is sufficient and appropriate for use in the SAMA evaluation because it is technically sufficient and meets the guidance provided in NEI 05-01A.

F-35
Tabl
e F-
6. S
AMA
Cos
t/Ben
efit
Anal
ysis
for R
iver
Ben
d St
atio
n U
nit 1
a
Anal
ysis
Cas
e, A
naly
sis
Assu
mpt
ion,
Indi
vidu
al S
AM
As, a
nd C
ost E
stim
ates
% R
isk
Red
uctio
n
Inte
rnal
an
d Ex
tern
al
Bene
fit
Inte
rnal
an
d Ex
tern
al
Bene
fit w
ith
Unc
erta
inty
C
DF
PDR
O
ECR
C
ase
1. D
C P
ower
As
sum
ptio
n: E
limin
ates
bat
tery
-rel
ated
failu
res
(A
naly
sis
Cas
e fo
r SAM
A N
os. 1
, 2)
1—Pr
ovid
e ad
ditio
nal b
atte
ry c
apac
ity
$2,1
30,0
00
2—R
epla
ce le
ad-a
cid
batte
ries
with
fuel
cel
ls
$4,0
80,0
00
8 8
8 $1
43,0
00
$572
,000
Cas
e 2.
Impr
ove
Cha
rger
Rel
iabi
lity
As
sum
ptio
n: E
limin
ates
failu
re o
f bat
tery
cha
rger
s (A
naly
sis
Cas
e fo
r SAM
A N
o. 4
3)
43—
Mod
ify p
orta
ble
stat
ion
gene
rato
r to
auto
mat
ical
ly a
lign
to 1
25 V
DC
bat
tery
cha
rger
s $4
00,0
00
2 7
7 $9
2,60
0 $3
70,0
00
Cas
e 3.
Incr
ease
Ava
ilabi
lity
of O
n-Si
te A
ltern
atin
g C
urre
nt (A
C) P
ower
As
sum
ptio
n: E
limin
ates
failu
re o
f on-
site
pow
er fe
eds
to s
afet
y re
late
d bu
ses
(Ana
lysi
s C
ase
for S
AMA
No.
3)
15—
Inst
all a
gas
turb
ine
gene
rato
r with
torn
ado
prot
ectio
n $1
0,00
6,00
0
36
45
45
$753
,000
$3
,011
,000
Cas
e 4.
Impr
ove
AC P
ower
As
sum
ptio
n: A
dds
inde
pend
ent p
ower
sou
rce
to th
e 41
60 V
AC b
uses
(A
naly
sis
Cas
e fo
r SAM
A N
o. 3
4)
34—
Prov
ide
alte
rnat
e fe
eds
to e
ssen
tial l
oads
dire
ctly
from
an
alte
rnat
e em
erge
ncy
bus
$2,3
24,0
00
20
28
28
$457
,000
$1
,827
,000
Cas
e 5.
Red
uce
Loss
of O
ff-Si
te P
ower
dur
ing
Seve
re W
eath
er
Assu
mpt
ion:
Elim
inat
es th
e se
vere
wea
ther
con
tribu
tion
to lo
ss o
f offs
ite
pow
er
(Ana
lysi
s C
ase
for S
AMA
No.
14)
14
—In
stal
l an
addi
tiona
l, bu
ried
off-s
ite p
ower
sou
rce
$2,5
00,0
00
21
22
21
$382
,000
$1
,528
,000
Cas
e 6.
Pro
vide
Bac
kup
Emer
genc
y D
iese
l Gen
erat
or (E
DG
) Coo
ling
As
sum
ptio
n: E
limin
ates
failu
re o
f SSW
coo
ling
to th
e ED
Gs
(Ana
lysi
s C
ase
for S
AMA
Nos
. 21,
22)
21
—U
se fi
re w
ater
sys
tem
as
a ba
ckup
sou
rce
for d
iese
l co
olin
g $1
,344
,000
22—
Add
a ne
w b
acku
p so
urce
of d
iese
l coo
ling
$2,0
00,0
00
3 5
5 $7
8,80
0 $3
15,0
00

F-36
Anal
ysis
Cas
e, A
naly
sis
Assu
mpt
ion,
Indi
vidu
al S
AM
As, a
nd C
ost E
stim
ates
% R
isk
Red
uctio
n
CD
F
PD
R
OEC
R
Inte
rnal
an
d Ex
tern
al
Bene
fit
Inte
rnal
and
Ex
tern
al
Bene
fit w
ith
Unc
erta
inty
Cas
e 7.
Incr
ease
ED
G R
elia
bilit
y
Assu
mpt
ion:
Elim
inat
es fa
ilure
of E
DG
fuel
sup
ply
(Ana
lysi
s C
ase
for S
AMA
Nos
. 30,
204
) 30
—Pr
ovid
e a
porta
ble
EDG
fuel
tran
sfer
pum
p $1
,477
,000
204—
Adde
d ca
pabi
lity
to c
ross
-tie
fuel
oil
supp
ly to
em
erge
ncy
dies
el g
ener
ator
s $2
00,0
00
3 3
3 $4
8,70
0 $1
95,0
00
Cas
e 8.
Impr
ove
Die
sel G
ener
ator
Rel
iabi
lity
Assu
mpt
ion:
Elim
inat
es c
omm
on c
ause
failu
re o
f fai
lure
to s
tart
EDG
s (A
naly
sis
Cas
e fo
r SAM
A N
o. 3
3)
33—
Prov
ide
a di
vers
e sw
ing
dies
el g
ener
ator
air
star
t co
mpr
esso
r $1
00,0
00
0 <1
<1
$6
,500
$2
5,80
0
Cas
e 9.
Red
uce
Plan
t Cen
tere
d Lo
ss o
f Off-
site
Pow
er
Assu
mpt
ion:
Elim
inat
es fa
ilure
of s
witc
hyar
d tra
nsfo
rmer
s an
d m
ain
pow
er
feed
s fro
m th
e sw
itchy
ard
(Ana
lysi
s C
ase
for S
AMA
No.
38)
38
—Pr
otec
t ser
vice
tran
sfor
mer
s fro
m fa
ilure
$9
,998
,000
57
51
51
$946
,000
$3
,784
,000
Cas
e 10
. Im
prov
e Se
rvic
e W
ater
Coo
ling
(SW
C) F
ans
As
sum
ptio
n: E
limin
ates
failu
re o
f the
SW
C to
the
NSW
sys
tem
(A
naly
sis
Cas
e fo
r SAM
A N
o. 2
06)
206—
Impr
ove
flow
cap
acity
of S
WC
fans
for s
umm
er
cond
ition
s $2
00,0
00
2 3
3 $4
3,60
0 $1
74,0
00
Cas
e 11
. Hig
h Pr
essu
re In
ject
ion
Syst
em
Assu
mpt
ion:
Inc
lude
inde
pend
ent i
njec
tion
train
(A
naly
sis
Cas
e fo
r SAM
A N
o. 4
4)
44—
Inst
all a
n in
depe
nden
t act
ive
or p
assi
ve h
igh
pres
sure
in
ject
ion
syst
em
$8,8
00,0
00
17
14
15
$279
,000
$1
,115
,000
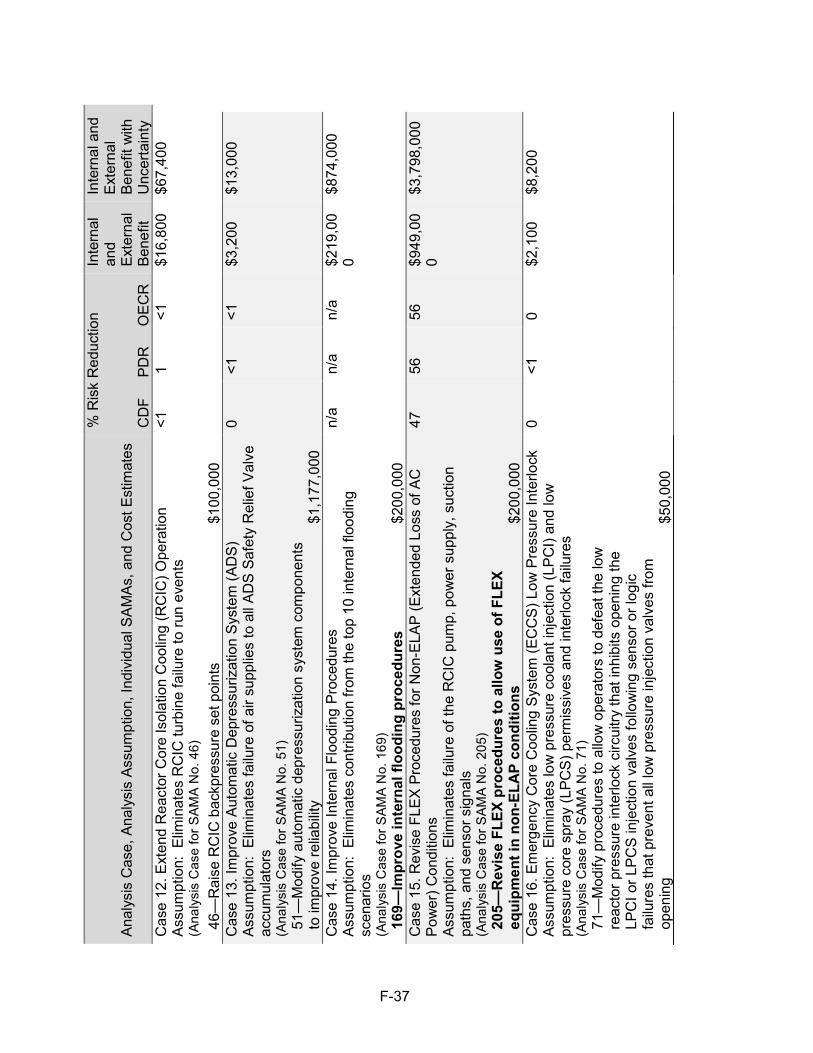
F-37
Anal
ysis
Cas
e, A
naly
sis
Assu
mpt
ion,
Indi
vidu
al S
AM
As, a
nd C
ost E
stim
ates
% R
isk
Red
uctio
n
CD
F
PD
R
OEC
R
Inte
rnal
an
d Ex
tern
al
Bene
fit
Inte
rnal
and
Ex
tern
al
Bene
fit w
ith
Unc
erta
inty
C
ase
12. E
xten
d R
eact
or C
ore
Isol
atio
n C
oolin
g (R
CIC
) Ope
ratio
n As
sum
ptio
n: E
limin
ates
RC
IC tu
rbin
e fa
ilure
to ru
n ev
ents
(A
naly
sis
Cas
e fo
r SAM
A N
o. 4
6)
46—
Rai
se R
CIC
bac
kpre
ssur
e se
t poi
nts
$100
,000
<1
1 <1
$1
6,80
0 $6
7,40
0
Cas
e 13
. Im
prov
e Au
tom
atic
Dep
ress
uriz
atio
n Sy
stem
(AD
S)
Assu
mpt
ion:
Elim
inat
es fa
ilure
of a
ir su
pplie
s to
all
ADS
Safe
ty R
elie
f Val
ve
accu
mul
ator
s (A
naly
sis
Cas
e fo
r SAM
A N
o. 5
1)
51—
Mod
ify a
utom
atic
dep
ress
uriz
atio
n sy
stem
com
pone
nts
to im
prov
e re
liabi
lity
$1,1
77,0
00
0 <1
<1
$3
,200
$1
3,00
0
Cas
e 14
. Im
prov
e In
tern
al F
lood
ing
Proc
edur
es
Assu
mpt
ion:
Elim
inat
es c
ontri
butio
n fro
m th
e to
p 10
inte
rnal
floo
ding
sc
enar
ios
(Ana
lysi
s C
ase
for S
AMA
No.
169
) 16
9—Im
prov
e in
tern
al fl
oodi
ng p
roce
dure
s $2
00,0
00
n/a
n/a
n/a
$219
,00
0 $8
74,0
00
Cas
e 15
. Rev
ise
FLEX
Pro
cedu
res
for N
on-E
LAP
(Ext
ende
d Lo
ss o
f AC
Po
wer
) Con
ditio
ns
Assu
mpt
ion:
Elim
inat
es fa
ilure
of t
he R
CIC
pum
p, p
ower
sup
ply,
suc
tion
path
s, a
nd s
enso
r sig
nals
(A
naly
sis
Cas
e fo
r SAM
A N
o. 2
05)
205—
Rev
ise
FLEX
pro
cedu
res
to a
llow
use
of F
LEX
equi
pmen
t in
non-
ELA
P co
nditi
ons
$200
,000
47
56
56
$949
,00
0 $3
,798
,000
Cas
e 16
. Em
erge
ncy
Cor
e C
oolin
g Sy
stem
(EC
CS)
Low
Pre
ssur
e In
terlo
ck
Assu
mpt
ion:
Elim
inat
es lo
w p
ress
ure
cool
ant i
njec
tion
(LPC
I) an
d lo
w
pres
sure
cor
e sp
ray
(LPC
S) p
erm
issi
ves
and
inte
rlock
failu
res
(Ana
lysi
s C
ase
for S
AMA
No.
71)
71
—M
odify
pro
cedu
res
to a
llow
ope
rato
rs to
def
eat t
he lo
w
reac
tor p
ress
ure
inte
rlock
circ
uitry
that
inhi
bits
ope
ning
the
LPC
I or L
PCS
inje
ctio
n va
lves
follo
win
g se
nsor
or l
ogic
fa
ilure
s th
at p
reve
nt a
ll lo
w p
ress
ure
inje
ctio
n va
lves
from
op
enin
g $5
0,00
0
0 <1
0
$2,1
00
$8,2
00

F-38
Anal
ysis
Cas
e, A
naly
sis
Assu
mpt
ion,
Indi
vidu
al S
AM
As, a
nd C
ost E
stim
ates
% R
isk
Red
uctio
n
CD
F
PD
R
OEC
R
Inte
rnal
an
d Ex
tern
al
Bene
fit
Inte
rnal
and
Ex
tern
al
Bene
fit w
ith
Unc
erta
inty
C
ase
17. R
esid
ual H
eat R
emov
al (R
HR
) Hea
t Exc
hang
ers
Assu
mpt
ion:
Elim
inat
es fa
ilure
of S
SW to
pro
vide
coo
ling
wat
er to
the
heat
ex
chan
gers
(A
naly
sis
Cas
e fo
r SAM
A N
o. 7
9)
79—
Impl
emen
t mod
ifica
tions
to a
llow
man
ual a
lignm
ent o
f th
e fir
e w
ater
sys
tem
to R
HR
hea
t exc
hang
ers
$1,9
60,0
00
4 10
10
$1
50,0
00
$599
,000
Cas
e 18
. Ser
vice
Wat
er S
yste
m R
elia
bilit
y
Assu
mpt
ion:
Elim
inat
es S
SW p
ump
com
mon
cau
se fa
ilure
s, fa
il-to
-sta
rt ev
ents
, fai
l-to-
run
even
ts a
nd m
aint
enan
ce e
vent
s (A
naly
sis
Cas
e fo
r SAM
A N
os. 7
5, 8
0)
75—
Add
redu
ndan
t DC
con
trol p
ower
for S
SW p
umps
80
—Ad
d an
othe
r SSW
pum
p $2
,188
,000
$5
,900
,000
29
29
29
$517
,000
$2
,070
,000
Cas
e 19
. Mai
n Fe
edw
ater
Sys
tem
Rel
iabi
lityb
Assu
mpt
ion:
Elim
inat
es lo
ss o
f mai
n fe
edw
ater
as
an a
ccid
ent i
nitia
tor a
nd
in re
spon
se to
oth
er in
itiat
ors
(Ana
lysi
s C
ase
for S
AMA
No.
87)
87
—In
stal
l dig
ital f
eedw
ater
upg
rade
$9
00,0
00
n/a
n/a
n/a
$57,
400
$230
,000
Cas
e 20
. Inc
reas
es A
vaila
bilit
y of
Roo
m C
oolin
g
Assu
mpt
ion:
Elim
inat
es fa
ilure
of r
oom
coo
ling
for E
CC
S an
d R
CIC
room
s in
the
Auxi
liary
Bui
ldin
g (A
naly
sis
Cas
e fo
r SAM
A N
o. 9
3)
93—
Prov
ide
a re
dund
ant t
rain
or m
eans
of v
entil
atio
n $2
,200
,000
13
14
14
$242
,000
$9
69,0
00
Cas
e 21
. Inc
reas
e Av
aila
bilit
y of
Die
sel G
ener
ator
Sys
tem
s th
roug
h H
eatin
g, V
entil
atio
n, a
nd C
oolin
g (H
VAC
) Im
prov
emen
ts
Assu
mpt
ion:
Elim
inat
es fa
ilure
of c
oolin
g to
the
thre
e ED
G ro
oms
(Ana
lysi
s C
ase
for S
AMA
Nos
. 100
, 101
, 102
) 10
0—D
iver
se E
DG
HVA
C lo
gic
101—
Inst
all a
dditi
onal
fan
and
louv
er p
air f
or E
DG
HVA
C
102—
Ope
rato
r pro
cedu
re re
visi
ons
to p
rovi
de
addi
tiona
l spa
ce c
oolin
g to
the
EDG
room
via
the
use
of
port
able
equ
ipm
ent
$1,1
48,0
00
$6,0
00,0
00
$150
,000
3 3
3 $5
1,00
0 $2
05,0
00

F-39
Anal
ysis
Cas
e, A
naly
sis
Assu
mpt
ion,
Indi
vidu
al S
AM
As, a
nd C
ost E
stim
ates
% R
isk
Red
uctio
n
CD
F
PD
R
OEC
R
Inte
rnal
an
d Ex
tern
al
Bene
fit
Inte
rnal
and
Ex
tern
al
Bene
fit w
ith
Unc
erta
inty
C
ase
22a.
Pro
cedu
res
for L
oss
of R
oom
Coo
ling
(HPC
S)
Assu
mpt
ion:
Elim
inat
es fa
ilure
of c
oolin
g to
hig
h pr
essu
re c
ore
spra
y (H
PCS)
pum
p ro
om
(Ana
lysi
s C
ase
for S
AMA
No.
94a
) 94
a—En
hanc
e pr
oced
ures
for a
ctio
ns o
n lo
ss o
f HVA
C
(HPC
S)
$100
,000
5 5
5 $9
3,70
0 $3
75,0
00
Cas
e 22
b. P
roce
dure
s fo
r Los
s of
Roo
m C
oolin
g (R
HR
B/C
) As
sum
ptio
n: E
limin
ates
failu
re o
f coo
ling
to R
HR
B a
nd C
pum
p ro
oms
(Ana
lysi
s C
ase
for S
AMA
No.
94b
)
94b—
Enha
nce
proc
edur
es fo
r act
ions
on
loss
of H
VAC
(R
HR
B/C
) $1
50,0
00
3 4
3 $5
6,70
0 $2
27,0
00
Cas
e 22
c. P
roce
dure
s fo
r Los
s of
Roo
m C
oolin
g (L
PCS,
RH
R A
) As
sum
ptio
n: E
limin
ates
failu
re o
f coo
ling
to th
e LP
CS
and
RH
R A
pum
p ro
oms
(Ana
lysi
s C
ase
for S
AMA
No.
94c
) 94
c— E
nhan
ce p
roce
dure
s fo
r act
ions
on
loss
of H
VAC
(L
PCS,
RH
R A
) $1
50,0
00
5 6
6 $1
03,0
00
$411
,000
Cas
e 23
. Trip
/Shu
tdow
n R
isk
As
sum
ptio
n: R
educ
es a
ll in
itiat
ing
even
t fre
quen
cies
exc
ept t
hose
for l
oss
of c
oola
nt a
ccid
ents
(LO
CAs
), pi
pe b
reak
s, a
nd L
OSP
by
10 p
erce
nt
(Ana
lysi
s C
ase
for S
AMA
No.
197
) 19
7—G
ener
atio
n R
isk
Asse
ssm
ent i
mpl
emen
tatio
n in
to
plan
t act
iviti
es (t
rip/s
hutd
own
risk
mod
elin
g)
$500
,000
3 4
3 $5
5,10
0 $2
20,0
00
Cas
e 24
. Im
prov
e Av
aila
bilit
y of
SR
Vs a
nd M
ain
Stea
m Is
olat
ion
Valv
es
(MSI
Vs)
Assu
mpt
ion:
Elim
inat
es fa
ilure
of S
RV
air s
uppl
y, S
RV
com
mon
cau
se
even
ts, a
nd M
SIVs
(A
naly
sis
Cas
e fo
r SAM
A N
o. 1
08)
108—
Impr
ove
SRV
and
MSI
V pn
eum
atic
com
pone
nts
$1,5
00,0
00
0 <1
<1
$3
,700
$1
4,70
0

F-40
Anal
ysis
Cas
e, A
naly
sis
Assu
mpt
ion,
Indi
vidu
al S
AM
As, a
nd C
ost E
stim
ates
% R
isk
Red
uctio
n
CD
F
PD
R
OEC
R
Inte
rnal
an
d Ex
tern
al
Bene
fit
Inte
rnal
and
Ex
tern
al
Bene
fit w
ith
Unc
erta
inty
C
ase
25. I
mpr
ove
Supp
ress
ion
Pool
Coo
ling
As
sum
ptio
n: E
limin
ates
failu
re o
f sup
pres
sion
poo
l coo
ling
(Ana
lysi
s C
ase
for S
AMA
No.
110
) 11
0—In
stal
l an
inde
pend
ent m
etho
d of
sup
pres
sion
poo
l co
olin
g $5
,800
,000
57
64
64
$1,1
06,0
00
$4,4
25,0
00
Cas
e 26
. Inc
reas
e Av
aila
bilit
y of
Con
tain
men
t Hea
t Rem
oval
As
sum
ptio
n: E
limin
ates
failu
re o
f saf
ety
rela
ted
cont
ainm
ent u
nit c
oole
rs
(Ana
lysi
s C
ase
for S
AMA
Nos
. 115
, 120
) 11
5—In
stal
l a p
assi
ve c
onta
inm
ent s
pray
sys
tem
12
0—In
stal
l an
unfil
tere
d ha
rden
ed c
onta
inm
ent v
ent
$5,8
00,0
00
$13,
000,
000
53
62
62
$1,0
57,0
00
$4,2
28,0
00
Cas
e 27
. Con
tain
men
t Filt
ered
Ven
t for
ATW
S
Assu
mpt
ion:
Sam
e as
Cas
e 26
plu
s re
duce
s po
pula
tion
dose
for e
ach
rele
ase
cate
gory
by
a fa
ctor
of 5
(A
naly
sis
Cas
e fo
r SAM
A N
o. 1
62)
162—
Inst
all a
n AT
WS
size
d fil
tere
d co
ntai
nmen
t ven
t to
rem
ove
deca
y he
at
$40,
000,
000
53
92
62
$1,2
35,0
00
$4,9
39,0
00
Cas
e 28
. Con
trol R
od D
rive
(CR
D) I
mpr
ovem
ents
As
sum
ptio
n: E
limin
ates
CR
D in
ject
ion
even
ts a
nd lo
ss o
f CR
D a
s an
in
itiat
or
(Ana
lysi
s C
ase
for S
AMA
No.
59)
59
—Im
plem
ent a
bilit
y to
cro
ss-ti
e sa
fety
rela
ted
pow
er to
C
RD
pum
ps fo
r ves
sel i
njec
tion
durin
g LO
SP
$656
,000
2 1
3 $3
2,40
0 $1
30,0
00
Cas
e 29
. Inc
reas
e R
ecov
ery
Tim
e of
EC
CS
upon
Los
s of
SSW
As
sum
ptio
n: E
limin
ates
failu
re o
f roo
m c
oolin
g fo
r the
LPC
I and
LPC
S pu
mp
room
s (A
naly
sis
Cas
e fo
r SAM
A N
os. 9
7, 1
98)
97—
Perf
orm
stu
dy a
nd a
naly
sis
to a
dd s
teps
to tr
ip
unne
eded
EC
CS
pum
ps o
n lo
ss o
f HVA
C
198—
Dev
elop
a p
roce
dure
for a
ltern
atin
g op
erat
ion
of
low
pre
ssur
e EC
CS
pum
ps fo
r los
s of
SSW
$100
,000
$2
00,0
00
8 9
9 $1
53,0
00
$614
,000

F-41
Anal
ysis
Cas
e, A
naly
sis
Assu
mpt
ion,
Indi
vidu
al S
AM
As, a
nd C
ost E
stim
ates
% R
isk
Red
uctio
n
CD
F
PD
R
OEC
R
Inte
rnal
an
d Ex
tern
al
Bene
fit
Inte
rnal
and
Ex
tern
al
Bene
fit w
ith
Unc
erta
inty
C
ase
30. R
educ
e H
ydro
gen
Igni
tion
As
sum
ptio
n: E
limin
ates
failu
re o
f ign
iters
(A
naly
sis
Cas
e fo
r SAM
A N
os. 1
28, 1
38)
128—
Prov
ide
post
-acc
iden
t con
tain
men
t ine
rting
sys
tem
13
8—In
stal
l pas
sive
hyd
roge
n sy
stem
$2
,665
,000
$7
60,0
00
0 1
1 $1
2,00
0 $4
7,80
0
Cas
e 31
. Im
prov
e R
HR
Hea
t Exc
hang
er A
vaila
bilit
y
Assu
mpt
ion:
Elim
inat
es fa
ilure
of S
SW s
uppl
y to
the
RH
R h
eat e
xcha
nger
(A
naly
sis
Cas
e fo
r SAM
A N
o. 2
01)
201—
Add
a by
pass
aro
und
the
RH
R H
x (h
eat e
xcha
nger
) ou
tlet v
alve
s $2
,832
,000
4 4
4 $7
5,80
0 $3
03,0
00
Cas
e 32
. Im
prov
e R
CIC
Lub
e O
il C
oolin
g
Assu
mpt
ion:
Elim
inat
es fa
ilure
to c
ool R
CIC
lube
oil
(Ana
lysi
s C
ase
for S
AMA
No.
202
) 20
2—Ad
d a
redu
ndan
t RC
IC lu
be o
il co
olin
g pa
th
$1,8
03,0
00
<1
<1
<1
$8,0
00
$31,
800
Cas
e 33
. MSI
V D
esig
n to
Dec
reas
e C
onta
inm
ent B
ypas
s Sc
enar
ios
Assu
mpt
ion:
Elim
inat
es fa
ilure
of t
he M
SIVs
to c
lose
(A
naly
sis
Cas
e fo
r SAM
A N
o. 1
47)
147—
Impr
ove
MSI
V de
sign
to d
ecre
ase
likel
ihoo
d of
co
ntai
nmen
t byp
ass
scen
ario
s $1
,000
,000
0 <1
0
$2,1
00
$8,2
00
Cas
e 34
. Sta
ndby
Liq
uid
Con
trol (
SLC
) Sys
tem
As
sum
ptio
n: E
limin
ates
failu
re o
f the
SLC
sys
tem
(A
naly
sis
Cas
e fo
r SAM
A N
os. 1
56, 1
58)
156—
Incr
ease
bor
on c
once
ntra
tion
in th
e SL
C s
yste
m
158—
Prov
ide
abilit
y to
use
CR
D o
r rea
ctor
wat
er c
lean
up
(RW
CU
) for
alte
rnat
e bo
ron
inje
ctio
n
$50,
000
$100
,000
0 <1
<1
$7
,600
$3
0,60
0
Cas
e 35
. SR
V Se
at
Assu
mpt
ion:
Elim
inat
es S
RV
inad
verte
nt o
peni
ng in
itiat
or a
nd b
asic
eve
nts
for s
tuck
ope
n SR
Vs
(Ana
lysi
s C
ase
for S
AMA
No.
160
) 16
0—In
crea
se s
afet
y re
lieve
val
ve (S
RV)
rese
at re
liabi
lity
$3,2
00,0
00
36
42
41
$710
,000
$2
,839
,000

F-42
Anal
ysis
Cas
e, A
naly
sis
Assu
mpt
ion,
Indi
vidu
al S
AM
As, a
nd C
ost E
stim
ates
% R
isk
Red
uctio
n
CD
F
PD
R
OEC
R
Inte
rnal
an
d Ex
tern
al
Bene
fit
Inte
rnal
and
Ex
tern
al
Bene
fit w
ith
Unc
erta
inty
C
ase
36. A
dd F
ire S
uppr
essi
on S
yste
mc
Assu
mpt
ion:
Elim
inat
es c
ontri
butio
n fro
m D
ivis
ion
1 Sw
itchg
ear R
oom
fire
s (A
naly
sis
Cas
e fo
r SAM
A N
o. 1
83)
183—
Add
auto
mat
ic fi
re s
uppr
essi
on [S
peci
fical
ly, a
dditi
on
of in
cipi
ent d
etec
tion
and
supp
ress
ion
to D
ivis
ion
1 Sw
itchg
ear R
oom
] $1
,100
,000
n/a
n/a
n/a
$242
,000
$9
70,0
00
Cas
e 37
. Red
uce
Ris
k fro
m F
ires
that
Req
uire
Con
trol R
oom
Eva
cuat
iond
Assu
mpt
ion:
Elim
inat
es c
ontri
butio
n fro
m C
ontro
l Roo
m fi
res
and
Con
trol
Roo
m V
entil
atio
n R
oom
fire
s (A
naly
sis
Cas
e fo
r SAM
A N
o. 1
85)
185—
Upg
rade
the
Alte
rnat
e Sh
utdo
wn
Syst
em (A
SDS)
pa
nel t
o in
clud
e ad
ditio
nal s
yste
m c
ontr
ols
for o
ppos
ite
divi
sion
$7
90,0
00
n/a
n/a
n/a
$346
,000
$1
,386
,000
Cas
e 38
. Lar
ge B
reak
LO
CA
As
sum
ptio
n: E
limin
ates
all
larg
e an
d m
ediu
m L
OC
A in
itiat
ing
even
ts
(Ana
lysi
s C
ase
for S
AMA
No.
190
) 19
0—In
stal
l dig
ital l
arge
bre
ak L
OC
A pr
otec
tion
syst
em
$13,
000,
000
0 <1
<1
$7
,800
$3
1,30
0
Cas
e 5.
b.ii.
Red
uce
Ris
k of
Eve
nt F
PW-X
HE-
LO-T
2SBO
e As
sum
ptio
n: R
educ
es fa
ilure
to a
lign
firew
ater
for i
njec
tion
even
t ZH
E-F
O-
FPW
STAR
TSB
by 5
0 pe
rcen
t; al
so re
duce
s by
50
perc
ent t
he fa
ilure
of
asso
ciat
ed d
epen
dent
HFE
s, in
clud
ing
Even
t FPW
-XH
E-LO
-T2S
BO
(Ana
lysi
s C
ase
for S
AMA
No.
5.b
.ii)
5.b.
ii—Im
prov
e Pr
oced
ures
and
Tra
inin
g on
Inje
ctio
nw
ith th
e Fi
re W
ater
Sys
tem
$100
,000
n/a
n/a
n/a
$73,
300
$293
,000
Cas
e 5.
b.vi
Red
uce
Ris
k of
Eve
nt A
DS
-XH
E-F
O-IN
DIV
A
ssum
ptio
n: R
educ
es p
roba
bilit
y of
failu
re to
sta
rt A
DS
by
open
ing
indi
vidu
al A
DS
val
ves
or S
RV
s, b
y 50
per
cent
.. 5.
b.vi
—Im
prov
e pr
oced
ures
and
trai
ning
on
star
ting
ADS
$100
,000
n/a
n/a
n/a
$16,
077
$64,
308
n/a
– no
t app
licab
le o
r not
ava
ilabl
e a
S
AM
As
in b
old
are
pote
ntia
lly c
ost-b
enef
icia
l. b
A
naly
sis
Cas
e as
sum
ptio
ns a
nd b
enef
it es
timat
es w
ere
upda
ted
in re
spon
se to
NR
C s
taff
RA
I 6.b
. R
evis
ed ri
sk re
duct
ion
estim
ates
wer
e no
t pro
vide
d (E
nter
gy 2
017b
). c
Ris
k re
duct
ion
and
bene
fit e
stim
ates
wer
e up
date
d in
resp
onse
to N
RC
sta
ff R
AI 6
.c.ii
(Ent
ergy
201
7b).
d A
naly
sis
Cas
e as
sum
ptio
ns, r
isk
redu
ctio
n es
timat
es, a
nd b
enef
it es
timat
es w
ere
upda
ted
in re
spon
se to
NR
C s
taff
RA
I 6.c
.i (E
nter
gy 2
017b
). e
New
SA
MA
eva
luat
ed in
resp
onse
to N
RC
sta
ff R
AI 5
.b.ii
(Ent
ergy
201
7b).

F-43
F.5 Cost Impacts of Candidate Plant Improvements
As enumerated in Table F-6, Entergy estimated the costs of implementing the 50 Phase II SAMAs using other applicants’ estimates for similar improvements and the development of site-specific cost estimates, where appropriate. Entergy provided cost estimates for implementation of the RBS SAMAs in Table D.2-1 of Attachment D to the ER (Entergy 2017a). Entergy stated in the ER that the cost ranges shown in Table F-7 below were used based on its review of previous SAMA applications (Entergy 2017a).
Table F-7. Estimated Cost Ranges for SAMA Applications
Entergy also stated in the ER that in most cases the development of detailed cost estimates was not necessary, particularly in the case of hardware modifications, because the cost of the modification clearly exceeded the benefit. When required, the RBS site-specific cost estimates were based on the engineering judgment of project engineers experienced in performing design changes at the facility. These estimates were compared, where possible, to estimates developed and used at plants of similar design and vintage.
The staff reviewed the applicant’s cost estimates, presented in Table D.2-1 of Attachment D to the ER (Entergy 2017a). For certain improvements, the staff also compared the cost estimates to estimates developed elsewhere for similar improvements, including estimates developed as part of other licensees’ analyses of SAMAs for operating reactors. The NRC staff also reviewed the basis for the cost estimates during the NRC audit of the SAMA analysis (NRC 2017a).
The benefit for Case 9 (Reduce Plant Centered Loss of Off-site Power) was evaluated by eliminating the plant centered events contribution to the LOSP initiator and removal of transformer failures. This case was used for the cost-benefit assessment of SAMA 38 - Protect service transformers from failure. The RBS specific cost estimate is almost $10,000,000. In an NRC staff RAI, Entergy was asked to describe what changes/modifications are associated with the implementation of this SAMA (NRC 2017a). In response to the RAI, Entergy indicated the scope of the modification for SAMA 38 is construction of structures that would provide protection (from hurricane or tornado flying debris and from explosion of a nearby transformer) for transformers and associated cabling and buses running from the transformers into nearby buildings (Entergy 2017b). The protection methods are to include walls, metal caging, or other suitable barriers. Protection is provided for three normal transformers and four preferred transformers. Failure of any of the seven service transformers has the potential to trip the plant, so all are protected. Power feed lines from offsite to the transformers are not protected by this SAMA. The conceptual design to address this SAMA included design and construction of two buildings that provide protection from high wind missiles and explosions from nearby transformers. Entergy did not identify any other lower cost alternative designs that satisfied the SAMA's objectives (Entergy 2017b).
Type of Change Estimated Cost Range Procedural only $50K Procedural change with engineering or training required $50K–$200K Procedural change with engineering and testing or training required
$200K–$300K
Hardware modification $100K to > $1000K

F-44
The staff concludes that the cost estimates provided by Entergy are reasonable and sufficient for use in the SAMA evaluation because economic viability of the proposed modification could be adequately gauged and the process meets the guidance provided in NEI 05-01A.
F.6 Cost-Benefit Comparison
Entergy’s cost-benefit analysis and the staff’s review are described in the following sections.
F.6.1 Entergy’s Evaluation
The methodology used by Entergy was based primarily on NRC’s guidance for performing cost-benefit analyses, NUREG/BR–0184 (NRC 1997a) which is referenced in the guidance provided in NEI 05-01A. As described in Sections 4.15.1.3 and D.1.5.4 of the ER (Entergy 2017a), the net value was determined for each SAMA according to the following formula:
Net Value = (APE + AOC + AOE + AOSC) – COE
where,
APE (averted public exposure) = present value of APE costs ($)
AOC (averted offsite property damage costs) = present value of AOC ($)
AOE (averted occupational exposure) = present value of AOE costs ($)
AOSC (averted onsite costs) = present value of AOSC ($)
COE = cost of enhancement ($)
If the net value of a SAMA is negative, the cost of implementing the SAMA is larger than the benefit associated with the SAMA, and it is not considered to be cost beneficial. Entergy’s derivation of each of the associated costs is summarized next.
NEI 05-01A states that two sets of estimates should be developed for discount rates of 7 percent and 3 percent (NEI 2005). Entergy provided a base set of results using a discount rate of 7 percent and a 29-year analysis period with a sensitivity case at 3 percent.
F.6.1.1 Averted Public Exposure (APE) Costs
Entergy defined annual off-site exposure risk, or averted public exposure (APE), as the monetary value of accident risk avoided from population doses after discounting (Entergy 2017a). The APE costs were calculated using the following formula:
APE = Annual reduction in public exposure (Δ person-rem per year)
× monetary equivalent of unit dose ($5,500 per person-rem)
× present value conversion (NRC 1997a)

F-45
The monetary equivalent of unit dose of $5,500 per person-rem was determined using the methodology in NUREG-1530, Rev. 1 (NRC 2015b). The annual reduction in public exposure was calculated according to the following formula:
Annual reduction in public exposure = (Accident frequency without modification × accident population dose without modification) – (Accident frequency with modification × accident population dose with modification)
As stated in NUREG/BR–0184 (NRC 1997a), it is important to note that the monetary value of the public health risk after discounting does not represent the expected reduction in public health risk due to a single accident. Rather, it is the present value of a stream of potential losses extending over the remaining lifetime (in this case, the 20-year renewal period plus the nine years remaining on the current operating license at the time the analysis was performed) of the facility. Thus, it reflects the expected annual loss due to a single accident, the possibility that such an accident could occur at any time over the analysis period, and the effect of discounting these potential future losses to present value. For a discount rate of 7 percent and a 29-year analysis period with a CDF of 2.8 × 10⁻⁶ per reactor-year and a monetary equivalent of unit dose of $5,500 per person-rem, the applicant calculated an APE cost of approximately $82,600 for internal events (Entergy 2017a).
F.6.1.2 Averted Offsite Property Damage Costs (AOC)
Entergy defined annual offsite economic cost risk, or averted offsite property damage costs (AOC), as the monetary value of risk avoided from offsite property damage after discounting (Entergy 2017a). The AOC values were calculated using the following formula, consistent with the guidance in NUREG/BR–0184 (NRC 1997a):
AOC = Annual reduction in offsite property damage × present value conversion
The annual reduction in offsite property damage was calculated according to the following formula:
Annual reduction in offsite property damage = (Accident frequency without modification × accident property damage without modification) – (Accident frequency with modification × accident property damage with modification)
For a discount rate of 7 percent and a 29-year analysis period with a CDF of 2.8 × 10⁻⁶ per year, the applicant calculated an AOC of approximately $91,000 for internal events (Entergy 2017a).
F.6.1.3 Averted Occupational Exposure (AOE) Costs
Entergy defined annual on-site or occupational exposure risk, or AOE, as the avoided onsite exposure (Entergy 2017a). Similar to the APE calculations, the applicant calculated costs for immediate onsite exposure. Long-term onsite exposure costs were calculated consistent with guidance in NUREG/BR–0184 (NRC 1997a).
Entergy derived the values for averted occupational exposure from information provided in Section 5.7.3 of NUREG/BR–0184 (NRC 1997a). Best estimate values provided for immediate occupational dose (3,300 person-rem) and long-term occupational dose (20,000 person-rem over a 10-year clean-up period) were used. The present value of these doses was calculated using the equations provided in the NUREG/BR–0184 handbook with a monetary equivalent of

F-46
unit dose of $5,500 per person-rem, a real discount rate of 7 percent, and an analysis period of 29 years to represent the remaining life of RBS. Immediate and long-term onsite exposure costs were summed to determine AOE cost. For a CDF of 2.8 × 10⁻⁶ per year, the applicant calculated an AOE cost of approximately $3,400 for internal events (Entergy 2017a).
F.6.1.4 Averted Onsite Costs (AOSC)
Averted Onsite Costs (AOSC) includes averted cleanup and decontamination costs and averted power replacement costs. Repair and refurbishment costs are considered for recoverable accidents only and not for severe accidents. The applicant derived the values for AOSC based on information provided in Section 5.7.6 of NUREG/BR–0184 (NRC 1997a). This cost element was divided into two parts: the onsite cleanup and decontamination cost, also commonly referred to as averted cleanup and decontamination costs; and the replacement power cost (RPC).
Averted cleanup and decontamination costs (ACC) were calculated using the following formula:
ACC = Annual CDF reduction
× present value of clean-up costs per core damage event
× present value conversion factor
The total cost of clean-up and decontamination subsequent to a severe accident is estimated in NUREG/BR–0184 to be $1.5 × 10⁹ (undiscounted). This value was converted to present costs spread over a 10-year clean-up period and integrated over the term of the proposed license extension. For a discount rate of 7 percent and a 29-year remaining RBS life with a CDF of 2.8 × 10⁻⁶ per year, Entergy calculated an ACC of approximately $37,300 from internal events (Entergy 2017a).
Long-term RPCs were calculated using the following formula:
RPC = Annual CDF reduction
× present value of replacement power for a single event
× factor to account for remaining service years for which replacement power is required
× reactor power scaling factor
The applicant based its calculations on a net electric output of 967 megawatts-electric (MWe) and scaled up from the 910 MWe reference plant in NUREG/BR-0184 (NRC 1997a). Therefore, the applicant applied a power-scaling factor of 1.06 (967 / 910) to determine the RPC. For a discount rate of 7 percent and a 29-year remaining RBS life with a CDF of 2.8 × 10⁻⁶ per year, Entergy calculated an RPC of $41,300 from internal events (Entergy 2017a). AOSC, the summation of ACC and RPC, is therefore approximately $78,600 from internal events for the 29-year analysis period and a discount rate of 7 percent.

F-47
Using the above equations, Entergy estimated the total present dollar value equivalent associated with completely eliminating severe accidents due to internal events at RBS to be about $255,700 (Entergy 2017a, Table D.1-31).
Entergy multiplied the internal events estimated benefit by a factor of 7 to account for the risk contributions from external and internal flooding events to yield the internal and external benefit or Maximum Averted Cost Risk (MACR) (Entergy 2017a). Additionally, the internal and external benefits were multiplied by a factor of 4 to account for uncertainties in the CDF calculation (Entergy 2017a).
F.6.1.5 Entergy’s Results
In Entergy’s analysis, if the implementation costs for a candidate SAMA exceeded the calculated benefit, the SAMA was determined not cost beneficial. If the benefit exceeded the estimated cost, the SAMA candidate was considered cost beneficial. In the analysis, 10 SAMA candidates were found to be potentially cost beneficial (Entergy 2017a, Entergy 2017b). The results of the cost-benefit evaluation are presented in Table F-6.
The potentially cost-beneficial SAMAs are:
• SAMA No. 94a—Enhance procedures for actions on loss of HVAC (HPCS)• SAMA No. 94b—Enhance procedures for actions on loss of HVAC (RHR B/C)• SAMA No. 94c—Enhance procedures for actions on loss of HVAC (LPCS, RHR A)• SAMA No. 97—Perform study and analysis to add steps to trip unneeded ECCS
pumps on loss of HVAC• SAMA No. 102—Operator procedure revisions to provide additional space cooling to
the EDG room via the use of portable equipment• SAMA No. 169—Improve internal flooding procedures• SAMA No. 185—Upgrade the Alternate Shutdown System (ASDS) panel to include
additional system controls for opposite division• SAMA No. 198—Develop a Procedure for Alternating Operation of Low Pressure
ECCS Pumps for Loss of SSW• SAMA No. 205—Revise FLEX procedures to allow use of FLEX equipment in non-
ELAP conditions• SAMA No. 5.b.ii—Improve Procedures and Training on Injection with the Fire Water
System
Entergy stated in ER Section 4.15.1.4, and in response to RAIs, that each of these potentially cost-beneficial SAMAs have been entered into the action tracking process at RBS to be evaluated for implementation (Entergy 2017a, Entergy 2017b).
F.6.2 Review of Entergy’s Cost-Benefit Evaluation
Based primarily on NUREG/BR–0184 (NRC 1997a) and NEI guidelines on discount rates (NEI 2005), the staff determined the cost-benefit analysis performed by Entergy was consistent with the guidance. Three SAMA candidates (i.e., SAMAs 97, 169, and 205) were found to be potentially cost beneficial based on the benefit from internal and external events, assuming an external events multiplier of 7 (Entergy 2017a).
The applicant considered possible increases in benefits from analysis uncertainties on the results of the SAMA assessment. In the ER (Entergy 2017a), Entergy stated that the

F-48
95th percentile value of the RBS CDF was a factor of 3.58 greater than the mean CDF. A multiplication factor of 4 was selected by the applicant to account for uncertainty. Five additional SAMA candidates (i.e., SAMAs 94a, 94b, 94c, 102, and 198) were determined to be potentially cost-beneficial as a result of the uncertainty analysis (Entergy 2017a).
The NRC staff considers the multipliers of 4 to account for uncertainty and 7 to account for external events provide adequate margin and are acceptable for the SAMA analysis.
In the ER, Entergy analyzed the sensitivity of the cost-benefit analysis results to a lower discount rate of 3 percent. This sensitivity analysis was performed applying the external events multiplier of 7 to account for external events. No additional cost-beneficial SAMAs were identified as a result of this sensitivity analysis (Entergy 2017a).
As discussed in Section F.2 above Entergy performed additional sensitivity analyses on MACCS input parameters for faster and slower evacuation speeds, for higher and lower percentages of the population that are assumed to evacuate, for a delay in the declaration of the general emergency, and for a longer decontamination time and higher non-farm decontamination costs. No additional cost-beneficial SAMAs were identified as a result of these sensitivity analyses (Entergy 2017a).
As discussed in Section F.4 above, Case 37, Reduce Risk From Fires That Require Control Room Evacuation, was used to evaluate the benefit for SAMA 185 by assuming this SAMA eliminated control room fires from the RBS fire CDF. Entergy was asked in an NRC staff RAI to identify the other control room abandonment areas and discuss the impact on the cost-benefit analysis of SAMA 185 from crediting the risk reduction benefit of this SAMA for the identified abandonment areas (NRC 2017a). In response to the RAI, Entergy explained that smoke generated from fires in Fire Area C-17, Control Room Ventilation Room, could be transferred to the control room and ultimately require evacuation because of low visibility (Entergy 2017b). A bounding analysis was performed by eliminating the CDF associated with these two rooms, which is 42 percent of the total fire CDF (see Table F-4 above). Entergy calculated a revised benefit using the same method as that described for Case 37 in Section F.4, which is reported in Table F–6. Based on the result of the baseline evaluation, SAMA 185 was determined not to be cost-beneficial. However, based on the result of the 95th percentile CDF uncertainty analysis, SAMA 185 was nonetheless determined to be potentially cost-beneficial. Entergy stated that SAMA 185 will be entered into the RBS action tracking system to be evaluated for further implementation (Entergy 2017b).
As discussed in Section F.3.2 above, Event FPW-XHE-LO-T2SBO, "operator fails to follow attachment 2 for SBO," is addressed by several hardware modifications. Entergy was asked in an NRC staff RAI to discuss the potential for a SAMA to improve the procedure or training for injection of fire water for SBO (NRC 2017a). In response to the RAI, Entergy evaluated a new SAMA to improve the procedures and training on injection with the fire water system. This evaluation assumed that the failure to align firewater for injection event is reduced by 50 percent. This resulted in a baseline internal and external event benefit of $73,300 and a 95th percentile CDF benefit of $293,000. Since this SAMA requires both procedure and training improvements, the implementation cost was estimated to be $100,000 (see Table F–7). Based on these results, Entergy concluded that this SAMA is potentially cost-beneficial as a result of the uncertainty analysis. Entergy stated that this SAMA will be entered into the RBS action tracking system to be evaluated for further implementation (Entergy 2017b). This SAMA is included in Table F–6 as SAMA RAI 5.b.ii, under Case 5.b.ii.

F-49
As discussed in Section F.3.2 above, for Event ADS-XHE-FO-INDIV, "operator fails to start ADS by opening individual ADS valves or SRVs,” Entergy was asked in an NRC staff RAI to consider improvements in procedures and training (NRC 2017a). Entergy responded to the RAI that a new SAMA case was performed to evaluate the potential benefit from improvements in procedures and training for this event. The case assumes the improvements reduce the failure probability of ADS-XHE-FO-INDIV (and also dependent events including this event) by a conservative value of 50 percent. The baseline internal and external benefit was found to be $16,000 and the 95th percentile CDF uncertainty benefit was found to be $64,000. Because this SAMA requires both procedure and training improvements, the implementation cost was estimated to be $100,000 (see Table F-7). Based on these results, Entergy concluded that this SAMA would not be cost-beneficial (Entergy 2017b).
The staff concludes that the cost-benefit results provided by Entergy are reasonable and sufficient for use in the SAMA evaluation because the process and methodology for estimating the MACR, and for performing uncertainty and sensitivity analyses, meets the guidance provided in NEI 05-01A (NEI 2005) and NUREG/BR–0184 (NRC 1997a).
F.7 Conclusions
Entergy considered 206 candidate SAMAs based on NRC and industry documentation of potential plant improvements, its review of SAMA analyses for other BWR plants, RBS IPE and IPEEE assessments, and risk-significant contributors at RBS from plant-specific probabilistic risk assessment models. Phase I screening reduced the list to 48 unique SAMA candidates by eliminating SAMAs that were not applicable to RBS, had already been implemented at RBS, or were combined into a more comprehensive or plant-specific SAMA. One of these SAMA candidates was subdivided into three SAMA candidates, increasing the number of Phase II SAMA candidates to 50.
For these remaining SAMA candidates, Entergy performed a cost-benefit analysis with results shown in Table F–6 above. The cost-benefit analysis identified eight potentially cost-beneficial SAMAs (Phase II SAMA Nos. 94a, 94b, 94c, 97, 102, 169, 198, and 205). Sensitivity cases were analyzed for the present value discount rate and the MACCS input parameters. In response to an NRC staff RAI concerning potential lower cost alternatives; Entergy identified two additional potentially cost-beneficial SAMA (i.e., SAMA 5.b.ii and SAMA 185).
The staff reviewed the Entergy SAMA analysis and concludes that, as discussed above, the methods used and implementation of the methods were reasonable. Based on the applicant’s treatment of SAMA benefits and costs, the staff finds that the SAMA evaluations performed by Entergy are reasonable and sufficient for the license renewal submittal.
The staff agrees with Entergy’s conclusion that the 10 candidate SAMAs discussed in this section are potentially cost beneficial, which was based on a conservative treatment of costs, benefits, and uncertainties. This conclusion of a small number of potentially cost-beneficial SAMAs is consistent with the low residual level of risk indicated in the RBS PRA and the fact that Entergy has already implemented the plant improvements identified from the IPE and IPEEE. Because the potentially cost-beneficial SAMAs do not relate to aging management during the period of extended operation, they do not need to be implemented as part of license renewal in accordance with Title 10 of the Code of Federal Regulations, Part 54. Nevertheless, Entergy stated that each of these potentially cost beneficial SAMAs has been entered into the RBS action tracking system to further evaluate their implementation.

F-50
F.8 References
[ASME/ANS] American Society of Mechanical Engineers/American Nuclear Society. 2009.
"Addenda to ASME/ANS RA-S-2008, Standard for Level 1/Large Early Release Frequency Probabilistic Risk Assessment for Nuclear Power Plant Applications." ASME/ANS RA-Sa-2009. February 2, 2009.
[EPRI] Electric Power Research Institute. 1992. “Fire-Induced Vulnerability Evaluation (FIVE),” TR-100370. Professional Loss Control, Inc. Palo Alto, CA. April 1992.
[EPRI] Electric Power Research Institute. 1994. “EPRI Fire PRA Implementation Guide.” EPRI Report Project 3385–01. Draft, Parkinson, W.J., et al. Palo Alto, CA. January 1994.
[EPRI] Electric Power Research Institute. 2012. “Seismic Evaluation Guidance.” EPRI Report 1025287. Palo Alto, CA. November 2012. ADAMS No. ML12333A170.
[EPRI] Electric Power Research Institute. 2014. Letter from Stuart Lewis, EPRI, to Anthony R. Petrangelo, Nuclear Energy Institute. Subject: Fleet Seismic Core Damage Frequency Estimates for Central and Eastern U.S. Nuclear Power Plants Using New Site-Specific Seismic Hazard Estimates. March 11, 2014. ADAMS No. ML14083A586
[Entergy] Entergy Operations, Inc. 1993. Letter from W. H. Odel, Entergy to U.S. NRC Document Control Desk. Subject: River Bend Station - Unit 1, Docket No. 50-458. February 1, 1993. ADAMS Accession No. ML080140384 (nonpublic document)
[Entergy] Entergy Operations, Inc. 1995. Letter from John R. McGaha, Jr., Entergy to U.S. NRC Document Control Desk. Subject: River Bend Station - Unit 1, Docket No. 50-458, License No. NPF-47, Supplemental Response to Generic Letter 88-20. June 30, 1995. ADAMS Accession No. ML080140054 (nonpublic document)
[Entergy] Entergy Operations, Inc. 2014a. Letter from Eric W. Olsen, Entergy, to U.S. Nuclear Regulatory Commission Document Control Desk. Subject: Response to NRC Request for Information Pursuant to 10 CFR 50.54(f) Regarding Recommendation 2.1 of the Near-Term Task Force Review of Insights from the Fukushima Dai-ichi Accident, River Bend Station Unit 1, Docket Number 50-458, License No. NPF-47. March 12, 2014. ADAMS Accession No. ML14073A648.
[Entergy] Entergy Operations, Inc. 2014b. Letter from Willis F. Mashburn, Entergy, to U.S. Nuclear Regulatory Commission Document Control Desk. Subject: Entergy Operations Inc. Seismic Hazard and Screening Report (CEUS Sites), Response NRC Request for Information Pursuant to 10 CFR 50.54(f) Regarding Recommendation 2.1 of the Near-Term Task Force Review of Insights from the Fukushima Dai-ichi Accident, River Bend Station - Unit 1, Docket No. 050-458, License No. NPF-47. March 26, 2014. ADAMS Accession No. ML14091A426.
[Entergy] Entergy Operations, Inc. 2016a. Letter from William F. Maguire, Entergy, to U.S. Nuclear Regulatory Commission Document Control Desk. Subject: Seismic Mitigating Strategies Assessment, River Bend Station Unit - 1, Docket Number 50-458, License No. NPF-47. August 31, 2016. ADAMS Accession No. ML16251A069.

F-51
[Entergy] Entergy Operations, Inc. 2016b. Letter from William F. Maguire, Entergy, to U.S. Nuclear Regulatory Commission Document Control Desk. Subject: Mitigating Strategies Assessment (MSA) for Flooding, River Bend Station Unit - 1, Docket Number 50-458, License No. NPF-47. October 24, 2016. ADAMS Accession No. ML16302A158.
[Entergy] Entergy Operations, Inc. 2017a. River Bend Station, Unit 1, Redacted License Renewal Application, Appendix E, Applicant’s Environmental Report. West Feliciana Parish, LA. May 2017. 859 p. ADAMS Accession No. ML17174A531.
[Entergy] Entergy Operations, Inc. 2017b. Letter from William F. Maguire, Entergy, to U.S. Nuclear Regulatory Commission Document Control Desk. Subject: Response to License Renewal Application (LRA) NRC Request for Additional Information, Severe Accident Mitigation Alternatives River Bend Station, Unit 1, Docket No. 50-458, License No. NPF-47. December 5, 2017. ADAMS Accession No. ML17339A795.
[Entergy] Entergy Operations, Inc. 2017c. Letter from Steven P. Vercelli, Entergy, to U.S. Nuclear Regulatory Commission Document Control Desk. Subject: Focused Evaluation of External Flooding, River Bend Station - Unit 1, Docket No. 50-458, License No. NPF-47. June 28, 2017. ADAMS Accession No. ML17207A105.
[Entergy] Entergy Operations, Inc. 2018. Letter from William F. Maguire, Entergy, to U.S. Nuclear Regulatory Commission Document Control Desk. Subject: Response to License Renewal Application NRC Request for Additional Information - Clarification, Severe Accident Mitigation Alternatives, River Bend Station, Unit 1, Docket No. 50-458, License No. NPF-47. January 24, 2018. ADAMS Accession No. ML18025B711.
[NEI] Nuclear Energy Institute. 2005. “Severe Accident Mitigation Alternative (SAMA) Analysis Guidance Document.” NEI 05–01, Revision A. Washington, DC. November 2005. ADAMS Accession No. ML060530203.
[NEI] Nuclear Energy Institute. 2008. "Process for Performing Internal Events PRA Peer Reviews Using the ASME/ANS PRA Standard, Revision 2." NEI 05-04, Revision 2. Washington, DC. November 2008. ADAMS Accession No. ML083430462.
[NRC] U.S. Nuclear Regulatory Commission. 1988. “Individual Plant Examination for Severe Accident Vulnerabilities.” Generic Letter 88–20. November 23, 1988. ADAMS Accession No. ML031470299.
[NRC] U.S. Nuclear Regulatory Commission. 1990. Evaluation of Severe Accident Risks: Grand Gulf, Unit 1. NUREG/CR-4551, Volume 6, Rev. 1, Washington, DC. December 1990. ADAMS Accession No. ML063540025.
[NRC] U.S. Nuclear Regulatory Commission. 1991a. “Individual Plant Examination of External Events (IPEEE) for Severe Accident Vulnerabilities.” Generic Letter 88–20, Supplement 4. Washington, DC. June 28, 1991. ADAMS Accession No. ML031150485.
[NRC] U.S. Nuclear Regulatory Commission. 1991b. Procedural and Submittal Guidance for the Individual Plant Examination of External Events (IPEEE) for Severe Accident Vulnerabilities. NUREG–1407. Washington, DC. May 1991. ADAMS Accession No. ML063550238.

F-52
[NRC] U.S. Nuclear Regulatory Commission. 1996. Memorandum from Wayne Hodges, NRC, to Steven A. Varga, NRC. Subject: Review of River Bend Station Unit 1 Individual Plant Examination (IPE) Submittal - Internal Events. May 20, 1996. ADAMS Accession No. ML18025A682 (nonpublic document).
[NRC] U.S. Nuclear Regulatory Commission. 1997a. Regulatory Analysis Technical Evaluation Handbook. NUREG/BR–0184. Washington, DC. ADAMS Accession No. ML050190193.
[NRC] U.S. Nuclear Regulatory Commission. 1997b. Individual Plant Examination Program: Perspectives on Reactor Safety and Plant Performance Parts 2–5, Final Report.” NUREG–1560, Vol. 2. Washington, DC. December 31, 1997. ADAMS Accession No. ML0635550228 (nonpublic document).
[NRC] U.S. Nuclear Regulatory Commission. 2001. Letter from Robert E. Moody, NRC, to Randall K. Edington, Entergy. Subject: “River Bend Station, Unit 1 – Review of the River Bend Station Individual Plant Examination of External Events (IPEEE) Submittal, (TAC No. M83667). June 13, 2001. ADAMS Accession No. ML011640678 (nonpublic document).
[NRC] U.S. Nuclear Regulatory Commission. 2009. “An Approach for Determining the Technical Adequacy of Probabilistic Risk Assessment Results for Risk-Informed Activities.” Regulatory Guide 1.200, Revision 2. March 2009. ADAMS Accession No. ML090410014.
[NRC] U.S. Nuclear Regulatory Commission. 2010. “NRC Information Notice 2010–18: Generic Issue 199, Implications of Updated Probabilistic Seismic Hazard Estimates in Central and Eastern United States on Existing Plants.” Washington, DC. September 2, 2010. ADAMS Accession No. ML101970221.
[NRC] U.S. Nuclear Regulatory Commission. 2012a. “Electric Power Research Institute; Seismic Evaluation Guidance.” NRC-2013-0038. February 15, 2013. ADAMS Accession No. ML12324A198.
[NRC] U.S. Nuclear Regulatory Commission. 2012b. Letter from Eric J. Leeds, NRC, and Michael R. Johnson, NRC, to All Power Reactor Licensees and Holders of Construction Permits in Active or Deferred Status. Subject: Request for Information Pursuant to Title 10 of the Code of Federal Regulations 50.54(f) Regarding Recommendations 2.1, 2.3, and 9.3 of the Near-Term Task Force Review of Insights from the Fukushima Dai-ichi Nuclear Power Plant Accident. March 12, 2012. ADAMS Accession No. ML12053A340.
[NRC] U.S. Nuclear Regulatory Commission. 2012c. Letter from Eric J. Leeds, NRC, and Michael R. Johnson, NRC, to All Power Reactor Licensees and Holders of Construction Permits in Active or Deferred Status. Subject: Issuance of Order to Modify Licenses with Regard to the Requirements for Mitigation Strategies for Beyond-Design-Basis External Events. March 12, 2012. ADAMS Accession No. ML12054A735.
[NRC] U.S. Nuclear Regulatory Commission (NRC). 2013. “Preparation Of Environmental Reports For Nuclear Power Plant License Renewal Applications.” Regulatory Guide 4.2, Supplement 1, Rev. 1, Washington, D.C., June 2013, ADAMS Accession No ML13067A354.
[NRC] U.S. Nuclear Regulatory Commission. 2014a. Letter from Alan Wang, NRC, to Vice President, Operations, Entergy. Subject: River Bend Station, Unit 1 – Staff Assessment of the Seismic Walkdown Report Supporting Implementation of Near-Term Task Force

F-53
Recommendation 2.3 Related to the Fukushima Dai-ichi Nuclear Power Plant Accident (TAC No. MF0167). May 1, 2014. ADAMS Accession No. ML14073A548.
[NRC] U.S. Nuclear Regulatory Commission. 2014b. Letter from Alan Wang, NRC, to Vice President, Operations, Entergy. Subject: River Bend Station, Unit 1 – Staff Assessment of the Flooding Walkdown Report Supporting Implementation of Near-Term Task Force Recommendation 2.3 Related to the Fukushima Dai-ichi Nuclear Power Plant Accident (TAC No. MF0272). June 20, 2014. ADAMS Accession No. ML14148A150.
[NRC] U.S. Nuclear Regulatory Commission. 2015a. Letter from Frankie Vega, NRC, to Vice President, Operations, Entergy. Subject: River Bend Station, Unit 1 – Staff Assessment of Information Provided Pursuant to Title 10 Code of Federal Regulations Part 50, Section 50.54(f), Seismic Hazard Reevaluations for Recommendation 2.1 of the Near-Term Task Force Review of Insights from the Fukushima Dai-ichi Nuclear Power Plant Accident (TAC No. MF3706). November 3, 2015. ADAMS Accession No. ML15295A186.
[NRC] U.S. Nuclear Regulatory Commission. 2015b. Reassessment of NRC’s Dollar per Person-Rem Conversion Factor Policy (Draft Report for Comment). NUREG–1530, Revision 1. Washington, DC. August 2015. ADAMS Accession No. ML15237A211.
[NRC] U.S. Nuclear Regulatory Commission. 2016a. Letter from Stephen Wyman, NRC, to Vice President, Operations, Entergy. Subject: Staff Review High Frequency Confirmation Associated with Reevaluated Seismic Hazard Response to March 12, 2012 50.54(f) Request for Information. February 18, 2016. ADAMS Accession No. ML15364A544.
[NRC] U.S. Nuclear Regulatory Commission. 2016b. Letter from Stephen Wyman, NRC, to Vice President, Operations, Entergy, Subject: River Bend Station, Unit 1 – Staff Review of Mitigation Strategies Assessment Report of the Impact of the Reevaluated Seismic Hazard Developed in Response to the March 12, 2012, 50.54(f) Letter. September 29, 2016. ADAMS Accession No. ML16259A362.
[NRC] U.S. Nuclear Regulatory Commission. 2016c. Letter from Robert Bernardo, NRC, to William F. Maguire, Entergy. Subject: River Bend Station, Unit 1 – Staff Assessment of Response to 10 CFR 50.54(f) Information Request - Flood-Causing Mechanisms Reevaluation (CAC No.MF3675). August 31, 2016. ADAMS Accession No. ML16204A207.
[NRC] U.S. Nuclear Regulatory Commission. 2016d. Memorandum and Order CLI-16-07. May 4, 2016. Accessible at ADAMS No. ML16125A150.
[NRC] U.S. Nuclear Regulatory Commission. 2017a. NRC email: River Bend Station, Unit 1, Request for Additional Information, RBS Severe Accident Mitigation Alternatives - License Renewal Application - dated November 8,2017. ADAMS Accession No. ML17317A002.
[NRC] U.S. Nuclear Regulatory Commission. 2017b. Letter from Joseph Sebrosky, NRC, to Vice President, Operations, Entergy. Subject: River Bend Station, Unit 1 – Flood Hazard Mitigation Strategies Assessment (CAC No.MF7968). May 2, 2017. ADAMS Accession No. ML17075A059.

F-54
[NRC] U.S. Nuclear Regulatory Commission. 2017c. Letter from Joseph Sebrosky, NRC, to Vice President, Operations, Entergy. Subject: River Bend Station, Unit 1 – Staff Assessment of Flooding Focused Evaluation (CAC No.MF9899). August 23, 2017. ADAMS Accession No. ML17220A113.

NUREG-1437 Supplement 58
See Chapter 7 of the report.
Division of Materials and License Renewal Office Nuclear Reactor Regulation U.S. Nuclear Regulatory Commission Washington, DC 20555-0001
D. Drucker
Same as 8 above.
The U.S. Nuclear Regulatory Commission (NRC) staff prepared this supplemental environmental impact statement (SEIS) in response to Entergy Louisiana, LLC and Entergy Operations, Inc.’s application to renew the operating license for River Bend Station, Unit 1 (RBS) for an additional 20 years. This SEIS includes the NRC staff’s analysis that evaluates the environmental impacts of the proposed action and alternatives to the proposed action. Alternatives considered include: (1) new nuclear power generation, (2) supercritical pulverized coal, (3) natural gas combined cycle, and (4) a combination of natural gas combined-cycle, biomass, and demand-side management. The NRC staff’s recommendation is that the adverse environmental impacts of license renewal for RBS are not so great that preserving the option of license renewal for energy planning decisionmakers would be unreasonable. The NRC staff based its recommendation on the following factors: • the analysis and findings in NUREG–1437, “Generic Environmental Impact Statement for License Renewal ofNuclear Plants”• the environmental report submitted by Entergy• the NRC staff’s consultation with Federal, State, Tribal, and local agencies• the NRC staff’s independent environmental review• the NRC staff’s consideration of public comments
River Bend Station, Unit 1; RBS; Supplement to the Generic Environmental Impact Statement; License Renewal; FSEIS; GEIS; National Environmental Policy Act; NEPA
November 2018
Technical
Generic Environmental Impact Statement for License Renewal of Nuclear Plants Supplement 58 Regarding River Bend Station, Unit 1
Final Report


NU
REG
-1437 Supplem
ent 58 Final
Generic Environm
ental Impact Statem
ent for License Renew
al of Nuclear Plants
Regarding R
iver Bend Station, U
nit 1 N
ovember 2018


