Embed Size (px)
Citation preview
November 2020
Technical Assistance for BMTC Transitioning to an all - EV/Clean Fuel
Public Transport Fleet
Gender Equality and Social Inclusion in Electrification of
BMTC Fleet
C40 Cities Finance Facility
i
ABOUT THE C40 CITIES FINANCE FACILITY
The C40 Cities Finance Facility (CFF) is a collaboration of the C40 Cities Climate Leadership Group and Deutsche Gesellschaft für Internationale Zusammenarbeit (GIZ) GmbH. The CFF supports cities in developing and emerging economies to develop finance-ready projects to reduce emissions to limit global temperature rise to 1.5°C and strengthen resilience against the impacts of a warming climate. The CFF is funded by the German Federal Ministry for Economic Cooperation and Development (BMZ), the Children’s Investment Fund Foundation (CIFF), the Government of the United Kingdom and the United States Agency for International Development (USAID).
Published by: C40 Cities Finance Facility
Deutsche Gesellschaft für Internationale Zusammenarbeit (GIZ) GmbH
Registered offices Bonn and Eschborn, Germany
Potsdamer Platz 10 10785 Berlin, Germany
E [email protected] W c40cff.org
Author/Responsible/Editor: GFA/ HEAT GmbH Habitat, Energy, Application & Technology
Seilerbahnweg 14 61462 Koenigstein, Germany
Bonn, 2020
ii
TABLE OF CONTENTS
About the C40 Cities Finance Facility.......................................................................... i
List of Figures ............................................................................................................. iv
List of Tables .............................................................................................................. v
list of abbreviations..................................................................................................... vi
Executive Summary ................................................................................................... 1
1 Introduction .......................................................................................................... 2
1.1 Background ................................................................................................................................ 2
1.2 Methodology .............................................................................................................................. 2
2 Gender Equality and Social Inclusion in BMTC ................................................... 4
2.1 Services and infrastructure for women, elderly, persons with disabilities ............................... 4
2.1.1 Bus services ....................................................................................................................... 4
2.1.2 Depots and bus terminals ................................................................................................. 4
2.1.3 Bus stops ........................................................................................................................... 5
2.1.4 Buses, fares and concessions ............................................................................................ 5
2.2 Information and Communication .............................................................................................. 6
2.2.1 Complaint Redressal System ............................................................................................. 6
2.2.2 Website ............................................................................................................................. 6
2.2.3 Mobile Phone Application ................................................................................................. 6
2.2.4 Securtiy Patrols and Committees ...................................................................................... 6
2.2.5 Last-Mile Connectivity to metro stations .......................................................................... 7
2.3 Gender and social inclusion within BMTC ................................................................................. 7
2.3.1 Employment ...................................................................................................................... 7
2.3.2 Maternity benefits ............................................................................................................ 8
2.3.3 Women employees grievance redressal committee ........................................................ 8
2.3.4 Gender sensitization trainings .......................................................................................... 8
3 conduct of User Perception Survey ..................................................................... 9
3.1 Methodology .............................................................................................................................. 9
3.1.1 Questionnaire design ........................................................................................................ 9
3.1.2 Training of the survey team .............................................................................................. 9
3.1.3 Mode of the survey ........................................................................................................... 9
3.1.4 Sample selection ............................................................................................................. 10
3.1.5 Spatial distribution of surveys ......................................................................................... 10
iii
3.1.6 Field monitoring and data quality checks ....................................................................... 11
4 Findings from user perception survey ................................................................ 12
4.1 Demography............................................................................................................................. 12
4.1.1 Sex and age ..................................................................................................................... 12
4.1.2 Education......................................................................................................................... 12
4.1.3 Primary Occupation ......................................................................................................... 13
4.2 Travel details while using BMTC services ................................................................................ 13
4.2.1 Frequency of use ............................................................................................................. 13
4.2.2 Major travel purposes ..................................................................................................... 14
4.2.3 Travel timings .................................................................................................................. 14
4.2.4 Overall monthly travel expenditure ................................................................................ 18
4.3 Perception of BMTC services ................................................................................................... 20
4.3.1 Rating of BMTC services in the day ................................................................................. 20
4.3.2 Rating of BMTC services in the night .............................................................................. 20
4.3.3 Concerns and priorities for commuters .......................................................................... 20
4.3.4 Awareness of BMTC initiatives ........................................................................................ 21
5 Importance-Satisfaction Analysis ....................................................................... 23
5.1 Importance-Satisfaction (IS) Rating ......................................................................................... 23
5.2 Heterogenous Customer Satisfaction Index ............................................................................ 26
6 Recommendations for Gender equality and Leave No One Behind .................. 27
6.1 Gender Equality and Social Inclusion Action Plan .................................................................... 27
7 Implementation note .......................................................................................... 32
7.1 Output 1: BMTC bus services and access are gender and socially inclusive ............................ 32
7.2 Output 2: BMTC terminals and TTMCs are improved .............................................................. 35
7.3 Output 3: Information and communication systems established ............................................ 36
7.4 Output 4: Inclusive strengthening of BMTC ............................................................................. 37
Annexures ................................................................................................................ 40
Annexure 1: Survey Questionnaire ................................................................................................... 40
Annexure 2:Calculation of HCSI ........................................................................................................ 53
References ............................................................................................................... 61
iv
LIST OF FIGURES
Figure 1: Methodology of the study ....................................................................................... 2
Figure 2: User perception survey locations ......................................................................... 11
Figure 3: Age groups........................................................................................................... 12
Figure 4: Age groups, by sex .............................................................................................. 12
Figure 5: Education Levels .................................................................................................. 13
Figure 6: Education levels, by sex ....................................................................................... 13
Figure 7: Primary occupation .............................................................................................. 14
Figure 8: Primary occupation, by sex .................................................................................. 14
Figure 9: Trips taken daily ................................................................................................... 15
Figure 10: Trips taken daily, by sex ..................................................................................... 15
Figure 11: Trips taken weekly ............................................................................................. 15
Figure 12: Trips taken weekly, by sex ................................................................................. 15
Figure 13: Most frequent travel purpose .............................................................................. 16
Figure 14: Most frequent travel purpose, by sex .................................................................. 16
Figure 15: Second most frequent travel purpose ................................................................. 16
Figure 16: Second most frequent travel purpose, by sex ..................................................... 16
Figure 17: Time of travel for the onward journey ................................................................. 17
Figure 18: Time of travel for the onward journey, by sex ..................................................... 17
Figure 19: Time of travel for the return journey.................................................................... 17
Figure 20: Time of travel for the return journey, by sex ....................................................... 17
Figure 21: Individual monthly travel expenditure ................................................................. 18
Figure 22: Individual monthly travel expenditure, by sex ..................................................... 18
Figure 23: Bus trips per month and total cost of transport per month .................................. 18
Figure 24: Travel expenditure as a share of income ............................................................ 19
Figure 25: Travel expenditure as a share of income, ........................................................... 19
Figure 26: Perception of BMTC services in the day ............................................................. 20
Figure 27: Perception of BMTC services in the day, by sex ................................................ 20
Figure 28: Perception of BMTC services in the night ........................................................... 21
Figure 29: Perception of BMTC services in the ................................................................... 21
Figure 30: Weighted Priorities ............................................................................................. 21
Figure 31: Weighted Priorities, by sex ................................................................................. 21
Figure 32: Awareness of BMTC helpline number ................................................................ 22
Figure 33: Awareness of BMTC helpline number, by sex .................................................... 22
Figure 34: Awareness of BMTC’s women’s safety committee ............................................. 22
Figure 35: Awareness of BMTC’s women’s safety committee, by sex ................................. 22
v
Figure 36: An example of a bus stop with GESI features .................................................... 33
Figure 37: Principles of pedestrian infrastructure for access to and from bus stops ............ 34
Figure 38: Addressing dead spaces and corners along pedestrian routes to bus stops and stations ............................................................................................................................... 35
LIST OF TABLES
Table 1: Sex-disaggregated class-wise employment data of BMTC ...................................... 7
Table 2: Mode of survey ........................................................................................................ 9
Table 3: Survey distribution at TTMCs ................................................................................ 10
Table 4: Options for respondents in the Importance-Satisfaction Survey............................. 23
Table 5: IS ratings for all major parameters ......................................................................... 23
Table 6: Interpretation of IS Ratings .................................................................................... 24
Table 7: IS Rating for all adopted set of indicators .............................................................. 24
Table 8: Gender Equality and Social Inclusion Action Plan ................................................. 27
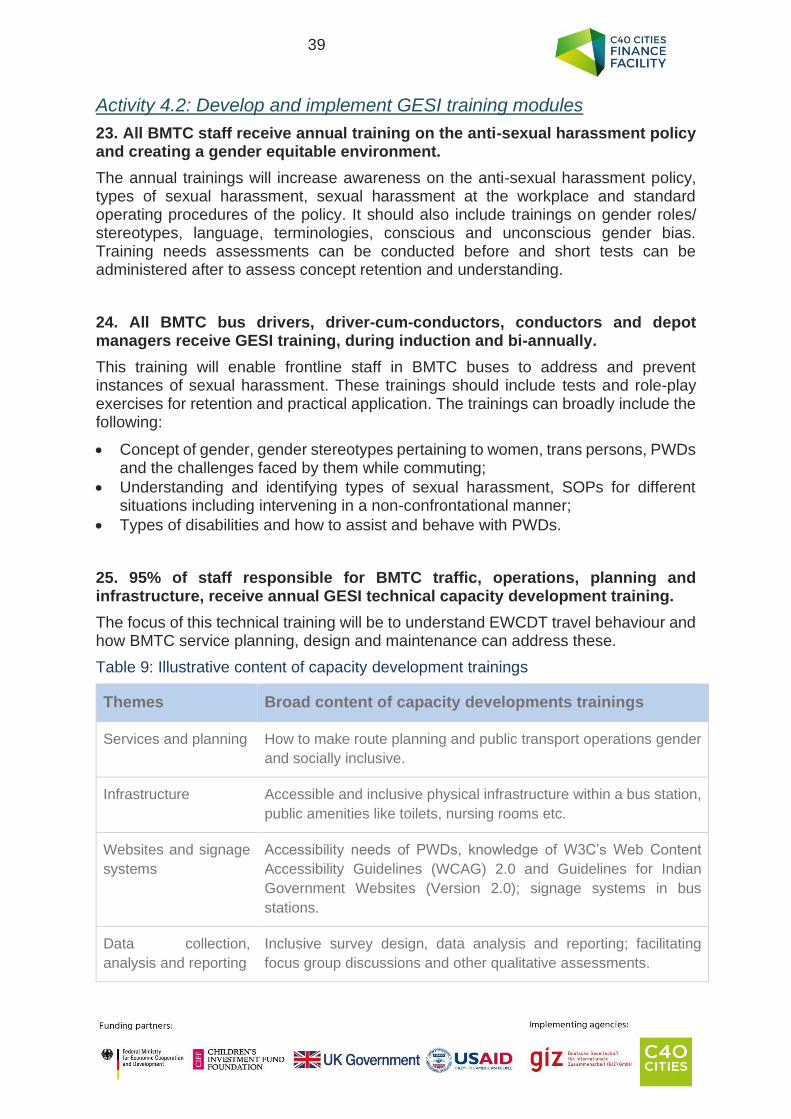
Table 9: Illustrative content of capacity development trainings ............................................ 39
Table 10: Calculation of the HCSI ....................................................................................... 54
Table 11: HCSI calculation for female respondents ............................................................. 57
vi
LIST OF ABBREVIATIONS
AC Airconditioned
BBMP Bruhat Bengaluru Mahanagara Palike
BMTC Bangalore Metropolitan Transport Corporation
BP Bangalore Police
CCTV Closed-circuit television
CFF City Finance Facility
CSI Customer Satisfaction Index
EWCDT Elderly, Women, Children, Differently-abled and Trans persons
GESI Gender Equality and Social Inclusion
GNO Gender Nodal Officer
HCSI Homogenous Customer Satisfaction Index
IRC Indian Road Congress
IS Importance-Satisfaction
ISBT Interstate Bus Terminal
MSE Medium and Small Enterprises
NGO Non-Governmental Organization
PIS Public Information System
PT Public Transport
PWD Persons with disabilities
SOP Standard Operating Procedure
SRTUs State Road Transport Undertakings
TTMC Traffic Transit Management Centres
1
EXECUTIVE SUMMARY
Buses are the predominant mode of public transport in Bengaluru and cater to 44.3 lakh passengers per day. C40 Cities Finance Facility and GIZ are preparing a road map to support the Bengaluru Metropolitan Transport Corporation (BMTC) in electrifying its bus fleet. This report provides an overview of the gender and social inclusion initiatives undertaken by BMTC and summarizes the findings of the user perception survey conducted from 24th August to 10th October 2020 (refer Section 3). The surveys provide insights on the demographic profile of BMTC users and assess the importance and performance of BMTC services, from an inclusion perspective.
The survey, which has equal representation of men and women, highlights that women make 6% fewer trips by bus per day than men. 92% of men’s bus trips are for work and education, whereas 94% of women’s bus trips are for work, education and household and care. More than half (52%) of the bus users spend between Rs. 1,000-2,000 on travel in a month, accounting for ≤10% of their individual monthly income. However, a monthly pass for ordinary services can cost around 25% of the income of residents in informal settlements, raising affordability concerns of using BMTC services on a regular basis (refer Section 4).
While the overall Heterogenous Customer Satisfaction Index (HCSI) is 2.69 on a 4-point scale, the same score is 2.96 for women, reflecting a greater satisfaction or lower expectation with BMTC services (refer Section 5). Information and communication, travel within the bus and waiting at the bus stops reflect the least satisfaction. The survey also underscored the need to increase women’s awareness of the safety initiatives undertaken by BMTC.
This report concludes with a Gender Equality and Social Inclusion Action Plan (GESI/AP) (refer Section 6 and 7) with measurable indicators and timeline for implementation. The findings of the user perception survey, employment within BMTC, preliminary physical infrastructure assessment are used to inform the GESI/AP. It focuses on mainstreaming gender and social inclusion in BMTC services, infrastructure and information & communication. Inclusive strengthening of BMTC is also recommended through capacity development trainings, gender balanced representation and employment for persons with disabilities.
2
1 INTRODUCTION
1.1 Background
C40 Cities Finance Facility and GIZ are creating a roadmap for Bengaluru Metropolitan Transport Corporation (BMTC) for its transition to zero emissions bus technology by 2032. This report provides an overview of gender and socially inclusive policies adopted by BMTC, findings from the user perception surveys and a Gender Equality and Social Inclusion Action Plan (GESI/AP) to make this transition gender and socially inclusive.
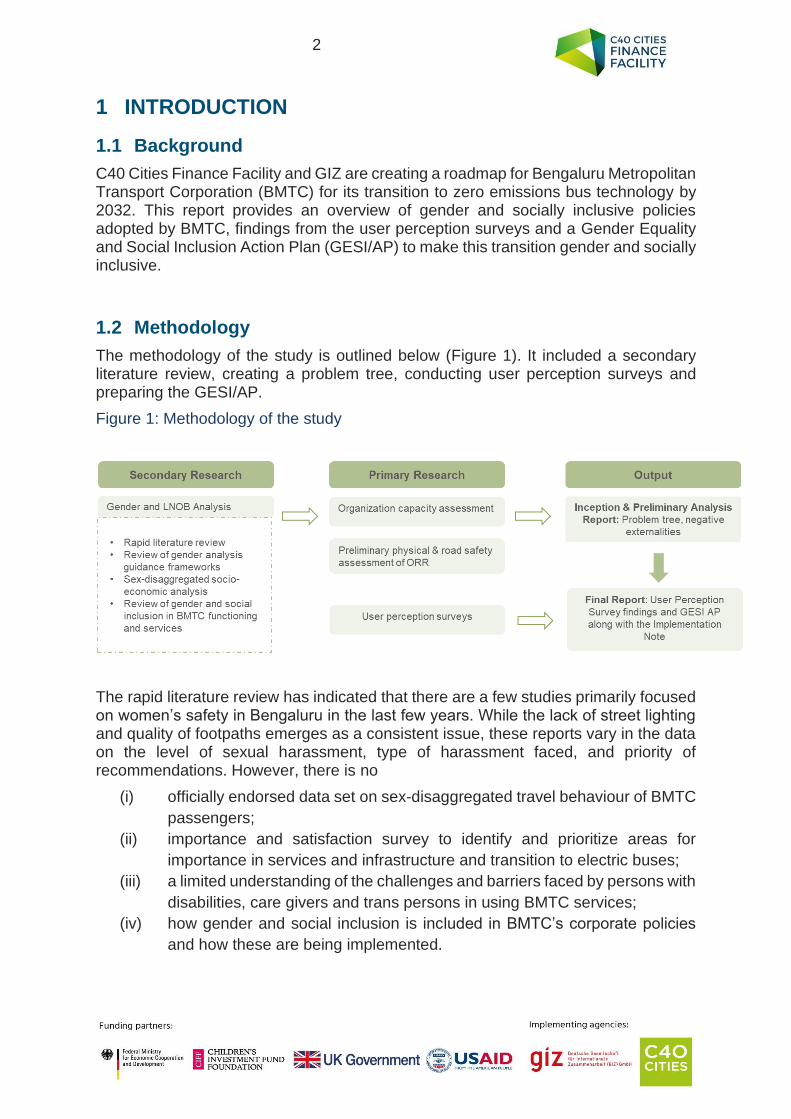
1.2 Methodology
The methodology of the study is outlined below (Figure 1). It included a secondary literature review, creating a problem tree, conducting user perception surveys and preparing the GESI/AP.
Figure 1: Methodology of the study
The rapid literature review has indicated that there are a few studies primarily focused on women’s safety in Bengaluru in the last few years. While the lack of street lighting and quality of footpaths emerges as a consistent issue, these reports vary in the data on the level of sexual harassment, type of harassment faced, and priority of recommendations. However, there is no
(i) officially endorsed data set on sex-disaggregated travel behaviour of BMTC
passengers;
(ii) importance and satisfaction survey to identify and prioritize areas for
importance in services and infrastructure and transition to electric buses;
(iii) a limited understanding of the challenges and barriers faced by persons with
disabilities, care givers and trans persons in using BMTC services;
(iv) how gender and social inclusion is included in BMTC’s corporate policies
and how these are being implemented.
3
These findings informed the methodology of the gender & LNOB analyses. An online survey tool (Error! Reference source not found.) was created to assess the importance and satisfaction of BMTC services from a gender and social inclusion perspective. This survey tool was used to obtain responses from organizations and users to capture perspectives on a consistent set of service quality parameters. The survey included 57 service quality parameters under 9 factors, along with a question on additional suggestions:
1. Service planning
2. Access/egress to & from the bus stops
3. Waiting at the bus stops
4. Boarding and alighting
5. Travel inside the buses
6. Information and communications
7. Behaviour of bus conductors and drivers
8. Services at terminals
9. Inclusion in BMTC vision and organization
The rating was done on a 4-point Likert scale, 1 being the least important/very poor and 4 being critical/excellent service.
4
2 GENDER EQUALITY AND SOCIAL INCLUSION IN BMTC
The EWCA1 population in BBMP is 5.74 million, which constitutes 68 percent i.e. more than two-thirds of the population of the city (Census of India 2011). Therefore, creating an electric bus network that is responsive to these groups, could substantially increase BMTC’s ridership. Currently, BMTC has a fleet of 6,677 (6,143 operational; 12 percent AC buses) buses, operating on 2,253 routes, with an average ridership of 44.3 lakh passengers per day (BMTC 2017-18).
2.1 Services and infrastructure for women, elderly, persons with disabilities
2.1.1 Bus services
BMTC provides different types of bus services which include; (i) Ordinary services, (ii) BIG 10 (operating on 10 major traffic corridors since 2009, connecting the city to its suburbs), (iii) Atal Sarige (catering to economically weaker and marginal sections); (iv) Vajra Services (AC Volvo buses catering to IT hubs and major residential areas); (v) Night Services (operate between important extensions/localities and Kempegowda Bus Station between 23.00 to 05.00) (vi) Vayu Vajra (dedicated airport services operating along 9 routes); (vii) K-Route (providing direct connectivity between diagonally placed interior areas of the city and bypassing the central business districts); (viii) Big trunk and feeder services (to facilitate the general public in suburbs with only 3-4 trips in a day), and (ix) Metro feeder services (BMTC 2017-18). BMTC celebrates ‘Bus day’ on the 4th of every month.
2.1.2 Depots and bus terminals
BMTC is operating its fleet through 45 depots in 6 zones (North, South, East, West, East-east and Central zone). It has 2 major and 27 minor bus terminals, named as bus stations in Bengaluru, with basic passenger amenities (BMTC 2019). These include user-friendly signage, toilets, time-table of bus services, drinking water points, canteen, medical and stationery shops, public telephones, wheelchair and seating arrangement- especially for persons with disabilities (PWD) and elderly (BMTC 2013).
BMTC established bus terminals cum Traffic and Transit Management Centres (TTMC) under the JNNURM scheme. TTMCs are planned with multi-level parking lots, public utilities like mini-shopping centres, food courts and office spaces. BMTC planned forty-five TTMCs, of which ten are operational (DULT 2012).
Thirty-five PIS boards are installed at major bus stations and TTMCs (BMTC 2017-18). With the support of DULT, BMTC has installed Passenger Information Kiosks at 10 TTMCs, 2 major bus stations and at the airport. The kiosks provide information on bus routes, bus stops, schedule of bus services, bus fare, information on BMTC career opportunities, helpline number and contact details of officials for any query and to
1 Adolescents includes those less than 19 years and the elderly includes those 60 years and above.
5
lodge a complaint. It also allows passengers to provide feedback on the BMTC website (BMTC n.d.).
Waiting lounges for women have been constructed on the ground floor of 10 TTMCs and following 5 bus stands: Shivajinagar bus terminal, Kempegowda bus terminal, Yelahanka bus stand, Jeevan Bheema Nagar and Basaveshwaranagar bus stand under the Nirbhaya Scheme. These lounges are air-conditioned with drinking water facility and restrooms for women (Bangalore Mirror 2019).
2.1.3 Bus stops
There are 2,212 bus stops in BBMP’s jurisdiction, of which only 45 percent (992) have bus shelters (BMTC 2017-18).
2.1.4 Buses, fares and concessions
Women
Almost 32 percent of women2 in Bengaluru (U) district travel to their place of work in buses (Census of India 2011). BMTC has undertaken some initiatives to improve the safety and comfort of women in buses, which includes:
• 16 seats are reserved for women in ordinary buses (BMTC 2013).
• 500 of the BMTC buses are equipped with CCTV cameras (Bhatt, Menon and Khan 2015).
• 22 ladies’ special services operating between different parts of the city and the central business district in the morning and evening hours (BMTC 2013).
Elderly
BMTC has reserved 6 seats for the elderly in ordinary buses, including 2 of the 16 seats reserved for females. It provides 25 percent concession on ticket rates and 10 percent concession on Monthly Commuter Pass rates to persons of 60 years and above (BMTC 2013).
Persons with disabilities
BMTC provides concessional travel to persons with physical and visual impairments and has reserved 1 seat each near the front and rear doors in all ordinary buses and 2 seats in Vajra services with a notice “Physically Challenged Persons” pasted on the respective windowsills. However, less than one-fifth of the buses (<1,330 buses) have low floors, making accessibility poor for persons with disabilities (Deloitte 2018).
2 Other workers.
6
2.2 Information and Communication
2.2.1 Complaint Redressal System
There is a public complaints wing in BMTC which looks into public grievances, suggestions and complaints. BMTC has a single helpline number (1-800-425-1663) that passengers can use to lodge a complaint or provide suggestions. The helpline number gives three options- one for general complaints, two for sexual harassment complaint and three for PWD and elderly (Kumar Pushkar, Director (IT), BMTC, The Hindu 2016). The calls of sexual harassment cases are then directed to nearest Sarathi team or police to apprehend the perpetrator.
Bus commuters can register queries/requests/complaints/grievances can be registered through the BMTC website, mobile phone application, and in-person at bus stations, depot and control room. All complaints submitted by users are registered in the BMTC call centre and forwarded to the concerned department. Complaints are acknowledged by giving a complaint serial number to the complainant (BMRCL 2017-18). There is no separate helpline number for women and persons with disabilities.
2.2.2 Website
BMTC shares information in both English and Kannada through its website: https://www.mybmtc.karnataka.gov.in/english. It provides information about bus services, routes, timetables, bus stops, schemes and policies, the physical and financial performance of BMTC as well as allow passengers to lodge a complaint and check its status. The website follows World Wide Web Consortium (W3C) Web Content Accessibility Guidelines (WCAG) 2.0 level (BMTC 2020).
2.2.3 Mobile Phone Application
The mobile phone application – My BMTC- provides information about bus routes, timetable, the fare of the route and nearest bus stops. It also provides real-time information. The mobile phone application is not universally accessible.
2.2.4 Securtiy Patrols and Committees
Sarathi Patrolling Squad
BMTC has a Sarathi Patrolling Squad to ensure the compliance amongst drivers, conductors and driver cum conductors to reduce the incidents of stoppage of buses at undesignated stops, preventing male passengers to occupy reserved seats of women, using mobile phones on duty or consumption of alcohol while on duty. A total of 65,672 cases were booked against the running staff, an increase by 3 percent over the previous year (BMTC 2017-18). The number of Sarathi vehicles, launched under the Nirbhaya scheme, were increased from 12 to 25 units in 2017 (The Hindu 2019).
Passengers’ Security Committee/Women’s Safety Committee
BMTC has also constituted a Passengers’ Security Committee/ Women’s Safety Committee under Director, Security and Vigilance of BMTC, with women officers from
7
BMTC, Police and representatives from various NGOs and commuter forums like the Bengaluru Bus Prayaanikara Vedike (BBPV) (Bhatt, Menon and Khan 2015).
2.2.5 Last-Mile Connectivity to metro stations
BMTC has introduced 23 Volvo and 16 ordinary buses to provide last-mile connectivity service along the Purple Line (Roychowdhury and Dubey 2018). BMTC has issued a tender for 90 non-AC electric buses to provide last mile connectivity to 6 metro stations.
2.3 Gender and social inclusion within BMTC
2.3.1 Employment
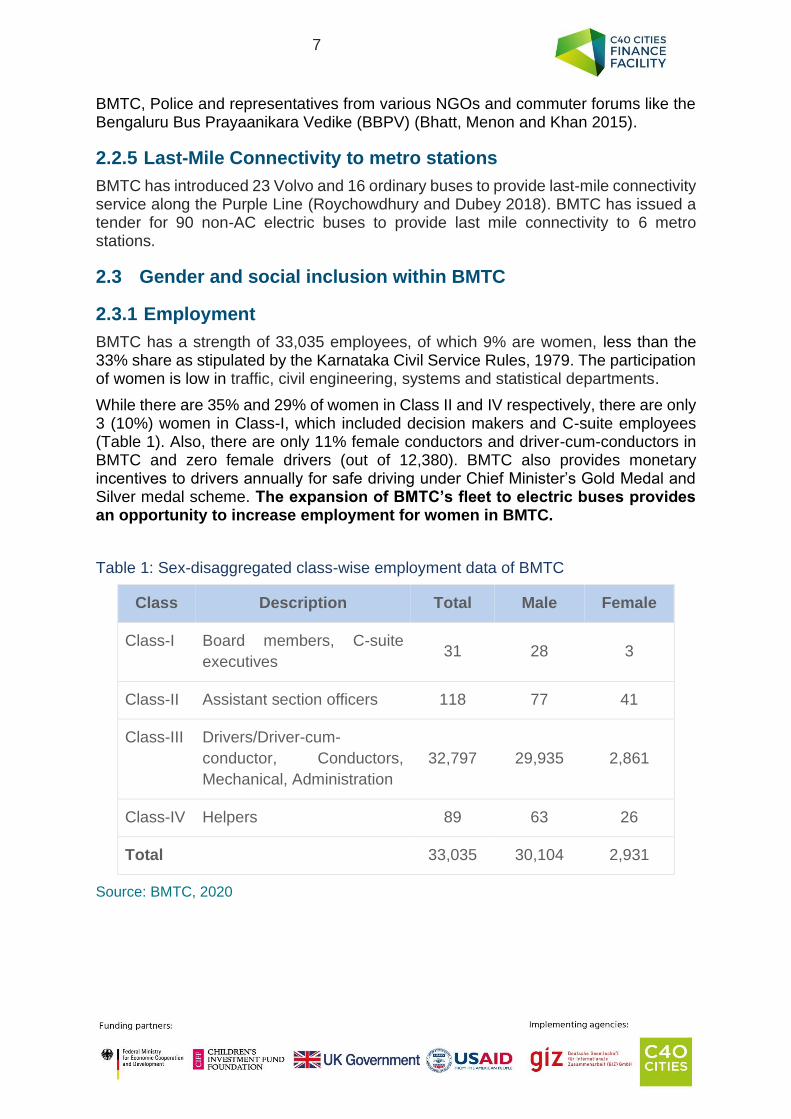
BMTC has a strength of 33,035 employees, of which 9% are women, less than the 33% share as stipulated by the Karnataka Civil Service Rules, 1979. The participation of women is low in traffic, civil engineering, systems and statistical departments.
While there are 35% and 29% of women in Class II and IV respectively, there are only 3 (10%) women in Class-I, which included decision makers and C-suite employees (Table 1). Also, there are only 11% female conductors and driver-cum-conductors in BMTC and zero female drivers (out of 12,380). BMTC also provides monetary incentives to drivers annually for safe driving under Chief Minister’s Gold Medal and Silver medal scheme. The expansion of BMTC’s fleet to electric buses provides an opportunity to increase employment for women in BMTC.
Table 1: Sex-disaggregated class-wise employment data of BMTC
Class Description Total Male Female
Class-I Board members, C-suite
executives 31 28 3
Class-II Assistant section officers 118 77 41
Class-III Drivers/Driver-cum-
conductor, Conductors,
Mechanical, Administration
32,797 29,935 2,861
Class-IV Helpers 89 63 26
Total 33,035 30,104 2,931
Source: BMTC, 2020
8
2.3.2 Maternity benefits
180 days of maternity benefit leave are provided to employees, of which 90 days can be availed before the date of delivery and 90 days after the delivery. 730 days paid leave to women employees having a child with autism, blindness, mental illness, cerebral palsy, mental retardation and multiple disabilities. A monthly childcare allowance of Rs 750 is provided for children up to 2 years (BMTC 2017-18).
2.3.3 Women employees grievance redressal committee
BMTC has constituted a grievance redressal committee at the corporate level and sub-committees in all 45 depots (BMTC 2017-18).
2.3.4 Gender sensitization trainings
BMTC conducts refresher training for its drivers and conductors on effective communication with commuters and gender sensitization along with trainings on safe driving, compulsory adherence to traffic rules and regulations. Specific trainings are provided for saving fuel for drivers, patient behaviour with the commuters and stress management for conductors. In 2017-18, awareness trainings were conducted for 225 women employees on polices to deter sexual harassment at the workplace (BMTC 2017-18).
BMTC partnered with B.PAC and Parity Consulting to impart gender sensitization training BMTC employees. 11,301 (41%) drivers and conductors (BMTC 2017-18) were trained through 50+ workshops. 3-4 sessions were conducted a week with 80-120 employees (Lalitha 2019). They were sensitized on gender difference, how to make BMTC buses an inclusive space for different users group including elderly, PWD and LGBTQ, and POSH act (B.PAC and Parity Consulting & Training Private Limited 2019).
9
3 CONDUCT OF USER PERCEPTION SURVEY
A user perception survey was conducted from 24th August to 10th October 2020 to assess the importance and performance rating of BMTC services from an inclusion perspective.
3.1 Methodology
3.1.1 Questionnaire design
An Importance-Satisfaction survey questionnaire was designed on Survey Monkey to
understand commuters’ expectations and perceptions about BMTC services. Before
finalizing the questionnaire, pilot tests were conducted with the C40 team and urban
planners for content and length to ensure the questions asked would gather the
requisite information and be easily understood by both by surveyors and respondents.
The questionnaire was revised based on the responses and comments. The
questionnaire is placed in Annexure 1.
3.1.2 Training of the survey team
A training session was organized for the team leader, field supervisor and enumerators to familiarize them with the survey questionnaire, responses and the overall objective. They were also briefed about how to share their real-time location through Google Maps application, how-to geo-tag surveys in My Maps application and short videos for the same are also circulated.
3.1.3 Mode of the survey
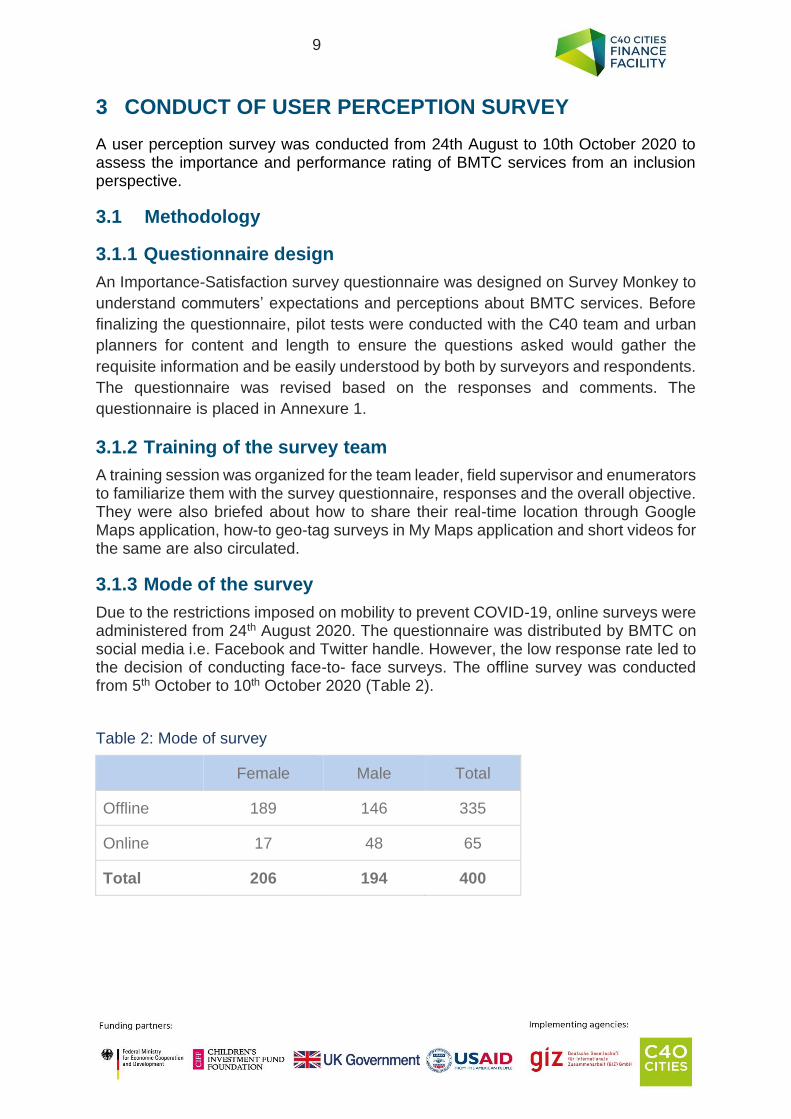
Due to the restrictions imposed on mobility to prevent COVID-19, online surveys were administered from 24th August 2020. The questionnaire was distributed by BMTC on social media i.e. Facebook and Twitter handle. However, the low response rate led to the decision of conducting face-to- face surveys. The offline survey was conducted from 5th October to 10th October 2020 (Table 2).
Table 2: Mode of survey
Female Male Total
Offline 189 146 335
Online 17 48 65
Total 206 194 400
10
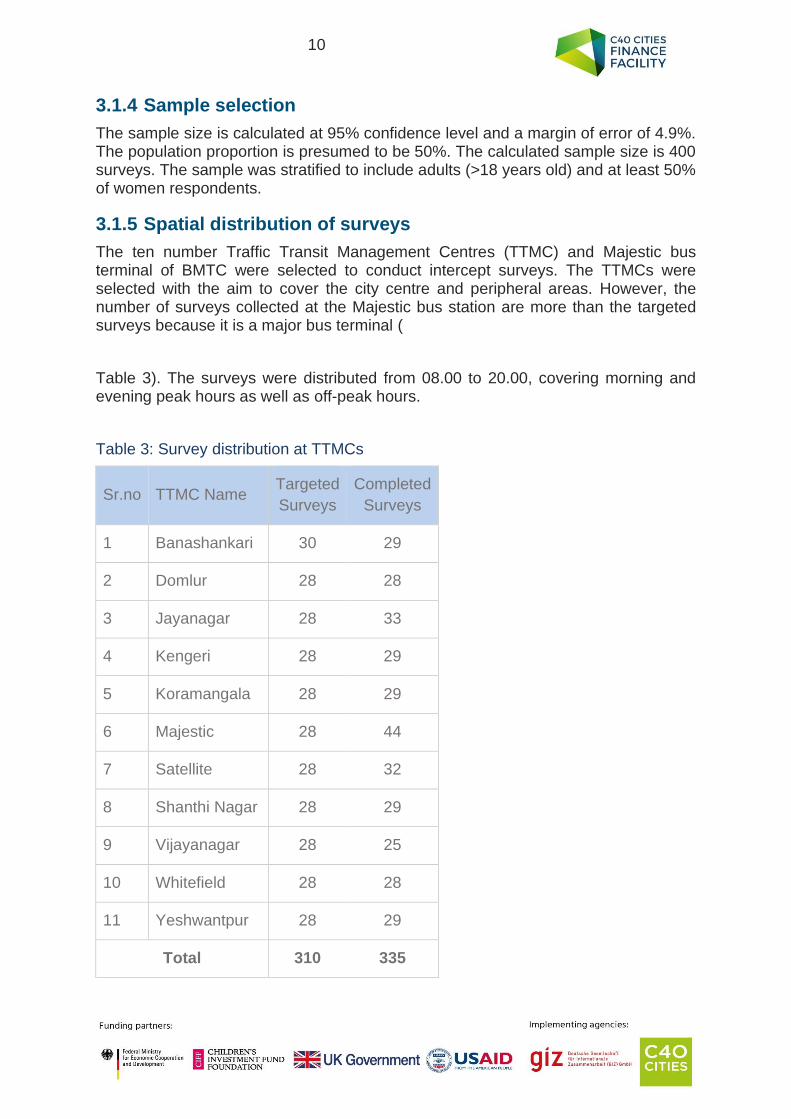
3.1.4 Sample selection
The sample size is calculated at 95% confidence level and a margin of error of 4.9%. The population proportion is presumed to be 50%. The calculated sample size is 400 surveys. The sample was stratified to include adults (>18 years old) and at least 50% of women respondents.
3.1.5 Spatial distribution of surveys
The ten number Traffic Transit Management Centres (TTMC) and Majestic bus terminal of BMTC were selected to conduct intercept surveys. The TTMCs were selected with the aim to cover the city centre and peripheral areas. However, the number of surveys collected at the Majestic bus station are more than the targeted surveys because it is a major bus terminal (
Table 3). The surveys were distributed from 08.00 to 20.00, covering morning and evening peak hours as well as off-peak hours.
Table 3: Survey distribution at TTMCs
Sr.no TTMC Name Targeted
Surveys
Completed
Surveys
1 Banashankari 30 29
2 Domlur 28 28
3 Jayanagar 28 33
4 Kengeri 28 29
5 Koramangala 28 29
6 Majestic 28 44
7 Satellite 28 32
8 Shanthi Nagar 28 29
9 Vijayanagar 28 25
10 Whitefield 28 28
11 Yeshwantpur 28 29
Total 310 335
11
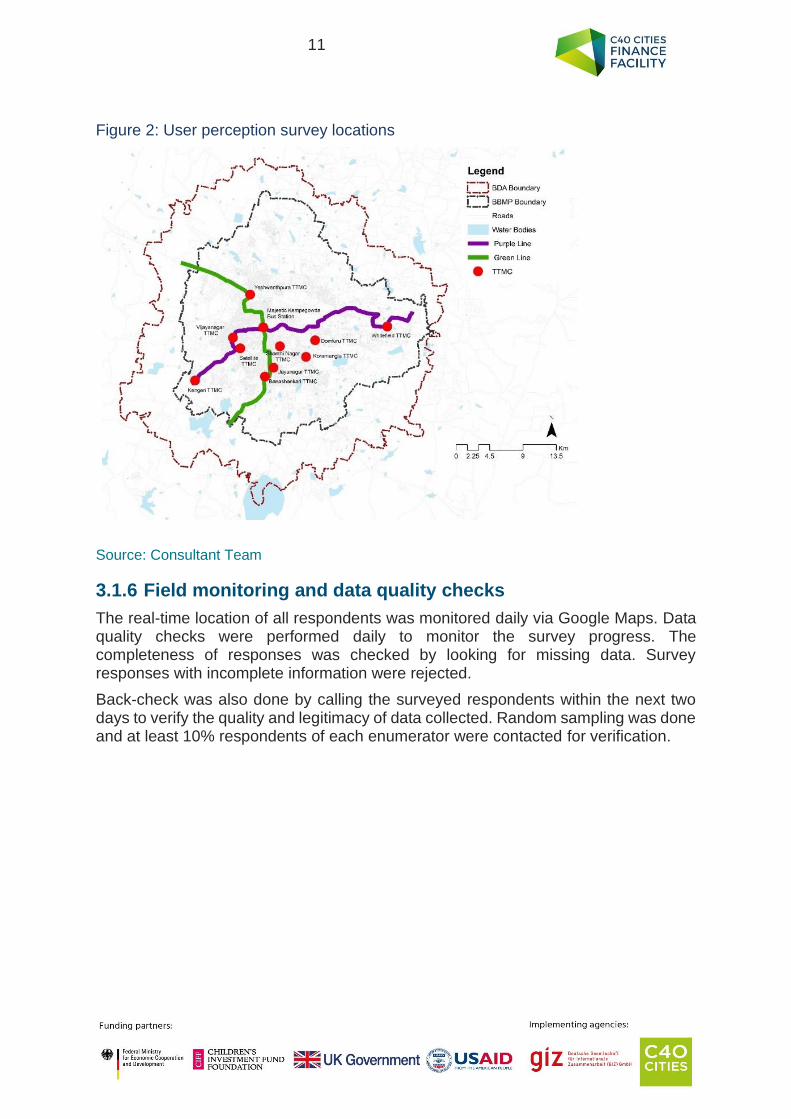
Figure 2: User perception survey locations
Source: Consultant Team
3.1.6 Field monitoring and data quality checks
The real-time location of all respondents was monitored daily via Google Maps. Data quality checks were performed daily to monitor the survey progress. The completeness of responses was checked by looking for missing data. Survey responses with incomplete information were rejected.
Back-check was also done by calling the surveyed respondents within the next two days to verify the quality and legitimacy of data collected. Random sampling was done and at least 10% respondents of each enumerator were contacted for verification.
12
4 FINDINGS FROM USER PERCEPTION SURVEY
4.1 Demography
4.1.1 Sex and age
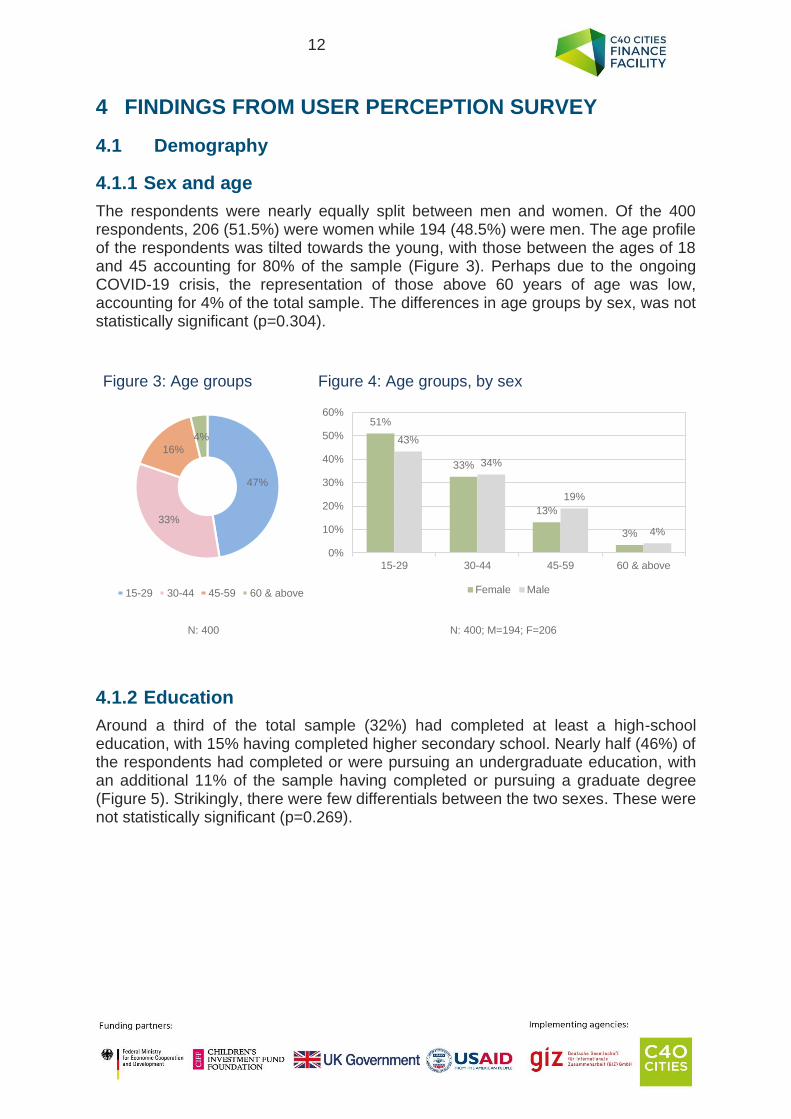
The respondents were nearly equally split between men and women. Of the 400 respondents, 206 (51.5%) were women while 194 (48.5%) were men. The age profile of the respondents was tilted towards the young, with those between the ages of 18 and 45 accounting for 80% of the sample (Figure 3). Perhaps due to the ongoing COVID-19 crisis, the representation of those above 60 years of age was low, accounting for 4% of the total sample. The differences in age groups by sex, was not statistically significant (p=0.304).
4.1.2 Education
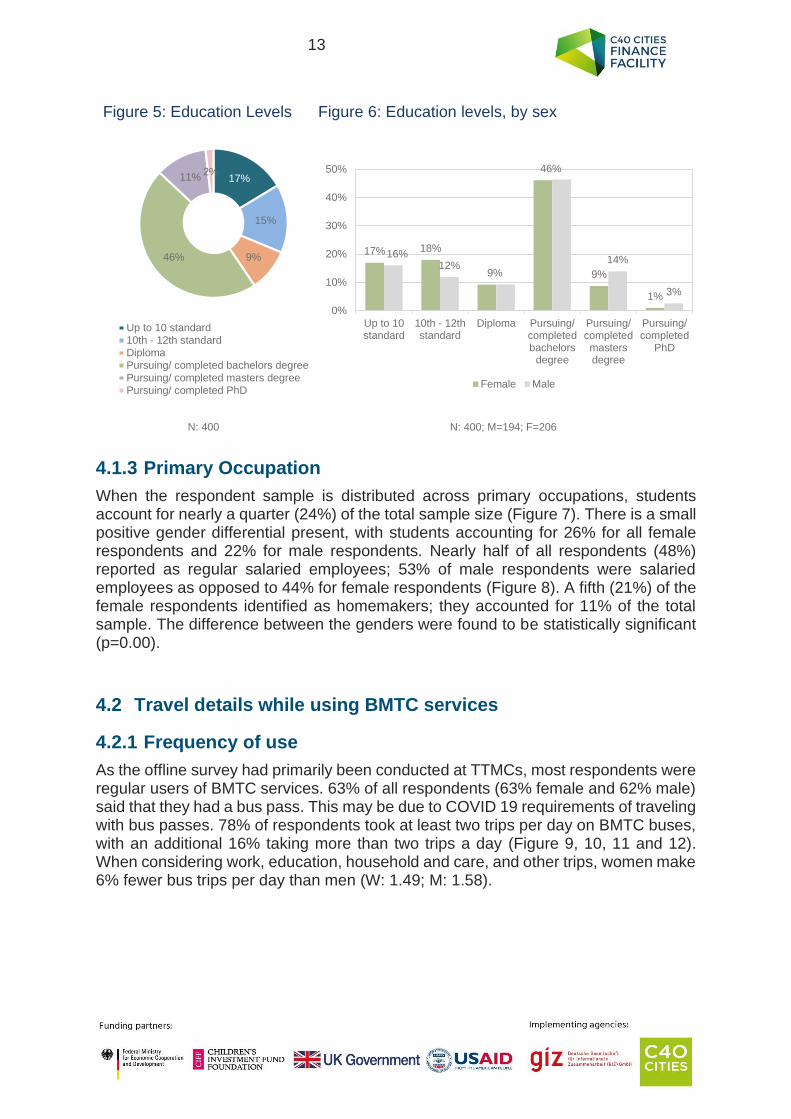
Around a third of the total sample (32%) had completed at least a high-school education, with 15% having completed higher secondary school. Nearly half (46%) of the respondents had completed or were pursuing an undergraduate education, with an additional 11% of the sample having completed or pursuing a graduate degree (Figure 5). Strikingly, there were few differentials between the two sexes. These were not statistically significant (p=0.269).
Figure 3: Age groups
Figure 4: Age groups, by sex
N: 400 N: 400; M=194; F=206
47%
33%
16%
4%
15-29 30-44 45-59 60 & above
51%
33%
13%
3%
43%
34%
19%
4%
0%
10%
20%
30%
40%
50%
60%
15-29 30-44 45-59 60 & above
Female Male
13
Figure 5: Education Levels
Figure 6: Education levels, by sex
N: 400 N: 400; M=194; F=206
4.1.3 Primary Occupation
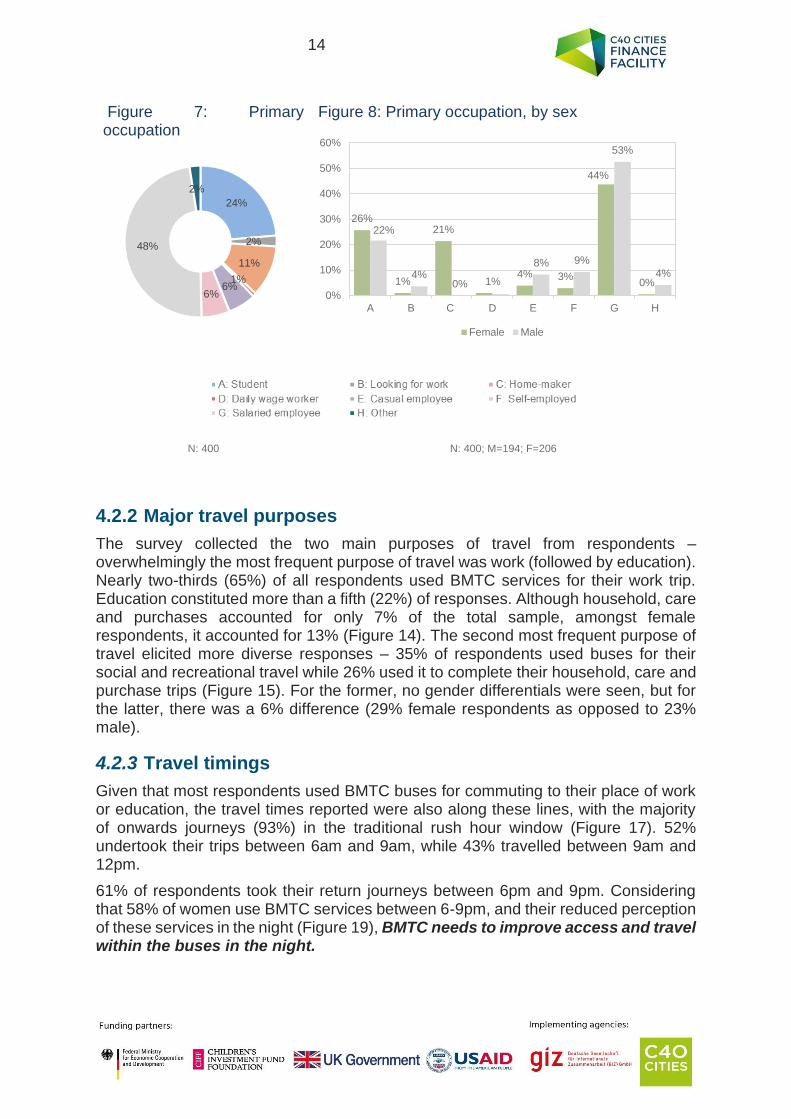
When the respondent sample is distributed across primary occupations, students account for nearly a quarter (24%) of the total sample size (Figure 7). There is a small positive gender differential present, with students accounting for 26% for all female respondents and 22% for male respondents. Nearly half of all respondents (48%) reported as regular salaried employees; 53% of male respondents were salaried employees as opposed to 44% for female respondents (Figure 8). A fifth (21%) of the female respondents identified as homemakers; they accounted for 11% of the total sample. The difference between the genders were found to be statistically significant (p=0.00).
4.2 Travel details while using BMTC services
4.2.1 Frequency of use
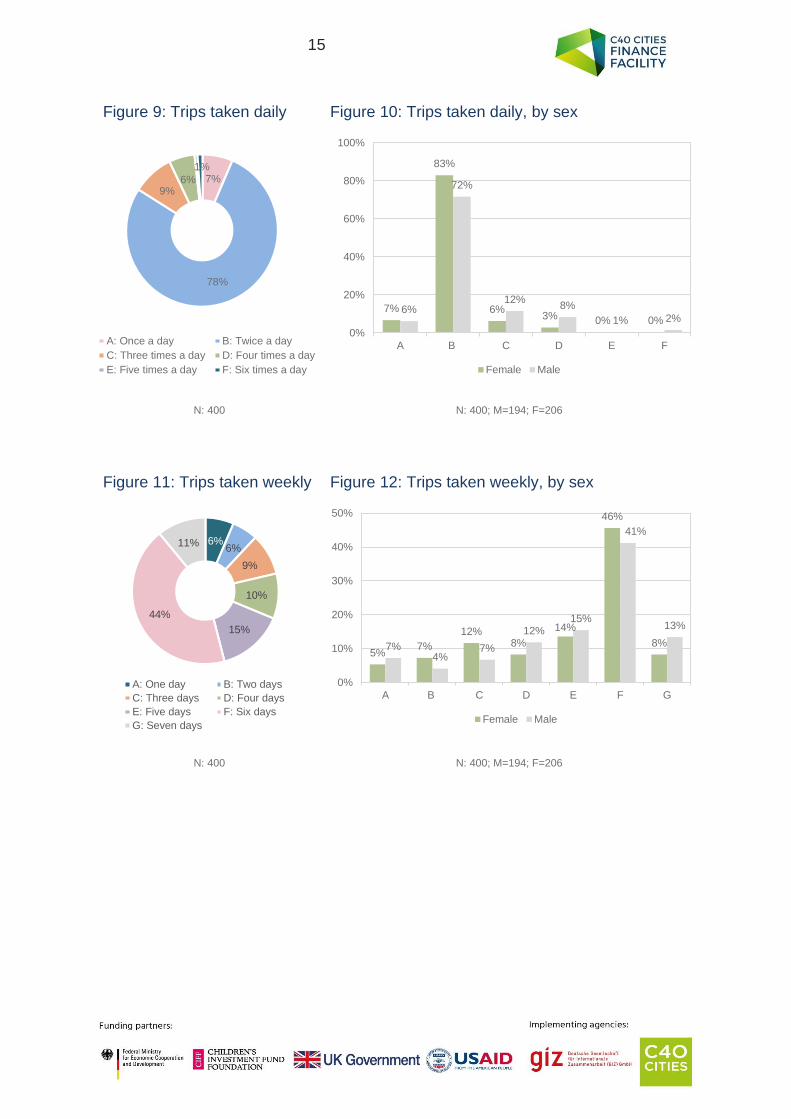
As the offline survey had primarily been conducted at TTMCs, most respondents were regular users of BMTC services. 63% of all respondents (63% female and 62% male) said that they had a bus pass. This may be due to COVID 19 requirements of traveling with bus passes. 78% of respondents took at least two trips per day on BMTC buses, with an additional 16% taking more than two trips a day (Figure 9, 10, 11 and 12). When considering work, education, household and care, and other trips, women make 6% fewer bus trips per day than men (W: 1.49; M: 1.58).
17%
15%
9%46%
11%2%
Up to 10 standard
10th - 12th standardDiploma
Pursuing/ completed bachelors degree
Pursuing/ completed masters degree
Pursuing/ completed PhD
17% 18%
9%
46%
9%
1%
16%12%
14%
3%
0%
10%
20%
30%
40%
50%
Up to 10standard
10th - 12thstandard
Diploma Pursuing/completedbachelors
degree
Pursuing/completedmastersdegree
Pursuing/completed
PhD
Female Male
14
Figure 7: Primary occupation
Figure 8: Primary occupation, by sex
N: 400 N: 400; M=194; F=206
4.2.2 Major travel purposes
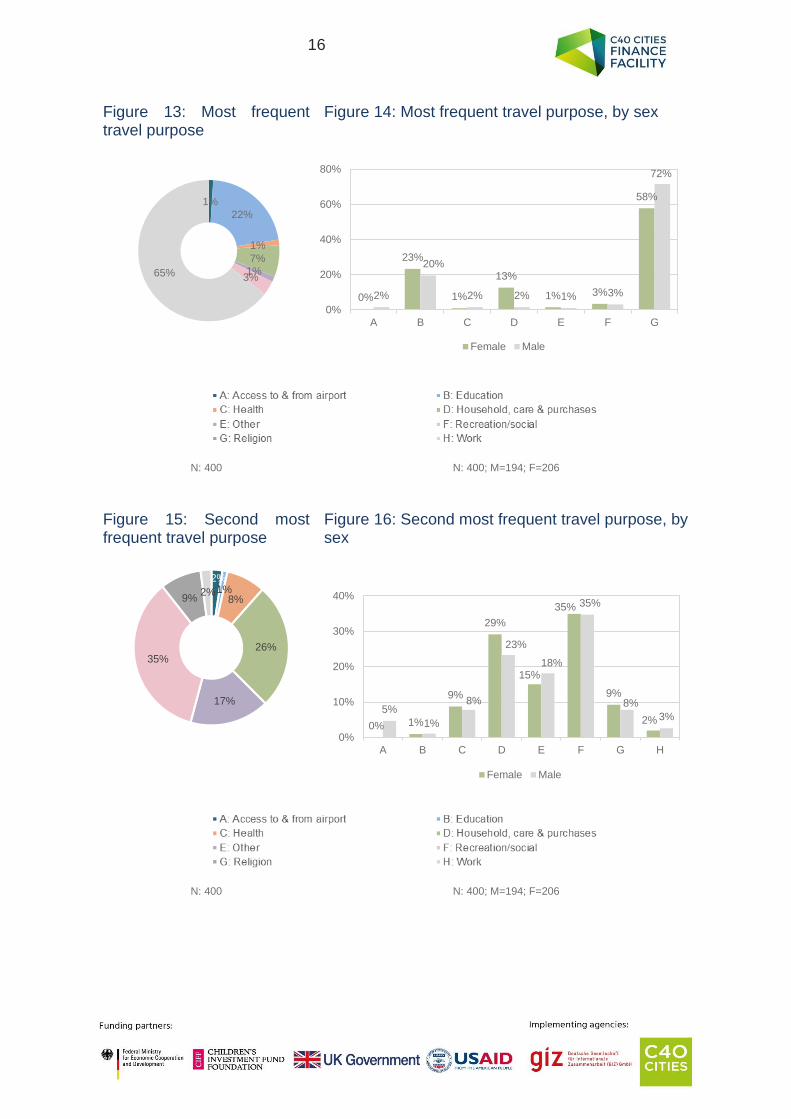
The survey collected the two main purposes of travel from respondents – overwhelmingly the most frequent purpose of travel was work (followed by education). Nearly two-thirds (65%) of all respondents used BMTC services for their work trip. Education constituted more than a fifth (22%) of responses. Although household, care and purchases accounted for only 7% of the total sample, amongst female respondents, it accounted for 13% (Figure 14). The second most frequent purpose of travel elicited more diverse responses – 35% of respondents used buses for their social and recreational travel while 26% used it to complete their household, care and purchase trips (Figure 15). For the former, no gender differentials were seen, but for the latter, there was a 6% difference (29% female respondents as opposed to 23% male).
4.2.3 Travel timings
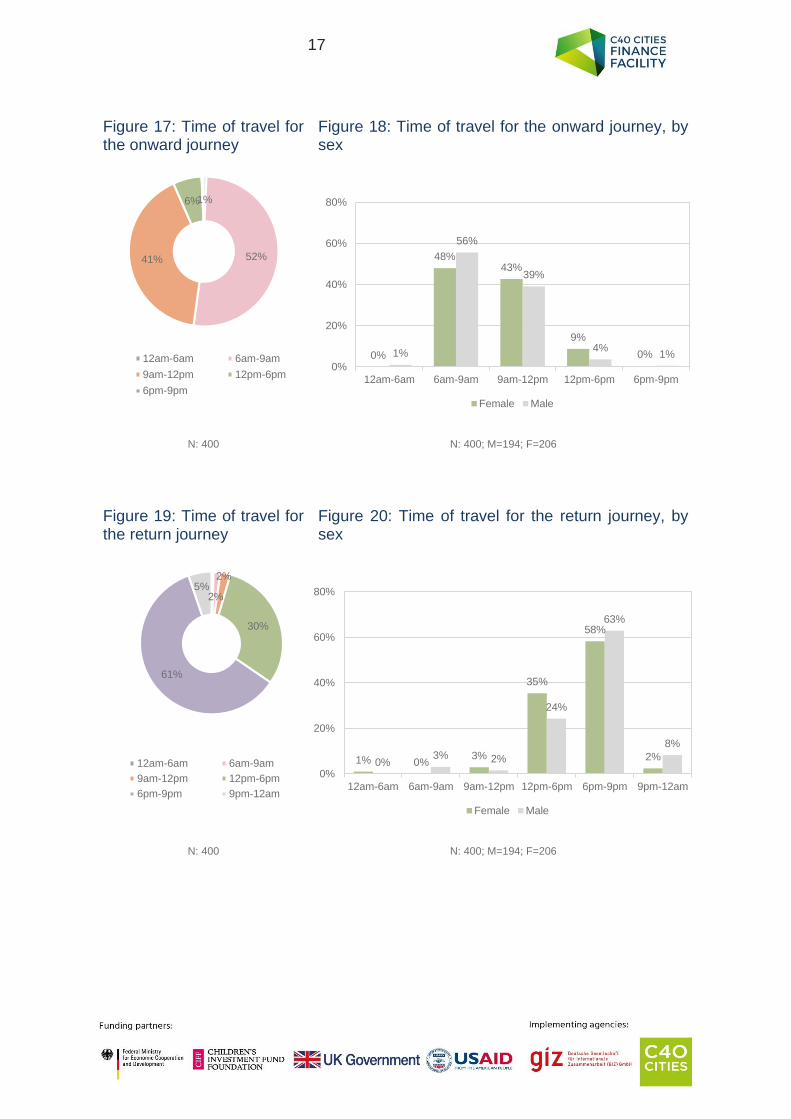
Given that most respondents used BMTC buses for commuting to their place of work or education, the travel times reported were also along these lines, with the majority of onwards journeys (93%) in the traditional rush hour window (Figure 17). 52% undertook their trips between 6am and 9am, while 43% travelled between 9am and 12pm.
61% of respondents took their return journeys between 6pm and 9pm. Considering that 58% of women use BMTC services between 6-9pm, and their reduced perception of these services in the night (Figure 19), BMTC needs to improve access and travel within the buses in the night.
24%
2%
11%
1%6%
6%
48%
2%
26%
1%
21%
4% 3%
44%
0%
22%
4%0% 1%
8% 9%
53%
4%
0%
10%
20%
30%
40%
50%
60%
A B C D E F G H
Female Male
15
Figure 9: Trips taken daily
Figure 10: Trips taken daily, by sex
N: 400
N: 400; M=194; F=206
Figure 11: Trips taken weekly
Figure 12: Trips taken weekly, by sex
N: 400 N: 400; M=194; F=206
7%
78%
9%6%
1%
A: Once a day B: Twice a day
C: Three times a day D: Four times a day
E: Five times a day F: Six times a day
7%
83%
6%3% 0% 0%
6%
72%
12%8%
1% 2%
0%
20%
40%
60%
80%
100%
A B C D E F
Female Male
6%6%
9%
10%
15%
44%
11%
A: One day B: Two days
C: Three days D: Four days
E: Five days F: Six days
G: Seven days
5%7%
12%8%
14%
46%
8%7%4%
7%
12%15%
41%
13%
0%
10%
20%
30%
40%
50%
A B C D E F G
Female Male
16
Figure 13: Most frequent travel purpose
Figure 14: Most frequent travel purpose, by sex
N: 400
N: 400; M=194; F=206
Figure 15: Second most frequent travel purpose
Figure 16: Second most frequent travel purpose, by sex
N: 400 N: 400; M=194; F=206
1%
22%
1%
7%
1%3%65%
0%
23%
1%
13%
1% 3%
58%
2%
20%
2% 2% 1% 3%
72%
0%
20%
40%
60%
80%
A B C D E F G
Female Male
2%1%
8%
26%
17%
35%
9%2%
0% 1%
9%
29%
15%
35%
9%
2%5%
1%
8%
23%
18%
35%
8%
3%
0%
10%
20%
30%
40%
A B C D E F G H
Female Male
17
Figure 19: Time of travel for the return journey
Figure 20: Time of travel for the return journey, by sex
N: 400 N: 400; M=194; F=206
2%
2%
30%
61%
5%
12am-6am 6am-9am
9am-12pm 12pm-6pm
6pm-9pm 9pm-12am
1% 0%3%
35%
58%
2%0%
3% 2%
24%
63%
8%
0%
20%
40%
60%
80%
12am-6am 6am-9am 9am-12pm 12pm-6pm 6pm-9pm 9pm-12am
Female Male
Figure 17: Time of travel for the onward journey
Figure 18: Time of travel for the onward journey, by sex
N: 400
N: 400; M=194; F=206
1%
52%41%
6%
12am-6am 6am-9am
9am-12pm 12pm-6pm
6pm-9pm
0%
48%43%
9%
0%1%
56%
39%
4%1%
0%
20%
40%
60%
80%
12am-6am 6am-9am 9am-12pm 12pm-6pm 6pm-9pm
Female Male
18
4.2.4 Overall monthly travel expenditure
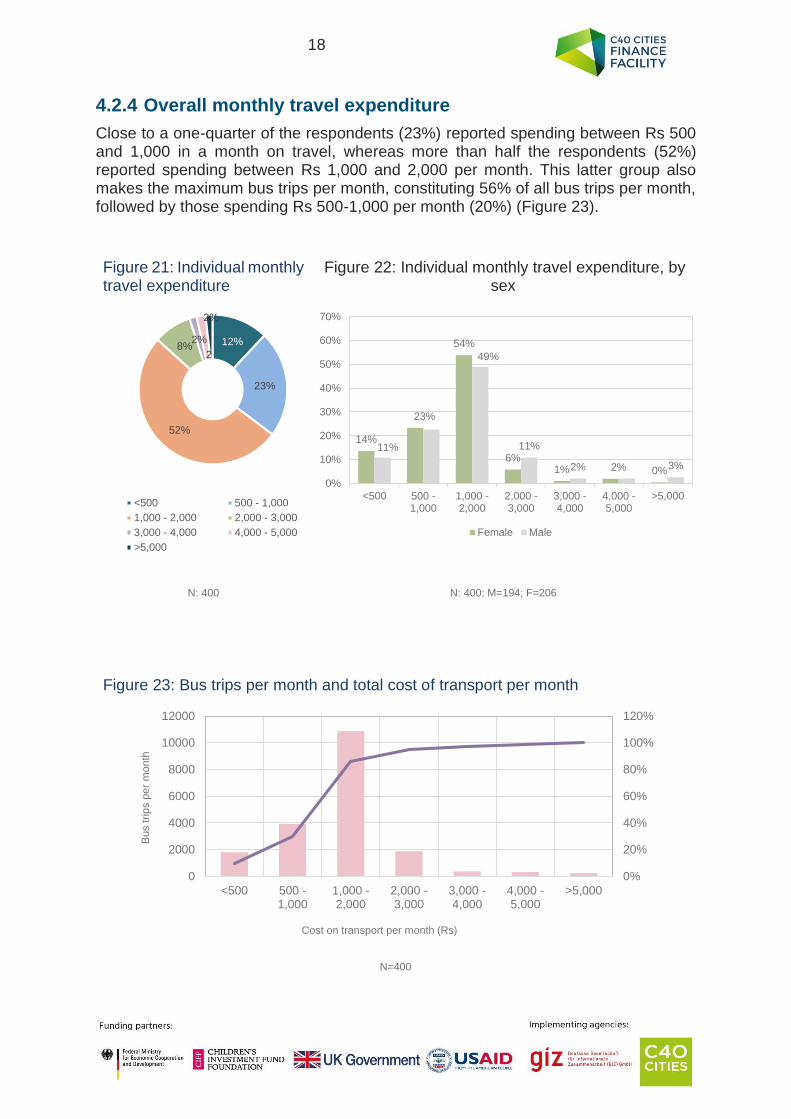
Close to a one-quarter of the respondents (23%) reported spending between Rs 500 and 1,000 in a month on travel, whereas more than half the respondents (52%) reported spending between Rs 1,000 and 2,000 per month. This latter group also makes the maximum bus trips per month, constituting 56% of all bus trips per month, followed by those spending Rs 500-1,000 per month (20%) (Figure 23).
Figure 21: Individual monthly travel expenditure
Figure 22: Individual monthly travel expenditure, by sex
N: 400 N: 400; M=194; F=206
Figure 23: Bus trips per month and total cost of transport per month
N=400
12%
23%
52%
8%2%
2
2%
<500 500 - 1,000
1,000 - 2,000 2,000 - 3,000
3,000 - 4,000 4,000 - 5,000
>5,000
14%
23%
54%
6%1% 2% 0%
11%
49%
11%
2% 3%
0%
10%
20%
30%
40%
50%
60%
70%
<500 500 -1,000
1,000 -2,000
2,000 -3,000
3,000 -4,000
4,000 -5,000
>5,000
Female Male
0%
20%
40%
60%
80%
100%
120%
0
2000
4000
6000
8000
10000
12000
<500 500 -1,000
1,000 -2,000
2,000 -3,000
3,000 -4,000
4,000 -5,000
>5,000
Bus trip
s p
er
month
Cost on transport per month (Rs)
19
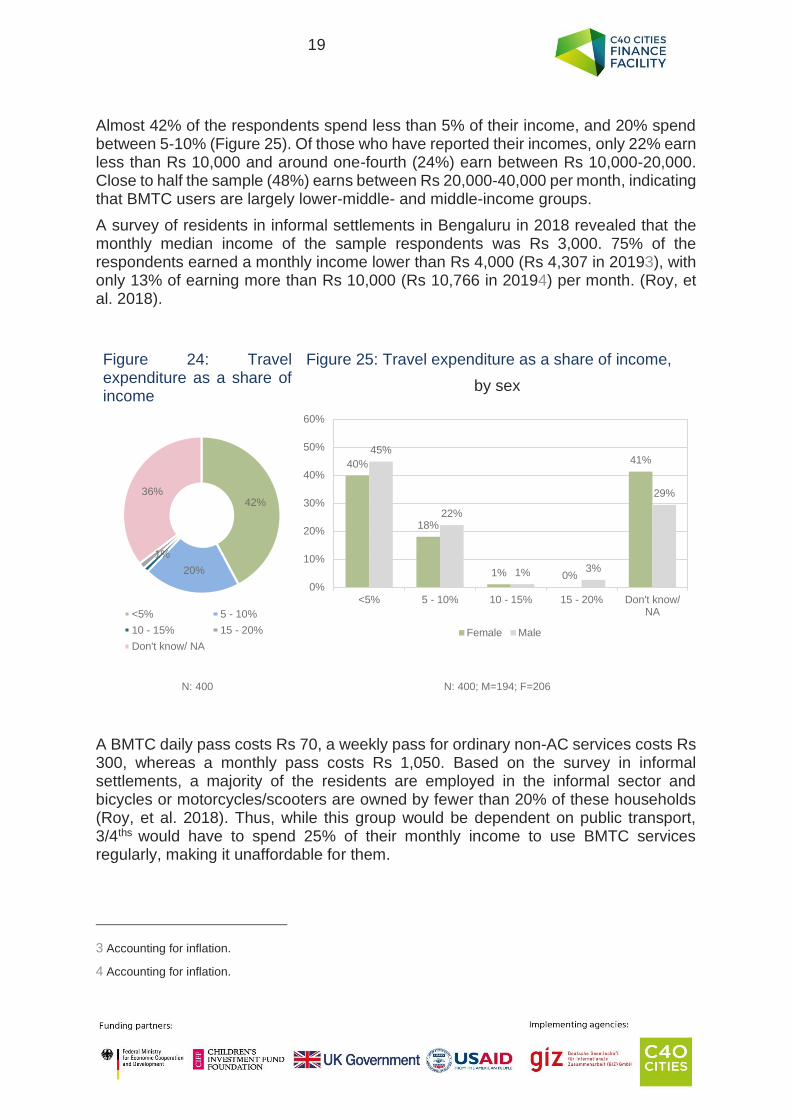
Almost 42% of the respondents spend less than 5% of their income, and 20% spend between 5-10% (Figure 25). Of those who have reported their incomes, only 22% earn less than Rs 10,000 and around one-fourth (24%) earn between Rs 10,000-20,000. Close to half the sample (48%) earns between Rs 20,000-40,000 per month, indicating that BMTC users are largely lower-middle- and middle-income groups.
A survey of residents in informal settlements in Bengaluru in 2018 revealed that the monthly median income of the sample respondents was Rs 3,000. 75% of the respondents earned a monthly income lower than Rs 4,000 (Rs 4,307 in 20193), with only 13% of earning more than Rs 10,000 (Rs 10,766 in 20194) per month. (Roy, et al. 2018).
Figure 24: Travel expenditure as a share of income
Figure 25: Travel expenditure as a share of income,
by sex
N: 400 N: 400; M=194; F=206
A BMTC daily pass costs Rs 70, a weekly pass for ordinary non-AC services costs Rs 300, whereas a monthly pass costs Rs 1,050. Based on the survey in informal settlements, a majority of the residents are employed in the informal sector and bicycles or motorcycles/scooters are owned by fewer than 20% of these households (Roy, et al. 2018). Thus, while this group would be dependent on public transport, 3/4ths would have to spend 25% of their monthly income to use BMTC services regularly, making it unaffordable for them.
3 Accounting for inflation.
4 Accounting for inflation.
42%
20%
1%
36%
<5% 5 - 10%
10 - 15% 15 - 20%
Don't know/ NA
40%
18%
1% 0%
41%45%
22%
1% 3%
29%
0%
10%
20%
30%
40%
50%
60%
<5% 5 - 10% 10 - 15% 15 - 20% Don't know/NA
Female Male
20
4.3 Perception of BMTC services
4.3.1 Rating of BMTC services in the day
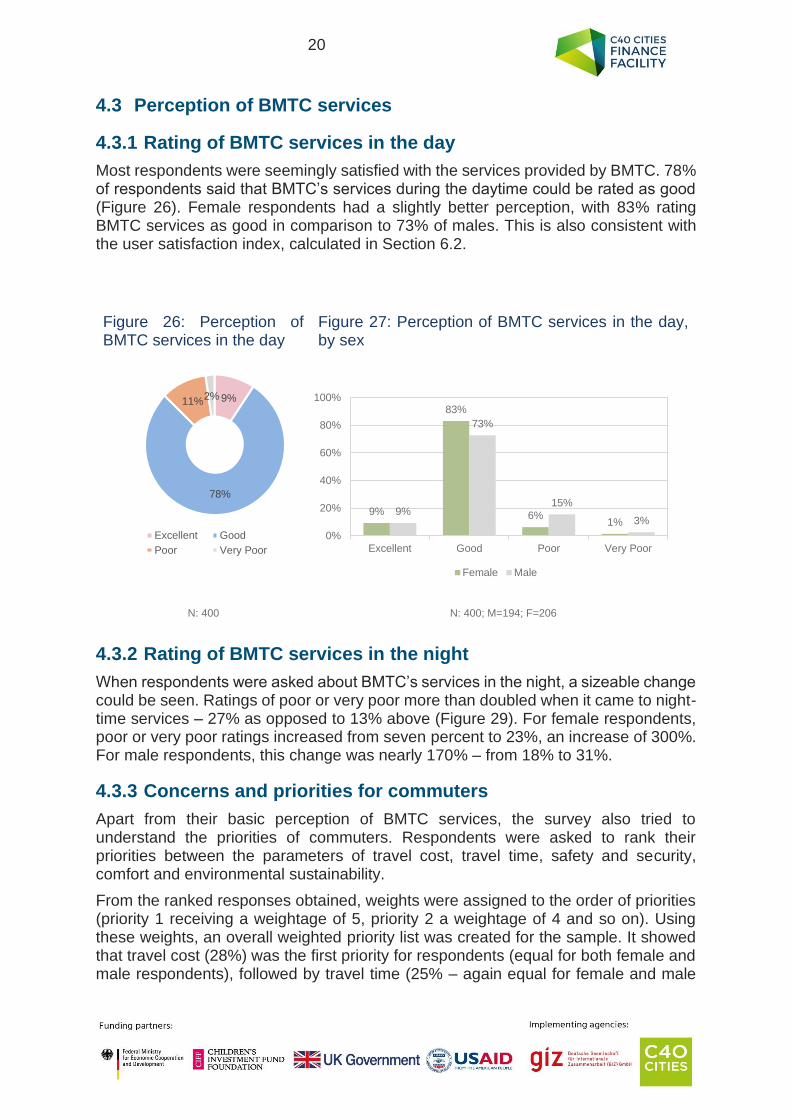
Most respondents were seemingly satisfied with the services provided by BMTC. 78% of respondents said that BMTC’s services during the daytime could be rated as good (Figure 26). Female respondents had a slightly better perception, with 83% rating BMTC services as good in comparison to 73% of males. This is also consistent with the user satisfaction index, calculated in Section 6.2.
Figure 26: Perception of BMTC services in the day
Figure 27: Perception of BMTC services in the day, by sex
N: 400 N: 400; M=194; F=206
4.3.2 Rating of BMTC services in the night
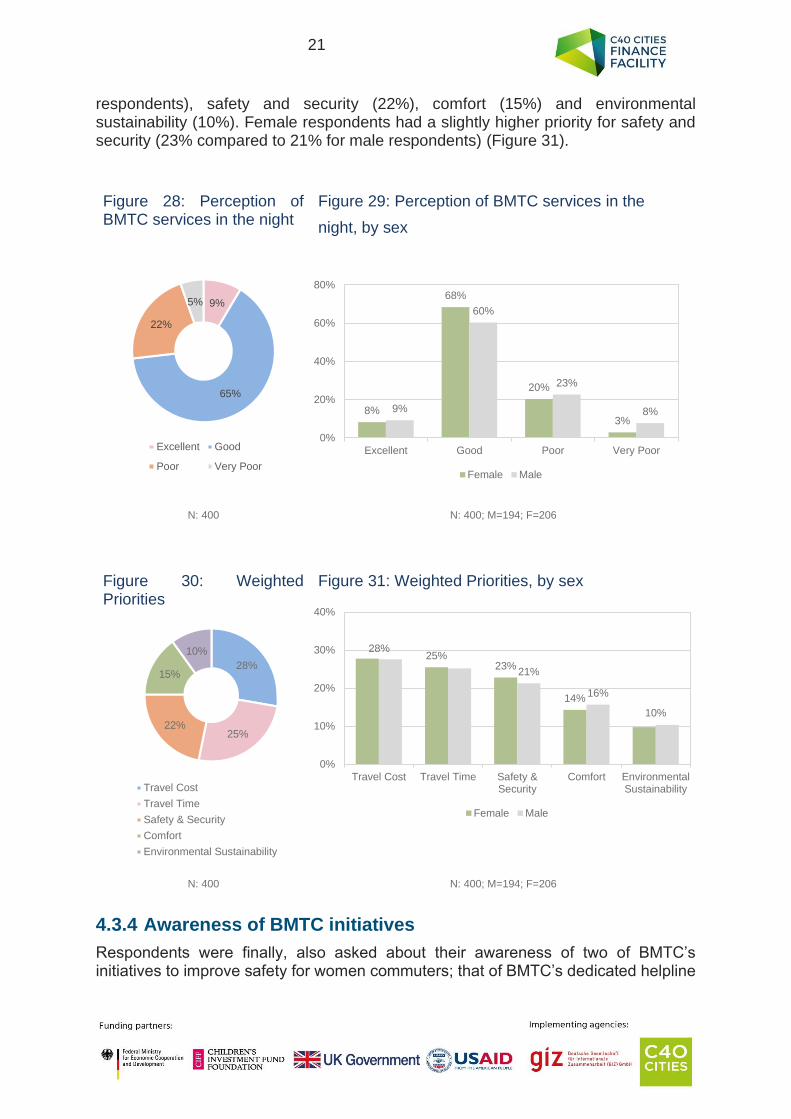
When respondents were asked about BMTC’s services in the night, a sizeable change could be seen. Ratings of poor or very poor more than doubled when it came to night-time services – 27% as opposed to 13% above (Figure 29). For female respondents, poor or very poor ratings increased from seven percent to 23%, an increase of 300%. For male respondents, this change was nearly 170% – from 18% to 31%.
4.3.3 Concerns and priorities for commuters
Apart from their basic perception of BMTC services, the survey also tried to understand the priorities of commuters. Respondents were asked to rank their priorities between the parameters of travel cost, travel time, safety and security, comfort and environmental sustainability.
From the ranked responses obtained, weights were assigned to the order of priorities (priority 1 receiving a weightage of 5, priority 2 a weightage of 4 and so on). Using these weights, an overall weighted priority list was created for the sample. It showed that travel cost (28%) was the first priority for respondents (equal for both female and male respondents), followed by travel time (25% – again equal for female and male
9%
78%
11%2%
Excellent Good
Poor Very Poor
9%
83%
6%1%
9%
73%
15%
3%
0%
20%
40%
60%
80%
100%
Excellent Good Poor Very Poor
Female Male
21
respondents), safety and security (22%), comfort (15%) and environmental sustainability (10%). Female respondents had a slightly higher priority for safety and security (23% compared to 21% for male respondents) (Figure 31).
Figure 28: Perception of BMTC services in the night
Figure 29: Perception of BMTC services in the
night, by sex
N: 400 N: 400; M=194; F=206
Figure 30: Weighted Priorities
Figure 31: Weighted Priorities, by sex
N: 400 N: 400; M=194; F=206
4.3.4 Awareness of BMTC initiatives
Respondents were finally, also asked about their awareness of two of BMTC’s initiatives to improve safety for women commuters; that of BMTC’s dedicated helpline
9%
65%
22%
5%
Excellent Good
Poor Very Poor
8%
68%
20%
3%9%
60%
23%
8%
0%
20%
40%
60%
80%
Excellent Good Poor Very Poor
Female Male
28%
25%22%
15%
10%
Travel Cost
Travel Time
Safety & Security
Comfort
Environmental Sustainability
28%25%
23%
14%
10%
21%
16%
0%
10%
20%
30%
40%
Travel Cost Travel Time Safety &Security
Comfort EnvironmentalSustainability
Female Male
22
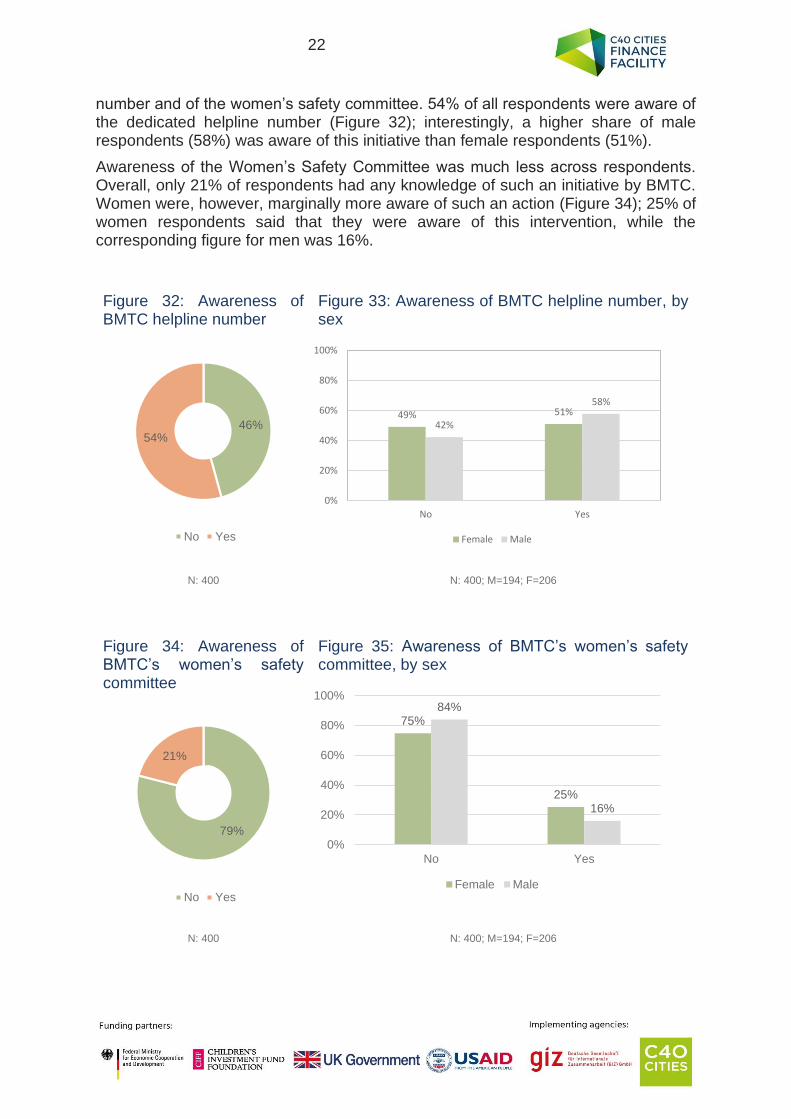
number and of the women’s safety committee. 54% of all respondents were aware of the dedicated helpline number (Figure 32); interestingly, a higher share of male respondents (58%) was aware of this initiative than female respondents (51%).
Awareness of the Women’s Safety Committee was much less across respondents. Overall, only 21% of respondents had any knowledge of such an initiative by BMTC. Women were, however, marginally more aware of such an action (Figure 34); 25% of women respondents said that they were aware of this intervention, while the corresponding figure for men was 16%.
Figure 32: Awareness of BMTC helpline number
Figure 33: Awareness of BMTC helpline number, by sex
N: 400 N: 400; M=194; F=206
Figure 34: Awareness of BMTC’s women’s safety committee
Figure 35: Awareness of BMTC’s women’s safety committee, by sex
N: 400 N: 400; M=194; F=206
46%54%
No Yes
49% 51%42%
58%
0%
20%
40%
60%
80%
100%
No Yes
Female Male
79%
21%
No Yes
75%
25%
84%
16%
0%
20%
40%
60%
80%
100%
No Yes
Female Male
23
5 IMPORTANCE-SATISFACTION ANALYSIS
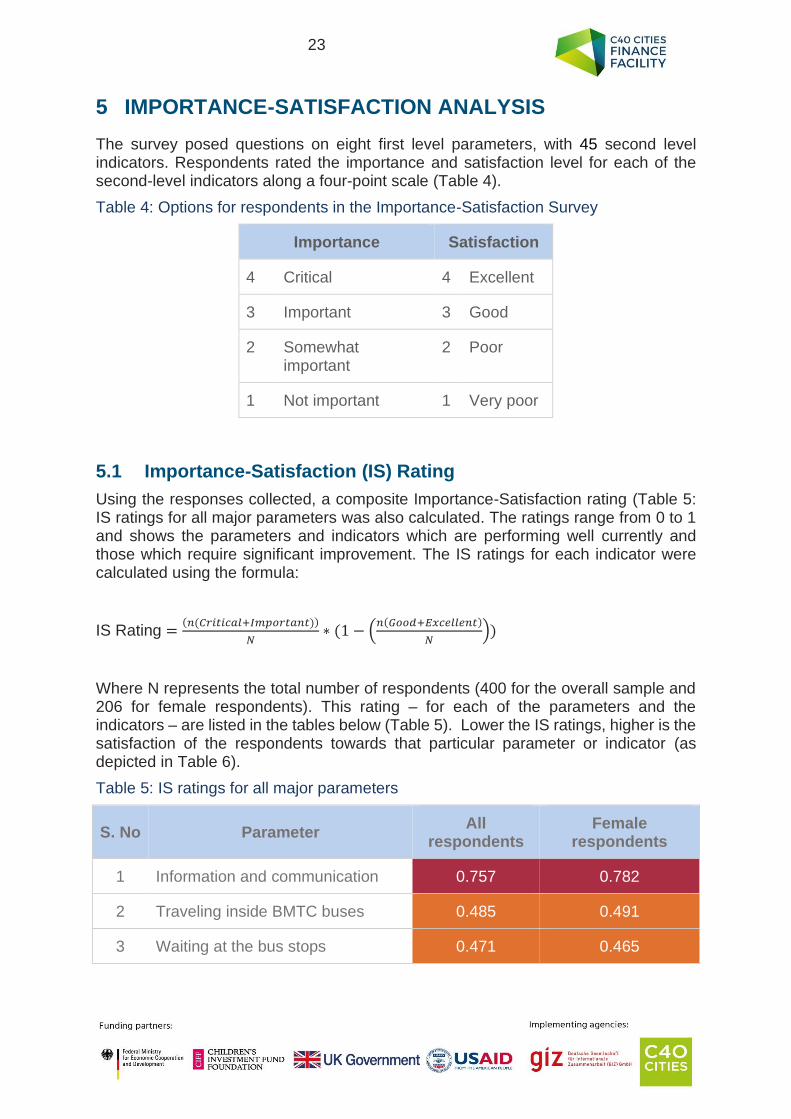
The survey posed questions on eight first level parameters, with 45 second level indicators. Respondents rated the importance and satisfaction level for each of the second-level indicators along a four-point scale (Table 4).
Table 4: Options for respondents in the Importance-Satisfaction Survey
Importance Satisfaction
4 Critical 4 Excellent
3 Important 3 Good
2 Somewhat important
2 Poor
1 Not important 1 Very poor
5.1 Importance-Satisfaction (IS) Rating
Using the responses collected, a composite Importance-Satisfaction rating (Table 5: IS ratings for all major parameters was also calculated. The ratings range from 0 to 1 and shows the parameters and indicators which are performing well currently and those which require significant improvement. The IS ratings for each indicator were calculated using the formula:
IS Rating =(𝑛(𝐶𝑟𝑖𝑡𝑖𝑐𝑎𝑙+𝐼𝑚𝑝𝑜𝑟𝑡𝑎𝑛𝑡))
𝑁∗ (1 − (
𝑛(𝐺𝑜𝑜𝑑+𝐸𝑥𝑐𝑒𝑙𝑙𝑒𝑛𝑡)
𝑁))
Where N represents the total number of respondents (400 for the overall sample and 206 for female respondents). This rating – for each of the parameters and the indicators – are listed in the tables below (Table 5). Lower the IS ratings, higher is the satisfaction of the respondents towards that particular parameter or indicator (as depicted in Table 6).
Table 5: IS ratings for all major parameters
S. No Parameter All
respondents Female
respondents
1 Information and communication 0.757 0.782
2 Traveling inside BMTC buses 0.485 0.491
3 Waiting at the bus stops 0.471 0.465
24
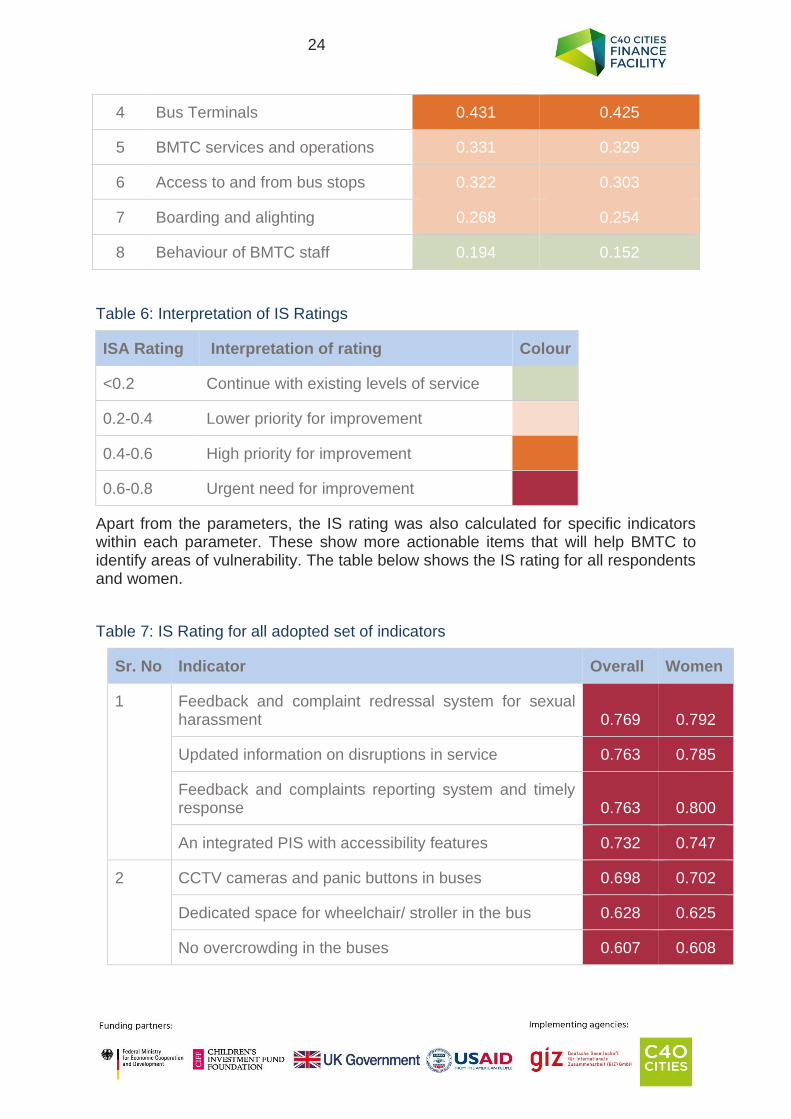
4 Bus Terminals 0.431 0.425
5 BMTC services and operations 0.331 0.329
6 Access to and from bus stops 0.322 0.303
7 Boarding and alighting 0.268 0.254
8 Behaviour of BMTC staff 0.194 0.152
Table 6: Interpretation of IS Ratings
ISA Rating Interpretation of rating Colour
<0.2 Continue with existing levels of service
0.2-0.4 Lower priority for improvement
0.4-0.6 High priority for improvement
0.6-0.8 Urgent need for improvement
Apart from the parameters, the IS rating was also calculated for specific indicators within each parameter. These show more actionable items that will help BMTC to identify areas of vulnerability. The table below shows the IS rating for all respondents and women.
Table 7: IS Rating for all adopted set of indicators
Sr. No Indicator Overall Women
1 Feedback and complaint redressal system for sexual harassment 0.769 0.792
Updated information on disruptions in service 0.763 0.785
Feedback and complaints reporting system and timely response 0.763 0.800
An integrated PIS with accessibility features 0.732 0.747
2 CCTV cameras and panic buttons in buses 0.698 0.702
Dedicated space for wheelchair/ stroller in the bus 0.628 0.625
No overcrowding in the buses 0.607 0.608
25
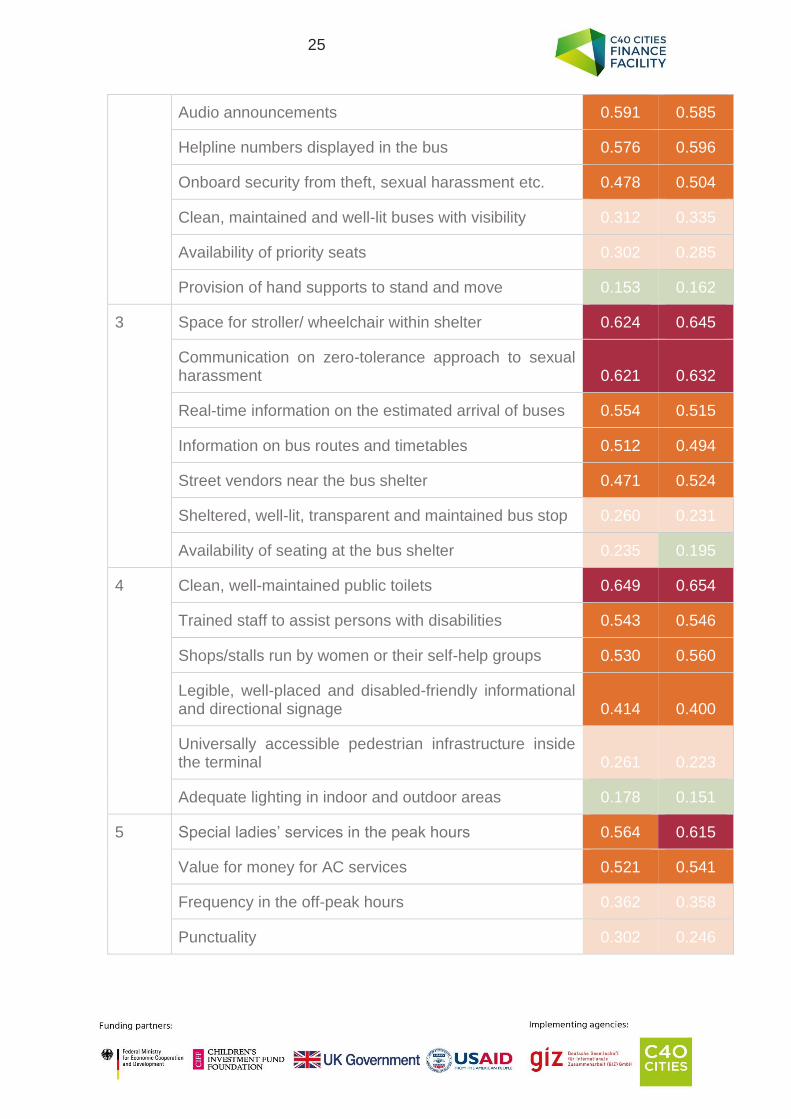
Audio announcements 0.591 0.585
Helpline numbers displayed in the bus 0.576 0.596
Onboard security from theft, sexual harassment etc. 0.478 0.504
Clean, maintained and well-lit buses with visibility 0.312 0.335
Availability of priority seats 0.302 0.285
Provision of hand supports to stand and move 0.153 0.162
3 Space for stroller/ wheelchair within shelter 0.624 0.645
Communication on zero-tolerance approach to sexual harassment 0.621 0.632
Real-time information on the estimated arrival of buses 0.554 0.515
Information on bus routes and timetables 0.512 0.494
Street vendors near the bus shelter 0.471 0.524
Sheltered, well-lit, transparent and maintained bus stop 0.260 0.231
Availability of seating at the bus shelter 0.235 0.195
4 Clean, well-maintained public toilets 0.649 0.654
Trained staff to assist persons with disabilities 0.543 0.546
Shops/stalls run by women or their self-help groups 0.530 0.560
Legible, well-placed and disabled-friendly informational and directional signage 0.414 0.400
Universally accessible pedestrian infrastructure inside the terminal 0.261 0.223
Adequate lighting in indoor and outdoor areas 0.178 0.151
5 Special ladies’ services in the peak hours 0.564 0.615
Value for money for AC services 0.521 0.541
Frequency in the off-peak hours 0.362 0.358
Punctuality 0.302 0.246
26
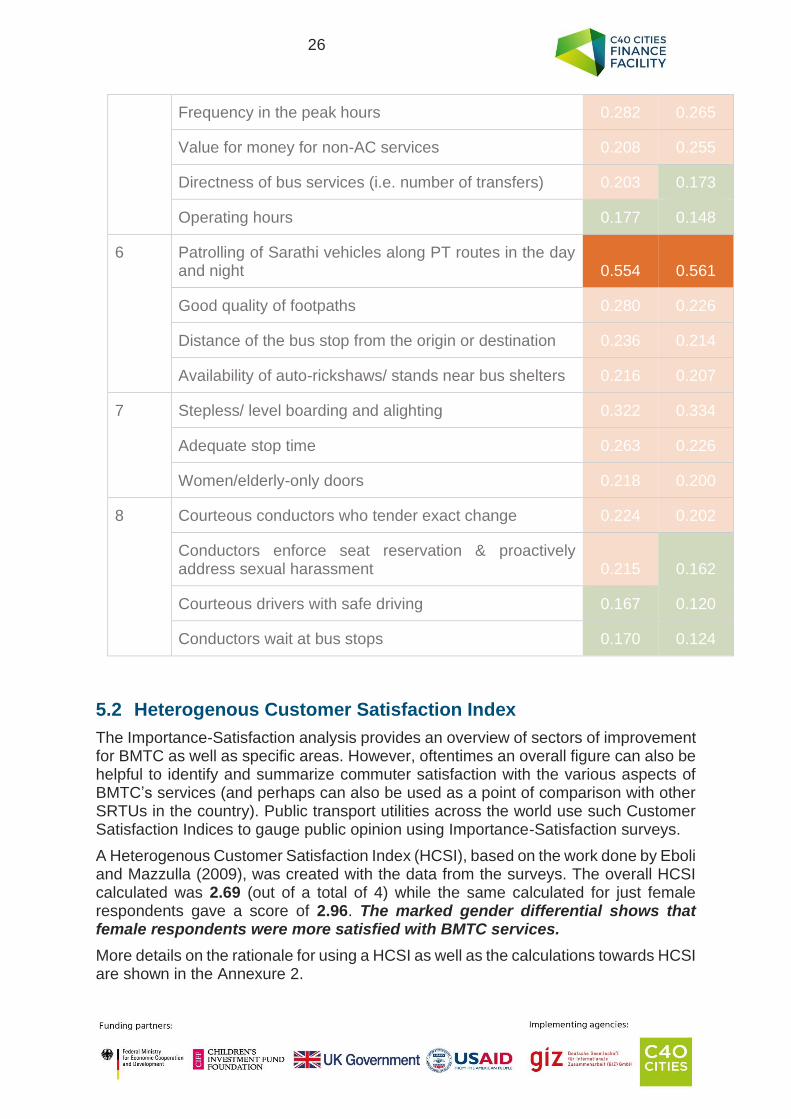
Frequency in the peak hours 0.282 0.265
Value for money for non-AC services 0.208 0.255
Directness of bus services (i.e. number of transfers) 0.203 0.173
Operating hours 0.177 0.148
6 Patrolling of Sarathi vehicles along PT routes in the day and night 0.554 0.561
Good quality of footpaths 0.280 0.226
Distance of the bus stop from the origin or destination 0.236 0.214
Availability of auto-rickshaws/ stands near bus shelters 0.216 0.207
7 Stepless/ level boarding and alighting 0.322 0.334
Adequate stop time 0.263 0.226
Women/elderly-only doors 0.218 0.200
8 Courteous conductors who tender exact change 0.224 0.202
Conductors enforce seat reservation & proactively address sexual harassment 0.215 0.162
Courteous drivers with safe driving 0.167 0.120
Conductors wait at bus stops 0.170 0.124
5.2 Heterogenous Customer Satisfaction Index
The Importance-Satisfaction analysis provides an overview of sectors of improvement for BMTC as well as specific areas. However, oftentimes an overall figure can also be helpful to identify and summarize commuter satisfaction with the various aspects of BMTC’s services (and perhaps can also be used as a point of comparison with other SRTUs in the country). Public transport utilities across the world use such Customer Satisfaction Indices to gauge public opinion using Importance-Satisfaction surveys.
A Heterogenous Customer Satisfaction Index (HCSI), based on the work done by Eboli and Mazzulla (2009), was created with the data from the surveys. The overall HCSI calculated was 2.69 (out of a total of 4) while the same calculated for just female respondents gave a score of 2.96. The marked gender differential shows that female respondents were more satisfied with BMTC services.
More details on the rationale for using a HCSI as well as the calculations towards HCSI are shown in the Annexure 2.
27
6 RECOMMENDATIONS FOR GENDER EQUALITY AND LEAVE NO ONE BEHIND
6.1 Gender Equality and Social Inclusion Action Plan
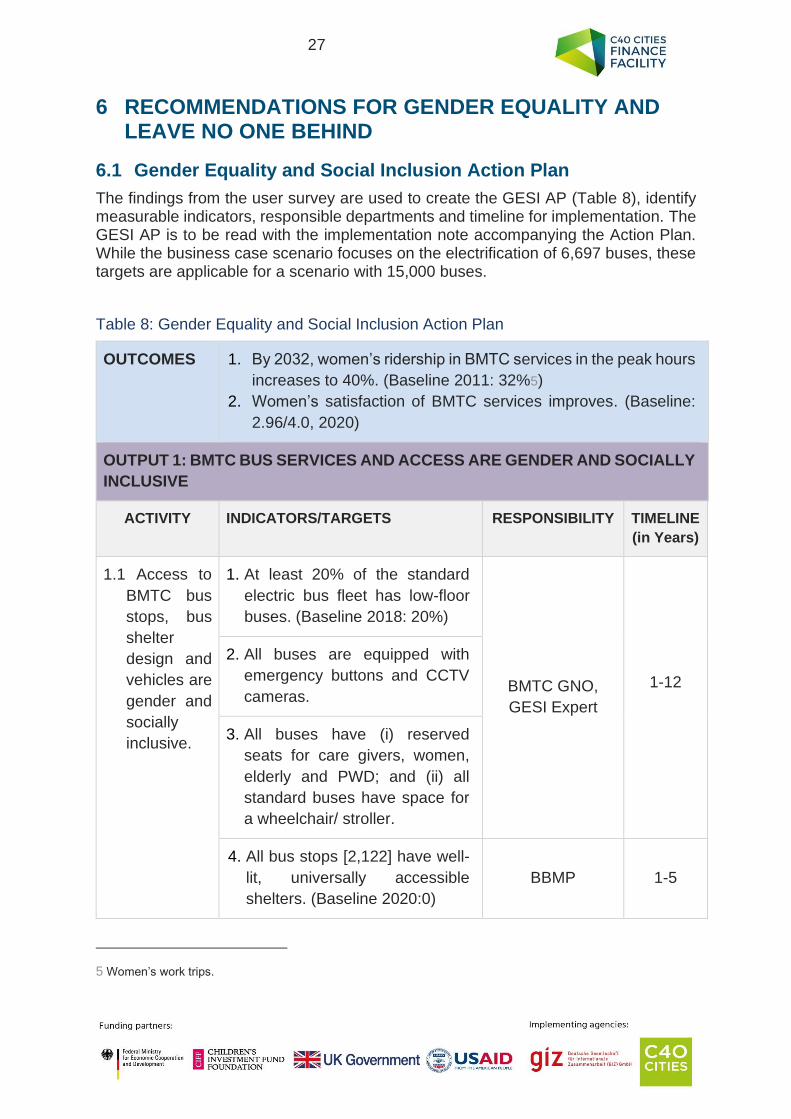
The findings from the user survey are used to create the GESI AP (Table 8), identify measurable indicators, responsible departments and timeline for implementation. The GESI AP is to be read with the implementation note accompanying the Action Plan. While the business case scenario focuses on the electrification of 6,697 buses, these targets are applicable for a scenario with 15,000 buses.
Table 8: Gender Equality and Social Inclusion Action Plan
OUTCOMES 1. By 2032, women’s ridership in BMTC services in the peak hours
increases to 40%. (Baseline 2011: 32%5)
2. Women’s satisfaction of BMTC services improves. (Baseline:
2.96/4.0, 2020)
OUTPUT 1: BMTC BUS SERVICES AND ACCESS ARE GENDER AND SOCIALLY
INCLUSIVE
ACTIVITY INDICATORS/TARGETS RESPONSIBILITY TIMELINE
(in Years)
1.1 Access to
BMTC bus
stops, bus
shelter
design and
vehicles are
gender and
socially
inclusive.
1. At least 20% of the standard
electric bus fleet has low-floor
buses. (Baseline 2018: 20%)
BMTC GNO,
GESI Expert
1-12
2. All buses are equipped with
emergency buttons and CCTV
cameras.
3. All buses have (i) reserved
seats for care givers, women,
elderly and PWD; and (ii) all
standard buses have space for
a wheelchair/ stroller.
4. All bus stops [2,122] have well-
lit, universally accessible
shelters. (Baseline 2020:0)
BBMP 1-5
5 Women’s work trips.
28
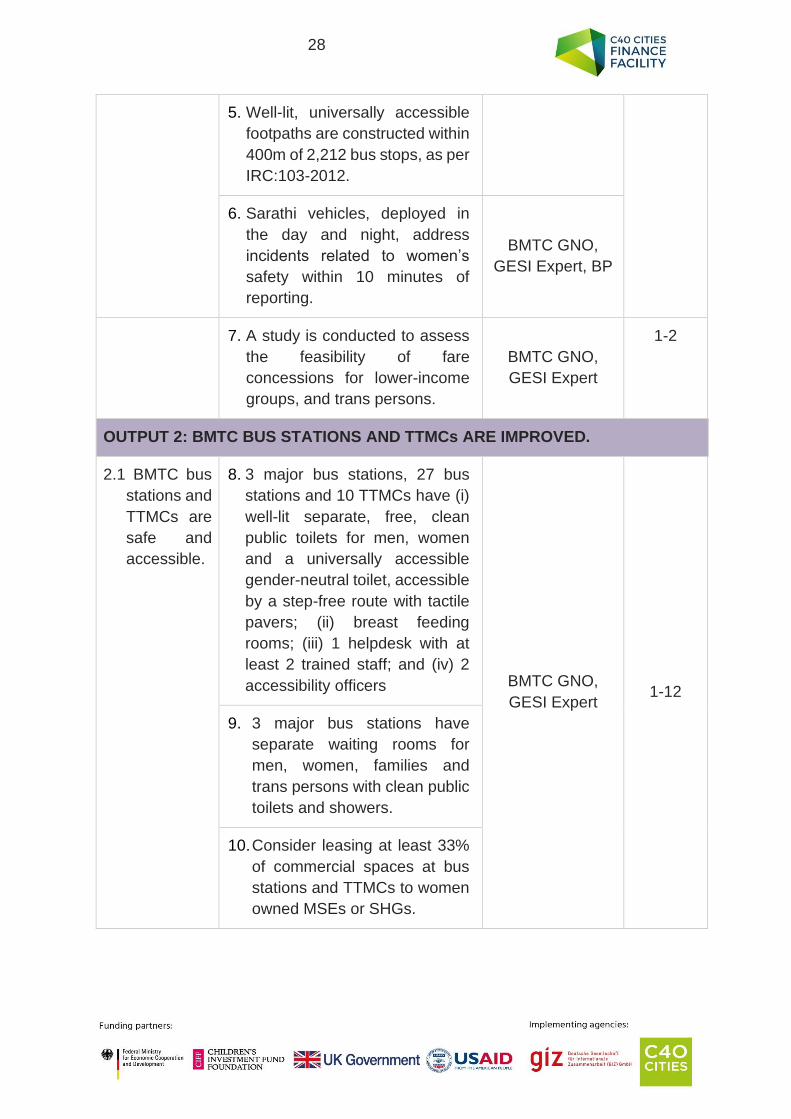
5. Well-lit, universally accessible
footpaths are constructed within
400m of 2,212 bus stops, as per
IRC:103-2012.
6. Sarathi vehicles, deployed in
the day and night, address
incidents related to women’s
safety within 10 minutes of
reporting.
BMTC GNO,
GESI Expert, BP
7. A study is conducted to assess
the feasibility of fare
concessions for lower-income
groups, and trans persons.
BMTC GNO,
GESI Expert
1-2
OUTPUT 2: BMTC BUS STATIONS AND TTMCs ARE IMPROVED.
2.1 BMTC bus
stations and
TTMCs are
safe and
accessible.
8. 3 major bus stations, 27 bus
stations and 10 TTMCs have (i)
well-lit separate, free, clean
public toilets for men, women
and a universally accessible
gender-neutral toilet, accessible
by a step-free route with tactile
pavers; (ii) breast feeding
rooms; (iii) 1 helpdesk with at
least 2 trained staff; and (iv) 2
accessibility officers BMTC GNO,
GESI Expert 1-12
9. 3 major bus stations have
separate waiting rooms for
men, women, families and
trans persons with clean public
toilets and showers.
10. Consider leasing at least 33%
of commercial spaces at bus
stations and TTMCs to women
owned MSEs or SHGs.
29
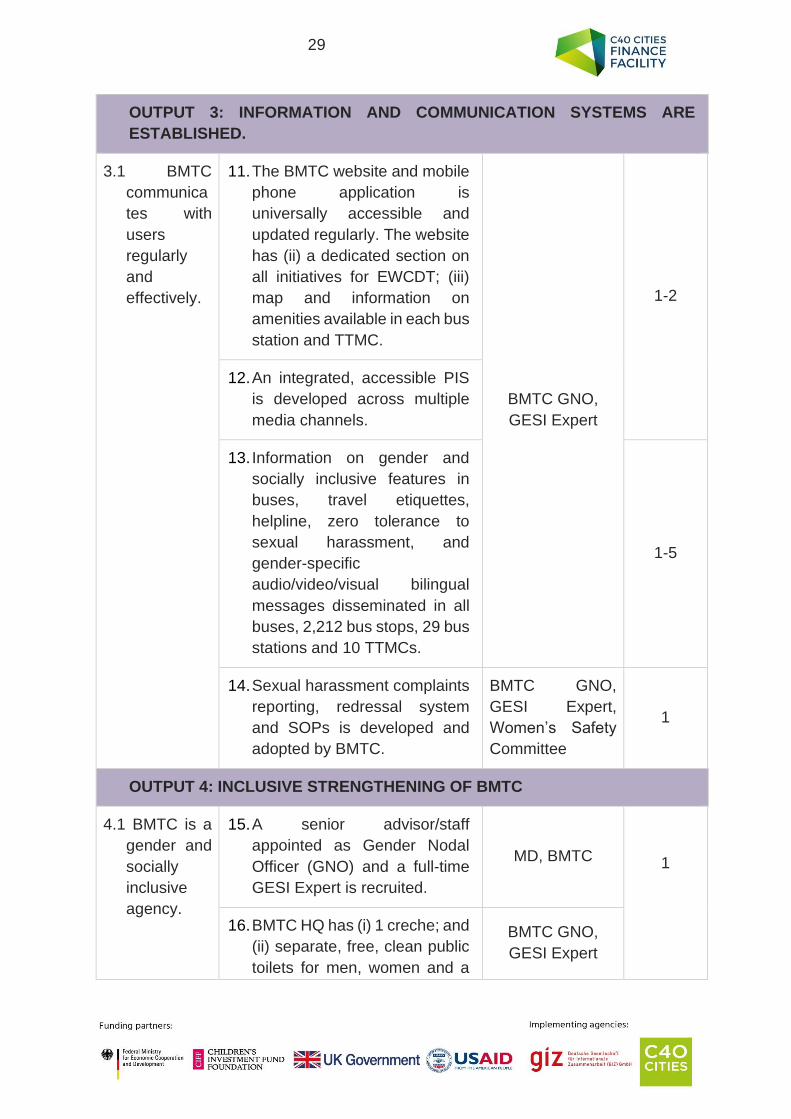
OUTPUT 3: INFORMATION AND COMMUNICATION SYSTEMS ARE
ESTABLISHED.
3.1 BMTC
communica
tes with
users
regularly
and
effectively.
11. The BMTC website and mobile
phone application is
universally accessible and
updated regularly. The website
has (ii) a dedicated section on
all initiatives for EWCDT; (iii)
map and information on
amenities available in each bus
station and TTMC.
BMTC GNO,
GESI Expert
1-2
12. An integrated, accessible PIS
is developed across multiple
media channels.
13. Information on gender and
socially inclusive features in
buses, travel etiquettes,
helpline, zero tolerance to
sexual harassment, and
gender-specific
audio/video/visual bilingual
messages disseminated in all
buses, 2,212 bus stops, 29 bus
stations and 10 TTMCs.
1-5
14. Sexual harassment complaints
reporting, redressal system
and SOPs is developed and
adopted by BMTC.
BMTC GNO,
GESI Expert,
Women’s Safety
Committee
1
OUTPUT 4: INCLUSIVE STRENGTHENING OF BMTC
4.1 BMTC is a
gender and
socially
inclusive
agency.
15. A senior advisor/staff
appointed as Gender Nodal
Officer (GNO) and a full-time
GESI Expert is recruited.
MD, BMTC 1
16. BMTC HQ has (i) 1 creche; and
(ii) separate, free, clean public
toilets for men, women and a
BMTC GNO,
GESI Expert
30
universally accessible gender-
neutral toilet, accessible by a
step-free route with tactile
pavers.
17. Women’s Safety and Access
Committee is constituted and
meets quarterly.
18. At least 33% of BMTC
personnel are women and
trans persons.
(Baseline 2020: 8.8%)
1-12
19. At least 33% of selection grade
and senior staff of Class-1
employees are women.
(Baseline 2020: 3 out of 31,
2020)
20. (i) At least 10% of all drivers
are women and trans persons;
(ii) At least 50% of conductors
are women. (Baseline 2020:
0.03%; 29.8%,)
21. At least 4% of personnel are
differently abled, as per Rights
of Persons with Disabilities Act,
2016. (Baseline 2020: 0.17%)
22. Annual sex-disaggregated
user satisfaction surveys are
conducted.
4.2 Develop
and
implement
GESI
training
modules
23. All BMTC staff receive annual
training on the anti-sexual
harassment policy and creating
a gender equitable
environment.
BMTC GNO,
GESI Expert
1-12
24. All BMTC bus drivers/driver-
cum-conductors, conductors
31
and depot managers receive
GESI training, during induction
and bi-annually.
25. 95% of staff responsible for
BMTC traffic, operations,
planning and infrastructure,
receive annual technical GESI
capacity development training.
32
7 IMPLEMENTATION NOTE
This implementation note provides elaborations and guidance on selected targets of the GESI AP.
7.1 Output 1: BMTC bus services and access are gender and socially inclusive
Activity 1.1: Access to BMTC bus stops, bus shelter design and vehicles are gender and socially inclusive
3. All buses have (i) reserved seats for care givers, women, elderly and PWD; and (ii) all standard buses have EWCD doors in the front and a space for a wheelchair/ stroller.
Currently, 16 seats are reserved for women, 6 seats for the elderly and 1 seat each near the front and rear doors for PWDs in all ordinary buses (BMTC 2013). Additionally, 2 seats are reserved for PWDs in the Vajra services. These should be retained in the non-AC standard buses and priority seats for care givers are also recommended. Since these seats are located towards the front of the bus, it is recommended that the front door be permitted only for elderly, women, children and persons with disabilities. The seat reservation in midi and standard AC buses may be considered based on the ridership.
4. All bus stops [2,122] have well-lit and universally accessible shelters. (Baseline:0, 2020)
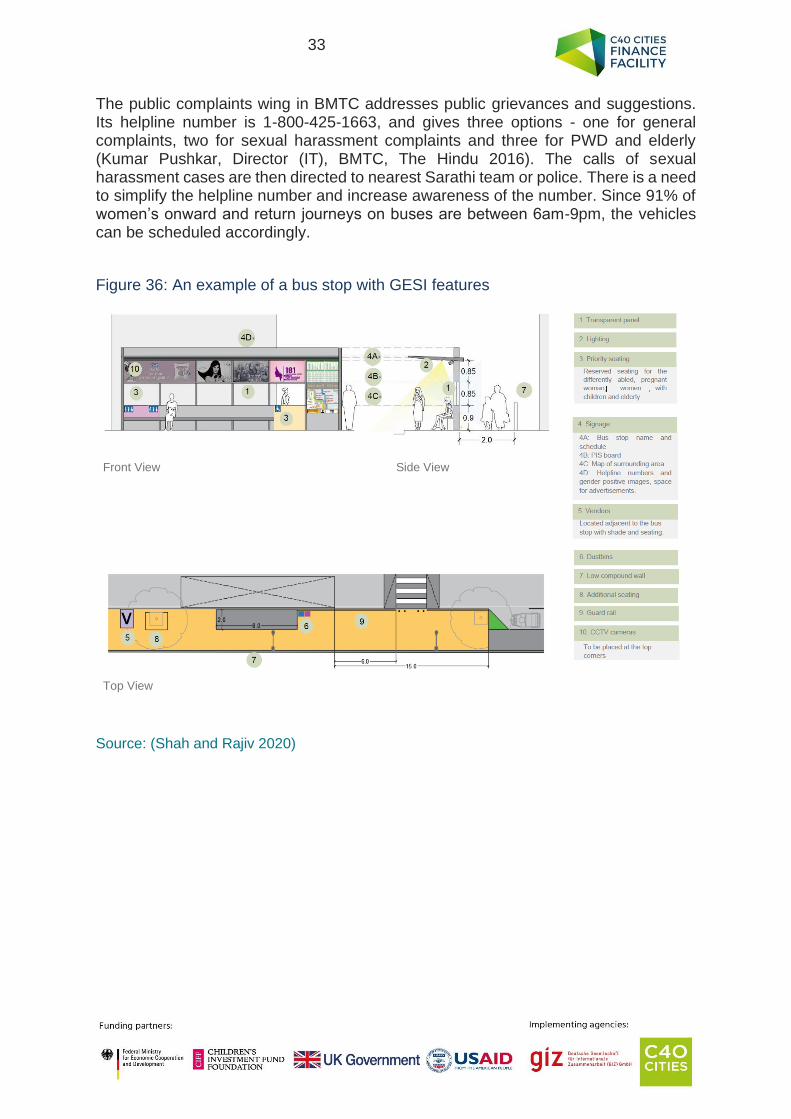
Currently, 45% (992) of bus stops in BBMP’s jurisdiction have shelters (BMTC 2017-18). All bus stops need to have shelters with at least 2m of walking width behind the bus stop. A bus stop should include the following GESI features (Figure 36). Since advertisements are not permitted in public spaces in Bangalore, the same space can be used for communicating public service messages highlighting achievements of women, trans persons and PWDs, conveying a zero tolerance to sexual harassment on streets, buses and IPT.
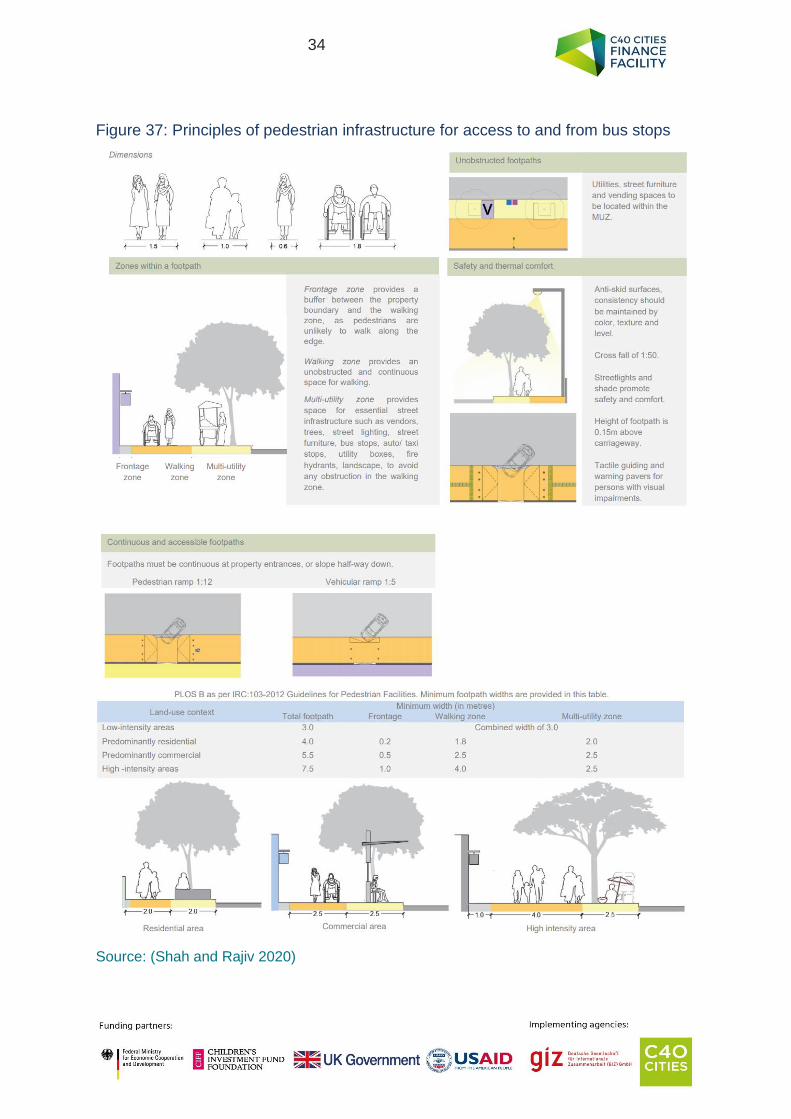
5. Well-lit, universally accessible footpaths are constructed within 400m of 2,212 bus stops, as per IRC:103-2012.
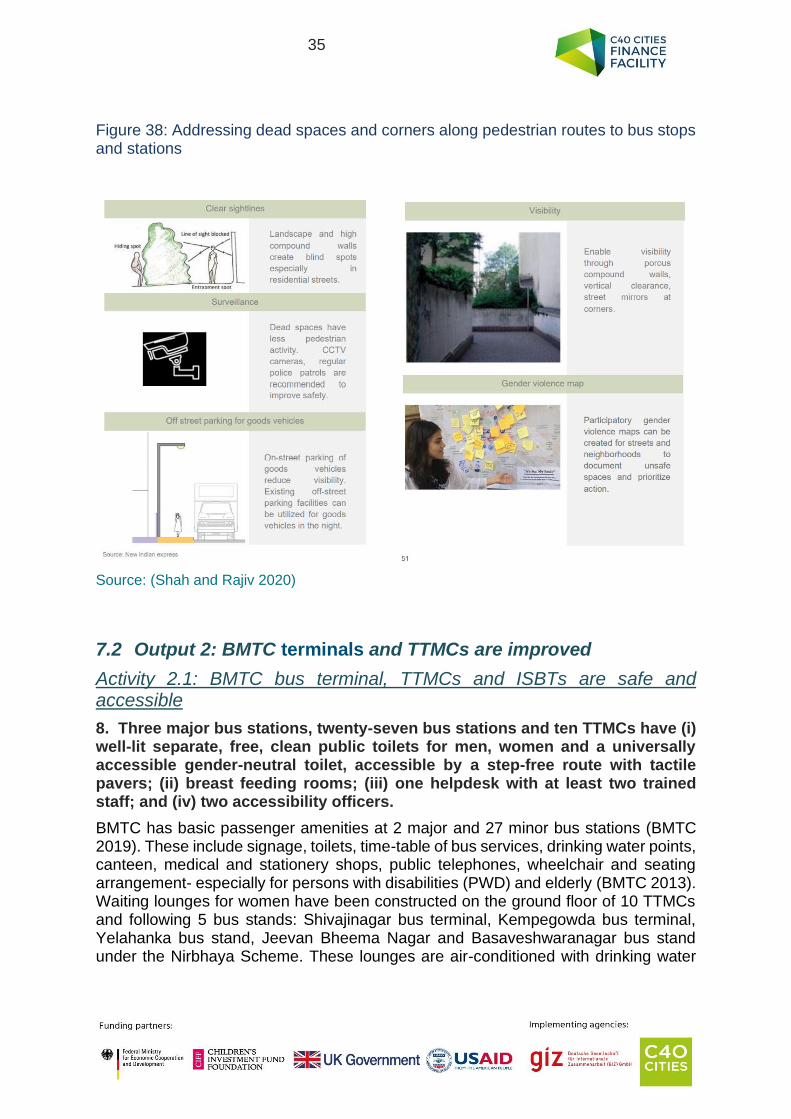
The footpaths should be designed considering the adjacent land uses and include a dead zone, uninterrupted walking zone and a multi-utility zone (Figure 37). Dark corners and dead spaces along streets, while accessing the bus stops or stations should be identified and addressed (Figure 38).
6. Sarathi vehicles, deployed in the day and night, address incidents related to women’s safety within 10 minutes of reporting.
33
The public complaints wing in BMTC addresses public grievances and suggestions. Its helpline number is 1-800-425-1663, and gives three options - one for general complaints, two for sexual harassment complaints and three for PWD and elderly (Kumar Pushkar, Director (IT), BMTC, The Hindu 2016). The calls of sexual harassment cases are then directed to nearest Sarathi team or police. There is a need to simplify the helpline number and increase awareness of the number. Since 91% of women’s onward and return journeys on buses are between 6am-9pm, the vehicles can be scheduled accordingly.
Figure 36: An example of a bus stop with GESI features
Front View Side View
Top View
Source: (Shah and Rajiv 2020)
34
Figure 37: Principles of pedestrian infrastructure for access to and from bus stops
Source: (Shah and Rajiv 2020)
35
Figure 38: Addressing dead spaces and corners along pedestrian routes to bus stops and stations
Source: (Shah and Rajiv 2020)
7.2 Output 2: BMTC terminals and TTMCs are improved
Activity 2.1: BMTC bus terminal, TTMCs and ISBTs are safe and accessible
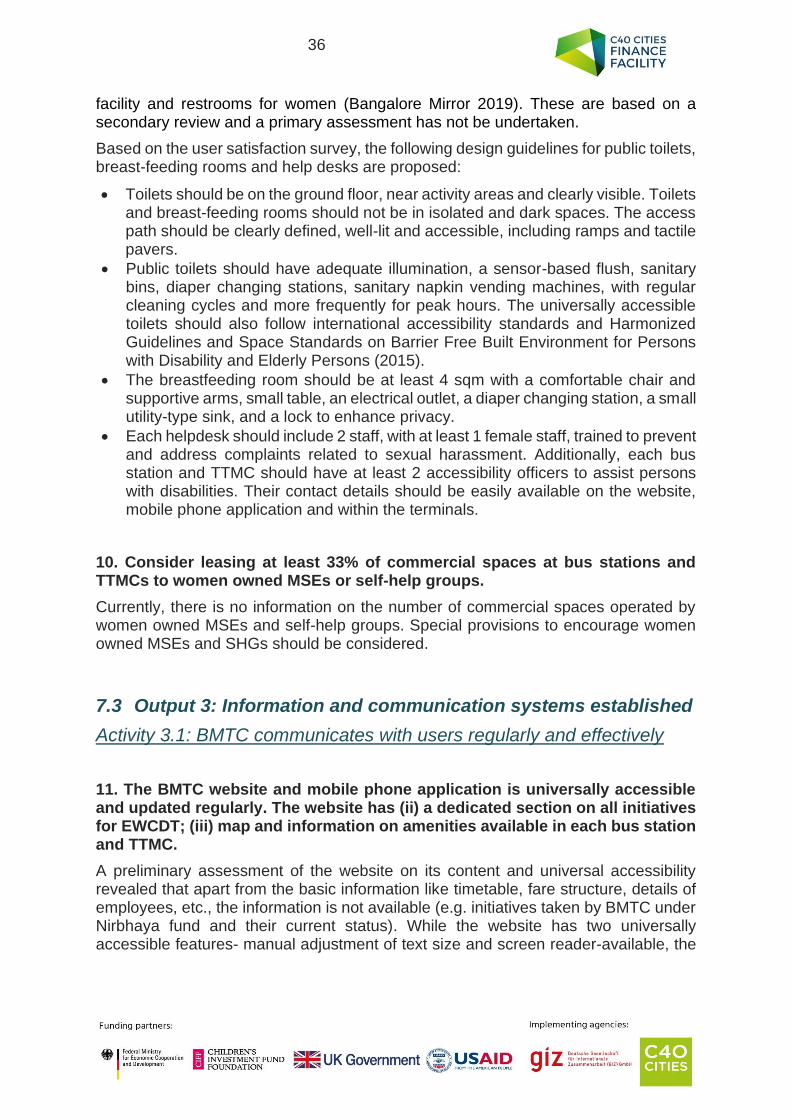
8. Three major bus stations, twenty-seven bus stations and ten TTMCs have (i) well-lit separate, free, clean public toilets for men, women and a universally accessible gender-neutral toilet, accessible by a step-free route with tactile pavers; (ii) breast feeding rooms; (iii) one helpdesk with at least two trained staff; and (iv) two accessibility officers.
BMTC has basic passenger amenities at 2 major and 27 minor bus stations (BMTC 2019). These include signage, toilets, time-table of bus services, drinking water points, canteen, medical and stationery shops, public telephones, wheelchair and seating arrangement- especially for persons with disabilities (PWD) and elderly (BMTC 2013). Waiting lounges for women have been constructed on the ground floor of 10 TTMCs and following 5 bus stands: Shivajinagar bus terminal, Kempegowda bus terminal, Yelahanka bus stand, Jeevan Bheema Nagar and Basaveshwaranagar bus stand under the Nirbhaya Scheme. These lounges are air-conditioned with drinking water
36
facility and restrooms for women (Bangalore Mirror 2019). These are based on a secondary review and a primary assessment has not be undertaken.
Based on the user satisfaction survey, the following design guidelines for public toilets, breast-feeding rooms and help desks are proposed:
• Toilets should be on the ground floor, near activity areas and clearly visible. Toilets and breast-feeding rooms should not be in isolated and dark spaces. The access path should be clearly defined, well-lit and accessible, including ramps and tactile pavers.
• Public toilets should have adequate illumination, a sensor-based flush, sanitary bins, diaper changing stations, sanitary napkin vending machines, with regular cleaning cycles and more frequently for peak hours. The universally accessible toilets should also follow international accessibility standards and Harmonized Guidelines and Space Standards on Barrier Free Built Environment for Persons with Disability and Elderly Persons (2015).
• The breastfeeding room should be at least 4 sqm with a comfortable chair and supportive arms, small table, an electrical outlet, a diaper changing station, a small utility-type sink, and a lock to enhance privacy.
• Each helpdesk should include 2 staff, with at least 1 female staff, trained to prevent and address complaints related to sexual harassment. Additionally, each bus station and TTMC should have at least 2 accessibility officers to assist persons with disabilities. Their contact details should be easily available on the website, mobile phone application and within the terminals.
10. Consider leasing at least 33% of commercial spaces at bus stations and TTMCs to women owned MSEs or self-help groups.
Currently, there is no information on the number of commercial spaces operated by women owned MSEs and self-help groups. Special provisions to encourage women owned MSEs and SHGs should be considered.
7.3 Output 3: Information and communication systems established
Activity 3.1: BMTC communicates with users regularly and effectively
11. The BMTC website and mobile phone application is universally accessible and updated regularly. The website has (ii) a dedicated section on all initiatives for EWCDT; (iii) map and information on amenities available in each bus station and TTMC.
A preliminary assessment of the website on its content and universal accessibility revealed that apart from the basic information like timetable, fare structure, details of employees, etc., the information is not available (e.g. initiatives taken by BMTC under Nirbhaya fund and their current status). While the website has two universally accessible features- manual adjustment of text size and screen reader-available, the
37
mobile phone application is not accessible at all (2020). Also, the data available on the website in the form of reports and presentations are not universally accessible.
The mobile phone application and website should be modified as per W3C’s Web Content Accessibility Guidelines (WCAG) 2.0 and Guidelines for Indian Government Websites (Version 2.0) by Ministry of Electronics & Information Technology, India. Some of the accessible features include manual text size, text alternatives for any non-text content like pictures and videos, colour contrast, avoid screen flickering and blinking, audio recording for the available content, and inbuilt screen reader software.
12. An integrated, accessible PIS is developed across multiple media channels.
The need for real-time information and update on service disruption is underscored in the user survey. The integrated PIS should provide arrival times and update on any disruption in services at bus stops, stations and TTMCs, and digital platforms, including website, mobile phone application and other social media platforms (e.g. Twitter, Facebook). It will allow all users to plan their journey accordingly.
7.4 Output 4: Inclusive strengthening of BMTC
Activity 4.1: BMTC is gender and socially inclusive agency
15. A senior advisor/staff is appointed as the Gender Nodal Officer and a full-time GESI Expert recruited.
The Gender Nodal Officer (GNO) will be responsible for overseeing the implementation of the GESI AP and will report progress to the MD and the Board of Directors. A senior officer is recommended to ensure buy-in and compliance from different departments.
The GESI Expert will support the GNO in implementing the GESI AP. The following are the roles and responsibilities of GESI Expert:
• Develop a GESI vision and human resource policies in BMTC;
• Create sexual harassment reporting, redressal system and SOPs;
• Review the design of all infrastructure and audio/video/visual messages for increasing awareness on socially inclusive features in buses, travel etiquettes, helpline number, zero tolerance to sexual harassment;
• Create modules for gender sensitization training of BMTC staff, frontline staff and capacity development training of technical staff;
• Coordinate with all departments in BMTC for the implementation of the GESI AP;
• Provide monthly and quarterly updates to the GNO on the implementation progress of the GESI AP.
17. Women’s Safety and Access Committee is constituted and meets monthly.
BMTC has constituted a Passengers’ Security Committee/ Women’s Safety Committee under Director, Security and Vigilance of BMTC, with women officers from
38
BMTC, Police and representatives from various NGOs and commuter forums like the Bengaluru Bus Prayaanikara Vedike (BBPV) (Bhatt, Menon and Khan 2015). The user survey revealed low awareness of the committee, and the website does not include any information on the committee.
It is recommended that the committee be revived and advise BMTC on implementing the GESI AP. It should include BBPV, at least 30% representation from non-government organizations, and 50% women, along with trans persons and persons with disabilities. The activities and initiatives of the committee should be regularly updated on multiple media channels.
18. At least 33% of BMTC personnel are women and trans persons. (Baseline: 8.8%, 2020)
The overall employment of women in BMTC is 8.8% as compared to the required 33% as per Karnataka Civil Services Rules, 1977. Women’s recruitment should be encouraged in civil, mechanical engineering, traffic and mechanics departments, as these have a low representation of women (15-19%). Priority should be given to women and trans persons when filling vacancies.
19. At least 33% of selection grade and senior staff of Class-1 employees are women. (Baseline 2020: 3 of 31)
As per data provided by BMTC, the representation of women in decision-making levels is low. Women constitute only 3 of 31 Class-1 employees, and that too at the junior level. To increase women’s representation in decision-making positions within BMTC, it is recommended that at least 33% of employees at selection grade and senior level be women.
20. At least 10% of all drivers are women and trans persons; (ii) At least 50% of conductors are women.
As per data provided by BMTC, it currently has 0 female drivers (out of 12,380) and 1,507 (30%) female conductors. There are 1,287 vacancies for drivers. As BMTC increases its fleet to 15,000 buses, it will need to recruit new drivers and conductors (or include it in service contracts), creating an opportunity to increase the representation of women and trans persons.
22. Annual sex-disaggregated user satisfaction surveys are conducted.
Annual sex-disaggregated surveys are recommended to monitor performance of bus services. The data should be collected and reported by sex and age. Focus group discussions should be conducted with persons with disabilities and trans persons as they may be under-represented in primary surveys.
39
Activity 4.2: Develop and implement GESI training modules
23. All BMTC staff receive annual training on the anti-sexual harassment policy and creating a gender equitable environment.
The annual trainings will increase awareness on the anti-sexual harassment policy, types of sexual harassment, sexual harassment at the workplace and standard operating procedures of the policy. It should also include trainings on gender roles/ stereotypes, language, terminologies, conscious and unconscious gender bias. Training needs assessments can be conducted before and short tests can be administered after to assess concept retention and understanding.
24. All BMTC bus drivers, driver-cum-conductors, conductors and depot managers receive GESI training, during induction and bi-annually.
This training will enable frontline staff in BMTC buses to address and prevent instances of sexual harassment. These trainings should include tests and role-play exercises for retention and practical application. The trainings can broadly include the following:
• Concept of gender, gender stereotypes pertaining to women, trans persons, PWDs and the challenges faced by them while commuting;
• Understanding and identifying types of sexual harassment, SOPs for different situations including intervening in a non-confrontational manner;
• Types of disabilities and how to assist and behave with PWDs.
25. 95% of staff responsible for BMTC traffic, operations, planning and infrastructure, receive annual GESI technical capacity development training.
The focus of this technical training will be to understand EWCDT travel behaviour and how BMTC service planning, design and maintenance can address these.
Table 9: Illustrative content of capacity development trainings
Themes Broad content of capacity developments trainings
Services and planning How to make route planning and public transport operations gender
and socially inclusive.
Infrastructure Accessible and inclusive physical infrastructure within a bus station,
public amenities like toilets, nursing rooms etc.
Websites and signage
systems
Accessibility needs of PWDs, knowledge of W3C’s Web Content
Accessibility Guidelines (WCAG) 2.0 and Guidelines for Indian
Government Websites (Version 2.0); signage systems in bus
stations.
Data collection,
analysis and reporting
Inclusive survey design, data analysis and reporting; facilitating
focus group discussions and other qualitative assessments.
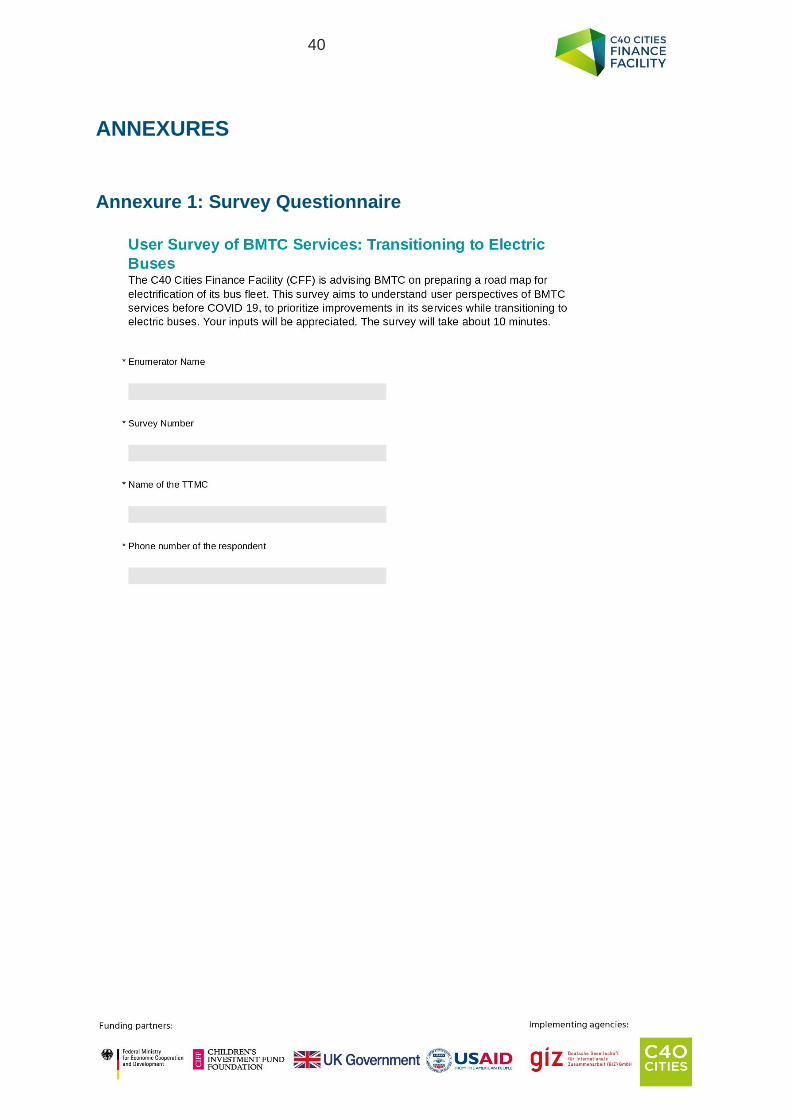
40
ANNEXURES
Annexure 1: Survey Questionnaire
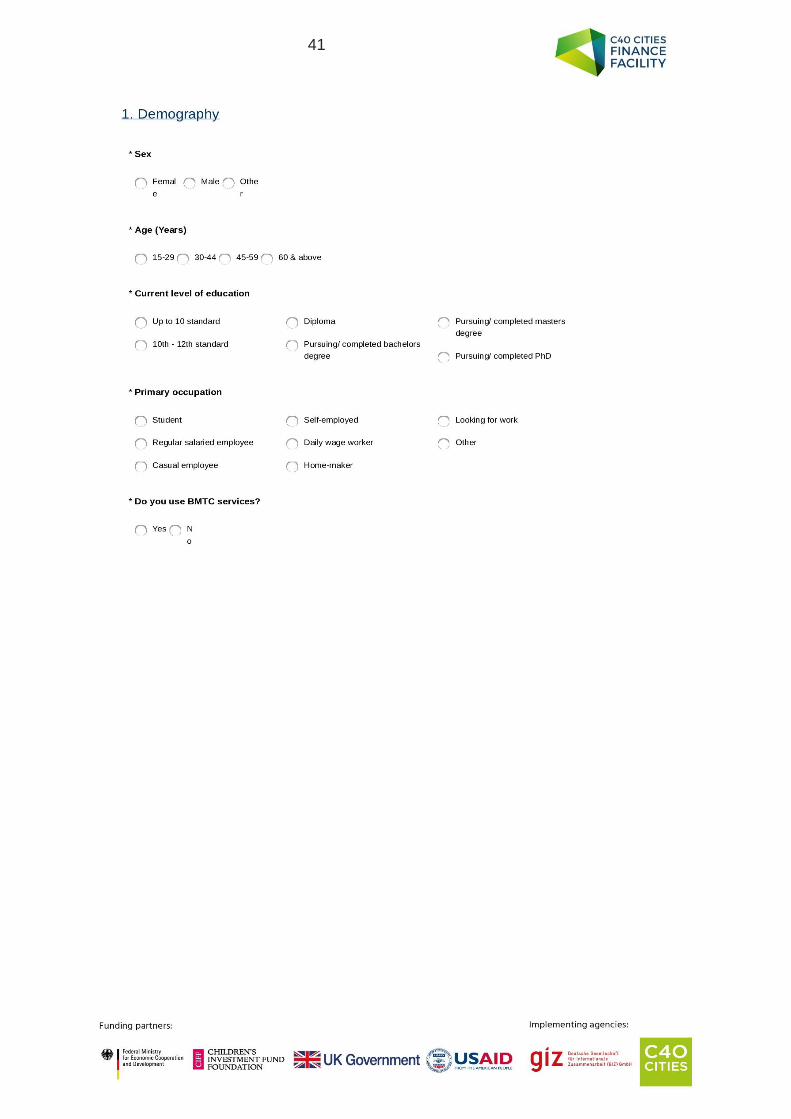
41
42
43
44
45
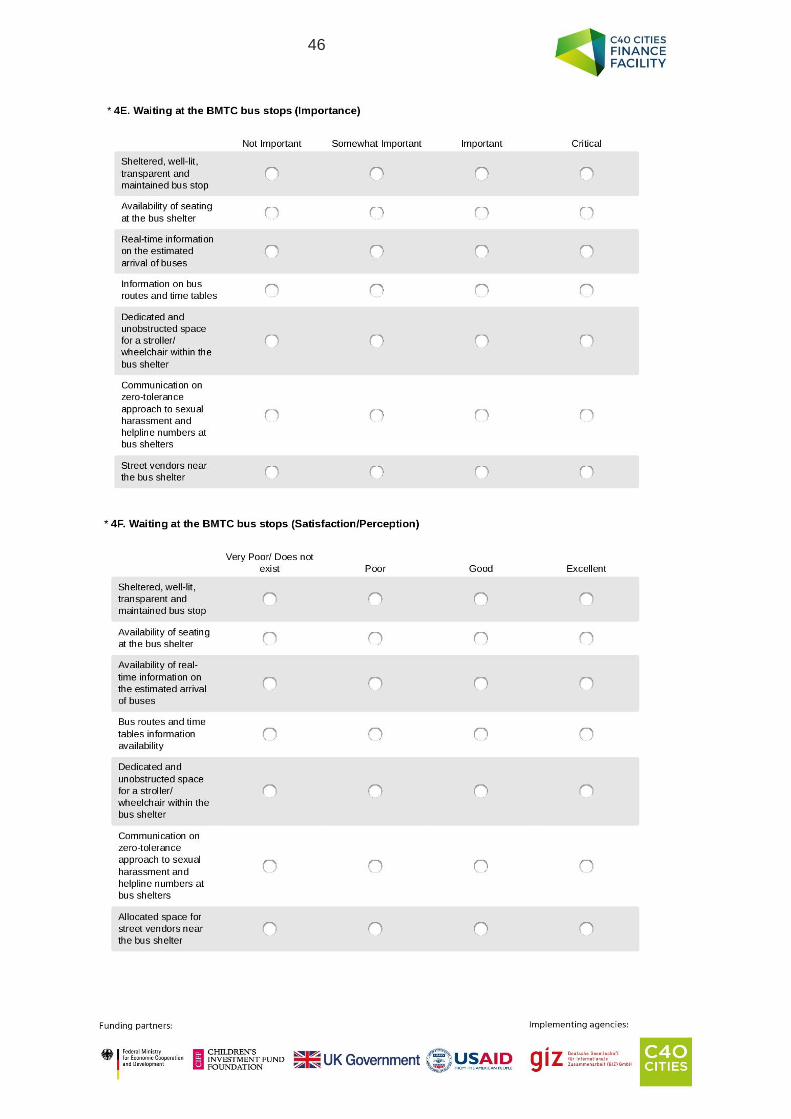
46
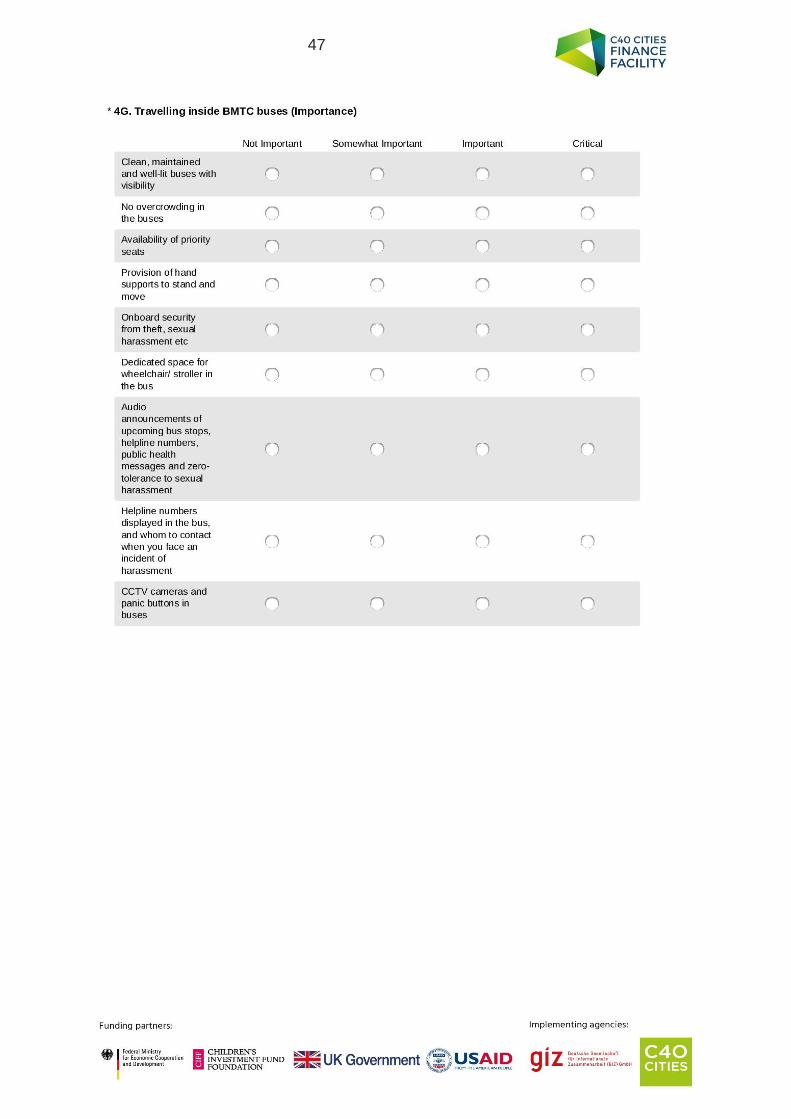
47
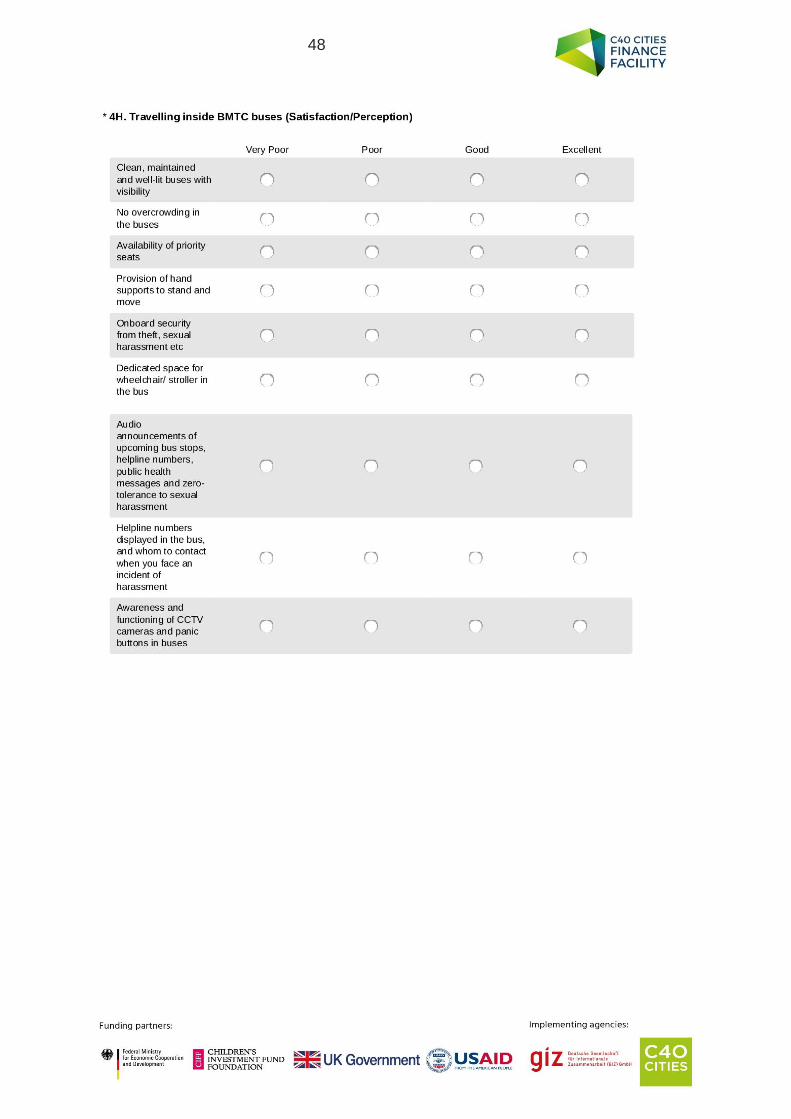
48
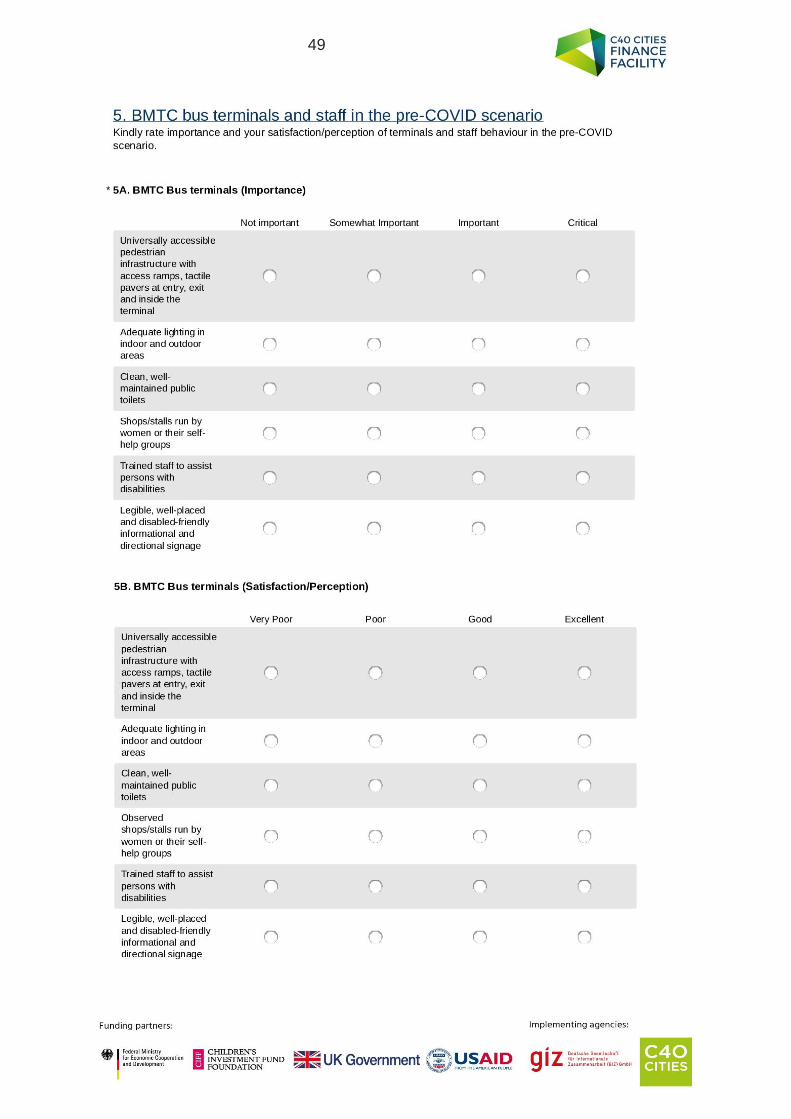
49
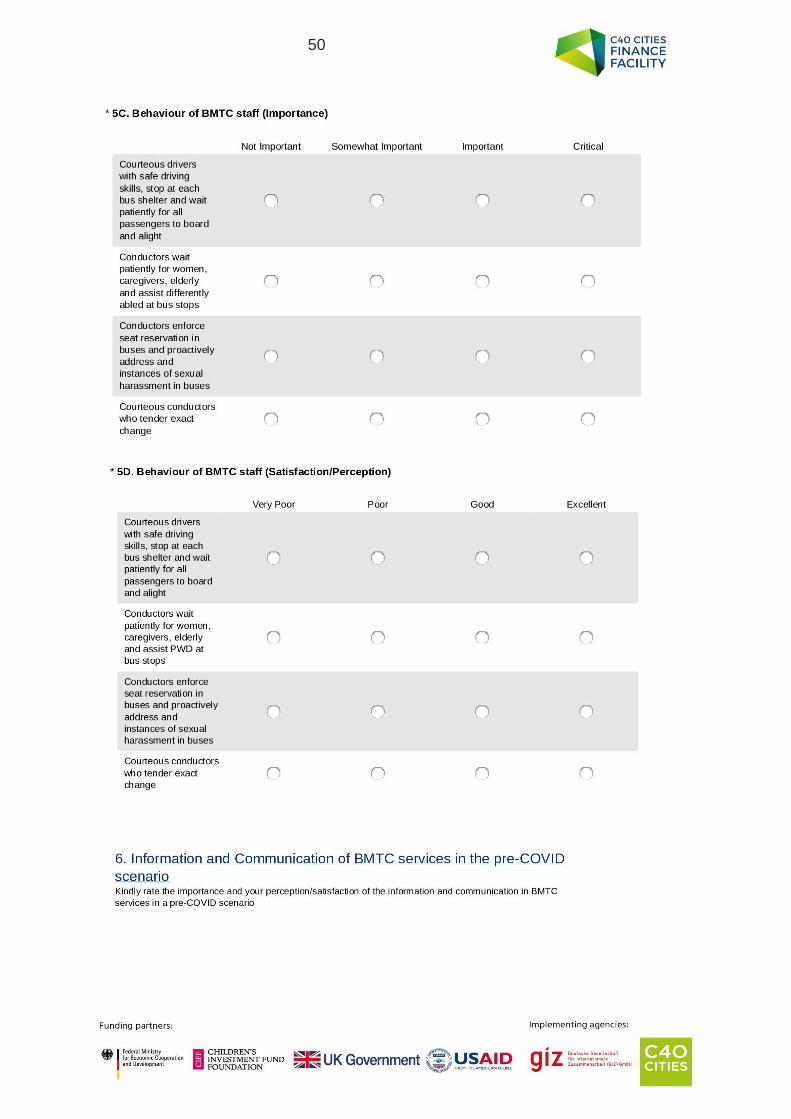
50
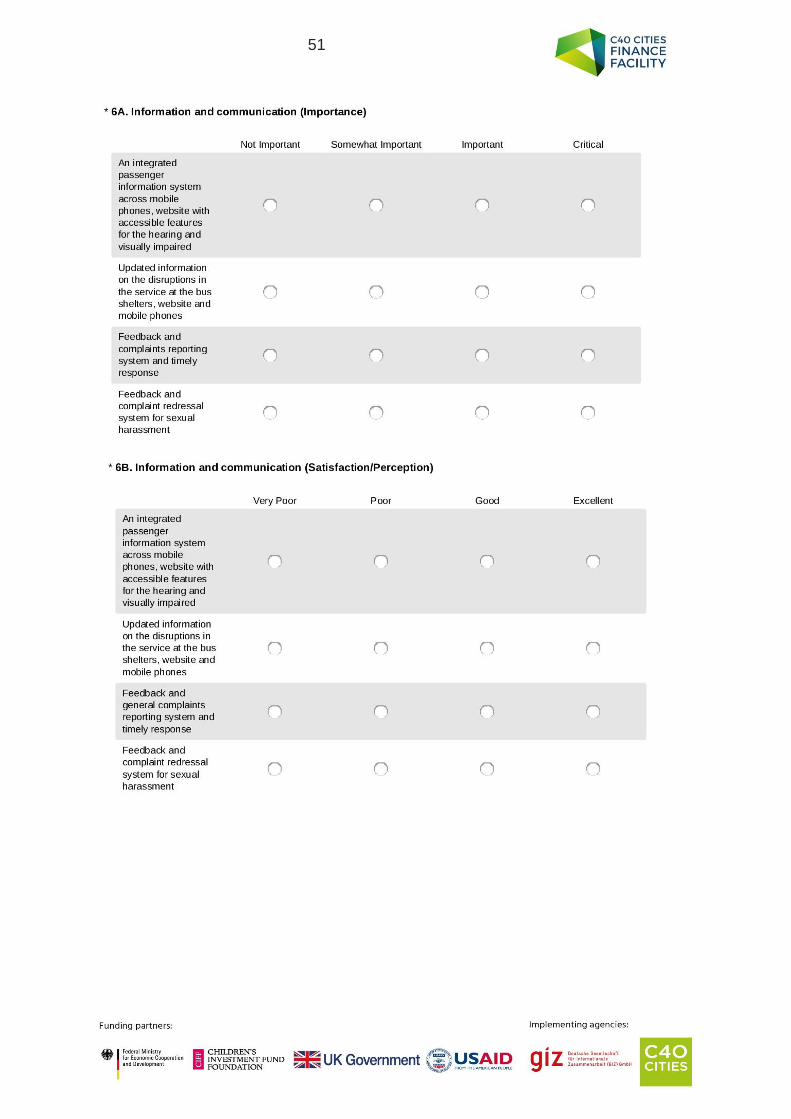
51
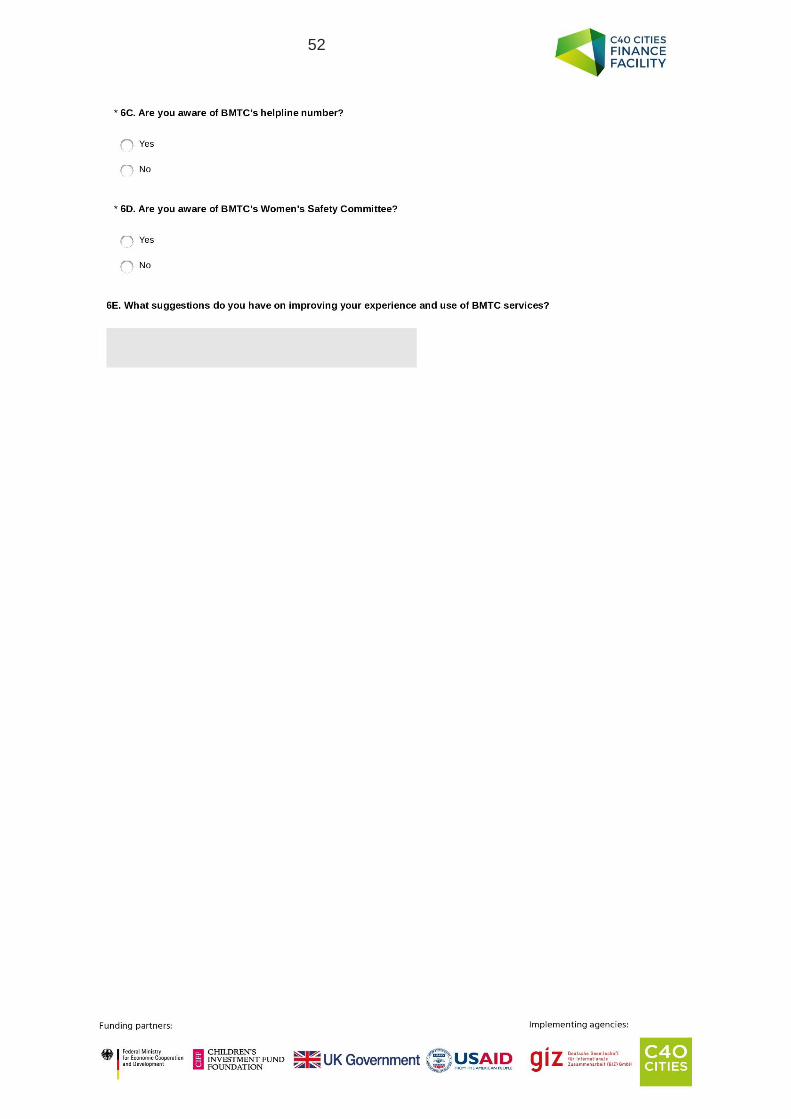
52
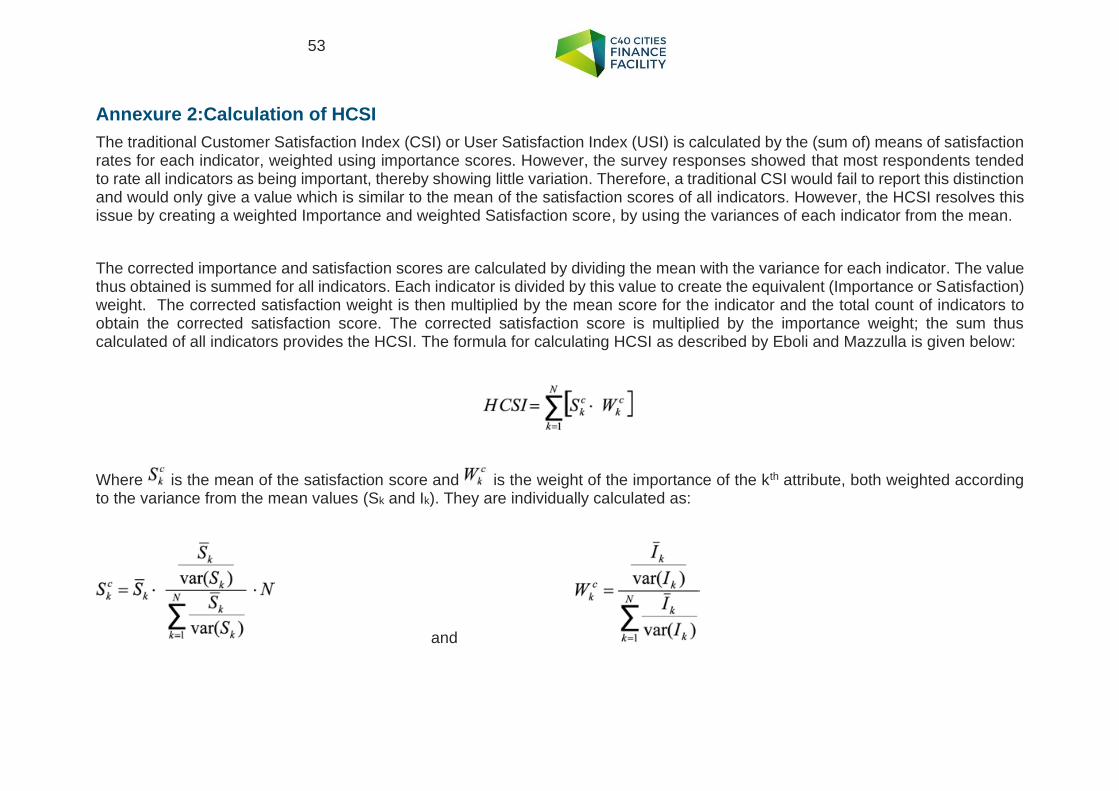
53
Annexure 2:Calculation of HCSI
The traditional Customer Satisfaction Index (CSI) or User Satisfaction Index (USI) is calculated by the (sum of) means of satisfaction rates for each indicator, weighted using importance scores. However, the survey responses showed that most respondents tended to rate all indicators as being important, thereby showing little variation. Therefore, a traditional CSI would fail to report this distinction and would only give a value which is similar to the mean of the satisfaction scores of all indicators. However, the HCSI resolves this issue by creating a weighted Importance and weighted Satisfaction score, by using the variances of each indicator from the mean.
The corrected importance and satisfaction scores are calculated by dividing the mean with the variance for each indicator. The value thus obtained is summed for all indicators. Each indicator is divided by this value to create the equivalent (Importance or Satisfaction) weight. The corrected satisfaction weight is then multiplied by the mean score for the indicator and the total count of indicators to obtain the corrected satisfaction score. The corrected satisfaction score is multiplied by the importance weight; the sum thus calculated of all indicators provides the HCSI. The formula for calculating HCSI as described by Eboli and Mazzulla is given below:
Where is the mean of the satisfaction score and is the weight of the importance of the kth attribute, both weighted according to the variance from the mean values (Sk and Ik). They are individually calculated as:
and
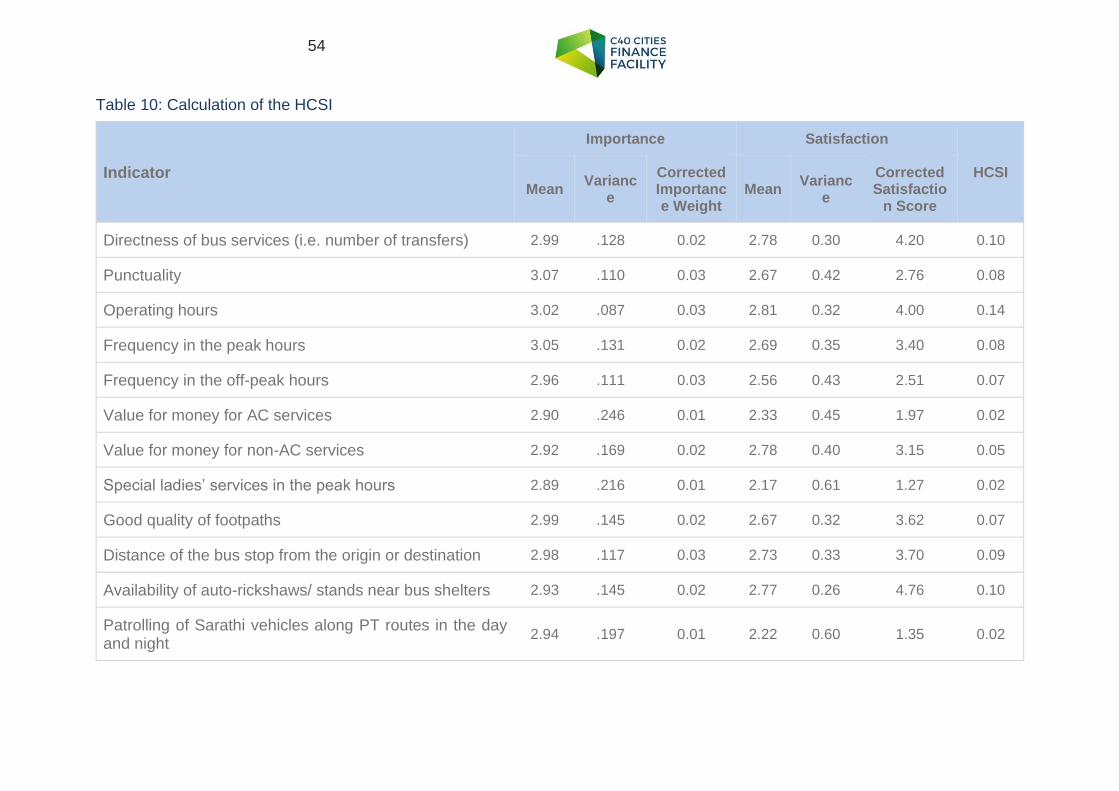
54
Table 10: Calculation of the HCSI
Indicator
Importance Satisfaction
HCSI Mean
Variance
Corrected Importance Weight
Mean Varianc
e
Corrected Satisfactio
n Score
Directness of bus services (i.e. number of transfers) 2.99 .128 0.02 2.78 0.30 4.20 0.10
Punctuality 3.07 .110 0.03 2.67 0.42 2.76 0.08
Operating hours 3.02 .087 0.03 2.81 0.32 4.00 0.14
Frequency in the peak hours 3.05 .131 0.02 2.69 0.35 3.40 0.08
Frequency in the off-peak hours 2.96 .111 0.03 2.56 0.43 2.51 0.07
Value for money for AC services 2.90 .246 0.01 2.33 0.45 1.97 0.02
Value for money for non-AC services 2.92 .169 0.02 2.78 0.40 3.15 0.05
Special ladies’ services in the peak hours 2.89 .216 0.01 2.17 0.61 1.27 0.02
Good quality of footpaths 2.99 .145 0.02 2.67 0.32 3.62 0.07
Distance of the bus stop from the origin or destination 2.98 .117 0.03 2.73 0.33 3.70 0.09
Availability of auto-rickshaws/ stands near bus shelters 2.93 .145 0.02 2.77 0.26 4.76 0.10
Patrolling of Sarathi vehicles along PT routes in the day and night
2.94 .197 0.01 2.22 0.60 1.35 0.02
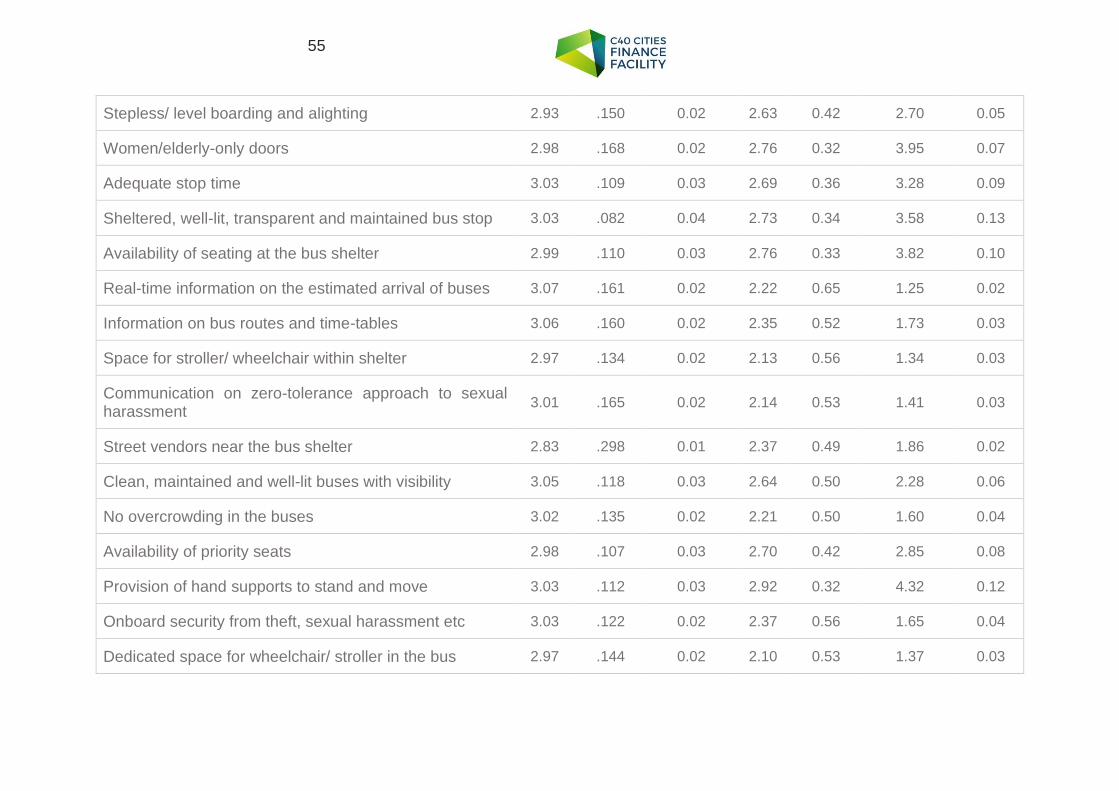
55
Stepless/ level boarding and alighting 2.93 .150 0.02 2.63 0.42 2.70 0.05
Women/elderly-only doors 2.98 .168 0.02 2.76 0.32 3.95 0.07
Adequate stop time 3.03 .109 0.03 2.69 0.36 3.28 0.09
Sheltered, well-lit, transparent and maintained bus stop 3.03 .082 0.04 2.73 0.34 3.58 0.13
Availability of seating at the bus shelter 2.99 .110 0.03 2.76 0.33 3.82 0.10
Real-time information on the estimated arrival of buses 3.07 .161 0.02 2.22 0.65 1.25 0.02
Information on bus routes and time-tables 3.06 .160 0.02 2.35 0.52 1.73 0.03
Space for stroller/ wheelchair within shelter 2.97 .134 0.02 2.13 0.56 1.34 0.03
Communication on zero-tolerance approach to sexual harassment
3.01 .165 0.02 2.14 0.53 1.41 0.03
Street vendors near the bus shelter 2.83 .298 0.01 2.37 0.49 1.86 0.02
Clean, maintained and well-lit buses with visibility 3.05 .118 0.03 2.64 0.50 2.28 0.06
No overcrowding in the buses 3.02 .135 0.02 2.21 0.50 1.60 0.04
Availability of priority seats 2.98 .107 0.03 2.70 0.42 2.85 0.08
Provision of hand supports to stand and move 3.03 .112 0.03 2.92 0.32 4.32 0.12
Onboard security from theft, sexual harassment etc 3.03 .122 0.02 2.37 0.56 1.65 0.04
Dedicated space for wheelchair/ stroller in the bus 2.97 .144 0.02 2.10 0.53 1.37 0.03
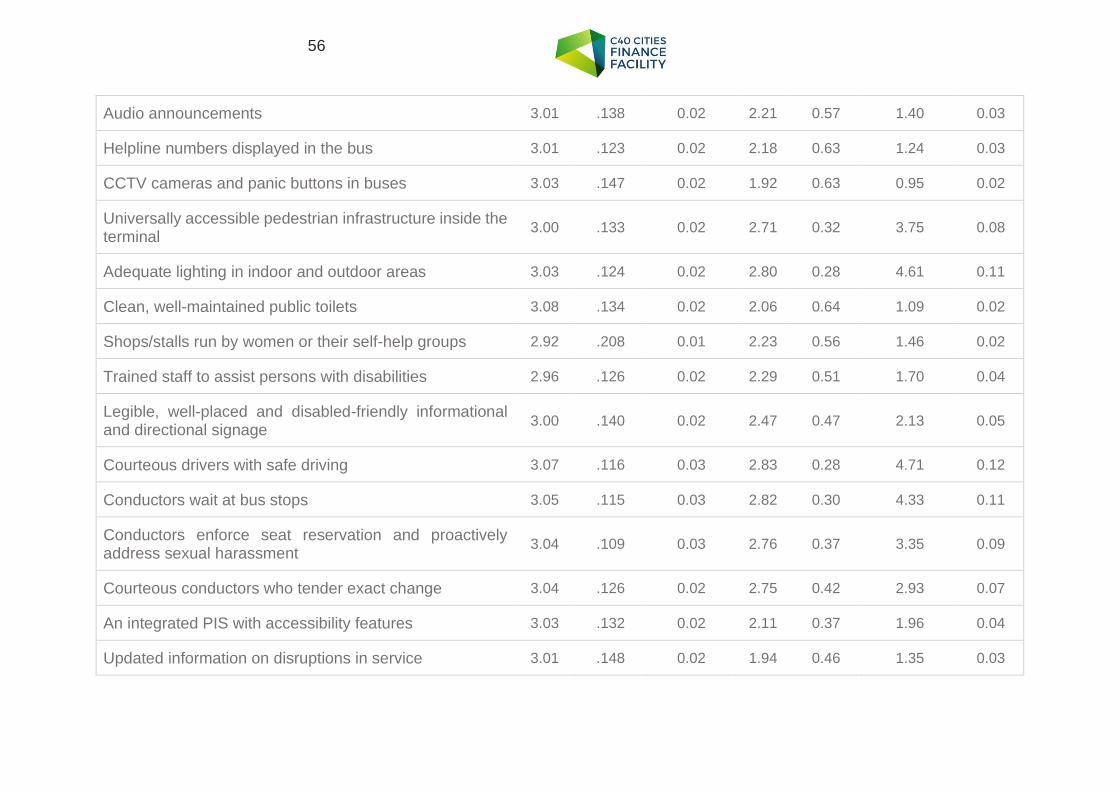
56
Audio announcements 3.01 .138 0.02 2.21 0.57 1.40 0.03
Helpline numbers displayed in the bus 3.01 .123 0.02 2.18 0.63 1.24 0.03
CCTV cameras and panic buttons in buses 3.03 .147 0.02 1.92 0.63 0.95 0.02
Universally accessible pedestrian infrastructure inside the terminal
3.00 .133 0.02 2.71 0.32 3.75 0.08
Adequate lighting in indoor and outdoor areas 3.03 .124 0.02 2.80 0.28 4.61 0.11
Clean, well-maintained public toilets 3.08 .134 0.02 2.06 0.64 1.09 0.02
Shops/stalls run by women or their self-help groups 2.92 .208 0.01 2.23 0.56 1.46 0.02
Trained staff to assist persons with disabilities 2.96 .126 0.02 2.29 0.51 1.70 0.04
Legible, well-placed and disabled-friendly informational and directional signage
3.00 .140 0.02 2.47 0.47 2.13 0.05
Courteous drivers with safe driving 3.07 .116 0.03 2.83 0.28 4.71 0.12
Conductors wait at bus stops 3.05 .115 0.03 2.82 0.30 4.33 0.11
Conductors enforce seat reservation and proactively address sexual harassment
3.04 .109 0.03 2.76 0.37 3.35 0.09
Courteous conductors who tender exact change 3.04 .126 0.02 2.75 0.42 2.93 0.07
An integrated PIS with accessibility features 3.03 .132 0.02 2.11 0.37 1.96 0.04
Updated information on disruptions in service 3.01 .148 0.02 1.94 0.46 1.35 0.03
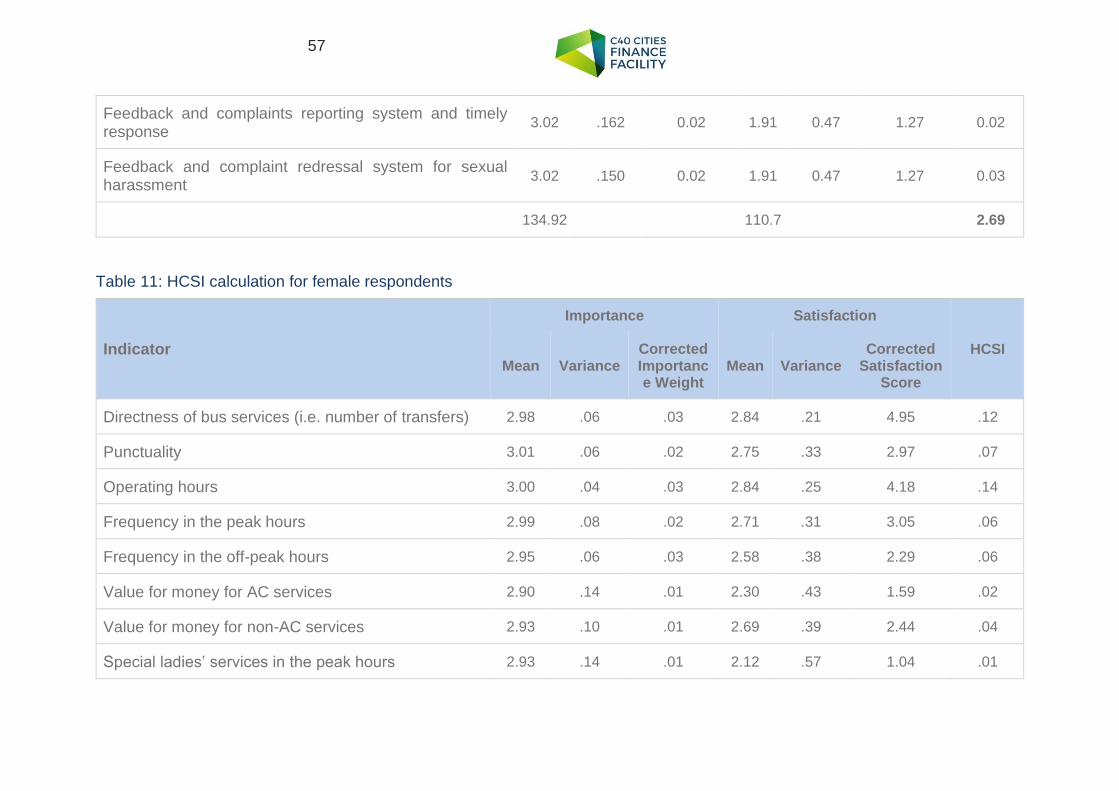
57
Feedback and complaints reporting system and timely response
3.02 .162 0.02 1.91 0.47 1.27 0.02
Feedback and complaint redressal system for sexual harassment
3.02 .150 0.02 1.91 0.47 1.27 0.03
134.92 110.7 2.69
Table 11: HCSI calculation for female respondents
Indicator
Importance Satisfaction
HCSI Mean Variance
Corrected Importance Weight
Mean Variance Corrected
Satisfaction Score
Directness of bus services (i.e. number of transfers) 2.98 .06 .03 2.84 .21 4.95 .12
Punctuality 3.01 .06 .02 2.75 .33 2.97 .07
Operating hours 3.00 .04 .03 2.84 .25 4.18 .14
Frequency in the peak hours 2.99 .08 .02 2.71 .31 3.05 .06
Frequency in the off-peak hours 2.95 .06 .03 2.58 .38 2.29 .06
Value for money for AC services 2.90 .14 .01 2.30 .43 1.59 .02
Value for money for non-AC services 2.93 .10 .01 2.69 .39 2.44 .04
Special ladies’ services in the peak hours 2.93 .14 .01 2.12 .57 1.04 .01
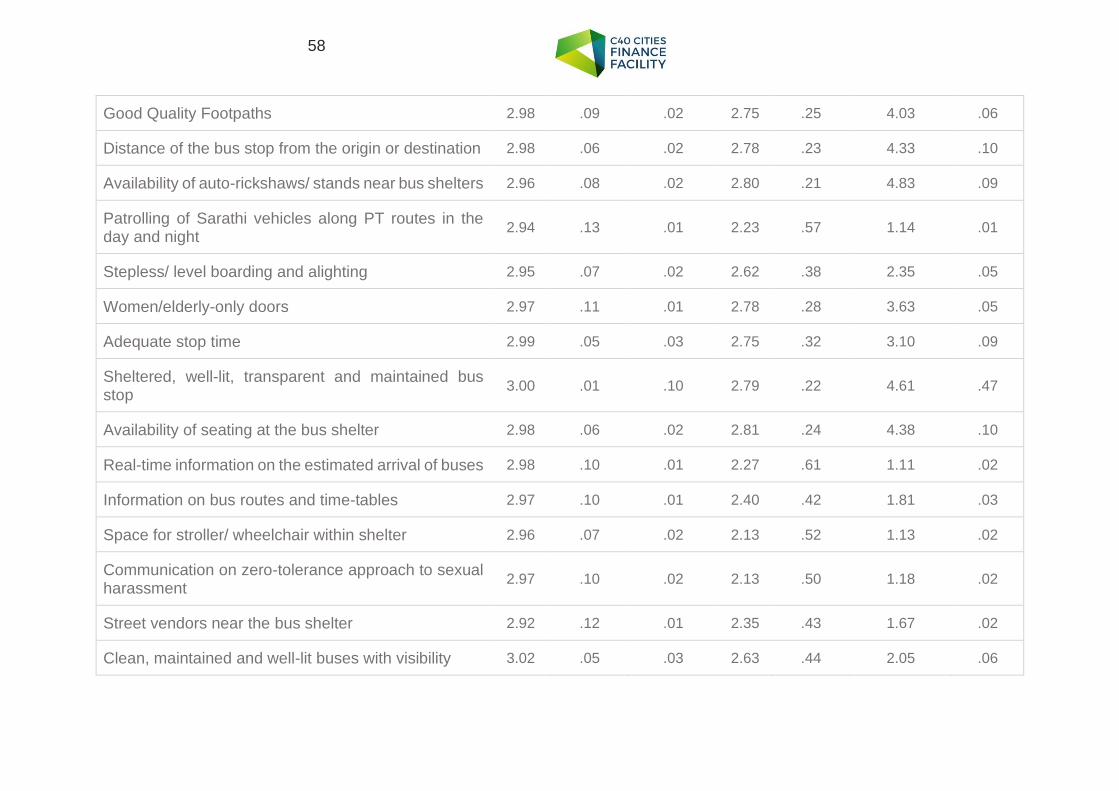
58
Good Quality Footpaths 2.98 .09 .02 2.75 .25 4.03 .06
Distance of the bus stop from the origin or destination 2.98 .06 .02 2.78 .23 4.33 .10
Availability of auto-rickshaws/ stands near bus shelters 2.96 .08 .02 2.80 .21 4.83 .09
Patrolling of Sarathi vehicles along PT routes in the day and night
2.94 .13 .01 2.23 .57 1.14 .01
Stepless/ level boarding and alighting 2.95 .07 .02 2.62 .38 2.35 .05
Women/elderly-only doors 2.97 .11 .01 2.78 .28 3.63 .05
Adequate stop time 2.99 .05 .03 2.75 .32 3.10 .09
Sheltered, well-lit, transparent and maintained bus stop
3.00 .01 .10 2.79 .22 4.61 .47
Availability of seating at the bus shelter 2.98 .06 .02 2.81 .24 4.38 .10
Real-time information on the estimated arrival of buses 2.98 .10 .01 2.27 .61 1.11 .02
Information on bus routes and time-tables 2.97 .10 .01 2.40 .42 1.81 .03
Space for stroller/ wheelchair within shelter 2.96 .07 .02 2.13 .52 1.13 .02
Communication on zero-tolerance approach to sexual harassment
2.97 .10 .02 2.13 .50 1.18 .02
Street vendors near the bus shelter 2.92 .12 .01 2.35 .43 1.67 .02
Clean, maintained and well-lit buses with visibility 3.02 .05 .03 2.63 .44 2.05 .06
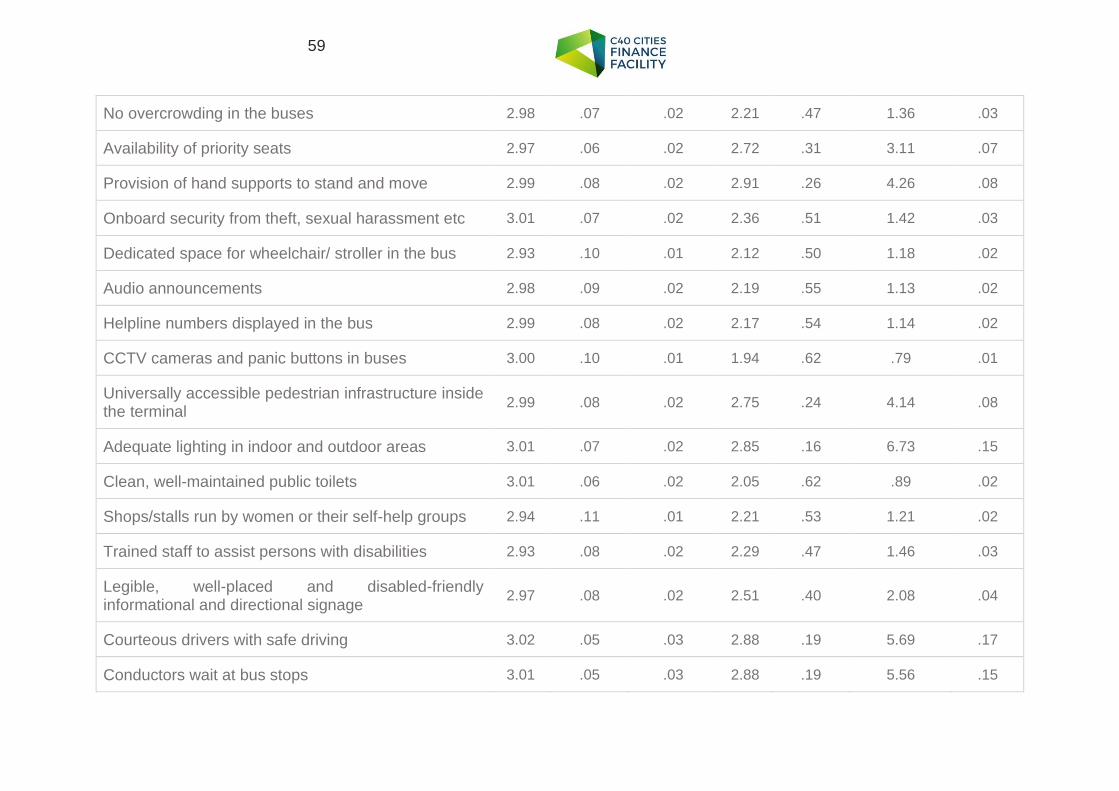
59
No overcrowding in the buses 2.98 .07 .02 2.21 .47 1.36 .03
Availability of priority seats 2.97 .06 .02 2.72 .31 3.11 .07
Provision of hand supports to stand and move 2.99 .08 .02 2.91 .26 4.26 .08
Onboard security from theft, sexual harassment etc 3.01 .07 .02 2.36 .51 1.42 .03
Dedicated space for wheelchair/ stroller in the bus 2.93 .10 .01 2.12 .50 1.18 .02
Audio announcements 2.98 .09 .02 2.19 .55 1.13 .02
Helpline numbers displayed in the bus 2.99 .08 .02 2.17 .54 1.14 .02
CCTV cameras and panic buttons in buses 3.00 .10 .01 1.94 .62 .79 .01
Universally accessible pedestrian infrastructure inside the terminal
2.99 .08 .02 2.75 .24 4.14 .08
Adequate lighting in indoor and outdoor areas 3.01 .07 .02 2.85 .16 6.73 .15
Clean, well-maintained public toilets 3.01 .06 .02 2.05 .62 .89 .02
Shops/stalls run by women or their self-help groups 2.94 .11 .01 2.21 .53 1.21 .02
Trained staff to assist persons with disabilities 2.93 .08 .02 2.29 .47 1.46 .03
Legible, well-placed and disabled-friendly informational and directional signage
2.97 .08 .02 2.51 .40 2.08 .04
Courteous drivers with safe driving 3.02 .05 .03 2.88 .19 5.69 .17
Conductors wait at bus stops 3.01 .05 .03 2.88 .19 5.56 .15
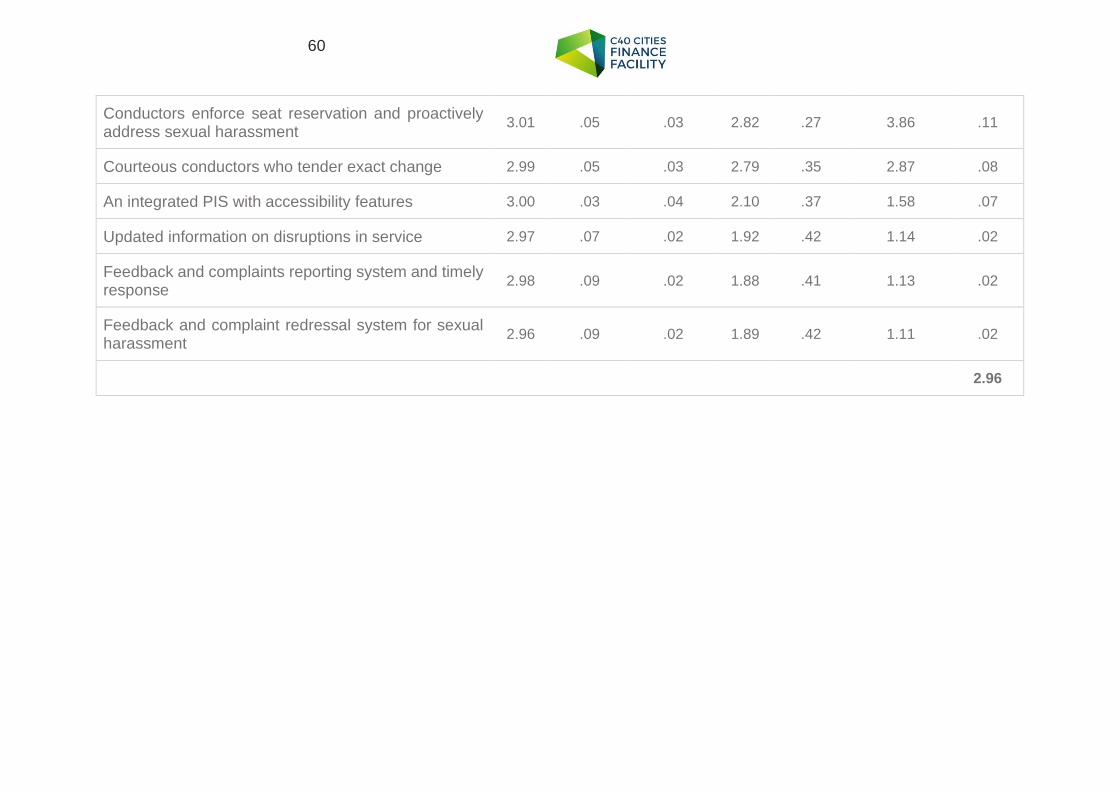
60
Conductors enforce seat reservation and proactively address sexual harassment
3.01 .05 .03 2.82 .27 3.86 .11
Courteous conductors who tender exact change 2.99 .05 .03 2.79 .35 2.87 .08
An integrated PIS with accessibility features 3.00 .03 .04 2.10 .37 1.58 .07
Updated information on disruptions in service 2.97 .07 .02 1.92 .42 1.14 .02
Feedback and complaints reporting system and timely response
2.98 .09 .02 1.88 .41 1.13 .02
Feedback and complaint redressal system for sexual harassment
2.96 .09 .02 1.89 .42 1.11 .02
2.96
61
REFERENCES
B.PAC and Parity Consulting & Training Private Limited. 2019. “Gender sensitization training for BMTC employees.” Bengaluru. https://www.parityconsulting.in/wp-content/uploads/2019/12/Gender-Sensitization-Program-for-BMTC-Employees.pdf.
Bangalore Mirror. 2019. No men allowed’ at these lounges in BMTC terminals. Edited by Reya Malhotra. Bangalore, 6 10. Accessed April 28, 2020. https://bangaloremirror.indiatimes.com/bangalore/others/no-men-allowed-at-these-lounges-in-bmtc-terminals/articleshow/71459391.cms.
Bhatt, Amit, Ranjana Menon, and Azra Khan. 2015. Women's Safety in Public Transport: A Pilot Initiative in Bhopal. New Delhi: WRI India. Accessed April 10, 2020. https://wrirosscities.org/sites/default/files/Final_Report_30072015.pdf.
BMRCL. 2017-18. 12th Annual Report. Bengaluru: BMRCL. Accessed April 2, 2020. https://www.mybmtc.karnataka.gov.in/storage/pdf-files/ENG%20%20ADM%20REPORT%20BMTC%20-%202017-18.pdf.
BMTC. 2017-18. Annual Administration Report. Bengaluru: BMTC. Accessed April 03, 2020. https://www.mybmtc.karnataka.gov.in/storage/pdf-files/ENG%20%20ADM%20REPORT%20BMTC%20-%202017-18.pdf.
—. 2019. Bus Stations. 06 May. Accessed April 20, 2020. https://mybmtc.karnataka.gov.in/info-1/Bus+Stations/en.
BMTC. 2013. “Citizen Charter: BMTC Total Commitment to the Commuters.” Bangalore. Accessed April 04, 2020.
—. 2020. Home: Screen Reader Access. Accessed May 12, 2020. https://mybmtc.karnataka.gov.in/english.
BMTC. n.d. “Passenger Information Kiosk Brochure.” Accessed May 01, 2020. https://www.mybmtc.karnataka.gov.in/storage/pdf-files/Passenger%20Information%20Kiosk%20Brochure_0.pdf.
Census of India. 2011. A Series including Primary Census Abstract Data (Final Population). Accessed April 1, 2020. http://censusindia.gov.in/2011census/population_enumeration.html.
Deloitte. 2018. “Bangalore City Mobility Index.” Accessed April 06, 2020. https://www2.deloitte.com/content/dam/insights/us/articles/4331_Deloitte-City-Mobility-Index/Bangalore_GlobalCityMobility_WEB.pdf.
DULT. 2012. “Traffic and Transit Management Centre, Shantinagar.” Accessed April 10, 2020. http://www.urbantransport.kar.gov.in/Traffic%20Mangement%20and%20circulation%20Study-%20TTMC%20Shanthinagar.pdf.
Lalitha, S. 2019. The New Indian Express. 01 April. Accessed April 05, 2020. https://www.newindianexpress.com/cities/bengaluru/2019/apr/01/drivers-conductors-get-lessons-on-gender-sensitization-1958637.html.
62
Roy, D, B Palavalli, N Menon, R King, K Pfeffer, M Lees, and Peter MA Sloot. 2018. “Survey-based socio-economic data from slums in Bangalore, India.” Scientific Data. https://www.nature.com/articles/sdata2017200.
Roychowdhury, Anumita, and Gaurav Dubey. 2018. The Urban Commute and how it contributes to pollution and energy consumption. New Delhi: Centre for Science and Environment. Accessed April 11, 2020.
Shah, Sonal, and Rithvika Rajiv. 2020. Safer Streets, Safer cities in Bihar. Unpublished, The Urban Catalysts and C3.
The Hindu. 2019. Kumaraswamy launches ‘Pink Sarathi’ vehicles. 06 June. Accessed April 14, 2020. https://www.thehindu.com/news/cities/bangalore/kumaraswamy-launches-pink-sarathi-vehicles/article27583071.ece.
Funding Partners:
C40 Cities Climate Leadership Group 3 Queen Victoria Street, London EC4N 4TQ United Kingdom Deutsche Gesellschaft für Internationale Zusammenarbeit (GIZ) GmbH Potsdamer Platz 10 10785 Berlin Germany E [email protected] W c40cff.org
Funding partners:
Implementing agencies:


