Embed Size (px)
Citation preview
Working Paper Series
Department of Economics
University of Verona
Gender differences in risk aversion: Evidence from repeatedmultiple-choice exams
Giam Pietro Cipriani
WP Number: 21 December 2017
ISSN: 2036-2919 (paper), 2036-4679 (online)
1
Gender differences in risk aversion:
Evidence from repeated multiple-choice exams
Giam Pietro Cipriania University of Verona, Italy and IZA
Abstract
A considerable literature in economics and psychology has observed substantial gender
differences in risk aversion, confidence, and responses to high pressure. In the educational
measurement literature, it has been argued that these differences could disadvantage female
students when taking multiple-choice tests, especially if there is a penalty for wrong answers.
Using a dataset of multiple-choice exams, we investigate this issue by analysing the number of
unanswered questions. Since most individuals take this exam repeatedly, we can also observe if
there are differences after a failure. Our results show that there are significant differences
between men and women: in the second and third attempt women omit more questions than men.
However, this is also the case in the first attempt after excluding the best students.
JEL Classification: J16, D81
Keywords: gender differences, risk aversion, multiple-choice tests
a Department of Economics, University of Verona, Via Cantarane 24, 37129 Verona, Italy. Tel. +39 0458028271. E-mail address: [email protected]
2
INTRODUCTION AND LITERATURE REVIEW
This article seeks to contribute to the literature on gender difference in willingness to guess on
multiple-choice exams by testing for this difference in a high-stakes setting. Our data also allow
us to check if any such difference changes following a failed attempt. We argue that the results
are important to the academic assessment literature, given that multiple-choice tests are widely
used as a form of academic assessment and also as college entrance exams. Moreover, since
many students take some exams, for example the entrance exams (like the SAT) more than once,
this is an interesting setting to study if there are gender differences after the first attempt.
Gender differences in the tendency to omit items and to guess in multiple-choice test have been
studied in numerous papers, using surveys or laboratory experiments. Several factors have been
identified as affecting these differences. Among these, the most debated are: risk aversion,
confidence, and performance under pressure.
To start, a robust finding in economic experiments and field studies, confirmed by a large
number of original articles and meta-analyses, is that men are more risk prone than are women.
For instance, see Eckel and Grossman (2008) for a comprehensive and critical review of the
experimental evidence that, using both real and hypothetical gambles, finds that women are more
risk averse than men in most situations regarding choices between lotteries according to the
mean-variance criterion, choices of insurance coverage, and other financial decisions. In
sociology and psychology many papers have found gender differences in the perception of risk
and in risk preferences regarding alcohol and drug use, catastrophic events, sports or social
activities, health domains, religion and the afterlife, and criminal behaviour. On this subject, a
meta-analysis by Byrnes et al. (1999) reviewed over 150 studies in which the risk-taking
tendencies of male and female participants were compared. They concluded that there is a clear
support to the hypothesis that male participants are more likely to take risks than female
participants.
3
Various other explanations have been suggested for the observed differences, as thoroughly
reviewed by Croson and Gneezy (2009) in a comprehensive survey of the literature. One type of
explanation has to do with overconfidence. It has often been claimed that men are more confident
in their success than women. For example, regarding investment decisions, this has been tested
and confirmed in experiments by Estes and Hosseini (1988), who show that, after controlling
for all the relevant variables, women have significantly lower confidence in an investment task
than men, and by Fellner and Maciejovsky (2007) who find that they also engage less often in
trades. Also Charness and Gneezy (2012) assembling data from 15 sets of experiments, find that
women invest less and appear to be more financially risk averse than men. Similarly, Niederle
and Vesterlund (2007) find that in a competitive tournament incentive scheme men are more
confident about their relative performance than women. They also find that the beliefs on relative
performance help predict tournament entry. Finally, Reuben et al. (2012) find that men’s
overconfidence is the driving force behind the emergence of male leadership in competitive
environments.
Another explanation of the gender difference is the interpretation of risk as a challenge or threat.
According to Arch (1993) differences in risk taking behaviour result from diverse views between
men and women, whereby the first are more likely to see a risky situation as a challenge that
calls for a participation and the second as a threat to avoid.
Our results are derived from a high-stakes test: a multiple-choice exam with penalty for wrong
answers, which all students must eventually pass in order to graduate in economics in a medium-
sized Italian university. Various papers have shown that women underperform compared to men
in competitive environments (Gneezy et al. 2003; Antonovics et al. 2009; Shurchkov 2012;
Azmat et al. 2016) or simply avoid competitive environments (Niederle and Vesterlund 2007;
Buser et al. 2014). In our setting the individual mark is independent of the performance of other
4
students and the test is compulsory, however competition could still play a role because, for
example, exam results matter when allocating Erasmus scholarships.
Among the various possible explanations for a gender difference, risk aversion is likely to play
an important role in our framework, since performance in this type of test reflects not only
students’ knowledge of the material, but also their willingness to guess when unsure about the
answer. In fact, there are four possible answers to each question, only one of which is correct ,
and the final mark is computed with a formula scoring that assigns a penalty of one third of a
point to each incorrect answer, whilst one full point is given for a correct answer and zero points
to each omitted question, such that the expected score for random guessing is zero, i.e. the same
as that for omitting. Therefore, for test takers the decision whether to answer or to omit also
depends on their attitude to risk: more risk averse individuals may be more likely to skip a
question, holding constant their knowledge and therefore the likelihood of answering correctly.
The debate on this issue concerning multiple-choice exams is so old in the educational literature
that an early survey, reviewing papers starting from 1925, was published more than forty years
ago (Diamond and Evans 1973). In this literature, there is abundant evidence that women
perform relatively worse in multiple-choice tests compared to essay style exams (Ferber et al.
1983, Lumsden and Scott 1987) and this evidence usually concludes that women are more likely
to skip questions than men. Therefore, these tests have often been criticized because they could
be a biased way to test knowledge or forecast future achievements, since they discriminate
against risk averse and loss averse test takers (Burton 2005, and Budescu and Bo 2014).
In our study, we do not find a gender effect in the number of omitted answers at the first attempt.
However, we do find that that there is a statistically significant gender difference in the second
and third attempts: ceteris paribus women omit 12% more answers than men in the second and
17% more in the third (p<0.05). Since our test is carried out in a real-world setting, where the
size of the stakes involved are high, and given the open question whether laboratory experiments
5
with small stakes can yield conclusion that can be generalized, we view this first result as
important per se. Also, since many students fail the exam at the first attempt and then retake it
later, a gender difference in the second attempt could be the result of a time-varying risk
aversion. In other words, it could be the result of a change in behaviour whereby women become
more risk averse than men after a failed attempt to pass the exam. However, we do not find
support for this hypothesis. Instead, we find that there is a selection effect, whereby a gender
difference emerges once we exclude the best students (those who pass at the first attempt) from
the sample. In fact, such a difference exists also at the first attempt if we consider only the
subsample of those who fail it.
In conclusion, our results provide some support for the view that multiple-choice tests with
negative marking are a biased way to test knowledge, probably because they discriminate against
more risk averse students. In fact, the behaviour of men and women appears to be significantly
different. Hence, the results confirm that multiple-choice tests with deductions for incorrect
answers should be adopted with caution, because different results could be driven by differences
in risk aversion or other irrelevant personal characteristics. Incidentally, this seems to be the
current view of the SAT College Board, which has redesigned the SAT in 2016 and moved to
rights-only scoring in order “to remove from the process any extraneous test-taking strategies
that are irrelevant to the achievement constructs being measured” (SAT College Board, 2015,
p.18). Since the SAT is taken by more than 1.5 million people every year, about 40% of which
take it for the second time, this redesign seems quite appropriate given our results.
The next section describes our dataset, the following illustrates the method and results and the
last section present the conclusions.
6
DATA
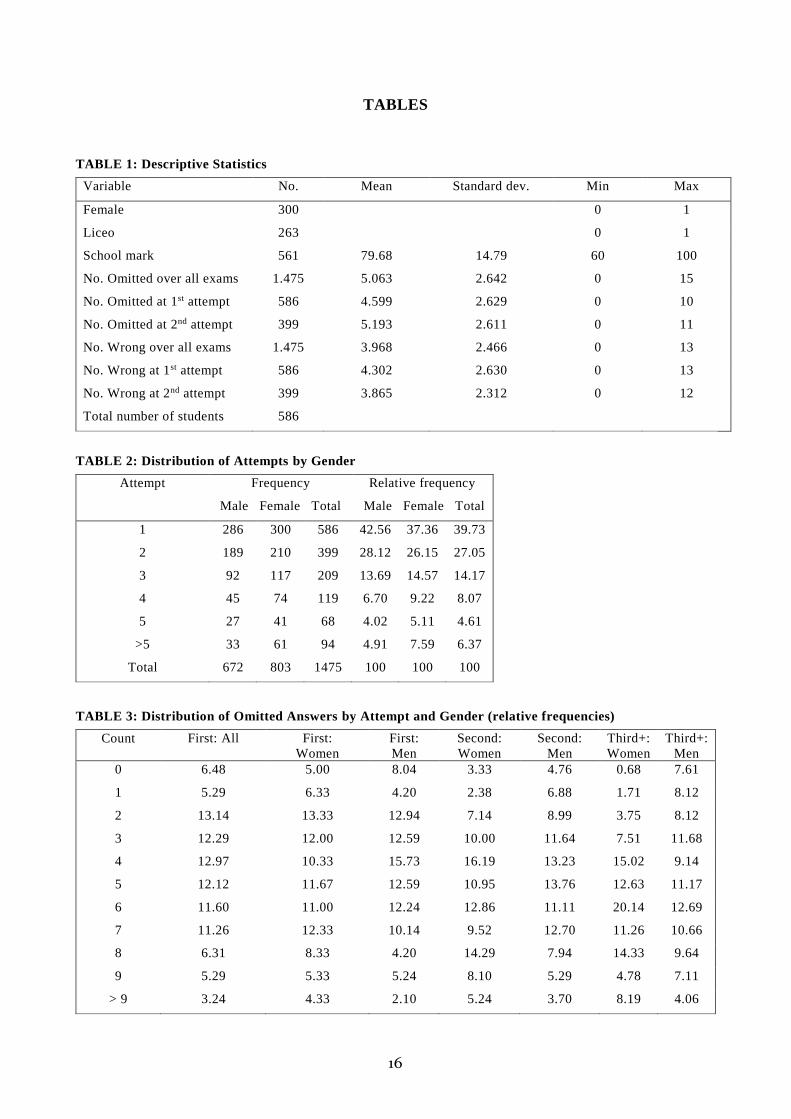
Our dataset consists of 586 students, 300 of which female, who took the Intermediate
Microeconomics exam at an Italian university. The background information, summarized in
Table 1, includes the gender of the applicant, the type of secondary school attended, and the
final mark obtained in the school-leaving examination.
[Insert Table 1 about here]
Secondary schools in Italy are essentially of three types: professional schools, which should
directly prepare for blue collar type jobs, emphasizing also manual skills; technical schools,
aimed at both blue and white-collar type jobs but with a more technical content; and ‘‘liceo”, a
more general school that should better prepare for university. The school leaving examination
mark ranges from 60 (lowest) to 100 (highest). This mark depends both on a student’s
performance during her career at high school and on the result of a nation-wide comprehensive
examination administered centrally by Ministry of University and Education, which is identical
for all students but specific to the school type.
The Intermediate Microeconomics exam consists of 15 multiple-choice questions, which account
for 30% of the final mark. However, all students must pass this test in order to be evaluated in
the second part of the exam, which consists of exercises. Each question presents four possible
answers, only one of which is correct. There is a penalty for wrong answers, but no penalty for
unanswered questions, such that the expected score for random guessing is the same as that for
omitting. In an exam, each student receives the same set of questions, randomly picked from a
large dataset of questions. Questions and answers appear in random order for each student.
A unique feature of our dataset originates from the fact that in Italian universities exam failures
are not at all unusual and students are allowed to repeat the exam, even several times each year
(up to four times in our case), until they finally pass. Intermediate Microeconomics is considered
7
to be a very hard exam and the pass rate in each exam is less than 30%. Hence, the majority of
students sit this exam twice, and more than a third do it three times, as can be seen in Table 2
which reports the distribution of attempts. In fact, we have a total of 1,475 exams in our dataset,
which is an average of 2.4 exams for each student. In any case, this exam is compulsory and
must eventually be passed in order to graduate.
[Insert Table 2 about here]
METHOD AND RESULTS
Answering a question on a multiple-choice test can be seen as a risky decision. In our test there
are four answers to each question and only one of these is correct. A correct answer gives one
point, a wrong answer takes away one-third of a point, and skipping a question gives a certain
payoff of zero. Therefore, the expected payoff of a random guess is zero. Given that, we can see
each question as a separate lottery, where a more risk averse individual may be more likely to
skip it, holding constant the likelihood of answering the question correctly. In other words, a
risk neutral student who does not know the answer will be indifferent between choosing at
random and not answering, while a risk averse individual would prefer to leave the question
unanswered. Also, risk averse students who have partial knowledge of the material covered in a
question or are simply unsure in their own assessment of their knowledge may omit items with
positive expected reward (for a discussion of the implications of formula scoring in multiple -
choice tests see Espinosa and Gardeazabal 2010).
To test for gender differences, we regress the number of omitted answers on the female indicator
variable and on our two controls for ability: the type of secondary school attended, and the final
mark attained at the end of the secondary school. The first control is a dummy variable, taking
the value of one if the school is a “liceo” (a school which should better prepare for the university)
8
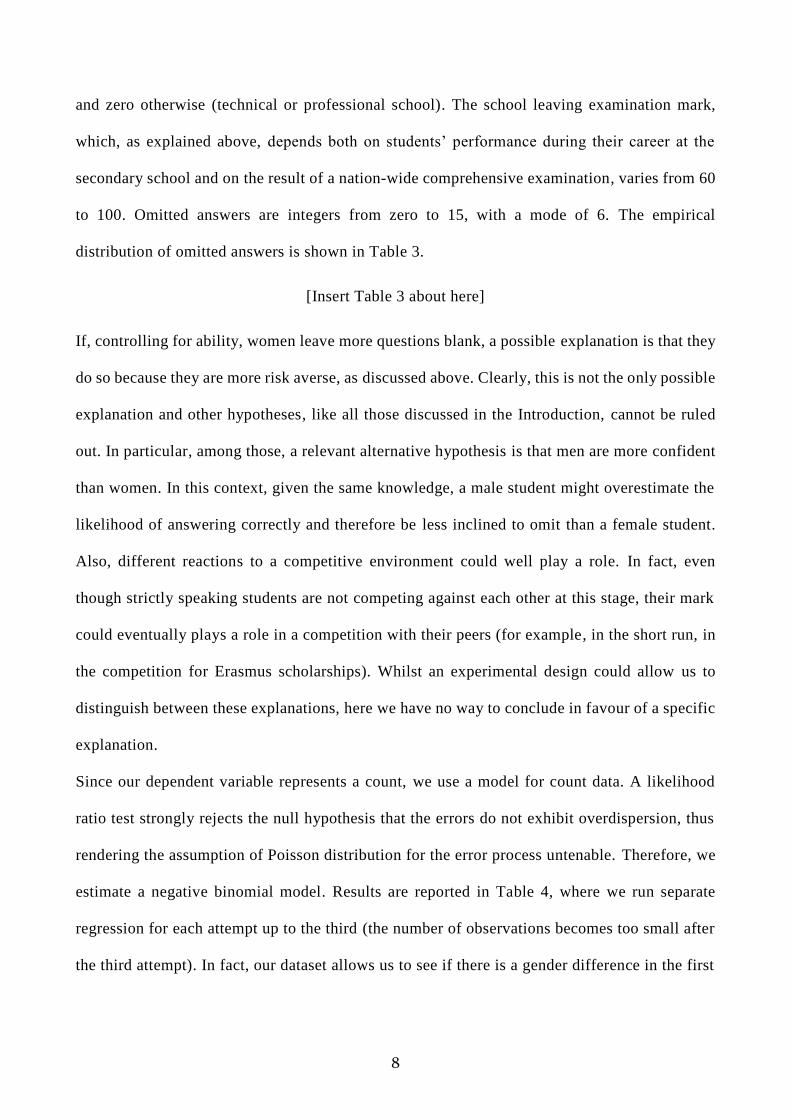
and zero otherwise (technical or professional school). The school leaving examination mark,
which, as explained above, depends both on students’ performance during their career at the
secondary school and on the result of a nation-wide comprehensive examination, varies from 60
to 100. Omitted answers are integers from zero to 15, with a mode of 6. The empirical
distribution of omitted answers is shown in Table 3.
[Insert Table 3 about here]
If, controlling for ability, women leave more questions blank, a possible explanation is that they
do so because they are more risk averse, as discussed above. Clearly, this is not the only possible
explanation and other hypotheses, like all those discussed in the Introduction, cannot be ruled
out. In particular, among those, a relevant alternative hypothesis is that men are more confident
than women. In this context, given the same knowledge, a male student might overestimate the
likelihood of answering correctly and therefore be less inclined to omit than a female student.
Also, different reactions to a competitive environment could well play a role. In fact, even
though strictly speaking students are not competing against each other at this stage, their mark
could eventually plays a role in a competition with their peers (for example, in the short run, in
the competition for Erasmus scholarships). Whilst an experimental design could allow us to
distinguish between these explanations, here we have no way to conclude in favour of a specific
explanation.
Since our dependent variable represents a count, we use a model for count data. A likelihood
ratio test strongly rejects the null hypothesis that the errors do not exhibit overdispersion, thus
rendering the assumption of Poisson distribution for the error process untenable. Therefore, we
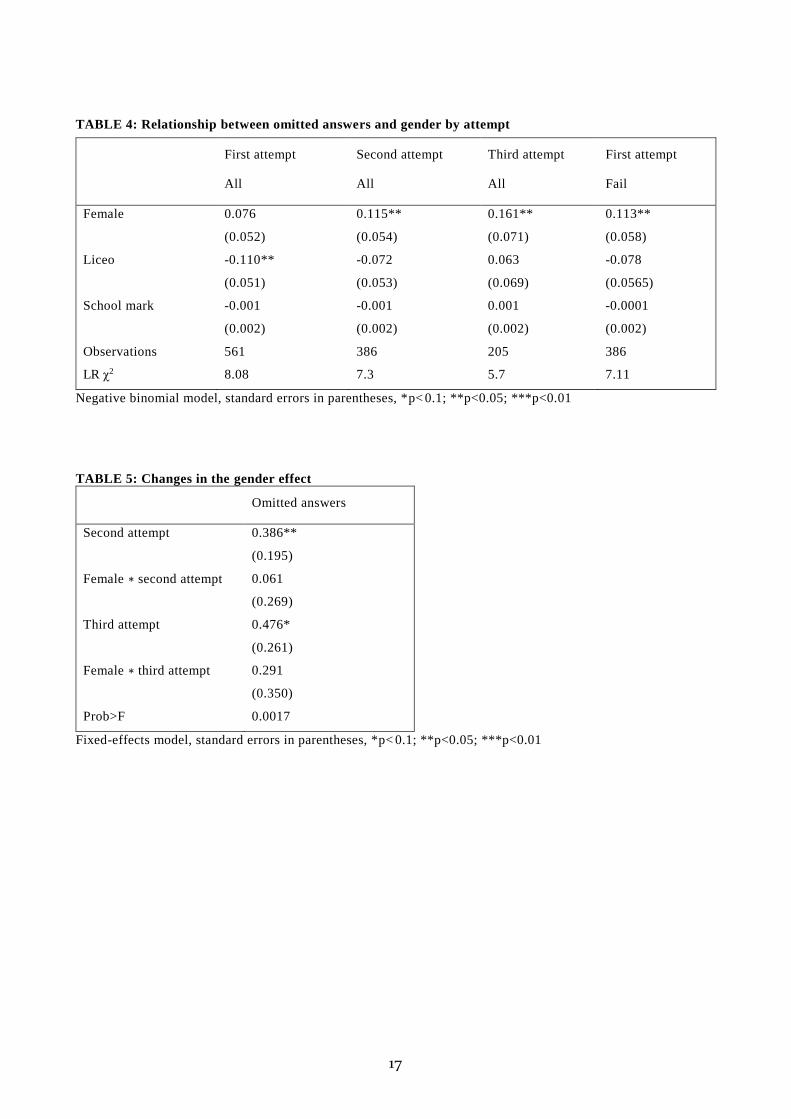
estimate a negative binomial model. Results are reported in Table 4, where we run separate
regression for each attempt up to the third (the number of observations becomes too small after
the third attempt). In fact, our dataset allows us to see if there is a gender difference in the first
9
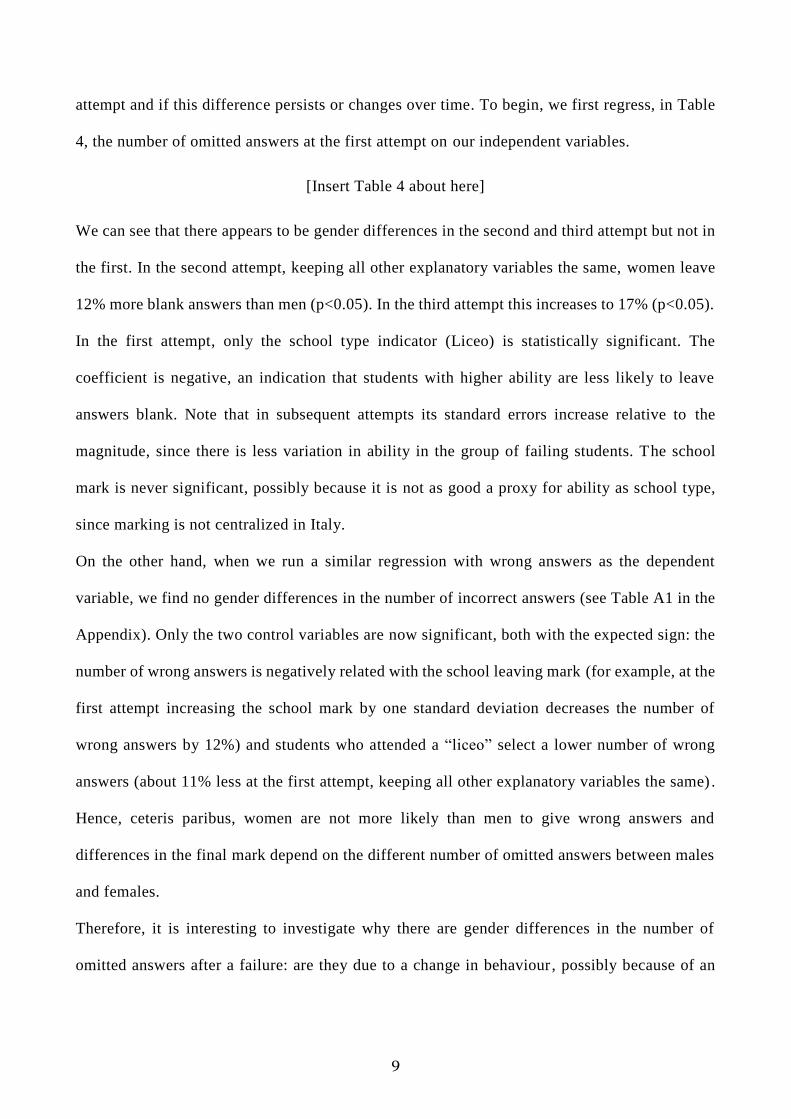
attempt and if this difference persists or changes over time. To begin, we first regress, in Table
4, the number of omitted answers at the first attempt on our independent variables.
[Insert Table 4 about here]
We can see that there appears to be gender differences in the second and third attempt but not in
the first. In the second attempt, keeping all other explanatory variables the same, women leave
12% more blank answers than men (p<0.05). In the third attempt this increases to 17% (p<0.05).
In the first attempt, only the school type indicator (Liceo) is statistically significant. The
coefficient is negative, an indication that students with higher ability are less likely to leave
answers blank. Note that in subsequent attempts its standard errors increase relative to the
magnitude, since there is less variation in ability in the group of failing students. The school
mark is never significant, possibly because it is not as good a proxy for ability as school type,
since marking is not centralized in Italy.
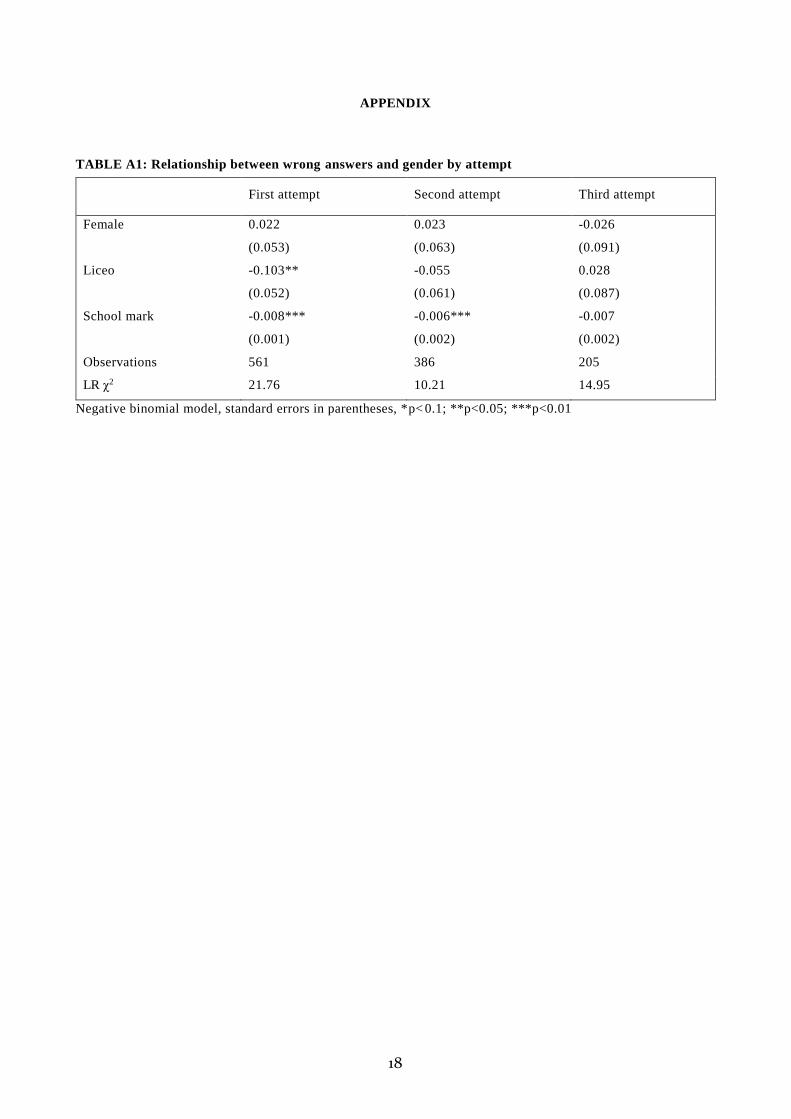
On the other hand, when we run a similar regression with wrong answers as the dependent
variable, we find no gender differences in the number of incorrect answers (see Table A1 in the
Appendix). Only the two control variables are now significant, both with the expected sign: the
number of wrong answers is negatively related with the school leaving mark (for example, at the
first attempt increasing the school mark by one standard deviation decreases the number of
wrong answers by 12%) and students who attended a “liceo” select a lower number of wrong
answers (about 11% less at the first attempt, keeping all other explanatory variables the same) .
Hence, ceteris paribus, women are not more likely than men to give wrong answers and
differences in the final mark depend on the different number of omitted answers between males
and females.
Therefore, it is interesting to investigate why there are gender differences in the number of
omitted answers after a failure: are they due to a change in behaviour, possibly because of an

10
increase in risk aversion after failing affecting more women than men, or is there a selection
effect, whereby only within the group of students who fail gender differences show up?
To begin taking into account a possible selection effect, in the last column of Table 4 we estimate
the same model for the subsample of those who fail the first attempt. In this group, the gender
difference in the expected log count of the number omitted answers at the first attempt is 0.113
(p<0.05), before any effect of failing on the omitting behaviour (note that there is a constant in
the regression). This is a first indication that goes in the direction of a selection effect, i.e. that
a gender difference emerges among low ability students. To test this further, in Table 5 we
estimate a student fixed-effects regression where the dependent variable is, as usual, the number
of omitted questions.
[Insert Table 5 about here]
“Second attempt” is an indicator for the second attempt and “Female כ second attempt” is the
interaction between gender and the second attempt. Similarly, for the third attempt. Both
interaction terms are not statistically significant, thus the hypothesis that there is a significant
change in behaviour does not seem to be supported by the data.
In conclusion, there is a significant gender difference only when the best students are excluded:
in the second and third attempt and, in the subsample of those who fail, also in the first attempt.
Incidentally, various studies have found that lower cognitive ability is associated with greater
risk aversion (for a recent example see Dohmen et al. 2010). Therefore, one possible explanation
for our results is that the greater number of omitted answers among women is the result of higher
risk aversion but this difference becomes noticeable only in the least able, and probably more
risk averse, group.
11
CONCLUSION
By using a new dataset of scores in a multiple-choice test, we study the issue of gender bias in
willingness to guess. It has been argued that the use of multiple-choice exams with penalty for
wrong answers is discriminating against women, who have been found to be more risk averse
than men. This is because they will omit more items compared to male test-takers of similar
abilities, who are less risk averse.
In our setting, we check if there exists a gender difference in the tendency to skip questions and
if such a difference changes after the first attempt. In fact, since our students are allowed to
retake the exam if they fail, we can see what happens at the second attempt. Differently from
various other papers in the literature, our dataset comes from a real-world setting, where the size
of the stakes involved is high. Also, we do not know of other studies that consider how the
willingness to guess changes after a failure, which is an interesting question to ask since in many
cases exams can be retaken, like for example the university entrance exams.
We find that there is a statistically significant difference in the number of omitted items between
males and females after a failure. At the second and third attempt women omit more questions
than men. This is also true, however, at the first attempt if we exclude from the sample the best
students (those who pass). On the other hand, a difference is not observed in the number of
wrong answers. A possible explanation for a gender difference after a failure points to a change
in behaviour, for example an increase in risk aversion of women after a failure. However, ou r
analysis does not support the hypothesis of a change in behaviour and suggest instead that the
gender difference is conditional on ability. This is a new result in the education literature on
multiple-choice exams, which so far has not investigated what happens to the willingness to
answer when individuals retake a test. Therefore, our results provide some support for the view
that a multiple-choice test with a penalty for wrong answers is discriminating against women.
12
Finally, it should be noted that our results are derived from a population of second year
Economics and Business students who have, therefore, a similar background. Johnson and
Powell (1994) show that in a “non-managerial” population (i.e. where individuals have not
undergone formal economics and management education) a difference in risk aversion between
genders is greater than in a “managerial” population. This might be due, of course, to both a
selection effect (individuals with lower risk aversion self-select into studying economics or
management) and a treatment effect (adaptive behaviour to the requirements of the job).
Therefore, in a more general population, one might expect to find even greater gender
differences than those measured in this case.
13
REFERENCES
Antonovics, K., Arcidiacono, P., & Walsh, R. 2009. The Effects of Gender Interactions in the Lab
and in the Field. Review of Economics and Statistics, 91, 152–162.
Arch, E. 1993. Risk-Taking: A Motivational Basis for Sex Differences. Psychological Reports,
73, 6-11.
Azmat, G., Calsamiglia, C., & Iriberri, N. 2016. Gender Differences in Response to Big Stakes.
Journal of the European Economic Association, 14, 1372-1400.
Budescu, D.V., & Bo, Y. 2014. Analyzing Test-Taking Behavior: Decision Theory Meets
Psychometric Theory. Psychometrika, 80, 1105-1122.
Burton R.F. 2005. MultipleǦchoice and True/False Tests: Myths and Misapprehensions.
Assessment & Evaluation in Higher Education, 30, 65-72.
Buser, T., Niederle, M. & Oosterbeek, H. 2014. Gender, Competitiveness and Career Choices.
Quarterly Journal of Economics, 129, 1409–1447.
Byrnes, J.P., Miller, D.C., & Schafer W.D. 1999. Gender Differences in Risk-Taking: A Meta-
analysis. Psychological Bulletin, 125, 367–83.
Charness, G., & Gneezy, U. 2012. Strong Evidence for Gender Differences in Risk Taking.
Journal of Economic Behavior & Organization, 83, 50-58.
Croson, R., & Gneezy, U. 2009. Gender Differences in Preferences. Journal of Economic
Literature, 47, 448-474.
Diamond, J., & Evans, W. 1973. The Correction for Guessing. Review of Educational Research,
43, 181-191.
Dohmen, T., Falk, A., Huffman, D. & Sunde, U. 2010. Are Risk Aversion and Impatience
Related to Cognitive Ability? American Economic Review, 100, 1238-1260.
14
Eckel, C.C., & Grossman, P.J. 2008. Men, Women and Risk Aversion: Experimental Evidence.
In: Plott, C., Smith, V., (Eds.). Handbook of Experimental Economics Results, Vol. 1.
New York: Elsevier, 1061-73.
Espinosa, M.P., & Gardeazabal, J. 2010. Optimal Correction for Guessing in Multiple-Choice
Tests. Journal of Mathematical Psychology, 54, 415-425.
Estes, R., & Hosseini, J. 1988. The Gender Gap on Wall Street: An Empirical Analysis of
Confidence in Investment Decision Making. Journal of Psychology, 122, 577–90.
Fellner, G., & Maciejovsky, B. 2007. Risk Attitude and Market Behavior: Evidence from
Experimental Asset Markets. Journal of Economic Psychology, 28, 338-350.
Ferber, M.A., Birnbaum, B.G., & Green, C.A. 1983. Gender Differences in Economic
Knowledge: A Re-evaluation of the Evidence. Journal of Economic Education, 14, 24 -
37.
Gneezy, U., Niederle, M., & Rustichini, A. 2003. Performance in Competitive Environments: Gender
Differences. Quarterly Journal of Economics , 118, 1049–1074.
Johnson, J.E.V., & Powell, P.L. 1994. Decision Making, Risk and Gender: Are Managers
Different? British Journal of Management, 5, 123-138.
Lumsden, K.G., & Scott, A., 1987. The Economics Student Re-Examined: Male- female
Differences in Comprehension. Journal of Economic Education, 18, 365-375.
Niederle, M., & Vesterlund, L. 2007. Do Women Shy Away from Competition? Do Men
Compete Too Much? Quarterly Journal of Economics, 122, 1067–1101.
Reuben, E., Rey-Biel, P., Sapienza, P., & Zingales, L. 2012. The Emergence of Male Leadership
in Competitive Environments. Journal of Economic Behaviour and Organization, 83,
111-117.
15
SAT College Board, 2015. Test Specifications for the Redesigned SAT.
https://collegereadiness.collegeboard.org/pdf/test-specifications-redesigned-sat-1.pdf
Shurchkov, O. 2012. Under Pressure: Gender Differences in Output Quality and Quantity Under
Competition and Time Constraints. Journal of the European Economic Association, 10, 1189–
1213.
16
TABLES
TABLE 1: Descriptive Statistics
Variable No. Mean Standard dev. Min Max
Female 300 0 1
Liceo 263 0 1
School mark 561 79.68 14.79 60 100
No. Omitted over all exams 1.475 5.063 2.642 0 15
No. Omitted at 1st attempt 586 4.599 2.629 0 10
No. Omitted at 2nd attempt 399 5.193 2.611 0 11
No. Wrong over all exams 1.475 3.968 2.466 0 13
No. Wrong at 1st attempt 586 4.302 2.630 0 13
No. Wrong at 2nd attempt 399 3.865 2.312 0 12
Total number of students 586
TABLE 2: Distribution of Attempts by Gender
Attempt Frequency
Male Female Total
Relative frequency
Male Female Total
1 286 300 586 42.56 37.36 39.73
2 189 210 399 28.12 26.15 27.05
3 92 117 209 13.69 14.57 14.17
4 45 74 119 6.70 9.22 8.07
5 27 41 68 4.02 5.11 4.61
>5 33 61 94 4.91 7.59 6.37
Total 672 803 1475 100 100 100
TABLE 3: Distribution of Omitted Answers by Attempt and Gender (relative frequencies)
Count First: All First: Women
First: Men
Second: Women
Second: Men
Third+: Women
Third+: Men
0 6.48 5.00 8.04 3.33 4.76 0.68 7.61
1 5.29 6.33 4.20 2.38 6.88 1.71 8.12
2 13.14 13.33 12.94 7.14 8.99 3.75 8.12
3 12.29 12.00 12.59 10.00 11.64 7.51 11.68
4 12.97 10.33 15.73 16.19 13.23 15.02 9.14
5 12.12 11.67 12.59 10.95 13.76 12.63 11.17
6 11.60 11.00 12.24 12.86 11.11 20.14 12.69
7 11.26 12.33 10.14 9.52 12.70 11.26 10.66
8 6.31 8.33 4.20 14.29 7.94 14.33 9.64
9 5.29 5.33 5.24 8.10 5.29 4.78 7.11
> 9 3.24 4.33 2.10 5.24 3.70 8.19 4.06
17
TABLE 4: Relationship between omitted answers and gender by attempt
First attempt
All
Second attempt
All
Third attempt
All
First attempt
Fail
Female 0.076
(0.052)
0.115**
(0.054)
0.161**
(0.071)
0.113**
(0.058)
Liceo -0.110**
(0.051)
-0.072
(0.053)
0.063
(0.069)
-0.078
(0.0565)
School mark -0.001
(0.002)
-0.001
(0.002)
0.001
(0.002)
-0.0001
(0.002)
Observations 561 386 205 386
LR ぬ2 8.08 7.3 5.7 7.11
Negative binomial model, standard errors in parentheses, *p< 0.1; **p<0.05; ***p<0.01 TABLE 5: Changes in the gender effect
Omitted answers
Second attempt 0.386**
(0.195)
Female כ second attempt 0.061
(0.269)
Third attempt 0.476*
(0.261)
Female כ third attempt 0.291
(0.350)
Prob>F 0.0017
Fixed-effects model, standard errors in parentheses, *p< 0.1; **p<0.05; ***p<0.01
18
APPENDIX TABLE A1: Relationship between wrong answers and gender by attempt
First attempt Second attempt Third attempt
Female 0.022
(0.053)
0.023
(0.063)
-0.026
(0.091)
Liceo -0.103**
(0.052)
-0.055
(0.061)
0.028
(0.087)
School mark -0.008***
(0.001)
-0.006***
(0.002)
-0.007
(0.002)
Observations 561 386 205
LR ぬ2 21.76 10.21 14.95
Negative binomial model, standard errors in parentheses, *p< 0.1; **p<0.05; ***p<0.01


