Embed Size (px)
Citation preview
City of Everett, Massachusetts Fiscal Year 2017
Adopted Annual General Fund and Enterprise Fund Operating Budgets
Capital Improvement Budget
July 1, 2016 – June 30, 2017
Presented By:
Mayor Carlo DeMaria
i
To Everett City Council ‐ 2017 Prepared By: Reviewed By:
John Hanlon, President Eric Demas, CFO/City Auditor City Council – Committee on Budget*
Frederick Capone Laureen Hurley, Budget Director
Richard Dell Isola Ryan Smith, Assistant City Auditor
Rosa DiFlorio Tom Philbin, ECTV Director
Anthony DiPierro Kevin Dorgan, IT Director
Michael Mangan
Wayne Matewsky
Michael McLaughlin
John “Leo” McKinnon
Peter Napolitano
Stephen Simonelli
* includes all members of the Everett City Council
On the Cover – Newly renovated Werner Park. Picture taken by Andrew Napolitano, ECTV
ii
The Government Finance Officers Association of the United States and Canada (GFOA) presented a
Distinguished Budget Presentation Award to the City of Everett, Massachusetts for the
Annual Budget beginning July 1, 2015. In order to receive this award, a governmental unit must publish a budget document that meets program criteria as a
policy document, as an operational guide, as a financial plan, and as a communication
device.
This award is valid for a period of one year only. We believe our current budget continues to
conform to program requirements, as we are submitting it to GFOA to determine its eligibility for
another award.
iii
A Certificate of Achievement for Excellence in Financial Reporting is presented by the Government Finance Officers Association of the United States and Canada
(GFOA) to government units and public employee retirement
systems whose Comprehensive Annual Financial Reports
(CAFRs) achieve the highest standards in government accounting and financial
reporting.
iv
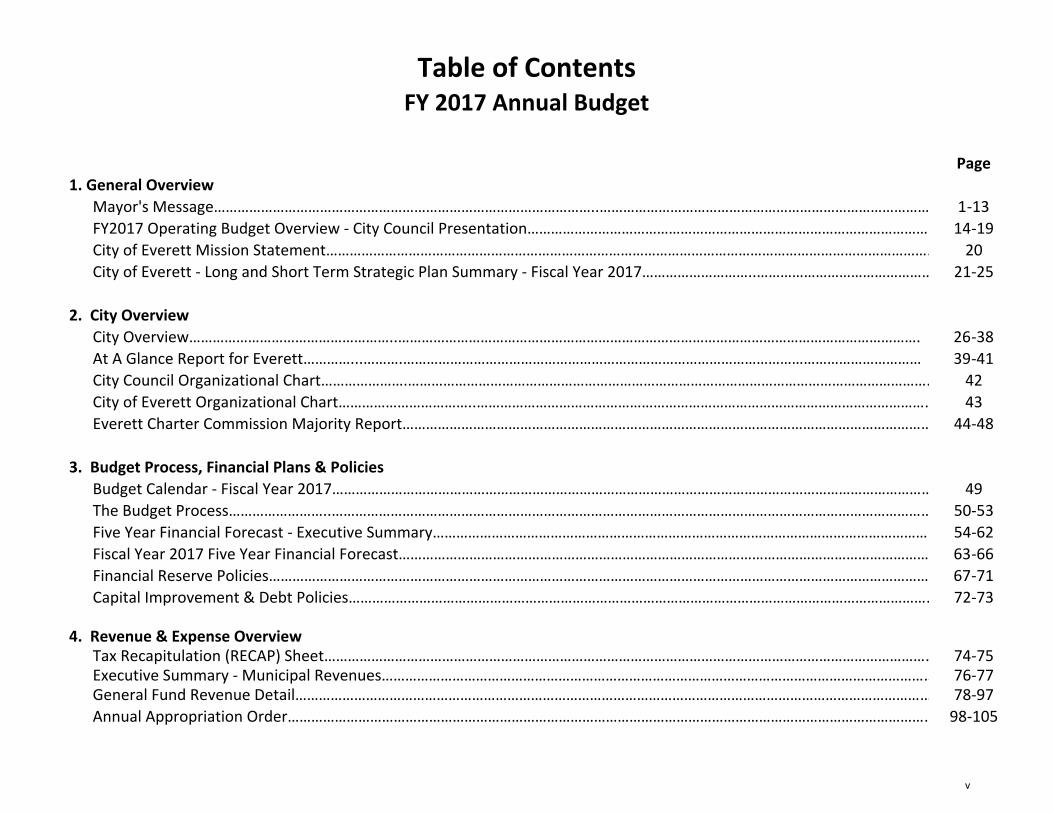
Page1. General Overview
Mayor's Message……………………………………………………………………………………..………………………………………………………………………… 1‐13FY2017 Operating Budget Overview ‐ City Council Presentation………………………………………………………………………………………… 14‐19City of Everett Mission Statement………………………………………………………………………………………………………………………………………… 20City of Everett ‐ Long and Short Term Strategic Plan Summary ‐ Fiscal Year 2017………………………..……………………………………… 21‐25
2. City OverviewCity Overview……………………………………………..……………………………………………………………………………………………………………………. 26‐38At A Glance Report for Everett…………...……….…………………………………………………………………………………………………………………… 39‐41City Council Organizational Chart………………….……………………………………………………………………………………………………………………. 42City of Everett Organizational Chart……………………………..……………………………………………………………………………………………………… 43Everett Charter Commission Majority Report……………………………………………………………………………………………………………………… 44‐48
3. Budget Process, Financial Plans & PoliciesBudget Calendar ‐ Fiscal Year 2017……………………………………………………………………………………………………………………………………… 49The Budget Process……………………..……………………………………………………………………………………………………………………………………… 50‐53Five Year Financial Forecast ‐ Executive Summary………………………………………………………………………………………………………………… 54‐62Fiscal Year 2017 Five Year Financial Forecast……………………………………………………………………………………………………………………… 63‐66Financial Reserve Policies…………………………………………………………………………………………………………………………………………………… 67‐71Capital Improvement & Debt Policies…………………………………………………………………………………………………………………………………… 72‐73
4. Revenue & Expense OverviewTax Recapitulation (RECAP) Sheet………………………………………………………………………………………………………………………………………… 74‐75Executive Summary ‐ Municipal Revenues…………………………………………………………………………………………………………………………… 76‐77General Fund Revenue Detail……………………………………………………………………………………………………………………………………………… 78‐97Annual Appropriation Order………………………………………………………………………………………………………………………………………………… 98‐105
Table of ContentsFY 2017 Annual Budget
v
Page
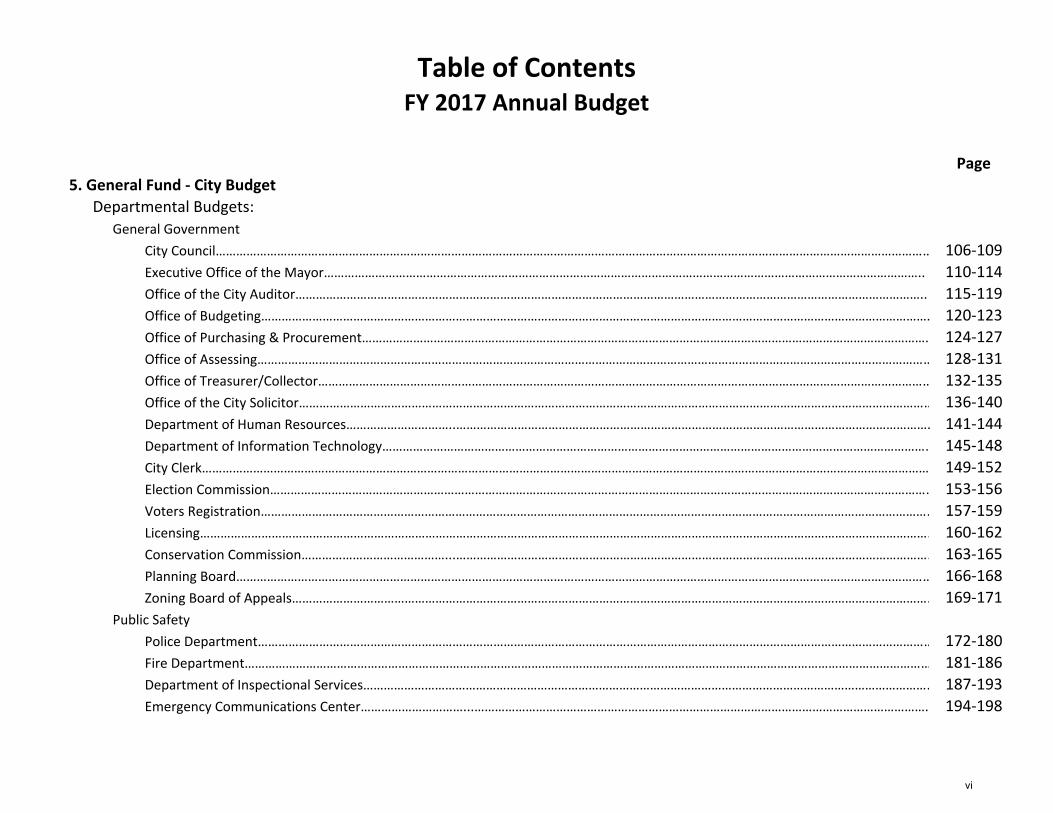
Table of ContentsFY 2017 Annual Budget
5. General Fund ‐ City BudgetDepartmental Budgets:
General GovernmentCity Council………………………………………………………………………………………………………………………………………………………………………………………… 106‐109Executive Office of the Mayor………………………………………………………………………………………………………………………………………………………….. 110‐114Office of the City Auditor………………………………………………………………………………………………………………………………………………………………….. 115‐119Office of Budgeting……………………………………………………………………………………………………………………………………………………………………………. 120‐123Office of Purchasing & Procurement…………………………………………………………………………………………………………………………………………………. 124‐127Office of Assessing……………………………………………………………………………………………………………………………………………………………………………… 128‐131Office of Treasurer/Collector……………………………………………………………………………………………………………………………………………………………… 132‐135Office of the City Solicitor…………………………………………………………………………………………………………………………………………………………………… 136‐140Department of Human Resources…………………………..…………………………………………………………………………………………………………………………. 141‐144Department of Information Technology……………………………………………………………………………………………………………………………………………… 145‐148City Clerk…………………………………………………………………………………………………………………………………………………………………………………………… 149‐152Election Commission…………………………………………………………………………………………………………………………………………………………………………… 153‐156Voters Registration……………………………………………………………………………………………………………………………………………………………………………… 157‐159Licensing……………………………………………………………………………………………………………………………………………………………………………………………… 160‐162Conservation Commission……………………………………...…………………………………………………………………………………………………………………………. 163‐165Planning Board…………………………………………………………………………………………………………………………………………………………………………………… 166‐168Zoning Board of Appeals……………………………………………………………………………………………………………………………………………………………………… 169‐171
Public SafetyPolice Department……………………………………………………………………………………………………………………………………………………………………………… 172‐180Fire Department………………………………………………………………………………………………………………………………………………………………………………… 181‐186Department of Inspectional Services…………………………………………………………………………………………………………………………………………………… 187‐193Emergency Communications Center…………………………...……………………………………………………………………………………………………………………. 194‐198
vi
Page
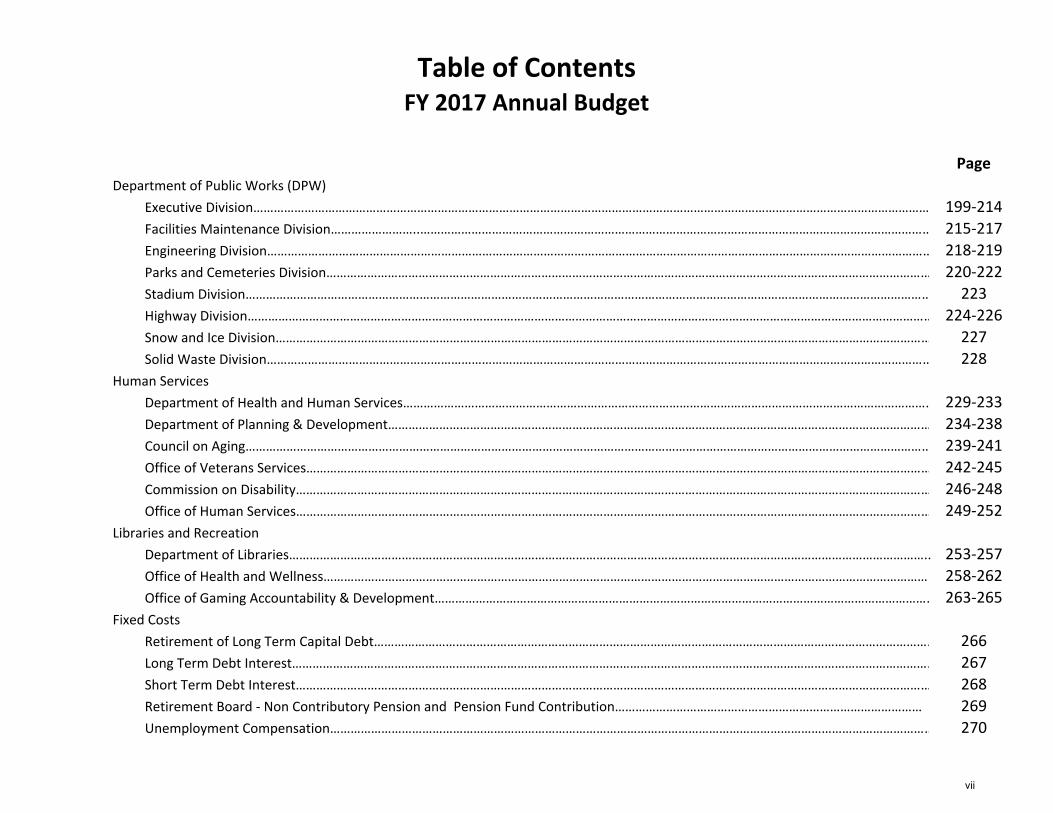
Table of ContentsFY 2017 Annual Budget
Department of Public Works (DPW)Executive Division……………………………………………………………………………………………………………………………………………………………………………… 199‐214Facilities Maintenance Division……………………..…………………………………………………………………………………………………………………………………… 215‐217Engineering Division…………………………………………………………………………………………………………………………………………………………………………… 218‐219Parks and Cemeteries Division…………………………………………………………………………………………………………………………………………………………… 220‐222Stadium Division………………………………………………………………………………………………………………………………………………………………………………… 223Highway Division………………………………………………………………………………………………………………………………………………………………………………… 224‐226Snow and Ice Division………………………………………………………………………………………………………………………………………………………………………… 227Solid Waste Division…………………………………………………………………………………………………………………………………………………………………………… 228
Human ServicesDepartment of Health and Human Services………………………………………………………………………………………………………………………………………… 229‐233Department of Planning & Development…………………………………………………………………………………………………………………………………………… 234‐238Council on Aging………………………………………………………………………………………………………………………………………………………………………………… 239‐241Office of Veterans Services………………………………………………………………………………………………………………………………………………………………… 242‐245Commission on Disability…………………………………………………………………………………………………………………………………………………………………… 246‐248Office of Human Services…………………………………………………………………………………………………………………………………………………………………… 249‐252
Libraries and RecreationDepartment of Libraries…………………………………………………………………………………………………………………………………………………………………….. 253‐257Office of Health and Wellness……………………………………………………………………………………………………………………………………………………………… 258‐262Office of Gaming Accountability & Development………………………………………………………………………………………………………………………………… 263‐265
Fixed CostsRetirement of Long Term Capital Debt………………………………………………………………………………………………………………………………………………. 266Long Term Debt Interest……………………………………………………………………………………………………………………………………………………………………… 267Short Term Debt Interest…………………………………………………………………………………………………………………………………………………………………… 268Retirement Board ‐ Non Contributory Pension and Pension Fund Contribution……………………………………………………………………………… 269Unemployment Compensation…………………………………………………………………………………………………………………………………………………………… 270
vii
Page
Table of ContentsFY 2017 Annual Budget
Employee Insurance ‐ Life Insurance, Health Insurance, A D & D Insurance………………………………………………………………………………………… 271FICA (Medicare)………………………………………………………………………………………………………………………………………………………………………………… 272Employee Injuries ‐ Active Police & Fire, Retired Police & Fire, Workers Compensation…………………………………………………………………… 273Property/Liability Insurance ‐ Comp General Liability, Insurance Deductibles……………………………………………………………………………………. 274Transfers…………………………………………………………………………………………………………………………………………………………………………………………… 275
Water and Sewer Enterprise FundWater and Sewer Enterprise Fund……………………………………………………………………………………………………………………………………………………… 276‐280Retirement of Long Term Capital Debt……………………………………………………………………………………………………………………………………………… 281Long Term Debt Interest……………………………………………………………………………………………………………………………………………………………………… 282Short Term Debt Interest…………………………………………………………………………………………………………………………………………………………………… 283Mass Water Resources Authority (MWRA)………………………………………………………………………………………………………………………………………… 284Transfers…………………………………………………………………………………………………………………………………………………………………………………………… 285
School DepartmentBudget Calendar ‐ Fiscal Year 2017……………………………………………………………………………………………………………………………………………………… 286Everett Public Schools Organizational Chart………………………………………………………………………………………………………………………………………… 287Everett Public Schools Mission Statement…………………………………………………………………………………………………………………………………………… 288‐299Everett Public Schools Adopted Fiscal 2017 Budget…………………………………………………………………………………………………………………………… 300‐322Everett Public Schools District Improvement Plan……………………………………………………………………………………………………………………………… 323‐337Massachusetts Department of Elementary and Secondary Education ‐ FY17 Chapter 70 Summary…………………………………………………… 338‐341Everett Public Schools Proposed Fiscal 2017 Budget ‐ Presentation to School Committee………………………………………………………………… 342‐345
Full‐Time Equivalent Headcount…………………………………………………………………………………………………………………………………………… 346
6. W/S Enterprise Fund ‐ Budget and Capital Improvement ProgramEnterprise Fund Overview…………………………………………………………………………………………………………………………………………………… 347Water/Sewer Enterprise Fund FY2017 Budget ‐ Presentation to City Council……………………………………………………………………… 348‐349Water and Sewer Rates………………………………………………………………………………………………………………………………………………………… 350
viii
Page
Table of ContentsFY 2017 Annual Budget
FY17 CIP Enterprise Funds ‐ Executive Summary………………………………………………………………………………………………………………… 351‐352City of Everett Capital Plan ‐ Enterprise Fund (Water/Sewer) Fiscal Year 2016 ‐ 2020………………………………………………………… 353Water/Sewer Pro Forma Debt Schedule……………………………………………………………………………………………………………………………… 354‐355MWRA Advisory Board 2015 Annual Water and Sewer Retail Rate Survey…………………………………………………………………………… 356‐363
7. Capital Improvement ProgramCapital Improvement Program Overview……………………………………………………………………………………………………………………………… 364Capital Improvement Program Mayor's Message………………………………………………………………………………………………………………… 365‐366Capital Improvement Program FY2016 ‐ FY2020 & FY2017 Capital Budget Overview ‐ Presentation to City Council…………… 367‐369FY2017 CIP ‐ General Fund Executive Summary…………………………………………………………………………………………………………………… 370‐373City of Everett Five Year Capital Improvement Program ‐ General Fund ‐ Fiscal Years 2016‐2020………………………………………… 374‐378City of Everett Impact Summary FY2017……………………………………………………………………………………………………………………………… 379‐381Everett Debt Service Projection ‐ FY2017 Projects ‐ General Fund……………………………………………………………………………………… 382‐384Capital Improvement Policies and Debt Policies…………….………………………………………………………………………………………………… 385‐386
8. Debt & Bond RatingCity of Everett Fixed Costs ‐ Debt………………………………………….……………………………………………………………………………………………… 387Understanding Municipal Debt………………………………………………………………………………………………………………………………………… 388‐392General Information on Debt Authorization and Legal Limit………………………………………………………………………………………………… 393‐395City of Everett, Massachusetts ‐ Fiscal Year 2017 Projected Principal & Interest Payments ‐ Net of MCWT Subsidy…………… 396‐398Long Term Debt Schedule as of June 30, 2016……………………………………………………………………………………………………………………… 399‐404Credit Rating Definitions & Frequently Asked Questions (FAQ's)………………………………………………………………………………………… 405‐407Analytical Framework ‐ Standard & Poor's Rating Services…………………………………………………………………………………………………… 408Summary: Everett, Massachusetts; General Obligation ‐ Standard & Poor's Rating Services………………………………………………… 409‐414
ix
Page
Table of ContentsFY 2017 Annual Budget
9. AppendixBudgeting and Accounting Practices…………………………………………………………………………………………………………………………………… 415‐419Government Wide and Fund Financial Statements……………………………………………………………………………………………………………… 420‐424Performance Management and Measurers………………………………………………………………………………………………………………………… 425‐426Departmental Fund Relationships………………………………………………………………………………………………………………………………………… 427‐428Major and Non‐Major Funds ‐ Changes in Fund Balance……………………………………………………………………………………………………… 429‐430Departmental Revolving Funds ‐ MGL Section 53E 1/2………………………………………………………………………………………………………… 431‐433Revolving Funds Council Order…………………………………………………………………………………………………………………………………………… 434‐435Organizational Structure……………………………………………………………...……………………………………………………………………………………… 436‐441
10. GlossaryGlossary of Terms………………………………………………………………………………………………………………………………………………………………… 442‐451
x
Mayor’s Message
CarloDeMariaMayor
CITY OF EVERETT Office of the Mayor Everett City Hall
484BroadwayEverett,MA02149‐3694Phone:(617)394‐2270Fax:(617)381‐1150
Dear Citizens and Honorable Members of the Council,
I am pleased to present you with the proposed FY2017 operating budget for the City of Everett. The proposed FY2017 budget totals $190,937,539, a 2% increase over the FY2016 adjusted budget. The largest increases are in fixed costs including debt service, pension costs and health insurance. In order to balance the FY2017 budget and address rising costs we are proposing the initial $5,000,000 received in 2016 from the Gaming Commissions host community agreement be used for capital related debt in 2017, a 2% increase in water and sewer rates and a 2.5% increase in the levy limit.
Together, we have done much to ensure our fiscal health. The rating agency Standard & Poor’s has affirmed the City’s excellent “AA” long‐term debt rating, citing our strong management and solid financial policies. This budget continues our tradition of managing our debt obligations and ensuring the most efficient use of taxpayer dollars.
We are a safer city, a more educated city, a city where businesses are investing and creating jobs, a city with a growing school population and a city that communities across the nation look to for ideas and inspiration.
1
As the founding fathers stated in the Federalist Papers that “a good government implies two things: first…the happiness of the people and second… the object by which that can best be attained.”
Exercise and proper nutrition is essential to our wellbeing. Those simple measures alone improve a sense of well being and reduce stress, anxiety, and depression.
Businesses also understand this. Healthy workers are more productive, happier and dramatically reduce health care costs for companies. The healthier we are, as a community, the more likely businesses are to locate here.
A Healthy City
My vision for Everett is to make us the healthiest city in America, reduce our health care costs and attract new businesses. This is one of the reasons Everett is becoming a boomtown and why we are seeing a large number of public and private investments in our city. Recently the Boston Globe Magazine named Everett one of the Top 10 spots to live and the Boston Business Journal named us the most diverse city in the Commonwealth. All this growth adds value to our tax base, generates new revenue and jobs that improves everyone’s quality of life.
At $19 million dollars, health care is the second largest expense for our city. And we have the highest obesity rate in the Commonwealth. We must take charge of the health of our citizenry and in turn help control our budget. All of this begins with good health and good health begins with eating well. We implemented a healthy vending policy for all of our schools. We built community gardens, and opened a local farmers’ market so that residents have access to affordable, locally grown produce. We started a Healthy Meals program that provides our residents with the convenience of healthy, affordable, precooked meals. To date we have already provided over 2,000 meals to busy, working families.
This year we opened one of the only municipal Health and Wellness Centers in the nation and already over 4,000 people have joined. For as little as $15.00 a month, an entire family can join a state‐of‐the‐art fitness facility with an indoor track, treadmills, bicycles, elliptical trainers, free weights, personal trainers and so much more. In particular, municipal employees are encouraged to take full advantage of this facility.
2
Right next to the Fitness Center, we have partnered with the Malden YMCA to create a teen center giving kids a chance to participate in positive after school activities.
For younger children we launched a BOKS program that includes movement drills, running, relay races, obstacle courses and strength movements. We know exercise is the single most powerful tool that we have to optimize brain function. In Everett, we are using every tool available to help ensure that every citizen has access to the resources to be healthy, both physically and mentally, to be successful and contribute to our community.
All this costs money, but we have leveraged our resources with federal and state grant money. For example the BOKS program was made possible by a grant to target childhood obesity from the US Conference of Mayors. I was honored to travel to Washington D.C. to accept this grant. Mayors from across the country congratulated me on the award and asked how they could get started.
Others around the nation are also recognizing Everett as a leader in creating healthy infrastructure. The Robert Wood Johnson Foundation awarded the City of Everett “The Culture of Health Prize” for innovative efforts in community engagement to help resident’s lead healthier lives. This year, we were also presented with the Kenneth E. Pickard Municipal Innovation Award from the Massachusetts Municipal Association for the city’s Health & Wellness Center.
Healthy people need healthy places and that is why Everett is investing millions in our parks, open spaces and recreational facilities. Last year, we completed the Everett portion of the Northern Strand Community bicycle trail and now users can travel safely from Everett through Malden, Revere, and Saugus to the Lynn line. We have applied for and were awarded a $150,000 grant from the Massachusetts Gaming Commission to connect the Northern Strand Community Trail to a Wynn Resort Riverwalk, which will connect to the Assembly Row T station and to Boston.
In addition, we are also working with the Massachusetts Department of Transportation to build multimodal paths from the Malden River Walk to Sullivan Station. All these connections will require little or no resources from the City of Everett, but will greatly benefit our residents, businesses and commuters.
Advocating for state, federal, and private funding to support the city’s priorities and strengthening relationships with the state and federal government and other entities to advance the city’s economic interests and opportunities is one of my top priorities. That is
3
why the City of Everett signed a Community Compact with the Commonwealth of Massachusetts. Through this compact, we committed to work aggressively on measures to address climate change; to preserve and promote open space and recreational opportunities for our residents, and to develop a policy around Complete Streets to promote walking and biking.
Everett has fully funded a Director of Public Policy who brought in several million dollars in state and federal grants to support projects and initiatives. Over the past year, the Director coordinated and developed strategies to advance large‐scale development like the Wynn project and a new elementary school. Because of the success of this effort, we have added a new position in this year’s budget for a full time grant writer to support our economic development and other efforts.
Capital Improvement Plan FY2017
We have also established a fiscally responsible Capital Improvement Program. For example, by analyzing every expense, we determined that we could save taxpayer dollars and provide more effective and efficient snow removal by purchasing 13 new vehicles and doing that job ourselves.
We have been blessed with leaders who have had the foresight to build public buildings that are truly unique, like the Shute Memorial Library and old Everett High School. We are honoring those leaders by investing capital dollars into restoring the Shute Library and repurposing the old high school into a state‐of‐the‐art Health and Wellness Center. We have also completed the first phase of work on the Central Fire House, a beautiful building that is a source of pride for all Everett residents.
We are investing in seven parks across Everett through our Capital Improvement Plan. These parks will provide much needed open space for residents and workers alike. Special places to play, enjoy lunch, or soak in the sun all around our city. We also know that properties located next to well‐maintained parks hold a much higher value and the amount of taxes people pay on these properties can be directly attributable to the presence of a park.
Construction is happening now on Florence Park and Day Park was recently completed. Construction on Meadows Park is underway and we are getting ready to begin work at Sacramone Park and Hughes Common. Design work on Swan Street and Gramstorf Parks will begin later this year.
4
We are also focusing on improving other areas of the city. Capital Improvement initiatives include repaving and repairing streets, sidewalks and continually working to improve the quality of life of our residents.
We will be renovating the Hancock Street Fire Station, the cafeteria at the Webster School, installing a new roof at the Whittier School and renovating six additional parks, improving and expanding the bike path with new street furniture, signage, lighting and bike racks.
We will be revitalizing and expanding the 7‐Acre Park and my goal is to build canoe and kayak launches on the Malden River. Soon, Wynn Resorts will be building additional boating facilities and public parks along our waterfront at no taxpayer expense. Much like we worked with our neighboring communities to build the Northern Strand Community bicycle trail, Everett will work with the Friends of the Malden River and the Mystic River Watershed to create a similar water trail for canoes and kayaks.
Stormwater runoff is now the number one pollutant of our waterways and one of the most difficult and costly to treat. Our investment in the Deer Island treatment plant has made Boston Harbor one of the cleanest harbors in the world today. But after heavy rains, pollutants from stormwater runoff are fouling our rivers and streams. Now that we are opening up public access to the Mystic and Malden Rivers and the harbor, we must ensure that the water is always clean, so that residents and visitors alike can fish, swim, kayak and enjoy the views.
Recently the United Sates Environmental Protection Agency released a new stormwater permit for Massachusetts’s communities. The MS4 permit will go into effect on July 1, 2017. It was estimated by the Massachusetts Water Infrastructure Finance Commission that it could take an estimated $18 billion in stormwater investments over the next 20 years for communities to meet the regulatory requirements. In Everett, we have submitted to USEPA and MADEP an integrated management plan for 63 projects that will cost an estimated $50 million over the next 40 years. To reduce treatment costs associated with the permit, public works will implement strategies to reduce impervious surfaces such as asphalt and concrete, so that the ground can absorb and filter polluted run‐off. We are examining a change in our residential zoning rules that currently force residents to pave yards to meet bedroom to parking spaces ratios.
In addition, we will implement a rain barrel program to capture stormwater and utilize capital improvement funds to remove illicit connections and reduce inflow of stormwater into our sewer system.
5
Recently we met with the EPA to begin discussions on implementing a stormwater utility fee based on impervious surface cover as an additional source of revenue to pay for the MS4 permit regulations. These efforts are the most cost effective way to ensuring our rivers are fishable and swimmable and to meet the US EPA’s stringent stormwater regulations. Cost of the Opioid Crisis My Administration is committed at every level and at every department to work to combat this statewide epidemic. I appreciate the City Council support and leadership on this issue. Together, Everett continues to do what we can to assist those in our community battling addiction. We are also working to stop addiction before it begins with non‐profit partners such as Everett Overcoming Addiction, TEASA, the Cambridge Health Alliance, and others. We recently received a $425,000 grant to prevent the misuse of prescription drugs by teens and young adults. Addiction impacts all of us including the budgets of our police, fire, emergency services, and schools. Financial Health of the City In order to ensure the physical health and wellness of our residents we must continue the progress we have made on the fiscal health of our city. With over $5 million dollars in surplus, a stellar bond rating, healthy financial reserves, and increasing development, we have done much to ensure our fiscal health. We must continue to focus on managing our debt obligations and ensuring the most efficient use of taxpayer dollars. In fact this past year, the City of Everett refinanced $6 million dollars of existing debt which saved the city almost $400,000 in debt service. That savings allows us to invest more in our schools, public safety and basic city services. In addition, the city sold $18 million dollars in general obligation bonds with an average interest rate of 2%. Prior to the sale, Standard & Poor’s affirmed the City’s ‘AA’ long‐term debt rating. S&P cited the City’s strong management and solid financial policies and practices as positive credit factors.
6
Last year the Government Finance Officers Association (GFOA) awarded a Certificate of Achievement for Excellence in Financial Reporting to the City of Everett. The city also received the Association’s Distinguished Budget Presentation Award for our annual budget document. This was the second year the city had received such a prestigious award. In addition, I have directed the Finance Department to establish a formal Cash and Investment Policy. The development of this policy is fundamental to sound financial management. The policy will provide for strong internal controls, adherence to state investment law and highlight the city’s approach to investments. I have also directed the Finance Department to centralize and strengthen internal approval processes and establish formal written policies and procedures for city employees who have responsibility for any aspect of purchasing, accounting or financial operations of the city. A More Efficient Everett Efficiencies will be implemented this year that include cross‐training personnel who have been relocated. We are seeing the benefits of this in our Collector’s office, where residents can come to City Hall and make tax payments, pay parking tickets or water bills all in one place. We are implementing new technology to make access to government easier and more efficient in nearly every department. The state has provided us with a technical assistance grant of $27,000 for software and related consulting services for the administration of snow clearing operations. This software will greatly reduce costs by streamlining snowstorm operations and automate the invoicing process. We will expand our online application, payment and registration programs to include all bills, permits and fees, as well as registrations for city programs. Our inspectors will now be equipped with tablets with real time information. We have developed a new software system for online access for building permits and inspectional services, and will soon expand online access to our Planning Department, Health Department, the City Clerk’s Office and Zoning Board of Appeals.
7
We have also introduced electronic work orders, implemented interactive constituent services software and will implement a citywide 311 system. All of these systems will reduce costs and make City Hall much more efficient and effective. We are literally tearing down the walls of municipal government and making it more accessible to all.
Public Safety
Preventing crime before it occurs costs less and is immeasurably better for all parties than incarceration. This year Everett launched Cops Corner at the High School during lunch period. The goal is to build rapport between our officers and students by sharing a meal and creating trusting relationships.
This compliments the establishment of the Everett Police Community Partnership Council that we launched in January. The Partnership Council is made up of a diverse group of individuals to ensure that our Police Department is reaching out to all segments of the Everett community and hearing their concerns. Our department is also using cutting edge technology to reduce crime and social media to interact with the public. The department is ranked second, only to Boston, in active followers on their Facebook page.
Along with smarter policing we are investing in our human capital. The FY2017 budget will fund 10 new police officers and 12 new firefighters. These new public safety officers will ensure we are meeting the evolving needs of a fast‐growing city. In addition, we will provide our Police Department with 6 new state‐of‐the‐art police cruisers.
Planning and Community Development
Critical to making our community an even more dynamic and sustainable urban center for years to come is providing the Planning and Development department with the necessary tools for professional services. We are poised for rapid growth and development, and the decisions we make now will impact the city for generations to come. This year’s increase will help the department enhance community engagement efforts, promote technology innovations, advance affordable housing, support small businesses with technical assistance services, and hire specialized consultants to assist with our neighborhood and master planning efforts.
8
The Planning and Development department is currently working with stakeholders to look at how to preserve and improve Everett Square. As our center of civic and commercial activity, the Square provides some of the greatest potential for new housing, commercial and mixed‐use development. Imagine a Broadway lined with new trees, historic lighting, open air restaurants with outdoor seating, storefronts painted in historic colors with brightly lit windows and awnings and planted flower beds in front of businesses.
I am excited to begin Everett’s first master plan in over 50 years. I want to be sure that we are capturing every opportunity to take advantage of the dramatic new developments happening in our city.
We have successfully created developmental studies and proposals such as our award‐winning Lower Broadway Master Plan, our Municipal Harbor Plan, our newly released Commercial Triangle Master Plan and our comprehensive Housing Development Plan. All these plans are our road map to attract developers and businesses and increase our tax base.
Last fall, the Massachusetts Department of Transportation began studying the transit needs of the people of Everett ‐ where people need to go and how they get there.
We all know that we have the advantage of geography ‐ we are only a couple of miles from downtown Boston, 12 minutes from Logan Airport and we are located within a vibrant, thriving region of the Commonwealth. We are the next growth area in Greater Boston.
However, we are the only urban core community that is not linked into the transit system by rail. By studying and planning for ways to extend transit in Everett, the Department of Transportation is helping to position us to unlock huge development potential.
Transportation and interconnection amongst communities, whether through rail, bus, bike paths, pedestrian footbridges, or any other mode is the key to commerce, economic development, and an improved quality of life for all of our residents. Can you imagine a new commuter rail stop, a pedestrian bridge to Assembly Row T‐station, and trolley service into Boston? By working with Mass DOT we can make these possibilities a reality.
9
In the meantime we are working to improve the transportation system we currently have. We started a Complete Streets Program; we hired a transportation planner, instituted a pavement management system, implemented Trip Loop technology to upgrade traffic signals to reduce congestion on our major thoroughfares and started the city’s first traffic congestion database.
We have begun design work on major intersections including Sweetser Circle, Santilli Circle, lower Broadway and Ferry Street, for which we have secured a $14 million commitment from the state.
Inspectional Services and Quality of Life
Inspectional Services is focused on code violations that negatively impact the quality of life for residents and businesses. We are proactively addressing issues such as absentee landlords, back taxes, graffiti abandoned properties and other issues. We are working with residents and developers to restore and transform blighted buildings.
To combat vacant and blighted properties that drive down property values and destroy people’s pride in our neighborhoods, this year’s budget includes a new wiring inspector, a new gas inspector and new code enforcement officers. In addition, we are adding a new housing attorney to our legal team, who will head up our problem properties task force. These additions to our Inspectional Services Department and Solicitor’s Department will go a long way in maintaining responsible owner’s property values and improving the health and safety of our residents. We must ensure that our quality of life continues to climb and grow.
To continue this growth the City of Everett began a Home Beautification Program to enforce the Massachusetts’ sanitary code. Our Inspectional Services Department issues letters to residents whose homes violate regulations. The city recommends home improvements such as new paint, repairs to broken gutters and sinking porches, removal of overgrown vegetation, etc. The residents are advised to clean up any structural elements that may be dangerous to passers‐by. The goal of the Home Beautification Program is to improve a property’s value and the value of surroundings properties, enrich the appearance of a neighborhood and create a healthy and safe living environment. To date, 28 houses have been completely updated to city standards and several more are under construction. Because of efforts like these, Everett was recently named one of the top ten spots to live in Massachusetts
10
Education and Schools
One of the keys to our increasing property values is the strength of our schools. Today we have one of the best urban education systems in the state, we are among the top performers and have one of the highest graduation rates over 85%, with a low dropout rate of only 3.2% and that includes students from around the world, who speak English as a second language. Our school leaders should be recognized and commended for this.
Educational expenses represent by far the largest portion of the budget at $73.5 million dollars, as the city continues to commit substantial resources to this critical area for our children and families. Providing the best education to our children is our most important goal. This is why we have committed an additional $1.5 million dollars in FY2017, above the School Foundation Budget. Throughout my tenure as Mayor, education has always remained a budget priority. In fact, over the past seven years my administration has provided over $36 million dollars above required net school spending. The additional school funding will assist with the demands of an ever‐increasing school population.
To accommodate our new growth, last summer we built five new bathrooms and four new classrooms at the Parlin School. We have built a new tot lot at the Webster School and we are embracing new technology by providing every teaching space in our school system with interactive white boards. As we grow, we will continue to make capital improvements throughout the entire school system.
But that is not enough; we must plan and construct new school facilities to meet our growing school population. Currently, we are in the beginning stages of a feasibility study examining our schools.
New Economic Development
Developers have already built or are building hundreds of units of market rate housing, representing substantial multi‐million dollar investments such as the Batchyard, and Wellington Apartments. These successful projects provided the spark to private investors to build in Everett, most significantly, Wynn Resorts.
11
Critical to making our community an even more dynamic and sustainable urban center for years to come is providing the Planning and Development department with the necessary tools for professional services. The decisions we make now will impact the city for generations to come. This year’s increase will help the department enhance community engagement efforts, promote technology innovations, advance affordable housing, support small businesses with technical assistance services, and hire specialized consultants to assist with our neighborhood and master planning efforts.
But I also want to ensure that we remain diverse, inclusive and accessible to all. That is our strength as a city. We are currently working to implement an inclusionary zoning policy. This policy will ensure that when large‐scale residential developments are planned in the city, the developer will be required to include a certain percentage of affordable units for working families.
We are also working to grow our commercial tax base by marketing unique urban business areas like the Village Industrial Area with Night Shift and Bone Up Breweries, Shortpath Distillery, Metro Rock Climbing Gym and Skyzone.
Everett has unrealized opportunities for growth in Island End and waterfront industrial areas. We recently attracted one of the fastest growing companies in the world, AmazonFresh. This company brings one hundred new jobs into Everett – one hundred new workers, shopping in our stores, eating in restaurants and buying homes in our community.
Also adding to our growth is the redevelopment of the former Harley Davidson building into apartments and the Market Forge site is currently being remediated. Soon we will see our first hotel open on Revere Beach Parkway that will generate room and meals taxes. In addition, the EnVision Hotel is bringing both visitors and job opportunities for building trades and hospitality workers. When the hotel opens in the next few months it will also help attract new shops and restaurants to Everett – there has never been a better time to invest in Everett than right now.
My vision is about creating a hospitality economy for the City of Everett. At the center of this vision is the Wynn Resort.
Wynn has completed most of the environmental remediation of the Monsanto chemical plant site, at their expense. This was one of the most undervalued sites in Massachusetts and soon will become one of the most valuable. It was the largest, undeveloped site in Everett, which has sat for decades – untouched due to contamination. The Wynn development team has already hauled over 300 truckloads of contaminated soil out of Everett ‐‐ helping our city to become cleaner and greener in the process.
12
Wynn is supporting a healthier Everett by providing the resources and infrastructure needed to make our harbor and river ways accessible to all.
Wynn Everett will be a world‐class destination resort, attracting tourists from all over the world. The $2 billion development is the largest private development underway in all of New England. We have already received our first host community payment of $5 million dollars and will receive another $25 million. Once the resort opens, it will generate millions of dollars in taxes; improve property values and additional growth for the City of Everett. It will also bring real jobs for Everett residents ‐ 4,000 construction jobs and 4,000 hospitality jobs when the resort opens.
As the Wynn development progresses, it puts pressure on the city to provide services at a scale that would not otherwise be needed. To meet the demand, we have hired outside vendors to provide those services. For example, 4LEAF, LLC, will provide specialized inspectional services for the development. Although the city is required to pay 4LEAF for those services, all related expenses will be fully reimbursed by Wynn. The services will not cost the city anything.
Everett is a city of pride, progress, and possibilities. I am very proud of the progress we have made and proud of the foundation we have laid for possibilities yet to come. Most of all I am proud of our collective health, our physical health, our fiscal health, our intellectual health, and our environmental health.
This budget helps to continue the strong momentum we have achieved over the past several years.
I am confident that with the FY2017 budget, Everett will continue to provide our residents with the best services in the Commonwealth in a fiscally prudent and responsible manner.
Respectfully submitted,
Mayor Carlo DeMaria City of Everett, Massachusetts
13
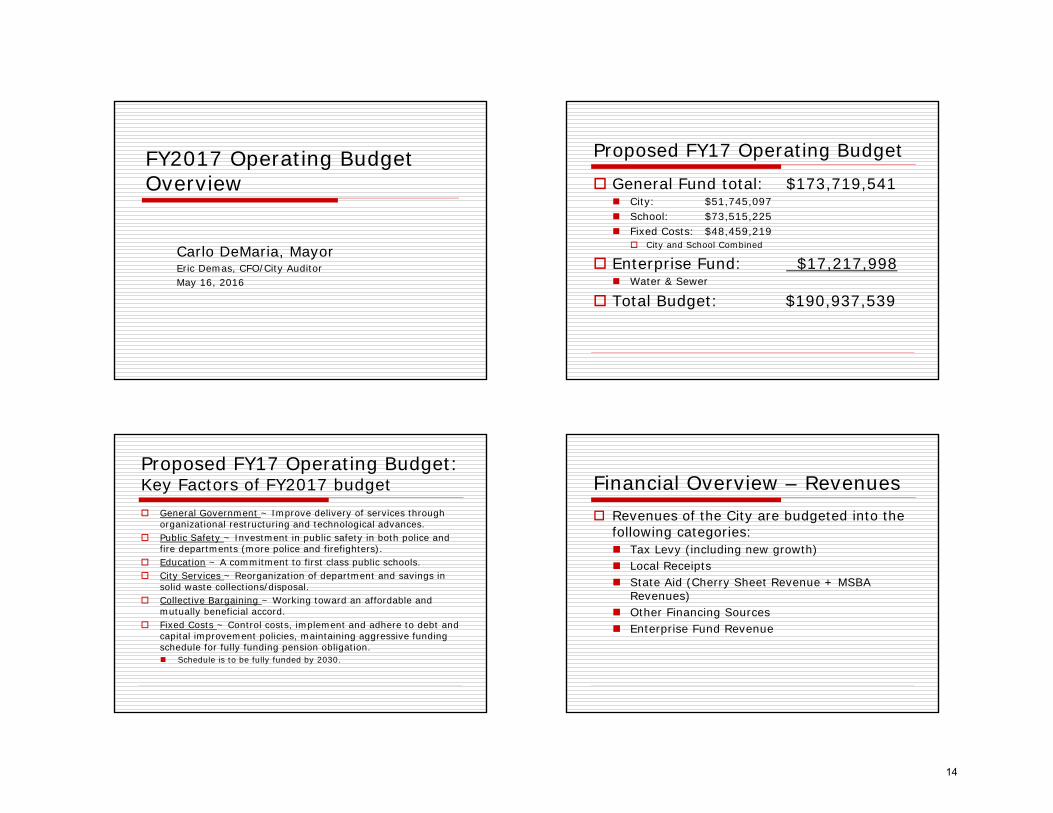
FY2017 Operating Budget Overview
Carlo DeMaria, MayorEric Demas, CFO/City AuditorMay 16, 2016
Proposed FY17 Operating Budget
General Fund total: $173,719,541 City: $51,745,097 School: $73,515,225 Fixed Costs: $48,459,219
City and School Combined
Enterprise Fund: $17,217,998 Water & Sewer
Total Budget: $190,937,539
Proposed FY17 Operating Budget:Key Factors of FY2017 budget General Government ~ Improve delivery of services through
organizational restructuring and technological advances. Public Safety ~ Investment in public safety in both police and
fire departments (more police and firefighters). Education ~ A commitment to first class public schools. City Services ~ Reorganization of department and savings in
solid waste collections/disposal. Collective Bargaining ~ Working toward an affordable and
mutually beneficial accord. Fixed Costs ~ Control costs, implement and adhere to debt and
capital improvement policies, maintaining aggressive fundingschedule for fully funding pension obligation. Schedule is to be fully funded by 2030.
Financial Overview – Revenues Revenues of the City are budgeted into the
following categories: Tax Levy (including new growth) Local Receipts State Aid (Cherry Sheet Revenue + MSBA
Revenues) Other Financing Sources Enterprise Fund Revenue
14
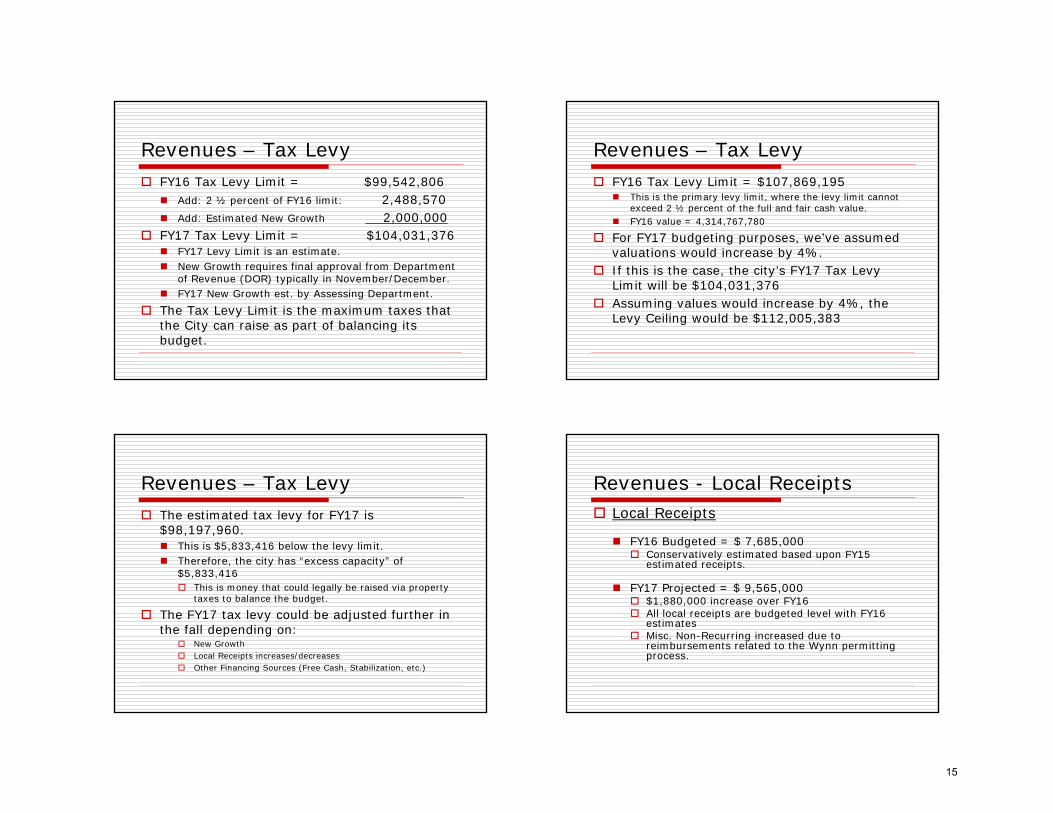
Revenues – Tax Levy FY16 Tax Levy Limit = $99,542,806
Add: 2 ½ percent of FY16 limit: 2,488,570 Add: Estimated New Growth 2,000,000
FY17 Tax Levy Limit = $104,031,376 FY17 Levy Limit is an estimate. New Growth requires final approval from Department
of Revenue (DOR) typically in November/December. FY17 New Growth est. by Assessing Department.
The Tax Levy Limit is the maximum taxes thatthe City can raise as part of balancing its budget.
Revenues – Tax Levy FY16 Tax Levy Limit = $107,869,195
This is the primary levy limit, where the levy limit cannotexceed 2 ½ percent of the full and fair cash value.
FY16 value = 4,314,767,780
For FY17 budgeting purposes, we’ve assumedvaluations would increase by 4%.
If this is the case, the city’s FY17 Tax LevyLimit will be $104,031,376
Assuming values would increase by 4%, theLevy Ceiling would be $112,005,383
Revenues – Tax Levy The estimated tax levy for FY17 is
$98,197,960. This is $5,833,416 below the levy limit. Therefore, the city has “excess capacity” of
$5,833,416 This is money that could legally be raised via property
taxes to balance the budget.
The FY17 tax levy could be adjusted further inthe fall depending on:
New Growth Local Receipts increases/decreases Other Financing Sources (Free Cash, Stabilization, etc.)
Revenues - Local Receipts Local Receipts
FY16 Budgeted = $ 7,685,000 Conservatively estimated based upon FY15
estimated receipts.
FY17 Projected = $ 9,565,000 $1,880,000 increase over FY16 All local receipts are budgeted level with FY16
estimates Misc. Non-Recurring increased due to
reimbursements related to the Wynn permittingprocess.
15
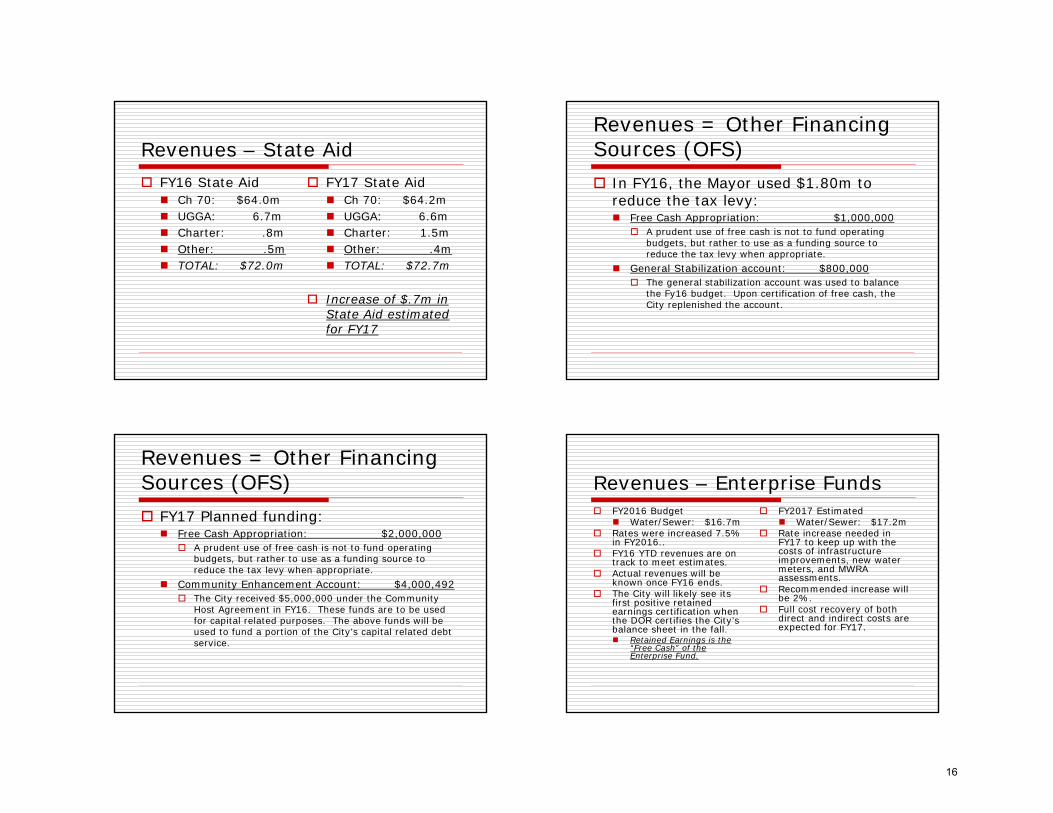
Revenues – State Aid FY16 State Aid Ch 70: $64.0m UGGA: 6.7m Charter: .8m Other: .5m TOTAL: $72.0m
FY17 State Aid Ch 70: $64.2m UGGA: 6.6m Charter: 1.5m Other: .4m TOTAL: $72.7m
Increase of $.7m inState Aid estimatedfor FY17
Revenues = Other Financing Sources (OFS) In FY16, the Mayor used $1.80m to
reduce the tax levy: Free Cash Appropriation: $1,000,000
A prudent use of free cash is not to fund operatingbudgets, but rather to use as a funding source toreduce the tax levy when appropriate.
General Stabilization account: $800,000 The general stabilization account was used to balance
the Fy16 budget. Upon certification of free cash, theCity replenished the account.
Revenues = Other Financing Sources (OFS) FY17 Planned funding:
Free Cash Appropriation: $2,000,000 A prudent use of free cash is not to fund operating
budgets, but rather to use as a funding source toreduce the tax levy when appropriate.
Community Enhancement Account: $4,000,492 The City received $5,000,000 under the Community
Host Agreement in FY16. These funds are to be usedfor capital related purposes. The above funds will beused to fund a portion of the City’s capital related debtservice.
Revenues – Enterprise Funds FY2016 Budget
Water/Sewer: $16.7m Rates were increased 7.5%
in FY2016.. FY16 YTD revenues are on
track to meet estimates. Actual revenues will be
known once FY16 ends. The City will likely see its
first positive retained earnings certification whenthe DOR certifies the City’sbalance sheet in the fall. Retained Earnings is the
“Free Cash” of the Enterprise Fund.
FY2017 Estimated Water/Sewer: $17.2m
Rate increase needed inFY17 to keep up with the costs of infrastructure improvements, new watermeters, and MWRA assessments.
Recommended increase willbe 2%.
Full cost recovery of bothdirect and indirect costs are expected for FY17.
16
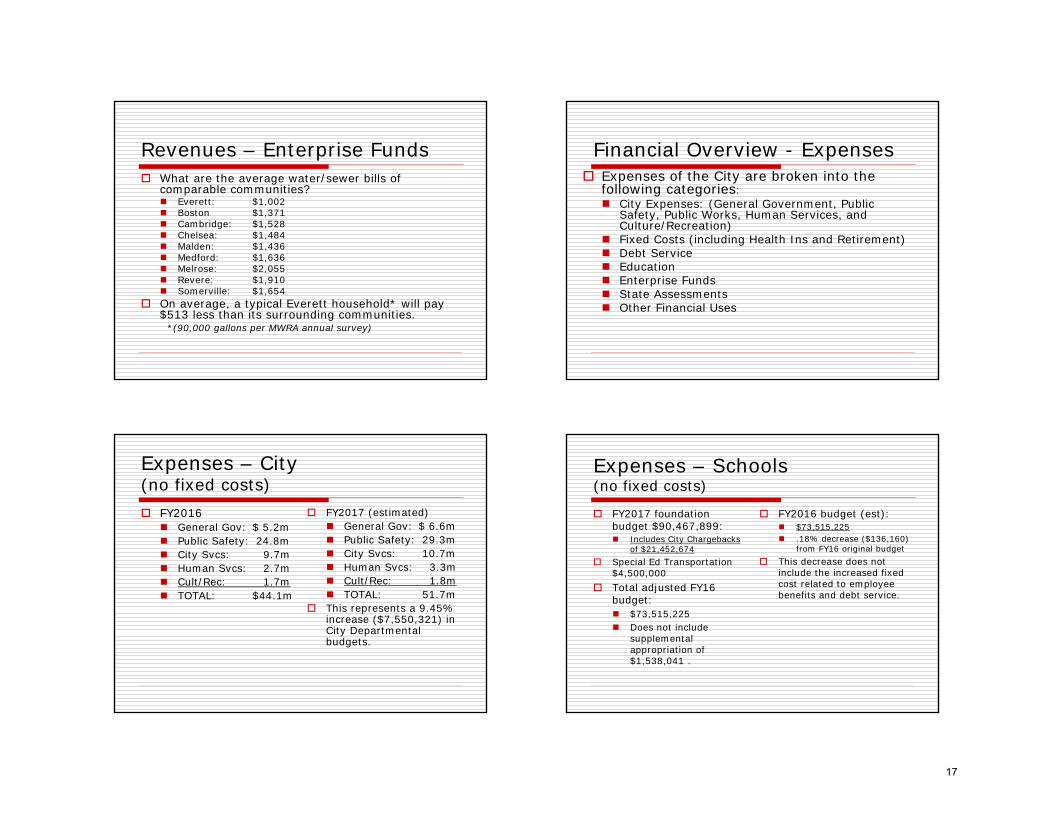
Revenues – Enterprise Funds What are the average water/sewer bills of
comparable communities? Everett: $1,002 Boston $1,371 Cambridge: $1,528 Chelsea: $1,484 Malden: $1,436 Medford: $1,636 Melrose: $2,055 Revere: $1,910 Somerville: $1,654
On average, a typical Everett household* will pay$513 less than its surrounding communities.
*(90,000 gallons per MWRA annual survey)
Financial Overview - Expenses Expenses of the City are broken into the
following categories: City Expenses: (General Government, Public
Safety, Public Works, Human Services, andCulture/Recreation)
Fixed Costs (including Health Ins and Retirement) Debt Service Education Enterprise Funds State Assessments Other Financial Uses
Expenses – City (no fixed costs) FY2016
General Gov: $ 5.2m Public Safety: 24.8m City Svcs: 9.7m Human Svcs: 2.7m Cult/Rec: 1.7m TOTAL: $44.1m
FY2017 (estimated) General Gov: $ 6.6m Public Safety: 29.3m City Svcs: 10.7m Human Svcs: 3.3m Cult/Rec: 1.8m TOTAL: 51.7m
This represents a 9.45%increase ($7,550,321) inCity Departmentalbudgets.
Expenses – Schools(no fixed costs)
FY2017 foundationbudget $90,467,899: Includes City Chargebacks
of $21,452,674 Special Ed Transportation
$4,500,000 Total adjusted FY16
budget: $73,515,225 Does not include
supplementalappropriation of$1,538,041 .
FY2016 budget (est): $73,515,225 .18% decrease ($136,160)
from FY16 original budget This decrease does not
include the increased fixedcost related to employeebenefits and debt service.
17
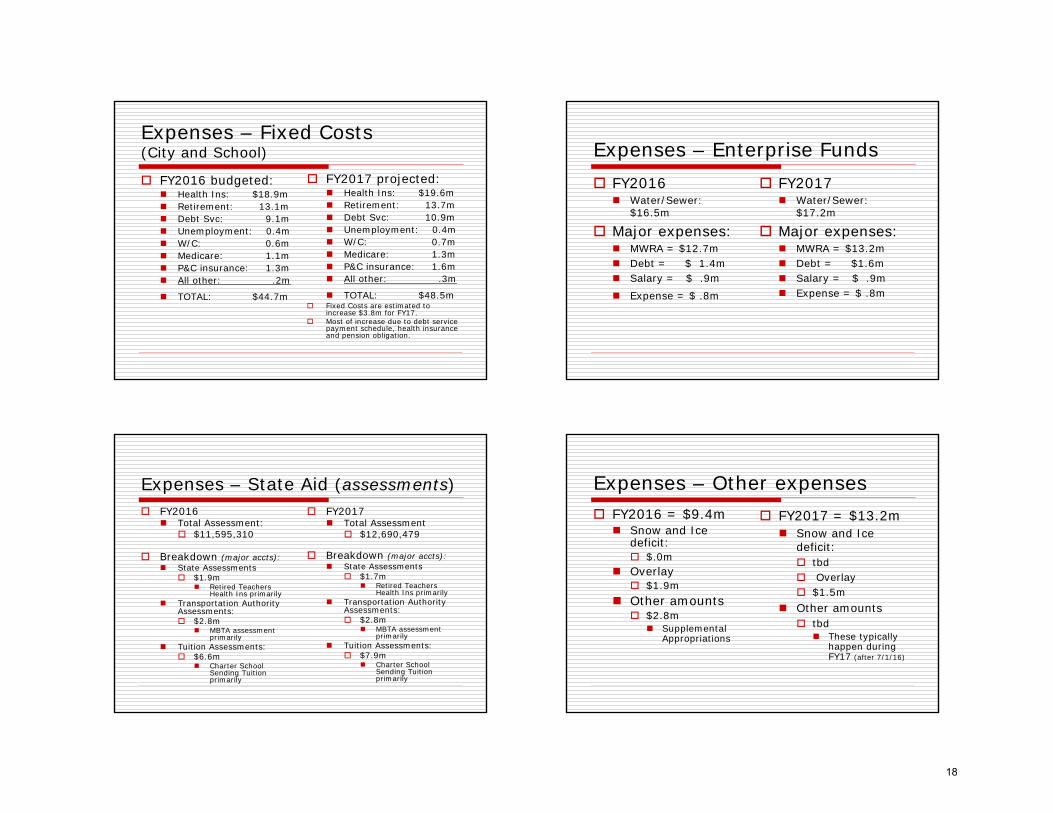
Expenses – Fixed Costs(City and School)
FY2016 budgeted: Health Ins: $18.9m Retirement: 13.1m Debt Svc: 9.1m Unemployment: 0.4m W/C: 0.6m Medicare: 1.1m P&C insurance: 1.3m All other: .2m
TOTAL: $44.7m
FY2017 projected: Health Ins: $19.6m Retirement: 13.7m Debt Svc: 10.9m Unemployment: 0.4m W/C: 0.7m Medicare: 1.3m P&C insurance: 1.6m All other: .3m
TOTAL: $48.5m Fixed Costs are estimated to
increase $3.8m for FY17. Most of increase due to debt service
payment schedule, health insurance and pension obligation.
Expenses – Enterprise Funds FY2016
Water/Sewer:$16.5m
Major expenses: MWRA = $12.7m Debt = $ 1.4m Salary = $ .9m Expense = $ .8m
FY2017 Water/Sewer:
$17.2m
Major expenses: MWRA = $13.2m Debt = $1.6m Salary = $ .9m Expense = $ .8m
Expenses – State Aid (assessments) FY2016
Total Assessment: $11,595,310
Breakdown (major accts): State Assessments
$1.9m Retired Teachers
Health Ins primarily Transportation Authority
Assessments: $2.8m
MBTA assessmentprimarily
Tuition Assessments: $6.6m
Charter School Sending Tuitionprimarily
FY2017 Total Assessment
$12,690,479
Breakdown (major accts): State Assessments
$1.7m Retired Teachers
Health Ins primarily Transportation Authority
Assessments: $2.8m
MBTA assessmentprimarily
Tuition Assessments: $7.9m
Charter School Sending Tuitionprimarily
Expenses – Other expenses FY2016 = $9.4m Snow and Ice
deficit: $.0m
Overlay $1.9m
Other amounts $2.8m Supplemental
Appropriations
FY2017 = $13.2m Snow and Ice
deficit: tbd Overlay $1.5m
Other amounts tbd These typically
happen duringFY17 (after 7/1/16)
18
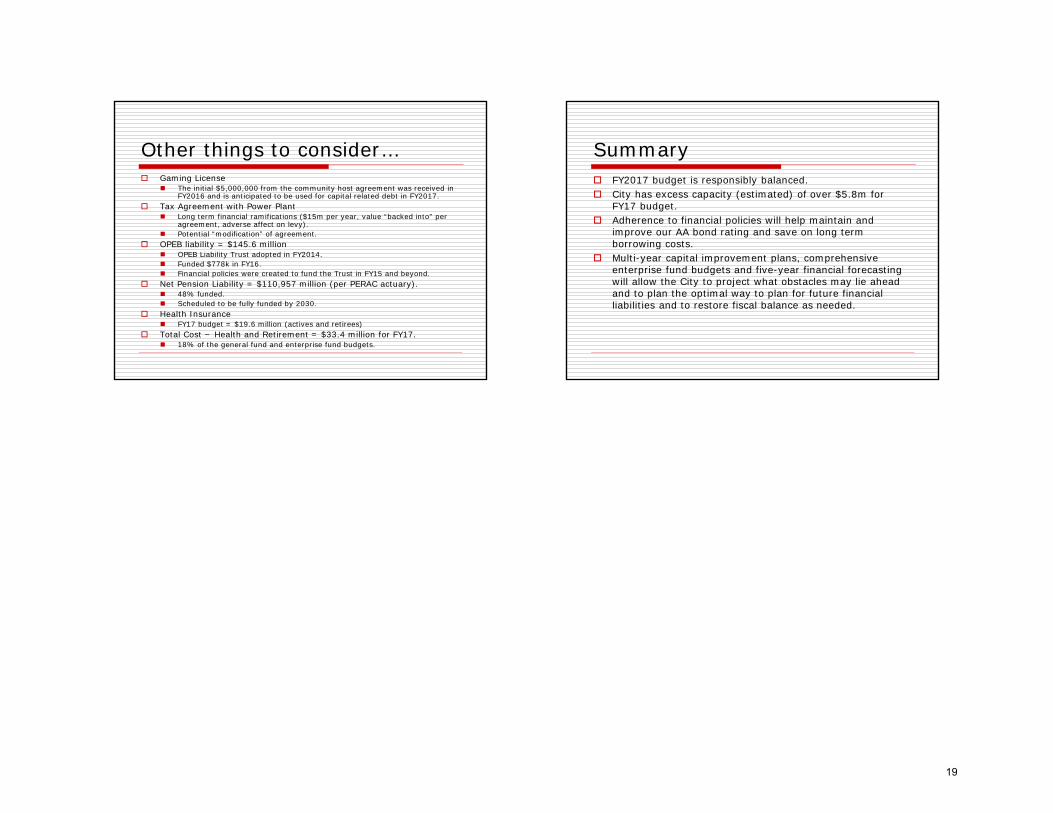
Other things to consider… Gaming License
The initial $5,000,000 from the community host agreement was received inFY2016 and is anticipated to be used for capital related debt in FY2017.
Tax Agreement with Power Plant Long term financial ramifications ($15m per year, value “backed into” per
agreement, adverse affect on levy). Potential “modification” of agreement.
OPEB liability = $145.6 million OPEB Liability Trust adopted in FY2014. Funded $778k in FY16. Financial policies were created to fund the Trust in FY15 and beyond.
Net Pension Liability = $110,957 million (per PERAC actuary). 48% funded. Scheduled to be fully funded by 2030.
Health Insurance FY17 budget = $19.6 million (actives and retirees)
Total Cost ~ Health and Retirement = $33.4 million for FY17. 18% of the general fund and enterprise fund budgets.
Summary FY2017 budget is responsibly balanced. City has excess capacity (estimated) of over $5.8m for
FY17 budget. Adherence to financial policies will help maintain and
improve our AA bond rating and save on long termborrowing costs.
Multi-year capital improvement plans, comprehensiveenterprise fund budgets and five-year financial forecastingwill allow the City to project what obstacles may lie aheadand to plan the optimal way to plan for future financialliabilities and to restore fiscal balance as needed.
19
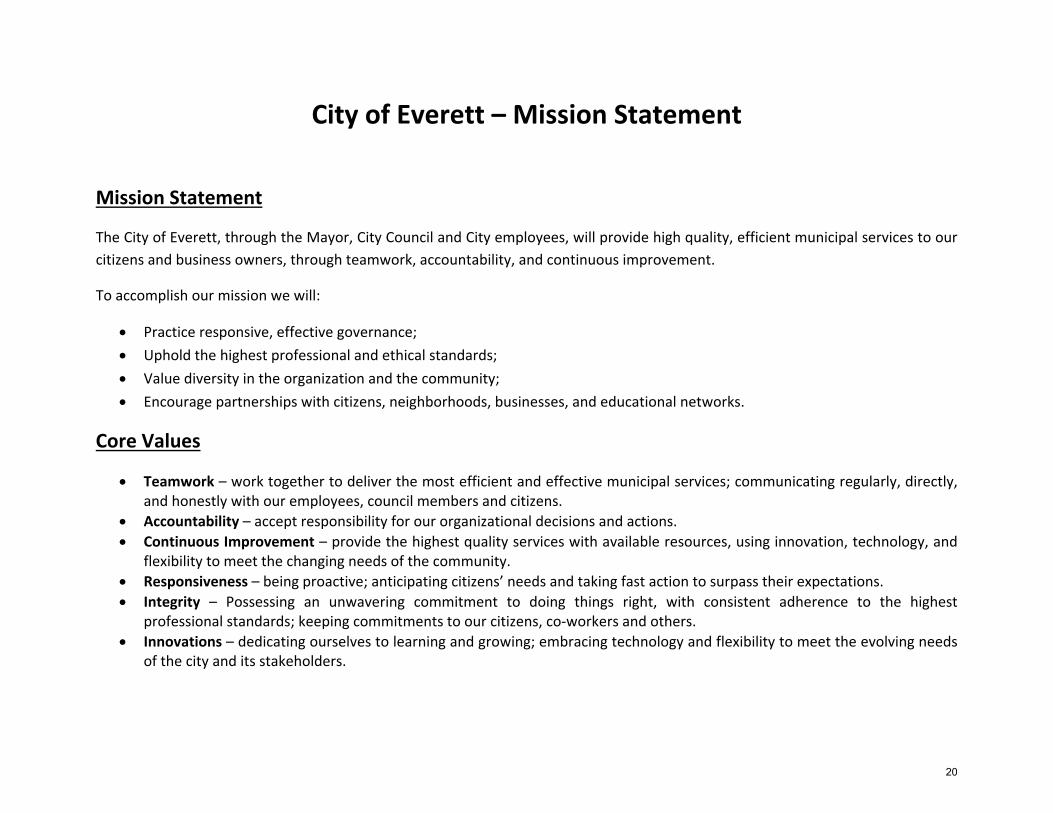
City of Everett – Mission Statement
Mission Statement
The City of Everett, through the Mayor, City Council and City employees, will provide high quality, efficient municipal services to our citizens and business owners, through teamwork, accountability, and continuous improvement.
To accomplish our mission we will:
Practice responsive, effective governance; Uphold the highest professional and ethical standards; Value diversity in the organization and the community; Encourage partnerships with citizens, neighborhoods, businesses, and educational networks.
Core Values
Teamwork – work together to deliver the most efficient and effective municipal services; communicating regularly, directly, and honestly with our employees, council members and citizens.
Accountability – accept responsibility for our organizational decisions and actions. Continuous Improvement – provide the highest quality services with available resources, using innovation, technology, and
flexibility to meet the changing needs of the community. Responsiveness – being proactive; anticipating citizens’ needs and taking fast action to surpass their expectations. Integrity – Possessing an unwavering commitment to doing things right, with consistent adherence to the highest
professional standards; keeping commitments to our citizens, co‐workers and others. Innovations – dedicating ourselves to learning and growing; embracing technology and flexibility to meet the evolving needs
of the city and its stakeholders.
20
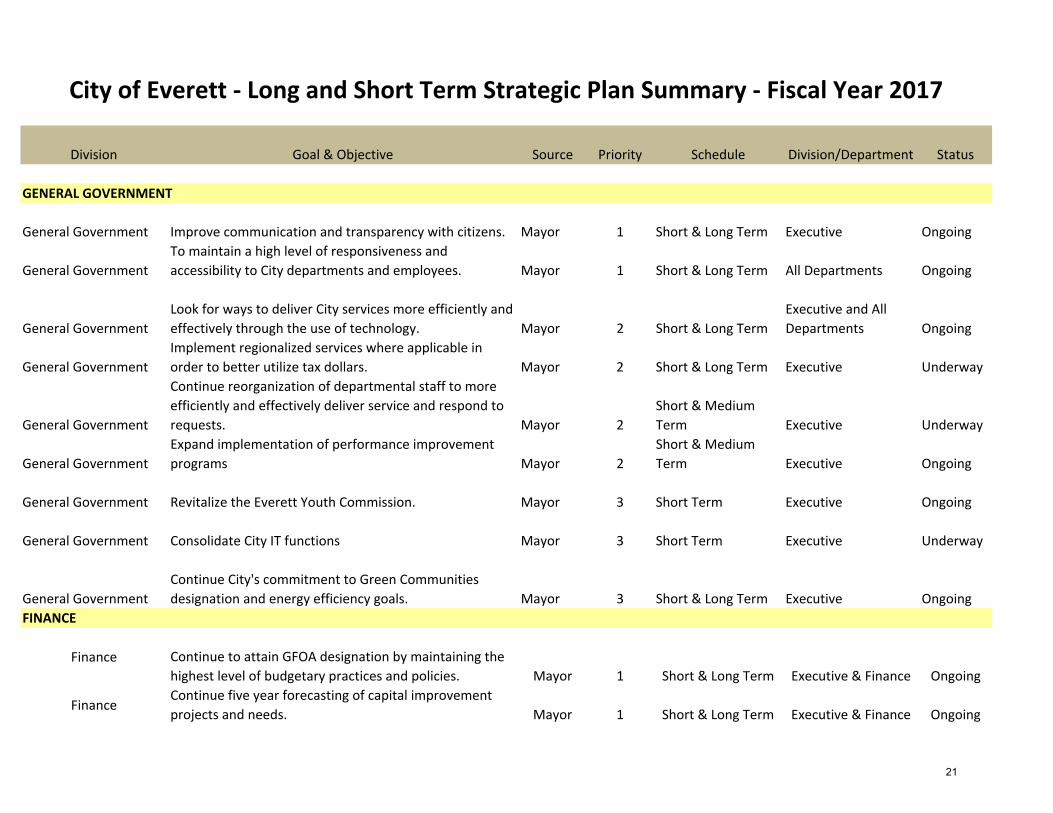
Division Goal & Objective Source Priority Schedule Division/Department Status
GENERAL GOVERNMENT
General Government Improve communication and transparency with citizens. Mayor 1 Short & Long Term Executive Ongoing
General GovernmentTo maintain a high level of responsiveness and accessibility to City departments and employees. Mayor 1 Short & Long Term All Departments Ongoing
General GovernmentLook for ways to deliver City services more efficiently and effectively through the use of technology. Mayor 2 Short & Long Term
Executive and All Departments Ongoing
General GovernmentImplement regionalized services where applicable in order to better utilize tax dollars. Mayor 2 Short & Long Term Executive Underway
General Government
Continue reorganization of departmental staff to more efficiently and effectively deliver service and respond to requests. Mayor 2
Short & Medium Term Executive Underway
General GovernmentExpand implementation of performance improvement programs Mayor 2
Short & Medium Term Executive Ongoing
General Government Revitalize the Everett Youth Commission. Mayor 3 Short Term Executive Ongoing
General Government Consolidate City IT functions Mayor 3 Short Term Executive Underway
General GovernmentContinue City's commitment to Green Communities designation and energy efficiency goals. Mayor 3 Short & Long Term Executive Ongoing
FINANCE
Finance Continue to attain GFOA designation by maintaining the highest level of budgetary practices and policies. Mayor 1 Short & Long Term Executive & Finance Ongoing
FinanceContinue five year forecasting of capital improvement projects and needs. Mayor 1 Short & Long Term Executive & Finance Ongoing
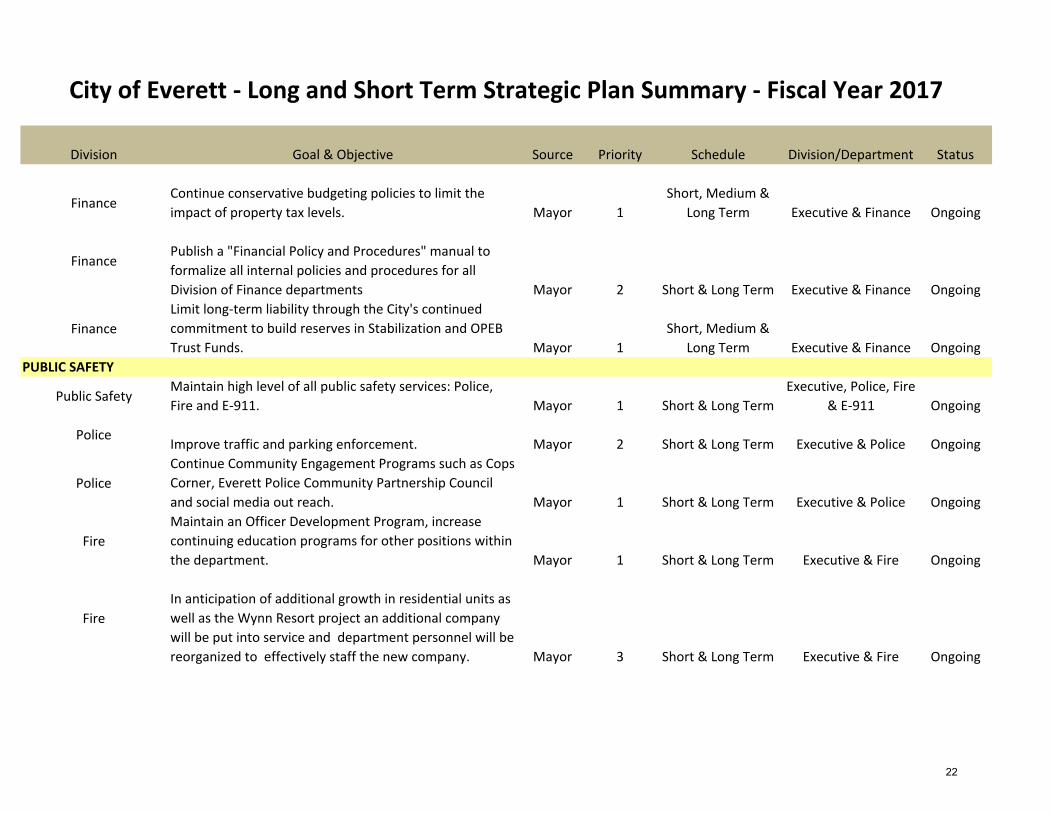
City of Everett ‐ Long and Short Term Strategic Plan Summary ‐ Fiscal Year 2017
21
Division Goal & Objective Source Priority Schedule Division/Department Status
City of Everett ‐ Long and Short Term Strategic Plan Summary ‐ Fiscal Year 2017
FinanceContinue conservative budgeting policies to limit the impact of property tax levels. Mayor 1
Short, Medium & Long Term Executive & Finance Ongoing
FinancePublish a "Financial Policy and Procedures" manual to formalize all internal policies and procedures for all Division of Finance departments Mayor 2 Short & Long Term Executive & Finance Ongoing
FinanceLimit long‐term liability through the City's continued commitment to build reserves in Stabilization and OPEB Trust Funds. Mayor 1
Short, Medium & Long Term Executive & Finance Ongoing
PUBLIC SAFETY
Public SafetyMaintain high level of all public safety services: Police, Fire and E‐911. Mayor 1 Short & Long Term
Executive, Police, Fire & E‐911 Ongoing
PoliceImprove traffic and parking enforcement. Mayor 2 Short & Long Term Executive & Police Ongoing
PoliceContinue Community Engagement Programs such as Cops Corner, Everett Police Community Partnership Council and social media out reach. Mayor 1 Short & Long Term Executive & Police Ongoing
FireMaintain an Officer Development Program, increase continuing education programs for other positions within the department. Mayor 1 Short & Long Term Executive & Fire Ongoing
FireIn anticipation of additional growth in residential units as well as the Wynn Resort project an additional company will be put into service and department personnel will be reorganized to effectively staff the new company. Mayor 3 Short & Long Term Executive & Fire Ongoing
22
Division Goal & Objective Source Priority Schedule Division/Department Status
City of Everett ‐ Long and Short Term Strategic Plan Summary ‐ Fiscal Year 2017
INSPECTIONAL SERVICES
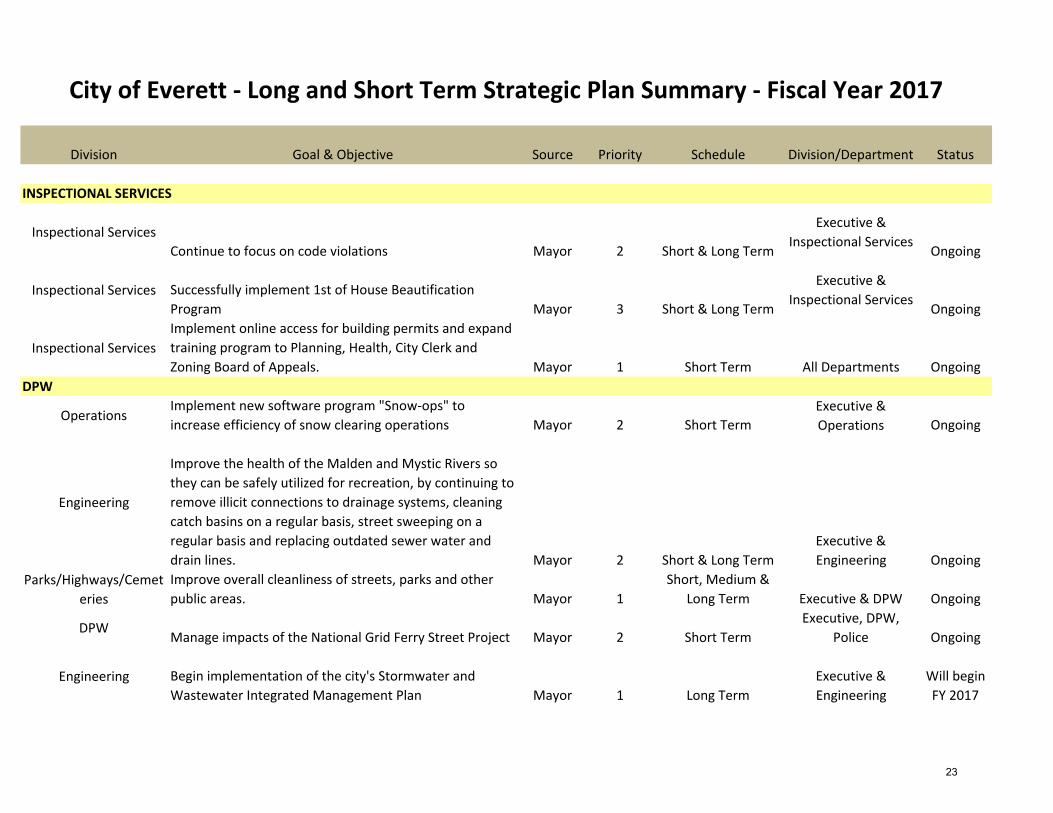
Inspectional ServicesContinue to focus on code violations Mayor 2 Short & Long Term
Executive & Inspectional Services
Ongoing
Inspectional Services Successfully implement 1st of House Beautification Program Mayor 3 Short & Long Term
Executive & Inspectional Services
Ongoing
Inspectional ServicesImplement online access for building permits and expand training program to Planning, Health, City Clerk and Zoning Board of Appeals. Mayor 1 Short Term All Departments Ongoing
DPW
OperationsImplement new software program "Snow‐ops" to increase efficiency of snow clearing operations Mayor 2 Short Term
Executive & Operations Ongoing
Engineering
Improve the health of the Malden and Mystic Rivers so they can be safely utilized for recreation, by continuing to remove illicit connections to drainage systems, cleaning catch basins on a regular basis, street sweeping on a regular basis and replacing outdated sewer water and drain lines. Mayor 2 Short & Long Term
Executive & Engineering Ongoing
Parks/Highways/Cemeteries
Improve overall cleanliness of streets, parks and other public areas. Mayor 1
Short, Medium & Long Term Executive & DPW Ongoing
DPWManage impacts of the National Grid Ferry Street Project Mayor 2 Short Term
Executive, DPW, Police Ongoing
Engineering Begin implementation of the city's Stormwater and Wastewater Integrated Management Plan Mayor 1 Long Term
Executive & Engineering
Will begin FY 2017
23
Division Goal & Objective Source Priority Schedule Division/Department Status
City of Everett ‐ Long and Short Term Strategic Plan Summary ‐ Fiscal Year 2017
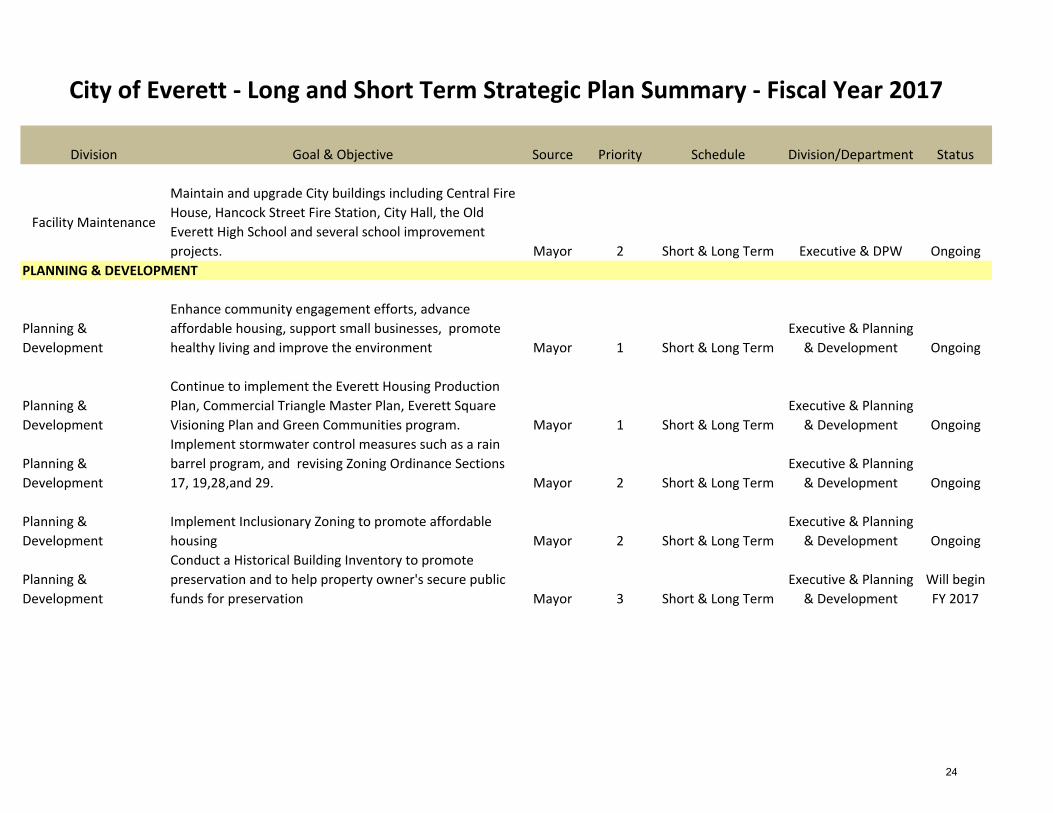
Facility Maintenance
Maintain and upgrade City buildings including Central Fire House, Hancock Street Fire Station, City Hall, the Old Everett High School and several school improvement projects. Mayor 2 Short & Long Term Executive & DPW Ongoing
PLANNING & DEVELOPMENT
Planning & Development
Enhance community engagement efforts, advance affordable housing, support small businesses, promote healthy living and improve the environment Mayor 1 Short & Long Term
Executive & Planning & Development Ongoing
Planning & Development
Continue to implement the Everett Housing Production Plan, Commercial Triangle Master Plan, Everett Square Visioning Plan and Green Communities program. Mayor 1 Short & Long Term
Executive & Planning & Development Ongoing
Planning & Development
Implement stormwater control measures such as a rain barrel program, and revising Zoning Ordinance Sections 17, 19,28,and 29. Mayor 2 Short & Long Term
Executive & Planning & Development Ongoing
Planning & Development
Implement Inclusionary Zoning to promote affordable housing Mayor 2 Short & Long Term
Executive & Planning & Development Ongoing
Planning & Development
Conduct a Historical Building Inventory to promote preservation and to help property owner's secure public funds for preservation Mayor 3 Short & Long Term
Executive & Planning & Development
Will begin FY 2017
24
Division Goal & Objective Source Priority Schedule Division/Department Status
City of Everett ‐ Long and Short Term Strategic Plan Summary ‐ Fiscal Year 2017
PARKS and HEALTH & WELLNESS
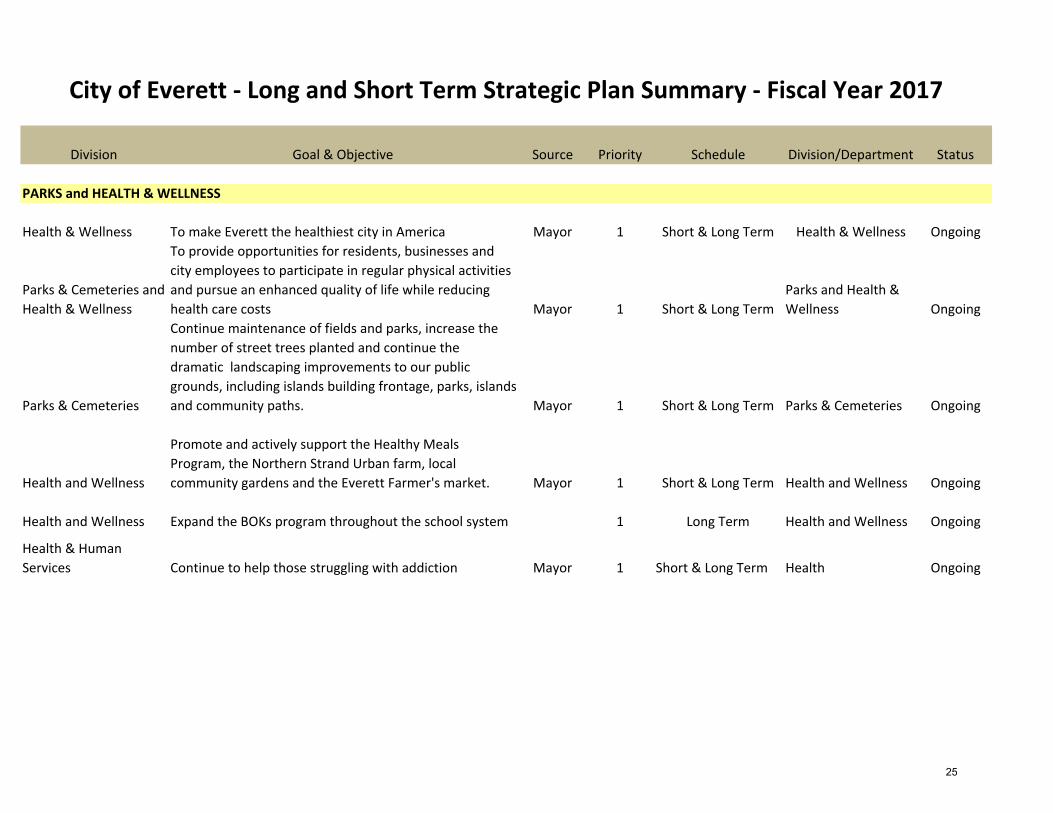
Health & Wellness To make Everett the healthiest city in America Mayor 1 Short & Long Term Health & Wellness Ongoing
Parks & Cemeteries and Health & Wellness
To provide opportunities for residents, businesses and city employees to participate in regular physical activities and pursue an enhanced quality of life while reducing health care costs Mayor 1 Short & Long Term
Parks and Health & Wellness Ongoing
Parks & Cemeteries
Continue maintenance of fields and parks, increase the number of street trees planted and continue the dramatic landscaping improvements to our public grounds, including islands building frontage, parks, islands and community paths. Mayor 1 Short & Long Term Parks & Cemeteries Ongoing
Health and Wellness
Promote and actively support the Healthy Meals Program, the Northern Strand Urban farm, local community gardens and the Everett Farmer's market. Mayor 1 Short & Long Term Health and Wellness Ongoing
Health and Wellness Expand the BOKs program throughout the school system 1 Long Term Health and Wellness Ongoing
Health & Human Services Continue to help those struggling with addiction Mayor 1 Short & Long Term Health Ongoing
25
City Overview
General The City of Everett is located in Middlesex County. It is bordered on the north by the City of Malden, on the east by the Cities of Revere and Chelsea, on the west by the Cities of Medford and Somerville, and on the south by the Mystic River and the City of Boston. Everett has a population of 41,667 (according to the 2010 Federal Census) and occupies a land area of 3.36 square miles. Incorporated as a town in 1870, and as a city in 1892, Everett is governed by a Mayor‐Council‐Alderman form of government, with seven aldermen (elected at large), and eighteen councilors (3 elected from each ward). On January 1, 2014, the City’s Council/Aldermen form of government converted to an elected 11 member City Council, and the Mayor’s term converted to 4 years.
Principal City Officials
Manner Length ExpirationTitle Name of Selection of Term of Term
Mayor Carlo DeMaria, Jr. Elected 4 Years 2018Chief Financial Officer/City Auditor Eric Demas Appointed 3 Years 2019City Treasurer/Collector Domenico D'Angelo Appointed 3 Years 2019City Clerk Michael Matarazzo Appointed Tenure TenureCity Solicitor Colleen Mejia Appointed 3 Years 2019
________________ Municipal Services The City provides general governmental services for the territory within its boundaries, including police and fire protection, disposal of garbage and rubbish, public education in grades K‐12, street maintenance, and parks and recreational facilities. Water and sewer services are provided via connections to the Massachusetts Water Resources Authority. Vocational technical education is provided for at the high school level by the City.
26
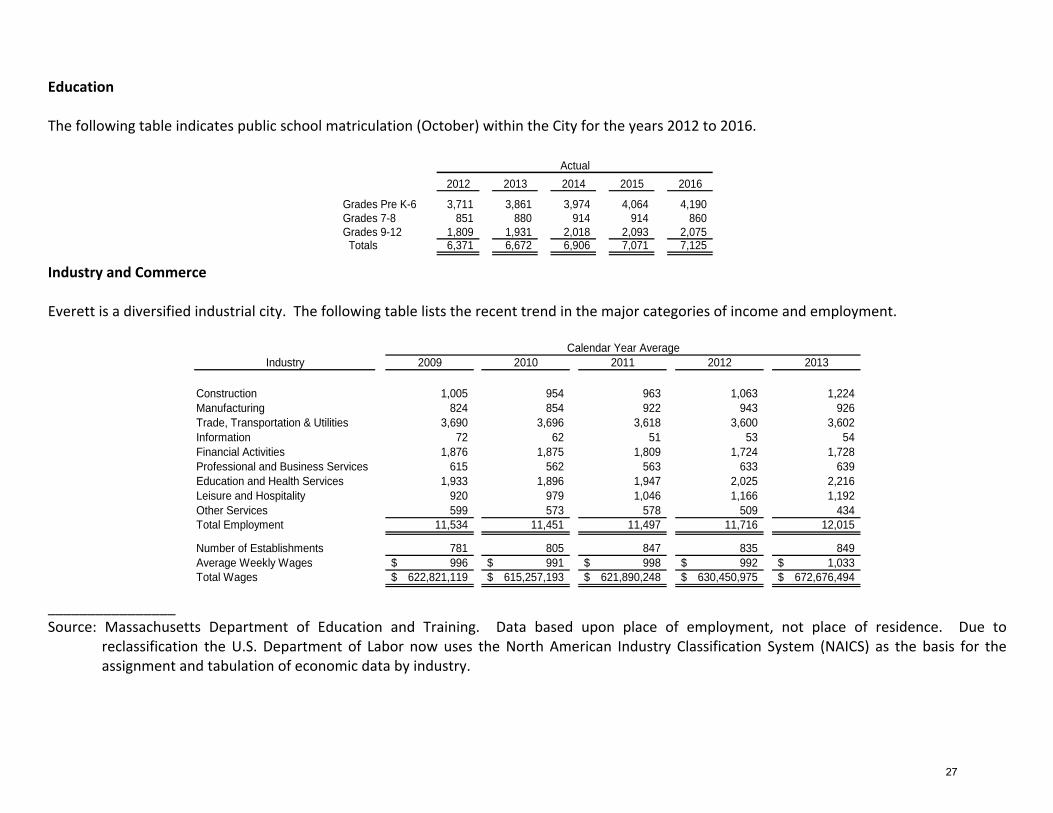
Education The following table indicates public school matriculation (October) within the City for the years 2012 to 2016.
2012 2013 2014 2015 2016
Grades Pre K-6 3,711 3,861 3,974 4,064 4,190 Grades 7-8 851 880 914 914 860 Grades 9-12 1,809 1,931 2,018 2,093 2,075 Totals 6,371 6,672 6,906 7,071 7,125
Actual
Industry and Commerce Everett is a diversified industrial city. The following table lists the recent trend in the major categories of income and employment.
Industry 2009 2010 2011 2012 2013
Construction 1,005 954 963 1,063 1,224 Manufacturing 824 854 922 943 926 Trade, Transportation & Utilities 3,690 3,696 3,618 3,600 3,602 Information 72 62 51 53 54 Financial Activities 1,876 1,875 1,809 1,724 1,728 Professional and Business Services 615 562 563 633 639 Education and Health Services 1,933 1,896 1,947 2,025 2,216 Leisure and Hospitality 920 979 1,046 1,166 1,192 Other Services 599 573 578 509 434 Total Employment 11,534 11,451 11,497 11,716 12,015
Number of Establishments 781 805 847 835 849 Average Weekly Wages 996$ 991$ 998$ 992$ 1,033$ Total Wages 622,821,119$ 615,257,193$ 621,890,248$ 630,450,975$ 672,676,494$
Calendar Year Average
________________ Source: Massachusetts Department of Education and Training. Data based upon place of employment, not place of residence. Due to
reclassification the U.S. Department of Labor now uses the North American Industry Classification System (NAICS) as the basis for the assignment and tabulation of economic data by industry.
27
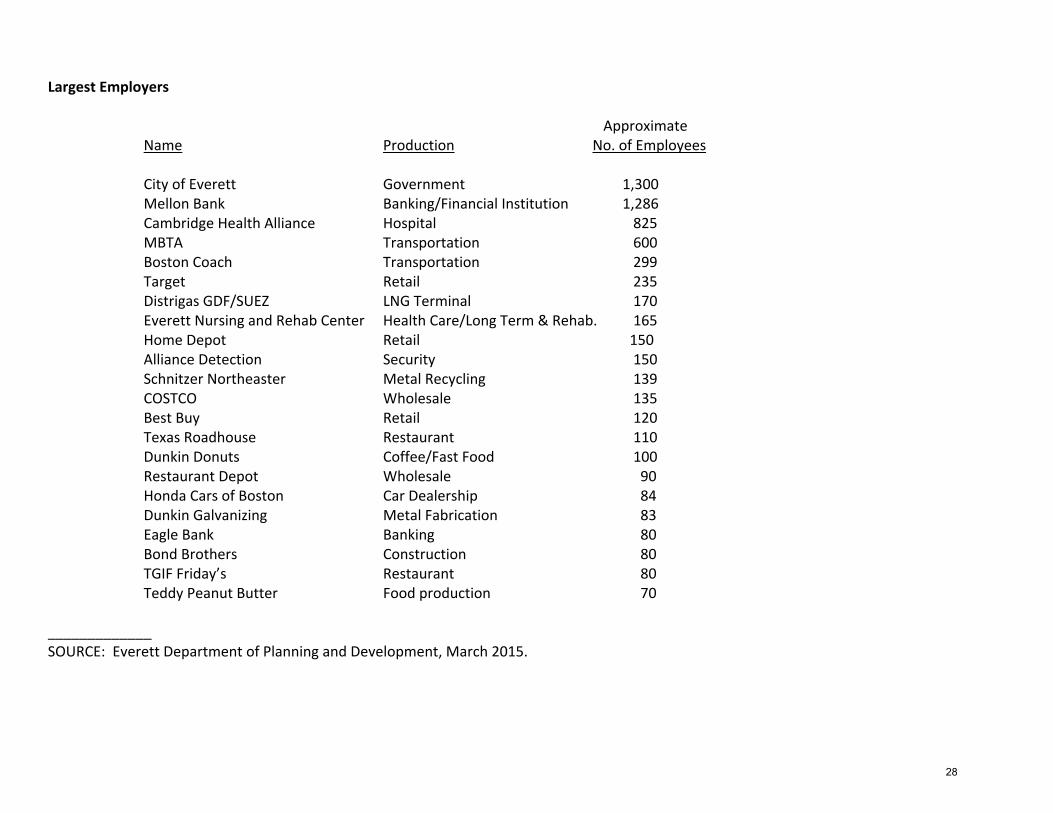
Largest Employers Approximate Name Production No. of Employees
City of Everett Government 1,300 Mellon Bank Banking/Financial Institution 1,286 Cambridge Health Alliance Hospital 825 MBTA Transportation 600 Boston Coach Transportation 299 Target Retail 235 Distrigas GDF/SUEZ LNG Terminal 170 Everett Nursing and Rehab Center Health Care/Long Term & Rehab. 165 Home Depot Retail 150 Alliance Detection Security 150 Schnitzer Northeaster Metal Recycling 139 COSTCO Wholesale 135 Best Buy Retail 120 Texas Roadhouse Restaurant 110 Dunkin Donuts Coffee/Fast Food 100 Restaurant Depot Wholesale 90 Honda Cars of Boston Car Dealership 84 Dunkin Galvanizing Metal Fabrication 83 Eagle Bank Banking 80 Bond Brothers Construction 80 TGIF Friday’s Restaurant 80 Teddy Peanut Butter Food production 70
_____________ SOURCE: Everett Department of Planning and Development, March 2015.
28
Transportation and Utilities Modern transportation facilities are available to residents and commercial enterprises in the City of Everett. The City maintains a total of 56 miles of roads. Bus transportation within the City and throughout the local region is provided by the Massachusetts Bay Transportation Authority (MBTA). The MBTA maintains a major repair facility in the City. Gas, electric, and telephone services are provided by established private utilities. PLANNING AND ECONOMIC DEVELOPMENT The City is committed to completing long range planning designed to support a high quality, safe community that supports sustainable housing and economic development initiatives. Through community involvement and strategic neighborhood investments, the city strives to support community improvement projects, and seeks to retain existing and support new, sustainable, safe businesses within the city. The City’s long‐range planning and economic development goals include:
1. Ensuring a high‐quality, affordable community for people to live, work and recreate; 2. Supporting the creation of new full‐time, well‐paying jobs; 3. Establishing a sustainable and diversified tax base and land‐use mix; 4. Returning vacant buildings and former industrial properties to safe, active use; 5. Encouraging compatible and diversified commercial and industrial districts; 6. Improving the appearance of the City; 7. Stimulating sustained investment in the community.
The City continuously pursues economic development initiatives to achieve economic diversity and success. Economic Development Programs and Designations Gateway City Designation: In 2010, the City was designated by The Commonwealth of Massachusetts as a “Gateway City.” This designation provides eligible communities with additional state resources and access to grant and program funding through various state agencies. Designed to assist the Commonwealth’s cities in the most need, Gateway Cities can utilize numerous grant programs for various activities, including site, roadway, and infrastructure acquisition and reconstruction, economic development programming, and the design and construction of public parks and other public facilities.
29
In 2012, the City received $500,000 through the Gateway Cities PARC Grant program for the rehabilitation of Glendale Park. Combined with City Capital Improvement Funding, this $2.6 million project will rehabilitate the City’s historic and primary open space into a new multi‐purpose open space with baseball and softball fields, a walking track, and an expanded tot lot (project complete). Also in 2012, $235,000 of Gateway Cities PARC Grant funding was awarded for the design and construction of the Northern Strand Community Trail, also known as the Bike to the Sea corridor (project complete). In 2014 the City received a $200,000 Our Common Back Yard grant through the Gateway Cities program for the reconstruction of the Jacob Scharf Park. The project is underway. In 2015, the city received a $400,000 PARC Grant for the reconstruction of Sacramone Park, including a new synthetic turf ball field, tot lot, splash pad and concession stand. The $3.1M project is due to commence work in the spring of 2016, following bidding. Most recently, the city received a $300,000 PARC Grant for the reconstruction of Swan Street Park. The design services will be done later this year with construction scheduled to commence sometime in 2017. Mini‐Entitlement Designation: The City is a designated “Mini‐Entitlement” community. Administered through the state’s Department of Housing and Community Development (DHCD), Mini‐Entitlement communities are eligible to receive federal Community Development Block Grant (CDBG) funds design to assist communities with meeting a broad range of community development needs. Assistance is provided to qualifying cities and towns for housing, community, and economic development projects that assist low and moderate‐income residents, or by revitalizing areas of slum or blight. In fiscal year 2016, the City of Everett will request $825,000 in Mini‐Entitlement funding, which will be used to support numerous initiatives, including a housing rehabilitation program for low to moderate income property owners; a Best Retail Practices seminar with individual consultations to support Everett’s small business and retail owners; a park renovation project for the Gramstorf Park; and to provide assistance to five (5) public social service agencies that serve low‐income residents. In fiscal year 2015, the City of Everett received $825,000 in mini‐Entitlement funding, which is being used to support numerous initiatives, including a housing rehabilitation program for low to moderate income property owners; a Best Retail Practices seminar with individual consultations to support Everett’s small business and retail owners; Phase II renovation project for the Jacob Scharf Park; and to provide assistance to five (5) public social service agencies that serve low‐income residents. In fiscal year 2014, the City of Everett received $900,000 in Mini‐Entitlement funding, which is being used to support numerous initiatives, including a housing rehabilitation program for low to moderate income property owners; a Best Retail Practices seminar with individual consultations to
30
support Everett’s small business and retail owners; a park renovation project for the Jacob Scharf park; and to provide assistance to four (4) public social service agencies that serve low‐income residents. In fiscal year 2013, the City of Everett received $900,000 in Mini‐Entitlement funding, which is being used to support numerous initiatives, including a housing rehabilitation program for low to moderate income property owners; a Best Retail Practices seminar with individual consultations to support Everett’s small business and retail owners; roadway reconstruction work; development of a master plan for the Commercial Triangle portion of the City (more detail below); and to provide assistance to four (4) public social service agencies that serve low‐income residents. Economic Target Area (ETA) Designation: Since 1993, a portion of the City has been designated as an Economic Target Area (TeleCom City ETA) by the Commonwealth of Massachusetts Economic Assistance Coordinating Council, as administered through the Massachusetts Office of Business Development (MOBD). The ETA designation is a part of the State’s Economic Development Incentive Program (EDIP), the purpose of which is to provide additional financial incentives for municipalities to utilize in order to encourage economic development and business/job retention in targeted areas within the community. Through the EDIP, Everett is able to offer tax benefits not available in other areas of the City. The ETA designation is a tool for the City to promote projects that meet the City’s economic development goals. In 2012, the City entered into two tax incentive agreements within the TeleCom City ETA, which include:
5‐year TIF (Tax Increment Financing) with Cumar Tile 4‐year STA (Special Tax Assessment) with L.Knife and Sons
In 2014, the City worked with several businesses seeking to locate within the City, many of which found real estate in Everett. Interestingly, few of these businesses sought assistance within the ETA and through the EDIP; as such no new agreements were entered into in 2013. More details on the 2012 agreements and projects are outlined below. Economic Opportunity Area (EOA) Designation: On November 30, 1998, the City received approval of its first Economic Opportunity Area (EOA) within the City TeleCom City Economic Target Area. The newly created EOA is named the Parkway/Island End EOA. The boundaries of the EOA are the Revere Beach Parkway, the Chelsea City Line, the Island End and Mystic Rivers, and Broadway (Route 99). A business that is expanding, relocating, or building new facilities and creating permanent new jobs within the EOA can be designated as a Certified Project by the City and the State’s Economic Assistance Coordinating Council. The benefits to Certified Projects within an EOA include:
An investment tax credit of five percent toward the state corporate or personal income tax A state corporate or personal income tax deduction equal to 10 percent of the cost of renovating an abandoned building Property tax benefits negotiated with the City, offered through the TIF and STA programs (see below)
31
Tax Incentive Financing (TIF) Program: Capitalizing on the ETA and EOA Designation, in March 2012, the Everett City Council authorized a Tax Incentive Financing (TIF) Agreement between the City and Cumar Inc. Co. for a period of 5 years. A local company, Cumar Tile is a leading importer and cutter of high end tile (marble, granite, etc.) typically used to make countertops and other items. Expressing their desire to expand within Everett, the TIF agreement provides Cumar with the ability to invest $6.5 million to expanding their facility within the City, and adding approximately 10 new jobs. The negotiated TIF provides a 5‐year tax break to Cumar Tile on the added investment at their facility. The $6.5 million investment includes the purchase of a permanent, expanded space (previously leased), purchase of new equipment, the build out of manufacturing and office space, and hiring of additional staff. Construction is ongoing. Special Tax Assessment (STA) Agreement: In August 2012, the Everett City Council approved a 4‐year Special Tax Assessment (STA) with L. Knife and Son, Inc., a family owned beverage distribution company based in Kingston, MA. The 4‐year STA provides a 4‐year tax break on a portion of the entire assessed value of the property. The incentive is supporting L. Knife’s desire to locate its craft beer and international import beverage businesses within the City of Everett. The $13.4 million investment includes the purchase and rehabilitation of a vacant 222,000 square foot former food distribution facility located on Beacham Street. The company intends to convert the empty building into a state of the art beverage distribution facility, which will also house the corporate offices for its craft beer and import beverage businesses and serve as a regional corporate training facility. The new facility will relocate 82 existing jobs to Everett, and create an additional 20 new full time jobs within the first two years of operation. Expedited Local Permitting – Chapter 43D: The City is committed to expediting the local permitting process to the greatest extent possible. Displaying this commitment, the City designated two parcels under the provisions of MGL Chapter 43D, the state’s expedited permitting program. These sites include the Rivergreen Business Park (2010) and the former Everett High School (2011). In 2015, the City designated the Wynn Everett gaming site as a Chapter 43D property. This designation provides priority consideration for various state grant programs, places the sites on the State’s economic development priorities site list, and ensures an expedited local permitting process for any project proposed at these sites, whereby all local decisions must be rendered on the project within 180 days of application submission. Regional Projects/Partnerships River’s Edge Project: The River’s Edge Project is a partnership among the Cities of Everett, Malden and Medford to create a regional mixed‐use district designed to support the construction of up to 222 units of housing, 441,000 square feet of commercial space, and a permanent boathouse for Tufts University. Located on former industrial properties along the Malden River, the River’s Edge Project has many supporters and partners, including university leaders, local, state and federal government officials and agencies, and private developers. This unique agreement includes a
32
tax sharing component whereby projects completed within the project area are taxed through a blended tax rate, and the revenues are shared by the three partner communities. Criterion Development Partners, a national developer of luxury multi‐family housing with offices in Dallas and Boston, completed the construction of a 222 unit luxury rental apartment building, including 34 affordable units. Final occupancy was obtained in December 2009. The project is 100% occupied and is located in Medford within the River’s Edge Project area. Along with the housing project, a 115,000 square foot commercial office building was constructed on site, and is currently over 65 percent leased (http://www.riversedgema.com/). Since 2000, over $56 million in state and federal funds have been committed to the project. These funds have supported the construction of a new roadway in Medford and Malden, property acquisitions, and environmental assessment and cleanup. In Everett, over $5 million in infrastructure funds have been invested within the project area, primarily to support the construction of a permanent roadway into the site known as Airforce Road. This investment is adding new private interest in the area. Commercial Projects Wynn MA, LLC: In 2014, the Massachusetts Gaming Commission selected Wynn MA, LLC for the sole Eastern Massachusetts gaming license. This project, located in the Lower Broadway District of Everett, is set to redevelop a former 35 acre chemical company brownfield site. The over $1.6 billion investment is expected to include nearly 1.8 million square feet of commercial, mixed use space, including a 620 room luxury hotel, retail and restaurant space, a luxury spa, and a casino floor to be completed by Wynn Development of Las Vegas. The project is anticipated to start physical construction in the fall of 2015, and take approximately 36 months to complete. Once open, the investment will generate a minimum of $25 million per year in revenue to the City from the facility alone, not including spin off development or hotel room taxes, as well as support an estimated 4,000 new permanent jobs. AmazonFresh: In 2015, the Planning Board approved site development plans for the construction of a food distribution center on Beacham Street. AmazonFresh will offer grocery items for sale, as well as a subset of items from the main Amazon.com storefront. Items ordered through AmazonFresh are available for home delivery on the same day or the next day. The project is expected to be completed in 2016. AmazonFresh expects to hire approximately 60 employees and hire third party vendors. EnVision Hotel: In 2015, the Planning Board approved site development plans for the construction of a 101 room hotel (3 star) at the corner of Vine Street and Revere Beach Parkway. EnVision is part of the Choice Hotels brand. The project is expected to be completed in 2016. EnVision expects to hire approximately 20 employees and have some third party vendors. L.Knife and Sons: As noted above, in August 2012, the Everett City Council approved a Special Tax Assessment (STA) with L.Knife and Son, Inc., a family owned beverage distribution company based out of Kingston, MA. The STA is supporting L. Knife’s desire to locate its craft beer and import
33
beverage businesses within the City. The $13.4 million investment includes the purchase and rehabilitation of a vacant 222,000 square foot former food distribution facility located on Beacham Street. This project has been completed. In 2013, the company converted the empty building into a state of the art beverage distribution facility, which houses the corporate offices for its craft beer and import beverage businesses and serve as a regional corporate training facility. The new facility is in the process of relocating approximately 82 existing jobs to Everett, and creating an additional 20 new full time jobs within the first two years of operation. Gateway Center: The Gateway Retail Center is a successful brownfields redevelopment. The “Destination Retail Center” consists of a collection of retail stores and restaurants totaling almost 600,000 square feet. Tenants in the Gateway Center include Target Department Store, Home Depot, Office Max, Old Navy, Gap Outlet, Bed Bath and Beyond, Michael’s Crafts, and others. Gateway Center is located at the intersection of Route 99 and Route 16. The developer, Developers Diversified, also funded the design and construction of Gateway Park, a 23‐acre passive recreational park adjacent to Gateway Center. This park is part of the Commonwealth of Massachusetts Department of Conservation and Recreation park system. The Gateway Park project is closely linked to the Gateway Center, with the center providing parking and access to the park. Residential Projects The Batchyard: In 2012, Post Road Construction of Connecticut purchased the remaining two parcels of the Charleston Lofts site and was granted local approvals to continue the construction of the site. The new project includes the renovation of an addition to the 4‐story former Charlestown Chew Factory building into a 7‐story building, the construction of a new 5‐level parking structure, and the construction of two new multi‐family buildings on site. The total project includes 329 units of market rate housing, representing a $90 million investment. The project was completed in the winter of 2015, and is fully leased. This development is another example of how the City continues to advance its economic development goals by returning vacant buildings to active uses that provide additional sources of revenue for the city. Parkside Lofts: In 2012, this former Tillotson Rubber Company site located on Waters Avenue, was granted final local permits to construct approximately 190 units of market rate housing. The project started construction in the summer of 2014 and is anticipated to be completed in 2016. Charleston Lofts: Pinnacle Properties Holdings, L.L.C. purchased four multi‐story, former mill buildings consisting of 255,000 square feet at 210 Broadway and 7‐43 Charlton Street, just a quarter mile north of the Boston city limits along Route 99 near its intersection with Route 16. The largest of the buildings was the former home of the Charleston Chew chocolate factory. This project was permitted for development in three phases totaling an anticipated 250‐260 luxury loft style condominiums units. In 2009, Pinnacle Properties Holdings, L.L.C completed construction of 69 loft style residential units. The majority of the units were sold at market rate. Due to collapse in the condo housing market, Pinnacle Properties did not complete phase 2 and 3 as planned (see The Batchyard).
34
Long‐Range Planning and Targeted Redevelopment Sites Lower Broadway Master Plan and Development: The City, with assistance from Sasaki Associates and GLC Development Resources, developed a master plan for the Lower Broadway District, completed in 2012. This plan has been adopted by the City to guide the permitting and negotiation process undertaken with the Wynn MA LLC group for the redevelopment of the Modern Continental Site. Since the creation of the Master Plan and the partnership with Wynn MA LLC, the City has worked to re‐write the zoning within the neighborhood to accommodate the long range land use outlined within the Master Plan and to accommodate the Wynn MA project. Further, the city has created a redevelopment authority and is currently working on formulating a Lower Broadway Urban Renewal Plan to further target redevelopment within the neighborhood surrounding the Wynn MA project. Commercial Triangle Master Plan: Another area of focus for the City is the Commercial Triangle, a neighborhood characterized by its former industrial past, and current underutilized commercial parcels located in close proximity to the Revere Beach Parkway. The City is currently utilizing Mini‐Entitlement grant funding to complete a comprehensive master plan for this neighborhood with Crosby Schlessinger and Smallridge, a planning and design firm from Boston. The anticipated Commercial Triangle Master Plan is anticipated to be completed by February 2016. Redevelopment of Old Everett High School: Located at the geographic center of Everett is the former Everett High School. Originally built in 1921 and expanded in 1970s, this building has been vacant since 2007. The City is working with a private consultant to redesign the historic property into a new municipal complex, to accommodate a new City Hall and police station. Redevelopment of the River Green Site: In 2008, Berkeley Investments Inc. acquired this 40‐acre brownfields site that was previously operated by General Electric as an aircraft engine manufacturing facility. Since acquisition, Berkeley has completed significant environmental remediation activities to support the property’s reuse. As shown on a master plan for the site completed by the owners in 2009, the site is designed to support the construction of a 500,000 square foot research and development business park. This parcel is located within the boundaries of the regional River’s Edge Project (outlined above). The goal of this project is redevelop over 200 acres of brownfield’s among the three partnering communities in order to create jobs, provide housing opportunities, and reconnect the public with the Malden River. Redevelopment of the former St. Theresa’s Church and Grounds: Located in the Northern section of the City, this parcel includes a church and parish hall. The City has been in discussions with the Archdiocese of Boston regarding the future re‐use of this closed facility, which is currently delayed due to the disposition process governed by Vatican Law. This parcel is located on Broadway (Route 99) in the northern section of the City. Everett Square Economic Development Strategy: The City is working to develop a comprehensive transportation and streetscape strategy for Everett Square, the City’s historic commercial center. The primary goal of this strategy is to create an economically viable Square that is attractive to residents and businesses alike, while at the same time addressing the traffic and parking demands of the neighborhood. The City has secured a
35
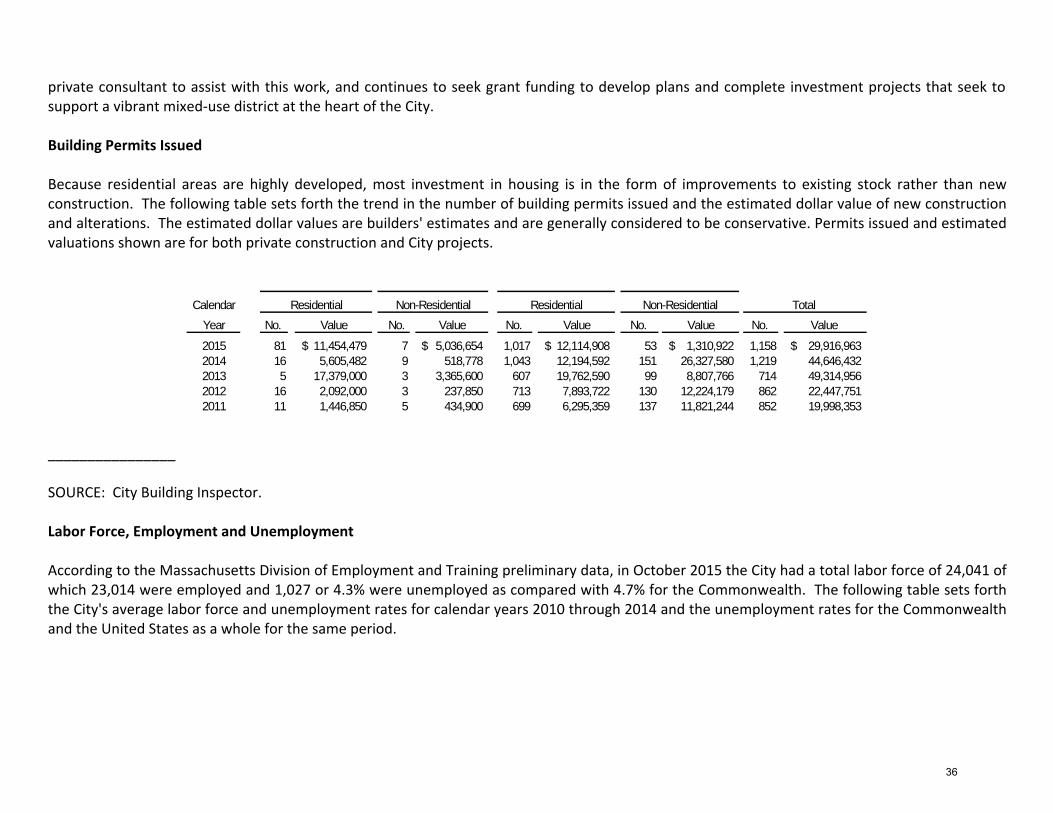
private consultant to assist with this work, and continues to seek grant funding to develop plans and complete investment projects that seek to support a vibrant mixed‐use district at the heart of the City. Building Permits Issued Because residential areas are highly developed, most investment in housing is in the form of improvements to existing stock rather than new construction. The following table sets forth the trend in the number of building permits issued and the estimated dollar value of new construction and alterations. The estimated dollar values are builders' estimates and are generally considered to be conservative. Permits issued and estimated valuations shown are for both private construction and City projects.
Calendar Residential Non-Residential Residential Non-Residential Total
Year No. Value No. Value No. Value No. Value No. Value
2015 81 11,454,479$ 7 5,036,654$ 1,017 12,114,908$ 53 1,310,922$ 1,158 29,916,963$ 2014 16 5,605,482 9 518,778 1,043 12,194,592 151 26,327,580 1,219 44,646,432 2013 5 17,379,000 3 3,365,600 607 19,762,590 99 8,807,766 714 49,314,956 2012 16 2,092,000 3 237,850 713 7,893,722 130 12,224,179 862 22,447,751 2011 11 1,446,850 5 434,900 699 6,295,359 137 11,821,244 852 19,998,353
________________ SOURCE: City Building Inspector. Labor Force, Employment and Unemployment According to the Massachusetts Division of Employment and Training preliminary data, in October 2015 the City had a total labor force of 24,041 of which 23,014 were employed and 1,027 or 4.3% were unemployed as compared with 4.7% for the Commonwealth. The following table sets forth the City's average labor force and unemployment rates for calendar years 2010 through 2014 and the unemployment rates for the Commonwealth and the United States as a whole for the same period.
36
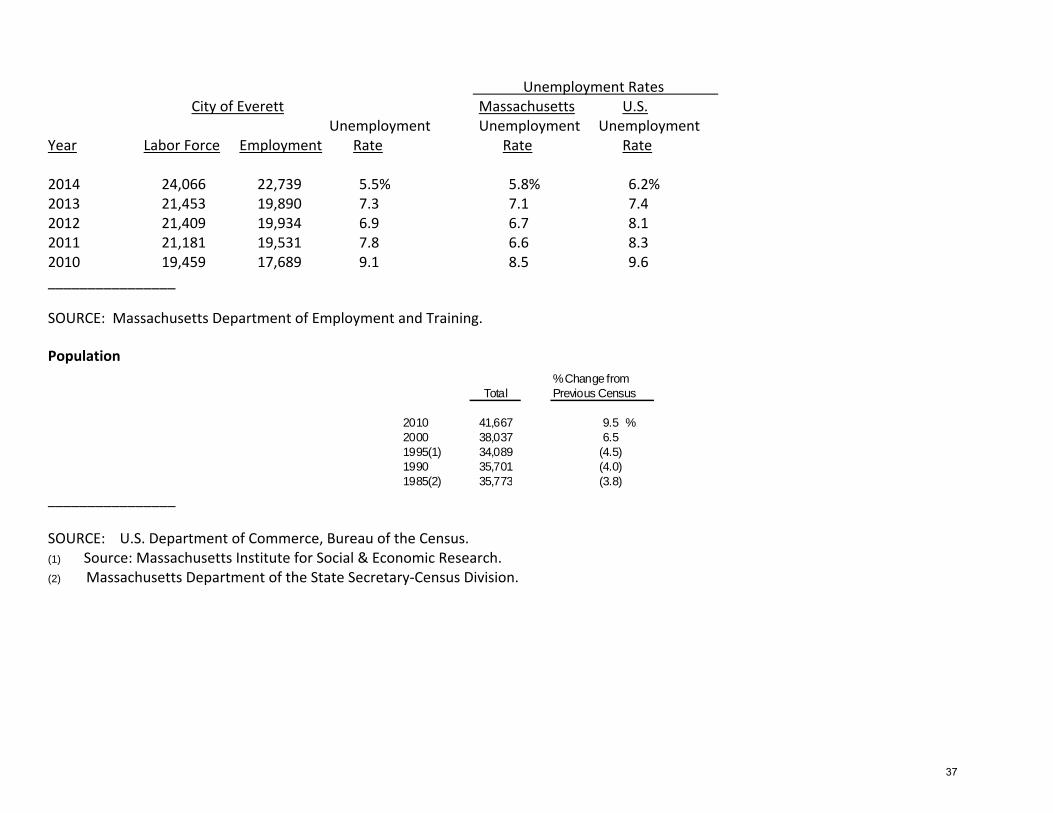
Unemployment Rates City of Everett Massachusetts U.S. Unemployment Unemployment Unemployment Year Labor Force Employment Rate Rate Rate 2014 24,066 22,739 5.5% 5.8% 6.2% 2013 21,453 19,890 7.3 7.1 7.4 2012 21,409 19,934 6.9 6.7 8.1 2011 21,181 19,531 7.8 6.6 8.3 2010 19,459 17,689 9.1 8.5 9.6 ________________ SOURCE: Massachusetts Department of Employment and Training. Population
% Change fromTotal Previous Census
2010 41,667 9.5 %2000 38,037 6.5 1995(1) 34,089 (4.5) 1990 35,701 (4.0) 1985(2) 35,773 (3.8)
________________ SOURCE: U.S. Department of Commerce, Bureau of the Census. (1) Source: Massachusetts Institute for Social & Economic Research. (2) Massachusetts Department of the State Secretary‐Census Division.
37
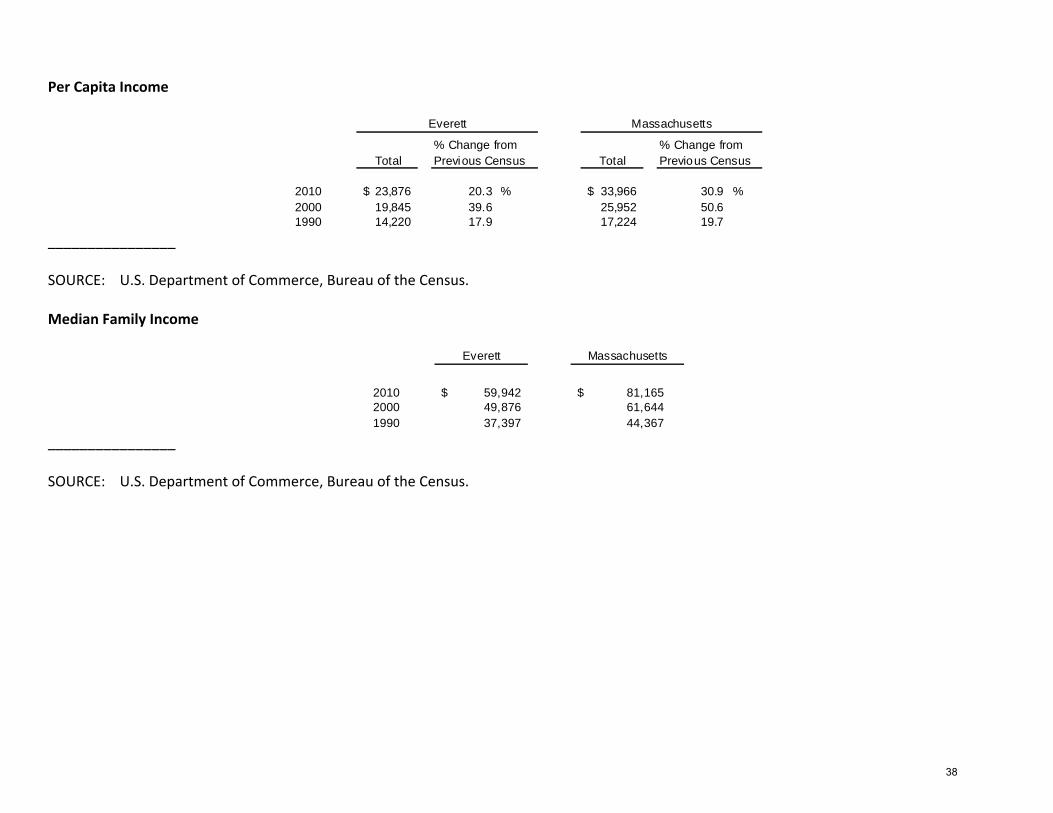
Per Capita Income
% Change from % Change fromTotal Previous Census Total Previous Census
2010 23,876$ 20.3 % 33,966$ 30.9 %2000 19,845 39.6 25,952 50.6 1990 14,220 17.9 17,224 19.7
Everett Massachusetts
________________ SOURCE: U.S. Department of Commerce, Bureau of the Census. Median Family Income
Everett
2010 59,942$ 81,165$ 2000 49,876 61,644 1990 37,397 44,367
Massachusetts
________________ SOURCE: U.S. Department of Commerce, Bureau of the Census.
38
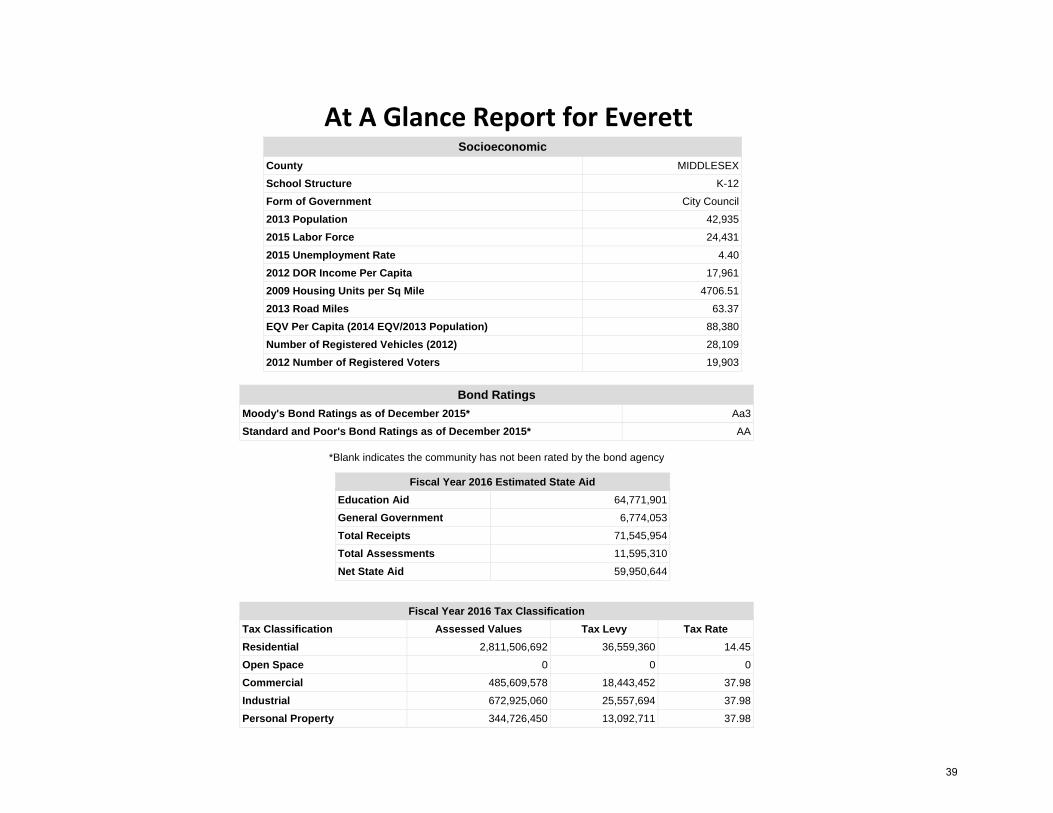
At A Glance Report for Everett
Socioeconomic County MIDDLESEX School Structure K-12 Form of Government City Council 2013 Population 42,935 2015 Labor Force 24,431 2015 Unemployment Rate 4.40 2012 DOR Income Per Capita 17,961 2009 Housing Units per Sq Mile 4706.51 2013 Road Miles 63.37 EQV Per Capita (2014 EQV/2013 Population) 88,380 Number of Registered Vehicles (2012) 28,109 2012 Number of Registered Voters 19,903
Bond Ratings Moody's Bond Ratings as of December 2015* Aa3 Standard and Poor's Bond Ratings as of December 2015* AA
*Blank indicates the community has not been rated by the bond agency
Fiscal Year 2016 Estimated State Aid Education Aid 64,771,901 General Government 6,774,053 Total Receipts 71,545,954 Total Assessments 11,595,310 Net State Aid 59,950,644
Fiscal Year 2016 Tax Classification Tax Classification Assessed Values Tax Levy Tax Rate Residential 2,811,506,692 36,559,360 14.45 Open Space 0 0 0 Commercial 485,609,578 18,443,452 37.98 Industrial 672,925,060 25,557,694 37.98 Personal Property 344,726,450 13,092,711 37.98
39
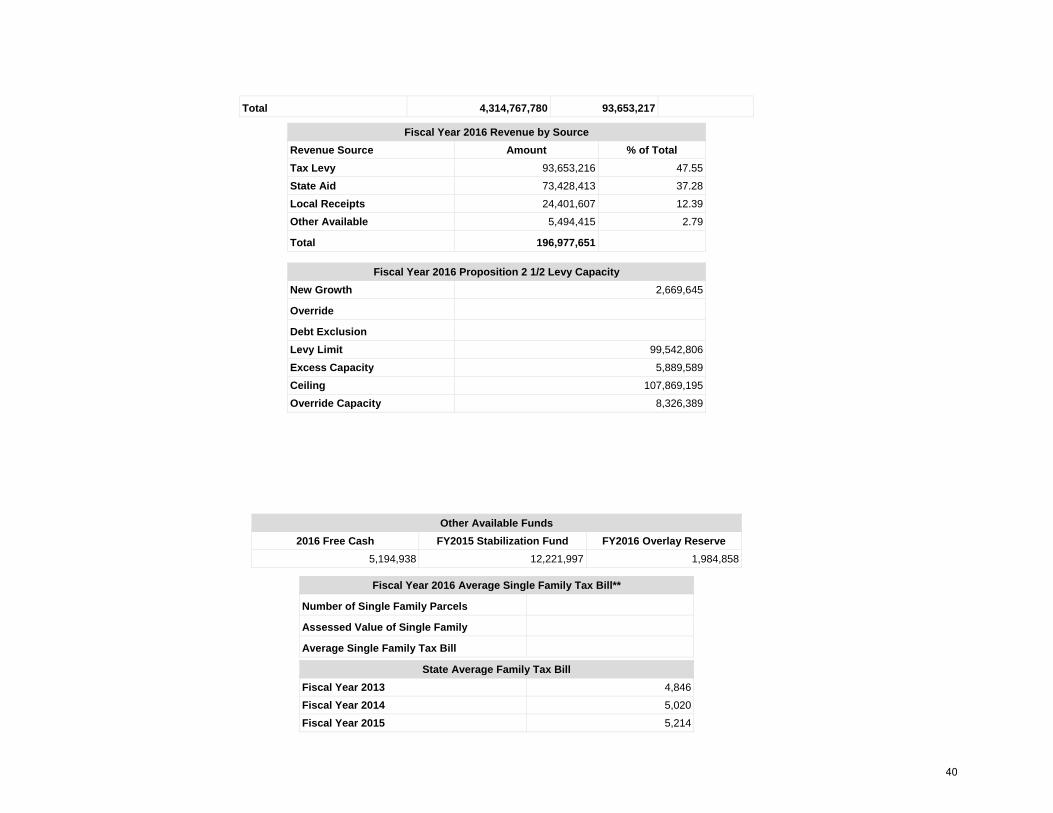
Total 4,314,767,780 93,653,217
Fiscal Year 2016 Revenue by Source Revenue Source Amount % of Total Tax Levy 93,653,216 47.55 State Aid 73,428,413 37.28 Local Receipts 24,401,607 12.39 Other Available 5,494,415 2.79 Total 196,977,651
Fiscal Year 2016 Proposition 2 1/2 Levy Capacity New Growth 2,669,645 Override Debt Exclusion Levy Limit 99,542,806 Excess Capacity 5,889,589 Ceiling 107,869,195 Override Capacity 8,326,389
Other Available Funds 2016 Free Cash FY2015 Stabilization Fund FY2016 Overlay Reserve
5,194,938 12,221,997 1,984,858
Fiscal Year 2016 Average Single Family Tax Bill** Number of Single Family Parcels Assessed Value of Single Family Average Single Family Tax Bill
State Average Family Tax Bill Fiscal Year 2013 4,846 Fiscal Year 2014 5,020 Fiscal Year 2015 5,214
40
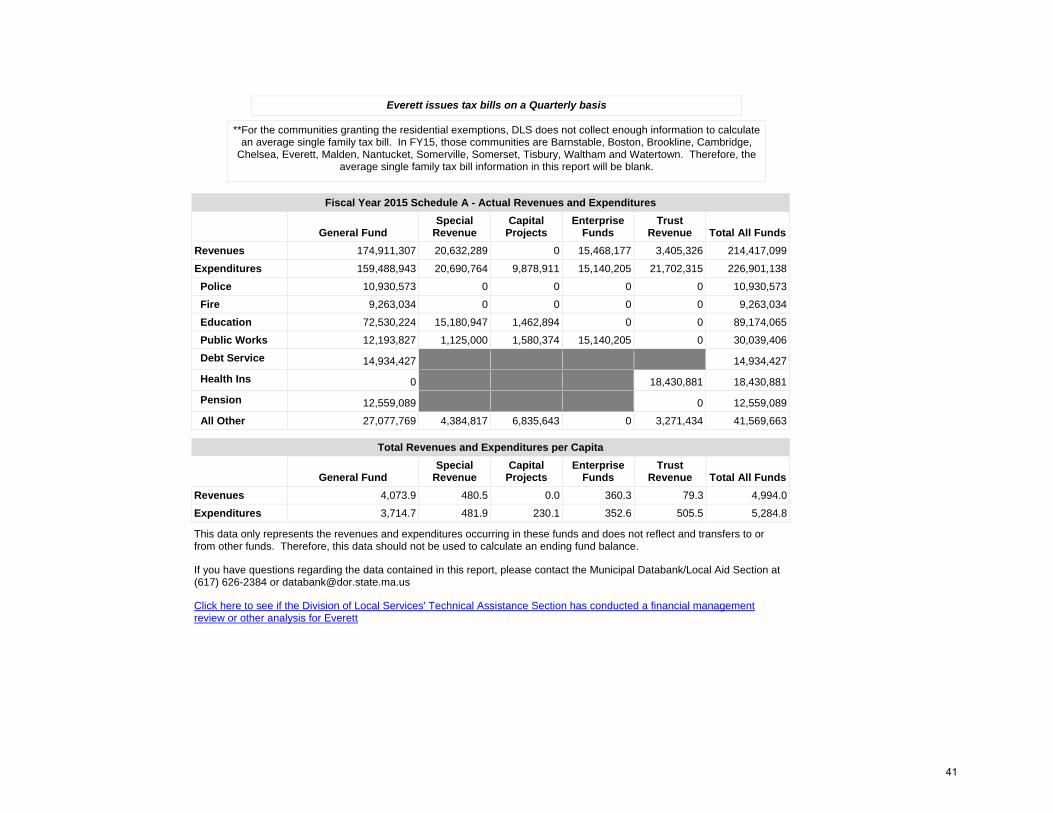
Everett issues tax bills on a Quarterly basis
**For the communities granting the residential exemptions, DLS does not collect enough information to calculate an average single family tax bill. In FY15, those communities are Barnstable, Boston, Brookline, Cambridge,
Chelsea, Everett, Malden, Nantucket, Somerville, Somerset, Tisbury, Waltham and Watertown. Therefore, the average single family tax bill information in this report will be blank.
Fiscal Year 2015 Schedule A - Actual Revenues and Expenditures
General Fund Special
Revenue Capital
Projects Enterprise
Funds Trust
Revenue Total All Funds Revenues 174,911,307 20,632,289 0 15,468,177 3,405,326 214,417,099 Expenditures 159,488,943 20,690,764 9,878,911 15,140,205 21,702,315 226,901,138 Police 10,930,573 0 0 0 0 10,930,573 Fire 9,263,034 0 0 0 0 9,263,034 Education 72,530,224 15,180,947 1,462,894 0 0 89,174,065 Public Works 12,193,827 1,125,000 1,580,374 15,140,205 0 30,039,406 Debt Service 14,934,427 14,934,427 Health Ins 0 18,430,881 18,430,881 Pension 12,559,089 0 12,559,089 All Other 27,077,769 4,384,817 6,835,643 0 3,271,434 41,569,663
Total Revenues and Expenditures per Capita
General Fund Special
Revenue Capital
Projects Enterprise
Funds Trust
Revenue Total All Funds Revenues 4,073.9 480.5 0.0 360.3 79.3 4,994.0 Expenditures 3,714.7 481.9 230.1 352.6 505.5 5,284.8
This data only represents the revenues and expenditures occurring in these funds and does not reflect and transfers to or from other funds. Therefore, this data should not be used to calculate an ending fund balance.
If you have questions regarding the data contained in this report, please contact the Municipal Databank/Local Aid Section at (617) 626-2384 or [email protected]
Click here to see if the Division of Local Services' Technical Assistance Section has conducted a financial management review or other analysis for Everett
41
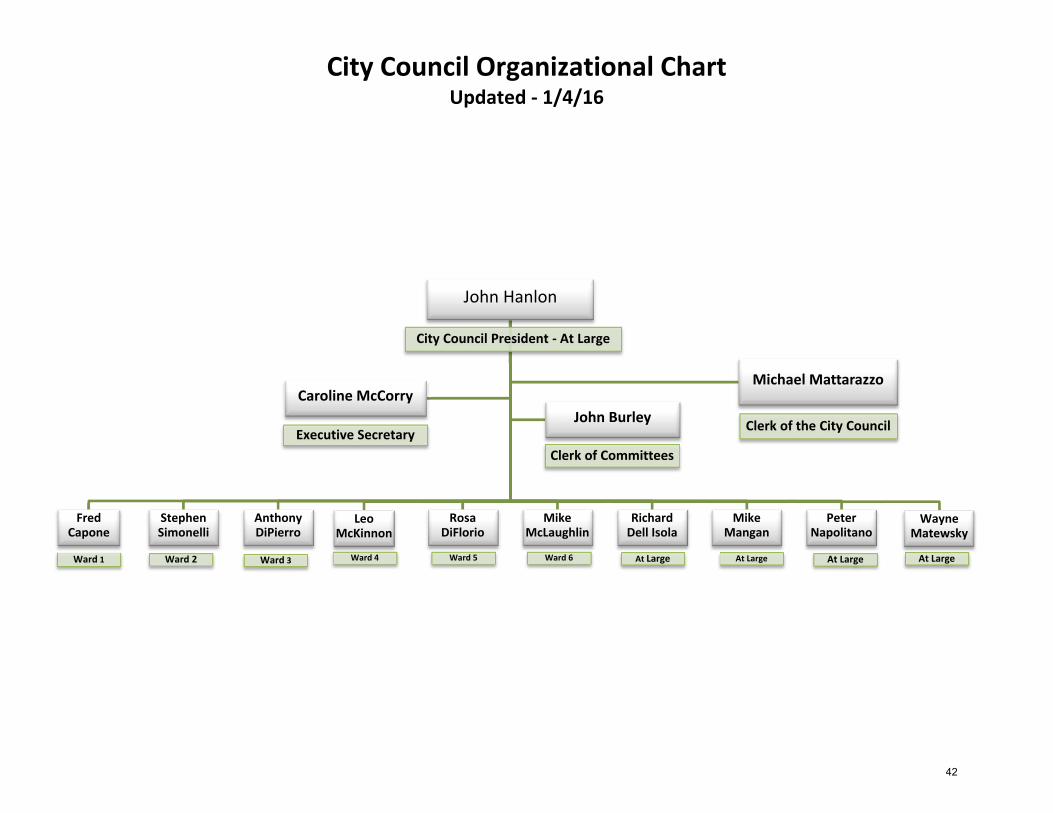
City Council Organizational Chart Updated ‐ 1/4/16
John Hanlon
City Council President ‐ At Large
Fred Capone
Ward 1
Stephen Simonelli
Ward 2
Anthony DiPierro
Ward 3
Leo McKinnon
Ward 4
Rosa DiFlorio
Ward 5
Mike McLaughlin
Ward 6
Richard Dell Isola
At Large
Mike Mangan
At Large
Peter Napolitano
At Large
Wayne Matewsky
At Large
Caroline McCorry
Executive Secretary
Michael Mattarazzo
Clerk of the City CouncilJohn Burley
Clerk of Committees
42
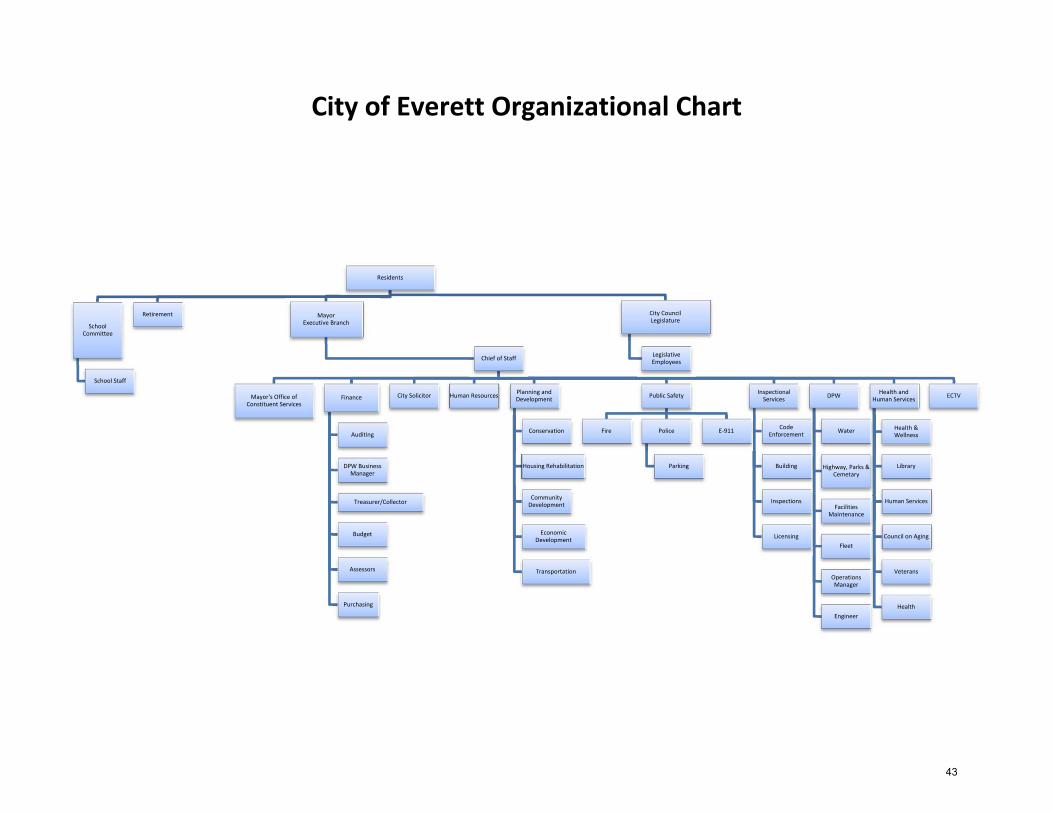
City of Everett Organizational Chart
Residents
City Council Legislature
Legislative Employees
Mayor Executive Branch
Chief of Staff
Mayor's Office of Constituent Services
Finance
Auditing
DPW Business Manager
Treasurer/Collector
Budget
Assessors
Purchasing
City Solicitor Human Resources Planning and Development
Conservation
Housing Rehabilitation
Community Development
Economic Development
Transportation
Public Safety
E‐911Police
Parking
Fire
Inspectional Services
Code Enforcement
Building
Inspections
Licensing
DPW
Water
Highway, Parks & Cemetary
Facilities Maintenance
Fleet
Operations Manager
Engineer
Health and Human Services
Health & Wellness
Library
Human Services
Council on Aging
Veterans
Health
ECTV
Retirement
School Committee
School Staff
43
Everett Charter Commission Majority Report
TO THE CITIZENS OF EVERETT:
The Everett Charter Commission took great pride in presenting and recommending the Everett Home Rule Charter to the citizens of Everett for your consideration at the November 2011 municipal election.
Key recommendations included replacing the current 25‐person bicameral city council consisting of a 7‐member board of aldermen and an 18 member common council, with a unicameral single‐branch 11‐member city council. The Commission recommended adopting a 4‐year term for the office of mayor in order to maximize efficiency and effectiveness for the entire city administration. The charter includes a provision to recall any elected official.
INTRODUCTION AND PROCESS:
In November of 2009, the voters of Everett overwhelmingly approved the formation of a 9‐member independent Charter Commission. The city’s voters elected this independent commission, separately and apart from the ongoing electoral politics of the City, in order to focus specifically on the issues of the structure and operation of the city government.
Over an 18‐month period, the Commission performed a thorough, comprehensive review of the entire current city charter, a process that had not formally taken place for 118 years. The Commission attempted to identify those specific provisions of the current charter that worked, those that did not, those that could be improved and those that needed to be added in order to have a more modern, efficient and responsive city government. To aid in that process, we also reviewed many other charters, with a special emphasis on those municipalities that have recently conducted a charter development process. Members interviewed city department heads, elected and appointed committees, boards and mayors.
The Commission held 27 open public meetings, 3 public hearings and met with various public officials, both local and statewide. During the public comment period at its regular meetings, at public hearings and through written communications, the Commission heard a myriad of varied ideas from the voters of the City as to the form and shape of city government that they felt would best serve the citizens of Everett going forward. This testimony only reinforced the perception that most voters want a restructuring of Everett's current form of city government.
44
Besides listening to the will of the voters, each Commissioner also brought his or her own ideas to the table. The debates were lively, with strongly defended opinions. At the same time, Commission members listened to, learned from and were often persuaded by one another. In all instances, the Commission was a model of civil discourse and participatory democracy.
To guide the Commission through this process and to write the charter, the Commission retained an experienced municipal charter consultant from the Edward J. Collins, Jr. Center for Public Management, McCormack Graduate School of Policy and Global Studies, at the University of Massachusetts Boston. Stephen McGoldrick was the lead consultant.
Although the past city charter had served the interests of the city and its citizens well for many years, it did not kept up with the times. Therefore, the city's charter needed to be entirely rewritten to bring it up to the modern standards required by the laws of the Commonwealth of Massachusetts. While that part of the process was important, even more important was for the new charter to define a structure of Everett's city government going forward that was based upon the will of the voters, as we understood it.
We believe that we have a charter that we can all be proud of. We stand firmly behind and endorse the charter that we have produced.
CHARTER HIGHLIGHTS
City Council
The existing 2‐branch city council was replaced with a one‐branch city council. The city council is composed of 11members, all elected citywide. The City Council consists of 6 ward councilors and 5 at‐large councilors. There is one ward councilor per ward and they are required to be domiciled in the ward they represent. Councilors serve 2‐year terms. The city council has all the powers and duties of municipal legislative bodies in Massachusetts, as defined within the General Laws of the Commonwealth. The city council also has additional powers and duties as contained in the charter or by ordinance.
Mayor
The mayor will continue to carry out the functions of the office of mayor, much as it currently exists. All of the executive powers of cities will continue to be vested solely in the mayor. The mayor will continue to have additional powers and duties as contained in the charter or by ordinance. The mayor has a number of new responsibilities, most notably in the area of city finances. The term of the office of mayor has increased from 2 to 4 years.
45
School Committee
The school committee is a 9 member body, with all members elected citywide. The school committee consists of 6 ward members and 3 at‐large members. There is 1 ward member per ward and they are required to be domiciled in the ward they represent. Members continue to serve 2‐year terms. The school committee has all the powers conferred on school committees by Massachusetts General Laws, as well as additional duties and powers as contained in the charter or by ordinance. Except in the case of an emergency, the school committee will not meet on the same day as a regular city council meeting. The mayor has a right to attend school committee meetings to participate in discussions, to make motions and to exercise every other right of a regular member but not including the right to vote.
Prohibitions
Members of the city council and the school committee are not allowed to hold any other city office or city employment. Members of the city council and school committee are not eligible to participate in the city’s group health and life insurance programs. No elected official is able to hold a compensated city position for one year following the conclusion of his or her elected service. Any elected official finally convicted of a felony will immediately be removed from office and is disqualified from serving in any other elective or appointed office or position under the city.
Organization of City Operations
The mayor is authorized to submit reorganization plans of City departments, boards and commissions to the city council. The city council will approve or reject the mayor’s proposals but does not have the authority to amend them. There are merit principles, which require the mayor to hire individuals that are especially fitted by training and experience for city positions.
City Finances
The mayor is required, at least quarterly and in writing, to keep the city council fully informed of the financial condition of the city. The mayor is required to call a joint meeting of the city council and the school committee to review the fiscal condition of the city before the start of each year’s budget process. The budget process should become more open and transparent. The annual proposed operating budget will include a complete fiscal plan of all city funds, activities and agencies, including revenues and expenditures. A capital improvement plan will be updated annually by the mayor and submitted to the city council for approval, prior to the operating budget. The capital improvement plan is required to contain 5‐year projections, including projected costs. The city council, not the mayor, has control over the city's annual independent, outside audit.
46
Elections and Filling of Vacant Seats
A preliminary election will be held for all elected positions, if so needed. The process of filling vacancies on the city council and the school committee is modified. Preference is given to candidates who ran in the prior election but did not win a seat, as long as they received a vote for the seat on 20% of the ballots cast in that prior election. The filling of a vacancy in the office of mayor has been modified to reflect the change to a 4‐year term.
Voter Participation Provisions
There are more provisions for voters to directly participate in the decisions of city government. All regular meetings of the city council need to provide for a period of public comment. Public hearings are required before the city council can act on the city's annual capital improvement plan and annual operating budget. There are provisions to allow voters to petition the city council or the school committee to put an item on their agendas; to initiate a referendum to allow voters to reverse certain measures adopted by the city council or the school committee; to initiate petitions to compel the city council or the school committee to adopt measures; and to recall any elected official. However, there are also safeguards against frivolous petitions.
Charter and Ordinance Review
The new charter calls for periodic reviews of the charter and a re‐codification of the city's ordinances.
Time of Taking Effect
The new charter is now in effect.
CONCLUSION:
The members of the Charter Commission were honored to have served on the commission, and thanked the voters for the confidence they showed by electing the members of the Commission to serve. The Commission carried out its duties to the best of its abilities, based on the members’ commitment to an open and transparent process.
The Charter Commission thanked all the leaders of the city, elected and appointed, for the ongoing cooperation that they ‐‐ and all city employees ‐‐ have afforded the Commission since it was elected in 2009.
47
They have offered their sincere appreciation to all those citizens of Everett who participated in the process ‐ particularly those citizens who took the time and made the effort to present their views directly to the Everett Charter Commission. The thoughts of many were interwoven throughout the new charter.
This charter resulted in a significant reorganization and improvement in the way that Everett city government supports and informs its residents, as Everett continues to meet the challenges facing Massachusetts' communities in the twenty‐first century.
We fully recognize that the changes that were recommended were significant. These changes were arrived at after considerable research, thought and discussion. Decisions were arrived at by consensus, often after heated debate. We feel that it is very significant that this charter received the unanimous approval of all of the members of the Charter Commission and no member will be writing a minority report, as was their right if they felt so compelled.
We are confident that this charter does contain all of the tools necessary to correct, change or improve the charter as the city moves forward.
48
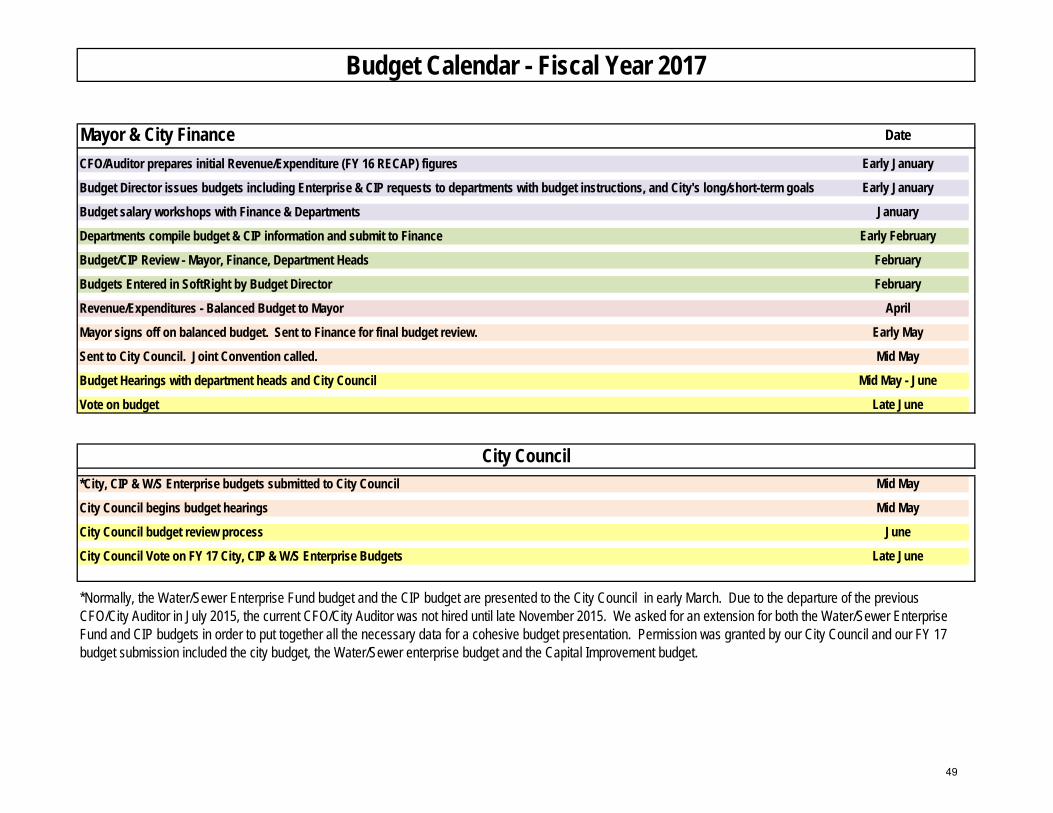
Mayor & City Finance Date
CFO/Auditor prepares initial Revenue/Expenditure (FY 16 RECAP) figures Early January
Budget Director issues budgets including Enterprise & CIP requests to departments with budget instructions, and City's long/short-term goals Early January
Budget salary workshops with Finance & Departments January
Departments compile budget & CIP information and submit to Finance Early February
Budget/CIP Review - Mayor, Finance, Department Heads February
Budgets Entered in SoftRight by Budget Director February
Revenue/Expenditures - Balanced Budget to Mayor April
Mayor signs off on balanced budget. Sent to Finance for final budget review. Early May
Sent to City Council. Joint Convention called. Mid May
Budget Hearings with department heads and City Council Mid May - June
Vote on budget Late June
*City, CIP & W/S Enterprise budgets submitted to City Council Mid May
City Council begins budget hearings Mid May
City Council budget review process June
City Council Vote on FY 17 City, CIP & W/S Enterprise Budgets Late June
Budget Calendar - Fiscal Year 2017
City Council
*Normally, the Water/Sewer Enterprise Fund budget and the CIP budget are presented to the City Council in early March. Due to the departure of the previous CFO/City Auditor in July 2015, the current CFO/City Auditor was not hired until late November 2015. We asked for an extension for both the Water/Sewer Enterprise Fund and CIP budgets in order to put together all the necessary data for a cohesive budget presentation. Permission was granted by our City Council and our FY 17 budget submission included the city budget, the Water/Sewer enterprise budget and the Capital Improvement budget.
49
The Budget Process The Budget and Appropriation Process
The budget document is the instrument used by the budget‐making authority to present a comprehensive financial program to the appropriating body. The legalistic view is that a budget is a plan of financial operation embodying an estimate of proposed expenditures for a given period of time and the proposed means of financing them. In a much more general sense, budgets may be regarded as devised to aid management to operate an organization more effectively. In the general sense, budgets are the financial expression of plans prepared by managers for operating an organization during a time period and for changing its physical facilities and its capital structure.
The budget preparation process for all Cities is governed by Massachusetts General Law (MGL) Ch. 44. The General Laws require that the budget be supported by revenues earned during the year plus any savings from prior years. The General Laws also requires public involvement in the process, including the requirement for a public hearing on the proposed budget.
The Mayor provides leadership in the budget process by developing budgetary policy and working closely with department heads and the City Council to assure that the process identifies community needs and priorities and develops a farsighted and well‐crafted plan. The Mayor initiates the budget process that provides the policy context for identification of priorities and development of initiatives.
Within 170 days after the annual organization of the city government (which is ordinarily in early January), the Mayor is required to submit a budget of proposed expenditures for the fiscal year beginning on the next July 1. The City Council may make appropriations for the recommended purposes and may reduce or reject any item. Without a recommendation of the Mayor, the City Council may not increase any item or make an appropriation for a purpose not included in the proposed budget (except by a two‐thirds vote in case of the failure of the Mayor to recommend an appropriation for such a purpose within 7 days after a request from the City Council). If the City Council fails to act on any item of the proposed budget within 45 days, that item takes effect.
If the Mayor does not make a timely budget submission, provision is made for preparation of a budget by the City Council. Provision is also made for supplementary appropriations upon recommendation of the Mayor. Enterprise Fund expenditures are required to
50
be included in the budget adopted by the City Council. The school budget is limited to the amount appropriated by the City Council, but the school committee retains full power to allocate the funds appropriated.
Under certain circumstances and subject to certain limits and requirements, the City Council of a city, upon the recommendation of the Mayor, may transfer amounts appropriated for the use of the department (except for a municipal light department or a school department) to another appropriation for the same department or for the use of any other department.
Commencing July 1, 2012, the City established enterprise funds in accordance with Chapter 44, Section 531F ½, of the General Laws for the City’s water and sewer services.
The Finance Department prepares budget packages for each department in January. The Mayor holds a city‐wide budget meeting, attended by all department heads and finance personnel, concerning a general overview of the state of the economy, and to outline specific guidelines dictating the preparation of individual department budgets. In consultation with the Finance Department, each department then prepares an operating budget and a mission statement outlining the projected goals for the future. These operating budgets are submitted to the Finance Department for review and entry into the computerized accounting system. The budgets are then prepared for the Mayor’s review.
In March and April, each department head meets with the Mayor, the Mayor’s Chief of Staff, the CFO/City Auditor and the Budget Director to review their proposed budgets and program changes for the coming year. As the proposed budgets are reviewed by the Mayor, the budgets submitted may be adjusted based on the individual needs of each department. During the months of April and May, the Mayor finalizes the Annual Budget document for submission to the City Council. The proposed budget documentation is prepared by the Finance Department. The City Council accepts the budget and submits it to the Council on the Whole of the Budget. The Council on the Whole of the Budget then holds meetings with the Mayor, the Mayor’s Chief of Staff, the CFO/City Auditor, Budget Director and department heads to review each departmental budget. The budget must be approved by a majority vote of the City Council within 45 days of receipt of the budget, but not later than June 30th of each year.
The school department budgets are prepared by the Superintendent of Schools and the School Department. The school budget is reviewed and approved by the School Committee and subsequently submitted to the City Finance Department for inclusion in the city budget presented to the City Council for approval and appropriation.
51
WHAT IS A BALANCED BUDGET?
A budget is considered in balance when revenues are equal to, or exceed expenditures. This is a requirement of all Massachusetts communities.
THE BUDGET FORMAT
The budget summary contains summary totals from all operating segments. The revenue section details revenue sources with expected trends. Each departmental section contains a department mission statement and financial data relating to the entire department, including personnel detail. The enterprise section includes revenue and expenditure trends of the self‐sustaining enterprise funds along with departmental goals. THE CIP section details all expected capital program outlays in the current fiscal year as well as a summary of the next following years.
BUDGET AMENDMENTS
Budget Amendment Increases – Any increase to the budget must be submitted to the City Council by the Mayor for approval. Budget amendments usually occur from transfers from other special revenue funds (usually receipts reserved for appropriation funds), free cash appropriations in general fund, or retained earnings appropriations within the Enterprise Funds. They can also be voted as an additional appropriation to the budget to be offset by property taxes, local revenue, state aid, and reserves prior to the tax rate being set in December of each year.
Budget Amendment Transfers
Budget transfers within the school department are submitted to the School Committee for their approval, and are processed by the Finance Department once approved. Budget transfers for City (non‐school) budgets, either between personnel and non‐personnel line items or between departments, must be submitted to City Council for their approval. This is due to the fact that the City Council votes the original budget as follows:
City Budgets – The City Council votes each personnel and non‐personnel line separately within each department unit.
52
School Budgets – The City Council votes the TOTAL for the school budget, not separate departments and/or organizational units as they do for the City budgets.
BUDGET GOALS
Policy Driven Planning: The budget is developed based upon community values and key city strategic financial and program policies. The City’s Five Year Financial Forecast provides the nexus between the long‐term financial plan and budgetary development. The plan includes a comprehensive multi‐year projection of the financial position and budget projections, including documentation of revenue and cost assumptions and projections.
Program of Services for the Community: The budget is designed to focus on financial information and missions and goals that have value added outcomes to the community through City services. The Mayor and the City Council will use the City’s fundamental principles as a basis for allocation choices and policy discussions. It also provides a basis for measuring progress toward goals during the budget period.
Financial Plan of Allocation and Resource Management: The budget establishes the plan and legal appropriations to allow the City to operate during the fiscal year. The budget provides specific direction for departments and agencies for management of resources. It also provides broad goals related to the City’s overall financial position and identifies business decisions required to keep the City financially viable and strong. It is developed using all available financial and planning reviews, including the Five Year Financial Forecast and the five‐year rolling Capital Improvement Program.
Communication Tool: The budget is intended to communicate to a broad range of readers, both locally and around the region, as well as the larger governmental and financial community. The budget expresses priorities and goals, assignments and plans, targets and hopes. It is a key statement of City priorities, and is meant to provide confidence in, and confirmation of, the ordinance mandated mayoral form of government.
53
Five Year Financial Forecast – Executive Summary
The five year financial forecast for the City of Everett is used as a budget tool that enables municipal officials to review operating needs, identify fiscal challenges and opportunities, and help develop long term budgeting policies as part of an overall strategic plan. The five year financial forecast is invaluable in identifying key areas that the City needs to focus on such as rising health insurance costs, retirement assessments, and collective bargaining agreements. It also helps the City plan for its capital budget, debt service management, and long term sustainability. Financial forecasting is the process of projecting revenues and expenditures over a five to ten year period. Factors that affect forecasting are current and future economic conditions, collective bargaining agreements, future operating and capital scenarios, and other factors that affect future revenues and expenditures. The five year financial forecast is also used as a communication tool for both the City Council and the public. A separate power point document helps the administration communicate the long term strategies, fiscal challenges, and overall financial health of the City of Everett. The five year forecast is assumed to be realistic in its assumptions, both for revenue and expenditures. Revenue forecasting is based upon historical trends as well as current economic conditions. Expenditure forecasting is based upon the same factors, as well as known facts that pertain to specific sectors (i.e. collective bargaining agreements, long term contracts, debt service, etc.). Revenues Tax Levy: $98,197,960 The tax levy is the City’s primary revenue source, comprising approximately 51.9% of the City’s total general fund revenues forecasted for the FY2017 operating budget. Residential property values pay 42.5% of the total property taxes, while commercial, industrial, and personal property values pay 57.5%. The City has a split tax rate of 1.75, and a residential exemption of 20%, which translates to a residential rate of $14.71/m. and commercial rate of $36.56/m. for FY2017.
54
The City realizes an automatic 2.5% increase to the tax levy under Proposition 2 ½, plus any increase due to “new growth” in the City. New growth includes new development, condominium conversions, and renovations/expansions to existing properties, to name a few. The City has typically averaged approximately $2.4 million per year in new growth; however, it is recommended by the City’s Assessor that the growth estimate to be used for FY2017 should be $2.0 million. This number we consider conservative. In FY2016, the City’s primary levy limit was $107,869,806. This primary levy limit is 2.5% of the full and fair cash value of taxable real and personal property in the City. It is assumed that the City will see a 9.5% increase overall to this value in FY2017. If so, the primary levy limit (levy ceiling) in the City should be approximately $112 million. The city’s overall levy limit, when including 2.5% increase per Proposition 2 ½ and $1.2 million of new growth, is estimated to be $104,031,376 million for FY2017. Local Receipts: $9,565,000 Local receipts are locally generated revenues other than real and personal property taxes. Examples include motor vehicle excise, investment income, hotel/motel tax, fees, rentals, and charges. The City has increased its estimate for local receipts by 24.4%. This large increase reflects an additional $2,000,000 the City will be receiving under the terms of the community host agreement related to the new casino project with “Wynn Resorts”. These payments will offset the direct costs incurred by the City related to the permitting process during construction. Most other local receipts are level funded as the FY2016 estimated amounts. These are budgeted conservatively and, if budgeted amounts are exceeded by actual receipts, the difference flows to the City’s budgetary fund balance (free cash). Conservative revenue forecasting is considered a “best practice” by both the Department of Revenue and the bond rating agencies. For purposes of forecasting, it is estimated that local recurring receipts will increase by 2.5% for FY2018 through FY2020. Cherry Sheet Revenue (State Aid): $72,705,663 Named for the cherry colored paper on which it was originally printed, the Cherry Sheet is the official notification by the Commissioner of Revenue to municipalities and regional school districts of estimated state aid to be paid and charges to be assessed over the next fiscal year. Cherry Sheets are usually issued each spring, following enactment by the Legislature of the state budget for the following year.
55
This year, the Legislature has increased the estimated state aid to the City of Everett by approximately $1.2 million from the FY2016 amount. The $1.2 million represents a 1.6% increase over FY2016. The City estimated a historical 2.5% increase; however, the Commonwealth changed their methodology regarding Chapter 70 funds (school aid), which caused the lower than expected increase. It is difficult to gauge the amount that the Commonwealth will allocate to the 351 municipalities due to the volatile economy. Nevertheless, we need to assume a figure for purposes of completing the five‐year financial forecast. Therefore, it is predicted that the State will increase the FY2017 appropriation by 3% each year through FY2020. School Building Assistance: $1,882,459 The Massachusetts School Building Authority (MSBA) administers the school building assistance program that reimburses cities, towns, and regional school districts varying percentages of their school construction costs depending on the wealth of the community or district and the category of reimbursement. The City of Everett was lucky enough to receive 90% reimbursement for all its building projects. In FY17, the amount of SBA reimbursement remains level with the FY2016 amount, per the MSBA reimbursement schedule. The amounts listed in the five year forecast reflect the funding schedule of the MSBA for FY2018 through FY2020. Enterprise Fund Revenue: $17,217,998 An enterprise fund, authorized by MGL Chapter 44, Section 53F ½ is a separate accounting and financial reporting mechanism for municipal services for which a fee is charged in exchange for goods or services. It allows a community to demonstrate to the public the portion of total costs of a service that is recovered through user charges and the portion that is subsidized by the tax levy, if any. The City of Everett has one Enterprise Fund for water and sewer. The water and sewer enterprise fund, with estimated revenues of $17.2 million, provides for full cost recovery, including indirect costs that are appropriated in the general fund. The water and sewer enterprise fund revenues are estimated to have various increases over the next four fiscal years depending on the costs of assessments from the MWRA, as well as the debt service from some of the major projects underway in the City, including, the reconstruction of several water mains, sewer inflow and infiltration projects, and other infrastructure repairs as described in the Enterprise Fund budget document distributed and approved in April of 2016 for FY2017.
56
Other Financial Resources – Recurring: $6,000,492 The administration is proposing to use $2 million dollars of free cash and $4 million dollars from the “casino mitigation funds” to reduce the tax rate in FY2017. As such, the City has budgeted $6.00 million of “other financial sources” for the FY2017 budget in its financial forecast. The administration may choose to use this strategy in future years, however, for purposes of forecasting, free cash has not been estimated for FY2018 through FY2020. Expenses City Departments: General Government: $6,609,938 Departments under General Government include all of the financial offices and overhead support functions, including City Council, Mayor, Auditor, Purchasing, Assessing, Treasurer/Collector, Solicitor, Human Resources, IT, City Clerk and Election Commission. In FY2017, the administration had budgeted a 2% increase to most salaries. No collective bargaining agreements were complete at the time of the budget submittal deadline. For FY2017, funding for all anticipated collective bargaining settlements is budgeted within the respective departments (not including schools). Also, for FY2017, some salaries have been adjusted to reflect the results of new hires and some reclassifications. While still maintaining their departmental status, the expenses of the Office of Budgeting have been moved under the Auditor’s office. This will allow more leeway with regard to general operating expenses and to share the vacant Finance/Budget personnel. Another major change has been the establishment of an Election Commission. This new department has absorbed the election expenses that were budgeted within the City Clerk’s purview, as well as all the personnel and expenses that were previously budgeted under the Registrar of Voters department. The estimated expense increase for general government services for the City will be 3% for FY2018 through FY2021.
57
Public Safety: $29,317,429 Departments under Public Safety include Police, Fire, Inspectional Services (ISD), and E‐911. Both the Police and Fire unions settled their last contract in late FY2016. We have added 8 new police officer positions and 9 new firefighter positions. This will allow these departments to fully staff patrol and fire shifts to meet the growing needs of the City. Salary increases are due in part because some police/fire employees are coming off grants that are expiring. Our ISD department has funded two new positions for a Wire Inspector and for an Inspector of Gas & Plumbing. These two hires will be working solely on the building of the Wynn casino. There are also 3 new Code Officer positions. This will allow a code officer to be assigned to each ward in the city as well as having an Administrator oversee their operations. We have created an account in our FY2017 budget entitled Contract Services. This was done for the 4Leaf contractors who are overseeing the work being done on the Wynn Casino. The Wynn casino is reimbursing the city for all expenses incurred by 4Leaf. To that end, we have also set up a revenue account as well so we can track expenses and related revenue. It is expected that public safety expenses will increase by 5% for FY2018 through FY2021. Department of Public Works : $10,741,756 Divisions under DPW include Administration/Fleet Management (490), Facilities Maintenance (491), Engineering (492), Parks/Cemetery/Stadium (493‐494), Highway (495), Snow and Ice (496), and Solid Waste (497). For FY2017, all departments under public works are budgeted in their respective organizational categories (490‐497), for better accountability and deliverance of services. Fleet Management will fall under the administrative arm of public works, with a business manager overseeing the management and maintenance/repairs of the fleet. In addition, the Business Manager position has been moved to the finance department to provide a better, more efficient bridge between the two departments. You will note that we have moved some personnel between the Parks/Cemetery/Stadium division and the Highway division and some between our Health & Wellness department into the Facilities Maintenance division. This better represents where the union personnel are assigned. Estimated expense increase for DPW has increased at 4% per year for FY2018 through FY2021.
58
Health and Human Services: $3,275,093 Departments under Health and Human Services include the Health department, Planning and Development, Council on Aging, Veterans’ Services, Commission on Disabilities and the Mayor’s Office of Human Services. In FY2017, we are continuing to bring together the Department of Health & Human Services, the Mayor’s Office of Human Services and the Office of Health & Wellness. We have begun restructuring the hierarchy by hiring a Director in FY2016 but eliminating the Director of Joint Committee position. We have also added 2 additional full‐time nursing positions to meet the needs of our growing School Department. Expenses in health and human services are projected to increase by 3% per year due for FY2018 through FY2021. Libraries and Recreation: $1,806,179 Departments under Libraries and Recreation include the City’s two libraries (Parlin and Shute), as well as the Office of Health and Wellness. The Office of Gaming Accountability and Development has not been funded in FY2017. The city has elected not to fill the vacant Director of Gaming Accountability & Development position. Costs have been absorbed by other departments such as Finance, City Solicitor and ISD. Expenses in Libraries and Recreation are projected to increase by 3% per year due to normal increases in salaries and expenses. School Department: Everett Public Schools: $73,565,225 The School Committee oversees the budget process for the schools, and it has a bottom line budget of $73,565,225 for FY2017 per Net School Spending (NSS) minimum requirements as calculated by the Department of Elementary and Secondary Education (DESE). For financial forecasting purposes, we expect that the cost of education will increase the general fund budget by 4% per year. The Mayor and Superintendent, through their respective financial administrators, continue to work on cost saving measures and cooperative operational and capital planning to ensure that the level of professional and non‐professional staff (operating) and all school facilities (capital) will be adequately funded to provide quality education and services to its students and their families.
59
Fixed Costs (City and School): Fixed Costs – Debt Service: $10,930,176 Debt service is the repayment cost, usually stated in annual terms and based on an amortization schedule, of the principal and interest on any particular bond issue. The overall debt service for the City is shown in greater detail in the Appendix of the FY2017 operating budget. The amounts on this forecast for FY2017 through FY2021 reflect the debt service schedules provided in the appendix of the budget. These debt schedules are provided by the City’s financial advisors at First Southwest and reflect all debt that has been authorized and issued as of April of 2016. Fixed Costs – all other fixed costs: $37,529,043 Fixed costs are costs that are legally or contractually mandated such as health insurance, pension, Medicare, unemployment, property & casualty insurance, and employee injuries. Fixed costs continue to be the biggest challenge in municipal budgets. They account for approximately 30% of the total budget in FY2017. Each fixed cost has its own projected increase over the five year forecast that reflects the average costs municipalities are seeing in each category. The projected increases for FY2018 through FY2021 for each fixed cost are as follows:
Health Insurance: 5% o Historical health insurance trend.
Contributory Pension: 4.5% o Per funding schedule to fully fund pension liability by 2030.
Non – Contributory Pension: ‐3% o Negative number due to the shrinking number of those retirees who are part of this group.
Medicare: 4% o To keep up with collective bargaining increases and additional staffing.
Municipal Insurance: 4% o Municipal insurance trend.
Worker’s Compensation: 5% o Conservative estimate.
Unemployment: 3% o Conservative estimate.
60
Water/Sewer Department – Enterprise Fund Enterprise Fund Expenses: $17,217,998 Expenses in the enterprise fund represent personnel, expenses, contracted services, assessments, and debt service costs. Expenses in the funds are projected to rise from FY2018 to FY2021 as follows:
Personnel: 3% Expenses: 3% Assessments: 5% Debt Service: per debt schedules (actual and projected)
Other Expenditures Cherry Sheet Assessment: $12,690,479 Named for the cherry colored paper on which it was originally printed, the Cherry Sheet is the official notification by the Commissioner of Revenue to municipalities and regional school districts of estimated state aid to be paid and charges to be assessed over the next fiscal year. Cherry Sheets are usually issued each spring, following enactment by the Legislature of the state budget for the following year. The categories of charges include retired teachers’ health insurance, RMV non‐renewal surcharge, MBTA, and tuition assessment. This year’s overall assessments have increased by 9% (increase of $1,095,169) from last year’s assessment of $11,595,310. The most significant change in the assessments is the increase of charter school sending tuition from $6,616,798 to $8,091,615 an increase of $1,474,817. It is projected that the Cherry Sheet assessment from the Commonwealth will increase 3% from FY2018 to FY2021.
61
Miscellaneous Other Expenditures: $2,552,833
o Overlay: $1,540,520 o Overlay is an account established annually to fund anticipated property tax abatements exemptions and uncollected taxes in that
year. It is anticipated that overlay will increase by 2.5% in FY2017 through FY2019; however, the increase may vary due to the triennial certifications of values per the DOR and the increased values of properties throughout the City.
o Snow and Ice Deficit: $867,351
o FY2017 is the final year of the amortization of the deficit incurred by the city in FY2014, which was an unusually active winter.
o Cherry Sheet Offset: $55,859 o Offset receipts are receipts from the Cherry Sheet that are to be used for a specific purpose (public library). These obligations are
expected to increase 3% for FY2017 to FY2021.
Conclusion The City of Everett, like all municipalities throughout the Commonwealth, continues to struggle with rising fixed costs, a sluggish economy, and contractual obligations that make balancing budgets very challenging. In most cases, Proposition 2 ½, the law that regulates the amounts a municipality can increase its property taxes, does not allow for property tax revenue to keep up with the costs of doing business. The five year financial forecast is a tool that helps us best manage the challenges. It is a tool that uses reasonable estimates in both revenue and expenditure trends while considering the overall economic picture of the current times. The goal is to project revenues and expenditures up to five years into the future which will help the administration analyze where current trends are leading and estimate if money will be available for discretionary spending such as capital purchases, collective bargaining settlements, and new municipal programs. It also will help identify those “budget buster” items that need reform. The five year forecast, combined with the capital improvement program and the FY2017 budget will continue to be the basis for all future financial planning for the City of Everett.
62
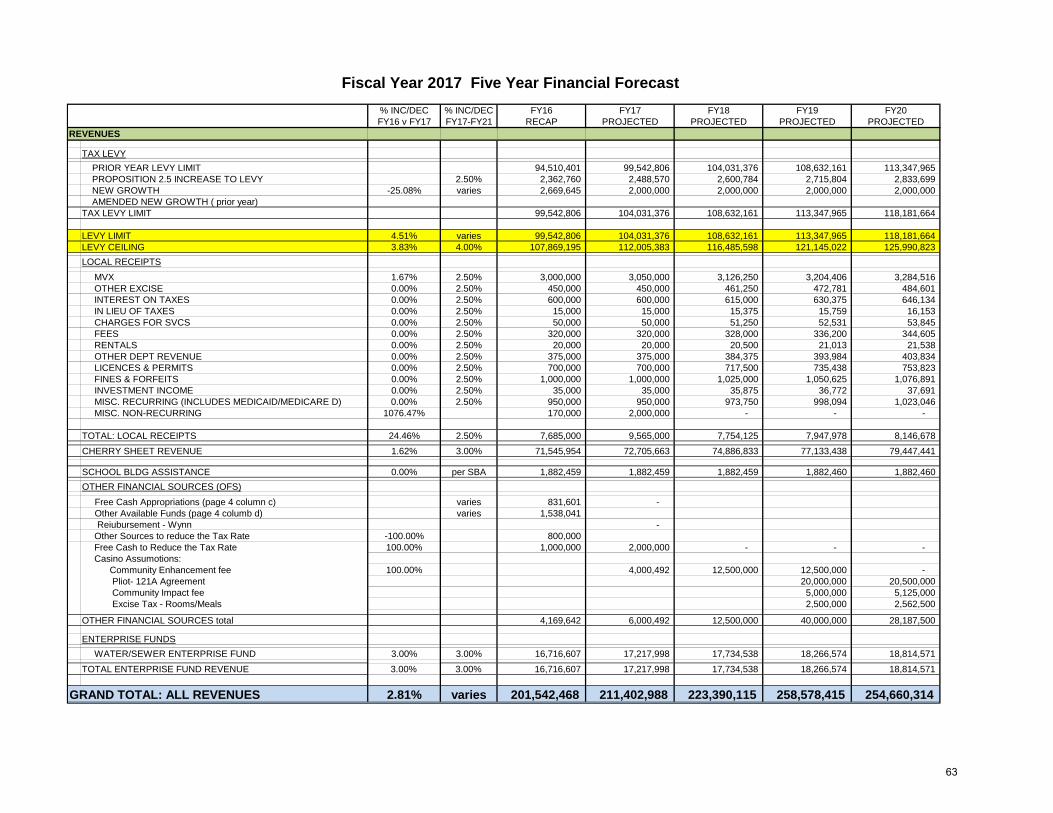
% INC/DEC % INC/DEC FY16 FY17 FY18 FY19 FY20FY16 v FY17 FY17-FY21 RECAP PROJECTED PROJECTED PROJECTED PROJECTED
REVENUES
TAX LEVY PRIOR YEAR LEVY LIMIT 94,510,401 99,542,806 104,031,376 108,632,161 113,347,965 PROPOSITION 2.5 INCREASE TO LEVY 2.50% 2,362,760 2,488,570 2,600,784 2,715,804 2,833,699 NEW GROWTH -25.08% varies 2,669,645 2,000,000 2,000,000 2,000,000 2,000,000 AMENDED NEW GROWTH ( prior year)TAX LEVY LIMIT 99,542,806 104,031,376 108,632,161 113,347,965 118,181,664
LEVY LIMIT 4.51% varies 99,542,806 104,031,376 108,632,161 113,347,965 118,181,664 LEVY CEILING 3.83% 4.00% 107,869,195 112,005,383 116,485,598 121,145,022 125,990,823 LOCAL RECEIPTS
MVX 1.67% 2.50% 3,000,000 3,050,000 3,126,250 3,204,406 3,284,516 OTHER EXCISE 0.00% 2.50% 450,000 450,000 461,250 472,781 484,601 INTEREST ON TAXES 0.00% 2.50% 600,000 600,000 615,000 630,375 646,134 IN LIEU OF TAXES 0.00% 2.50% 15,000 15,000 15,375 15,759 16,153 CHARGES FOR SVCS 0.00% 2.50% 50,000 50,000 51,250 52,531 53,845 FEES 0.00% 2.50% 320,000 320,000 328,000 336,200 344,605 RENTALS 0.00% 2.50% 20,000 20,000 20,500 21,013 21,538 OTHER DEPT REVENUE 0.00% 2.50% 375,000 375,000 384,375 393,984 403,834 LICENCES & PERMITS 0.00% 2.50% 700,000 700,000 717,500 735,438 753,823 FINES & FORFEITS 0.00% 2.50% 1,000,000 1,000,000 1,025,000 1,050,625 1,076,891 INVESTMENT INCOME 0.00% 2.50% 35,000 35,000 35,875 36,772 37,691 MISC. RECURRING (INCLUDES MEDICAID/MEDICARE D) 0.00% 2.50% 950,000 950,000 973,750 998,094 1,023,046 MISC. NON-RECURRING 1076.47% 170,000 2,000,000 - - -
TOTAL: LOCAL RECEIPTS 24.46% 2.50% 7,685,000 9,565,000 7,754,125 7,947,978 8,146,678 CHERRY SHEET REVENUE 1.62% 3.00% 71,545,954 72,705,663 74,886,833 77,133,438 79,447,441
SCHOOL BLDG ASSISTANCE 0.00% per SBA 1,882,459 1,882,459 1,882,459 1,882,460 1,882,460 OTHER FINANCIAL SOURCES (OFS) Free Cash Appropriations (page 4 column c) varies 831,601 - Other Available Funds (page 4 columb d) varies 1,538,041 Reiubursement - Wynn -
Other Sources to reduce the Tax Rate -100.00% 800,000 Free Cash to Reduce the Tax Rate 100.00% 1,000,000 2,000,000 - - - Casino Assumotions: Community Enhancement fee 100.00% 4,000,492 12,500,000 12,500,000 - Pliot- 121A Agreement 20,000,000 20,500,000 Community Impact fee 5,000,000 5,125,000 Excise Tax - Rooms/Meals 2,500,000 2,562,500
OTHER FINANCIAL SOURCES total 4,169,642 6,000,492 12,500,000 40,000,000 28,187,500
ENTERPRISE FUNDSWATER/SEWER ENTERPRISE FUND 3.00% 3.00% 16,716,607 17,217,998 17,734,538 18,266,574 18,814,571
TOTAL ENTERPRISE FUND REVENUE 3.00% 3.00% 16,716,607 17,217,998 17,734,538 18,266,574 18,814,571
GRAND TOTAL: ALL REVENUES 2.81% varies 201,542,468 211,402,988 223,390,115 258,578,415 254,660,314
Fiscal Year 2017 Five Year Financial Forecast
63
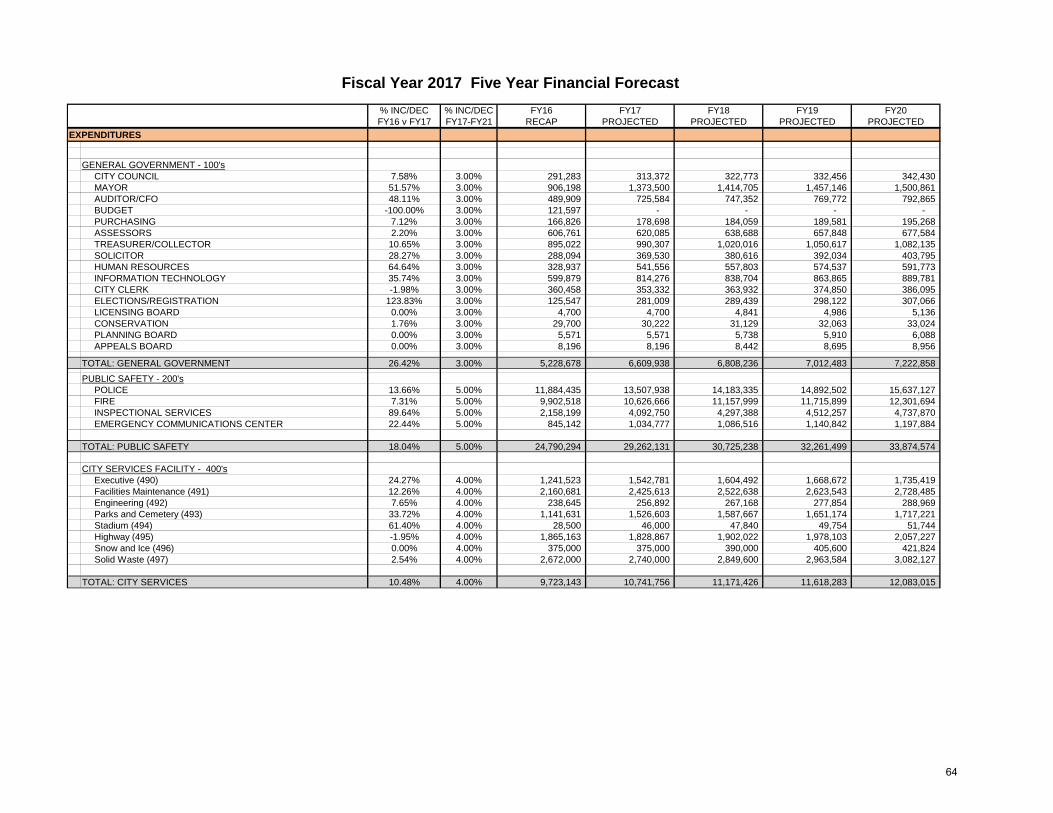
% INC/DEC % INC/DEC FY16 FY17 FY18 FY19 FY20FY16 v FY17 FY17-FY21 RECAP PROJECTED PROJECTED PROJECTED PROJECTED
Fiscal Year 2017 Five Year Financial Forecast
EXPENDITURES
GENERAL GOVERNMENT - 100'sCITY COUNCIL 7.58% 3.00% 291,283 313,372 322,773 332,456 342,430 MAYOR 51.57% 3.00% 906,198 1,373,500 1,414,705 1,457,146 1,500,861 AUDITOR/CFO 48.11% 3.00% 489,909 725,584 747,352 769,772 792,865 BUDGET -100.00% 3.00% 121,597 - - - - PURCHASING 7.12% 3.00% 166,826 178,698 184,059 189,581 195,268 ASSESSORS 2.20% 3.00% 606,761 620,085 638,688 657,848 677,584 TREASURER/COLLECTOR 10.65% 3.00% 895,022 990,307 1,020,016 1,050,617 1,082,135 SOLICITOR 28.27% 3.00% 288,094 369,530 380,616 392,034 403,795 HUMAN RESOURCES 64.64% 3.00% 328,937 541,556 557,803 574,537 591,773 INFORMATION TECHNOLOGY 35.74% 3.00% 599,879 814,276 838,704 863,865 889,781 CITY CLERK -1.98% 3.00% 360,458 353,332 363,932 374,850 386,095 ELECTIONS/REGISTRATION 123.83% 3.00% 125,547 281,009 289,439 298,122 307,066 LICENSING BOARD 0.00% 3.00% 4,700 4,700 4,841 4,986 5,136 CONSERVATION 1.76% 3.00% 29,700 30,222 31,129 32,063 33,024 PLANNING BOARD 0.00% 3.00% 5,571 5,571 5,738 5,910 6,088 APPEALS BOARD 0.00% 3.00% 8,196 8,196 8,442 8,695 8,956
TOTAL: GENERAL GOVERNMENT 26.42% 3.00% 5,228,678 6,609,938 6,808,236 7,012,483 7,222,858 PUBLIC SAFETY - 200's
POLICE 13.66% 5.00% 11,884,435 13,507,938 14,183,335 14,892,502 15,637,127 FIRE 7.31% 5.00% 9,902,518 10,626,666 11,157,999 11,715,899 12,301,694 INSPECTIONAL SERVICES 89.64% 5.00% 2,158,199 4,092,750 4,297,388 4,512,257 4,737,870 EMERGENCY COMMUNICATIONS CENTER 22.44% 5.00% 845,142 1,034,777 1,086,516 1,140,842 1,197,884
TOTAL: PUBLIC SAFETY 18.04% 5.00% 24,790,294 29,262,131 30,725,238 32,261,499 33,874,574
CITY SERVICES FACILITY - 400'sExecutive (490) 24.27% 4.00% 1,241,523 1,542,781 1,604,492 1,668,672 1,735,419 Facilities Maintenance (491) 12.26% 4.00% 2,160,681 2,425,613 2,522,638 2,623,543 2,728,485 Engineering (492) 7.65% 4.00% 238,645 256,892 267,168 277,854 288,969 Parks and Cemetery (493) 33.72% 4.00% 1,141,631 1,526,603 1,587,667 1,651,174 1,717,221 Stadium (494) 61.40% 4.00% 28,500 46,000 47,840 49,754 51,744 Highway (495) -1.95% 4.00% 1,865,163 1,828,867 1,902,022 1,978,103 2,057,227 Snow and Ice (496) 0.00% 4.00% 375,000 375,000 390,000 405,600 421,824 Solid Waste (497) 2.54% 4.00% 2,672,000 2,740,000 2,849,600 2,963,584 3,082,127
TOTAL: CITY SERVICES 10.48% 4.00% 9,723,143 10,741,756 11,171,426 11,618,283 12,083,015
64
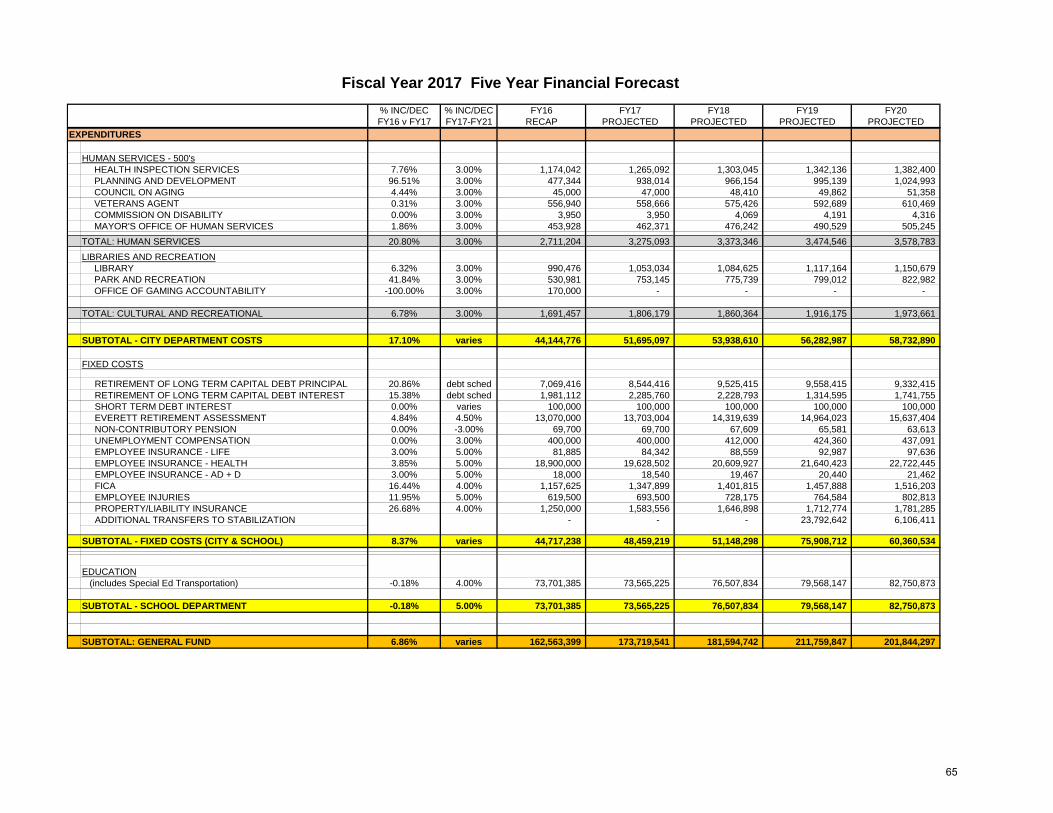
% INC/DEC % INC/DEC FY16 FY17 FY18 FY19 FY20FY16 v FY17 FY17-FY21 RECAP PROJECTED PROJECTED PROJECTED PROJECTED
Fiscal Year 2017 Five Year Financial Forecast
EXPENDITURES
HUMAN SERVICES - 500'sHEALTH INSPECTION SERVICES 7.76% 3.00% 1,174,042 1,265,092 1,303,045 1,342,136 1,382,400 PLANNING AND DEVELOPMENT 96.51% 3.00% 477,344 938,014 966,154 995,139 1,024,993 COUNCIL ON AGING 4.44% 3.00% 45,000 47,000 48,410 49,862 51,358 VETERANS AGENT 0.31% 3.00% 556,940 558,666 575,426 592,689 610,469 COMMISSION ON DISABILITY 0.00% 3.00% 3,950 3,950 4,069 4,191 4,316 MAYOR'S OFFICE OF HUMAN SERVICES 1.86% 3.00% 453,928 462,371 476,242 490,529 505,245
TOTAL: HUMAN SERVICES 20.80% 3.00% 2,711,204 3,275,093 3,373,346 3,474,546 3,578,783 LIBRARIES AND RECREATION
LIBRARY 6.32% 3.00% 990,476 1,053,034 1,084,625 1,117,164 1,150,679 PARK AND RECREATION 41.84% 3.00% 530,981 753,145 775,739 799,012 822,982 OFFICE OF GAMING ACCOUNTABILITY -100.00% 3.00% 170,000 - - - -
TOTAL: CULTURAL AND RECREATIONAL 6.78% 3.00% 1,691,457 1,806,179 1,860,364 1,916,175 1,973,661
SUBTOTAL - CITY DEPARTMENT COSTS 17.10% varies 44,144,776 51,695,097 53,938,610 56,282,987 58,732,890
FIXED COSTS
RETIREMENT OF LONG TERM CAPITAL DEBT PRINCIPAL 20.86% debt sched 7,069,416 8,544,416 9,525,415 9,558,415 9,332,415 RETIREMENT OF LONG TERM CAPITAL DEBT INTEREST 15.38% debt sched 1,981,112 2,285,760 2,228,793 1,314,595 1,741,755 SHORT TERM DEBT INTEREST 0.00% varies 100,000 100,000 100,000 100,000 100,000 EVERETT RETIREMENT ASSESSMENT 4.84% 4.50% 13,070,000 13,703,004 14,319,639 14,964,023 15,637,404 NON-CONTRIBUTORY PENSION 0.00% -3.00% 69,700 69,700 67,609 65,581 63,613 UNEMPLOYMENT COMPENSATION 0.00% 3.00% 400,000 400,000 412,000 424,360 437,091 EMPLOYEE INSURANCE - LIFE 3.00% 5.00% 81,885 84,342 88,559 92,987 97,636 EMPLOYEE INSURANCE - HEALTH 3.85% 5.00% 18,900,000 19,628,502 20,609,927 21,640,423 22,722,445 EMPLOYEE INSURANCE - AD + D 3.00% 5.00% 18,000 18,540 19,467 20,440 21,462 FICA 16.44% 4.00% 1,157,625 1,347,899 1,401,815 1,457,888 1,516,203 EMPLOYEE INJURIES 11.95% 5.00% 619,500 693,500 728,175 764,584 802,813 PROPERTY/LIABILITY INSURANCE 26.68% 4.00% 1,250,000 1,583,556 1,646,898 1,712,774 1,781,285 ADDITIONAL TRANSFERS TO STABILIZATION - - - 23,792,642 6,106,411
SUBTOTAL - FIXED COSTS (CITY & SCHOOL) 8.37% varies 44,717,238 48,459,219 51,148,298 75,908,712 60,360,534
EDUCATION (includes Special Ed Transportation) -0.18% 4.00% 73,701,385 73,565,225 76,507,834 79,568,147 82,750,873
SUBTOTAL - SCHOOL DEPARTMENT -0.18% 5.00% 73,701,385 73,565,225 76,507,834 79,568,147 82,750,873
SUBTOTAL: GENERAL FUND 6.86% varies 162,563,399 173,719,541 181,594,742 211,759,847 201,844,297
65
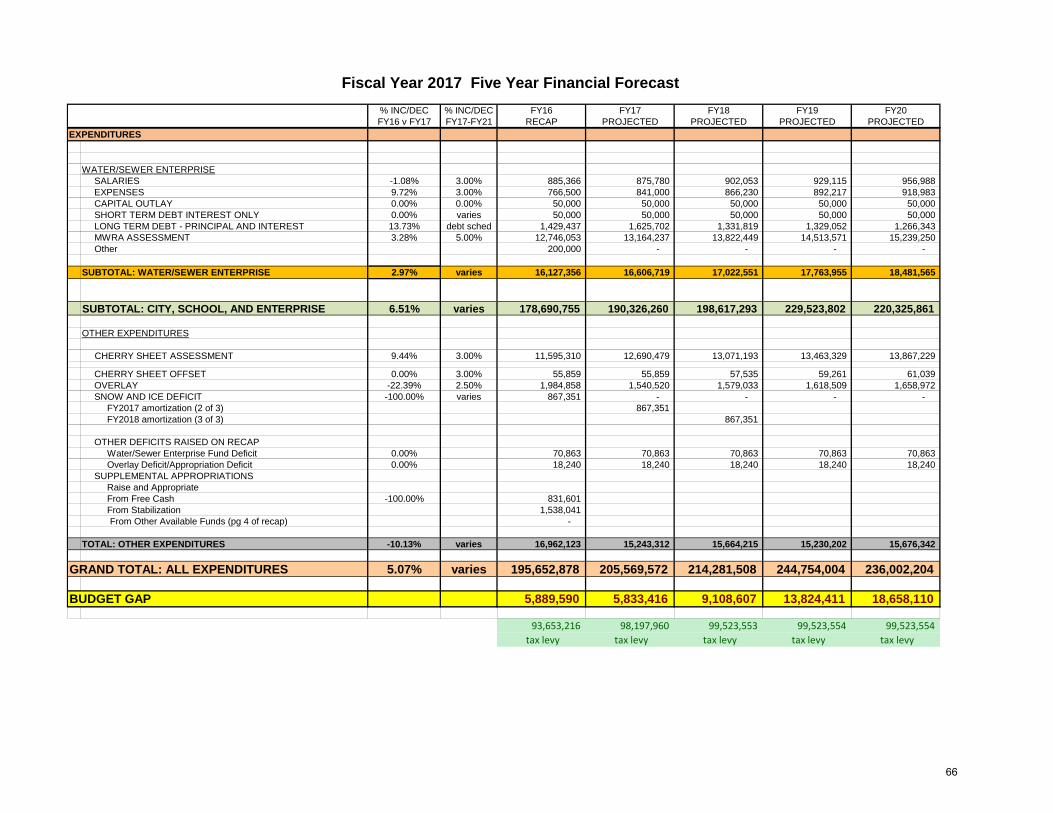
% INC/DEC % INC/DEC FY16 FY17 FY18 FY19 FY20FY16 v FY17 FY17-FY21 RECAP PROJECTED PROJECTED PROJECTED PROJECTED
Fiscal Year 2017 Five Year Financial Forecast
EXPENDITURES
WATER/SEWER ENTERPRISESALARIES -1.08% 3.00% 885,366 875,780 902,053 929,115 956,988 EXPENSES 9.72% 3.00% 766,500 841,000 866,230 892,217 918,983 CAPITAL OUTLAY 0.00% 0.00% 50,000 50,000 50,000 50,000 50,000 SHORT TERM DEBT INTEREST ONLY 0.00% varies 50,000 50,000 50,000 50,000 50,000 LONG TERM DEBT - PRINCIPAL AND INTEREST 13.73% debt sched 1,429,437 1,625,702 1,331,819 1,329,052 1,266,343 MWRA ASSESSMENT 3.28% 5.00% 12,746,053 13,164,237 13,822,449 14,513,571 15,239,250 Other 200,000 - - - -
SUBTOTAL: WATER/SEWER ENTERPRISE 2.97% varies 16,127,356 16,606,719 17,022,551 17,763,955 18,481,565
SUBTOTAL: CITY, SCHOOL, AND ENTERPRISE 6.51% varies 178,690,755 190,326,260 198,617,293 229,523,802 220,325,861
OTHER EXPENDITURES
CHERRY SHEET ASSESSMENT 9.44% 3.00% 11,595,310 12,690,479 13,071,193 13,463,329 13,867,229
CHERRY SHEET OFFSET 0.00% 3.00% 55,859 55,859 57,535 59,261 61,039 OVERLAY -22.39% 2.50% 1,984,858 1,540,520 1,579,033 1,618,509 1,658,972 SNOW AND ICE DEFICIT -100.00% varies 867,351 - - - - FY2017 amortization (2 of 3) 867,351 FY2018 amortization (3 of 3) 867,351
OTHER DEFICITS RAISED ON RECAP Water/Sewer Enterprise Fund Deficit 0.00% 70,863 70,863 70,863 70,863 70,863 Overlay Deficit/Appropriation Deficit 0.00% 18,240 18,240 18,240 18,240 18,240 SUPPLEMENTAL APPROPRIATIONS Raise and Appropriate From Free Cash -100.00% 831,601 From Stabilization 1,538,041
From Other Available Funds (pg 4 of recap) -
TOTAL: OTHER EXPENDITURES -10.13% varies 16,962,123 15,243,312 15,664,215 15,230,202 15,676,342
GRAND TOTAL: ALL EXPENDITURES 5.07% varies 195,652,878 205,569,572 214,281,508 244,754,004 236,002,204
BUDGET GAP 5,889,590 5,833,416 9,108,607 13,824,411 18,658,110
93,653,216 98,197,960 99,523,553 99,523,554 99,523,554 tax levy tax levy tax levy tax levy tax levy
66
Financial Reserve Policies Stabilization Fund A stabilization fund is a fund designed to accumulate amounts for capital and other future spending purposes, although it may be appropriated for any lawful purpose (MGL Ch. 40 §5B). Communities may establish one or more stabilization funds for different purposes and may appropriate into them in any year an amount not to exceed ten percent of the prior year’s tax levy. The total of all stabilization fund balances shall not exceed ten percent of the community’s equalized value, and any interest shall be added to and become a part of the funds. A two‐thirds vote of the city council is required to establish, amend the purpose of, or appropriate money from the stabilization fund. The City has set a target level for the Stabilization fund of 10% of the City’s current general fund operating budget ($17.3 million based on 2017 budget). The target funding date is projected to occur by fiscal year 2018. The stabilization fund shall be funded by appropriations from free cash, operating budget appropriations when available, and other one‐time non‐recurring revenues that become available for appropriation per M.G.L.
1. Any draw down of the stabilization fund from the prior fiscal year should be allocated from the certified free cash if available.
2. Fifteen percent (15%) of any free cash available after funding #1 above will be allocated from free cash to the stabilization fund, up to the proposed reserve balance of the stabilization fund (10% of operating budget).
The stabilization fund should only be used for the following circumstances:
1. When net State Aid (receipts less assessments) is reduced by an amount less than the average of the prior two years.
2. When Local Receipts projected are below a three per cent (3%) increase of the prior two year’s actual receipts as reported on page three of the Tax Rate Recapitulation as certified by the Director of the Bureau of Accounts (excluding non‐recurring receipts).
67
3. When there is a catastrophic or emergency event(s) that cannot be supported by current general fund appropriations.
As of June 2016, the balance of the City’s Stabilization Fund is $13,854,048. Other Post‐Employment Benefits Liability Trust Fund (OPEB Trust Fund) The City is mandated by the Governmental Accounting Standards Board (GASB) to start accounting for Other Post Employment Benefit (OPEB) as outlined in Statement 45. In FY2014, the Administration brought forward a council order to adopt Massachusetts General Law (MGL) Chapter 32b, Section 20 (OPEB Liability Trust Fund local option). The purpose of the fund is to reduce the unfunded actuarial liability of health care and other post‐employment benefits, similar to the way the City funds its unfunded actuarial liability for pension benefits. The City Council approved the order, and funded the first appropriation order in the amount of $773,500. The current balance in the OPEB Trust Fund is $2,460,951 as of June 30, 2016. The custodian of the fund is the City Treasurer and funds will be invested and reinvested by the custodian consistent with the prudent investor rule set forth in Chapter 203C. The City will appropriate amounts to be credited to the fund in accordance with its financial policies. Any interest or other income generated by the fund shall be added to and become part of the fund. All monies held in the fund shall be segregated from other funds and shall not be subject to the claims of any general creditor of the City. The administration will fund this account through annual appropriation from certified free cash, with fifteen percent (15%) of any free cash certified allocated to the OPEB Trust Fund, to fund the future liability of current worker’s post‐employment benefits (other than retirement pension). This includes the cost of health, life, and dental benefits. The amount to be funded for GASB 45 is to be determined by an actuarial study that is to be performed bi‐annually by an independent firm hired by the CFO. The unfunded liability for the City for OPEB as of July 1, 2013 is $161,490,260. The City is in the process of performing a new actuarial study to calculate its unfunded liability as of July 1, 2015.
68
Capital Improvement Stabilization Fund (CIP Fund) The Capital Improvement Stabilization Fund will be used to fund the annual capital budget as part of the City’s annual capital improvement plan, as well as any extraordinary and unforeseen capital repairs and acquisitions that may arise during the current fiscal year. This fund will require a two‐thirds vote of the City Council and the vote must clearly define the purpose of the fund. This fund will be used to cover the costs of capital items of the city, including maintenance and repair of municipal buildings, infrastructure, facilities, and equipment. It is anticipated that funding for the CIP Fund as follows:
1. Fifteen percent (15%) of any free cash will be allocated from free cash to the CIP Fund. The City has set a target level for the CIP Fund of 10% of the City’s general fund operating budget ($17.3 million based on 2017 budget). The balance of this fund is $1,516,081 as of 6/30/16. The CIP Fund shall be funded by appropriations from free cash per the financial reserve policies of the City. Operating budget appropriations (when available) and other one‐time non‐recurring revenues that become available for appropriation per M.G.L. may also be used as funding sources.
Employee Leave Buyback Stabilization Fund (ELB Fund) The Employee Leave Buyback Stabilization Fund will be used to fund all appropriations for sick, vacation and other accrued time earned by an employee as regulated by collective bargaining agreements or City of Everett policy for non‐union and management employees. Appropriations to and from the ELB Fund will require a 2/3 vote of the City Council.
1. The fund shall be limited to 5% of the prior year’s tax levy (FY2017 limit would be $4.7 million).
69
2. All interest earned in the Employee Leave Buyback Stabilization Fund will stay with the Fund.
As part of the FY2018 budget process, the CFO will request each department head to determine if there are any employees in their respective departments who may be retiring. Departments will submit list of employees and the anticipated amounts of each employee’s retirement buyout. The CFO will incorporate the amount into the Mayor’s recommended budget submitted to Council. The City has set a target level for the ELB Fund of 5% of the prior year’s tax levy ($4.7 million based on FY2017 budget). The target funding date is projected to occur by fiscal year 2024. The ELB Fund shall be funded by appropriations from free cash per the financial reserve policies of the City. Operating budget appropriations (when available) and other one‐time non‐recurring revenues that become available for appropriation per M.G.L. may also be used as funding sources.
Budgetary Fund Balance ‐ a.k.a. “Free Cash” General Fund Free cash is the remaining, unrestricted funds from operations of the previous fiscal year including unexpended free cash from the previous year, actual receipts in excess of revenue estimates shown on the tax rate recapitulation sheet, and unspent amounts in budget line‐items. Unpaid property taxes and certain deficits reduce the amount that can be certified as free cash. The calculation of free cash is based on the balance sheet as of June 30, which is submitted by the community's auditor, accountant, or comptroller. Free cash is not available for appropriation until certified by the Massachusetts Director of Accounts. Free cash is the term used for a community’s funds that are available for appropriation. Once free cash is certified, it is available for appropriation by City Council. Free cash may be used for any lawful municipal purpose and provides communities with flexibility to fund additional appropriations after the tax rate has been set. Free cash balances do not necessarily carry forward to the next fiscal year (July 1st); the Director’s certification expires on June 30th at the end of the fiscal year.
70
The City’s policy is to use free cash for reserves, capital, and special uses in accordance with the policies set forth by the Mayor and CFO as stated above. Any free cash available after funding the above may be used to augment trust funds related to fringe benefits and un‐funded liabilities related to employee benefits, including Health Insurance Trust Fund, Workers' Compensation Fund, Unemployment Fund, and any health benefits payable through Police and Fire operating budgets (111f settlements). Free Cash available may also be used to augment general fund appropriations for expenses that increased due to extraordinary and/or unforeseen events as detailed by the department head of the affected budget. Budgetary Fund Balance ‐ a.k.a. “Retained Earnings” Water/Sewer Enterprise Fund Retained Earnings is the portion of Net Assets Unrestricted that is certified by the Department of Revenue as available for appropriation. Certification requires submission of a June 30 balance sheet accompanied by all information necessary to calculate free cash in the General Fund. Once certified, retained earnings may be appropriated through the following June 30 and no appropriation may be in excess of the certified amount. Retained earnings may be appropriated to:
1. Fund direct costs of the enterprise fund for the current fiscal year; 2. Fund indirect costs appropriated in the general fund operating budget and allocated to the enterprise for the current fiscal year; 3. Fund capital improvements, equipment, and infrastructure of the enterprise fund; 4. Fund emergency repairs; 5. Offset water and sewer rate increases.
The City of Everett, as a policy, will generally use Water & Sewer retained earnings to fund capital improvements that may come up during the fiscal year as well as emergency repairs needed due to water or sewer main breaks or other related repairs. However, any of the above items may be funded by retained earnings, as requested by the Mayor and appropriated by the City Council.
71
Capital Improvement and Debt Policies Budget Policies
The city will make all capital purchases and improvements in accordance with the adopted capital improvement program. The city will develop a multi‐year plan for capital improvements and update it annually. The city will enact an annual capital budget based on the multi‐year capital improvement plan. Future capital expenditures
necessitated by changes in population, changes in real estate development or changes in economic base will be calculated and included in capital budget projections.
The city will coordinate development of the capital improvement budget with the development of the operating budget.
Future operating costs associated with new capital improvement will be projected and included in operating budget forecasts.
The city will use intergovernmental assistance to finance only those capital improvements that are consistent with the capital
improvement plan and priorities, and who’s operating and maintenance costs have been included in operating budget forecasts.
The city will maintain all its assets at a level adequate to protect the city’s capital investment and to minimize future
maintenance and replacement costs.
The city, as part of its capital planning process, will project its equipment replacement and maintenance needs for the next several years and will update this projection each year. From this projection, a maintenance and replacement schedule will be developed and followed.
The city will identify the estimated costs and potential funding sources for each capital project proposal before it is submitted
to the City Council for approval.
72
The city will determine the least costly financing method for all new projects.
Debt Policies
The city will confine long‐term borrowing to capital improvements or projects/equipment that cannot be finance from current revenues.
When the city finances capital projects by issuing bonds, it will pay back the bonds within a period not to exceed the
expected useful life of the project.
Total net debt service from general obligation debt will not exceed five (5) percent of total annual operating budget as listed on part 1a of the annual tax rate recapitulation as submitted to the Department of Revenue.
Debt will only be issued for capital that is valued greater than $25,000, and has a depreciable life of five (5) or more years.
Total general obligation debt will not exceed that provided in the state statues.
Whenever possible, the city will use special revenue funds, special assessments, or other self‐supporting bonds, instead of
general obligation bonds.
The city will not use long‐term debt for current operations unless otherwise allowed via special legislation.
The city will retire bond anticipation debt within six months after completion of the project.
The city will maintain good communications with bond rating agencies about its financial condition.
The city will follow a policy of full disclosure on every financial report and bond prospectus.
73
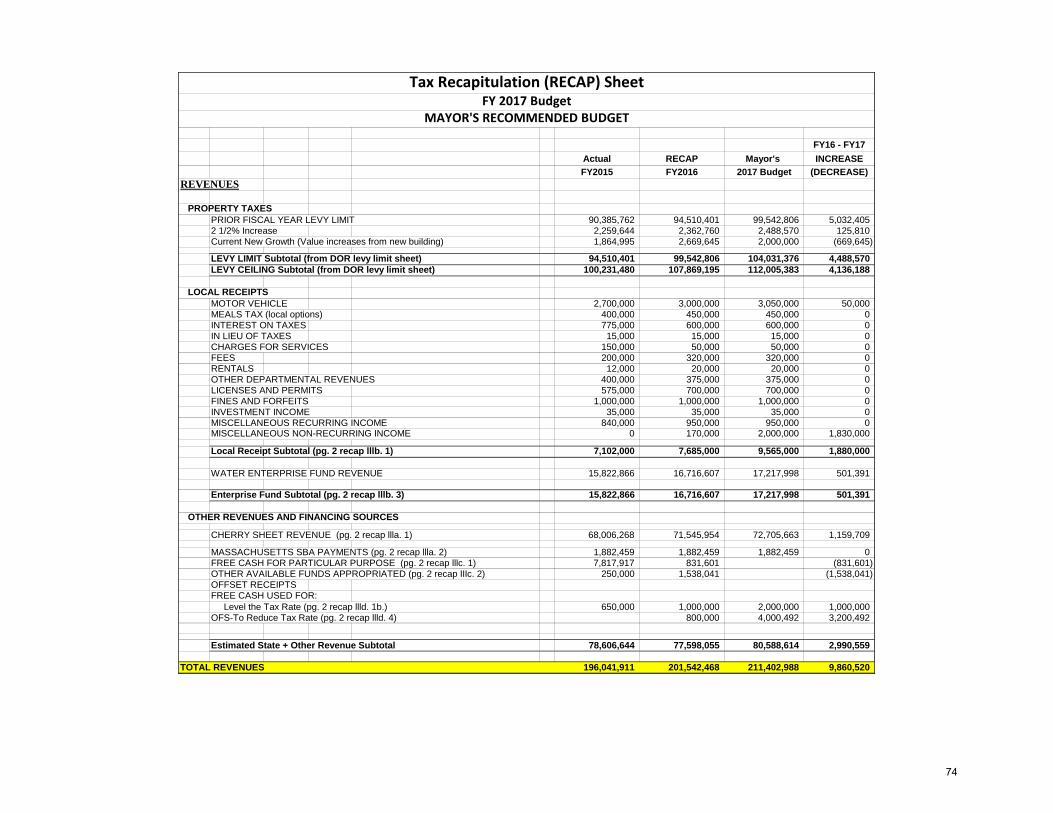
FY16 - FY17Actual RECAP Mayor's INCREASEFY2015 FY2016 2017 Budget (DECREASE)
REVENUES
PROPERTY TAXESPRIOR FISCAL YEAR LEVY LIMIT 90,385,762 94,510,401 99,542,806 5,032,4052 1/2% Increase 2,259,644 2,362,760 2,488,570 125,810Current New Growth (Value increases from new building) 1,864,995 2,669,645 2,000,000 (669,645) LEVY LIMIT Subtotal (from DOR levy limit sheet) 94,510,401 99,542,806 104,031,376 4,488,570LEVY CEILING Subtotal (from DOR levy limit sheet) 100,231,480 107,869,195 112,005,383 4,136,188
LOCAL RECEIPTSMOTOR VEHICLE 2,700,000 3,000,000 3,050,000 50,000MEALS TAX (local options) 400,000 450,000 450,000 0INTEREST ON TAXES 775,000 600,000 600,000 0IN LIEU OF TAXES 15,000 15,000 15,000 0CHARGES FOR SERVICES 150,000 50,000 50,000 0FEES 200,000 320,000 320,000 0RENTALS 12,000 20,000 20,000 0OTHER DEPARTMENTAL REVENUES 400,000 375,000 375,000 0LICENSES AND PERMITS 575,000 700,000 700,000 0FINES AND FORFEITS 1,000,000 1,000,000 1,000,000 0INVESTMENT INCOME 35,000 35,000 35,000 0MISCELLANEOUS RECURRING INCOME 840,000 950,000 950,000 0MISCELLANEOUS NON-RECURRING INCOME 0 170,000 2,000,000 1,830,000
Local Receipt Subtotal (pg. 2 recap lllb. 1) 7,102,000 7,685,000 9,565,000 1,880,000
WATER ENTERPRISE FUND REVENUE 15,822,866 16,716,607 17,217,998 501,391
Enterprise Fund Subtotal (pg. 2 recap lllb. 3) 15,822,866 16,716,607 17,217,998 501,391
OTHER REVENUES AND FINANCING SOURCES
CHERRY SHEET REVENUE (pg. 2 recap llla. 1) 68,006,268 71,545,954 72,705,663 1,159,709
MASSACHUSETTS SBA PAYMENTS (pg. 2 recap llla. 2) 1,882,459 1,882,459 1,882,459 0FREE CASH FOR PARTICULAR PURPOSE (pg. 2 recap lllc. 1) 7,817,917 831,601 (831,601)OTHER AVAILABLE FUNDS APPROPRIATED (pg. 2 recap IIIc. 2) 250,000 1,538,041 (1,538,041)OFFSET RECEIPTSFREE CASH USED FOR: Level the Tax Rate (pg. 2 recap llld. 1b.) 650,000 1,000,000 2,000,000 1,000,000OFS-To Reduce Tax Rate (pg. 2 recap llld. 4) 800,000 4,000,492 3,200,492
Estimated State + Other Revenue Subtotal 78,606,644 77,598,055 80,588,614 2,990,559
TOTAL REVENUES 196,041,911 201,542,468 211,402,988 9,860,520
Tax Recapitulation (RECAP) SheetFY 2017 Budget
MAYOR'S RECOMMENDED BUDGET
74
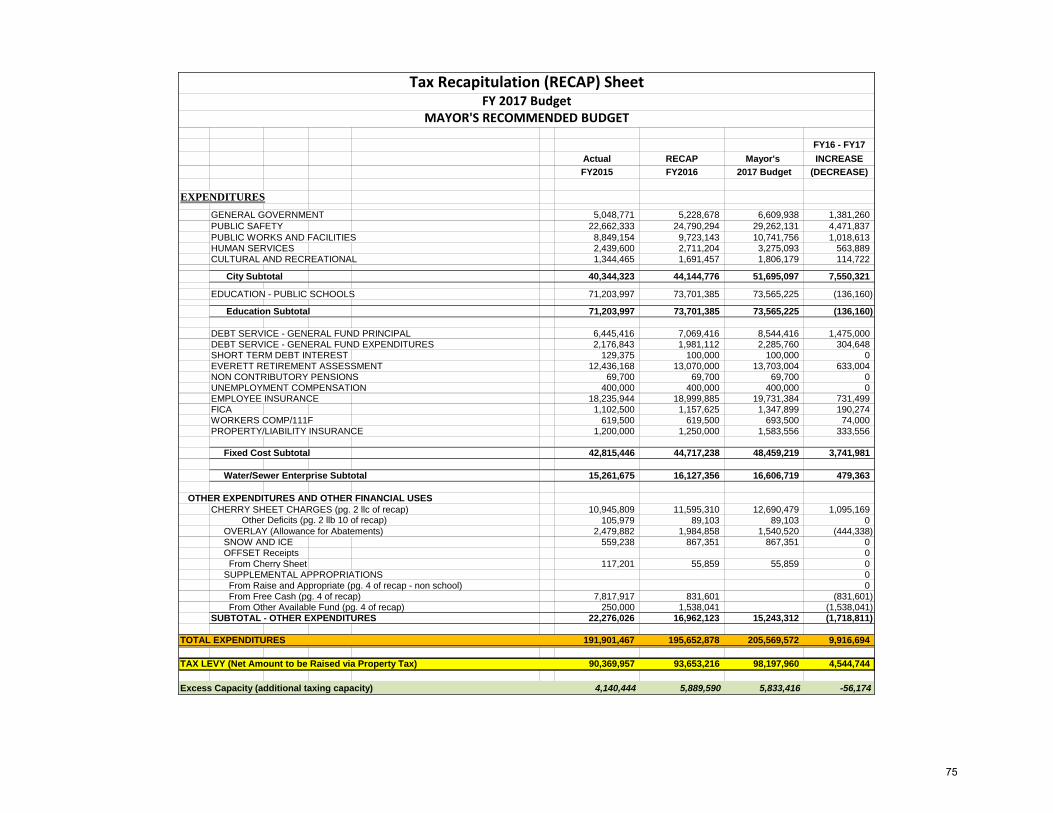
FY16 - FY17Actual RECAP Mayor's INCREASEFY2015 FY2016 2017 Budget (DECREASE)
Tax Recapitulation (RECAP) SheetFY 2017 Budget
MAYOR'S RECOMMENDED BUDGET
EXPENDITURESGENERAL GOVERNMENT 5,048,771 5,228,678 6,609,938 1,381,260PUBLIC SAFETY 22,662,333 24,790,294 29,262,131 4,471,837PUBLIC WORKS AND FACILITIES 8,849,154 9,723,143 10,741,756 1,018,613HUMAN SERVICES 2,439,600 2,711,204 3,275,093 563,889CULTURAL AND RECREATIONAL 1,344,465 1,691,457 1,806,179 114,722
City Subtotal 40,344,323 44,144,776 51,695,097 7,550,321
EDUCATION - PUBLIC SCHOOLS 71,203,997 73,701,385 73,565,225 (136,160)
Education Subtotal 71,203,997 73,701,385 73,565,225 (136,160)
DEBT SERVICE - GENERAL FUND PRINCIPAL 6,445,416 7,069,416 8,544,416 1,475,000DEBT SERVICE - GENERAL FUND EXPENDITURES 2,176,843 1,981,112 2,285,760 304,648SHORT TERM DEBT INTEREST 129,375 100,000 100,000 0EVERETT RETIREMENT ASSESSMENT 12,436,168 13,070,000 13,703,004 633,004NON CONTRIBUTORY PENSIONS 69,700 69,700 69,700 0UNEMPLOYMENT COMPENSATION 400,000 400,000 400,000 0EMPLOYEE INSURANCE 18,235,944 18,999,885 19,731,384 731,499FICA 1,102,500 1,157,625 1,347,899 190,274WORKERS COMP/111F 619,500 619,500 693,500 74,000PROPERTY/LIABILITY INSURANCE 1,200,000 1,250,000 1,583,556 333,556
Fixed Cost Subtotal 42,815,446 44,717,238 48,459,219 3,741,981
Water/Sewer Enterprise Subtotal 15,261,675 16,127,356 16,606,719 479,363
OTHER EXPENDITURES AND OTHER FINANCIAL USESCHERRY SHEET CHARGES (pg. 2 llc of recap) 10,945,809 11,595,310 12,690,479 1,095,169
105,979 89,103 89,103 0 OVERLAY (Allowance for Abatements) 2,479,882 1,984,858 1,540,520 (444,338) SNOW AND ICE 559,238 867,351 867,351 0 OFFSET Receipts 0 From Cherry Sheet 117,201 55,859 55,859 0 SUPPLEMENTAL APPROPRIATIONS 0 From Raise and Appropriate (pg. 4 of recap - non school) 0 From Free Cash (pg. 4 of recap) 7,817,917 831,601 (831,601) From Other Available Fund (pg. 4 of recap) 250,000 1,538,041 (1,538,041)SUBTOTAL - OTHER EXPENDITURES 22,276,026 16,962,123 15,243,312 (1,718,811)
TOTAL EXPENDITURES 191,901,467 195,652,878 205,569,572 9,916,694
TAX LEVY (Net Amount to be Raised via Property Tax) 90,369,957 93,653,216 98,197,960 4,544,744
Excess Capacity (additional taxing capacity) 4,140,444 5,889,590 5,833,416 -56,174
Other Deficits (pg. 2 llb 10 of recap)
75
Executive Summary ‐ Municipal Revenues General Fund Revenues A fundamental principle of municipal finance in Massachusetts is that all revenue received or collected from any source and by any department, belongs to a common pool referred to as the general fund. As such, it is unrestricted and available for expenditure for any lawful purpose after appropriation by city council. (M.G.L. Ch. 44 Sec. 53). Included is real and personal property taxes, excises, special assessments and betterments, unrestricted local aid, investment and rental income, voluntary and statutory payments in lieu of taxes and other local receipts not expressly dedicated by statute. Municipalities can only segregate money for specific purposes if authorized to do so by another general law or special act. Cities and towns cannot unilaterally decide to hold, earmark or set aside funds to finance a particular project or purchase, even if it intends to spend through an appropriation later. Anticipated general fund revenues for the fiscal year may be appropriated as the tax levy (raise and appropriate) until the tax rate is set. Collections during the year above the estimates used to set the rate are not ordinarily available for appropriation until after the close of the fiscal year and certification by the DOR Director of Accounts as part of the municipality's undesignated fund balance (free cash). Special Revenue Funds Particular revenues segregated from the general fund into a separate fund and earmarked for expenditure for specified purposes by statute. Special revenue funds are classified based on the availability of the funds for expenditure and need for a prior appropriation. Special revenue funds include receipts reserved for appropriation and revolving funds. They also include gifts and grants from governmental entities and private individuals and organizations. Special revenue funds must be established by statute.
76
Receipts Reserved for Appropriation (Actual Collections) Receipts from a specific revenue source segregated from general fund into a separate fund and earmarked for appropriation for specified purposes by statute. Appropriations are limited to actual collections on hand and available. Revolving Funds (Actual Collections) Receipts from a specific revenue source segregated from general fund into a separate fund and earmarked for expenditure without appropriation for specified purposes by statute to support the activity, program or service that generated the receipts. Typically authorized for programs or services with expenses that (l) fluctuate with demand and (2) can be matched with the fees, charges or other revenues collected during the year. The board or officer operating the program is usually given spending authority, but can only spend from actual collections on hand and available. Enterprise Funds (Estimated Receipts) Annual revenue streams segregated from the general fund into a separate fund to separately budget and account for services that generates, or for purposes supported by, those revenues. These include funds for services financed and delivered in a manner similar to private enterprises in order to account for all costs, direct or indirect, of providing the goods or services.
Trust and Agency Funds Fiduciary funds segregated from the general fund to account for assets held in a trustee capacity or as an agent for individuals, private organizations, other governmental units, etc. These include expendable trust funds, non‐expendable trust funds, pension trust funds and agency funds.
77
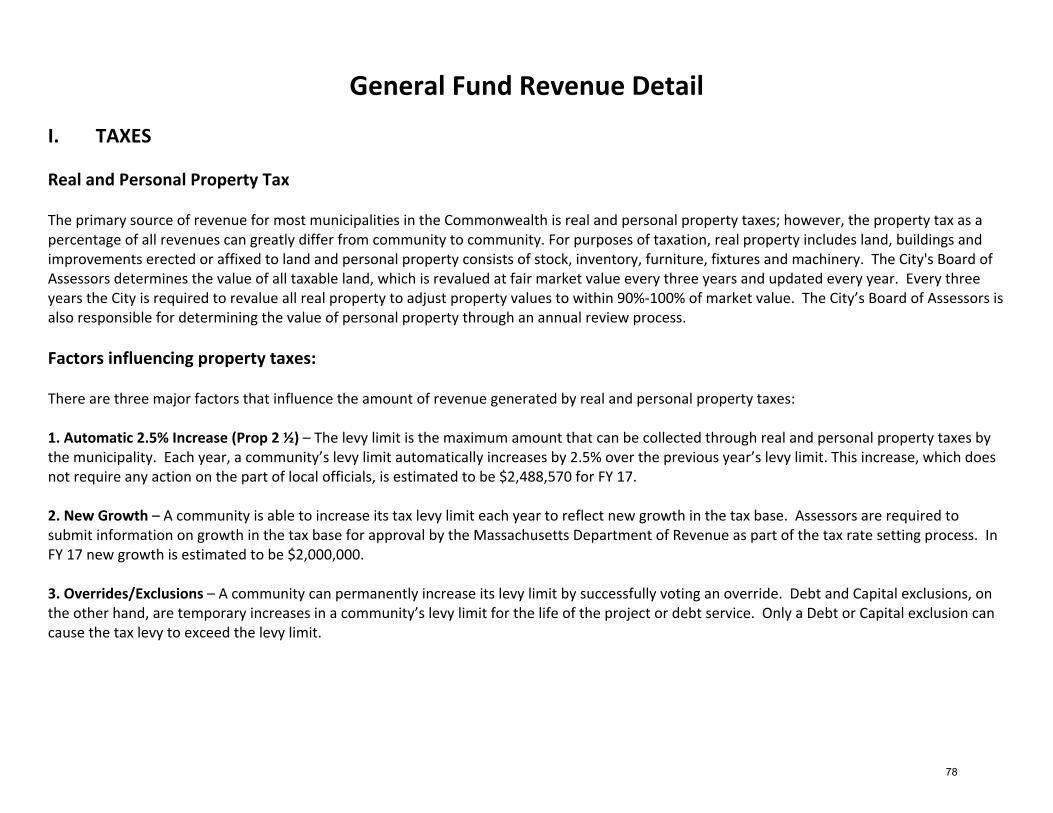
General Fund Revenue Detail I. TAXES Real and Personal Property Tax The primary source of revenue for most municipalities in the Commonwealth is real and personal property taxes; however, the property tax as a percentage of all revenues can greatly differ from community to community. For purposes of taxation, real property includes land, buildings and improvements erected or affixed to land and personal property consists of stock, inventory, furniture, fixtures and machinery. The City's Board of Assessors determines the value of all taxable land, which is revalued at fair market value every three years and updated every year. Every three years the City is required to revalue all real property to adjust property values to within 90%‐100% of market value. The City’s Board of Assessors is also responsible for determining the value of personal property through an annual review process. Factors influencing property taxes: There are three major factors that influence the amount of revenue generated by real and personal property taxes: 1. Automatic 2.5% Increase (Prop 2 ½) – The levy limit is the maximum amount that can be collected through real and personal property taxes by the municipality. Each year, a community’s levy limit automatically increases by 2.5% over the previous year’s levy limit. This increase, which does not require any action on the part of local officials, is estimated to be $2,488,570 for FY 17. 2. New Growth – A community is able to increase its tax levy limit each year to reflect new growth in the tax base. Assessors are required to submit information on growth in the tax base for approval by the Massachusetts Department of Revenue as part of the tax rate setting process. In FY 17 new growth is estimated to be $2,000,000. 3. Overrides/Exclusions – A community can permanently increase its levy limit by successfully voting an override. Debt and Capital exclusions, on the other hand, are temporary increases in a community’s levy limit for the life of the project or debt service. Only a Debt or Capital exclusion can cause the tax levy to exceed the levy limit.
78
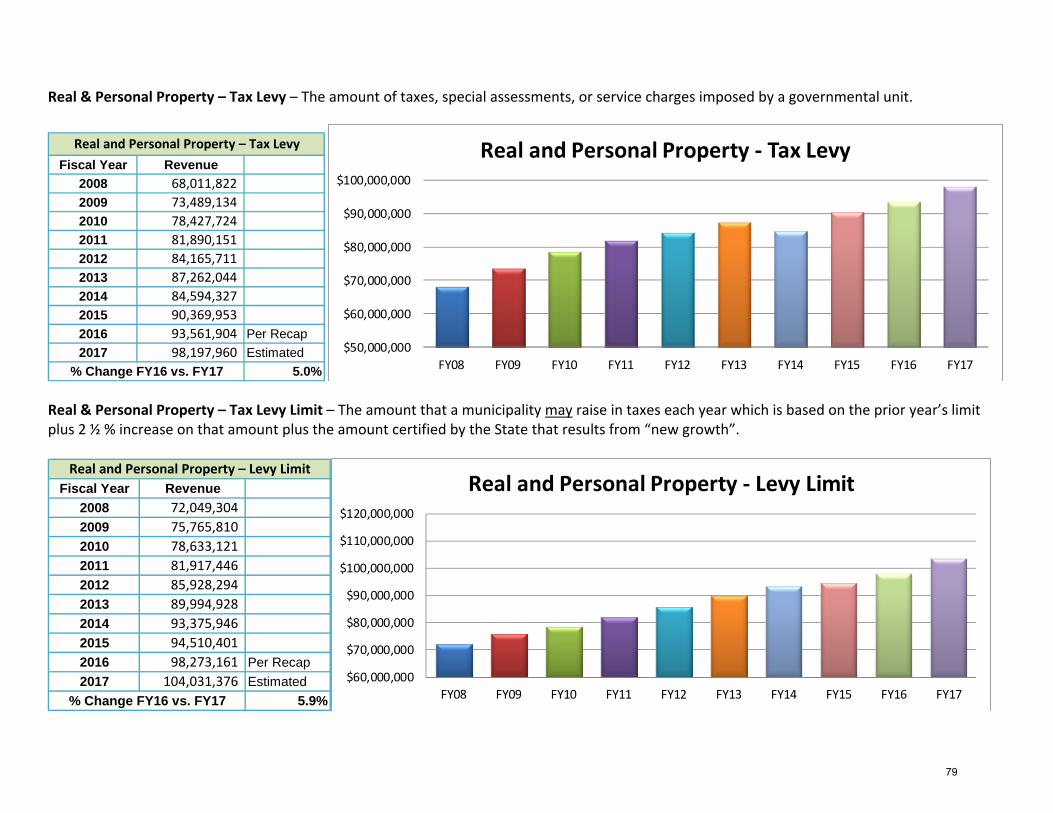
Real & Personal Property – Tax Levy – The amount of taxes, special assessments, or service charges imposed by a governmental unit.
Fiscal Year Revenue2008 68,011,822 2009 73,489,134 2010 78,427,724 2011 81,890,151 2012 84,165,711 2013 87,262,044 2014 84,594,327 2015 90,369,953 2016 93,561,904 Per Recap2017 98,197,960 Estimated
5.0%% Change FY16 vs. FY17
Real and Personal Property – Tax Levy
$50,000,000
$60,000,000
$70,000,000
$80,000,000
$90,000,000
$100,000,000
FY08 FY09 FY10 FY11 FY12 FY13 FY14 FY15 FY16 FY17
Real and Personal Property ‐ Tax Levy
Real & Personal Property – Tax Levy Limit – The amount that a municipality may raise in taxes each year which is based on the prior year’s limit plus 2 ½ % increase on that amount plus the amount certified by the State that results from “new growth”.
Fiscal Year Revenue2008 72,049,304 2009 75,765,810 2010 78,633,121 2011 81,917,446 2012 85,928,294 2013 89,994,928 2014 93,375,946 2015 94,510,401 2016 98,273,161 Per Recap2017 104,031,376 Estimated
5.9%
Real and Personal Property – Levy Limit
% Change FY16 vs. FY17
$60,000,000
$70,000,000
$80,000,000
$90,000,000
$100,000,000
$110,000,000
$120,000,000
FY08 FY09 FY10 FY11 FY12 FY13 FY14 FY15 FY16 FY17
Real and Personal Property ‐ Levy Limit
79
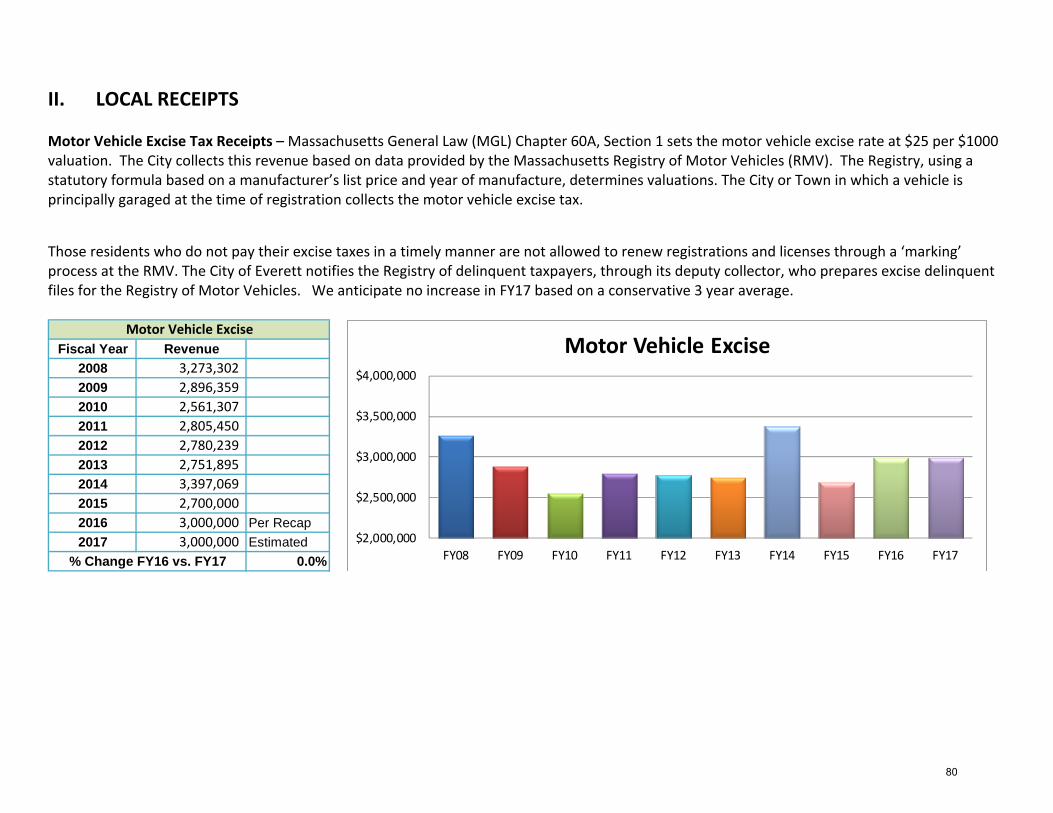
II. LOCAL RECEIPTS Motor Vehicle Excise Tax Receipts – Massachusetts General Law (MGL) Chapter 60A, Section 1 sets the motor vehicle excise rate at $25 per $1000 valuation. The City collects this revenue based on data provided by the Massachusetts Registry of Motor Vehicles (RMV). The Registry, using a statutory formula based on a manufacturer’s list price and year of manufacture, determines valuations. The City or Town in which a vehicle is principally garaged at the time of registration collects the motor vehicle excise tax.
Those residents who do not pay their excise taxes in a timely manner are not allowed to renew registrations and licenses through a ‘marking’ process at the RMV. The City of Everett notifies the Registry of delinquent taxpayers, through its deputy collector, who prepares excise delinquent files for the Registry of Motor Vehicles. We anticipate no increase in FY17 based on a conservative 3 year average.
Fiscal Year Revenue2008 3,273,302 2009 2,896,359 2010 2,561,307 2011 2,805,450 2012 2,780,239 2013 2,751,895 2014 3,397,069 2015 2,700,000 2016 3,000,000 Per Recap2017 3,000,000 Estimated
0.0%
Motor Vehicle Excise
% Change FY16 vs. FY17
$2,000,000
$2,500,000
$3,000,000
$3,500,000
$4,000,000
FY08 FY09 FY10 FY11 FY12 FY13 FY14 FY15 FY16 FY17
Motor Vehicle Excise
80
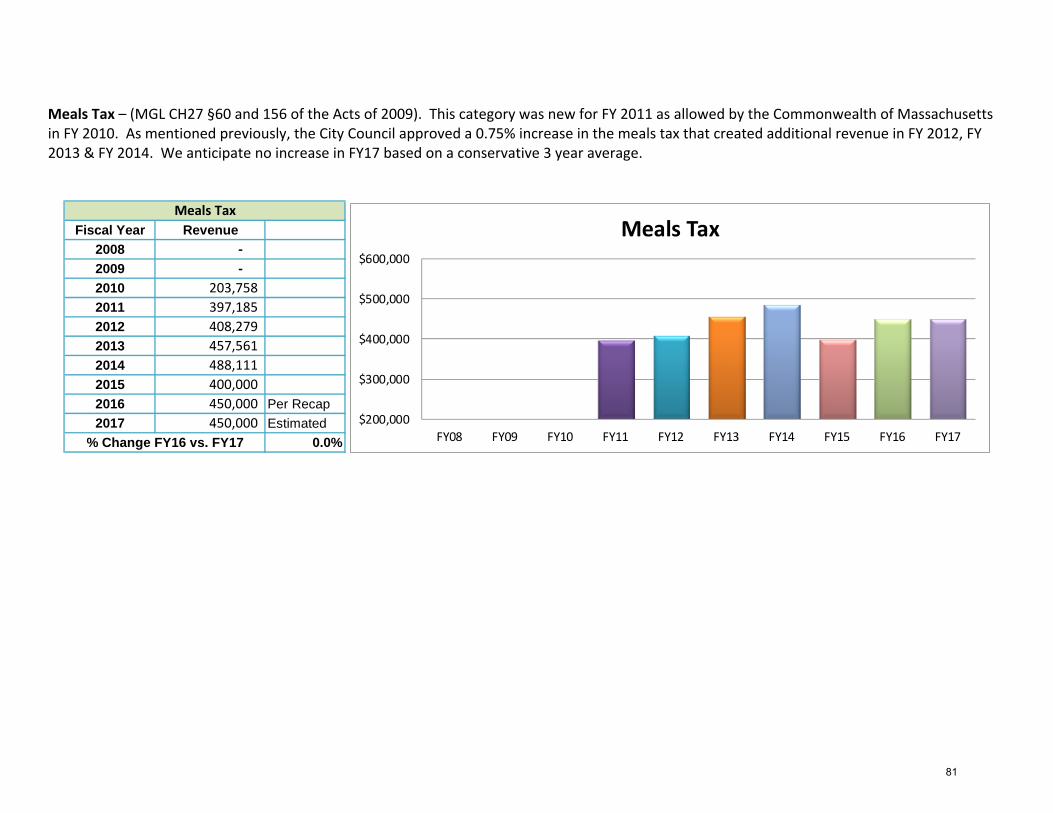
Meals Tax – (MGL CH27 §60 and 156 of the Acts of 2009). This category was new for FY 2011 as allowed by the Commonwealth of Massachusetts in FY 2010. As mentioned previously, the City Council approved a 0.75% increase in the meals tax that created additional revenue in FY 2012, FY 2013 & FY 2014. We anticipate no increase in FY17 based on a conservative 3 year average.
Fiscal Year Revenue2008 ‐ 2009 ‐ 2010 203,758 2011 397,185 2012 408,279 2013 457,561 2014 488,111 2015 400,000 2016 450,000 Per Recap2017 450,000 Estimated
0.0%
Meals Tax
% Change FY16 vs. FY17
$200,000
$300,000
$400,000
$500,000
$600,000
FY08 FY09 FY10 FY11 FY12 FY13 FY14 FY15 FY16 FY17
Meals Tax
81
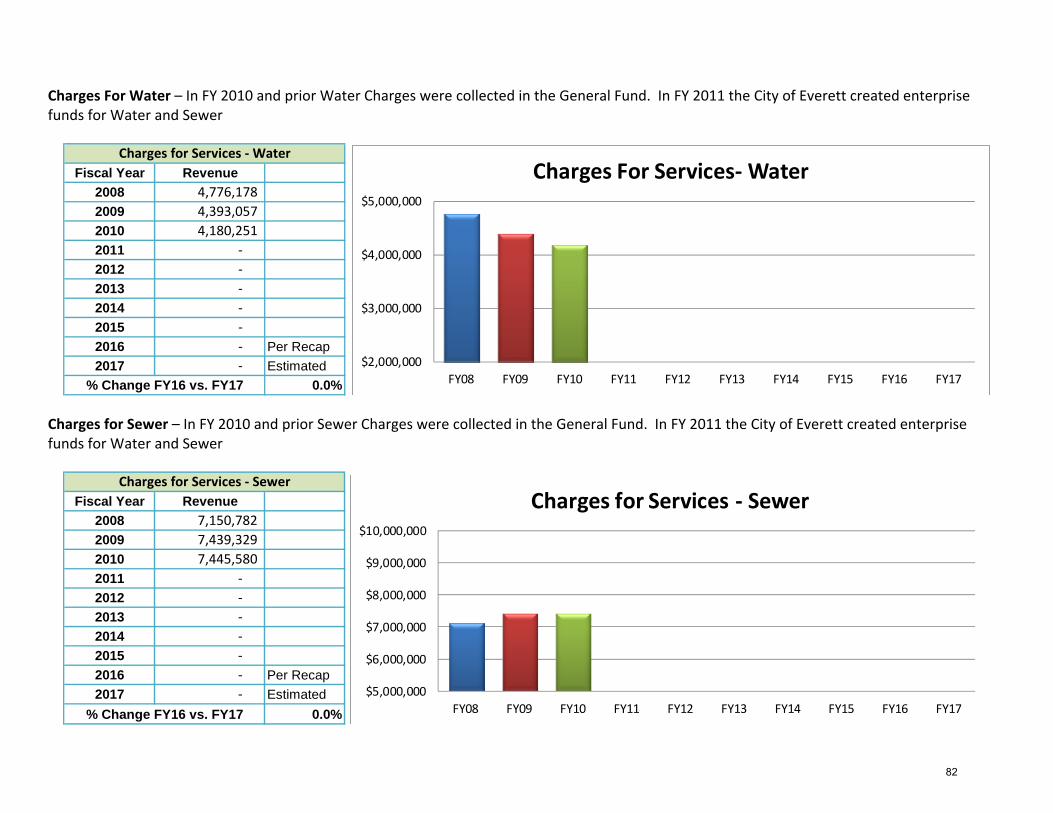
Charges For Water – In FY 2010 and prior Water Charges were collected in the General Fund. In FY 2011 the City of Everett created enterprise funds for Water and Sewer
Fiscal Year Revenue2008 4,776,178 2009 4,393,057 2010 4,180,251 2011 ‐ 2012 ‐ 2013 ‐ 2014 ‐ 2015 ‐ 2016 ‐ Per Recap2017 ‐ Estimated
0.0%
Charges for Services ‐ Water
% Change FY16 vs. FY17
$2,000,000
$3,000,000
$4,000,000
$5,000,000
FY08 FY09 FY10 FY11 FY12 FY13 FY14 FY15 FY16 FY17
Charges For Services‐Water
Charges for Sewer – In FY 2010 and prior Sewer Charges were collected in the General Fund. In FY 2011 the City of Everett created enterprise funds for Water and Sewer
Fiscal Year Revenue2008 7,150,782 2009 7,439,329 2010 7,445,580 2011 ‐ 2012 ‐ 2013 ‐ 2014 ‐ 2015 ‐ 2016 ‐ Per Recap2017 ‐ Estimated
0.0%
Charges for Services ‐ Sewer
% Change FY16 vs. FY17
$5,000,000
$6,000,000
$7,000,000
$8,000,000
$9,000,000
$10,000,000
FY08 FY09 FY10 FY11 FY12 FY13 FY14 FY15 FY16 FY17
Charges for Services ‐ Sewer
82
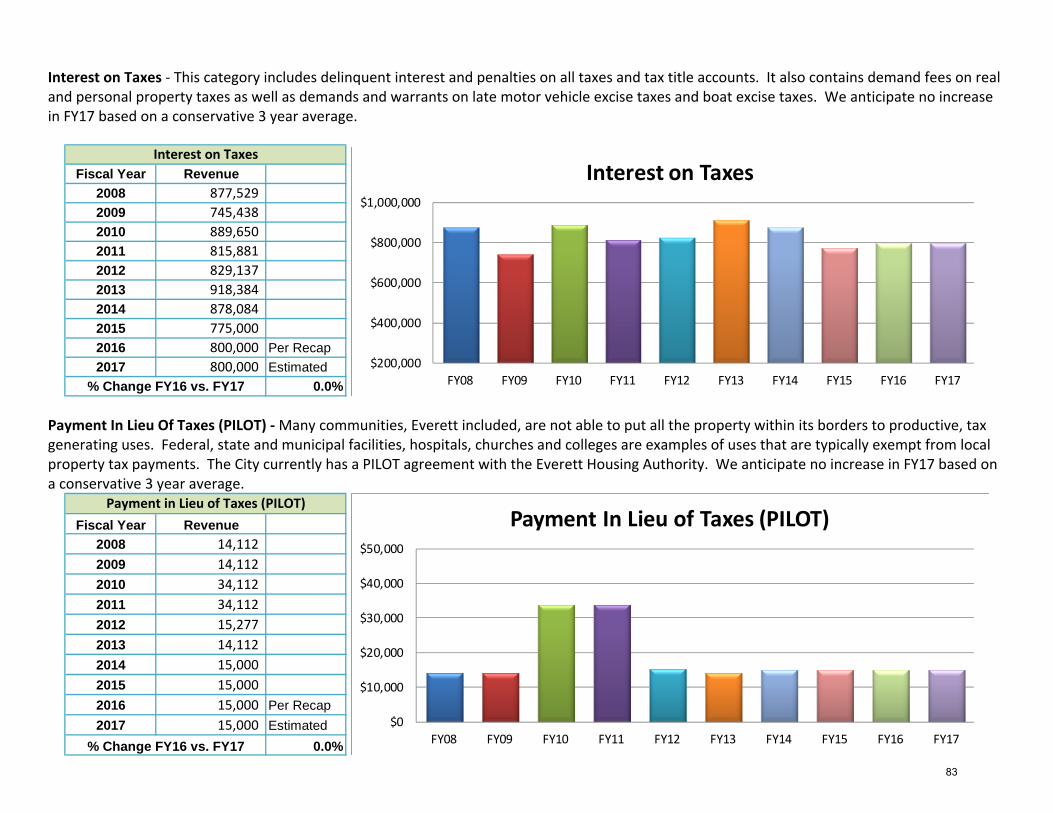
Interest on Taxes ‐ This category includes delinquent interest and penalties on all taxes and tax title accounts. It also contains demand fees on real and personal property taxes as well as demands and warrants on late motor vehicle excise taxes and boat excise taxes. We anticipate no increase in FY17 based on a conservative 3 year average.
Fiscal Year Revenue2008 877,529 2009 745,438 2010 889,650 2011 815,881 2012 829,137 2013 918,384 2014 878,084 2015 775,000 2016 800,000 Per Recap2017 800,000 Estimated
0.0%
Interest on Taxes
% Change FY16 vs. FY17
$200,000
$400,000
$600,000
$800,000
$1,000,000
FY08 FY09 FY10 FY11 FY12 FY13 FY14 FY15 FY16 FY17
Interest on Taxes
Payment In Lieu Of Taxes (PILOT) ‐ Many communities, Everett included, are not able to put all the property within its borders to productive, tax generating uses. Federal, state and municipal facilities, hospitals, churches and colleges are examples of uses that are typically exempt from local property tax payments. The City currently has a PILOT agreement with the Everett Housing Authority. We anticipate no increase in FY17 based on a conservative 3 year average.
Fiscal Year Revenue2008 14,112 2009 14,112 2010 34,112 2011 34,112 2012 15,277 2013 14,112 2014 15,000 2015 15,000 2016 15,000 Per Recap2017 15,000 Estimated
0.0%
Payment in Lieu of Taxes (PILOT)
% Change FY16 vs. FY17
$0
$10,000
$20,000
$30,000
$40,000
$50,000
FY08 FY09 FY10 FY11 FY12 FY13 FY14 FY15 FY16 FY17
Payment In Lieu of Taxes (PILOT)
83
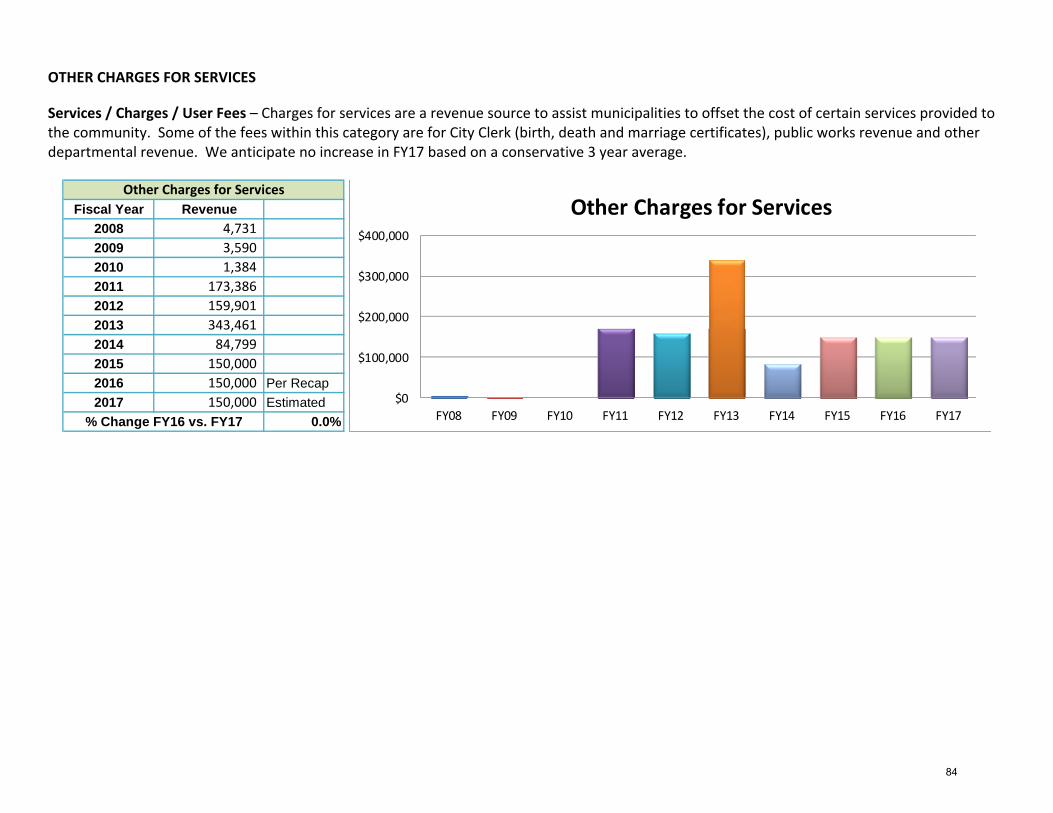
OTHER CHARGES FOR SERVICES Services / Charges / User Fees – Charges for services are a revenue source to assist municipalities to offset the cost of certain services provided to the community. Some of the fees within this category are for City Clerk (birth, death and marriage certificates), public works revenue and other departmental revenue. We anticipate no increase in FY17 based on a conservative 3 year average.
Fiscal Year Revenue2008 4,731 2009 3,590 2010 1,384 2011 173,386 2012 159,901 2013 343,461 2014 84,799 2015 150,000 2016 150,000 Per Recap2017 150,000 Estimated
0.0%
Other Charges for Services
% Change FY16 vs. FY17
$0
$100,000
$200,000
$300,000
$400,000
FY08 FY09 FY10 FY11 FY12 FY13 FY14 FY15 FY16 FY17
Other Charges for Services
84
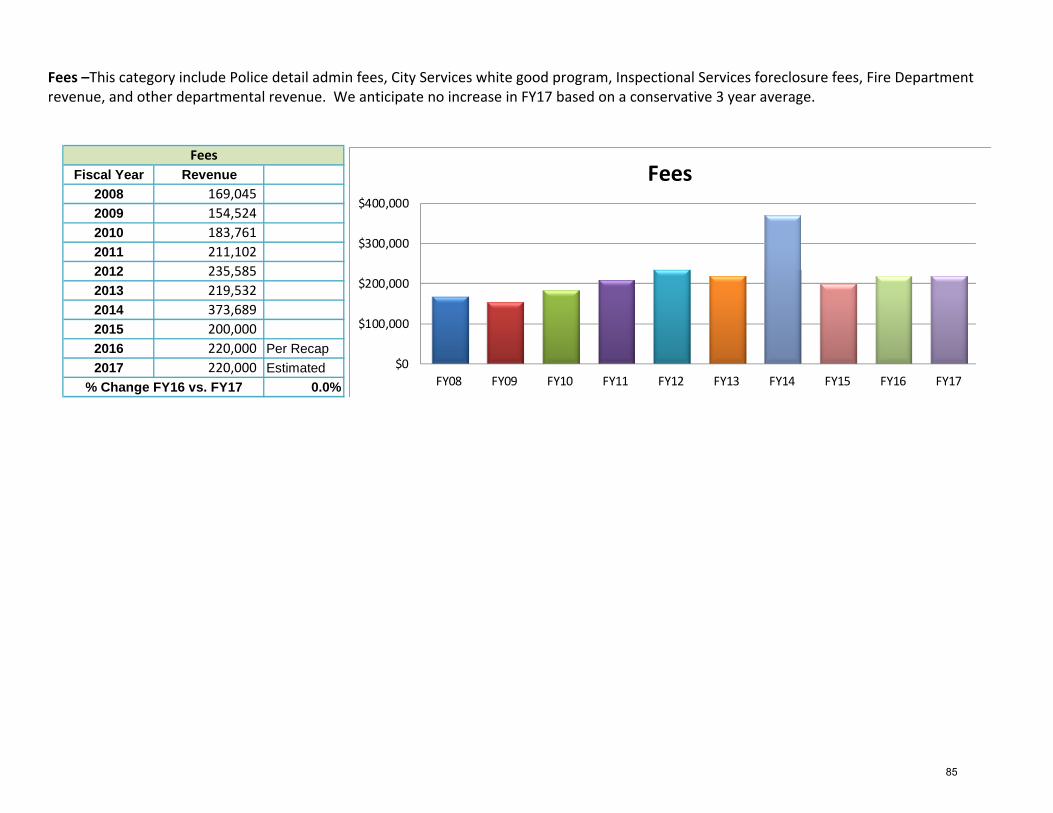
Fees –This category include Police detail admin fees, City Services white good program, Inspectional Services foreclosure fees, Fire Department revenue, and other departmental revenue. We anticipate no increase in FY17 based on a conservative 3 year average.
Fiscal Year Revenue2008 169,045 2009 154,524 2010 183,761 2011 211,102 2012 235,585 2013 219,532 2014 373,689 2015 200,000 2016 220,000 Per Recap2017 220,000 Estimated
0.0%
Fees
% Change FY16 vs. FY17
$0
$100,000
$200,000
$300,000
$400,000
FY08 FY09 FY10 FY11 FY12 FY13 FY14 FY15 FY16 FY17
Fees
85
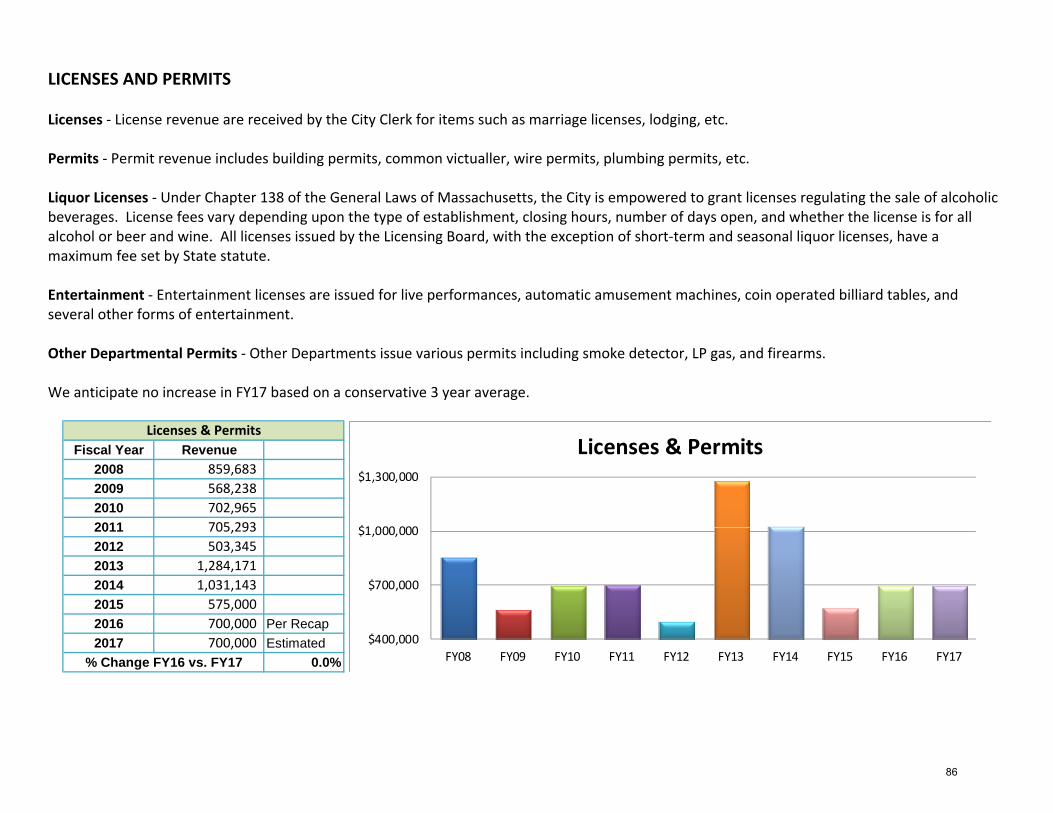
LICENSES AND PERMITS Licenses ‐ License revenue are received by the City Clerk for items such as marriage licenses, lodging, etc. Permits ‐ Permit revenue includes building permits, common victualler, wire permits, plumbing permits, etc. Liquor Licenses ‐ Under Chapter 138 of the General Laws of Massachusetts, the City is empowered to grant licenses regulating the sale of alcoholic beverages. License fees vary depending upon the type of establishment, closing hours, number of days open, and whether the license is for all alcohol or beer and wine. All licenses issued by the Licensing Board, with the exception of short‐term and seasonal liquor licenses, have a maximum fee set by State statute. Entertainment ‐ Entertainment licenses are issued for live performances, automatic amusement machines, coin operated billiard tables, and several other forms of entertainment. Other Departmental Permits ‐ Other Departments issue various permits including smoke detector, LP gas, and firearms. We anticipate no increase in FY17 based on a conservative 3 year average.
Fiscal Year Revenue2008 859,683 2009 568,238 2010 702,965 2011 705,293 2012 503,345 2013 1,284,171 2014 1,031,143 2015 575,000 2016 700,000 Per Recap2017 700,000 Estimated
0.0%
Licenses & Permits
% Change FY16 vs. FY17
$400,000
$700,000
$1,000,000
$1,300,000
FY08 FY09 FY10 FY11 FY12 FY13 FY14 FY15 FY16 FY17
Licenses & Permits
86
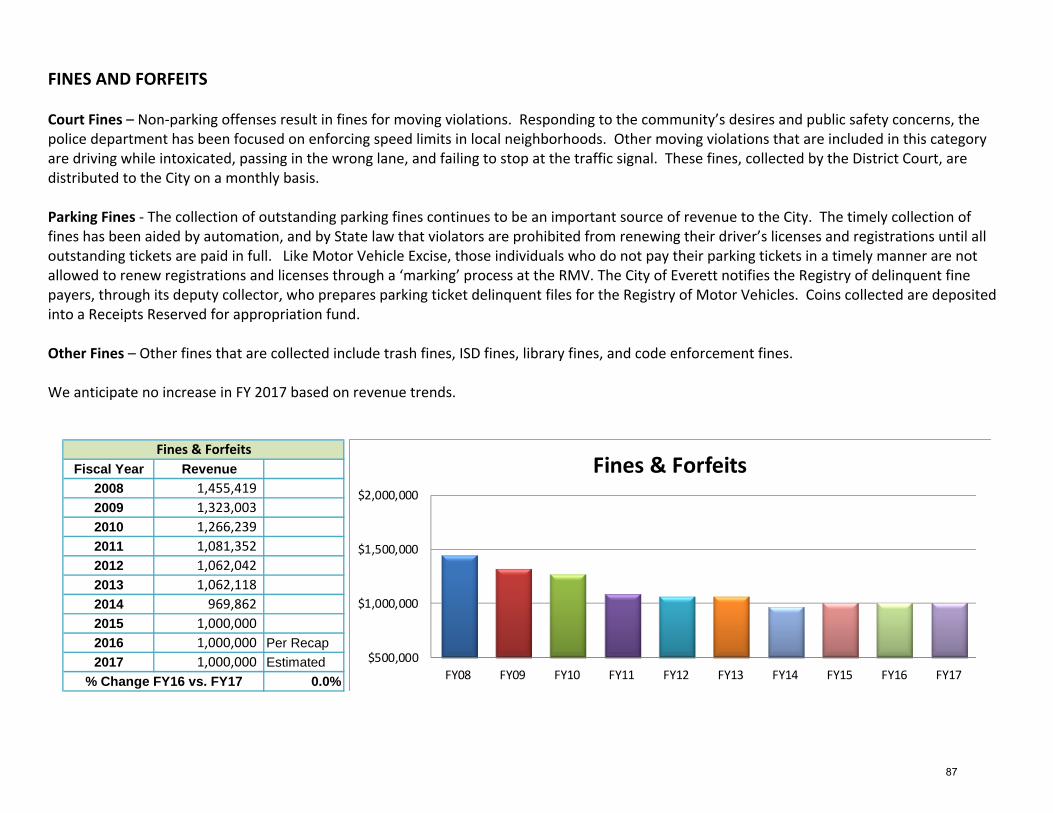
FINES AND FORFEITS Court Fines – Non‐parking offenses result in fines for moving violations. Responding to the community’s desires and public safety concerns, the police department has been focused on enforcing speed limits in local neighborhoods. Other moving violations that are included in this category are driving while intoxicated, passing in the wrong lane, and failing to stop at the traffic signal. These fines, collected by the District Court, are distributed to the City on a monthly basis. Parking Fines ‐ The collection of outstanding parking fines continues to be an important source of revenue to the City. The timely collection of fines has been aided by automation, and by State law that violators are prohibited from renewing their driver’s licenses and registrations until all outstanding tickets are paid in full. Like Motor Vehicle Excise, those individuals who do not pay their parking tickets in a timely manner are not allowed to renew registrations and licenses through a ‘marking’ process at the RMV. The City of Everett notifies the Registry of delinquent fine payers, through its deputy collector, who prepares parking ticket delinquent files for the Registry of Motor Vehicles. Coins collected are deposited into a Receipts Reserved for appropriation fund. Other Fines – Other fines that are collected include trash fines, ISD fines, library fines, and code enforcement fines. We anticipate no increase in FY 2017 based on revenue trends.
Fiscal Year Revenue2008 1,455,419 2009 1,323,003 2010 1,266,239 2011 1,081,352 2012 1,062,042 2013 1,062,118 2014 969,862 2015 1,000,000 2016 1,000,000 Per Recap2017 1,000,000 Estimated
0.0%
Fines & Forfeits
% Change FY16 vs. FY17
$500,000
$1,000,000
$1,500,000
$2,000,000
FY08 FY09 FY10 FY11 FY12 FY13 FY14 FY15 FY16 FY17
Fines & Forfeits
87
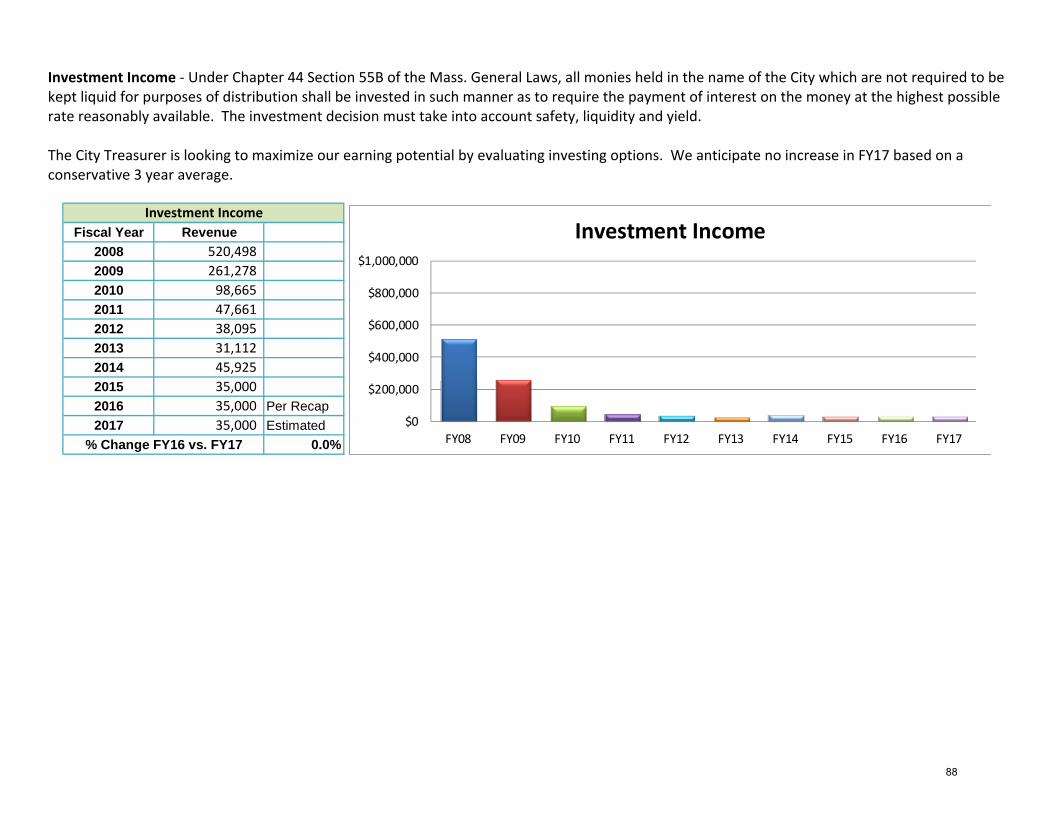
Investment Income ‐ Under Chapter 44 Section 55B of the Mass. General Laws, all monies held in the name of the City which are not required to be kept liquid for purposes of distribution shall be invested in such manner as to require the payment of interest on the money at the highest possible rate reasonably available. The investment decision must take into account safety, liquidity and yield. The City Treasurer is looking to maximize our earning potential by evaluating investing options. We anticipate no increase in FY17 based on a conservative 3 year average.
Fiscal Year Revenue2008 520,498 2009 261,278 2010 98,665 2011 47,661 2012 38,095 2013 31,112 2014 45,925 2015 35,000 2016 35,000 Per Recap2017 35,000 Estimated
0.0%
Investment Income
% Change FY16 vs. FY17
$0
$200,000
$400,000
$600,000
$800,000
$1,000,000
FY08 FY09 FY10 FY11 FY12 FY13 FY14 FY15 FY16 FY17
Investment Income
88
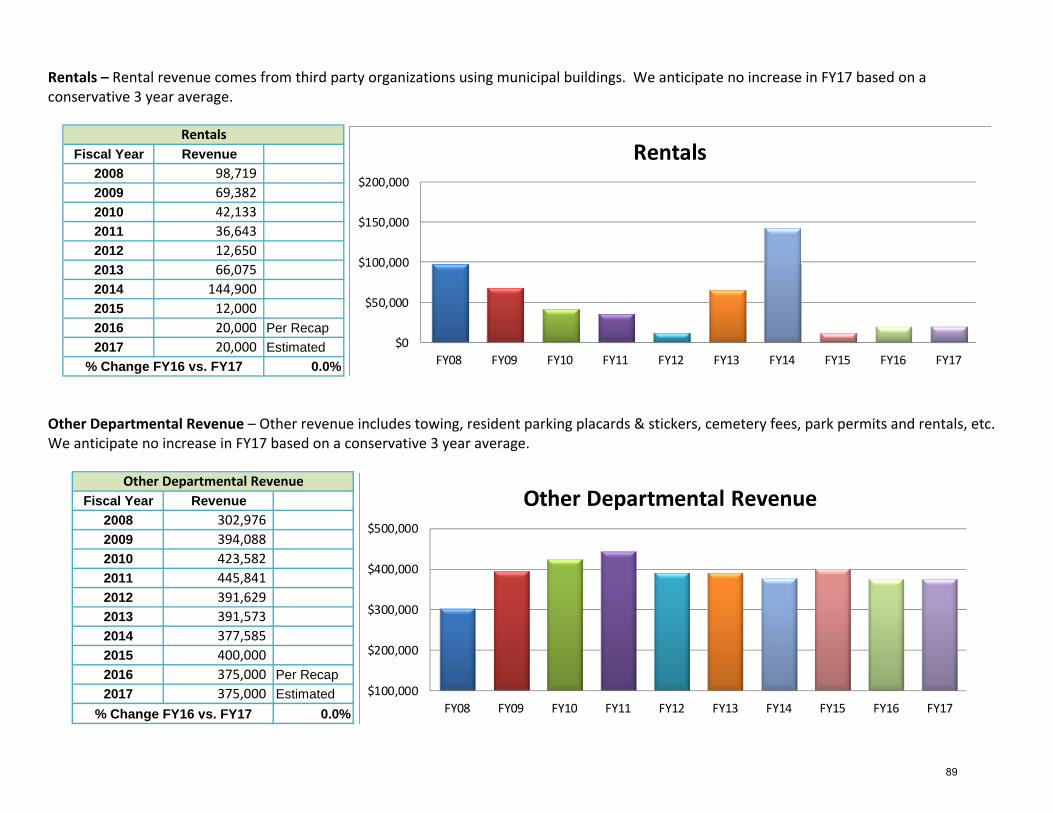
Rentals – Rental revenue comes from third party organizations using municipal buildings. We anticipate no increase in FY17 based on a conservative 3 year average.
Fiscal Year Revenue2008 98,719 2009 69,382 2010 42,133 2011 36,643 2012 12,650 2013 66,075 2014 144,900 2015 12,000 2016 20,000 Per Recap2017 20,000 Estimated
0.0%
Rentals
% Change FY16 vs. FY17
$0
$50,000
$100,000
$150,000
$200,000
FY08 FY09 FY10 FY11 FY12 FY13 FY14 FY15 FY16 FY17
Rentals
Other Departmental Revenue – Other revenue includes towing, resident parking placards & stickers, cemetery fees, park permits and rentals, etc. We anticipate no increase in FY17 based on a conservative 3 year average.
Fiscal Year Revenue2008 302,976 2009 394,088 2010 423,582 2011 445,841 2012 391,629 2013 391,573 2014 377,585 2015 400,000 2016 375,000 Per Recap2017 375,000 Estimated
0.0%
Other Departmental Revenue
% Change FY16 vs. FY17
$100,000
$200,000
$300,000
$400,000
$500,000
FY08 FY09 FY10 FY11 FY12 FY13 FY14 FY15 FY16 FY17
Other Departmental Revenue
89
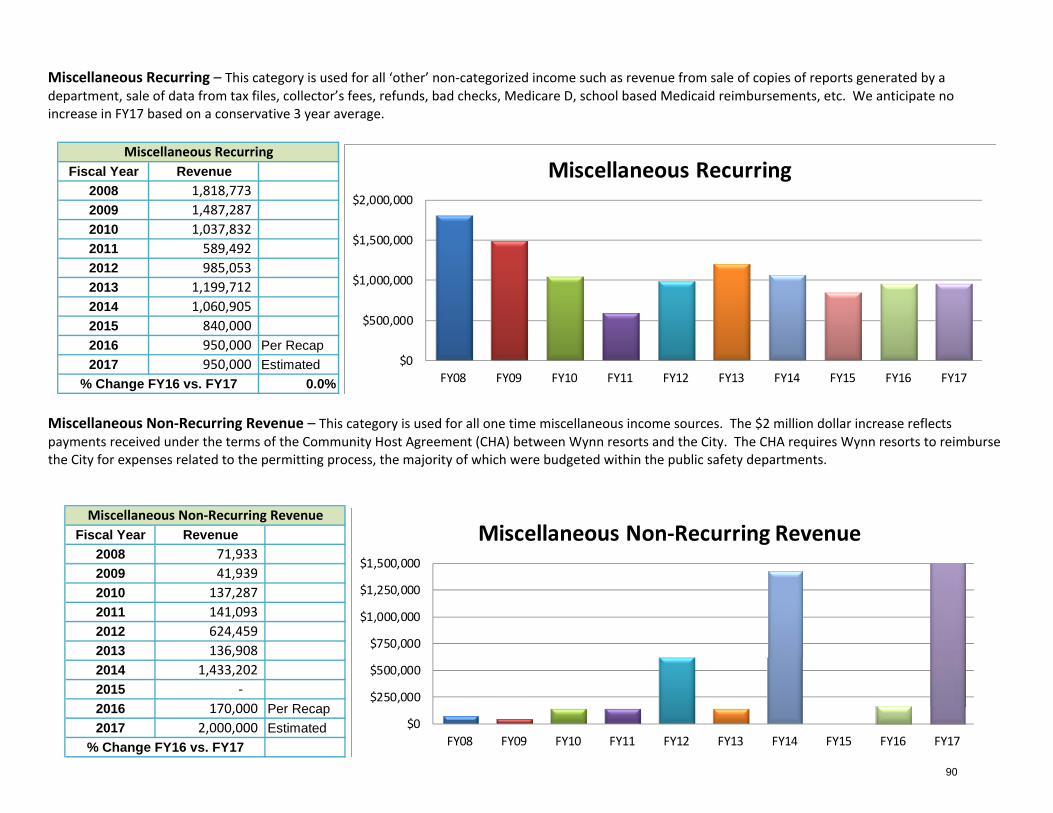
Miscellaneous Recurring – This category is used for all ‘other’ non‐categorized income such as revenue from sale of copies of reports generated by a department, sale of data from tax files, collector’s fees, refunds, bad checks, Medicare D, school based Medicaid reimbursements, etc. We anticipate no increase in FY17 based on a conservative 3 year average.
Fiscal Year Revenue2008 1,818,773 2009 1,487,287 2010 1,037,832 2011 589,492 2012 985,053 2013 1,199,712 2014 1,060,905 2015 840,000 2016 950,000 Per Recap2017 950,000 Estimated
0.0%
Miscellaneous Recurring
% Change FY16 vs. FY17
$0
$500,000
$1,000,000
$1,500,000
$2,000,000
FY08 FY09 FY10 FY11 FY12 FY13 FY14 FY15 FY16 FY17
Miscellaneous Recurring
Miscellaneous Non‐Recurring Revenue – This category is used for all one time miscellaneous income sources. The $2 million dollar increase reflects payments received under the terms of the Community Host Agreement (CHA) between Wynn resorts and the City. The CHA requires Wynn resorts to reimburse the City for expenses related to the permitting process, the majority of which were budgeted within the public safety departments.
Fiscal Year Revenue2008 71,933 2009 41,939 2010 137,287 2011 141,093 2012 624,459 2013 136,908 2014 1,433,202 2015 ‐ 2016 170,000 Per Recap2017 2,000,000 Estimated
Miscellaneous Non‐Recurring Revenue
% Change FY16 vs. FY17
$0
$250,000
$500,000
$750,000
$1,000,000
$1,250,000
$1,500,000
FY08 FY09 FY10 FY11 FY12 FY13 FY14 FY15 FY16 FY17
Miscellaneous Non‐Recurring Revenue
90
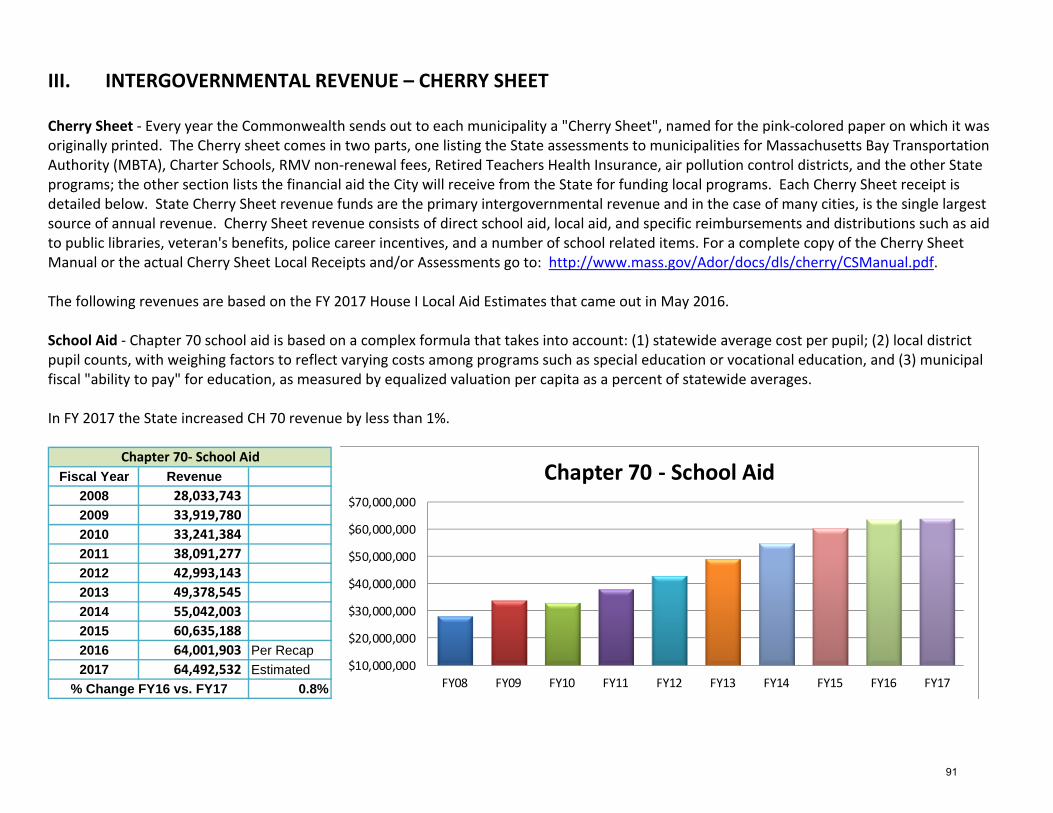
III. INTERGOVERNMENTAL REVENUE – CHERRY SHEET Cherry Sheet ‐ Every year the Commonwealth sends out to each municipality a "Cherry Sheet", named for the pink‐colored paper on which it was originally printed. The Cherry sheet comes in two parts, one listing the State assessments to municipalities for Massachusetts Bay Transportation Authority (MBTA), Charter Schools, RMV non‐renewal fees, Retired Teachers Health Insurance, air pollution control districts, and the other State programs; the other section lists the financial aid the City will receive from the State for funding local programs. Each Cherry Sheet receipt is detailed below. State Cherry Sheet revenue funds are the primary intergovernmental revenue and in the case of many cities, is the single largest source of annual revenue. Cherry Sheet revenue consists of direct school aid, local aid, and specific reimbursements and distributions such as aid to public libraries, veteran's benefits, police career incentives, and a number of school related items. For a complete copy of the Cherry Sheet Manual or the actual Cherry Sheet Local Receipts and/or Assessments go to: http://www.mass.gov/Ador/docs/dls/cherry/CSManual.pdf. The following revenues are based on the FY 2017 House I Local Aid Estimates that came out in May 2016. School Aid ‐ Chapter 70 school aid is based on a complex formula that takes into account: (1) statewide average cost per pupil; (2) local district pupil counts, with weighing factors to reflect varying costs among programs such as special education or vocational education, and (3) municipal fiscal "ability to pay" for education, as measured by equalized valuation per capita as a percent of statewide averages. In FY 2017 the State increased CH 70 revenue by less than 1%.
Fiscal Year Revenue2008 28,033,743 2009 33,919,780 2010 33,241,384 2011 38,091,277 2012 42,993,143 2013 49,378,545 2014 55,042,003 2015 60,635,188 2016 64,001,903 Per Recap2017 64,492,532 Estimated
0.8%
Chapter 70‐ School Aid
% Change FY16 vs. FY17
$10,000,000
$20,000,000
$30,000,000
$40,000,000
$50,000,000
$60,000,000
$70,000,000
FY08 FY09 FY10 FY11 FY12 FY13 FY14 FY15 FY16 FY17
Chapter 70 ‐ School Aid
91
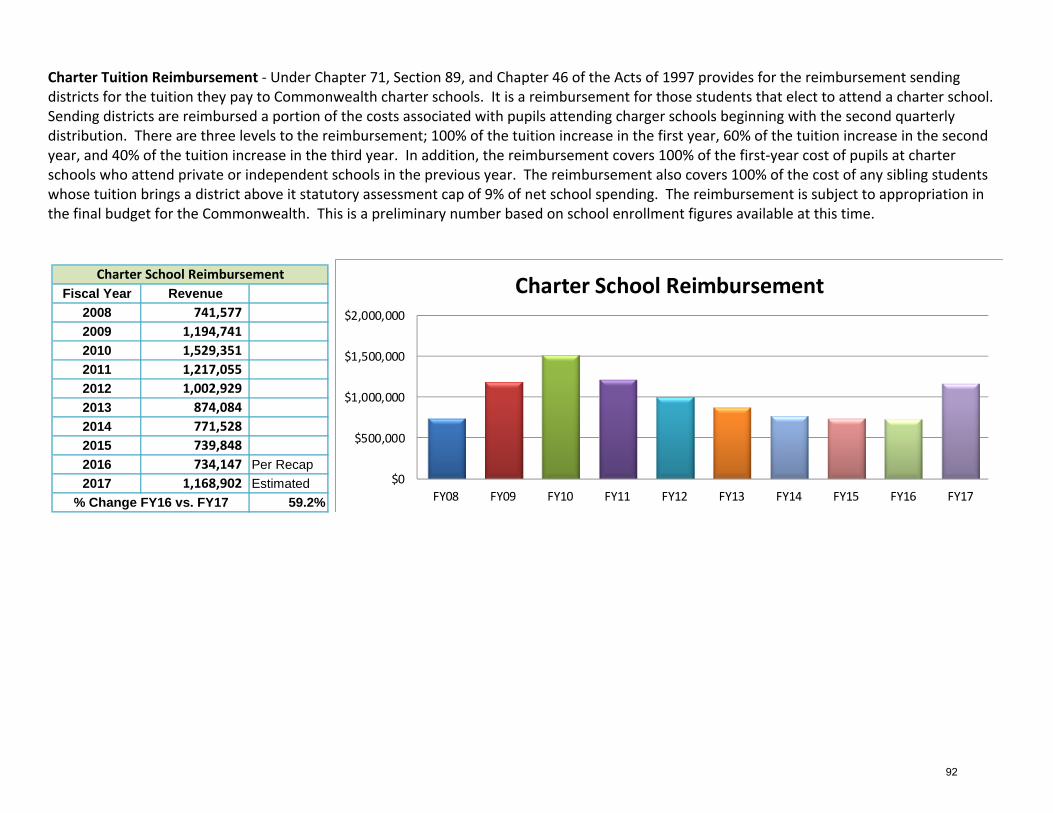
Charter Tuition Reimbursement ‐ Under Chapter 71, Section 89, and Chapter 46 of the Acts of 1997 provides for the reimbursement sending districts for the tuition they pay to Commonwealth charter schools. It is a reimbursement for those students that elect to attend a charter school. Sending districts are reimbursed a portion of the costs associated with pupils attending charger schools beginning with the second quarterly distribution. There are three levels to the reimbursement; 100% of the tuition increase in the first year, 60% of the tuition increase in the second year, and 40% of the tuition increase in the third year. In addition, the reimbursement covers 100% of the first‐year cost of pupils at charter schools who attend private or independent schools in the previous year. The reimbursement also covers 100% of the cost of any sibling students whose tuition brings a district above it statutory assessment cap of 9% of net school spending. The reimbursement is subject to appropriation in the final budget for the Commonwealth. This is a preliminary number based on school enrollment figures available at this time.
Fiscal Year Revenue2008 741,577 2009 1,194,741 2010 1,529,351 2011 1,217,055 2012 1,002,929 2013 874,084 2014 771,528 2015 739,848 2016 734,147 Per Recap2017 1,168,902 Estimated
59.2%
Charter School Reimbursement
% Change FY16 vs. FY17
$0
$500,000
$1,000,000
$1,500,000
$2,000,000
FY08 FY09 FY10 FY11 FY12 FY13 FY14 FY15 FY16 FY17
Charter School Reimbursement
92
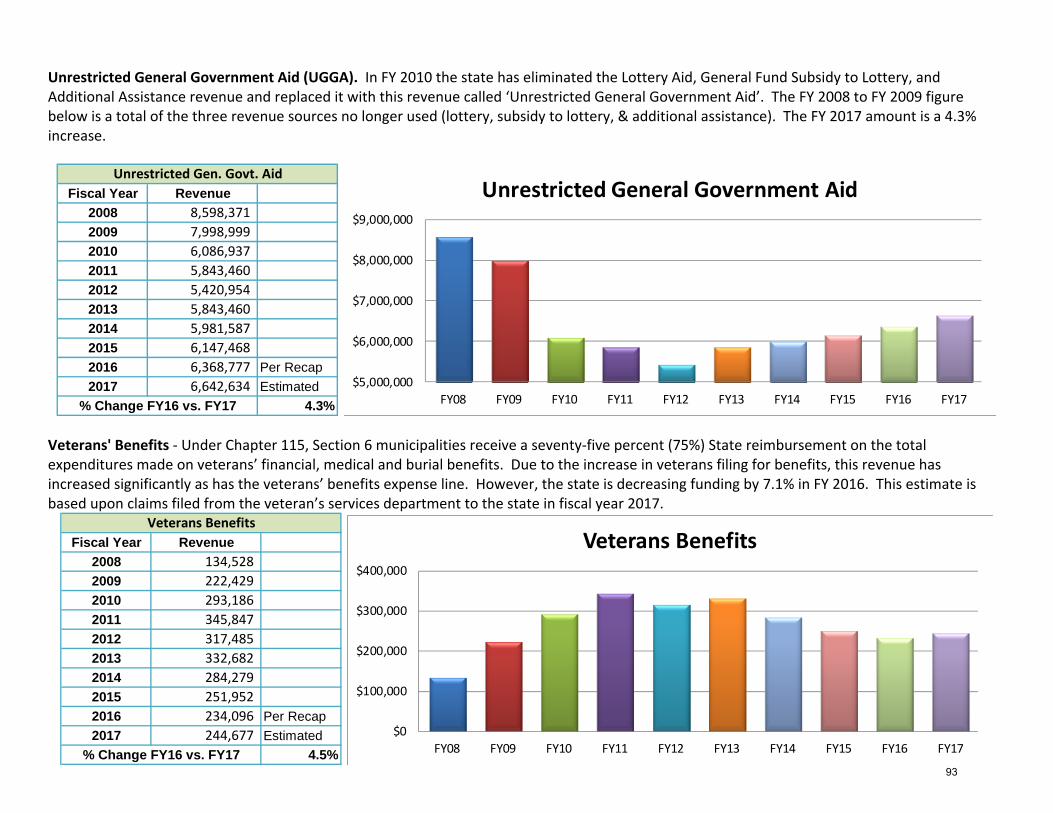
Unrestricted General Government Aid (UGGA). In FY 2010 the state has eliminated the Lottery Aid, General Fund Subsidy to Lottery, and Additional Assistance revenue and replaced it with this revenue called ‘Unrestricted General Government Aid’. The FY 2008 to FY 2009 figure below is a total of the three revenue sources no longer used (lottery, subsidy to lottery, & additional assistance). The FY 2017 amount is a 4.3% increase.
Fiscal Year Revenue2008 8,598,371 2009 7,998,999 2010 6,086,937 2011 5,843,460 2012 5,420,954 2013 5,843,460 2014 5,981,587 2015 6,147,468 2016 6,368,777 Per Recap2017 6,642,634 Estimated
4.3%
Unrestricted Gen. Govt. Aid
% Change FY16 vs. FY17
$5,000,000
$6,000,000
$7,000,000
$8,000,000
$9,000,000
FY08 FY09 FY10 FY11 FY12 FY13 FY14 FY15 FY16 FY17
Unrestricted General Government Aid
Veterans' Benefits ‐ Under Chapter 115, Section 6 municipalities receive a seventy‐five percent (75%) State reimbursement on the total expenditures made on veterans’ financial, medical and burial benefits. Due to the increase in veterans filing for benefits, this revenue has increased significantly as has the veterans’ benefits expense line. However, the state is decreasing funding by 7.1% in FY 2016. This estimate is based upon claims filed from the veteran’s services department to the state in fiscal year 2017.
Fiscal Year Revenue2008 134,528 2009 222,429 2010 293,186 2011 345,847 2012 317,485 2013 332,682 2014 284,279 2015 251,952 2016 234,096 Per Recap2017 244,677 Estimated
4.5%
Veterans Benefits
% Change FY16 vs. FY17
$0
$100,000
$200,000
$300,000
$400,000
FY08 FY09 FY10 FY11 FY12 FY13 FY14 FY15 FY16 FY17
Veterans Benefits
93
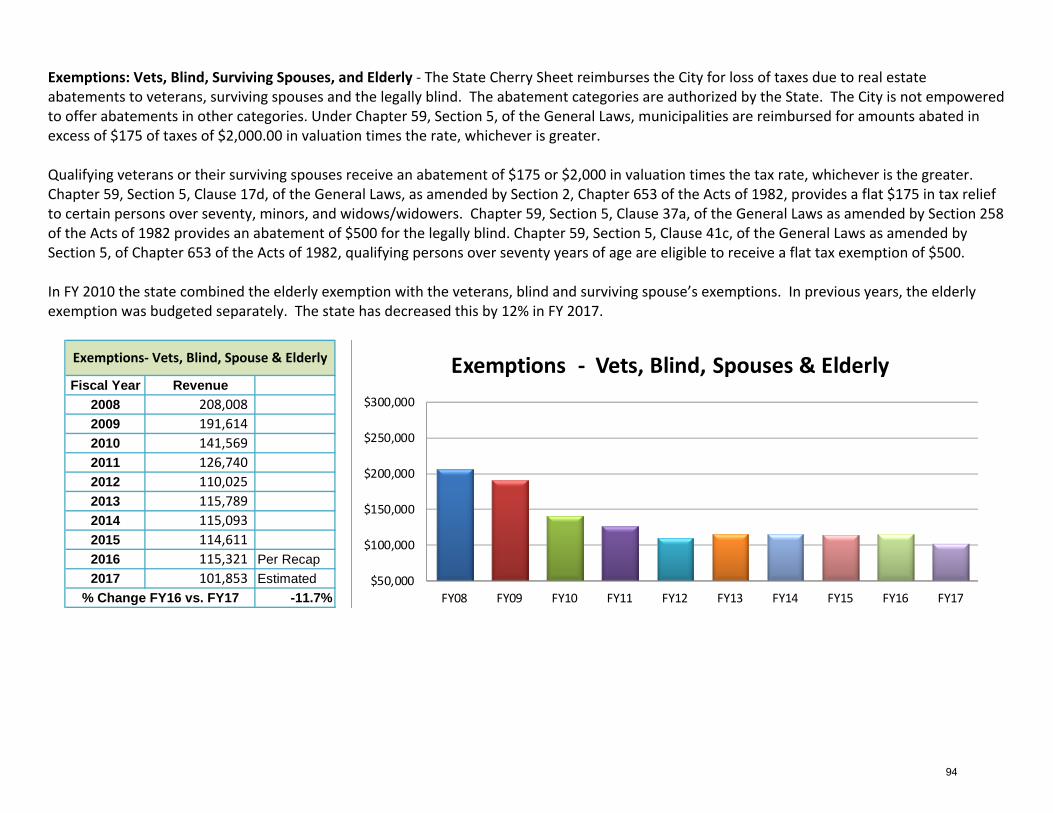
Exemptions: Vets, Blind, Surviving Spouses, and Elderly ‐ The State Cherry Sheet reimburses the City for loss of taxes due to real estate abatements to veterans, surviving spouses and the legally blind. The abatement categories are authorized by the State. The City is not empowered to offer abatements in other categories. Under Chapter 59, Section 5, of the General Laws, municipalities are reimbursed for amounts abated in excess of $175 of taxes of $2,000.00 in valuation times the rate, whichever is greater. Qualifying veterans or their surviving spouses receive an abatement of $175 or $2,000 in valuation times the tax rate, whichever is the greater. Chapter 59, Section 5, Clause 17d, of the General Laws, as amended by Section 2, Chapter 653 of the Acts of 1982, provides a flat $175 in tax relief to certain persons over seventy, minors, and widows/widowers. Chapter 59, Section 5, Clause 37a, of the General Laws as amended by Section 258 of the Acts of 1982 provides an abatement of $500 for the legally blind. Chapter 59, Section 5, Clause 41c, of the General Laws as amended by Section 5, of Chapter 653 of the Acts of 1982, qualifying persons over seventy years of age are eligible to receive a flat tax exemption of $500. In FY 2010 the state combined the elderly exemption with the veterans, blind and surviving spouse’s exemptions. In previous years, the elderly exemption was budgeted separately. The state has decreased this by 12% in FY 2017.
Fiscal Year Revenue2008 208,008 2009 191,614 2010 141,569 2011 126,740 2012 110,025 2013 115,789 2014 115,093 2015 114,611 2016 115,321 Per Recap2017 101,853 Estimated
-11.7%
Exemptions‐ Vets, Blind, Spouse & Elderly
% Change FY16 vs. FY17 $50,000
$100,000
$150,000
$200,000
$250,000
$300,000
FY08 FY09 FY10 FY11 FY12 FY13 FY14 FY15 FY16 FY17
Exemptions ‐ Vets, Blind, Spouses & Elderly
94
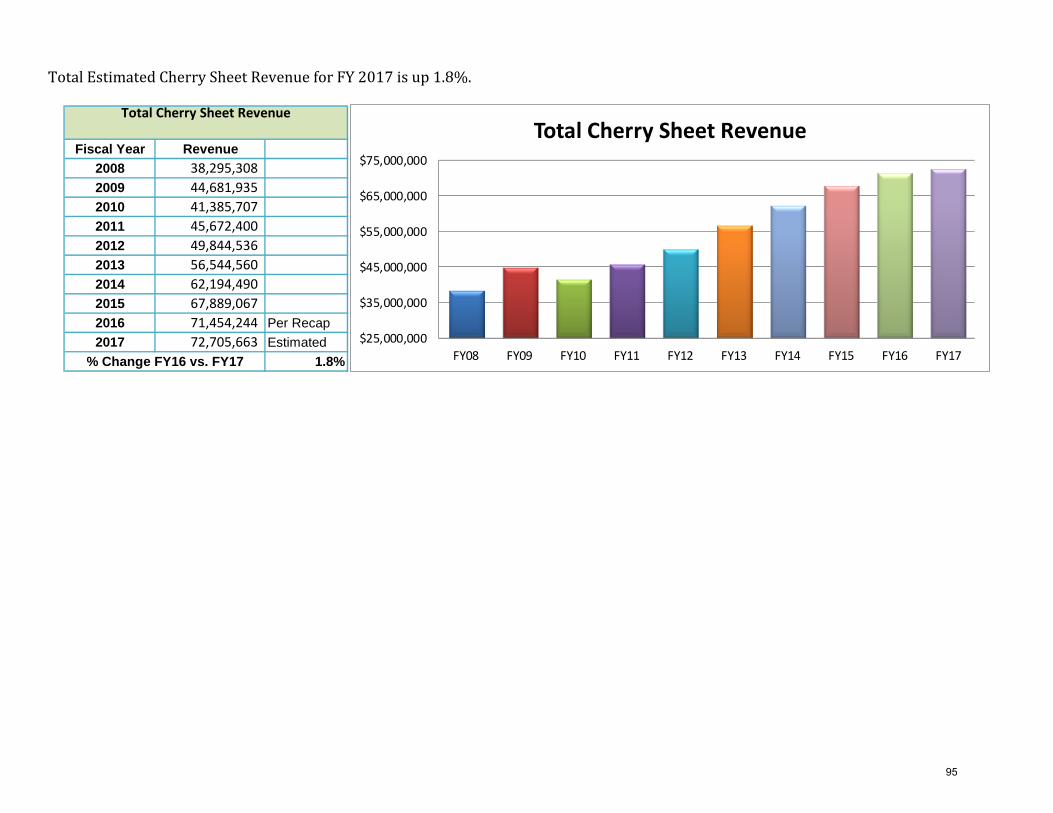
TotalEstimatedCherrySheetRevenueforFY2017isup1.8%.
Fiscal Year Revenue2008 38,295,308 2009 44,681,935 2010 41,385,707 2011 45,672,400 2012 49,844,536 2013 56,544,560 2014 62,194,490 2015 67,889,067 2016 71,454,244 Per Recap2017 72,705,663 Estimated
1.8%
Total Cherry Sheet Revenue
% Change FY16 vs. FY17
$25,000,000
$35,000,000
$45,000,000
$55,000,000
$65,000,000
$75,000,000
FY08 FY09 FY10 FY11 FY12 FY13 FY14 FY15 FY16 FY17
Total Cherry Sheet Revenue
95
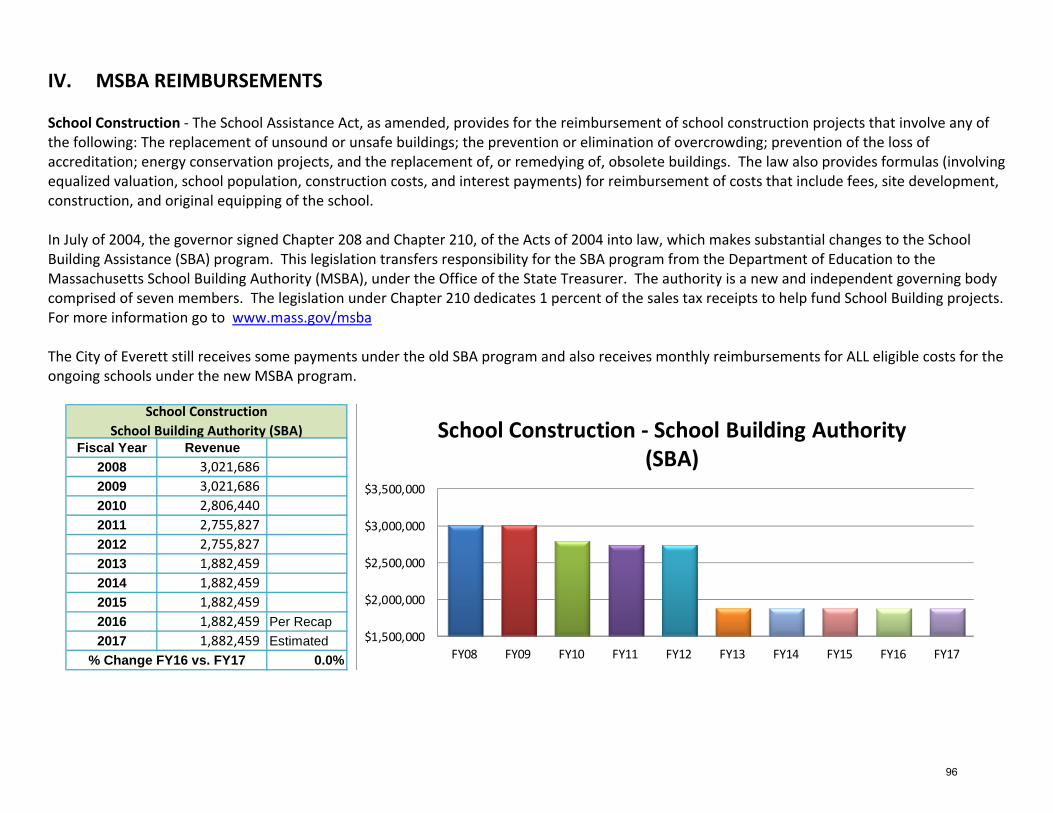
IV. MSBA REIMBURSEMENTS
School Construction ‐ The School Assistance Act, as amended, provides for the reimbursement of school construction projects that involve any of the following: The replacement of unsound or unsafe buildings; the prevention or elimination of overcrowding; prevention of the loss of accreditation; energy conservation projects, and the replacement of, or remedying of, obsolete buildings. The law also provides formulas (involving equalized valuation, school population, construction costs, and interest payments) for reimbursement of costs that include fees, site development, construction, and original equipping of the school. In July of 2004, the governor signed Chapter 208 and Chapter 210, of the Acts of 2004 into law, which makes substantial changes to the School Building Assistance (SBA) program. This legislation transfers responsibility for the SBA program from the Department of Education to the Massachusetts School Building Authority (MSBA), under the Office of the State Treasurer. The authority is a new and independent governing body comprised of seven members. The legislation under Chapter 210 dedicates 1 percent of the sales tax receipts to help fund School Building projects. For more information go to www.mass.gov/msba The City of Everett still receives some payments under the old SBA program and also receives monthly reimbursements for ALL eligible costs for the ongoing schools under the new MSBA program.
Fiscal Year Revenue2008 3,021,686 2009 3,021,686 2010 2,806,440 2011 2,755,827 2012 2,755,827 2013 1,882,459 2014 1,882,459 2015 1,882,459 2016 1,882,459 Per Recap2017 1,882,459 Estimated
0.0%
School ConstructionSchool Building Authority (SBA)
% Change FY16 vs. FY17
$1,500,000
$2,000,000
$2,500,000
$3,000,000
$3,500,000
FY08 FY09 FY10 FY11 FY12 FY13 FY14 FY15 FY16 FY17
School Construction ‐ School Building Authority (SBA)
96
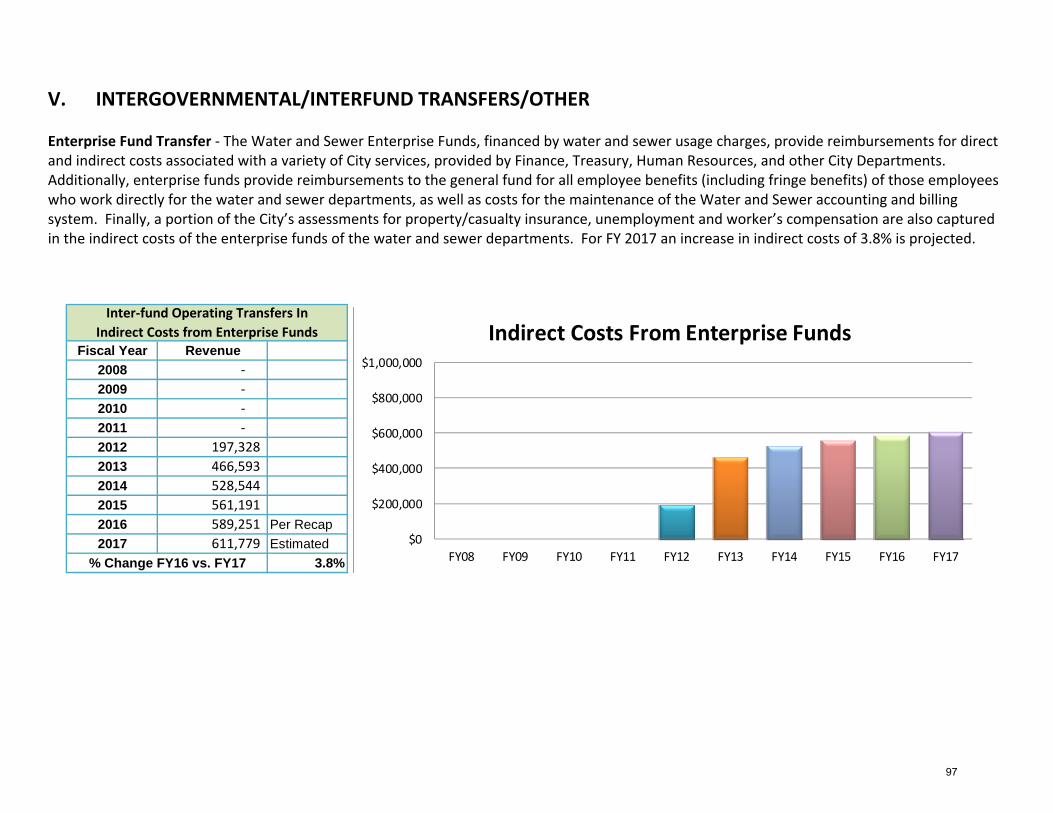
V. INTERGOVERNMENTAL/INTERFUND TRANSFERS/OTHER Enterprise Fund Transfer ‐ The Water and Sewer Enterprise Funds, financed by water and sewer usage charges, provide reimbursements for direct and indirect costs associated with a variety of City services, provided by Finance, Treasury, Human Resources, and other City Departments. Additionally, enterprise funds provide reimbursements to the general fund for all employee benefits (including fringe benefits) of those employees who work directly for the water and sewer departments, as well as costs for the maintenance of the Water and Sewer accounting and billing system. Finally, a portion of the City’s assessments for property/casualty insurance, unemployment and worker’s compensation are also captured in the indirect costs of the enterprise funds of the water and sewer departments. For FY 2017 an increase in indirect costs of 3.8% is projected.
Fiscal Year Revenue2008 ‐ 2009 ‐ 2010 ‐ 2011 ‐ 2012 197,328 2013 466,593 2014 528,544 2015 561,191 2016 589,251 Per Recap2017 611,779 Estimated
3.8%
Inter‐fund Operating Transfers InIndirect Costs from Enterprise Funds
% Change FY16 vs. FY17
$0
$200,000
$400,000
$600,000
$800,000
$1,000,000
FY08 FY09 FY10 FY11 FY12 FY13 FY14 FY15 FY16 FY17
Indirect Costs From Enterprise Funds
97
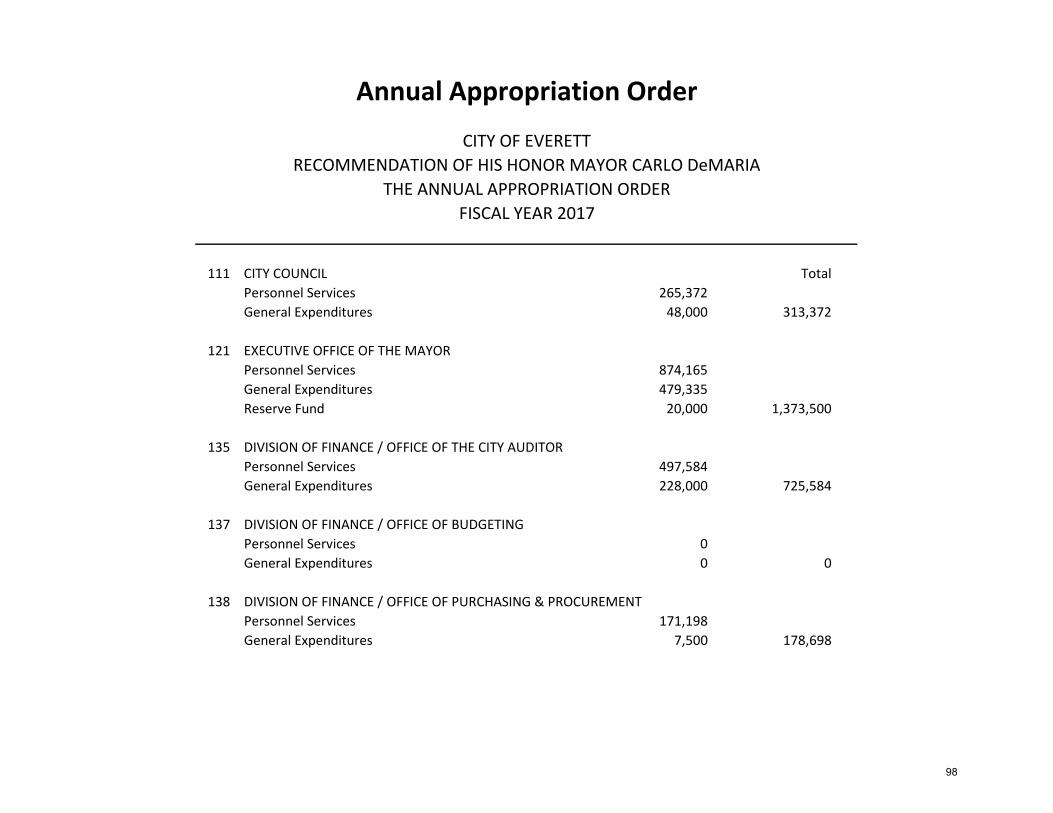
111 CITY COUNCIL TotalPersonnel Services 265,372General Expenditures 48,000 313,372
121 EXECUTIVE OFFICE OF THE MAYORPersonnel Services 874,165General Expenditures 479,335Reserve Fund 20,000 1,373,500
135 DIVISION OF FINANCE / OFFICE OF THE CITY AUDITORPersonnel Services 497,584General Expenditures 228,000 725,584
137 DIVISION OF FINANCE / OFFICE OF BUDGETINGPersonnel Services 0General Expenditures 0 0
138 DIVISION OF FINANCE / OFFICE OF PURCHASING & PROCUREMENTPersonnel Services 171,198General Expenditures 7,500 178,698
Annual Appropriation Order
CITY OF EVERETTRECOMMENDATION OF HIS HONOR MAYOR CARLO DeMARIA
THE ANNUAL APPROPRIATION ORDERFISCAL YEAR 2017
98
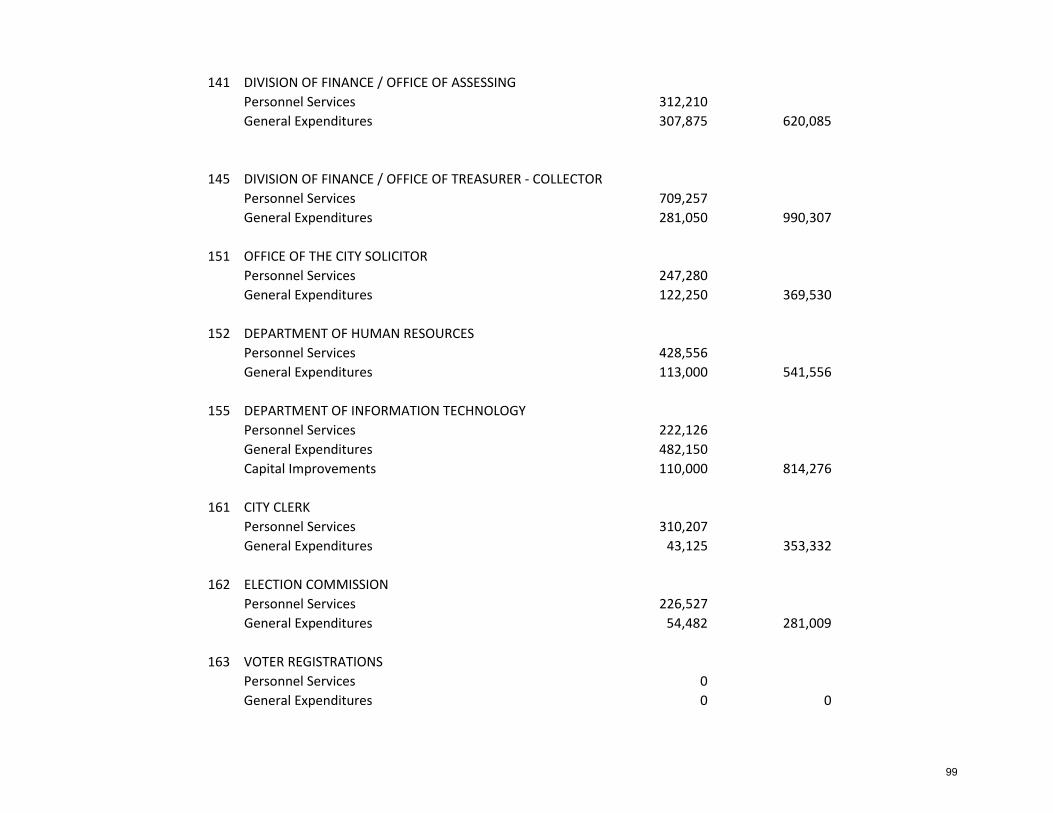
141 DIVISION OF FINANCE / OFFICE OF ASSESSINGPersonnel Services 312,210General Expenditures 307,875 620,085
145 DIVISION OF FINANCE / OFFICE OF TREASURER ‐ COLLECTORPersonnel Services 709,257General Expenditures 281,050 990,307
151 OFFICE OF THE CITY SOLICITORPersonnel Services 247,280General Expenditures 122,250 369,530
152 DEPARTMENT OF HUMAN RESOURCESPersonnel Services 428,556General Expenditures 113,000 541,556
155 DEPARTMENT OF INFORMATION TECHNOLOGYPersonnel Services 222,126General Expenditures 482,150Capital Improvements 110,000 814,276
161 CITY CLERK
Personnel Services 310,207General Expenditures 43,125 353,332
162 ELECTION COMMISSION Personnel Services 226,527General Expenditures 54,482 281,009
163 VOTER REGISTRATIONS Personnel Services 0General Expenditures 0 0
99
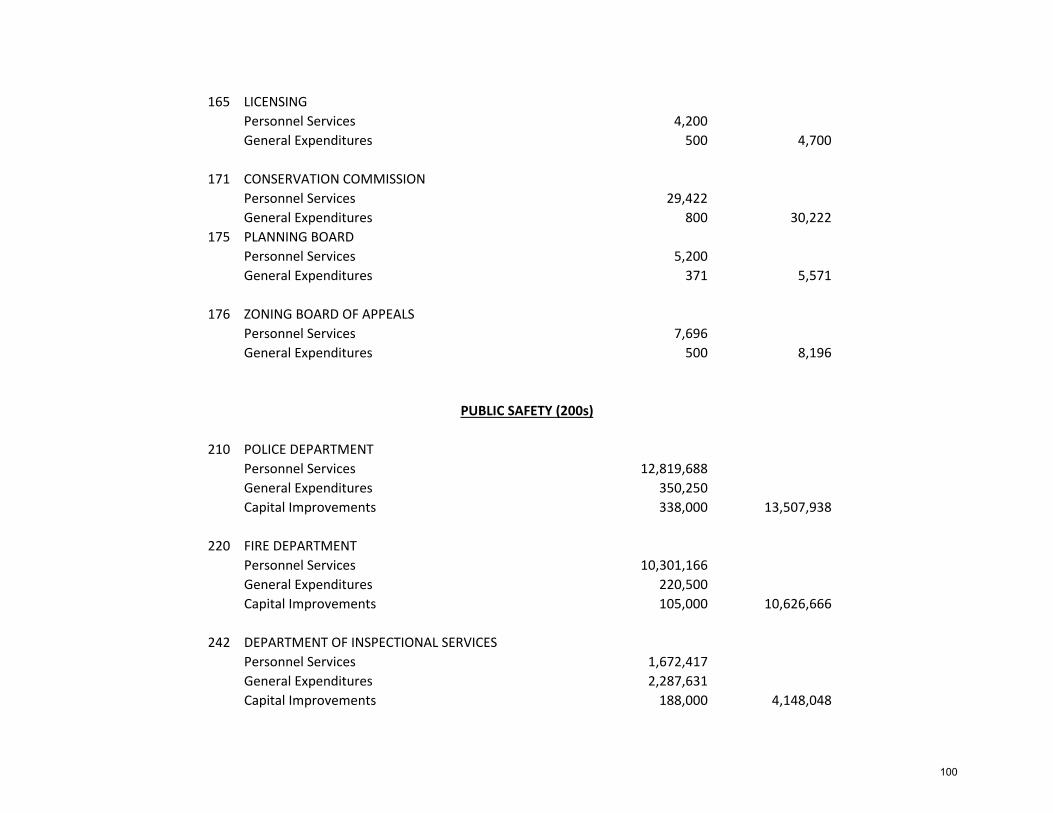
165 LICENSING
Personnel Services 4,200General Expenditures 500 4,700
171 CONSERVATION COMMISSION
Personnel Services 29,422General Expenditures 800 30,222
175 PLANNING BOARD Personnel Services 5,200General Expenditures 371 5,571
176 ZONING BOARD OF APPEALS
Personnel Services 7,696General Expenditures 500 8,196
210 POLICE DEPARTMENTPersonnel Services 12,819,688General Expenditures 350,250Capital Improvements 338,000 13,507,938
220 FIRE DEPARTMENT
Personnel Services 10,301,166General Expenditures 220,500Capital Improvements 105,000 10,626,666
242 DEPARTMENT OF INSPECTIONAL SERVICES
Personnel Services 1,672,417General Expenditures 2,287,631Capital Improvements 188,000 4,148,048
PUBLIC SAFETY (200s)
100
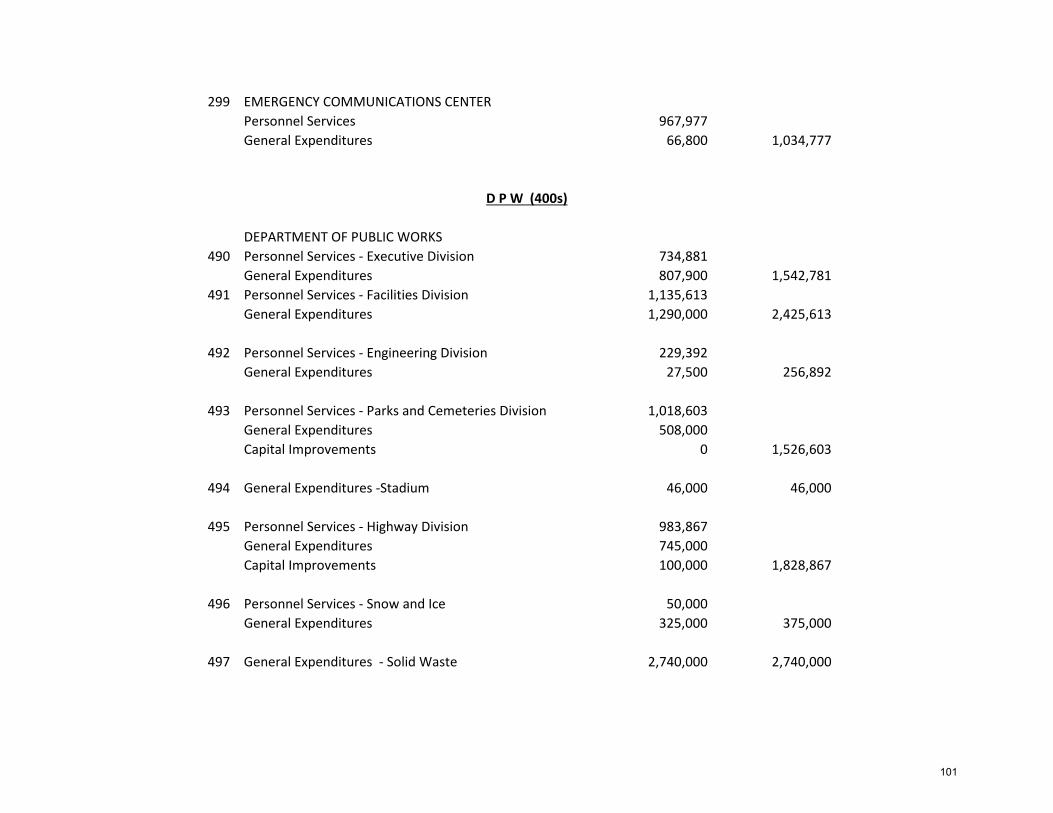
299 EMERGENCY COMMUNICATIONS CENTER Personnel Services 967,977General Expenditures 66,800 1,034,777
DEPARTMENT OF PUBLIC WORKS490 Personnel Services ‐ Executive Division 734,881
General Expenditures 807,900 1,542,781491 Personnel Services ‐ Facilities Division 1,135,613
General Expenditures 1,290,000 2,425,613
492 Personnel Services ‐ Engineering Division 229,392General Expenditures 27,500 256,892
493 Personnel Services ‐ Parks and Cemeteries Division 1,018,603General Expenditures 508,000Capital Improvements 0 1,526,603
494 General Expenditures ‐Stadium 46,000 46,000
495 Personnel Services ‐ Highway Division 983,867General Expenditures 745,000Capital Improvements 100,000 1,828,867
496 Personnel Services ‐ Snow and Ice 50,000General Expenditures 325,000 375,000
497 General Expenditures ‐ Solid Waste 2,740,000 2,740,000
D P W (400s)
101
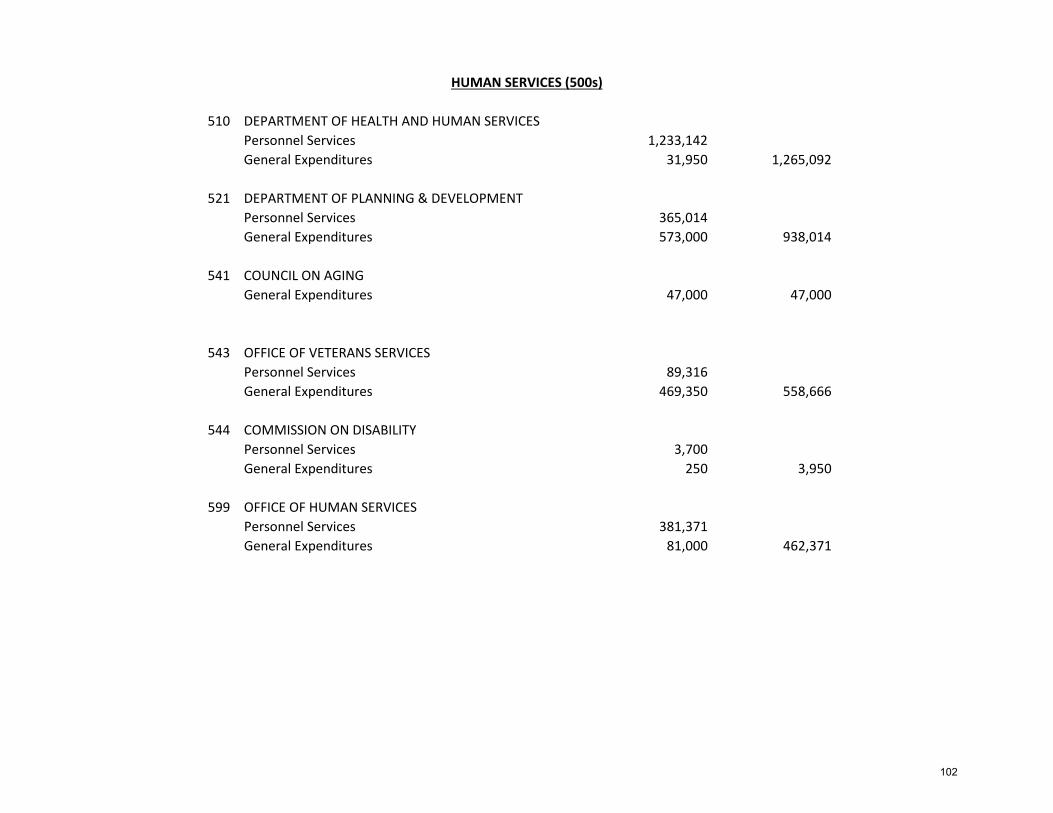
510 DEPARTMENT OF HEALTH AND HUMAN SERVICESPersonnel Services 1,233,142General Expenditures 31,950 1,265,092
521 DEPARTMENT OF PLANNING & DEVELOPMENT
Personnel Services 365,014General Expenditures 573,000 938,014
541 COUNCIL ON AGING
General Expenditures 47,000 47,000
543 OFFICE OF VETERANS SERVICES Personnel Services 89,316General Expenditures 469,350 558,666
544 COMMISSION ON DISABILITYPersonnel Services 3,700General Expenditures 250 3,950
599 OFFICE OF HUMAN SERVICES
Personnel Services 381,371General Expenditures 81,000 462,371
HUMAN SERVICES (500s)
102
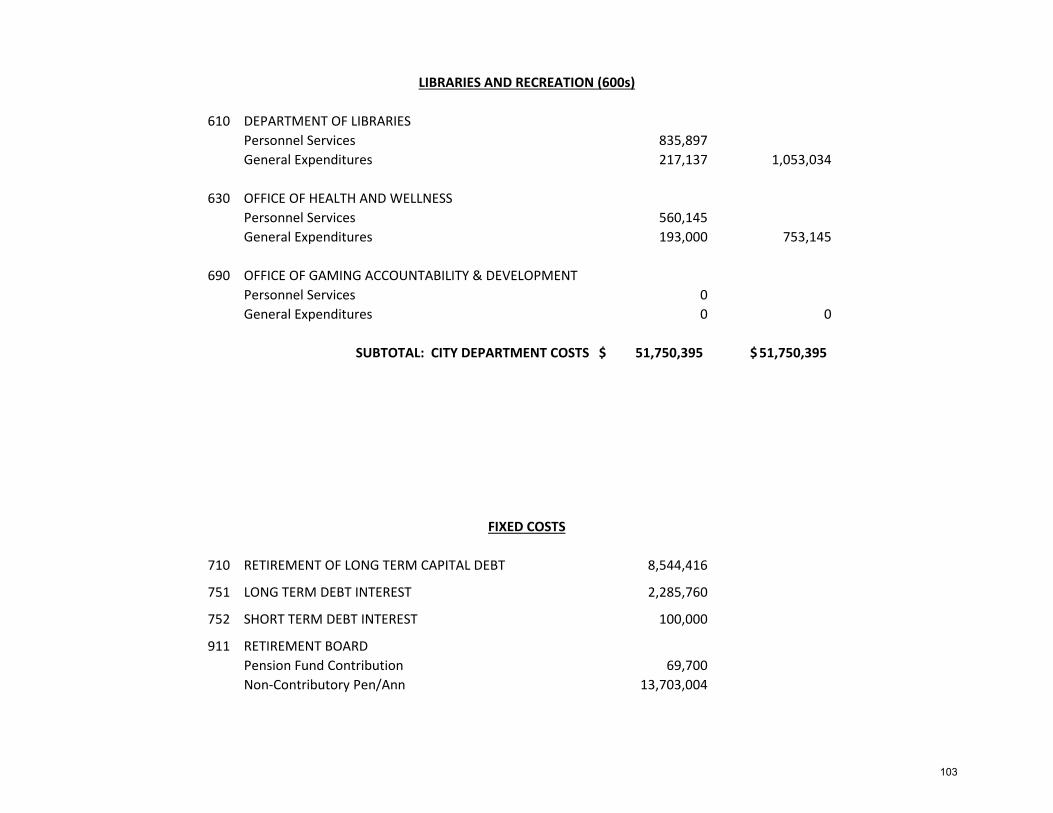
610 DEPARTMENT OF LIBRARIESPersonnel Services 835,897 General Expenditures 217,137 1,053,034
630 OFFICE OF HEALTH AND WELLNESS Personnel Services 560,145General Expenditures 193,000 753,145
690 OFFICE OF GAMING ACCOUNTABILITY & DEVELOPMENT Personnel Services 0General Expenditures 0 0
SUBTOTAL: CITY DEPARTMENT COSTS 51,750,395$ 51,750,395$
710 RETIREMENT OF LONG TERM CAPITAL DEBT 8,544,416
751 LONG TERM DEBT INTEREST 2,285,760
752 SHORT TERM DEBT INTEREST 100,000
911 RETIREMENT BOARDPension Fund Contribution 69,700Non‐Contributory Pen/Ann 13,703,004
LIBRARIES AND RECREATION (600s)
FIXED COSTS
103
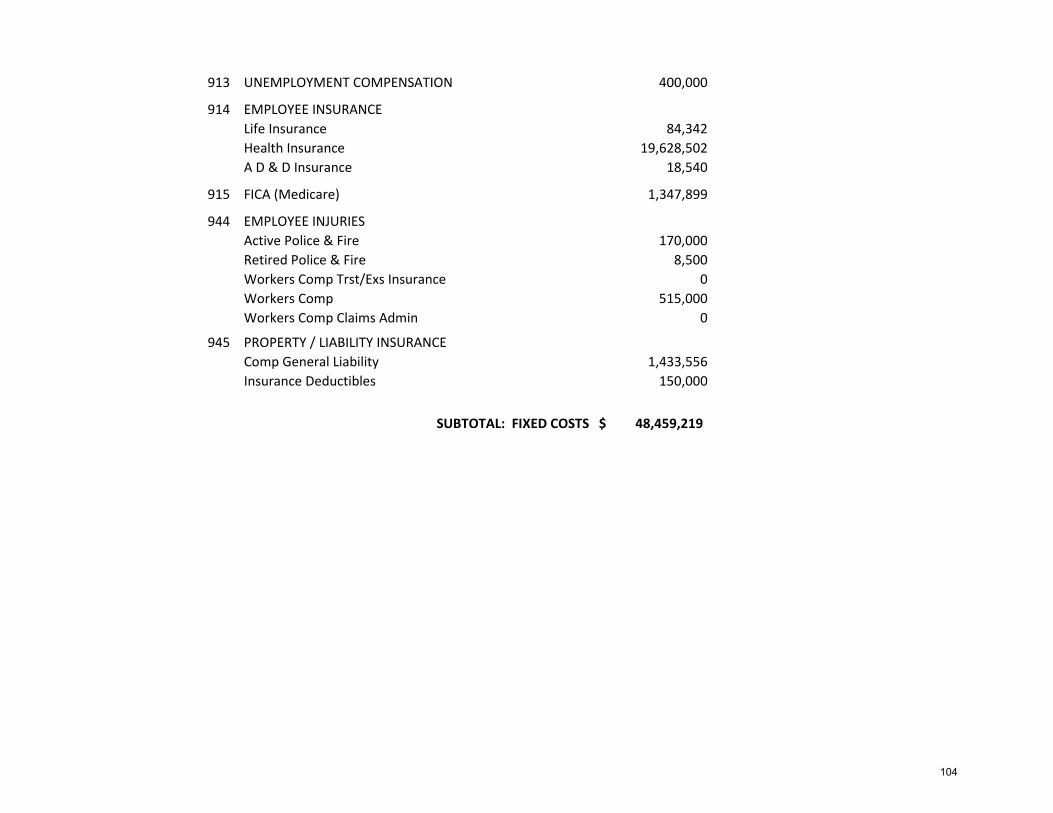
913 UNEMPLOYMENT COMPENSATION 400,000
914 EMPLOYEE INSURANCELife Insurance 84,342Health Insurance 19,628,502A D & D Insurance 18,540
915 FICA (Medicare) 1,347,899
944 EMPLOYEE INJURIES Active Police & Fire 170,000Retired Police & Fire 8,500Workers Comp Trst/Exs Insurance 0Workers Comp 515,000Workers Comp Claims Admin 0
945 PROPERTY / LIABILITY INSURANCE Comp General Liability 1,433,556Insurance Deductibles 150,000
SUBTOTAL: FIXED COSTS 48,459,219$
104
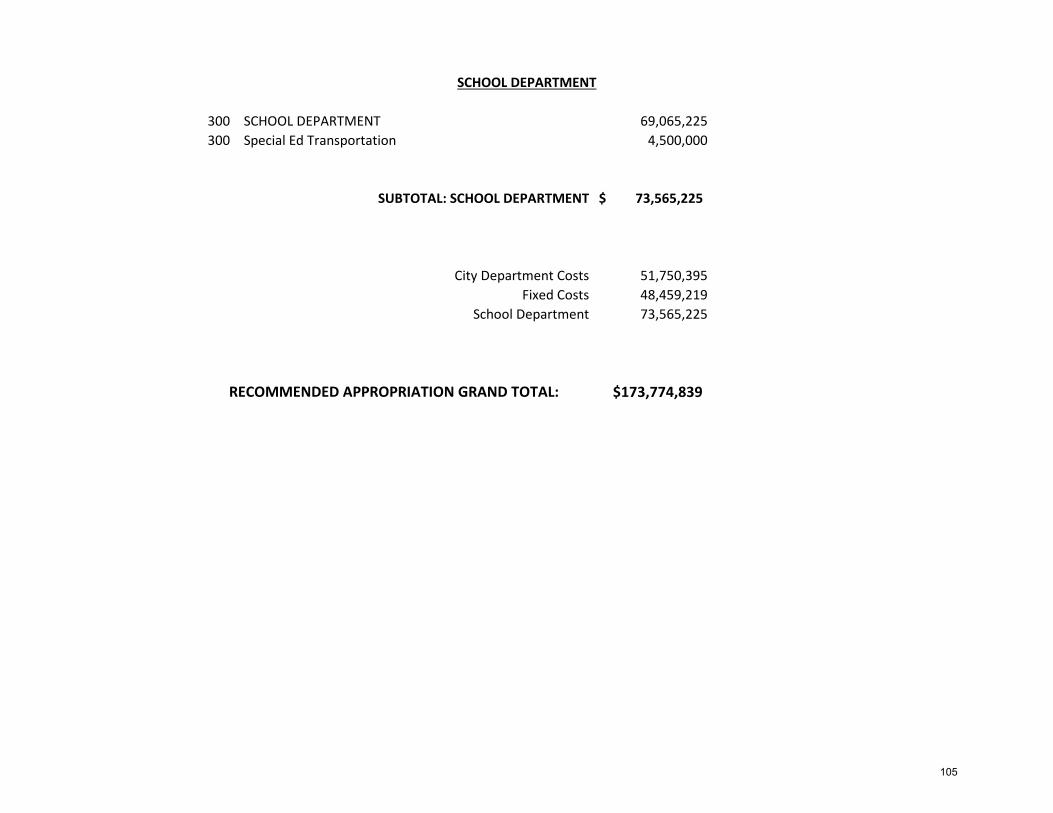
300 SCHOOL DEPARTMENT 69,065,225300 Special Ed Transportation 4,500,000
SUBTOTAL: SCHOOL DEPARTMENT 73,565,225$
City Department Costs 51,750,395Fixed Costs 48,459,219
School Department 73,565,225
$173,774,839RECOMMENDED APPROPRIATION GRAND TOTAL:
SCHOOL DEPARTMENT
105

City Council
Mission Statement
To perform legislative duties encumbered upon us by Massachusetts General Laws, the Everett City Charter and City Ordinances on behalf of residents of the City of Everett.
Significant Budget & Staffing Changes for FY 2016
8% increase due to: The Clerk of Committees position was reclassified. A 2% increase on the Administrative Assistant salary. Reimbursable Expenses was increased to give each City Councilor a $3K budget which would now include travel to conferences.
FY 2016: Accomplishments
Continue transition to unicameral form of government. Remodeled and transformed City Council Chambers. Continue to review and revise ordinances in accordance with the new City Charter.
FY 2017: Goals & Objectives
Remodel back office and Conference Room. Strengthen and encourage government participation and cooperation for the
benefit of the City of Everett. Continue to review, revise and update City Ordinances. Begin working with the Historical Commission on issues of Historical Preservation
for homes in our City.
106
City Council
Mission Statement
To perform legislative duties encumbered upon us by Massachusetts General Laws, the Everett City Charter and City Ordinances on behalf of residents of the City of Everett.
Significant Budget & Staffing Changes for FY 2016
8% increase due to: The Clerk of Committees position was reclassified. A 2% increase on the Administrative Assistant salary. Reimbursable Expenses was increased to give each City Councilor a $3K budget which would now include travel to conferences.
FY 2016: Accomplishments
Continue transition to unicameral form of government. Remodeled and transformed City Council Chambers. Continue to review and revise ordinances in accordance with the new City Charter.
FY 2017: Goals & Objectives
Remodel back office and Conference Room. Strengthen and encourage government participation and cooperation for the
benefit of the City of Everett. Continue to review, revise and update City Ordinances. Begin working with the Historical Commission on issues of Historical Preservation
for homes in our City.
107
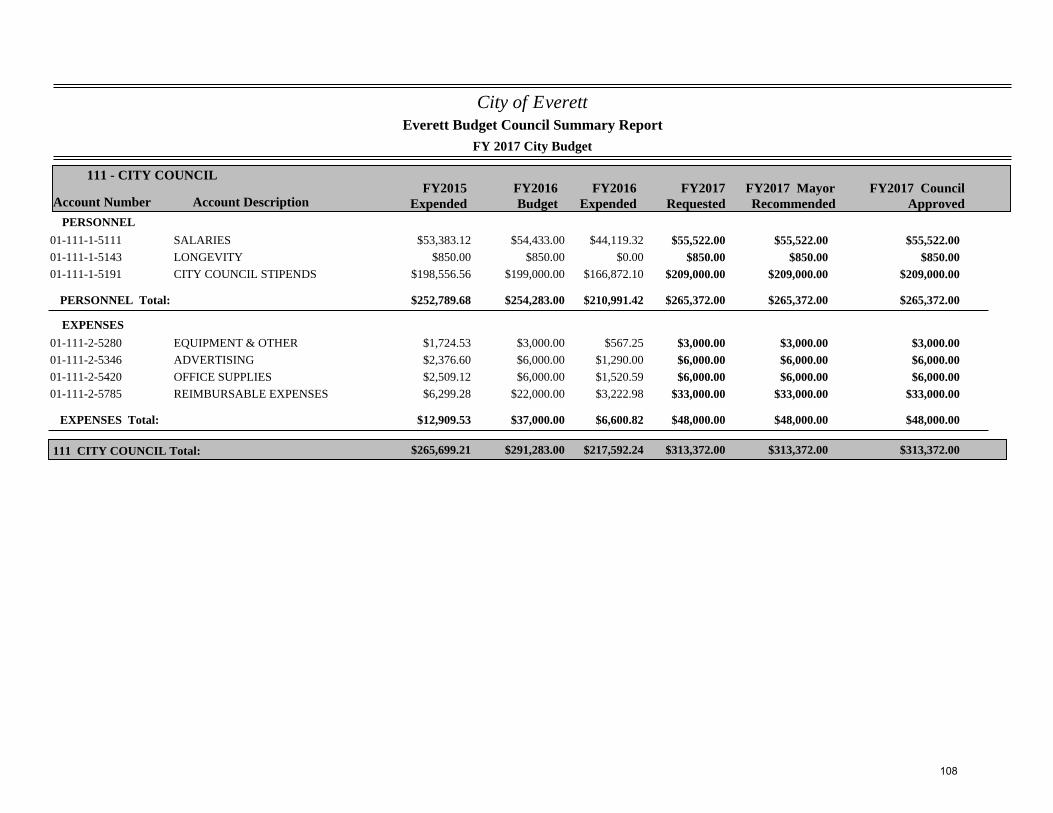
City of Everett
FY 2017 City Budget
Account Number Account DescriptionFY2015
ExpendedFY2016Budget
FY2017Requested
111 - CITY COUNCIL
Everett Budget Council Summary Report
FY2017 MayorRecommended
FY2016Expended
FY2017 CouncilApproved
PERSONNEL$53,383.12 $54,433.00 $55,522.0001-111-1-5111 SALARIES $44,119.32 $55,522.00 $55,522.00
$850.00 $850.00 $850.0001-111-1-5143 LONGEVITY $0.00 $850.00 $850.00$198,556.56 $199,000.00 $209,000.0001-111-1-5191 CITY COUNCIL STIPENDS $166,872.10 $209,000.00 $209,000.00
PERSONNEL Total: $252,789.68 $254,283.00 $265,372.00$210,991.42 $265,372.00 $265,372.00
EXPENSES$1,724.53 $3,000.00 $3,000.0001-111-2-5280 EQUIPMENT & OTHER $567.25 $3,000.00 $3,000.00$2,376.60 $6,000.00 $6,000.0001-111-2-5346 ADVERTISING $1,290.00 $6,000.00 $6,000.00$2,509.12 $6,000.00 $6,000.0001-111-2-5420 OFFICE SUPPLIES $1,520.59 $6,000.00 $6,000.00$6,299.28 $22,000.00 $33,000.0001-111-2-5785 REIMBURSABLE EXPENSES $3,222.98 $33,000.00 $33,000.00
EXPENSES Total: $12,909.53 $37,000.00 $48,000.00$6,600.82 $48,000.00 $48,000.00
$265,699.21 $291,283.00 $313,372.00111 CITY COUNCIL Total: $217,592.24 $313,372.00 $313,372.00
108
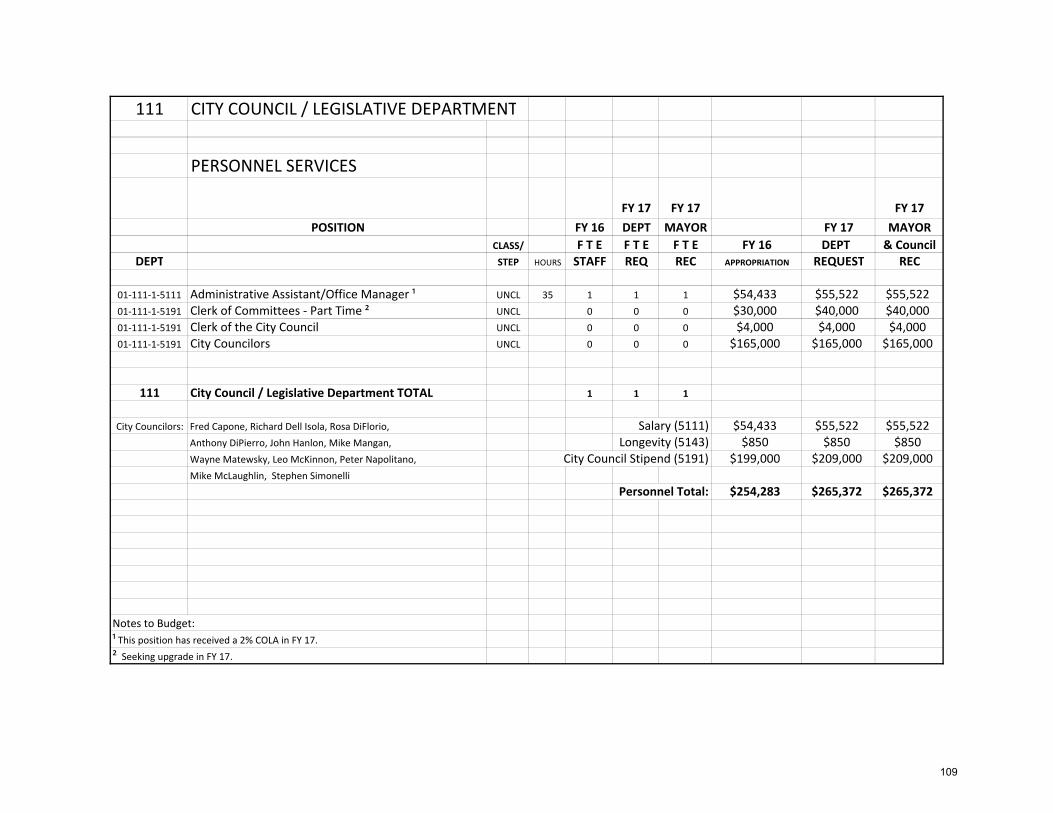
111 CITY COUNCIL / LEGISLATIVE DEPARTMENT
PERSONNEL SERVICES
FY 17 FY 17 FY 17POSITION FY 16 DEPT MAYOR FY 17 MAYOR
CLASS/ F T E F T E F T E FY 16 DEPT & CouncilDEPT STEP HOURS STAFF REQ REC APPROPRIATION REQUEST REC
01‐111‐1‐5111 Administrative Assistant/Office Manager ¹ UNCL 35 1 1 1 $54,433 $55,522 $55,52201‐111‐1‐5191 Clerk of Committees ‐ Part Time ² UNCL 0 0 0 $30,000 $40,000 $40,00001‐111‐1‐5191 Clerk of the City Council UNCL 0 0 0 $4,000 $4,000 $4,00001‐111‐1‐5191 City Councilors UNCL 0 0 0 $165,000 $165,000 $165,000
111 City Council / Legislative Department TOTAL 1 1 1
City Councilors: Fred Capone, Richard Dell Isola, Rosa DiFlorio, Salary (5111) $54,433 $55,522 $55,522Anthony DiPierro, John Hanlon, Mike Mangan, Longevity (5143) $850 $850 $850Wayne Matewsky, Leo McKinnon, Peter Napolitano, City Council Stipend (5191) $199,000 $209,000 $209,000Mike McLaughlin, Stephen Simonelli
Personnel Total: $254,283 $265,372 $265,372
Notes to Budget:¹ This position has received a 2% COLA in FY 17.² Seeking upgrade in FY 17.
109
Executive Office of Mayor
Mission Statement
The Mayor is the Chief Executive Officer and administrative head of the City of Everett. As the general administrator of all city departments, the Mayor appoints departmental staff and board members, submits the annual budget to the City Council, approves all financial documents and contracts, and recommends bond issues, legislation and orders to the City Council. The mayor also represents the city with all other governmental entities. The Mayor’s primary goal is to enhance the quality of life for Everett’s citizens by providing a clear vision, strong leadership and quality services. The Office of the Mayor is committed to move Everett forward by creating an environment that will foster economic growth, preserve and improve city assets and implement effective and efficient operations. The Office prides itself on accountability, respect for all individuals, teamwork and is committed to excellence.
Significant Budget & Staffing Changes for FY 2017
52% increase due to: The Office of the Mayor has been restructured to be a more efficient and effective operation. Our new Chief of Staff is working fewer hours than the previous employee, which has reduced administrative costs. We will also be hiring a Grant Writer to bring in funding from available grants provided by the state and federal agencies. Due to the amount of foot traffic the Constituent Service’s department has seen last fiscal year, we have increased the hours to full‐time for one of the aides and have hired 2 more as part‐time aides.
110
We have added funding in two new accounts. The Marketing & Business account ($100K) was created to fund and advance the economic development goals of the city, including a branding and marketing strategy that integrates and coordinates planned and existing public and business programs while also suggesting cost‐effective enhancements. The plan will cover both digital and offline marketing.
The After School account ($75K) will fund the program that allows children in the Everett School System to stay at school until 6:00 p.m. Official Celebrations account ($135K) was increased due to the number of city‐wide events that are hosted during the fiscal year by the Mayor and his staff. This includes July 4th festivities, the Senior Barbecue, Village Fest, the Drum and Bugle Corp Competition, Movie Night, Halloween Celebrations, the Winter Holiday event and the summer concert series to name a few.
FY 2016: Accomplishments
Completed Comprehensive Annual Finance Report in accordance with GFOA standards. Implemented multi‐lingual greeters at City Hall in Constituent Service’s department and the City Clerk’s office. Ongoing capital improvements on streets, sidewalks and city infrastructure to maintain and increase value of community. Implemented effective and cohesive Constitute Service department. Received Distinguished Budget Presentation Award. Received a Certificate of Achievement for Excellence in Financial Reporting from the GFOA.
Received a confirmation of Standard & Poor’s bond rating citing strong management and solid financial policies and practices. Established formal written policies and procedures for purchasing,
accounting and financial operations.
Other Accomplishments
Boston Globe Magazine named Everett one of the Top 10 spots to live. Boston Business Journal named Everett the most diverse city in the
Commonwealth.
111
Robert Wood Johnson Foundation awarded Everett the Culture of Health Prize. The Massachusetts Municipal Association presented Everett with the Kenneth E. Pickard Municipal Innovation award for the
City’s Health & Wellness Center. Massachusetts Gaming Commission awarded Everett a $150,000 grant to extend the Northern Strand Community bike trail. Received a $27,000 grant from the Commonwealth of Massachusetts to streamline snow operations. Established Everett Police Community Partnership Council. Completed several planning studies. Implemented online permitting. Top performing urban schools, with a graduation rate of 85% and low dropout rate at 3.2% Broke ground on Wynn Resort – the largest private development in New England.
FY 2017: Goals & Objectives
To begin design, renovation and construction for the parks projects under our Capital Improvement Projects.
To implement “311” system for the City before FY2017 end. Continue reorganization of departmental staff to more efficiently deliver services. Current
projects are Finance and the newly created Election Commission. Continue Master Planning process. Bring in new technology to make government more efficient and accessible. Document historical properties throughout the city. Implement branding and marketing campaign. Continue to build upon Everett’s development. To present our FY17 budget to GFOA for Distinguished Budget Award. Pass and implement Inclusionary Zoning Ordinance. Promote construction and hospitality jobs for local residents. Continue to respond to constituent requests and inquiries quickly and effectively.
112
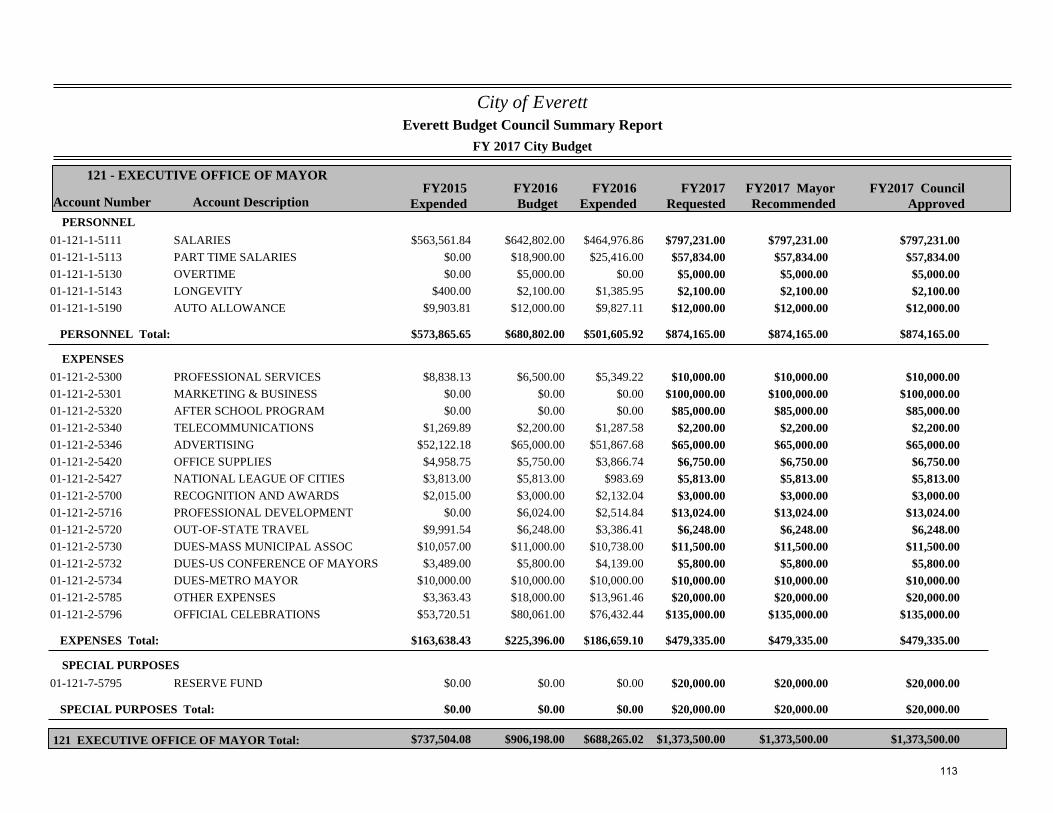
City of Everett
FY 2017 City Budget
Account Number Account DescriptionFY2015
ExpendedFY2016Budget
FY2017Requested
121 - EXECUTIVE OFFICE OF MAYOR
Everett Budget Council Summary Report
FY2017 MayorRecommended
FY2016Expended
FY2017 CouncilApproved
PERSONNEL$563,561.84 $642,802.00 $797,231.0001-121-1-5111 SALARIES $464,976.86 $797,231.00 $797,231.00
$0.00 $18,900.00 $57,834.0001-121-1-5113 PART TIME SALARIES $25,416.00 $57,834.00 $57,834.00$0.00 $5,000.00 $5,000.0001-121-1-5130 OVERTIME $0.00 $5,000.00 $5,000.00
$400.00 $2,100.00 $2,100.0001-121-1-5143 LONGEVITY $1,385.95 $2,100.00 $2,100.00$9,903.81 $12,000.00 $12,000.0001-121-1-5190 AUTO ALLOWANCE $9,827.11 $12,000.00 $12,000.00
PERSONNEL Total: $573,865.65 $680,802.00 $874,165.00$501,605.92 $874,165.00 $874,165.00
EXPENSES$8,838.13 $6,500.00 $10,000.0001-121-2-5300 PROFESSIONAL SERVICES $5,349.22 $10,000.00 $10,000.00
$0.00 $0.00 $100,000.0001-121-2-5301 MARKETING & BUSINESS $0.00 $100,000.00 $100,000.00$0.00 $0.00 $85,000.0001-121-2-5320 AFTER SCHOOL PROGRAM $0.00 $85,000.00 $85,000.00
$1,269.89 $2,200.00 $2,200.0001-121-2-5340 TELECOMMUNICATIONS $1,287.58 $2,200.00 $2,200.00$52,122.18 $65,000.00 $65,000.0001-121-2-5346 ADVERTISING $51,867.68 $65,000.00 $65,000.00$4,958.75 $5,750.00 $6,750.0001-121-2-5420 OFFICE SUPPLIES $3,866.74 $6,750.00 $6,750.00$3,813.00 $5,813.00 $5,813.0001-121-2-5427 NATIONAL LEAGUE OF CITIES $983.69 $5,813.00 $5,813.00$2,015.00 $3,000.00 $3,000.0001-121-2-5700 RECOGNITION AND AWARDS $2,132.04 $3,000.00 $3,000.00
$0.00 $6,024.00 $13,024.0001-121-2-5716 PROFESSIONAL DEVELOPMENT $2,514.84 $13,024.00 $13,024.00$9,991.54 $6,248.00 $6,248.0001-121-2-5720 OUT-OF-STATE TRAVEL $3,386.41 $6,248.00 $6,248.00
$10,057.00 $11,000.00 $11,500.0001-121-2-5730 DUES-MASS MUNICIPAL ASSOC $10,738.00 $11,500.00 $11,500.00$3,489.00 $5,800.00 $5,800.0001-121-2-5732 DUES-US CONFERENCE OF MAYORS $4,139.00 $5,800.00 $5,800.00
$10,000.00 $10,000.00 $10,000.0001-121-2-5734 DUES-METRO MAYOR $10,000.00 $10,000.00 $10,000.00$3,363.43 $18,000.00 $20,000.0001-121-2-5785 OTHER EXPENSES $13,961.46 $20,000.00 $20,000.00
$53,720.51 $80,061.00 $135,000.0001-121-2-5796 OFFICIAL CELEBRATIONS $76,432.44 $135,000.00 $135,000.00
EXPENSES Total: $163,638.43 $225,396.00 $479,335.00$186,659.10 $479,335.00 $479,335.00
SPECIAL PURPOSES$0.00 $0.00 $20,000.0001-121-7-5795 RESERVE FUND $0.00 $20,000.00 $20,000.00
SPECIAL PURPOSES Total: $0.00 $0.00 $20,000.00$0.00 $20,000.00 $20,000.00
$737,504.08 $906,198.00 $1,373,500.00121 EXECUTIVE OFFICE OF MAYOR Total: $688,265.02 $1,373,500.00 $1,373,500.00
113
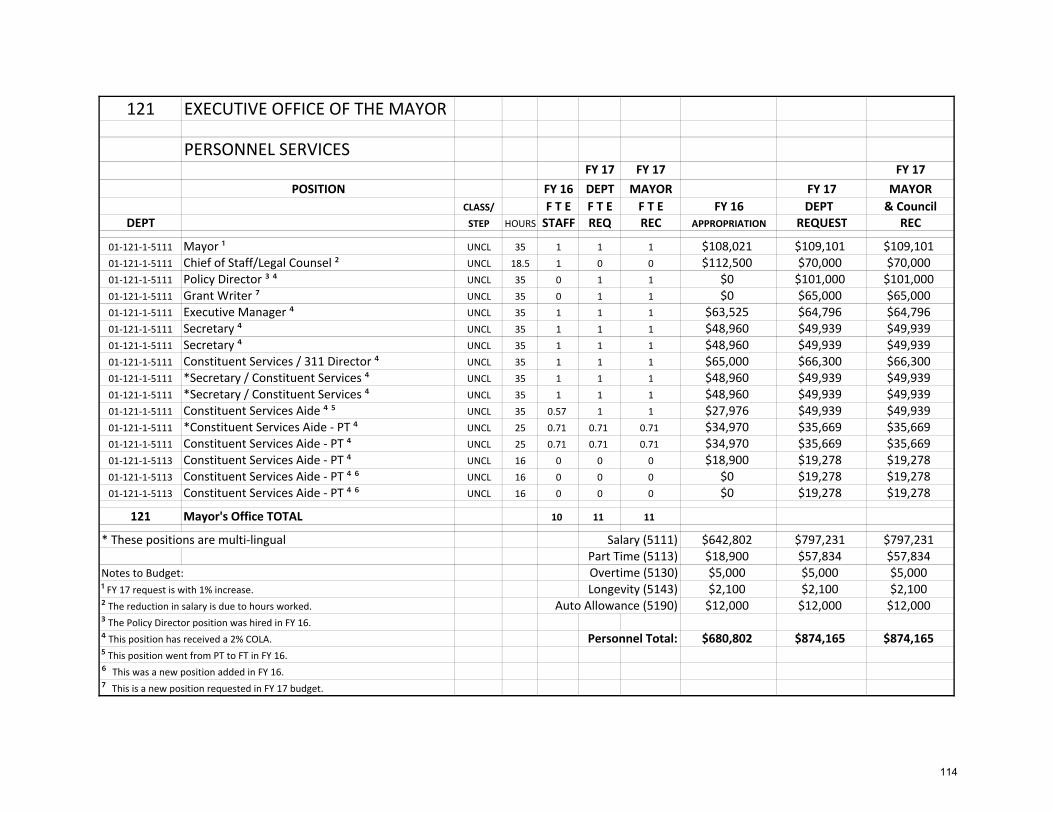
121 EXECUTIVE OFFICE OF THE MAYOR
PERSONNEL SERVICESFY 17 FY 17 FY 17
POSITION FY 16 DEPT MAYOR FY 17 MAYORCLASS/ F T E F T E F T E FY 16 DEPT & Council
DEPT STEP HOURS STAFF REQ REC APPROPRIATION REQUEST REC
01‐121‐1‐5111 Mayor ¹ UNCL 35 1 1 1 $108,021 $109,101 $109,10101‐121‐1‐5111 Chief of Staff/Legal Counsel ² UNCL 18.5 1 0 0 $112,500 $70,000 $70,00001‐121‐1‐5111 Policy Director ³ ⁴ UNCL 35 0 1 1 $0 $101,000 $101,00001‐121‐1‐5111 Grant Writer ⁷ UNCL 35 0 1 1 $0 $65,000 $65,00001‐121‐1‐5111 Executive Manager ⁴ UNCL 35 1 1 1 $63,525 $64,796 $64,79601‐121‐1‐5111 Secretary ⁴ UNCL 35 1 1 1 $48,960 $49,939 $49,93901‐121‐1‐5111 Secretary ⁴ UNCL 35 1 1 1 $48,960 $49,939 $49,93901‐121‐1‐5111 Constituent Services / 311 Director ⁴ UNCL 35 1 1 1 $65,000 $66,300 $66,30001‐121‐1‐5111 *Secretary / Constituent Services ⁴ UNCL 35 1 1 1 $48,960 $49,939 $49,93901‐121‐1‐5111 *Secretary / Constituent Services ⁴ UNCL 35 1 1 1 $48,960 $49,939 $49,93901‐121‐1‐5111 Constituent Services Aide ⁴ ⁵ UNCL 35 0.57 1 1 $27,976 $49,939 $49,93901‐121‐1‐5111 *Constituent Services Aide ‐ PT ⁴ UNCL 25 0.71 0.71 0.71 $34,970 $35,669 $35,66901‐121‐1‐5111 Constituent Services Aide ‐ PT ⁴ UNCL 25 0.71 0.71 0.71 $34,970 $35,669 $35,66901‐121‐1‐5113 Constituent Services Aide ‐ PT ⁴ UNCL 16 0 0 0 $18,900 $19,278 $19,27801‐121‐1‐5113 Constituent Services Aide ‐ PT ⁴ ⁶ UNCL 16 0 0 0 $0 $19,278 $19,27801‐121‐1‐5113 Constituent Services Aide ‐ PT ⁴ ⁶ UNCL 16 0 0 0 $0 $19,278 $19,278
121 Mayor's Office TOTAL 10 11 11
* These positions are multi‐lingual Salary (5111) $642,802 $797,231 $797,231Part Time (5113) $18,900 $57,834 $57,834
Notes to Budget: Overtime (5130) $5,000 $5,000 $5,000¹ FY 17 request is with 1% increase. Longevity (5143) $2,100 $2,100 $2,100² The reduction in salary is due to hours worked. Auto Allowance (5190) $12,000 $12,000 $12,000³ The Policy Director position was hired in FY 16.⁴ This position has received a 2% COLA. Personnel Total: $680,802 $874,165 $874,165⁵ This position went from PT to FT in FY 16.⁶ This was a new position added in FY 16.⁷ This is a new position requested in FY 17 budget.
114
Office of the Chief Financial Officer / City Auditor
Mission Statement
To provide a complete and accurate statement of the City’s financial condition by maintaining all of the City’s financial records in accordance with Massachusetts General Laws and the City Charter.
Significant Budget & Staffing Changes for FY 2017
48% increase due to: The salary increase for the CFO/City Auditor is contractual. In FY 17, we have moved 80% of the DPW Business Manager/Assistant City Solicitor’s salary into the Auditor’s budget. The Office of Budgeting has been accreted into the Auditor’s budget as well. The Assistant City Auditor position was hired at a salary less than what was budgeted in FY 16. The same is true for the Administrative Assistant position. There is one vacant position to date, the Finance/Budget Assistant. Finally, the Principal Clerk position went from part‐time to full‐time. Also, during FY 16, the contract for Local 25 Clerical was settled for FY 15 and FY 16. This accounts for the large jump in salaries for clerical and DPW based employees. Most salaries have been increased by 2% in the FY 17 budget.
The Office Supplies account, Printing of Budget Documents account and Professional Development account have all increased due to the Budget office moving into the Auditor’s budget. The Financial Software & Equipment account supports our contracts with SoftRight and Vadar.
FY 2016: Accomplishments
The city’s FY16 residential tax rate dropped from $14.61 per thousand dollars of valuation to $14.45 per thousand in the coming year. Additionally, FY16 commercial and industrial property tax rates dropped from $39.45 per thousand to $37.98 per thousand. These reductions were able to be achieved by the Mayor utilizing $1,000,000 of free cash and $800,000 from general stabilization funds.
115
In 2016, Standard and Poor’s, the city’s bond rating agency assigned an “AA” rating to the city’s 2016 general obligation (GO) municipal purpose loan bonds. Standard and Poor’s has given the city a “stable outlook” on its financial future reflecting on:
Very strong debt and contingent liability profile, due to low net debt and rapid amortization; Very strong liquidity, providing very strong cash to cover debt service and expenditures; Strong budgetary flexibility, with fiscal 2015 audited available reserves at 12.7% of general fund expenditures; Very strong debt and contingent liability position, with debt service carrying charges at 4.2% of expenditures and net direct
debt that is 35.9% of total governmental revenue, as well as low overall net debt at less than 3.0% of market value and rapid amortization, with 81.9% of debt scheduled to be retired in 10 years;
Strong institutional framework. Submitted a Comprehensive Annual Financial Report (CAFR) to the Government Finance Officers Association (GFOA) for
consideration and received their award of Excellence in Financial Reporting.
FY 2017: Goals & Objectives
To publish a “Financial Policy and Procedures” manual to formalize all internal policies and procedures for all Division of Finance departments. Conduct a city‐wide telecommunications audit. A telecommunications audit consists of a complete review of all telecom services that a telecom provider bills on a monthly basis and includes the validation that the telecom services billed are actually installed, being used and invoiced at the correct rates. The anticipated result will be cost savings and potential refunds for overcharges that may have occurred due to telecom provider errors along with optimization recommendations.
To work with the Treasurer and Human Resource Director to overhaul the current payroll process by eliminating the use of excel spreadsheets and having departments directly enter time and attendance into our existing payroll software, which will create efficiencies, formally track all vacation, sick, and personal leave accruals, and to maximize the capacity of existing software for management to centralize employee personnel data, history of compensation (both salary and fringe benefits) and accruals.
116
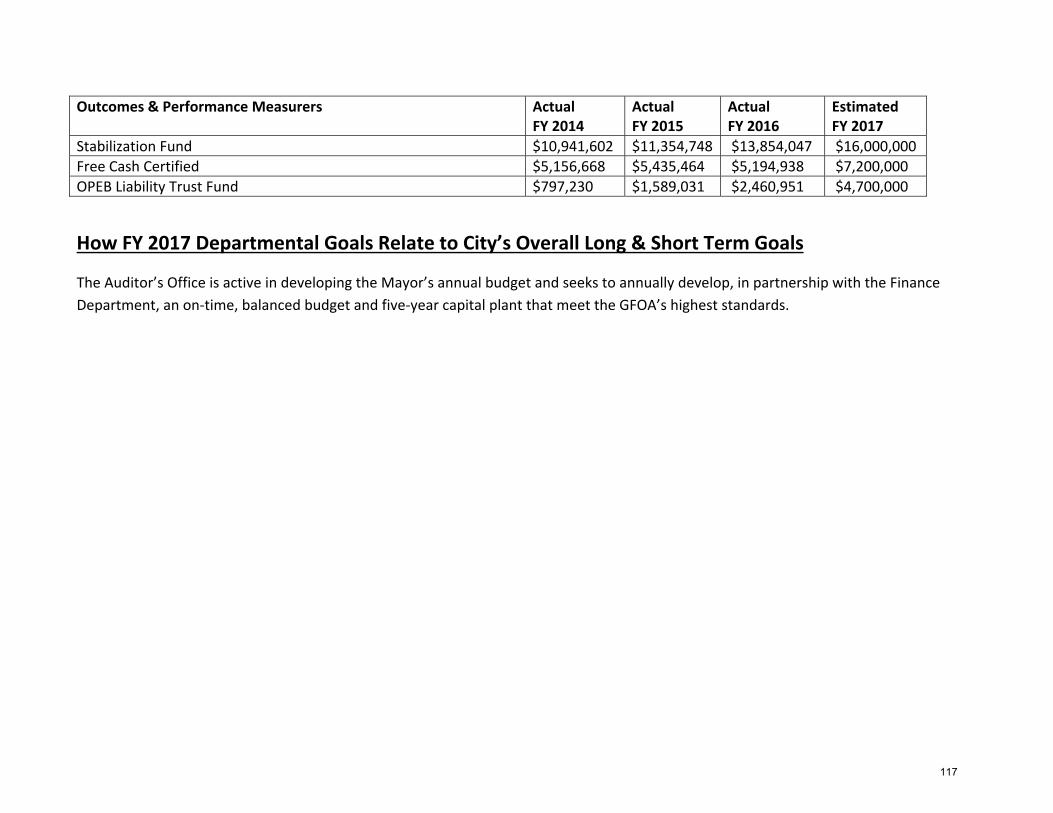
Outcomes & Performance Measurers Actual FY 2014
Actual FY 2015
Actual FY 2016
Estimated FY 2017
Stabilization Fund $10,941,602 $11,354,748 $13,854,047 $16,000,000 Free Cash Certified $5,156,668 $5,435,464 $5,194,938 $7,200,000 OPEB Liability Trust Fund $797,230 $1,589,031 $2,460,951 $4,700,000
How FY 2017 Departmental Goals Relate to City’s Overall Long & Short Term Goals
The Auditor’s Office is active in developing the Mayor’s annual budget and seeks to annually develop, in partnership with the Finance Department, an on‐time, balanced budget and five‐year capital plant that meet the GFOA’s highest standards.
117
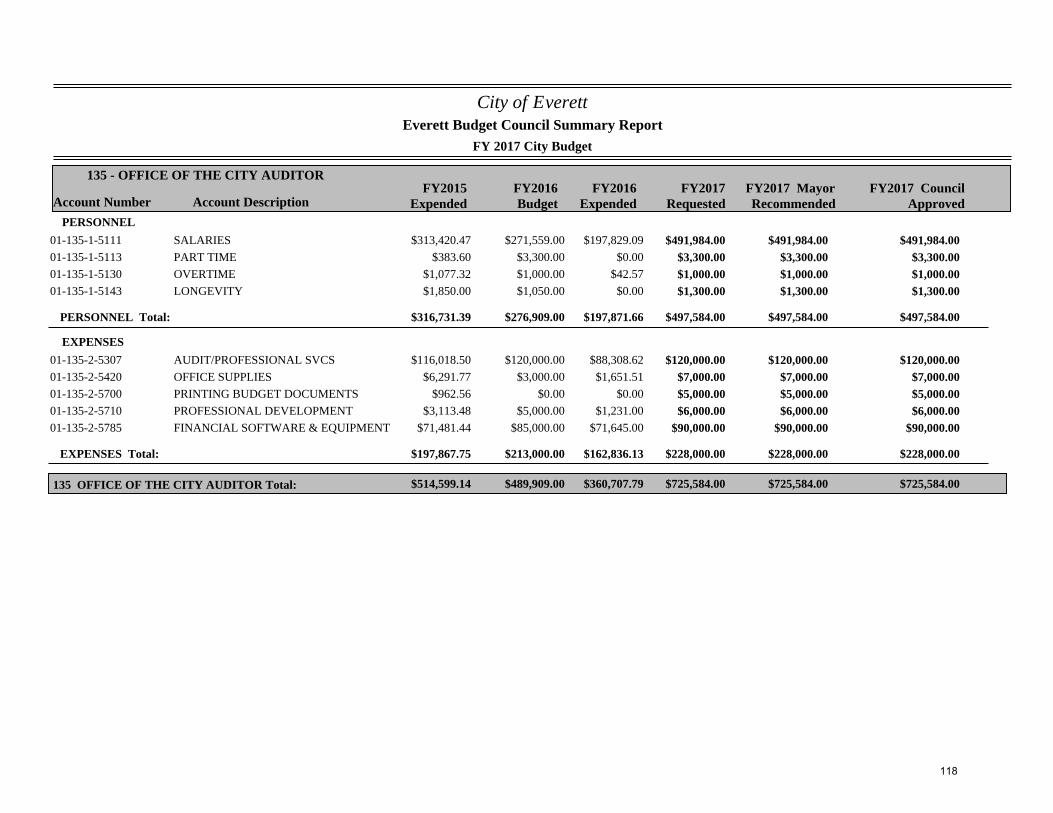
City of Everett
FY 2017 City Budget
Account Number Account DescriptionFY2015
ExpendedFY2016Budget
FY2017Requested
135 - OFFICE OF THE CITY AUDITOR
Everett Budget Council Summary Report
FY2017 MayorRecommended
FY2016Expended
FY2017 CouncilApproved
PERSONNEL$313,420.47 $271,559.00 $491,984.0001-135-1-5111 SALARIES $197,829.09 $491,984.00 $491,984.00
$383.60 $3,300.00 $3,300.0001-135-1-5113 PART TIME $0.00 $3,300.00 $3,300.00$1,077.32 $1,000.00 $1,000.0001-135-1-5130 OVERTIME $42.57 $1,000.00 $1,000.00$1,850.00 $1,050.00 $1,300.0001-135-1-5143 LONGEVITY $0.00 $1,300.00 $1,300.00
PERSONNEL Total: $316,731.39 $276,909.00 $497,584.00$197,871.66 $497,584.00 $497,584.00
EXPENSES$116,018.50 $120,000.00 $120,000.0001-135-2-5307 AUDIT/PROFESSIONAL SVCS $88,308.62 $120,000.00 $120,000.00
$6,291.77 $3,000.00 $7,000.0001-135-2-5420 OFFICE SUPPLIES $1,651.51 $7,000.00 $7,000.00$962.56 $0.00 $5,000.0001-135-2-5700 PRINTING BUDGET DOCUMENTS $0.00 $5,000.00 $5,000.00
$3,113.48 $5,000.00 $6,000.0001-135-2-5710 PROFESSIONAL DEVELOPMENT $1,231.00 $6,000.00 $6,000.00$71,481.44 $85,000.00 $90,000.0001-135-2-5785 FINANCIAL SOFTWARE & EQUIPMENT $71,645.00 $90,000.00 $90,000.00
EXPENSES Total: $197,867.75 $213,000.00 $228,000.00$162,836.13 $228,000.00 $228,000.00
$514,599.14 $489,909.00 $725,584.00135 OFFICE OF THE CITY AUDITOR Total: $360,707.79 $725,584.00 $725,584.00
118
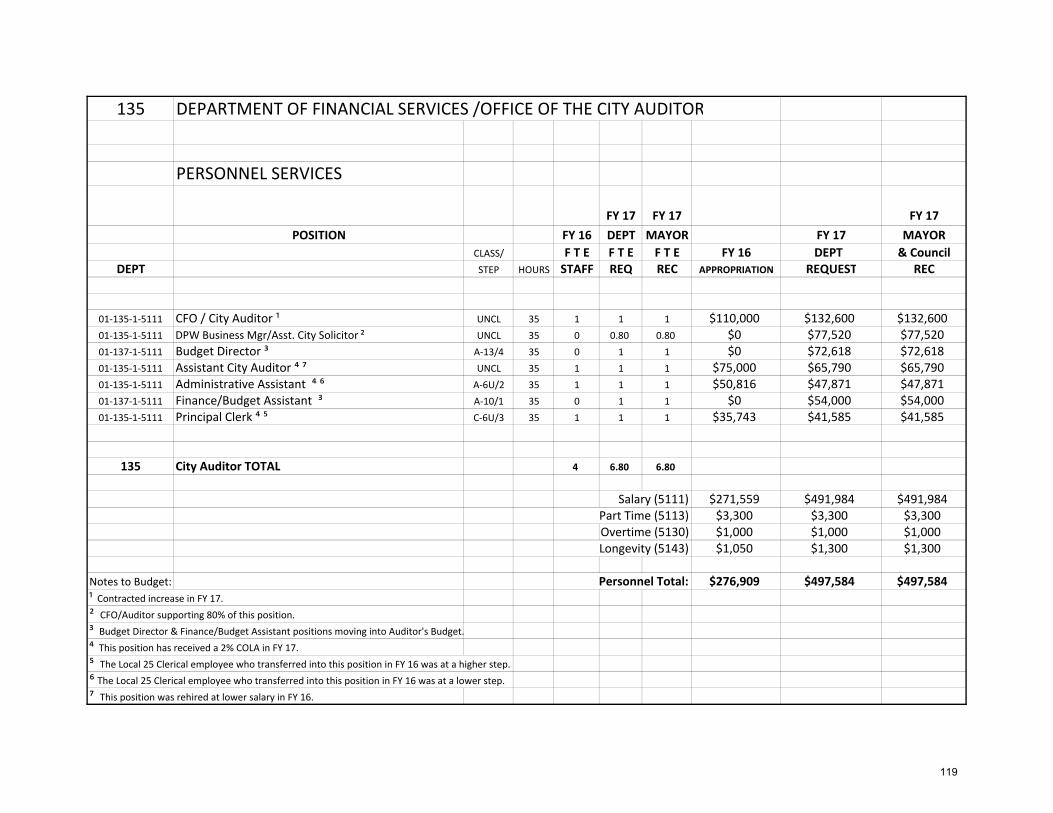
135 DEPARTMENT OF FINANCIAL SERVICES /OFFICE OF THE CITY AUDITOR
PERSONNEL SERVICES
FY 17 FY 17 FY 17POSITION FY 16 DEPT MAYOR FY 17 MAYOR
CLASS/ F T E F T E F T E FY 16 DEPT & CouncilDEPT STEP HOURS STAFF REQ REC APPROPRIATION REQUEST REC
01‐135‐1‐5111 CFO / City Auditor ¹ UNCL 35 1 1 1 $110,000 $132,600 $132,60001‐135‐1‐5111 DPW Business Mgr/Asst. City Solicitor ² UNCL 35 0 0.80 0.80 $0 $77,520 $77,52001‐137‐1‐5111 Budget Director ³ A‐13/4 35 0 1 1 $0 $72,618 $72,61801‐135‐1‐5111 Assistant City Auditor ⁴ ⁷ UNCL 35 1 1 1 $75,000 $65,790 $65,79001‐135‐1‐5111 Administrative Assistant ⁴ ⁶ A‐6U/2 35 1 1 1 $50,816 $47,871 $47,87101‐137‐1‐5111 Finance/Budget Assistant ³ A‐10/1 35 0 1 1 $0 $54,000 $54,00001‐135‐1‐5111 Principal Clerk ⁴ ⁵ C‐6U/3 35 1 1 1 $35,743 $41,585 $41,585
135 City Auditor TOTAL 4 6.80 6.80
Salary (5111) $271,559 $491,984 $491,984Part Time (5113) $3,300 $3,300 $3,300Overtime (5130) $1,000 $1,000 $1,000Longevity (5143) $1,050 $1,300 $1,300
Notes to Budget: Personnel Total: $276,909 $497,584 $497,584¹ Contracted increase in FY 17.² CFO/Auditor supporting 80% of this position.³ Budget Director & Finance/Budget Assistant positions moving into Auditor's Budget.⁴ This position has received a 2% COLA in FY 17.⁵ The Local 25 Clerical employee who transferred into this position in FY 16 was at a higher step.⁶ The Local 25 Clerical employee who transferred into this position in FY 16 was at a lower step.⁷ This position was rehired at lower salary in FY 16.
119
Office of Budgeting
Mission Statement
To implement exemplary budget practices, including the development, delivery and administration of the City’s operating, capital, and enterprise fund budgets, for the citizens and other stakeholders of the City.
Significant Budget & Staffing Changes for FY 2017
We have accreted the Office of Budgeting accounts under the Auditor’s office. This will allow the sharing of available support staff.
FY 2016: Accomplishments
Received the “Distinguished Budget Presentation Award” from the Government Finance Officers Association (GFOA), which is the highest form of recognition of governmental budgeting.
Enhanced the newly redesigned City website to allow the citizens and stakeholders the ability to access budget documents and to better understand the role of the budget department.
Implemented monthly budget meetings with department heads per the administrative code to review and project both revenue and expenditure trends to ensure that revenue benchmarks are reached and appropriations are sufficient. Ongoing.
FY 2017: Goals & Objectives
Hire a Finance/Budget Assistant to further improve upon all budgeting, reporting, and other initiatives as directed by the administration.
Analyze spending trends with department heads to research opportunities to collectively purchase goods and services at a discounted rate and to ensure that procurement requirements are being adhered to per Massachusetts General Laws.
Assist Mayor’s office and Auditor’s office in presenting a budget that meets the stringent guidelines of the GFOA.
120
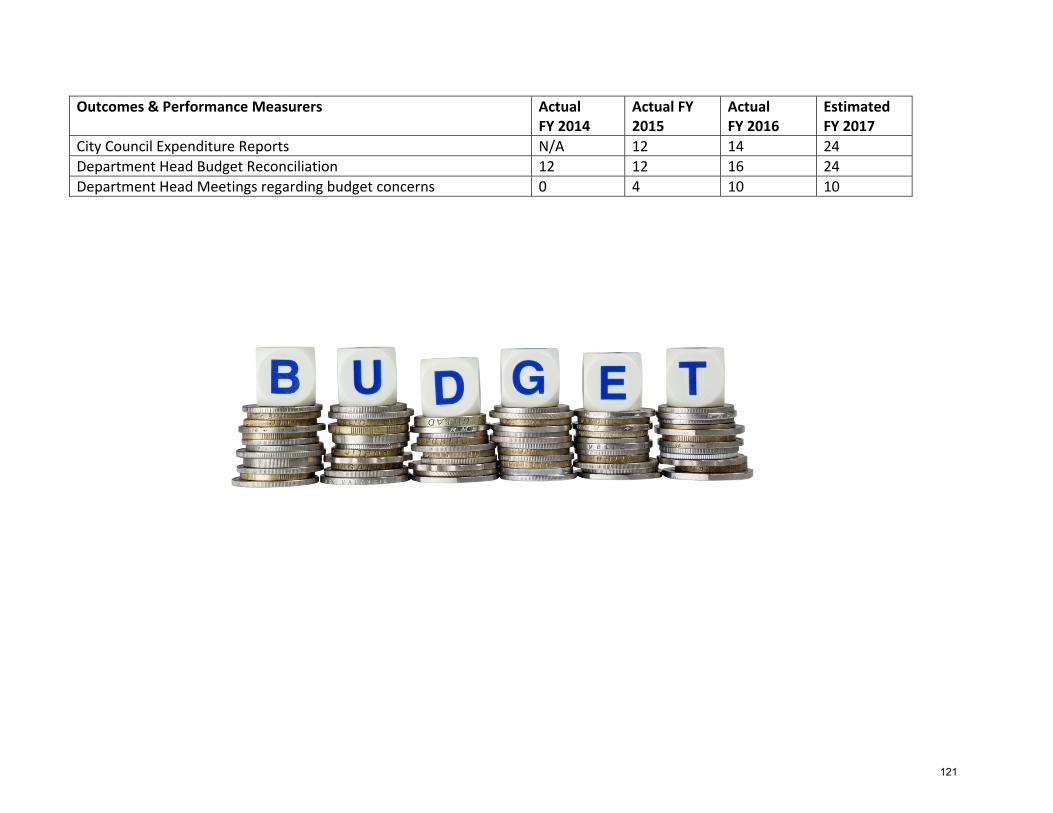
Outcomes & Performance Measurers Actual FY 2014
Actual FY 2015
Actual FY 2016
Estimated FY 2017
City Council Expenditure Reports N/A 12 14 24 Department Head Budget Reconciliation 12 12 16 24 Department Head Meetings regarding budget concerns 0 4 10 10
121
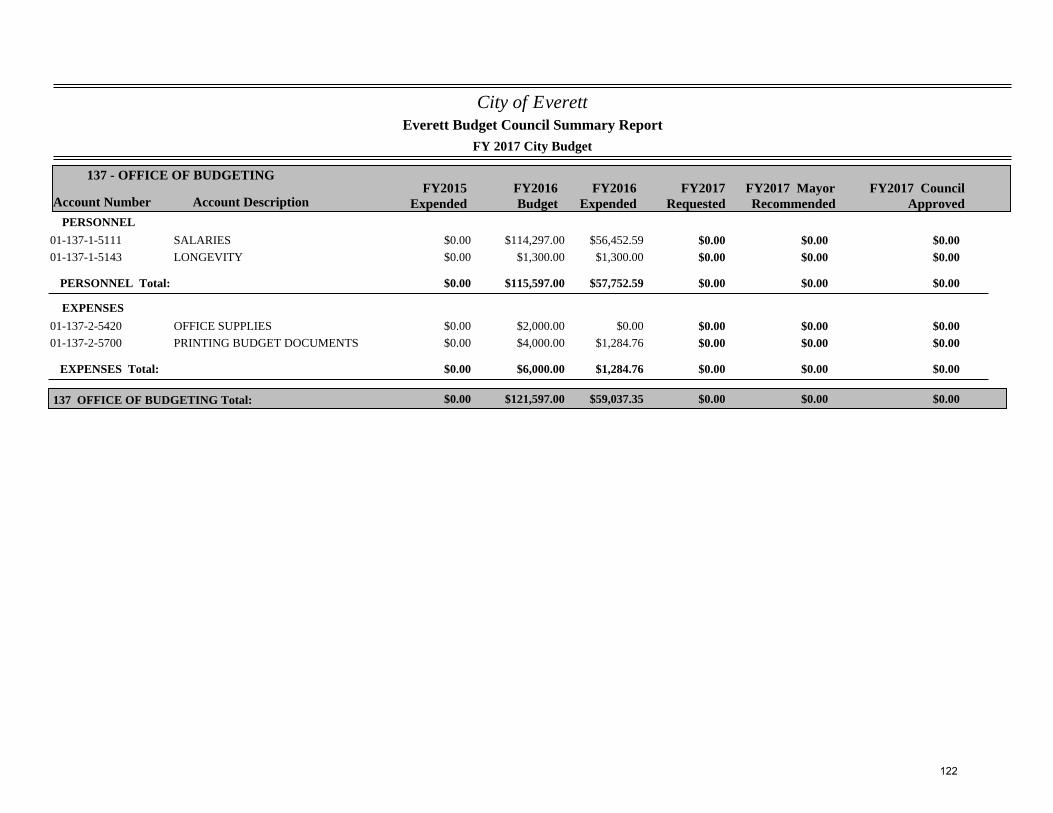
City of Everett
FY 2017 City Budget
Account Number Account DescriptionFY2015
ExpendedFY2016Budget
FY2017Requested
137 - OFFICE OF BUDGETING
Everett Budget Council Summary Report
FY2017 MayorRecommended
FY2016Expended
FY2017 CouncilApproved
PERSONNEL$0.00 $114,297.00 $0.0001-137-1-5111 SALARIES $56,452.59 $0.00 $0.00$0.00 $1,300.00 $0.0001-137-1-5143 LONGEVITY $1,300.00 $0.00 $0.00
PERSONNEL Total: $0.00 $115,597.00 $0.00$57,752.59 $0.00 $0.00
EXPENSES$0.00 $2,000.00 $0.0001-137-2-5420 OFFICE SUPPLIES $0.00 $0.00 $0.00$0.00 $4,000.00 $0.0001-137-2-5700 PRINTING BUDGET DOCUMENTS $1,284.76 $0.00 $0.00
EXPENSES Total: $0.00 $6,000.00 $0.00$1,284.76 $0.00 $0.00
$0.00 $121,597.00 $0.00137 OFFICE OF BUDGETING Total: $59,037.35 $0.00 $0.00
122
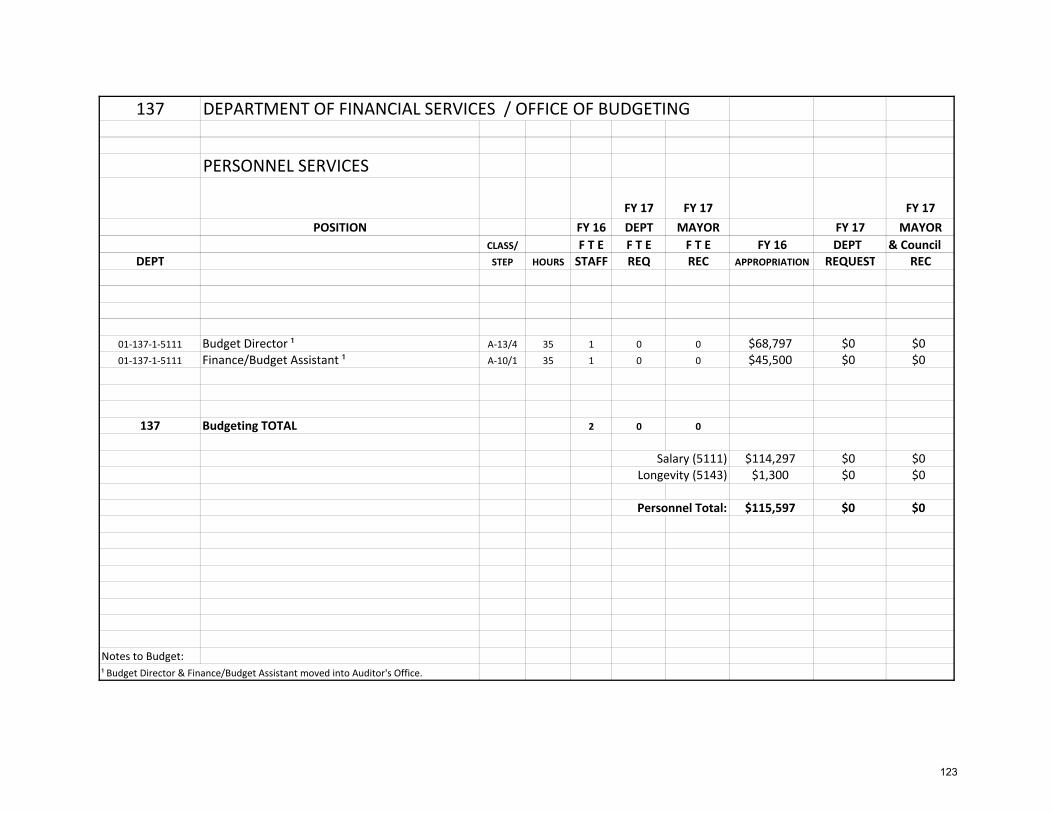
137 DEPARTMENT OF FINANCIAL SERVICES / OFFICE OF BUDGETING
PERSONNEL SERVICES
FY 17 FY 17 FY 17POSITION FY 16 DEPT MAYOR FY 17 MAYOR
CLASS/ F T E F T E F T E FY 16 DEPT & CouncilDEPT STEP HOURS STAFF REQ REC APPROPRIATION REQUEST REC
01‐137‐1‐5111 Budget Director ¹ A‐13/4 35 1 0 0 $68,797 $0 $001‐137‐1‐5111 Finance/Budget Assistant ¹ A‐10/1 35 1 0 0 $45,500 $0 $0
137 Budgeting TOTAL 2 0 0
Salary (5111) $114,297 $0 $0Longevity (5143) $1,300 $0 $0
Personnel Total: $115,597 $0 $0
Notes to Budget:¹ Budget Director & Finance/Budget Assistant moved into Auditor's Office.
123
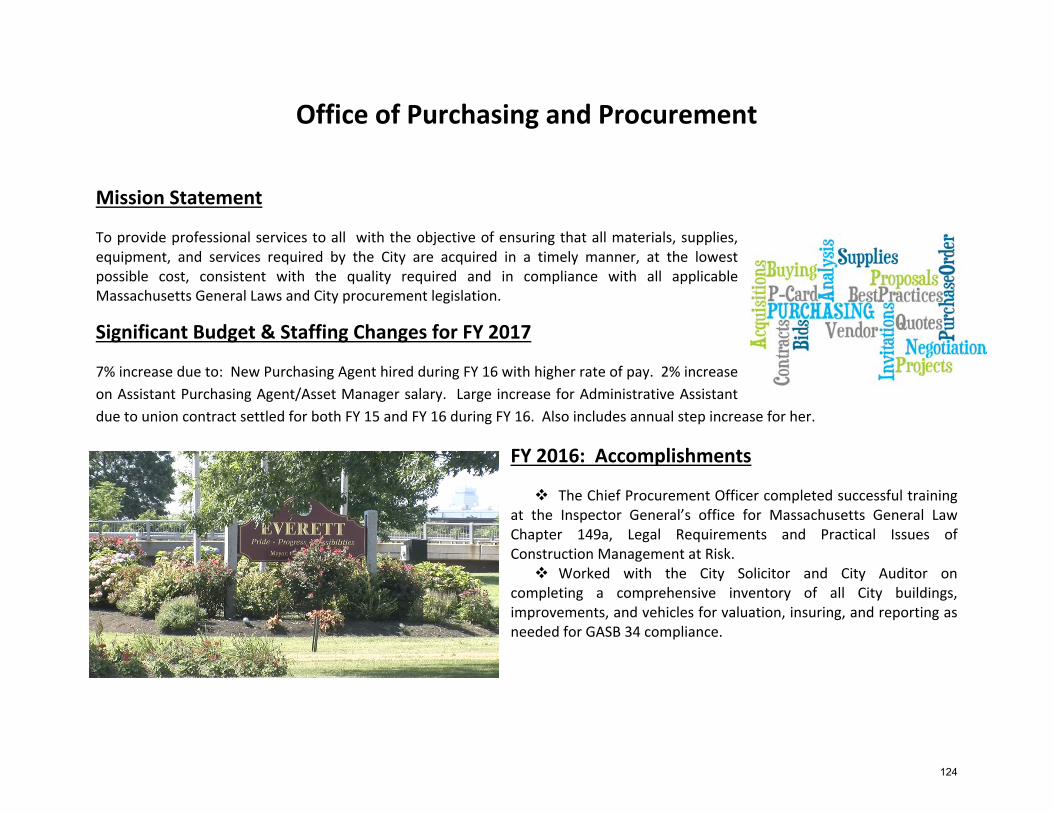
Office of Purchasing and Procurement
Mission Statement
To provide professional services to all with the objective of ensuring that all materials, supplies, equipment, and services required by the City are acquired in a timely manner, at the lowest possible cost, consistent with the quality required and in compliance with all applicable Massachusetts General Laws and City procurement legislation.
Significant Budget & Staffing Changes for FY 2017
7% increase due to: New Purchasing Agent hired during FY 16 with higher rate of pay. 2% increase on Assistant Purchasing Agent/Asset Manager salary. Large increase for Administrative Assistant due to union contract settled for both FY 15 and FY 16 during FY 16. Also includes annual step increase for her.
FY 2016: Accomplishments
The Chief Procurement Officer completed successful training at the Inspector General’s office for Massachusetts General Law Chapter 149a, Legal Requirements and Practical Issues of Construction Management at Risk. Worked with the City Solicitor and City Auditor on
completing a comprehensive inventory of all City buildings, improvements, and vehicles for valuation, insuring, and reporting as needed for GASB 34 compliance.
124
FY 2017: Goals & Objectives
To update and distribute a comprehensive “Procurement Policy and Procedures” manual for distribution to all city departments.
To research all statewide and local collaborates for purposes of streamlining purchases of goods and services that would otherwise have to be put out to bid separately. Group purchasing through collaborative often results in greater cost savings and a more efficient process.
To streamline the contract administration and distribution process to significantly decrease the amount of time it takes to create and distribute contracts.
Outcomes & Performance Measurers Actual FY 2014
Actual FY 2015
Estimated FY 2016
Estimated FY 2017
Purchase Orders *TBD Surplus items auctioned ($) *TBD Invitations to Bid and Requests for Proposals *TBD *Purchasing Director has recently been hired. He has been collecting data and will be able to show results in FY2018 budget.
125
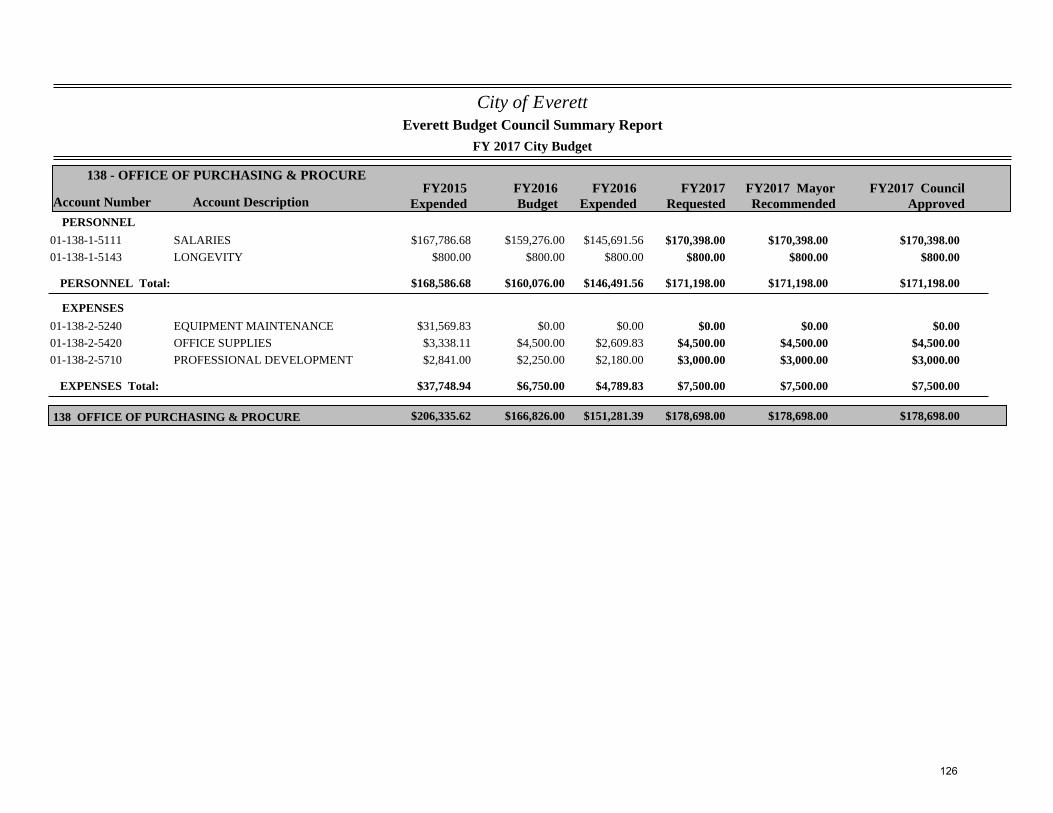
City of Everett
FY 2017 City Budget
Account Number Account DescriptionFY2015
ExpendedFY2016Budget
FY2017Requested
138 - OFFICE OF PURCHASING & PROCURE
Everett Budget Council Summary Report
FY2017 MayorRecommended
FY2016Expended
FY2017 CouncilApproved
PERSONNEL$167,786.68 $159,276.00 $170,398.0001-138-1-5111 SALARIES $145,691.56 $170,398.00 $170,398.00
$800.00 $800.00 $800.0001-138-1-5143 LONGEVITY $800.00 $800.00 $800.00
PERSONNEL Total: $168,586.68 $160,076.00 $171,198.00$146,491.56 $171,198.00 $171,198.00
EXPENSES$31,569.83 $0.00 $0.0001-138-2-5240 EQUIPMENT MAINTENANCE $0.00 $0.00 $0.00$3,338.11 $4,500.00 $4,500.0001-138-2-5420 OFFICE SUPPLIES $2,609.83 $4,500.00 $4,500.00$2,841.00 $2,250.00 $3,000.0001-138-2-5710 PROFESSIONAL DEVELOPMENT $2,180.00 $3,000.00 $3,000.00
EXPENSES Total: $37,748.94 $6,750.00 $7,500.00$4,789.83 $7,500.00 $7,500.00
$206,335.62 $166,826.00 $178,698.00138 OFFICE OF PURCHASING & PROCURE $151,281.39 $178,698.00 $178,698.00
126
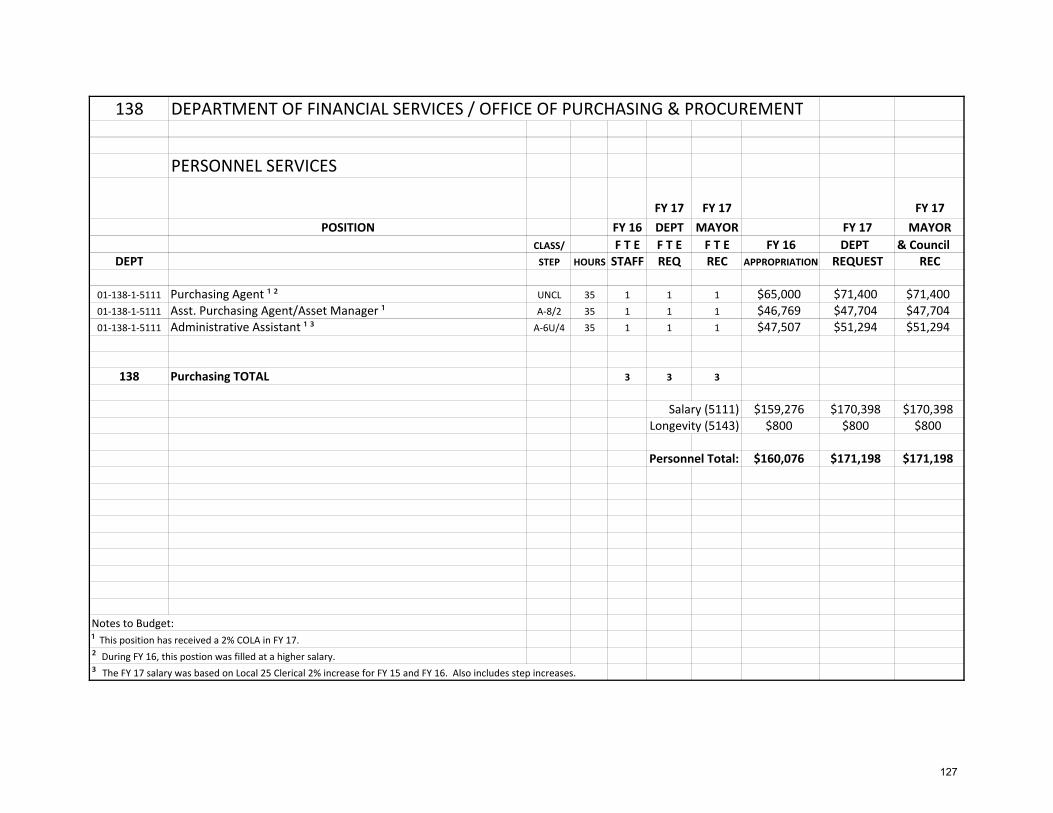
138 DEPARTMENT OF FINANCIAL SERVICES / OFFICE OF PURCHASING & PROCUREMENT
PERSONNEL SERVICES
FY 17 FY 17 FY 17POSITION FY 16 DEPT MAYOR FY 17 MAYOR
CLASS/ F T E F T E F T E FY 16 DEPT & CouncilDEPT STEP HOURS STAFF REQ REC APPROPRIATION REQUEST REC
01‐138‐1‐5111 Purchasing Agent ¹ ² UNCL 35 1 1 1 $65,000 $71,400 $71,40001‐138‐1‐5111 Asst. Purchasing Agent/Asset Manager ¹ A‐8/2 35 1 1 1 $46,769 $47,704 $47,70401‐138‐1‐5111 Administrative Assistant ¹ ³ A‐6U/4 35 1 1 1 $47,507 $51,294 $51,294
138 Purchasing TOTAL 3 3 3
Salary (5111) $159,276 $170,398 $170,398Longevity (5143) $800 $800 $800
Personnel Total: $160,076 $171,198 $171,198
Notes to Budget:¹ This position has received a 2% COLA in FY 17.² During FY 16, this postion was filled at a higher salary.³ The FY 17 salary was based on Local 25 Clerical 2% increase for FY 15 and FY 16. Also includes step increases.
127
Office of Assessing
Mission Statement
To produce an annual assessment roll including all assessable property in accordance with legal mandates in a timely, accurate, and efficient manner and provide current assessment‐related information to the public and to governmental agencies in a timely and responsive way.
Significant Budget & Staffing Changes for FY 2017
2% increase due to: After the retirement of our Assistant Assessor, the new replacement was hired at a higher salary. Large increases for union employees due to union contract settled for both FY 15 and FY 16 during FY 16. Also includes step increases for these union personnel and one clerk being reclassified. 2% increase on most salaries.
FY 2016: Accomplishments
Continued to list and re‐measure residential and commercial properties to maintain the most accurate information on condition of real estate in the City of Everett
Assessed Values are produced with a state‐of‐the‐art CAMA (Computer Assisted Mass Appraisal) system for residential and commercial properties. This proprietary system by Patriot Properties has provided taxpayers with better access to data by means of public research terminals and online. We have taken digital photographs of the overwhelming majority of properties in Everett and linked them to their property record cards. All taxpayers are able to obtain documents with descriptive information about their property along with a sketch and photograph.
128
FY 2017: Goals & Objectives
Staff will continue to provide taxpayer assistance workshops to answer general property valuation questions and provide forms for exemptions and/or abatements
Continue to improve the business personal property valuation system ensuring taxpayer confidence and equity
Outcomes & Performance Measurers Actual FY 2014
Actual FY 2015
Estimated FY 2016
Estimated FY 2017 *
Total Valuation of all Property $3,615,430,470 $4,009,259,197 $4,314,767,780 $4,712,879,424 Overlay Raised $2,070,922 $2,479,882 $1,984,858 $1,525,160 Total Accounts Assessed 9,434 9,575 9,719 9,710 Levy Ceiling $90,385,762 $100,231,480 $107,869,195 $117,821,986 *Preliminary Estimate
129
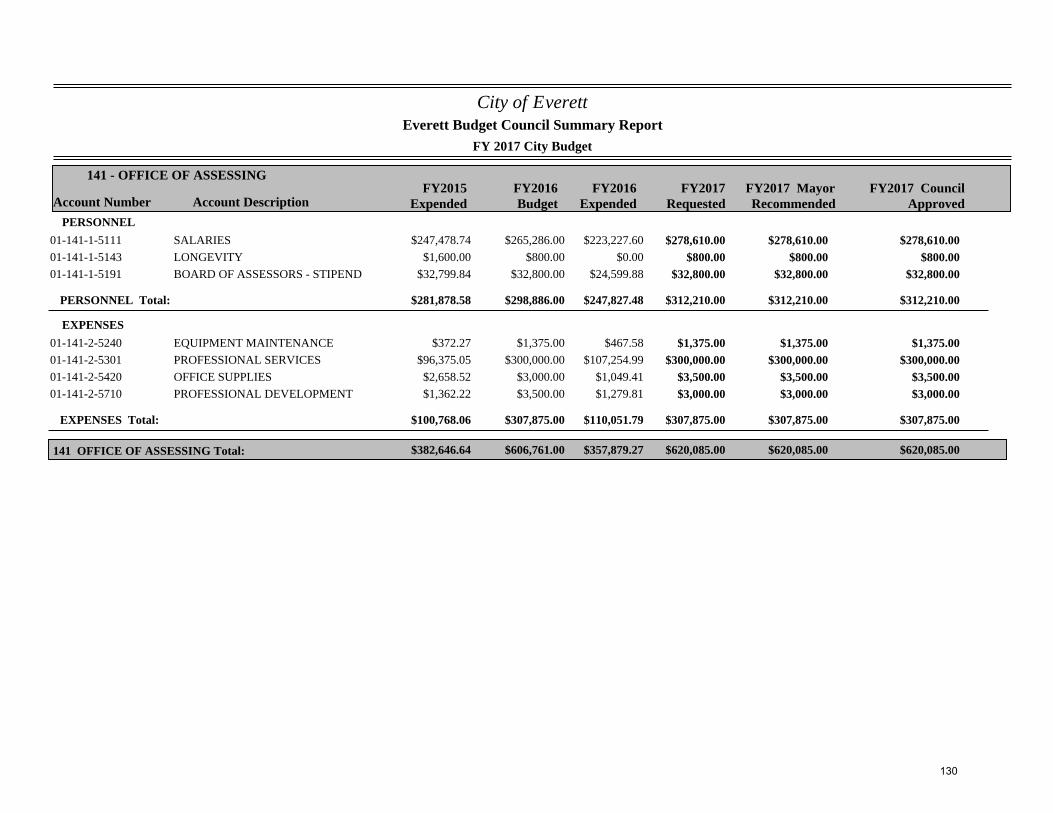
City of Everett
FY 2017 City Budget
Account Number Account DescriptionFY2015
ExpendedFY2016Budget
FY2017Requested
141 - OFFICE OF ASSESSING
Everett Budget Council Summary Report
FY2017 MayorRecommended
FY2016Expended
FY2017 CouncilApproved
PERSONNEL$247,478.74 $265,286.00 $278,610.0001-141-1-5111 SALARIES $223,227.60 $278,610.00 $278,610.00
$1,600.00 $800.00 $800.0001-141-1-5143 LONGEVITY $0.00 $800.00 $800.00$32,799.84 $32,800.00 $32,800.0001-141-1-5191 BOARD OF ASSESSORS - STIPEND $24,599.88 $32,800.00 $32,800.00
PERSONNEL Total: $281,878.58 $298,886.00 $312,210.00$247,827.48 $312,210.00 $312,210.00
EXPENSES$372.27 $1,375.00 $1,375.0001-141-2-5240 EQUIPMENT MAINTENANCE $467.58 $1,375.00 $1,375.00
$96,375.05 $300,000.00 $300,000.0001-141-2-5301 PROFESSIONAL SERVICES $107,254.99 $300,000.00 $300,000.00$2,658.52 $3,000.00 $3,500.0001-141-2-5420 OFFICE SUPPLIES $1,049.41 $3,500.00 $3,500.00$1,362.22 $3,500.00 $3,000.0001-141-2-5710 PROFESSIONAL DEVELOPMENT $1,279.81 $3,000.00 $3,000.00
EXPENSES Total: $100,768.06 $307,875.00 $307,875.00$110,051.79 $307,875.00 $307,875.00
$382,646.64 $606,761.00 $620,085.00141 OFFICE OF ASSESSING Total: $357,879.27 $620,085.00 $620,085.00
130
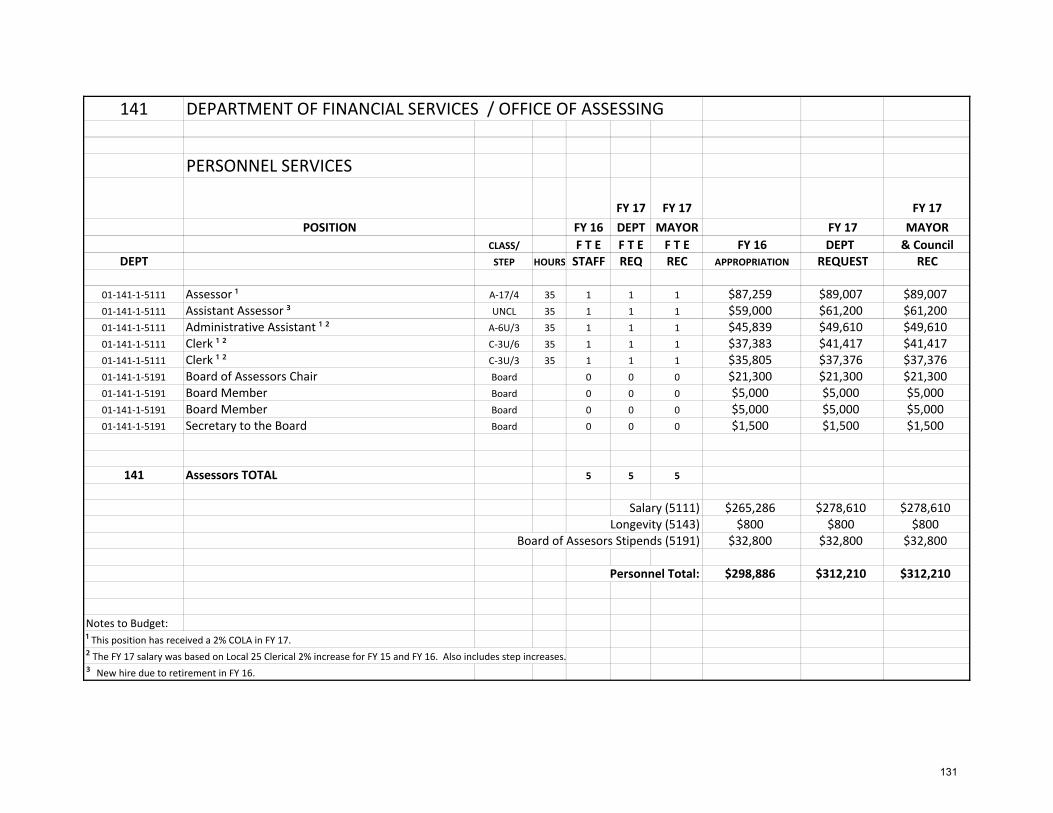
141 DEPARTMENT OF FINANCIAL SERVICES / OFFICE OF ASSESSING
PERSONNEL SERVICES
FY 17 FY 17 FY 17POSITION FY 16 DEPT MAYOR FY 17 MAYOR
CLASS/ F T E F T E F T E FY 16 DEPT & CouncilDEPT STEP HOURS STAFF REQ REC APPROPRIATION REQUEST REC
01‐141‐1‐5111 Assessor ¹ A‐17/4 35 1 1 1 $87,259 $89,007 $89,00701‐141‐1‐5111 Assistant Assessor ³ UNCL 35 1 1 1 $59,000 $61,200 $61,20001‐141‐1‐5111 Administrative Assistant ¹ ² A‐6U/3 35 1 1 1 $45,839 $49,610 $49,61001‐141‐1‐5111 Clerk ¹ ² C‐3U/6 35 1 1 1 $37,383 $41,417 $41,41701‐141‐1‐5111 Clerk ¹ ² C‐3U/3 35 1 1 1 $35,805 $37,376 $37,37601‐141‐1‐5191 Board of Assessors Chair Board 0 0 0 $21,300 $21,300 $21,30001‐141‐1‐5191 Board Member Board 0 0 0 $5,000 $5,000 $5,00001‐141‐1‐5191 Board Member Board 0 0 0 $5,000 $5,000 $5,00001‐141‐1‐5191 Secretary to the Board Board 0 0 0 $1,500 $1,500 $1,500
141 Assessors TOTAL 5 5 5
Salary (5111) $265,286 $278,610 $278,610Longevity (5143) $800 $800 $800
Board of Assesors Stipends (5191) $32,800 $32,800 $32,800
Personnel Total: $298,886 $312,210 $312,210
Notes to Budget:¹ This position has received a 2% COLA in FY 17.² The FY 17 salary was based on Local 25 Clerical 2% increase for FY 15 and FY 16. Also includes step increases.³ New hire due to retirement in FY 16.
131
Office of Treasurer‐Collector
Mission Statement
Treasurer: To serve the taxpayers, employees, and vendors of the City of Everett in a fair, consistent and professional manner and to manage the City’s money to maximize investment income while minimizing risk.
Collector: To provide professional and quality customer service to the citizens and taxpayers of Everett.
Significant Budget & Staffing Changes for FY 2017
11% increase due to: The City’s Treasurer/Collector’s salary has been adjusted to reflect the salary study performed by the Collins Center. Large increases for union employees due to union contract settled for both FY 15 and FY 16 during FY 16. Also includes step increases for these union personnel and one clerk being reclassified. 2% increase on most salaries.
Recording Fees are expected to be high in FY 17. This is about $75 per deed and we expect about 400 deeds this fiscal year. The account Other Charges includes Century Bank lockbox fees, the cost of credit card fees with the implementation of residents paying bills with credit cards and for the costs associated with the city‐wide parking sticker program.
FY 2016: Accomplishments
Turnover of all FY 14 and FY 15 delinquent taxes to Tax Title. This quick turnover helped increase cash balances and decrease receivables, helping boost free cash
Installation of a check scanner in the Treasurer’s office for mobile deposit of all checks received. Deposits hit out account immediately and taxpayer checks clear quickly. This results in better taxpayer service and more efficient collection procedures
132
Completion of the Annual Audit on time. All records required by Powers and Sullivan were turned over by August 2015 Successful implementation of credit card processing in the Collector’s office and the
Health and Wellness Center. This gives taxpayers another option when making a payment Continued cross‐training of clerical staff between Treasurer, Collector and Parking
departments to help keep up with the demands of the respective departments as needed due to yearly cycles. Several new employees were trained in new positions in each office
FY 2017: Goals & Objectives
To fully integrate the software for parking enforcement and collections into the current SoftRight Accounts Payable and Collection Module so that all transactions from the Collector’s office to the Treasurer’s office will be fully automated for a more efficient process. Parking ticket collections and enforcement will be put out to bid to streamline and modernize both applications
Turnover of all FY2016 delinquent taxes to Tax Title before December 31, 2016. This quick turnover will help increase cash balances and decrease receivables, helping boost free cash for FY2018
Close out and balance all bank accounts by August 2016 so the Annual Audit can be completed on schedule Implement credit card processing for all types of payments. Continue to expand the program to cover more departments
Outcomes & Performance Measurers Actual FY 2014
Actual FY 2015
Estimated FY 2016
Estimated FY 2017
Tax Title Collected $1,800,921 $1,146,627 $1,150,000 $1,200,000 Revenue Processed $219,981,297 $224,196,291 $230,000,000 $240,000,000 Payrolls Processed $101,136,817 $101,580,969 $106,000,000 $112,000,000 Bank Accounts Reconciled 70 71 74 75
133
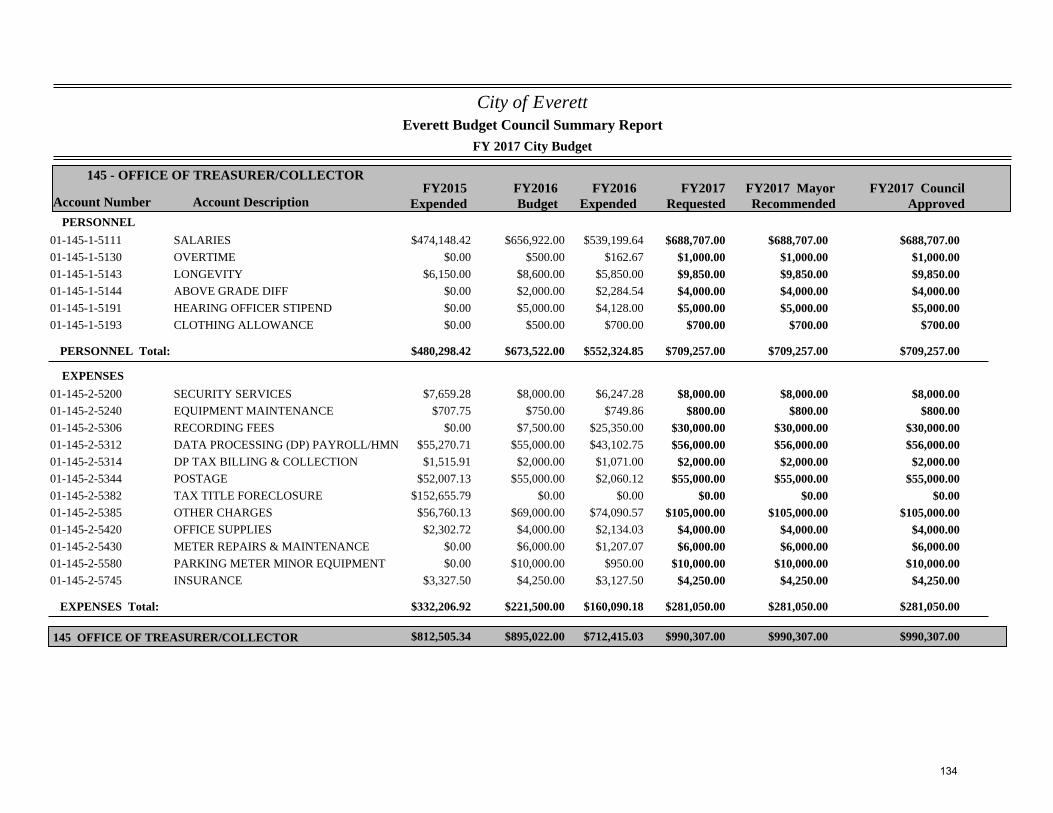
City of Everett
FY 2017 City Budget
Account Number Account DescriptionFY2015
ExpendedFY2016Budget
FY2017Requested
145 - OFFICE OF TREASURER/COLLECTOR
Everett Budget Council Summary Report
FY2017 MayorRecommended
FY2016Expended
FY2017 CouncilApproved
PERSONNEL$474,148.42 $656,922.00 $688,707.0001-145-1-5111 SALARIES $539,199.64 $688,707.00 $688,707.00
$0.00 $500.00 $1,000.0001-145-1-5130 OVERTIME $162.67 $1,000.00 $1,000.00$6,150.00 $8,600.00 $9,850.0001-145-1-5143 LONGEVITY $5,850.00 $9,850.00 $9,850.00
$0.00 $2,000.00 $4,000.0001-145-1-5144 ABOVE GRADE DIFF $2,284.54 $4,000.00 $4,000.00$0.00 $5,000.00 $5,000.0001-145-1-5191 HEARING OFFICER STIPEND $4,128.00 $5,000.00 $5,000.00$0.00 $500.00 $700.0001-145-1-5193 CLOTHING ALLOWANCE $700.00 $700.00 $700.00
PERSONNEL Total: $480,298.42 $673,522.00 $709,257.00$552,324.85 $709,257.00 $709,257.00
EXPENSES$7,659.28 $8,000.00 $8,000.0001-145-2-5200 SECURITY SERVICES $6,247.28 $8,000.00 $8,000.00
$707.75 $750.00 $800.0001-145-2-5240 EQUIPMENT MAINTENANCE $749.86 $800.00 $800.00$0.00 $7,500.00 $30,000.0001-145-2-5306 RECORDING FEES $25,350.00 $30,000.00 $30,000.00
$55,270.71 $55,000.00 $56,000.0001-145-2-5312 DATA PROCESSING (DP) PAYROLL/HMN $43,102.75 $56,000.00 $56,000.00$1,515.91 $2,000.00 $2,000.0001-145-2-5314 DP TAX BILLING & COLLECTION $1,071.00 $2,000.00 $2,000.00
$52,007.13 $55,000.00 $55,000.0001-145-2-5344 POSTAGE $2,060.12 $55,000.00 $55,000.00$152,655.79 $0.00 $0.0001-145-2-5382 TAX TITLE FORECLOSURE $0.00 $0.00 $0.00
$56,760.13 $69,000.00 $105,000.0001-145-2-5385 OTHER CHARGES $74,090.57 $105,000.00 $105,000.00$2,302.72 $4,000.00 $4,000.0001-145-2-5420 OFFICE SUPPLIES $2,134.03 $4,000.00 $4,000.00
$0.00 $6,000.00 $6,000.0001-145-2-5430 METER REPAIRS & MAINTENANCE $1,207.07 $6,000.00 $6,000.00$0.00 $10,000.00 $10,000.0001-145-2-5580 PARKING METER MINOR EQUIPMENT $950.00 $10,000.00 $10,000.00
$3,327.50 $4,250.00 $4,250.0001-145-2-5745 INSURANCE $3,127.50 $4,250.00 $4,250.00
EXPENSES Total: $332,206.92 $221,500.00 $281,050.00$160,090.18 $281,050.00 $281,050.00
$812,505.34 $895,022.00 $990,307.00145 OFFICE OF TREASURER/COLLECTOR $712,415.03 $990,307.00 $990,307.00
134
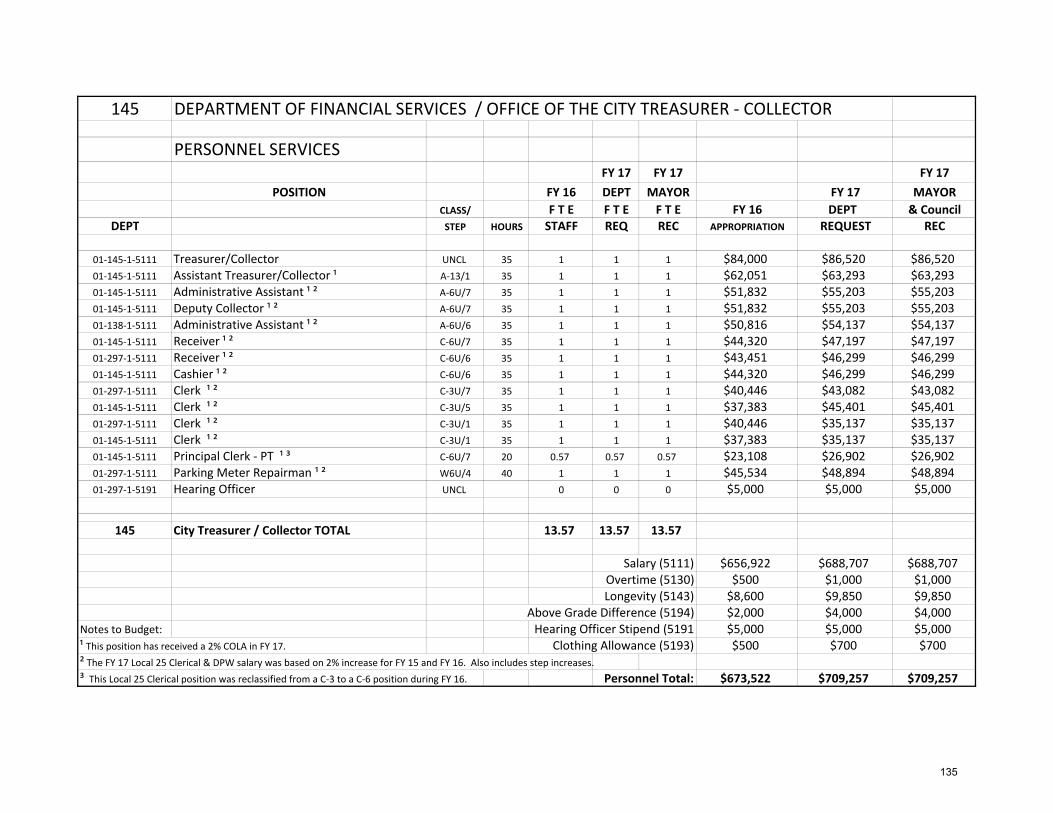
145 DEPARTMENT OF FINANCIAL SERVICES / OFFICE OF THE CITY TREASURER ‐ COLLECTOR
PERSONNEL SERVICESFY 17 FY 17 FY 17
POSITION FY 16 DEPT MAYOR FY 17 MAYORCLASS/ F T E F T E F T E FY 16 DEPT & Council
DEPT STEP HOURS STAFF REQ REC APPROPRIATION REQUEST REC
01‐145‐1‐5111 Treasurer/Collector UNCL 35 1 1 1 $84,000 $86,520 $86,52001‐145‐1‐5111 Assistant Treasurer/Collector ¹ A‐13/1 35 1 1 1 $62,051 $63,293 $63,29301‐145‐1‐5111 Administrative Assistant ¹ ² A‐6U/7 35 1 1 1 $51,832 $55,203 $55,20301‐145‐1‐5111 Deputy Collector ¹ ² A‐6U/7 35 1 1 1 $51,832 $55,203 $55,20301‐138‐1‐5111 Administrative Assistant ¹ ² A‐6U/6 35 1 1 1 $50,816 $54,137 $54,13701‐145‐1‐5111 Receiver ¹ ² C‐6U/7 35 1 1 1 $44,320 $47,197 $47,19701‐297‐1‐5111 Receiver ¹ ² C‐6U/6 35 1 1 1 $43,451 $46,299 $46,29901‐145‐1‐5111 Cashier ¹ ² C‐6U/6 35 1 1 1 $44,320 $46,299 $46,29901‐297‐1‐5111 Clerk ¹ ² C‐3U/7 35 1 1 1 $40,446 $43,082 $43,08201‐145‐1‐5111 Clerk ¹ ² C‐3U/5 35 1 1 1 $37,383 $45,401 $45,40101‐297‐1‐5111 Clerk ¹ ² C‐3U/1 35 1 1 1 $40,446 $35,137 $35,13701‐145‐1‐5111 Clerk ¹ ² C‐3U/1 35 1 1 1 $37,383 $35,137 $35,13701‐145‐1‐5111 Principal Clerk ‐ PT ¹ ³ C‐6U/7 20 0.57 0.57 0.57 $23,108 $26,902 $26,90201‐297‐1‐5111 Parking Meter Repairman ¹ ² W6U/4 40 1 1 1 $45,534 $48,894 $48,89401‐297‐1‐5191 Hearing Officer UNCL 0 0 0 $5,000 $5,000 $5,000
145 City Treasurer / Collector TOTAL 13.57 13.57 13.57
Salary (5111) $656,922 $688,707 $688,707Overtime (5130) $500 $1,000 $1,000Longevity (5143) $8,600 $9,850 $9,850
Above Grade Difference (5194) $2,000 $4,000 $4,000Notes to Budget: Hearing Officer Stipend (5191 $5,000 $5,000 $5,000¹ This position has received a 2% COLA in FY 17. Clothing Allowance (5193) $500 $700 $700² The FY 17 Local 25 Clerical & DPW salary was based on 2% increase for FY 15 and FY 16. Also includes step increases.³ This Local 25 Clerical position was reclassified from a C‐3 to a C‐6 position during FY 16. Personnel Total: $673,522 $709,257 $709,257
135
Office of the City Solicitor
Mission Statement
To provide representation and advice to the City and its officials in numerous areas including but not limited to: zoning issues, employment law, civil rights, civil service, contract actions, real estate, workers’ compensation, education law, tort actions involving personal injury and property damage claims. Members of the solicitor’s department regularly attend and provide advice at meetings of the City Council and sub‐committees thereof and to several City boards and commissions. In addition to drafting ordinances and other legal documents, numerous verbal and written opinions are rendered to the City Council and Department Heads.
Significant Budget & Staffing Changes for FY 2017
28% increase due to: The position of Assistant City Solicitor has been split. She is working in this office for 20% of her time and is working in the Auditor’s office (as DPW Business Manager) for 80% of her time. We have also upgraded the salary for the Paralegal position as she has successfully graduated the course of study to become a paralegal. A new position has been added – Housing Attorney. This person will assist the ISD in code enforcement violations. Most salaries have been increased by 2%.
The Litigation/Professional Services account was increased as we have entered into a contract with K & P, P.C. for outside legal services to aid in processing legal work. Due to the loss of time due to the Assistant Solicitor’s split, the city decided to retain outside legal services rather than hiring another employee. This will allow a cost savings in unfunded liabilities. Professional Development increased based on need. A new account Equipment & Other was created for a replacement conference table in the Meeting Room and for a desk for the City Solicitor.
136
FY 2016: Accomplishments
Successfully ratified several union contracts including New England Police Benevolent Association Local 94 and 95, IAFF Local 143, Teamsters Local 25 (DPW), Teamsters Local 25 (E‐911), Teamsters Local 25 (Clerical) and Civilian Parking Enforcement SEIU Local 888.
Managed claims against city with minimal damages paid outside of insurance policy. Defended law suits against the city and its Boards.
Defended the city in labor arbitration cases. Prepared contracts, license agreements and mutual aid agreements. Advised various boards and commissions re: state and local law and case law. Successfully negotiated a slight decrease in cost of insurance premiums with lower deductibles. Prepared opinions for City Council, Boards and Commissions. Worked with various departments on solicitations for bids and requests for proposals. Settled disputes with contractors on payments. Advised HR on various personnel matters. Investigated and advised departments on personnel infractions and prepared disciplinary documents.
FY 2017: Goals & Objectives
Successfully ratify all union contracts through FY 2020. Revise existing ordinances to address any inefficiency. Address local needs/neighborhood concerns. Successfully defend claims against city and its officer’s resources, including insurance coverage to defend claims. Continue to provide legal advisement to the city administration, all city departments, City Council and all subcommittees.
137
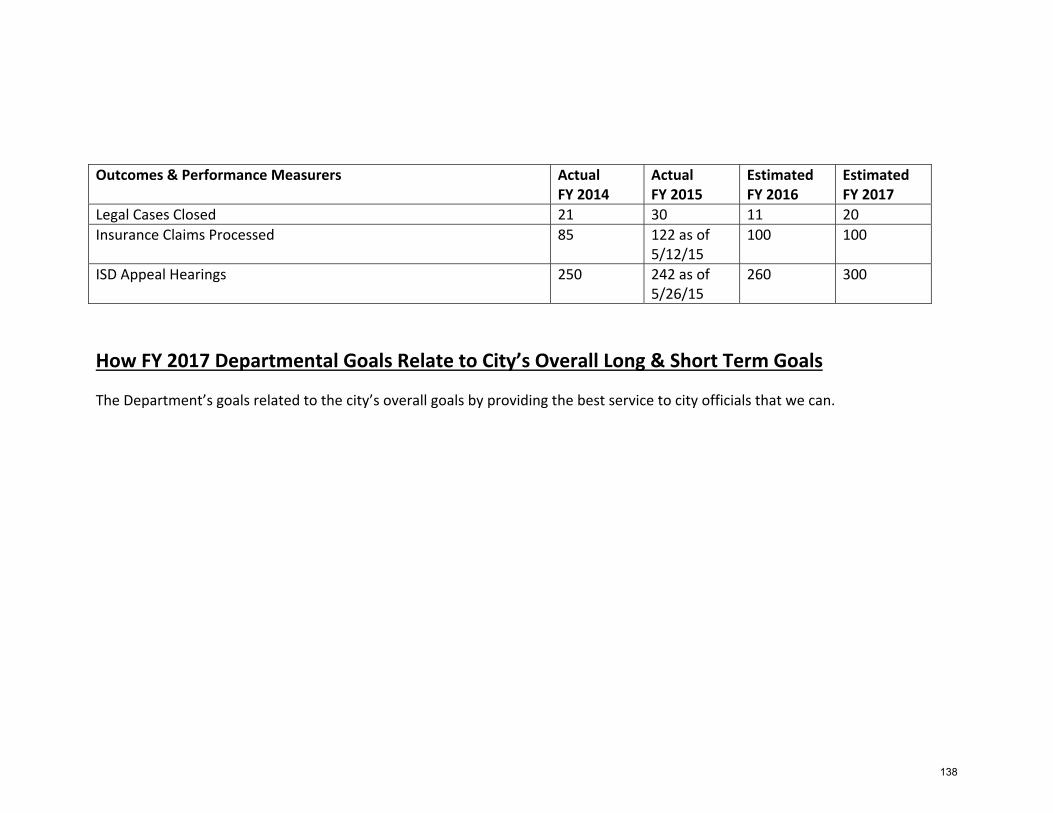
Outcomes & Performance Measurers Actual FY 2014
Actual FY 2015
Estimated FY 2016
Estimated FY 2017
Legal Cases Closed 21 30 11 20 Insurance Claims Processed 85 122 as of
5/12/15 100 100
ISD Appeal Hearings 250 242 as of 5/26/15
260 300
How FY 2017 Departmental Goals Relate to City’s Overall Long & Short Term Goals
The Department’s goals related to the city’s overall goals by providing the best service to city officials that we can.
138
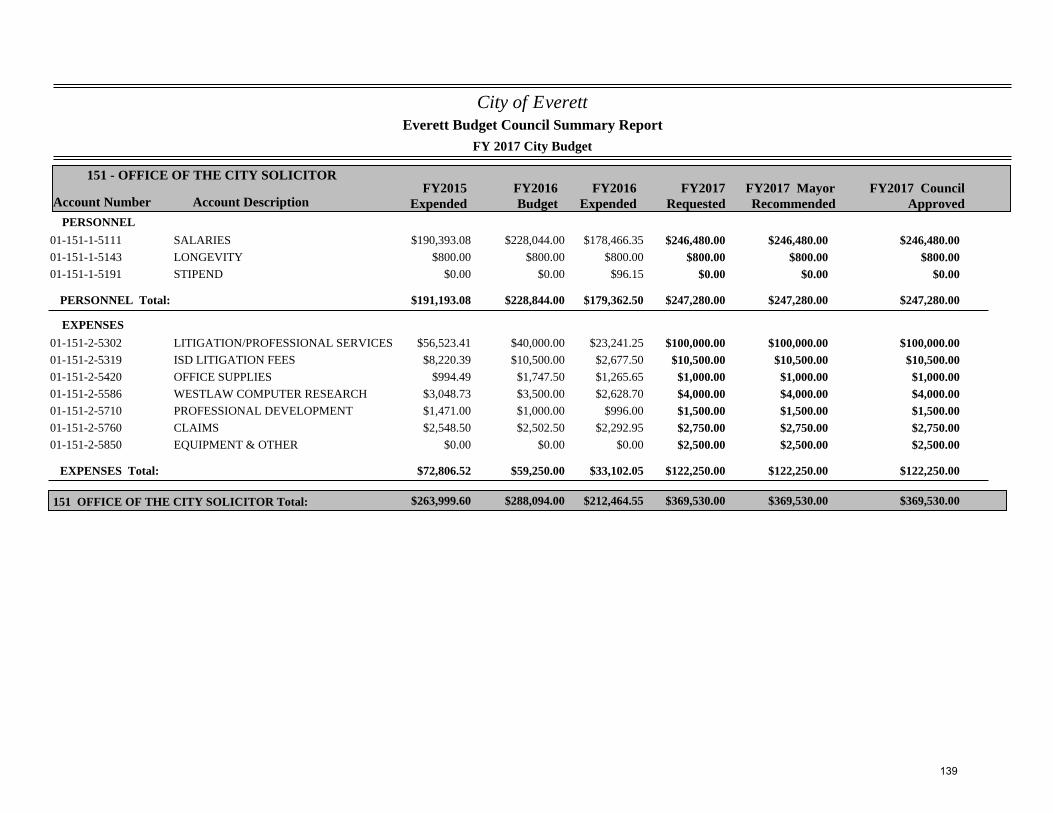
City of Everett
FY 2017 City Budget
Account Number Account DescriptionFY2015
ExpendedFY2016Budget
FY2017Requested
151 - OFFICE OF THE CITY SOLICITOR
Everett Budget Council Summary Report
FY2017 MayorRecommended
FY2016Expended
FY2017 CouncilApproved
PERSONNEL$190,393.08 $228,044.00 $246,480.0001-151-1-5111 SALARIES $178,466.35 $246,480.00 $246,480.00
$800.00 $800.00 $800.0001-151-1-5143 LONGEVITY $800.00 $800.00 $800.00$0.00 $0.00 $0.0001-151-1-5191 STIPEND $96.15 $0.00 $0.00
PERSONNEL Total: $191,193.08 $228,844.00 $247,280.00$179,362.50 $247,280.00 $247,280.00
EXPENSES$56,523.41 $40,000.00 $100,000.0001-151-2-5302 LITIGATION/PROFESSIONAL SERVICES $23,241.25 $100,000.00 $100,000.00$8,220.39 $10,500.00 $10,500.0001-151-2-5319 ISD LITIGATION FEES $2,677.50 $10,500.00 $10,500.00
$994.49 $1,747.50 $1,000.0001-151-2-5420 OFFICE SUPPLIES $1,265.65 $1,000.00 $1,000.00$3,048.73 $3,500.00 $4,000.0001-151-2-5586 WESTLAW COMPUTER RESEARCH $2,628.70 $4,000.00 $4,000.00$1,471.00 $1,000.00 $1,500.0001-151-2-5710 PROFESSIONAL DEVELOPMENT $996.00 $1,500.00 $1,500.00$2,548.50 $2,502.50 $2,750.0001-151-2-5760 CLAIMS $2,292.95 $2,750.00 $2,750.00
$0.00 $0.00 $2,500.0001-151-2-5850 EQUIPMENT & OTHER $0.00 $2,500.00 $2,500.00
EXPENSES Total: $72,806.52 $59,250.00 $122,250.00$33,102.05 $122,250.00 $122,250.00
$263,999.60 $288,094.00 $369,530.00151 OFFICE OF THE CITY SOLICITOR Total: $212,464.55 $369,530.00 $369,530.00
139
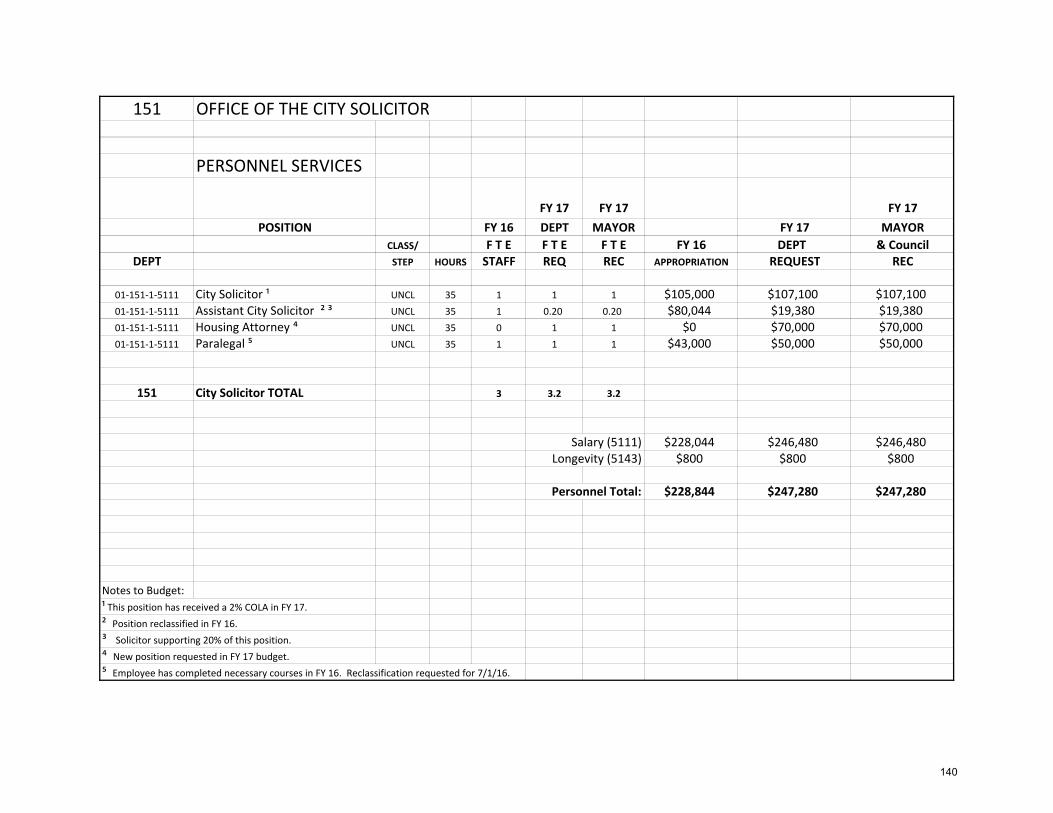
151 OFFICE OF THE CITY SOLICITOR
PERSONNEL SERVICES
FY 17 FY 17 FY 17POSITION FY 16 DEPT MAYOR FY 17 MAYOR
CLASS/ F T E F T E F T E FY 16 DEPT & CouncilDEPT STEP HOURS STAFF REQ REC APPROPRIATION REQUEST REC
01‐151‐1‐5111 City Solicitor ¹ UNCL 35 1 1 1 $105,000 $107,100 $107,10001‐151‐1‐5111 Assistant City Solicitor ² ³ UNCL 35 1 0.20 0.20 $80,044 $19,380 $19,38001‐151‐1‐5111 Housing Attorney ⁴ UNCL 35 0 1 1 $0 $70,000 $70,00001‐151‐1‐5111 Paralegal ⁵ UNCL 35 1 1 1 $43,000 $50,000 $50,000
151 City Solicitor TOTAL 3 3.2 3.2
Salary (5111) $228,044 $246,480 $246,480Longevity (5143) $800 $800 $800
Personnel Total: $228,844 $247,280 $247,280
Notes to Budget:¹ This position has received a 2% COLA in FY 17.² Position reclassified in FY 16.³ Solicitor supporting 20% of this position.⁴ New position requested in FY 17 budget.⁵ Employee has completed necessary courses in FY 16. Reclassification requested for 7/1/16.
140
Department of Human Resources
Mission Statement
To establish, administer, and effectively communicate sound policies, rules and practices that treat employees with dignity and equality while maintaining compliance with municipal governance and employment and labor laws.
Significant Budget & Staffing Changes for FY 2017
65% increase due to: A new Human Resources Director was hired in January 2016. The FY 17 salary request is the approved salary. The HR Generalist position is vacant and a search is underway for a replacement. 2% increase on most salaries. The Temp Personnel account is for temporary help needed by any city department (excluding DPW). The HR office was going to utilize this account in FY 17 for help with the HR audits and help with updating departmental software. The Summer Jobs account is the Mayor’s program to hire teens to work for the city during July and August. This increase was made due to the large number of applications received last fiscal year and the need for temporary help by city departments. Overtime is to be made available to those employees who do not want to receive comp time for overtime work. Employee Buyback is the account used to pay employees who have bought back time. Our expectations for FY 16 were exceeded. Because we don’t always have the same results every year, we increased the FY 17 budget to better meet the anticipated demand.
FY 2016: Accomplishments
Began program to assure that central record keeping and our archived records system were in full compliance with Massachusetts General Law.
Implemented Direct Deposit stipend to all city employees who had their paychecks switched from city checks to direct deposit.
Ran successful health insurance fair in May for all city employees. Worked with Local 25 Clerical union on upgrading positions for eligible employees.
141
Began union contract negotiations with Local 25 DPW, Local 25 E911, Local 25 Clerical, New England Police Benevolent Association #93 (Superior Officers) and #94 (Patrol Officers), Parking Enforcement SEIU Local 888 and the Nurses SEIU Local 888 union.
Began working with our IT department on creating an online add/change form to reduce the amount of paperwork and to make storage of information more efficient.
Have renovated and upgraded the Human Resources office to meet ADA requirements and to make a more efficient use of space.
FY 2017: Goals & Objectives
Review and update Policies and Procedures Handbook. Update job descriptions. Implement manager development training. Continue contract negotiations for all unions who are not currently ratified. Continue technology advancements as well as finalizing the online add/change
forms. Begin employee engagement meetings. Talent development.
Outcomes & Performance Measurers Actual FY 2014
Actual FY 2015
Estimated FY 2016
Estimated FY 2017
Job Applications Processed *TBD CORI Checks *TBD Health Insurance Fairs *TBD *HR Director has recently been hired. He has been collecting data and will be able to show results in FY2018 budget.
142
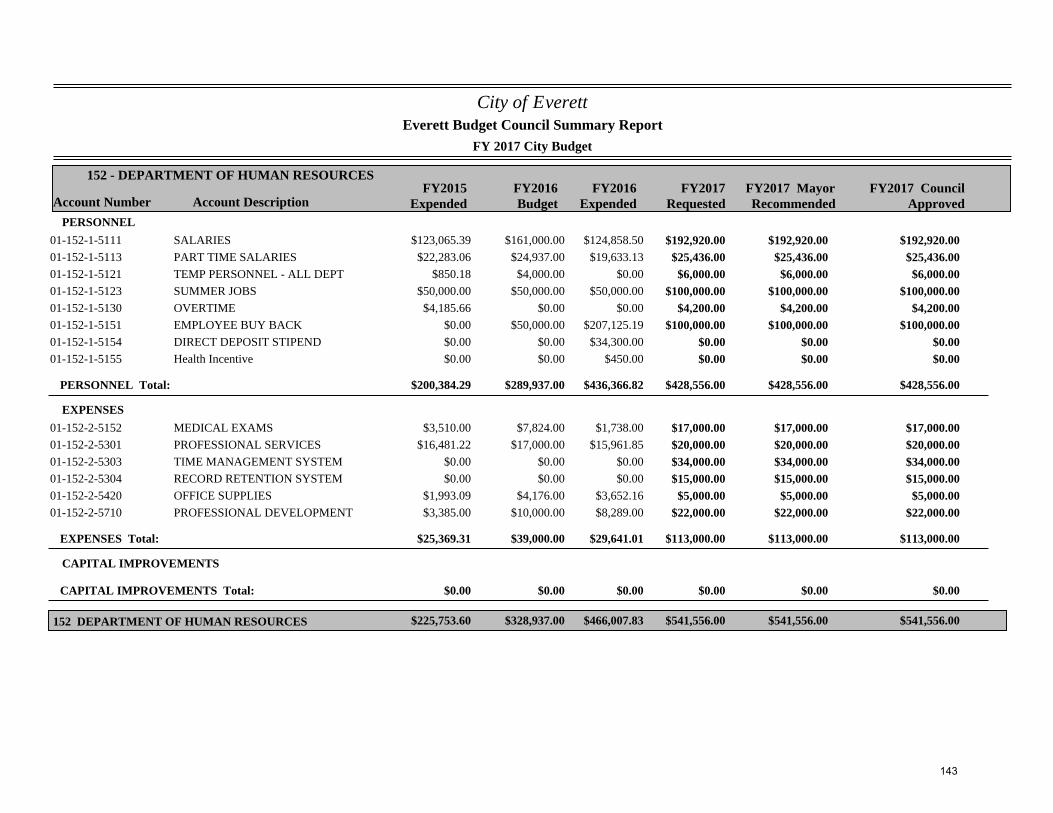
City of Everett
FY 2017 City Budget
Account Number Account DescriptionFY2015
ExpendedFY2016Budget
FY2017Requested
152 - DEPARTMENT OF HUMAN RESOURCES
Everett Budget Council Summary Report
FY2017 MayorRecommended
FY2016Expended
FY2017 CouncilApproved
PERSONNEL$123,065.39 $161,000.00 $192,920.0001-152-1-5111 SALARIES $124,858.50 $192,920.00 $192,920.00
$22,283.06 $24,937.00 $25,436.0001-152-1-5113 PART TIME SALARIES $19,633.13 $25,436.00 $25,436.00$850.18 $4,000.00 $6,000.0001-152-1-5121 TEMP PERSONNEL - ALL DEPT $0.00 $6,000.00 $6,000.00
$50,000.00 $50,000.00 $100,000.0001-152-1-5123 SUMMER JOBS $50,000.00 $100,000.00 $100,000.00$4,185.66 $0.00 $4,200.0001-152-1-5130 OVERTIME $0.00 $4,200.00 $4,200.00
$0.00 $50,000.00 $100,000.0001-152-1-5151 EMPLOYEE BUY BACK $207,125.19 $100,000.00 $100,000.00$0.00 $0.00 $0.0001-152-1-5154 DIRECT DEPOSIT STIPEND $34,300.00 $0.00 $0.00$0.00 $0.00 $0.0001-152-1-5155 Health Incentive $450.00 $0.00 $0.00
PERSONNEL Total: $200,384.29 $289,937.00 $428,556.00$436,366.82 $428,556.00 $428,556.00
EXPENSES$3,510.00 $7,824.00 $17,000.0001-152-2-5152 MEDICAL EXAMS $1,738.00 $17,000.00 $17,000.00
$16,481.22 $17,000.00 $20,000.0001-152-2-5301 PROFESSIONAL SERVICES $15,961.85 $20,000.00 $20,000.00$0.00 $0.00 $34,000.0001-152-2-5303 TIME MANAGEMENT SYSTEM $0.00 $34,000.00 $34,000.00$0.00 $0.00 $15,000.0001-152-2-5304 RECORD RETENTION SYSTEM $0.00 $15,000.00 $15,000.00
$1,993.09 $4,176.00 $5,000.0001-152-2-5420 OFFICE SUPPLIES $3,652.16 $5,000.00 $5,000.00$3,385.00 $10,000.00 $22,000.0001-152-2-5710 PROFESSIONAL DEVELOPMENT $8,289.00 $22,000.00 $22,000.00
EXPENSES Total: $25,369.31 $39,000.00 $113,000.00$29,641.01 $113,000.00 $113,000.00
CAPITAL IMPROVEMENTS
CAPITAL IMPROVEMENTS Total: $0.00 $0.00 $0.00$0.00 $0.00 $0.00
$225,753.60 $328,937.00 $541,556.00152 DEPARTMENT OF HUMAN RESOURCES $466,007.83 $541,556.00 $541,556.00
143
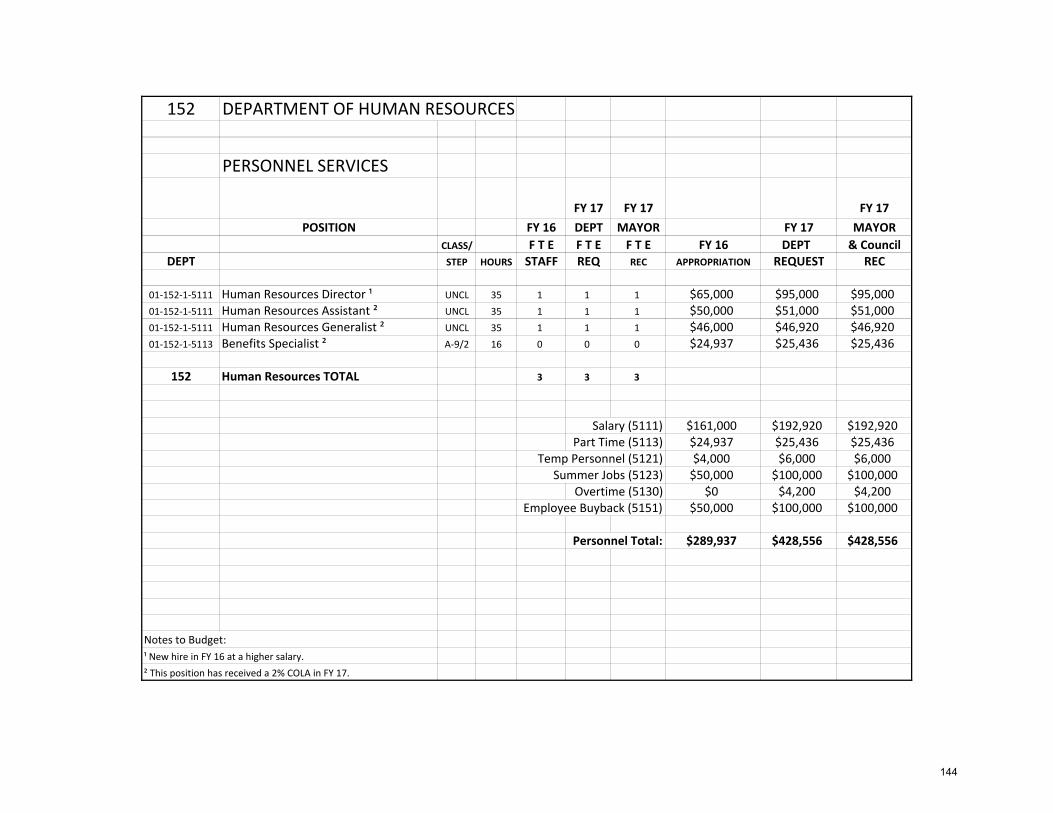
152 DEPARTMENT OF HUMAN RESOURCES
PERSONNEL SERVICES
FY 17 FY 17 FY 17POSITION FY 16 DEPT MAYOR FY 17 MAYOR
CLASS/ F T E F T E F T E FY 16 DEPT & CouncilDEPT STEP HOURS STAFF REQ REC APPROPRIATION REQUEST REC
01‐152‐1‐5111 Human Resources Director ¹ UNCL 35 1 1 1 $65,000 $95,000 $95,00001‐152‐1‐5111 Human Resources Assistant ² UNCL 35 1 1 1 $50,000 $51,000 $51,00001‐152‐1‐5111 Human Resources Generalist ² UNCL 35 1 1 1 $46,000 $46,920 $46,92001‐152‐1‐5113 Benefits Specialist ² A‐9/2 16 0 0 0 $24,937 $25,436 $25,436
152 Human Resources TOTAL 3 3 3
Salary (5111) $161,000 $192,920 $192,920Part Time (5113) $24,937 $25,436 $25,436
Temp Personnel (5121) $4,000 $6,000 $6,000Summer Jobs (5123) $50,000 $100,000 $100,000
Overtime (5130) $0 $4,200 $4,200Employee Buyback (5151) $50,000 $100,000 $100,000
Personnel Total: $289,937 $428,556 $428,556
Notes to Budget:¹ New hire in FY 16 at a higher salary.² This position has received a 2% COLA in FY 17.
144
Department of Information Technology
Mission Statement
To provide the highest quality technology based services in the most cost‐effective manner. We also provide reliable technical services to city employees to accomplish daily tasks.
Significant Budget & Staffing Changes for FY 2017
36% increase due to: The previous IT Director left the city’s employ early on in FY 16. Both the IT Director position and the Assistant IT Director position were reclassified to remain competitive. The IT Technician position is vacant.
Contract Maintenance was increased due to several contracts needing to be put out to bid in FY 17. The Copiers/Maintenance account was transferred from Purchasing in FY 16. This new account now includes the monthly payments and maintenance for 13 copiers within the city. The Supplies account is for smaller computer equipment items such as keyboards, cables, mice, etc. that are needed throughout the year. The Wireless Communications account has increased due to all wireless devices in the city now being paid from one account. Data Communications is increased to allow for a direct fiber connection between all city
buildings. Hardware/Software Equipment supplies printers, computers, monitors and servers to all departments based on a scheduled replacement program.
The Technology Infrastructure is for Network Storage Backup ($19,500), Firewalls and Servers for new phone system ($26,500) and Replacement of EOL/Outdated Equipment ($64,000).
FY 2016: Accomplishments
Initial work for server Virtualization Migration of permiting / ticketing software to Viewpoint
145
FY 2017: Goals and Objectives
Completion of Virtualization project / unified NAS and disaster recovery. Finalization of VOIP phone system and expansion to all City buildings, along with upgrading to fiber network for all City
Buildings Unified database for interdepartmental document work flow and storage.
146
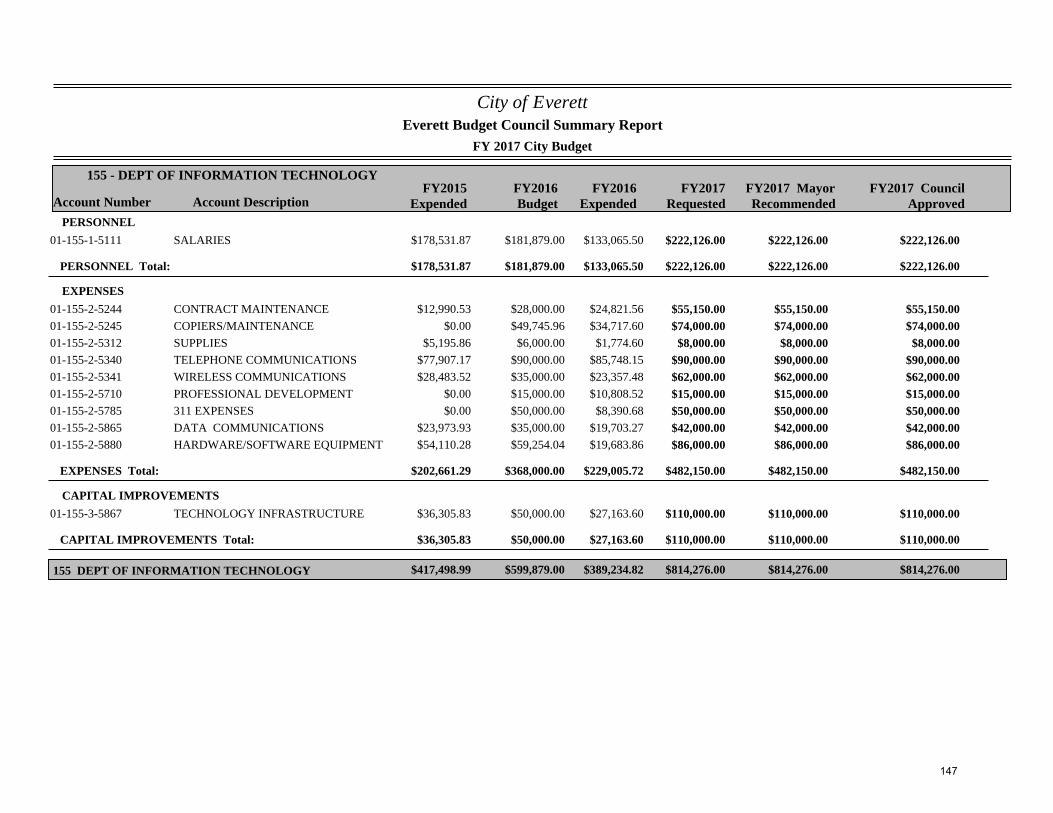
City of Everett
FY 2017 City Budget
Account Number Account DescriptionFY2015
ExpendedFY2016Budget
FY2017Requested
155 - DEPT OF INFORMATION TECHNOLOGY
Everett Budget Council Summary Report
FY2017 MayorRecommended
FY2016Expended
FY2017 CouncilApproved
PERSONNEL$178,531.87 $181,879.00 $222,126.0001-155-1-5111 SALARIES $133,065.50 $222,126.00 $222,126.00
PERSONNEL Total: $178,531.87 $181,879.00 $222,126.00$133,065.50 $222,126.00 $222,126.00
EXPENSES$12,990.53 $28,000.00 $55,150.0001-155-2-5244 CONTRACT MAINTENANCE $24,821.56 $55,150.00 $55,150.00
$0.00 $49,745.96 $74,000.0001-155-2-5245 COPIERS/MAINTENANCE $34,717.60 $74,000.00 $74,000.00$5,195.86 $6,000.00 $8,000.0001-155-2-5312 SUPPLIES $1,774.60 $8,000.00 $8,000.00
$77,907.17 $90,000.00 $90,000.0001-155-2-5340 TELEPHONE COMMUNICATIONS $85,748.15 $90,000.00 $90,000.00$28,483.52 $35,000.00 $62,000.0001-155-2-5341 WIRELESS COMMUNICATIONS $23,357.48 $62,000.00 $62,000.00
$0.00 $15,000.00 $15,000.0001-155-2-5710 PROFESSIONAL DEVELOPMENT $10,808.52 $15,000.00 $15,000.00$0.00 $50,000.00 $50,000.0001-155-2-5785 311 EXPENSES $8,390.68 $50,000.00 $50,000.00
$23,973.93 $35,000.00 $42,000.0001-155-2-5865 DATA COMMUNICATIONS $19,703.27 $42,000.00 $42,000.00$54,110.28 $59,254.04 $86,000.0001-155-2-5880 HARDWARE/SOFTWARE EQUIPMENT $19,683.86 $86,000.00 $86,000.00
EXPENSES Total: $202,661.29 $368,000.00 $482,150.00$229,005.72 $482,150.00 $482,150.00
CAPITAL IMPROVEMENTS$36,305.83 $50,000.00 $110,000.0001-155-3-5867 TECHNOLOGY INFRASTRUCTURE $27,163.60 $110,000.00 $110,000.00
CAPITAL IMPROVEMENTS Total: $36,305.83 $50,000.00 $110,000.00$27,163.60 $110,000.00 $110,000.00
$417,498.99 $599,879.00 $814,276.00155 DEPT OF INFORMATION TECHNOLOGY $389,234.82 $814,276.00 $814,276.00
147
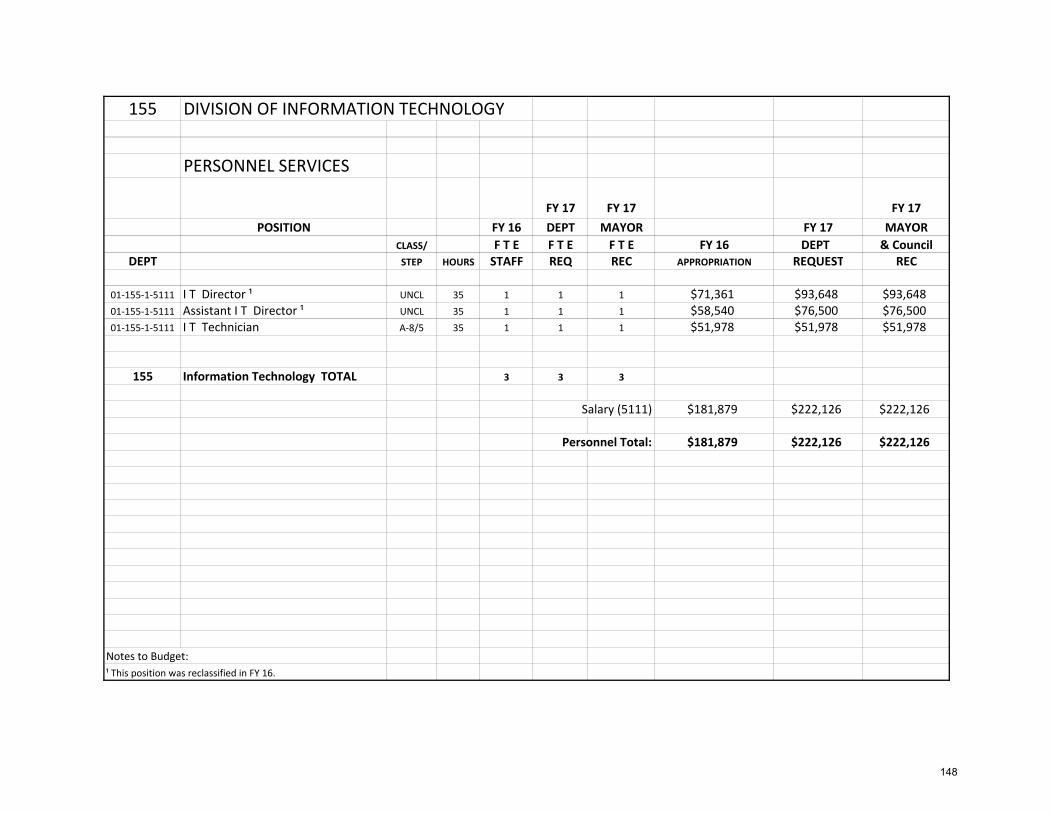
155 DIVISION OF INFORMATION TECHNOLOGY
PERSONNEL SERVICES
FY 17 FY 17 FY 17POSITION FY 16 DEPT MAYOR FY 17 MAYOR
CLASS/ F T E F T E F T E FY 16 DEPT & CouncilDEPT STEP HOURS STAFF REQ REC APPROPRIATION REQUEST REC
01‐155‐1‐5111 I T Director ¹ UNCL 35 1 1 1 $71,361 $93,648 $93,64801‐155‐1‐5111 Assistant I T Director ¹ UNCL 35 1 1 1 $58,540 $76,500 $76,50001‐155‐1‐5111 I T Technician A‐8/5 35 1 1 1 $51,978 $51,978 $51,978
155 Information Technology TOTAL 3 3 3
Salary (5111) $181,879 $222,126 $222,126
Personnel Total: $181,879 $222,126 $222,126
Notes to Budget:¹ This position was reclassified in FY 16.
148
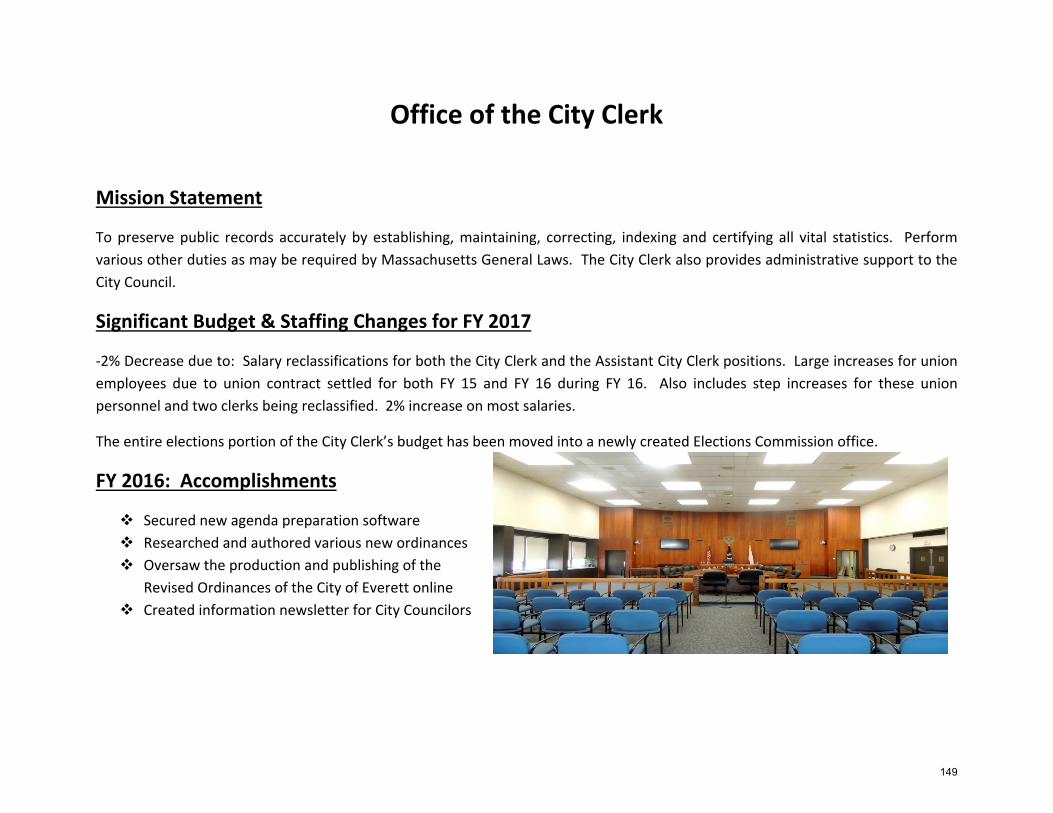
Office of the City Clerk
Mission Statement
To preserve public records accurately by establishing, maintaining, correcting, indexing and certifying all vital statistics. Perform various other duties as may be required by Massachusetts General Laws. The City Clerk also provides administrative support to the City Council.
Significant Budget & Staffing Changes for FY 2017
‐2% Decrease due to: Salary reclassifications for both the City Clerk and the Assistant City Clerk positions. Large increases for union employees due to union contract settled for both FY 15 and FY 16 during FY 16. Also includes step increases for these union personnel and two clerks being reclassified. 2% increase on most salaries.
The entire elections portion of the City Clerk’s budget has been moved into a newly created Elections Commission office.
FY 2016: Accomplishments
Secured new agenda preparation software Researched and authored various new ordinances Oversaw the production and publishing of the
Revised Ordinances of the City of Everett online Created information newsletter for City Councilors
149
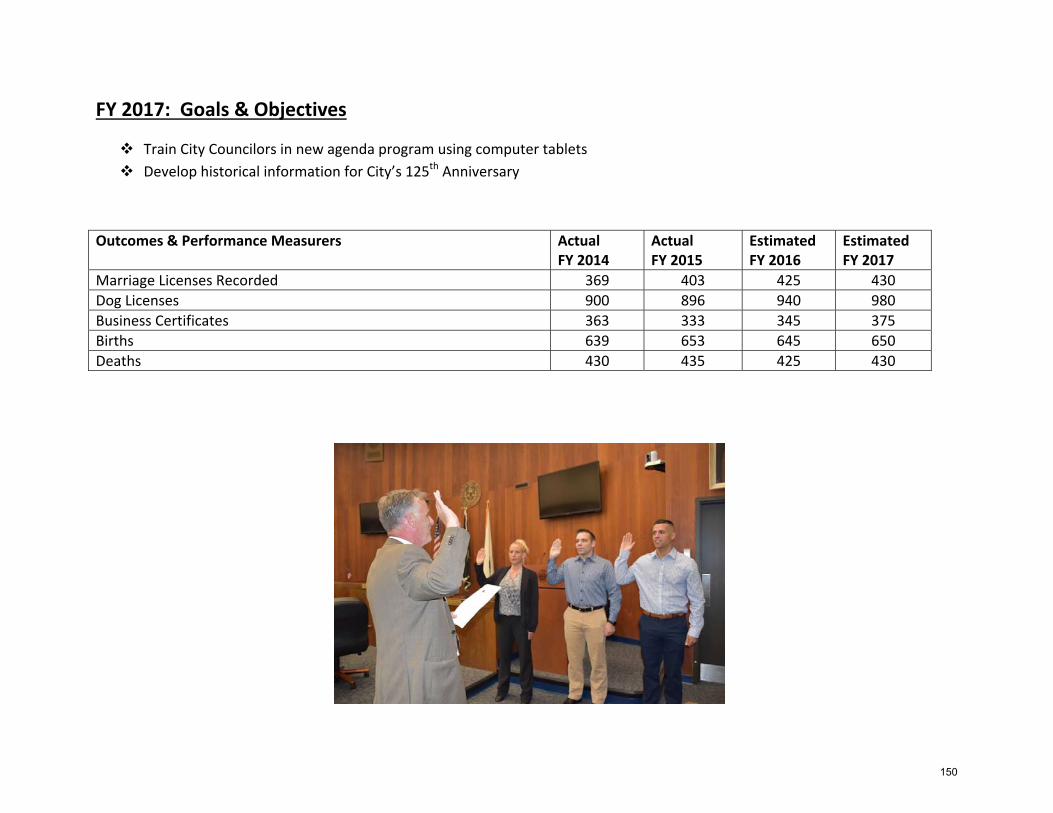
FY 2017: Goals & Objectives
Train City Councilors in new agenda program using computer tablets Develop historical information for City’s 125th Anniversary
Outcomes & Performance Measurers Actual FY 2014
Actual FY 2015
Estimated FY 2016
Estimated FY 2017
Marriage Licenses Recorded 369 403 425 430 Dog Licenses 900 896 940 980 Business Certificates 363 333 345 375 Births 639 653 645 650 Deaths 430 435 425 430
150
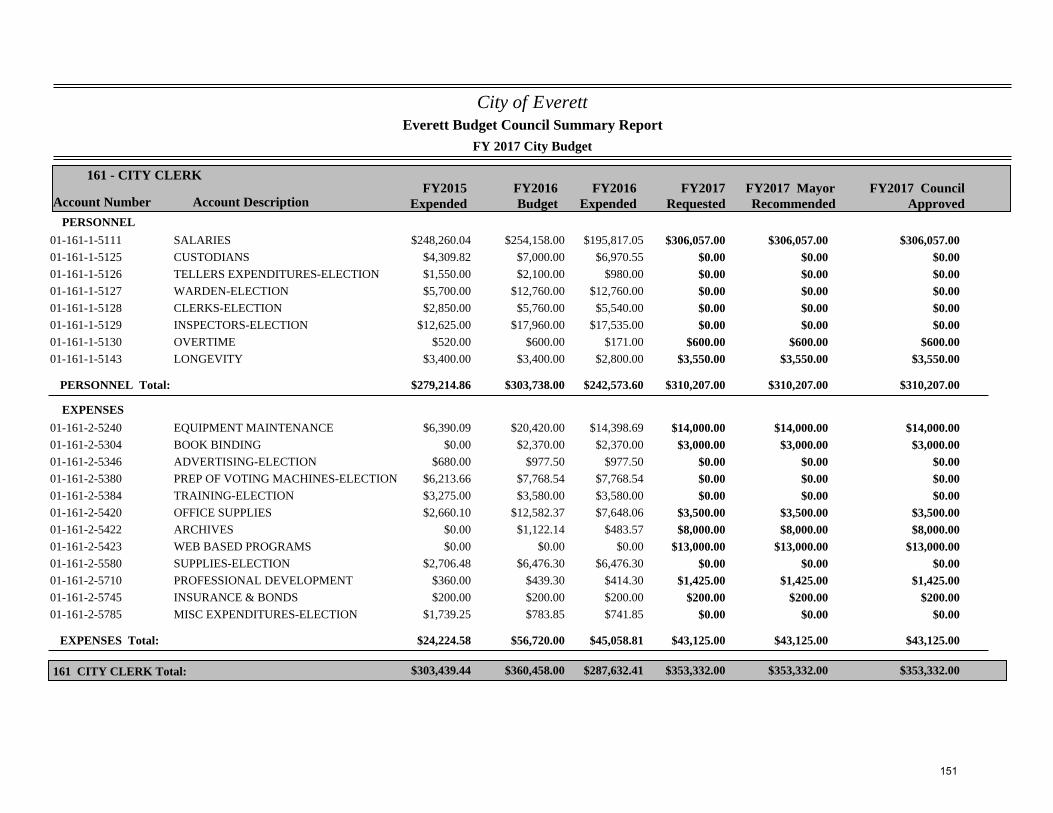
City of Everett
FY 2017 City Budget
Account Number Account DescriptionFY2015
ExpendedFY2016Budget
FY2017Requested
161 - CITY CLERK
Everett Budget Council Summary Report
FY2017 MayorRecommended
FY2016Expended
FY2017 CouncilApproved
PERSONNEL$248,260.04 $254,158.00 $306,057.0001-161-1-5111 SALARIES $195,817.05 $306,057.00 $306,057.00
$4,309.82 $7,000.00 $0.0001-161-1-5125 CUSTODIANS $6,970.55 $0.00 $0.00$1,550.00 $2,100.00 $0.0001-161-1-5126 TELLERS EXPENDITURES-ELECTION $980.00 $0.00 $0.00$5,700.00 $12,760.00 $0.0001-161-1-5127 WARDEN-ELECTION $12,760.00 $0.00 $0.00$2,850.00 $5,760.00 $0.0001-161-1-5128 CLERKS-ELECTION $5,540.00 $0.00 $0.00
$12,625.00 $17,960.00 $0.0001-161-1-5129 INSPECTORS-ELECTION $17,535.00 $0.00 $0.00$520.00 $600.00 $600.0001-161-1-5130 OVERTIME $171.00 $600.00 $600.00
$3,400.00 $3,400.00 $3,550.0001-161-1-5143 LONGEVITY $2,800.00 $3,550.00 $3,550.00
PERSONNEL Total: $279,214.86 $303,738.00 $310,207.00$242,573.60 $310,207.00 $310,207.00
EXPENSES$6,390.09 $20,420.00 $14,000.0001-161-2-5240 EQUIPMENT MAINTENANCE $14,398.69 $14,000.00 $14,000.00
$0.00 $2,370.00 $3,000.0001-161-2-5304 BOOK BINDING $2,370.00 $3,000.00 $3,000.00$680.00 $977.50 $0.0001-161-2-5346 ADVERTISING-ELECTION $977.50 $0.00 $0.00
$6,213.66 $7,768.54 $0.0001-161-2-5380 PREP OF VOTING MACHINES-ELECTION $7,768.54 $0.00 $0.00$3,275.00 $3,580.00 $0.0001-161-2-5384 TRAINING-ELECTION $3,580.00 $0.00 $0.00$2,660.10 $12,582.37 $3,500.0001-161-2-5420 OFFICE SUPPLIES $7,648.06 $3,500.00 $3,500.00
$0.00 $1,122.14 $8,000.0001-161-2-5422 ARCHIVES $483.57 $8,000.00 $8,000.00$0.00 $0.00 $13,000.0001-161-2-5423 WEB BASED PROGRAMS $0.00 $13,000.00 $13,000.00
$2,706.48 $6,476.30 $0.0001-161-2-5580 SUPPLIES-ELECTION $6,476.30 $0.00 $0.00$360.00 $439.30 $1,425.0001-161-2-5710 PROFESSIONAL DEVELOPMENT $414.30 $1,425.00 $1,425.00$200.00 $200.00 $200.0001-161-2-5745 INSURANCE & BONDS $200.00 $200.00 $200.00
$1,739.25 $783.85 $0.0001-161-2-5785 MISC EXPENDITURES-ELECTION $741.85 $0.00 $0.00
EXPENSES Total: $24,224.58 $56,720.00 $43,125.00$45,058.81 $43,125.00 $43,125.00
$303,439.44 $360,458.00 $353,332.00161 CITY CLERK Total: $287,632.41 $353,332.00 $353,332.00
151
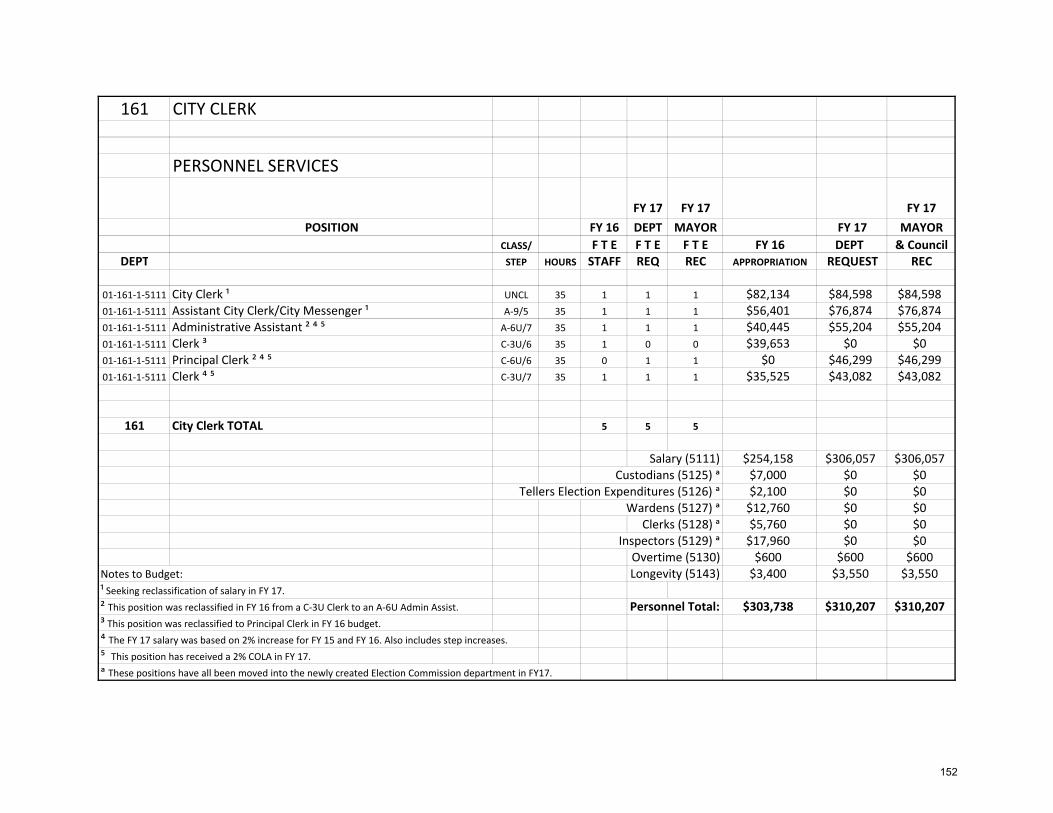
161 CITY CLERK
PERSONNEL SERVICES
FY 17 FY 17 FY 17POSITION FY 16 DEPT MAYOR FY 17 MAYOR
CLASS/ F T E F T E F T E FY 16 DEPT & CouncilDEPT STEP HOURS STAFF REQ REC APPROPRIATION REQUEST REC
01‐161‐1‐5111 City Clerk ¹ UNCL 35 1 1 1 $82,134 $84,598 $84,59801‐161‐1‐5111 Assistant City Clerk/City Messenger ¹ A‐9/5 35 1 1 1 $56,401 $76,874 $76,87401‐161‐1‐5111 Administrative Assistant ² ⁴ ⁵ A‐6U/7 35 1 1 1 $40,445 $55,204 $55,20401‐161‐1‐5111 Clerk ³ C‐3U/6 35 1 0 0 $39,653 $0 $001‐161‐1‐5111 Principal Clerk ² ⁴ ⁵ C‐6U/6 35 0 1 1 $0 $46,299 $46,29901‐161‐1‐5111 Clerk ⁴ ⁵ C‐3U/7 35 1 1 1 $35,525 $43,082 $43,082
161 City Clerk TOTAL 5 5 5
Salary (5111) $254,158 $306,057 $306,057Custodians (5125) ᵃ $7,000 $0 $0
Tellers Election Expenditures (5126) ᵃ $2,100 $0 $0Wardens (5127) ᵃ $12,760 $0 $0
Clerks (5128) ᵃ $5,760 $0 $0Inspectors (5129) ᵃ $17,960 $0 $0Overtime (5130) $600 $600 $600
Notes to Budget: Longevity (5143) $3,400 $3,550 $3,550¹ Seeking reclassification of salary in FY 17.² This position was reclassified in FY 16 from a C‐3U Clerk to an A‐6U Admin Assist. Personnel Total: $303,738 $310,207 $310,207³ This position was reclassified to Principal Clerk in FY 16 budget.⁴ The FY 17 salary was based on 2% increase for FY 15 and FY 16. Also includes step increases.⁵ This position has received a 2% COLA in FY 17.ᵃ These positions have all been moved into the newly created Election Commission department in FY17.
152
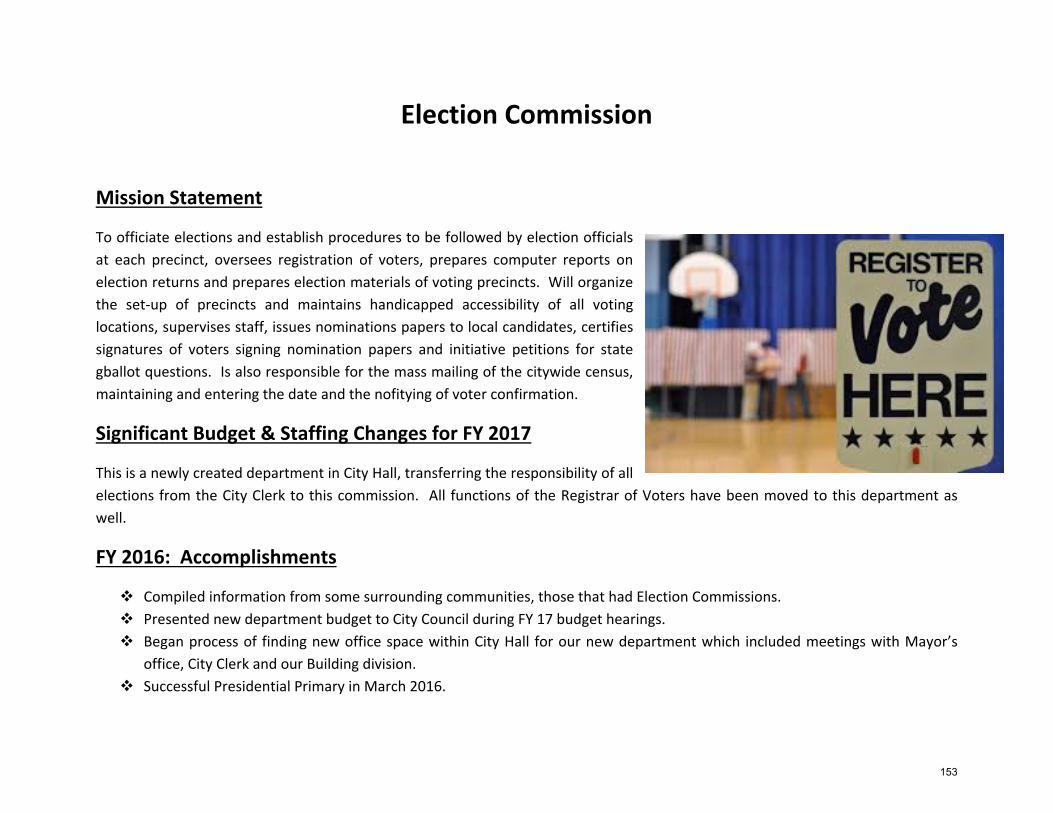
Election Commission
Mission Statement
To officiate elections and establish procedures to be followed by election officials at each precinct, oversees registration of voters, prepares computer reports on election returns and prepares election materials of voting precincts. Will organize the set‐up of precincts and maintains handicapped accessibility of all voting locations, supervises staff, issues nominations papers to local candidates, certifies signatures of voters signing nomination papers and initiative petitions for state gballot questions. Is also responsible for the mass mailing of the citywide census, maintaining and entering the date and the nofitying of voter confirmation.
Significant Budget & Staffing Changes for FY 2017
This is a newly created department in City Hall, transferring the responsibility of all elections from the City Clerk to this commission. All functions of the Registrar of Voters have been moved to this department as well.
FY 2016: Accomplishments
Compiled information from some surrounding communities, those that had Election Commissions. Presented new department budget to City Council during FY 17 budget hearings. Began process of finding new office space within City Hall for our new department which included meetings with Mayor’s
office, City Clerk and our Building division. Successful Presidential Primary in March 2016.
153
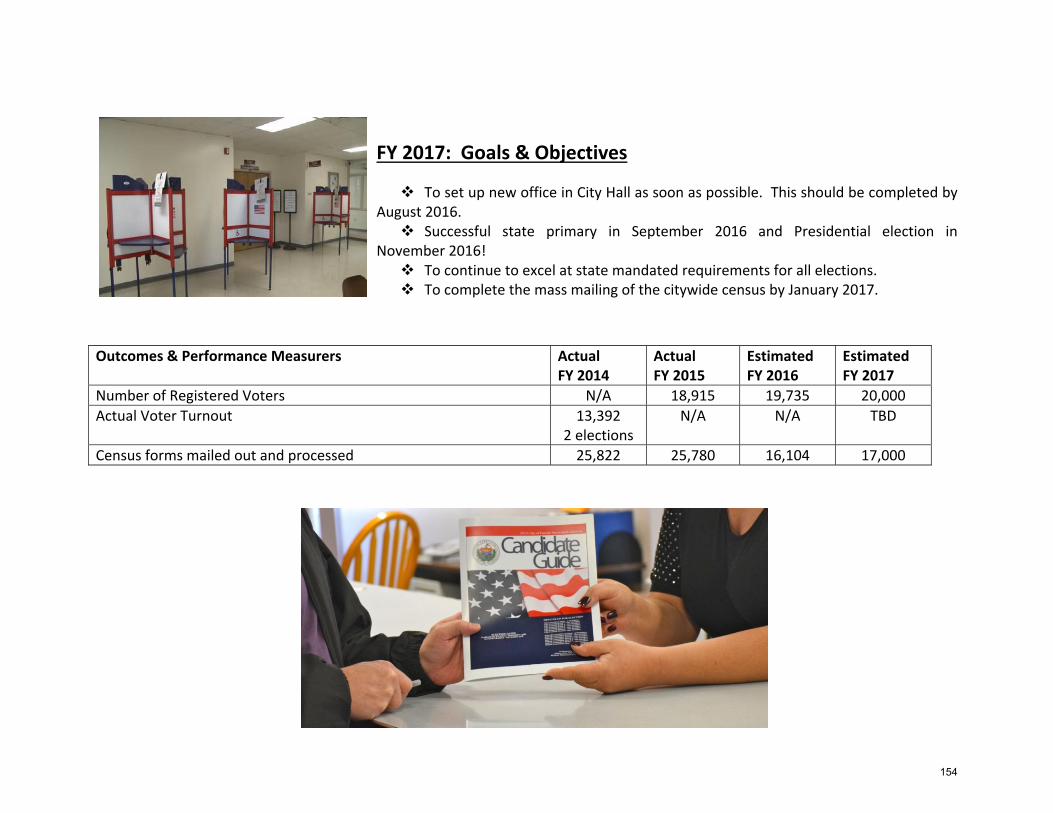
FY 2017: Goals & Objectives
To set up new office in City Hall as soon as possible. This should be completed by August 2016. Successful state primary in September 2016 and Presidential election in
November 2016! To continue to excel at state mandated requirements for all elections. To complete the mass mailing of the citywide census by January 2017.
Outcomes & Performance Measurers Actual FY 2014
Actual FY 2015
Estimated FY 2016
Estimated FY 2017
Number of Registered Voters N/A 18,915 19,735 20,000 Actual Voter Turnout 13,392
2 elections N/A N/A TBD
Census forms mailed out and processed 25,822 25,780 16,104 17,000
154
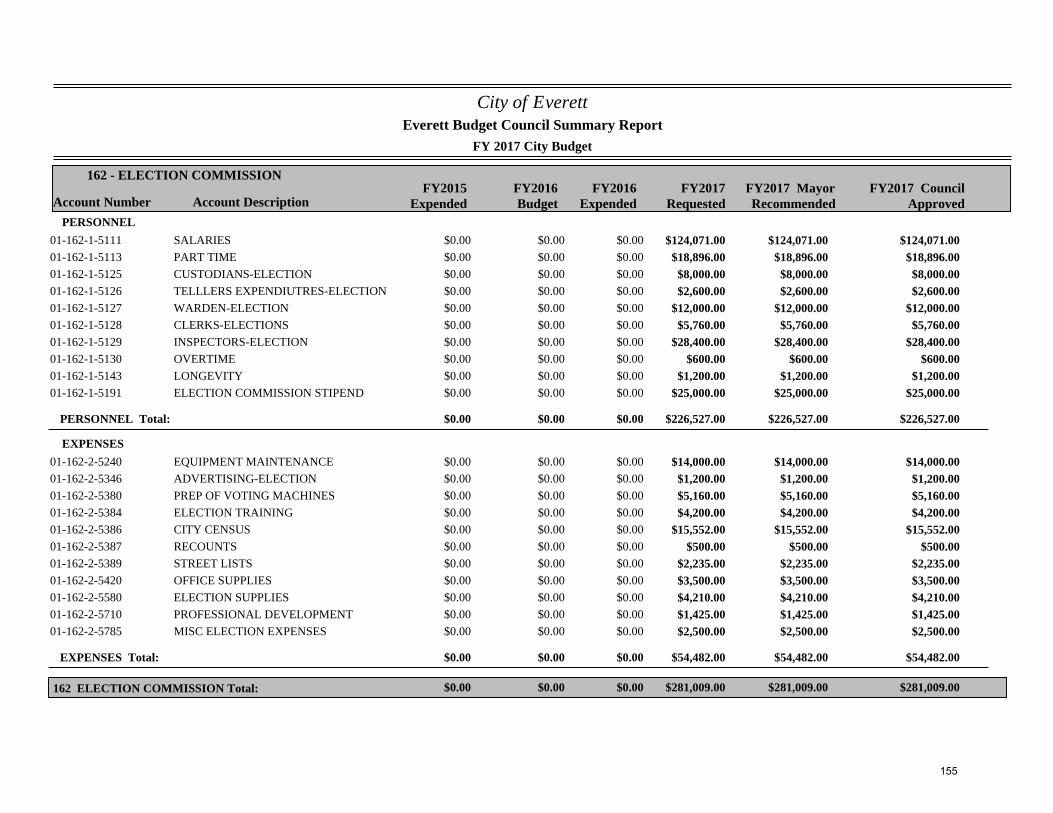
City of Everett
FY 2017 City Budget
Account Number Account DescriptionFY2015
ExpendedFY2016Budget
FY2017Requested
162 - ELECTION COMMISSION
Everett Budget Council Summary Report
FY2017 MayorRecommended
FY2016Expended
FY2017 CouncilApproved
PERSONNEL$0.00 $0.00 $124,071.0001-162-1-5111 SALARIES $0.00 $124,071.00 $124,071.00$0.00 $0.00 $18,896.0001-162-1-5113 PART TIME $0.00 $18,896.00 $18,896.00$0.00 $0.00 $8,000.0001-162-1-5125 CUSTODIANS-ELECTION $0.00 $8,000.00 $8,000.00$0.00 $0.00 $2,600.0001-162-1-5126 TELLLERS EXPENDIUTRES-ELECTION $0.00 $2,600.00 $2,600.00$0.00 $0.00 $12,000.0001-162-1-5127 WARDEN-ELECTION $0.00 $12,000.00 $12,000.00$0.00 $0.00 $5,760.0001-162-1-5128 CLERKS-ELECTIONS $0.00 $5,760.00 $5,760.00$0.00 $0.00 $28,400.0001-162-1-5129 INSPECTORS-ELECTION $0.00 $28,400.00 $28,400.00$0.00 $0.00 $600.0001-162-1-5130 OVERTIME $0.00 $600.00 $600.00$0.00 $0.00 $1,200.0001-162-1-5143 LONGEVITY $0.00 $1,200.00 $1,200.00$0.00 $0.00 $25,000.0001-162-1-5191 ELECTION COMMISSION STIPEND $0.00 $25,000.00 $25,000.00
PERSONNEL Total: $0.00 $0.00 $226,527.00$0.00 $226,527.00 $226,527.00
EXPENSES$0.00 $0.00 $14,000.0001-162-2-5240 EQUIPMENT MAINTENANCE $0.00 $14,000.00 $14,000.00$0.00 $0.00 $1,200.0001-162-2-5346 ADVERTISING-ELECTION $0.00 $1,200.00 $1,200.00$0.00 $0.00 $5,160.0001-162-2-5380 PREP OF VOTING MACHINES $0.00 $5,160.00 $5,160.00$0.00 $0.00 $4,200.0001-162-2-5384 ELECTION TRAINING $0.00 $4,200.00 $4,200.00$0.00 $0.00 $15,552.0001-162-2-5386 CITY CENSUS $0.00 $15,552.00 $15,552.00$0.00 $0.00 $500.0001-162-2-5387 RECOUNTS $0.00 $500.00 $500.00$0.00 $0.00 $2,235.0001-162-2-5389 STREET LISTS $0.00 $2,235.00 $2,235.00$0.00 $0.00 $3,500.0001-162-2-5420 OFFICE SUPPLIES $0.00 $3,500.00 $3,500.00$0.00 $0.00 $4,210.0001-162-2-5580 ELECTION SUPPLIES $0.00 $4,210.00 $4,210.00$0.00 $0.00 $1,425.0001-162-2-5710 PROFESSIONAL DEVELOPMENT $0.00 $1,425.00 $1,425.00$0.00 $0.00 $2,500.0001-162-2-5785 MISC ELECTION EXPENSES $0.00 $2,500.00 $2,500.00
EXPENSES Total: $0.00 $0.00 $54,482.00$0.00 $54,482.00 $54,482.00
$0.00 $0.00 $281,009.00162 ELECTION COMMISSION Total: $0.00 $281,009.00 $281,009.00
155
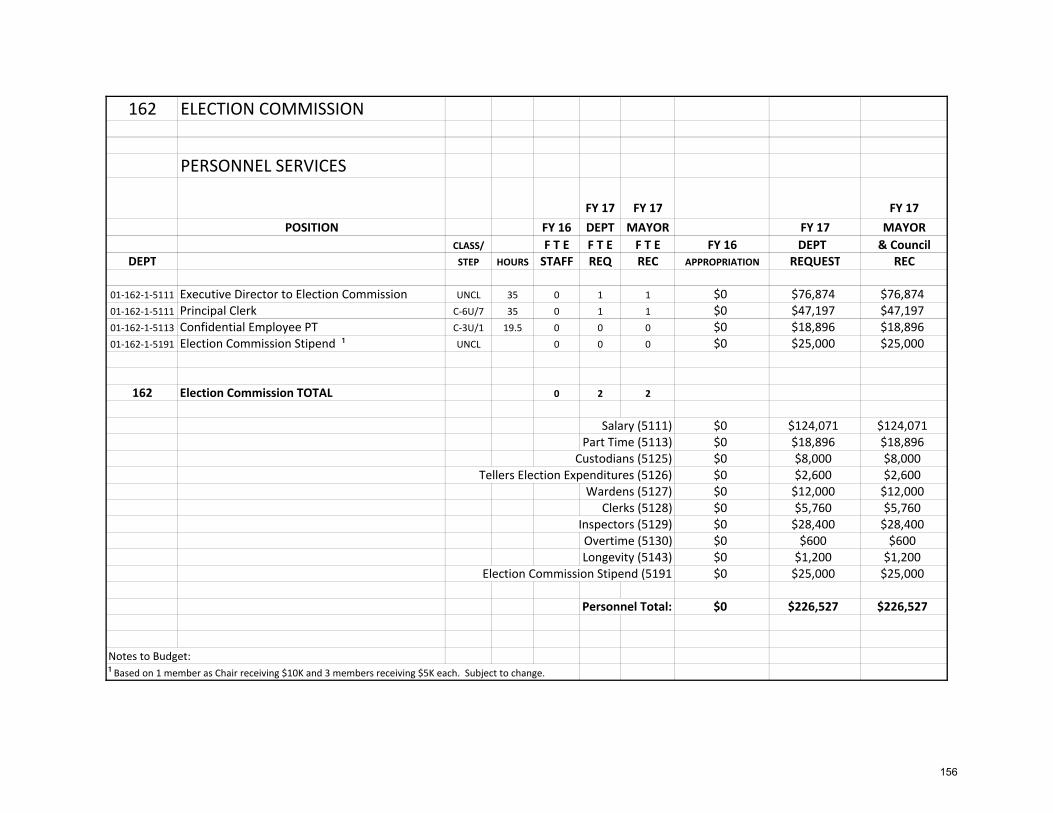
162 ELECTION COMMISSION
PERSONNEL SERVICES
FY 17 FY 17 FY 17POSITION FY 16 DEPT MAYOR FY 17 MAYOR
CLASS/ F T E F T E F T E FY 16 DEPT & CouncilDEPT STEP HOURS STAFF REQ REC APPROPRIATION REQUEST REC
01‐162‐1‐5111 Executive Director to Election Commission UNCL 35 0 1 1 $0 $76,874 $76,87401‐162‐1‐5111 Principal Clerk C‐6U/7 35 0 1 1 $0 $47,197 $47,19701‐162‐1‐5113 Confidential Employee PT C‐3U/1 19.5 0 0 0 $0 $18,896 $18,89601‐162‐1‐5191 Election Commission Stipend ¹ UNCL 0 0 0 $0 $25,000 $25,000
162 Election Commission TOTAL 0 2 2
Salary (5111) $0 $124,071 $124,071Part Time (5113) $0 $18,896 $18,896
Custodians (5125) $0 $8,000 $8,000Tellers Election Expenditures (5126) $0 $2,600 $2,600
Wardens (5127) $0 $12,000 $12,000Clerks (5128) $0 $5,760 $5,760
Inspectors (5129) $0 $28,400 $28,400Overtime (5130) $0 $600 $600Longevity (5143) $0 $1,200 $1,200
Election Commission Stipend (5191 $0 $25,000 $25,000
Personnel Total: $0 $226,527 $226,527
Notes to Budget:¹ Based on 1 member as Chair receiving $10K and 3 members receiving $5K each. Subject to change.
156
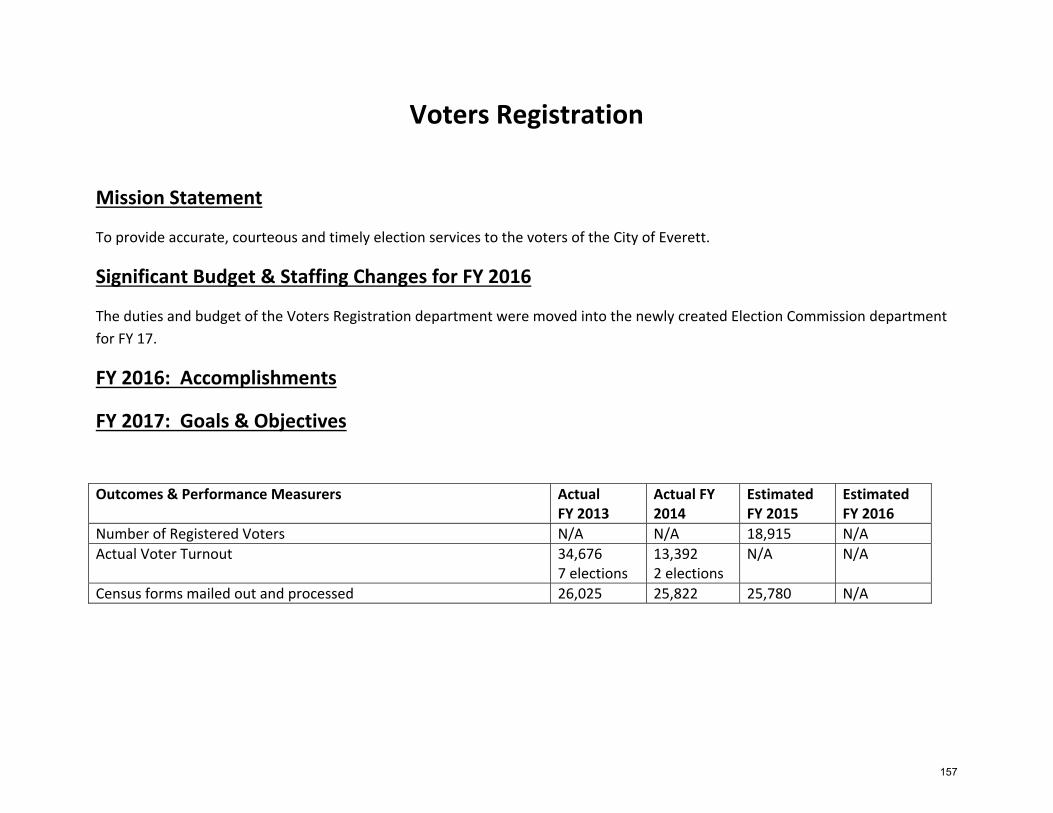
Voters Registration
Mission Statement
To provide accurate, courteous and timely election services to the voters of the City of Everett.
Significant Budget & Staffing Changes for FY 2016
The duties and budget of the Voters Registration department were moved into the newly created Election Commission department for FY 17.
FY 2016: Accomplishments
FY 2017: Goals & Objectives
Outcomes & Performance Measurers Actual FY 2013
Actual FY 2014
Estimated FY 2015
Estimated FY 2016
Number of Registered Voters N/A N/A 18,915 N/A Actual Voter Turnout 34,676
7 elections 13,392 2 elections
N/A N/A
Census forms mailed out and processed 26,025 25,822 25,780 N/A
157
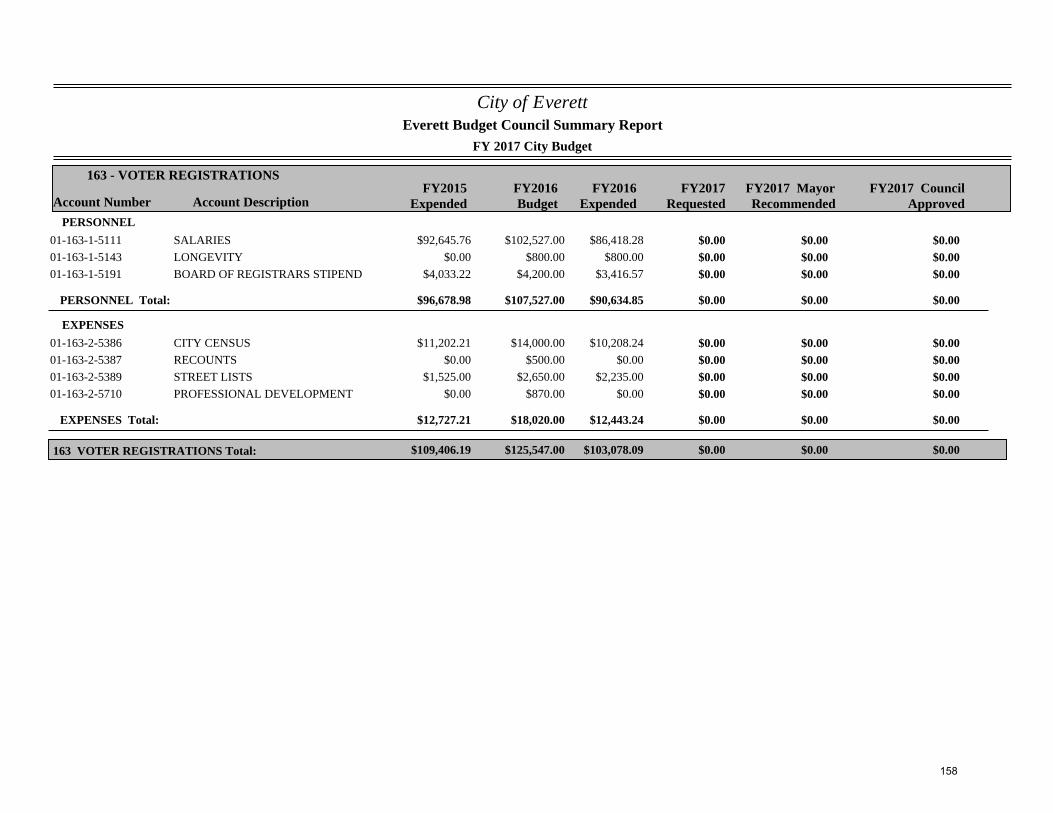
City of Everett
FY 2017 City Budget
Account Number Account DescriptionFY2015
ExpendedFY2016Budget
FY2017Requested
163 - VOTER REGISTRATIONS
Everett Budget Council Summary Report
FY2017 MayorRecommended
FY2016Expended
FY2017 CouncilApproved
PERSONNEL$92,645.76 $102,527.00 $0.0001-163-1-5111 SALARIES $86,418.28 $0.00 $0.00
$0.00 $800.00 $0.0001-163-1-5143 LONGEVITY $800.00 $0.00 $0.00$4,033.22 $4,200.00 $0.0001-163-1-5191 BOARD OF REGISTRARS STIPEND $3,416.57 $0.00 $0.00
PERSONNEL Total: $96,678.98 $107,527.00 $0.00$90,634.85 $0.00 $0.00
EXPENSES$11,202.21 $14,000.00 $0.0001-163-2-5386 CITY CENSUS $10,208.24 $0.00 $0.00
$0.00 $500.00 $0.0001-163-2-5387 RECOUNTS $0.00 $0.00 $0.00$1,525.00 $2,650.00 $0.0001-163-2-5389 STREET LISTS $2,235.00 $0.00 $0.00
$0.00 $870.00 $0.0001-163-2-5710 PROFESSIONAL DEVELOPMENT $0.00 $0.00 $0.00
EXPENSES Total: $12,727.21 $18,020.00 $0.00$12,443.24 $0.00 $0.00
$109,406.19 $125,547.00 $0.00163 VOTER REGISTRATIONS Total: $103,078.09 $0.00 $0.00
158
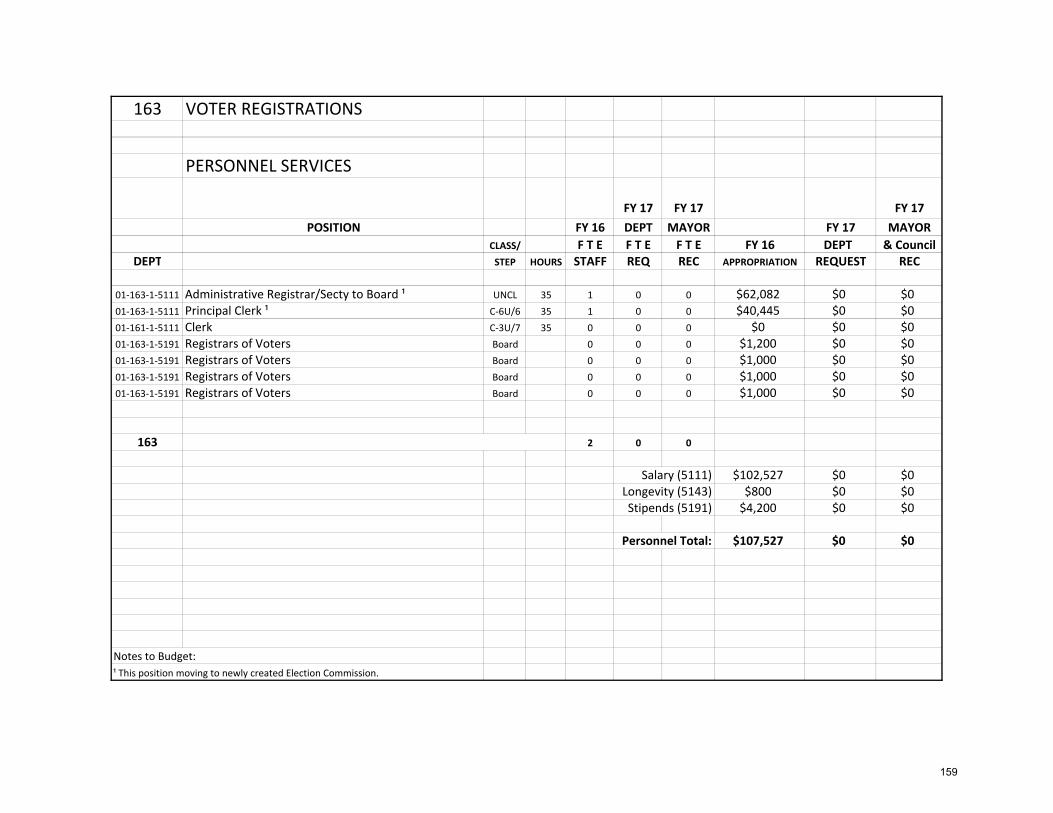
163 VOTER REGISTRATIONS
PERSONNEL SERVICES
FY 17 FY 17 FY 17POSITION FY 16 DEPT MAYOR FY 17 MAYOR
CLASS/ F T E F T E F T E FY 16 DEPT & CouncilDEPT STEP HOURS STAFF REQ REC APPROPRIATION REQUEST REC
01‐163‐1‐5111 Administrative Registrar/Secty to Board ¹ UNCL 35 1 0 0 $62,082 $0 $001‐163‐1‐5111 Principal Clerk ¹ C‐6U/6 35 1 0 0 $40,445 $0 $001‐161‐1‐5111 Clerk C‐3U/7 35 0 0 0 $0 $0 $001‐163‐1‐5191 Registrars of Voters Board 0 0 0 $1,200 $0 $001‐163‐1‐5191 Registrars of Voters Board 0 0 0 $1,000 $0 $001‐163‐1‐5191 Registrars of Voters Board 0 0 0 $1,000 $0 $001‐163‐1‐5191 Registrars of Voters Board 0 0 0 $1,000 $0 $0
163 2 0 0
Salary (5111) $102,527 $0 $0Longevity (5143) $800 $0 $0Stipends (5191) $4,200 $0 $0
Personnel Total: $107,527 $0 $0
Notes to Budget:¹ This position moving to newly created Election Commission.
159
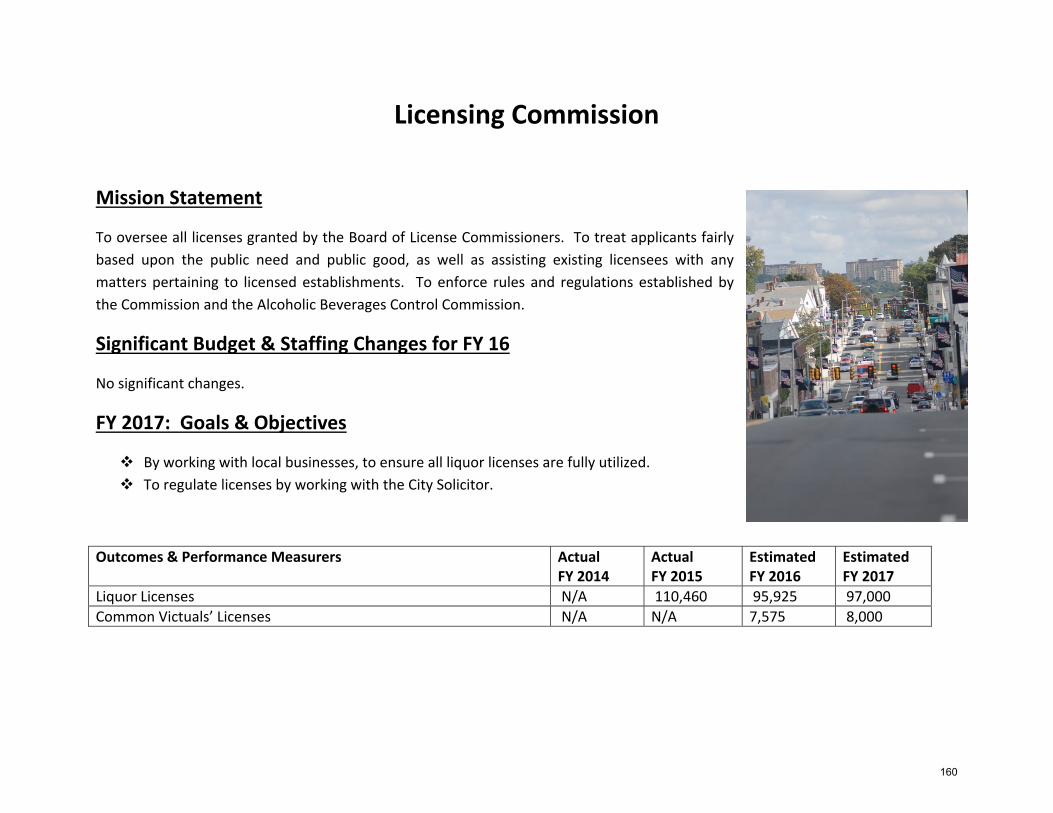
Licensing Commission
Mission Statement
To oversee all licenses granted by the Board of License Commissioners. To treat applicants fairly based upon the public need and public good, as well as assisting existing licensees with any matters pertaining to licensed establishments. To enforce rules and regulations established by the Commission and the Alcoholic Beverages Control Commission.
Significant Budget & Staffing Changes for FY 16
No significant changes.
FY 2017: Goals & Objectives
By working with local businesses, to ensure all liquor licenses are fully utilized. To regulate licenses by working with the City Solicitor.
Outcomes & Performance Measurers Actual FY 2014
Actual FY 2015
Estimated FY 2016
Estimated FY 2017
Liquor Licenses N/A 110,460 95,925 97,000 Common Victuals’ Licenses N/A N/A 7,575 8,000
160
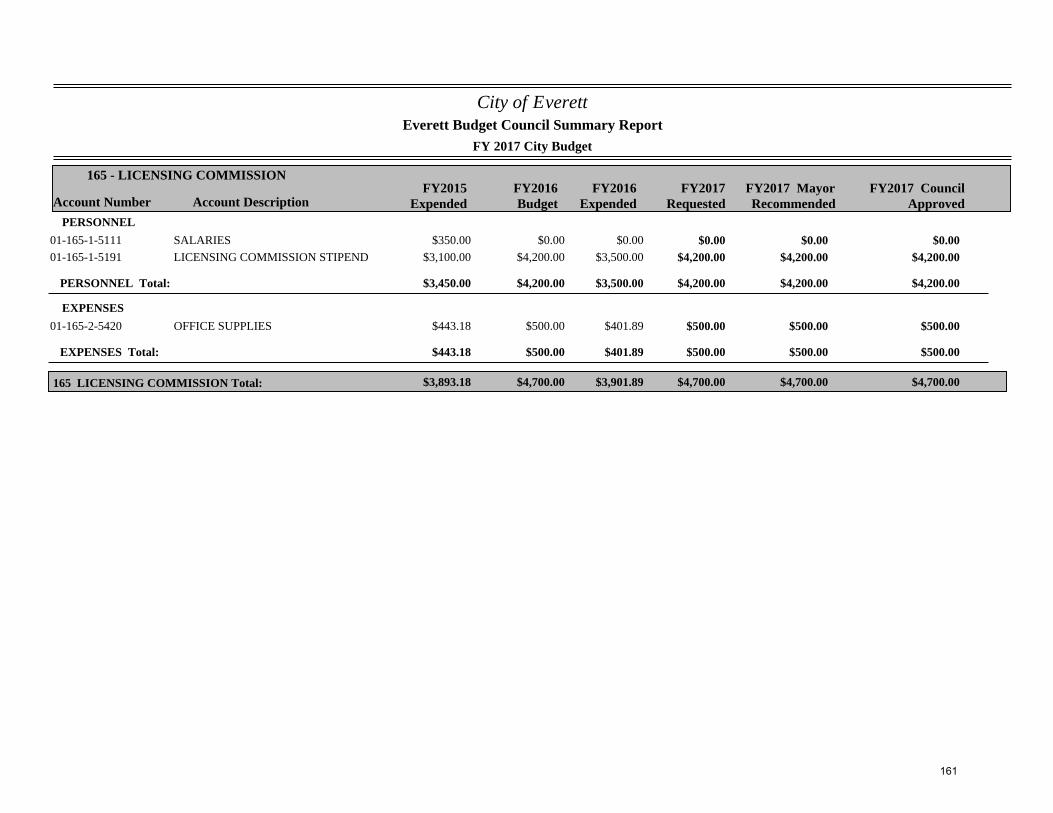
City of Everett
FY 2017 City Budget
Account Number Account DescriptionFY2015
ExpendedFY2016Budget
FY2017Requested
165 - LICENSING COMMISSION
Everett Budget Council Summary Report
FY2017 MayorRecommended
FY2016Expended
FY2017 CouncilApproved
PERSONNEL$350.00 $0.00 $0.0001-165-1-5111 SALARIES $0.00 $0.00 $0.00
$3,100.00 $4,200.00 $4,200.0001-165-1-5191 LICENSING COMMISSION STIPEND $3,500.00 $4,200.00 $4,200.00
PERSONNEL Total: $3,450.00 $4,200.00 $4,200.00$3,500.00 $4,200.00 $4,200.00
EXPENSES$443.18 $500.00 $500.0001-165-2-5420 OFFICE SUPPLIES $401.89 $500.00 $500.00
EXPENSES Total: $443.18 $500.00 $500.00$401.89 $500.00 $500.00
$3,893.18 $4,700.00 $4,700.00165 LICENSING COMMISSION Total: $3,901.89 $4,700.00 $4,700.00
161
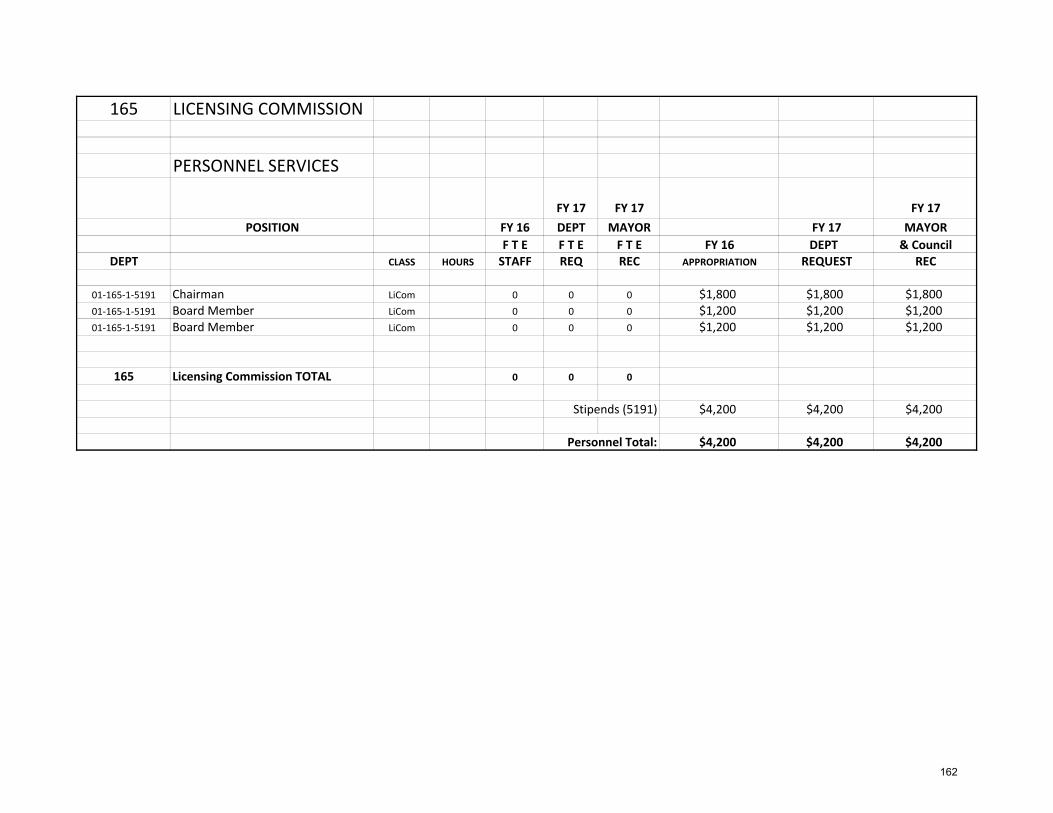
165 LICENSING COMMISSION
PERSONNEL SERVICES
FY 17 FY 17 FY 17POSITION FY 16 DEPT MAYOR FY 17 MAYOR
F T E F T E F T E FY 16 DEPT & CouncilDEPT CLASS HOURS STAFF REQ REC APPROPRIATION REQUEST REC
01‐165‐1‐5191 Chairman LiCom 0 0 0 $1,800 $1,800 $1,80001‐165‐1‐5191 Board Member LiCom 0 0 0 $1,200 $1,200 $1,20001‐165‐1‐5191 Board Member LiCom 0 0 0 $1,200 $1,200 $1,200
165 Licensing Commission TOTAL 0 0 0
Stipends (5191) $4,200 $4,200 $4,200
Personnel Total: $4,200 $4,200 $4,200
162
Conservation Commission
Mission Statement
To protect the wetlands of the City by controlling the activities deemed to have a significant effect upon wetland values, including but not limited to the following: public or private water supply, groundwater, flood control, erosion control, storm damage prevention, water pollution, fisheries, shellfish, wildlife, recreations and aesthetics. The control of activities is achieved through permitting required under Chapter 131 Section 40 of Massachusetts General Laws (The Wetlands Protection Act).
Significant Budget & Staffing Changes for FY 16
No significant changes.
FY 2017: Goals & Objectives
To protect wetlands by identifying and planning for acquisition of key wetland and buffer properties.
To protect open space by participating in long range planning for protection of open space and working with other city departments to keep these plans current and updated.
Outcomes & Performance Measurers Actual FY 2014
Actual FY 2015
Actual FY 2016
Estimated FY 2017
Notices of Intent considered *TBD Orders of Conditions issued *TBD Full Certificates of Compliance issued *TBD *Conservation Commissioner has retired. Information will be available in FY2018 budget.
163
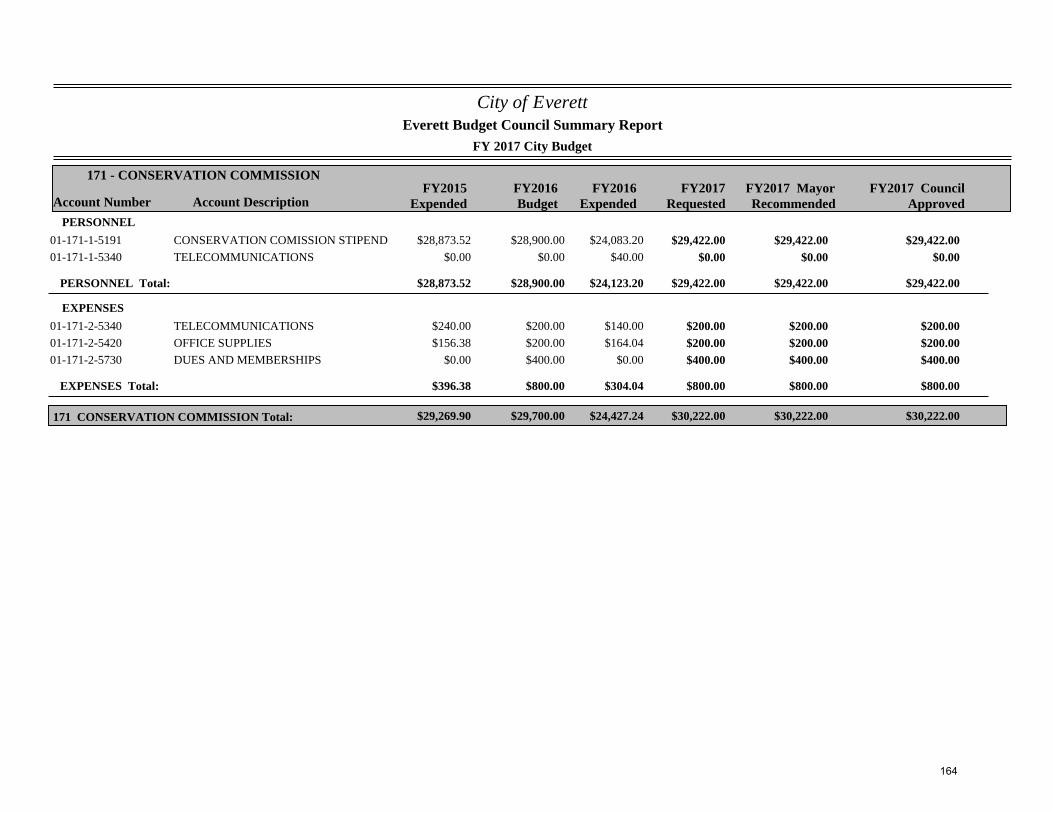
City of Everett
FY 2017 City Budget
Account Number Account DescriptionFY2015
ExpendedFY2016Budget
FY2017Requested
171 - CONSERVATION COMMISSION
Everett Budget Council Summary Report
FY2017 MayorRecommended
FY2016Expended
FY2017 CouncilApproved
PERSONNEL$28,873.52 $28,900.00 $29,422.0001-171-1-5191 CONSERVATION COMISSION STIPEND $24,083.20 $29,422.00 $29,422.00
$0.00 $0.00 $0.0001-171-1-5340 TELECOMMUNICATIONS $40.00 $0.00 $0.00
PERSONNEL Total: $28,873.52 $28,900.00 $29,422.00$24,123.20 $29,422.00 $29,422.00
EXPENSES$240.00 $200.00 $200.0001-171-2-5340 TELECOMMUNICATIONS $140.00 $200.00 $200.00$156.38 $200.00 $200.0001-171-2-5420 OFFICE SUPPLIES $164.04 $200.00 $200.00
$0.00 $400.00 $400.0001-171-2-5730 DUES AND MEMBERSHIPS $0.00 $400.00 $400.00
EXPENSES Total: $396.38 $800.00 $800.00$304.04 $800.00 $800.00
$29,269.90 $29,700.00 $30,222.00171 CONSERVATION COMMISSION Total: $24,427.24 $30,222.00 $30,222.00
164
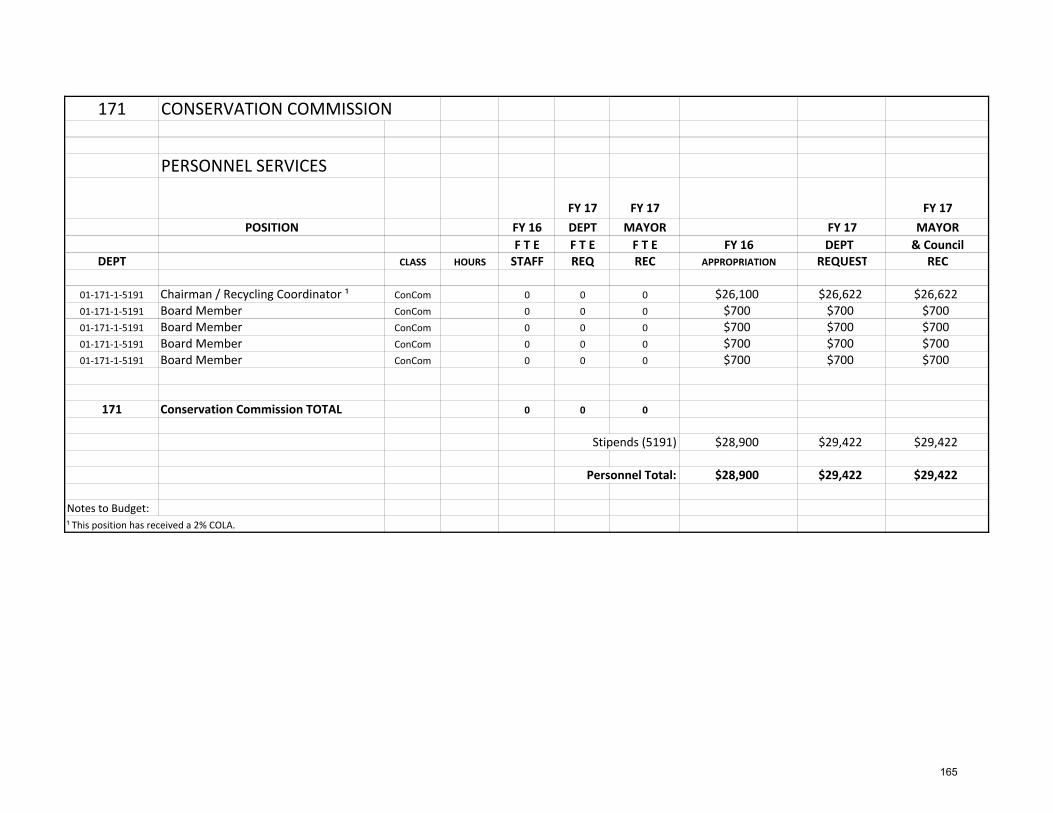
171 CONSERVATION COMMISSION
PERSONNEL SERVICES
FY 17 FY 17 FY 17POSITION FY 16 DEPT MAYOR FY 17 MAYOR
F T E F T E F T E FY 16 DEPT & CouncilDEPT CLASS HOURS STAFF REQ REC APPROPRIATION REQUEST REC
01‐171‐1‐5191 Chairman / Recycling Coordinator ¹ ConCom 0 0 0 $26,100 $26,622 $26,62201‐171‐1‐5191 Board Member ConCom 0 0 0 $700 $700 $70001‐171‐1‐5191 Board Member ConCom 0 0 0 $700 $700 $70001‐171‐1‐5191 Board Member ConCom 0 0 0 $700 $700 $70001‐171‐1‐5191 Board Member ConCom 0 0 0 $700 $700 $700
171 Conservation Commission TOTAL 0 0 0
Stipends (5191) $28,900 $29,422 $29,422
Personnel Total: $28,900 $29,422 $29,422
Notes to Budget:¹ This position has received a 2% COLA.
165
Planning Board
Mission Statement
To guide the development of land and growth within the City of Everett. In accordance with the City of Everett Zoning Ordinance and state statute, the Planning Board reviews and approves commercial and residential development.
Significant Budget & Staffing Changes for FY 16
No significant changes.
FY 2017: Goals & Objectives
To ensure compliance with state laws and local ordinances. To effectively work with other local boards and commissions reviewing
development projects. To enhance the future development of the city.
Outcomes & Performance Measurers Actual FY 2014
Actual FY 2015
Estimated FY 2016
Estimated FY 2017
Special Permits TBD Site Plan Reviews TBD
166
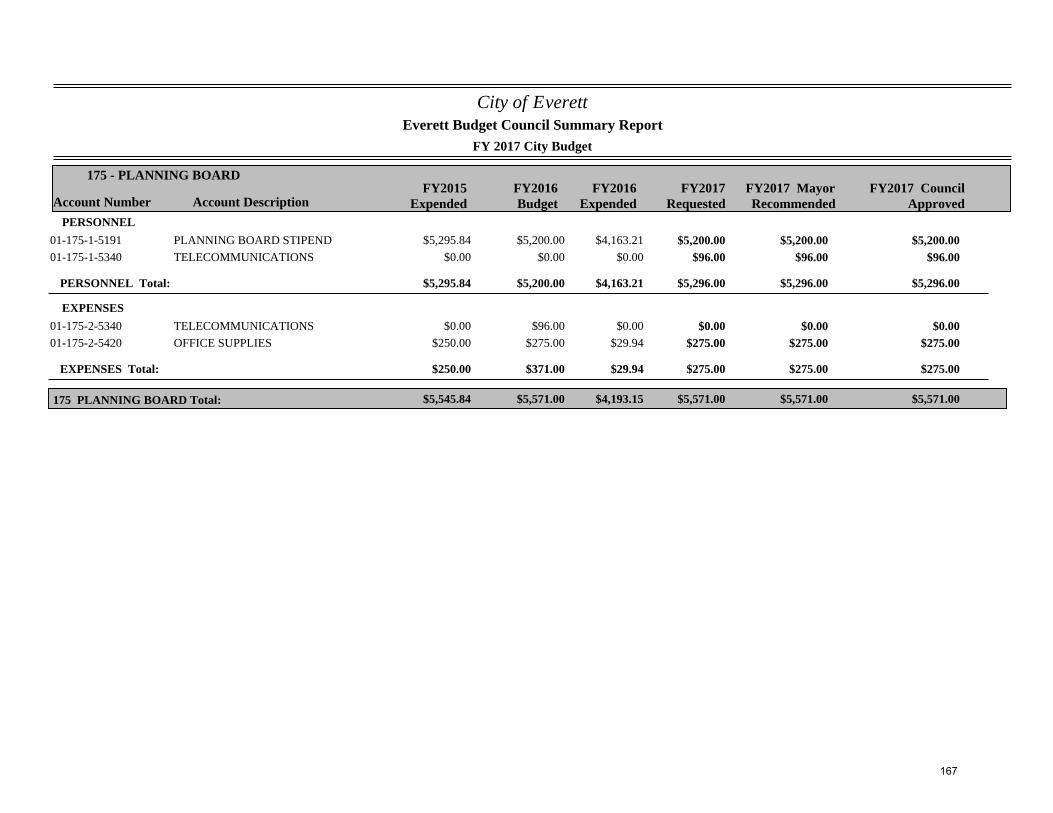
City of Everett
FY 2017 City Budget
Account Number Account DescriptionFY2015
ExpendedFY2016Budget
FY2017Requested
175 - PLANNING BOARD
Everett Budget Council Summary Report
FY2017 MayorRecommended
FY2016Expended
FY2017 CouncilApproved
PERSONNEL$5,295.84 $5,200.00 $5,200.0001-175-1-5191 PLANNING BOARD STIPEND $4,163.21 $5,200.00 $5,200.00
$0.00 $0.00 $96.0001-175-1-5340 TELECOMMUNICATIONS $0.00 $96.00 $96.00
PERSONNEL Total: $5,295.84 $5,200.00 $5,296.00$4,163.21 $5,296.00 $5,296.00
EXPENSES$0.00 $96.00 $0.0001-175-2-5340 TELECOMMUNICATIONS $0.00 $0.00 $0.00
$250.00 $275.00 $275.0001-175-2-5420 OFFICE SUPPLIES $29.94 $275.00 $275.00
EXPENSES Total: $250.00 $371.00 $275.00$29.94 $275.00 $275.00
$5,545.84 $5,571.00 $5,571.00175 PLANNING BOARD Total: $4,193.15 $5,571.00 $5,571.00
167
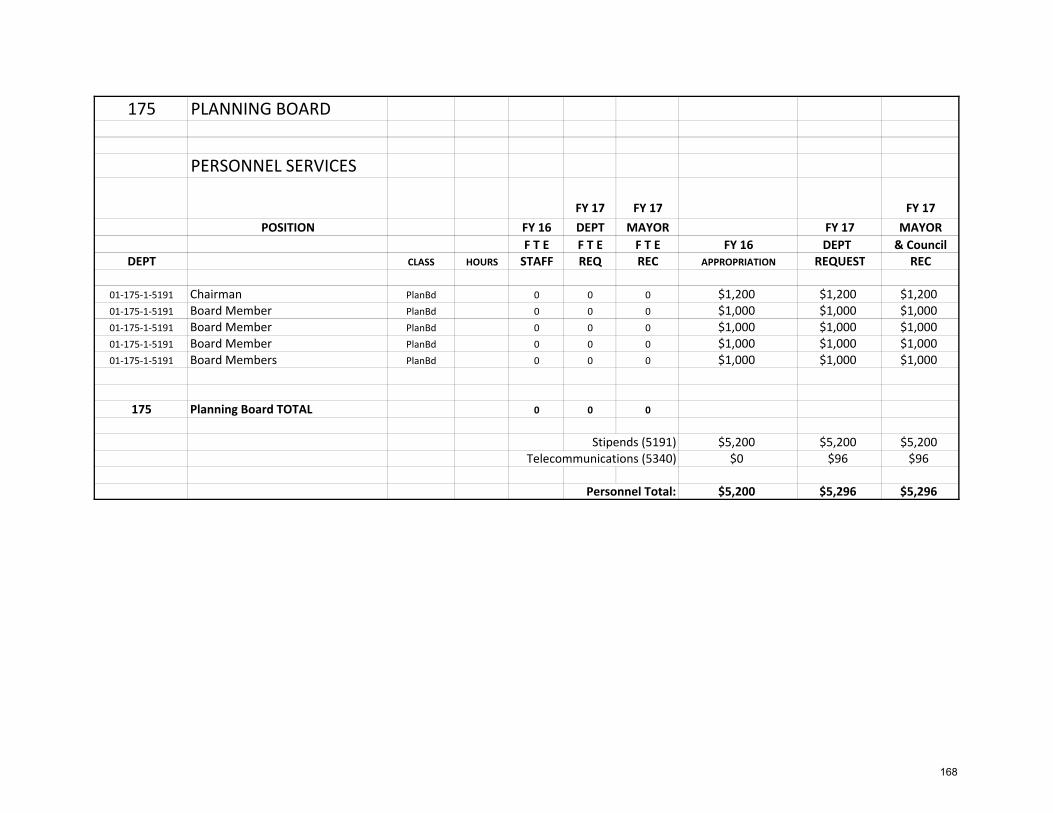
175 PLANNING BOARD
PERSONNEL SERVICES
FY 17 FY 17 FY 17POSITION FY 16 DEPT MAYOR FY 17 MAYOR
F T E F T E F T E FY 16 DEPT & CouncilDEPT CLASS HOURS STAFF REQ REC APPROPRIATION REQUEST REC
01‐175‐1‐5191 Chairman PlanBd 0 0 0 $1,200 $1,200 $1,20001‐175‐1‐5191 Board Member PlanBd 0 0 0 $1,000 $1,000 $1,00001‐175‐1‐5191 Board Member PlanBd 0 0 0 $1,000 $1,000 $1,00001‐175‐1‐5191 Board Member PlanBd 0 0 0 $1,000 $1,000 $1,00001‐175‐1‐5191 Board Members PlanBd 0 0 0 $1,000 $1,000 $1,000
175 Planning Board TOTAL 0 0 0
Stipends (5191) $5,200 $5,200 $5,200Telecommunications (5340) $0 $96 $96
Personnel Total: $5,200 $5,296 $5,296
168
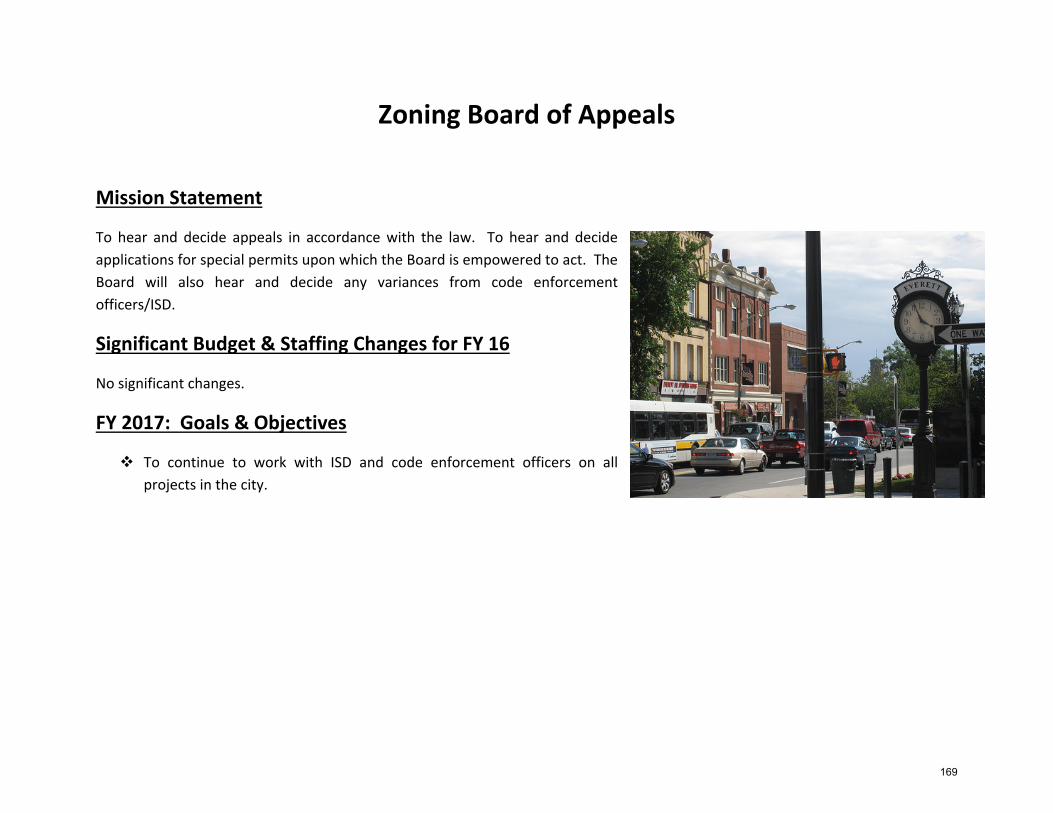
Zoning Board of Appeals
Mission Statement
To hear and decide appeals in accordance with the law. To hear and decide applications for special permits upon which the Board is empowered to act. The Board will also hear and decide any variances from code enforcement officers/ISD.
Significant Budget & Staffing Changes for FY 16
No significant changes.
FY 2017: Goals & Objectives
To continue to work with ISD and code enforcement officers on all projects in the city.
169
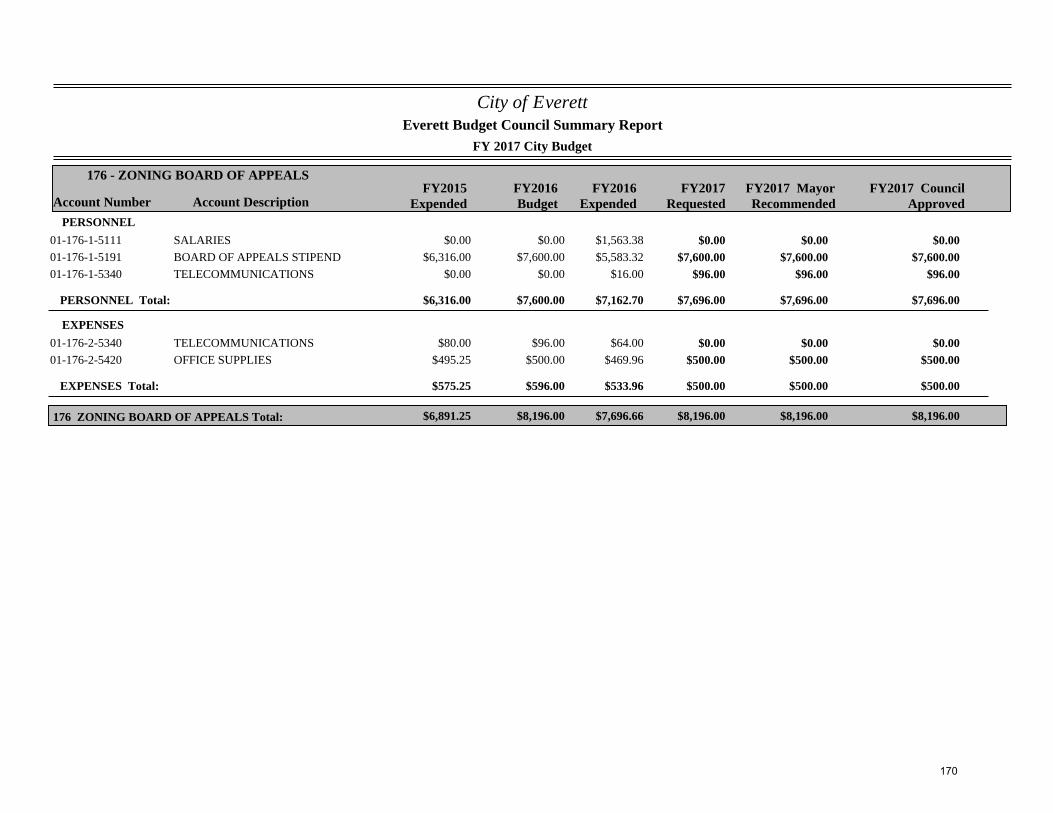
City of Everett
FY 2017 City Budget
Account Number Account DescriptionFY2015
ExpendedFY2016Budget
FY2017Requested
176 - ZONING BOARD OF APPEALS
Everett Budget Council Summary Report
FY2017 MayorRecommended
FY2016Expended
FY2017 CouncilApproved
PERSONNEL$0.00 $0.00 $0.0001-176-1-5111 SALARIES $1,563.38 $0.00 $0.00
$6,316.00 $7,600.00 $7,600.0001-176-1-5191 BOARD OF APPEALS STIPEND $5,583.32 $7,600.00 $7,600.00$0.00 $0.00 $96.0001-176-1-5340 TELECOMMUNICATIONS $16.00 $96.00 $96.00
PERSONNEL Total: $6,316.00 $7,600.00 $7,696.00$7,162.70 $7,696.00 $7,696.00
EXPENSES$80.00 $96.00 $0.0001-176-2-5340 TELECOMMUNICATIONS $64.00 $0.00 $0.00
$495.25 $500.00 $500.0001-176-2-5420 OFFICE SUPPLIES $469.96 $500.00 $500.00
EXPENSES Total: $575.25 $596.00 $500.00$533.96 $500.00 $500.00
$6,891.25 $8,196.00 $8,196.00176 ZONING BOARD OF APPEALS Total: $7,696.66 $8,196.00 $8,196.00
170
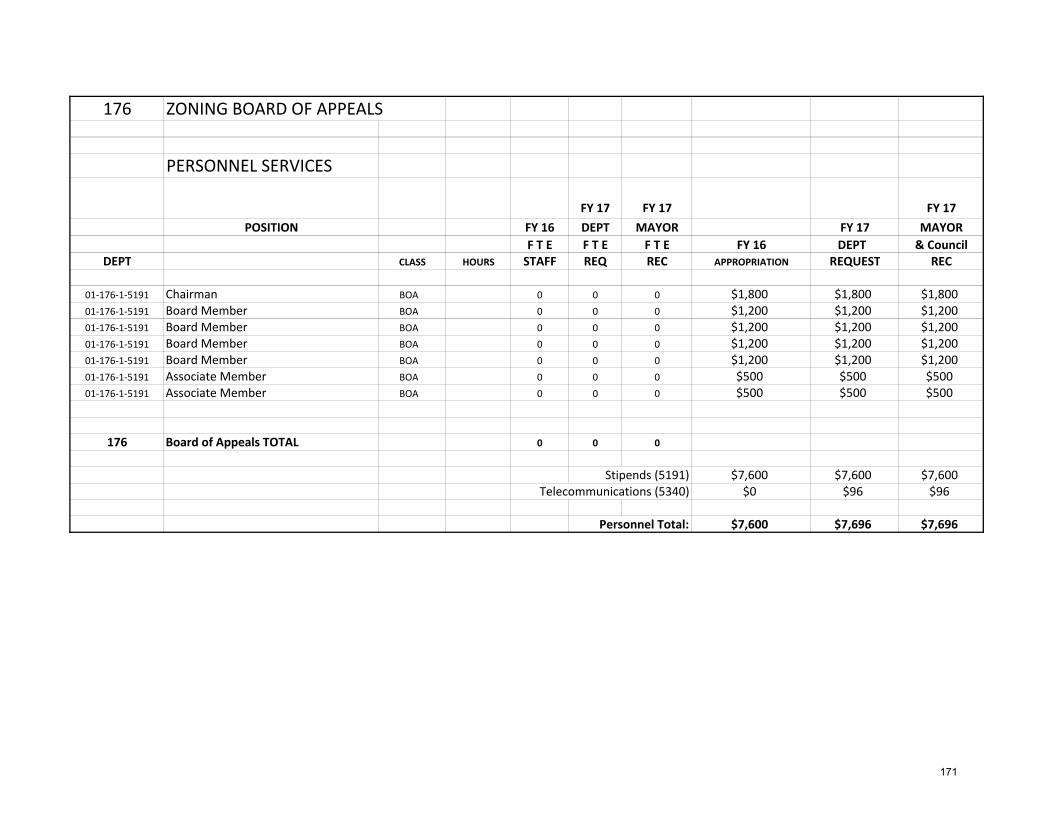
176 ZONING BOARD OF APPEALS
PERSONNEL SERVICES
FY 17 FY 17 FY 17POSITION FY 16 DEPT MAYOR FY 17 MAYOR
F T E F T E F T E FY 16 DEPT & CouncilDEPT CLASS HOURS STAFF REQ REC APPROPRIATION REQUEST REC
01‐176‐1‐5191 Chairman BOA 0 0 0 $1,800 $1,800 $1,80001‐176‐1‐5191 Board Member BOA 0 0 0 $1,200 $1,200 $1,20001‐176‐1‐5191 Board Member BOA 0 0 0 $1,200 $1,200 $1,20001‐176‐1‐5191 Board Member BOA 0 0 0 $1,200 $1,200 $1,20001‐176‐1‐5191 Board Member BOA 0 0 0 $1,200 $1,200 $1,20001‐176‐1‐5191 Associate Member BOA 0 0 0 $500 $500 $50001‐176‐1‐5191 Associate Member BOA 0 0 0 $500 $500 $500
176 Board of Appeals TOTAL 0 0 0
Stipends (5191) $7,600 $7,600 $7,600Telecommunications (5340) $0 $96 $96
Personnel Total: $7,600 $7,696 $7,696
171
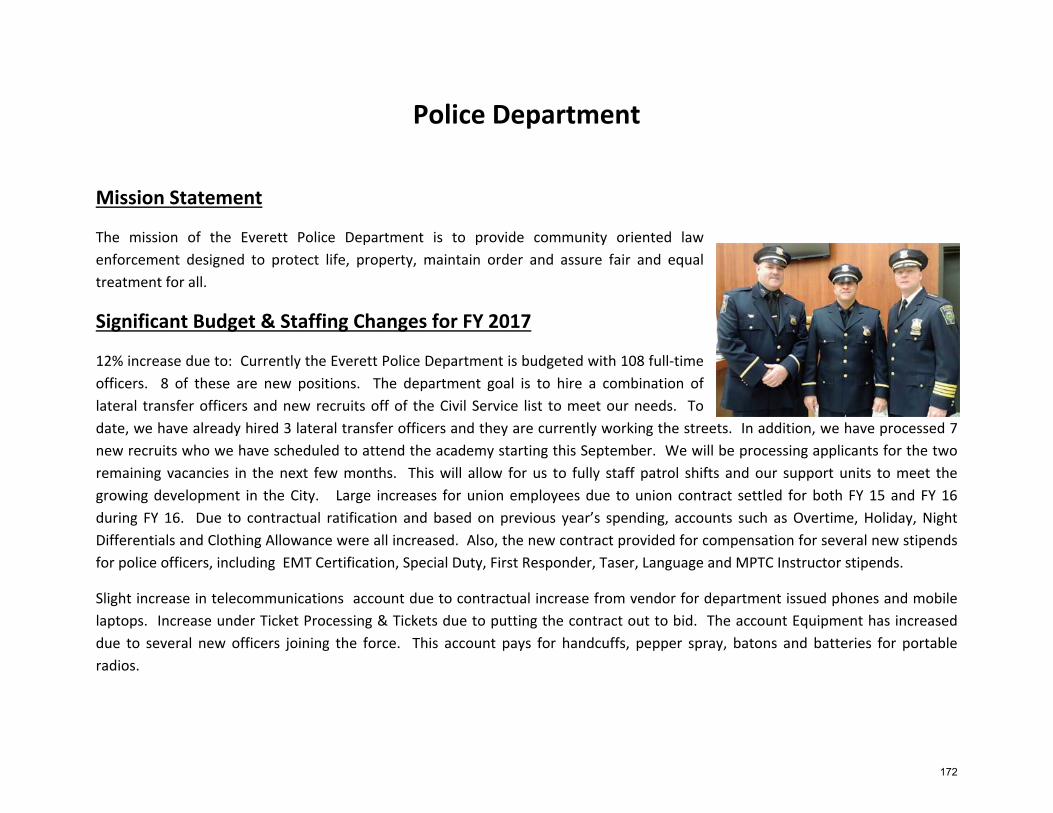
Police Department
Mission Statement
The mission of the Everett Police Department is to provide community oriented law enforcement designed to protect life, property, maintain order and assure fair and equal treatment for all.
Significant Budget & Staffing Changes for FY 2017
12% increase due to: Currently the Everett Police Department is budgeted with 108 full‐time officers. 8 of these are new positions. The department goal is to hire a combination of lateral transfer officers and new recruits off of the Civil Service list to meet our needs. To date, we have already hired 3 lateral transfer officers and they are currently working the streets. In addition, we have processed 7 new recruits who we have scheduled to attend the academy starting this September. We will be processing applicants for the two remaining vacancies in the next few months. This will allow for us to fully staff patrol shifts and our support units to meet the growing development in the City. Large increases for union employees due to union contract settled for both FY 15 and FY 16 during FY 16. Due to contractual ratification and based on previous year’s spending, accounts such as Overtime, Holiday, Night Differentials and Clothing Allowance were all increased. Also, the new contract provided for compensation for several new stipends for police officers, including EMT Certification, Special Duty, First Responder, Taser, Language and MPTC Instructor stipends.
Slight increase in telecommunications account due to contractual increase from vendor for department issued phones and mobile laptops. Increase under Ticket Processing & Tickets due to putting the contract out to bid. The account Equipment has increased due to several new officers joining the force. This account pays for handcuffs, pepper spray, batons and batteries for portable radios.
172
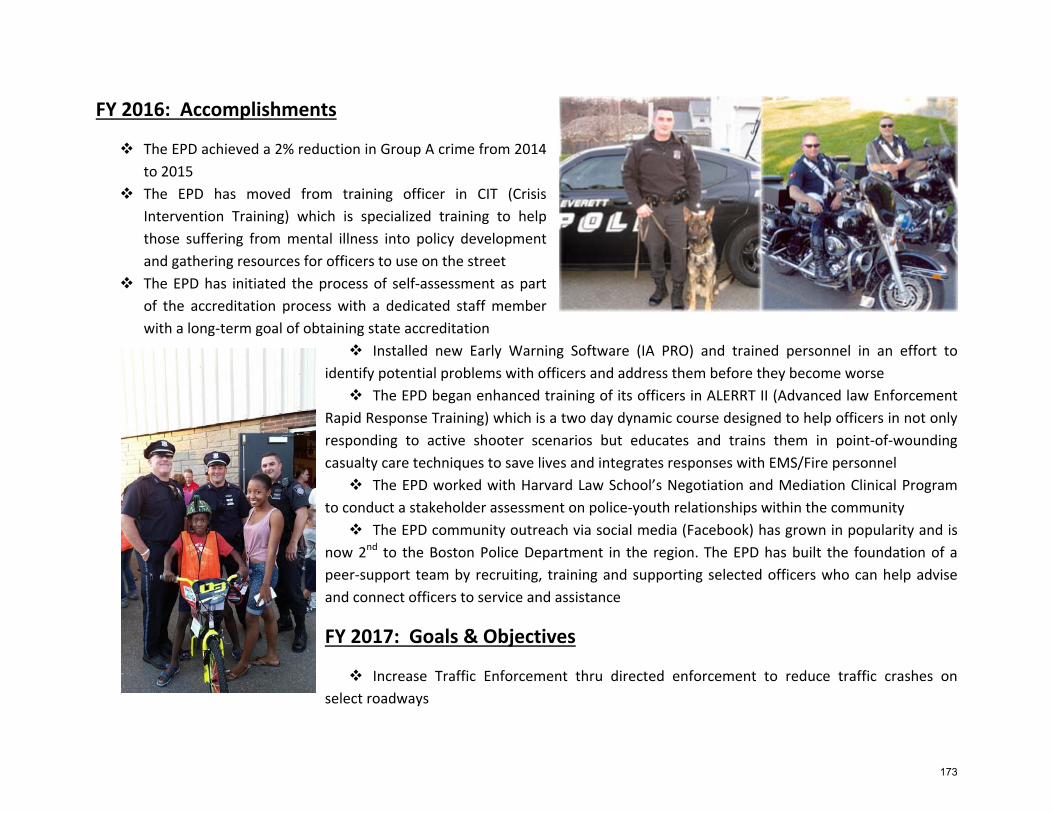
FY 2016: Accomplishments
The EPD achieved a 2% reduction in Group A crime from 2014 to 2015
The EPD has moved from training officer in CIT (Crisis Intervention Training) which is specialized training to help those suffering from mental illness into policy development and gathering resources for officers to use on the street
The EPD has initiated the process of self‐assessment as part of the accreditation process with a dedicated staff member with a long‐term goal of obtaining state accreditation
Installed new Early Warning Software (IA PRO) and trained personnel in an effort to identify potential problems with officers and address them before they become worse The EPD began enhanced training of its officers in ALERRT II (Advanced law Enforcement
Rapid Response Training) which is a two day dynamic course designed to help officers in not only responding to active shooter scenarios but educates and trains them in point‐of‐wounding casualty care techniques to save lives and integrates responses with EMS/Fire personnel The EPD worked with Harvard Law School’s Negotiation and Mediation Clinical Program
to conduct a stakeholder assessment on police‐youth relationships within the community The EPD community outreach via social media (Facebook) has grown in popularity and is
now 2nd to the Boston Police Department in the region. The EPD has built the foundation of a peer‐support team by recruiting, training and supporting selected officers who can help advise and connect officers to service and assistance
FY 2017: Goals & Objectives
Increase Traffic Enforcement thru directed enforcement to reduce traffic crashes on select roadways
173
Continue to improve police community relations, by kicking off new EPD Community Partnership Council that will include a wide range of community stakeholders in an effort to provide two‐way communications to the public, provide solutions to community programs, enhance dialogue and educate the public on crime related matters
Establish a Cops Corner initiative at Everett High School cafeteria with the emphasis on building positive relationships with youth that will result in longer term reductions in your related crime
Submit plan and work to meet the goals of the five‐year strategic plan that will be the blueprint for the EPD’s future staffing levels and services provided
Increase our presence and positive contacts in neighborhoods by rebuilding and deploying the Mountain Bicycle Unit
Outcomes & Performance Measurers Actual FY 2014
Actual FY 2015
Estimated FY 2016
Estimated FY 2017
Calls for Service 31,548 28,629 32,023 32,983 Arrests 859 888 878 894 Protective Custody 25 28 27 24 Robberies 68 36 46 43 Break and Entering 148 162 120 94 Sexual Assaults including fondling 14 37 29 30 MV Thefts 102 86 72 59 Thefts from a Motor Vehicle 177 178 144 119 Larceny – all others including shoplifting, theft from a building 656 639 628 619
174
Outcomes & Performance Measurers (continued) Actual FY 2014
Actual FY 2015
Estimated FY 2016
Estimated FY 2017
All Assaults including domestics with arrest 379 405 372 348 MV Accidents all types 1,235 1,273 1,267 1,284 MV Citations all types 3,044 2,927 3,084 3,193
175
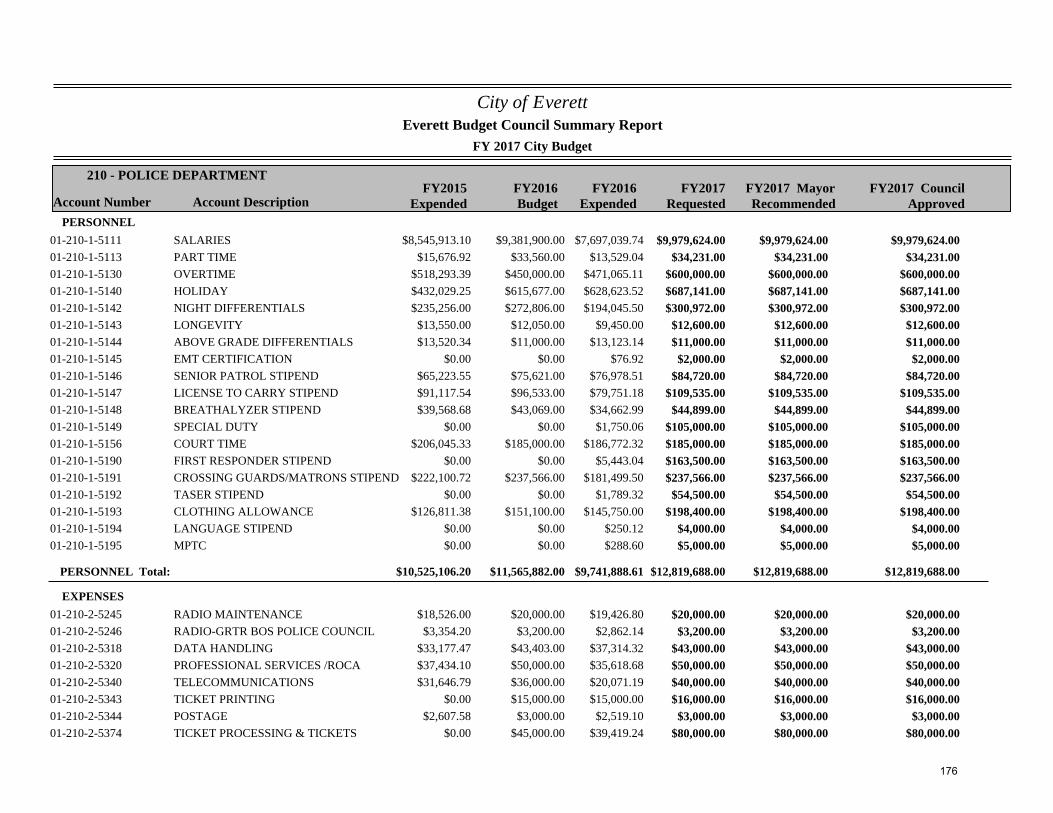
City of Everett
FY 2017 City Budget
Account Number Account DescriptionFY2015
ExpendedFY2016Budget
FY2017Requested
210 - POLICE DEPARTMENT
Everett Budget Council Summary Report
FY2017 MayorRecommended
FY2016Expended
FY2017 CouncilApproved
PERSONNEL$8,545,913.10 $9,381,900.00 $9,979,624.0001-210-1-5111 SALARIES $7,697,039.74 $9,979,624.00 $9,979,624.00
$15,676.92 $33,560.00 $34,231.0001-210-1-5113 PART TIME $13,529.04 $34,231.00 $34,231.00$518,293.39 $450,000.00 $600,000.0001-210-1-5130 OVERTIME $471,065.11 $600,000.00 $600,000.00$432,029.25 $615,677.00 $687,141.0001-210-1-5140 HOLIDAY $628,623.52 $687,141.00 $687,141.00$235,256.00 $272,806.00 $300,972.0001-210-1-5142 NIGHT DIFFERENTIALS $194,045.50 $300,972.00 $300,972.00
$13,550.00 $12,050.00 $12,600.0001-210-1-5143 LONGEVITY $9,450.00 $12,600.00 $12,600.00$13,520.34 $11,000.00 $11,000.0001-210-1-5144 ABOVE GRADE DIFFERENTIALS $13,123.14 $11,000.00 $11,000.00
$0.00 $0.00 $2,000.0001-210-1-5145 EMT CERTIFICATION $76.92 $2,000.00 $2,000.00$65,223.55 $75,621.00 $84,720.0001-210-1-5146 SENIOR PATROL STIPEND $76,978.51 $84,720.00 $84,720.00$91,117.54 $96,533.00 $109,535.0001-210-1-5147 LICENSE TO CARRY STIPEND $79,751.18 $109,535.00 $109,535.00$39,568.68 $43,069.00 $44,899.0001-210-1-5148 BREATHALYZER STIPEND $34,662.99 $44,899.00 $44,899.00
$0.00 $0.00 $105,000.0001-210-1-5149 SPECIAL DUTY $1,750.06 $105,000.00 $105,000.00$206,045.33 $185,000.00 $185,000.0001-210-1-5156 COURT TIME $186,772.32 $185,000.00 $185,000.00
$0.00 $0.00 $163,500.0001-210-1-5190 FIRST RESPONDER STIPEND $5,443.04 $163,500.00 $163,500.00$222,100.72 $237,566.00 $237,566.0001-210-1-5191 CROSSING GUARDS/MATRONS STIPEND $181,499.50 $237,566.00 $237,566.00
$0.00 $0.00 $54,500.0001-210-1-5192 TASER STIPEND $1,789.32 $54,500.00 $54,500.00$126,811.38 $151,100.00 $198,400.0001-210-1-5193 CLOTHING ALLOWANCE $145,750.00 $198,400.00 $198,400.00
$0.00 $0.00 $4,000.0001-210-1-5194 LANGUAGE STIPEND $250.12 $4,000.00 $4,000.00$0.00 $0.00 $5,000.0001-210-1-5195 MPTC $288.60 $5,000.00 $5,000.00
PERSONNEL Total: $10,525,106.20 $11,565,882.00 $12,819,688.00$9,741,888.61 $12,819,688.00 $12,819,688.00
EXPENSES$18,526.00 $20,000.00 $20,000.0001-210-2-5245 RADIO MAINTENANCE $19,426.80 $20,000.00 $20,000.00$3,354.20 $3,200.00 $3,200.0001-210-2-5246 RADIO-GRTR BOS POLICE COUNCIL $2,862.14 $3,200.00 $3,200.00
$33,177.47 $43,403.00 $43,000.0001-210-2-5318 DATA HANDLING $37,314.32 $43,000.00 $43,000.00$37,434.10 $50,000.00 $50,000.0001-210-2-5320 PROFESSIONAL SERVICES /ROCA $35,618.68 $50,000.00 $50,000.00$31,646.79 $36,000.00 $40,000.0001-210-2-5340 TELECOMMUNICATIONS $20,071.19 $40,000.00 $40,000.00
$0.00 $15,000.00 $16,000.0001-210-2-5343 TICKET PRINTING $15,000.00 $16,000.00 $16,000.00$2,607.58 $3,000.00 $3,000.0001-210-2-5344 POSTAGE $2,519.10 $3,000.00 $3,000.00
$0.00 $45,000.00 $80,000.0001-210-2-5374 TICKET PROCESSING & TICKETS $39,419.24 $80,000.00 $80,000.00
176
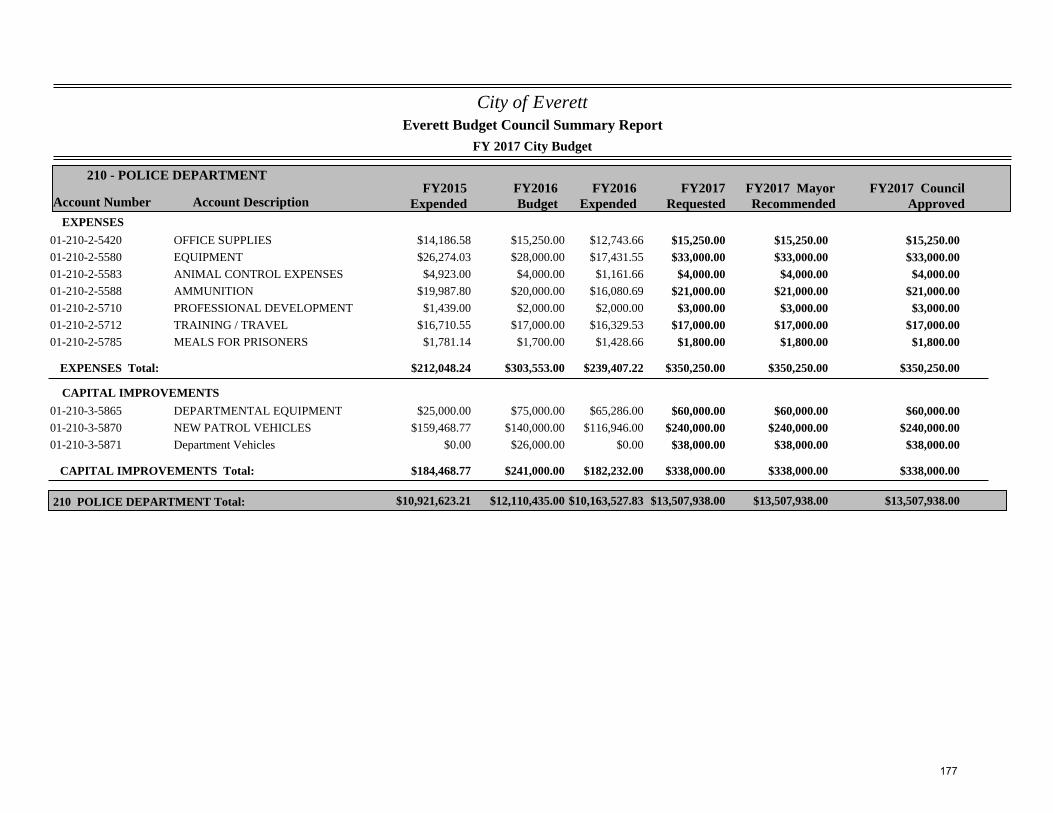
City of Everett
FY 2017 City Budget
Account Number Account DescriptionFY2015
ExpendedFY2016Budget
FY2017Requested
210 - POLICE DEPARTMENT
Everett Budget Council Summary Report
FY2017 MayorRecommended
FY2016Expended
FY2017 CouncilApproved
EXPENSES$14,186.58 $15,250.00 $15,250.0001-210-2-5420 OFFICE SUPPLIES $12,743.66 $15,250.00 $15,250.00$26,274.03 $28,000.00 $33,000.0001-210-2-5580 EQUIPMENT $17,431.55 $33,000.00 $33,000.00$4,923.00 $4,000.00 $4,000.0001-210-2-5583 ANIMAL CONTROL EXPENSES $1,161.66 $4,000.00 $4,000.00
$19,987.80 $20,000.00 $21,000.0001-210-2-5588 AMMUNITION $16,080.69 $21,000.00 $21,000.00$1,439.00 $2,000.00 $3,000.0001-210-2-5710 PROFESSIONAL DEVELOPMENT $2,000.00 $3,000.00 $3,000.00
$16,710.55 $17,000.00 $17,000.0001-210-2-5712 TRAINING / TRAVEL $16,329.53 $17,000.00 $17,000.00$1,781.14 $1,700.00 $1,800.0001-210-2-5785 MEALS FOR PRISONERS $1,428.66 $1,800.00 $1,800.00
EXPENSES Total: $212,048.24 $303,553.00 $350,250.00$239,407.22 $350,250.00 $350,250.00
CAPITAL IMPROVEMENTS$25,000.00 $75,000.00 $60,000.0001-210-3-5865 DEPARTMENTAL EQUIPMENT $65,286.00 $60,000.00 $60,000.00
$159,468.77 $140,000.00 $240,000.0001-210-3-5870 NEW PATROL VEHICLES $116,946.00 $240,000.00 $240,000.00$0.00 $26,000.00 $38,000.0001-210-3-5871 Department Vehicles $0.00 $38,000.00 $38,000.00
CAPITAL IMPROVEMENTS Total: $184,468.77 $241,000.00 $338,000.00$182,232.00 $338,000.00 $338,000.00
$10,921,623.21 $12,110,435.00 $13,507,938.00210 POLICE DEPARTMENT Total: $10,163,527.83 $13,507,938.00 $13,507,938.00
177
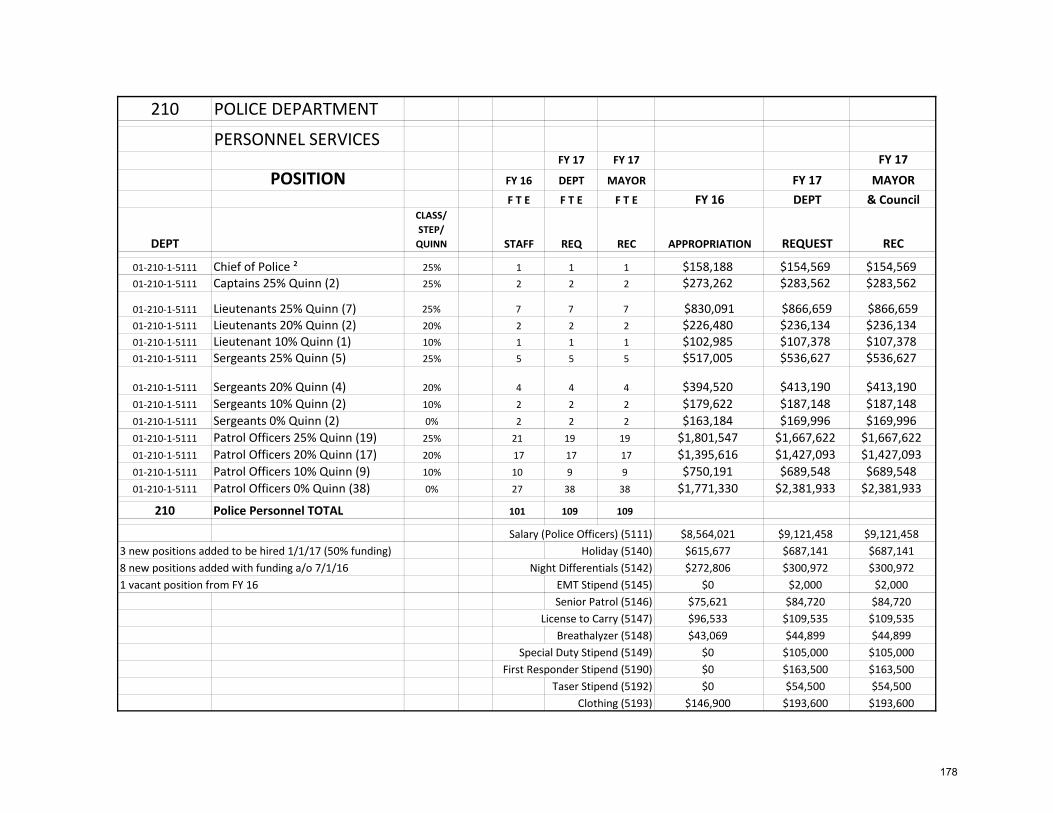
210 POLICE DEPARTMENT
PERSONNEL SERVICESFY 17 FY 17 FY 17
POSITION FY 16 DEPT MAYOR FY 17 MAYOR F T E F T E F T E FY 16 DEPT & Council
DEPT
CLASS/ STEP/ QUINN STAFF REQ REC APPROPRIATION REQUEST REC
01‐210‐1‐5111 Chief of Police ² 25% 1 1 1 $158,188 $154,569 $154,56901‐210‐1‐5111 Captains 25% Quinn (2) 25% 2 2 2 $273,262 $283,562 $283,562
01‐210‐1‐5111 Lieutenants 25% Quinn (7) 25% 7 7 7 $830,091 $866,659 $866,659 01‐210‐1‐5111 Lieutenants 20% Quinn (2) 20% 2 2 2 $226,480 $236,134 $236,13401‐210‐1‐5111 Lieutenant 10% Quinn (1) 10% 1 1 1 $102,985 $107,378 $107,37801‐210‐1‐5111 Sergeants 25% Quinn (5) 25% 5 5 5 $517,005 $536,627 $536,627
01‐210‐1‐5111 Sergeants 20% Quinn (4) 20% 4 4 4 $394,520 $413,190 $413,19001‐210‐1‐5111 Sergeants 10% Quinn (2) 10% 2 2 2 $179,622 $187,148 $187,14801‐210‐1‐5111 Sergeants 0% Quinn (2) 0% 2 2 2 $163,184 $169,996 $169,99601‐210‐1‐5111 Patrol Officers 25% Quinn (19) 25% 21 19 19 $1,801,547 $1,667,622 $1,667,62201‐210‐1‐5111 Patrol Officers 20% Quinn (17) 20% 17 17 17 $1,395,616 $1,427,093 $1,427,09301‐210‐1‐5111 Patrol Officers 10% Quinn (9) 10% 10 9 9 $750,191 $689,548 $689,54801‐210‐1‐5111 Patrol Officers 0% Quinn (38) 0% 27 38 38 $1,771,330 $2,381,933 $2,381,933
210 Police Personnel TOTAL 101 109 109
Salary (Police Officers) (5111) $8,564,021 $9,121,458 $9,121,4583 new positions added to be hired 1/1/17 (50% funding) Holiday (5140) $615,677 $687,141 $687,1418 new positions added with funding a/o 7/1/16 Night Differentials (5142) $272,806 $300,972 $300,9721 vacant position from FY 16 EMT Stipend (5145) $0 $2,000 $2,000
Senior Patrol (5146) $75,621 $84,720 $84,720License to Carry (5147) $96,533 $109,535 $109,535
Breathalyzer (5148) $43,069 $44,899 $44,899Special Duty Stipend (5149) $0 $105,000 $105,000
First Responder Stipend (5190) $0 $163,500 $163,500Taser Stipend (5192) $0 $54,500 $54,500
Clothing (5193) $146,900 $193,600 $193,600
178
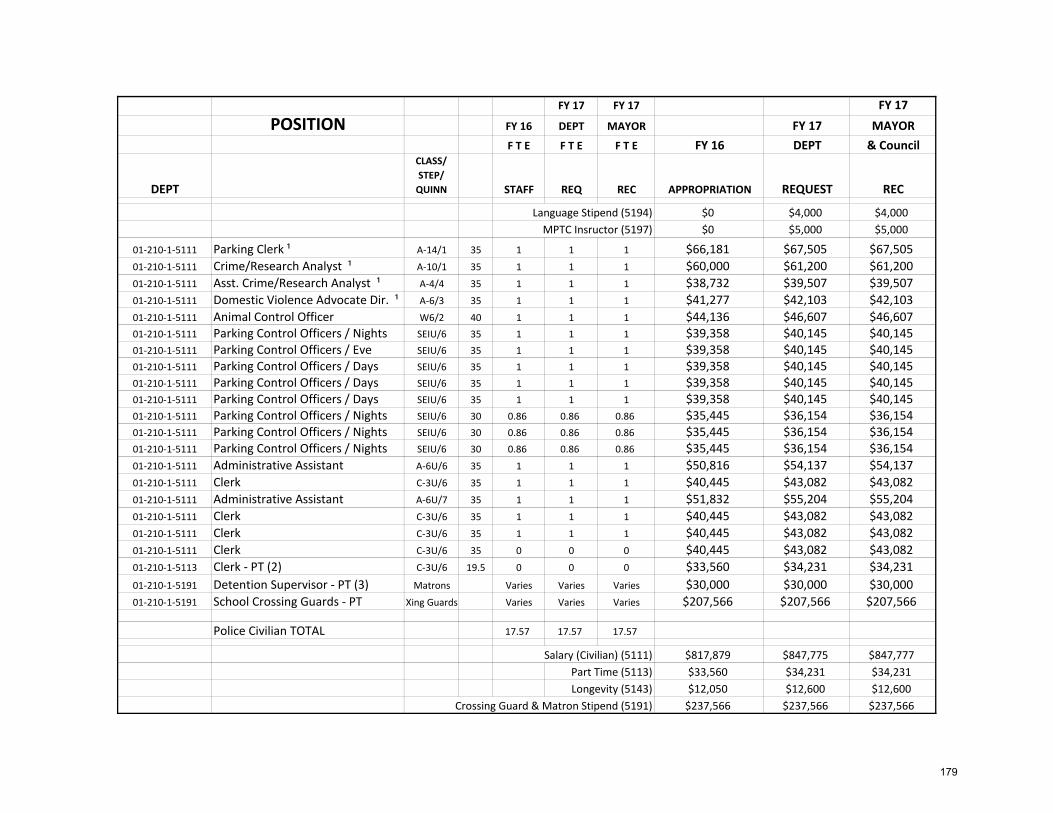
FY 17 FY 17 FY 17
POSITION FY 16 DEPT MAYOR FY 17 MAYOR F T E F T E F T E FY 16 DEPT & Council
DEPT
CLASS/ STEP/ QUINN STAFF REQ REC APPROPRIATION REQUEST REC
Language Stipend (5194) $0 $4,000 $4,000MPTC Insructor (5197) $0 $5,000 $5,000
01‐210‐1‐5111 Parking Clerk ¹ A‐14/1 35 1 1 1 $66,181 $67,505 $67,50501‐210‐1‐5111 Crime/Research Analyst ¹ A‐10/1 35 1 1 1 $60,000 $61,200 $61,20001‐210‐1‐5111 Asst. Crime/Research Analyst ¹ A‐4/4 35 1 1 1 $38,732 $39,507 $39,50701‐210‐1‐5111 Domestic Violence Advocate Dir. ¹ A‐6/3 35 1 1 1 $41,277 $42,103 $42,10301‐210‐1‐5111 Animal Control Officer W6/2 40 1 1 1 $44,136 $46,607 $46,60701‐210‐1‐5111 Parking Control Officers / Nights SEIU/6 35 1 1 1 $39,358 $40,145 $40,14501‐210‐1‐5111 Parking Control Officers / Eve SEIU/6 35 1 1 1 $39,358 $40,145 $40,14501‐210‐1‐5111 Parking Control Officers / Days SEIU/6 35 1 1 1 $39,358 $40,145 $40,14501‐210‐1‐5111 Parking Control Officers / Days SEIU/6 35 1 1 1 $39,358 $40,145 $40,14501‐210‐1‐5111 Parking Control Officers / Days SEIU/6 35 1 1 1 $39,358 $40,145 $40,14501‐210‐1‐5111 Parking Control Officers / Nights SEIU/6 30 0.86 0.86 0.86 $35,445 $36,154 $36,15401‐210‐1‐5111 Parking Control Officers / Nights SEIU/6 30 0.86 0.86 0.86 $35,445 $36,154 $36,15401‐210‐1‐5111 Parking Control Officers / Nights SEIU/6 30 0.86 0.86 0.86 $35,445 $36,154 $36,15401‐210‐1‐5111 Administrative Assistant A‐6U/6 35 1 1 1 $50,816 $54,137 $54,13701‐210‐1‐5111 Clerk C‐3U/6 35 1 1 1 $40,445 $43,082 $43,08201‐210‐1‐5111 Administrative Assistant A‐6U/7 35 1 1 1 $51,832 $55,204 $55,20401‐210‐1‐5111 Clerk C‐3U/6 35 1 1 1 $40,445 $43,082 $43,08201‐210‐1‐5111 Clerk C‐3U/6 35 1 1 1 $40,445 $43,082 $43,08201‐210‐1‐5111 Clerk C‐3U/6 35 0 0 0 $40,445 $43,082 $43,08201‐210‐1‐5113 Clerk ‐ PT (2) C‐3U/6 19.5 0 0 0 $33,560 $34,231 $34,23101‐210‐1‐5191 Detention Supervisor ‐ PT (3) Matrons Varies Varies Varies $30,000 $30,000 $30,00001‐210‐1‐5191 School Crossing Guards ‐ PT Xing Guards Varies Varies Varies $207,566 $207,566 $207,566
Police Civilian TOTAL 17.57 17.57 17.57
Salary (Civilian) (5111) $817,879 $847,775 $847,777Part Time (5113) $33,560 $34,231 $34,231Longevity (5143) $12,050 $12,600 $12,600
Crossing Guard & Matron Stipend (5191) $237,566 $237,566 $237,566
179
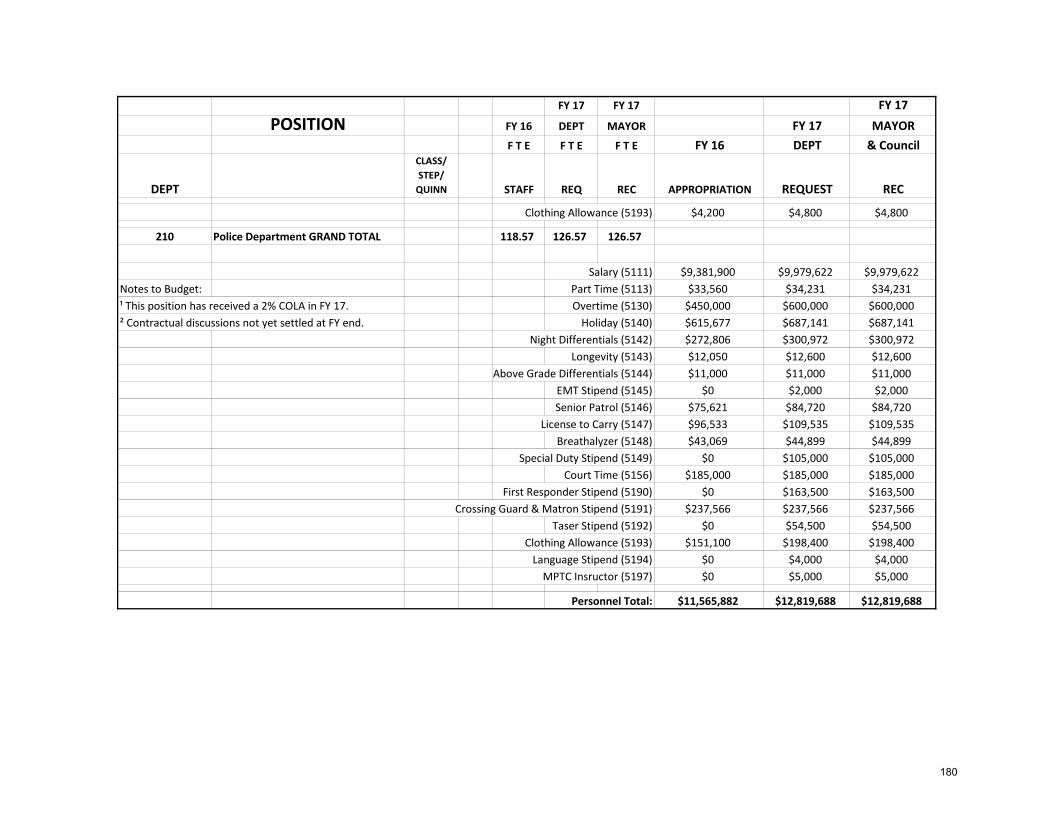
FY 17 FY 17 FY 17
POSITION FY 16 DEPT MAYOR FY 17 MAYOR F T E F T E F T E FY 16 DEPT & Council
DEPT
CLASS/ STEP/ QUINN STAFF REQ REC APPROPRIATION REQUEST REC
Clothing Allowance (5193) $4,200 $4,800 $4,800
210 Police Department GRAND TOTAL 118.57 126.57 126.57
Salary (5111) $9,381,900 $9,979,622 $9,979,622Notes to Budget: Part Time (5113) $33,560 $34,231 $34,231¹ This position has received a 2% COLA in FY 17. Overtime (5130) $450,000 $600,000 $600,000² Contractual discussions not yet settled at FY end. Holiday (5140) $615,677 $687,141 $687,141
Night Differentials (5142) $272,806 $300,972 $300,972 Longevity (5143) $12,050 $12,600 $12,600
Above Grade Differentials (5144) $11,000 $11,000 $11,000EMT Stipend (5145) $0 $2,000 $2,000Senior Patrol (5146) $75,621 $84,720 $84,720
License to Carry (5147) $96,533 $109,535 $109,535Breathalyzer (5148) $43,069 $44,899 $44,899
Special Duty Stipend (5149) $0 $105,000 $105,000Court Time (5156) $185,000 $185,000 $185,000
First Responder Stipend (5190) $0 $163,500 $163,500Crossing Guard & Matron Stipend (5191) $237,566 $237,566 $237,566
Taser Stipend (5192) $0 $54,500 $54,500Clothing Allowance (5193) $151,100 $198,400 $198,400Language Stipend (5194) $0 $4,000 $4,000MPTC Insructor (5197) $0 $5,000 $5,000
Personnel Total: $11,565,882 $12,819,688 $12,819,688
180
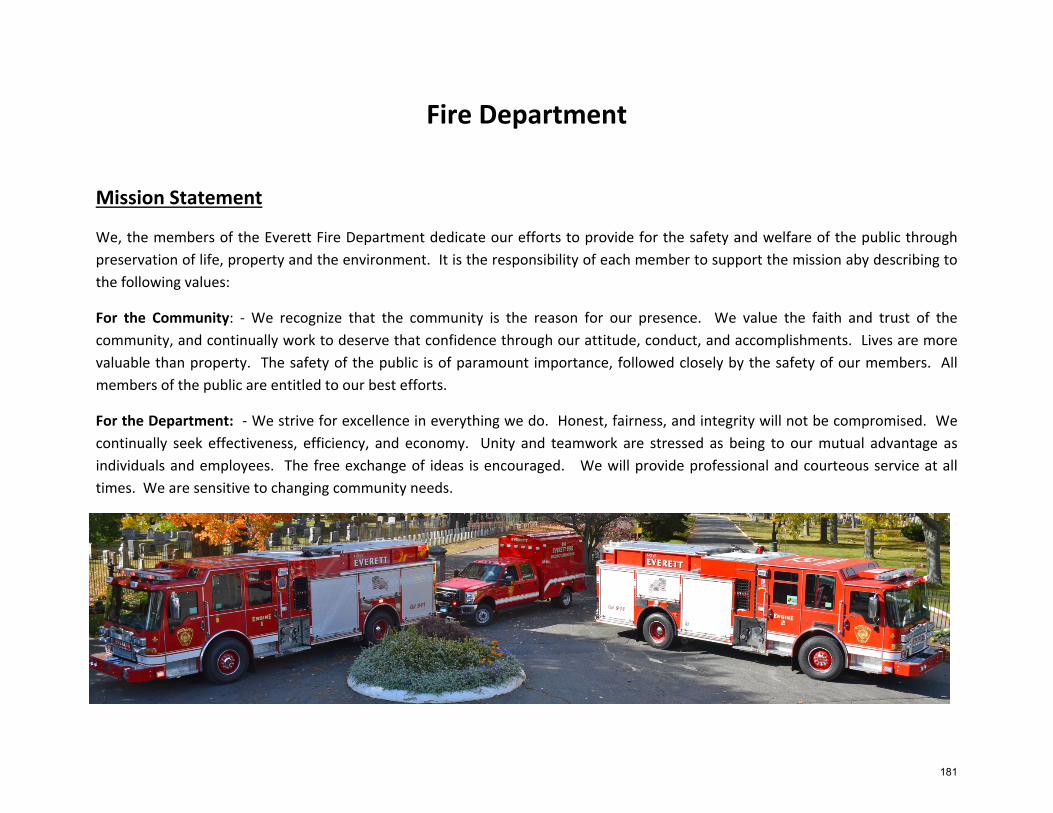
Fire Department
Mission Statement
We, the members of the Everett Fire Department dedicate our efforts to provide for the safety and welfare of the public through preservation of life, property and the environment. It is the responsibility of each member to support the mission aby describing to the following values:
For the Community: ‐ We recognize that the community is the reason for our presence. We value the faith and trust of the community, and continually work to deserve that confidence through our attitude, conduct, and accomplishments. Lives are more valuable than property. The safety of the public is of paramount importance, followed closely by the safety of our members. All members of the public are entitled to our best efforts.
For the Department: ‐ We strive for excellence in everything we do. Honest, fairness, and integrity will not be compromised. We continually seek effectiveness, efficiency, and economy. Unity and teamwork are stressed as being to our mutual advantage as individuals and employees. The free exchange of ideas is encouraged. We will provide professional and courteous service at all times. We are sensitive to changing community needs.
181
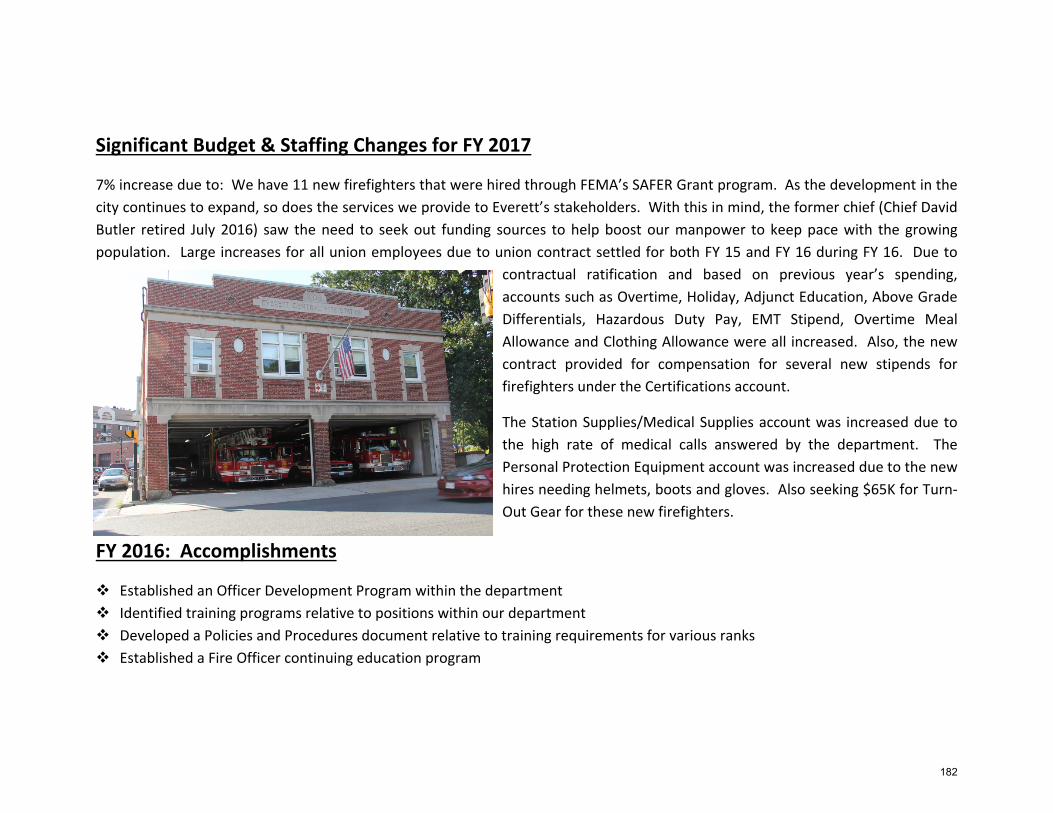
Significant Budget & Staffing Changes for FY 2017
7% increase due to: We have 11 new firefighters that were hired through FEMA’s SAFER Grant program. As the development in the city continues to expand, so does the services we provide to Everett’s stakeholders. With this in mind, the former chief (Chief David Butler retired July 2016) saw the need to seek out funding sources to help boost our manpower to keep pace with the growing population. Large increases for all union employees due to union contract settled for both FY 15 and FY 16 during FY 16. Due to
contractual ratification and based on previous year’s spending, accounts such as Overtime, Holiday, Adjunct Education, Above Grade Differentials, Hazardous Duty Pay, EMT Stipend, Overtime Meal Allowance and Clothing Allowance were all increased. Also, the new contract provided for compensation for several new stipends for firefighters under the Certifications account.
The Station Supplies/Medical Supplies account was increased due to the high rate of medical calls answered by the department. The Personal Protection Equipment account was increased due to the new hires needing helmets, boots and gloves. Also seeking $65K for Turn‐Out Gear for these new firefighters.
FY 2016: Accomplishments
Established an Officer Development Program within the department Identified training programs relative to positions within our department Developed a Policies and Procedures document relative to training requirements for various ranks Established a Fire Officer continuing education program
182
FY 2017: Goals & Objectives
Place an additional company in service this fiscal year Renovation of Hancock Street Fire Station Obtain funding to promote 4 current personnel to the rank of Fire
Lieutenant and additional Firefighters as needed Reorganization of department personnel to effectively staff new
company Complete plans for Station Renovation Award contract for project
Outcomes & Performance Measurers Actual FY 2014
Actual FY 2015
Estimated FY 2016
Estimated FY 2017
Fire Inspections 5,300 5,800 5,800 6,200 Emergency Responses 5,629 5,721 5,920 6,000 Average response time to emergencies 3.25 min 3.55 min 3.5 min 3.5 min Mutual Aid Given 45 39 41 40 Mutual Aid Received 35 47 46 50 Training Classes 11,076 10,637 10,751 11,000
How FY 2017 Departmental Goals Relate to City’s Overall Long & Short Term Goals
With the increased staff of 11 new firefighters, we will be able to provide our services to a growing population in our city. This population includes both permanent residents in developments like the Batch Yard and the soon‐to‐be developed former Harley Davidson property ‐ to temporary visitors at the newly constructed Envision Hotel and Wynn Boston Harbor. We want to stay ahead of this type of growth to the extent the existing population of the city will never see a decrease from the high quality of service they have come to expect from their Fire and Emergency Services. The renovation of Hancock Street Fire Station is a prime example of both the Fire Department’s commitment to its existing customers in the well‐established neighborhoods and the Mayor’s foresight to see the need for preserving these buildings with an aggressive capital improvement program.
183
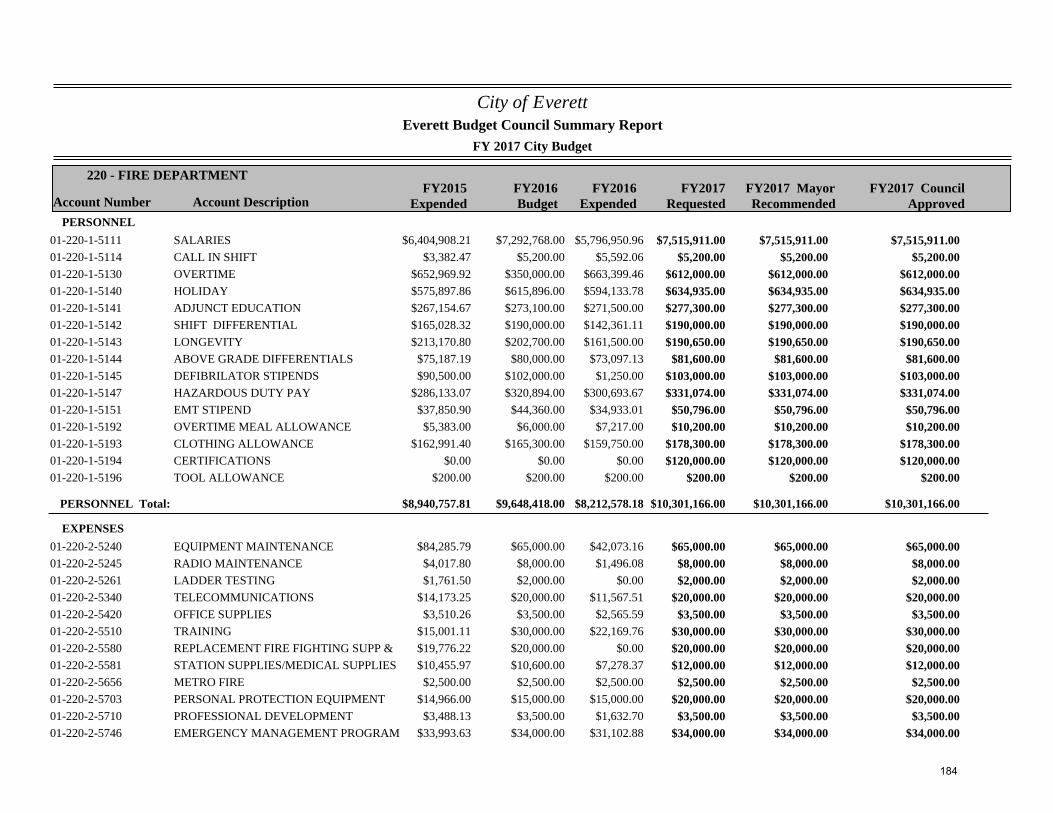
City of Everett
FY 2017 City Budget
Account Number Account DescriptionFY2015
ExpendedFY2016Budget
FY2017Requested
220 - FIRE DEPARTMENT
Everett Budget Council Summary Report
FY2017 MayorRecommended
FY2016Expended
FY2017 CouncilApproved
PERSONNEL$6,404,908.21 $7,292,768.00 $7,515,911.0001-220-1-5111 SALARIES $5,796,950.96 $7,515,911.00 $7,515,911.00
$3,382.47 $5,200.00 $5,200.0001-220-1-5114 CALL IN SHIFT $5,592.06 $5,200.00 $5,200.00$652,969.92 $350,000.00 $612,000.0001-220-1-5130 OVERTIME $663,399.46 $612,000.00 $612,000.00$575,897.86 $615,896.00 $634,935.0001-220-1-5140 HOLIDAY $594,133.78 $634,935.00 $634,935.00$267,154.67 $273,100.00 $277,300.0001-220-1-5141 ADJUNCT EDUCATION $271,500.00 $277,300.00 $277,300.00$165,028.32 $190,000.00 $190,000.0001-220-1-5142 SHIFT DIFFERENTIAL $142,361.11 $190,000.00 $190,000.00$213,170.80 $202,700.00 $190,650.0001-220-1-5143 LONGEVITY $161,500.00 $190,650.00 $190,650.00
$75,187.19 $80,000.00 $81,600.0001-220-1-5144 ABOVE GRADE DIFFERENTIALS $73,097.13 $81,600.00 $81,600.00$90,500.00 $102,000.00 $103,000.0001-220-1-5145 DEFIBRILATOR STIPENDS $1,250.00 $103,000.00 $103,000.00
$286,133.07 $320,894.00 $331,074.0001-220-1-5147 HAZARDOUS DUTY PAY $300,693.67 $331,074.00 $331,074.00$37,850.90 $44,360.00 $50,796.0001-220-1-5151 EMT STIPEND $34,933.01 $50,796.00 $50,796.00$5,383.00 $6,000.00 $10,200.0001-220-1-5192 OVERTIME MEAL ALLOWANCE $7,217.00 $10,200.00 $10,200.00
$162,991.40 $165,300.00 $178,300.0001-220-1-5193 CLOTHING ALLOWANCE $159,750.00 $178,300.00 $178,300.00$0.00 $0.00 $120,000.0001-220-1-5194 CERTIFICATIONS $0.00 $120,000.00 $120,000.00
$200.00 $200.00 $200.0001-220-1-5196 TOOL ALLOWANCE $200.00 $200.00 $200.00
PERSONNEL Total: $8,940,757.81 $9,648,418.00 $10,301,166.00$8,212,578.18 $10,301,166.00 $10,301,166.00
EXPENSES$84,285.79 $65,000.00 $65,000.0001-220-2-5240 EQUIPMENT MAINTENANCE $42,073.16 $65,000.00 $65,000.00$4,017.80 $8,000.00 $8,000.0001-220-2-5245 RADIO MAINTENANCE $1,496.08 $8,000.00 $8,000.00$1,761.50 $2,000.00 $2,000.0001-220-2-5261 LADDER TESTING $0.00 $2,000.00 $2,000.00
$14,173.25 $20,000.00 $20,000.0001-220-2-5340 TELECOMMUNICATIONS $11,567.51 $20,000.00 $20,000.00$3,510.26 $3,500.00 $3,500.0001-220-2-5420 OFFICE SUPPLIES $2,565.59 $3,500.00 $3,500.00
$15,001.11 $30,000.00 $30,000.0001-220-2-5510 TRAINING $22,169.76 $30,000.00 $30,000.00$19,776.22 $20,000.00 $20,000.0001-220-2-5580 REPLACEMENT FIRE FIGHTING SUPP & $0.00 $20,000.00 $20,000.00$10,455.97 $10,600.00 $12,000.0001-220-2-5581 STATION SUPPLIES/MEDICAL SUPPLIES $7,278.37 $12,000.00 $12,000.00$2,500.00 $2,500.00 $2,500.0001-220-2-5656 METRO FIRE $2,500.00 $2,500.00 $2,500.00
$14,966.00 $15,000.00 $20,000.0001-220-2-5703 PERSONAL PROTECTION EQUIPMENT $15,000.00 $20,000.00 $20,000.00$3,488.13 $3,500.00 $3,500.0001-220-2-5710 PROFESSIONAL DEVELOPMENT $1,632.70 $3,500.00 $3,500.00
$33,993.63 $34,000.00 $34,000.0001-220-2-5746 EMERGENCY MANAGEMENT PROGRAM $31,102.88 $34,000.00 $34,000.00
184
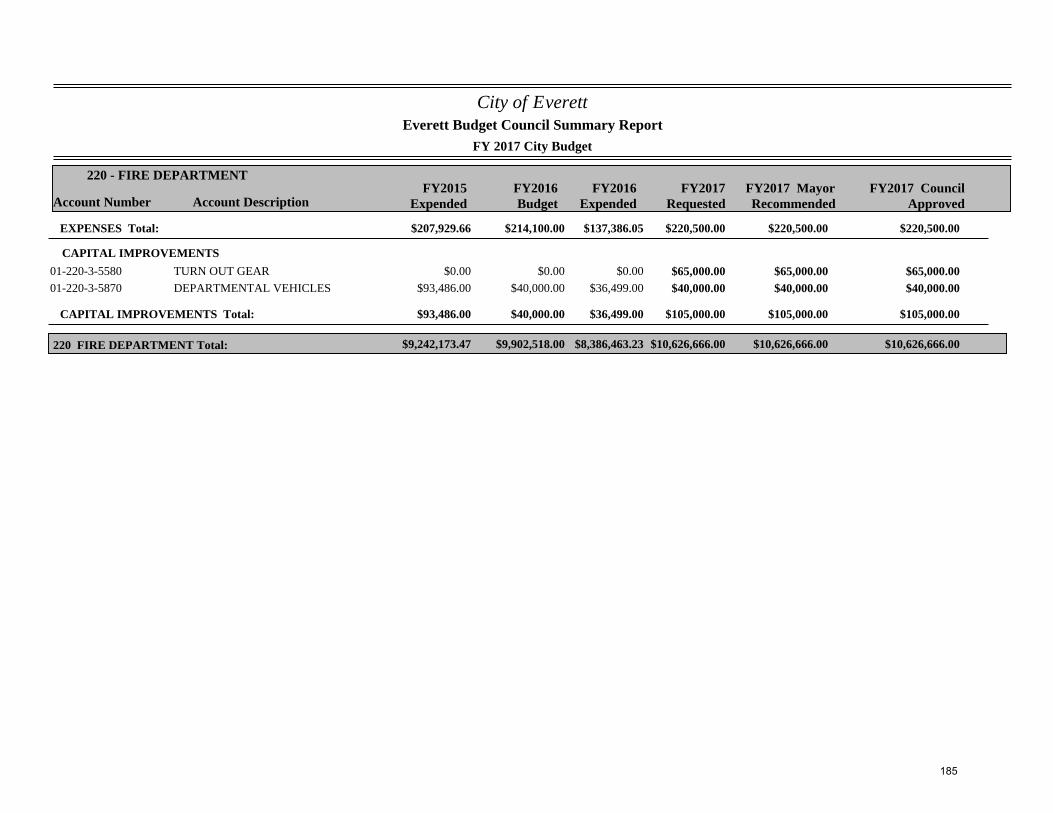
City of Everett
FY 2017 City Budget
Account Number Account DescriptionFY2015
ExpendedFY2016Budget
FY2017Requested
220 - FIRE DEPARTMENT
Everett Budget Council Summary Report
FY2017 MayorRecommended
FY2016Expended
FY2017 CouncilApproved
EXPENSES Total: $207,929.66 $214,100.00 $220,500.00$137,386.05 $220,500.00 $220,500.00
CAPITAL IMPROVEMENTS$0.00 $0.00 $65,000.0001-220-3-5580 TURN OUT GEAR $0.00 $65,000.00 $65,000.00
$93,486.00 $40,000.00 $40,000.0001-220-3-5870 DEPARTMENTAL VEHICLES $36,499.00 $40,000.00 $40,000.00
CAPITAL IMPROVEMENTS Total: $93,486.00 $40,000.00 $105,000.00$36,499.00 $105,000.00 $105,000.00
$9,242,173.47 $9,902,518.00 $10,626,666.00220 FIRE DEPARTMENT Total: $8,386,463.23 $10,626,666.00 $10,626,666.00
185
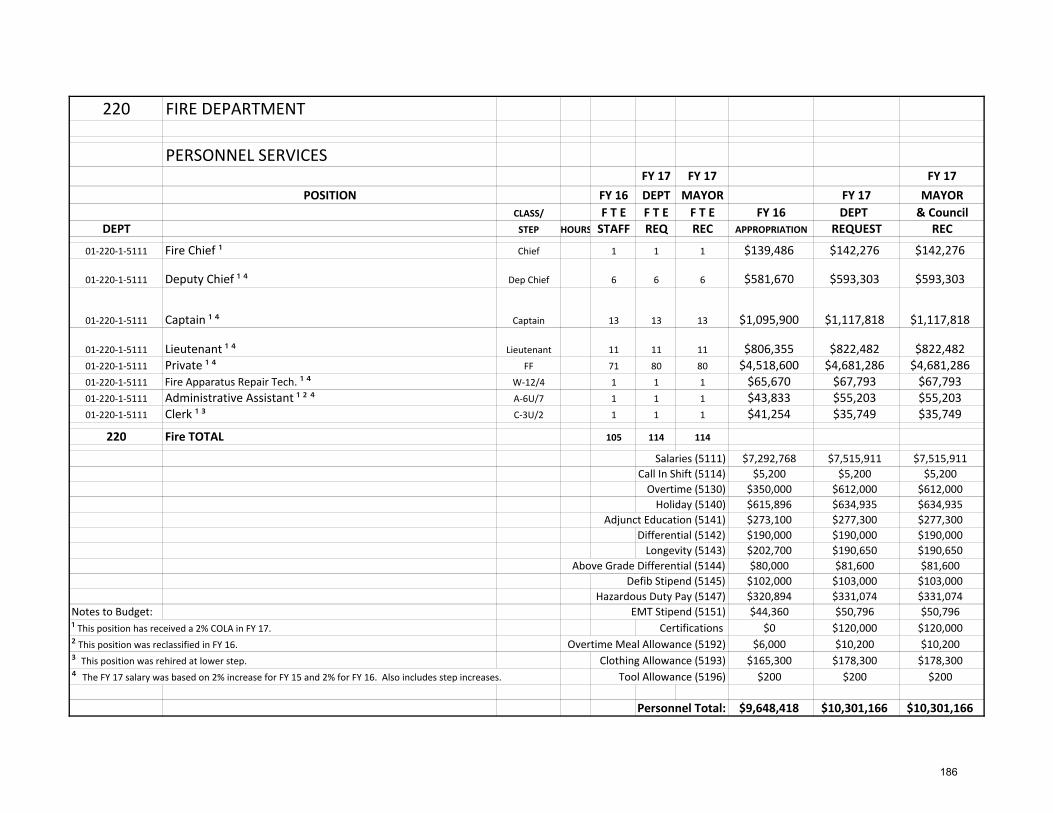
220 FIRE DEPARTMENT
PERSONNEL SERVICESFY 17 FY 17 FY 17
POSITION FY 16 DEPT MAYOR FY 17 MAYORCLASS/ F T E F T E F T E FY 16 DEPT & Council
DEPT STEP HOURS STAFF REQ REC APPROPRIATION REQUEST REC
01‐220‐1‐5111 Fire Chief ¹ Chief 1 1 1 $139,486 $142,276 $142,276
01‐220‐1‐5111 Deputy Chief ¹ ⁴ Dep Chief 6 6 6 $581,670 $593,303 $593,303
01‐220‐1‐5111 Captain ¹ ⁴ Captain 13 13 13 $1,095,900 $1,117,818 $1,117,818
01‐220‐1‐5111 Lieutenant ¹ ⁴ Lieutenant 11 11 11 $806,355 $822,482 $822,48201‐220‐1‐5111 Private ¹ ⁴ FF 71 80 80 $4,518,600 $4,681,286 $4,681,28601‐220‐1‐5111 Fire Apparatus Repair Tech. ¹ ⁴ W‐12/4 1 1 1 $65,670 $67,793 $67,79301‐220‐1‐5111 Administrative Assistant ¹ ² ⁴ A‐6U/7 1 1 1 $43,833 $55,203 $55,20301‐220‐1‐5111 Clerk ¹ ³ C‐3U/2 1 1 1 $41,254 $35,749 $35,749
220 Fire TOTAL 105 114 114
Salaries (5111) $7,292,768 $7,515,911 $7,515,911Call In Shift (5114) $5,200 $5,200 $5,200Overtime (5130) $350,000 $612,000 $612,000Holiday (5140) $615,896 $634,935 $634,935
Adjunct Education (5141) $273,100 $277,300 $277,300Differential (5142) $190,000 $190,000 $190,000Longevity (5143) $202,700 $190,650 $190,650
Above Grade Differential (5144) $80,000 $81,600 $81,600Defib Stipend (5145) $102,000 $103,000 $103,000
Hazardous Duty Pay (5147) $320,894 $331,074 $331,074Notes to Budget: EMT Stipend (5151) $44,360 $50,796 $50,796¹ This position has received a 2% COLA in FY 17. Certifications $0 $120,000 $120,000² This position was reclassified in FY 16. Overtime Meal Allowance (5192) $6,000 $10,200 $10,200³ This position was rehired at lower step. Clothing Allowance (5193) $165,300 $178,300 $178,300⁴ The FY 17 salary was based on 2% increase for FY 15 and 2% for FY 16. Also includes step increases. Tool Allowance (5196) $200 $200 $200
Personnel Total: $9,648,418 $10,301,166 $10,301,166
186
Inspectional Services Division (ISD)
Mission Statement
To protect the health, welfare, and safety of the residents and visitors of the City of Everett as mandated by Local Ordinances and State Law. To fulfill very specific rules and regulations regarding the Safe Construction of Buildings, Certifications of Structures, Residential and Commercial Habitability of Dwelling Units, Enforcement of State Sanitary Codes, Testing of Weighing Devices and Preparation of Food, Restaurant Grading, Signage, and Occupancy permits as well as enforcing the City of Everett zoning by‐laws. Maintain and repair City traffic lights and the Fire Alarm Systems in a safe and operable condition.
Significant Budget & Staffing Changes for FY 2017
92% increase due to: Both the ISD Director and the Assistant Building Inspector have received salary increases due to the added responsibilities of the Wynn Casino project. ISD has requested budget funding for a full‐time Wire Inspector and an Inspector of Gas & Plumbing to be designated to provide inspections for the Wynn Casino project. Two new Code Officer Positions have been added to the FY 17 budget as well as one new Code Officer ‐ Administrator. The Mayor has implemented a process that puts one code enforcement officer in each ward in the city. The Administrator will oversee this program. During FY 16, the contract for Local 25 Clerical and Local 25 DPW was settled for FY 15 and FY 16. This accounts for the large jump in salaries, overtime and clothing allowance for clerical and DPW based employees. Most salaries have been increased by 2% in the FY 17 budget. A new account called Certifications was created to pay a bonus to those employees who pass certification exams.
The Signal & Shop Repairs account was increased to maintain the decorative street lighting owned by the City on Lower Broadway and Airforce Road. Contract Services was added to the budget for our Four Leaf contract. This is building inspection services for the Wynn Boston Harbor project and is funded directly by Wynn Casino.
187
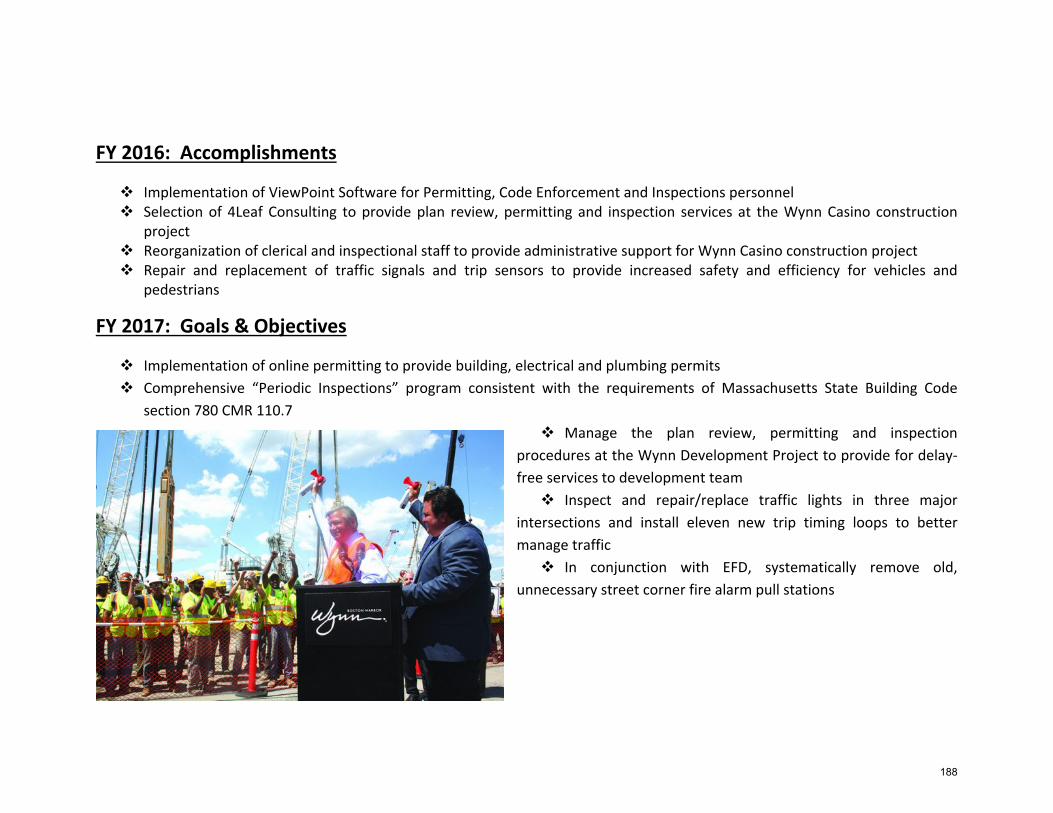
FY 2016: Accomplishments
Implementation of ViewPoint Software for Permitting, Code Enforcement and Inspections personnel Selection of 4Leaf Consulting to provide plan review, permitting and inspection services at the Wynn Casino construction
project Reorganization of clerical and inspectional staff to provide administrative support for Wynn Casino construction project Repair and replacement of traffic signals and trip sensors to provide increased safety and efficiency for vehicles and
pedestrians
FY 2017: Goals & Objectives
Implementation of online permitting to provide building, electrical and plumbing permits Comprehensive “Periodic Inspections” program consistent with the requirements of Massachusetts State Building Code
section 780 CMR 110.7 Manage the plan review, permitting and inspection
procedures at the Wynn Development Project to provide for delay‐free services to development team Inspect and repair/replace traffic lights in three major
intersections and install eleven new trip timing loops to better manage traffic In conjunction with EFD, systematically remove old,
unnecessary street corner fire alarm pull stations
188
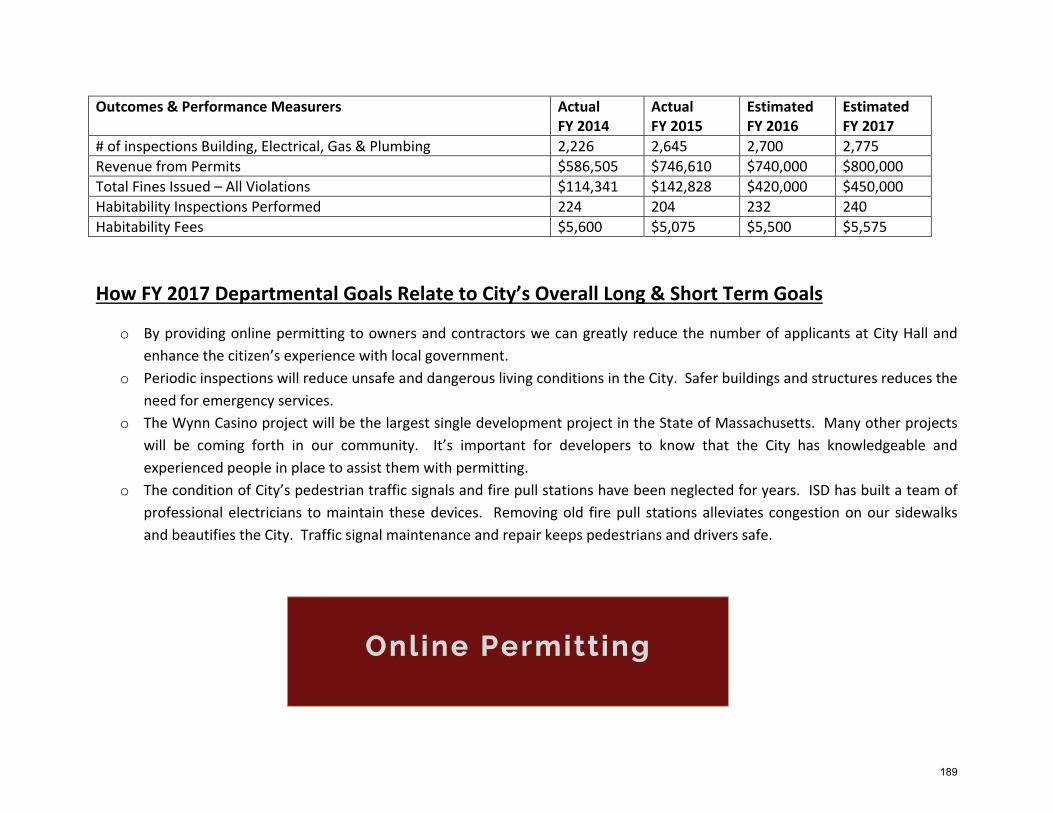
Outcomes & Performance Measurers Actual FY 2014
Actual FY 2015
Estimated FY 2016
Estimated FY 2017
# of inspections Building, Electrical, Gas & Plumbing 2,226 2,645 2,700 2,775 Revenue from Permits $586,505 $746,610 $740,000 $800,000 Total Fines Issued – All Violations $114,341 $142,828 $420,000 $450,000 Habitability Inspections Performed 224 204 232 240 Habitability Fees $5,600 $5,075 $5,500 $5,575
How FY 2017 Departmental Goals Relate to City’s Overall Long & Short Term Goals
o By providing online permitting to owners and contractors we can greatly reduce the number of applicants at City Hall and enhance the citizen’s experience with local government.
o Periodic inspections will reduce unsafe and dangerous living conditions in the City. Safer buildings and structures reduces the need for emergency services.
o The Wynn Casino project will be the largest single development project in the State of Massachusetts. Many other projects will be coming forth in our community. It’s important for developers to know that the City has knowledgeable and experienced people in place to assist them with permitting.
o The condition of City’s pedestrian traffic signals and fire pull stations have been neglected for years. ISD has built a team of professional electricians to maintain these devices. Removing old fire pull stations alleviates congestion on our sidewalks and beautifies the City. Traffic signal maintenance and repair keeps pedestrians and drivers safe.
189
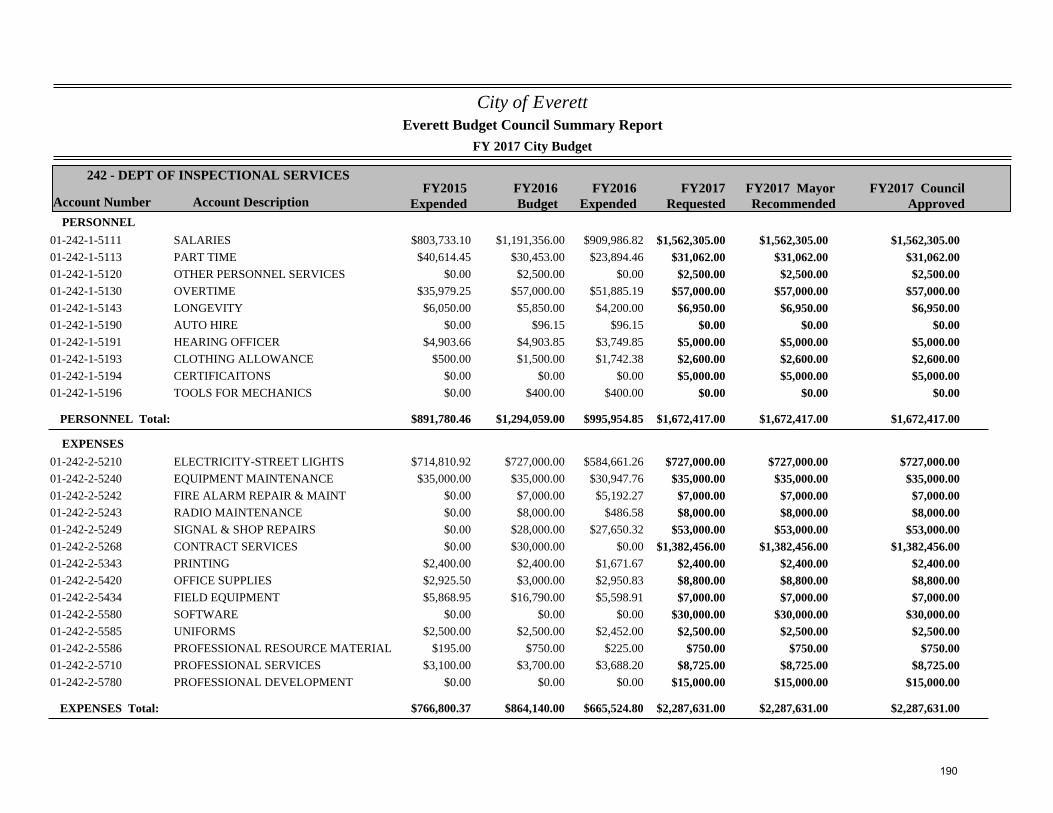
City of Everett
FY 2017 City Budget
Account Number Account DescriptionFY2015
ExpendedFY2016Budget
FY2017Requested
242 - DEPT OF INSPECTIONAL SERVICES
Everett Budget Council Summary Report
FY2017 MayorRecommended
FY2016Expended
FY2017 CouncilApproved
PERSONNEL$803,733.10 $1,191,356.00 $1,562,305.0001-242-1-5111 SALARIES $909,986.82 $1,562,305.00 $1,562,305.00
$40,614.45 $30,453.00 $31,062.0001-242-1-5113 PART TIME $23,894.46 $31,062.00 $31,062.00$0.00 $2,500.00 $2,500.0001-242-1-5120 OTHER PERSONNEL SERVICES $0.00 $2,500.00 $2,500.00
$35,979.25 $57,000.00 $57,000.0001-242-1-5130 OVERTIME $51,885.19 $57,000.00 $57,000.00$6,050.00 $5,850.00 $6,950.0001-242-1-5143 LONGEVITY $4,200.00 $6,950.00 $6,950.00
$0.00 $96.15 $0.0001-242-1-5190 AUTO HIRE $96.15 $0.00 $0.00$4,903.66 $4,903.85 $5,000.0001-242-1-5191 HEARING OFFICER $3,749.85 $5,000.00 $5,000.00
$500.00 $1,500.00 $2,600.0001-242-1-5193 CLOTHING ALLOWANCE $1,742.38 $2,600.00 $2,600.00$0.00 $0.00 $5,000.0001-242-1-5194 CERTIFICAITONS $0.00 $5,000.00 $5,000.00$0.00 $400.00 $0.0001-242-1-5196 TOOLS FOR MECHANICS $400.00 $0.00 $0.00
PERSONNEL Total: $891,780.46 $1,294,059.00 $1,672,417.00$995,954.85 $1,672,417.00 $1,672,417.00
EXPENSES$714,810.92 $727,000.00 $727,000.0001-242-2-5210 ELECTRICITY-STREET LIGHTS $584,661.26 $727,000.00 $727,000.00
$35,000.00 $35,000.00 $35,000.0001-242-2-5240 EQUIPMENT MAINTENANCE $30,947.76 $35,000.00 $35,000.00$0.00 $7,000.00 $7,000.0001-242-2-5242 FIRE ALARM REPAIR & MAINT $5,192.27 $7,000.00 $7,000.00$0.00 $8,000.00 $8,000.0001-242-2-5243 RADIO MAINTENANCE $486.58 $8,000.00 $8,000.00$0.00 $28,000.00 $53,000.0001-242-2-5249 SIGNAL & SHOP REPAIRS $27,650.32 $53,000.00 $53,000.00$0.00 $30,000.00 $1,382,456.0001-242-2-5268 CONTRACT SERVICES $0.00 $1,382,456.00 $1,382,456.00
$2,400.00 $2,400.00 $2,400.0001-242-2-5343 PRINTING $1,671.67 $2,400.00 $2,400.00$2,925.50 $3,000.00 $8,800.0001-242-2-5420 OFFICE SUPPLIES $2,950.83 $8,800.00 $8,800.00$5,868.95 $16,790.00 $7,000.0001-242-2-5434 FIELD EQUIPMENT $5,598.91 $7,000.00 $7,000.00
$0.00 $0.00 $30,000.0001-242-2-5580 SOFTWARE $0.00 $30,000.00 $30,000.00$2,500.00 $2,500.00 $2,500.0001-242-2-5585 UNIFORMS $2,452.00 $2,500.00 $2,500.00
$195.00 $750.00 $750.0001-242-2-5586 PROFESSIONAL RESOURCE MATERIAL $225.00 $750.00 $750.00$3,100.00 $3,700.00 $8,725.0001-242-2-5710 PROFESSIONAL SERVICES $3,688.20 $8,725.00 $8,725.00
$0.00 $0.00 $15,000.0001-242-2-5780 PROFESSIONAL DEVELOPMENT $0.00 $15,000.00 $15,000.00
EXPENSES Total: $766,800.37 $864,140.00 $2,287,631.00$665,524.80 $2,287,631.00 $2,287,631.00
190
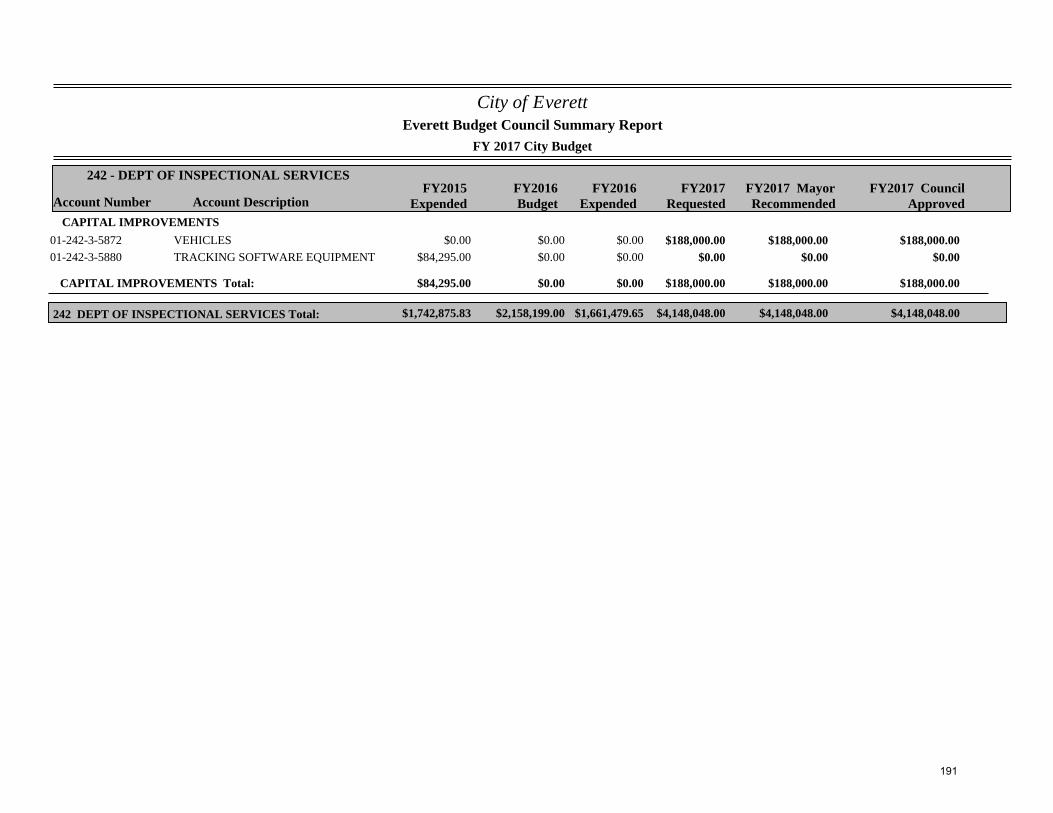
City of Everett
FY 2017 City Budget
Account Number Account DescriptionFY2015
ExpendedFY2016Budget
FY2017Requested
242 - DEPT OF INSPECTIONAL SERVICES
Everett Budget Council Summary Report
FY2017 MayorRecommended
FY2016Expended
FY2017 CouncilApproved
CAPITAL IMPROVEMENTS$0.00 $0.00 $188,000.0001-242-3-5872 VEHICLES $0.00 $188,000.00 $188,000.00
$84,295.00 $0.00 $0.0001-242-3-5880 TRACKING SOFTWARE EQUIPMENT $0.00 $0.00 $0.00
CAPITAL IMPROVEMENTS Total: $84,295.00 $0.00 $188,000.00$0.00 $188,000.00 $188,000.00
$1,742,875.83 $2,158,199.00 $4,148,048.00242 DEPT OF INSPECTIONAL SERVICES Total: $1,661,479.65 $4,148,048.00 $4,148,048.00
191
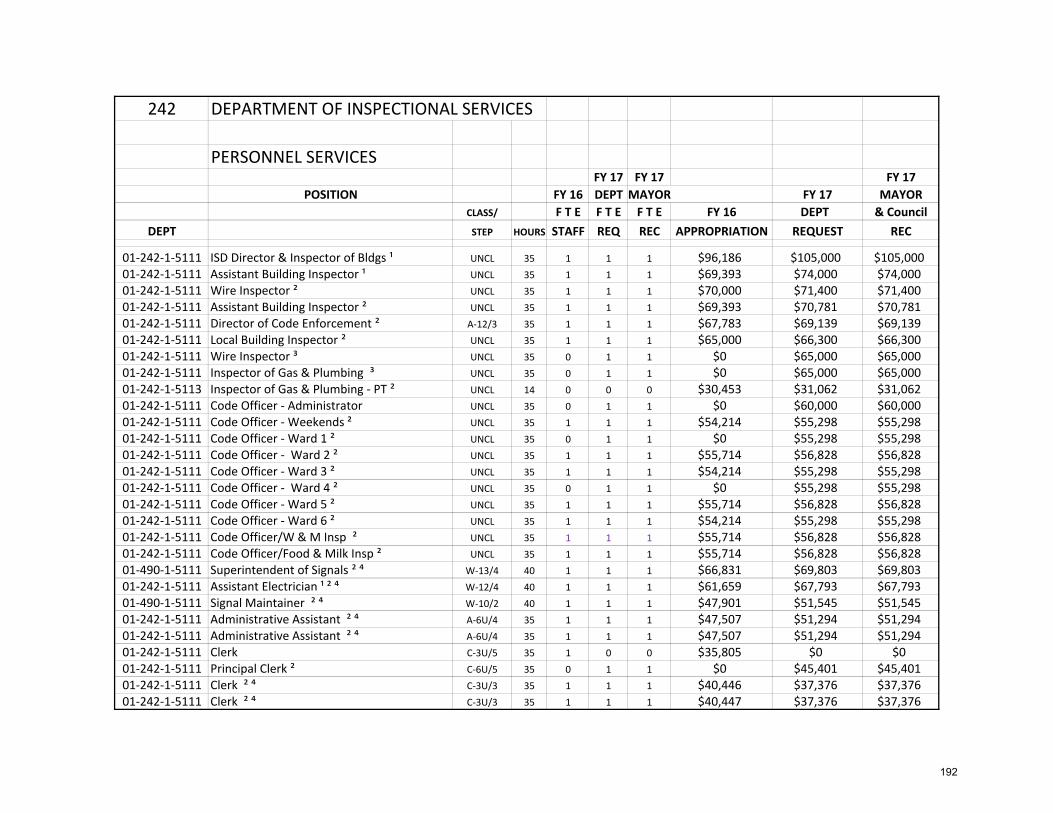
242 DEPARTMENT OF INSPECTIONAL SERVICES
PERSONNEL SERVICESFY 17 FY 17 FY 17
POSITION FY 16 DEPT MAYOR FY 17 MAYORCLASS/ F T E F T E F T E FY 16 DEPT & Council
DEPT STEP HOURS STAFF REQ REC APPROPRIATION REQUEST REC
01‐242‐1‐5111 ISD Director & Inspector of Bldgs ¹ UNCL 35 1 1 1 $96,186 $105,000 $105,00001‐242‐1‐5111 Assistant Building Inspector ¹ UNCL 35 1 1 1 $69,393 $74,000 $74,00001‐242‐1‐5111 Wire Inspector ² UNCL 35 1 1 1 $70,000 $71,400 $71,40001‐242‐1‐5111 Assistant Building Inspector ² UNCL 35 1 1 1 $69,393 $70,781 $70,78101‐242‐1‐5111 Director of Code Enforcement ² A‐12/3 35 1 1 1 $67,783 $69,139 $69,13901‐242‐1‐5111 Local Building Inspector ² UNCL 35 1 1 1 $65,000 $66,300 $66,30001‐242‐1‐5111 Wire Inspector ³ UNCL 35 0 1 1 $0 $65,000 $65,00001‐242‐1‐5111 Inspector of Gas & Plumbing ³ UNCL 35 0 1 1 $0 $65,000 $65,00001‐242‐1‐5113 Inspector of Gas & Plumbing ‐ PT ² UNCL 14 0 0 0 $30,453 $31,062 $31,06201‐242‐1‐5111 Code Officer ‐ Administrator UNCL 35 0 1 1 $0 $60,000 $60,00001‐242‐1‐5111 Code Officer ‐ Weekends ² UNCL 35 1 1 1 $54,214 $55,298 $55,29801‐242‐1‐5111 Code Officer ‐ Ward 1 ² UNCL 35 0 1 1 $0 $55,298 $55,29801‐242‐1‐5111 Code Officer ‐ Ward 2 ² UNCL 35 1 1 1 $55,714 $56,828 $56,82801‐242‐1‐5111 Code Officer ‐ Ward 3 ² UNCL 35 1 1 1 $54,214 $55,298 $55,29801‐242‐1‐5111 Code Officer ‐ Ward 4 ² UNCL 35 0 1 1 $0 $55,298 $55,29801‐242‐1‐5111 Code Officer ‐ Ward 5 ² UNCL 35 1 1 1 $55,714 $56,828 $56,82801‐242‐1‐5111 Code Officer ‐ Ward 6 ² UNCL 35 1 1 1 $54,214 $55,298 $55,29801‐242‐1‐5111 Code Officer/W & M Insp ² UNCL 35 1 1 1 $55,714 $56,828 $56,82801‐242‐1‐5111 Code Officer/Food & Milk Insp ² UNCL 35 1 1 1 $55,714 $56,828 $56,82801‐490‐1‐5111 Superintendent of Signals ² ⁴ W‐13/4 40 1 1 1 $66,831 $69,803 $69,80301‐242‐1‐5111 Assistant Electrician ¹ ² ⁴ W‐12/4 40 1 1 1 $61,659 $67,793 $67,79301‐490‐1‐5111 Signal Maintainer ² ⁴ W‐10/2 40 1 1 1 $47,901 $51,545 $51,54501‐242‐1‐5111 Administrative Assistant ² ⁴ A‐6U/4 35 1 1 1 $47,507 $51,294 $51,29401‐242‐1‐5111 Administrative Assistant ² ⁴ A‐6U/4 35 1 1 1 $47,507 $51,294 $51,29401‐242‐1‐5111 Clerk C‐3U/5 35 1 0 0 $35,805 $0 $001‐242‐1‐5111 Principal Clerk ² C‐6U/5 35 0 1 1 $0 $45,401 $45,40101‐242‐1‐5111 Clerk ² ⁴ C‐3U/3 35 1 1 1 $40,446 $37,376 $37,37601‐242‐1‐5111 Clerk ² ⁴ C‐3U/3 35 1 1 1 $40,447 $37,376 $37,376
192
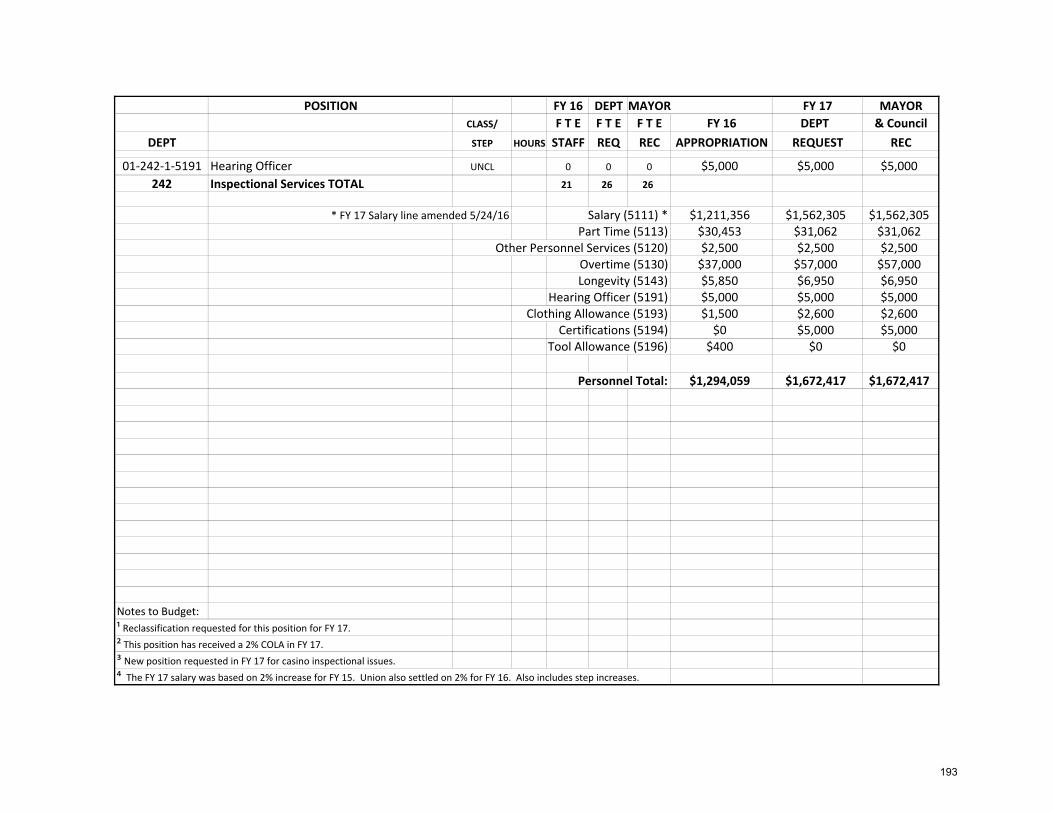
POSITION FY 16 DEPT MAYOR FY 17 MAYORCLASS/ F T E F T E F T E FY 16 DEPT & Council
DEPT STEP HOURS STAFF REQ REC APPROPRIATION REQUEST REC
01‐242‐1‐5191 Hearing Officer UNCL 0 0 0 $5,000 $5,000 $5,000242 Inspectional Services TOTAL 21 26 26
* FY 17 Salary line amended 5/24/16 Salary (5111) * $1,211,356 $1,562,305 $1,562,305 Part Time (5113) $30,453 $31,062 $31,062 Other Personnel Services (5120) $2,500 $2,500 $2,500
Overtime (5130) $37,000 $57,000 $57,000Longevity (5143) $5,850 $6,950 $6,950
Hearing Officer (5191) $5,000 $5,000 $5,000Clothing Allowance (5193) $1,500 $2,600 $2,600
Certifications (5194) $0 $5,000 $5,000Tool Allowance (5196) $400 $0 $0
Personnel Total: $1,294,059 $1,672,417 $1,672,417
Notes to Budget:¹ Reclassification requested for this position for FY 17.² This position has received a 2% COLA in FY 17.³ New position requested in FY 17 for casino inspectional issues.⁴ The FY 17 salary was based on 2% increase for FY 15. Union also settled on 2% for FY 16. Also includes step increases.
193
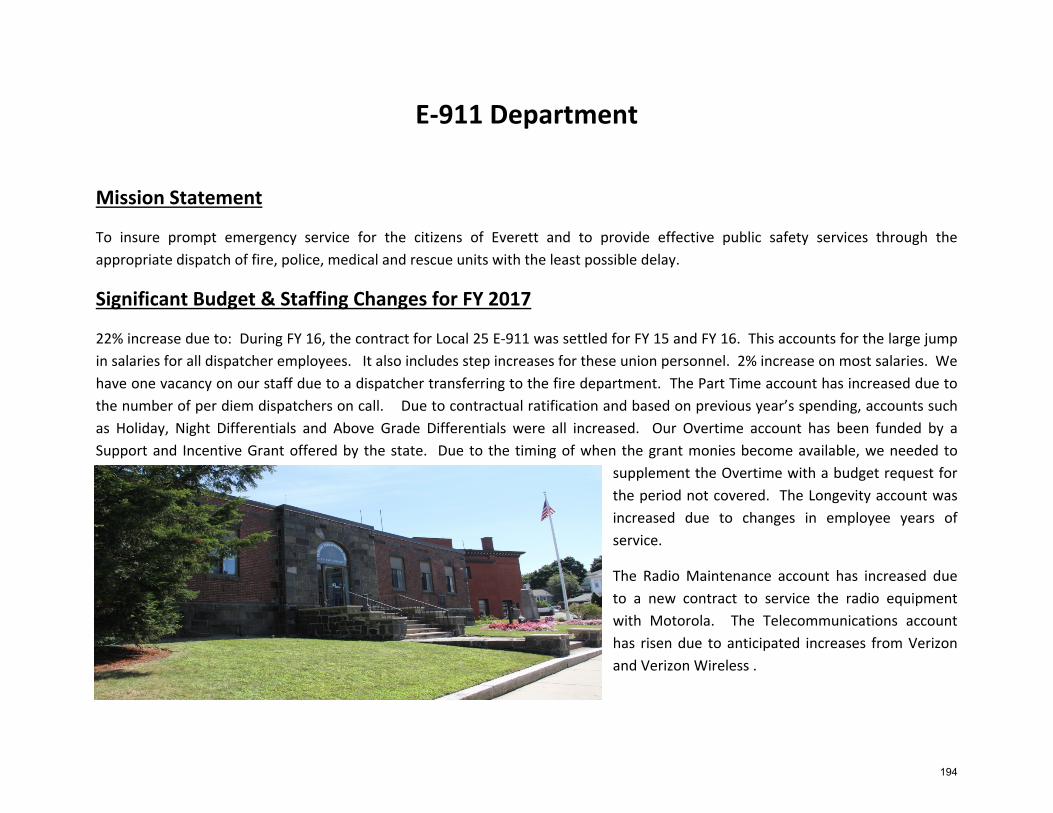
E‐911 Department
Mission Statement
To insure prompt emergency service for the citizens of Everett and to provide effective public safety services through the appropriate dispatch of fire, police, medical and rescue units with the least possible delay.
Significant Budget & Staffing Changes for FY 2017
22% increase due to: During FY 16, the contract for Local 25 E‐911 was settled for FY 15 and FY 16. This accounts for the large jump in salaries for all dispatcher employees. It also includes step increases for these union personnel. 2% increase on most salaries. We have one vacancy on our staff due to a dispatcher transferring to the fire department. The Part Time account has increased due to the number of per diem dispatchers on call. Due to contractual ratification and based on previous year’s spending, accounts such as Holiday, Night Differentials and Above Grade Differentials were all increased. Our Overtime account has been funded by a Support and Incentive Grant offered by the state. Due to the timing of when the grant monies become available, we needed to
supplement the Overtime with a budget request for the period not covered. The Longevity account was increased due to changes in employee years of service.
The Radio Maintenance account has increased due to a new contract to service the radio equipment with Motorola. The Telecommunications account has risen due to anticipated increases from Verizon and Verizon Wireless .
194
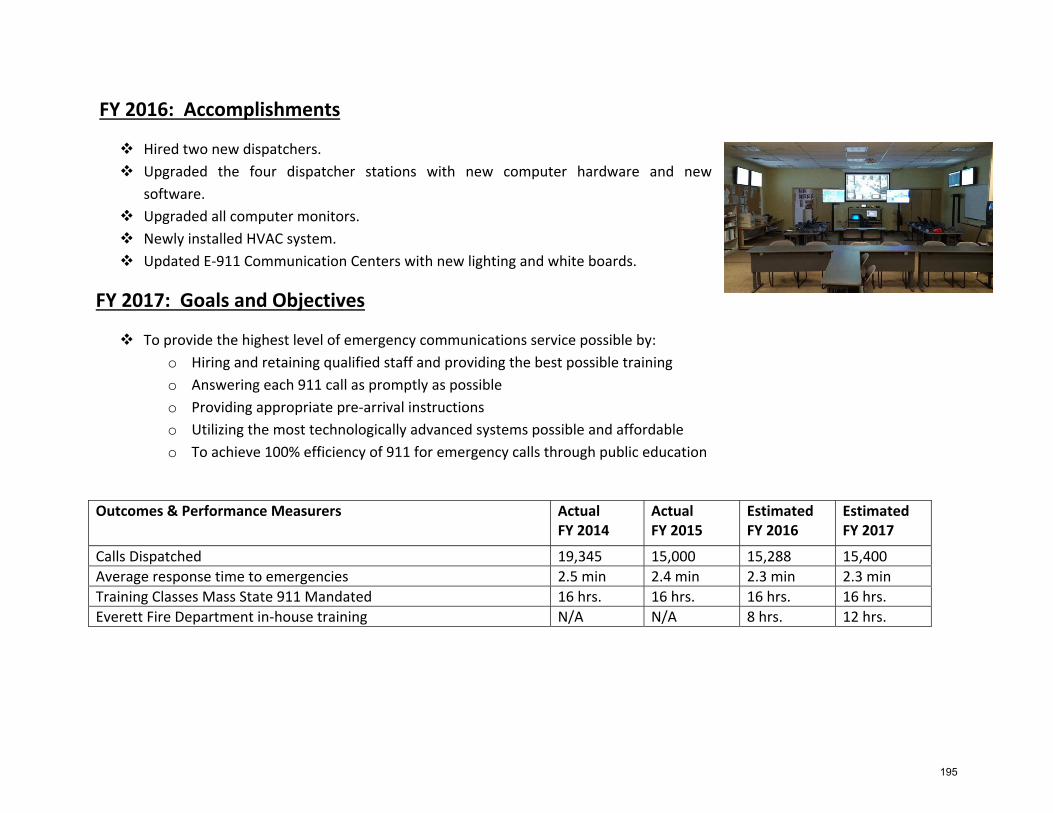
FY 2016: Accomplishments
Hired two new dispatchers. Upgraded the four dispatcher stations with new computer hardware and new
software. Upgraded all computer monitors. Newly installed HVAC system. Updated E‐911 Communication Centers with new lighting and white boards.
FY 2017: Goals and Objectives
To provide the highest level of emergency communications service possible by: o Hiring and retaining qualified staff and providing the best possible training o Answering each 911 call as promptly as possible o Providing appropriate pre‐arrival instructions o Utilizing the most technologically advanced systems possible and affordable o To achieve 100% efficiency of 911 for emergency calls through public education
Outcomes & Performance Measurers Actual FY 2014
Actual FY 2015
Estimated FY 2016
Estimated FY 2017
Calls Dispatched 19,345 15,000 15,288 15,400 Average response time to emergencies 2.5 min 2.4 min 2.3 min 2.3 min Training Classes Mass State 911 Mandated 16 hrs. 16 hrs. 16 hrs. 16 hrs. Everett Fire Department in‐house training N/A N/A 8 hrs. 12 hrs.
195
How FY 2017 Departmental Goals Relate to City’s Overall Long & Short Term Goals
911 Call Centers, also known as Public Safety Answering Points (PSAPs) are the public’s first line of contact to public safety authorities in an emergency. To strengthen emergency communications capabilities citywide, focusing on technology, coordination, governance, planning, usage, training and exercise at all levels of public safety. One of the city’s short‐term goals is to incorporate Text‐to‐911, which is the ability to send a text message to reach 911emergency call takers from your mobile phone or device. Today, most consumers cannot reach 911 by sending a text message from their wireless phone. In limited areas of the US however, it is now possible to use certain wireless telephone services to send a text message to 911. This means that in such areas, if you are unable to make a voice 911 call you can type your message on your wireless phone and send it to a 911 operator. In the future, thext‐to‐911 will be widely available in the US. However, text‐to‐911 is currently only available in certain markets where 911 call centers (PSAPs) have elected to accept emergency text messages from the public. For this reason, unless you have confirmed that the PSAP in your area supports text‐to‐911, you should not rely on text to reach 911.
It is the City of Everett’s intention to update all emergency telecommunications with fiber optics. Fiber optics communication has revolutionized the telecommunications industry. Using fiber optic cable, optical communications have enabled telecommunications links to be made over much greater distances and with much lower levels of loss in the transmission medium and possible most important of all, fiber optical communications has enabled much higher data rates to be accommodated.
196
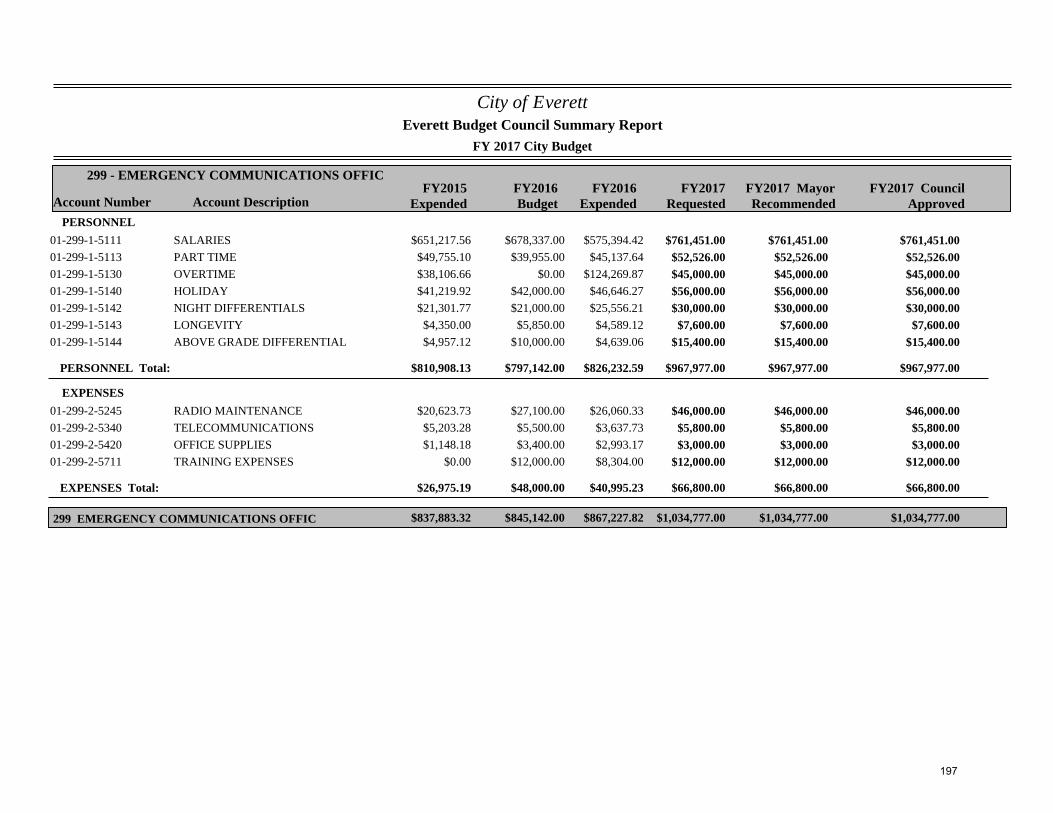
City of Everett
FY 2017 City Budget
Account Number Account DescriptionFY2015
ExpendedFY2016Budget
FY2017Requested
299 - EMERGENCY COMMUNICATIONS OFFIC
Everett Budget Council Summary Report
FY2017 MayorRecommended
FY2016Expended
FY2017 CouncilApproved
PERSONNEL$651,217.56 $678,337.00 $761,451.0001-299-1-5111 SALARIES $575,394.42 $761,451.00 $761,451.00
$49,755.10 $39,955.00 $52,526.0001-299-1-5113 PART TIME $45,137.64 $52,526.00 $52,526.00$38,106.66 $0.00 $45,000.0001-299-1-5130 OVERTIME $124,269.87 $45,000.00 $45,000.00$41,219.92 $42,000.00 $56,000.0001-299-1-5140 HOLIDAY $46,646.27 $56,000.00 $56,000.00$21,301.77 $21,000.00 $30,000.0001-299-1-5142 NIGHT DIFFERENTIALS $25,556.21 $30,000.00 $30,000.00$4,350.00 $5,850.00 $7,600.0001-299-1-5143 LONGEVITY $4,589.12 $7,600.00 $7,600.00$4,957.12 $10,000.00 $15,400.0001-299-1-5144 ABOVE GRADE DIFFERENTIAL $4,639.06 $15,400.00 $15,400.00
PERSONNEL Total: $810,908.13 $797,142.00 $967,977.00$826,232.59 $967,977.00 $967,977.00
EXPENSES$20,623.73 $27,100.00 $46,000.0001-299-2-5245 RADIO MAINTENANCE $26,060.33 $46,000.00 $46,000.00$5,203.28 $5,500.00 $5,800.0001-299-2-5340 TELECOMMUNICATIONS $3,637.73 $5,800.00 $5,800.00$1,148.18 $3,400.00 $3,000.0001-299-2-5420 OFFICE SUPPLIES $2,993.17 $3,000.00 $3,000.00
$0.00 $12,000.00 $12,000.0001-299-2-5711 TRAINING EXPENSES $8,304.00 $12,000.00 $12,000.00
EXPENSES Total: $26,975.19 $48,000.00 $66,800.00$40,995.23 $66,800.00 $66,800.00
$837,883.32 $845,142.00 $1,034,777.00299 EMERGENCY COMMUNICATIONS OFFIC $867,227.82 $1,034,777.00 $1,034,777.00
197
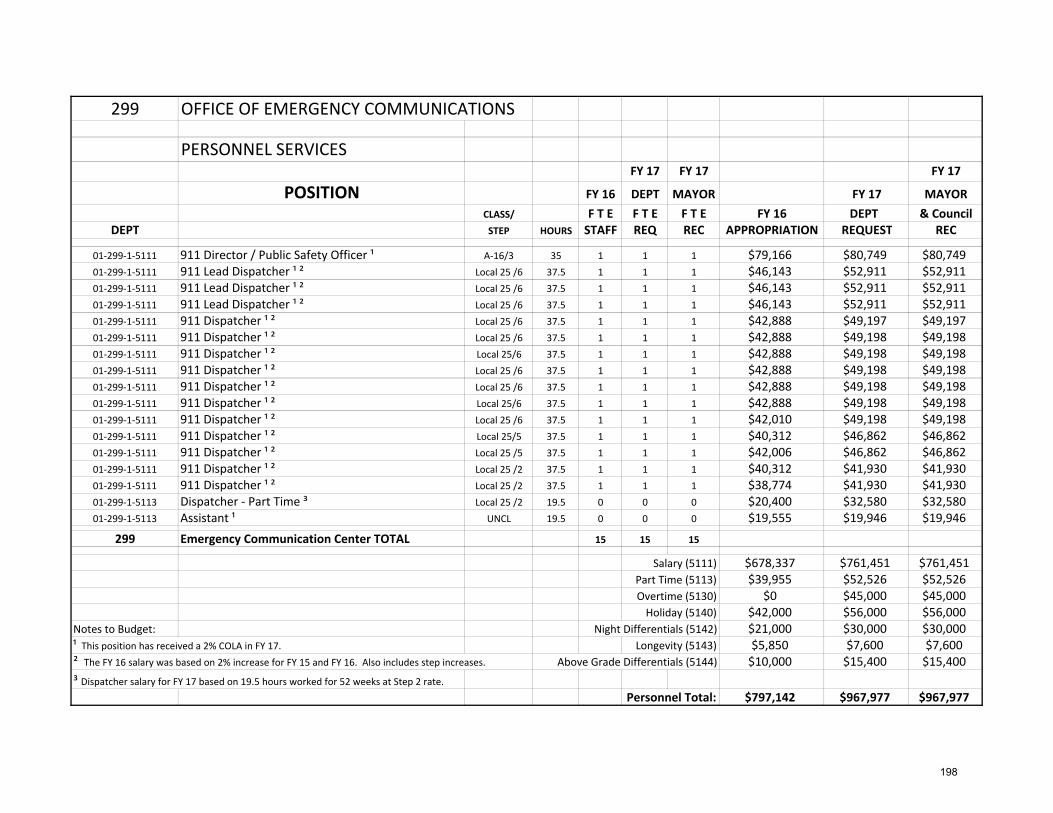
299 OFFICE OF EMERGENCY COMMUNICATIONS
PERSONNEL SERVICESFY 17 FY 17 FY 17
POSITION FY 16 DEPT MAYOR FY 17 MAYORCLASS/ F T E F T E F T E FY 16 DEPT & Council
DEPT STEP HOURS STAFF REQ REC APPROPRIATION REQUEST REC
01‐299‐1‐5111 911 Director / Public Safety Officer ¹ A‐16/3 35 1 1 1 $79,166 $80,749 $80,74901‐299‐1‐5111 911 Lead Dispatcher ¹ ² Local 25 /6 37.5 1 1 1 $46,143 $52,911 $52,91101‐299‐1‐5111 911 Lead Dispatcher ¹ ² Local 25 /6 37.5 1 1 1 $46,143 $52,911 $52,91101‐299‐1‐5111 911 Lead Dispatcher ¹ ² Local 25 /6 37.5 1 1 1 $46,143 $52,911 $52,91101‐299‐1‐5111 911 Dispatcher ¹ ² Local 25 /6 37.5 1 1 1 $42,888 $49,197 $49,19701‐299‐1‐5111 911 Dispatcher ¹ ² Local 25 /6 37.5 1 1 1 $42,888 $49,198 $49,19801‐299‐1‐5111 911 Dispatcher ¹ ² Local 25/6 37.5 1 1 1 $42,888 $49,198 $49,19801‐299‐1‐5111 911 Dispatcher ¹ ² Local 25 /6 37.5 1 1 1 $42,888 $49,198 $49,19801‐299‐1‐5111 911 Dispatcher ¹ ² Local 25 /6 37.5 1 1 1 $42,888 $49,198 $49,19801‐299‐1‐5111 911 Dispatcher ¹ ² Local 25/6 37.5 1 1 1 $42,888 $49,198 $49,19801‐299‐1‐5111 911 Dispatcher ¹ ² Local 25 /6 37.5 1 1 1 $42,010 $49,198 $49,19801‐299‐1‐5111 911 Dispatcher ¹ ² Local 25/5 37.5 1 1 1 $40,312 $46,862 $46,86201‐299‐1‐5111 911 Dispatcher ¹ ² Local 25 /5 37.5 1 1 1 $42,006 $46,862 $46,86201‐299‐1‐5111 911 Dispatcher ¹ ² Local 25 /2 37.5 1 1 1 $40,312 $41,930 $41,93001‐299‐1‐5111 911 Dispatcher ¹ ² Local 25 /2 37.5 1 1 1 $38,774 $41,930 $41,93001‐299‐1‐5113 Dispatcher ‐ Part Time ³ Local 25 /2 19.5 0 0 0 $20,400 $32,580 $32,58001‐299‐1‐5113 Assistant ¹ UNCL 19.5 0 0 0 $19,555 $19,946 $19,946
299 Emergency Communication Center TOTAL 15 15 15
Salary (5111) $678,337 $761,451 $761,451Part Time (5113) $39,955 $52,526 $52,526Overtime (5130) $0 $45,000 $45,000Holiday (5140) $42,000 $56,000 $56,000
Notes to Budget: Night Differentials (5142) $21,000 $30,000 $30,000¹ This position has received a 2% COLA in FY 17. Longevity (5143) $5,850 $7,600 $7,600² The FY 16 salary was based on 2% increase for FY 15 and FY 16. Also includes step increases. Above Grade Differentials (5144) $10,000 $15,400 $15,400³ Dispatcher salary for FY 17 based on 19.5 hours worked for 52 weeks at Step 2 rate.
Personnel Total: $797,142 $967,977 $967,977
198
Department of Public Works
Mission Statement
To provide essential services to the citizens of Everett in a prompt, courteous, safe, efficient and cost‐effective manner. City Services, through its dedicated employees, strives to plan, design, build, maintain, and operate public infrastructure in a manner that respects the environment and the ability of government to adequately preserve these assets for succeeding generations.
Executive / Fleet Division
Significant Budget & Staffing Changes for FY 2017
24% increase due to: Fleet Manager salary added to budget. Also seeking funding under newly created Part Time account for a Motor Equipment Repairman. Large increases for union employees due to their contract settled for both FY 15 and FY 16 during FY 16. Also includes step increases for these union personnel and one clerk being reclassified to a reduced position. 2% increase on most salaries. Longevity decreased due to a retirement in this division. The Mechanic Stipend was a contractual addition to the FY 17 budget. Contractual increase in the Clothing Allowance account.
Gasoline/Diesel/Oil was increased based on prior year’s history for the cost of product. This line also supports all new city vehicles. Under the new federal regulations, we must use DEF additive to the new diesel trucks. This is purchased under this account as well. DPW Repair Maintenance account increased due to the number of vehicles on‐line. Also, more repairs are needed on the fleet due to age. Shop Tools was increased to purchase a new tire machine (changes tires) and a wheel balancing machine. Also for electronic diagnostic equipment needed to maintain the fleet’s health. The Fleet Manager is also hoping to purchase a hydraulic hose maker. This will allow us to make repairs instantly instead of depending on an outside vendor. MV Inspections account has gone up due to
199
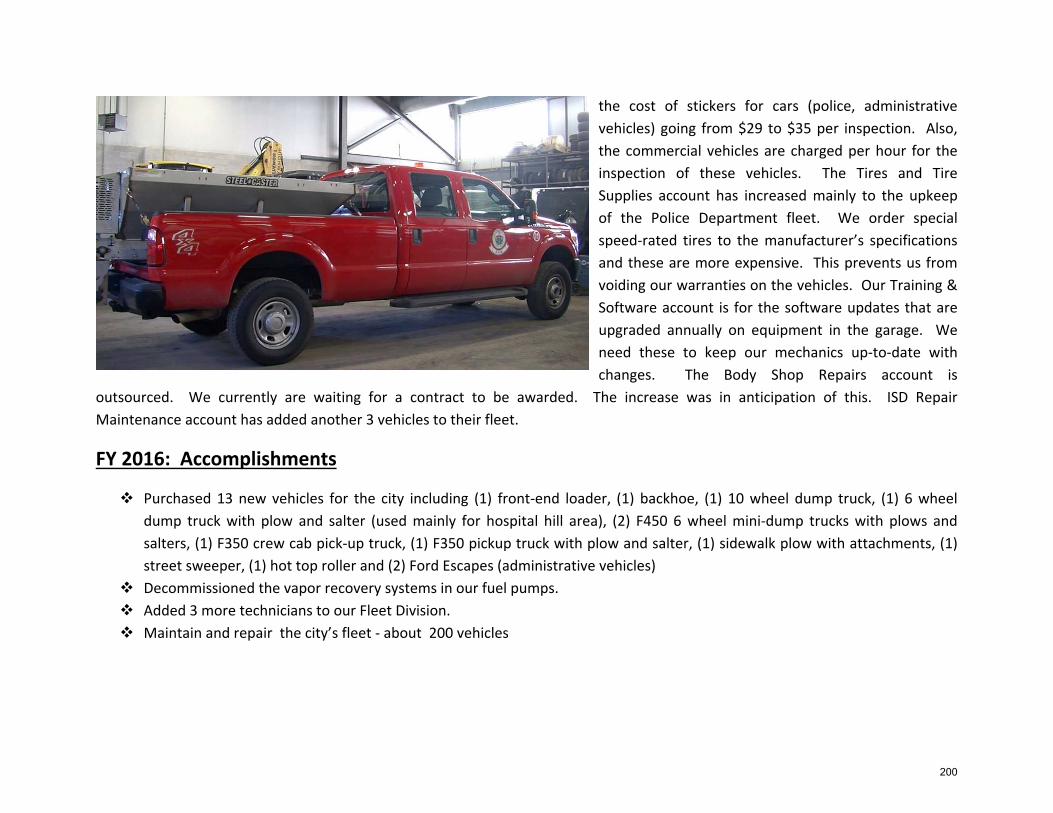
the cost of stickers for cars (police, administrative vehicles) going from $29 to $35 per inspection. Also, the commercial vehicles are charged per hour for the inspection of these vehicles. The Tires and Tire Supplies account has increased mainly to the upkeep of the Police Department fleet. We order special speed‐rated tires to the manufacturer’s specifications and these are more expensive. This prevents us from voiding our warranties on the vehicles. Our Training & Software account is for the software updates that are upgraded annually on equipment in the garage. We need these to keep our mechanics up‐to‐date with changes. The Body Shop Repairs account is
outsourced. We currently are waiting for a contract to be awarded. The increase was in anticipation of this. ISD Repair Maintenance account has added another 3 vehicles to their fleet.
FY 2016: Accomplishments
Purchased 13 new vehicles for the city including (1) front‐end loader, (1) backhoe, (1) 10 wheel dump truck, (1) 6 wheel dump truck with plow and salter (used mainly for hospital hill area), (2) F450 6 wheel mini‐dump trucks with plows and salters, (1) F350 crew cab pick‐up truck, (1) F350 pickup truck with plow and salter, (1) sidewalk plow with attachments, (1) street sweeper, (1) hot top roller and (2) Ford Escapes (administrative vehicles)
Decommissioned the vapor recovery systems in our fuel pumps. Added 3 more technicians to our Fleet Division. Maintain and repair the city’s fleet ‐ about 200 vehicles
200
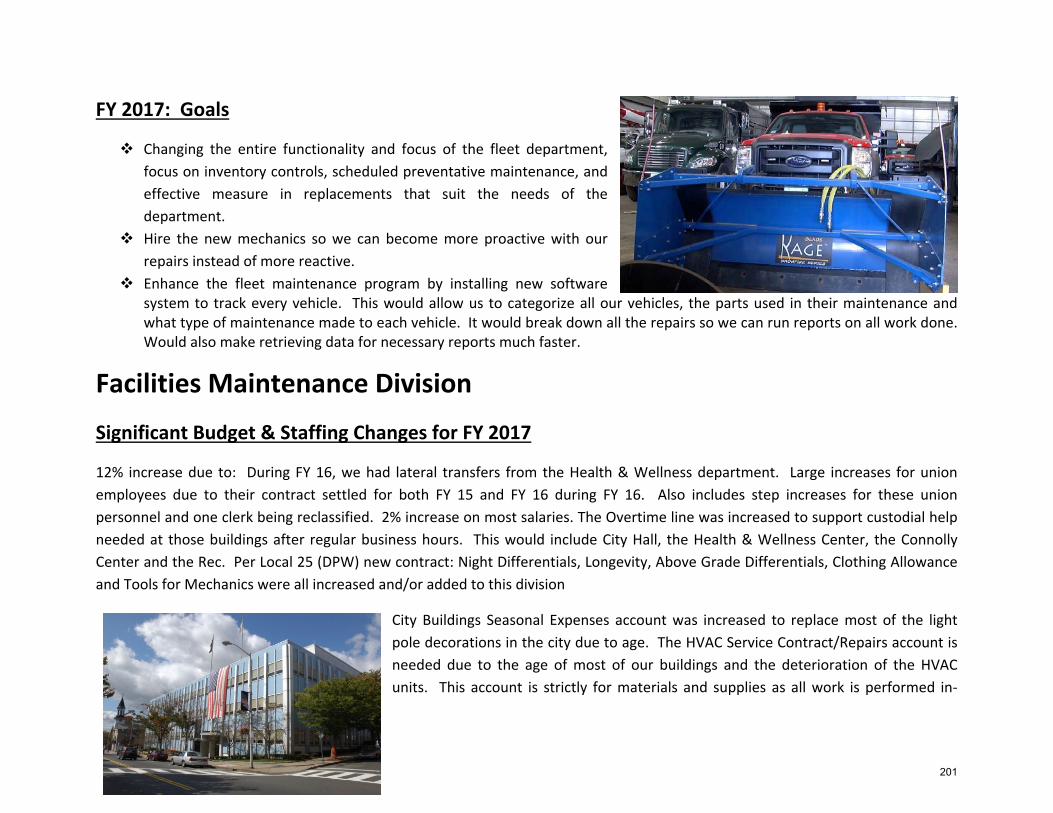
FY 2017: Goals
Changing the entire functionality and focus of the fleet department, focus on inventory controls, scheduled preventative maintenance, and effective measure in replacements that suit the needs of the department.
Hire the new mechanics so we can become more proactive with our repairs instead of more reactive.
Enhance the fleet maintenance program by installing new software system to track every vehicle. This would allow us to categorize all our vehicles, the parts used in their maintenance and what type of maintenance made to each vehicle. It would break down all the repairs so we can run reports on all work done. Would also make retrieving data for necessary reports much faster.
Facilities Maintenance Division
Significant Budget & Staffing Changes for FY 2017
12% increase due to: During FY 16, we had lateral transfers from the Health & Wellness department. Large increases for union employees due to their contract settled for both FY 15 and FY 16 during FY 16. Also includes step increases for these union personnel and one clerk being reclassified. 2% increase on most salaries. The Overtime line was increased to support custodial help needed at those buildings after regular business hours. This would include City Hall, the Health & Wellness Center, the Connolly Center and the Rec. Per Local 25 (DPW) new contract: Night Differentials, Longevity, Above Grade Differentials, Clothing Allowance and Tools for Mechanics were all increased and/or added to this division
City Buildings Seasonal Expenses account was increased to replace most of the light pole decorations in the city due to age. The HVAC Service Contract/Repairs account is needed due to the age of most of our buildings and the deterioration of the HVAC units. This account is strictly for materials and supplies as all work is performed in‐
201
house. The Elevator Service Contract was increased due to the Shute Library being added to the existing contract with 3 Phase Elevator. The Cleaning Service Contract/City account and the Custodial Supplies account were increased due to the addition of the new Health & Wellness Center and the newly renovated Shute Library coming back online. Building Repair & Maintenance was reduced due to spending history. Wire Expenses account was increased due to the anticipated installation of new holiday decorations.
FY 2016: Accomplishments
Two new bathrooms added to the Central Fire House and new kitchen added. New doors installed at the Connolly Center, new windows installed and a new security system installed (outside). Installed new batting cage at Recreation Center. Also repainted the facility. Installed new portable units at the Health & Wellness Center. Renovated 5 offices at City Hall including construction, painting and tile work. Ran new sewer lines into the bathrooms at Everett Memorial Stadium out to the street.
FY 2017: Goals
Install new hardwood floors and roof to the Connolly Center and redesign the front entranceway. Moving the KUBA department from the second floor to newly renovated office space on the basement floor. Also need to
move new Elections Commission department info offices at City Hall. Hancock Street Fire Station renovations. Everett Police Station and E‐911– reconditioned air conditioning unit. Upgrade juvenile cells at the station. Purchase a 25 ton AC unit for the Wellness Center. Installing a new hot water/heating element to the old EHS Charter School. New rugs and painting at the Parlin Library. Continue to be on‐call for any issues with our city buildings and preventative maintenance to all buildings.
202
Engineering Division
Significant Budget & Staffing Changes for FY 2017
8% increase due to: During FY 16 there was a clerical vacancy in this department. The union employee who filled the position was at a higher salary when transferred. This employee also receives longevity which is why that account was increased. 2% increase on most salaries.
The Office Supplies account was increased due to the purchase of a new plotter‐printer and the supplies needed for it. The Office Equipment account is for this specialized printer. The current one is about 15 years old and has high maintenance fees. We use this plotter to print AutoCAD drawings. This new plotter allows the city to design small in‐house projects so that money on outside consulting services is saved.
FY 2016: Accomplishments
Completion of the city’s Stormwater and Wastewater Integrated Management Plan. This plan evaluates alternative means for addressing a community’s current and future wastewater and stormwater needs. It also identifies the most economical and environmentally appropriate means of meeting those needs. The city developed a list of 63 projects with an estimated construction value of close to $50M and developed a timeline for completing these projects over 40 years.
Shute Library Drainage Project – Worked with DPW personnel to install a 170‐feet long 4‐inch perforated pipe under the sidewalk to drain a perched water table that was causing sidewalk icing problems during winter conditions. The cost of this in‐house project was approximately $8,500.
Webster School Playground – Designed and installed new
203
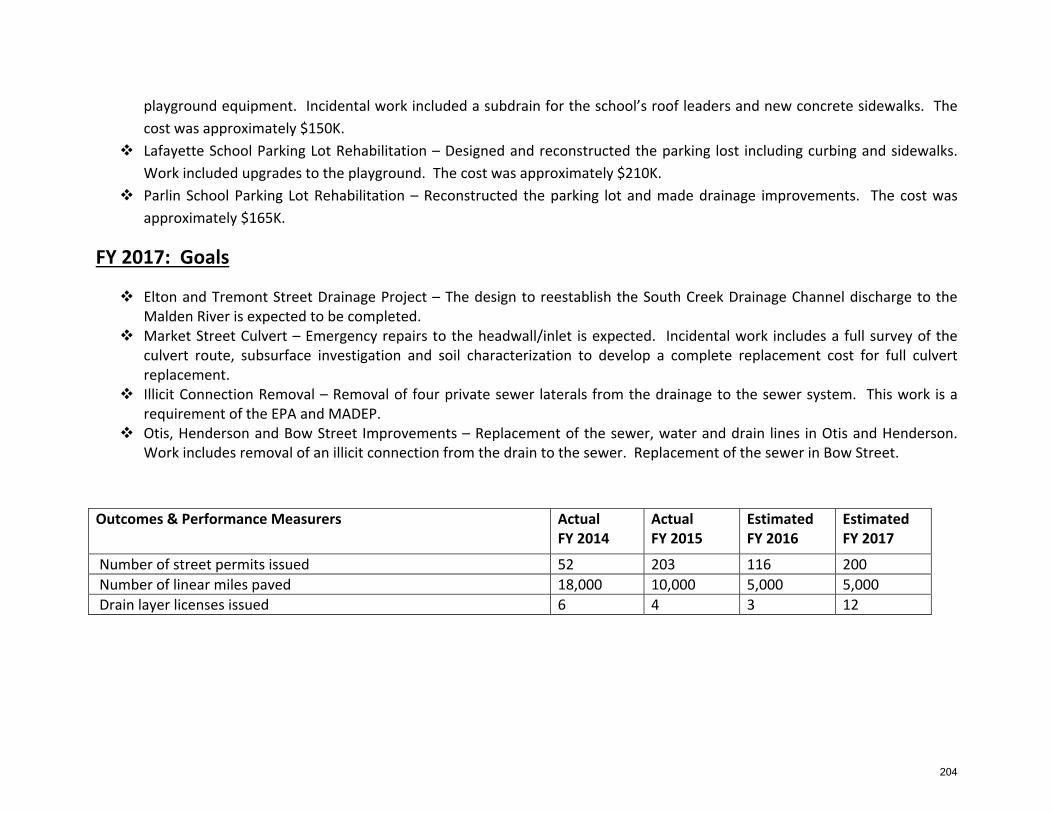
playground equipment. Incidental work included a subdrain for the school’s roof leaders and new concrete sidewalks. The cost was approximately $150K.
Lafayette School Parking Lot Rehabilitation – Designed and reconstructed the parking lost including curbing and sidewalks. Work included upgrades to the playground. The cost was approximately $210K.
Parlin School Parking Lot Rehabilitation – Reconstructed the parking lot and made drainage improvements. The cost was approximately $165K.
FY 2017: Goals
Elton and Tremont Street Drainage Project – The design to reestablish the South Creek Drainage Channel discharge to the Malden River is expected to be completed.
Market Street Culvert – Emergency repairs to the headwall/inlet is expected. Incidental work includes a full survey of the culvert route, subsurface investigation and soil characterization to develop a complete replacement cost for full culvert replacement.
Illicit Connection Removal – Removal of four private sewer laterals from the drainage to the sewer system. This work is a requirement of the EPA and MADEP.
Otis, Henderson and Bow Street Improvements – Replacement of the sewer, water and drain lines in Otis and Henderson. Work includes removal of an illicit connection from the drain to the sewer. Replacement of the sewer in Bow Street.
Outcomes & Performance Measurers Actual FY 2014
Actual FY 2015
Estimated FY 2016
Estimated FY 2017
Number of street permits issued 52 203 116 200 Number of linear miles paved 18,000 10,000 5,000 5,000 Drain layer licenses issued 6 4 3 12
204
Parks & Cemeteries Division
Significant Budget & Staffing Changes for FY 2017
34% increase due to: During FY 16, we had 5 lateral transfers from the Highway division. Large increases for union employees due to their contract settled for both FY 15 and FY 16 during FY 16. Also includes step increases for these union personnel and one clerk being reclassified. 2% increase on most salaries. The Overtime line was increased to support these lateral transfers. Also, Clothing Allowance was increased as it was a contractual issue.
Our Landscaping account was increased due to new contracts with McHue’s for purchasing all seasonal citywide flowers and hanging baskets. Also for the landscaping and planting of all flowers at public buildings and islands in and around the city. The Glenwood Cemetery Expenses will cover the purchase of a new Bobcat Utility Vehicle.
Repair & Maintenance increase covers all repairs to fields and parks. Contracts are to be put out to bid for portable restrooms, fence maintenance and the painting of all fields. Also Glendale Park has been placed under this account. Expect to have continued maintenance to field and park done
in‐house. Trees, Seed & Sod Supplies are for the trees needed for all streets that have either had new sidewalk pavement put in, were removed due to damage/disease/car accidents. We are going out to bid in FY 17 for new contracts for these trees.
205
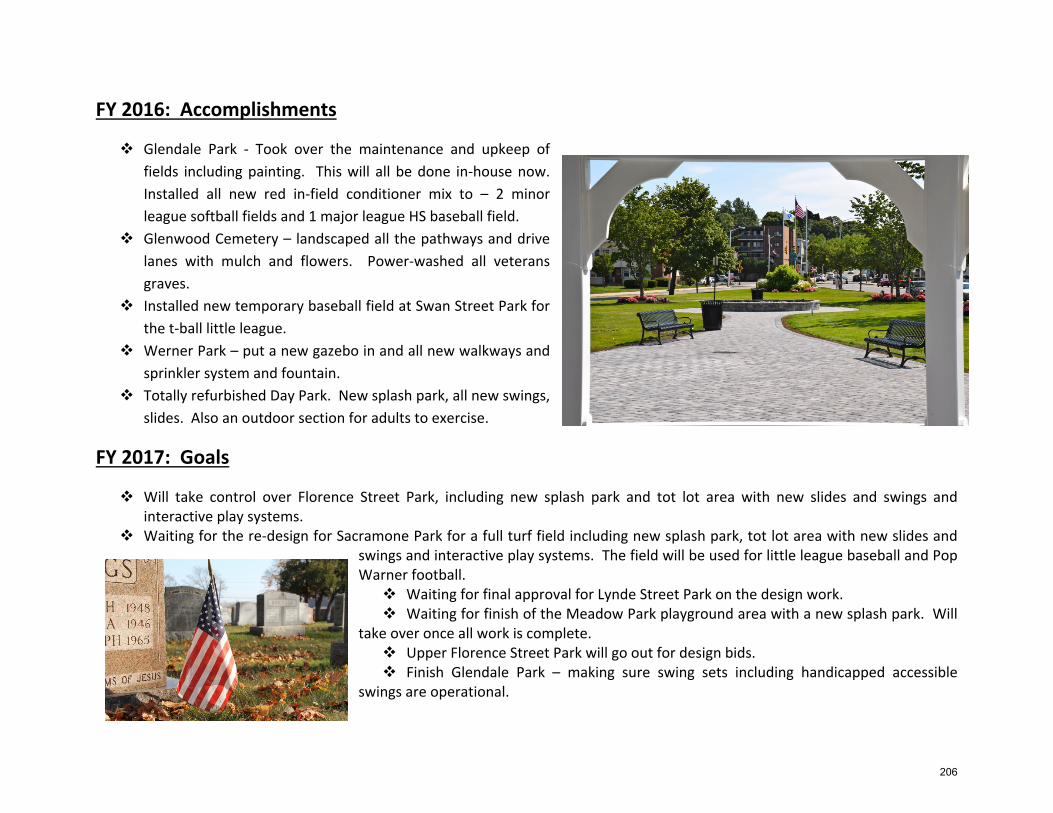
FY 2016: Accomplishments
Glendale Park ‐ Took over the maintenance and upkeep of fields including painting. This will all be done in‐house now. Installed all new red in‐field conditioner mix to – 2 minor league softball fields and 1 major league HS baseball field.
Glenwood Cemetery – landscaped all the pathways and drive lanes with mulch and flowers. Power‐washed all veterans graves.
Installed new temporary baseball field at Swan Street Park for the t‐ball little league.
Werner Park – put a new gazebo in and all new walkways and sprinkler system and fountain.
Totally refurbished Day Park. New splash park, all new swings, slides. Also an outdoor section for adults to exercise.
FY 2017: Goals
Will take control over Florence Street Park, including new splash park and tot lot area with new slides and swings and interactive play systems.
Waiting for the re‐design for Sacramone Park for a full turf field including new splash park, tot lot area with new slides and swings and interactive play systems. The field will be used for little league baseball and Pop Warner football. Waiting for final approval for Lynde Street Park on the design work. Waiting for finish of the Meadow Park playground area with a new splash park. Will
take over once all work is complete. Upper Florence Street Park will go out for design bids. Finish Glendale Park – making sure swing sets including handicapped accessible
swings are operational.
206
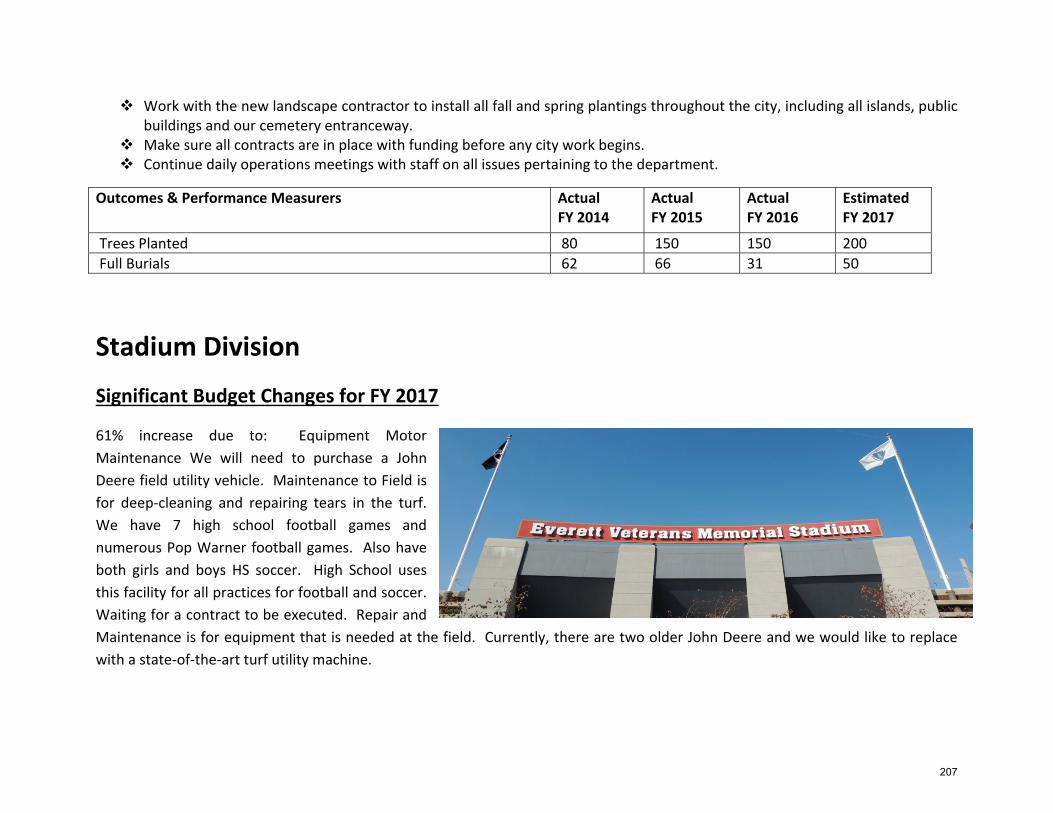
Work with the new landscape contractor to install all fall and spring plantings throughout the city, including all islands, public buildings and our cemetery entranceway.
Make sure all contracts are in place with funding before any city work begins. Continue daily operations meetings with staff on all issues pertaining to the department.
Outcomes & Performance Measurers Actual FY 2014
Actual FY 2015
Actual FY 2016
Estimated FY 2017
Trees Planted 80 150 150 200 Full Burials 62 66 31 50
Stadium Division
Significant Budget Changes for FY 2017
61% increase due to: Equipment Motor Maintenance We will need to purchase a John Deere field utility vehicle. Maintenance to Field is for deep‐cleaning and repairing tears in the turf. We have 7 high school football games and numerous Pop Warner football games. Also have both girls and boys HS soccer. High School uses this facility for all practices for football and soccer. Waiting for a contract to be executed. Repair and Maintenance is for equipment that is needed at the field. Currently, there are two older John Deere and we would like to replace with a state‐of‐the‐art turf utility machine.
207
FY 2016: Accomplishments
New bathrooms in the field house. Added two new field lights to allow night games.
FY 2017: Goals
Have a successful drum and bugle corps event in August 2016. This is the first time we were able to accommodate a national corps to perform.
To install a new turf field. The current life of our field is 10 – 12 years. We are at that stage now.
Highway Division
Significant Budget & Staffing Changes for FY 2017
‐2% decrease due to: Several positions moved to Parks & Cemeteries Division. Night Differential and Clothing Allowance increases were contractual (Local 25 DPW).
The Construction Repairs account and the Cement Stone and Asphalt account increased due to moving away from hiring outside contractors and doing the work in‐house. Overall, the cost savings is significant by doings this. The Equipment Hire account was increased due to rentals for A‐Frame barricades needed for city‐wide events. The Street & Traffic account is for the supplies and maintenance needed for our new street sweeper. The Street & Traffic Signs account was increased to meet new state regulations on street signage. Every street sign must be replaced with the new specifications set by the Commonwealth.
FY 2016: Accomplishments
New sidewalks installed on 40 streets (6,000 feet). This work was all done in‐house at significant savings. Catch basins – repaired approximately 40 catch basins throughout the city. All done in‐house. Asphalt repairs, about 200 tons of asphalt used for all asphalt repairs, including water trenches, pot holes, sink holes, etc.
208
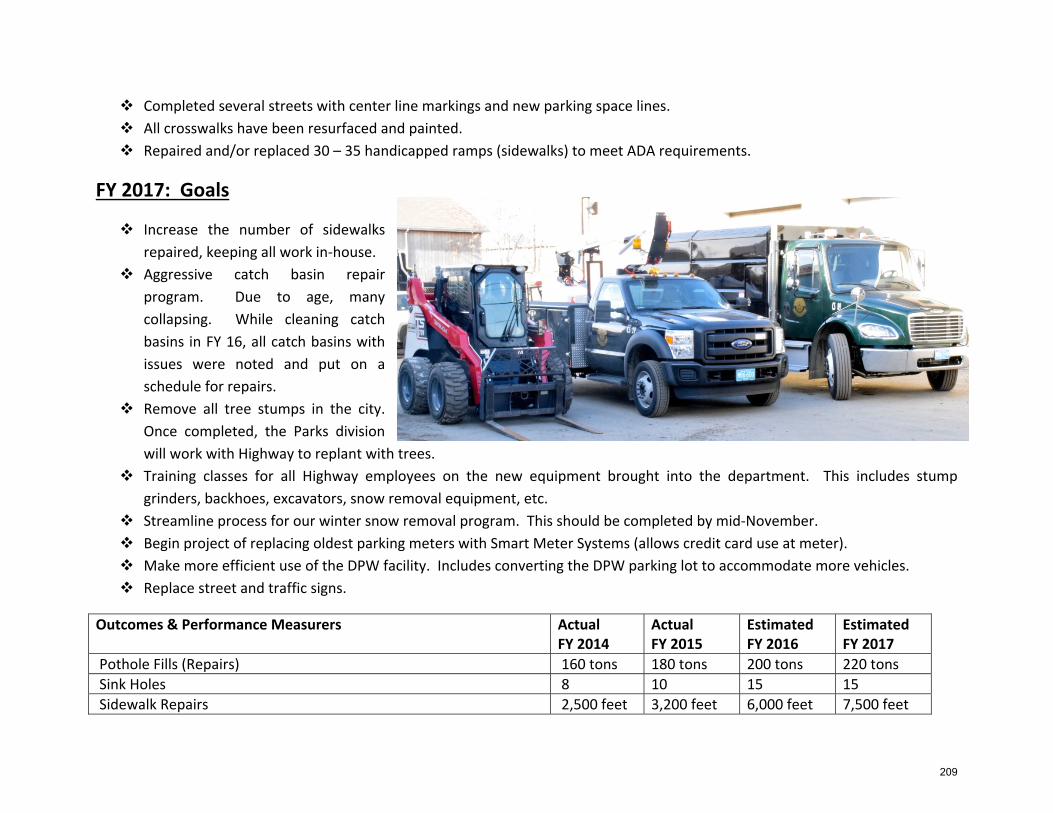
Completed several streets with center line markings and new parking space lines. All crosswalks have been resurfaced and painted. Repaired and/or replaced 30 – 35 handicapped ramps (sidewalks) to meet ADA requirements.
FY 2017: Goals
Increase the number of sidewalks repaired, keeping all work in‐house.
Aggressive catch basin repair program. Due to age, many collapsing. While cleaning catch basins in FY 16, all catch basins with issues were noted and put on a schedule for repairs.
Remove all tree stumps in the city. Once completed, the Parks division will work with Highway to replant with trees.
Training classes for all Highway employees on the new equipment brought into the department. This includes stump grinders, backhoes, excavators, snow removal equipment, etc.
Streamline process for our winter snow removal program. This should be completed by mid‐November. Begin project of replacing oldest parking meters with Smart Meter Systems (allows credit card use at meter). Make more efficient use of the DPW facility. Includes converting the DPW parking lot to accommodate more vehicles. Replace street and traffic signs.
Outcomes & Performance Measurers Actual FY 2014
Actual FY 2015
Estimated FY 2016
Estimated FY 2017
Pothole Fills (Repairs) 160 tons 180 tons 200 tons 220 tons Sink Holes 8 10 15 15 Sidewalk Repairs 2,500 feet 3,200 feet 6,000 feet 7,500 feet
209
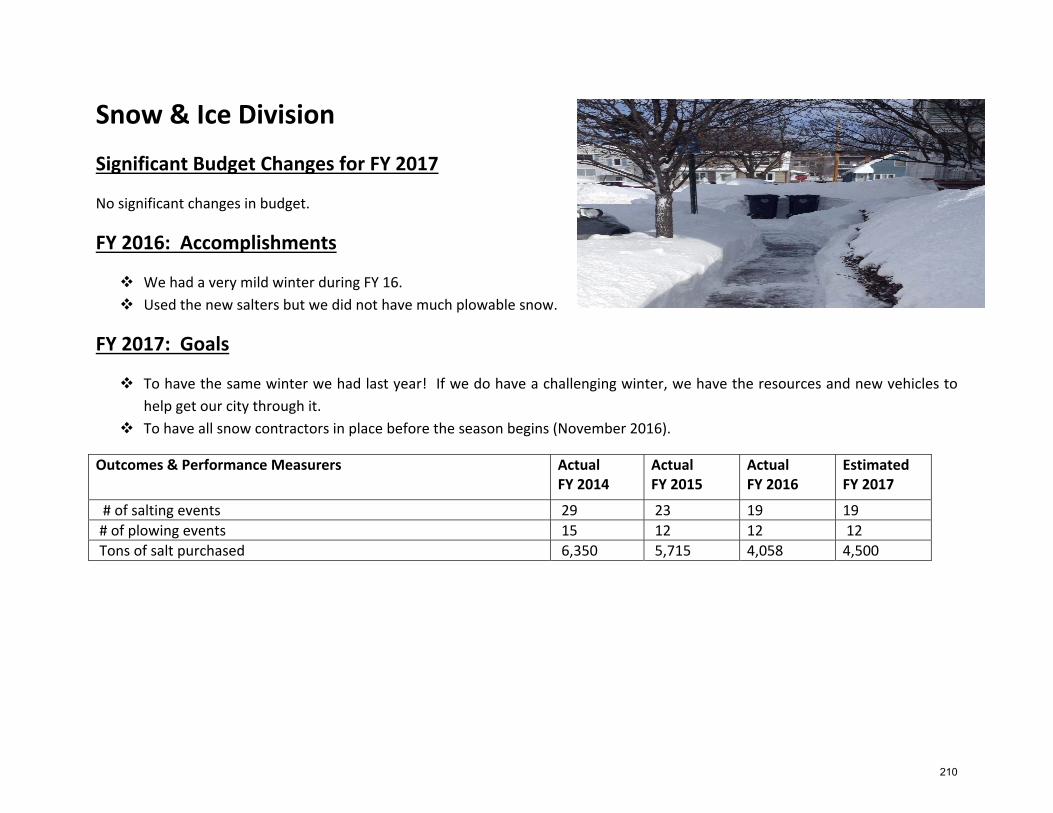
Snow & Ice Division
Significant Budget Changes for FY 2017
No significant changes in budget.
FY 2016: Accomplishments
We had a very mild winter during FY 16. Used the new salters but we did not have much plowable snow.
FY 2017: Goals
To have the same winter we had last year! If we do have a challenging winter, we have the resources and new vehicles to help get our city through it.
To have all snow contractors in place before the season begins (November 2016).
Outcomes & Performance Measurers Actual FY 2014
Actual FY 2015
Actual FY 2016
Estimated FY 2017
# of salting events 29 23 19 19 # of plowing events 15 12 12 12 Tons of salt purchased 6,350 5,715 4,058 4,500
210
Solid Waste Division
Significant Budget Changes for FY 2017
3% increase due to: Contractual increases
FY 2016: Accomplishments
New trash/recycling bins continue to be solid investment
FY 2017: Goals
Continue to keep city proactive with recycling and increasing number of hazardous/yard waste pickups
Outcomes & Performance Measurers Actual FY 2014
Actual FY 2015
Estimated FY 2016
Estimated FY 2017
Consumer complaints regarding trash pick up *TBD # of yard waste pick ups *TBD Tons of trash picked up *TBD Tons of recycling picked up *TBD *Will be provided in FY2018 budget
211
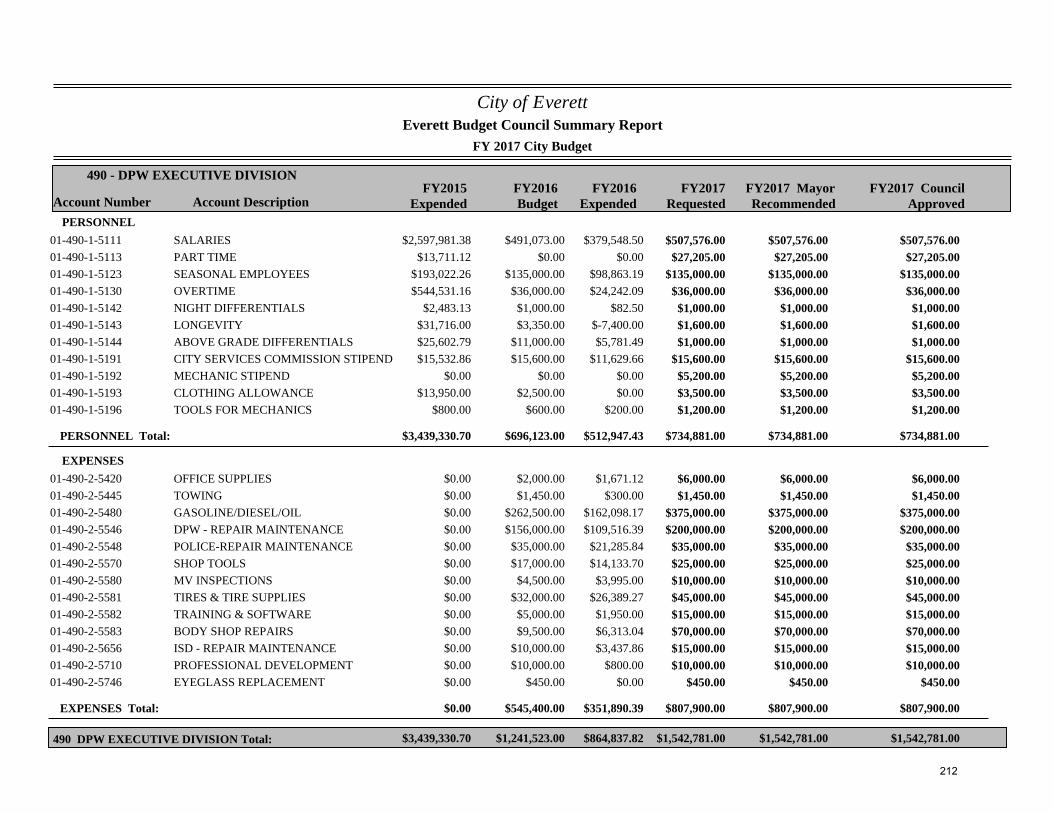
City of Everett
FY 2017 City Budget
Account Number Account DescriptionFY2015
ExpendedFY2016Budget
FY2017Requested
490 - DPW EXECUTIVE DIVISION
Everett Budget Council Summary Report
FY2017 MayorRecommended
FY2016Expended
FY2017 CouncilApproved
PERSONNEL$2,597,981.38 $491,073.00 $507,576.0001-490-1-5111 SALARIES $379,548.50 $507,576.00 $507,576.00
$13,711.12 $0.00 $27,205.0001-490-1-5113 PART TIME $0.00 $27,205.00 $27,205.00$193,022.26 $135,000.00 $135,000.0001-490-1-5123 SEASONAL EMPLOYEES $98,863.19 $135,000.00 $135,000.00$544,531.16 $36,000.00 $36,000.0001-490-1-5130 OVERTIME $24,242.09 $36,000.00 $36,000.00
$2,483.13 $1,000.00 $1,000.0001-490-1-5142 NIGHT DIFFERENTIALS $82.50 $1,000.00 $1,000.00$31,716.00 $3,350.00 $1,600.0001-490-1-5143 LONGEVITY $-7,400.00 $1,600.00 $1,600.00$25,602.79 $11,000.00 $1,000.0001-490-1-5144 ABOVE GRADE DIFFERENTIALS $5,781.49 $1,000.00 $1,000.00$15,532.86 $15,600.00 $15,600.0001-490-1-5191 CITY SERVICES COMMISSION STIPEND $11,629.66 $15,600.00 $15,600.00
$0.00 $0.00 $5,200.0001-490-1-5192 MECHANIC STIPEND $0.00 $5,200.00 $5,200.00$13,950.00 $2,500.00 $3,500.0001-490-1-5193 CLOTHING ALLOWANCE $0.00 $3,500.00 $3,500.00
$800.00 $600.00 $1,200.0001-490-1-5196 TOOLS FOR MECHANICS $200.00 $1,200.00 $1,200.00
PERSONNEL Total: $3,439,330.70 $696,123.00 $734,881.00$512,947.43 $734,881.00 $734,881.00
EXPENSES$0.00 $2,000.00 $6,000.0001-490-2-5420 OFFICE SUPPLIES $1,671.12 $6,000.00 $6,000.00$0.00 $1,450.00 $1,450.0001-490-2-5445 TOWING $300.00 $1,450.00 $1,450.00$0.00 $262,500.00 $375,000.0001-490-2-5480 GASOLINE/DIESEL/OIL $162,098.17 $375,000.00 $375,000.00$0.00 $156,000.00 $200,000.0001-490-2-5546 DPW - REPAIR MAINTENANCE $109,516.39 $200,000.00 $200,000.00$0.00 $35,000.00 $35,000.0001-490-2-5548 POLICE-REPAIR MAINTENANCE $21,285.84 $35,000.00 $35,000.00$0.00 $17,000.00 $25,000.0001-490-2-5570 SHOP TOOLS $14,133.70 $25,000.00 $25,000.00$0.00 $4,500.00 $10,000.0001-490-2-5580 MV INSPECTIONS $3,995.00 $10,000.00 $10,000.00$0.00 $32,000.00 $45,000.0001-490-2-5581 TIRES & TIRE SUPPLIES $26,389.27 $45,000.00 $45,000.00$0.00 $5,000.00 $15,000.0001-490-2-5582 TRAINING & SOFTWARE $1,950.00 $15,000.00 $15,000.00$0.00 $9,500.00 $70,000.0001-490-2-5583 BODY SHOP REPAIRS $6,313.04 $70,000.00 $70,000.00$0.00 $10,000.00 $15,000.0001-490-2-5656 ISD - REPAIR MAINTENANCE $3,437.86 $15,000.00 $15,000.00$0.00 $10,000.00 $10,000.0001-490-2-5710 PROFESSIONAL DEVELOPMENT $800.00 $10,000.00 $10,000.00$0.00 $450.00 $450.0001-490-2-5746 EYEGLASS REPLACEMENT $0.00 $450.00 $450.00
EXPENSES Total: $0.00 $545,400.00 $807,900.00$351,890.39 $807,900.00 $807,900.00
$3,439,330.70 $1,241,523.00 $1,542,781.00490 DPW EXECUTIVE DIVISION Total: $864,837.82 $1,542,781.00 $1,542,781.00
212
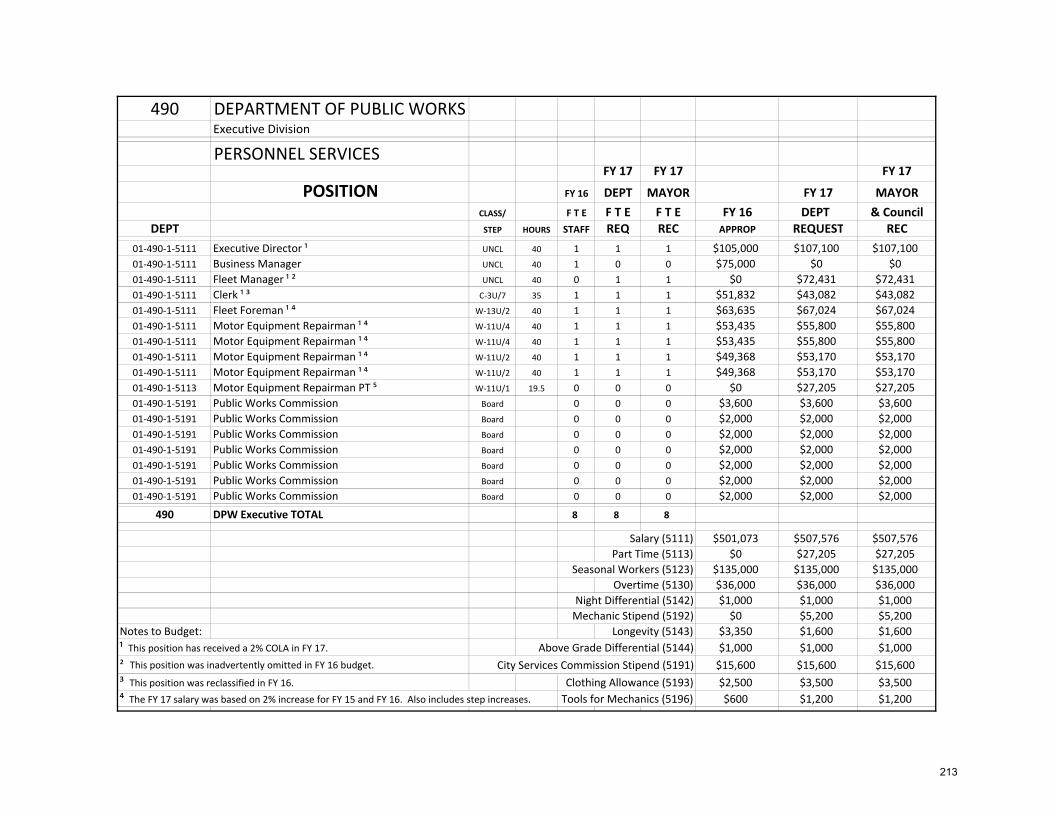
490 DEPARTMENT OF PUBLIC WORKSExecutive Division
PERSONNEL SERVICESFY 17 FY 17 FY 17
POSITION FY 16 DEPT MAYOR FY 17 MAYORCLASS/ F T E F T E F T E FY 16 DEPT & Council
DEPT STEP HOURS STAFF REQ REC APPROP REQUEST REC01‐490‐1‐5111 Executive Director ¹ UNCL 40 1 1 1 $105,000 $107,100 $107,10001‐490‐1‐5111 Business Manager UNCL 40 1 0 0 $75,000 $0 $001‐490‐1‐5111 Fleet Manager ¹ ² UNCL 40 0 1 1 $0 $72,431 $72,43101‐490‐1‐5111 Clerk ¹ ³ C‐3U/7 35 1 1 1 $51,832 $43,082 $43,08201‐490‐1‐5111 Fleet Foreman ¹ ⁴ W‐13U/2 40 1 1 1 $63,635 $67,024 $67,02401‐490‐1‐5111 Motor Equipment Repairman ¹ ⁴ W‐11U/4 40 1 1 1 $53,435 $55,800 $55,80001‐490‐1‐5111 Motor Equipment Repairman ¹ ⁴ W‐11U/4 40 1 1 1 $53,435 $55,800 $55,80001‐490‐1‐5111 Motor Equipment Repairman ¹ ⁴ W‐11U/2 40 1 1 1 $49,368 $53,170 $53,17001‐490‐1‐5111 Motor Equipment Repairman ¹ ⁴ W‐11U/2 40 1 1 1 $49,368 $53,170 $53,17001‐490‐1‐5113 Motor Equipment Repairman PT ⁵ W‐11U/1 19.5 0 0 0 $0 $27,205 $27,20501‐490‐1‐5191 Public Works Commission Board 0 0 0 $3,600 $3,600 $3,60001‐490‐1‐5191 Public Works Commission Board 0 0 0 $2,000 $2,000 $2,00001‐490‐1‐5191 Public Works Commission Board 0 0 0 $2,000 $2,000 $2,00001‐490‐1‐5191 Public Works Commission Board 0 0 0 $2,000 $2,000 $2,00001‐490‐1‐5191 Public Works Commission Board 0 0 0 $2,000 $2,000 $2,00001‐490‐1‐5191 Public Works Commission Board 0 0 0 $2,000 $2,000 $2,00001‐490‐1‐5191 Public Works Commission Board 0 0 0 $2,000 $2,000 $2,000
490 DPW Executive TOTAL 8 8 8
Salary (5111) $501,073 $507,576 $507,576Part Time (5113) $0 $27,205 $27,205
Seasonal Workers (5123) $135,000 $135,000 $135,000Overtime (5130) $36,000 $36,000 $36,000
Night Differential (5142) $1,000 $1,000 $1,000Mechanic Stipend (5192) $0 $5,200 $5,200
Notes to Budget: Longevity (5143) $3,350 $1,600 $1,600¹ This position has received a 2% COLA in FY 17. Above Grade Differential (5144) $1,000 $1,000 $1,000² This position was inadvertently omitted in FY 16 budget. City Services Commission Stipend (5191) $15,600 $15,600 $15,600³ This position was reclassified in FY 16. Clothing Allowance (5193) $2,500 $3,500 $3,500⁴ The FY 17 salary was based on 2% increase for FY 15 and FY 16. Also includes step increases. Tools for Mechanics (5196) $600 $1,200 $1,200
213
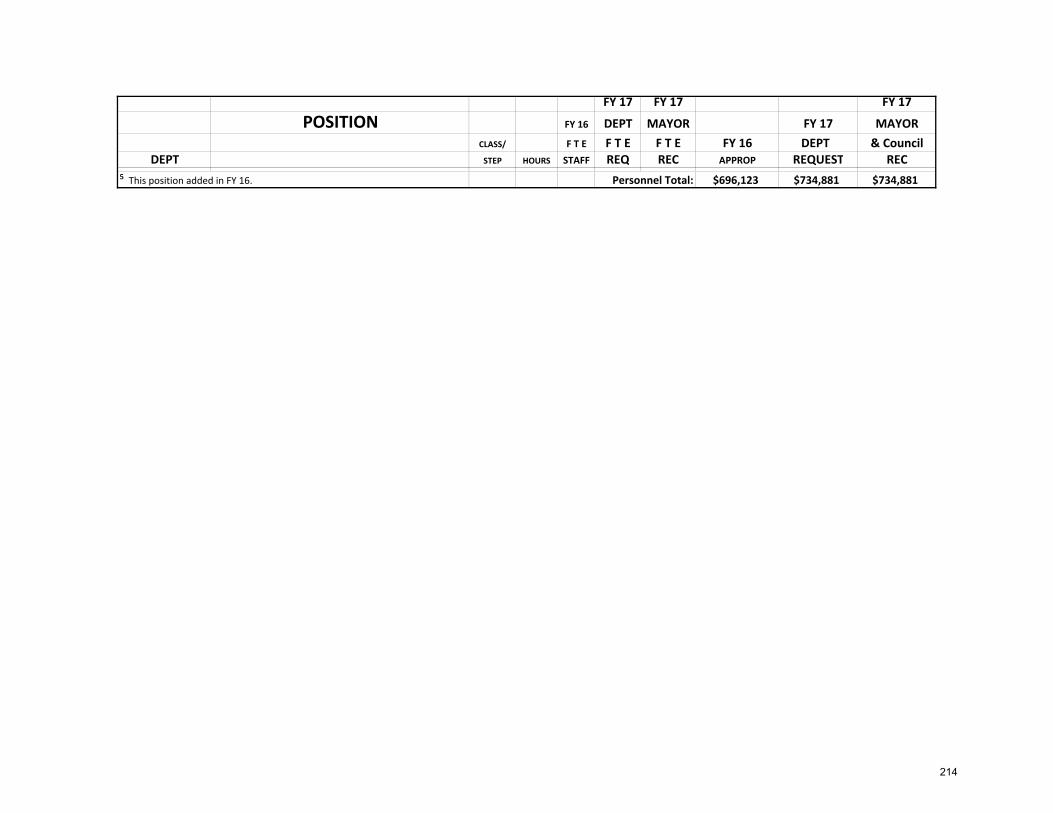
FY 17 FY 17 FY 17
POSITION FY 16 DEPT MAYOR FY 17 MAYORCLASS/ F T E F T E F T E FY 16 DEPT & Council
DEPT STEP HOURS STAFF REQ REC APPROP REQUEST REC⁵ This position added in FY 16. Personnel Total: $696,123 $734,881 $734,881
214
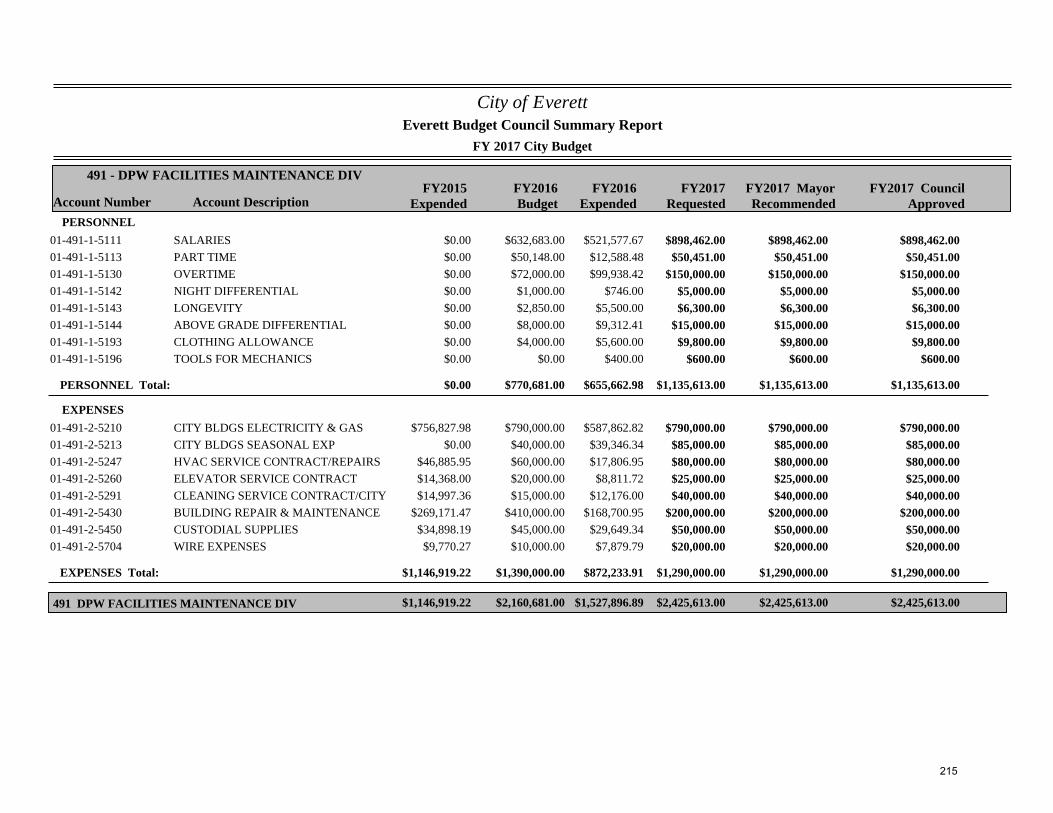
City of Everett
FY 2017 City Budget
Account Number Account DescriptionFY2015
ExpendedFY2016Budget
FY2017Requested
491 - DPW FACILITIES MAINTENANCE DIV
Everett Budget Council Summary Report
FY2017 MayorRecommended
FY2016Expended
FY2017 CouncilApproved
PERSONNEL$0.00 $632,683.00 $898,462.0001-491-1-5111 SALARIES $521,577.67 $898,462.00 $898,462.00$0.00 $50,148.00 $50,451.0001-491-1-5113 PART TIME $12,588.48 $50,451.00 $50,451.00$0.00 $72,000.00 $150,000.0001-491-1-5130 OVERTIME $99,938.42 $150,000.00 $150,000.00$0.00 $1,000.00 $5,000.0001-491-1-5142 NIGHT DIFFERENTIAL $746.00 $5,000.00 $5,000.00$0.00 $2,850.00 $6,300.0001-491-1-5143 LONGEVITY $5,500.00 $6,300.00 $6,300.00$0.00 $8,000.00 $15,000.0001-491-1-5144 ABOVE GRADE DIFFERENTIAL $9,312.41 $15,000.00 $15,000.00$0.00 $4,000.00 $9,800.0001-491-1-5193 CLOTHING ALLOWANCE $5,600.00 $9,800.00 $9,800.00$0.00 $0.00 $600.0001-491-1-5196 TOOLS FOR MECHANICS $400.00 $600.00 $600.00
PERSONNEL Total: $0.00 $770,681.00 $1,135,613.00$655,662.98 $1,135,613.00 $1,135,613.00
EXPENSES$756,827.98 $790,000.00 $790,000.0001-491-2-5210 CITY BLDGS ELECTRICITY & GAS $587,862.82 $790,000.00 $790,000.00
$0.00 $40,000.00 $85,000.0001-491-2-5213 CITY BLDGS SEASONAL EXP $39,346.34 $85,000.00 $85,000.00$46,885.95 $60,000.00 $80,000.0001-491-2-5247 HVAC SERVICE CONTRACT/REPAIRS $17,806.95 $80,000.00 $80,000.00$14,368.00 $20,000.00 $25,000.0001-491-2-5260 ELEVATOR SERVICE CONTRACT $8,811.72 $25,000.00 $25,000.00$14,997.36 $15,000.00 $40,000.0001-491-2-5291 CLEANING SERVICE CONTRACT/CITY $12,176.00 $40,000.00 $40,000.00
$269,171.47 $410,000.00 $200,000.0001-491-2-5430 BUILDING REPAIR & MAINTENANCE $168,700.95 $200,000.00 $200,000.00$34,898.19 $45,000.00 $50,000.0001-491-2-5450 CUSTODIAL SUPPLIES $29,649.34 $50,000.00 $50,000.00$9,770.27 $10,000.00 $20,000.0001-491-2-5704 WIRE EXPENSES $7,879.79 $20,000.00 $20,000.00
EXPENSES Total: $1,146,919.22 $1,390,000.00 $1,290,000.00$872,233.91 $1,290,000.00 $1,290,000.00
$1,146,919.22 $2,160,681.00 $2,425,613.00491 DPW FACILITIES MAINTENANCE DIV $1,527,896.89 $2,425,613.00 $2,425,613.00
215
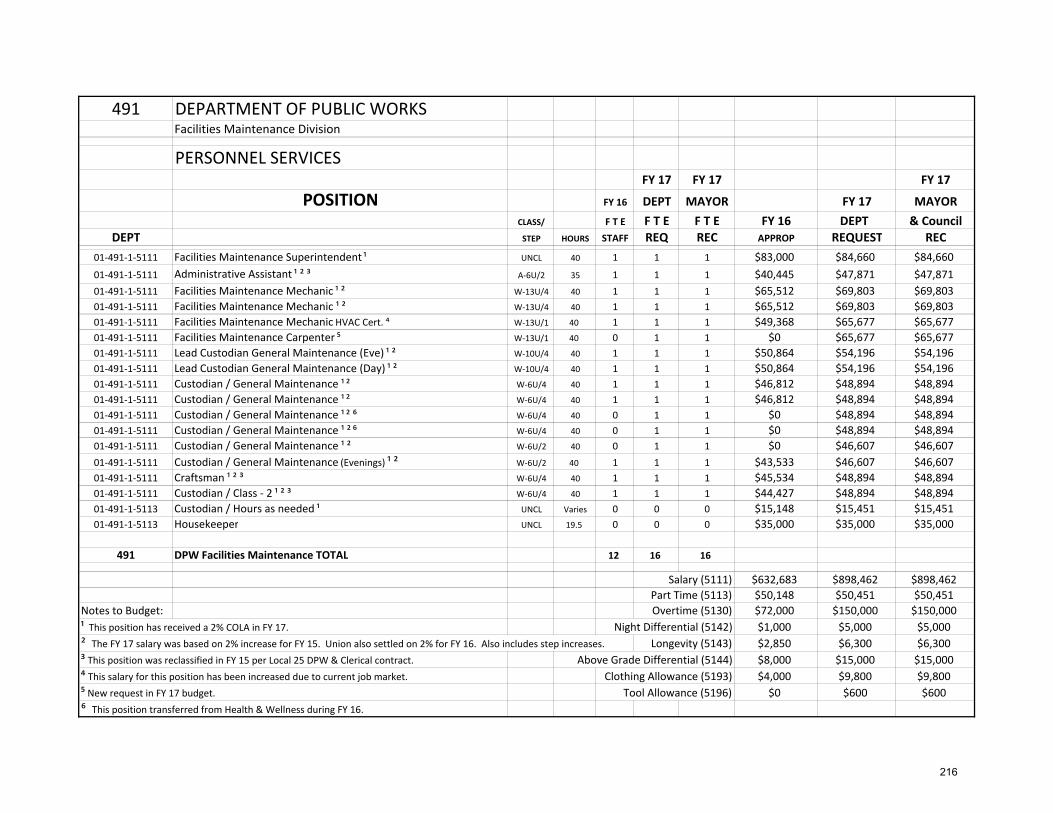
491 DEPARTMENT OF PUBLIC WORKSFacilities Maintenance Division
PERSONNEL SERVICESFY 17 FY 17 FY 17
POSITION FY 16 DEPT MAYOR FY 17 MAYORCLASS/ F T E F T E F T E FY 16 DEPT & Council
DEPT STEP HOURS STAFF REQ REC APPROP REQUEST REC01‐491‐1‐5111 Facilities Maintenance Superintendent ¹ UNCL 40 1 1 1 $83,000 $84,660 $84,66001‐491‐1‐5111 Administrative Assistant ¹ ² ³ A‐6U/2 35 1 1 1 $40,445 $47,871 $47,87101‐491‐1‐5111 Facilities Maintenance Mechanic ¹ ² W‐13U/4 40 1 1 1 $65,512 $69,803 $69,80301‐491‐1‐5111 Facilities Maintenance Mechanic ¹ ² W‐13U/4 40 1 1 1 $65,512 $69,803 $69,80301‐491‐1‐5111 Facilities Maintenance Mechanic HVAC Cert. ⁴ W‐13U/1 40 1 1 1 $49,368 $65,677 $65,67701‐491‐1‐5111 Facilities Maintenance Carpenter ⁵ W‐13U/1 40 0 1 1 $0 $65,677 $65,67701‐491‐1‐5111 Lead Custodian General Maintenance (Eve) ¹ ² W‐10U/4 40 1 1 1 $50,864 $54,196 $54,19601‐491‐1‐5111 Lead Custodian General Maintenance (Day) ¹ ² W‐10U/4 40 1 1 1 $50,864 $54,196 $54,19601‐491‐1‐5111 Custodian / General Maintenance ¹ ² W‐6U/4 40 1 1 1 $46,812 $48,894 $48,89401‐491‐1‐5111 Custodian / General Maintenance ¹ ² W‐6U/4 40 1 1 1 $46,812 $48,894 $48,89401‐491‐1‐5111 Custodian / General Maintenance ¹ ² ⁶ W‐6U/4 40 0 1 1 $0 $48,894 $48,89401‐491‐1‐5111 Custodian / General Maintenance ¹ ² ⁶ W‐6U/4 40 0 1 1 $0 $48,894 $48,89401‐491‐1‐5111 Custodian / General Maintenance ¹ ² W‐6U/2 40 0 1 1 $0 $46,607 $46,60701‐491‐1‐5111 Custodian / General Maintenance (Evenings) ¹ ² W‐6U/2 40 1 1 1 $43,533 $46,607 $46,60701‐491‐1‐5111 Craftsman ¹ ² ³ W‐6U/4 40 1 1 1 $45,534 $48,894 $48,89401‐491‐1‐5111 Custodian / Class ‐ 2 ¹ ² ³ W‐6U/4 40 1 1 1 $44,427 $48,894 $48,89401‐491‐1‐5113 Custodian / Hours as needed ¹ UNCL Varies 0 0 0 $15,148 $15,451 $15,45101‐491‐1‐5113 Housekeeper UNCL 19.5 0 0 0 $35,000 $35,000 $35,000
491 DPW Facilities Maintenance TOTAL 12 16 16
Salary (5111) $632,683 $898,462 $898,462 Part Time (5113) $50,148 $50,451 $50,451Notes to Budget: Overtime (5130) $72,000 $150,000 $150,000¹ This position has received a 2% COLA in FY 17. Night Differential (5142) $1,000 $5,000 $5,000² The FY 17 salary was based on 2% increase for FY 15. Union also settled on 2% for FY 16. Also includes step increases. Longevity (5143) $2,850 $6,300 $6,300³ This position was reclassified in FY 15 per Local 25 DPW & Clerical contract. Above Grade Differential (5144) $8,000 $15,000 $15,000⁴ This salary for this position has been increased due to current job market. Clothing Allowance (5193) $4,000 $9,800 $9,800⁵ New request in FY 17 budget. Tool Allowance (5196) $0 $600 $600⁶ This position transferred from Health & Wellness during FY 16.
216
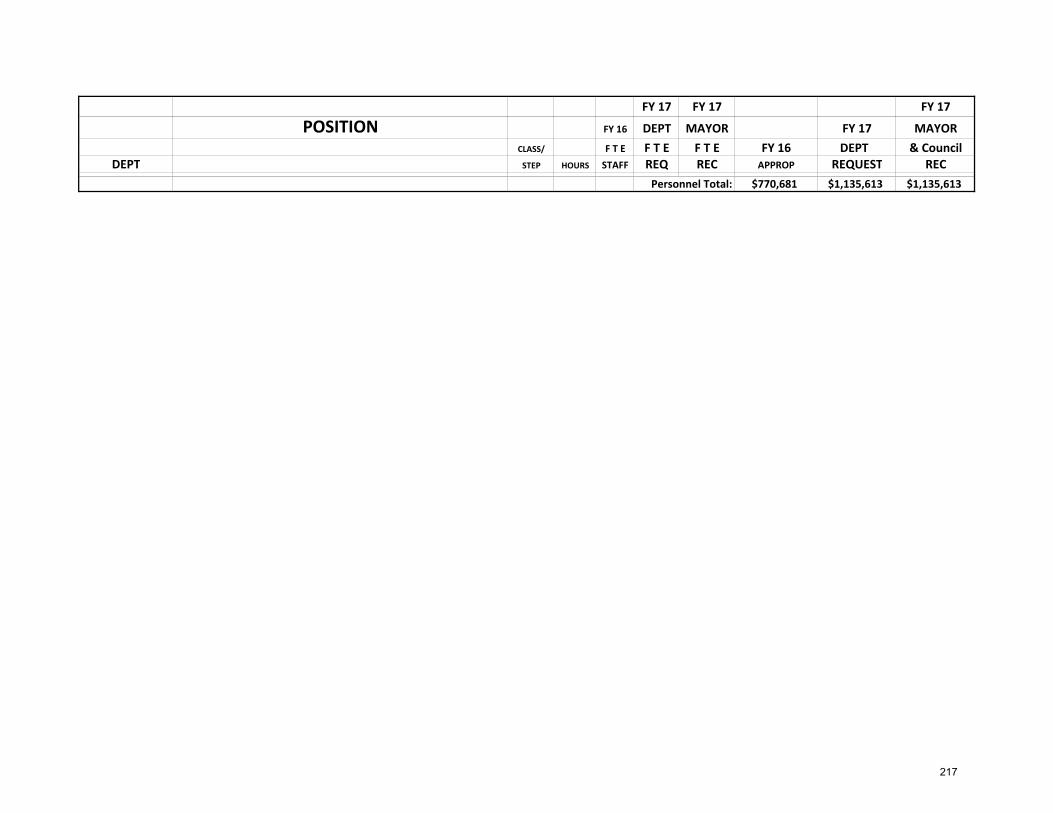
FY 17 FY 17 FY 17
POSITION FY 16 DEPT MAYOR FY 17 MAYORCLASS/ F T E F T E F T E FY 16 DEPT & Council
DEPT STEP HOURS STAFF REQ REC APPROP REQUEST RECPersonnel Total: $770,681 $1,135,613 $1,135,613
217
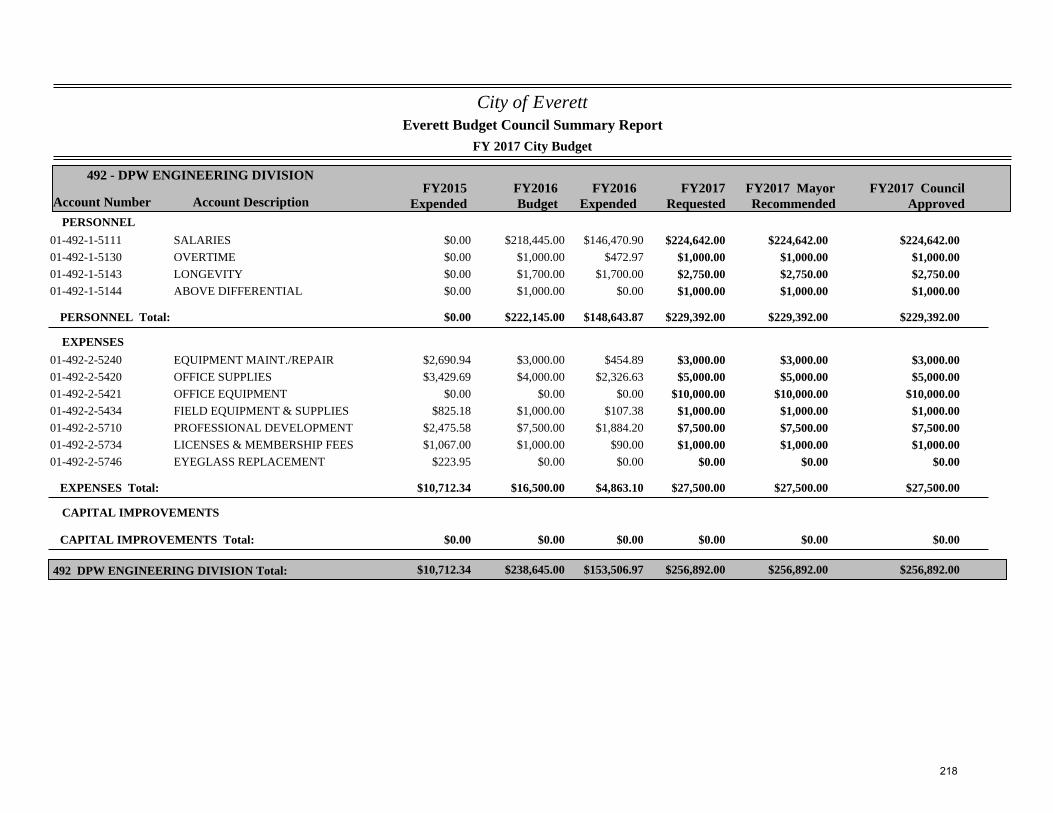
City of Everett
FY 2017 City Budget
Account Number Account DescriptionFY2015
ExpendedFY2016Budget
FY2017Requested
492 - DPW ENGINEERING DIVISION
Everett Budget Council Summary Report
FY2017 MayorRecommended
FY2016Expended
FY2017 CouncilApproved
PERSONNEL$0.00 $218,445.00 $224,642.0001-492-1-5111 SALARIES $146,470.90 $224,642.00 $224,642.00$0.00 $1,000.00 $1,000.0001-492-1-5130 OVERTIME $472.97 $1,000.00 $1,000.00$0.00 $1,700.00 $2,750.0001-492-1-5143 LONGEVITY $1,700.00 $2,750.00 $2,750.00$0.00 $1,000.00 $1,000.0001-492-1-5144 ABOVE DIFFERENTIAL $0.00 $1,000.00 $1,000.00
PERSONNEL Total: $0.00 $222,145.00 $229,392.00$148,643.87 $229,392.00 $229,392.00
EXPENSES$2,690.94 $3,000.00 $3,000.0001-492-2-5240 EQUIPMENT MAINT./REPAIR $454.89 $3,000.00 $3,000.00$3,429.69 $4,000.00 $5,000.0001-492-2-5420 OFFICE SUPPLIES $2,326.63 $5,000.00 $5,000.00
$0.00 $0.00 $10,000.0001-492-2-5421 OFFICE EQUIPMENT $0.00 $10,000.00 $10,000.00$825.18 $1,000.00 $1,000.0001-492-2-5434 FIELD EQUIPMENT & SUPPLIES $107.38 $1,000.00 $1,000.00
$2,475.58 $7,500.00 $7,500.0001-492-2-5710 PROFESSIONAL DEVELOPMENT $1,884.20 $7,500.00 $7,500.00$1,067.00 $1,000.00 $1,000.0001-492-2-5734 LICENSES & MEMBERSHIP FEES $90.00 $1,000.00 $1,000.00
$223.95 $0.00 $0.0001-492-2-5746 EYEGLASS REPLACEMENT $0.00 $0.00 $0.00
EXPENSES Total: $10,712.34 $16,500.00 $27,500.00$4,863.10 $27,500.00 $27,500.00
CAPITAL IMPROVEMENTS
CAPITAL IMPROVEMENTS Total: $0.00 $0.00 $0.00$0.00 $0.00 $0.00
$10,712.34 $238,645.00 $256,892.00492 DPW ENGINEERING DIVISION Total: $153,506.97 $256,892.00 $256,892.00
218
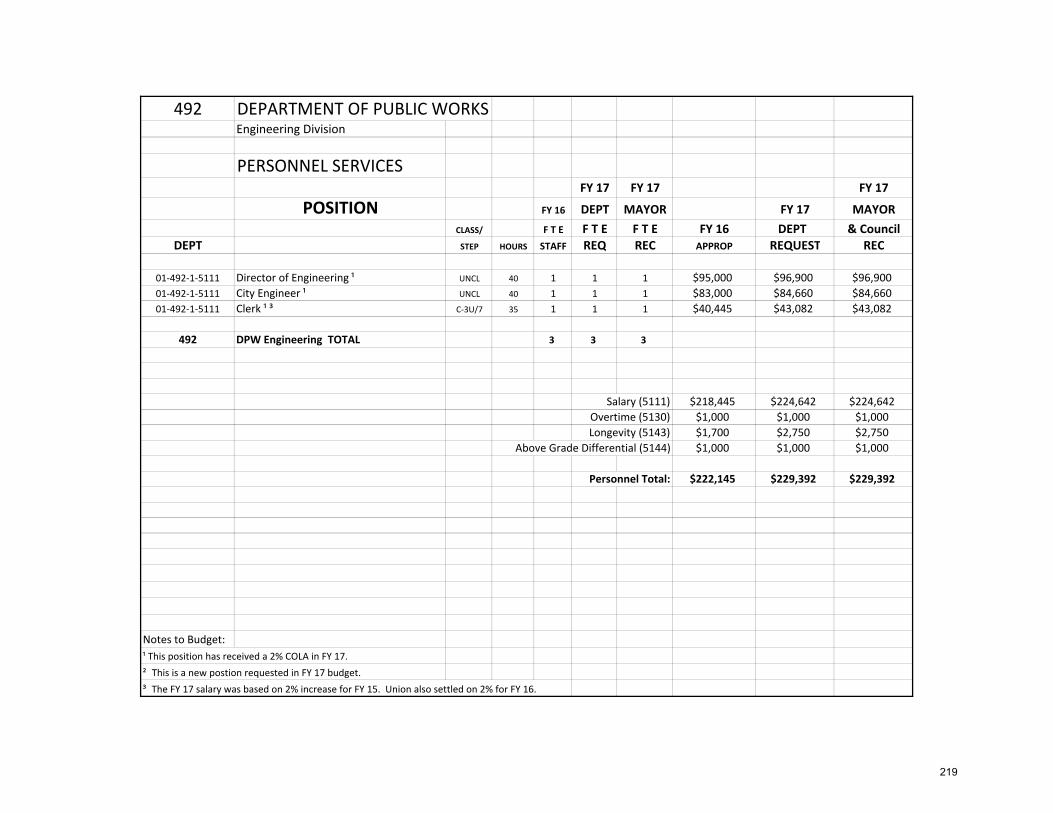
492 DEPARTMENT OF PUBLIC WORKSEngineering Division
PERSONNEL SERVICESFY 17 FY 17 FY 17
POSITION FY 16 DEPT MAYOR FY 17 MAYORCLASS/ F T E F T E F T E FY 16 DEPT & Council
DEPT STEP HOURS STAFF REQ REC APPROP REQUEST REC
01‐492‐1‐5111 Director of Engineering ¹ UNCL 40 1 1 1 $95,000 $96,900 $96,90001‐492‐1‐5111 City Engineer ¹ UNCL 40 1 1 1 $83,000 $84,660 $84,66001‐492‐1‐5111 Clerk ¹ ³ C‐3U/7 35 1 1 1 $40,445 $43,082 $43,082
492 DPW Engineering TOTAL 3 3 3
Salary (5111) $218,445 $224,642 $224,642Overtime (5130) $1,000 $1,000 $1,000Longevity (5143) $1,700 $2,750 $2,750
Above Grade Differential (5144) $1,000 $1,000 $1,000
Personnel Total: $222,145 $229,392 $229,392
Notes to Budget:¹ This position has received a 2% COLA in FY 17.² This is a new postion requested in FY 17 budget.³ The FY 17 salary was based on 2% increase for FY 15. Union also settled on 2% for FY 16.
219
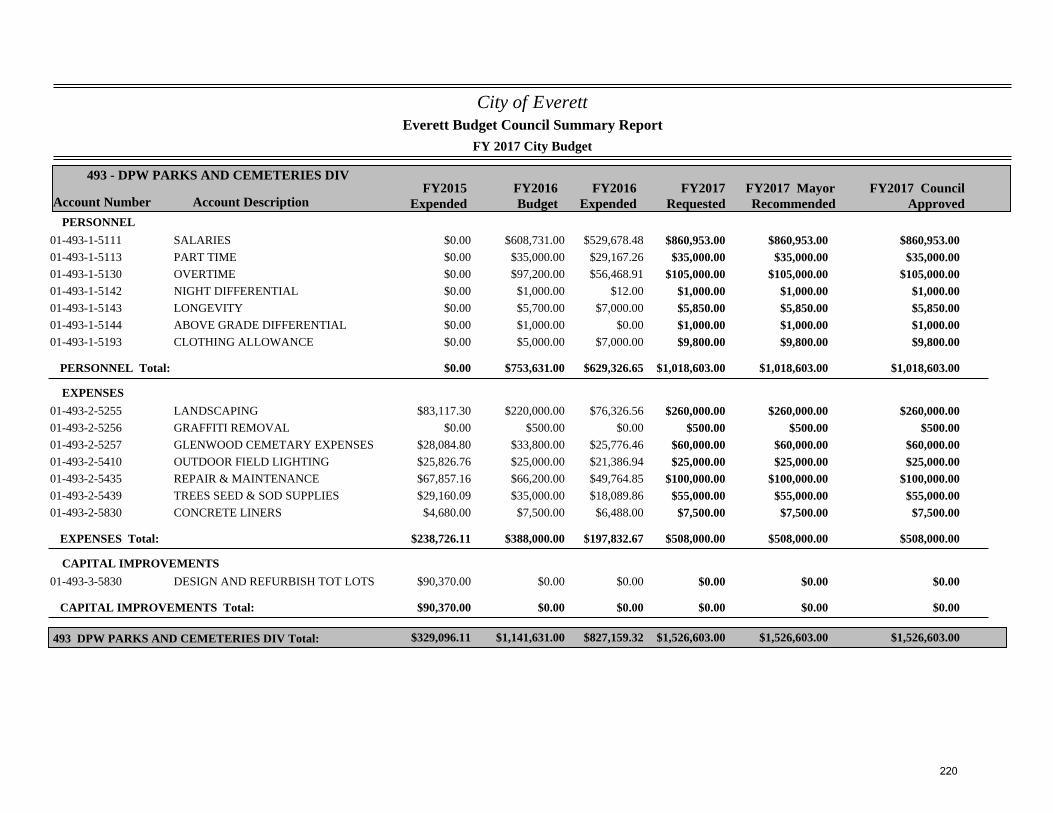
City of Everett
FY 2017 City Budget
Account Number Account DescriptionFY2015
ExpendedFY2016Budget
FY2017Requested
493 - DPW PARKS AND CEMETERIES DIV
Everett Budget Council Summary Report
FY2017 MayorRecommended
FY2016Expended
FY2017 CouncilApproved
PERSONNEL$0.00 $608,731.00 $860,953.0001-493-1-5111 SALARIES $529,678.48 $860,953.00 $860,953.00$0.00 $35,000.00 $35,000.0001-493-1-5113 PART TIME $29,167.26 $35,000.00 $35,000.00$0.00 $97,200.00 $105,000.0001-493-1-5130 OVERTIME $56,468.91 $105,000.00 $105,000.00$0.00 $1,000.00 $1,000.0001-493-1-5142 NIGHT DIFFERENTIAL $12.00 $1,000.00 $1,000.00$0.00 $5,700.00 $5,850.0001-493-1-5143 LONGEVITY $7,000.00 $5,850.00 $5,850.00$0.00 $1,000.00 $1,000.0001-493-1-5144 ABOVE GRADE DIFFERENTIAL $0.00 $1,000.00 $1,000.00$0.00 $5,000.00 $9,800.0001-493-1-5193 CLOTHING ALLOWANCE $7,000.00 $9,800.00 $9,800.00
PERSONNEL Total: $0.00 $753,631.00 $1,018,603.00$629,326.65 $1,018,603.00 $1,018,603.00
EXPENSES$83,117.30 $220,000.00 $260,000.0001-493-2-5255 LANDSCAPING $76,326.56 $260,000.00 $260,000.00
$0.00 $500.00 $500.0001-493-2-5256 GRAFFITI REMOVAL $0.00 $500.00 $500.00$28,084.80 $33,800.00 $60,000.0001-493-2-5257 GLENWOOD CEMETARY EXPENSES $25,776.46 $60,000.00 $60,000.00$25,826.76 $25,000.00 $25,000.0001-493-2-5410 OUTDOOR FIELD LIGHTING $21,386.94 $25,000.00 $25,000.00$67,857.16 $66,200.00 $100,000.0001-493-2-5435 REPAIR & MAINTENANCE $49,764.85 $100,000.00 $100,000.00$29,160.09 $35,000.00 $55,000.0001-493-2-5439 TREES SEED & SOD SUPPLIES $18,089.86 $55,000.00 $55,000.00$4,680.00 $7,500.00 $7,500.0001-493-2-5830 CONCRETE LINERS $6,488.00 $7,500.00 $7,500.00
EXPENSES Total: $238,726.11 $388,000.00 $508,000.00$197,832.67 $508,000.00 $508,000.00
CAPITAL IMPROVEMENTS$90,370.00 $0.00 $0.0001-493-3-5830 DESIGN AND REFURBISH TOT LOTS $0.00 $0.00 $0.00
CAPITAL IMPROVEMENTS Total: $90,370.00 $0.00 $0.00$0.00 $0.00 $0.00
$329,096.11 $1,141,631.00 $1,526,603.00493 DPW PARKS AND CEMETERIES DIV Total: $827,159.32 $1,526,603.00 $1,526,603.00
220
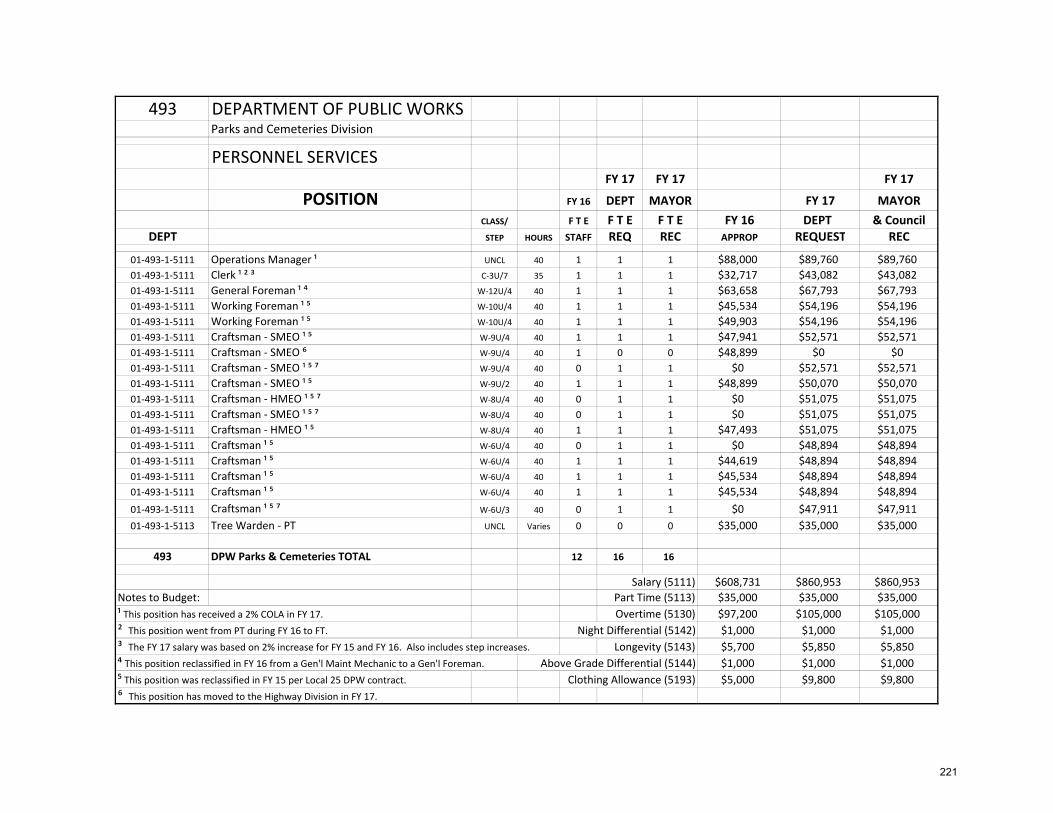
493 DEPARTMENT OF PUBLIC WORKSParks and Cemeteries Division
PERSONNEL SERVICESFY 17 FY 17 FY 17
POSITION FY 16 DEPT MAYOR FY 17 MAYORCLASS/ F T E F T E F T E FY 16 DEPT & Council
DEPT STEP HOURS STAFF REQ REC APPROP REQUEST REC
01‐493‐1‐5111 Operations Manager ¹ UNCL 40 1 1 1 $88,000 $89,760 $89,76001‐493‐1‐5111 Clerk ¹ ² ³ C‐3U/7 35 1 1 1 $32,717 $43,082 $43,08201‐493‐1‐5111 General Foreman ¹ ⁴ W‐12U/4 40 1 1 1 $63,658 $67,793 $67,79301‐493‐1‐5111 Working Foreman ¹ ⁵ W‐10U/4 40 1 1 1 $45,534 $54,196 $54,19601‐493‐1‐5111 Working Foreman ¹ ⁵ W‐10U/4 40 1 1 1 $49,903 $54,196 $54,19601‐493‐1‐5111 Craftsman ‐ SMEO ¹ ⁵ W‐9U/4 40 1 1 1 $47,941 $52,571 $52,57101‐493‐1‐5111 Craftsman ‐ SMEO ⁶ W‐9U/4 40 1 0 0 $48,899 $0 $001‐493‐1‐5111 Craftsman ‐ SMEO ¹ ⁵ ⁷ W‐9U/4 40 0 1 1 $0 $52,571 $52,57101‐493‐1‐5111 Craftsman ‐ SMEO ¹ ⁵ W‐9U/2 40 1 1 1 $48,899 $50,070 $50,07001‐493‐1‐5111 Craftsman ‐ HMEO ¹ ⁵ ⁷ W‐8U/4 40 0 1 1 $0 $51,075 $51,07501‐493‐1‐5111 Craftsman ‐ SMEO ¹ ⁵ ⁷ W‐8U/4 40 0 1 1 $0 $51,075 $51,07501‐493‐1‐5111 Craftsman ‐ HMEO ¹ ⁵ W‐8U/4 40 1 1 1 $47,493 $51,075 $51,07501‐493‐1‐5111 Craftsman ¹ ⁵ W‐6U/4 40 0 1 1 $0 $48,894 $48,89401‐493‐1‐5111 Craftsman ¹ ⁵ W‐6U/4 40 1 1 1 $44,619 $48,894 $48,89401‐493‐1‐5111 Craftsman ¹ ⁵ W‐6U/4 40 1 1 1 $45,534 $48,894 $48,89401‐493‐1‐5111 Craftsman ¹ ⁵ W‐6U/4 40 1 1 1 $45,534 $48,894 $48,89401‐493‐1‐5111 Craftsman ¹ ⁵ ⁷ W‐6U/3 40 0 1 1 $0 $47,911 $47,91101‐493‐1‐5113 Tree Warden ‐ PT UNCL Varies 0 0 0 $35,000 $35,000 $35,000
493 DPW Parks & Cemeteries TOTAL 12 16 16
Salary (5111) $608,731 $860,953 $860,953Notes to Budget: Part Time (5113) $35,000 $35,000 $35,000¹ This position has received a 2% COLA in FY 17. Overtime (5130) $97,200 $105,000 $105,000² This position went from PT during FY 16 to FT. Night Differential (5142) $1,000 $1,000 $1,000³ The FY 17 salary was based on 2% increase for FY 15 and FY 16. Also includes step increases. Longevity (5143) $5,700 $5,850 $5,850⁴ This position reclassified in FY 16 from a Gen'l Maint Mechanic to a Gen'l Foreman. Above Grade Differential (5144) $1,000 $1,000 $1,000⁵ This position was reclassified in FY 15 per Local 25 DPW contract. Clothing Allowance (5193) $5,000 $9,800 $9,800⁶ This position has moved to the Highway Division in FY 17.
221
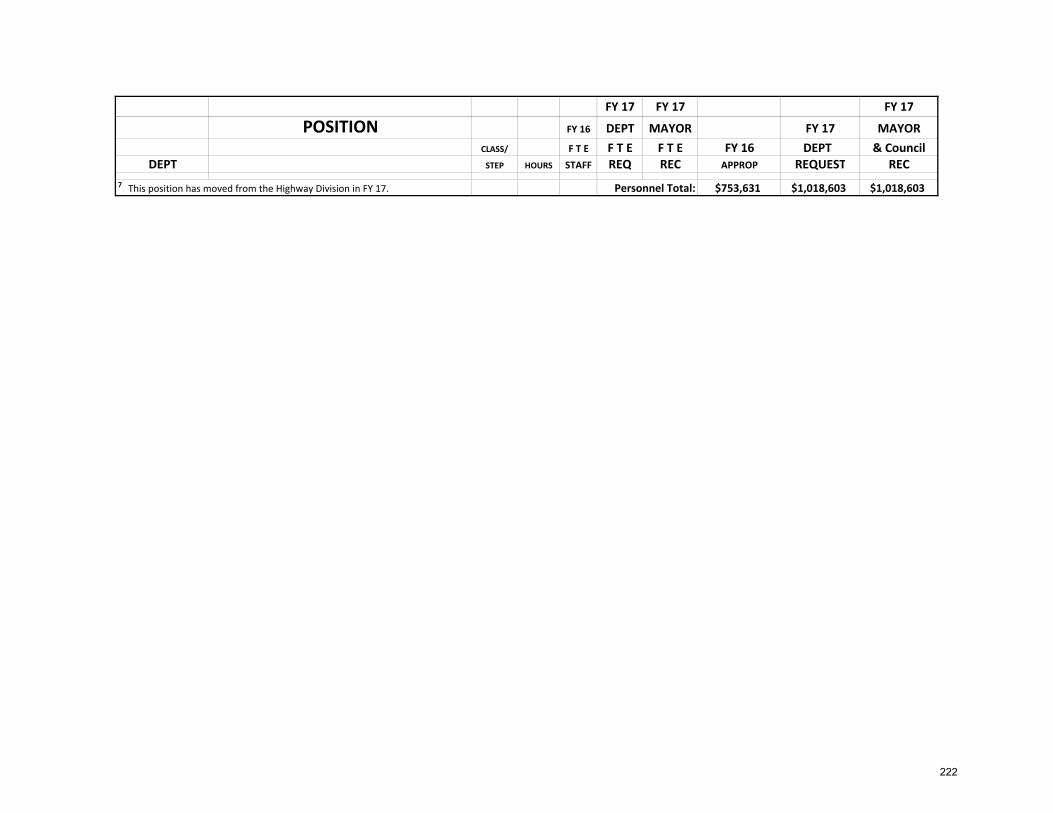
FY 17 FY 17 FY 17
POSITION FY 16 DEPT MAYOR FY 17 MAYORCLASS/ F T E F T E F T E FY 16 DEPT & Council
DEPT STEP HOURS STAFF REQ REC APPROP REQUEST REC
⁷ This position has moved from the Highway Division in FY 17. Personnel Total: $753,631 $1,018,603 $1,018,603
222
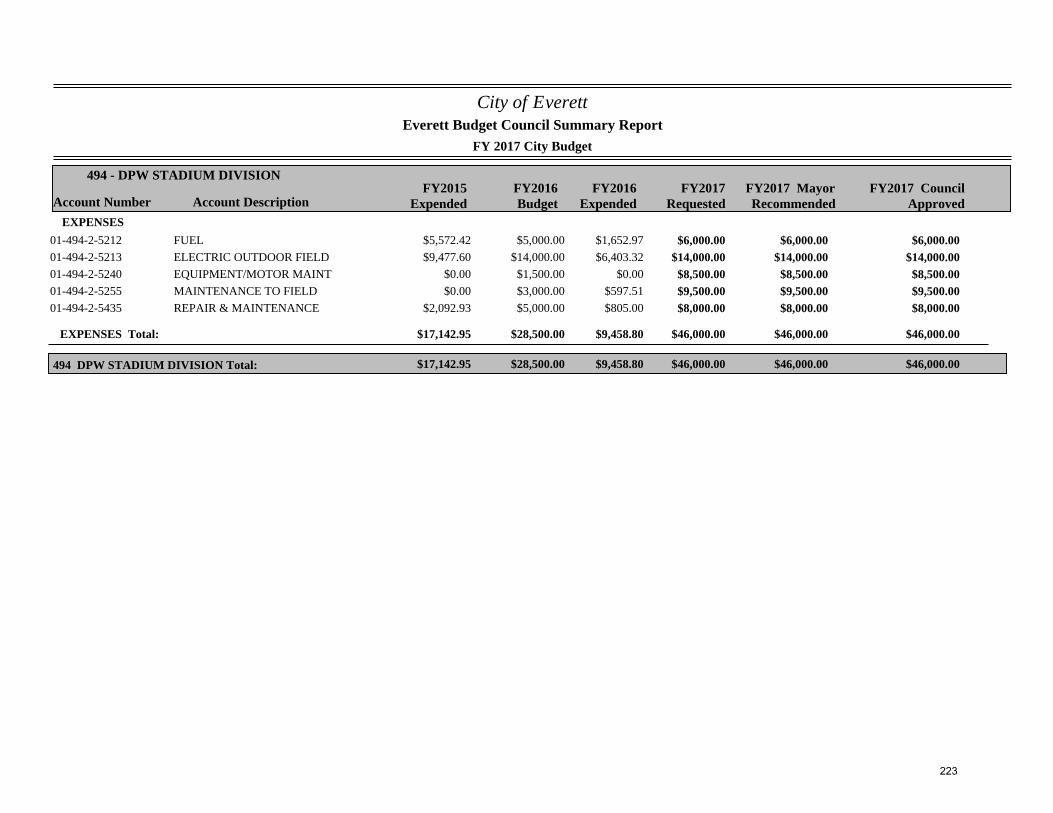
City of Everett
FY 2017 City Budget
Account Number Account DescriptionFY2015
ExpendedFY2016Budget
FY2017Requested
494 - DPW STADIUM DIVISION
Everett Budget Council Summary Report
FY2017 MayorRecommended
FY2016Expended
FY2017 CouncilApproved
EXPENSES$5,572.42 $5,000.00 $6,000.0001-494-2-5212 FUEL $1,652.97 $6,000.00 $6,000.00$9,477.60 $14,000.00 $14,000.0001-494-2-5213 ELECTRIC OUTDOOR FIELD $6,403.32 $14,000.00 $14,000.00
$0.00 $1,500.00 $8,500.0001-494-2-5240 EQUIPMENT/MOTOR MAINT $0.00 $8,500.00 $8,500.00$0.00 $3,000.00 $9,500.0001-494-2-5255 MAINTENANCE TO FIELD $597.51 $9,500.00 $9,500.00
$2,092.93 $5,000.00 $8,000.0001-494-2-5435 REPAIR & MAINTENANCE $805.00 $8,000.00 $8,000.00
EXPENSES Total: $17,142.95 $28,500.00 $46,000.00$9,458.80 $46,000.00 $46,000.00
$17,142.95 $28,500.00 $46,000.00494 DPW STADIUM DIVISION Total: $9,458.80 $46,000.00 $46,000.00
223
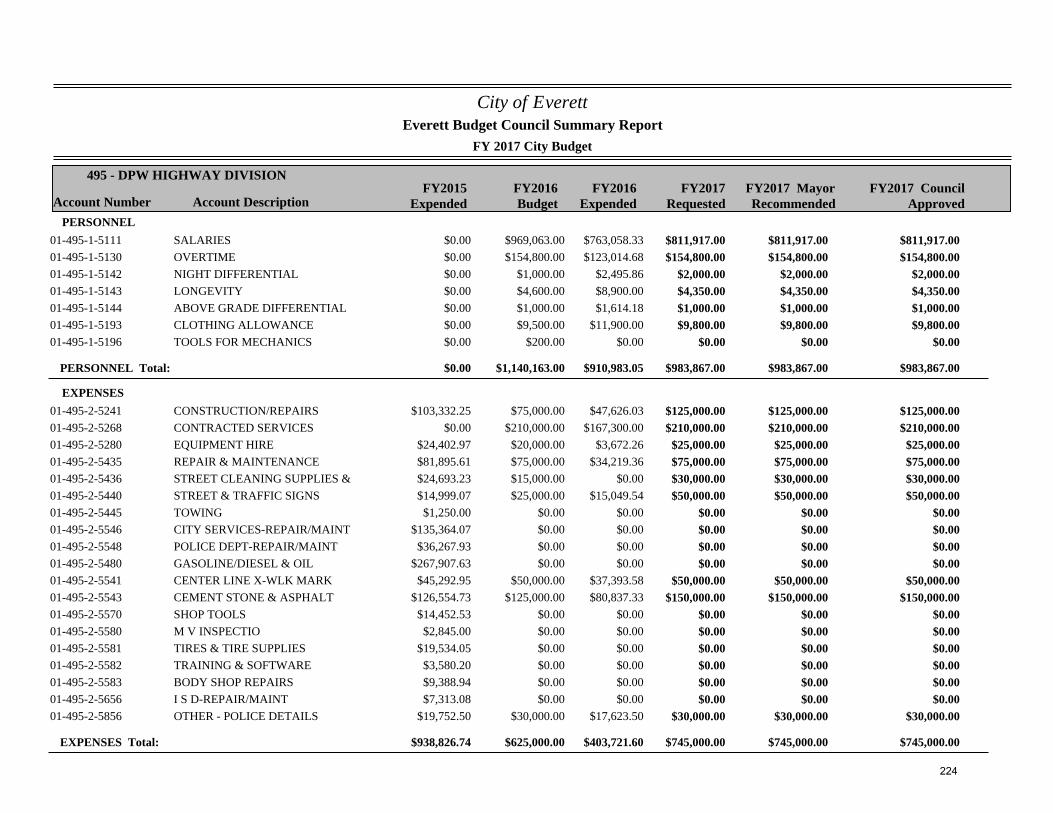
City of Everett
FY 2017 City Budget
Account Number Account DescriptionFY2015
ExpendedFY2016Budget
FY2017Requested
495 - DPW HIGHWAY DIVISION
Everett Budget Council Summary Report
FY2017 MayorRecommended
FY2016Expended
FY2017 CouncilApproved
PERSONNEL$0.00 $969,063.00 $811,917.0001-495-1-5111 SALARIES $763,058.33 $811,917.00 $811,917.00$0.00 $154,800.00 $154,800.0001-495-1-5130 OVERTIME $123,014.68 $154,800.00 $154,800.00$0.00 $1,000.00 $2,000.0001-495-1-5142 NIGHT DIFFERENTIAL $2,495.86 $2,000.00 $2,000.00$0.00 $4,600.00 $4,350.0001-495-1-5143 LONGEVITY $8,900.00 $4,350.00 $4,350.00$0.00 $1,000.00 $1,000.0001-495-1-5144 ABOVE GRADE DIFFERENTIAL $1,614.18 $1,000.00 $1,000.00$0.00 $9,500.00 $9,800.0001-495-1-5193 CLOTHING ALLOWANCE $11,900.00 $9,800.00 $9,800.00$0.00 $200.00 $0.0001-495-1-5196 TOOLS FOR MECHANICS $0.00 $0.00 $0.00
PERSONNEL Total: $0.00 $1,140,163.00 $983,867.00$910,983.05 $983,867.00 $983,867.00
EXPENSES$103,332.25 $75,000.00 $125,000.0001-495-2-5241 CONSTRUCTION/REPAIRS $47,626.03 $125,000.00 $125,000.00
$0.00 $210,000.00 $210,000.0001-495-2-5268 CONTRACTED SERVICES $167,300.00 $210,000.00 $210,000.00$24,402.97 $20,000.00 $25,000.0001-495-2-5280 EQUIPMENT HIRE $3,672.26 $25,000.00 $25,000.00$81,895.61 $75,000.00 $75,000.0001-495-2-5435 REPAIR & MAINTENANCE $34,219.36 $75,000.00 $75,000.00$24,693.23 $15,000.00 $30,000.0001-495-2-5436 STREET CLEANING SUPPLIES & $0.00 $30,000.00 $30,000.00$14,999.07 $25,000.00 $50,000.0001-495-2-5440 STREET & TRAFFIC SIGNS $15,049.54 $50,000.00 $50,000.00$1,250.00 $0.00 $0.0001-495-2-5445 TOWING $0.00 $0.00 $0.00
$135,364.07 $0.00 $0.0001-495-2-5546 CITY SERVICES-REPAIR/MAINT $0.00 $0.00 $0.00$36,267.93 $0.00 $0.0001-495-2-5548 POLICE DEPT-REPAIR/MAINT $0.00 $0.00 $0.00
$267,907.63 $0.00 $0.0001-495-2-5480 GASOLINE/DIESEL & OIL $0.00 $0.00 $0.00$45,292.95 $50,000.00 $50,000.0001-495-2-5541 CENTER LINE X-WLK MARK $37,393.58 $50,000.00 $50,000.00
$126,554.73 $125,000.00 $150,000.0001-495-2-5543 CEMENT STONE & ASPHALT $80,837.33 $150,000.00 $150,000.00$14,452.53 $0.00 $0.0001-495-2-5570 SHOP TOOLS $0.00 $0.00 $0.00$2,845.00 $0.00 $0.0001-495-2-5580 M V INSPECTIO $0.00 $0.00 $0.00
$19,534.05 $0.00 $0.0001-495-2-5581 TIRES & TIRE SUPPLIES $0.00 $0.00 $0.00$3,580.20 $0.00 $0.0001-495-2-5582 TRAINING & SOFTWARE $0.00 $0.00 $0.00$9,388.94 $0.00 $0.0001-495-2-5583 BODY SHOP REPAIRS $0.00 $0.00 $0.00$7,313.08 $0.00 $0.0001-495-2-5656 I S D-REPAIR/MAINT $0.00 $0.00 $0.00
$19,752.50 $30,000.00 $30,000.0001-495-2-5856 OTHER - POLICE DETAILS $17,623.50 $30,000.00 $30,000.00
EXPENSES Total: $938,826.74 $625,000.00 $745,000.00$403,721.60 $745,000.00 $745,000.00
224
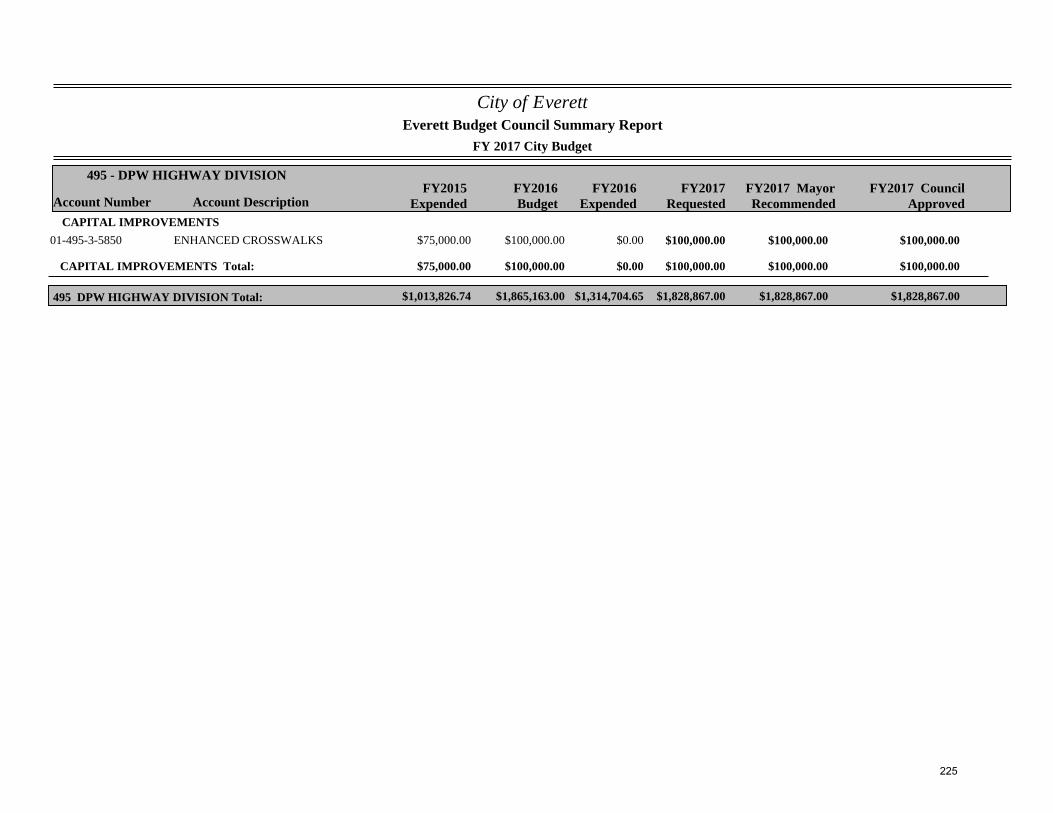
City of Everett
FY 2017 City Budget
Account Number Account DescriptionFY2015
ExpendedFY2016Budget
FY2017Requested
495 - DPW HIGHWAY DIVISION
Everett Budget Council Summary Report
FY2017 MayorRecommended
FY2016Expended
FY2017 CouncilApproved
CAPITAL IMPROVEMENTS$75,000.00 $100,000.00 $100,000.0001-495-3-5850 ENHANCED CROSSWALKS $0.00 $100,000.00 $100,000.00
CAPITAL IMPROVEMENTS Total: $75,000.00 $100,000.00 $100,000.00$0.00 $100,000.00 $100,000.00
$1,013,826.74 $1,865,163.00 $1,828,867.00495 DPW HIGHWAY DIVISION Total: $1,314,704.65 $1,828,867.00 $1,828,867.00
225
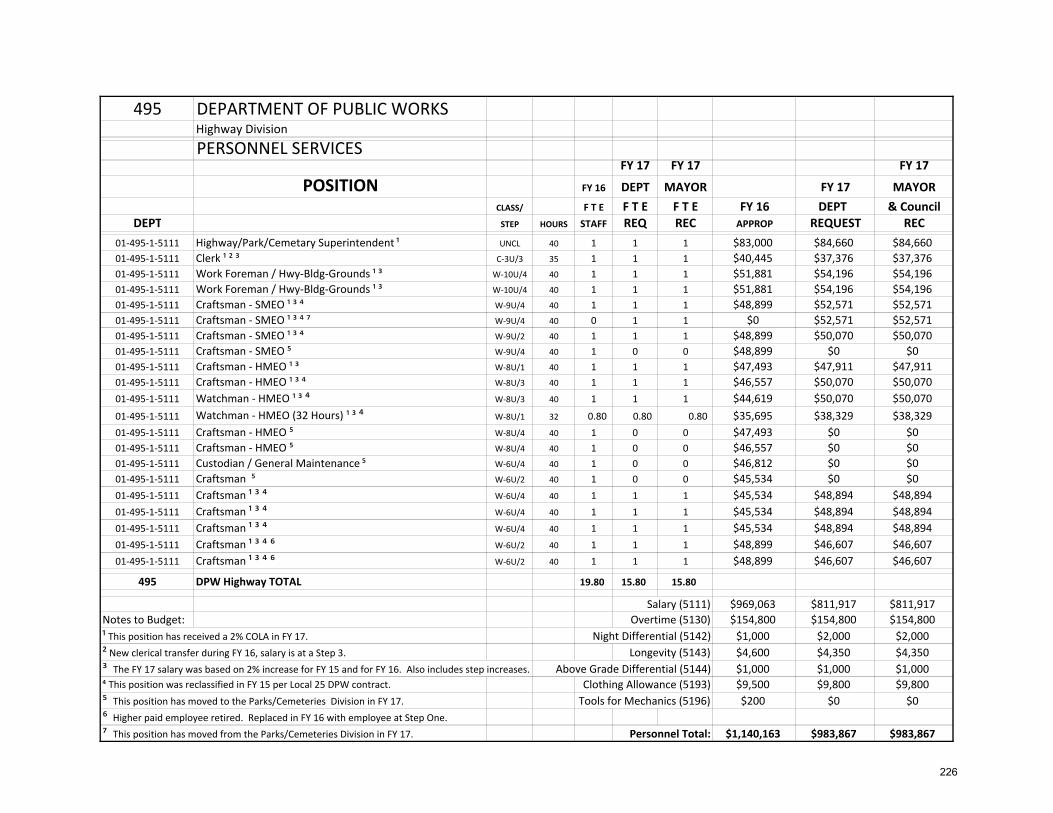
495 DEPARTMENT OF PUBLIC WORKSHighway Division
PERSONNEL SERVICESFY 17 FY 17 FY 17
POSITION FY 16 DEPT MAYOR FY 17 MAYORCLASS/ F T E F T E F T E FY 16 DEPT & Council
DEPT STEP HOURS STAFF REQ REC APPROP REQUEST REC01‐495‐1‐5111 Highway/Park/Cemetary Superintendent ¹ UNCL 40 1 1 1 $83,000 $84,660 $84,66001‐495‐1‐5111 Clerk ¹ ² ³ C‐3U/3 35 1 1 1 $40,445 $37,376 $37,37601‐495‐1‐5111 Work Foreman / Hwy‐Bldg‐Grounds ¹ ³ W‐10U/4 40 1 1 1 $51,881 $54,196 $54,19601‐495‐1‐5111 Work Foreman / Hwy‐Bldg‐Grounds ¹ ³ W‐10U/4 40 1 1 1 $51,881 $54,196 $54,19601‐495‐1‐5111 Craftsman ‐ SMEO ¹ ³ ⁴ W‐9U/4 40 1 1 1 $48,899 $52,571 $52,57101‐495‐1‐5111 Craftsman ‐ SMEO ¹ ³ ⁴ ⁷ W‐9U/4 40 0 1 1 $0 $52,571 $52,57101‐495‐1‐5111 Craftsman ‐ SMEO ¹ ³ ⁴ W‐9U/2 40 1 1 1 $48,899 $50,070 $50,07001‐495‐1‐5111 Craftsman ‐ SMEO ⁵ W‐9U/4 40 1 0 0 $48,899 $0 $001‐495‐1‐5111 Craftsman ‐ HMEO ¹ ³ W‐8U/1 40 1 1 1 $47,493 $47,911 $47,91101‐495‐1‐5111 Craftsman ‐ HMEO ¹ ³ ⁴ W‐8U/3 40 1 1 1 $46,557 $50,070 $50,07001‐495‐1‐5111 Watchman ‐ HMEO ¹ ³ ⁴ W‐8U/3 40 1 1 1 $44,619 $50,070 $50,07001‐495‐1‐5111 Watchman ‐ HMEO (32 Hours) ¹ ³ ⁴ W‐8U/1 32 0.80 0.80 0.80 $35,695 $38,329 $38,32901‐495‐1‐5111 Craftsman ‐ HMEO ⁵ W‐8U/4 40 1 0 0 $47,493 $0 $001‐495‐1‐5111 Craftsman ‐ HMEO ⁵ W‐8U/4 40 1 0 0 $46,557 $0 $001‐495‐1‐5111 Custodian / General Maintenance ⁵ W‐6U/4 40 1 0 0 $46,812 $0 $001‐495‐1‐5111 Craftsman ⁵ W‐6U/2 40 1 0 0 $45,534 $0 $001‐495‐1‐5111 Craftsman ¹ ³ ⁴ W‐6U/4 40 1 1 1 $45,534 $48,894 $48,89401‐495‐1‐5111 Craftsman ¹ ³ ⁴ W‐6U/4 40 1 1 1 $45,534 $48,894 $48,89401‐495‐1‐5111 Craftsman ¹ ³ ⁴ W‐6U/4 40 1 1 1 $45,534 $48,894 $48,89401‐495‐1‐5111 Craftsman ¹ ³ ⁴ ⁶ W‐6U/2 40 1 1 1 $48,899 $46,607 $46,60701‐495‐1‐5111 Craftsman ¹ ³ ⁴ ⁶ W‐6U/2 40 1 1 1 $48,899 $46,607 $46,607
495 DPW Highway TOTAL 19.80 15.80 15.80
Salary (5111) $969,063 $811,917 $811,917Notes to Budget: Overtime (5130) $154,800 $154,800 $154,800¹ This position has received a 2% COLA in FY 17. Night Differential (5142) $1,000 $2,000 $2,000² New clerical transfer during FY 16, salary is at a Step 3. Longevity (5143) $4,600 $4,350 $4,350³ The FY 17 salary was based on 2% increase for FY 15 and for FY 16. Also includes step increases. Above Grade Differential (5144) $1,000 $1,000 $1,000⁴ This position was reclassified in FY 15 per Local 25 DPW contract. Clothing Allowance (5193) $9,500 $9,800 $9,800⁵ This position has moved to the Parks/Cemeteries Division in FY 17. Tools for Mechanics (5196) $200 $0 $0⁶ Higher paid employee retired. Replaced in FY 16 with employee at Step One.⁷ This position has moved from the Parks/Cemeteries Division in FY 17. Personnel Total: $1,140,163 $983,867 $983,867
226
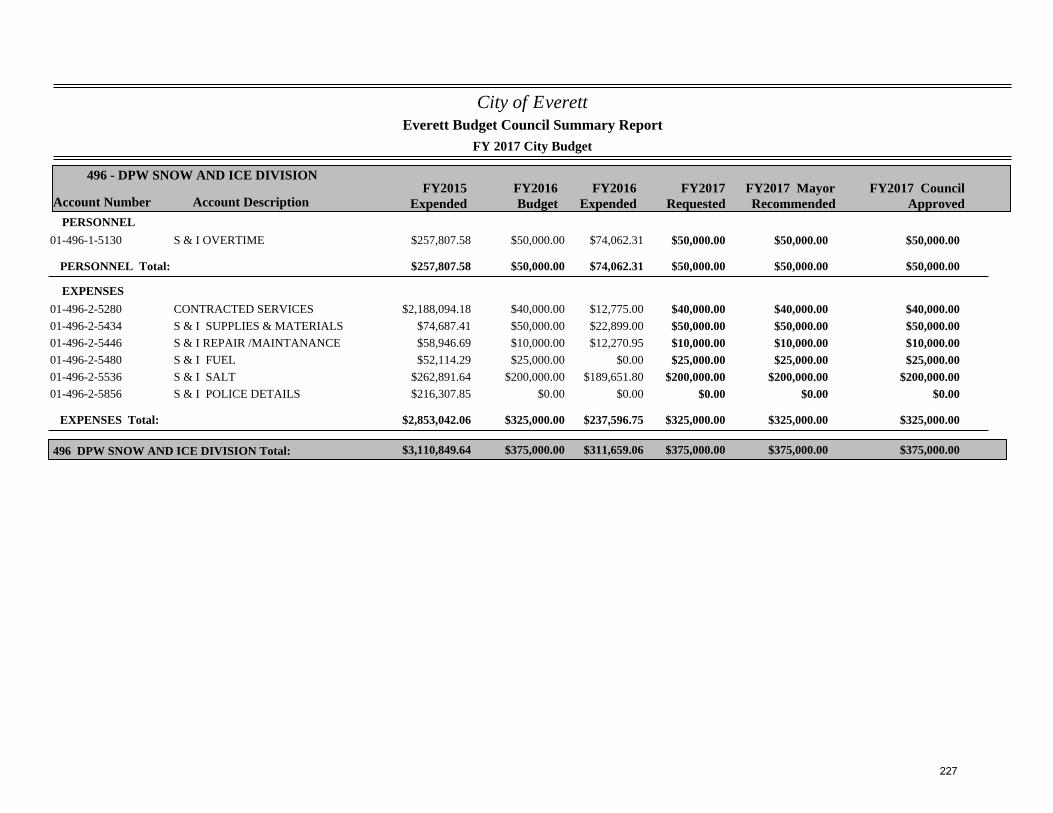
City of Everett
FY 2017 City Budget
Account Number Account DescriptionFY2015
ExpendedFY2016Budget
FY2017Requested
496 - DPW SNOW AND ICE DIVISION
Everett Budget Council Summary Report
FY2017 MayorRecommended
FY2016Expended
FY2017 CouncilApproved
PERSONNEL$257,807.58 $50,000.00 $50,000.0001-496-1-5130 S & I OVERTIME $74,062.31 $50,000.00 $50,000.00
PERSONNEL Total: $257,807.58 $50,000.00 $50,000.00$74,062.31 $50,000.00 $50,000.00
EXPENSES$2,188,094.18 $40,000.00 $40,000.0001-496-2-5280 CONTRACTED SERVICES $12,775.00 $40,000.00 $40,000.00
$74,687.41 $50,000.00 $50,000.0001-496-2-5434 S & I SUPPLIES & MATERIALS $22,899.00 $50,000.00 $50,000.00$58,946.69 $10,000.00 $10,000.0001-496-2-5446 S & I REPAIR /MAINTANANCE $12,270.95 $10,000.00 $10,000.00$52,114.29 $25,000.00 $25,000.0001-496-2-5480 S & I FUEL $0.00 $25,000.00 $25,000.00
$262,891.64 $200,000.00 $200,000.0001-496-2-5536 S & I SALT $189,651.80 $200,000.00 $200,000.00$216,307.85 $0.00 $0.0001-496-2-5856 S & I POLICE DETAILS $0.00 $0.00 $0.00
EXPENSES Total: $2,853,042.06 $325,000.00 $325,000.00$237,596.75 $325,000.00 $325,000.00
$3,110,849.64 $375,000.00 $375,000.00496 DPW SNOW AND ICE DIVISION Total: $311,659.06 $375,000.00 $375,000.00
227
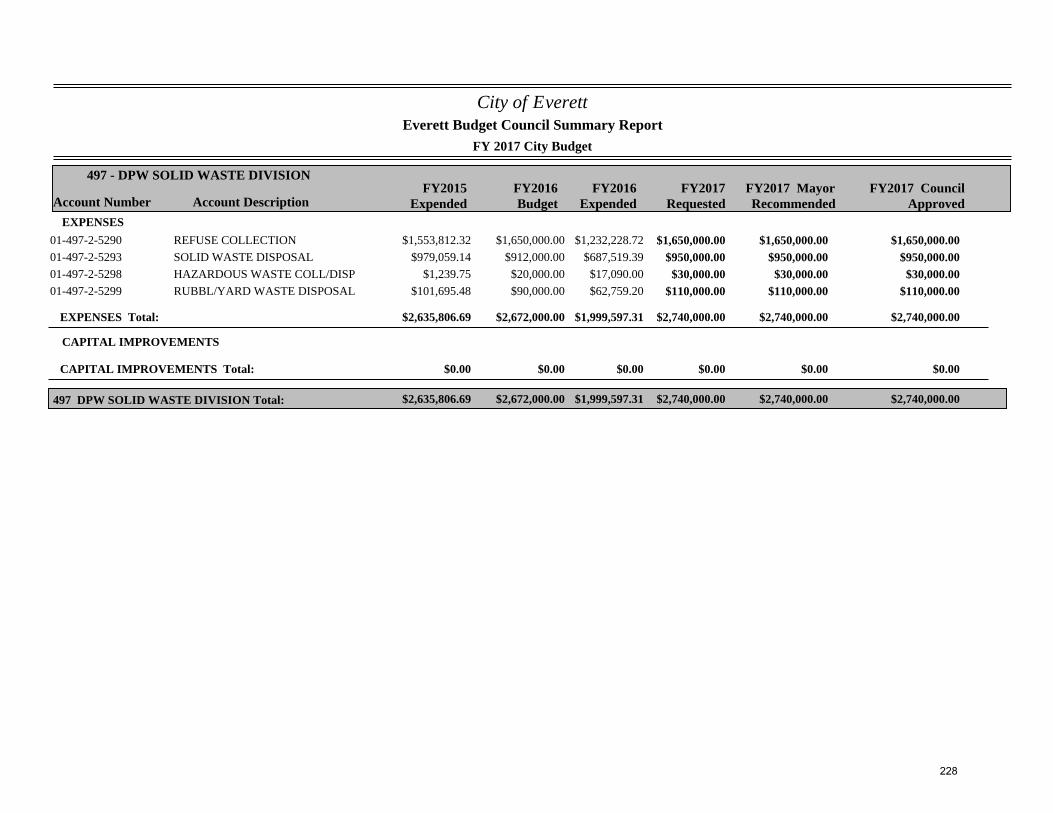
City of Everett
FY 2017 City Budget
Account Number Account DescriptionFY2015
ExpendedFY2016Budget
FY2017Requested
497 - DPW SOLID WASTE DIVISION
Everett Budget Council Summary Report
FY2017 MayorRecommended
FY2016Expended
FY2017 CouncilApproved
EXPENSES$1,553,812.32 $1,650,000.00 $1,650,000.0001-497-2-5290 REFUSE COLLECTION $1,232,228.72 $1,650,000.00 $1,650,000.00
$979,059.14 $912,000.00 $950,000.0001-497-2-5293 SOLID WASTE DISPOSAL $687,519.39 $950,000.00 $950,000.00$1,239.75 $20,000.00 $30,000.0001-497-2-5298 HAZARDOUS WASTE COLL/DISP $17,090.00 $30,000.00 $30,000.00
$101,695.48 $90,000.00 $110,000.0001-497-2-5299 RUBBL/YARD WASTE DISPOSAL $62,759.20 $110,000.00 $110,000.00
EXPENSES Total: $2,635,806.69 $2,672,000.00 $2,740,000.00$1,999,597.31 $2,740,000.00 $2,740,000.00
CAPITAL IMPROVEMENTS
CAPITAL IMPROVEMENTS Total: $0.00 $0.00 $0.00$0.00 $0.00 $0.00
$2,635,806.69 $2,672,000.00 $2,740,000.00497 DPW SOLID WASTE DIVISION Total: $1,999,597.31 $2,740,000.00 $2,740,000.00
228
Department of Health & Human Services
Mission Statement
To prevent disease and injury, promote wellness and protect the personal, community and environmental health of all Everett residents through regulatory enforcement, policy development and coalition building.
Significant Budget & Staffing Changes for FY 2017
8% increase due to: The Director of Health & Human Services position was hired at a salary less than what was budgeted in FY 16. The Director of Joint Committee position has not been funded in FY 17. The Wellness Coordinator positions were dropped from full‐time in FY 16 to 20 hours in FY 17. Both the Supervising Nurse (Acting Director of Health and Human Services until Acting Director is confirmed by City Council) and the Public Health Nurse received increases to bring their salaries in line with the surrounding communities. During FY 16, the nurses received step increases based on their current contract. We also budgeted for 2 new full‐time nurses to work in the schools. Also, during FY 16 the contract for Local 25 Clerical was settled for FY 15 and FY 16. This accounts for the large jump in salary for the Clerk. All salaries have been increased by 2% in the FY 17 budget. Medical Waste account increased due to change in disposal regulations. Mosquito Control account increased to cover larvicide applications.
FY 2016: Accomplishments
Increased the number of flu vaccines administered from 752 to 848. Established a Sharps disposal program for the schools. Placed three AED machines in City Hall and have trained City Hall personnel on usage.
229
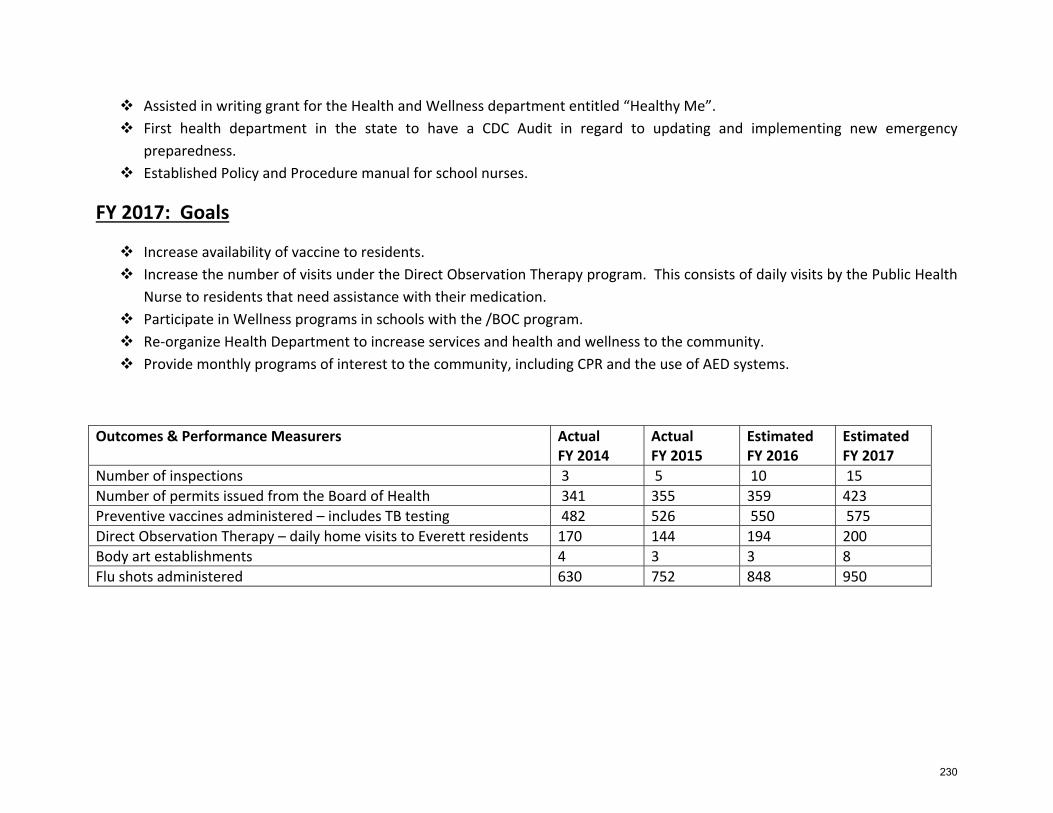
Assisted in writing grant for the Health and Wellness department entitled “Healthy Me”. First health department in the state to have a CDC Audit in regard to updating and implementing new emergency
preparedness. Established Policy and Procedure manual for school nurses.
FY 2017: Goals
Increase availability of vaccine to residents. Increase the number of visits under the Direct Observation Therapy program. This consists of daily visits by the Public Health
Nurse to residents that need assistance with their medication. Participate in Wellness programs in schools with the /BOC program. Re‐organize Health Department to increase services and health and wellness to the community. Provide monthly programs of interest to the community, including CPR and the use of AED systems.
Outcomes & Performance Measurers Actual FY 2014
Actual FY 2015
Estimated FY 2016
Estimated FY 2017
Number of inspections 3 5 10 15 Number of permits issued from the Board of Health 341 355 359 423 Preventive vaccines administered – includes TB testing 482 526 550 575 Direct Observation Therapy – daily home visits to Everett residents 170 144 194 200 Body art establishments 4 3 3 8 Flu shots administered 630 752 848 950
230
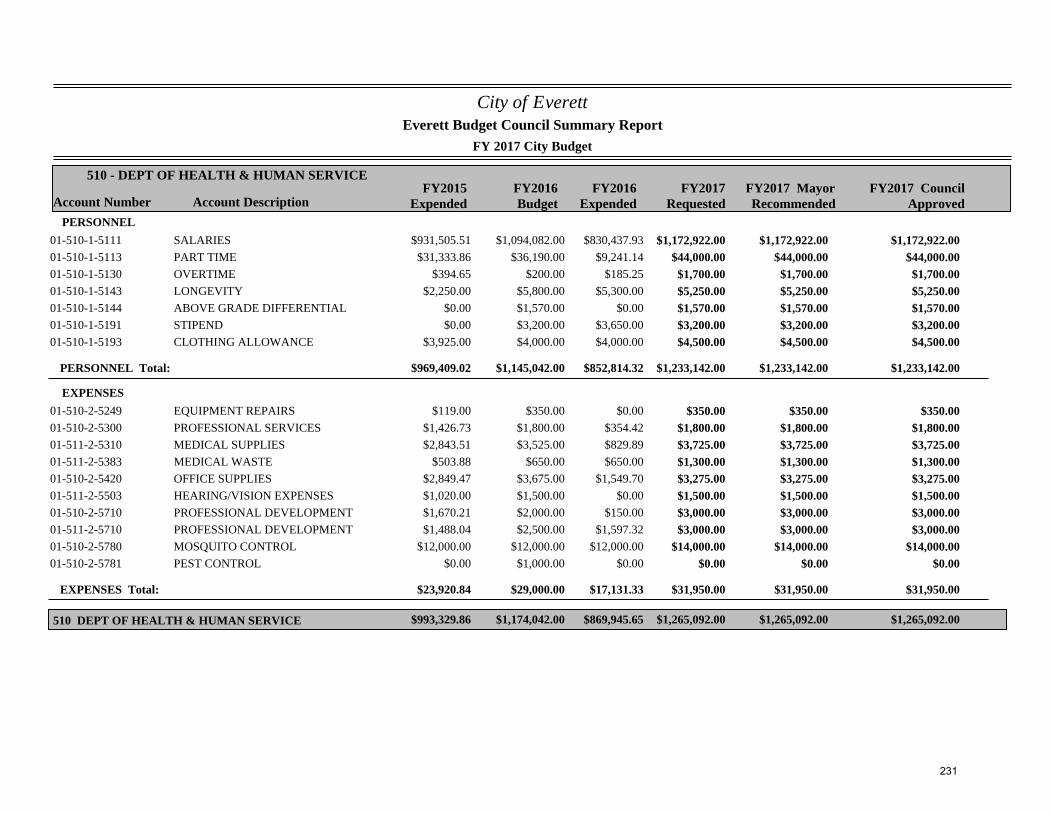
City of Everett
FY 2017 City Budget
Account Number Account DescriptionFY2015
ExpendedFY2016Budget
FY2017Requested
510 - DEPT OF HEALTH & HUMAN SERVICE
Everett Budget Council Summary Report
FY2017 MayorRecommended
FY2016Expended
FY2017 CouncilApproved
PERSONNEL$931,505.51 $1,094,082.00 $1,172,922.0001-510-1-5111 SALARIES $830,437.93 $1,172,922.00 $1,172,922.00
$31,333.86 $36,190.00 $44,000.0001-510-1-5113 PART TIME $9,241.14 $44,000.00 $44,000.00$394.65 $200.00 $1,700.0001-510-1-5130 OVERTIME $185.25 $1,700.00 $1,700.00
$2,250.00 $5,800.00 $5,250.0001-510-1-5143 LONGEVITY $5,300.00 $5,250.00 $5,250.00$0.00 $1,570.00 $1,570.0001-510-1-5144 ABOVE GRADE DIFFERENTIAL $0.00 $1,570.00 $1,570.00$0.00 $3,200.00 $3,200.0001-510-1-5191 STIPEND $3,650.00 $3,200.00 $3,200.00
$3,925.00 $4,000.00 $4,500.0001-510-1-5193 CLOTHING ALLOWANCE $4,000.00 $4,500.00 $4,500.00
PERSONNEL Total: $969,409.02 $1,145,042.00 $1,233,142.00$852,814.32 $1,233,142.00 $1,233,142.00
EXPENSES$119.00 $350.00 $350.0001-510-2-5249 EQUIPMENT REPAIRS $0.00 $350.00 $350.00
$1,426.73 $1,800.00 $1,800.0001-510-2-5300 PROFESSIONAL SERVICES $354.42 $1,800.00 $1,800.00$2,843.51 $3,525.00 $3,725.0001-511-2-5310 MEDICAL SUPPLIES $829.89 $3,725.00 $3,725.00
$503.88 $650.00 $1,300.0001-511-2-5383 MEDICAL WASTE $650.00 $1,300.00 $1,300.00$2,849.47 $3,675.00 $3,275.0001-510-2-5420 OFFICE SUPPLIES $1,549.70 $3,275.00 $3,275.00$1,020.00 $1,500.00 $1,500.0001-511-2-5503 HEARING/VISION EXPENSES $0.00 $1,500.00 $1,500.00$1,670.21 $2,000.00 $3,000.0001-510-2-5710 PROFESSIONAL DEVELOPMENT $150.00 $3,000.00 $3,000.00$1,488.04 $2,500.00 $3,000.0001-511-2-5710 PROFESSIONAL DEVELOPMENT $1,597.32 $3,000.00 $3,000.00
$12,000.00 $12,000.00 $14,000.0001-510-2-5780 MOSQUITO CONTROL $12,000.00 $14,000.00 $14,000.00$0.00 $1,000.00 $0.0001-510-2-5781 PEST CONTROL $0.00 $0.00 $0.00
EXPENSES Total: $23,920.84 $29,000.00 $31,950.00$17,131.33 $31,950.00 $31,950.00
$993,329.86 $1,174,042.00 $1,265,092.00510 DEPT OF HEALTH & HUMAN SERVICE $869,945.65 $1,265,092.00 $1,265,092.00
231
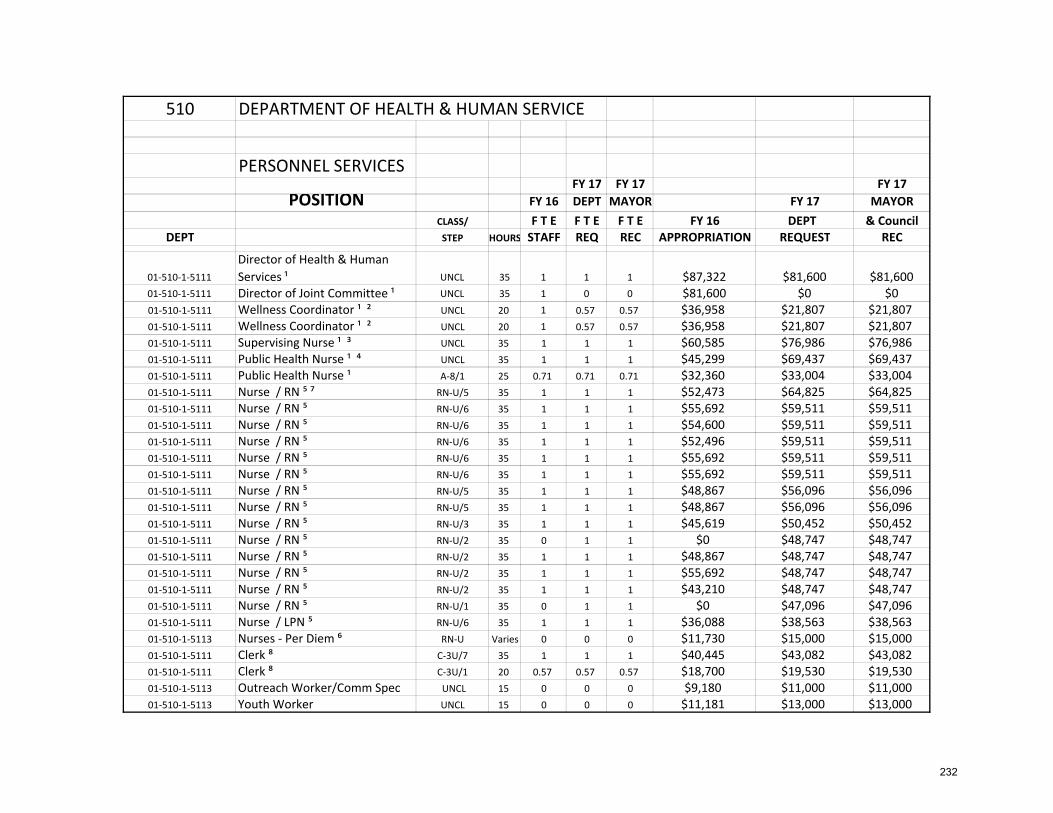
510 DEPARTMENT OF HEALTH & HUMAN SERVICE
PERSONNEL SERVICESFY 17 FY 17 FY 17
POSITION FY 16 DEPT MAYOR FY 17 MAYORCLASS/ F T E F T E F T E FY 16 DEPT & Council
DEPT STEP HOURS STAFF REQ REC APPROPRIATION REQUEST REC
01‐510‐1‐5111
Director of Health & Human Services ¹ UNCL 35 1 1 1 $87,322 $81,600 $81,600
01‐510‐1‐5111 Director of Joint Committee ¹ UNCL 35 1 0 0 $81,600 $0 $0 01‐510‐1‐5111 Wellness Coordinator ¹ ² UNCL 20 1 0.57 0.57 $36,958 $21,807 $21,80701‐510‐1‐5111 Wellness Coordinator ¹ ² UNCL 20 1 0.57 0.57 $36,958 $21,807 $21,80701‐510‐1‐5111 Supervising Nurse ¹ ³ UNCL 35 1 1 1 $60,585 $76,986 $76,98601‐510‐1‐5111 Public Health Nurse ¹ ⁴ UNCL 35 1 1 1 $45,299 $69,437 $69,43701‐510‐1‐5111 Public Health Nurse ¹ A‐8/1 25 0.71 0.71 0.71 $32,360 $33,004 $33,00401‐510‐1‐5111 Nurse / RN ⁵ ⁷ RN‐U/5 35 1 1 1 $52,473 $64,825 $64,82501‐510‐1‐5111 Nurse / RN ⁵ RN‐U/6 35 1 1 1 $55,692 $59,511 $59,51101‐510‐1‐5111 Nurse / RN ⁵ RN‐U/6 35 1 1 1 $54,600 $59,511 $59,51101‐510‐1‐5111 Nurse / RN ⁵ RN‐U/6 35 1 1 1 $52,496 $59,511 $59,51101‐510‐1‐5111 Nurse / RN ⁵ RN‐U/6 35 1 1 1 $55,692 $59,511 $59,51101‐510‐1‐5111 Nurse / RN ⁵ RN‐U/6 35 1 1 1 $55,692 $59,511 $59,51101‐510‐1‐5111 Nurse / RN ⁵ RN‐U/5 35 1 1 1 $48,867 $56,096 $56,09601‐510‐1‐5111 Nurse / RN ⁵ RN‐U/5 35 1 1 1 $48,867 $56,096 $56,09601‐510‐1‐5111 Nurse / RN ⁵ RN‐U/3 35 1 1 1 $45,619 $50,452 $50,45201‐510‐1‐5111 Nurse / RN ⁵ RN‐U/2 35 0 1 1 $0 $48,747 $48,74701‐510‐1‐5111 Nurse / RN ⁵ RN‐U/2 35 1 1 1 $48,867 $48,747 $48,74701‐510‐1‐5111 Nurse / RN ⁵ RN‐U/2 35 1 1 1 $55,692 $48,747 $48,74701‐510‐1‐5111 Nurse / RN ⁵ RN‐U/2 35 1 1 1 $43,210 $48,747 $48,74701‐510‐1‐5111 Nurse / RN ⁵ RN‐U/1 35 0 1 1 $0 $47,096 $47,09601‐510‐1‐5111 Nurse / LPN ⁵ RN‐U/6 35 1 1 1 $36,088 $38,563 $38,56301‐510‐1‐5113 Nurses ‐ Per Diem ⁶ RN‐U Varies 0 0 0 $11,730 $15,000 $15,00001‐510‐1‐5111 Clerk ⁸ C‐3U/7 35 1 1 1 $40,445 $43,082 $43,08201‐510‐1‐5111 Clerk ⁸ C‐3U/1 20 0.57 0.57 0.57 $18,700 $19,530 $19,53001‐510‐1‐5113 Outreach Worker/Comm Spec UNCL 15 0 0 0 $9,180 $11,000 $11,00001‐510‐1‐5113 Youth Worker UNCL 15 0 0 0 $11,181 $13,000 $13,000
232
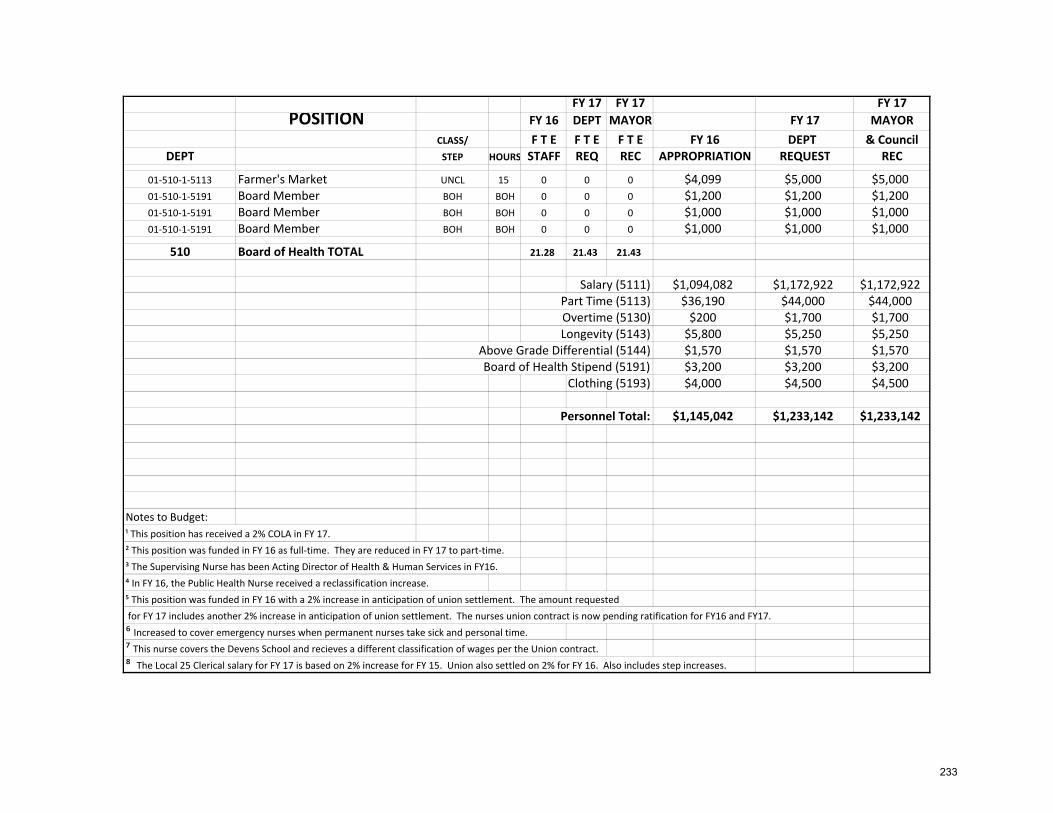
FY 17 FY 17 FY 17POSITION FY 16 DEPT MAYOR FY 17 MAYOR
CLASS/ F T E F T E F T E FY 16 DEPT & CouncilDEPT STEP HOURS STAFF REQ REC APPROPRIATION REQUEST REC
01‐510‐1‐5113 Farmer's Market UNCL 15 0 0 0 $4,099 $5,000 $5,00001‐510‐1‐5191 Board Member BOH BOH 0 0 0 $1,200 $1,200 $1,20001‐510‐1‐5191 Board Member BOH BOH 0 0 0 $1,000 $1,000 $1,00001‐510‐1‐5191 Board Member BOH BOH 0 0 0 $1,000 $1,000 $1,000
510 Board of Health TOTAL 21.28 21.43 21.43
Salary (5111) $1,094,082 $1,172,922 $1,172,922Part Time (5113) $36,190 $44,000 $44,000
Overtime (5130) $200 $1,700 $1,700 Longevity (5143) $5,800 $5,250 $5,250 Above Grade Differential (5144) $1,570 $1,570 $1,570
Board of Health Stipend (5191) $3,200 $3,200 $3,200Clothing (5193) $4,000 $4,500 $4,500
Personnel Total: $1,145,042 $1,233,142 $1,233,142
Notes to Budget:¹ This position has received a 2% COLA in FY 17.² This position was funded in FY 16 as full‐time. They are reduced in FY 17 to part‐time.³ The Supervising Nurse has been Acting Director of Health & Human Services in FY16.⁴ In FY 16, the Public Health Nurse received a reclassification increase.⁵ This position was funded in FY 16 with a 2% increase in anticipation of union settlement. The amount requested for FY 17 includes another 2% increase in anticipation of union settlement. The nurses union contract is now pending ratification for FY16 and FY17. ⁶ Increased to cover emergency nurses when permanent nurses take sick and personal time.⁷ This nurse covers the Devens School and recieves a different classification of wages per the Union contract.⁸ The Local 25 Clerical salary for FY 17 is based on 2% increase for FY 15. Union also settled on 2% for FY 16. Also includes step increases.
233
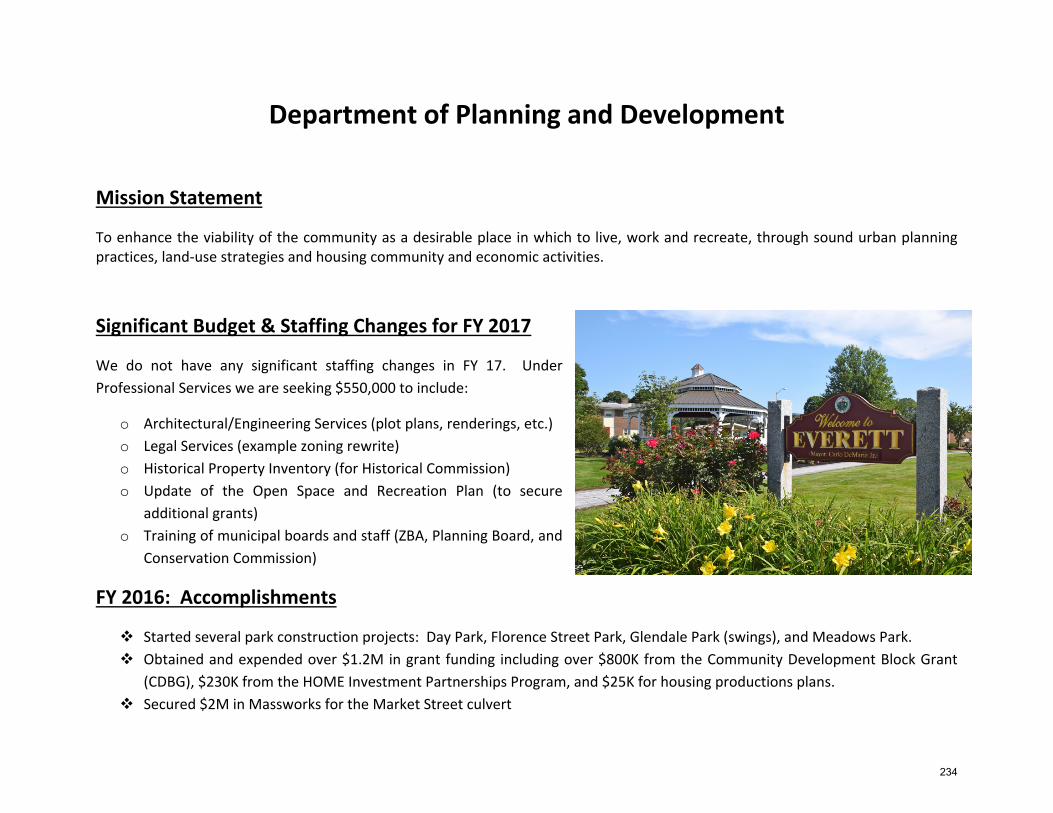
Department of Planning and Development
Mission Statement
To enhance the viability of the community as a desirable place in which to live, work and recreate, through sound urban planning practices, land‐use strategies and housing community and economic activities.
Significant Budget & Staffing Changes for FY 2017
We do not have any significant staffing changes in FY 17. Under Professional Services we are seeking $550,000 to include:
o Architectural/Engineering Services (plot plans, renderings, etc.) o Legal Services (example zoning rewrite) o Historical Property Inventory (for Historical Commission) o Update of the Open Space and Recreation Plan (to secure
additional grants) o Training of municipal boards and staff (ZBA, Planning Board, and
Conservation Commission)
FY 2016: Accomplishments
Started several park construction projects: Day Park, Florence Street Park, Glendale Park (swings), and Meadows Park. Obtained and expended over $1.2M in grant funding including over $800K from the Community Development Block Grant
(CDBG), $230K from the HOME Investment Partnerships Program, and $25K for housing productions plans. Secured $2M in Massworks for the Market Street culvert
234
Secured $150K for Bike Path Design Services
FY 2017: Goals & Objectives
Complete projects identified in the CIP (Capital Improvement Plan) including park construction projects, Streetlight Conversion Project, and Traffic Light Signalization Project.
Obtain over $1.5M in grant funding from state and federal sources. Continue to implement the Everett
Housing Production Plan, Commercial Triangle Master Plan, Everett Square Visioning Plan and Green Communities program.
Outcomes & Performance Measurers Actual FY 2014
Actual FY 2015
Estimated FY 2016
Estimated FY 2017
First Time Home Buyers Assisted N/A 15 25 25 Housing Rehabilitation Assistance (CDBG funded) 5 units 20 22 5 units Financial/Technical Assistance (small businesses) 8 10 12 5 ‐ 8 CDBG Projects/Programs Completed 1 3 3 1
235
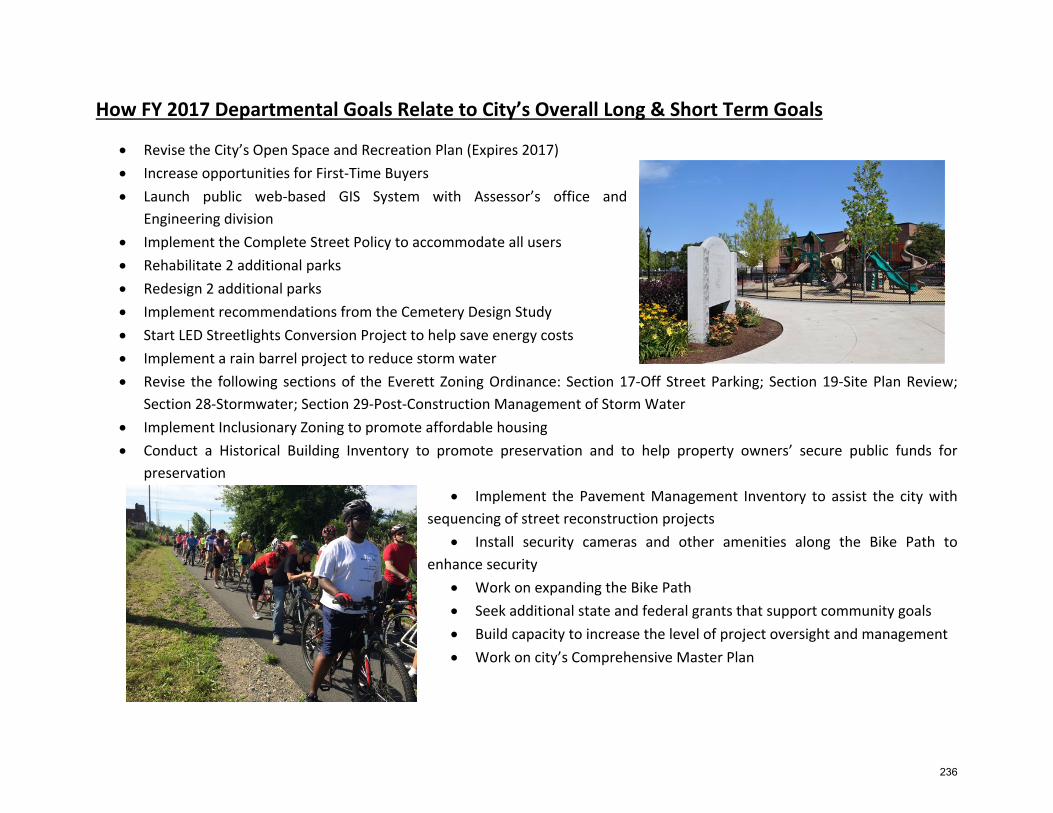
How FY 2017 Departmental Goals Relate to City’s Overall Long & Short Term Goals
Revise the City’s Open Space and Recreation Plan (Expires 2017) Increase opportunities for First‐Time Buyers Launch public web‐based GIS System with Assessor’s office and
Engineering division Implement the Complete Street Policy to accommodate all users Rehabilitate 2 additional parks Redesign 2 additional parks Implement recommendations from the Cemetery Design Study Start LED Streetlights Conversion Project to help save energy costs Implement a rain barrel project to reduce storm water Revise the following sections of the Everett Zoning Ordinance: Section 17‐Off Street Parking; Section 19‐Site Plan Review;
Section 28‐Stormwater; Section 29‐Post‐Construction Management of Storm Water Implement Inclusionary Zoning to promote affordable housing Conduct a Historical Building Inventory to promote preservation and to help property owners’ secure public funds for
preservation Implement the Pavement Management Inventory to assist the city with
sequencing of street reconstruction projects Install security cameras and other amenities along the Bike Path to
enhance security Work on expanding the Bike Path Seek additional state and federal grants that support community goals Build capacity to increase the level of project oversight and management Work on city’s Comprehensive Master Plan
236
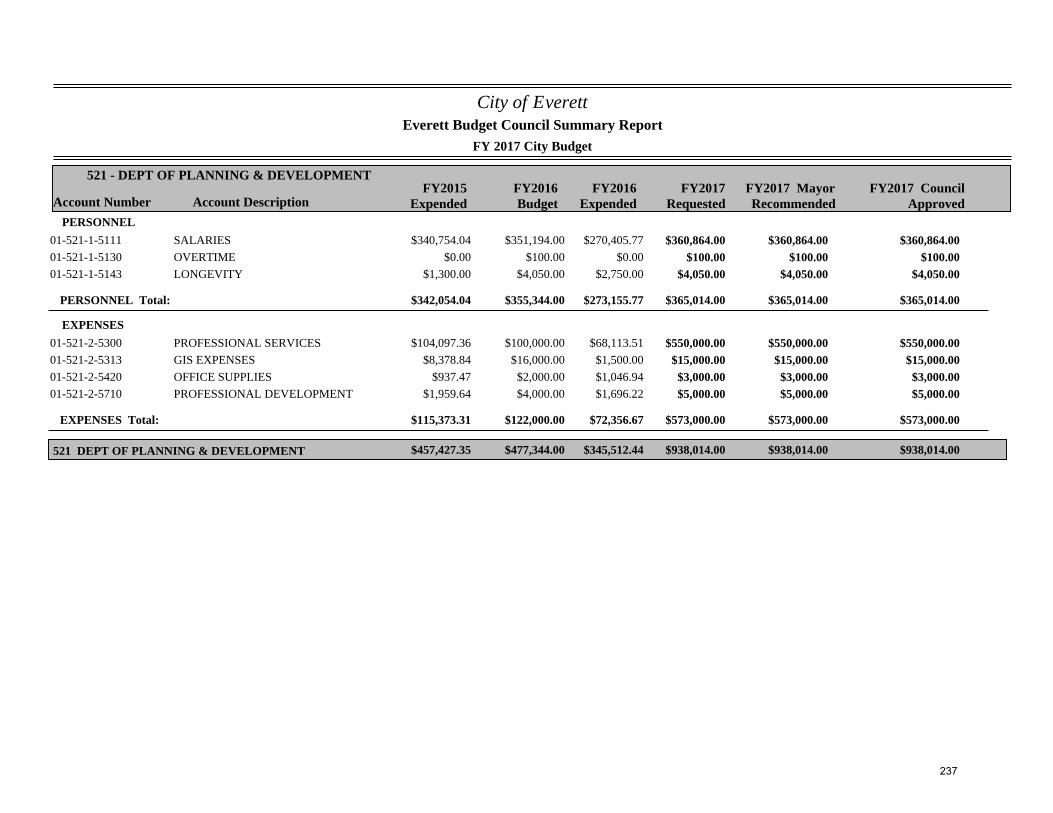
City of Everett
FY 2017 City Budget
Account Number Account DescriptionFY2015
ExpendedFY2016Budget
FY2017Requested
521 - DEPT OF PLANNING & DEVELOPMENT
Everett Budget Council Summary Report
FY2017 MayorRecommended
FY2016Expended
FY2017 CouncilApproved
PERSONNEL$340,754.04 $351,194.00 $360,864.0001-521-1-5111 SALARIES $270,405.77 $360,864.00 $360,864.00
$0.00 $100.00 $100.0001-521-1-5130 OVERTIME $0.00 $100.00 $100.00$1,300.00 $4,050.00 $4,050.0001-521-1-5143 LONGEVITY $2,750.00 $4,050.00 $4,050.00
PERSONNEL Total: $342,054.04 $355,344.00 $365,014.00$273,155.77 $365,014.00 $365,014.00
EXPENSES$104,097.36 $100,000.00 $550,000.0001-521-2-5300 PROFESSIONAL SERVICES $68,113.51 $550,000.00 $550,000.00
$8,378.84 $16,000.00 $15,000.0001-521-2-5313 GIS EXPENSES $1,500.00 $15,000.00 $15,000.00$937.47 $2,000.00 $3,000.0001-521-2-5420 OFFICE SUPPLIES $1,046.94 $3,000.00 $3,000.00
$1,959.64 $4,000.00 $5,000.0001-521-2-5710 PROFESSIONAL DEVELOPMENT $1,696.22 $5,000.00 $5,000.00
EXPENSES Total: $115,373.31 $122,000.00 $573,000.00$72,356.67 $573,000.00 $573,000.00
$457,427.35 $477,344.00 $938,014.00521 DEPT OF PLANNING & DEVELOPMENT $345,512.44 $938,014.00 $938,014.00
237
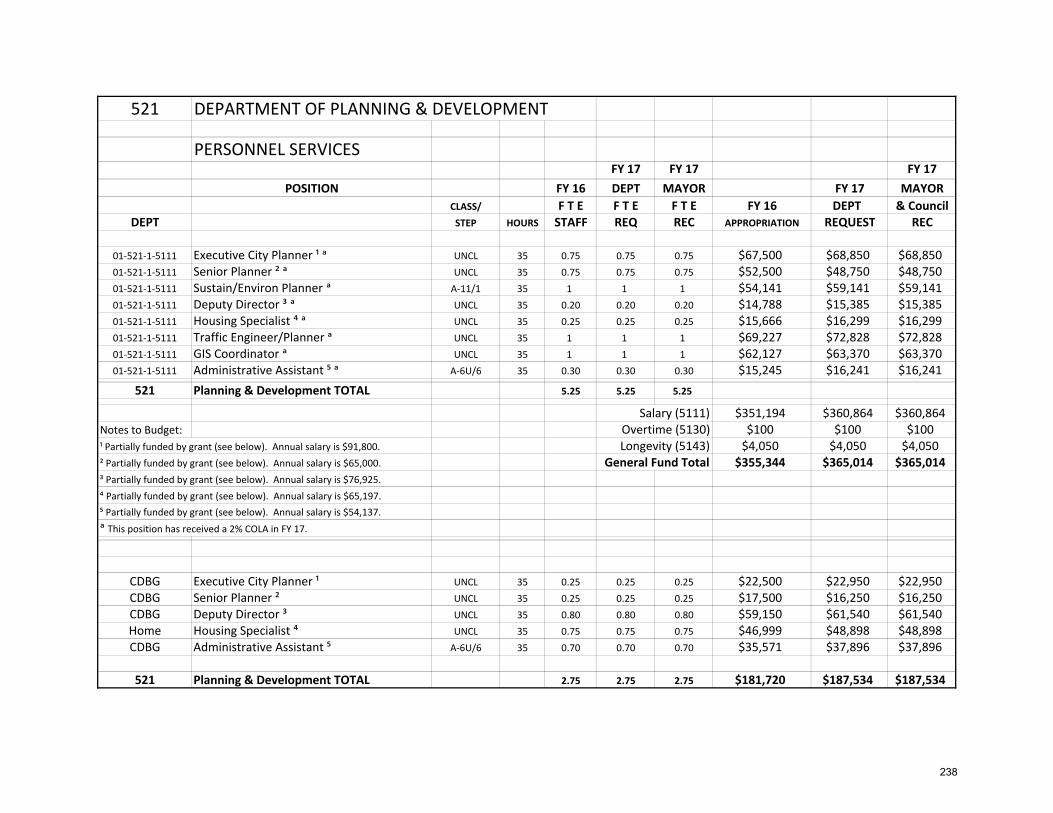
521 DEPARTMENT OF PLANNING & DEVELOPMENT
PERSONNEL SERVICESFY 17 FY 17 FY 17
POSITION FY 16 DEPT MAYOR FY 17 MAYORCLASS/ F T E F T E F T E FY 16 DEPT & Council
DEPT STEP HOURS STAFF REQ REC APPROPRIATION REQUEST REC
01‐521‐1‐5111 Executive City Planner ¹ ᵃ UNCL 35 0.75 0.75 0.75 $67,500 $68,850 $68,85001‐521‐1‐5111 Senior Planner ² ᵃ UNCL 35 0.75 0.75 0.75 $52,500 $48,750 $48,75001‐521‐1‐5111 Sustain/Environ Planner ᵃ A‐11/1 35 1 1 1 $54,141 $59,141 $59,14101‐521‐1‐5111 Deputy Director ³ ᵃ UNCL 35 0.20 0.20 0.20 $14,788 $15,385 $15,38501‐521‐1‐5111 Housing Specialist ⁴ ᵃ UNCL 35 0.25 0.25 0.25 $15,666 $16,299 $16,29901‐521‐1‐5111 Traffic Engineer/Planner ᵃ UNCL 35 1 1 1 $69,227 $72,828 $72,82801‐521‐1‐5111 GIS Coordinator ᵃ UNCL 35 1 1 1 $62,127 $63,370 $63,37001‐521‐1‐5111 Administrative Assistant ⁵ ᵃ A‐6U/6 35 0.30 0.30 0.30 $15,245 $16,241 $16,241
521 Planning & Development TOTAL 5.25 5.25 5.25
Salary (5111) $351,194 $360,864 $360,864Notes to Budget: Overtime (5130) $100 $100 $100¹ Partially funded by grant (see below). Annual salary is $91,800. Longevity (5143) $4,050 $4,050 $4,050² Partially funded by grant (see below). Annual salary is $65,000. General Fund Total $355,344 $365,014 $365,014³ Partially funded by grant (see below). Annual salary is $76,925.⁴ Partially funded by grant (see below). Annual salary is $65,197. ⁵ Partially funded by grant (see below). Annual salary is $54,137.
ᵃ This position has received a 2% COLA in FY 17.
CDBG Executive City Planner ¹ UNCL 35 0.25 0.25 0.25 $22,500 $22,950 $22,950CDBG Senior Planner ² UNCL 35 0.25 0.25 0.25 $17,500 $16,250 $16,250CDBG Deputy Director ³ UNCL 35 0.80 0.80 0.80 $59,150 $61,540 $61,540Home Housing Specialist ⁴ UNCL 35 0.75 0.75 0.75 $46,999 $48,898 $48,898CDBG Administrative Assistant ⁵ A‐6U/6 35 0.70 0.70 0.70 $35,571 $37,896 $37,896
521 Planning & Development TOTAL 2.75 2.75 2.75 $181,720 $187,534 $187,534
238
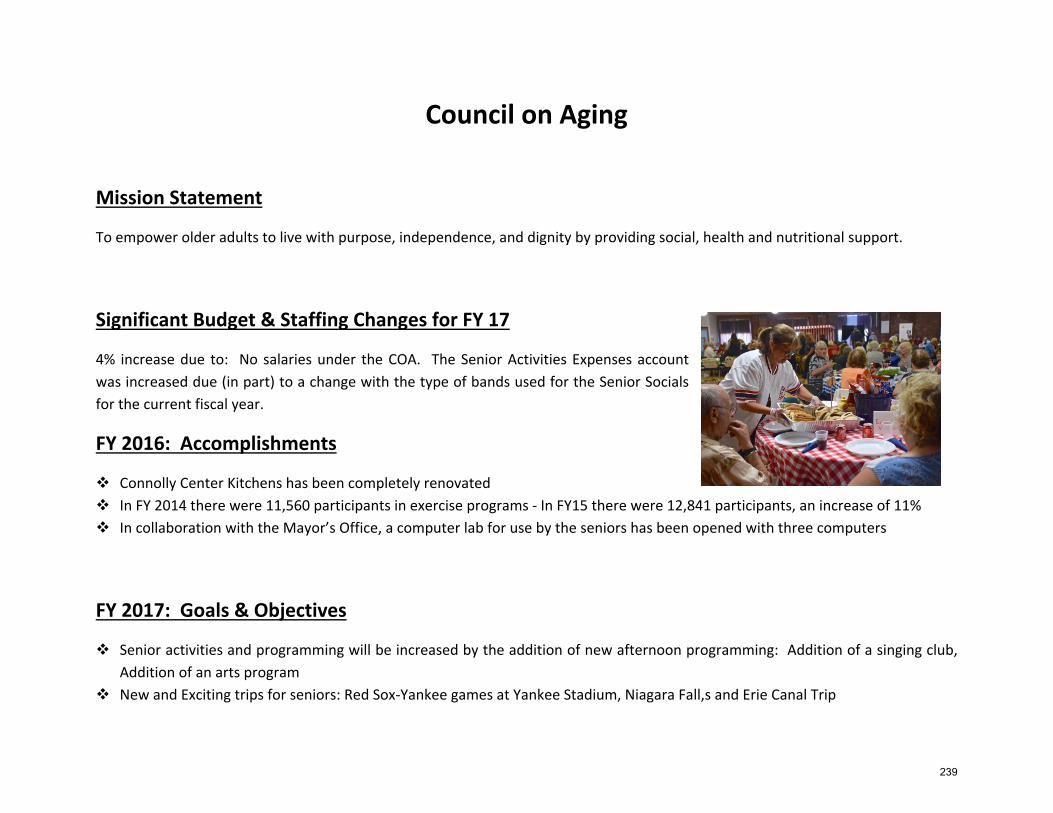
Council on Aging
Mission Statement
To empower older adults to live with purpose, independence, and dignity by providing social, health and nutritional support.
Significant Budget & Staffing Changes for FY 17
4% increase due to: No salaries under the COA. The Senior Activities Expenses account was increased due (in part) to a change with the type of bands used for the Senior Socials for the current fiscal year.
FY 2016: Accomplishments
Connolly Center Kitchens has been completely renovated In FY 2014 there were 11,560 participants in exercise programs ‐ In FY15 there were 12,841 participants, an increase of 11% In collaboration with the Mayor’s Office, a computer lab for use by the seniors has been opened with three computers
FY 2017: Goals & Objectives
Senior activities and programming will be increased by the addition of new afternoon programming: Addition of a singing club, Addition of an arts program
New and Exciting trips for seniors: Red Sox‐Yankee games at Yankee Stadium, Niagara Fall,s and Erie Canal Trip
239
Additional health programs in collaboration with Cambridge Health Alliance: A Matter of Balance, Continuation of the successful My Health Game Show.
Introduction of computer literacy classes in the new computer lab at the Connolly Center. Expand senior activities and programming.
Outcomes & Performance Measurers Actual FY 2014
Actual FY 2015
Estimated FY 2016
Estimated FY 2017
Total # Senior Citizens served through COA 968 1,009 1,030 1,076 Volunteers 24 25 28 35 Tax Work Off Participants 13 15 15 20 Van Rides – Units of Service 5,303 5,750 6,100 7,500
240
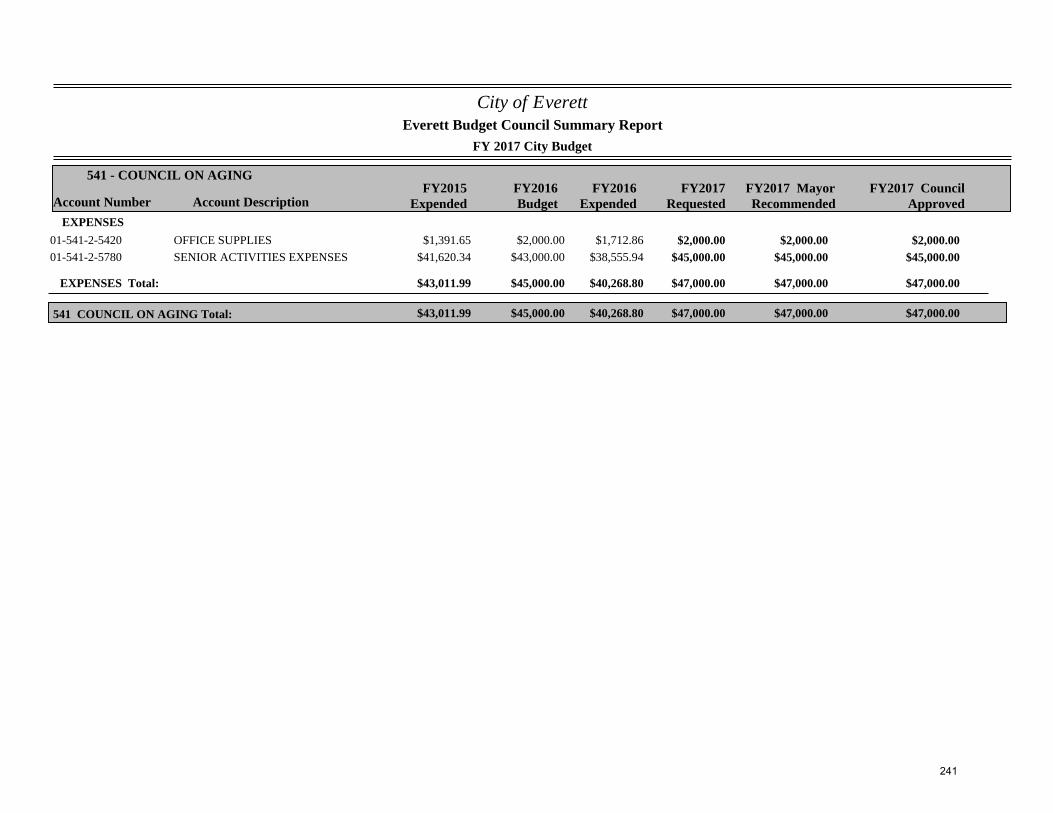
City of Everett
FY 2017 City Budget
Account Number Account DescriptionFY2015
ExpendedFY2016Budget
FY2017Requested
541 - COUNCIL ON AGING
Everett Budget Council Summary Report
FY2017 MayorRecommended
FY2016Expended
FY2017 CouncilApproved
EXPENSES$1,391.65 $2,000.00 $2,000.0001-541-2-5420 OFFICE SUPPLIES $1,712.86 $2,000.00 $2,000.00
$41,620.34 $43,000.00 $45,000.0001-541-2-5780 SENIOR ACTIVITIES EXPENSES $38,555.94 $45,000.00 $45,000.00
EXPENSES Total: $43,011.99 $45,000.00 $47,000.00$40,268.80 $47,000.00 $47,000.00
$43,011.99 $45,000.00 $47,000.00541 COUNCIL ON AGING Total: $40,268.80 $47,000.00 $47,000.00
241
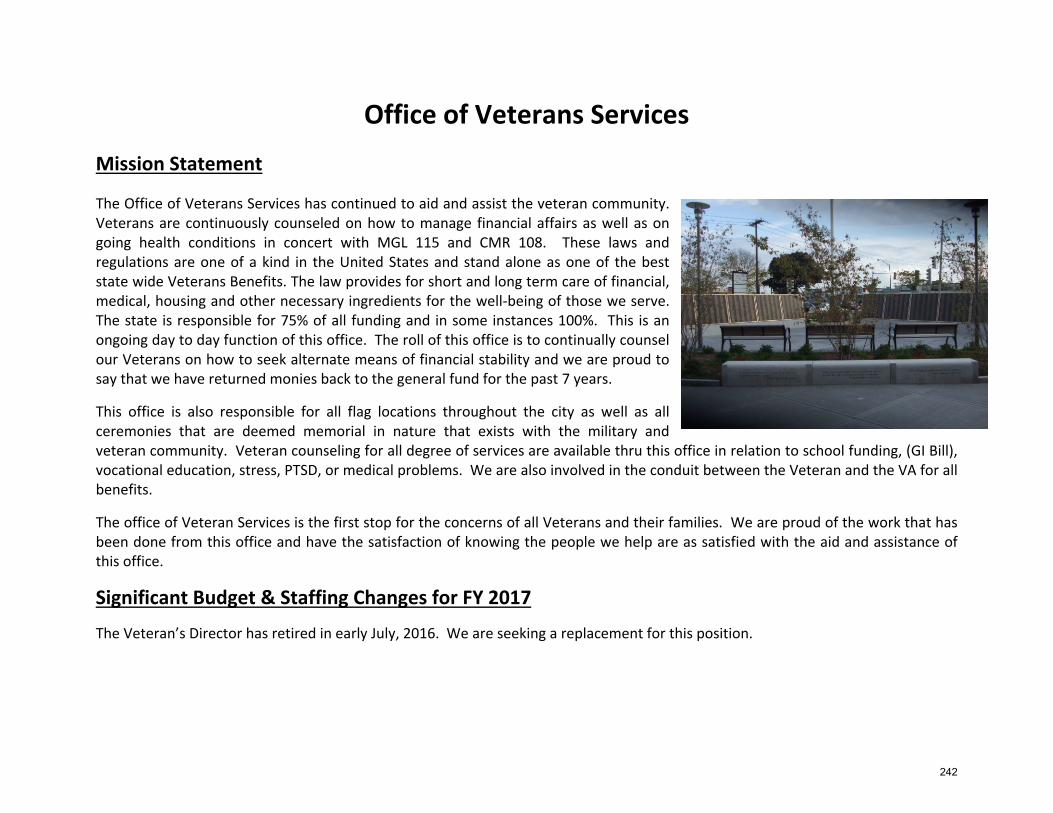
Office of Veterans Services
Mission Statement
The Office of Veterans Services has continued to aid and assist the veteran community. Veterans are continuously counseled on how to manage financial affairs as well as on going health conditions in concert with MGL 115 and CMR 108. These laws and regulations are one of a kind in the United States and stand alone as one of the best state wide Veterans Benefits. The law provides for short and long term care of financial, medical, housing and other necessary ingredients for the well‐being of those we serve. The state is responsible for 75% of all funding and in some instances 100%. This is an ongoing day to day function of this office. The roll of this office is to continually counsel our Veterans on how to seek alternate means of financial stability and we are proud to say that we have returned monies back to the general fund for the past 7 years.
This office is also responsible for all flag locations throughout the city as well as all ceremonies that are deemed memorial in nature that exists with the military and veteran community. Veteran counseling for all degree of services are available thru this office in relation to school funding, (GI Bill), vocational education, stress, PTSD, or medical problems. We are also involved in the conduit between the Veteran and the VA for all benefits.
The office of Veteran Services is the first stop for the concerns of all Veterans and their families. We are proud of the work that has been done from this office and have the satisfaction of knowing the people we help are as satisfied with the aid and assistance of this office.
Significant Budget & Staffing Changes for FY 2017
The Veteran’s Director has retired in early July, 2016. We are seeking a replacement for this position.
242
FY 2016: Accomplishments
Successful Veterans Day and Memorial Day programs Bring a Vet to School Day Successful Memorial Day program 5,600 Flags placed at
veterans gravesites Ongoing upkeep of WWII roll call board Continued state mandated VSO training requirements as
well as all Massachusetts Veterans Service seminars
FY 2017: Goals & Objectives
Looking forward to the new Director’s plan for our veterans
Outcomes & Performance Measurers Actual FY 2014
Actual FY 2015
Estimated FY 2016
Estimated FY 2017
# of Cases 78 78 67 60 Amount Reimbursed to City from State $241,559 $278,839 $262,500 $224,674 $$ and benefits expended $322,130 $371,192 $350,000 $299,566
243
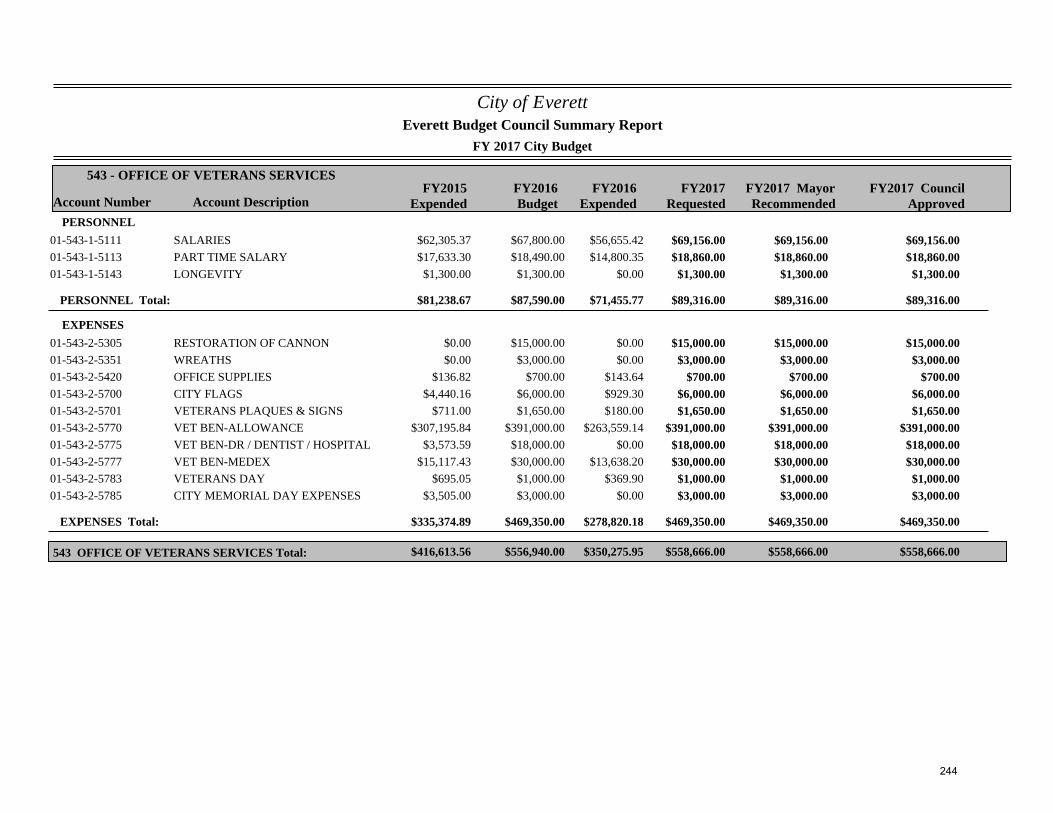
City of Everett
FY 2017 City Budget
Account Number Account DescriptionFY2015
ExpendedFY2016Budget
FY2017Requested
543 - OFFICE OF VETERANS SERVICES
Everett Budget Council Summary Report
FY2017 MayorRecommended
FY2016Expended
FY2017 CouncilApproved
PERSONNEL$62,305.37 $67,800.00 $69,156.0001-543-1-5111 SALARIES $56,655.42 $69,156.00 $69,156.00$17,633.30 $18,490.00 $18,860.0001-543-1-5113 PART TIME SALARY $14,800.35 $18,860.00 $18,860.00$1,300.00 $1,300.00 $1,300.0001-543-1-5143 LONGEVITY $0.00 $1,300.00 $1,300.00
PERSONNEL Total: $81,238.67 $87,590.00 $89,316.00$71,455.77 $89,316.00 $89,316.00
EXPENSES$0.00 $15,000.00 $15,000.0001-543-2-5305 RESTORATION OF CANNON $0.00 $15,000.00 $15,000.00$0.00 $3,000.00 $3,000.0001-543-2-5351 WREATHS $0.00 $3,000.00 $3,000.00
$136.82 $700.00 $700.0001-543-2-5420 OFFICE SUPPLIES $143.64 $700.00 $700.00$4,440.16 $6,000.00 $6,000.0001-543-2-5700 CITY FLAGS $929.30 $6,000.00 $6,000.00
$711.00 $1,650.00 $1,650.0001-543-2-5701 VETERANS PLAQUES & SIGNS $180.00 $1,650.00 $1,650.00$307,195.84 $391,000.00 $391,000.0001-543-2-5770 VET BEN-ALLOWANCE $263,559.14 $391,000.00 $391,000.00
$3,573.59 $18,000.00 $18,000.0001-543-2-5775 VET BEN-DR / DENTIST / HOSPITAL $0.00 $18,000.00 $18,000.00$15,117.43 $30,000.00 $30,000.0001-543-2-5777 VET BEN-MEDEX $13,638.20 $30,000.00 $30,000.00
$695.05 $1,000.00 $1,000.0001-543-2-5783 VETERANS DAY $369.90 $1,000.00 $1,000.00$3,505.00 $3,000.00 $3,000.0001-543-2-5785 CITY MEMORIAL DAY EXPENSES $0.00 $3,000.00 $3,000.00
EXPENSES Total: $335,374.89 $469,350.00 $469,350.00$278,820.18 $469,350.00 $469,350.00
$416,613.56 $556,940.00 $558,666.00543 OFFICE OF VETERANS SERVICES Total: $350,275.95 $558,666.00 $558,666.00
244
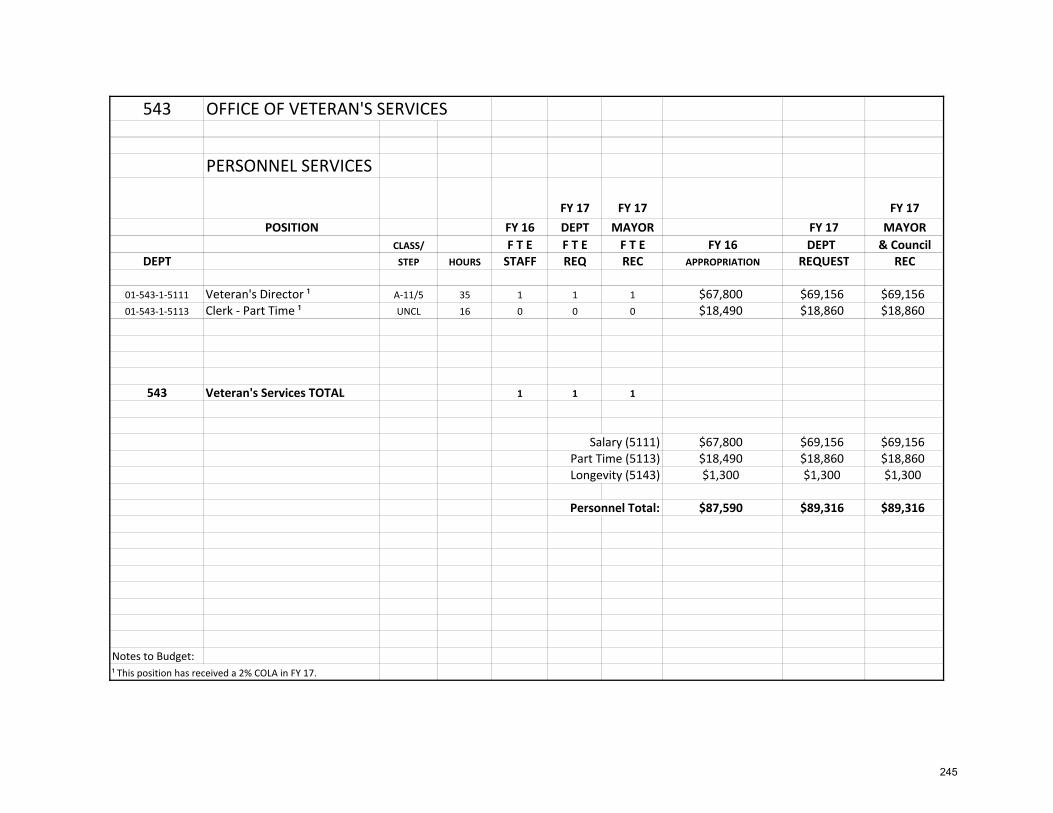
543 OFFICE OF VETERAN'S SERVICES
PERSONNEL SERVICES
FY 17 FY 17 FY 17POSITION FY 16 DEPT MAYOR FY 17 MAYOR
CLASS/ F T E F T E F T E FY 16 DEPT & CouncilDEPT STEP HOURS STAFF REQ REC APPROPRIATION REQUEST REC
01‐543‐1‐5111 Veteran's Director ¹ A‐11/5 35 1 1 1 $67,800 $69,156 $69,15601‐543‐1‐5113 Clerk ‐ Part Time ¹ UNCL 16 0 0 0 $18,490 $18,860 $18,860
543 Veteran's Services TOTAL 1 1 1
Salary (5111) $67,800 $69,156 $69,156Part Time (5113) $18,490 $18,860 $18,860Longevity (5143) $1,300 $1,300 $1,300
Personnel Total: $87,590 $89,316 $89,316
Notes to Budget:¹ This position has received a 2% COLA in FY 17.
245
Disability Commission
Mission Statement
To make all Everett Public buildings accessible and to support, educate and help all departments within the City to achieve this goal. To make the City of Everett an accessible and safe community to live in and visit.
Significant Budget & Staffing Changes for FY 16
No significant budget changes.
FY 2017: Goals & Objectives
Identify the needs of those in the city that need assistance with compliance issues. Measure the progress of all ongoing projects.
Outcomes & Performance Measurers Actual FY 2014
Actual FY 2015
Estimated FY 2016
Estimated FY 2017
TBD
246
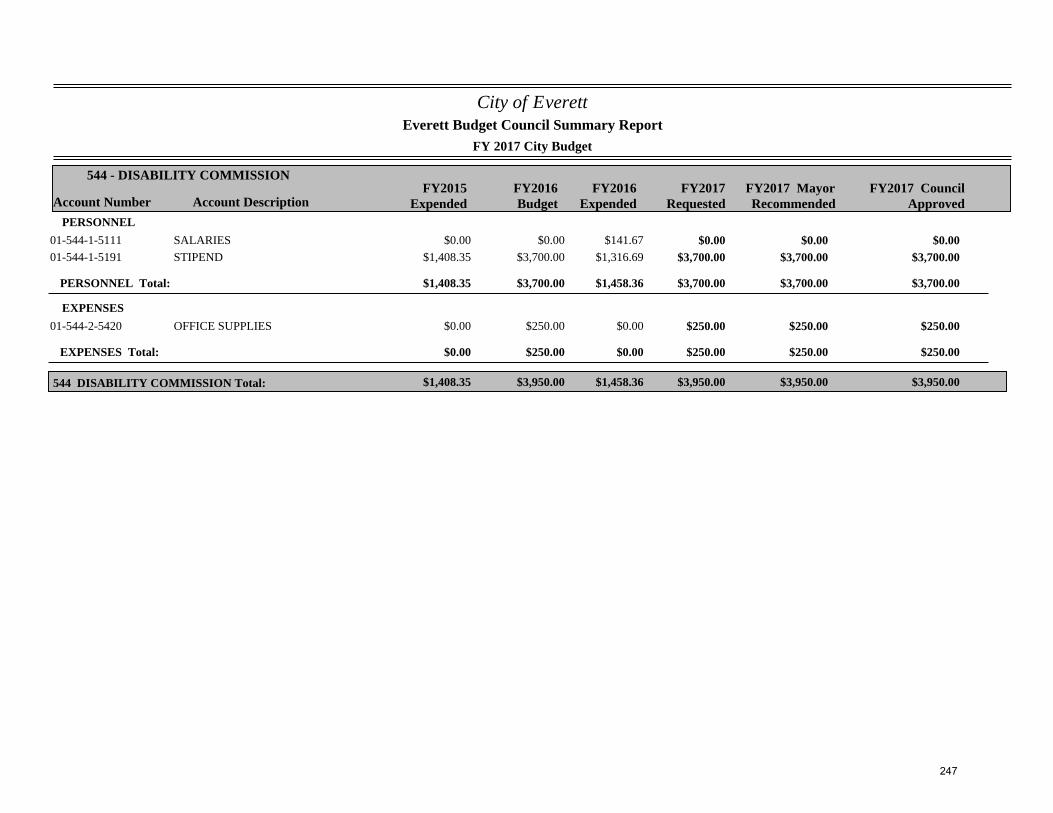
City of Everett
FY 2017 City Budget
Account Number Account DescriptionFY2015
ExpendedFY2016Budget
FY2017Requested
544 - DISABILITY COMMISSION
Everett Budget Council Summary Report
FY2017 MayorRecommended
FY2016Expended
FY2017 CouncilApproved
PERSONNEL$0.00 $0.00 $0.0001-544-1-5111 SALARIES $141.67 $0.00 $0.00
$1,408.35 $3,700.00 $3,700.0001-544-1-5191 STIPEND $1,316.69 $3,700.00 $3,700.00
PERSONNEL Total: $1,408.35 $3,700.00 $3,700.00$1,458.36 $3,700.00 $3,700.00
EXPENSES$0.00 $250.00 $250.0001-544-2-5420 OFFICE SUPPLIES $0.00 $250.00 $250.00
EXPENSES Total: $0.00 $250.00 $250.00$0.00 $250.00 $250.00
$1,408.35 $3,950.00 $3,950.00544 DISABILITY COMMISSION Total: $1,458.36 $3,950.00 $3,950.00
247
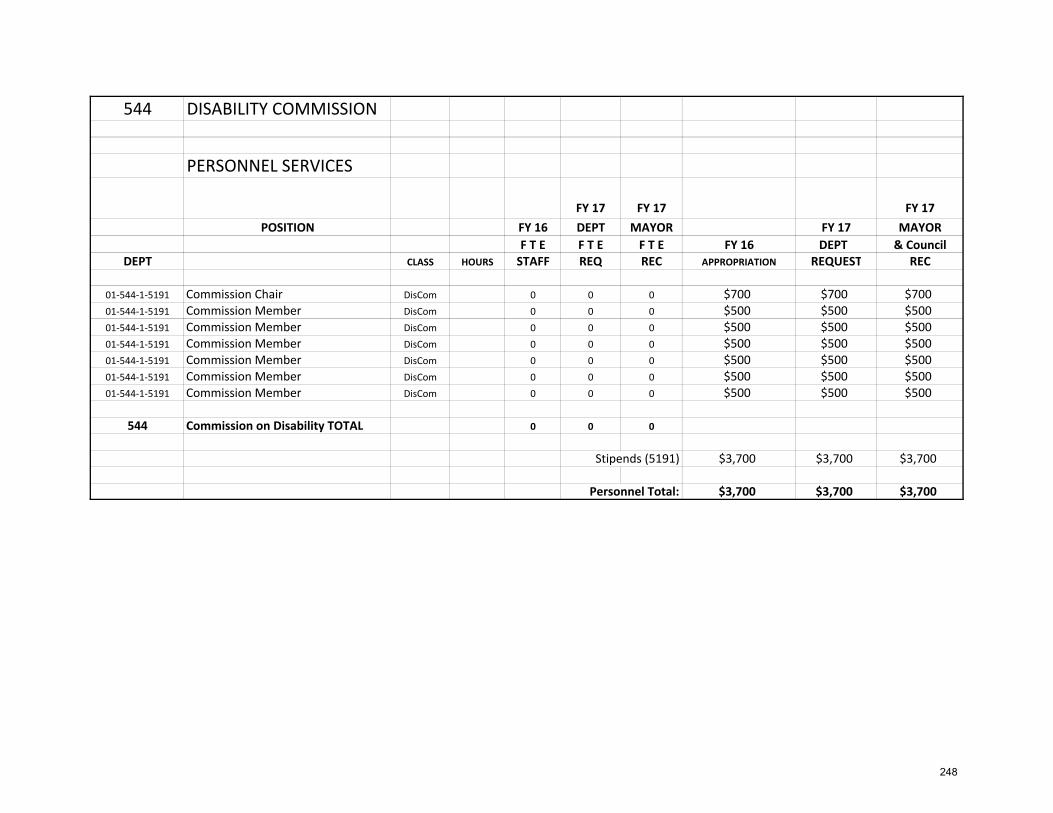
544 DISABILITY COMMISSION
PERSONNEL SERVICES
FY 17 FY 17 FY 17POSITION FY 16 DEPT MAYOR FY 17 MAYOR
F T E F T E F T E FY 16 DEPT & CouncilDEPT CLASS HOURS STAFF REQ REC APPROPRIATION REQUEST REC
01‐544‐1‐5191 Commission Chair DisCom 0 0 0 $700 $700 $70001‐544‐1‐5191 Commission Member DisCom 0 0 0 $500 $500 $50001‐544‐1‐5191 Commission Member DisCom 0 0 0 $500 $500 $50001‐544‐1‐5191 Commission Member DisCom 0 0 0 $500 $500 $50001‐544‐1‐5191 Commission Member DisCom 0 0 0 $500 $500 $50001‐544‐1‐5191 Commission Member DisCom 0 0 0 $500 $500 $50001‐544‐1‐5191 Commission Member DisCom 0 0 0 $500 $500 $500
544 Commission on Disability TOTAL 0 0 0
Stipends (5191) $3,700 $3,700 $3,700
Personnel Total: $3,700 $3,700 $3,700
248
Office of Human Services
Mission Statement
To establish and administer programs and services for the benefit of the City’s elderly, low‐income, minority and disabled population.
Significant Budget & Staffing Changes for FY 2017
2% increase due to: Human Services Director retired in FY 16. We are currently seeking candidates for this position. Large increases for union employees due to union contract settled for both FY 15 and FY 16 during FY 16. Also includes step increases for these union personnel and one clerk being reclassified. 2% increase on most salaries.
We have requested an increase to Domestic Violence Prevention in anticipation of need.
FY 2016: Accomplishments
Successful programs for all community outreach
FY 2017: Goals & Objectives
Increase collaboration with other local social service agencies to include: Action of Boston Community Development Increase in Mystic Valley Elder Service Programs.
249
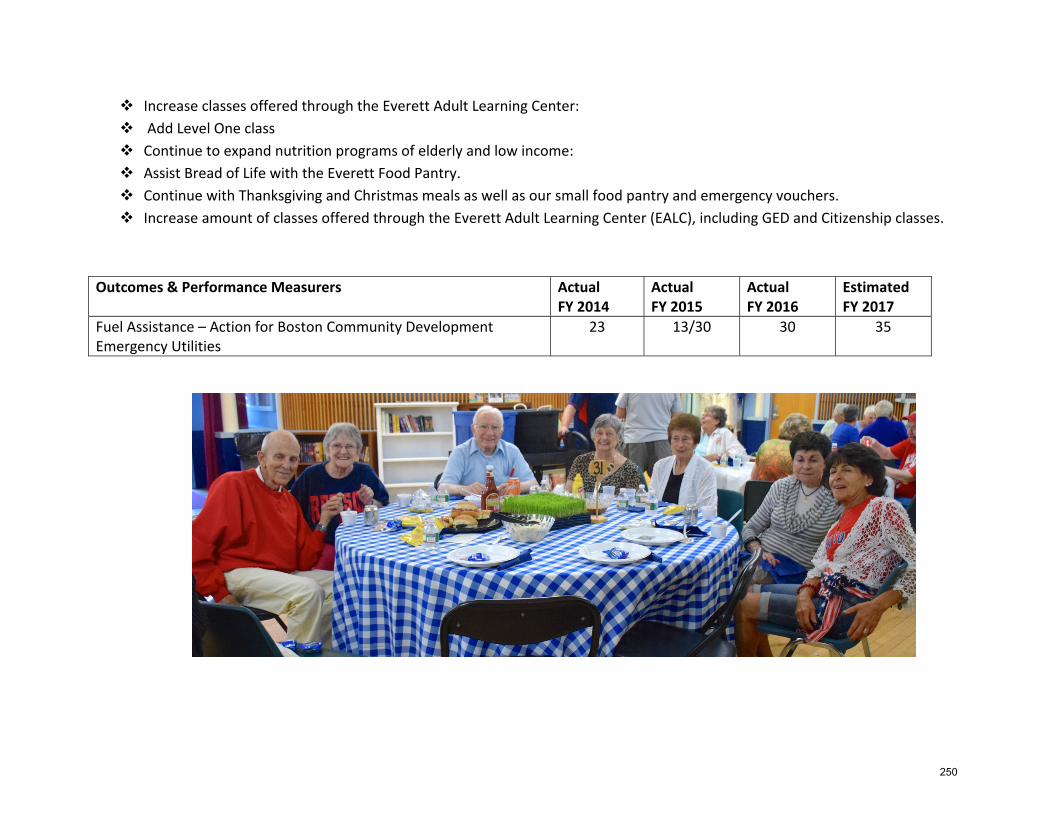
Increase classes offered through the Everett Adult Learning Center: Add Level One class Continue to expand nutrition programs of elderly and low income: Assist Bread of Life with the Everett Food Pantry. Continue with Thanksgiving and Christmas meals as well as our small food pantry and emergency vouchers. Increase amount of classes offered through the Everett Adult Learning Center (EALC), including GED and Citizenship classes.
Outcomes & Performance Measurers Actual FY 2014
Actual FY 2015
Actual FY 2016
Estimated FY 2017
Fuel Assistance – Action for Boston Community Development Emergency Utilities
23 13/30 30 35
250
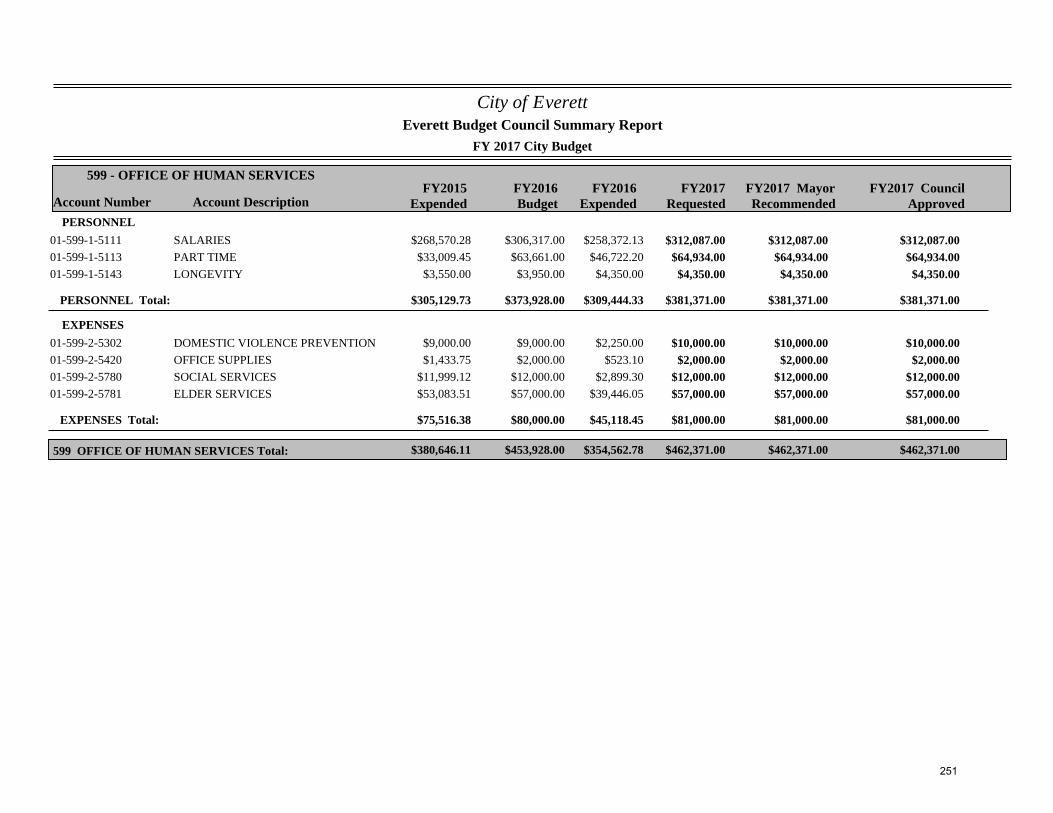
City of Everett
FY 2017 City Budget
Account Number Account DescriptionFY2015
ExpendedFY2016Budget
FY2017Requested
599 - OFFICE OF HUMAN SERVICES
Everett Budget Council Summary Report
FY2017 MayorRecommended
FY2016Expended
FY2017 CouncilApproved
PERSONNEL$268,570.28 $306,317.00 $312,087.0001-599-1-5111 SALARIES $258,372.13 $312,087.00 $312,087.00
$33,009.45 $63,661.00 $64,934.0001-599-1-5113 PART TIME $46,722.20 $64,934.00 $64,934.00$3,550.00 $3,950.00 $4,350.0001-599-1-5143 LONGEVITY $4,350.00 $4,350.00 $4,350.00
PERSONNEL Total: $305,129.73 $373,928.00 $381,371.00$309,444.33 $381,371.00 $381,371.00
EXPENSES$9,000.00 $9,000.00 $10,000.0001-599-2-5302 DOMESTIC VIOLENCE PREVENTION $2,250.00 $10,000.00 $10,000.00$1,433.75 $2,000.00 $2,000.0001-599-2-5420 OFFICE SUPPLIES $523.10 $2,000.00 $2,000.00
$11,999.12 $12,000.00 $12,000.0001-599-2-5780 SOCIAL SERVICES $2,899.30 $12,000.00 $12,000.00$53,083.51 $57,000.00 $57,000.0001-599-2-5781 ELDER SERVICES $39,446.05 $57,000.00 $57,000.00
EXPENSES Total: $75,516.38 $80,000.00 $81,000.00$45,118.45 $81,000.00 $81,000.00
$380,646.11 $453,928.00 $462,371.00599 OFFICE OF HUMAN SERVICES Total: $354,562.78 $462,371.00 $462,371.00
251
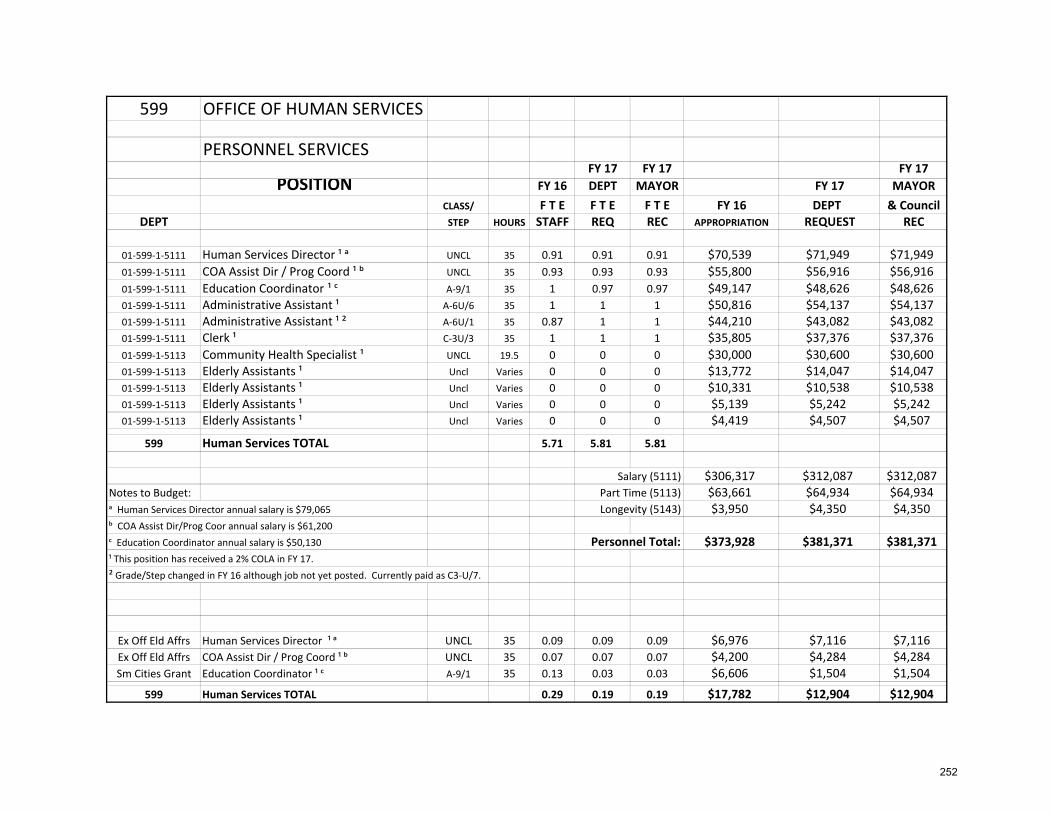
599 OFFICE OF HUMAN SERVICES
PERSONNEL SERVICESFY 17 FY 17 FY 17
POSITION FY 16 DEPT MAYOR FY 17 MAYORCLASS/ F T E F T E F T E FY 16 DEPT & Council
DEPT STEP HOURS STAFF REQ REC APPROPRIATION REQUEST REC
01‐599‐1‐5111 Human Services Director ¹ ᵃ UNCL 35 0.91 0.91 0.91 $70,539 $71,949 $71,94901‐599‐1‐5111 COA Assist Dir / Prog Coord ¹ ᵇ UNCL 35 0.93 0.93 0.93 $55,800 $56,916 $56,91601‐599‐1‐5111 Education Coordinator ¹ ᶜ A‐9/1 35 1 0.97 0.97 $49,147 $48,626 $48,62601‐599‐1‐5111 Administrative Assistant ¹ A‐6U/6 35 1 1 1 $50,816 $54,137 $54,13701‐599‐1‐5111 Administrative Assistant ¹ ² A‐6U/1 35 0.87 1 1 $44,210 $43,082 $43,08201‐599‐1‐5111 Clerk ¹ C‐3U/3 35 1 1 1 $35,805 $37,376 $37,37601‐599‐1‐5113 Community Health Specialist ¹ UNCL 19.5 0 0 0 $30,000 $30,600 $30,60001‐599‐1‐5113 Elderly Assistants ¹ Uncl Varies 0 0 0 $13,772 $14,047 $14,04701‐599‐1‐5113 Elderly Assistants ¹ Uncl Varies 0 0 0 $10,331 $10,538 $10,53801‐599‐1‐5113 Elderly Assistants ¹ Uncl Varies 0 0 0 $5,139 $5,242 $5,24201‐599‐1‐5113 Elderly Assistants ¹ Uncl Varies 0 0 0 $4,419 $4,507 $4,507
599 Human Services TOTAL 5.71 5.81 5.81
Salary (5111) $306,317 $312,087 $312,087Notes to Budget: Part Time (5113) $63,661 $64,934 $64,934ᵃ Human Services Director annual salary is $79,065 Longevity (5143) $3,950 $4,350 $4,350ᵇ COA Assist Dir/Prog Coor annual salary is $61,200 ᶜ Education Coordinator annual salary is $50,130 Personnel Total: $373,928 $381,371 $381,371¹ This position has received a 2% COLA in FY 17.² Grade/Step changed in FY 16 although job not yet posted. Currently paid as C3‐U/7.
Ex Off Eld Affrs Human Services Director ¹ ᵃ UNCL 35 0.09 0.09 0.09 $6,976 $7,116 $7,116Ex Off Eld Affrs COA Assist Dir / Prog Coord ¹ ᵇ UNCL 35 0.07 0.07 0.07 $4,200 $4,284 $4,284Sm Cities Grant Education Coordinator ¹ ᶜ A‐9/1 35 0.13 0.03 0.03 $6,606 $1,504 $1,504
599 Human Services TOTAL 0.29 0.19 0.19 $17,782 $12,904 $12,904
252
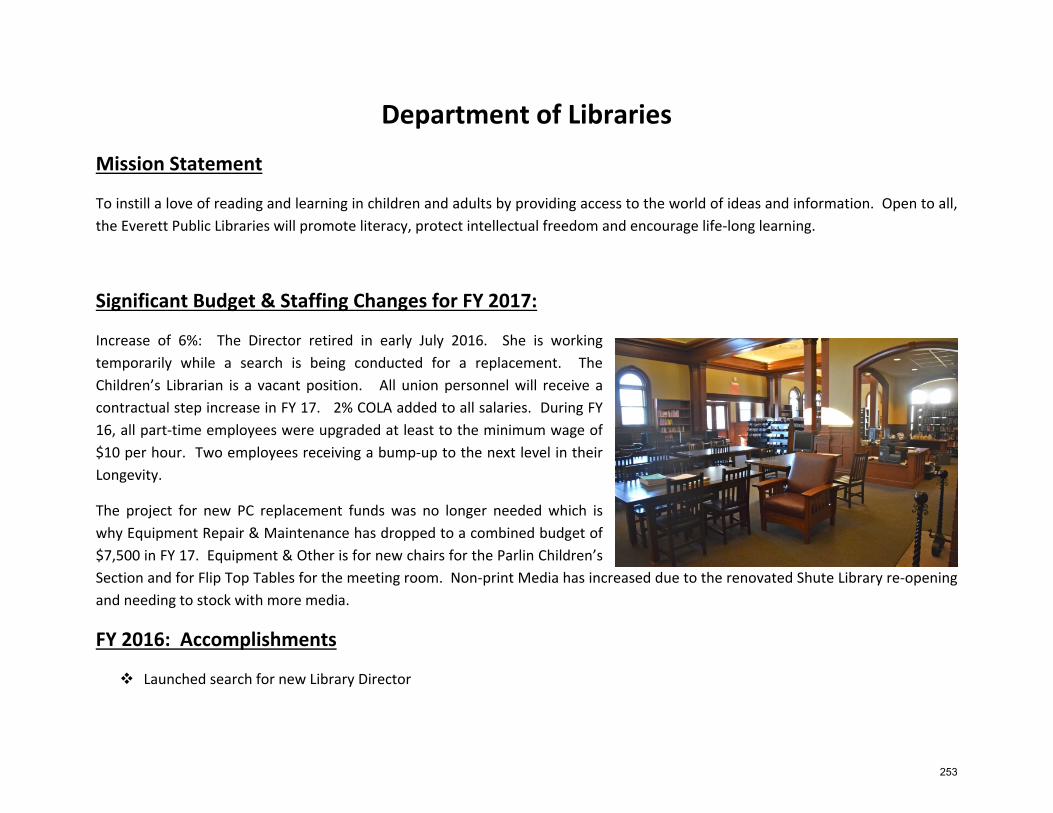
Department of Libraries
Mission Statement
To instill a love of reading and learning in children and adults by providing access to the world of ideas and information. Open to all, the Everett Public Libraries will promote literacy, protect intellectual freedom and encourage life‐long learning.
Significant Budget & Staffing Changes for FY 2017:
Increase of 6%: The Director retired in early July 2016. She is working temporarily while a search is being conducted for a replacement. The Children’s Librarian is a vacant position. All union personnel will receive a contractual step increase in FY 17. 2% COLA added to all salaries. During FY 16, all part‐time employees were upgraded at least to the minimum wage of $10 per hour. Two employees receiving a bump‐up to the next level in their Longevity.
The project for new PC replacement funds was no longer needed which is why Equipment Repair & Maintenance has dropped to a combined budget of $7,500 in FY 17. Equipment & Other is for new chairs for the Parlin Children’s Section and for Flip Top Tables for the meeting room. Non‐print Media has increased due to the renovated Shute Library re‐opening and needing to stock with more media.
FY 2016: Accomplishments
Launched search for new Library Director
253
Made significant progress in multi‐year collection development project (removing out‐of‐date items and purchasing current material)
Introduced several programs aimed at adult audiences (coloring for adults, financial planning series, craft program) Replaced all public access computers at the Parlin Library so that the public will have access to streaming sites and future
technology Introduced a new technology platform (Chromebooks) and started computer classes on email and job searching Upgraded hubs and switches which improved the libraries technological infra‐structure Installed new release of library software that allows for text message notification to patrons of items ready for pickup
FY 2017: Goals & Objectives
Complete 5 year Long Range Plan Inject energy into library program with new Director and Children’s Supervisor at the Parlin Launch new website featuring historical collection of photographs or digital resources Increase efforts to publicize library programs, services and accomplishments Combine all budged accounts together. Do not differentiate between Parlin and Shute libraries.
254
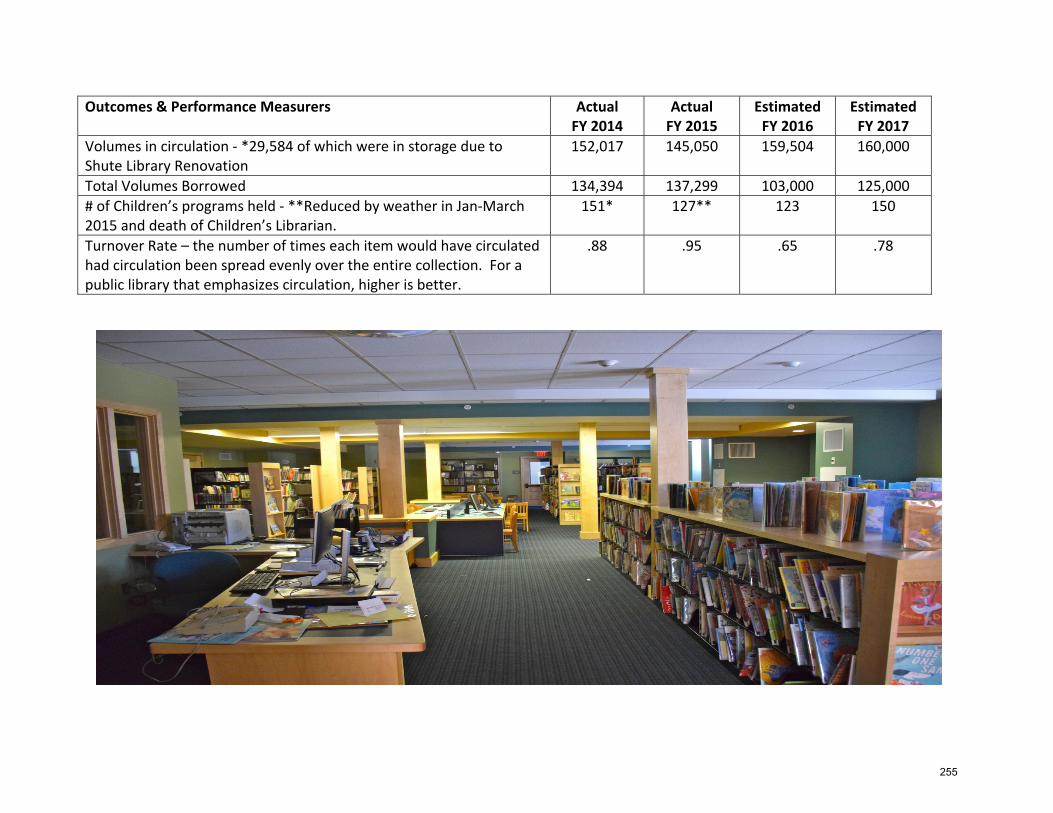
Outcomes & Performance Measurers Actual FY 2014
Actual FY 2015
Estimated FY 2016
Estimated FY 2017
Volumes in circulation ‐ *29,584 of which were in storage due to Shute Library Renovation
152,017 145,050 159,504 160,000
Total Volumes Borrowed 134,394 137,299 103,000 125,000 # of Children’s programs held ‐ **Reduced by weather in Jan‐March 2015 and death of Children’s Librarian.
151* 127** 123 150
Turnover Rate – the number of times each item would have circulated had circulation been spread evenly over the entire collection. For a public library that emphasizes circulation, higher is better.
.88 .95 .65 .78
255
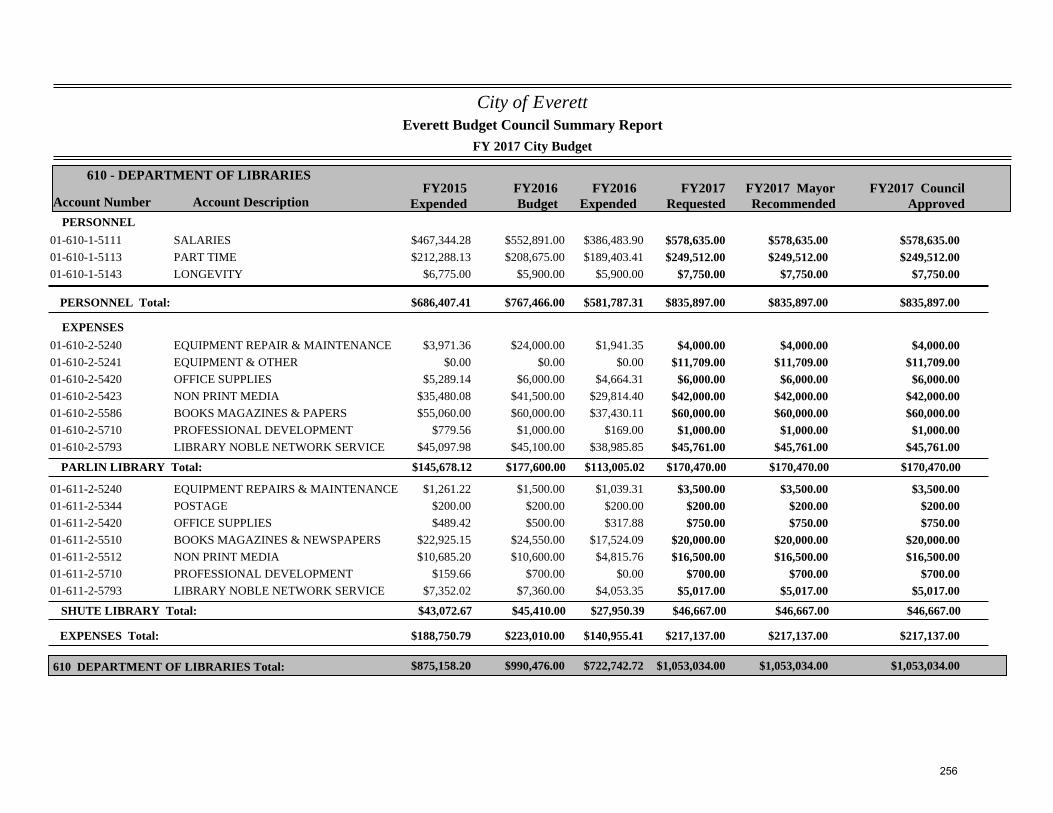
City of Everett
FY 2017 City Budget
Account Number Account DescriptionFY2015
ExpendedFY2016Budget
FY2017Requested
610 - DEPARTMENT OF LIBRARIES
Everett Budget Council Summary Report
FY2017 MayorRecommended
FY2016Expended
FY2017 CouncilApproved
PERSONNEL$467,344.28 $552,891.00 $578,635.0001-610-1-5111 SALARIES $386,483.90 $578,635.00 $578,635.00$212,288.13 $208,675.00 $249,512.0001-610-1-5113 PART TIME $189,403.41 $249,512.00 $249,512.00
$6,775.00 $5,900.00 $7,750.0001-610-1-5143 LONGEVITY $5,900.00 $7,750.00 $7,750.00
PERSONNEL Total: $686,407.41 $767,466.00 $835,897.00$581,787.31 $835,897.00 $835,897.00
EXPENSES$3,971.36 $24,000.00 $4,000.0001-610-2-5240 EQUIPMENT REPAIR & MAINTENANCE $1,941.35 $4,000.00 $4,000.00
$0.00 $0.00 $11,709.0001-610-2-5241 EQUIPMENT & OTHER $0.00 $11,709.00 $11,709.00$5,289.14 $6,000.00 $6,000.0001-610-2-5420 OFFICE SUPPLIES $4,664.31 $6,000.00 $6,000.00
$35,480.08 $41,500.00 $42,000.0001-610-2-5423 NON PRINT MEDIA $29,814.40 $42,000.00 $42,000.00$55,060.00 $60,000.00 $60,000.0001-610-2-5586 BOOKS MAGAZINES & PAPERS $37,430.11 $60,000.00 $60,000.00
$779.56 $1,000.00 $1,000.0001-610-2-5710 PROFESSIONAL DEVELOPMENT $169.00 $1,000.00 $1,000.00$45,097.98 $45,100.00 $45,761.0001-610-2-5793 LIBRARY NOBLE NETWORK SERVICE $38,985.85 $45,761.00 $45,761.00
PARLIN LIBRARY Total: $145,678.12 $177,600.00 $170,470.00$113,005.02 $170,470.00 $170,470.00
$1,261.22 $1,500.00 $3,500.0001-611-2-5240 EQUIPMENT REPAIRS & MAINTENANCE $1,039.31 $3,500.00 $3,500.00$200.00 $200.00 $200.0001-611-2-5344 POSTAGE $200.00 $200.00 $200.00$489.42 $500.00 $750.0001-611-2-5420 OFFICE SUPPLIES $317.88 $750.00 $750.00
$22,925.15 $24,550.00 $20,000.0001-611-2-5510 BOOKS MAGAZINES & NEWSPAPERS $17,524.09 $20,000.00 $20,000.00$10,685.20 $10,600.00 $16,500.0001-611-2-5512 NON PRINT MEDIA $4,815.76 $16,500.00 $16,500.00
$159.66 $700.00 $700.0001-611-2-5710 PROFESSIONAL DEVELOPMENT $0.00 $700.00 $700.00$7,352.02 $7,360.00 $5,017.0001-611-2-5793 LIBRARY NOBLE NETWORK SERVICE $4,053.35 $5,017.00 $5,017.00
SHUTE LIBRARY Total: $43,072.67 $45,410.00 $46,667.00$27,950.39 $46,667.00 $46,667.00
EXPENSES Total: $188,750.79 $223,010.00 $217,137.00$140,955.41 $217,137.00 $217,137.00
$875,158.20 $990,476.00 $1,053,034.00610 DEPARTMENT OF LIBRARIES Total: $722,742.72 $1,053,034.00 $1,053,034.00
256
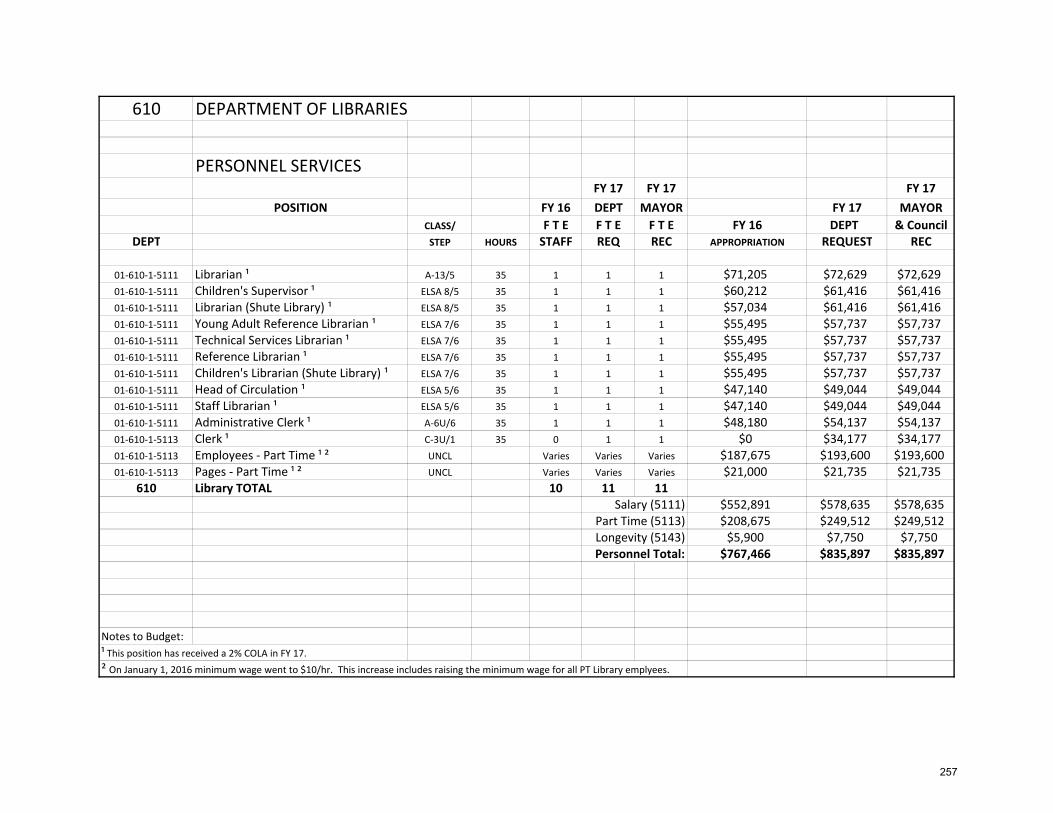
610 DEPARTMENT OF LIBRARIES
PERSONNEL SERVICESFY 17 FY 17 FY 17
POSITION FY 16 DEPT MAYOR FY 17 MAYORCLASS/ F T E F T E F T E FY 16 DEPT & Council
DEPT STEP HOURS STAFF REQ REC APPROPRIATION REQUEST REC
01‐610‐1‐5111 Librarian ¹ A‐13/5 35 1 1 1 $71,205 $72,629 $72,62901‐610‐1‐5111 Children's Supervisor ¹ ELSA 8/5 35 1 1 1 $60,212 $61,416 $61,41601‐610‐1‐5111 Librarian (Shute Library) ¹ ELSA 8/5 35 1 1 1 $57,034 $61,416 $61,41601‐610‐1‐5111 Young Adult Reference Librarian ¹ ELSA 7/6 35 1 1 1 $55,495 $57,737 $57,73701‐610‐1‐5111 Technical Services Librarian ¹ ELSA 7/6 35 1 1 1 $55,495 $57,737 $57,73701‐610‐1‐5111 Reference Librarian ¹ ELSA 7/6 35 1 1 1 $55,495 $57,737 $57,73701‐610‐1‐5111 Children's Librarian (Shute Library) ¹ ELSA 7/6 35 1 1 1 $55,495 $57,737 $57,73701‐610‐1‐5111 Head of Circulation ¹ ELSA 5/6 35 1 1 1 $47,140 $49,044 $49,04401‐610‐1‐5111 Staff Librarian ¹ ELSA 5/6 35 1 1 1 $47,140 $49,044 $49,04401‐610‐1‐5111 Administrative Clerk ¹ A‐6U/6 35 1 1 1 $48,180 $54,137 $54,13701‐610‐1‐5113 Clerk ¹ C‐3U/1 35 0 1 1 $0 $34,177 $34,17701‐610‐1‐5113 Employees ‐ Part Time ¹ ² UNCL Varies Varies Varies $187,675 $193,600 $193,60001‐610‐1‐5113 Pages ‐ Part Time ¹ ² UNCL Varies Varies Varies $21,000 $21,735 $21,735
610 Library TOTAL 10 11 11Salary (5111) $552,891 $578,635 $578,635
Part Time (5113) $208,675 $249,512 $249,512Longevity (5143) $5,900 $7,750 $7,750Personnel Total: $767,466 $835,897 $835,897
Notes to Budget:¹ This position has received a 2% COLA in FY 17.² On January 1, 2016 minimum wage went to $10/hr. This increase includes raising the minimum wage for all PT Library emplyees.
257
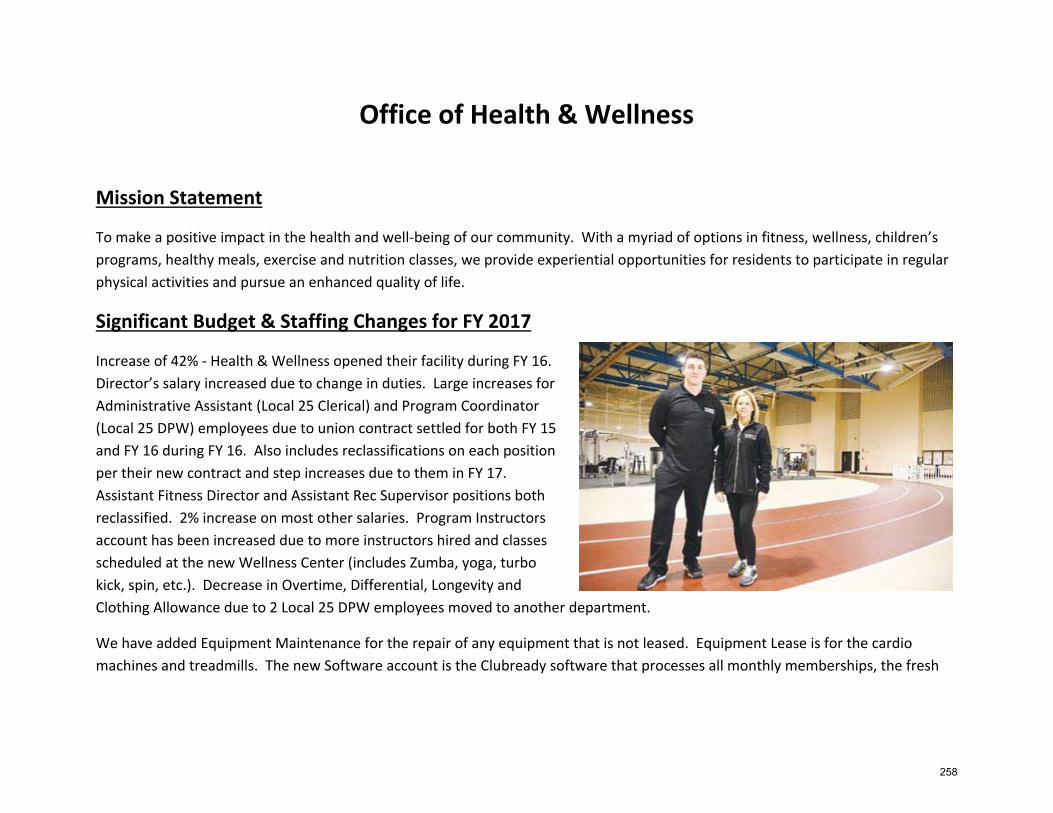
Office of Health & Wellness
Mission Statement
To make a positive impact in the health and well‐being of our community. With a myriad of options in fitness, wellness, children’s programs, healthy meals, exercise and nutrition classes, we provide experiential opportunities for residents to participate in regular physical activities and pursue an enhanced quality of life.
Significant Budget & Staffing Changes for FY 2017
Increase of 42% ‐ Health & Wellness opened their facility during FY 16. Director’s salary increased due to change in duties. Large increases for Administrative Assistant (Local 25 Clerical) and Program Coordinator (Local 25 DPW) employees due to union contract settled for both FY 15 and FY 16 during FY 16. Also includes reclassifications on each position per their new contract and step increases due to them in FY 17. Assistant Fitness Director and Assistant Rec Supervisor positions both reclassified. 2% increase on most other salaries. Program Instructors account has been increased due to more instructors hired and classes scheduled at the new Wellness Center (includes Zumba, yoga, turbo kick, spin, etc.). Decrease in Overtime, Differential, Longevity and Clothing Allowance due to 2 Local 25 DPW employees moved to another department.
We have added Equipment Maintenance for the repair of any equipment that is not leased. Equipment Lease is for the cardio machines and treadmills. The new Software account is the Clubready software that processes all monthly memberships, the fresh
258
food program and the scheduling of classes. Recreation Activities account was needed for the Child Care/Youth Programming through the YMCA at the Health and Wellness facility. AED/First Aid Equipment is due to defibrillators stations added at the facility.
FY 2016: Accomplishments
Implemented several community fitness and nutrition weight loss challenges with success. Everett residents have lost a total of 200 pounds over the course of our challenges!
Provided a variety of new exercise classes and programs to keep members motivated including Zumba, yoga, muscle conditioning, spin, funk fitness and total body pump.
Enrolled 10% of the community to the Wellness Center. Achieved USCM (United States Council of Mayors) “Healthy Me” grant for $100,000
to decrease childhood obesity. How much was grant for? What does USCM stand for?
Added new classes (yoga, weight training, soccer camp and teen spinning) for teens which increased enrollment.
FY 2017: Goals & Objectives
Continue the Healthy Meals program for residents; pick up pre‐made caloric friendly meals at a low cost. We currently have 10 – 20 participants per week. Our goal is to have 20 – 40 by our fiscal year end.
Offer personal training programs and lessons to members. Re‐vamp our youth programs to include nutrition education. Add more cardiovascular and strength training exercise equipment for our growing number of members. What kind of
equipment, be specific. Expand hours of operation on weekends.
259
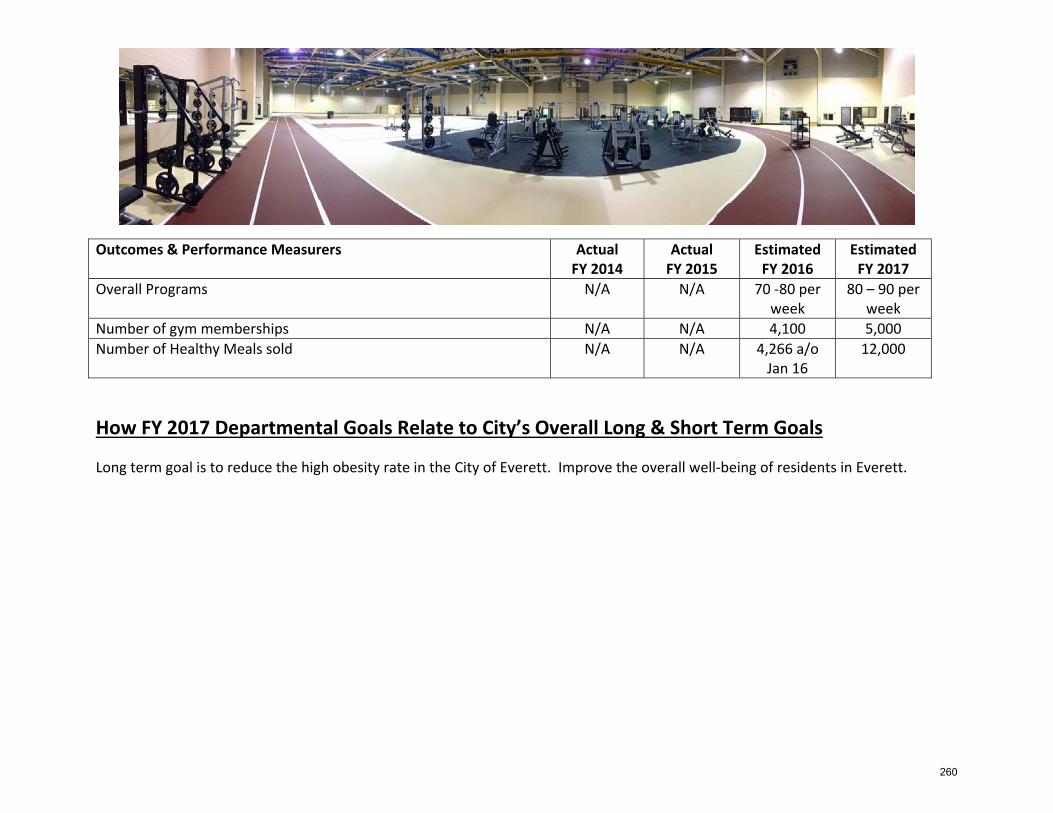
Outcomes & Performance Measurers Actual FY 2014
Actual FY 2015
Estimated FY 2016
Estimated FY 2017
Overall Programs N/A N/A 70 ‐80 per week
80 – 90 per week
Number of gym memberships N/A N/A 4,100 5,000 Number of Healthy Meals sold N/A N/A 4,266 a/o
Jan 16 12,000
How FY 2017 Departmental Goals Relate to City’s Overall Long & Short Term Goals
Long term goal is to reduce the high obesity rate in the City of Everett. Improve the overall well‐being of residents in Everett.
260
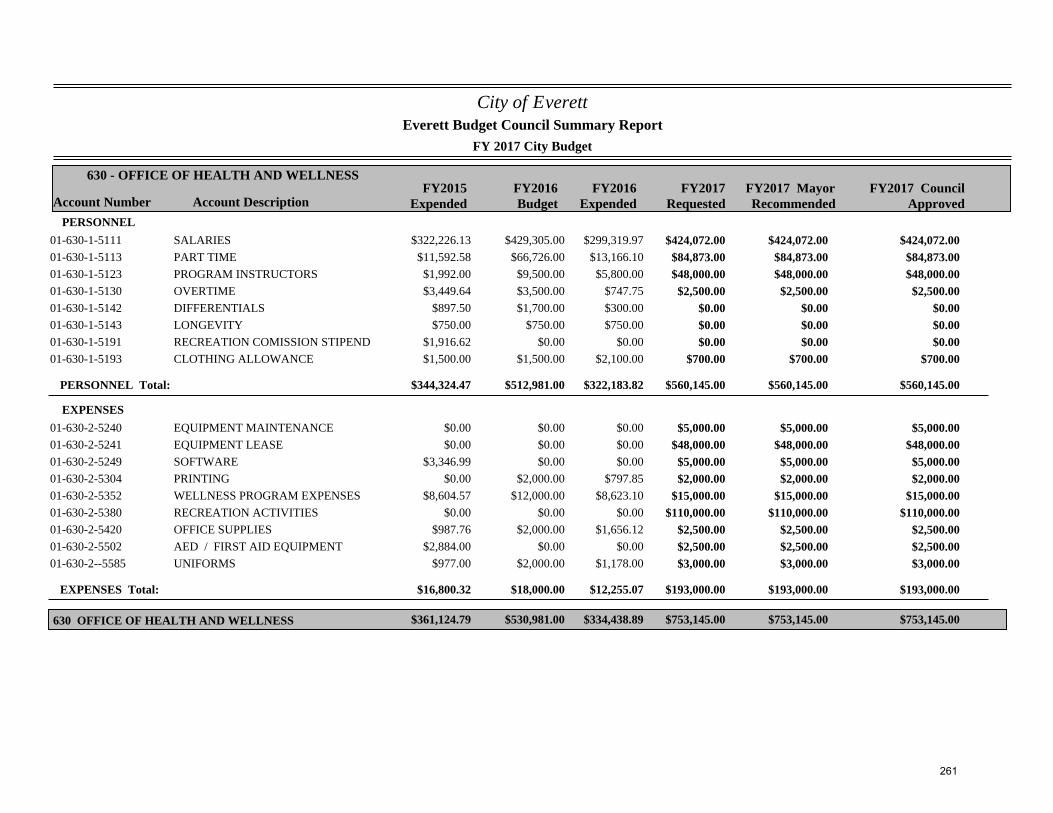
City of Everett
FY 2017 City Budget
Account Number Account DescriptionFY2015
ExpendedFY2016Budget
FY2017Requested
630 - OFFICE OF HEALTH AND WELLNESS
Everett Budget Council Summary Report
FY2017 MayorRecommended
FY2016Expended
FY2017 CouncilApproved
PERSONNEL$322,226.13 $429,305.00 $424,072.0001-630-1-5111 SALARIES $299,319.97 $424,072.00 $424,072.00
$11,592.58 $66,726.00 $84,873.0001-630-1-5113 PART TIME $13,166.10 $84,873.00 $84,873.00$1,992.00 $9,500.00 $48,000.0001-630-1-5123 PROGRAM INSTRUCTORS $5,800.00 $48,000.00 $48,000.00$3,449.64 $3,500.00 $2,500.0001-630-1-5130 OVERTIME $747.75 $2,500.00 $2,500.00
$897.50 $1,700.00 $0.0001-630-1-5142 DIFFERENTIALS $300.00 $0.00 $0.00$750.00 $750.00 $0.0001-630-1-5143 LONGEVITY $750.00 $0.00 $0.00
$1,916.62 $0.00 $0.0001-630-1-5191 RECREATION COMISSION STIPEND $0.00 $0.00 $0.00$1,500.00 $1,500.00 $700.0001-630-1-5193 CLOTHING ALLOWANCE $2,100.00 $700.00 $700.00
PERSONNEL Total: $344,324.47 $512,981.00 $560,145.00$322,183.82 $560,145.00 $560,145.00
EXPENSES$0.00 $0.00 $5,000.0001-630-2-5240 EQUIPMENT MAINTENANCE $0.00 $5,000.00 $5,000.00$0.00 $0.00 $48,000.0001-630-2-5241 EQUIPMENT LEASE $0.00 $48,000.00 $48,000.00
$3,346.99 $0.00 $5,000.0001-630-2-5249 SOFTWARE $0.00 $5,000.00 $5,000.00$0.00 $2,000.00 $2,000.0001-630-2-5304 PRINTING $797.85 $2,000.00 $2,000.00
$8,604.57 $12,000.00 $15,000.0001-630-2-5352 WELLNESS PROGRAM EXPENSES $8,623.10 $15,000.00 $15,000.00$0.00 $0.00 $110,000.0001-630-2-5380 RECREATION ACTIVITIES $0.00 $110,000.00 $110,000.00
$987.76 $2,000.00 $2,500.0001-630-2-5420 OFFICE SUPPLIES $1,656.12 $2,500.00 $2,500.00$2,884.00 $0.00 $2,500.0001-630-2-5502 AED / FIRST AID EQUIPMENT $0.00 $2,500.00 $2,500.00
$977.00 $2,000.00 $3,000.0001-630-2--5585 UNIFORMS $1,178.00 $3,000.00 $3,000.00
EXPENSES Total: $16,800.32 $18,000.00 $193,000.00$12,255.07 $193,000.00 $193,000.00
$361,124.79 $530,981.00 $753,145.00630 OFFICE OF HEALTH AND WELLNESS $334,438.89 $753,145.00 $753,145.00
261
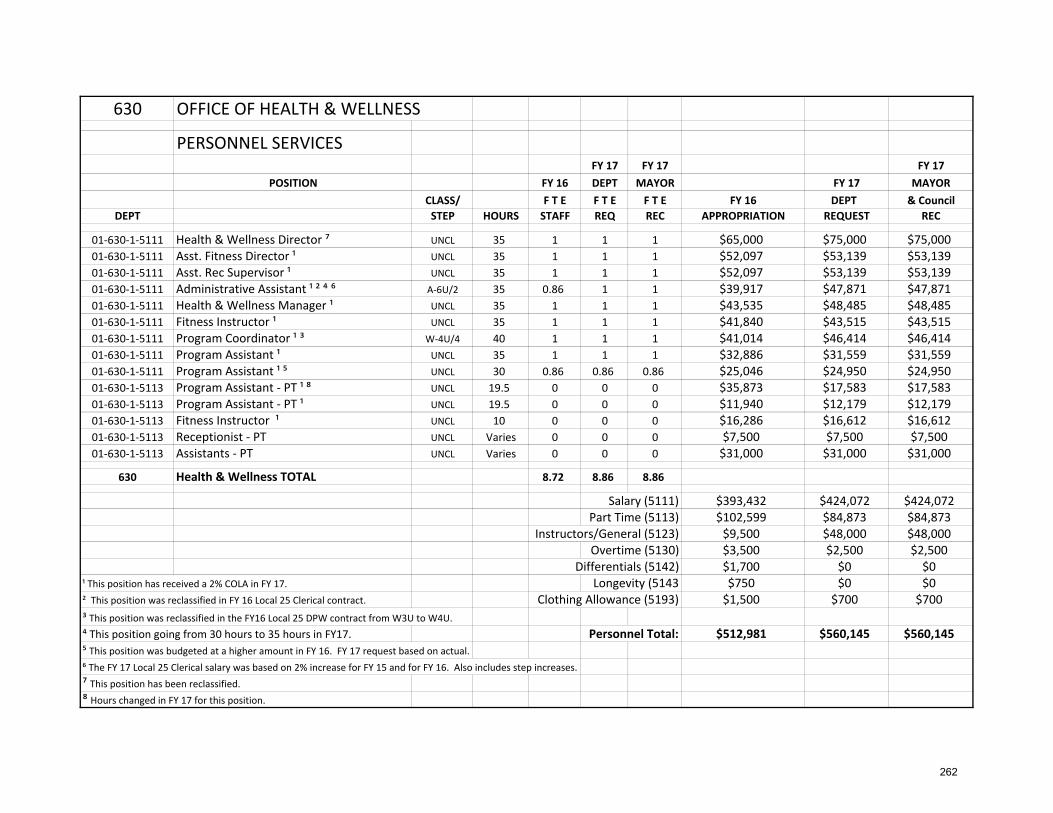
630 OFFICE OF HEALTH & WELLNESS
PERSONNEL SERVICESFY 17 FY 17 FY 17
POSITION FY 16 DEPT MAYOR FY 17 MAYORCLASS/ F T E F T E F T E FY 16 DEPT & Council
DEPT STEP HOURS STAFF REQ REC APPROPRIATION REQUEST REC
01‐630‐1‐5111 Health & Wellness Director ⁷ UNCL 35 1 1 1 $65,000 $75,000 $75,00001‐630‐1‐5111 Asst. Fitness Director ¹ UNCL 35 1 1 1 $52,097 $53,139 $53,13901‐630‐1‐5111 Asst. Rec Supervisor ¹ UNCL 35 1 1 1 $52,097 $53,139 $53,13901‐630‐1‐5111 Administrative Assistant ¹ ² ⁴ ⁶ A‐6U/2 35 0.86 1 1 $39,917 $47,871 $47,87101‐630‐1‐5111 Health & Wellness Manager ¹ UNCL 35 1 1 1 $43,535 $48,485 $48,48501‐630‐1‐5111 Fitness Instructor ¹ UNCL 35 1 1 1 $41,840 $43,515 $43,51501‐630‐1‐5111 Program Coordinator ¹ ³ W‐4U/4 40 1 1 1 $41,014 $46,414 $46,41401‐630‐1‐5111 Program Assistant ¹ UNCL 35 1 1 1 $32,886 $31,559 $31,55901‐630‐1‐5111 Program Assistant ¹ ⁵ UNCL 30 0.86 0.86 0.86 $25,046 $24,950 $24,95001‐630‐1‐5113 Program Assistant ‐ PT ¹ ⁸ UNCL 19.5 0 0 0 $35,873 $17,583 $17,58301‐630‐1‐5113 Program Assistant ‐ PT ¹ UNCL 19.5 0 0 0 $11,940 $12,179 $12,17901‐630‐1‐5113 Fitness Instructor ¹ UNCL 10 0 0 0 $16,286 $16,612 $16,61201‐630‐1‐5113 Receptionist ‐ PT UNCL Varies 0 0 0 $7,500 $7,500 $7,50001‐630‐1‐5113 Assistants ‐ PT UNCL Varies 0 0 0 $31,000 $31,000 $31,000
630 Health & Wellness TOTAL 8.72 8.86 8.86
Salary (5111) $393,432 $424,072 $424,072Part Time (5113) $102,599 $84,873 $84,873
Instructors/General (5123) $9,500 $48,000 $48,000Overtime (5130) $3,500 $2,500 $2,500
Differentials (5142) $1,700 $0 $0¹ This position has received a 2% COLA in FY 17. Longevity (5143 $750 $0 $0² This position was reclassified in FY 16 Local 25 Clerical contract. Clothing Allowance (5193) $1,500 $700 $700³ This position was reclassified in the FY16 Local 25 DPW contract from W3U to W4U.⁴ This position going from 30 hours to 35 hours in FY17. Personnel Total: $512,981 $560,145 $560,145⁵ This position was budgeted at a higher amount in FY 16. FY 17 request based on actual.⁶ The FY 17 Local 25 Clerical salary was based on 2% increase for FY 15 and for FY 16. Also includes step increases.⁷ This position has been reclassified.⁸ Hours changed in FY 17 for this position.
262
Office of Gaming Accountability and Development
Mission Statement
To provide timely updates on progress, the addressing of concerns and issues and completion of necessary planning for the project and to provide updates to all interested stakeholders.
Significant Budget & Staffing Changes for FY 2016
This department was not funded in FY 17. The city had elected not to fill the vacant Director of Gaming Accountability & Development position. Costs have been absorbed by other departments such as Finance, City Solicitor and ISD.
263
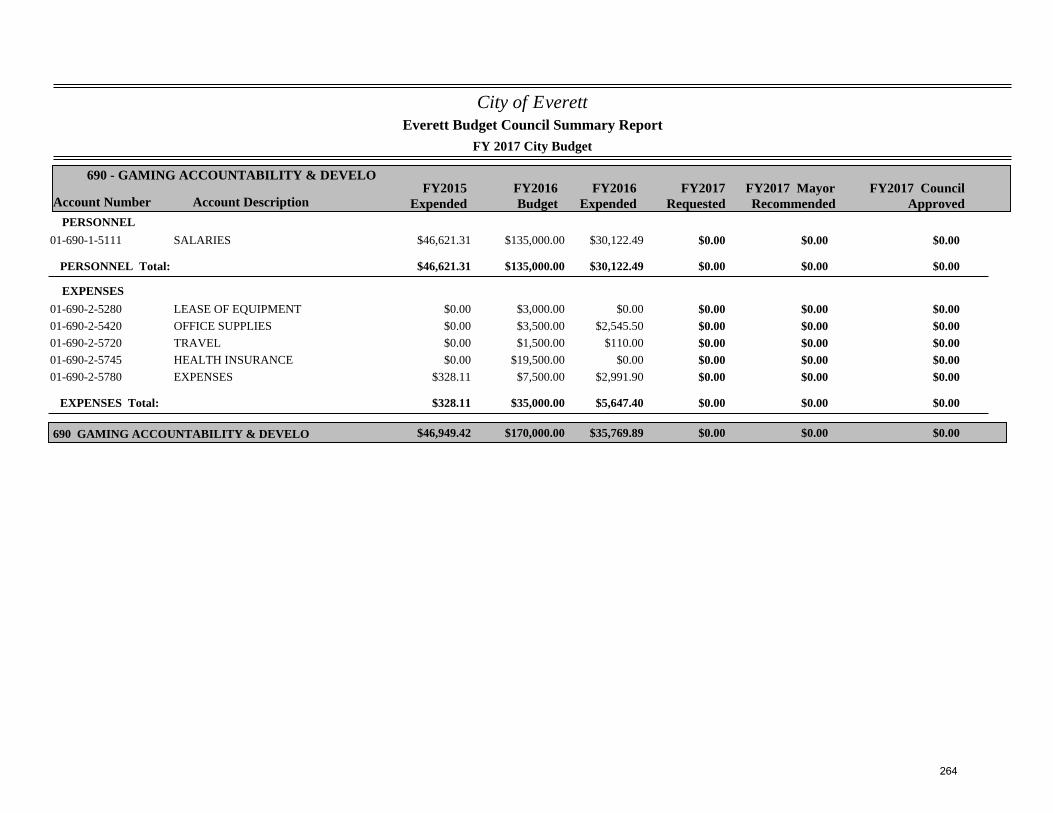
City of Everett
FY 2017 City Budget
Account Number Account DescriptionFY2015
ExpendedFY2016Budget
FY2017Requested
690 - GAMING ACCOUNTABILITY & DEVELO
Everett Budget Council Summary Report
FY2017 MayorRecommended
FY2016Expended
FY2017 CouncilApproved
PERSONNEL$46,621.31 $135,000.00 $0.0001-690-1-5111 SALARIES $30,122.49 $0.00 $0.00
PERSONNEL Total: $46,621.31 $135,000.00 $0.00$30,122.49 $0.00 $0.00
EXPENSES$0.00 $3,000.00 $0.0001-690-2-5280 LEASE OF EQUIPMENT $0.00 $0.00 $0.00$0.00 $3,500.00 $0.0001-690-2-5420 OFFICE SUPPLIES $2,545.50 $0.00 $0.00$0.00 $1,500.00 $0.0001-690-2-5720 TRAVEL $110.00 $0.00 $0.00$0.00 $19,500.00 $0.0001-690-2-5745 HEALTH INSURANCE $0.00 $0.00 $0.00
$328.11 $7,500.00 $0.0001-690-2-5780 EXPENSES $2,991.90 $0.00 $0.00
EXPENSES Total: $328.11 $35,000.00 $0.00$5,647.40 $0.00 $0.00
$46,949.42 $170,000.00 $0.00690 GAMING ACCOUNTABILITY & DEVELO $35,769.89 $0.00 $0.00
264
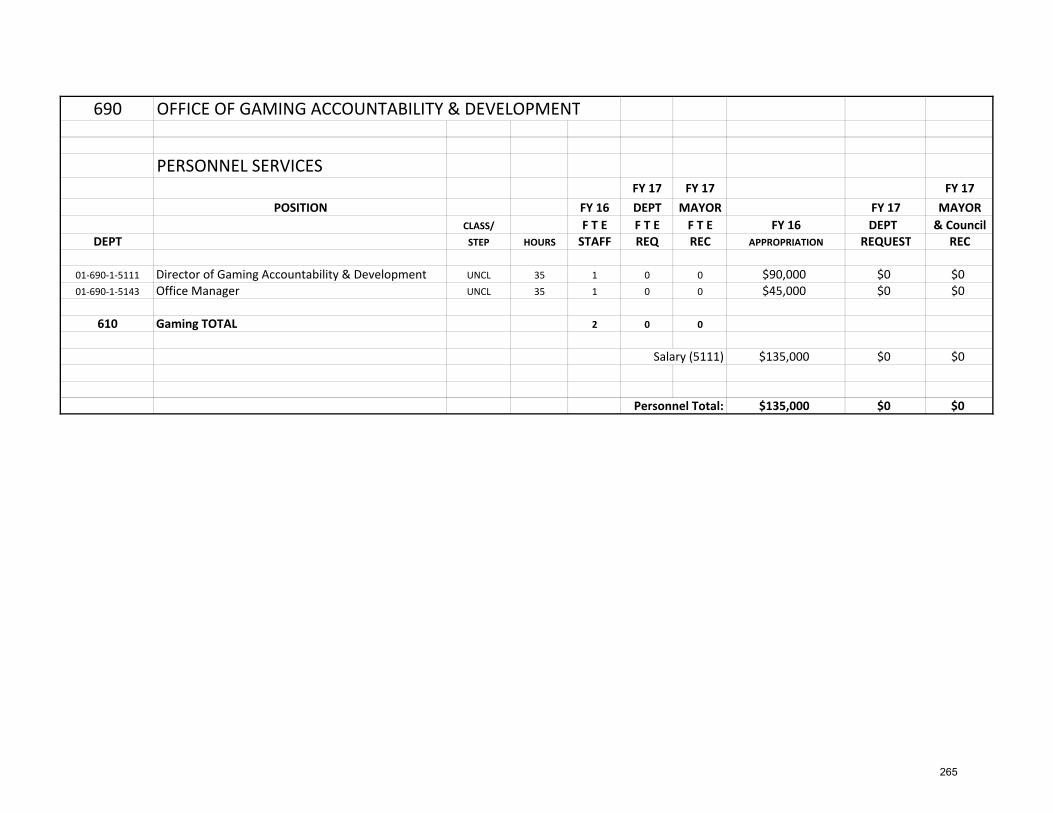
690 OFFICE OF GAMING ACCOUNTABILITY & DEVELOPMENT
PERSONNEL SERVICESFY 17 FY 17 FY 17
POSITION FY 16 DEPT MAYOR FY 17 MAYORCLASS/ F T E F T E F T E FY 16 DEPT & Council
DEPT STEP HOURS STAFF REQ REC APPROPRIATION REQUEST REC
01‐690‐1‐5111 Director of Gaming Accountability & Development UNCL 35 1 0 0 $90,000 $0 $001‐690‐1‐5143 Office Manager UNCL 35 1 0 0 $45,000 $0 $0
610 Gaming TOTAL 2 0 0
Salary (5111) $135,000 $0 $0
Personnel Total: $135,000 $0 $0
265
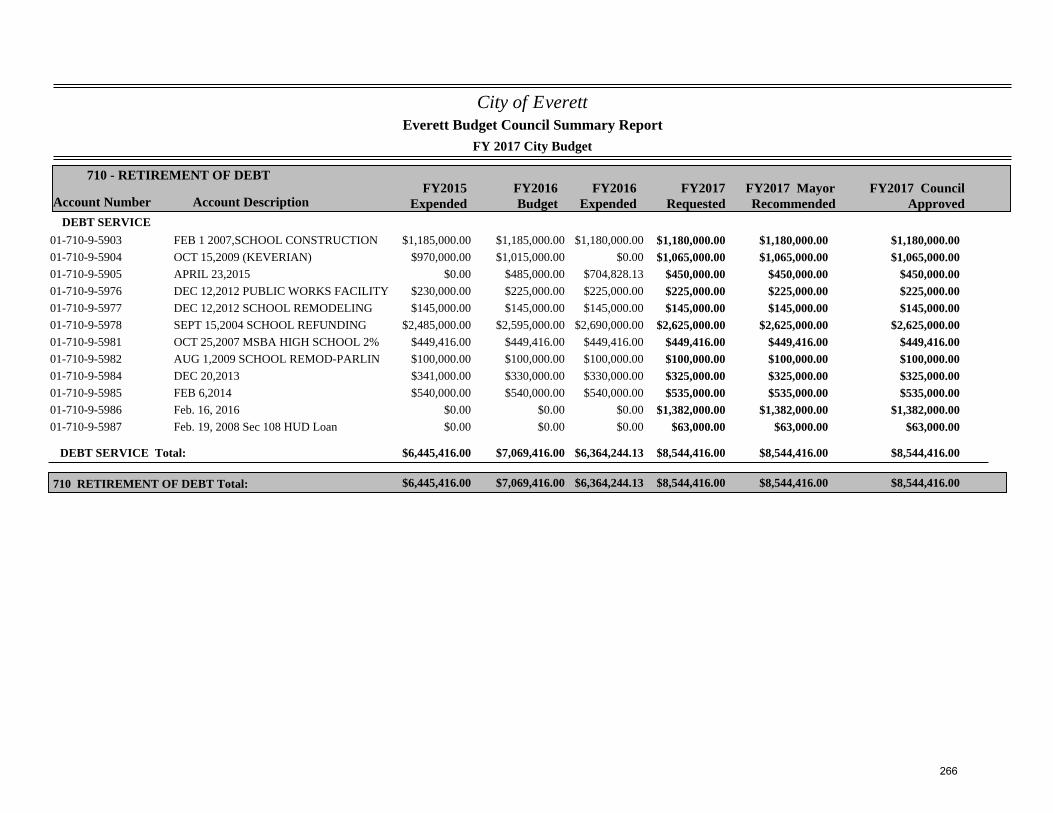
City of Everett
FY 2017 City Budget
Account Number Account DescriptionFY2015
ExpendedFY2016Budget
FY2017Requested
710 - RETIREMENT OF DEBT
Everett Budget Council Summary Report
FY2017 MayorRecommended
FY2016Expended
FY2017 CouncilApproved
DEBT SERVICE$1,185,000.00 $1,185,000.00 $1,180,000.0001-710-9-5903 FEB 1 2007,SCHOOL CONSTRUCTION $1,180,000.00 $1,180,000.00 $1,180,000.00
$970,000.00 $1,015,000.00 $1,065,000.0001-710-9-5904 OCT 15,2009 (KEVERIAN) $0.00 $1,065,000.00 $1,065,000.00$0.00 $485,000.00 $450,000.0001-710-9-5905 APRIL 23,2015 $704,828.13 $450,000.00 $450,000.00
$230,000.00 $225,000.00 $225,000.0001-710-9-5976 DEC 12,2012 PUBLIC WORKS FACILITY $225,000.00 $225,000.00 $225,000.00$145,000.00 $145,000.00 $145,000.0001-710-9-5977 DEC 12,2012 SCHOOL REMODELING $145,000.00 $145,000.00 $145,000.00
$2,485,000.00 $2,595,000.00 $2,625,000.0001-710-9-5978 SEPT 15,2004 SCHOOL REFUNDING $2,690,000.00 $2,625,000.00 $2,625,000.00$449,416.00 $449,416.00 $449,416.0001-710-9-5981 OCT 25,2007 MSBA HIGH SCHOOL 2% $449,416.00 $449,416.00 $449,416.00$100,000.00 $100,000.00 $100,000.0001-710-9-5982 AUG 1,2009 SCHOOL REMOD-PARLIN $100,000.00 $100,000.00 $100,000.00$341,000.00 $330,000.00 $325,000.0001-710-9-5984 DEC 20,2013 $330,000.00 $325,000.00 $325,000.00$540,000.00 $540,000.00 $535,000.0001-710-9-5985 FEB 6,2014 $540,000.00 $535,000.00 $535,000.00
$0.00 $0.00 $1,382,000.0001-710-9-5986 Feb. 16, 2016 $0.00 $1,382,000.00 $1,382,000.00$0.00 $0.00 $63,000.0001-710-9-5987 Feb. 19, 2008 Sec 108 HUD Loan $0.00 $63,000.00 $63,000.00
DEBT SERVICE Total: $6,445,416.00 $7,069,416.00 $8,544,416.00$6,364,244.13 $8,544,416.00 $8,544,416.00
$6,445,416.00 $7,069,416.00 $8,544,416.00710 RETIREMENT OF DEBT Total: $6,364,244.13 $8,544,416.00 $8,544,416.00
266
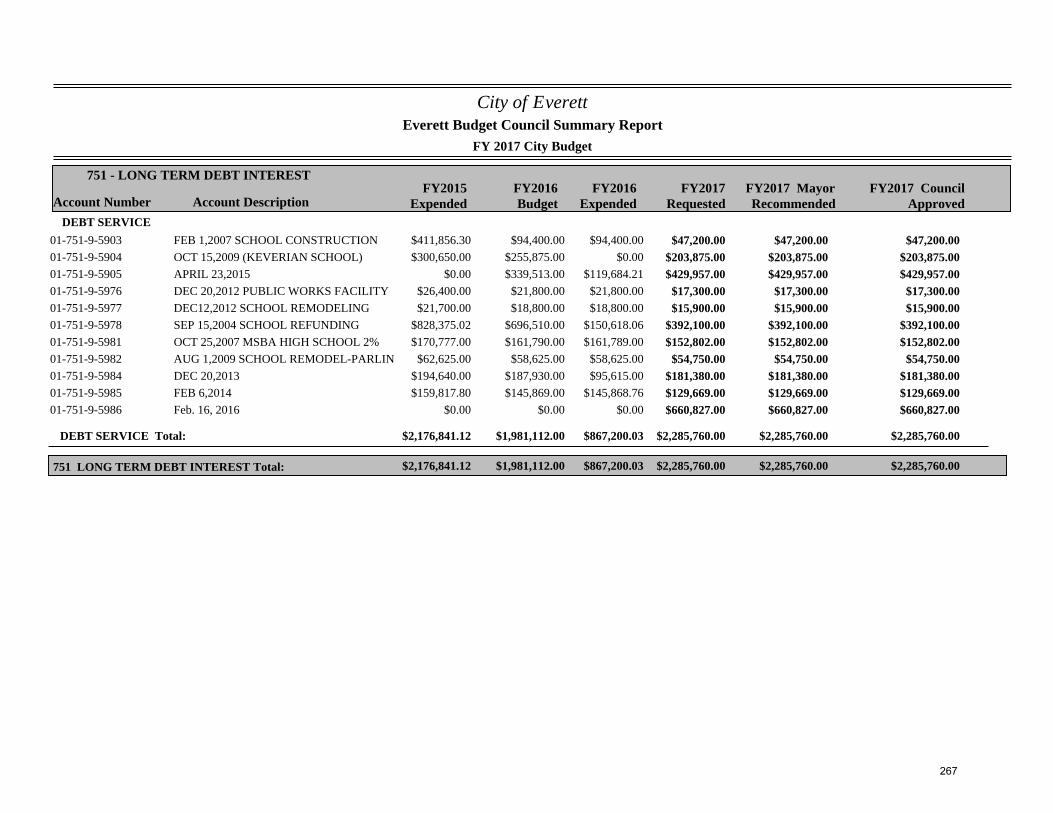
City of Everett
FY 2017 City Budget
Account Number Account DescriptionFY2015
ExpendedFY2016Budget
FY2017Requested
751 - LONG TERM DEBT INTEREST
Everett Budget Council Summary Report
FY2017 MayorRecommended
FY2016Expended
FY2017 CouncilApproved
DEBT SERVICE$411,856.30 $94,400.00 $47,200.0001-751-9-5903 FEB 1,2007 SCHOOL CONSTRUCTION $94,400.00 $47,200.00 $47,200.00$300,650.00 $255,875.00 $203,875.0001-751-9-5904 OCT 15,2009 (KEVERIAN SCHOOL) $0.00 $203,875.00 $203,875.00
$0.00 $339,513.00 $429,957.0001-751-9-5905 APRIL 23,2015 $119,684.21 $429,957.00 $429,957.00$26,400.00 $21,800.00 $17,300.0001-751-9-5976 DEC 20,2012 PUBLIC WORKS FACILITY $21,800.00 $17,300.00 $17,300.00$21,700.00 $18,800.00 $15,900.0001-751-9-5977 DEC12,2012 SCHOOL REMODELING $18,800.00 $15,900.00 $15,900.00
$828,375.02 $696,510.00 $392,100.0001-751-9-5978 SEP 15,2004 SCHOOL REFUNDING $150,618.06 $392,100.00 $392,100.00$170,777.00 $161,790.00 $152,802.0001-751-9-5981 OCT 25,2007 MSBA HIGH SCHOOL 2% $161,789.00 $152,802.00 $152,802.00
$62,625.00 $58,625.00 $54,750.0001-751-9-5982 AUG 1,2009 SCHOOL REMODEL-PARLIN $58,625.00 $54,750.00 $54,750.00$194,640.00 $187,930.00 $181,380.0001-751-9-5984 DEC 20,2013 $95,615.00 $181,380.00 $181,380.00$159,817.80 $145,869.00 $129,669.0001-751-9-5985 FEB 6,2014 $145,868.76 $129,669.00 $129,669.00
$0.00 $0.00 $660,827.0001-751-9-5986 Feb. 16, 2016 $0.00 $660,827.00 $660,827.00
DEBT SERVICE Total: $2,176,841.12 $1,981,112.00 $2,285,760.00$867,200.03 $2,285,760.00 $2,285,760.00
$2,176,841.12 $1,981,112.00 $2,285,760.00751 LONG TERM DEBT INTEREST Total: $867,200.03 $2,285,760.00 $2,285,760.00
267
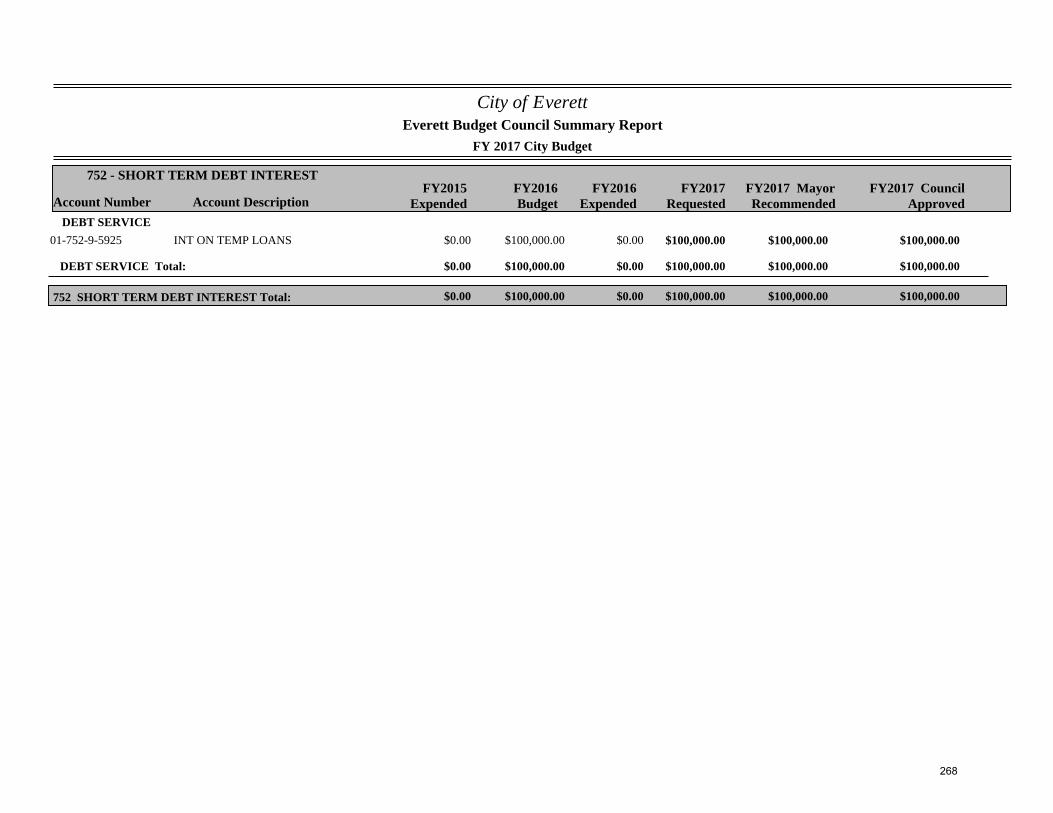
City of Everett
FY 2017 City Budget
Account Number Account DescriptionFY2015
ExpendedFY2016Budget
FY2017Requested
752 - SHORT TERM DEBT INTEREST
Everett Budget Council Summary Report
FY2017 MayorRecommended
FY2016Expended
FY2017 CouncilApproved
DEBT SERVICE$0.00 $100,000.00 $100,000.0001-752-9-5925 INT ON TEMP LOANS $0.00 $100,000.00 $100,000.00
DEBT SERVICE Total: $0.00 $100,000.00 $100,000.00$0.00 $100,000.00 $100,000.00
$0.00 $100,000.00 $100,000.00752 SHORT TERM DEBT INTEREST Total: $0.00 $100,000.00 $100,000.00
268
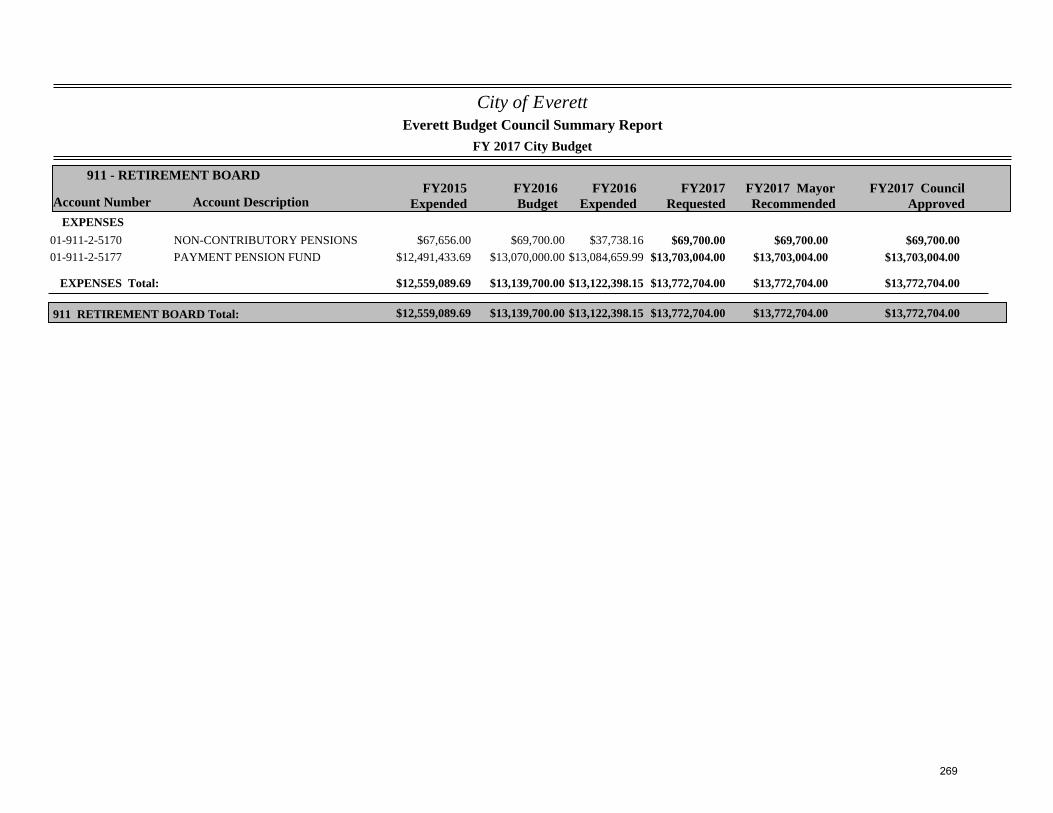
City of Everett
FY 2017 City Budget
Account Number Account DescriptionFY2015
ExpendedFY2016Budget
FY2017Requested
911 - RETIREMENT BOARD
Everett Budget Council Summary Report
FY2017 MayorRecommended
FY2016Expended
FY2017 CouncilApproved
EXPENSES$67,656.00 $69,700.00 $69,700.0001-911-2-5170 NON-CONTRIBUTORY PENSIONS $37,738.16 $69,700.00 $69,700.00
$12,491,433.69 $13,070,000.00 $13,703,004.0001-911-2-5177 PAYMENT PENSION FUND $13,084,659.99 $13,703,004.00 $13,703,004.00
EXPENSES Total: $12,559,089.69 $13,139,700.00 $13,772,704.00$13,122,398.15 $13,772,704.00 $13,772,704.00
$12,559,089.69 $13,139,700.00 $13,772,704.00911 RETIREMENT BOARD Total: $13,122,398.15 $13,772,704.00 $13,772,704.00
269
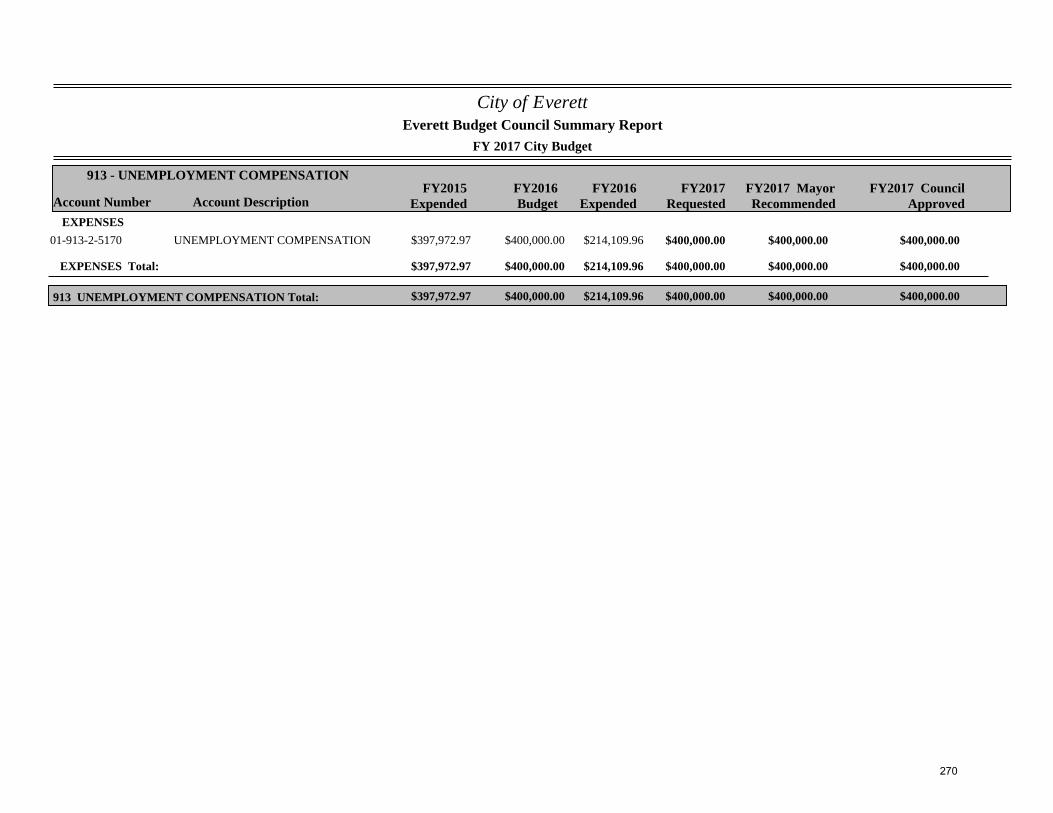
City of Everett
FY 2017 City Budget
Account Number Account DescriptionFY2015
ExpendedFY2016Budget
FY2017Requested
913 - UNEMPLOYMENT COMPENSATION
Everett Budget Council Summary Report
FY2017 MayorRecommended
FY2016Expended
FY2017 CouncilApproved
EXPENSES$397,972.97 $400,000.00 $400,000.0001-913-2-5170 UNEMPLOYMENT COMPENSATION $214,109.96 $400,000.00 $400,000.00
EXPENSES Total: $397,972.97 $400,000.00 $400,000.00$214,109.96 $400,000.00 $400,000.00
$397,972.97 $400,000.00 $400,000.00913 UNEMPLOYMENT COMPENSATION Total: $214,109.96 $400,000.00 $400,000.00
270
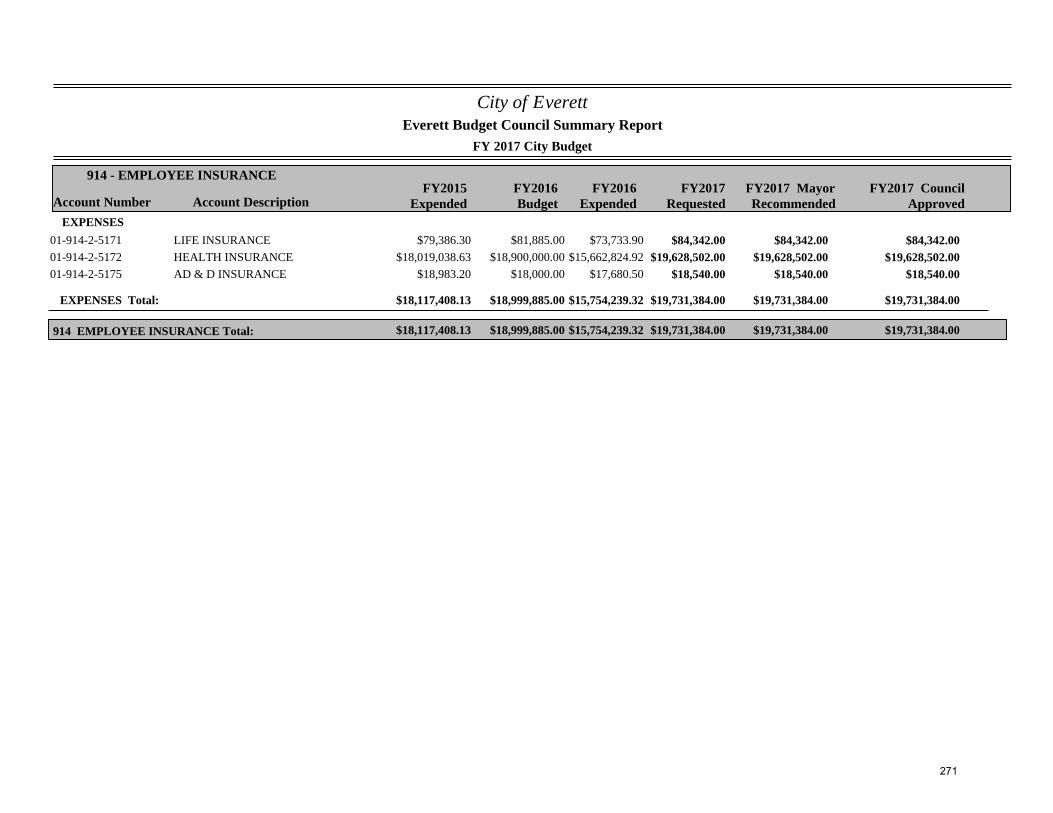
City of Everett
FY 2017 City Budget
Account Number Account DescriptionFY2015
ExpendedFY2016Budget
FY2017Requested
914 - EMPLOYEE INSURANCE
Everett Budget Council Summary Report
FY2017 MayorRecommended
FY2016Expended
FY2017 CouncilApproved
EXPENSES$79,386.30 $81,885.00 $84,342.0001-914-2-5171 LIFE INSURANCE $73,733.90 $84,342.00 $84,342.00
$18,019,038.63 $18,900,000.00 $19,628,502.0001-914-2-5172 HEALTH INSURANCE $15,662,824.92 $19,628,502.00 $19,628,502.00$18,983.20 $18,000.00 $18,540.0001-914-2-5175 AD & D INSURANCE $17,680.50 $18,540.00 $18,540.00
EXPENSES Total: $18,117,408.13 $18,999,885.00 $19,731,384.00$15,754,239.32 $19,731,384.00 $19,731,384.00
$18,117,408.13 $18,999,885.00 $19,731,384.00914 EMPLOYEE INSURANCE Total: $15,754,239.32 $19,731,384.00 $19,731,384.00
271
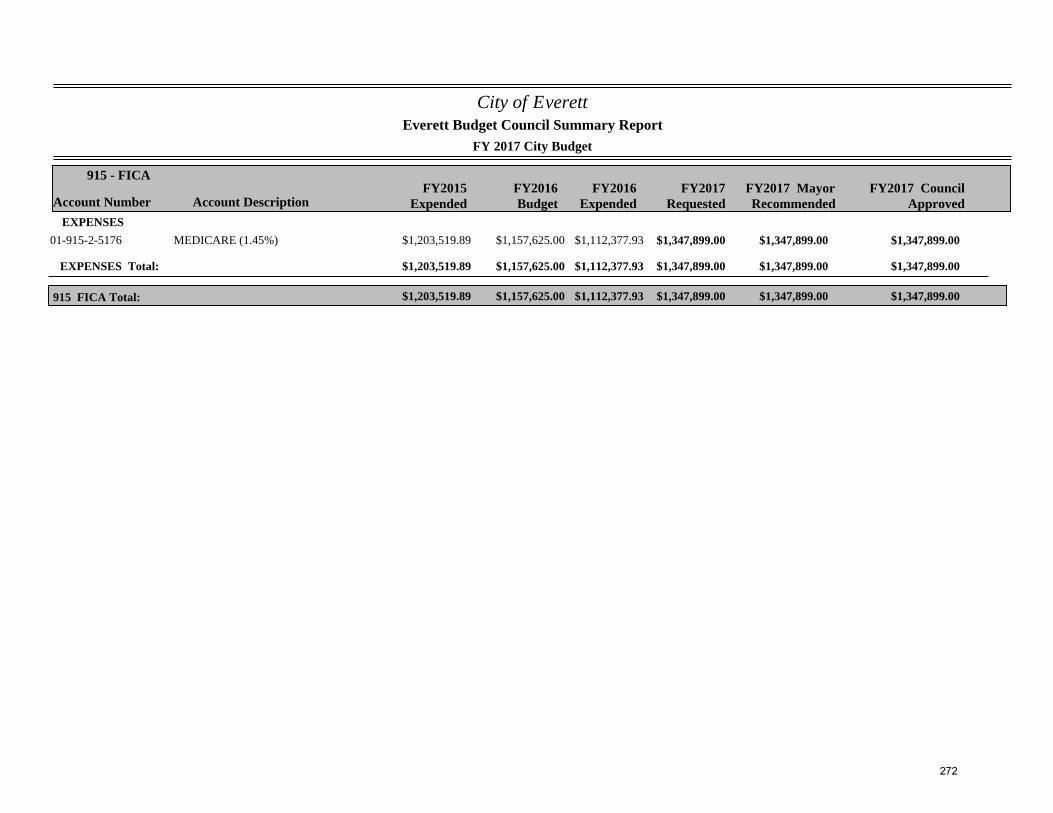
City of Everett
FY 2017 City Budget
Account Number Account DescriptionFY2015
ExpendedFY2016Budget
FY2017Requested
915 - FICA
Everett Budget Council Summary Report
FY2017 MayorRecommended
FY2016Expended
FY2017 CouncilApproved
EXPENSES$1,203,519.89 $1,157,625.00 $1,347,899.0001-915-2-5176 MEDICARE (1.45%) $1,112,377.93 $1,347,899.00 $1,347,899.00
EXPENSES Total: $1,203,519.89 $1,157,625.00 $1,347,899.00$1,112,377.93 $1,347,899.00 $1,347,899.00
$1,203,519.89 $1,157,625.00 $1,347,899.00915 FICA Total: $1,112,377.93 $1,347,899.00 $1,347,899.00
272
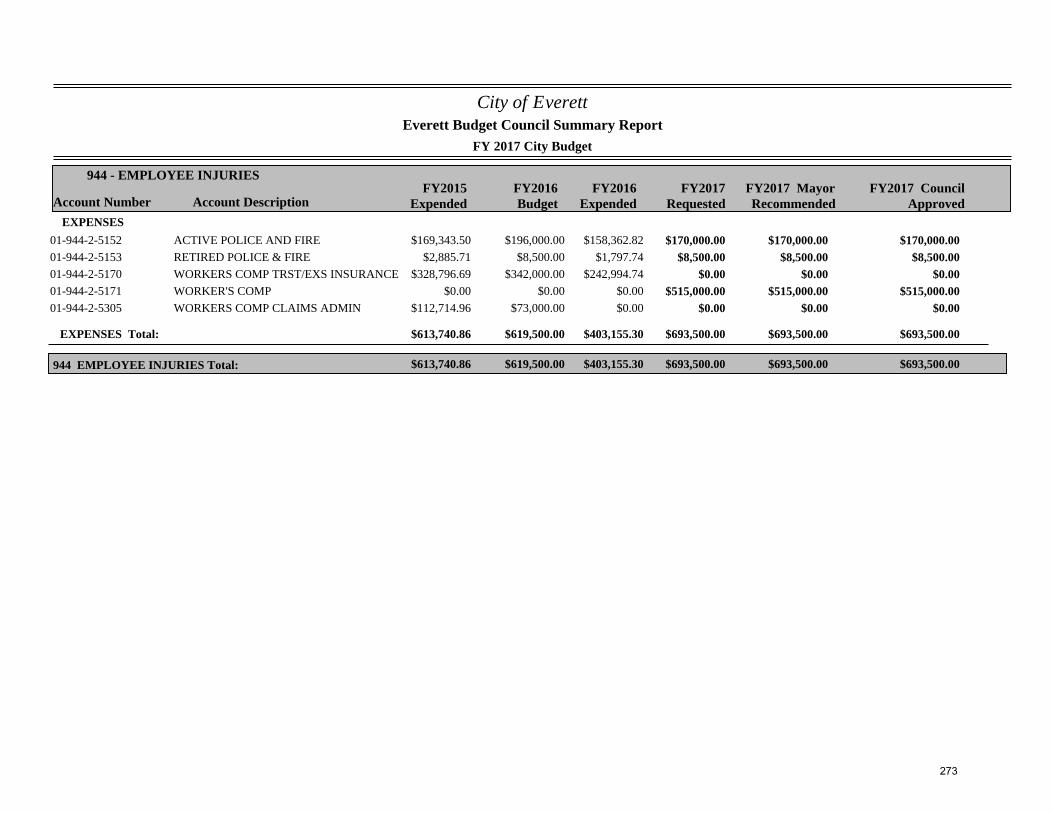
City of Everett
FY 2017 City Budget
Account Number Account DescriptionFY2015
ExpendedFY2016Budget
FY2017Requested
944 - EMPLOYEE INJURIES
Everett Budget Council Summary Report
FY2017 MayorRecommended
FY2016Expended
FY2017 CouncilApproved
EXPENSES$169,343.50 $196,000.00 $170,000.0001-944-2-5152 ACTIVE POLICE AND FIRE $158,362.82 $170,000.00 $170,000.00
$2,885.71 $8,500.00 $8,500.0001-944-2-5153 RETIRED POLICE & FIRE $1,797.74 $8,500.00 $8,500.00$328,796.69 $342,000.00 $0.0001-944-2-5170 WORKERS COMP TRST/EXS INSURANCE $242,994.74 $0.00 $0.00
$0.00 $0.00 $515,000.0001-944-2-5171 WORKER'S COMP $0.00 $515,000.00 $515,000.00$112,714.96 $73,000.00 $0.0001-944-2-5305 WORKERS COMP CLAIMS ADMIN $0.00 $0.00 $0.00
EXPENSES Total: $613,740.86 $619,500.00 $693,500.00$403,155.30 $693,500.00 $693,500.00
$613,740.86 $619,500.00 $693,500.00944 EMPLOYEE INJURIES Total: $403,155.30 $693,500.00 $693,500.00
273
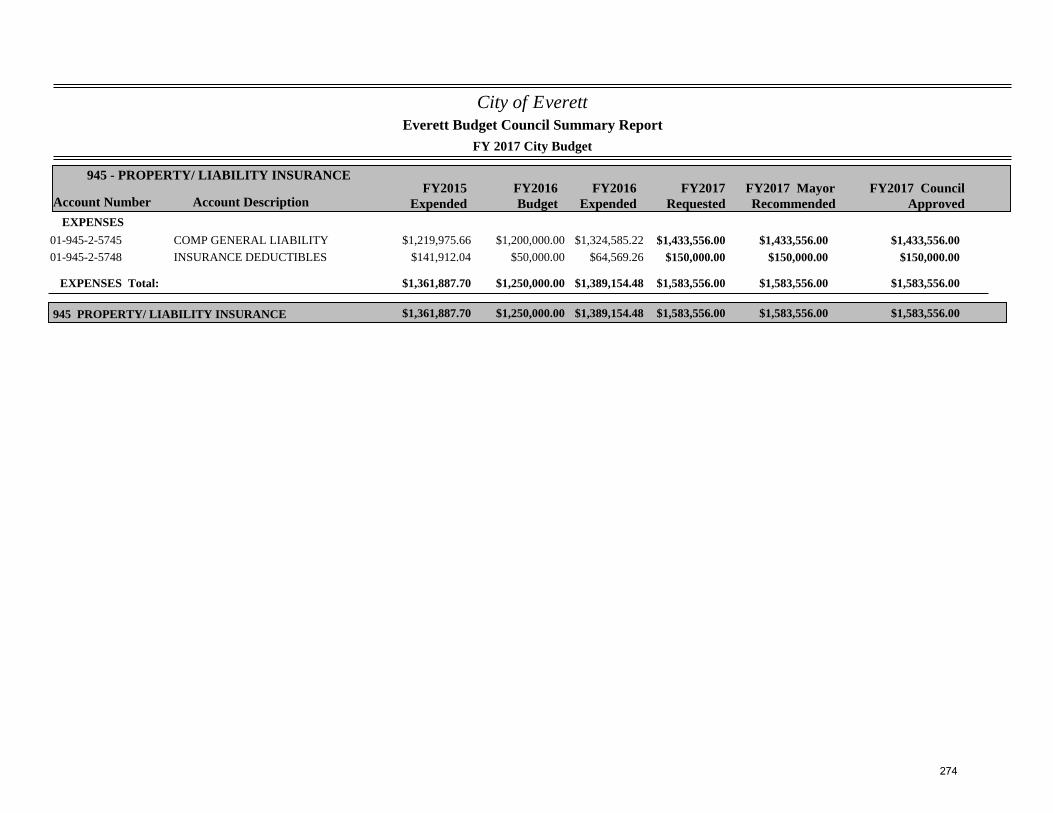
City of Everett
FY 2017 City Budget
Account Number Account DescriptionFY2015
ExpendedFY2016Budget
FY2017Requested
945 - PROPERTY/ LIABILITY INSURANCE
Everett Budget Council Summary Report
FY2017 MayorRecommended
FY2016Expended
FY2017 CouncilApproved
EXPENSES$1,219,975.66 $1,200,000.00 $1,433,556.0001-945-2-5745 COMP GENERAL LIABILITY $1,324,585.22 $1,433,556.00 $1,433,556.00
$141,912.04 $50,000.00 $150,000.0001-945-2-5748 INSURANCE DEDUCTIBLES $64,569.26 $150,000.00 $150,000.00
EXPENSES Total: $1,361,887.70 $1,250,000.00 $1,583,556.00$1,389,154.48 $1,583,556.00 $1,583,556.00
$1,361,887.70 $1,250,000.00 $1,583,556.00945 PROPERTY/ LIABILITY INSURANCE $1,389,154.48 $1,583,556.00 $1,583,556.00
274
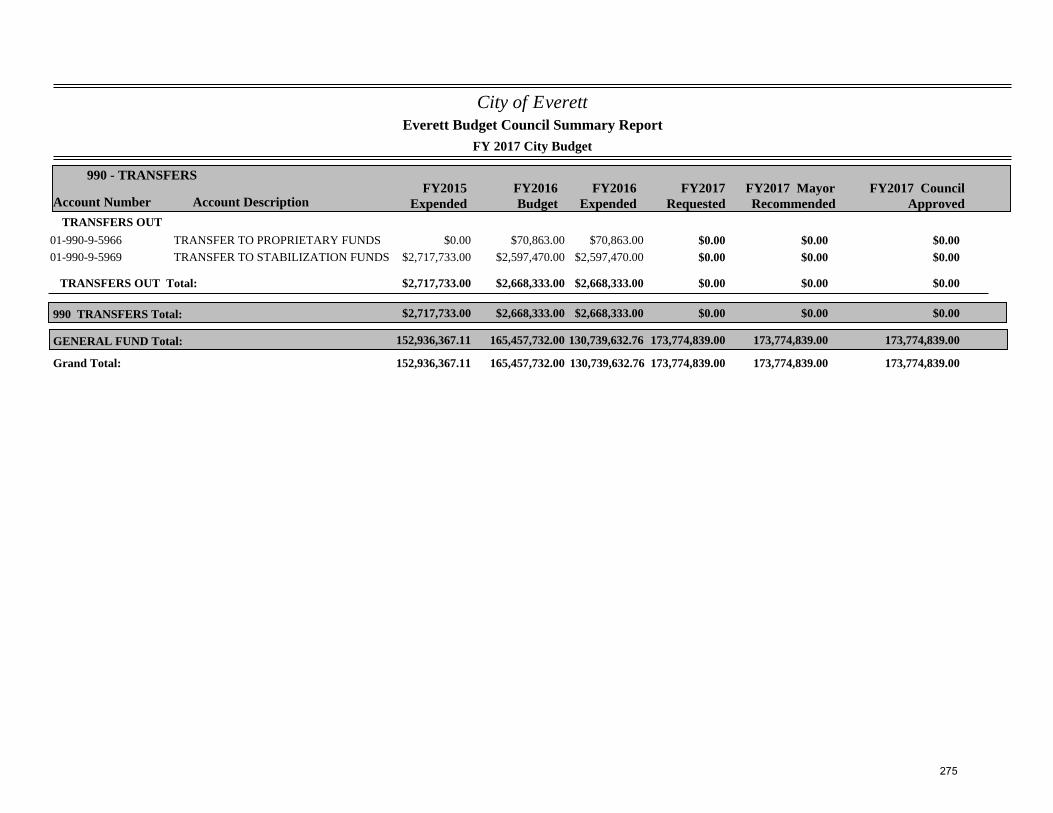
City of Everett
FY 2017 City Budget
Account Number Account DescriptionFY2015
ExpendedFY2016Budget
FY2017Requested
990 - TRANSFERS
Everett Budget Council Summary Report
FY2017 MayorRecommended
FY2016Expended
FY2017 CouncilApproved
TRANSFERS OUT$0.00 $70,863.00 $0.0001-990-9-5966 TRANSFER TO PROPRIETARY FUNDS $70,863.00 $0.00 $0.00
$2,717,733.00 $2,597,470.00 $0.0001-990-9-5969 TRANSFER TO STABILIZATION FUNDS $2,597,470.00 $0.00 $0.00
TRANSFERS OUT Total: $2,717,733.00 $2,668,333.00 $0.00$2,668,333.00 $0.00 $0.00
$2,717,733.00 $2,668,333.00 $0.00990 TRANSFERS Total: $2,668,333.00 $0.00 $0.00
152,936,367.11 165,457,732.00 173,774,839.00GENERAL FUND Total: 130,739,632.76 173,774,839.00 173,774,839.00
152,936,367.11 165,457,732.00 130,739,632.76 173,774,839.00Grand Total: 173,774,839.00 173,774,839.00
275
Water & Sewer Enterprise Fund
Mission Statement
To provide water and sewer billing services, products and support to residents. To maintain a safe and effective water distribution system and sewer infrastructure.
Significant Budget & Staffing Changes for FY 2017
% increase due to: The Storm Water Coordinator left the City in FY 16. We have elected not to fill this position in the FY 17 budget. Also, the Clerk in the office went from part‐time in FY 16 to full‐time in FY 17 due to working on the lead project for the Superintendent. Both the Foreman positions were reclassified during FY 16 due to an increase in responsibilities. Most salaries increased by 2%.
Equipment Hire was decreased due to the city’s purchase of a few items that are regularly used, thus cutting the need for rental. Telecommunications is for the iPads that are used for the software needed for asset management. This is for valves, hydrants, etc. The Sewer Line Cleaning account was decreased in FY 16 to help offset the Storm Water account. It shows as a large increase in FY 17 funding, but it is actually level‐funded. Pipes, Fittings, Valves account is for stock kept on hand. Storm Water Expenses account (used for cleaning catch basins) was supplemented during FY 16 from a transfer from Sewer Line Cleaning. The DEP requested this work be done. The amount requested for FY 17 is what is expected for this account.
276
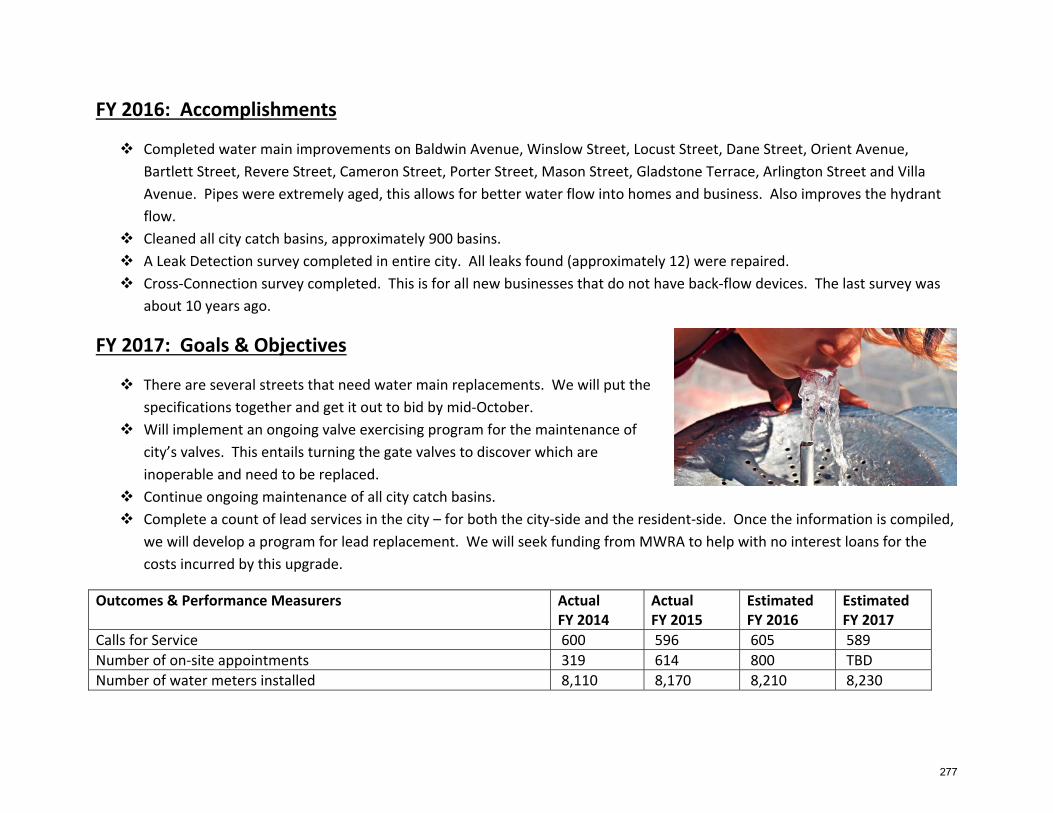
FY 2016: Accomplishments
Completed water main improvements on Baldwin Avenue, Winslow Street, Locust Street, Dane Street, Orient Avenue, Bartlett Street, Revere Street, Cameron Street, Porter Street, Mason Street, Gladstone Terrace, Arlington Street and Villa Avenue. Pipes were extremely aged, this allows for better water flow into homes and business. Also improves the hydrant flow.
Cleaned all city catch basins, approximately 900 basins. A Leak Detection survey completed in entire city. All leaks found (approximately 12) were repaired. Cross‐Connection survey completed. This is for all new businesses that do not have back‐flow devices. The last survey was
about 10 years ago.
FY 2017: Goals & Objectives
There are several streets that need water main replacements. We will put the specifications together and get it out to bid by mid‐October.
Will implement an ongoing valve exercising program for the maintenance of city’s valves. This entails turning the gate valves to discover which are inoperable and need to be replaced.
Continue ongoing maintenance of all city catch basins. Complete a count of lead services in the city – for both the city‐side and the resident‐side. Once the information is compiled,
we will develop a program for lead replacement. We will seek funding from MWRA to help with no interest loans for the costs incurred by this upgrade.
Outcomes & Performance Measurers Actual FY 2014
Actual FY 2015
Estimated FY 2016
Estimated FY 2017
Calls for Service 600 596 605 589 Number of on‐site appointments 319 614 800 TBD Number of water meters installed 8,110 8,170 8,210 8,230
277
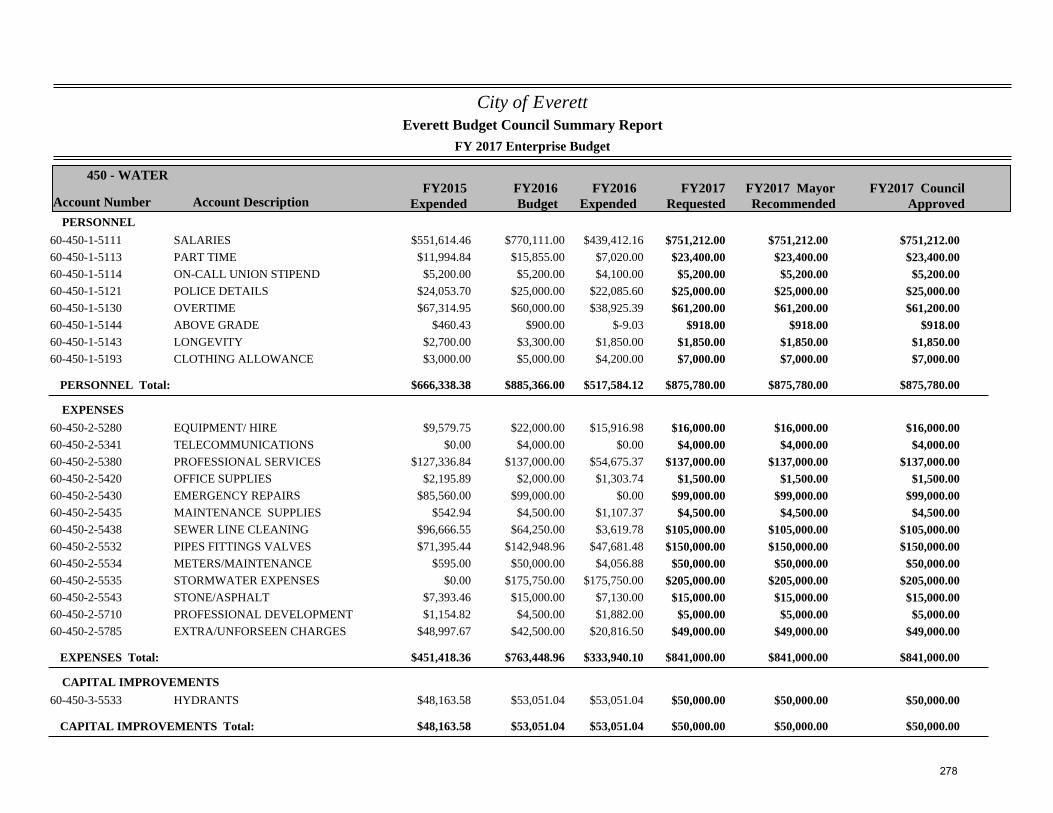
City of Everett
FY 2017 Enterprise Budget
Account Number Account DescriptionFY2015
ExpendedFY2016Budget
FY2017Requested
450 - WATER
Everett Budget Council Summary Report
FY2017 MayorRecommended
FY2016Expended
FY2017 CouncilApproved
PERSONNEL$551,614.46 $770,111.00 $751,212.0060-450-1-5111 SALARIES $439,412.16 $751,212.00 $751,212.00
$11,994.84 $15,855.00 $23,400.0060-450-1-5113 PART TIME $7,020.00 $23,400.00 $23,400.00$5,200.00 $5,200.00 $5,200.0060-450-1-5114 ON-CALL UNION STIPEND $4,100.00 $5,200.00 $5,200.00
$24,053.70 $25,000.00 $25,000.0060-450-1-5121 POLICE DETAILS $22,085.60 $25,000.00 $25,000.00$67,314.95 $60,000.00 $61,200.0060-450-1-5130 OVERTIME $38,925.39 $61,200.00 $61,200.00
$460.43 $900.00 $918.0060-450-1-5144 ABOVE GRADE $-9.03 $918.00 $918.00$2,700.00 $3,300.00 $1,850.0060-450-1-5143 LONGEVITY $1,850.00 $1,850.00 $1,850.00$3,000.00 $5,000.00 $7,000.0060-450-1-5193 CLOTHING ALLOWANCE $4,200.00 $7,000.00 $7,000.00
PERSONNEL Total: $666,338.38 $885,366.00 $875,780.00$517,584.12 $875,780.00 $875,780.00
EXPENSES$9,579.75 $22,000.00 $16,000.0060-450-2-5280 EQUIPMENT/ HIRE $15,916.98 $16,000.00 $16,000.00
$0.00 $4,000.00 $4,000.0060-450-2-5341 TELECOMMUNICATIONS $0.00 $4,000.00 $4,000.00$127,336.84 $137,000.00 $137,000.0060-450-2-5380 PROFESSIONAL SERVICES $54,675.37 $137,000.00 $137,000.00
$2,195.89 $2,000.00 $1,500.0060-450-2-5420 OFFICE SUPPLIES $1,303.74 $1,500.00 $1,500.00$85,560.00 $99,000.00 $99,000.0060-450-2-5430 EMERGENCY REPAIRS $0.00 $99,000.00 $99,000.00
$542.94 $4,500.00 $4,500.0060-450-2-5435 MAINTENANCE SUPPLIES $1,107.37 $4,500.00 $4,500.00$96,666.55 $64,250.00 $105,000.0060-450-2-5438 SEWER LINE CLEANING $3,619.78 $105,000.00 $105,000.00$71,395.44 $142,948.96 $150,000.0060-450-2-5532 PIPES FITTINGS VALVES $47,681.48 $150,000.00 $150,000.00
$595.00 $50,000.00 $50,000.0060-450-2-5534 METERS/MAINTENANCE $4,056.88 $50,000.00 $50,000.00$0.00 $175,750.00 $205,000.0060-450-2-5535 STORMWATER EXPENSES $175,750.00 $205,000.00 $205,000.00
$7,393.46 $15,000.00 $15,000.0060-450-2-5543 STONE/ASPHALT $7,130.00 $15,000.00 $15,000.00$1,154.82 $4,500.00 $5,000.0060-450-2-5710 PROFESSIONAL DEVELOPMENT $1,882.00 $5,000.00 $5,000.00
$48,997.67 $42,500.00 $49,000.0060-450-2-5785 EXTRA/UNFORSEEN CHARGES $20,816.50 $49,000.00 $49,000.00
EXPENSES Total: $451,418.36 $763,448.96 $841,000.00$333,940.10 $841,000.00 $841,000.00
CAPITAL IMPROVEMENTS$48,163.58 $53,051.04 $50,000.0060-450-3-5533 HYDRANTS $53,051.04 $50,000.00 $50,000.00
CAPITAL IMPROVEMENTS Total: $48,163.58 $53,051.04 $50,000.00$53,051.04 $50,000.00 $50,000.00
278
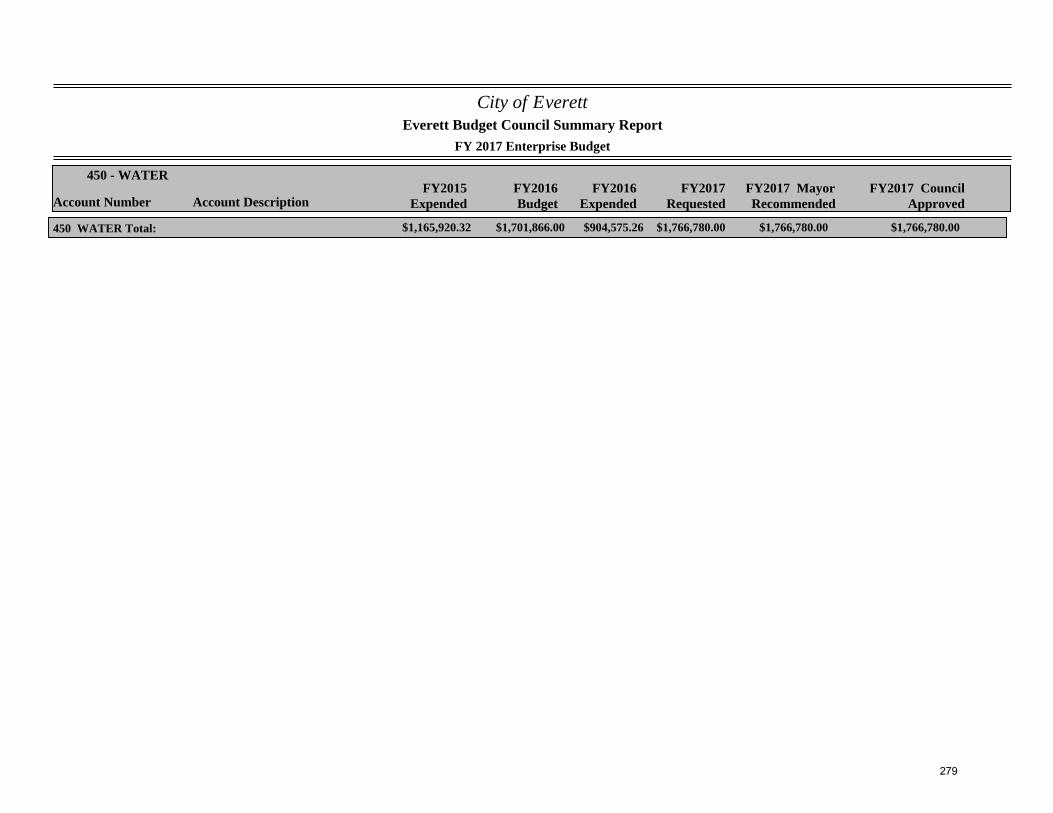
City of Everett
FY 2017 Enterprise Budget
Account Number Account DescriptionFY2015
ExpendedFY2016Budget
FY2017Requested
450 - WATER
Everett Budget Council Summary Report
FY2017 MayorRecommended
FY2016Expended
FY2017 CouncilApproved
$1,165,920.32 $1,701,866.00 $1,766,780.00450 WATER Total: $904,575.26 $1,766,780.00 $1,766,780.00
279
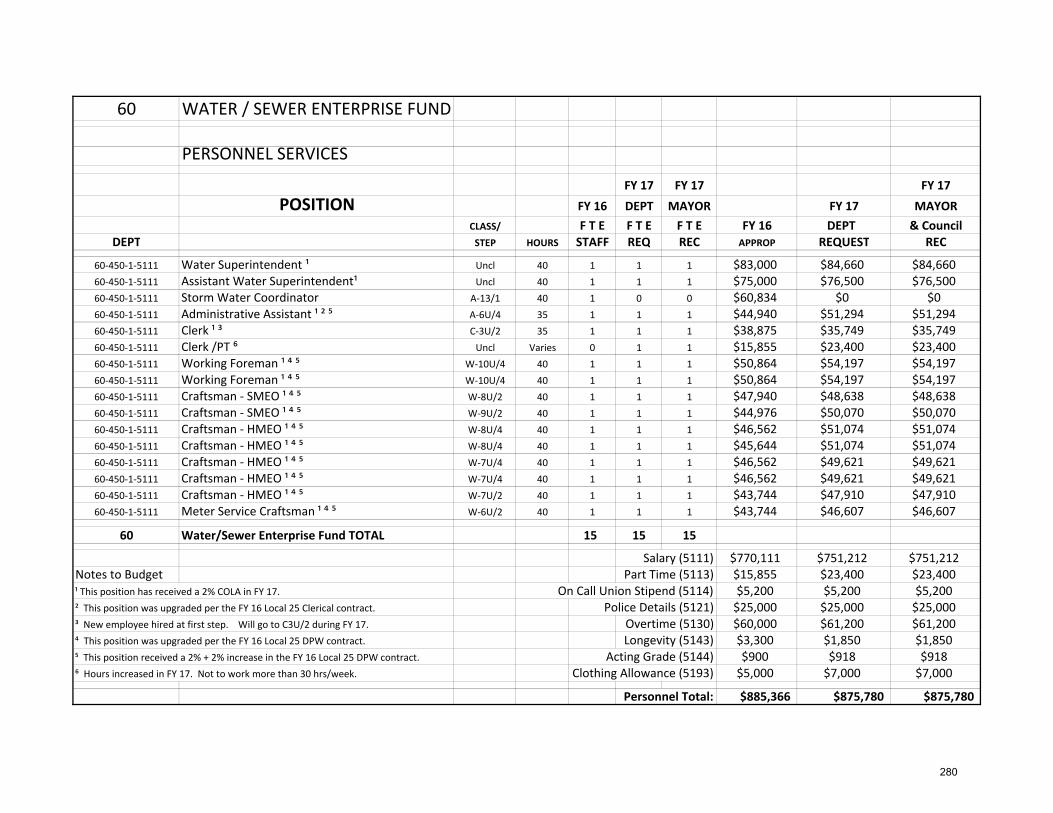
60 WATER / SEWER ENTERPRISE FUND
PERSONNEL SERVICES
FY 17 FY 17 FY 17
POSITION FY 16 DEPT MAYOR FY 17 MAYORCLASS/ F T E F T E F T E FY 16 DEPT & Council
DEPT STEP HOURS STAFF REQ REC APPROP REQUEST REC
60‐450‐1‐5111 Water Superintendent ¹ Uncl 40 1 1 1 $83,000 $84,660 $84,66060‐450‐1‐5111 Assistant Water Superintendent¹ Uncl 40 1 1 1 $75,000 $76,500 $76,50060‐450‐1‐5111 Storm Water Coordinator A‐13/1 40 1 0 0 $60,834 $0 $060‐450‐1‐5111 Administrative Assistant ¹ ² ⁵ A‐6U/4 35 1 1 1 $44,940 $51,294 $51,29460‐450‐1‐5111 Clerk ¹ ³ C‐3U/2 35 1 1 1 $38,875 $35,749 $35,74960‐450‐1‐5111 Clerk /PT ⁶ Uncl Varies 0 1 1 $15,855 $23,400 $23,40060‐450‐1‐5111 Working Foreman ¹ ⁴ ⁵ W‐10U/4 40 1 1 1 $50,864 $54,197 $54,19760‐450‐1‐5111 Working Foreman ¹ ⁴ ⁵ W‐10U/4 40 1 1 1 $50,864 $54,197 $54,19760‐450‐1‐5111 Craftsman ‐ SMEO ¹ ⁴ ⁵ W‐8U/2 40 1 1 1 $47,940 $48,638 $48,63860‐450‐1‐5111 Craftsman ‐ SMEO ¹ ⁴ ⁵ W‐9U/2 40 1 1 1 $44,976 $50,070 $50,07060‐450‐1‐5111 Craftsman ‐ HMEO ¹ ⁴ ⁵ W‐8U/4 40 1 1 1 $46,562 $51,074 $51,07460‐450‐1‐5111 Craftsman ‐ HMEO ¹ ⁴ ⁵ W‐8U/4 40 1 1 1 $45,644 $51,074 $51,07460‐450‐1‐5111 Craftsman ‐ HMEO ¹ ⁴ ⁵ W‐7U/4 40 1 1 1 $46,562 $49,621 $49,62160‐450‐1‐5111 Craftsman ‐ HMEO ¹ ⁴ ⁵ W‐7U/4 40 1 1 1 $46,562 $49,621 $49,62160‐450‐1‐5111 Craftsman ‐ HMEO ¹ ⁴ ⁵ W‐7U/2 40 1 1 1 $43,744 $47,910 $47,91060‐450‐1‐5111 Meter Service Craftsman ¹ ⁴ ⁵ W‐6U/2 40 1 1 1 $43,744 $46,607 $46,607
60 Water/Sewer Enterprise Fund TOTAL 15 15 15
Salary (5111) $770,111 $751,212 $751,212Notes to Budget Part Time (5113) $15,855 $23,400 $23,400¹ This position has received a 2% COLA in FY 17. On Call Union Stipend (5114) $5,200 $5,200 $5,200² This position was upgraded per the FY 16 Local 25 Clerical contract. Police Details (5121) $25,000 $25,000 $25,000³ New employee hired at first step. Will go to C3U/2 during FY 17. Overtime (5130) $60,000 $61,200 $61,200⁴ This position was upgraded per the FY 16 Local 25 DPW contract. Longevity (5143) $3,300 $1,850 $1,850⁵ This position received a 2% + 2% increase in the FY 16 Local 25 DPW contract. Acting Grade (5144) $900 $918 $918⁶ Hours increased in FY 17. Not to work more than 30 hrs/week. Clothing Allowance (5193) $5,000 $7,000 $7,000
Personnel Total: $885,366 $875,780 $875,780
280
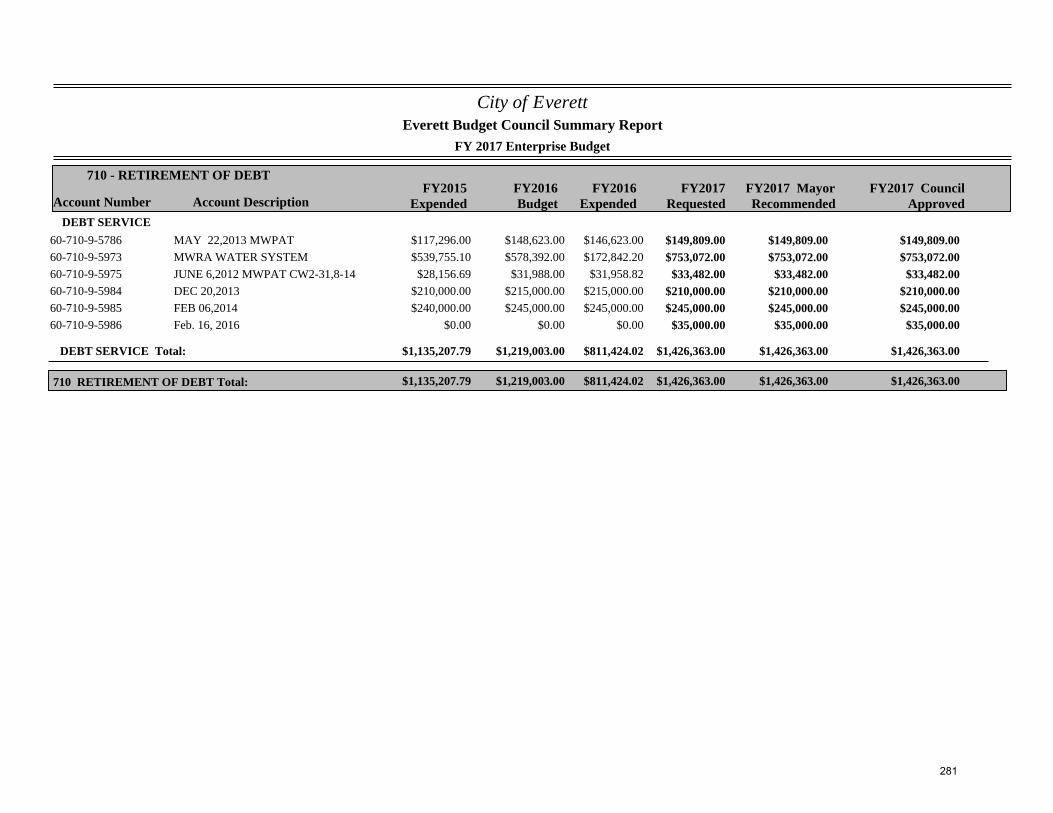
City of Everett
FY 2017 Enterprise Budget
Account Number Account DescriptionFY2015
ExpendedFY2016Budget
FY2017Requested
710 - RETIREMENT OF DEBT
Everett Budget Council Summary Report
FY2017 MayorRecommended
FY2016Expended
FY2017 CouncilApproved
DEBT SERVICE$117,296.00 $148,623.00 $149,809.0060-710-9-5786 MAY 22,2013 MWPAT $146,623.00 $149,809.00 $149,809.00$539,755.10 $578,392.00 $753,072.0060-710-9-5973 MWRA WATER SYSTEM $172,842.20 $753,072.00 $753,072.00
$28,156.69 $31,988.00 $33,482.0060-710-9-5975 JUNE 6,2012 MWPAT CW2-31,8-14 $31,958.82 $33,482.00 $33,482.00$210,000.00 $215,000.00 $210,000.0060-710-9-5984 DEC 20,2013 $215,000.00 $210,000.00 $210,000.00$240,000.00 $245,000.00 $245,000.0060-710-9-5985 FEB 06,2014 $245,000.00 $245,000.00 $245,000.00
$0.00 $0.00 $35,000.0060-710-9-5986 Feb. 16, 2016 $0.00 $35,000.00 $35,000.00
DEBT SERVICE Total: $1,135,207.79 $1,219,003.00 $1,426,363.00$811,424.02 $1,426,363.00 $1,426,363.00
$1,135,207.79 $1,219,003.00 $1,426,363.00710 RETIREMENT OF DEBT Total: $811,424.02 $1,426,363.00 $1,426,363.00
281
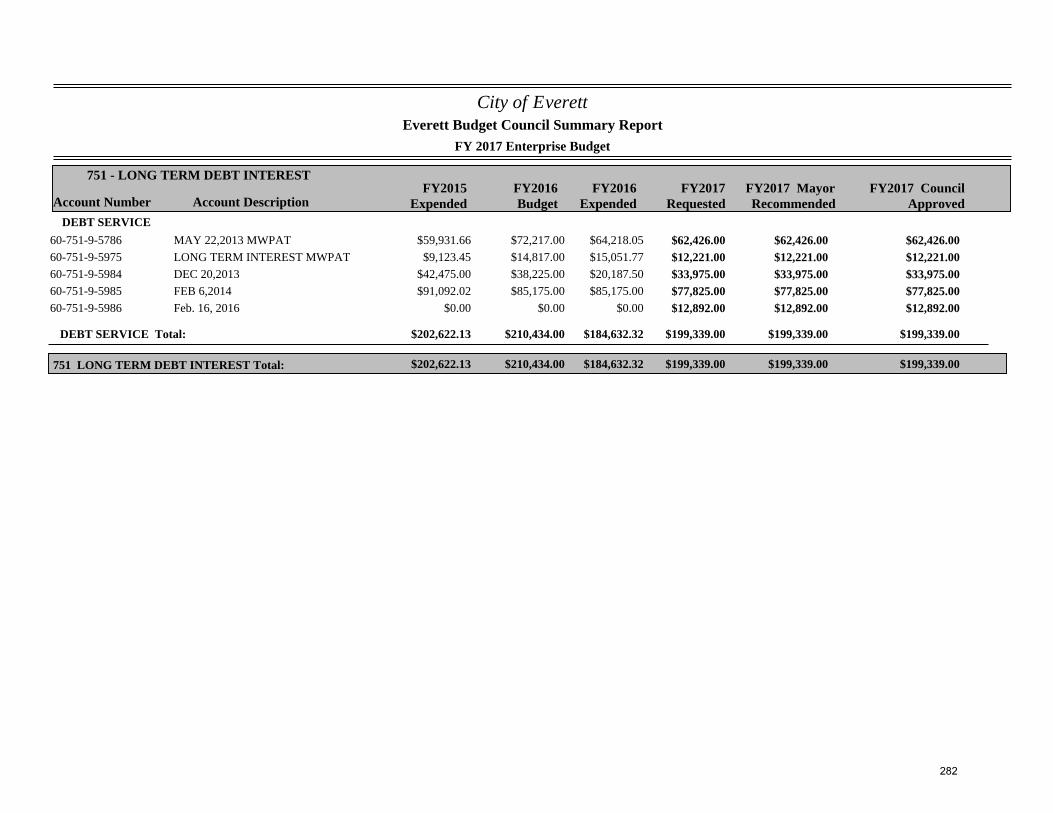
City of Everett
FY 2017 Enterprise Budget
Account Number Account DescriptionFY2015
ExpendedFY2016Budget
FY2017Requested
751 - LONG TERM DEBT INTEREST
Everett Budget Council Summary Report
FY2017 MayorRecommended
FY2016Expended
FY2017 CouncilApproved
DEBT SERVICE$59,931.66 $72,217.00 $62,426.0060-751-9-5786 MAY 22,2013 MWPAT $64,218.05 $62,426.00 $62,426.00$9,123.45 $14,817.00 $12,221.0060-751-9-5975 LONG TERM INTEREST MWPAT $15,051.77 $12,221.00 $12,221.00
$42,475.00 $38,225.00 $33,975.0060-751-9-5984 DEC 20,2013 $20,187.50 $33,975.00 $33,975.00$91,092.02 $85,175.00 $77,825.0060-751-9-5985 FEB 6,2014 $85,175.00 $77,825.00 $77,825.00
$0.00 $0.00 $12,892.0060-751-9-5986 Feb. 16, 2016 $0.00 $12,892.00 $12,892.00
DEBT SERVICE Total: $202,622.13 $210,434.00 $199,339.00$184,632.32 $199,339.00 $199,339.00
$202,622.13 $210,434.00 $199,339.00751 LONG TERM DEBT INTEREST Total: $184,632.32 $199,339.00 $199,339.00
282
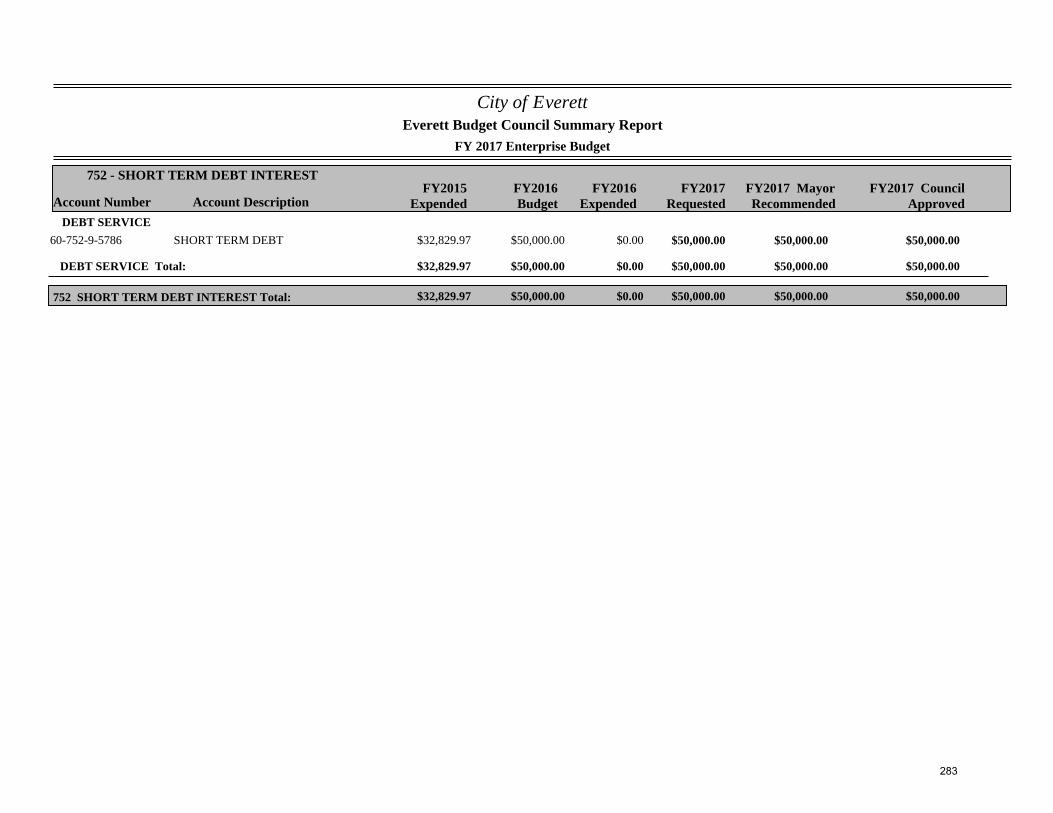
City of Everett
FY 2017 Enterprise Budget
Account Number Account DescriptionFY2015
ExpendedFY2016Budget
FY2017Requested
752 - SHORT TERM DEBT INTEREST
Everett Budget Council Summary Report
FY2017 MayorRecommended
FY2016Expended
FY2017 CouncilApproved
DEBT SERVICE$32,829.97 $50,000.00 $50,000.0060-752-9-5786 SHORT TERM DEBT $0.00 $50,000.00 $50,000.00
DEBT SERVICE Total: $32,829.97 $50,000.00 $50,000.00$0.00 $50,000.00 $50,000.00
$32,829.97 $50,000.00 $50,000.00752 SHORT TERM DEBT INTEREST Total: $0.00 $50,000.00 $50,000.00
283
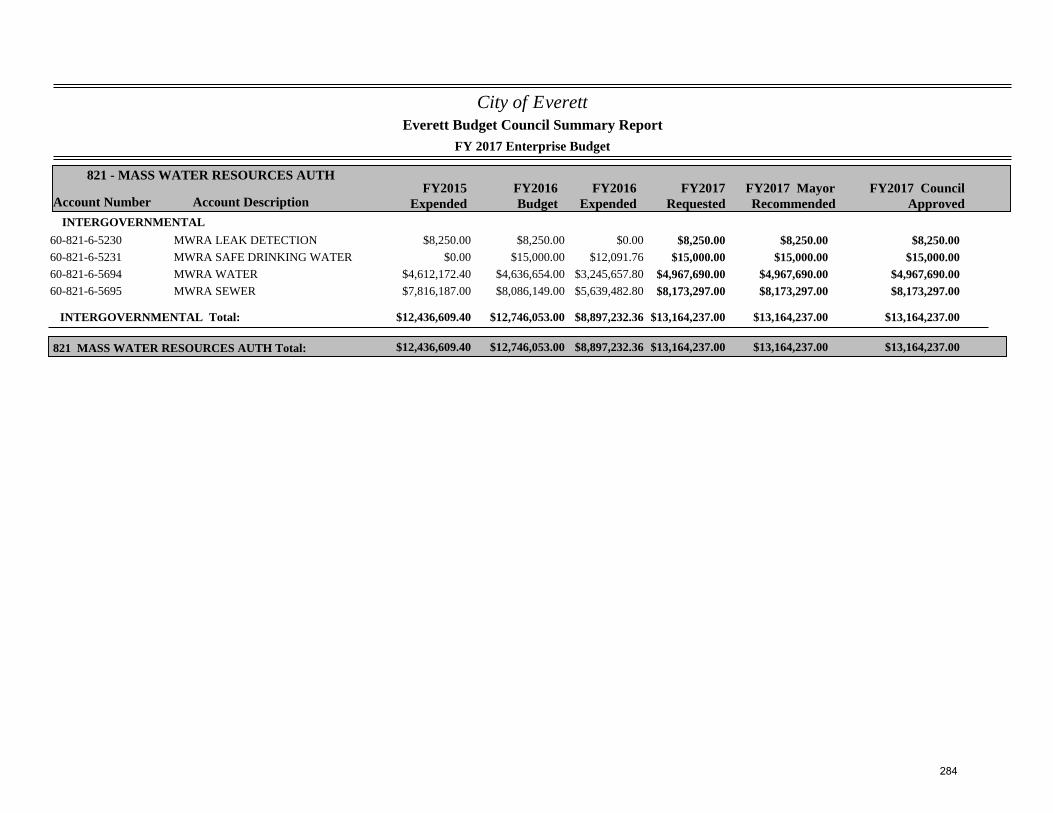
City of Everett
FY 2017 Enterprise Budget
Account Number Account DescriptionFY2015
ExpendedFY2016Budget
FY2017Requested
821 - MASS WATER RESOURCES AUTH
Everett Budget Council Summary Report
FY2017 MayorRecommended
FY2016Expended
FY2017 CouncilApproved
INTERGOVERNMENTAL$8,250.00 $8,250.00 $8,250.0060-821-6-5230 MWRA LEAK DETECTION $0.00 $8,250.00 $8,250.00
$0.00 $15,000.00 $15,000.0060-821-6-5231 MWRA SAFE DRINKING WATER $12,091.76 $15,000.00 $15,000.00$4,612,172.40 $4,636,654.00 $4,967,690.0060-821-6-5694 MWRA WATER $3,245,657.80 $4,967,690.00 $4,967,690.00$7,816,187.00 $8,086,149.00 $8,173,297.0060-821-6-5695 MWRA SEWER $5,639,482.80 $8,173,297.00 $8,173,297.00
INTERGOVERNMENTAL Total: $12,436,609.40 $12,746,053.00 $13,164,237.00$8,897,232.36 $13,164,237.00 $13,164,237.00
$12,436,609.40 $12,746,053.00 $13,164,237.00821 MASS WATER RESOURCES AUTH Total: $8,897,232.36 $13,164,237.00 $13,164,237.00
284
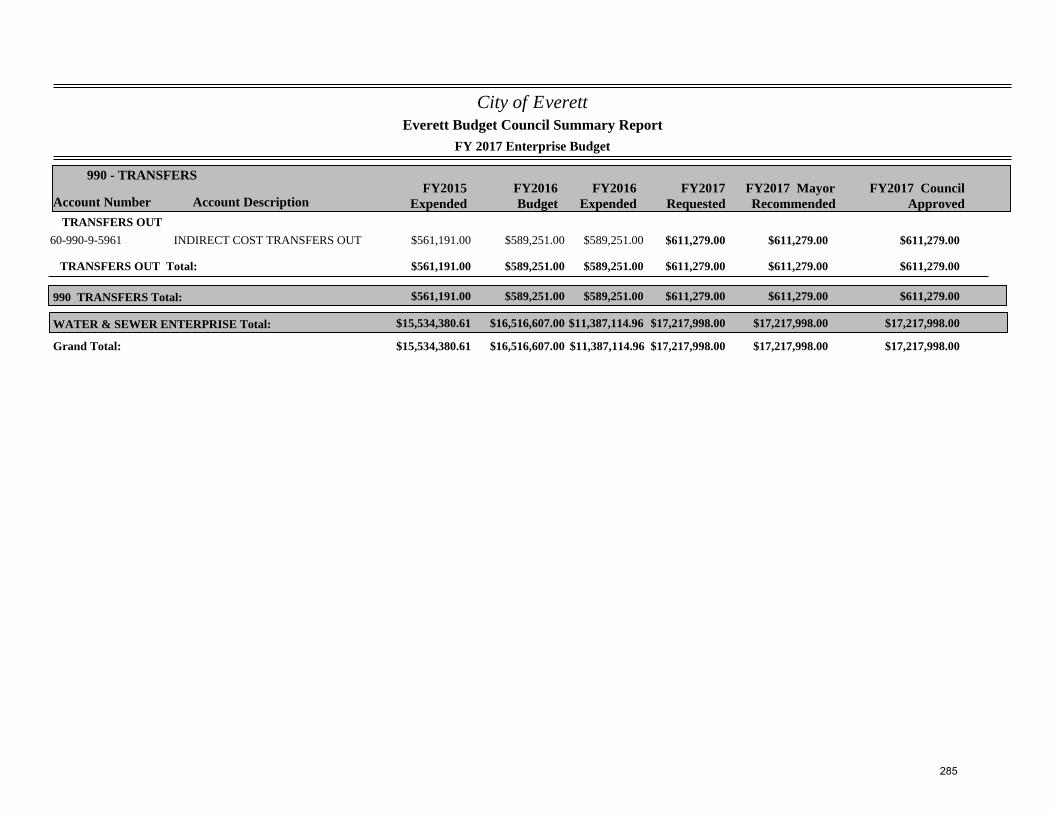
City of Everett
FY 2017 Enterprise Budget
Account Number Account DescriptionFY2015
ExpendedFY2016Budget
FY2017Requested
990 - TRANSFERS
Everett Budget Council Summary Report
FY2017 MayorRecommended
FY2016Expended
FY2017 CouncilApproved
TRANSFERS OUT$561,191.00 $589,251.00 $611,279.0060-990-9-5961 INDIRECT COST TRANSFERS OUT $589,251.00 $611,279.00 $611,279.00
TRANSFERS OUT Total: $561,191.00 $589,251.00 $611,279.00$589,251.00 $611,279.00 $611,279.00
$561,191.00 $589,251.00 $611,279.00990 TRANSFERS Total: $589,251.00 $611,279.00 $611,279.00
$15,534,380.61 $16,516,607.00 $17,217,998.00WATER & SEWER ENTERPRISE Total: $11,387,114.96 $17,217,998.00 $17,217,998.00
$15,534,380.61 $16,516,607.00 $11,387,114.96 $17,217,998.00Grand Total: $17,217,998.00 $17,217,998.00
285
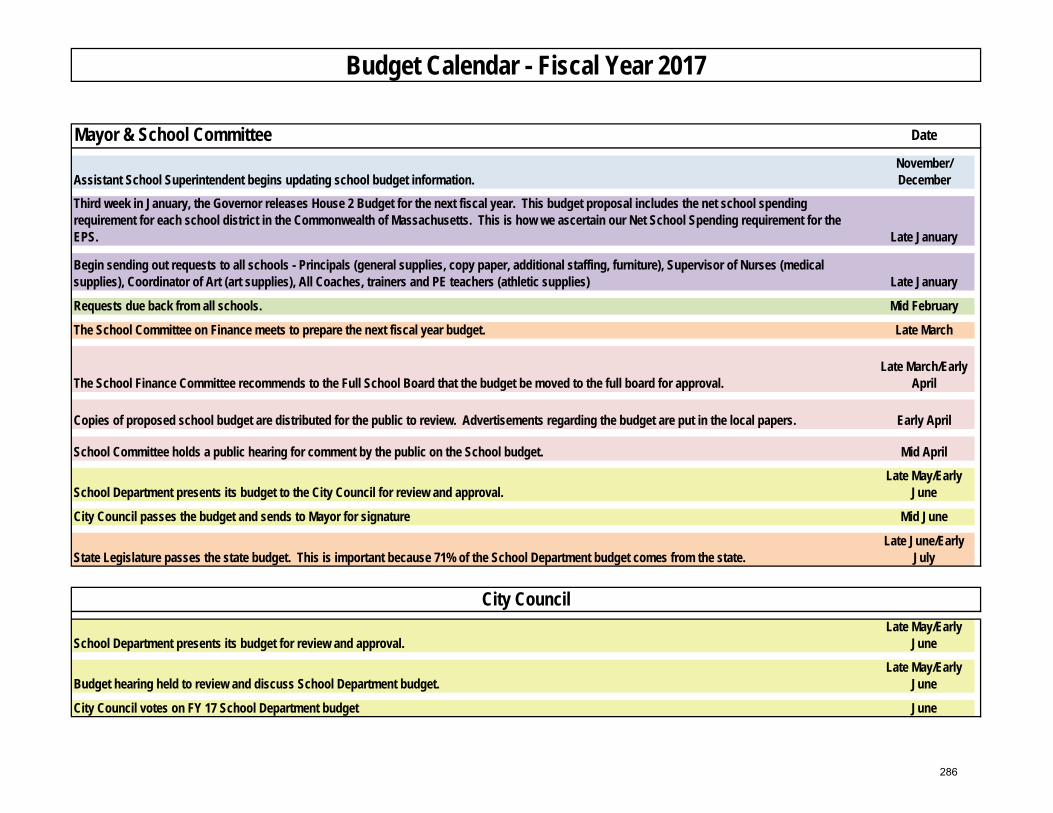
Mayor & School Committee Date
Assistant School Superintendent begins updating school budget information.November/ December
Third week in January, the Governor releases House 2 Budget for the next fiscal year. This budget proposal includes the net school spending requirement for each school district in the Commonwealth of Massachusetts. This is how we ascertain our Net School Spending requirement for the EPS. Late January
Begin sending out requests to all schools - Principals (general supplies, copy paper, additional staffing, furniture), Supervisor of Nurses (medical supplies), Coordinator of Art (art supplies), All Coaches, trainers and PE teachers (athletic supplies) Late January
Requests due back from all schools. Mid February
The School Committee on Finance meets to prepare the next fiscal year budget. Late March
The School Finance Committee recommends to the Full School Board that the budget be moved to the full board for approval.Late March/Early
April
Copies of proposed school budget are distributed for the public to review. Advertisements regarding the budget are put in the local papers. Early April
School Committee holds a public hearing for comment by the public on the School budget. Mid April
School Department presents its budget to the City Council for review and approval.Late May/Early
June
City Council passes the budget and sends to Mayor for signature Mid June
State Legislature passes the state budget. This is important because 71% of the School Department budget comes from the state.Late June/Early
July
School Department presents its budget for review and approval.Late May/Early
June
Budget hearing held to review and discuss School Department budget.Late May/Early
June
City Council votes on FY 17 School Department budget June
Budget Calendar - Fiscal Year 2017
City Council
286
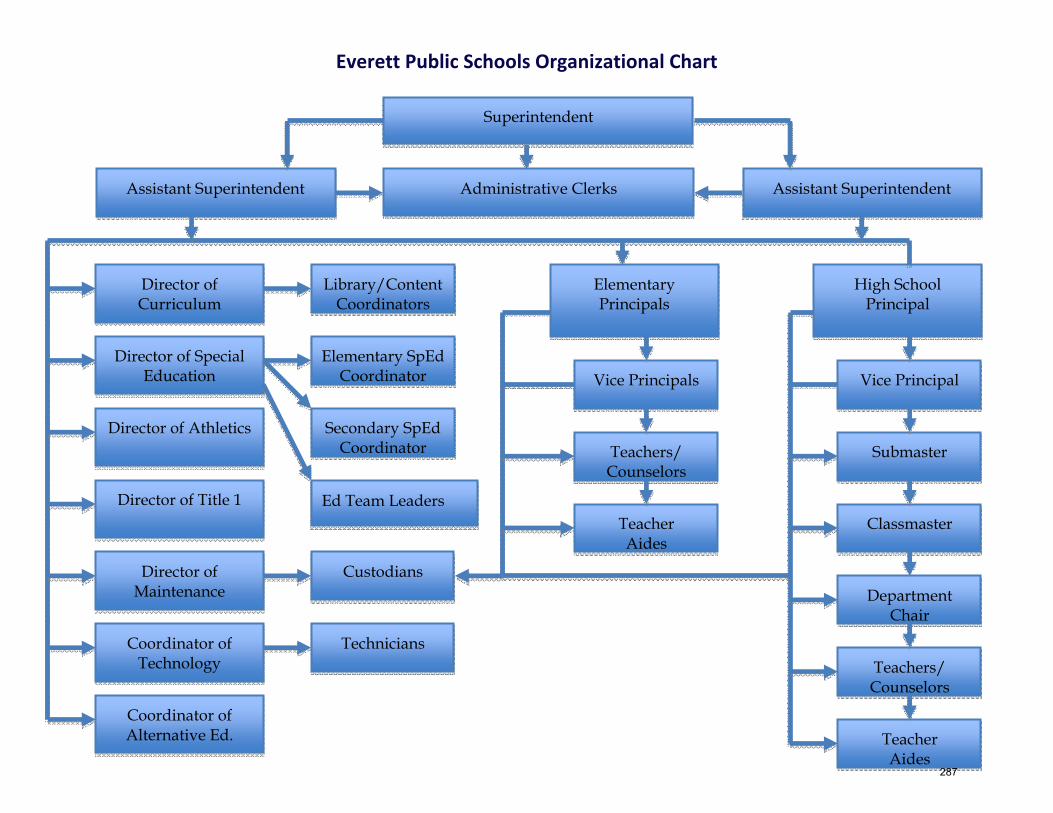
Everett Public Schools Organizational Chart
Assistant Superintendent Assistant Superintendent
Director of Athletics
Ed Team Leaders
Elementary SpEd Coordinator
Secondary SpEd Coordinator
Elementary Principals
High School Principal
Vice Principals Vice Principal
Submaster
Classmaster
Teachers/ Counselors
Custodians Department
Chair
Technicians
Director of Title 1
Director of Maintenance
Director of Curriculum
Director of Special Education
Library/Content Coordinators
Coordinator of Technology Teachers/
Counselors Coordinator of
Alternative Ed. Teacher Aides
Teacher Aides
Superintendent
Administrative Clerks
287
Everett Public Schools
Mission Statement
The Everett Public Schools provide a stimulating, integrated, educational environment for the intellectual, cultural, social, and physical growth of all children, while fostering the necessary concepts, attitudes and skills for further growth. This environment will encourage each student to develop the needed skills and sensitivity for living effectively and responsibly. It is the Everett Public Schools’ responsibility, in cooperation with the community, to provide the best possible education for all children. The schools will offer the opportunity for decision‐making, self actualization and continued personal development, while realizing that there are diverse capabilities in every human being. The local community will provide the necessary financial support and active participation in the education process to ensure the desired results so that students will receive 21st Century skills, ready for college and career.
288
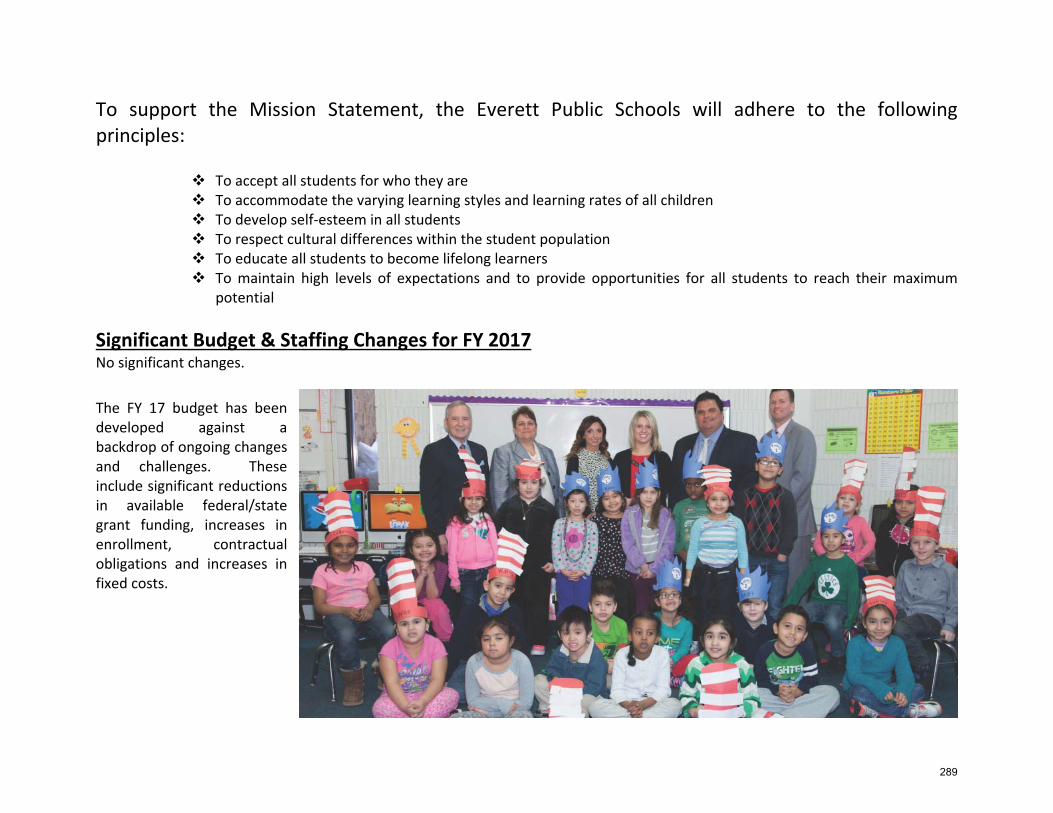
To support the Mission Statement, the Everett Public Schools will adhere to the following principles:
To accept all students for who they are To accommodate the varying learning styles and learning rates of all children To develop self‐esteem in all students To respect cultural differences within the student population To educate all students to become lifelong learners To maintain high levels of expectations and to provide opportunities for all students to reach their maximum
potential Significant Budget & Staffing Changes for FY 2017 No significant changes. The FY 17 budget has been developed against a backdrop of ongoing changes and challenges. These include significant reductions in available federal/state grant funding, increases in enrollment, contractual obligations and increases in fixed costs.
289
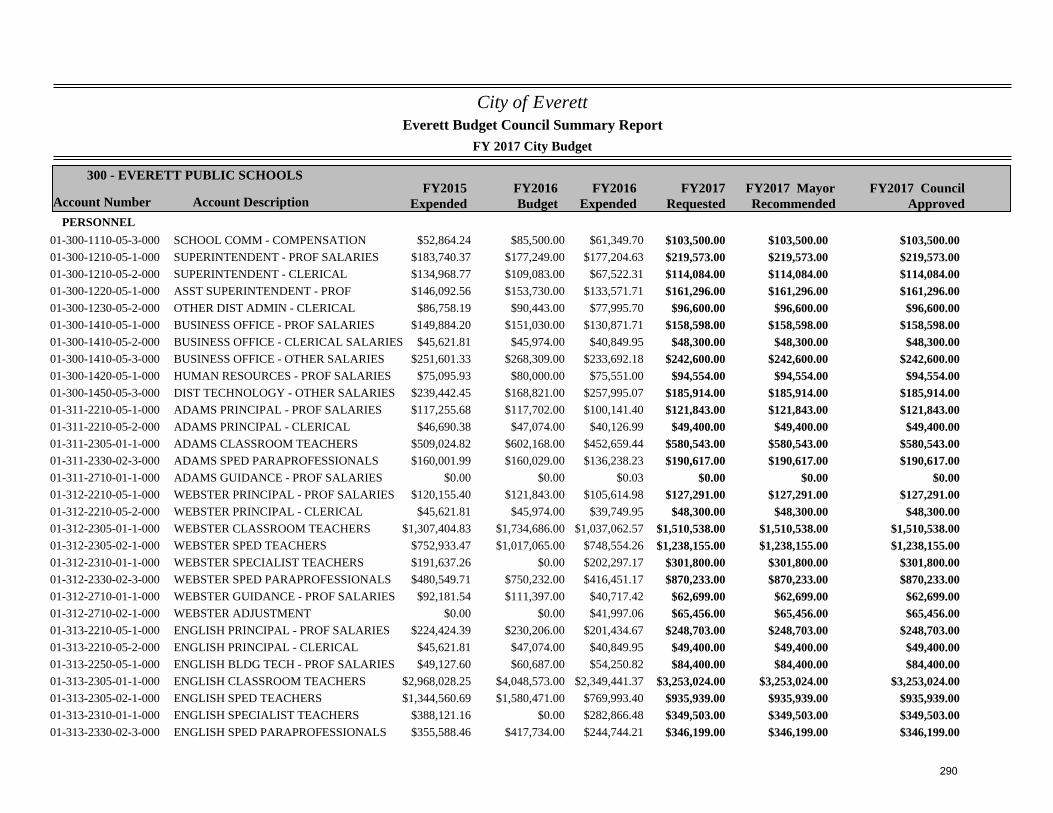
City of Everett
FY 2017 City Budget
Account Number Account DescriptionFY2015
ExpendedFY2016Budget
FY2017Requested
300 - EVERETT PUBLIC SCHOOLS
Everett Budget Council Summary Report
FY2017 MayorRecommended
FY2016Expended
FY2017 CouncilApproved
PERSONNEL$52,864.24 $85,500.00 $103,500.0001-300-1110-05-3-000 SCHOOL COMM - COMPENSATION $61,349.70 $103,500.00 $103,500.00
$183,740.37 $177,249.00 $219,573.0001-300-1210-05-1-000 SUPERINTENDENT - PROF SALARIES $177,204.63 $219,573.00 $219,573.00$134,968.77 $109,083.00 $114,084.0001-300-1210-05-2-000 SUPERINTENDENT - CLERICAL $67,522.31 $114,084.00 $114,084.00$146,092.56 $153,730.00 $161,296.0001-300-1220-05-1-000 ASST SUPERINTENDENT - PROF $133,571.71 $161,296.00 $161,296.00
$86,758.19 $90,443.00 $96,600.0001-300-1230-05-2-000 OTHER DIST ADMIN - CLERICAL $77,995.70 $96,600.00 $96,600.00$149,884.20 $151,030.00 $158,598.0001-300-1410-05-1-000 BUSINESS OFFICE - PROF SALARIES $130,871.71 $158,598.00 $158,598.00
$45,621.81 $45,974.00 $48,300.0001-300-1410-05-2-000 BUSINESS OFFICE - CLERICAL SALARIES $40,849.95 $48,300.00 $48,300.00$251,601.33 $268,309.00 $242,600.0001-300-1410-05-3-000 BUSINESS OFFICE - OTHER SALARIES $233,692.18 $242,600.00 $242,600.00
$75,095.93 $80,000.00 $94,554.0001-300-1420-05-1-000 HUMAN RESOURCES - PROF SALARIES $75,551.00 $94,554.00 $94,554.00$239,442.45 $168,821.00 $185,914.0001-300-1450-05-3-000 DIST TECHNOLOGY - OTHER SALARIES $257,995.07 $185,914.00 $185,914.00$117,255.68 $117,702.00 $121,843.0001-311-2210-05-1-000 ADAMS PRINCIPAL - PROF SALARIES $100,141.40 $121,843.00 $121,843.00
$46,690.38 $47,074.00 $49,400.0001-311-2210-05-2-000 ADAMS PRINCIPAL - CLERICAL $40,126.99 $49,400.00 $49,400.00$509,024.82 $602,168.00 $580,543.0001-311-2305-01-1-000 ADAMS CLASSROOM TEACHERS $452,659.44 $580,543.00 $580,543.00$160,001.99 $160,029.00 $190,617.0001-311-2330-02-3-000 ADAMS SPED PARAPROFESSIONALS $136,238.23 $190,617.00 $190,617.00
$0.00 $0.00 $0.0001-311-2710-01-1-000 ADAMS GUIDANCE - PROF SALARIES $0.03 $0.00 $0.00$120,155.40 $121,843.00 $127,291.0001-312-2210-05-1-000 WEBSTER PRINCIPAL - PROF SALARIES $105,614.98 $127,291.00 $127,291.00
$45,621.81 $45,974.00 $48,300.0001-312-2210-05-2-000 WEBSTER PRINCIPAL - CLERICAL $39,749.95 $48,300.00 $48,300.00$1,307,404.83 $1,734,686.00 $1,510,538.0001-312-2305-01-1-000 WEBSTER CLASSROOM TEACHERS $1,037,062.57 $1,510,538.00 $1,510,538.00
$752,933.47 $1,017,065.00 $1,238,155.0001-312-2305-02-1-000 WEBSTER SPED TEACHERS $748,554.26 $1,238,155.00 $1,238,155.00$191,637.26 $0.00 $301,800.0001-312-2310-01-1-000 WEBSTER SPECIALIST TEACHERS $202,297.17 $301,800.00 $301,800.00$480,549.71 $750,232.00 $870,233.0001-312-2330-02-3-000 WEBSTER SPED PARAPROFESSIONALS $416,451.17 $870,233.00 $870,233.00
$92,181.54 $111,397.00 $62,699.0001-312-2710-01-1-000 WEBSTER GUIDANCE - PROF SALARIES $40,717.42 $62,699.00 $62,699.00$0.00 $0.00 $65,456.0001-312-2710-02-1-000 WEBSTER ADJUSTMENT $41,997.06 $65,456.00 $65,456.00
$224,424.39 $230,206.00 $248,703.0001-313-2210-05-1-000 ENGLISH PRINCIPAL - PROF SALARIES $201,434.67 $248,703.00 $248,703.00$45,621.81 $47,074.00 $49,400.0001-313-2210-05-2-000 ENGLISH PRINCIPAL - CLERICAL $40,849.95 $49,400.00 $49,400.00$49,127.60 $60,687.00 $84,400.0001-313-2250-05-1-000 ENGLISH BLDG TECH - PROF SALARIES $54,250.82 $84,400.00 $84,400.00
$2,968,028.25 $4,048,573.00 $3,253,024.0001-313-2305-01-1-000 ENGLISH CLASSROOM TEACHERS $2,349,441.37 $3,253,024.00 $3,253,024.00$1,344,560.69 $1,580,471.00 $935,939.0001-313-2305-02-1-000 ENGLISH SPED TEACHERS $769,993.40 $935,939.00 $935,939.00
$388,121.16 $0.00 $349,503.0001-313-2310-01-1-000 ENGLISH SPECIALIST TEACHERS $282,866.48 $349,503.00 $349,503.00$355,588.46 $417,734.00 $346,199.0001-313-2330-02-3-000 ENGLISH SPED PARAPROFESSIONALS $244,744.21 $346,199.00 $346,199.00
290
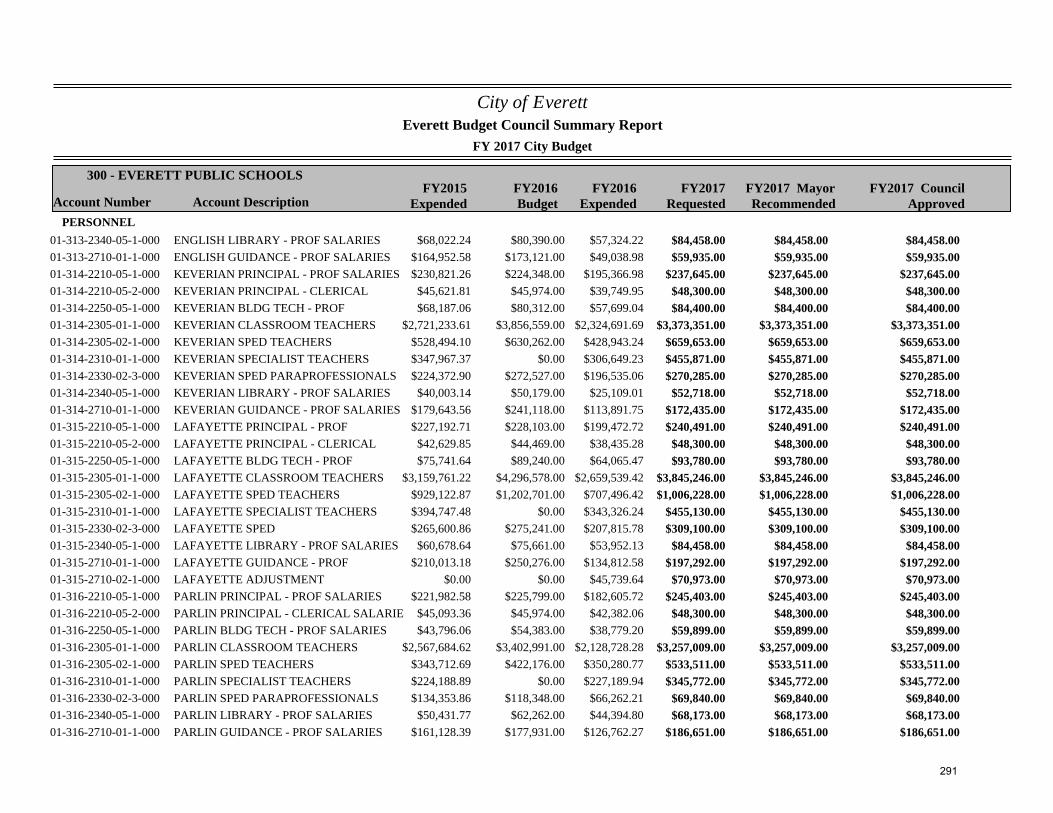
City of Everett
FY 2017 City Budget
Account Number Account DescriptionFY2015
ExpendedFY2016Budget
FY2017Requested
300 - EVERETT PUBLIC SCHOOLS
Everett Budget Council Summary Report
FY2017 MayorRecommended
FY2016Expended
FY2017 CouncilApproved
PERSONNEL$68,022.24 $80,390.00 $84,458.0001-313-2340-05-1-000 ENGLISH LIBRARY - PROF SALARIES $57,324.22 $84,458.00 $84,458.00
$164,952.58 $173,121.00 $59,935.0001-313-2710-01-1-000 ENGLISH GUIDANCE - PROF SALARIES $49,038.98 $59,935.00 $59,935.00$230,821.26 $224,348.00 $237,645.0001-314-2210-05-1-000 KEVERIAN PRINCIPAL - PROF SALARIES $195,366.98 $237,645.00 $237,645.00
$45,621.81 $45,974.00 $48,300.0001-314-2210-05-2-000 KEVERIAN PRINCIPAL - CLERICAL $39,749.95 $48,300.00 $48,300.00$68,187.06 $80,312.00 $84,400.0001-314-2250-05-1-000 KEVERIAN BLDG TECH - PROF $57,699.04 $84,400.00 $84,400.00
$2,721,233.61 $3,856,559.00 $3,373,351.0001-314-2305-01-1-000 KEVERIAN CLASSROOM TEACHERS $2,324,691.69 $3,373,351.00 $3,373,351.00$528,494.10 $630,262.00 $659,653.0001-314-2305-02-1-000 KEVERIAN SPED TEACHERS $428,943.24 $659,653.00 $659,653.00$347,967.37 $0.00 $455,871.0001-314-2310-01-1-000 KEVERIAN SPECIALIST TEACHERS $306,649.23 $455,871.00 $455,871.00$224,372.90 $272,527.00 $270,285.0001-314-2330-02-3-000 KEVERIAN SPED PARAPROFESSIONALS $196,535.06 $270,285.00 $270,285.00
$40,003.14 $50,179.00 $52,718.0001-314-2340-05-1-000 KEVERIAN LIBRARY - PROF SALARIES $25,109.01 $52,718.00 $52,718.00$179,643.56 $241,118.00 $172,435.0001-314-2710-01-1-000 KEVERIAN GUIDANCE - PROF SALARIES $113,891.75 $172,435.00 $172,435.00$227,192.71 $228,103.00 $240,491.0001-315-2210-05-1-000 LAFAYETTE PRINCIPAL - PROF $199,472.72 $240,491.00 $240,491.00
$42,629.85 $44,469.00 $48,300.0001-315-2210-05-2-000 LAFAYETTE PRINCIPAL - CLERICAL $38,435.28 $48,300.00 $48,300.00$75,741.64 $89,240.00 $93,780.0001-315-2250-05-1-000 LAFAYETTE BLDG TECH - PROF $64,065.47 $93,780.00 $93,780.00
$3,159,761.22 $4,296,578.00 $3,845,246.0001-315-2305-01-1-000 LAFAYETTE CLASSROOM TEACHERS $2,659,539.42 $3,845,246.00 $3,845,246.00$929,122.87 $1,202,701.00 $1,006,228.0001-315-2305-02-1-000 LAFAYETTE SPED TEACHERS $707,496.42 $1,006,228.00 $1,006,228.00$394,747.48 $0.00 $455,130.0001-315-2310-01-1-000 LAFAYETTE SPECIALIST TEACHERS $343,326.24 $455,130.00 $455,130.00$265,600.86 $275,241.00 $309,100.0001-315-2330-02-3-000 LAFAYETTE SPED $207,815.78 $309,100.00 $309,100.00
$60,678.64 $75,661.00 $84,458.0001-315-2340-05-1-000 LAFAYETTE LIBRARY - PROF SALARIES $53,952.13 $84,458.00 $84,458.00$210,013.18 $250,276.00 $197,292.0001-315-2710-01-1-000 LAFAYETTE GUIDANCE - PROF $134,812.58 $197,292.00 $197,292.00
$0.00 $0.00 $70,973.0001-315-2710-02-1-000 LAFAYETTE ADJUSTMENT $45,739.64 $70,973.00 $70,973.00$221,982.58 $225,799.00 $245,403.0001-316-2210-05-1-000 PARLIN PRINCIPAL - PROF SALARIES $182,605.72 $245,403.00 $245,403.00
$45,093.36 $45,974.00 $48,300.0001-316-2210-05-2-000 PARLIN PRINCIPAL - CLERICAL SALARIE $42,382.06 $48,300.00 $48,300.00$43,796.06 $54,383.00 $59,899.0001-316-2250-05-1-000 PARLIN BLDG TECH - PROF SALARIES $38,779.20 $59,899.00 $59,899.00
$2,567,684.62 $3,402,991.00 $3,257,009.0001-316-2305-01-1-000 PARLIN CLASSROOM TEACHERS $2,128,728.28 $3,257,009.00 $3,257,009.00$343,712.69 $422,176.00 $533,511.0001-316-2305-02-1-000 PARLIN SPED TEACHERS $350,280.77 $533,511.00 $533,511.00$224,188.89 $0.00 $345,772.0001-316-2310-01-1-000 PARLIN SPECIALIST TEACHERS $227,189.94 $345,772.00 $345,772.00$134,353.86 $118,348.00 $69,840.0001-316-2330-02-3-000 PARLIN SPED PARAPROFESSIONALS $66,262.21 $69,840.00 $69,840.00
$50,431.77 $62,262.00 $68,173.0001-316-2340-05-1-000 PARLIN LIBRARY - PROF SALARIES $44,394.80 $68,173.00 $68,173.00$161,128.39 $177,931.00 $186,651.0001-316-2710-01-1-000 PARLIN GUIDANCE - PROF SALARIES $126,762.27 $186,651.00 $186,651.00
291
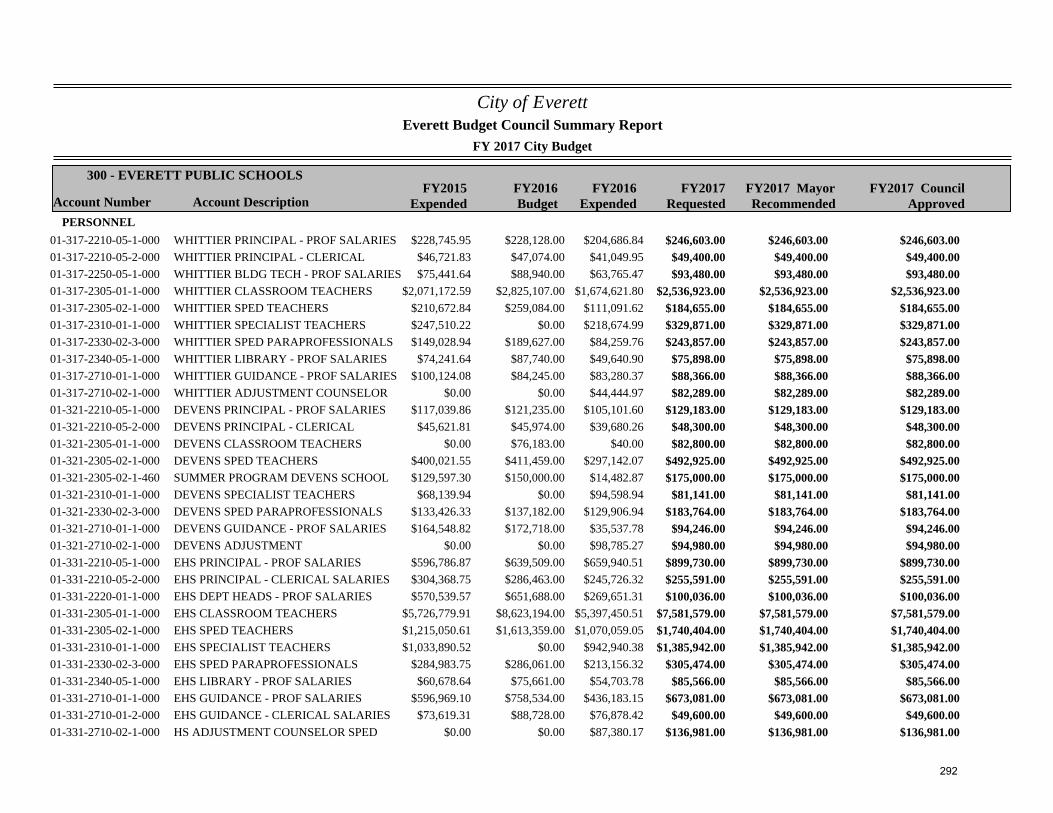
City of Everett
FY 2017 City Budget
Account Number Account DescriptionFY2015
ExpendedFY2016Budget
FY2017Requested
300 - EVERETT PUBLIC SCHOOLS
Everett Budget Council Summary Report
FY2017 MayorRecommended
FY2016Expended
FY2017 CouncilApproved
PERSONNEL$228,745.95 $228,128.00 $246,603.0001-317-2210-05-1-000 WHITTIER PRINCIPAL - PROF SALARIES $204,686.84 $246,603.00 $246,603.00
$46,721.83 $47,074.00 $49,400.0001-317-2210-05-2-000 WHITTIER PRINCIPAL - CLERICAL $41,049.95 $49,400.00 $49,400.00$75,441.64 $88,940.00 $93,480.0001-317-2250-05-1-000 WHITTIER BLDG TECH - PROF SALARIES $63,765.47 $93,480.00 $93,480.00
$2,071,172.59 $2,825,107.00 $2,536,923.0001-317-2305-01-1-000 WHITTIER CLASSROOM TEACHERS $1,674,621.80 $2,536,923.00 $2,536,923.00$210,672.84 $259,084.00 $184,655.0001-317-2305-02-1-000 WHITTIER SPED TEACHERS $111,091.62 $184,655.00 $184,655.00$247,510.22 $0.00 $329,871.0001-317-2310-01-1-000 WHITTIER SPECIALIST TEACHERS $218,674.99 $329,871.00 $329,871.00$149,028.94 $189,627.00 $243,857.0001-317-2330-02-3-000 WHITTIER SPED PARAPROFESSIONALS $84,259.76 $243,857.00 $243,857.00
$74,241.64 $87,740.00 $75,898.0001-317-2340-05-1-000 WHITTIER LIBRARY - PROF SALARIES $49,640.90 $75,898.00 $75,898.00$100,124.08 $84,245.00 $88,366.0001-317-2710-01-1-000 WHITTIER GUIDANCE - PROF SALARIES $83,280.37 $88,366.00 $88,366.00
$0.00 $0.00 $82,289.0001-317-2710-02-1-000 WHITTIER ADJUSTMENT COUNSELOR $44,444.97 $82,289.00 $82,289.00$117,039.86 $121,235.00 $129,183.0001-321-2210-05-1-000 DEVENS PRINCIPAL - PROF SALARIES $105,101.60 $129,183.00 $129,183.00
$45,621.81 $45,974.00 $48,300.0001-321-2210-05-2-000 DEVENS PRINCIPAL - CLERICAL $39,680.26 $48,300.00 $48,300.00$0.00 $76,183.00 $82,800.0001-321-2305-01-1-000 DEVENS CLASSROOM TEACHERS $40.00 $82,800.00 $82,800.00
$400,021.55 $411,459.00 $492,925.0001-321-2305-02-1-000 DEVENS SPED TEACHERS $297,142.07 $492,925.00 $492,925.00$129,597.30 $150,000.00 $175,000.0001-321-2305-02-1-460 SUMMER PROGRAM DEVENS SCHOOL $14,482.87 $175,000.00 $175,000.00
$68,139.94 $0.00 $81,141.0001-321-2310-01-1-000 DEVENS SPECIALIST TEACHERS $94,598.94 $81,141.00 $81,141.00$133,426.33 $137,182.00 $183,764.0001-321-2330-02-3-000 DEVENS SPED PARAPROFESSIONALS $129,906.94 $183,764.00 $183,764.00$164,548.82 $172,718.00 $94,246.0001-321-2710-01-1-000 DEVENS GUIDANCE - PROF SALARIES $35,537.78 $94,246.00 $94,246.00
$0.00 $0.00 $94,980.0001-321-2710-02-1-000 DEVENS ADJUSTMENT $98,785.27 $94,980.00 $94,980.00$596,786.87 $639,509.00 $899,730.0001-331-2210-05-1-000 EHS PRINCIPAL - PROF SALARIES $659,940.51 $899,730.00 $899,730.00$304,368.75 $286,463.00 $255,591.0001-331-2210-05-2-000 EHS PRINCIPAL - CLERICAL SALARIES $245,726.32 $255,591.00 $255,591.00$570,539.57 $651,688.00 $100,036.0001-331-2220-01-1-000 EHS DEPT HEADS - PROF SALARIES $269,651.31 $100,036.00 $100,036.00
$5,726,779.91 $8,623,194.00 $7,581,579.0001-331-2305-01-1-000 EHS CLASSROOM TEACHERS $5,397,450.51 $7,581,579.00 $7,581,579.00$1,215,050.61 $1,613,359.00 $1,740,404.0001-331-2305-02-1-000 EHS SPED TEACHERS $1,070,059.05 $1,740,404.00 $1,740,404.00$1,033,890.52 $0.00 $1,385,942.0001-331-2310-01-1-000 EHS SPECIALIST TEACHERS $942,940.38 $1,385,942.00 $1,385,942.00
$284,983.75 $286,061.00 $305,474.0001-331-2330-02-3-000 EHS SPED PARAPROFESSIONALS $213,156.32 $305,474.00 $305,474.00$60,678.64 $75,661.00 $85,566.0001-331-2340-05-1-000 EHS LIBRARY - PROF SALARIES $54,703.78 $85,566.00 $85,566.00
$596,969.10 $758,534.00 $673,081.0001-331-2710-01-1-000 EHS GUIDANCE - PROF SALARIES $436,183.15 $673,081.00 $673,081.00$73,619.31 $88,728.00 $49,600.0001-331-2710-01-2-000 EHS GUIDANCE - CLERICAL SALARIES $76,878.42 $49,600.00 $49,600.00
$0.00 $0.00 $136,981.0001-331-2710-02-1-000 HS ADJUSTMENT COUNSELOR SPED $87,380.17 $136,981.00 $136,981.00
292
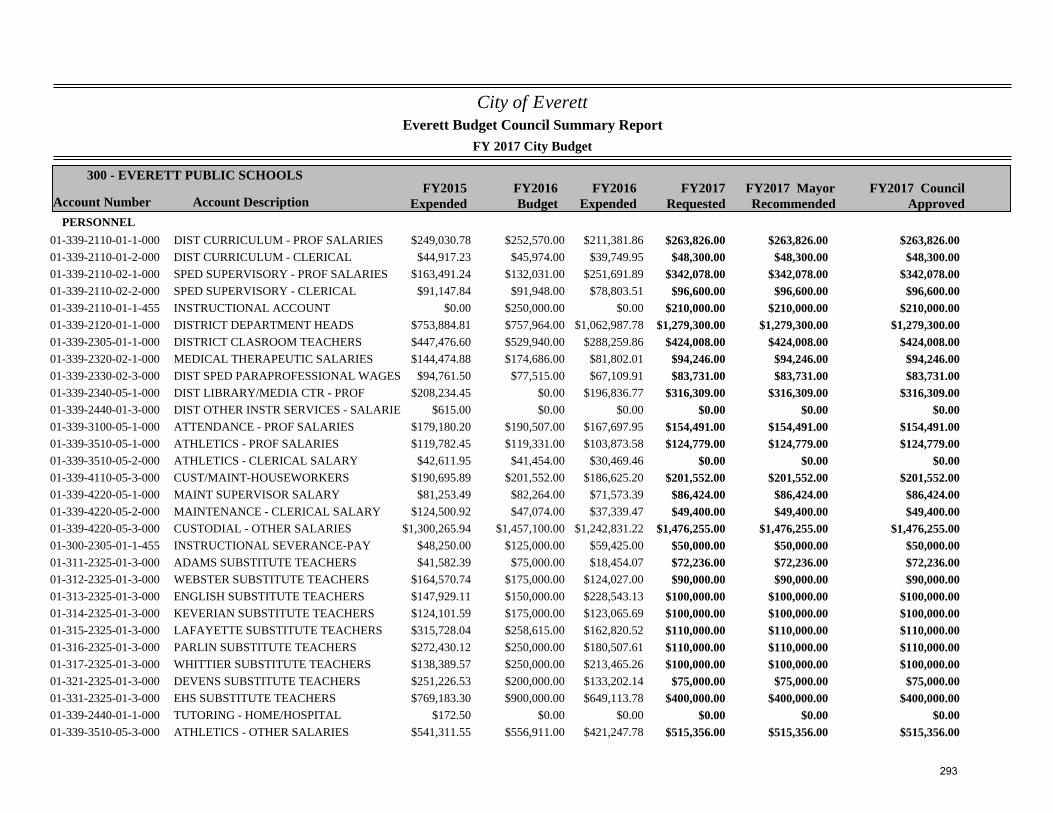
City of Everett
FY 2017 City Budget
Account Number Account DescriptionFY2015
ExpendedFY2016Budget
FY2017Requested
300 - EVERETT PUBLIC SCHOOLS
Everett Budget Council Summary Report
FY2017 MayorRecommended
FY2016Expended
FY2017 CouncilApproved
PERSONNEL$249,030.78 $252,570.00 $263,826.0001-339-2110-01-1-000 DIST CURRICULUM - PROF SALARIES $211,381.86 $263,826.00 $263,826.00
$44,917.23 $45,974.00 $48,300.0001-339-2110-01-2-000 DIST CURRICULUM - CLERICAL $39,749.95 $48,300.00 $48,300.00$163,491.24 $132,031.00 $342,078.0001-339-2110-02-1-000 SPED SUPERVISORY - PROF SALARIES $251,691.89 $342,078.00 $342,078.00
$91,147.84 $91,948.00 $96,600.0001-339-2110-02-2-000 SPED SUPERVISORY - CLERICAL $78,803.51 $96,600.00 $96,600.00$0.00 $250,000.00 $210,000.0001-339-2110-01-1-455 INSTRUCTIONAL ACCOUNT $0.00 $210,000.00 $210,000.00
$753,884.81 $757,964.00 $1,279,300.0001-339-2120-01-1-000 DISTRICT DEPARTMENT HEADS $1,062,987.78 $1,279,300.00 $1,279,300.00$447,476.60 $529,940.00 $424,008.0001-339-2305-01-1-000 DISTRICT CLASROOM TEACHERS $288,259.86 $424,008.00 $424,008.00$144,474.88 $174,686.00 $94,246.0001-339-2320-02-1-000 MEDICAL THERAPEUTIC SALARIES $81,802.01 $94,246.00 $94,246.00
$94,761.50 $77,515.00 $83,731.0001-339-2330-02-3-000 DIST SPED PARAPROFESSIONAL WAGES $67,109.91 $83,731.00 $83,731.00$208,234.45 $0.00 $316,309.0001-339-2340-05-1-000 DIST LIBRARY/MEDIA CTR - PROF $196,836.77 $316,309.00 $316,309.00
$615.00 $0.00 $0.0001-339-2440-01-3-000 DIST OTHER INSTR SERVICES - SALARIE $0.00 $0.00 $0.00$179,180.20 $190,507.00 $154,491.0001-339-3100-05-1-000 ATTENDANCE - PROF SALARIES $167,697.95 $154,491.00 $154,491.00$119,782.45 $119,331.00 $124,779.0001-339-3510-05-1-000 ATHLETICS - PROF SALARIES $103,873.58 $124,779.00 $124,779.00
$42,611.95 $41,454.00 $0.0001-339-3510-05-2-000 ATHLETICS - CLERICAL SALARY $30,469.46 $0.00 $0.00$190,695.89 $201,552.00 $201,552.0001-339-4110-05-3-000 CUST/MAINT-HOUSEWORKERS $186,625.20 $201,552.00 $201,552.00
$81,253.49 $82,264.00 $86,424.0001-339-4220-05-1-000 MAINT SUPERVISOR SALARY $71,573.39 $86,424.00 $86,424.00$124,500.92 $47,074.00 $49,400.0001-339-4220-05-2-000 MAINTENANCE - CLERICAL SALARY $37,339.47 $49,400.00 $49,400.00
$1,300,265.94 $1,457,100.00 $1,476,255.0001-339-4220-05-3-000 CUSTODIAL - OTHER SALARIES $1,242,831.22 $1,476,255.00 $1,476,255.00$48,250.00 $125,000.00 $50,000.0001-300-2305-01-1-455 INSTRUCTIONAL SEVERANCE-PAY $59,425.00 $50,000.00 $50,000.00$41,582.39 $75,000.00 $72,236.0001-311-2325-01-3-000 ADAMS SUBSTITUTE TEACHERS $18,454.07 $72,236.00 $72,236.00
$164,570.74 $175,000.00 $90,000.0001-312-2325-01-3-000 WEBSTER SUBSTITUTE TEACHERS $124,027.00 $90,000.00 $90,000.00$147,929.11 $150,000.00 $100,000.0001-313-2325-01-3-000 ENGLISH SUBSTITUTE TEACHERS $228,543.13 $100,000.00 $100,000.00$124,101.59 $175,000.00 $100,000.0001-314-2325-01-3-000 KEVERIAN SUBSTITUTE TEACHERS $123,065.69 $100,000.00 $100,000.00$315,728.04 $258,615.00 $110,000.0001-315-2325-01-3-000 LAFAYETTE SUBSTITUTE TEACHERS $162,820.52 $110,000.00 $110,000.00$272,430.12 $250,000.00 $110,000.0001-316-2325-01-3-000 PARLIN SUBSTITUTE TEACHERS $180,507.61 $110,000.00 $110,000.00$138,389.57 $250,000.00 $100,000.0001-317-2325-01-3-000 WHITTIER SUBSTITUTE TEACHERS $213,465.26 $100,000.00 $100,000.00$251,226.53 $200,000.00 $75,000.0001-321-2325-01-3-000 DEVENS SUBSTITUTE TEACHERS $133,202.14 $75,000.00 $75,000.00$769,183.30 $900,000.00 $400,000.0001-331-2325-01-3-000 EHS SUBSTITUTE TEACHERS $649,113.78 $400,000.00 $400,000.00
$172.50 $0.00 $0.0001-339-2440-01-1-000 TUTORING - HOME/HOSPITAL $0.00 $0.00 $0.00$541,311.55 $556,911.00 $515,356.0001-339-3510-05-3-000 ATHLETICS - OTHER SALARIES $421,247.78 $515,356.00 $515,356.00
293
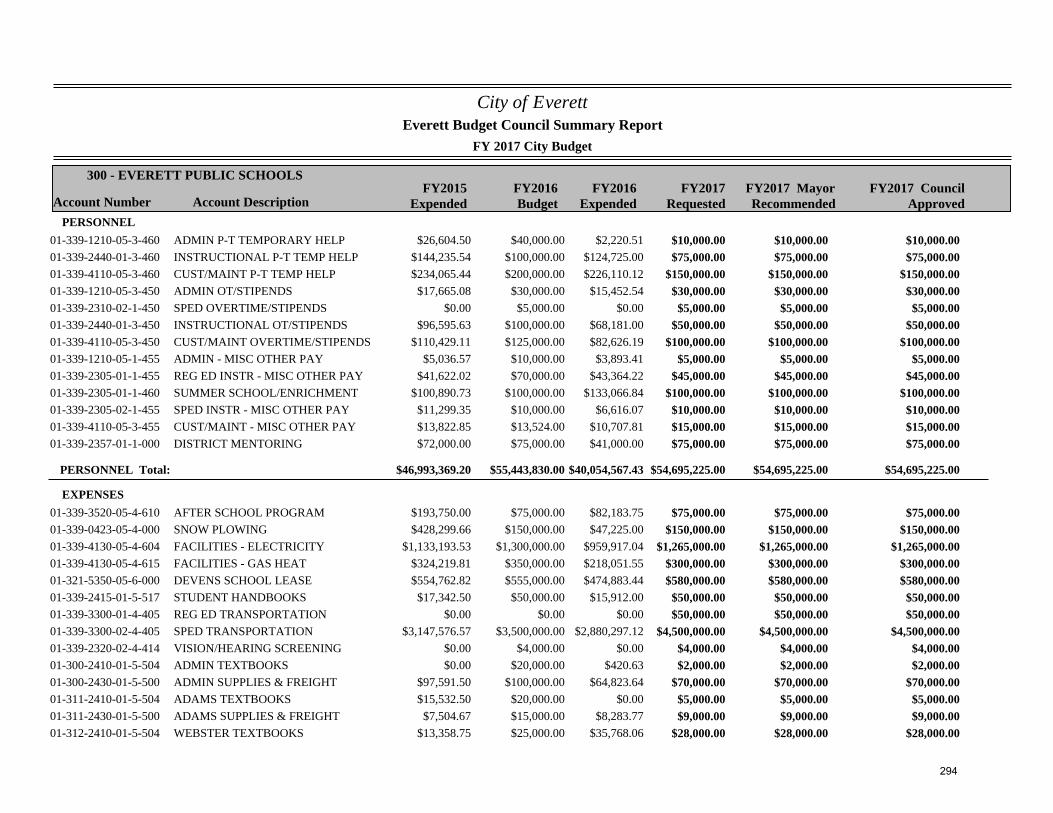
City of Everett
FY 2017 City Budget
Account Number Account DescriptionFY2015
ExpendedFY2016Budget
FY2017Requested
300 - EVERETT PUBLIC SCHOOLS
Everett Budget Council Summary Report
FY2017 MayorRecommended
FY2016Expended
FY2017 CouncilApproved
PERSONNEL$26,604.50 $40,000.00 $10,000.0001-339-1210-05-3-460 ADMIN P-T TEMPORARY HELP $2,220.51 $10,000.00 $10,000.00
$144,235.54 $100,000.00 $75,000.0001-339-2440-01-3-460 INSTRUCTIONAL P-T TEMP HELP $124,725.00 $75,000.00 $75,000.00$234,065.44 $200,000.00 $150,000.0001-339-4110-05-3-460 CUST/MAINT P-T TEMP HELP $226,110.12 $150,000.00 $150,000.00
$17,665.08 $30,000.00 $30,000.0001-339-1210-05-3-450 ADMIN OT/STIPENDS $15,452.54 $30,000.00 $30,000.00$0.00 $5,000.00 $5,000.0001-339-2310-02-1-450 SPED OVERTIME/STIPENDS $0.00 $5,000.00 $5,000.00
$96,595.63 $100,000.00 $50,000.0001-339-2440-01-3-450 INSTRUCTIONAL OT/STIPENDS $68,181.00 $50,000.00 $50,000.00$110,429.11 $125,000.00 $100,000.0001-339-4110-05-3-450 CUST/MAINT OVERTIME/STIPENDS $82,626.19 $100,000.00 $100,000.00
$5,036.57 $10,000.00 $5,000.0001-339-1210-05-1-455 ADMIN - MISC OTHER PAY $3,893.41 $5,000.00 $5,000.00$41,622.02 $70,000.00 $45,000.0001-339-2305-01-1-455 REG ED INSTR - MISC OTHER PAY $43,364.22 $45,000.00 $45,000.00
$100,890.73 $100,000.00 $100,000.0001-339-2305-01-1-460 SUMMER SCHOOL/ENRICHMENT $133,066.84 $100,000.00 $100,000.00$11,299.35 $10,000.00 $10,000.0001-339-2305-02-1-455 SPED INSTR - MISC OTHER PAY $6,616.07 $10,000.00 $10,000.00$13,822.85 $13,524.00 $15,000.0001-339-4110-05-3-455 CUST/MAINT - MISC OTHER PAY $10,707.81 $15,000.00 $15,000.00$72,000.00 $75,000.00 $75,000.0001-339-2357-01-1-000 DISTRICT MENTORING $41,000.00 $75,000.00 $75,000.00
PERSONNEL Total: $46,993,369.20 $55,443,830.00 $54,695,225.00$40,054,567.43 $54,695,225.00 $54,695,225.00
EXPENSES$193,750.00 $75,000.00 $75,000.0001-339-3520-05-4-610 AFTER SCHOOL PROGRAM $82,183.75 $75,000.00 $75,000.00$428,299.66 $150,000.00 $150,000.0001-339-0423-05-4-000 SNOW PLOWING $47,225.00 $150,000.00 $150,000.00
$1,133,193.53 $1,300,000.00 $1,265,000.0001-339-4130-05-4-604 FACILITIES - ELECTRICITY $959,917.04 $1,265,000.00 $1,265,000.00$324,219.81 $350,000.00 $300,000.0001-339-4130-05-4-615 FACILITIES - GAS HEAT $218,051.55 $300,000.00 $300,000.00$554,762.82 $555,000.00 $580,000.0001-321-5350-05-6-000 DEVENS SCHOOL LEASE $474,883.44 $580,000.00 $580,000.00
$17,342.50 $50,000.00 $50,000.0001-339-2415-01-5-517 STUDENT HANDBOOKS $15,912.00 $50,000.00 $50,000.00$0.00 $0.00 $50,000.0001-339-3300-01-4-405 REG ED TRANSPORTATION $0.00 $50,000.00 $50,000.00
$3,147,576.57 $3,500,000.00 $4,500,000.0001-339-3300-02-4-405 SPED TRANSPORTATION $2,880,297.12 $4,500,000.00 $4,500,000.00$0.00 $4,000.00 $4,000.0001-339-2320-02-4-414 VISION/HEARING SCREENING $0.00 $4,000.00 $4,000.00$0.00 $20,000.00 $2,000.0001-300-2410-01-5-504 ADMIN TEXTBOOKS $420.63 $2,000.00 $2,000.00
$97,591.50 $100,000.00 $70,000.0001-300-2430-01-5-500 ADMIN SUPPLIES & FREIGHT $64,823.64 $70,000.00 $70,000.00$15,532.50 $20,000.00 $5,000.0001-311-2410-01-5-504 ADAMS TEXTBOOKS $0.00 $5,000.00 $5,000.00$7,504.67 $15,000.00 $9,000.0001-311-2430-01-5-500 ADAMS SUPPLIES & FREIGHT $8,283.77 $9,000.00 $9,000.00
$13,358.75 $25,000.00 $28,000.0001-312-2410-01-5-504 WEBSTER TEXTBOOKS $35,768.06 $28,000.00 $28,000.00
294
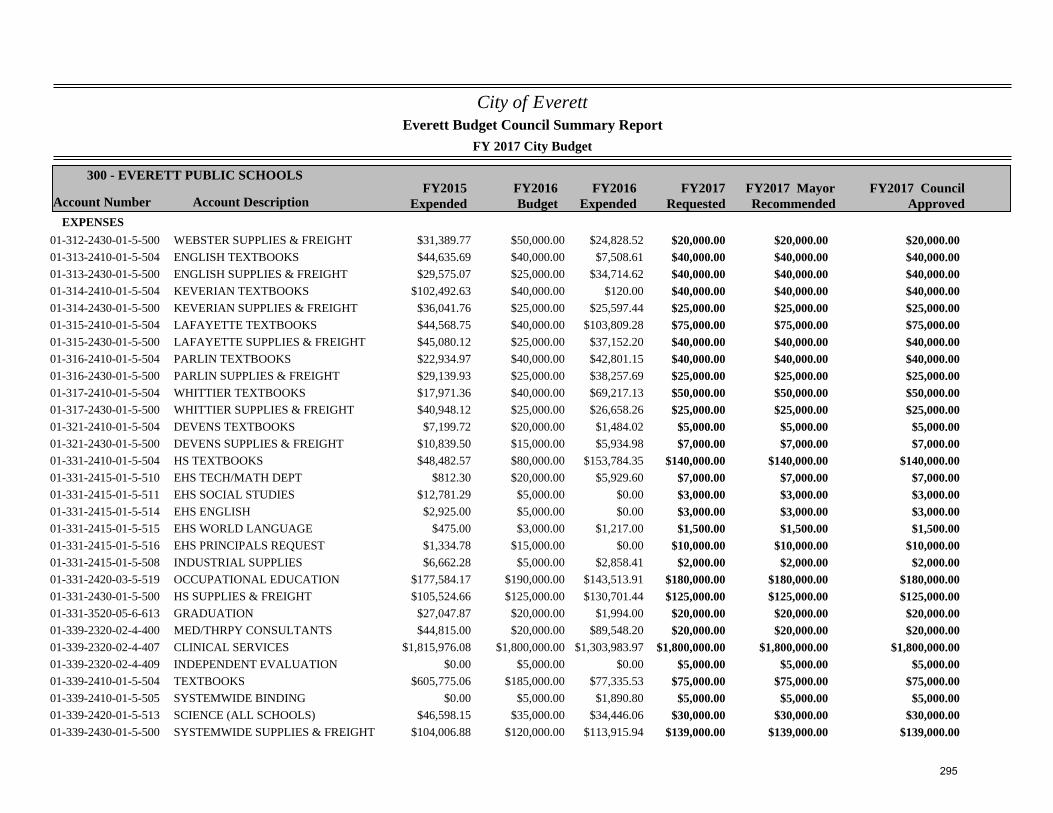
City of Everett
FY 2017 City Budget
Account Number Account DescriptionFY2015
ExpendedFY2016Budget
FY2017Requested
300 - EVERETT PUBLIC SCHOOLS
Everett Budget Council Summary Report
FY2017 MayorRecommended
FY2016Expended
FY2017 CouncilApproved
EXPENSES$31,389.77 $50,000.00 $20,000.0001-312-2430-01-5-500 WEBSTER SUPPLIES & FREIGHT $24,828.52 $20,000.00 $20,000.00$44,635.69 $40,000.00 $40,000.0001-313-2410-01-5-504 ENGLISH TEXTBOOKS $7,508.61 $40,000.00 $40,000.00$29,575.07 $25,000.00 $40,000.0001-313-2430-01-5-500 ENGLISH SUPPLIES & FREIGHT $34,714.62 $40,000.00 $40,000.00
$102,492.63 $40,000.00 $40,000.0001-314-2410-01-5-504 KEVERIAN TEXTBOOKS $120.00 $40,000.00 $40,000.00$36,041.76 $25,000.00 $25,000.0001-314-2430-01-5-500 KEVERIAN SUPPLIES & FREIGHT $25,597.44 $25,000.00 $25,000.00$44,568.75 $40,000.00 $75,000.0001-315-2410-01-5-504 LAFAYETTE TEXTBOOKS $103,809.28 $75,000.00 $75,000.00$45,080.12 $25,000.00 $40,000.0001-315-2430-01-5-500 LAFAYETTE SUPPLIES & FREIGHT $37,152.20 $40,000.00 $40,000.00$22,934.97 $40,000.00 $40,000.0001-316-2410-01-5-504 PARLIN TEXTBOOKS $42,801.15 $40,000.00 $40,000.00$29,139.93 $25,000.00 $25,000.0001-316-2430-01-5-500 PARLIN SUPPLIES & FREIGHT $38,257.69 $25,000.00 $25,000.00$17,971.36 $40,000.00 $50,000.0001-317-2410-01-5-504 WHITTIER TEXTBOOKS $69,217.13 $50,000.00 $50,000.00$40,948.12 $25,000.00 $25,000.0001-317-2430-01-5-500 WHITTIER SUPPLIES & FREIGHT $26,658.26 $25,000.00 $25,000.00$7,199.72 $20,000.00 $5,000.0001-321-2410-01-5-504 DEVENS TEXTBOOKS $1,484.02 $5,000.00 $5,000.00
$10,839.50 $15,000.00 $7,000.0001-321-2430-01-5-500 DEVENS SUPPLIES & FREIGHT $5,934.98 $7,000.00 $7,000.00$48,482.57 $80,000.00 $140,000.0001-331-2410-01-5-504 HS TEXTBOOKS $153,784.35 $140,000.00 $140,000.00
$812.30 $20,000.00 $7,000.0001-331-2415-01-5-510 EHS TECH/MATH DEPT $5,929.60 $7,000.00 $7,000.00$12,781.29 $5,000.00 $3,000.0001-331-2415-01-5-511 EHS SOCIAL STUDIES $0.00 $3,000.00 $3,000.00$2,925.00 $5,000.00 $3,000.0001-331-2415-01-5-514 EHS ENGLISH $0.00 $3,000.00 $3,000.00
$475.00 $3,000.00 $1,500.0001-331-2415-01-5-515 EHS WORLD LANGUAGE $1,217.00 $1,500.00 $1,500.00$1,334.78 $15,000.00 $10,000.0001-331-2415-01-5-516 EHS PRINCIPALS REQUEST $0.00 $10,000.00 $10,000.00$6,662.28 $5,000.00 $2,000.0001-331-2415-01-5-508 INDUSTRIAL SUPPLIES $2,858.41 $2,000.00 $2,000.00
$177,584.17 $190,000.00 $180,000.0001-331-2420-03-5-519 OCCUPATIONAL EDUCATION $143,513.91 $180,000.00 $180,000.00$105,524.66 $125,000.00 $125,000.0001-331-2430-01-5-500 HS SUPPLIES & FREIGHT $130,701.44 $125,000.00 $125,000.00
$27,047.87 $20,000.00 $20,000.0001-331-3520-05-6-613 GRADUATION $1,994.00 $20,000.00 $20,000.00$44,815.00 $20,000.00 $20,000.0001-339-2320-02-4-400 MED/THRPY CONSULTANTS $89,548.20 $20,000.00 $20,000.00
$1,815,976.08 $1,800,000.00 $1,800,000.0001-339-2320-02-4-407 CLINICAL SERVICES $1,303,983.97 $1,800,000.00 $1,800,000.00$0.00 $5,000.00 $5,000.0001-339-2320-02-4-409 INDEPENDENT EVALUATION $0.00 $5,000.00 $5,000.00
$605,775.06 $185,000.00 $75,000.0001-339-2410-01-5-504 TEXTBOOKS $77,335.53 $75,000.00 $75,000.00$0.00 $5,000.00 $5,000.0001-339-2410-01-5-505 SYSTEMWIDE BINDING $1,890.80 $5,000.00 $5,000.00
$46,598.15 $35,000.00 $30,000.0001-339-2420-01-5-513 SCIENCE (ALL SCHOOLS) $34,446.06 $30,000.00 $30,000.00$104,006.88 $120,000.00 $139,000.0001-339-2430-01-5-500 SYSTEMWIDE SUPPLIES & FREIGHT $113,915.94 $139,000.00 $139,000.00
295
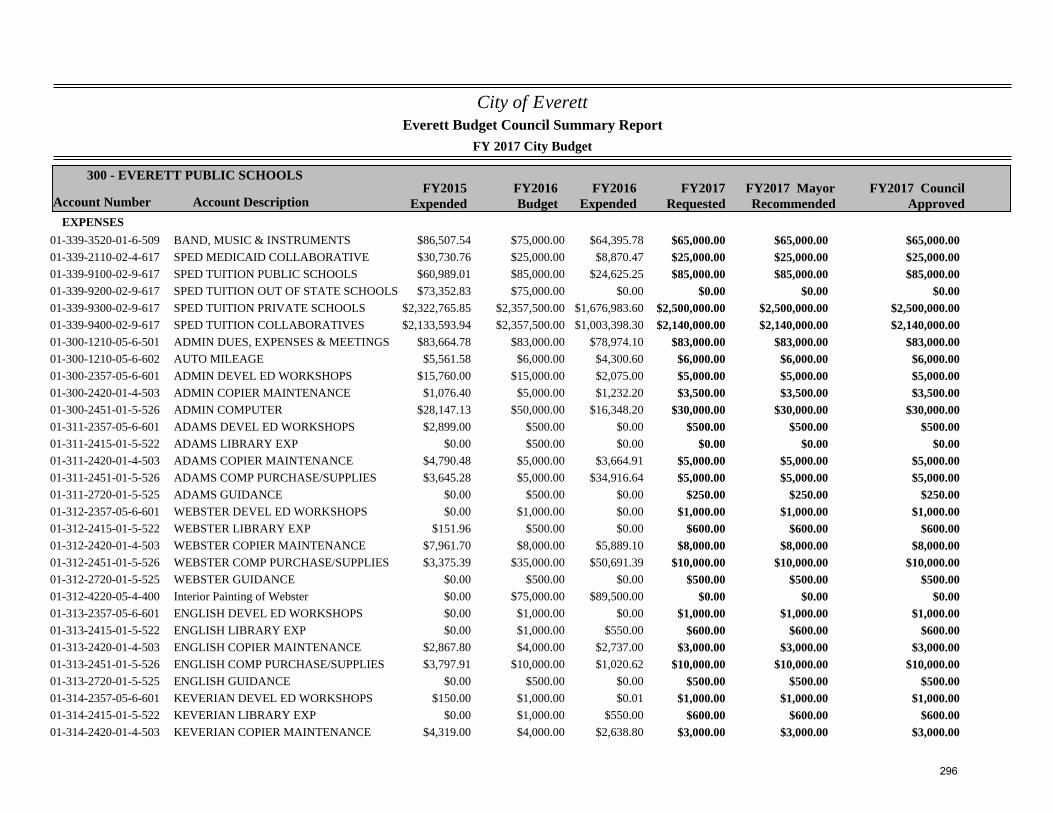
City of Everett
FY 2017 City Budget
Account Number Account DescriptionFY2015
ExpendedFY2016Budget
FY2017Requested
300 - EVERETT PUBLIC SCHOOLS
Everett Budget Council Summary Report
FY2017 MayorRecommended
FY2016Expended
FY2017 CouncilApproved
EXPENSES$86,507.54 $75,000.00 $65,000.0001-339-3520-01-6-509 BAND, MUSIC & INSTRUMENTS $64,395.78 $65,000.00 $65,000.00$30,730.76 $25,000.00 $25,000.0001-339-2110-02-4-617 SPED MEDICAID COLLABORATIVE $8,870.47 $25,000.00 $25,000.00$60,989.01 $85,000.00 $85,000.0001-339-9100-02-9-617 SPED TUITION PUBLIC SCHOOLS $24,625.25 $85,000.00 $85,000.00$73,352.83 $75,000.00 $0.0001-339-9200-02-9-617 SPED TUITION OUT OF STATE SCHOOLS $0.00 $0.00 $0.00
$2,322,765.85 $2,357,500.00 $2,500,000.0001-339-9300-02-9-617 SPED TUITION PRIVATE SCHOOLS $1,676,983.60 $2,500,000.00 $2,500,000.00$2,133,593.94 $2,357,500.00 $2,140,000.0001-339-9400-02-9-617 SPED TUITION COLLABORATIVES $1,003,398.30 $2,140,000.00 $2,140,000.00
$83,664.78 $83,000.00 $83,000.0001-300-1210-05-6-501 ADMIN DUES, EXPENSES & MEETINGS $78,974.10 $83,000.00 $83,000.00$5,561.58 $6,000.00 $6,000.0001-300-1210-05-6-602 AUTO MILEAGE $4,300.60 $6,000.00 $6,000.00
$15,760.00 $15,000.00 $5,000.0001-300-2357-05-6-601 ADMIN DEVEL ED WORKSHOPS $2,075.00 $5,000.00 $5,000.00$1,076.40 $5,000.00 $3,500.0001-300-2420-01-4-503 ADMIN COPIER MAINTENANCE $1,232.20 $3,500.00 $3,500.00
$28,147.13 $50,000.00 $30,000.0001-300-2451-01-5-526 ADMIN COMPUTER $16,348.20 $30,000.00 $30,000.00$2,899.00 $500.00 $500.0001-311-2357-05-6-601 ADAMS DEVEL ED WORKSHOPS $0.00 $500.00 $500.00
$0.00 $500.00 $0.0001-311-2415-01-5-522 ADAMS LIBRARY EXP $0.00 $0.00 $0.00$4,790.48 $5,000.00 $5,000.0001-311-2420-01-4-503 ADAMS COPIER MAINTENANCE $3,664.91 $5,000.00 $5,000.00$3,645.28 $5,000.00 $5,000.0001-311-2451-01-5-526 ADAMS COMP PURCHASE/SUPPLIES $34,916.64 $5,000.00 $5,000.00
$0.00 $500.00 $250.0001-311-2720-01-5-525 ADAMS GUIDANCE $0.00 $250.00 $250.00$0.00 $1,000.00 $1,000.0001-312-2357-05-6-601 WEBSTER DEVEL ED WORKSHOPS $0.00 $1,000.00 $1,000.00
$151.96 $500.00 $600.0001-312-2415-01-5-522 WEBSTER LIBRARY EXP $0.00 $600.00 $600.00$7,961.70 $8,000.00 $8,000.0001-312-2420-01-4-503 WEBSTER COPIER MAINTENANCE $5,889.10 $8,000.00 $8,000.00$3,375.39 $35,000.00 $10,000.0001-312-2451-01-5-526 WEBSTER COMP PURCHASE/SUPPLIES $50,691.39 $10,000.00 $10,000.00
$0.00 $500.00 $500.0001-312-2720-01-5-525 WEBSTER GUIDANCE $0.00 $500.00 $500.00$0.00 $75,000.00 $0.0001-312-4220-05-4-400 Interior Painting of Webster $89,500.00 $0.00 $0.00$0.00 $1,000.00 $1,000.0001-313-2357-05-6-601 ENGLISH DEVEL ED WORKSHOPS $0.00 $1,000.00 $1,000.00$0.00 $1,000.00 $600.0001-313-2415-01-5-522 ENGLISH LIBRARY EXP $550.00 $600.00 $600.00
$2,867.80 $4,000.00 $3,000.0001-313-2420-01-4-503 ENGLISH COPIER MAINTENANCE $2,737.00 $3,000.00 $3,000.00$3,797.91 $10,000.00 $10,000.0001-313-2451-01-5-526 ENGLISH COMP PURCHASE/SUPPLIES $1,020.62 $10,000.00 $10,000.00
$0.00 $500.00 $500.0001-313-2720-01-5-525 ENGLISH GUIDANCE $0.00 $500.00 $500.00$150.00 $1,000.00 $1,000.0001-314-2357-05-6-601 KEVERIAN DEVEL ED WORKSHOPS $0.01 $1,000.00 $1,000.00
$0.00 $1,000.00 $600.0001-314-2415-01-5-522 KEVERIAN LIBRARY EXP $550.00 $600.00 $600.00$4,319.00 $4,000.00 $3,000.0001-314-2420-01-4-503 KEVERIAN COPIER MAINTENANCE $2,638.80 $3,000.00 $3,000.00
296
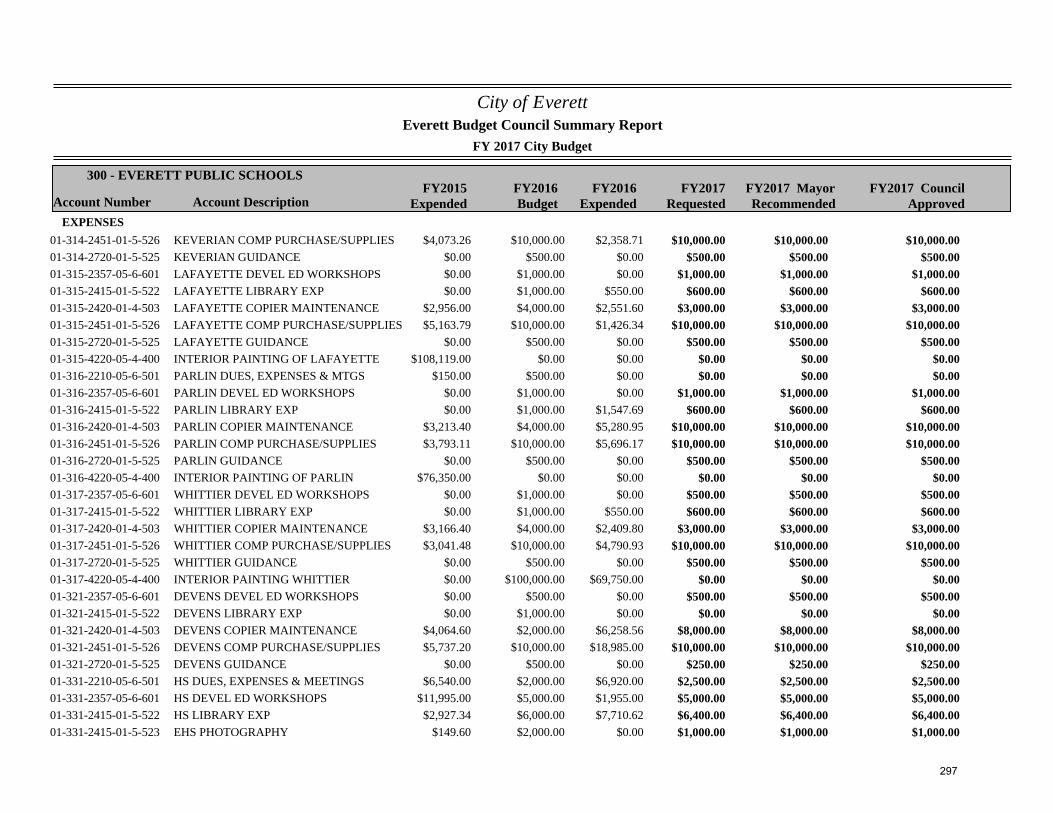
City of Everett
FY 2017 City Budget
Account Number Account DescriptionFY2015
ExpendedFY2016Budget
FY2017Requested
300 - EVERETT PUBLIC SCHOOLS
Everett Budget Council Summary Report
FY2017 MayorRecommended
FY2016Expended
FY2017 CouncilApproved
EXPENSES$4,073.26 $10,000.00 $10,000.0001-314-2451-01-5-526 KEVERIAN COMP PURCHASE/SUPPLIES $2,358.71 $10,000.00 $10,000.00
$0.00 $500.00 $500.0001-314-2720-01-5-525 KEVERIAN GUIDANCE $0.00 $500.00 $500.00$0.00 $1,000.00 $1,000.0001-315-2357-05-6-601 LAFAYETTE DEVEL ED WORKSHOPS $0.00 $1,000.00 $1,000.00$0.00 $1,000.00 $600.0001-315-2415-01-5-522 LAFAYETTE LIBRARY EXP $550.00 $600.00 $600.00
$2,956.00 $4,000.00 $3,000.0001-315-2420-01-4-503 LAFAYETTE COPIER MAINTENANCE $2,551.60 $3,000.00 $3,000.00$5,163.79 $10,000.00 $10,000.0001-315-2451-01-5-526 LAFAYETTE COMP PURCHASE/SUPPLIES $1,426.34 $10,000.00 $10,000.00
$0.00 $500.00 $500.0001-315-2720-01-5-525 LAFAYETTE GUIDANCE $0.00 $500.00 $500.00$108,119.00 $0.00 $0.0001-315-4220-05-4-400 INTERIOR PAINTING OF LAFAYETTE $0.00 $0.00 $0.00
$150.00 $500.00 $0.0001-316-2210-05-6-501 PARLIN DUES, EXPENSES & MTGS $0.00 $0.00 $0.00$0.00 $1,000.00 $1,000.0001-316-2357-05-6-601 PARLIN DEVEL ED WORKSHOPS $0.00 $1,000.00 $1,000.00$0.00 $1,000.00 $600.0001-316-2415-01-5-522 PARLIN LIBRARY EXP $1,547.69 $600.00 $600.00
$3,213.40 $4,000.00 $10,000.0001-316-2420-01-4-503 PARLIN COPIER MAINTENANCE $5,280.95 $10,000.00 $10,000.00$3,793.11 $10,000.00 $10,000.0001-316-2451-01-5-526 PARLIN COMP PURCHASE/SUPPLIES $5,696.17 $10,000.00 $10,000.00
$0.00 $500.00 $500.0001-316-2720-01-5-525 PARLIN GUIDANCE $0.00 $500.00 $500.00$76,350.00 $0.00 $0.0001-316-4220-05-4-400 INTERIOR PAINTING OF PARLIN $0.00 $0.00 $0.00
$0.00 $1,000.00 $500.0001-317-2357-05-6-601 WHITTIER DEVEL ED WORKSHOPS $0.00 $500.00 $500.00$0.00 $1,000.00 $600.0001-317-2415-01-5-522 WHITTIER LIBRARY EXP $550.00 $600.00 $600.00
$3,166.40 $4,000.00 $3,000.0001-317-2420-01-4-503 WHITTIER COPIER MAINTENANCE $2,409.80 $3,000.00 $3,000.00$3,041.48 $10,000.00 $10,000.0001-317-2451-01-5-526 WHITTIER COMP PURCHASE/SUPPLIES $4,790.93 $10,000.00 $10,000.00
$0.00 $500.00 $500.0001-317-2720-01-5-525 WHITTIER GUIDANCE $0.00 $500.00 $500.00$0.00 $100,000.00 $0.0001-317-4220-05-4-400 INTERIOR PAINTING WHITTIER $69,750.00 $0.00 $0.00$0.00 $500.00 $500.0001-321-2357-05-6-601 DEVENS DEVEL ED WORKSHOPS $0.00 $500.00 $500.00$0.00 $1,000.00 $0.0001-321-2415-01-5-522 DEVENS LIBRARY EXP $0.00 $0.00 $0.00
$4,064.60 $2,000.00 $8,000.0001-321-2420-01-4-503 DEVENS COPIER MAINTENANCE $6,258.56 $8,000.00 $8,000.00$5,737.20 $10,000.00 $10,000.0001-321-2451-01-5-526 DEVENS COMP PURCHASE/SUPPLIES $18,985.00 $10,000.00 $10,000.00
$0.00 $500.00 $250.0001-321-2720-01-5-525 DEVENS GUIDANCE $0.00 $250.00 $250.00$6,540.00 $2,000.00 $2,500.0001-331-2210-05-6-501 HS DUES, EXPENSES & MEETINGS $6,920.00 $2,500.00 $2,500.00
$11,995.00 $5,000.00 $5,000.0001-331-2357-05-6-601 HS DEVEL ED WORKSHOPS $1,955.00 $5,000.00 $5,000.00$2,927.34 $6,000.00 $6,400.0001-331-2415-01-5-522 HS LIBRARY EXP $7,710.62 $6,400.00 $6,400.00
$149.60 $2,000.00 $1,000.0001-331-2415-01-5-523 EHS PHOTOGRAPHY $0.00 $1,000.00 $1,000.00
297
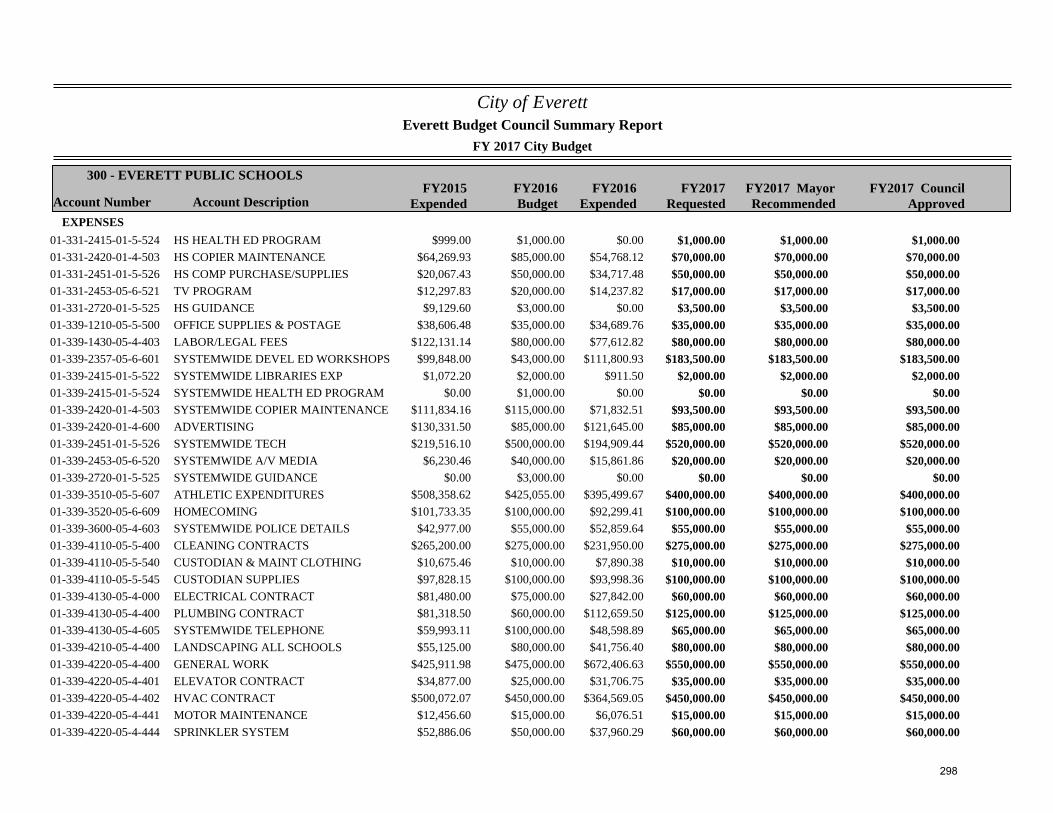
City of Everett
FY 2017 City Budget
Account Number Account DescriptionFY2015
ExpendedFY2016Budget
FY2017Requested
300 - EVERETT PUBLIC SCHOOLS
Everett Budget Council Summary Report
FY2017 MayorRecommended
FY2016Expended
FY2017 CouncilApproved
EXPENSES$999.00 $1,000.00 $1,000.0001-331-2415-01-5-524 HS HEALTH ED PROGRAM $0.00 $1,000.00 $1,000.00
$64,269.93 $85,000.00 $70,000.0001-331-2420-01-4-503 HS COPIER MAINTENANCE $54,768.12 $70,000.00 $70,000.00$20,067.43 $50,000.00 $50,000.0001-331-2451-01-5-526 HS COMP PURCHASE/SUPPLIES $34,717.48 $50,000.00 $50,000.00$12,297.83 $20,000.00 $17,000.0001-331-2453-05-6-521 TV PROGRAM $14,237.82 $17,000.00 $17,000.00$9,129.60 $3,000.00 $3,500.0001-331-2720-01-5-525 HS GUIDANCE $0.00 $3,500.00 $3,500.00
$38,606.48 $35,000.00 $35,000.0001-339-1210-05-5-500 OFFICE SUPPLIES & POSTAGE $34,689.76 $35,000.00 $35,000.00$122,131.14 $80,000.00 $80,000.0001-339-1430-05-4-403 LABOR/LEGAL FEES $77,612.82 $80,000.00 $80,000.00
$99,848.00 $43,000.00 $183,500.0001-339-2357-05-6-601 SYSTEMWIDE DEVEL ED WORKSHOPS $111,800.93 $183,500.00 $183,500.00$1,072.20 $2,000.00 $2,000.0001-339-2415-01-5-522 SYSTEMWIDE LIBRARIES EXP $911.50 $2,000.00 $2,000.00
$0.00 $1,000.00 $0.0001-339-2415-01-5-524 SYSTEMWIDE HEALTH ED PROGRAM $0.00 $0.00 $0.00$111,834.16 $115,000.00 $93,500.0001-339-2420-01-4-503 SYSTEMWIDE COPIER MAINTENANCE $71,832.51 $93,500.00 $93,500.00$130,331.50 $85,000.00 $85,000.0001-339-2420-01-4-600 ADVERTISING $121,645.00 $85,000.00 $85,000.00$219,516.10 $500,000.00 $520,000.0001-339-2451-01-5-526 SYSTEMWIDE TECH $194,909.44 $520,000.00 $520,000.00
$6,230.46 $40,000.00 $20,000.0001-339-2453-05-6-520 SYSTEMWIDE A/V MEDIA $15,861.86 $20,000.00 $20,000.00$0.00 $3,000.00 $0.0001-339-2720-01-5-525 SYSTEMWIDE GUIDANCE $0.00 $0.00 $0.00
$508,358.62 $425,055.00 $400,000.0001-339-3510-05-5-607 ATHLETIC EXPENDITURES $395,499.67 $400,000.00 $400,000.00$101,733.35 $100,000.00 $100,000.0001-339-3520-05-6-609 HOMECOMING $92,299.41 $100,000.00 $100,000.00
$42,977.00 $55,000.00 $55,000.0001-339-3600-05-4-603 SYSTEMWIDE POLICE DETAILS $52,859.64 $55,000.00 $55,000.00$265,200.00 $275,000.00 $275,000.0001-339-4110-05-5-400 CLEANING CONTRACTS $231,950.00 $275,000.00 $275,000.00
$10,675.46 $10,000.00 $10,000.0001-339-4110-05-5-540 CUSTODIAN & MAINT CLOTHING $7,890.38 $10,000.00 $10,000.00$97,828.15 $100,000.00 $100,000.0001-339-4110-05-5-545 CUSTODIAN SUPPLIES $93,998.36 $100,000.00 $100,000.00$81,480.00 $75,000.00 $60,000.0001-339-4130-05-4-000 ELECTRICAL CONTRACT $27,842.00 $60,000.00 $60,000.00$81,318.50 $60,000.00 $125,000.0001-339-4130-05-4-400 PLUMBING CONTRACT $112,659.50 $125,000.00 $125,000.00$59,993.11 $100,000.00 $65,000.0001-339-4130-05-4-605 SYSTEMWIDE TELEPHONE $48,598.89 $65,000.00 $65,000.00$55,125.00 $80,000.00 $80,000.0001-339-4210-05-4-400 LANDSCAPING ALL SCHOOLS $41,756.40 $80,000.00 $80,000.00
$425,911.98 $475,000.00 $550,000.0001-339-4220-05-4-400 GENERAL WORK $672,406.63 $550,000.00 $550,000.00$34,877.00 $25,000.00 $35,000.0001-339-4220-05-4-401 ELEVATOR CONTRACT $31,706.75 $35,000.00 $35,000.00
$500,072.07 $450,000.00 $450,000.0001-339-4220-05-4-402 HVAC CONTRACT $364,569.05 $450,000.00 $450,000.00$12,456.60 $15,000.00 $15,000.0001-339-4220-05-4-441 MOTOR MAINTENANCE $6,076.51 $15,000.00 $15,000.00$52,886.06 $50,000.00 $60,000.0001-339-4220-05-4-444 SPRINKLER SYSTEM $37,960.29 $60,000.00 $60,000.00
298
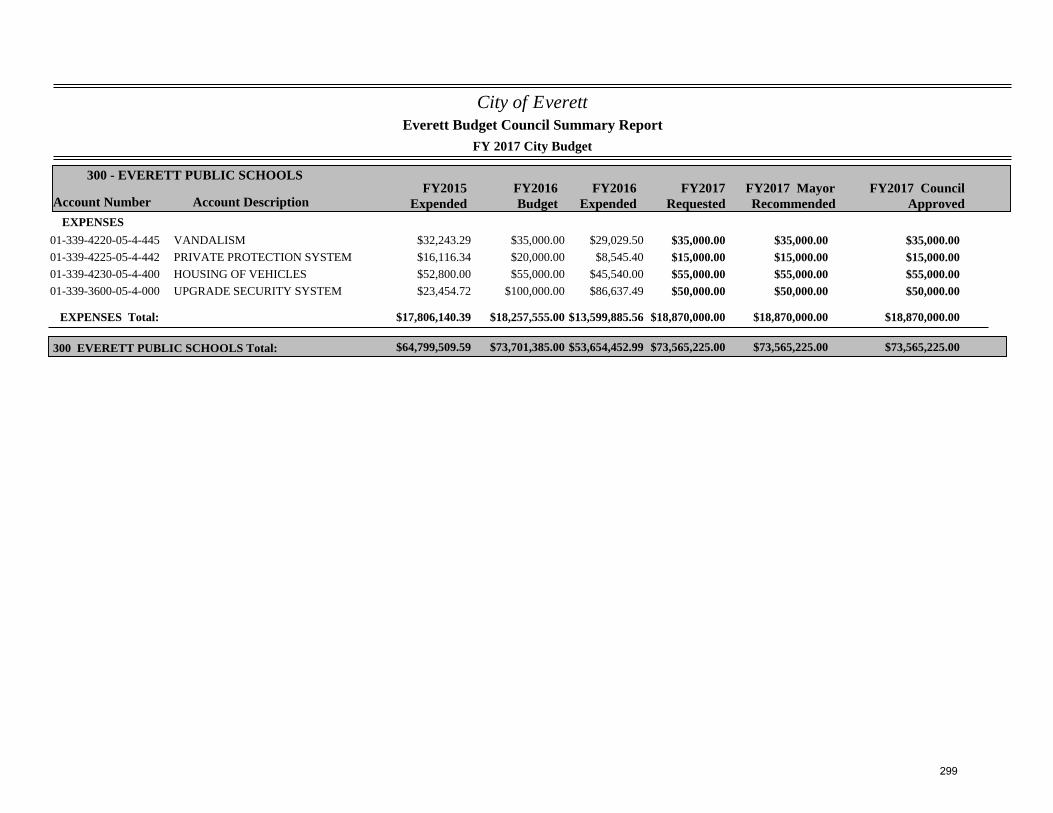
City of Everett
FY 2017 City Budget
Account Number Account DescriptionFY2015
ExpendedFY2016Budget
FY2017Requested
300 - EVERETT PUBLIC SCHOOLS
Everett Budget Council Summary Report
FY2017 MayorRecommended
FY2016Expended
FY2017 CouncilApproved
EXPENSES$32,243.29 $35,000.00 $35,000.0001-339-4220-05-4-445 VANDALISM $29,029.50 $35,000.00 $35,000.00$16,116.34 $20,000.00 $15,000.0001-339-4225-05-4-442 PRIVATE PROTECTION SYSTEM $8,545.40 $15,000.00 $15,000.00$52,800.00 $55,000.00 $55,000.0001-339-4230-05-4-400 HOUSING OF VEHICLES $45,540.00 $55,000.00 $55,000.00$23,454.72 $100,000.00 $50,000.0001-339-3600-05-4-000 UPGRADE SECURITY SYSTEM $86,637.49 $50,000.00 $50,000.00
EXPENSES Total: $17,806,140.39 $18,257,555.00 $18,870,000.00$13,599,885.56 $18,870,000.00 $18,870,000.00
$64,799,509.59 $73,701,385.00 $73,565,225.00300 EVERETT PUBLIC SCHOOLS Total: $53,654,452.99 $73,565,225.00 $73,565,225.00
299
- - �- 1 -
Everett Public Schools
Adopted Fiscal 2017 Budget
300
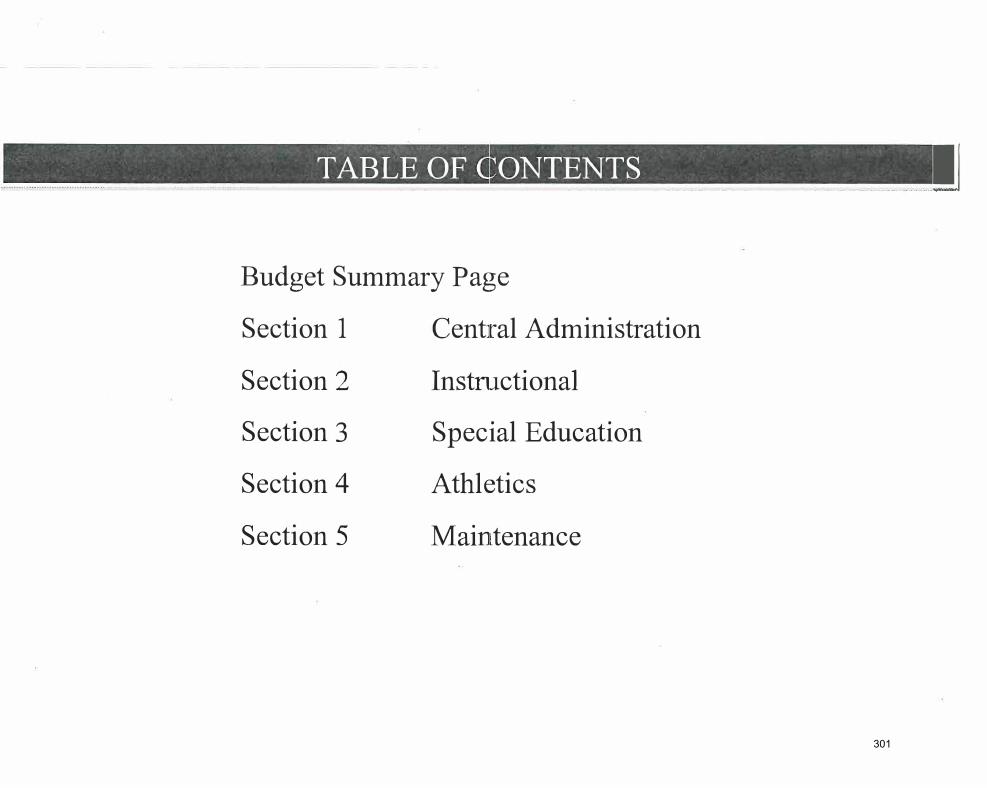
TABLE OF ONTENTS
Budget Summary Page
Section 1 Central Administration
Section 2
Section 3
Section 4
Section 5
Instn1ctional
Special Education
Athletics
Mai11tenance
..J
301
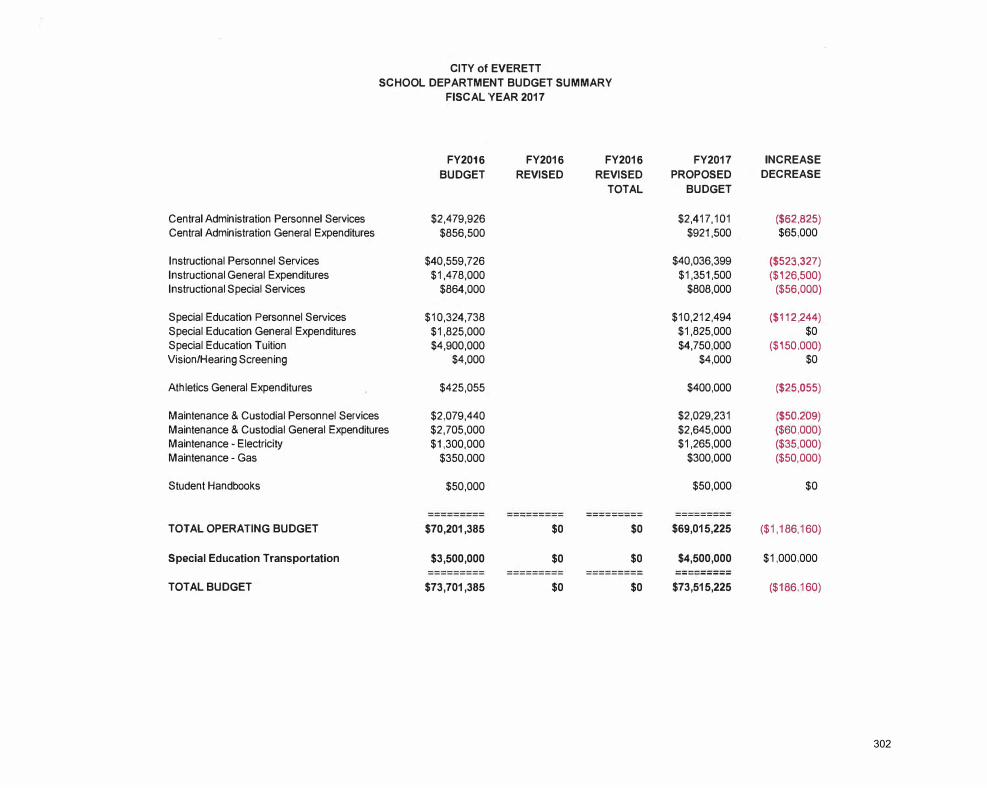
Central Administration Personnel Services Central Administration General Expenditures
Instructional Personnel Services Instructional General Expenditures Instructional Special Services
Special Education Personnel Services Special Education General Expenditures Special Education Tuition Vision/Hearing Screening
Athletics General Expenditures
Maintenance & Custodial Personnel Services
CITY of EVERETT
SCHOOL DEPARTMENT BUDGET SUMMARY
FISCAL YEAR 2017
FY2016 FY2016 FY2016
BUDGET REVISED REVISED
TOTAL
$2,479,926 $856,500
$40,559,726 $1,478,000
$864,000
$10,324,738 $1,825,000 $4,900,000
$4,000
$425,055
$2,079,440 Maintenance & Custodial General Expenditures $2,705,000 Maintenance - Electricity $1,300,000 Maintenance - Gas $350,000
Student Handbooks $50,000
--------- --------- ---------
TOTAL OPERATING BUDGET $70,201,385 $0 $0
Special Education Transportation $3,500,000 $0 $0 --------- --------- ---------
TOTAL BUDGET $73,701,385 $0 $0
FY2017 INCREASE
PROPOSED DECREASE
BUDGET
$2,417,101 ($62,825)
$921,500 $65,000
$40,036,399 ($523,327) $1,351,500 ($126,500)
$808,000 ($56,000)
$10,212,494 ($112,244) $1,825,000 $0 $4,750,000 ($150,000)
$4,000 $0
$400,000 ($25,055)
$2,029,231 ($50,209)
$2,645,000 ($60,000) $1,265,000 ($35,000)
$300,000 ($50,000)
$50,000 $0
---------
$69,015,225 ($1,186,160)
$4,500,000 $1,000,000 ---------
$73,515,225 ($186,160)
302
Section 1
Central Adn1inistration
303
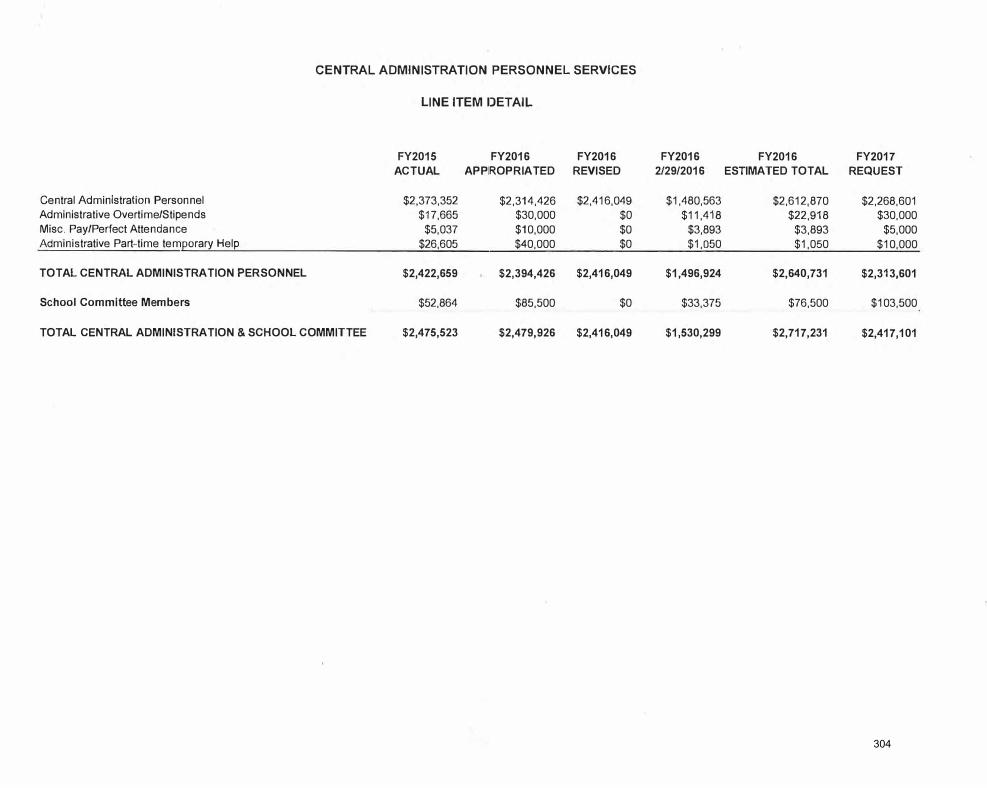
Central Administration Personnel Administrative Overtime/Stipends Misc. Pay/Perfect Attendance Administrative Part-time temeorary Help
TOTAL CENTRAL ADMINISTRATION PERSONNEL
School Committee Members
CENTRAL ADMINISTRATION PERSONNEL SERVICES
LINE ITEM DETAIL
FY2015 FY2016 FY2016 ACTUAL APPIROPRIATED REVISED
$2,373,352 $2,314,426 $2,416,049 $17,665 $30,000 $0
$5,037 $10,000 $0 $26,605 $40,000 $0
$2,422,659 $2,394,426 $2,416,049
$52,864 $85,500 $0
TOTAL CENTRAL ADMINISTRATION & SCHOOL COMMITTEE $2,475,523 $2,479,926 $2,416,049
FY2016 FY2016 FY2017 2/29/2016 ESTIMATED TOTAL REQUEST
$1,480,563 $2,612,870 $2,268,601 $11,418 $22,918 $30,000
$3,893 $3,893 $5,000 $1,050 $1,050 $10,000
$1,496,924 $2,640,731 $2,313,601
$33,375 $76,500 $103,500
$1,530,299 $2,717,231 $2,417,101
304
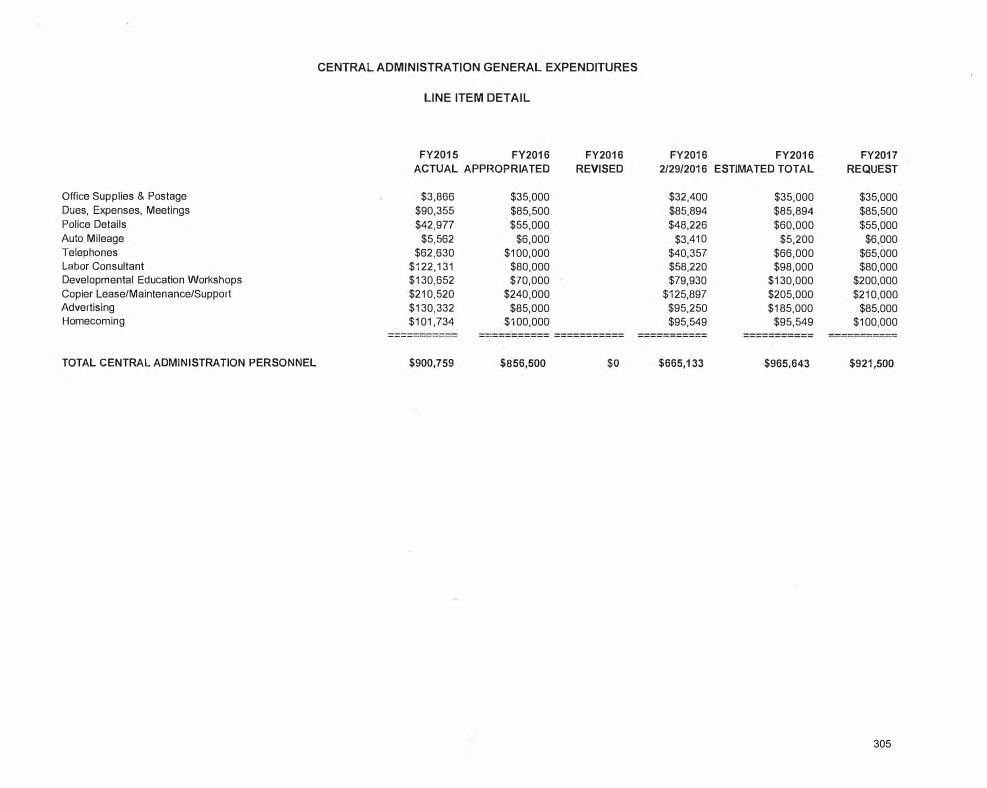
Office Supplies & Postage Dues, Expenses, Meetings Police Details Auto Mileage Telephones Labor Consultant Developmental Education Workshops Copier Lease/Maintenance/Support Advertising Homecoming
TOTAL CENTRAL ADMINISTRATION PERSONNEL
CENTRAL ADMINISTRATION GENERAL EXPENDITURES
LINE ITEM DETAIL
FY2015 FY2016 FY2016
ACTUAL APPHOPRIATED REVISED
$3,866 $90,355 $42,977
$5,562 $62,630
$122,131 $130,652 $210,520 $130,332 $101,734
-----------
$900,759
$35,000 $85,500 $55,000
$6,000 $100,000
$80,000 $70,000
$240,000 $85,000
$100,000 --·--------- -----------
$856,500 $0
FY2016 FY2016 FY2017
2/29/2016 ESTIMATED TOTAL REQUEST
$32,400 $35,000 $35,000 $85,894 $85,894 $85,500 $48,226 $60,000 $55,000
$3,410 $5,200 $6,000 $40,357 $66,000 $65,000 $58,220 $98,000 $80,000 $79,930 $130,000 $200,000
$125,897 $205,000 $210,000 $95,250 $185,000 $85,000 $95,549 $95,549 $100,000
----------- --------- -- -----------
$665,133 $965,643 $921,500
305
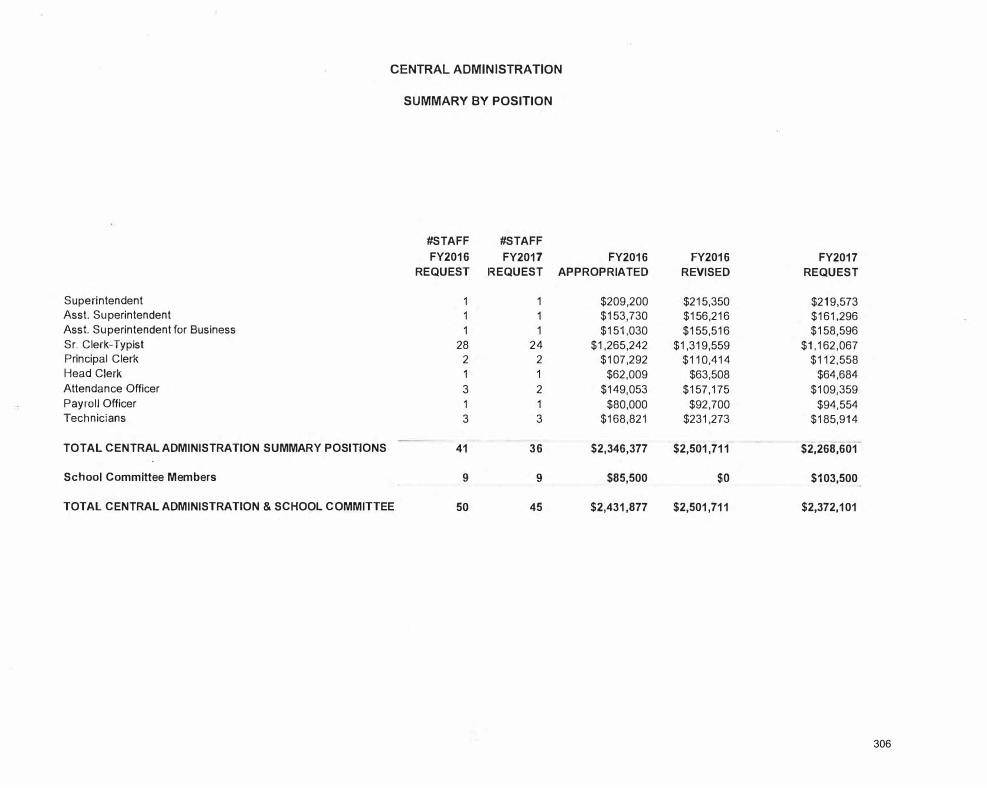
Superintendent Asst. Superintendent Asst. Superintendent for Business Sr. Clerk-Typist Principal Clerk Head Clerk Attendance Officer Payroll Officer Technicians
TOTAL CENTRAL ADMINISTRATION SUMMARY POSITIONS
School Committee Members
CENTRAL ADMINISTRATION
SUMMARY BY POSITION
#STAFF #STAFF FY2016 FY2017 FY2016
REQUEST !REQUEST APPROPRIATED
1 1 $209,200 1 1 $153,730 1 1 $151,030
28 24 $1,265,242 2 2 $107,292 1 1 $62,009 3 2 $149,053 1 1 $80,000 3 3 $168,821
41 36 $2,346,377
9 9 $85,500
TOTAL CENTRAL ADMINISTRATION & SCHOOL COMMITTEE 50 45 $2,431,877
FY2016 FY2017 REVISED REQUEST
$215,350 $219,573 $156,216 $161,296 $155,516 $158,596
$1,319,559 $1,162,067 $110,414 $112,558
$63,508 $64,684 $157,175 $109,359
$92,700 $94,554 $231,273 $185,914
$2,501,711 $2,268,601
$0 $103,500
$2,501,711 $2,372,101
306
Section 2
Instructional
307
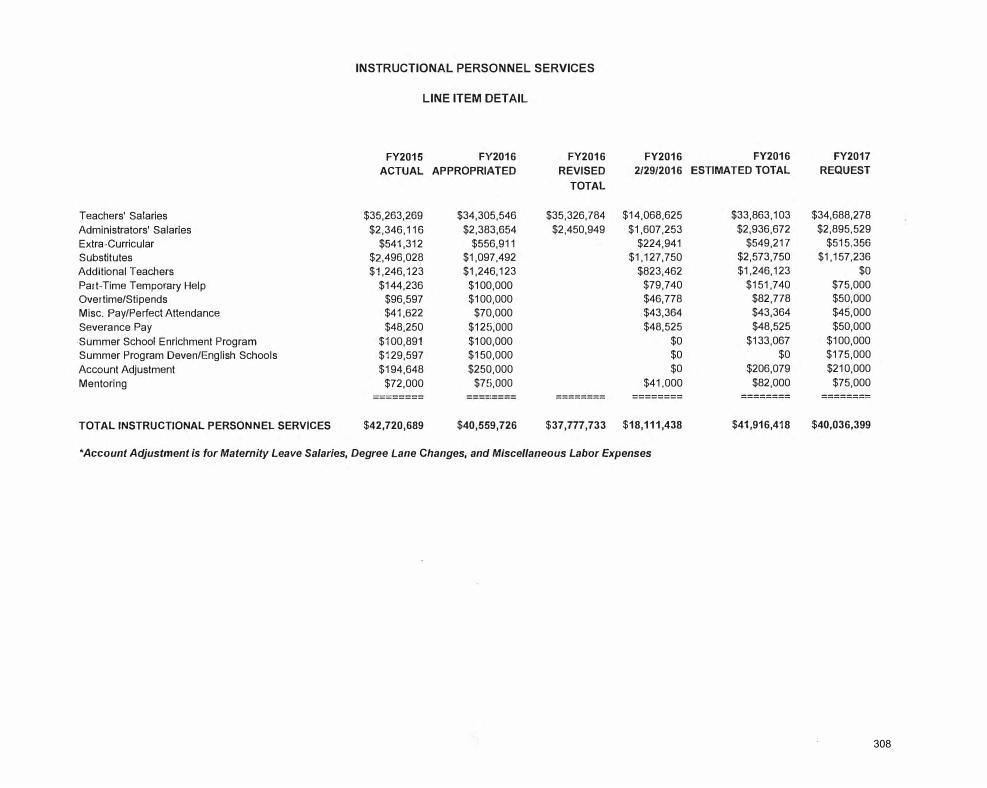
Teachers' Salaries Administrators' Salaries Extra-Curricular Substitutes Additional Teachers Part-Time Temporary Help Overtime/Stipends Misc. Pay/Perfect Attendance Severance Pay
-Summer School Enrichment ProgramSummer Program Deven/English SchoolsAccount Adjustment Mentoring
TOTAL INSTRUCTIONAL PERSONNEL SERVICES
INSTRUCTIONAL PERSONNEL SERVICES
LINE ITEM DETAIL
FY2015 FY2016 FY2016 ACTUAL APPROPRIATED REVISED
TOTAL
$35,263,269 $34,305,546 $35,326,784 $2,346,116 $2,383,654 $2,450,949
$541,312 $556,911 $2,496,028 $1,097,492 $1,246,123 $1,246,123
$144,236 $100,000 $96,597 $100,000 $41,622 $70,000 $48,250 $12�i,OOO
$100,891 $100,000 $129,597 $150,000 $194,648 $250,000
$72,000 $7Ei,OOO ======== --------- ========
$42,720,689 $40,559,726 $37,777,733
FY2016 2/29/2016
$14,068,625 $1,607,253
$224,941 $1,127,750
$823,462 $79,740 $46,778 $43,364 $48,525
$0 $0 $0
$41,000 ========
$18,111,438
*Account Adjustment is for Maternity Leave Salaries, Degree Lane Changes, and Miscellaneous Labor Expenses
FY2016 FY2017 ESTIMATED TOTAL REQUEST
$33,863,103 $34,688,278 $2,936,672 $2,895,529
$549,217 $515,356 $2,573,750 $1,157,236 $1,246,123 $0
$151,740 $75,000 $82,778 $50,000 $43,364 $45,000 $48,525 $50,000
$133,067 $100,000 $0 $175,000
$206,079 $210,000 $82,000 $75,000
======== =========
$41,916,418 $40,036,399
308
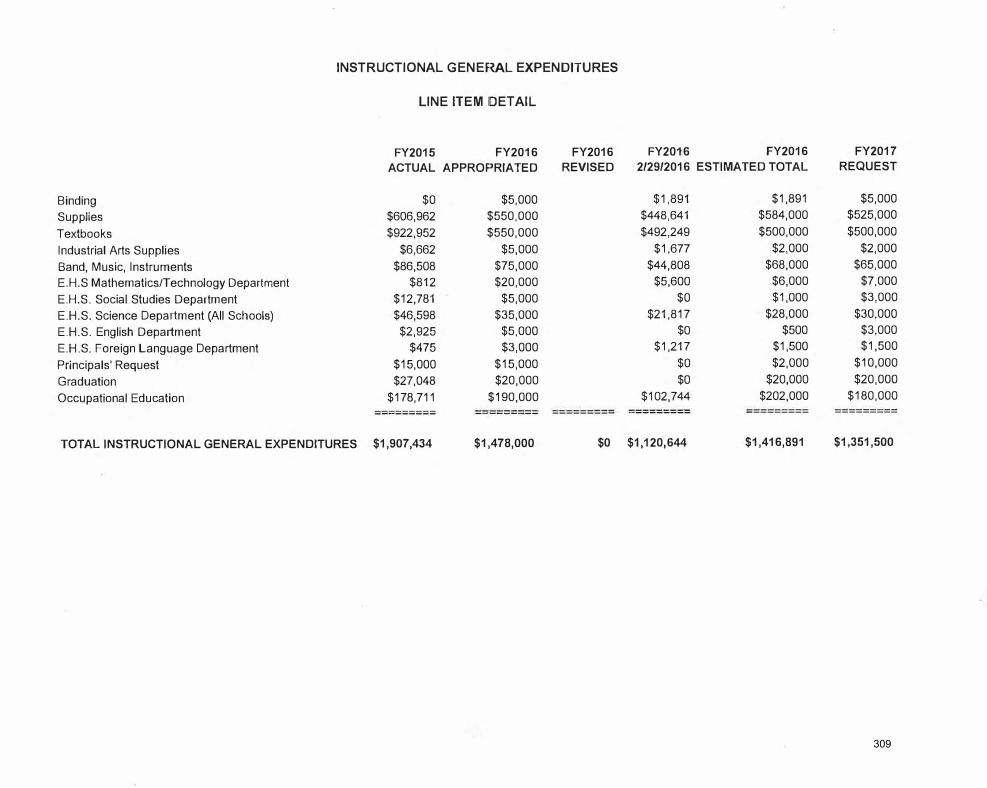
Binding Supplies Textbooks Industrial Arts Supplies Band, Music, Instruments E.H.S MathematicsfTechnology Department E.H.S. Social Studies Department E.H.S. Science Department (All Schools) E.H.S. English Department E.H.S. Foreign Language Department Principals' Request Graduation Occupational Education
INSTRUCTIONAL GENERAL EXPENDITURES
LINE ITEM DETAIL
FY2015 FY2016 FY2016 ACTUAL APPROPRIATED REVISED
$0 $5,000 $606,962 $550,000 $922,952 $550,000
$6,662 $5,000 $86,508 $75,000
$812 $20,000 $12,781 $5,000 $46,598 $35,000 $2,925 $5,000
$475 $3,000 $15,000 $15,000 $27,048 $20,000
$178,711 $190,000 --------- --------- ---------
TOTAL INSTRUCTIONAL GENERAL EXPENDITURES $1,907,434 $1,478,000 $0
FY2016 FY2016 FY2017 2/29/2016 ESTIMATED TOTAL REQUEST
$1,891 $1,891 $5,000 $448,641 $584,000 $525,000 $492,249 $500,000 $500,000
$1,677 $2,000 $2,000 $44,808 $68,000 $65,000
$5,600 $6,000 $7,000 $0 $1,000 $3,000
$21,817 $28,000 $30,000 $0 $500 $3,000
$1,217 $1,500 $1,500 $0 $2,000 $10,000 $0 $20,000 $20,000
$102,744 $202,000 $180,000 --------- --------- ---------
$1,120,644 $1,416,891 $1,351,500
309
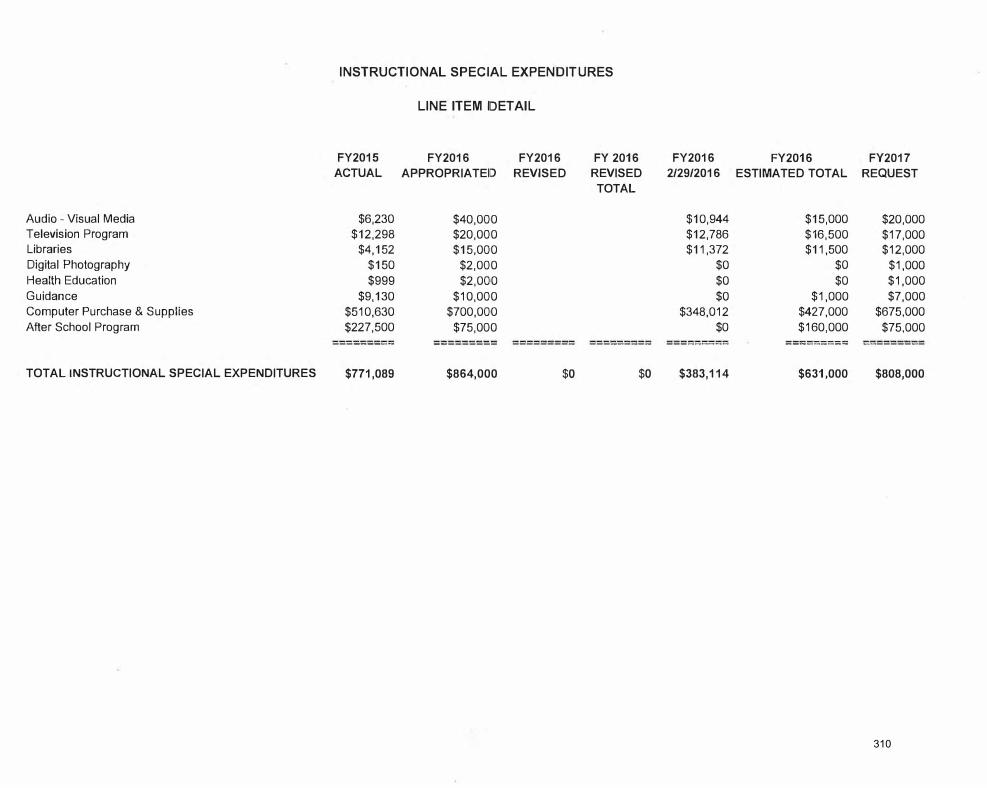
Audio - Visual Media Television Program Libraries Digital Photography Health Education Guidance Computer Purchase & Supplies After School Program
TOTAL INSTRUCTIONAL SPECIAL EXPENDITURES
INSTRUCTIONAL SPECIAL EXPENDITURES
LINE ITEM IDET AIL
FY2015 FY2016 FY2016 FY 2016 ACTUAL APPROPRIATEID REVISED REVISED
TOTAL
$6,230 $40,000 $12,298 $20,000
$4,152 $15,000 $150 $2,000 $999 $2,000
$9,130 $10,000 $510,630 $700,000 $227,500 $75,000
--------- --------- --------- ---------
$771,089 $864,000 $0 $0
FY2016 FY2016 FY2017 2/29/2016 ESTIMATED TOTAL REQUEST
$10,944 $15,000 $20,000 $12,786 $16,500 $17,000 $11,372 $11,500 $12,000
$0 $0 $1,000 $0 $0 $1,000 $0 $1,000 $7,000
$348,012 $427,000 $675,000 $0 $160,000 $75,000
------------------ --------- ---------
$383,114 $631,000 $808,000
310
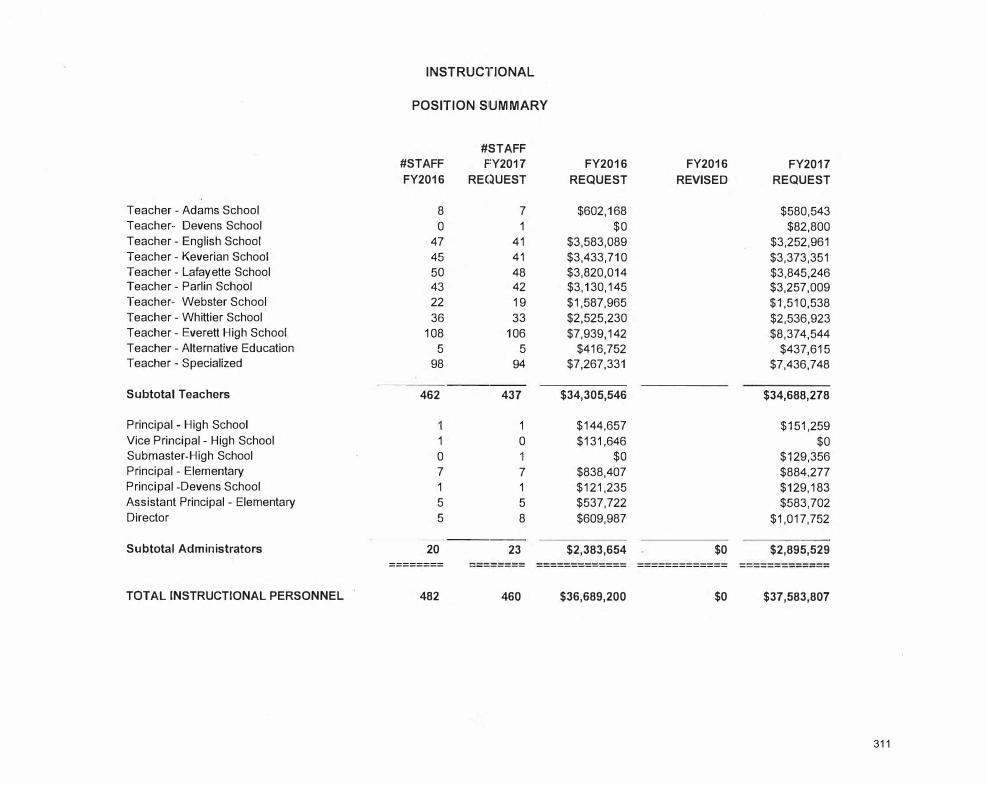
INSTRUClrlONAL
POSITION SUMMARY
#STAFF #STAFF FY2017 FY2016 FY2016 FY2017 FY2016 REC�UEST REQUEST REVISED REQUEST
Teach er - Adams School 8 7 $602,168 $580,543 Teacher- Devens School 0 1 $0 $82,800 Teacher - English School 47 41 $3,583,089 $3,252,961 Teacher - Keverian School 45 41 $3,433,710 $3,373,351 Teacher - Lafayette School 50 48 $3,820,014 $3,845,246 Teacher - Parlin School 43 42 $3,130,145 $3,257,009 Teacher- Webster School 22 19 $1,587,965 $1,510,538 Teacher - Whittier School 36 33 $2,525,230 $2,536,923 Teacher - Everett High School 108 106 $7,939,142 $8,374,544 Teacher - Alternative Education 5 5 $416,752 $437,615 Teacher - Specialized 98 94 $7,267,331 $7,436,748
Subtotal Teachers 462 437 $34,305,546 $34,688,278
Principal - High School 1 $144,657 $151,259 Vice Principal - High School 1 0 $131,646 $0 Submaster-High School 0 $0 $129,356 Principal - Elementary 7 7 $838,407 $884,277 Principal -Devens School 1 1 $121,235 $129,183 Assistant Principal - Elementary 5 5 $537,722 $583,702 Director 5 8 $609,987 $1,017,752
Subtotal Administrators 20 23 $2,383,654 $0 $2,895,529 ========= -------- ------------- ------------- -------------
TOTAL INSTRUCTIONAL PERSONNEL 482 460 $36,689,200 $0 $37,583,807
311
Section 3
Special Education
312
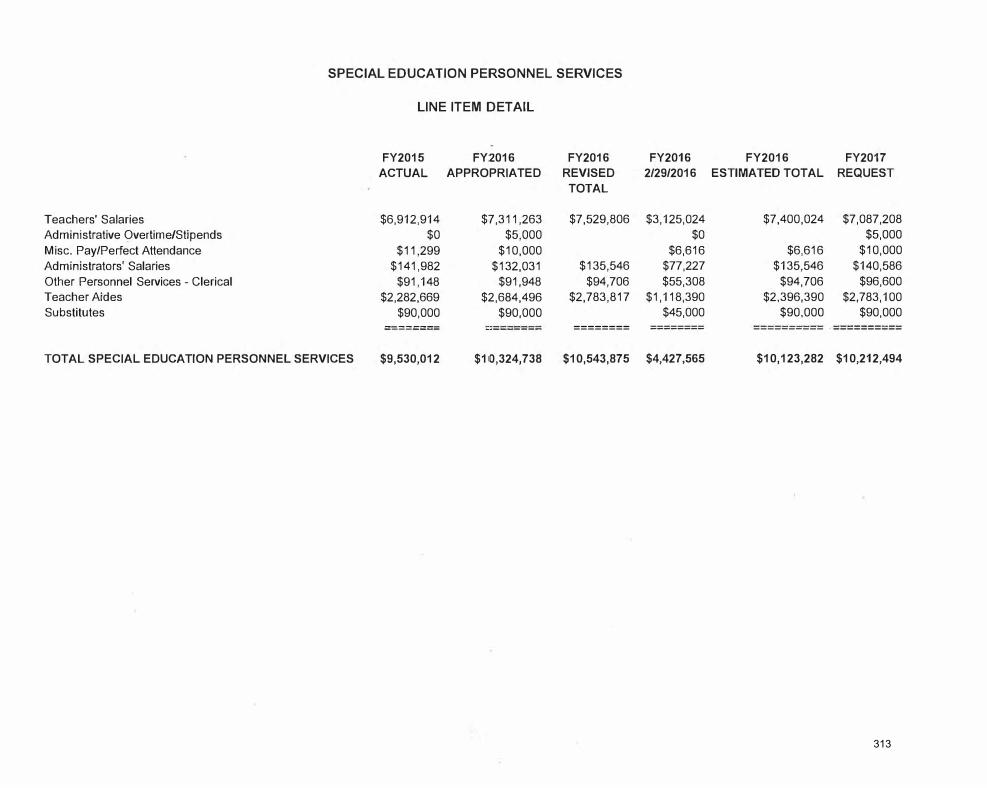
Teachers' Salaries Administrative Overtime/Stipends Misc. Pay/Perfect Attendance Administrators' Salaries Other Personnel Services - Clerical Teach er Aides Substitutes
SPECIAL EDUCATION PERSONNEL SERVICES
LINE ITEM DETAIL
FY2015 FY:2016 FY2016 ACTUAL APPROPRIATED REVISED
TOTAL
$6,912,914 $7,311,263 $7,529,806 $0 $5,000
$11,299 $10,000 $141,982 $132,031 $135,546
$91,148 $91,948 $94,706 $2,282,669 $2,684,496 $2,783,817
$90,000 $90,000 --------
--------- ======== --------
TOTAL SPECIAL EDUCATION PERSONNEL SERVICES $9,530,012 $110,324,738 $10,543,875
FY2016 FY2016 FY2017 2/29/2016 ESTIMATED TOTAL REQUEST
$3,125,024 $7,400,024 $7,087,208 $0 $5,000
$6,616 $6,616 $10,000 $77,227 $135,546 $140,586 $55,308 $94,706 $96,600
$1,118,390 $2,396,390 $2,783,100 $45,000 $90,000 $90,000
======== ---------- ·----------
$4,427,565 $10,123,282 $10,212,494
313
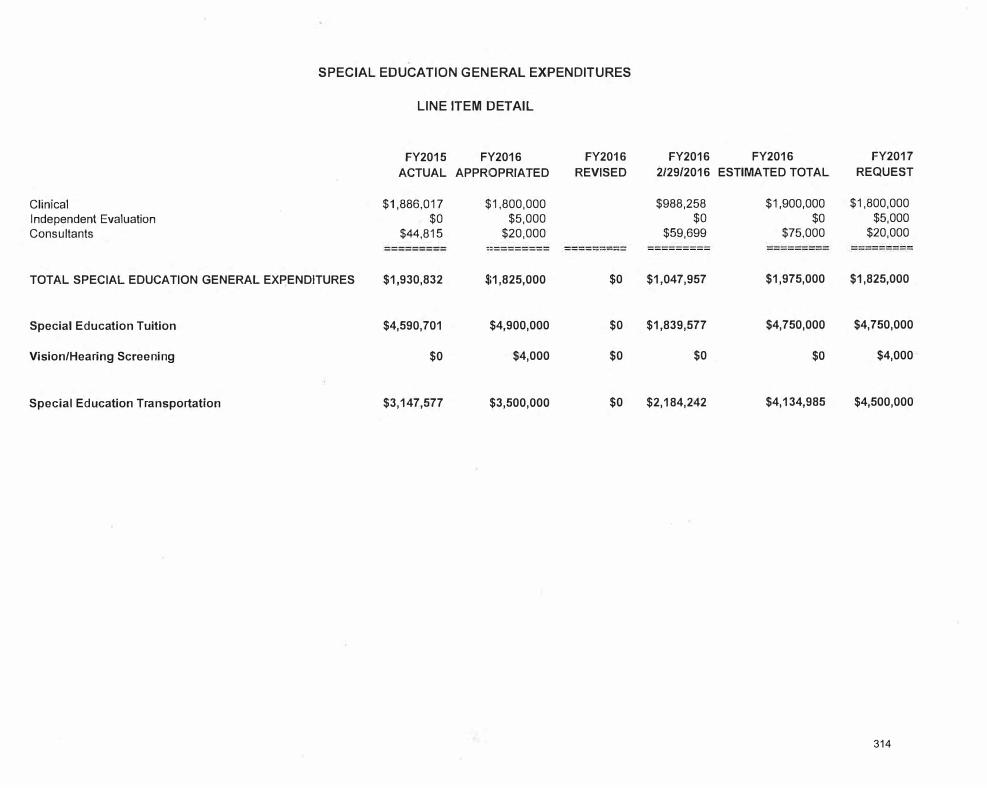
Clinical Independent Evaluation Consultants
SPECIAL EDUCATION GENERAL EXPENDITURES
LINE ITEM DETAIL
FY2015 FY2016 ACTUAL APPROPRIATED
$1,886,017 $1,800,000 $0 $5,000
$44,815 $20,000 --------- ----------
FY2016 REVISED
---------
TOTAL SPECIAL EDUCATION GENERAL EXPENDITURES $1,930,832 �i1 ,825,000 $0
Special Education Tuition $4,590,701 $4,900,000 $0
Vision/Hearing Screening $0 $4,000 $0
Special Education Transportation $3,147,577 $3,500,000 $0
FY2016 FY2016 2/29/2016 ESTIMATED TOTAL
$988,258 $0
$59,699 ---------
$1,047,957
$1,839,577
$0
$2,184,242
$1,900,000 $0
$75,000
$1,975,000
$4,750,000
$0
$4,134,985
FY2017 REQUEST
$1,800,000 $5,000
$20,000
$1,825,000
$4,750,000
$4,000
$4,500,000
314
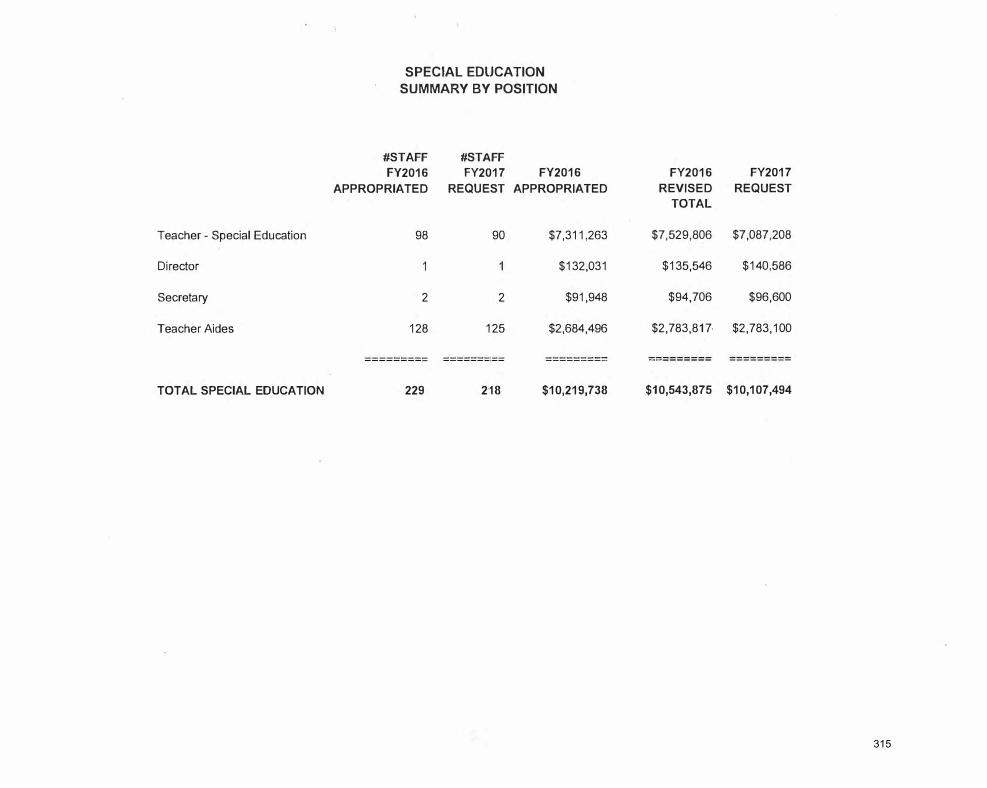
Teacher - Special Education
Director
Secretary
Teacher Aides
TOTAL SPECIAL EDUCATION
SPECIAL EDUCATION
SUMMARY BY POSITION
#STAFF #STA.FF FY2016 FY2017 FY2016
APPROPRIATED REQUEST APPROPRIATED
98 90 $7,311,263
$132,031
2 2 $91,948
128 125 $2,684,496
--------- -------·-- ---------
229 2'18 $10,219,738
FY2016 REVISED
TOTAL
$7,529,806
$135,546
$94,706
$2,783,817·
---------
$10,543,875
FY2017 REQUEST
$7,087,208
$140,586
$96,600
$2,783,100
------- ·-
$10,107,494
315
Section 4
Athle�tics
316
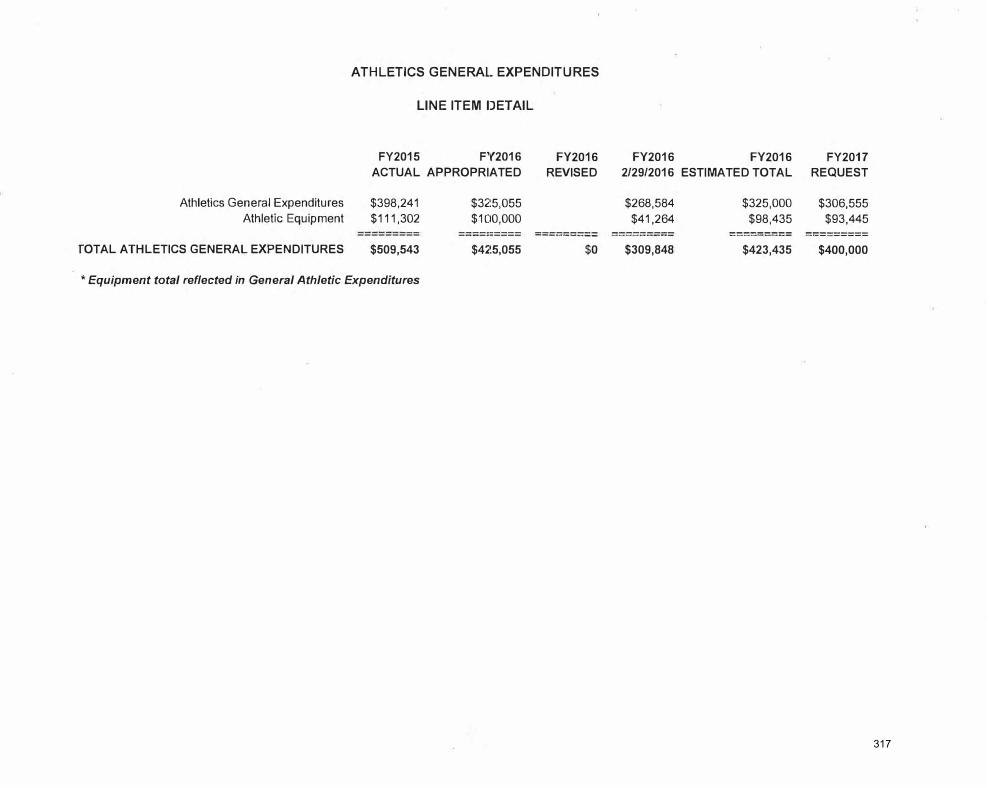
ATHLETICS GENERAL. EXPENDITURES
LINE ITEM IJET AIL
FY2015 FY2016 FY2016 FY2016 FY2016 FY2017 ACTUAL APPROPRIATED REVISED 2/29/2016 ESTIMATED TOTAL REQUEST
Athletics General Expenditures $398,241 $32'.5,055 $268,584 $325,000 $306,555 Athletic Equipment $111,302 $100,000 $41,264 $98,435 $93,445
------------------ ----·----- --------- --------- --------- ---------
TOTAL ATHLETICS GENERAL EXPENDITURES $509,543 $42'.5,055 $0 $309,848 $423,435 $400,000
* Equipment total reflected in General Athletic Expenditures
317
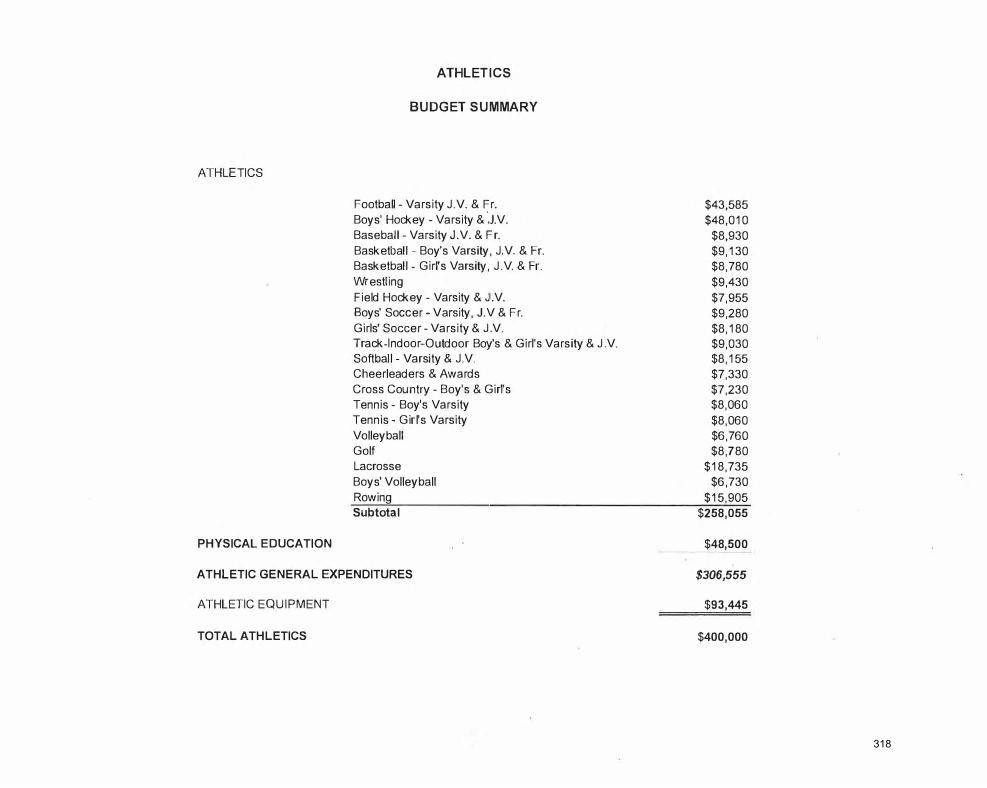
ATHLETICS
ATHLETICS
BUDGET SUMMARY
Football - Varsity J.V. & �r. Boys' Hockey - Varsity & .J.V. Baseball - Varsity J.V. & Fr. Basketball - Boy's Varsity, J.V. & Fr. Basketball - Girl's Varsity, J.V. & Fr. Wrestling Field Hockey - Varsity & J.V. Boys' Soccer - Varsity, J.V & Fr. Girls' Soccer - Varsity & J .V. Track-Indoor- Outdoor Boy's & Girl's Varsity & J .V. Softball - Varsity & J.V. Cheerleaders & Awards Cross Country - Boy's & Girl's Tennis - Boy's Varsity Tennis - Girl's Varsity Volleyball Golf Lacrosse Boys' Volleyball Rowing Subtotal
PHYSICAL EDUCATION
ATHLETIC GENERAL EXPENDITURES
ATHLETIC EQUIPMENT
TOTAL ATHLETICS
$43,585 $48,010
$8,930 $9,130 $8,780 $9,430 $7,955 $9,280 $8,180 $9,030 $8,155 $7,330 $7,230 $8,060 $8,060 $6,760 $8,780
$18,735 $6,730
$15,905 $258,055
$48,500
$306,555
$93,445
$400,000
318
Section 5
Mainte:nance
319
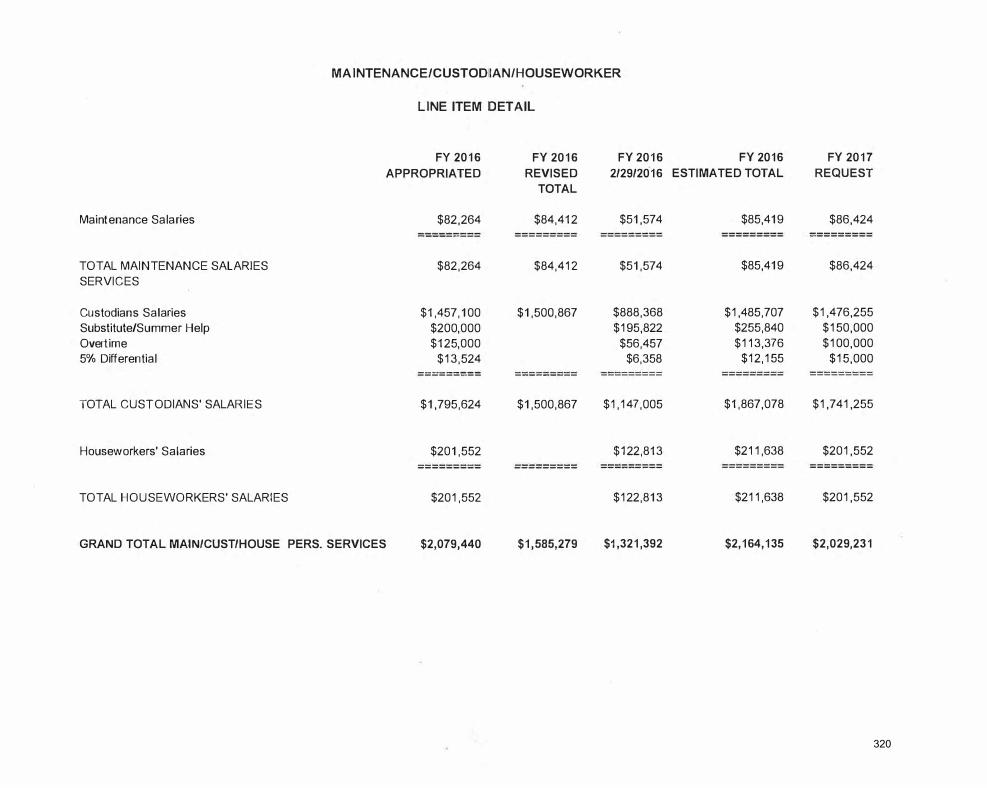
Maintenance Salaries
TOTAL MAINTENANCE SALARIES SERVICES
Custodians Salaries Substitute/Summer Help Overtime 5% Differential
TOTAL CUSTODIANS' SALARIES
Houseworkers' Salaries
TOTAL HOUSEWORKERS' SALARIES
MAINTENANCE/CUSTODIIAN/HOUSEWORKER
LINE ITEM IDET AIL
FY 2016 FY 2016 FY 2016 APPROPRIATED REVISED 2/29/2016
TOTAL
$82,264 $84,412 $51,574 --------- --------- ---------
$82,264 $84,412 $51,574
$1,457,100 $1,500,867 $888,368 $200,000 $195,822 $125,000 $56,457
$13,524 $6,358 ------------------ --------- ---------
$1,795,624 $1,500,867 $1,147,005
$201,552 $122,813 --------- --------- ---------
$201,552 $122,813
GRAND TOT AL MAIN/CUST/HOUSE PERS. SERVICES $2,079,440 $1,585,279 $1 ,321,392
FY 2016 FY 2017 ESTIMATED TOTAL REQUEST
$85,419 $86,424 --------- ---------
$85,419 $86,424
$1,485,707 $1,476,255 $255,840 $150,000 $113,376 $100,000
$12,155 $15,000 --------- ---------
$1,867,078 $1,741,255
$211,638 $201,552 --------- ---------
$211,638 $201,552
$2,164,135 $2,029,231
320
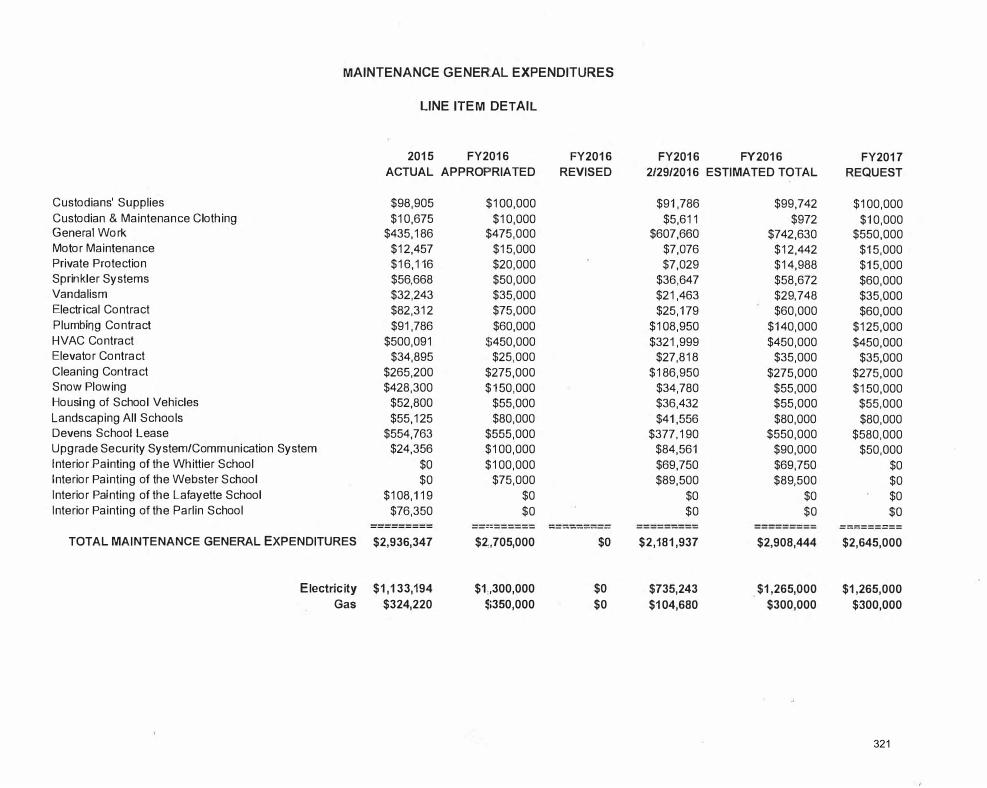
MAINTENANCE GENER:AL EXPENDITURES
LINE ITEM DETAIL
2015 FY2016 FY2016 FY2016 FY2016 FY2017 ACTUAL APPROPRIATED REVISED 2/29/2016 ESTIMATED TOTAL REQUEST
Custodians' Supplies $98,905 $100,000 $91,786 $99,742 $100,000 Custodian & Maintenance Clothing $10,675 $10,000 $5,611 $972 $10,000 General Work $435,186 $475,000 $607,660 $742,630 $550,000 Motor Maintenance $12,457 $15,000 $7,076 $12,442 $15,000 Private Protection $16,116 $20,000 $7,029 $14,988 $15,000 Sprinkler Systems $56,668 $50,000 $36,647 $58,672 $60,000 Vandalism $32,243 $35,000 $21,463 $29,748 $35,000 Electrical Contract $82,312 $75,000 $25,179 $60,000 $60,000 Plumbing Contract $91,786 $60,000 $108,950 $140,000 $125,000 HVAC Contract $500,091 $450,000 $321,999 $450,000 $450,000 Elevator Contract $34,895 $25,000 $27,818 $35,000 $35,000 Cleaning Contract $265,200 $275,000 $186,950 $275,000 $275,000 Snow Plowing $428,300 $ 150,000 $34,780 $55,000 $150,000 Housing of School Vehicles $52,800 $55,000 $36,432 $55,000 $55,000 Landscaping All Schools $55,125 $80,000 $41,556 $80,000 $80,000 Devens School Lease $554,763 $555,000 $377,190 $550,000 $580,000 Upgrade Security System/Communication System $24,356 $100,000 $84,561 $90,000 $50,000 Interior Painting of the Whittier School $0 $100,000 $69,750 $69,750 $0 Interior Painting of the Webster School $0 $75,000 $89,500 $89,500 $0 Interior Painting of the Lafayette School $108,119 $0 $0 $0 $0 Interior Painting of the Parlin School $76,350 $0 $0 $0 $0
--------- ---------- --------- --------- ---------------------------
TOTAL MAINTENANCE GENERAL EXPENDITURES $2,936,347 $2,,705,000 $0 $2,181,937 $2,908,444 $2,645,000
Electricity $1,133,194 $1,,300,000 $0 $735,243 $1,265,000 $1,265,000 Gas $324,220 �i350,000 $0 $104,680 $300,000 $300,000
321
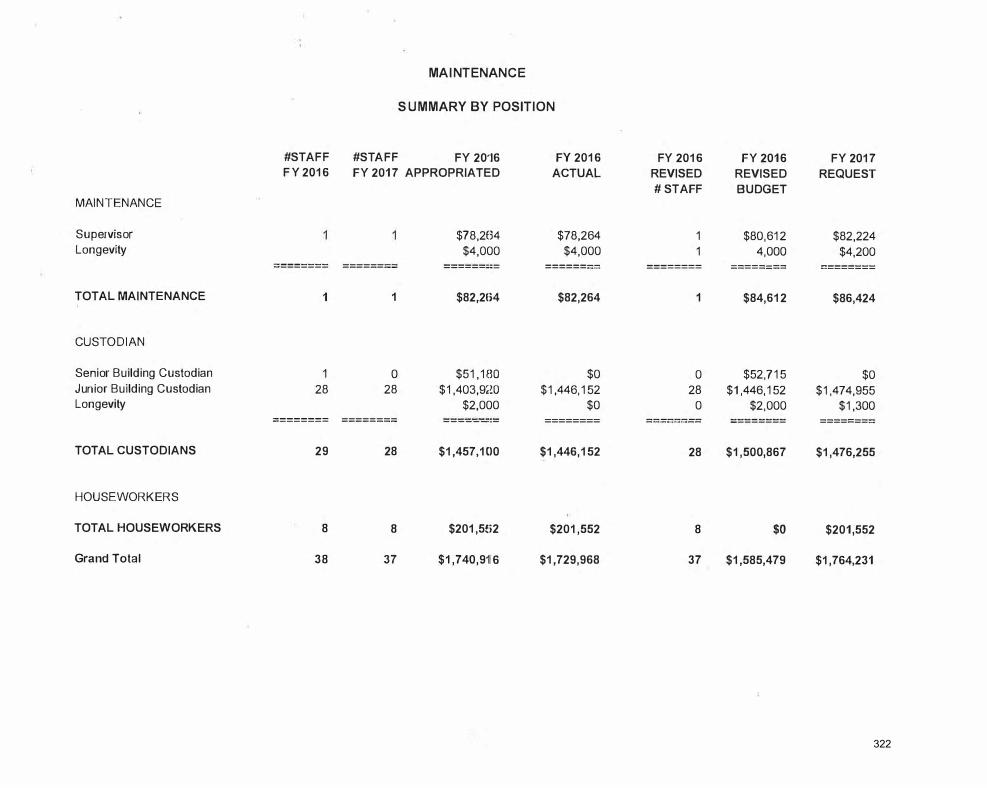
#STAF F F Y 2016
MAINTENANCE
Supervisor Longevity
========
TOTAL MAINTENANCE 1
CUSTODIAN
Senior Building Custodian 1 Junior Building Custodian 28 Longevity
========
TOTAL CUSTODIANS 29
HOUSEWORKERS
TOTAL HOUSEWORKERS 8
Grand Total 38
#STAFF
MAINTENANCE
SUMMARY BY POSITION
FY 20'16 FY 2016 FY 2017 APPROPRIATED ACTUAL
$78,2£34 $78,264 $4,000 $4,000
::;:::;::::;;;:; ------- -- ========
1 $82,21>4 $82,264
0 $51,1BO $0 28 $1,403,9�W $1,446,152
$2,000 $0 ====:::;:::::;:; --------- ========
28 $1,457,100 $1,446,152
8 $201,5fi2 $201,552
37 $1,740,911 6 $1,729,968
FY 2016 FY 2016 FY 2017 REVISED REVISED REQUEST # STAFF BUDGET
1 $80,612 $82,224 1 4,000 $4,200
======== :;::;:::;:::;::;::;:::::;:::;: ========
1 $84,612 $86,424
0 $52,715 $0 28 $1,446,152 $1,474,955
0 $2,000 $1,300 -------- -------- ====:::;=== -------- --------
28 $1,500,867 $1,476,255
8 $0 $201,552
37 $1,585,479 $1,764,231
322
Everett Public Schools
District Improvement Plan 2015-2016 2016-2017 2017-2018
323
EVERETT PUBLIC SCHOOLS DISTRICT IMPROVEMENT PLAN
The District Improvement Plan is the framework document for the Everett Public Schools. The district has identified five Core Values upon which its beliefs hinge. They are Student Achievement, Personal Growth, School Climate, Resources and Partnerships and Collaborations. The Core Values directly support the vision and mission of the district as outlined in this Plan. The specific strategies and district programs and protocols for implementation are elaborated in the District Strategic Plan (the action plan for implementation). While the District Improvement Plan shall be updated every three years, the District Strategic Plan shall be updated yearly with each activity being annotated according to their varying stages of implementation throughout the district as “complete”, “on-going” and “anticipated”.
Systemic professional development in all curriculum areas will support teacher performance standards as outlined in the new evaluation tool. Professional Development programs will strengthen pedagogy and curriculum refinement in accordance with the newly released Common Core documents. All School Improvement Plans across the district will document diagnostic and performance data of all students, thus ensuring best practices for assessing and evaluating the effectiveness of existing curricula and strategic placement of personnel.
Vision The Everett Public Schools collaborates with family and community to provide an environment that nurtures the unique capabilities of each student in order for them to become responsible learners and ethical, global citizens.
Mission The mission of the Everett Public Schools is to meet the needs of every student in our diverse learning communities. The Everett Public Schools is committed to providing a safe, supportive, challenging environment that empowers students to become productive members of society.
324
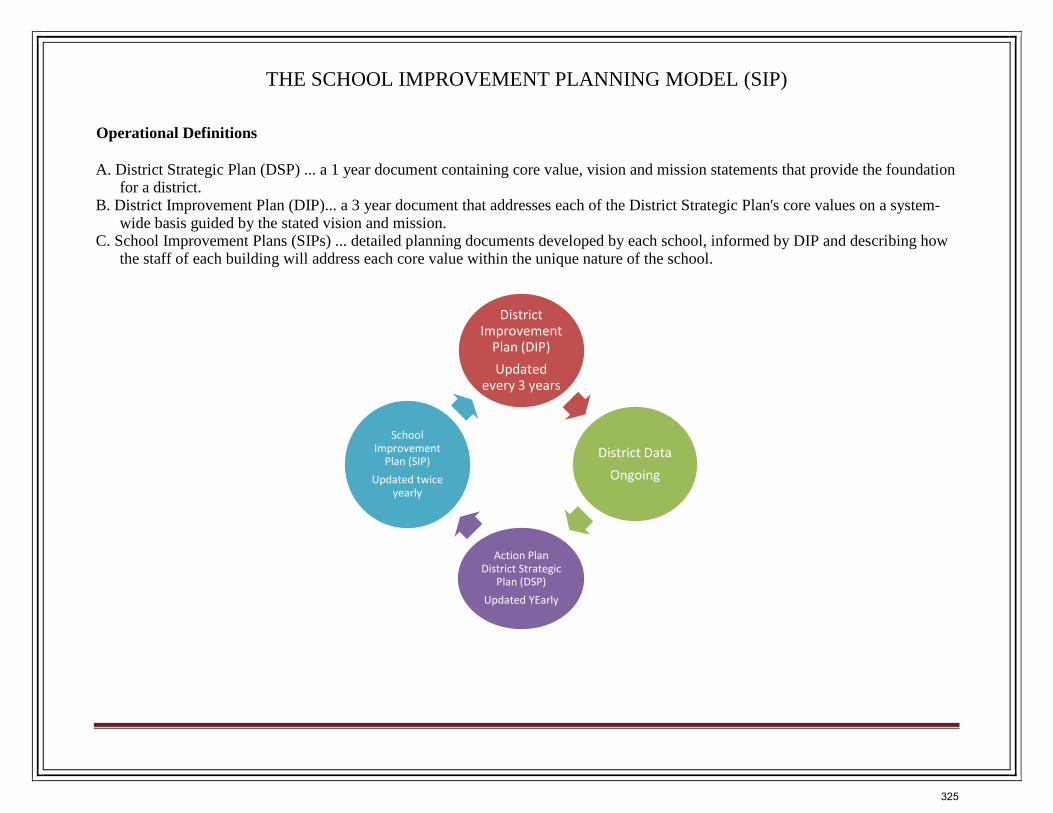
THE SCHOOL IMPROVEMENT PLANNING MODEL (SIP)
Operational Definitions
A. District Strategic Plan (DSP) ... a 1 year document containing core value, vision and mission statements that provide the foundationfor a district.
B. District Improvement Plan (DIP)... a 3 year document that addresses each of the District Strategic Plan's core values on a system-wide basis guided by the stated vision and mission.
C. School Improvement Plans (SIPs) ... detailed planning documents developed by each school, informed by DIP and describing howthe staff of each building will address each core value within the unique nature of the school.
District Improvement
Plan (DIP) Updated
every 3 years
District Data Ongoing
Action Plan District Strategic
Plan (DSP) Updated YEarly
School Improvement
Plan (SIP) Updated twice
yearly
325
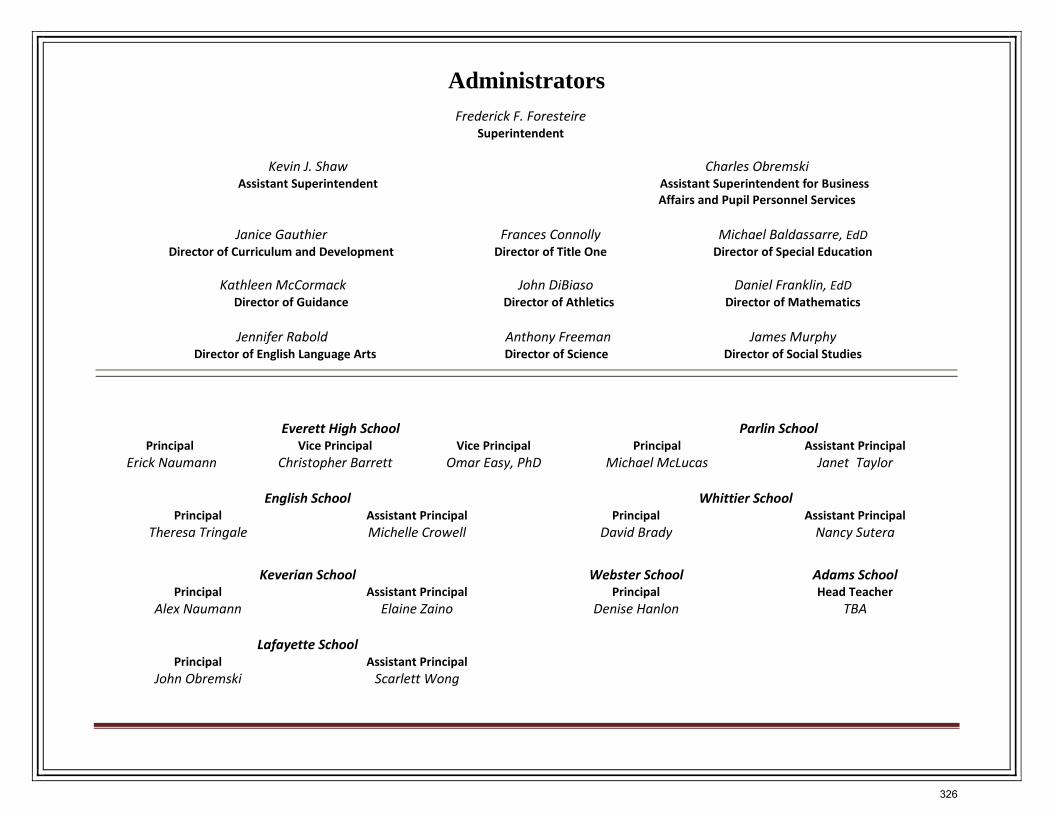
Administrators Frederick F. Foresteire
Superintendent
Kevin J. Shaw Assistant Superintendent
Charles Obremski Assistant Superintendent for Business
Affairs and Pupil Personnel Services
Janice Gauthier Director of Curriculum and Development
Frances Connolly Director of Title One
Michael Baldassarre, EdD Director of Special Education
Kathleen McCormack Director of Guidance
John DiBiaso Director of Athletics
Daniel Franklin, EdD Director of Mathematics
Jennifer Rabold Director of English Language Arts
Anthony Freeman Director of Science
James Murphy Director of Social Studies
Everett High School Parlin School Principal
Erick Naumann Vice Principal
Christopher Barrett Vice Principal
Omar Easy, PhD Principal
Michael McLucas Assistant Principal
Janet Taylor
English School Whittier School Principal
Theresa Tringale Assistant Principal Michelle Crowell
Principal David Brady
Assistant Principal Nancy Sutera
Keverian School Webster School Adams School Principal
Alex Naumann Assistant Principal
Elaine Zaino Principal
Denise Hanlon Head Teacher
TBA
Lafayette School Principal
John Obremski Assistant Principal
Scarlett Wong
326
Chair of Committee Mrs. Janice Gauthier
Director, English Language Arts Mrs. Katherine Scheidler
Director, Science Mr. Anthony Freeman
Director, Social Studies Mr. Nick Markos
Director of Libraries Mrs. Mary Puleo
Department Chair, Alternative Education Mr. John Hanrahan
Department Chair, Culinary Arts Ms. Despina Makredes
Department Chair, World Languages Ms. Andrea Tringali
Coordinator, Art Ms. Amanda Smith
Coordinator, Health Mrs. Jodi Ronci
Coordinator, Music Mr. Eugene O'Brien
Coordinator, Physical Education Ms. Tammy Turner
Coordinator, Special Education Elementary Mrs. Heidi Friedstein
Coordinator, Special Education Out-of-District Mrs. Donna Sweeney
Coordinator, English Language Learners Mrs. Ellen Berry
Clinical Coordinator, Guidance Counselors Ms. Carolyn Troy
327
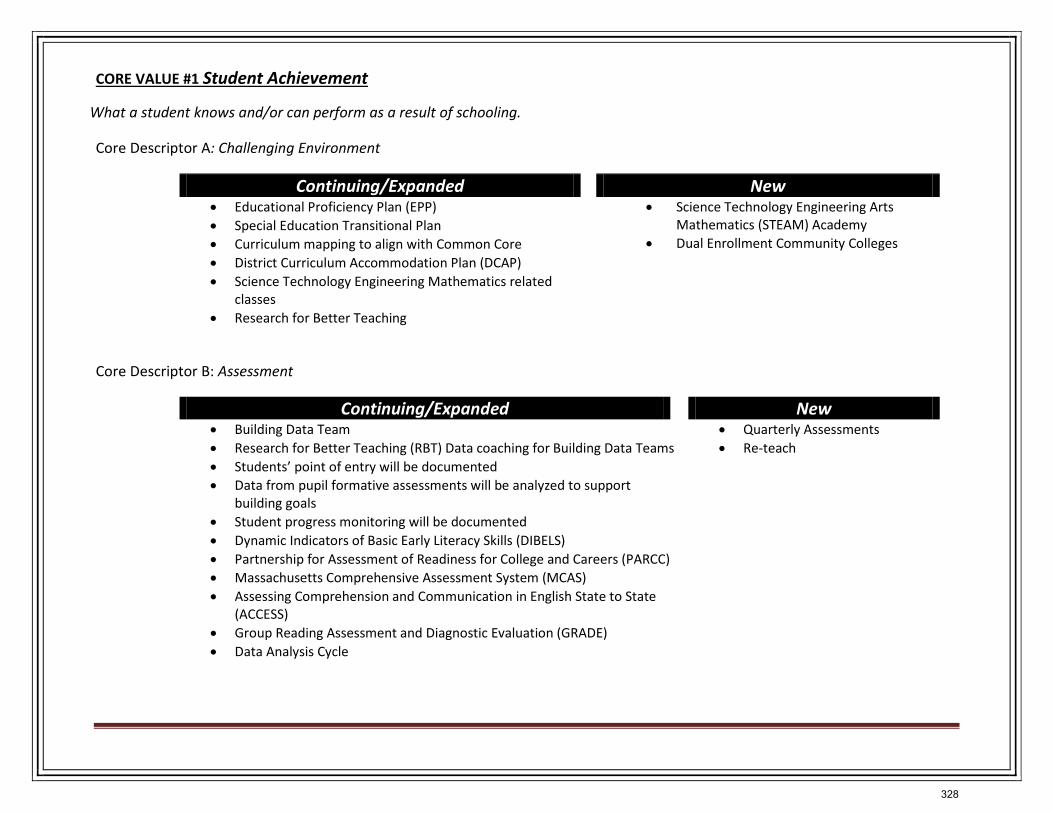
CORE VALUE #1 Student Achievement
What a student knows and/or can perform as a result of schooling.
Core Descriptor A: Challenging Environment
Continuing/Expanded New • Educational Proficiency Plan (EPP)• Special Education Transitional Plan• Curriculum mapping to align with Common Core• District Curriculum Accommodation Plan (DCAP)• Science Technology Engineering Mathematics related
classes• Research for Better Teaching
• Science Technology Engineering ArtsMathematics (STEAM) Academy
• Dual Enrollment Community Colleges
Core Descriptor B: Assessment
Continuing/Expanded New • Building Data Team• Research for Better Teaching (RBT) Data coaching for Building Data Teams• Students’ point of entry will be documented• Data from pupil formative assessments will be analyzed to support
building goals• Student progress monitoring will be documented• Dynamic Indicators of Basic Early Literacy Skills (DIBELS)• Partnership for Assessment of Readiness for College and Careers (PARCC)• Massachusetts Comprehensive Assessment System (MCAS)• Assessing Comprehension and Communication in English State to State
(ACCESS)• Group Reading Assessment and Diagnostic Evaluation (GRADE)• Data Analysis Cycle
• Quarterly Assessments• Re-teach
328
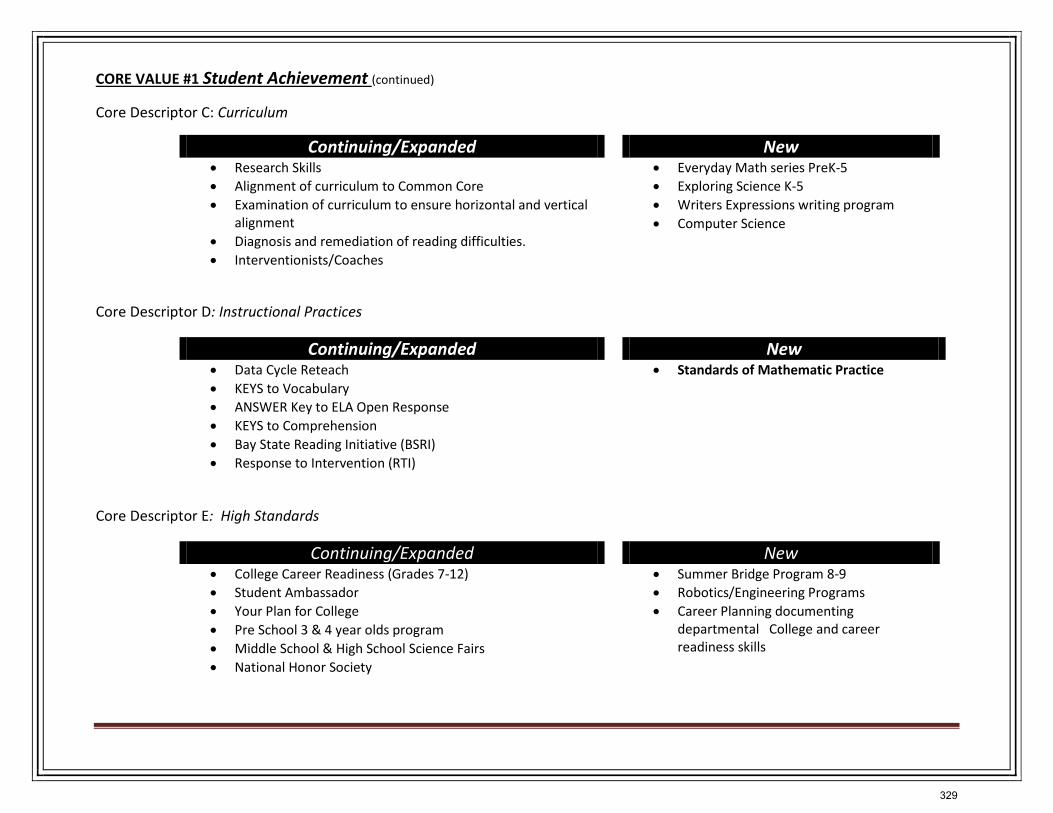
CORE VALUE #1 Student Achievement (continued)
Core Descriptor C: Curriculum
Continuing/Expanded New • Research Skills• Alignment of curriculum to Common Core• Examination of curriculum to ensure horizontal and vertical
alignment• Diagnosis and remediation of reading difficulties.• Interventionists/Coaches
• Everyday Math series PreK-5• Exploring Science K-5• Writers Expressions writing program• Computer Science
Core Descriptor D: Instructional Practices
Continuing/Expanded New • Data Cycle Reteach• KEYS to Vocabulary• ANSWER Key to ELA Open Response• KEYS to Comprehension• Bay State Reading Initiative (BSRI)• Response to Intervention (RTI)
• Standards of Mathematic Practice
Core Descriptor E: High Standards
Continuing/Expanded New • College Career Readiness (Grades 7-12)• Student Ambassador• Your Plan for College• Pre School 3 & 4 year olds program• Middle School & High School Science Fairs• National Honor Society
• Summer Bridge Program 8-9• Robotics/Engineering Programs• Career Planning documenting
departmental College and careerreadiness skills
329
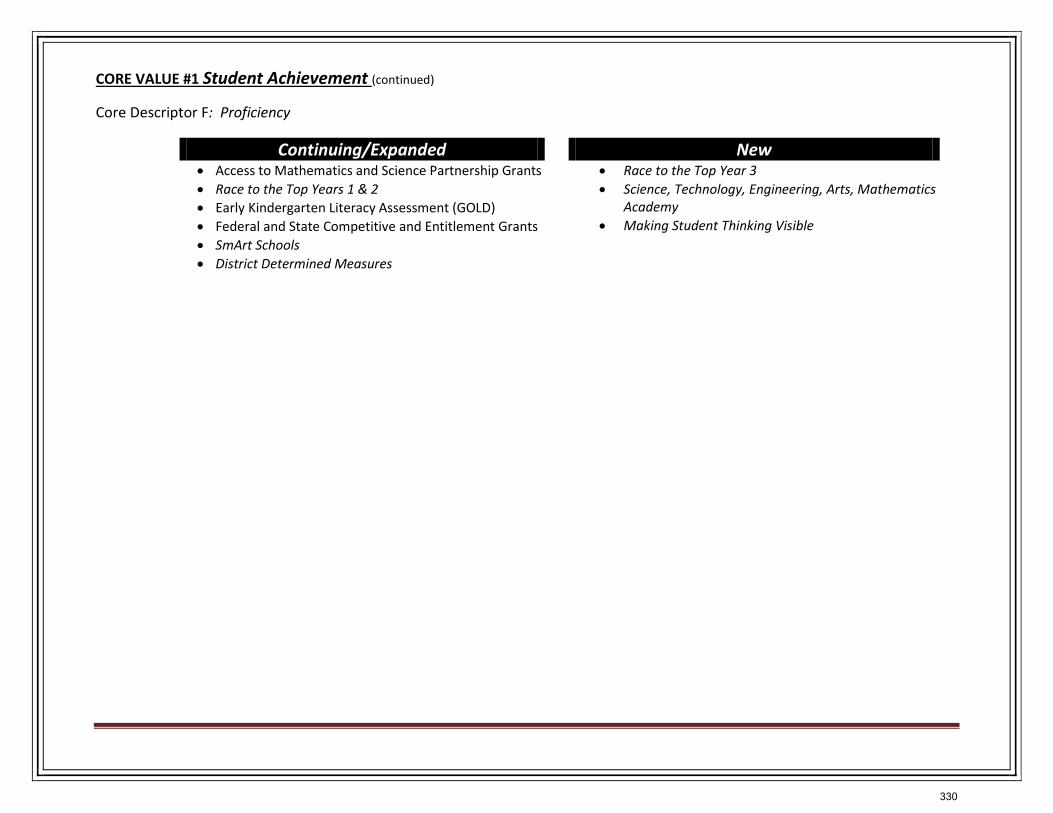
CORE VALUE #1 Student Achievement (continued)
Core Descriptor F: Proficiency
Continuing/Expanded New • Access to Mathematics and Science Partnership Grants• Race to the Top Years 1 & 2• Early Kindergarten Literacy Assessment (GOLD)• Federal and State Competitive and Entitlement Grants• SmArt Schools• District Determined Measures
• Race to the Top Year 3• Science, Technology, Engineering, Arts, Mathematics
Academy• Making Student Thinking Visible
330
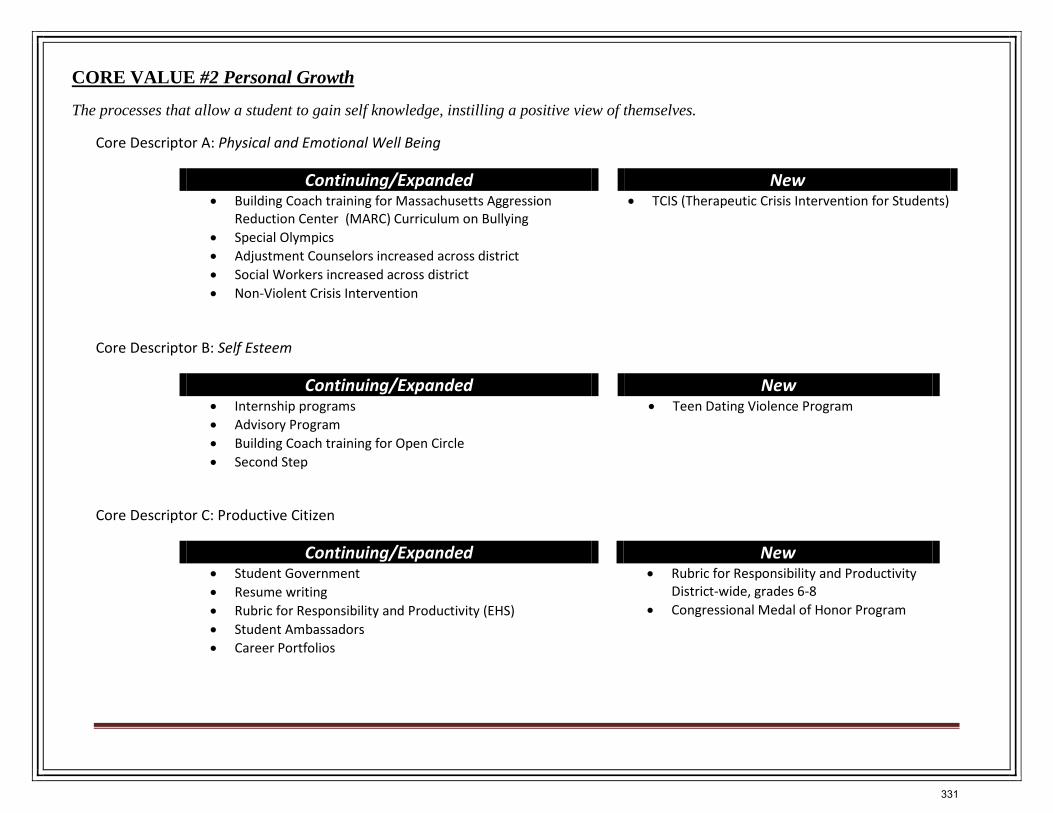
CORE VALUE #2 Personal Growth
The processes that allow a student to gain self knowledge, instilling a positive view of themselves.
Core Descriptor A: Physical and Emotional Well Being
Continuing/Expanded New • Building Coach training for Massachusetts Aggression
Reduction Center (MARC) Curriculum on Bullying• Special Olympics• Adjustment Counselors increased across district• Social Workers increased across district• Non-Violent Crisis Intervention
• TCIS (Therapeutic Crisis Intervention for Students)
Core Descriptor B: Self Esteem
Continuing/Expanded New • Internship programs• Advisory Program• Building Coach training for Open Circle• Second Step
• Teen Dating Violence Program
Core Descriptor C: Productive Citizen
Continuing/Expanded New • Student Government• Resume writing• Rubric for Responsibility and Productivity (EHS)• Student Ambassadors• Career Portfolios
• Rubric for Responsibility and ProductivityDistrict-wide, grades 6-8
• Congressional Medal of Honor Program
331
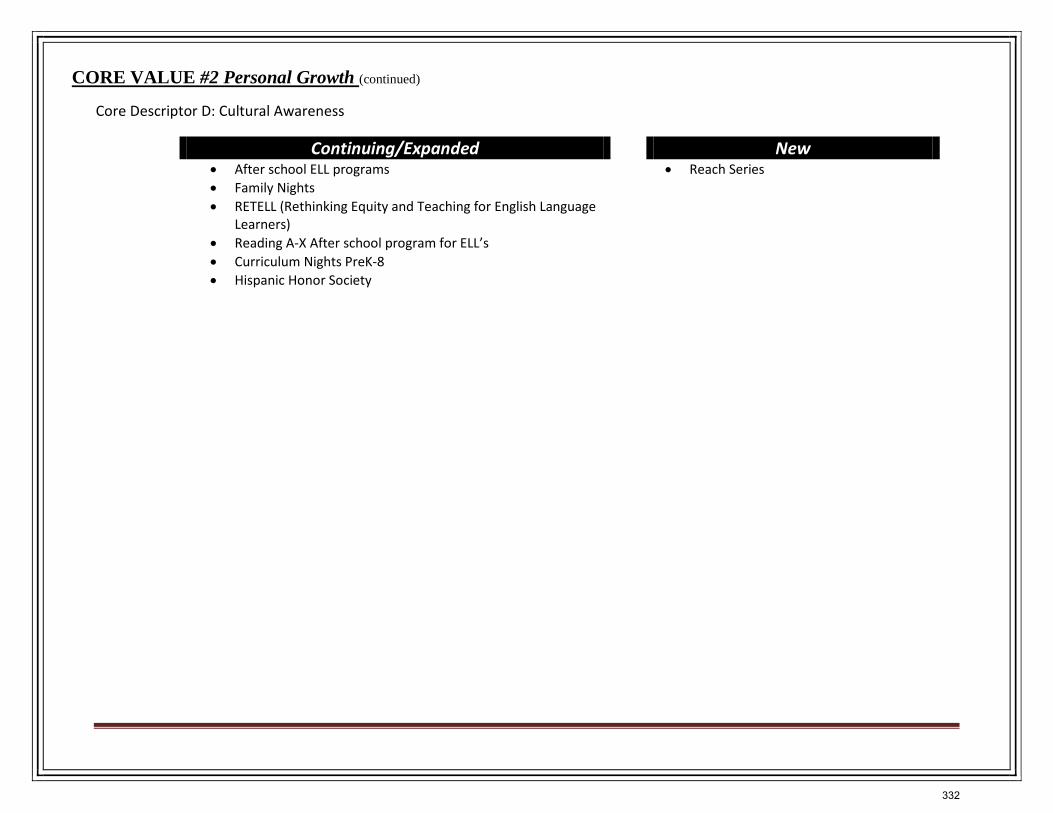
CORE VALUE #2 Personal Growth (continued)
Core Descriptor D: Cultural Awareness
Continuing/Expanded New • After school ELL programs• Family Nights• RETELL (Rethinking Equity and Teaching for English Language
Learners)• Reading A-X After school program for ELL’s• Curriculum Nights PreK-8• Hispanic Honor Society
• Reach Series
332
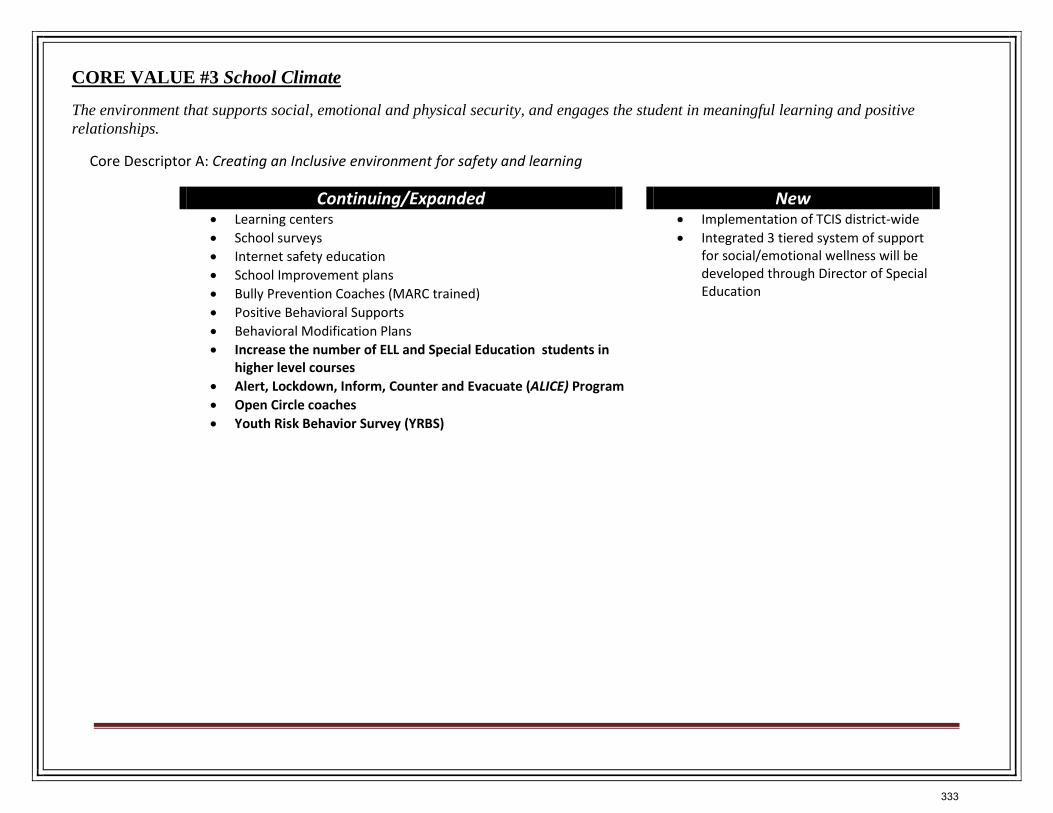
CORE VALUE #3 School Climate
The environment that supports social, emotional and physical security, and engages the student in meaningful learning and positive relationships.
Core Descriptor A: Creating an Inclusive environment for safety and learning
Continuing/Expanded New • Learning centers• School surveys• Internet safety education• School Improvement plans• Bully Prevention Coaches (MARC trained)• Positive Behavioral Supports• Behavioral Modification Plans• Increase the number of ELL and Special Education students in
higher level courses• Alert, Lockdown, Inform, Counter and Evacuate (ALICE) Program• Open Circle coaches• Youth Risk Behavior Survey (YRBS)
• Implementation of TCIS district-wide• Integrated 3 tiered system of support
for social/emotional wellness will bedeveloped through Director of SpecialEducation
333
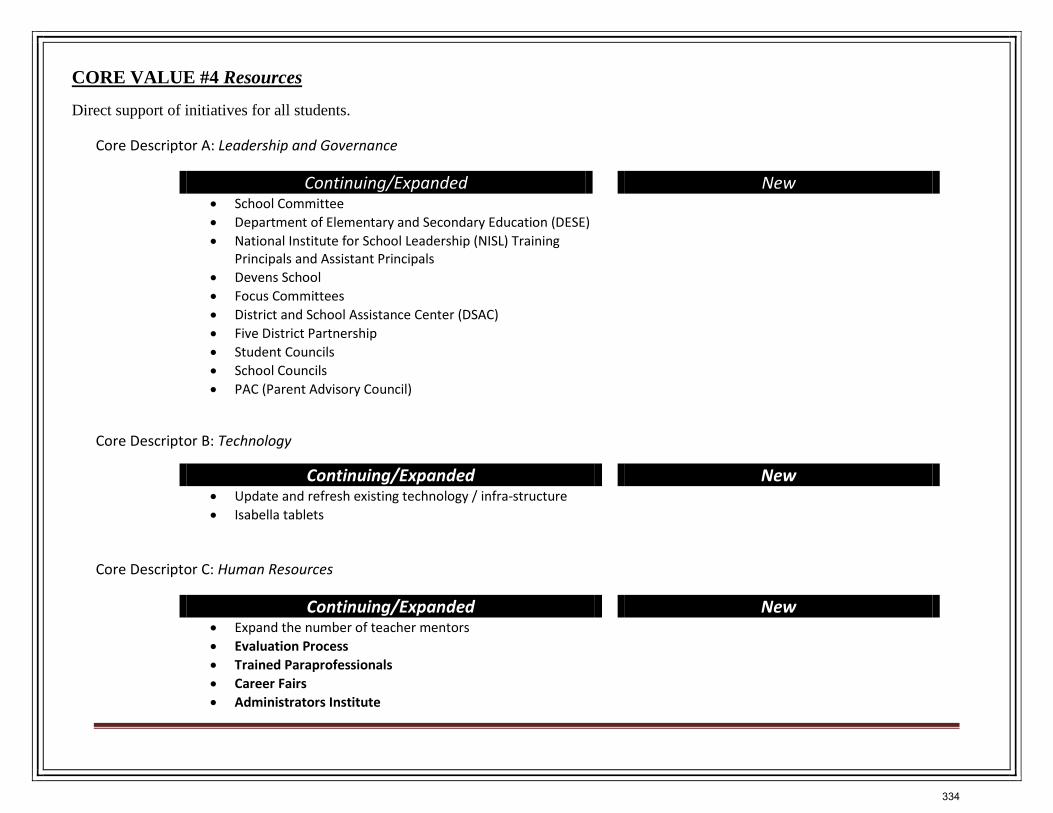
CORE VALUE #4 Resources
Direct support of initiatives for all students.
Core Descriptor A: Leadership and Governance
Continuing/Expanded New • School Committee• Department of Elementary and Secondary Education (DESE)• National Institute for School Leadership (NISL) Training
Principals and Assistant Principals• Devens School• Focus Committees• District and School Assistance Center (DSAC)• Five District Partnership• Student Councils• School Councils• PAC (Parent Advisory Council)
Core Descriptor B: Technology
Continuing/Expanded New • Update and refresh existing technology / infra-structure• Isabella tablets
Core Descriptor C: Human Resources
Continuing/Expanded New • Expand the number of teacher mentors• Evaluation Process• Trained Paraprofessionals• Career Fairs• Administrators Institute
334
CORE VALUE #4 Resources (continued)
Core Descriptor D: Professional Development
Continuing/Expanded New • RETELL- Rethinking Equity and Teaching for English Language
Learners• Ensure alignment of existing curriculum to the Common Core• Next Generation Science Standards
• Standards for Mathematical Practices• Use of new content series• Computer Programming & Apps
Core Descriptor E: Student Support
Continuing/Expanded New • Guidance Services• Full Day Kindergarten• Three and Four year old preschool program• Math & Literacy Coaches• Math & Literacy Interventionists• Credit Recovery• Gateway to College (Massasoit)
• Academic Intervention Center
335
CORE VALUE #5 Partnerships and Collaborations
Working with individuals and/or stakeholder groups, outside of the Everett Public Schools, to support a shared mission/vision.
Core Descriptor A: Parents/Families
Continuing/Expanded New • School Councils• Parent Information Center• Parent Advisory Council (PAC) meetings• Parent Teachers Organization• Translation services are provided in the four targeted
languages• School Messenger• Know Your School Better Night• Grade 8 Parents Night at Everett High School• Parents’ nights supported in the target languages
Core Descriptor B: Community Stakeholders
Continuing/Expanded New • Volunteer Readers• Social Services Agencies (Eliot Mental Health Services,
Cambridge Health Alliance, and Department of Children andFamily Services)
• Community Judges for academic presentations• Partnerships with community agencies to support academics
(STEAM, Robotics, History, Science Fairs) (moved from right)• Kiwanis• Rotary• Distrigas• Chamber of Commerce
• Mental Health Summit
336
CORE VALUE #5 Partnerships and Collaborations(continued)
Core Descriptor C: Higher Education
Continuing/Expanded New • College and Career Readiness• Governor’s STEM Council• University of Massachusetts- Boston• Salem State University• Boston University Program in Mathematics for Young Scient
(PROMYS) Program• Boston College• Tri-City Technology Education Collaborative (TRITEC)• Lesley University
• Bunkerhill Community College• Massasoit Community College• Cambridge College
Core Descriptor D: Government Agencies
Continuing/Expanded New • The District Attorney’s Community Based Justice Task
Force meetings• Federal government educational mandates for all
students• Department of Secondary and Elementary
Education(DESE)• Grant Opportunities (Federal and State)• District School Assistance Center (DSAC) Opportunities
• District participation in yearly workshops in CommunitBased Justice
337
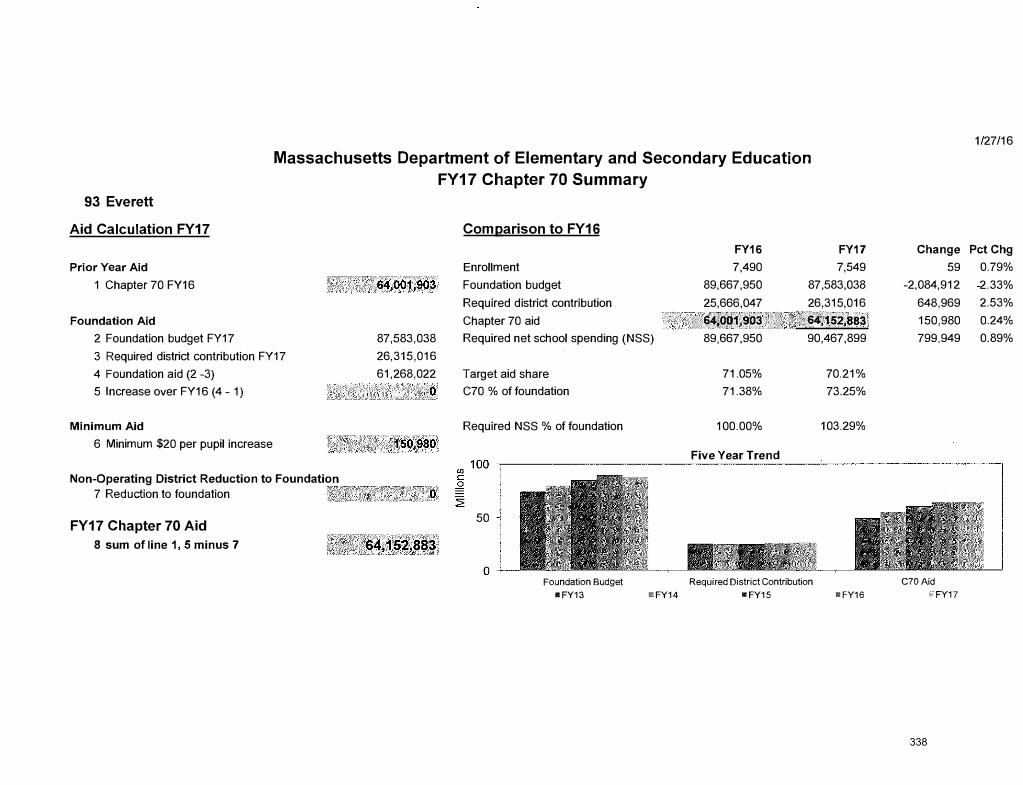
Massachusetts Department of Elementary and Secondary Education
FY17 Chapter 70 Summary
93 Everett
Aid Calculation FY17
Prior Year Aid
1 Chapter 70 FY16
Foundation Aid
2 Foundation budget FY17
3 Required district contribution FY17
4 Foundation aid (2 -3)
5 Increase over FY16 (4 - 1)
Minimum Aid
6 Minimum $20 per pupil increase
Non-Operating District Reduction to Foundation
7 Reduction to foundation
FY17 Chapter 70 Aid
8 sum ofline 1, 5 minus 7
87,583,038
26,315,016
61,268,022
Comparison to FY16
Enrollment
Foundation budget
Required district contribution
Chapter 70 aid
FY16
7,490
89,667,950
25,666,047 i '.j rf�tR>'.l/Jf �P�;rl' �
FY17
7,549
87,583,038
26,315,016
;,�[�4:!���sa' Required net school spending (NSS) 89,667,950 90,467,899
Target aid share
C70 % of foundation
Required NSS % of foundation
50
Foundation Budget
•FY13
71.05%
71.38%
100.00%
Five Year Trend
Required District Contribution
liliFY14 •FY15
70.21%
73.25%
103.29%
mFY16
Change
59
-2,084,912
648,969
150,980
799,949
C70Aid
ilFY17
1/27/16
Pct Chg
0.79%
-2.33%
2.53%
0.24%
0.89%
338
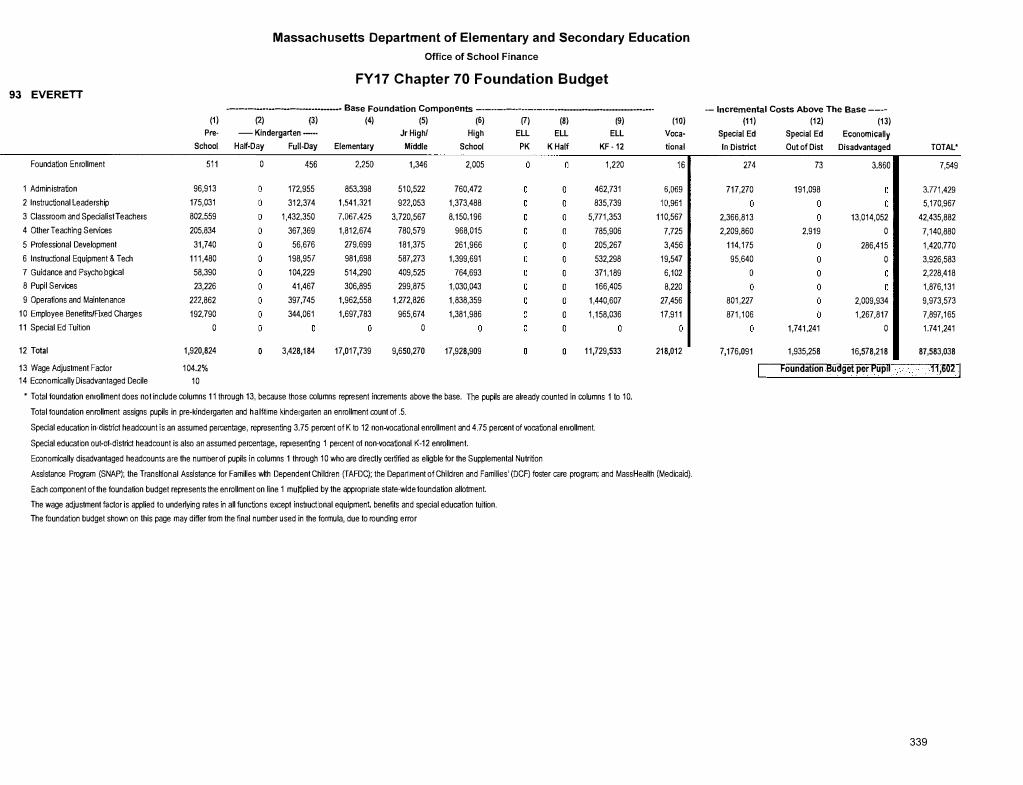
Massachusetts Department of Elementary and Secondary Education
Office of School Finance
FY17 Chapter 70 Foundation Budget 93 EVERETT
-----··----------· Base Foundation Components ----------------------------------
(1) �) (3) (4) (5) (6) �) (8) (9) Pra- - Kindergarten -·· Jr Hight High ELL ELL ELL
School Half-Day Full-Day Elementary Middle School PK KHalf KF-12
Foundation Enrollment 511 0 456 2,250 1,346 2,005 1,220
1 Administration 96,913 172,955 853,398 510,522 760,472 462,731 2 Instructional Leadership 175,031 312,374 1,541,321 922,053 1,373,488 835,739 3 Classroom and Specialist Teachers 802,559 1,432,350 7,067,425 3,720,567 8,150,196 5,771,353 4 Other Teaching Services 205,834 367,369 1,812,674 780,579 968,015 785,906 5 Professional Development 31,740 56,676 279,699 181,375 261,966 205,267 6 Instructional Equipment & Tech 111,480 198,957 981,698 587,273 1,399,691 532,298 7 Guidance and Psychological 58,390 104,229 514,290 409,525 764,693 371,189 8 Pupil Services 23,226 41,467 306,895 299,875 1,030,043 166,405 9 Operations and Maintenance 222,862 397,745 1,962,558 1,272,826 1,838,359 1,440,607
10 Employee Benefrts/Ftxed Charges 192,790 344,061 1,697,783 965,674 1,381,986 1,158,036 11 SpecialEdTuition 0 0
12 Total 1,920,824 3,428,184 17,017,739 9,650,270 17,928,909 11,729,533
13 Wage Adjustment Factor 104.2% 14 Economically Disadvantaged Decile 10
� Total foundation enrollment does not include columns 11 through 13, because those columns represent increments above the base. The pupils are already counted in columns 1 to 10.
Total foundation enrollment assigns pupils in pre-kindergarten and hal f-time kindergarten an enrollment count of .5.
Special education in-district headcount is an assumed percentage, representing 3.75 percent of K to 12 non-vocational enrollment and 4.75 percent of vocational enrollment.
Special education out-of-district headcount is also an assumed percentage, representing 1 percent of non-vocational K -12 enrollment.
Economically disadvantaged head counts are the number of pupils in columns 1 through 10 who are directly certified as eligble for the Supplemental Nutrition
(10) Voca-tional
16
6,069
10,961
110,567
7,725
3,456
19,547
6,102
8,220
27,456
17,911
218,012
Assistance Program {SNAP); the Transltional Assistance for Families wlth Dependent Children {TAFDC); the Department of Children and Families' (DCF} foster care program; and Mass Health (Medicaid).
Each component of the foundation budget represents the enrollment on line 1 multiplied by the appropriate state-wide foundation allotment.
The wage adjustment factor is applied to underlying rates in all functions except instructional equipment benefits and special education tuttion.
The foundation budget shown on this page may differ from the final number used in the formula, due to rounding error.
-- Incremental Costs Above The Base ----(11) (12) (13)
Special Ed Special Ed Econornico1lly In District Out of Dist Disadvantaged TOTAL*
274 73 3,860 7,549
717,270 191,098 3,771,429
5,170,967
2,366,813 13,014,052 42,435,882
2,209,860 2,919 0 7,140,880 114,175 286,415 1,420,770 95,640 0 3,926,583
0 2,228,418
1,876,131
801,227 2,009,934 9,973,573
871,106 1,267,817 7,897,165
1,741,241 0 1,741,241
7,176,091 1,935,258 16,578,218 87,583,038
Foundation Buclge{ per Pupil H,602 I
339
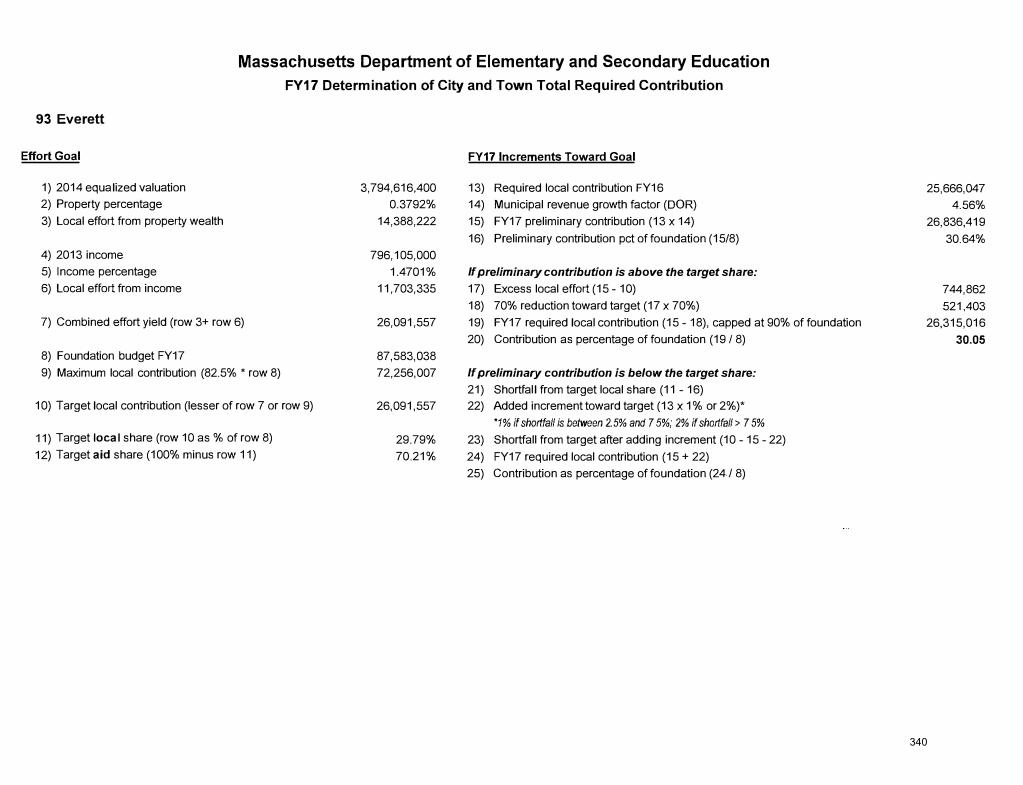
Massachusetts Department of Elementary and Secondary Education
FY17 Determination of City and Town Total Required Contribution
93 Everett
Effort Goal
1) 2014 equalized valuation
2) Property percentage
3) Local effort from property wealth
4) 2013 income
5) Income percentage
6) Local effort from income
7) Combined effort yield (row 3+ row 6)
8) Foundation budget FY17
9) Maxlmum local contribution (82.5% * row 8)
10) Target local contribution (lesser of row 7 or row 9)
11) Target local share (row 10 as % of row 8)
12) Target aid share (100% minus row 11)
3,794,616,400
0.3792%
14,388,222
796,105,000
1.4701%
11,703,335
26,091,557
87,583,038
72,256,007
26,091,557
29.79%
70.21%
FY17 Increments Toward Goal
13) Required local contribution FY16
14) Municipal revenue growth factor (DOR)
15) FY17 preliminary contribution (13 x 14)
16) Preliminary contribution pct of foundation (15/8)
If preliminary contribution is above the target share:
17) Excess local effort (15-10)
18) 70% reduction toward target (17 x 70%)
19) FY17 required local contribution (15 -18), capped at 90% of foundation
20) Contribution as percentage of foundation (19 / 8)
If preliminary contribution is below the target share:
21) Shortfall from target local share (11 -16)
22) Added increment toward target (13 x 1% or 2%)*
*1% if shortfall is between 2.5% and 7.5%; 2% if shortfall> 7.5%
23) Shortfall from target after adding increment (10 -15 -22)
24) FY17 required local contribution (15 + 22)
25) Contribution as percentage of foundation (24/ 8)
25,666,047
4.56%
26,836,419
30.64%
744,862
521,403
26,315,016
30.05
340
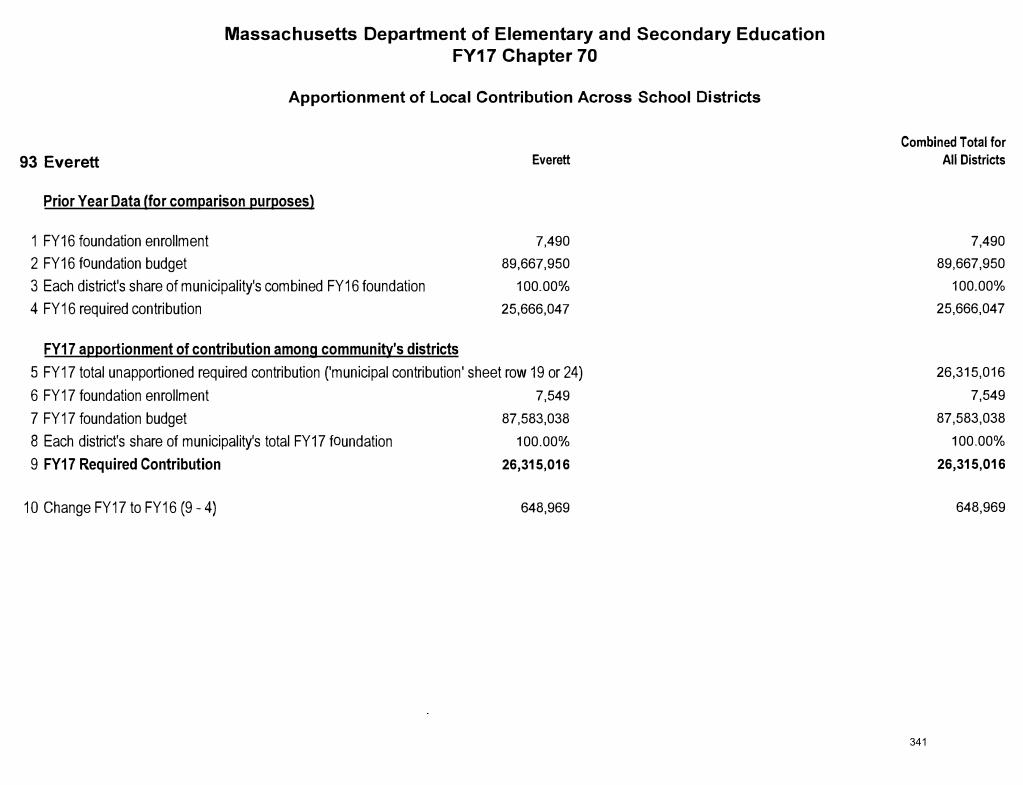
Massachusetts Department of Elementary and Secondary Education
FY17 Chapter 70
Apportionment of Local Contribution Across School Districts
93 Everett
Prior Year Data (for comparison purposes)
1 FY16 foundation enrollment
2 FY16 foundation budget
3 Each district's share of municipality's combined FY16 foundation
4 FY16 required contribution
FY17 apportionment of contribution among community's districts
Everett
7,490
89,667,950
100.00%
25,666,047
5 FY17 total unapportioned required contribution ('municipal contribution' sheet row 19 or 24)
6 FY17 foundation enrollment 7,549
7 FY17 foundation budget 87,583,038
8 Each district's share of municipality's total FY17 foundation
9 FY17 Required Contribution
10 Change FY17 to FY16 (9-4)
100.00%
26,315,016
648,969
Combined Total for
All Districts
7,490
89,667,950
100.00%
25,666,047
26,315,016
7,549
87,583,038
100.00%
26,315,016
648,969
341
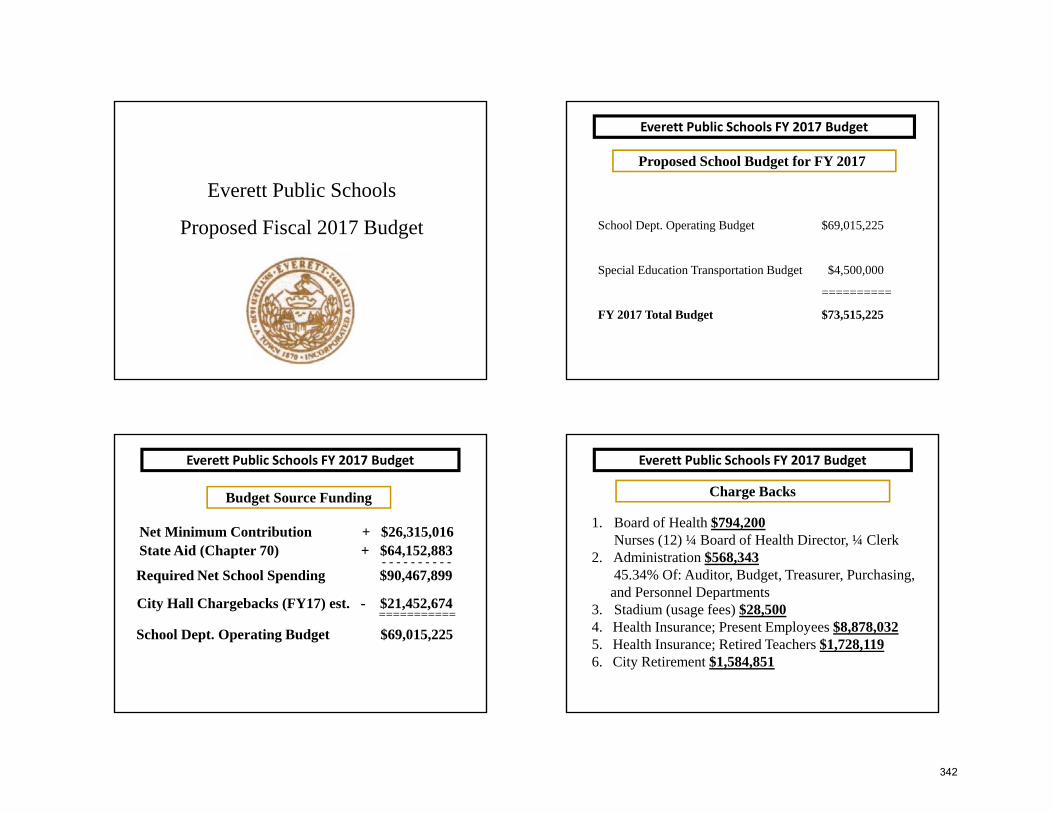
Everett Public Schools
Proposed Fiscal 2017 Budget
Everett Public Schools FY 2017 Budget
Proposed School Budget for FY 2017
School Dept. Operating Budget $69,015,225
Special Education Transportation Budget $4,500,000
==========
FY 2017 Total Budget $73,515,225
Net Minimum Contribution + $26,315,016State Aid (Chapter 70) + $64,152,883
- - - - - - - - - -Required Net School Spending $90,467,899
Budget Source Funding
City Hall Chargebacks (FY17) est. - $21,452,674===========
School Dept. Operating Budget $69,015,225
Everett Public Schools FY 2017 Budget
Charge Backs
Everett Public Schools FY 2017 Budget
1. Board of Health $794,200Nurses (12) ¼ Board of Health Director, ¼ Clerk
2. Administration $568,34345.34% Of: Auditor, Budget, Treasurer, Purchasing,and Personnel Departments
3. Stadium (usage fees) $28,5004. Health Insurance; Present Employees $8,878,0325. Health Insurance; Retired Teachers $1,728,1196. City Retirement $1,584,851
342
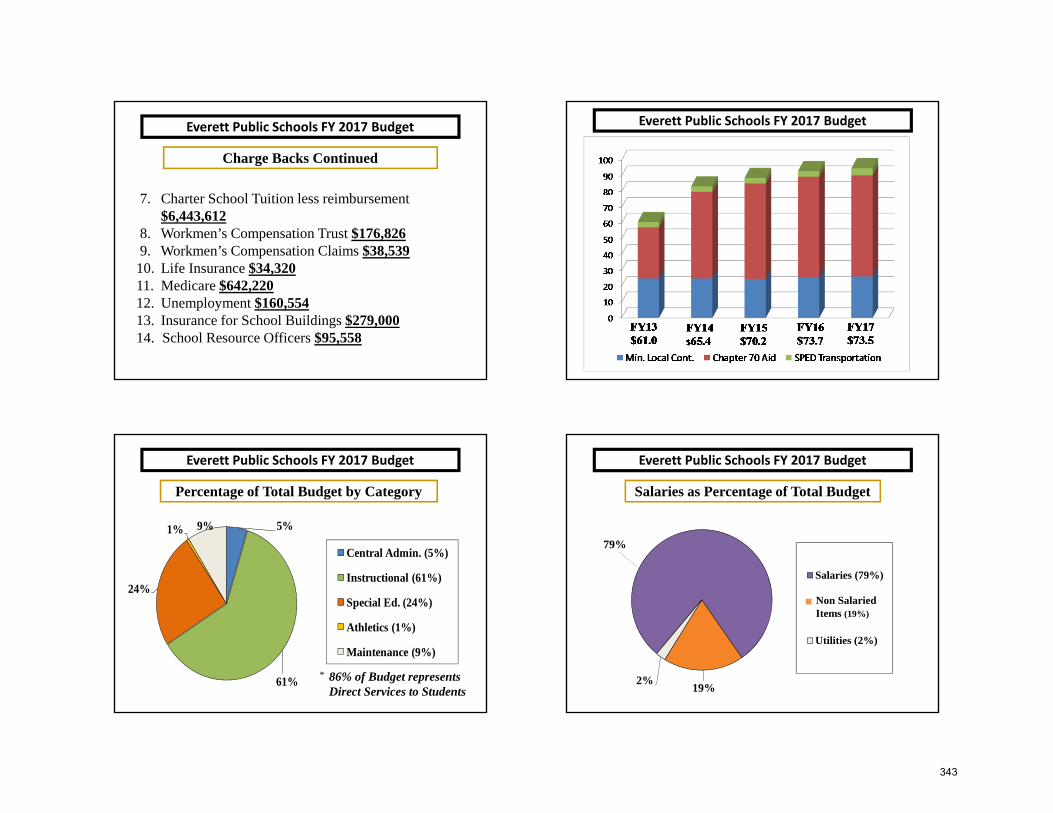
7. Charter School Tuition less reimbursement$6,443,612
8. Workmen’s Compensation Trust $176,8269. Workmen’s Compensation Claims $38,53910. Life Insurance $34,32011. Medicare $642,22012. Unemployment $160,55413. Insurance for School Buildings $279,00014. School Resource Officers $95,558
Everett Public Schools FY 2017 Budget
Charge Backs Continued(budget dollars in millions)
5 Year Budget History
Everett Public Schools FY 2017 Budget
5%
61%
24%
1% 9%
Central Admin. (5%)
Instructional (61%)
Special Ed. (24%)
Athletics (1%)
Maintenance (9%)
Percentage of Total Budget by Category
* 86% of Budget representsDirect Services to Students
Everett Public Schools FY 2017 Budget
79%
19%2%
Salaries (79%)
Utilities (2%)
Non Salaried Items (19%)
Salaries as Percentage of Total Budget
Everett Public Schools FY 2017 Budget
343
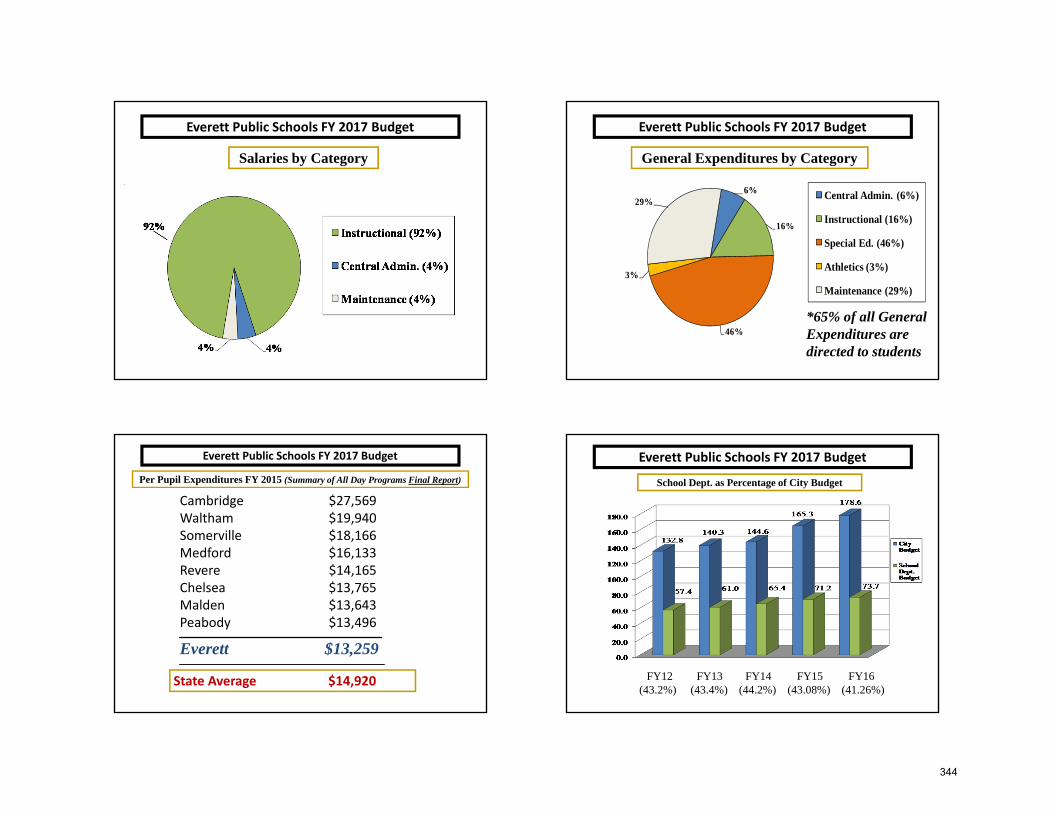
Salaries by Category
Everett Public Schools FY 2017 Budget
6%
16%
46%
3%
29% Central Admin. (6%)
Instructional (16%)
Special Ed. (46%)
Athletics (3%)
Maintenance (29%)
General Expenditures by Category
*65% of all GeneralExpenditures aredirected to students
Everett Public Schools FY 2017 Budget
Per Pupil Expenditures FY 2015 (Summary of All Day Programs Final Report)
Cambridge $27,569Waltham $19,940Somerville $18,166Medford $16,133Revere $14,165Chelsea $13,765Malden $13,643Peabody $13,496
Everett $13,259
State Average $14,920
Everett Public Schools FY 2017 Budget
School Dept. as Percentage of City Budget
Everett Public Schools FY 2017 Budget
FY12 FY13 FY14 FY15 FY16(43.2%) (43.4%) (44.2%) (43.08%) (41.26%)
344
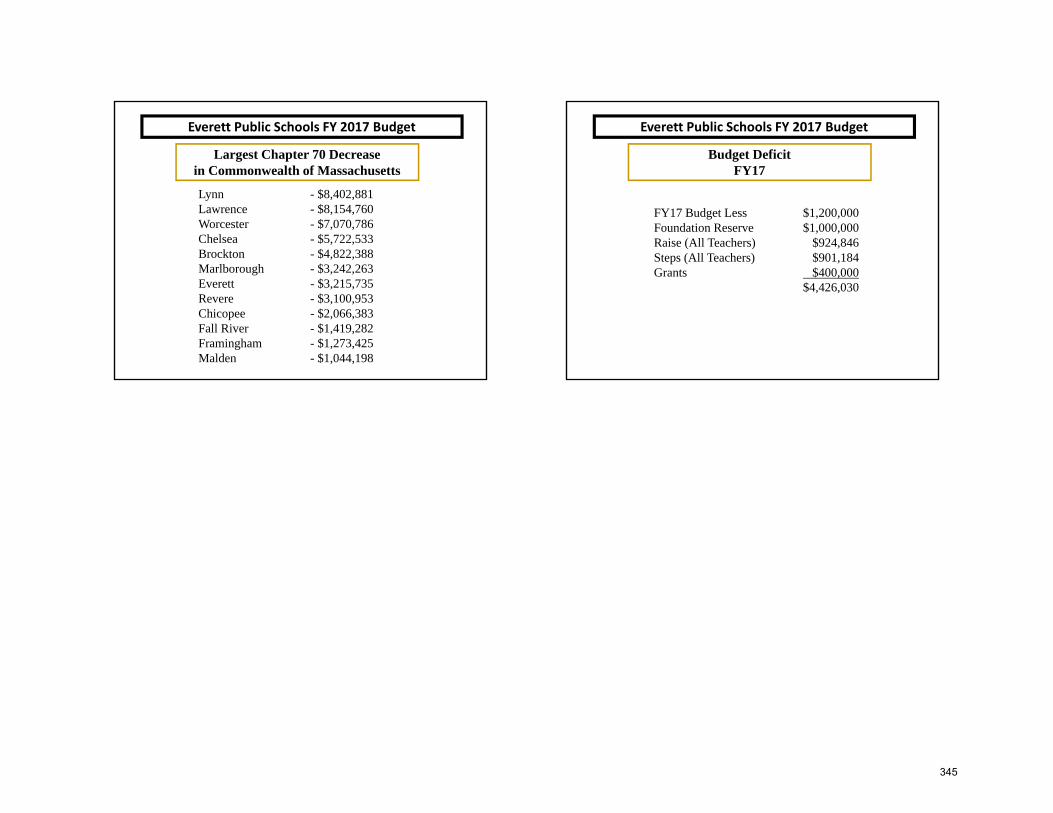
Everett Public Schools FY 2017 Budget
Lynn - $8,402,881Lawrence - $8,154,760Worcester - $7,070,786Chelsea - $5,722,533Brockton - $4,822,388Marlborough - $3,242,263Everett - $3,215,735Revere - $3,100,953Chicopee - $2,066,383Fall River - $1,419,282Framingham - $1,273,425Malden - $1,044,198
Largest Chapter 70 Decrease in Commonwealth of Massachusetts
Everett Public Schools FY 2017 Budget
FY17 Budget Less $1,200,000Foundation Reserve $1,000,000Raise (All Teachers) $924,846Steps (All Teachers) $901,184Grants $400,000
$4,426,030
Budget DeficitFY17
345
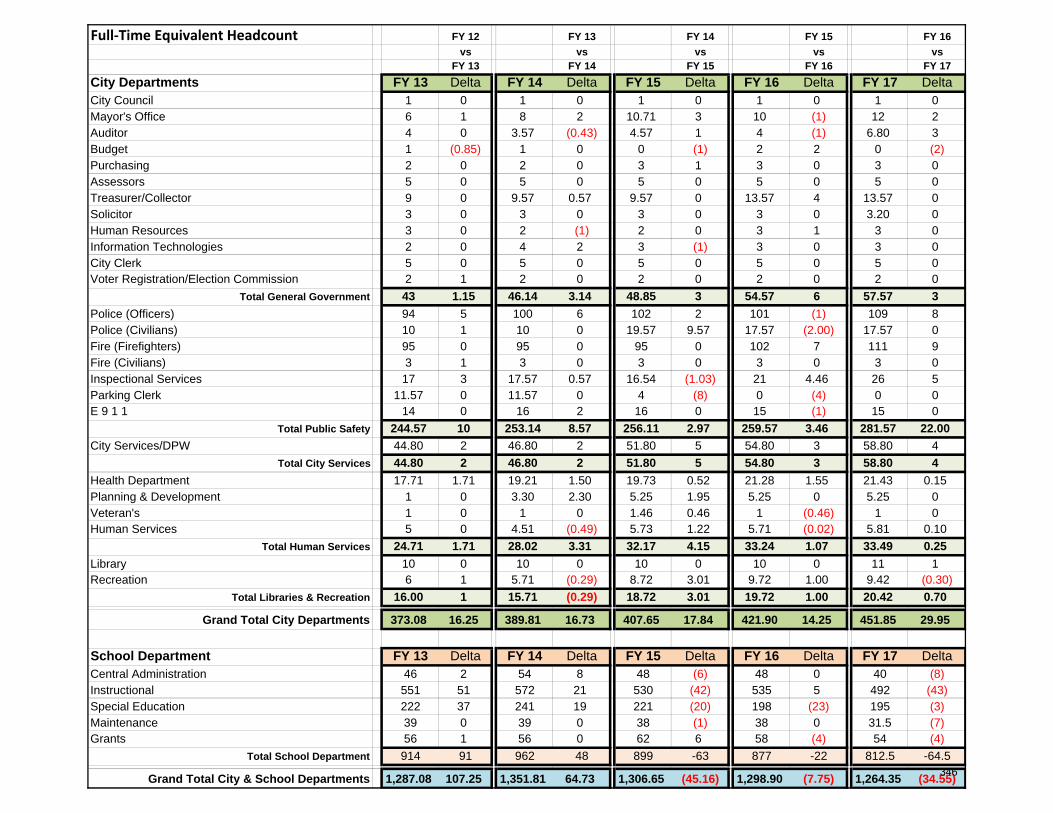
Full‐Time Equivalent Headcount FY 12 FY 13 FY 14 FY 15 FY 16vs vs vs vs vs
FY 13 FY 14 FY 15 FY 16 FY 17City Departments FY 13 Delta FY 14 Delta FY 15 Delta FY 16 Delta FY 17 DeltaCity Council 1 0 1 0 1 0 1 0 1 0Mayor's Office 6 1 8 2 10.71 3 10 (1) 12 2Auditor 4 0 3.57 (0.43) 4.57 1 4 (1) 6.80 3Budget 1 (0.85) 1 0 0 (1) 2 2 0 (2)Purchasing 2 0 2 0 3 1 3 0 3 0Assessors 5 0 5 0 5 0 5 0 5 0Treasurer/Collector 9 0 9.57 0.57 9.57 0 13.57 4 13.57 0Solicitor 3 0 3 0 3 0 3 0 3.20 0Human Resources 3 0 2 (1) 2 0 3 1 3 0Information Technologies 2 0 4 2 3 (1) 3 0 3 0City Clerk 5 0 5 0 5 0 5 0 5 0Voter Registration/Election Commission 2 1 2 0 2 0 2 0 2 0
Total General Government 43 1.15 46.14 3.14 48.85 3 54.57 6 57.57 3Police (Officers) 94 5 100 6 102 2 101 (1) 109 8Police (Civilians) 10 1 10 0 19.57 9.57 17.57 (2.00) 17.57 0Fire (Firefighters) 95 0 95 0 95 0 102 7 111 9Fire (Civilians) 3 1 3 0 3 0 3 0 3 0Inspectional Services 17 3 17.57 0.57 16.54 (1.03) 21 4.46 26 5Parking Clerk 11.57 0 11.57 0 4 (8) 0 (4) 0 0E 9 1 1 14 0 16 2 16 0 15 (1) 15 0
Total Public Safety 244.57 10 253.14 8.57 256.11 2.97 259.57 3.46 281.57 22.00City Services/DPW 44.80 2 46.80 2 51.80 5 54.80 3 58.80 4
Total City Services 44.80 2 46.80 2 51.80 5 54.80 3 58.80 4Health Department 17.71 1.71 19.21 1.50 19.73 0.52 21.28 1.55 21.43 0.15Planning & Development 1 0 3.30 2.30 5.25 1.95 5.25 0 5.25 0Veteran's 1 0 1 0 1.46 0.46 1 (0.46) 1 0Human Services 5 0 4.51 (0.49) 5.73 1.22 5.71 (0.02) 5.81 0.10
Total Human Services 24.71 1.71 28.02 3.31 32.17 4.15 33.24 1.07 33.49 0.25Library 10 0 10 0 10 0 10 0 11 1Recreation 6 1 5.71 (0.29) 8.72 3.01 9.72 1.00 9.42 (0.30)
Total Libraries & Recreation 16.00 1 15.71 (0.29) 18.72 3.01 19.72 1.00 20.42 0.70
Grand Total City Departments 373.08 16.25 389.81 16.73 407.65 17.84 421.90 14.25 451.85 29.95
School Department FY 13 Delta FY 14 Delta FY 15 Delta FY 16 Delta FY 17 DeltaCentral Administration 46 2 54 8 48 (6) 48 0 40 (8)Instructional 551 51 572 21 530 (42) 535 5 492 (43)Special Education 222 37 241 19 221 (20) 198 (23) 195 (3)Maintenance 39 0 39 0 38 (1) 38 0 31.5 (7)Grants 56 1 56 0 62 6 58 (4) 54 (4)
Total School Department 914 91 962 48 899 -63 877 -22 812.5 -64.5
Grand Total City & School Departments 1,287.08 107.25 1,351.81 64.73 1,306.65 (45.16) 1,298.90 (7.75) 1,264.35 (34.55)346
Enterprise Fund Overview
What is an Enterprise Fund? An enterprise fund establishes a separate accounting and financial reporting mechanism for municipal services for which a fee is charged in exchange for goods or services. Under enterprise accounting, the revenues and expenditures of the service are segregated into a separate fund with its own financial statements, rather than commingled with the revenues and expenses of all other governmental activities. Financial transactions are reported using standards similar to private sector accounting. Revenues are recognized when earned and expenses are recognized when incurred, under a full accrual basis of accounting. An enterprise fund provides management and taxpayers with information to measure performance, analyze the impact of financial decisions, determine the costs of providing a service and identify any subsidy from the general fund in providing a service. Enterprise accounting allows a community to demonstrate to the public the portion of total costs of a service that is recovered through user charges and the portion that is subsidized by the tax levy or other available funds, if any. A community may choose to recover total service costs through user charges, but it is not required. History The enterprise fund statute, MGL Ch 44 § 53F ½ (formerly Chapter 41 § 39K), was enacted in 1986. Before that time, communities used special revenue funds authorized under various general laws or special acts in order to separately account for their business type services. These special revenue funds were limited, however, with regard to the services and costs covered. The funds were most commonly authorized for water, gas and electric utility departments and used primarily to account for annual operating costs, not the indirect costs, capital expenditures or fixed assets of the service. The purpose of the enterprise fund statute was to give communities the flexibility to account separately for all financial activities associated with a broader range of municipal services. Basis of Accounting Proprietary fund revenues and expenses are recognized on the accrual basis. Revenues are recognized in the accounting period in which they are earned and become measurable; expenses are recognized in the period incurred, if measurable. The following major proprietary funds are classified as Proprietary funds and audited as such:
The Water and Sewer Enterprise fund is used to account for the Water and Sewer activities.
For the entire MGL on Enterprise Funds visit the Massachusetts Department of Revenue website: http://www.mass.gov/Ador/docs/dls/publ/misc/EnterpriseFundManual.pdf
347
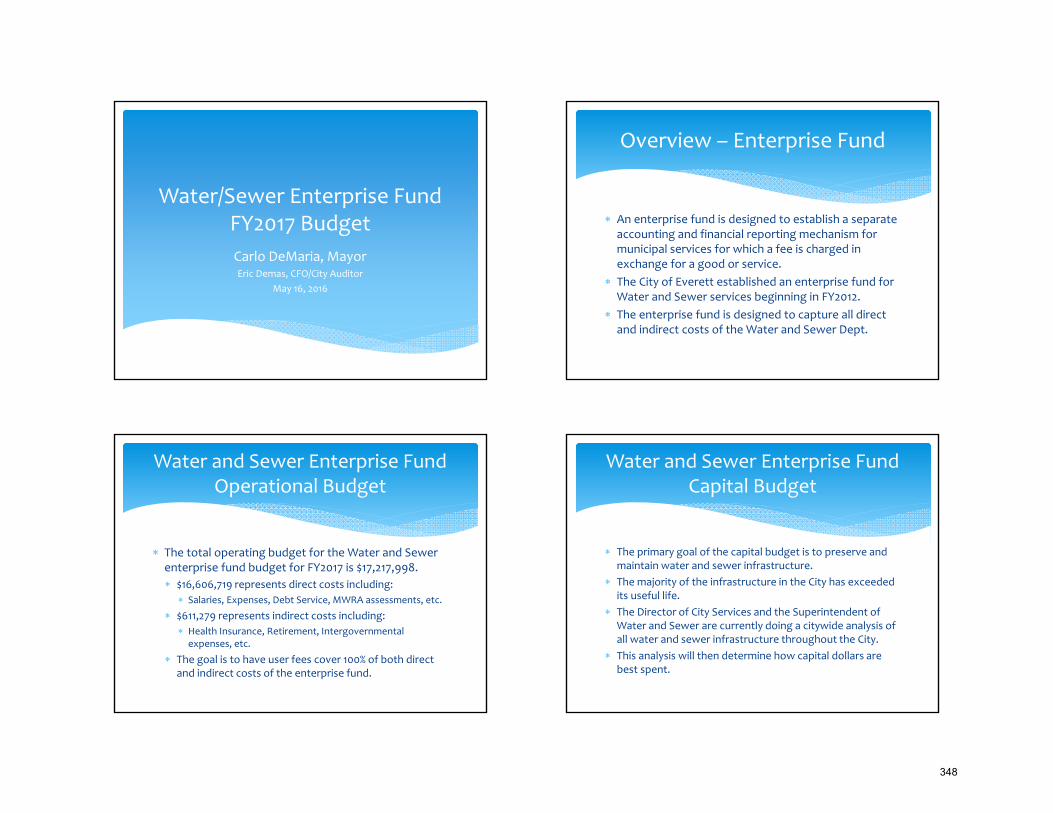
Water/Sewer Enterprise FundFY2017 Budget Carlo DeMaria, MayorEric Demas, CFO/City Auditor
May 16, 2016
An enterprise fund is designed to establish a separate accounting and financial reporting mechanism for municipal services for which a fee is charged in exchange for a good or service.
The City of Everett established an enterprise fund for Water and Sewer services beginning in FY2012.
The enterprise fund is designed to capture all direct and indirect costs of the Water and Sewer Dept.
Overview – Enterprise Fund
The total operating budget for the Water and Sewer enterprise fund budget for FY2017 is $17,217,998. $16,606,719 represents direct costs including:
Salaries, Expenses, Debt Service, MWRA assessments, etc.
$611,279 represents indirect costs including: Health Insurance, Retirement, Intergovernmental expenses, etc.
The goal is to have user fees cover 100% of both direct and indirect costs of the enterprise fund.
Water and Sewer Enterprise Fund Operational Budget
The primary goal of the capital budget is to preserve and maintain water and sewer infrastructure.
The majority of the infrastructure in the City has exceeded its useful life.
The Director of City Services and the Superintendent of Water and Sewer are currently doing a citywide analysis of all water and sewer infrastructure throughout the City.
This analysis will then determine how capital dollars are best spent.
Water and Sewer Enterprise Fund Capital Budget
348
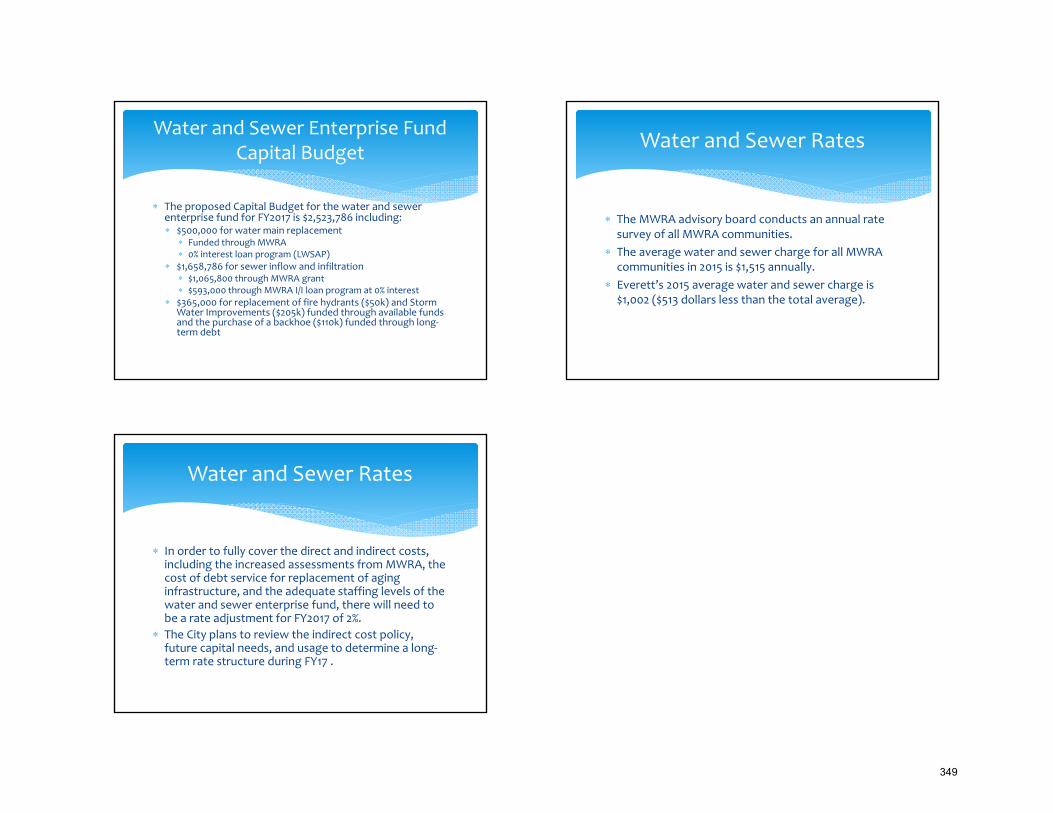
The proposed Capital Budget for the water and sewer enterprise fund for FY2017 is $2,523,786 including: $500,000 for water main replacement
Funded through MWRA 0% interest loan program (LWSAP)
$1,658,786 for sewer inflow and infiltration $1,065,800 through MWRA grant $593,000 through MWRA I/I loan program at 0% interest
$365,000 for replacement of fire hydrants ($50k) and Storm Water Improvements ($205k) funded through available funds and the purchase of a backhoe ($110k) funded through long‐term debt
Water and Sewer Enterprise Fund Capital Budget
The MWRA advisory board conducts an annual rate survey of all MWRA communities.
The average water and sewer charge for all MWRA communities in 2015 is $1,515 annually.
Everett’s 2015 average water and sewer charge is $1,002 ($513 dollars less than the total average).
Water and Sewer Rates
In order to fully cover the direct and indirect costs, including the increased assessments from MWRA, the cost of debt service for replacement of aging infrastructure, and the adequate staffing levels of the water and sewer enterprise fund, there will need to be a rate adjustment for FY2017 of 2%.
The City plans to review the indirect cost policy, future capital needs, and usage to determine a long‐term rate structure during FY17 .
Water and Sewer Rates
349
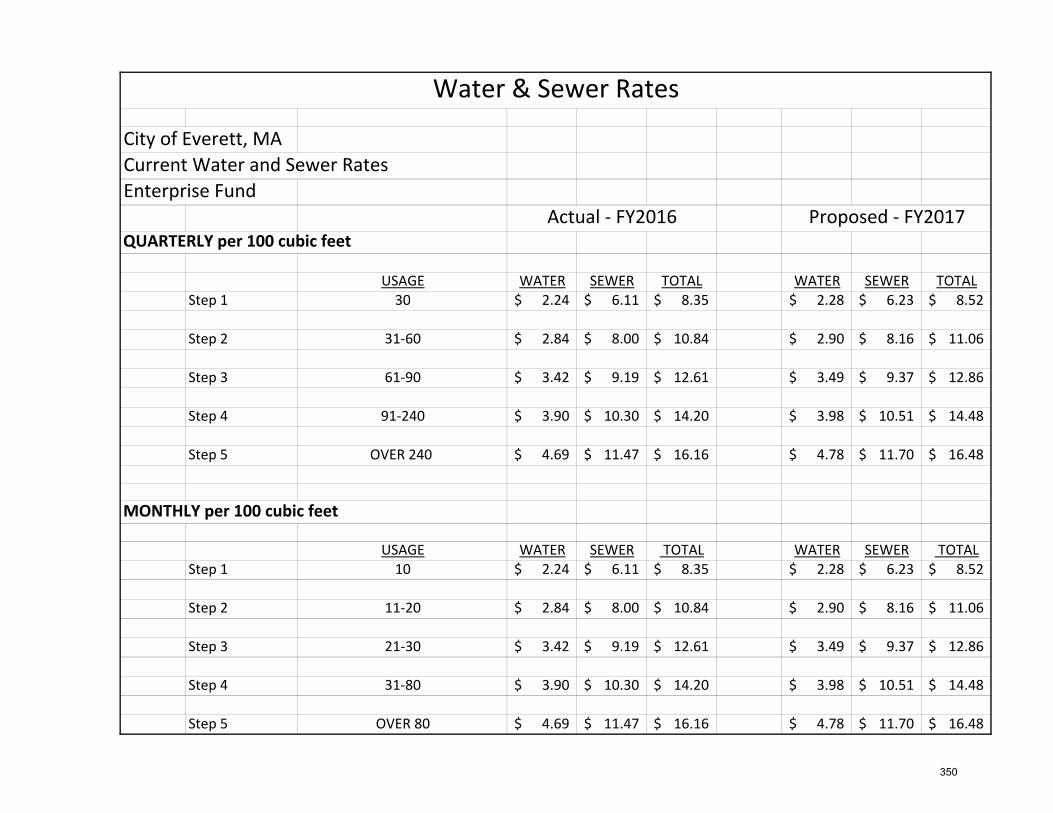
City of Everett, MACurrent Water and Sewer RatesEnterprise Fund
QUARTERLY per 100 cubic feet
USAGE WATER SEWER TOTAL WATER SEWER TOTALStep 1 30 2.24$ 6.11$ 8.35$ 2.28$ 6.23$ 8.52$
Step 2 31‐60 2.84$ 8.00$ 10.84$ 2.90$ 8.16$ 11.06$
Step 3 61‐90 3.42$ 9.19$ 12.61$ 3.49$ 9.37$ 12.86$
Step 4 91‐240 3.90$ 10.30$ 14.20$ 3.98$ 10.51$ 14.48$
Step 5 OVER 240 4.69$ 11.47$ 16.16$ 4.78$ 11.70$ 16.48$
MONTHLY per 100 cubic feet
USAGE WATER SEWER TOTAL WATER SEWER TOTALStep 1 10 2.24$ 6.11$ 8.35$ 2.28$ 6.23$ 8.52$
Step 2 11‐20 2.84$ 8.00$ 10.84$ 2.90$ 8.16$ 11.06$
Step 3 21‐30 3.42$ 9.19$ 12.61$ 3.49$ 9.37$ 12.86$
Step 4 31‐80 3.90$ 10.30$ 14.20$ 3.98$ 10.51$ 14.48$
Step 5 OVER 80 4.69$ 11.47$ 16.16$ 4.78$ 11.70$ 16.48$
Water & Sewer Rates
Actual ‐ FY2016 Proposed ‐ FY2017
350
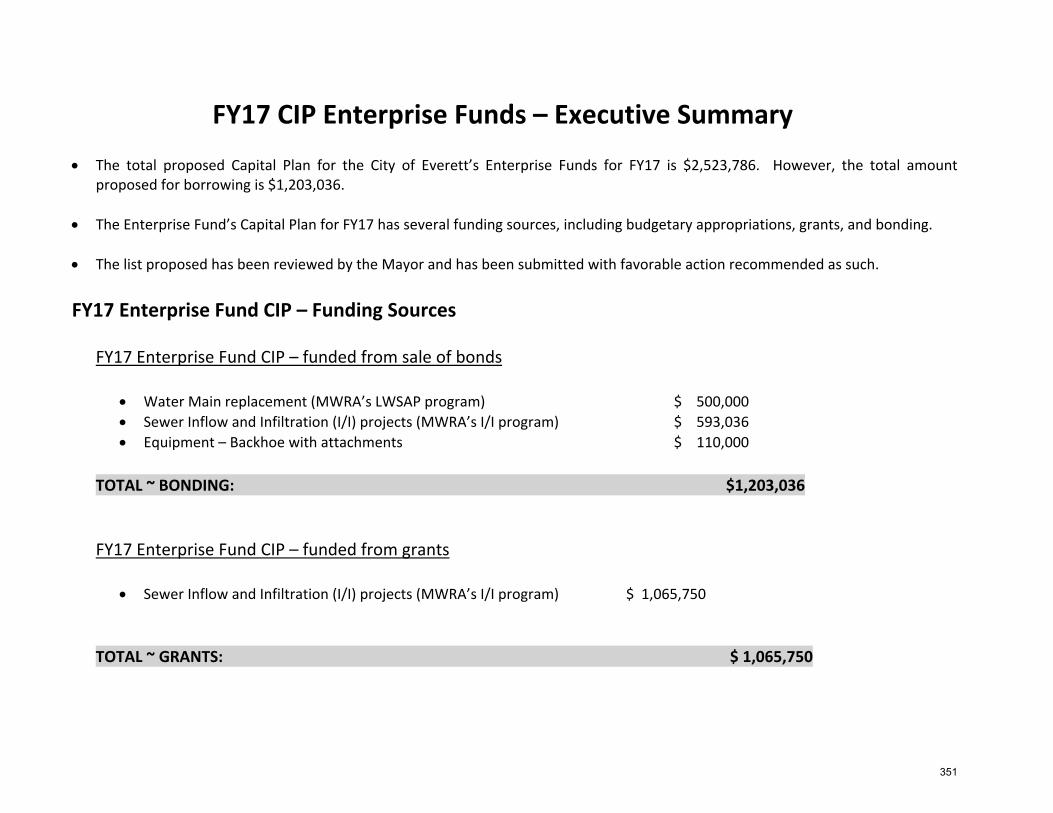
FY17 CIP Enterprise Funds – Executive Summary
The total proposed Capital Plan for the City of Everett’s Enterprise Funds for FY17 is $2,523,786. However, the total amount proposed for borrowing is $1,203,036.
The Enterprise Fund’s Capital Plan for FY17 has several funding sources, including budgetary appropriations, grants, and bonding.
The list proposed has been reviewed by the Mayor and has been submitted with favorable action recommended as such.
FY17 Enterprise Fund CIP – Funding Sources
FY17 Enterprise Fund CIP – funded from sale of bonds
Water Main replacement (MWRA’s LWSAP program) $ 500,000 Sewer Inflow and Infiltration (I/I) projects (MWRA’s I/I program) $ 593,036 Equipment – Backhoe with attachments $ 110,000
TOTAL ~ BONDING: $1,203,036 FY17 Enterprise Fund CIP – funded from grants
Sewer Inflow and Infiltration (I/I) projects (MWRA’s I/I program) $ 1,065,750
TOTAL ~ GRANTS: $ 1,065,750
351
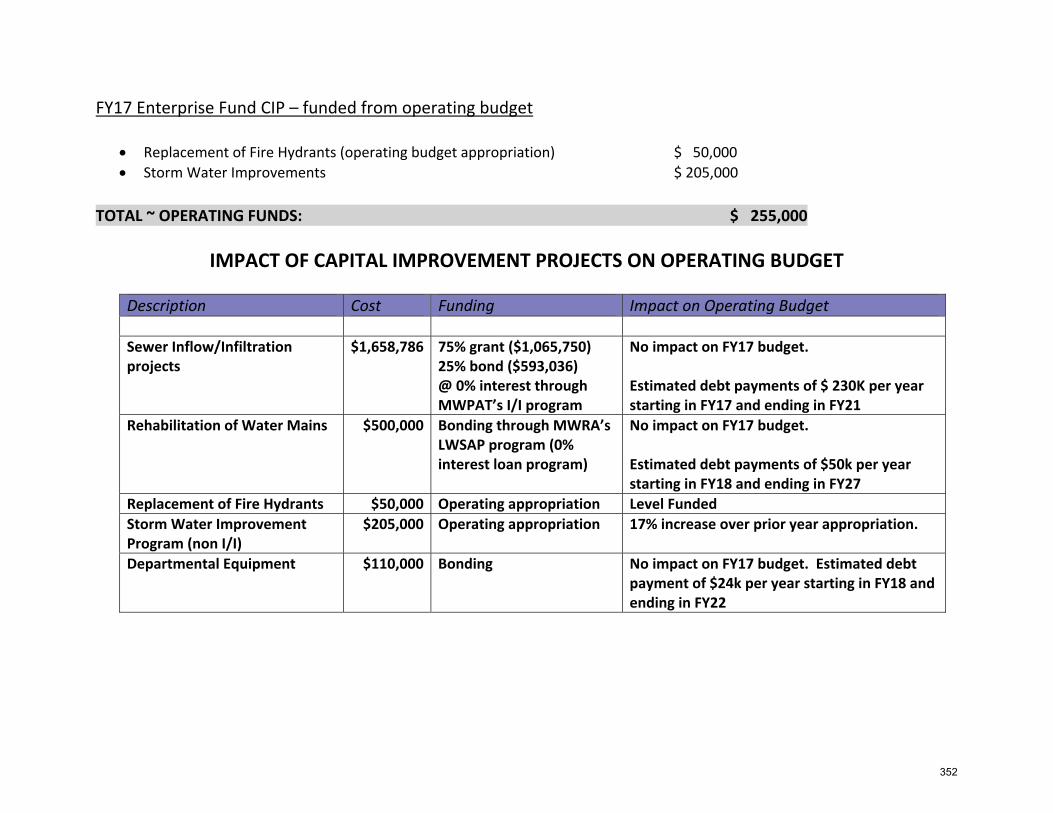
FY17 Enterprise Fund CIP – funded from operating budget
Replacement of Fire Hydrants (operating budget appropriation) $ 50,000 Storm Water Improvements $ 205,000
TOTAL ~ OPERATING FUNDS: $ 255,000
IMPACT OF CAPITAL IMPROVEMENT PROJECTS ON OPERATING BUDGET
Description Cost Funding Impact on Operating Budget Sewer Inflow/Infiltration projects
$1,658,786 75% grant ($1,065,750) 25% bond ($593,036) @ 0% interest through MWPAT’s I/I program
No impact on FY17 budget. Estimated debt payments of $ 230K per year starting in FY17 and ending in FY21
Rehabilitation of Water Mains $500,000 Bonding through MWRA’s LWSAP program (0% interest loan program)
No impact on FY17 budget. Estimated debt payments of $50k per year starting in FY18 and ending in FY27
Replacement of Fire Hydrants $50,000 Operating appropriation Level Funded Storm Water Improvement Program (non I/I)
$205,000 Operating appropriation 17% increase over prior year appropriation.
Departmental Equipment $110,000 Bonding No impact on FY17 budget. Estimated debt payment of $24k per year starting in FY18 and ending in FY22
352
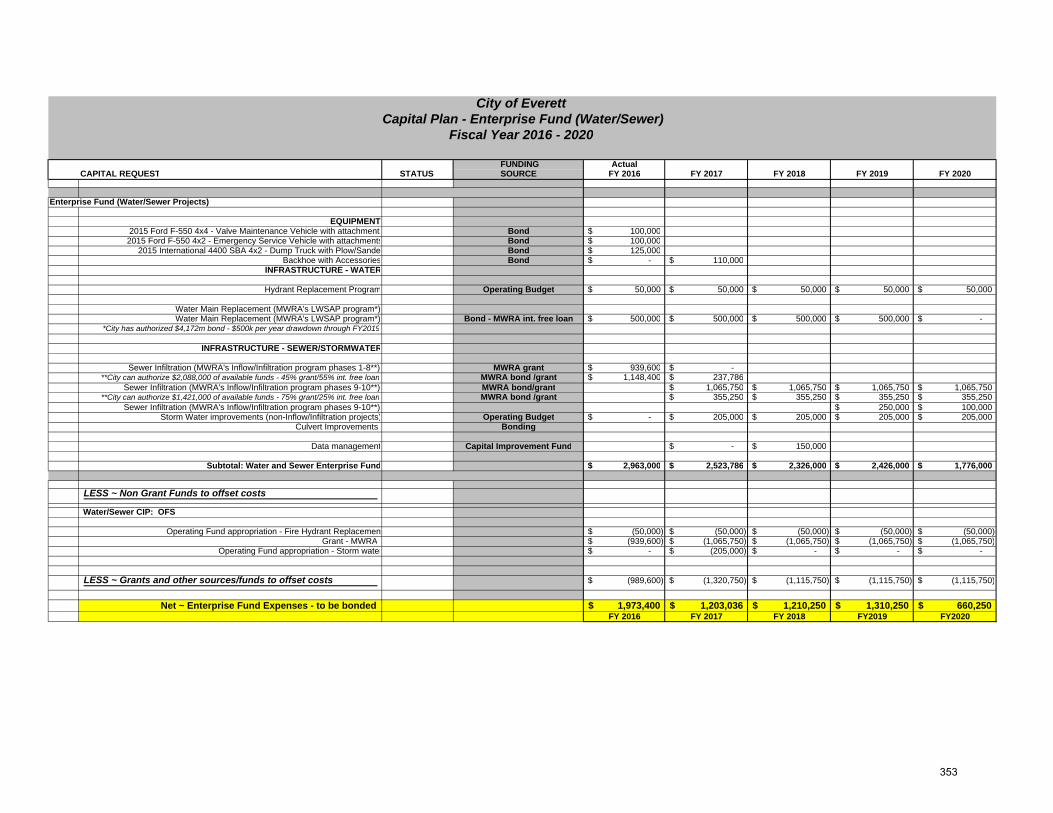
FUNDING ActualCAPITAL REQUEST STATUS SOURCE FY 2016 FY 2017 FY 2018 FY 2019 FY 2020
Enterprise Fund (Water/Sewer Projects)
EQUIPMENT2015 Ford F-550 4x4 - Valve Maintenance Vehicle with attachments Bond 100,000$
2015 Ford F-550 4x2 - Emergency Service Vehicle with attachments Bond 100,000$ 2015 International 4400 SBA 4x2 - Dump Truck with Plow/Sande Bond 125,000$
Backhoe with Accessories Bond -$ 110,000$ INFRASTRUCTURE - WATER
Hydrant Replacement Program Operating Budget 50,000$ 50,000$ 50,000$ 50,000$ 50,000$
Water Main Replacement (MWRA's LWSAP program*)Water Main Replacement (MWRA's LWSAP program*) Bond - MWRA int. free loan 500,000$ 500,000$ 500,000$ 500,000$ -$
*City has authorized $4,172m bond - $500k per year drawdown through FY2019
INFRASTRUCTURE - SEWER/STORMWATER
Sewer Infiltration (MWRA's Inflow/Infiltration program phases 1-8**) MWRA grant 939,600$ -$ **City can authorize $2,088,000 of available funds - 45% grant/55% int. free loan MWRA bond /grant 1,148,400$ 237,786$
Sewer Infiltration (MWRA's Inflow/Infiltration program phases 9-10**) MWRA bond/grant 1,065,750$ 1,065,750$ 1,065,750$ 1,065,750$ **City can authorize $1,421,000 of available funds - 75% grant/25% int. free loan MWRA bond /grant 355,250$ 355,250$ 355,250$ 355,250$
Sewer Infiltration (MWRA's Inflow/Infiltration program phases 9-10**) 250,000$ 100,000$ Storm Water improvements (non-Inflow/Infiltration projects) Operating Budget -$ 205,000$ 205,000$ 205,000$ 205,000$
Culvert Improvements Bonding
Data management Capital Improvement Fund -$ 150,000$
Subtotal: Water and Sewer Enterprise Fund 2,963,000$ 2,523,786$ 2,326,000$ 2,426,000$ 1,776,000$
LESS ~ Non Grant Funds to offset costs
Water/Sewer CIP: OFS
Operating Fund appropriation - Fire Hydrant Replacemen (50,000)$ (50,000)$ (50,000)$ (50,000)$ (50,000)$ Grant - MWRA (939,600)$ (1,065,750)$ (1,065,750)$ (1,065,750)$ (1,065,750)$
Operating Fund appropriation - Storm water -$ (205,000)$ -$ -$ -$
LESS ~ Grants and other sources/funds to offset costs (989,600)$ (1,320,750)$ (1,115,750)$ (1,115,750)$ (1,115,750)$
Net ~ Enterprise Fund Expenses - to be bonded 1,973,400$ 1,203,036$ 1,210,250$ 1,310,250$ 660,250$ FY 2016 FY 2017 FY 2018 FY2019 FY2020
City of Everett Capital Plan - Enterprise Fund (Water/Sewer)
Fiscal Year 2016 - 2020
353
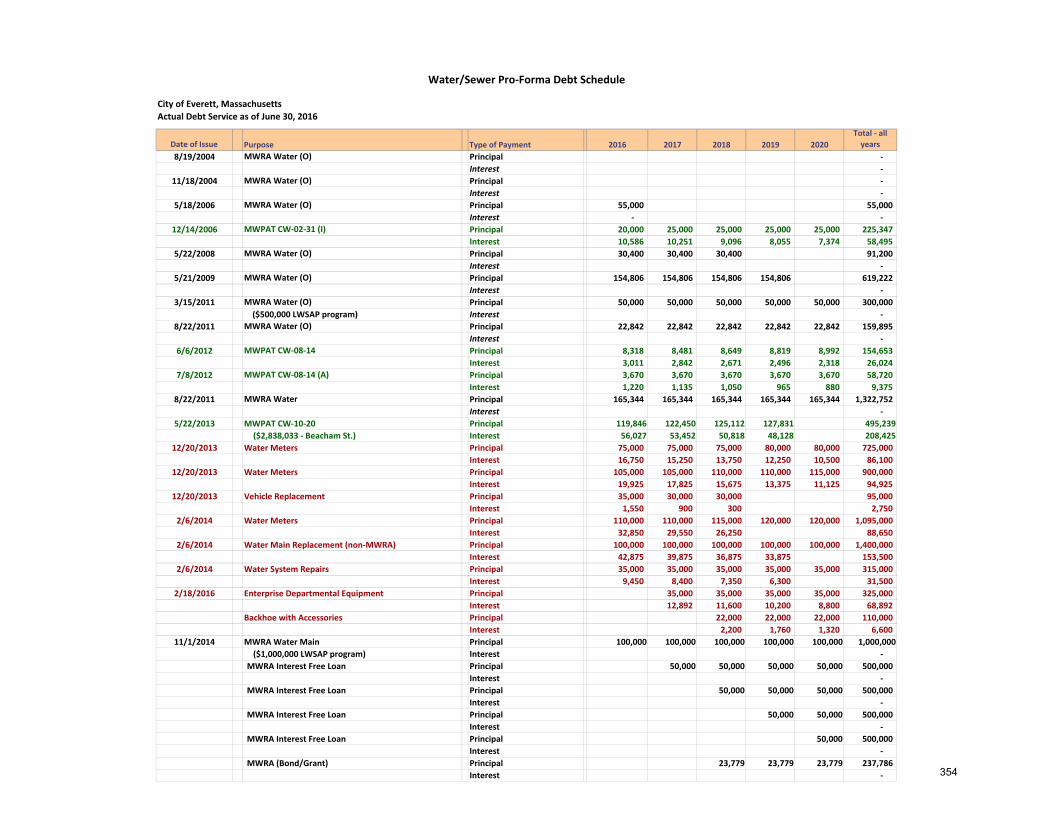
City of Everett, Massachusetts
Date of Issue Purpose Type of Payment 2016 2017 2018 2019 2020Total ‐ all years
8/19/2004 MWRA Water (O) Principal ‐ Interest ‐
11/18/2004 MWRA Water (O) Principal ‐ Interest ‐
5/18/2006 MWRA Water (O) Principal 55,000 55,000 Interest ‐ ‐
12/14/2006 MWPAT CW‐02‐31 (I) Principal 20,000 25,000 25,000 25,000 25,000 225,347 Interest 10,586 10,251 9,096 8,055 7,374 58,495
5/22/2008 MWRA Water (O) Principal 30,400 30,400 30,400 91,200 Interest ‐
5/21/2009 MWRA Water (O) Principal 154,806 154,806 154,806 154,806 619,222 Interest ‐
3/15/2011 MWRA Water (O) Principal 50,000 50,000 50,000 50,000 50,000 300,000 ($500,000 LWSAP program) Interest ‐
8/22/2011 MWRA Water (O) Principal 22,842 22,842 22,842 22,842 22,842 159,895 Interest ‐
6/6/2012 MWPAT CW‐08‐14 Principal 8,318 8,481 8,649 8,819 8,992 154,653 Interest 3,011 2,842 2,671 2,496 2,318 26,024
7/8/2012 MWPAT CW‐08‐14 (A) Principal 3,670 3,670 3,670 3,670 3,670 58,720 Interest 1,220 1,135 1,050 965 880 9,375
8/22/2011 MWRA Water Principal 165,344 165,344 165,344 165,344 165,344 1,322,752 Interest ‐
5/22/2013 MWPAT CW‐10‐20 Principal 119,846 122,450 125,112 127,831 495,239 ($2,838,033 ‐ Beacham St.) Interest 56,027 53,452 50,818 48,128 208,425
12/20/2013 Water Meters Principal 75,000 75,000 75,000 80,000 80,000 725,000 Interest 16,750 15,250 13,750 12,250 10,500 86,100
12/20/2013 Water Meters Principal 105,000 105,000 110,000 110,000 115,000 900,000 Interest 19,925 17,825 15,675 13,375 11,125 94,925
12/20/2013 Vehicle Replacement Principal 35,000 30,000 30,000 95,000 Interest 1,550 900 300 2,750
2/6/2014 Water Meters Principal 110,000 110,000 115,000 120,000 120,000 1,095,000 Interest 32,850 29,550 26,250 88,650
2/6/2014 Water Main Replacement (non‐MWRA) Principal 100,000 100,000 100,000 100,000 100,000 1,400,000 Interest 42,875 39,875 36,875 33,875 153,500
2/6/2014 Water System Repairs Principal 35,000 35,000 35,000 35,000 35,000 315,000 Interest 9,450 8,400 7,350 6,300 31,500
2/18/2016 Enterprise Departmental Equipment Principal 35,000 35,000 35,000 35,000 325,000 Interest 12,892 11,600 10,200 8,800 68,892
Backhoe with Accessories Principal 22,000 22,000 22,000 110,000 Interest 2,200 1,760 1,320 6,600
11/1/2014 MWRA Water Main Principal 100,000 100,000 100,000 100,000 100,000 1,000,000 ($1,000,000 LWSAP program) Interest ‐ MWRA Interest Free Loan Principal 50,000 50,000 50,000 50,000 500,000
Interest ‐ MWRA Interest Free Loan Principal 50,000 50,000 50,000 500,000
Interest ‐ MWRA Interest Free Loan Principal 50,000 50,000 500,000
Interest ‐ MWRA Interest Free Loan Principal 50,000 500,000
Interest ‐ MWRA (Bond/Grant) Principal 23,779 23,779 23,779 237,786
Interest ‐
Actual Debt Service as of June 30, 2016
Water/Sewer Pro‐Forma Debt Schedule
354
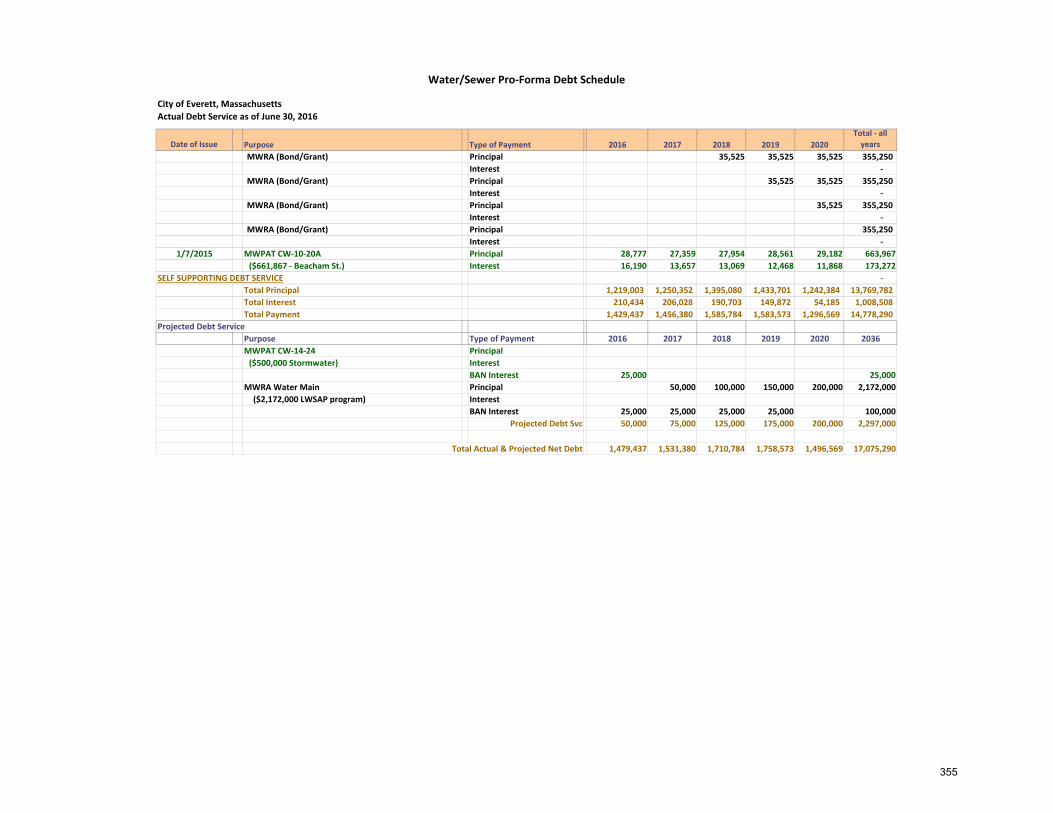
City of Everett, Massachusetts
Date of Issue Purpose Type of Payment 2016 2017 2018 2019 2020Total ‐ all years
Actual Debt Service as of June 30, 2016
Water/Sewer Pro‐Forma Debt Schedule
MWRA (Bond/Grant) Principal 35,525 35,525 35,525 355,250 Interest ‐
MWRA (Bond/Grant) Principal 35,525 35,525 355,250 Interest ‐
MWRA (Bond/Grant) Principal 35,525 355,250 Interest ‐
MWRA (Bond/Grant) Principal 355,250 Interest ‐
1/7/2015 MWPAT CW‐10‐20A Principal 28,777 27,359 27,954 28,561 29,182 663,967 ($661,867 ‐ Beacham St.) Interest 16,190 13,657 13,069 12,468 11,868 173,272
SELF SUPPORTING DEBT SERVICE ‐ Total Principal 1,219,003 1,250,352 1,395,080 1,433,701 1,242,384 13,769,782 Total Interest 210,434 206,028 190,703 149,872 54,185 1,008,508 Total Payment 1,429,437 1,456,380 1,585,784 1,583,573 1,296,569 14,778,290
Purpose Type of Payment 2016 2017 2018 2019 2020 2036MWPAT CW‐14‐24 Principal ($500,000 Stormwater) Interest
BAN Interest 25,000 25,000MWRA Water Main Principal 50,000 100,000 150,000 200,000 2,172,000 ($2,172,000 LWSAP program) Interest
BAN Interest 25,000 25,000 25,000 25,000 100,000Projected Debt Svc 50,000 75,000 125,000 175,000 200,000 2,297,000
Total Actual & Projected Net Debt 1,479,437 1,531,380 1,710,784 1,758,573 1,496,569 17,075,290
Projected Debt Service
355
356
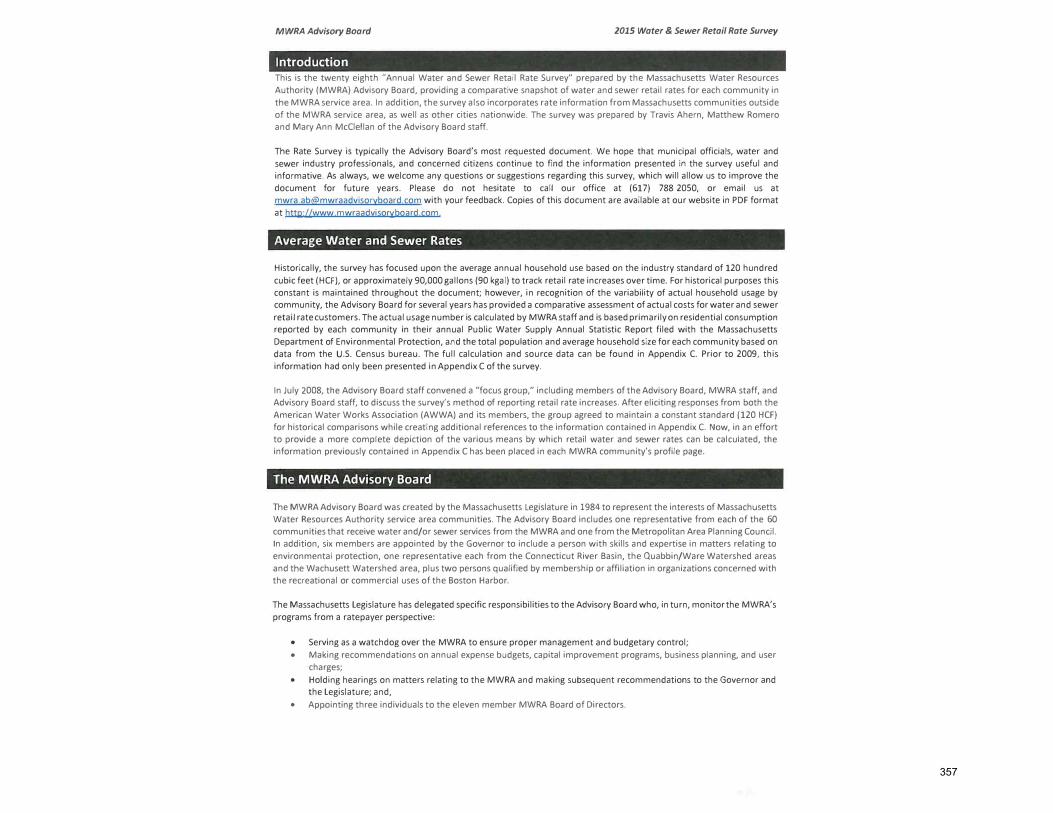
357
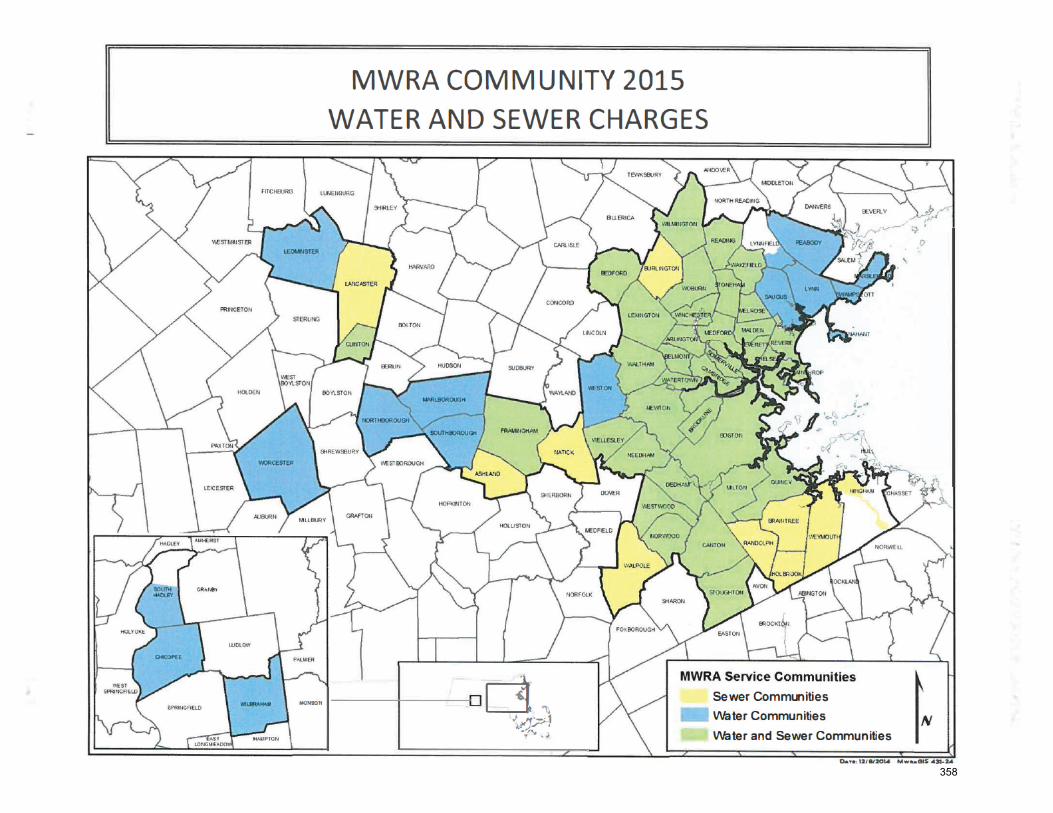
358
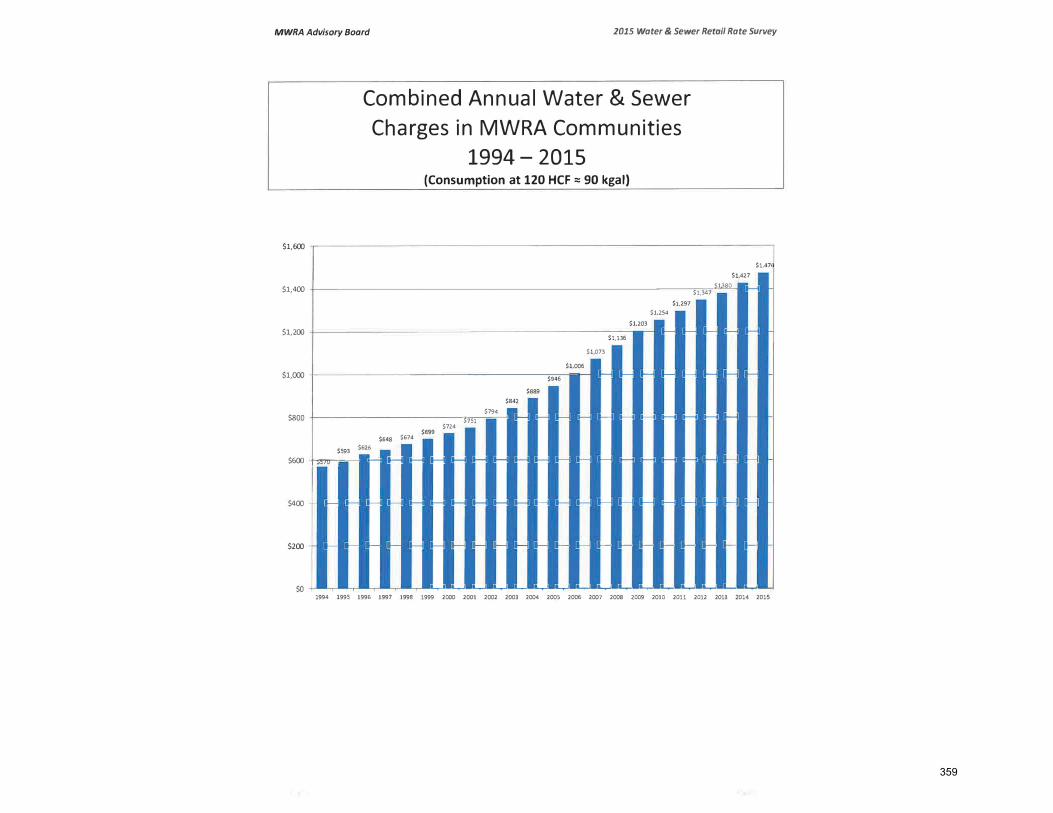
359
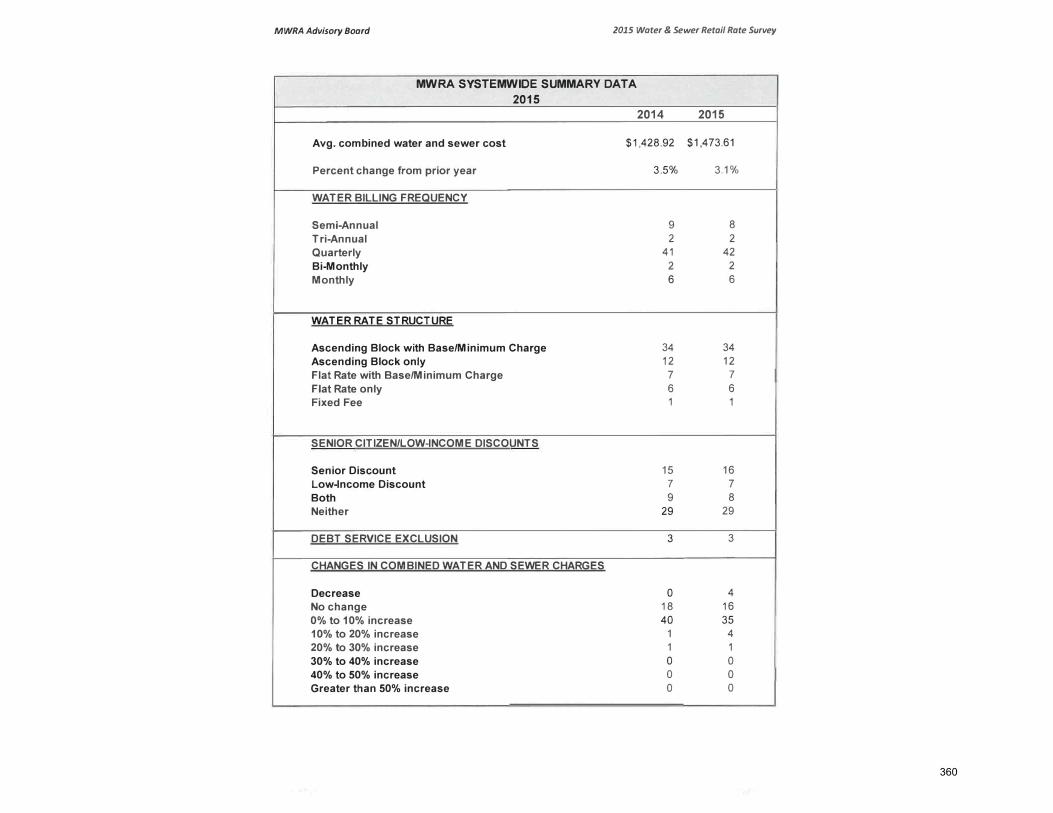
360
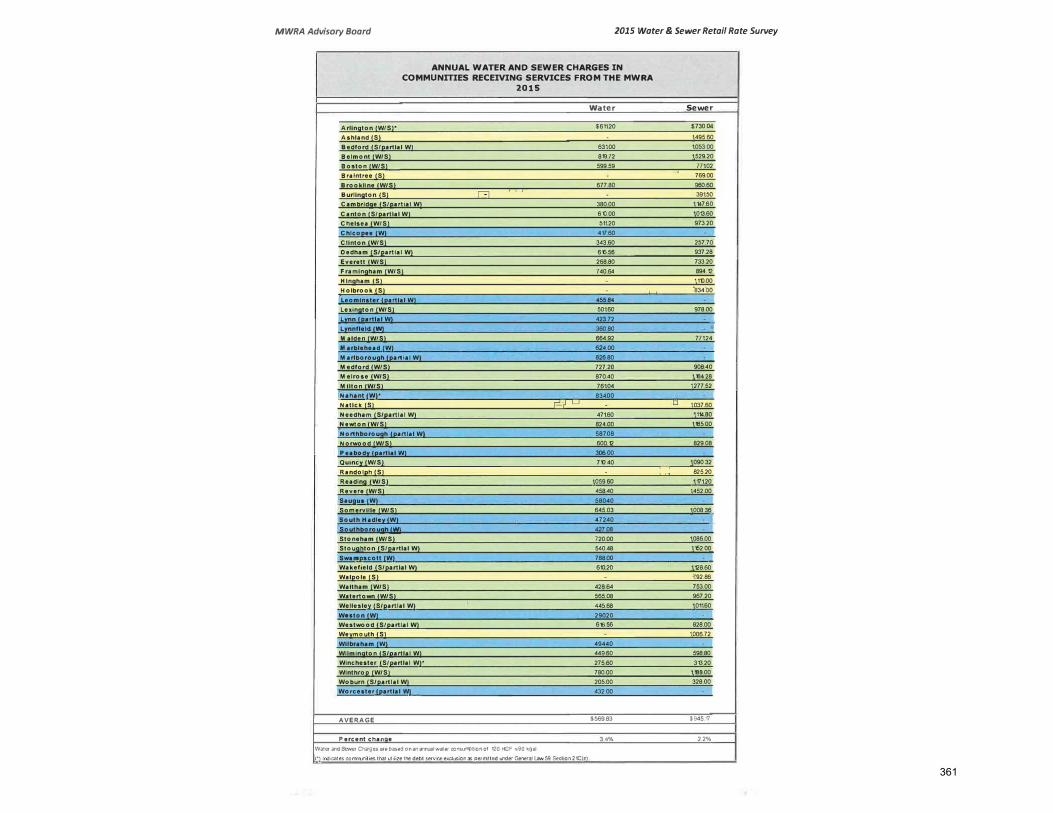
361
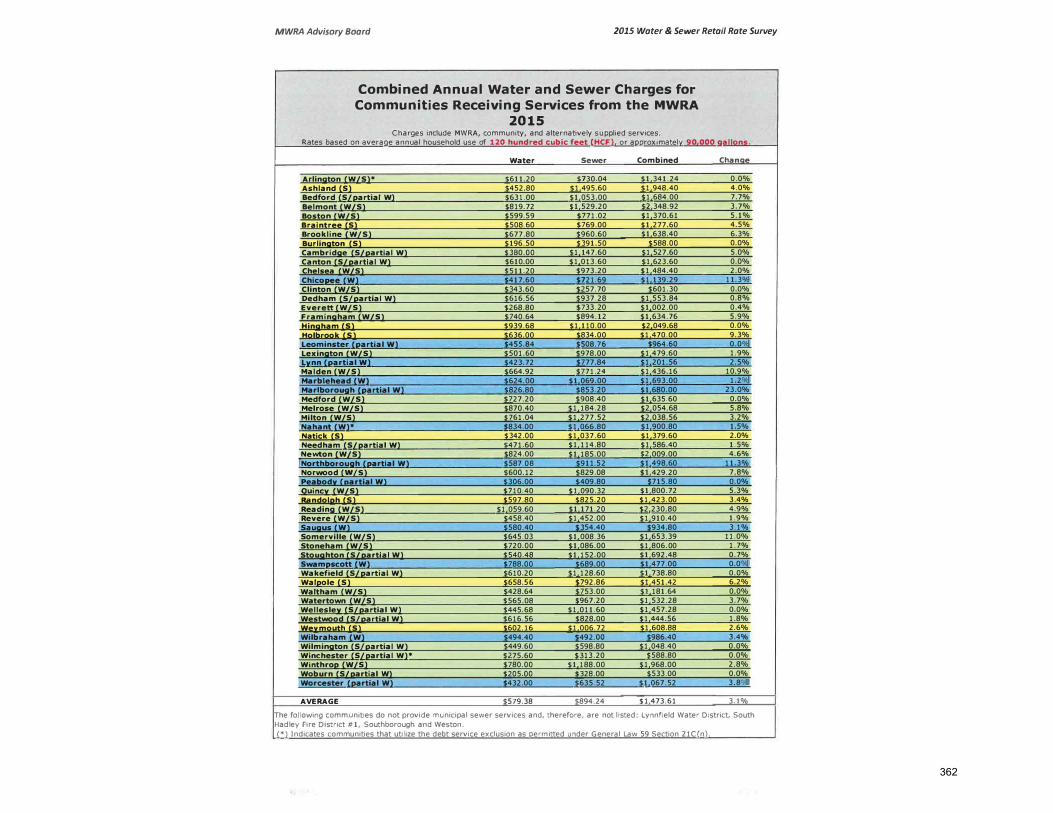
362
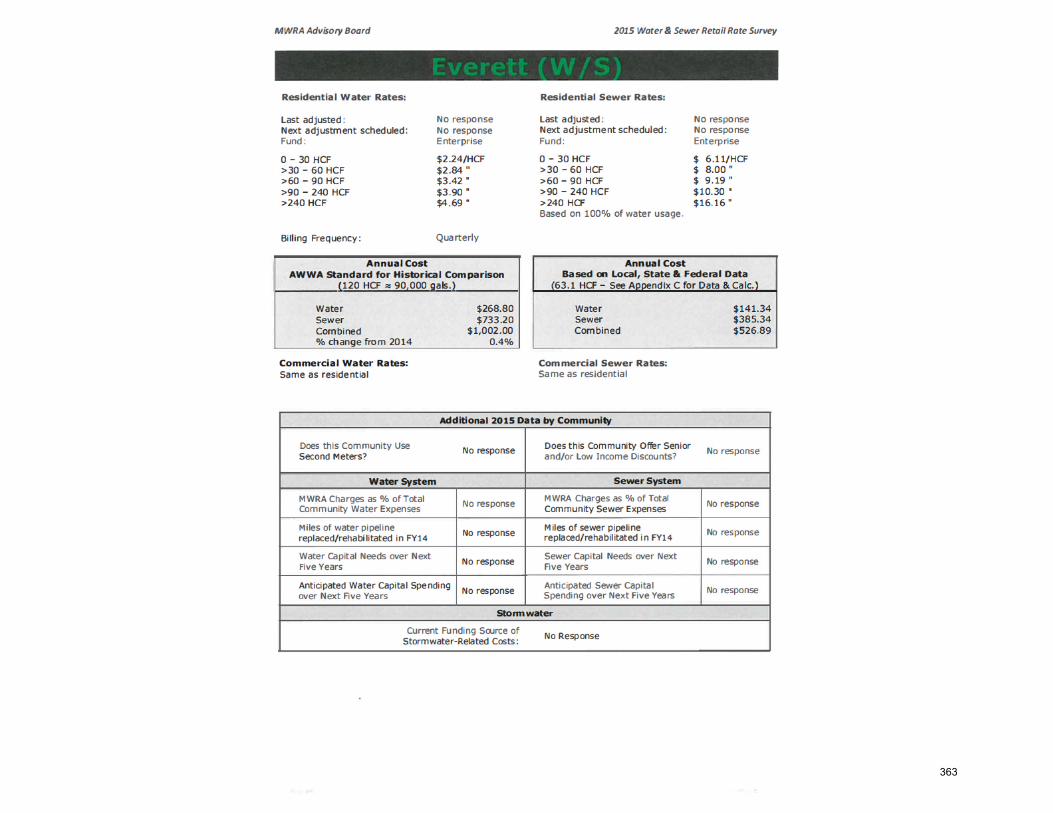
363
Capital Improvement Program Overview
A capital improvement program (CIP) is a blueprint for planning a community’s capital expenditures. A CIP is typically a multi‐year plan identifying capital projects and equipment to be funded during the planning period. A CIP is composed of two parts, a capital program and a capital budget. The capital program is a plan for capital expenditures that extends out past the capital budget. The capital budget is the upcoming year’s spending plan for capital items. Developing a CIP that will ensure sound financial and capital planning requires effective leadership and the involvement and cooperation of all municipal departments. A properly developed CIP will help the city in many ways such as enhancing a community’s credit rating, stabilizing debt service payments, and identifying the most economical means of financing capital projects. It will also help increase opportunities to obtain federal and state aid and help avoid duplication by overlapping governmental units. The city has several ways to finance its CIP, including state and federal grants, appropriations from available funds, capital leases, and long‐term borrowing. Depending on the cost and the useful life, the City Auditor will make recommendations to the Mayor for funding the city’s capital needs. Capital leases are often three years or less and are built into the operating budget. Capital leases are often used for items such as school buses, office equipment, and other items that may not last five years in useful life. The city’s policy is to fund capital items under $35,000 through appropriations; however, the city may fund capital items over $35,000 through appropriation if it is deemed prudent. Funding capital improvements through appropriation is beneficial because there is no borrowing or interest costs; you simply pay for the item in the year that it is purchased. Most of the city’s capital items over $35,000 require long‐term borrowing as authorized by a 2/3rd vote of the City Council upon recommendation of the Mayor. Long term bonding helps spread the costs of expensive capital improvements over their full useful life (per MGL Chapter 44/7 and Chapter 44/8). The CIP dovetails into the city’s five‐year financial forecast for planning purposes. The CIP has to be worked into the operational part of the budget so that both the operational and capital needs of the municipal departments are met on a year‐to‐year basis. Oftentimes, the CIP suffers as fixed costs such as health insurance and retirement assessments increase, which places further pressure on the operational budget. However, it is incumbent upon the administration to ensure that both the operating budget and CIP are reasonable and attainable to ensure fiscal stability within the limitations of Proposition 2 ½.
364
Capital Improvement Program Mayor’s Message
Goals of the Capital Improvement Program (CIP) The City of Everett relies on a five (5) year capital improvement program and a one (1) year capital budget to ensure that capital needs are being addressed in a responsible manner based on priority and thoughtful planning. A capital improvement program is a critical component of the capital improvement budget and the overall budget strategy. By formalizing a capital program and capital budget, the City of Everett now has the ability and knowledge to address deferred maintenance issues that have been postponed and ignored in prior years, as well as plan for the future needs of the city. When considering funding items in the Capital Improvement Program, the city strategically pursues available options from grants at the state and federal levels, and also utilizes other financing sources to avoid the issuance of long term debt for certain projects that can be covered in full by such retained earnings. From a financing perspective, priority is given to projects with grant revenues or other matching funds to offset the costs of borrowing. Addressing capital needs when appropriate will assist the city in reaching many of its longer‐term goals such as reducing fuel consumption, decreasing deferred maintenance costs, reducing heating and electricity expenses, and creating efficiencies by means of technological advances and automation. A sound capital improvement program will continue to ensure that our facilities, equipment and vehicles are safe, energy efficient and operable at all times to deliver top‐notch services to the city’s residents. Goals of the Mayor – FY2017 Capital Improvement Program (CIP) My main goals are to improve the overall planning and budget process for addressing capital needs and to ensure accountability as it relates to implementation of capital work projects. The FY2017 capital budget is focused on overhauling and renovating neglected parks, playgrounds and recreational spaces, as well as renovations at the Parlin School, City Hall, Fire Station and the Armory. In holding to the policies set forth in the CIP, we have given priority to projects that can use grant funds to help offset overall costs of projects, or in some cases, fund an entire project. Otherwise, projects are ranked based upon priority as well as the ability to reduce long term operational costs.
365
FY17 Capital Improvement Program (CIP) – Highlights of Proposed CIP and FY17 Capital Budget For FY2017, my administration has created a capital plan that is fiscally responsible and transparent. The plan includes a particular focus on asset preservation, replacement of apparatus, and continued improvements to the city’s infrastructure. Proposed capital equipment purchases for FY2017 include the following:
New equipment and vehicles for DPW, including a new 6‐wheel dump truck and forestry bucket truck Replacement of Police cruisers and Administrative vehicles Replacement of Inspectional Services Vehicles Replacement of City Information Technology systems
The total amount of the proposed FY2017 Capital Budget that will require an appropriation from the Capital Improvement Stabilization Fund is $175,000. Proposed capital projects include the following:
Construction and renovation at Swan Street, Gramstorf and Florence Street parks Design and refurbishment of citywide Tot Lots LED street lighting for utility poles North Strand Bike Path lighting, cameras and amenities
Also, with regards to the city’s infrastructure, the city is estimating $645,477 from the State’s Chapter 90 program for eligible road repairs. This will complement the $75,000 requested as part of the FY2017 Capital Budget for the continuation of improving sidewalks and crosswalks throughout the city per the city’s pavement management program.
366
Capital Improvement ProgramFY2016 - FY2020
& FY2017 Capital Budget Overview
Carlo DeMaria, MayorEric Demas, CFO/City AuditorMay 16, 2016
Overview: Capital Improvement Plan vs. Capital Improvement Budget
• Capital Improvement Plan (CIP) is the long term plan forcapital improvements throughout the City(FY2016-FY2020).
• Capital Improvement Budget is the spending plan for theupcoming fiscal year (FY2017) for capital items.
• Combined, the CIP and Capital Budget are tools thathelp professionalize how capital projects are identified,prioritized, and funded for all City departments.
Capital Improvement Plan – Why?
• “Capital planning and budgeting is central to economicdevelopment, transportation, communication, deliveryof essential services, environmental management andquality of life of our citizens. Much of what isaccomplished by local government depends on a soundlong-term investment in infrastructure and equipment.”
▫ From ICMA’s Capital Budgeting: A guide For Local Governments
Capital Improvement Plan:FY2016 – FY2020
• The Capital Improvement Plan (CIP) is the long term plan forcapital improvements throughout the City.
• CIP ensures that capital needs are being addressedresponsibly based upon priority and thoughtful planning.
• CIP is a critical component of capital improvement budget (FY2017) and overall budget strategy.
• CIP gives the administration the ability and knowledge toaddress deferred maintenance, infrastructure needs, and all other future capital needs of the City.
367
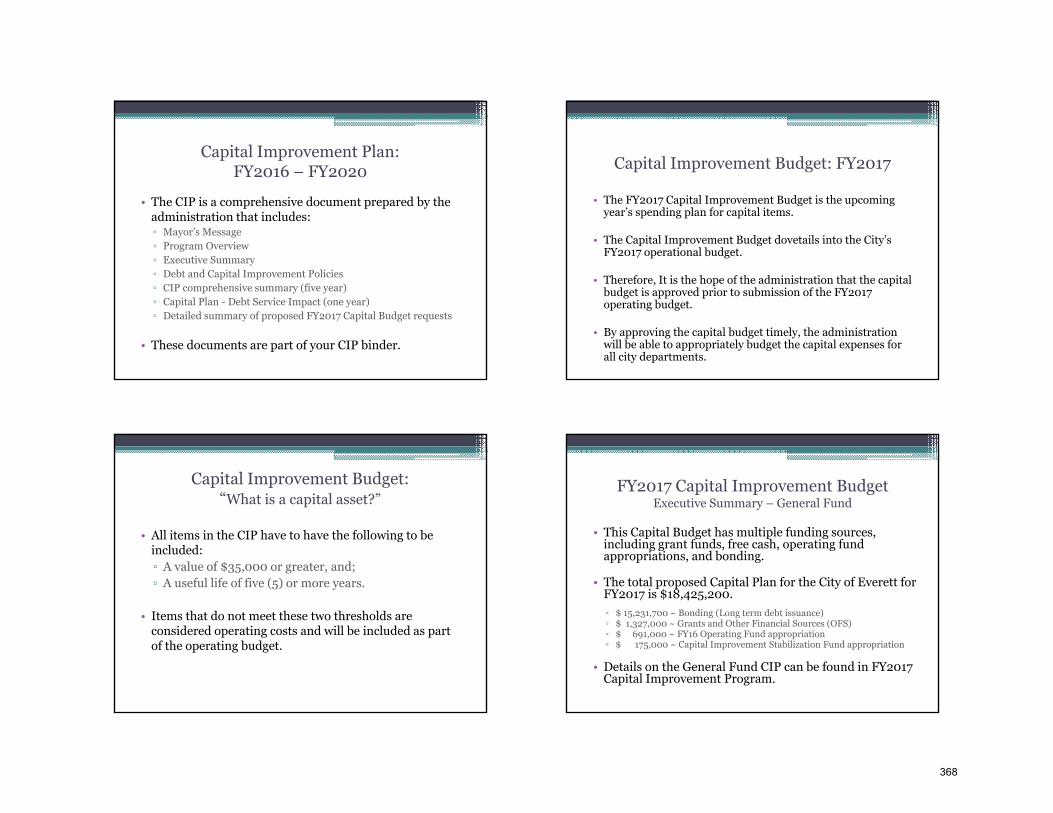
Capital Improvement Plan:FY2016 – FY2020
• The CIP is a comprehensive document prepared by theadministration that includes:▫ Mayor’s Message▫ Program Overview▫ Executive Summary▫ Debt and Capital Improvement Policies▫ CIP comprehensive summary (five year) ▫ Capital Plan - Debt Service Impact (one year)▫ Detailed summary of proposed FY2017 Capital Budget requests
• These documents are part of your CIP binder.
Capital Improvement Budget: FY2017
• The FY2017 Capital Improvement Budget is the upcomingyear’s spending plan for capital items.
• The Capital Improvement Budget dovetails into the City’sFY2017 operational budget.
• Therefore, It is the hope of the administration that the capitalbudget is approved prior to submission of the FY2017operating budget.
• By approving the capital budget timely, the administrationwill be able to appropriately budget the capital expenses forall city departments.
Capital Improvement Budget: “What is a capital asset?”
• All items in the CIP have to have the following to beincluded:▫ A value of $35,000 or greater, and;▫ A useful life of five (5) or more years.
• Items that do not meet these two thresholds areconsidered operating costs and will be included as partof the operating budget.
FY2017 Capital Improvement Budget Executive Summary – General Fund
• This Capital Budget has multiple funding sources,including grant funds, free cash, operating fundappropriations, and bonding.
• The total proposed Capital Plan for the City of Everett forFY2017 is $18,425,200.▫ $ 15,231,700 ~ Bonding (Long term debt issuance)▫ $ 1,327,000 ~ Grants and Other Financial Sources (OFS)▫ $ 691,000 ~ FY16 Operating Fund appropriation▫ $ 175,000 ~ Capital Improvement Stabilization Fund appropriation
• Details on the General Fund CIP can be found in FY2017Capital Improvement Program.
368
Summary: Capital Improvement Plan and its benefits
• Sound financial management represents one of the mostcritical aspects of local government administration.
• Capital planning enhances a community’s credit rating,controls its tax rate, and avoids sudden changes in debt service requirements.
• Capital planning process will keep public informed of current community objectives as well as future needs and projects.
• Sound policies and planning will identify the most economicalmeans of financing capital needs of the city.
369
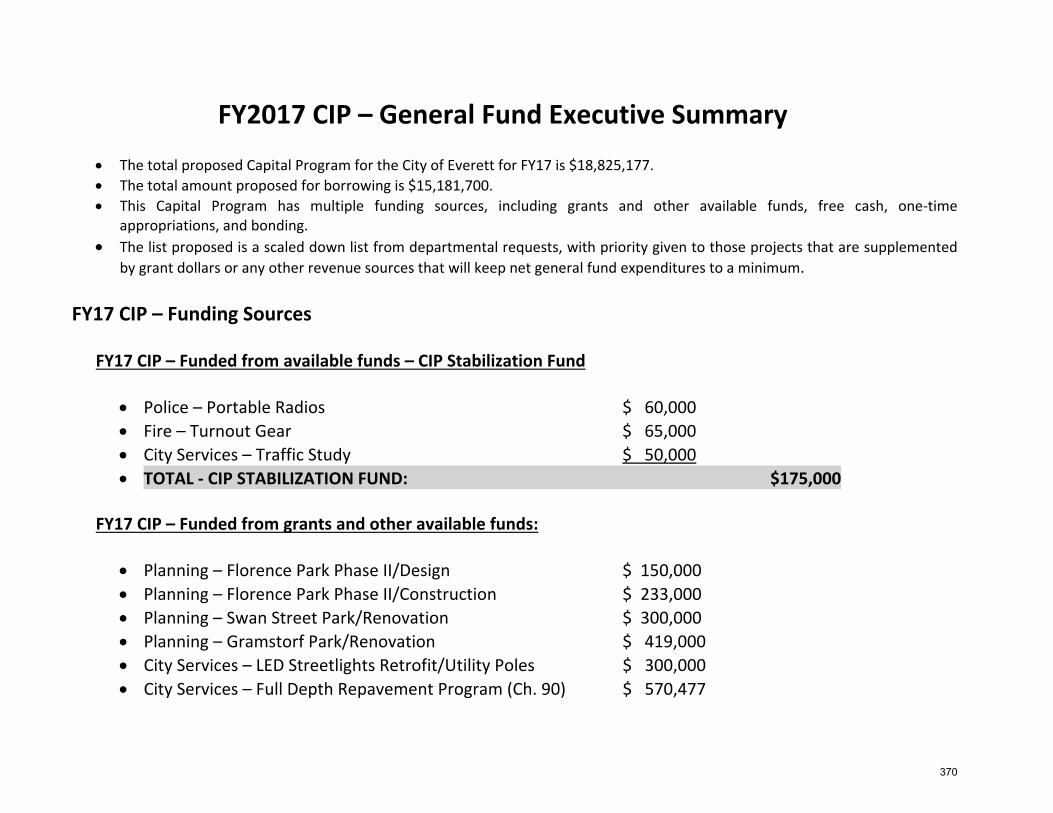
FY2017 CIP – General Fund Executive Summary
The total proposed Capital Program for the City of Everett for FY17 is $18,825,177. The total amount proposed for borrowing is $15,181,700. This Capital Program has multiple funding sources, including grants and other available funds, free cash, one‐time
appropriations, and bonding. The list proposed is a scaled down list from departmental requests, with priority given to those projects that are supplemented
by grant dollars or any other revenue sources that will keep net general fund expenditures to a minimum.
FY17 CIP – Funding Sources FY17 CIP – Funded from available funds – CIP Stabilization Fund
Police – Portable Radios $ 60,000 Fire – Turnout Gear $ 65,000 City Services – Traffic Study $ 50,000 TOTAL ‐ CIP STABILIZATION FUND: $175,000
FY17 CIP – Funded from grants and other available funds:
Planning – Florence Park Phase II/Design $ 150,000 Planning – Florence Park Phase II/Construction $ 233,000 Planning – Swan Street Park/Renovation $ 300,000 Planning – Gramstorf Park/Renovation $ 419,000 City Services – LED Streetlights Retrofit/Utility Poles $ 300,000 City Services – Full Depth Repavement Program (Ch. 90) $ 570,477
370
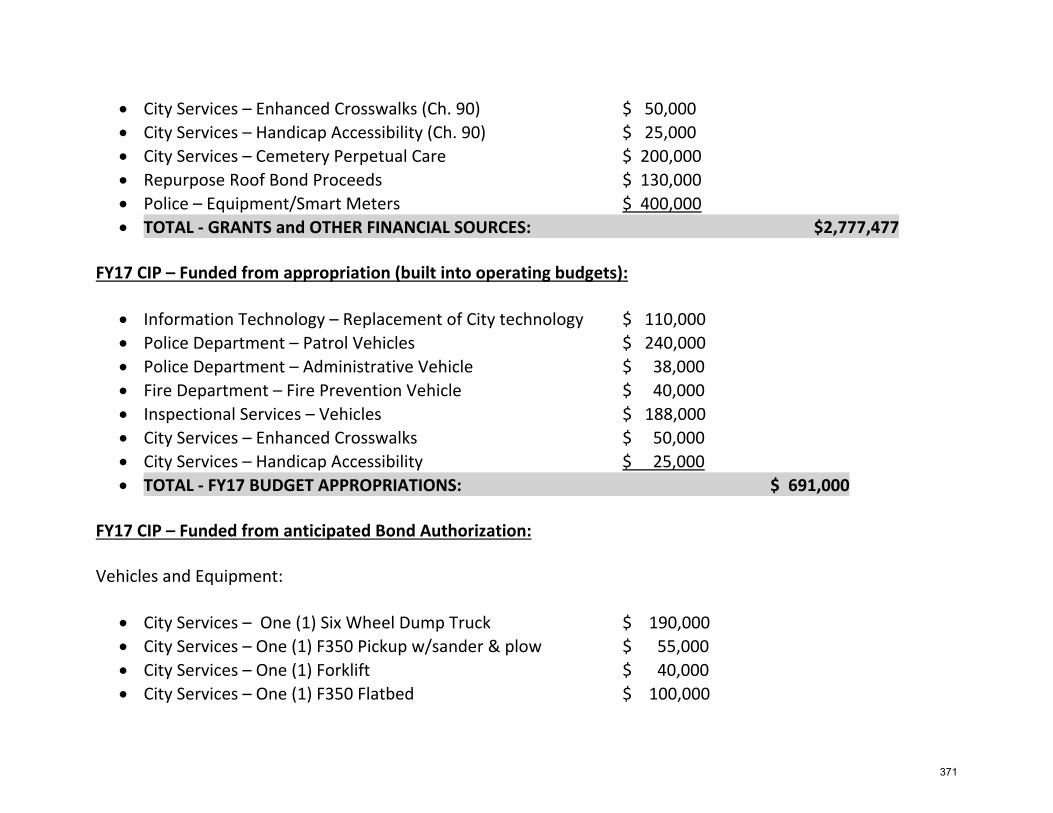
City Services – Enhanced Crosswalks (Ch. 90) $ 50,000 City Services – Handicap Accessibility (Ch. 90) $ 25,000 City Services – Cemetery Perpetual Care $ 200,000 Repurpose Roof Bond Proceeds $ 130,000 Police – Equipment/Smart Meters $ 400,000 TOTAL ‐ GRANTS and OTHER FINANCIAL SOURCES: $2,777,477
FY17 CIP – Funded from appropriation (built into operating budgets):
Information Technology – Replacement of City technology $ 110,000 Police Department – Patrol Vehicles $ 240,000 Police Department – Administrative Vehicle $ 38,000 Fire Department – Fire Prevention Vehicle $ 40,000 Inspectional Services – Vehicles $ 188,000 City Services – Enhanced Crosswalks $ 50,000 City Services – Handicap Accessibility $ 25,000 TOTAL ‐ FY17 BUDGET APPROPRIATIONS: $ 691,000
FY17 CIP – Funded from anticipated Bond Authorization: Vehicles and Equipment:
City Services – One (1) Six Wheel Dump Truck $ 190,000 City Services – One (1) F350 Pickup w/sander & plow $ 55,000 City Services – One (1) Forklift $ 40,000 City Services – One (1) F350 Flatbed $ 100,000
371
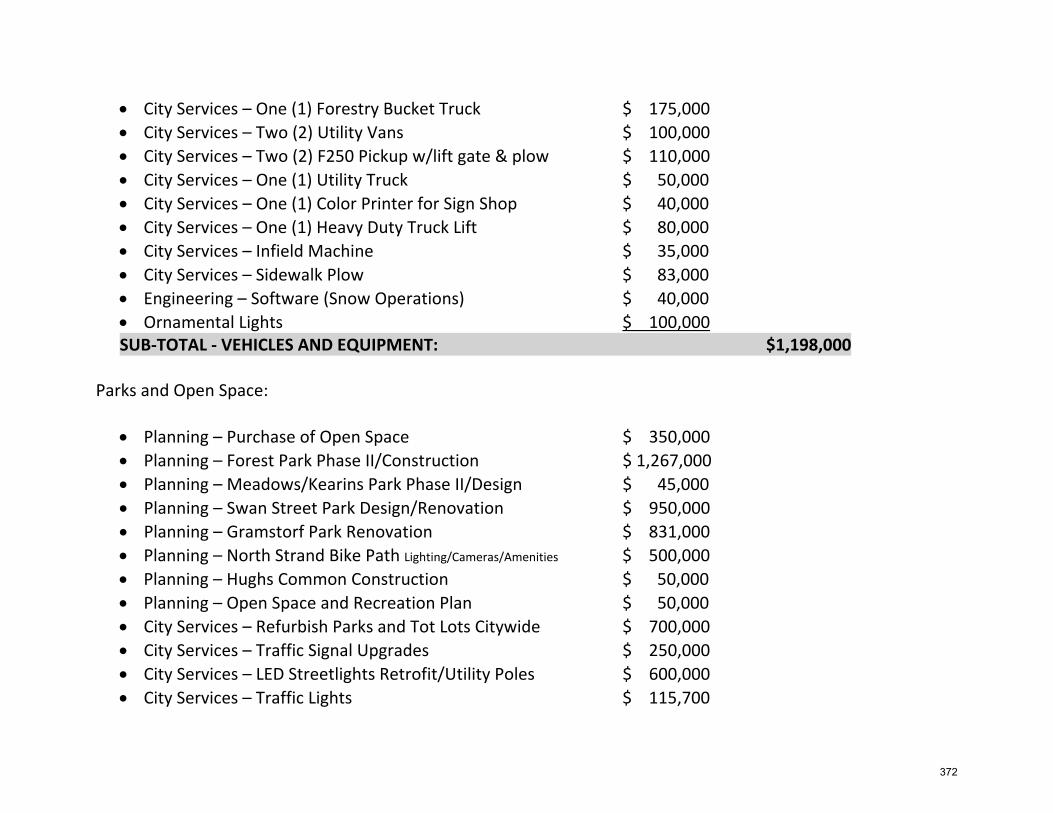
City Services – One (1) Forestry Bucket Truck $ 175,000 City Services – Two (2) Utility Vans $ 100,000 City Services – Two (2) F250 Pickup w/lift gate & plow $ 110,000 City Services – One (1) Utility Truck $ 50,000 City Services – One (1) Color Printer for Sign Shop $ 40,000 City Services – One (1) Heavy Duty Truck Lift $ 80,000 City Services – Infield Machine $ 35,000 City Services – Sidewalk Plow $ 83,000 Engineering – Software (Snow Operations) $ 40,000 Ornamental Lights $ 100,000 SUB‐TOTAL ‐ VEHICLES AND EQUIPMENT: $1,198,000
Parks and Open Space:
Planning – Purchase of Open Space $ 350,000 Planning – Forest Park Phase II/Construction $ 1,267,000 Planning – Meadows/Kearins Park Phase II/Design $ 45,000 Planning – Swan Street Park Design/Renovation $ 950,000 Planning – Gramstorf Park Renovation $ 831,000 Planning – North Strand Bike Path Lighting/Cameras/Amenities $ 500,000 Planning – Hughs Common Construction $ 50,000 Planning – Open Space and Recreation Plan $ 50,000 City Services – Refurbish Parks and Tot Lots Citywide $ 700,000 City Services – Traffic Signal Upgrades $ 250,000 City Services – LED Streetlights Retrofit/Utility Poles $ 600,000 City Services – Traffic Lights $ 115,700
372
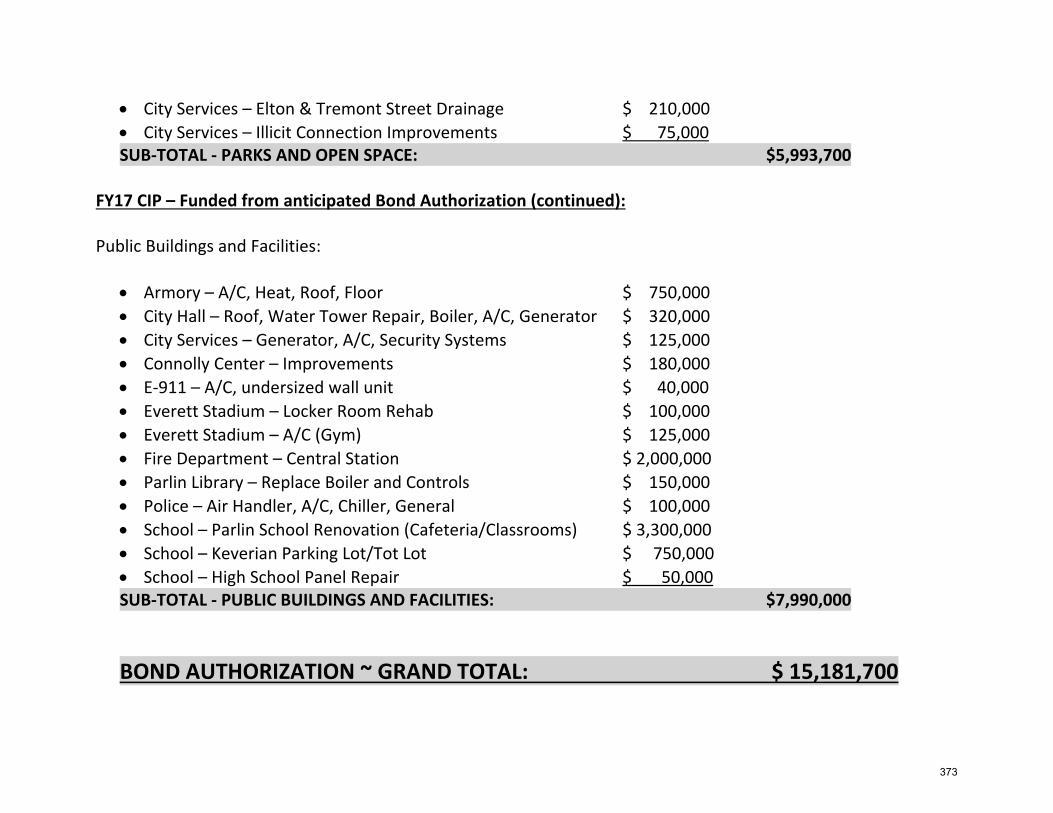
City Services – Elton & Tremont Street Drainage $ 210,000 City Services – Illicit Connection Improvements $ 75,000 SUB‐TOTAL ‐ PARKS AND OPEN SPACE: $5,993,700
FY17 CIP – Funded from anticipated Bond Authorization (continued): Public Buildings and Facilities:
Armory – A/C, Heat, Roof, Floor $ 750,000 City Hall – Roof, Water Tower Repair, Boiler, A/C, Generator $ 320,000 City Services – Generator, A/C, Security Systems $ 125,000 Connolly Center – Improvements $ 180,000 E‐911 – A/C, undersized wall unit $ 40,000 Everett Stadium – Locker Room Rehab $ 100,000 Everett Stadium – A/C (Gym) $ 125,000 Fire Department – Central Station $ 2,000,000 Parlin Library – Replace Boiler and Controls $ 150,000 Police – Air Handler, A/C, Chiller, General $ 100,000 School – Parlin School Renovation (Cafeteria/Classrooms) $ 3,300,000 School – Keverian Parking Lot/Tot Lot $ 750,000 School – High School Panel Repair $ 50,000 SUB‐TOTAL ‐ PUBLIC BUILDINGS AND FACILITIES: $7,990,000
BOND AUTHORIZATION ~ GRAND TOTAL: $ 15,181,700
373
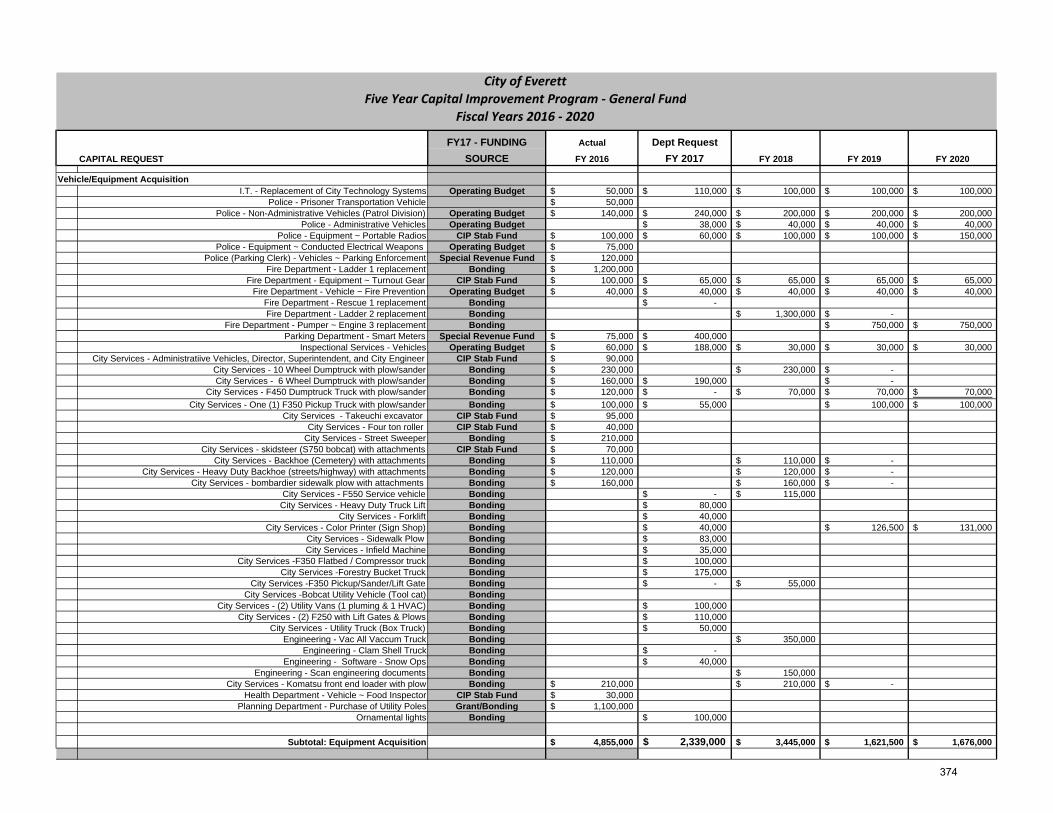
FY17 - FUNDING Actual Dept RequestCAPITAL REQUEST SOURCE FY 2016 FY 2017 FY 2018 FY 2019 FY 2020
Vehicle/Equipment AcquisitionI.T. - Replacement of City Technology Systems Operating Budget 50,000$ 110,000$ 100,000$ 100,000$ 100,000$
Police - Prisoner Transportation Vehicle 50,000$ Police - Non-Administrative Vehicles (Patrol Division) Operating Budget 140,000$ 240,000$ 200,000$ 200,000$ 200,000$
Police - Administrative Vehicles Operating Budget 38,000$ 40,000$ 40,000$ 40,000$ Police - Equipment ~ Portable Radios CIP Stab Fund 100,000$ 60,000$ 100,000$ 100,000$ 150,000$
Police - Equipment ~ Conducted Electrical Weapons Operating Budget 75,000$ Police (Parking Clerk) - Vehicles ~ Parking Enforcement Special Revenue Fund 120,000$
Fire Department - Ladder 1 replacement Bonding 1,200,000$ Fire Department - Equipment ~ Turnout Gear CIP Stab Fund 100,000$ 65,000$ 65,000$ 65,000$ 65,000$
Fire Department - Vehicle ~ Fire Prevention Operating Budget 40,000$ 40,000$ 40,000$ 40,000$ 40,000$ Fire Department - Rescue 1 replacement Bonding -$ Fire Department - Ladder 2 replacement Bonding 1,300,000$ -$
Fire Department - Pumper ~ Engine 3 replacement Bonding 750,000$ 750,000$ Parking Department - Smart Meters Special Revenue Fund 75,000$ 400,000$
Inspectional Services - Vehicles Operating Budget 60,000$ 188,000$ 30,000$ 30,000$ 30,000$ City Services - Administratiive Vehicles, Director, Superintendent, and City Engineer CIP Stab Fund 90,000$
City Services - 10 Wheel Dumptruck with plow/sander Bonding 230,000$ 230,000$ -$ City Services - 6 Wheel Dumptruck with plow/sander Bonding 160,000$ 190,000$ -$
City Services - F450 Dumptruck Truck with plow/sander Bonding 120,000$ -$ 70,000$ 70,000$ 70,000$ City Services - One (1) F350 Pickup Truck with plow/sander Bonding 100,000$ 55,000$ 100,000$ 100,000$
City Services - Takeuchi excavator CIP Stab Fund 95,000$ City Services - Four ton roller CIP Stab Fund 40,000$
City Services - Street Sweeper Bonding 210,000$ City Services - skidsteer (S750 bobcat) with attachments CIP Stab Fund 70,000$
City Services - Backhoe (Cemetery) with attachments Bonding 110,000$ 110,000$ -$ City Services - Heavy Duty Backhoe (streets/highway) with attachments Bonding 120,000$ 120,000$ -$
City Services - bombardier sidewalk plow with attachments Bonding 160,000$ 160,000$ -$ City Services - F550 Service vehicle Bonding -$ 115,000$
City Services - Heavy Duty Truck Lift Bonding 80,000$ City Services - Forklift Bonding 40,000$
City Services - Color Printer (Sign Shop) Bonding 40,000$ 126,500$ 131,000$ City Services - Sidewalk Plow Bonding 83,000$ City Services - Infield Machine Bonding 35,000$
City Services -F350 Flatbed / Compressor truck Bonding 100,000$ City Services -Forestry Bucket Truck Bonding 175,000$
City Services -F350 Pickup/Sander/Lift Gate Bonding -$ 55,000$ City Services -Bobcat Utility Vehicle (Tool cat) Bonding
City Services - (2) Utility Vans (1 pluming & 1 HVAC) Bonding 100,000$ City Services - (2) F250 with Lift Gates & Plows Bonding 110,000$
City Services - Utility Truck (Box Truck) Bonding 50,000$ Engineering - Vac All Vaccum Truck Bonding 350,000$
Engineering - Clam Shell Truck Bonding -$ Engineering - Software - Snow Ops Bonding 40,000$
Engineering - Scan engineering documents Bonding 150,000$ City Services - Komatsu front end loader with plow Bonding 210,000$ 210,000$ -$
Health Department - Vehicle ~ Food Inspector CIP Stab Fund 30,000$ Planning Department - Purchase of Utility Poles Grant/Bonding 1,100,000$
Ornamental lights Bonding 100,000$
Subtotal: Equipment Acquisition 4,855,000$ 2,339,000$ 3,445,000$ 1,621,500$ 1,676,000$
City of EverettFive Year Capital Improvement Program ‐ General Fund
Fiscal Years 2016 ‐ 2020
374
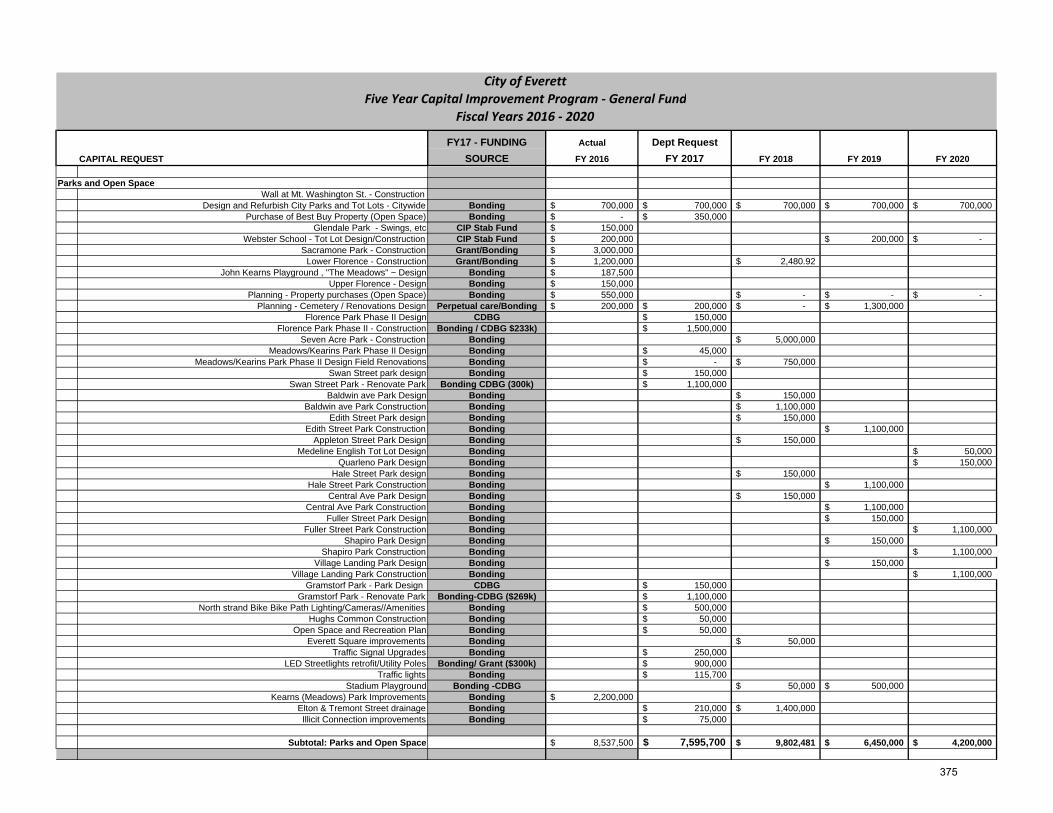
FY17 - FUNDING Actual Dept RequestCAPITAL REQUEST SOURCE FY 2016 FY 2017 FY 2018 FY 2019 FY 2020
City of EverettFive Year Capital Improvement Program ‐ General Fund
Fiscal Years 2016 ‐ 2020
Parks and Open SpaceWall at Mt. Washington St. - Construction
Design and Refurbish City Parks and Tot Lots - Citywide Bonding 700,000$ 700,000$ 700,000$ 700,000$ 700,000$ Purchase of Best Buy Property (Open Space) Bonding -$ 350,000$
Glendale Park - Swings, etc CIP Stab Fund 150,000$ Webster School - Tot Lot Design/Construction CIP Stab Fund 200,000$ 200,000$ -$
Sacramone Park - Construction Grant/Bonding 3,000,000$ Lower Florence - Construction Grant/Bonding 1,200,000$ 2,480.92$
John Kearns Playground , "The Meadows" ~ Design Bonding 187,500$ Upper Florence - Design Bonding 150,000$
Planning - Property purchases (Open Space) Bonding 550,000$ -$ -$ -$ Planning - Cemetery / Renovations Design Perpetual care/Bonding 200,000$ 200,000$ -$ 1,300,000$
Florence Park Phase II Design CDBG 150,000$ Florence Park Phase II - Construction Bonding / CDBG $233k) 1,500,000$
Seven Acre Park - Construction Bonding 5,000,000$ Meadows/Kearins Park Phase II Design Bonding 45,000$
Meadows/Kearins Park Phase II Design Field Renovations Bonding -$ 750,000$ Swan Street park design Bonding 150,000$
Swan Street Park - Renovate Park Bonding CDBG (300k) 1,100,000$ Baldwin ave Park Design Bonding 150,000$
Baldwin ave Park Construction Bonding 1,100,000$ Edith Street Park design Bonding 150,000$
Edith Street Park Construction Bonding 1,100,000$ Appleton Street Park Design Bonding 150,000$
Medeline English Tot Lot Design Bonding 50,000$ Quarleno Park Design Bonding 150,000$
Hale Street Park design Bonding 150,000$ Hale Street Park Construction Bonding 1,100,000$
Central Ave Park Design Bonding 150,000$ Central Ave Park Construction Bonding 1,100,000$
Fuller Street Park Design Bonding 150,000$ Fuller Street Park Construction Bonding 1,100,000$
Shapiro Park Design Bonding 150,000$ Shapiro Park Construction Bonding 1,100,000$
Village Landing Park Design Bonding 150,000$ Village Landing Park Construction Bonding 1,100,000$
Gramstorf Park - Park Design CDBG 150,000$ Gramstorf Park - Renovate Park Bonding-CDBG ($269k) 1,100,000$
North strand Bike Bike Path Lighting/Cameras//Amenities Bonding 500,000$ Hughs Common Construction Bonding 50,000$
Open Space and Recreation Plan Bonding 50,000$ Everett Square improvements Bonding 50,000$
Traffic Signal Upgrades Bonding 250,000$ LED Streetlights retrofit/Utility Poles Bonding/ Grant ($300k) 900,000$
Traffic lights Bonding 115,700$ Stadium Playground Bonding -CDBG 50,000$ 500,000$
Kearns (Meadows) Park Improvements Bonding 2,200,000$ Elton & Tremont Street drainage Bonding 210,000$ 1,400,000$ Illicit Connection improvements Bonding 75,000$
Subtotal: Parks and Open Space 8,537,500$ 7,595,700$ 9,802,481$ 6,450,000$ 4,200,000$
375
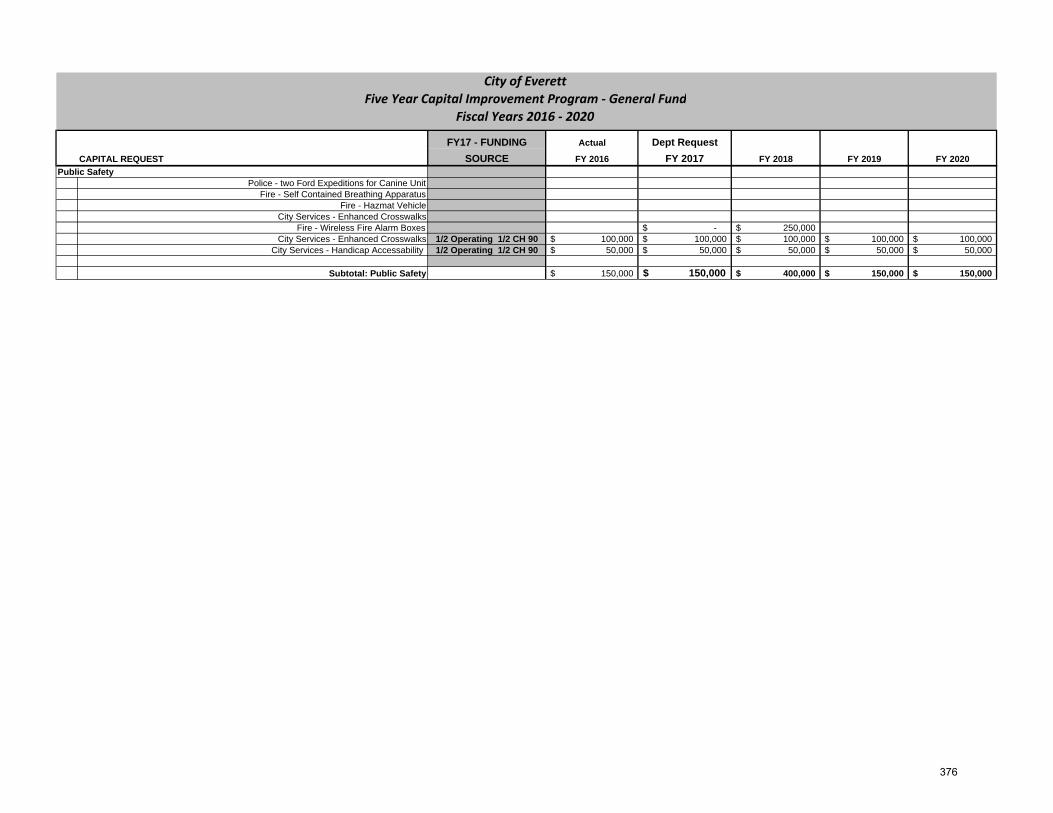
FY17 - FUNDING Actual Dept RequestCAPITAL REQUEST SOURCE FY 2016 FY 2017 FY 2018 FY 2019 FY 2020
City of EverettFive Year Capital Improvement Program ‐ General Fund
Fiscal Years 2016 ‐ 2020
Public SafetyPolice - two Ford Expeditions for Canine Unit
Fire - Self Contained Breathing ApparatusFire - Hazmat Vehicle
City Services - Enhanced CrosswalksFire - Wireless Fire Alarm Boxes -$ 250,000$
City Services - Enhanced Crosswalks 1/2 Operating 1/2 CH 90 100,000$ 100,000$ 100,000$ 100,000$ 100,000$ City Services - Handicap Accessability 1/2 Operating 1/2 CH 90 50,000$ 50,000$ 50,000$ 50,000$ 50,000$
Subtotal: Public Safety 150,000$ 150,000$ 400,000$ 150,000$ 150,000$
376
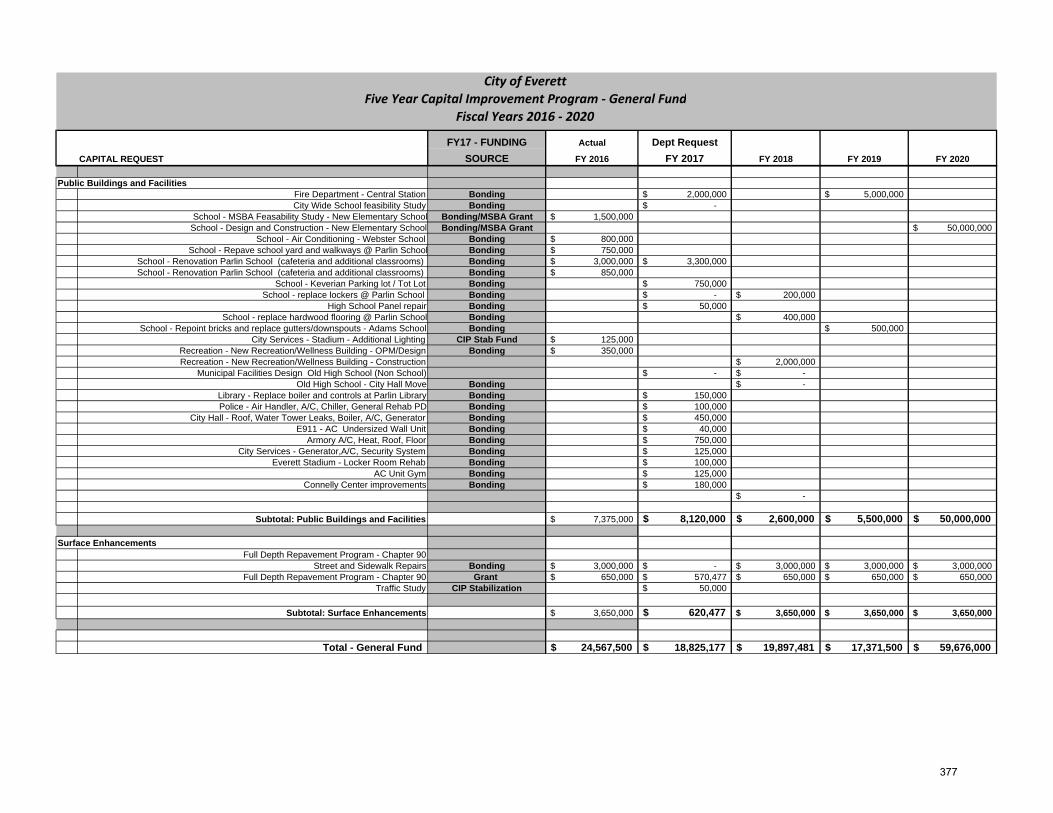
FY17 - FUNDING Actual Dept RequestCAPITAL REQUEST SOURCE FY 2016 FY 2017 FY 2018 FY 2019 FY 2020
City of EverettFive Year Capital Improvement Program ‐ General Fund
Fiscal Years 2016 ‐ 2020
Public Buildings and FacilitiesFire Department - Central Station Bonding 2,000,000$ 5,000,000$ City Wide School feasibility Study Bonding -$
School - MSBA Feasability Study - New Elementary School Bonding/MSBA Grant 1,500,000$ School - Design and Construction - New Elementary School Bonding/MSBA Grant 50,000,000$
School - Air Conditioning - Webster School Bonding 800,000$ School - Repave school yard and walkways @ Parlin School Bonding 750,000$
School - Renovation Parlin School (cafeteria and additional classrooms) Bonding 3,000,000$ 3,300,000$ School - Renovation Parlin School (cafeteria and additional classrooms) Bonding 850,000$
School - Keverian Parking lot / Tot Lot Bonding 750,000$ School - replace lockers @ Parlin School Bonding -$ 200,000$
High School Panel repair Bonding 50,000$ School - replace hardwood flooring @ Parlin School Bonding 400,000$
School - Repoint bricks and replace gutters/downspouts - Adams School Bonding 500,000$ City Services - Stadium - Additional Lighting CIP Stab Fund 125,000$
Recreation - New Recreation/Wellness Building - OPM/Design Bonding 350,000$ Recreation - New Recreation/Wellness Building - Construction 2,000,000$
Municipal Facilities Design Old High School (Non School) -$ -$ Old High School - City Hall Move Bonding -$
Library - Replace boiler and controls at Parlin Library Bonding 150,000$ Police - Air Handler, A/C, Chiller, General Rehab PD Bonding 100,000$
City Hall - Roof, Water Tower Leaks, Boiler, A/C, Generator Bonding 450,000$ E911 - AC Undersized Wall Unit Bonding 40,000$
Armory A/C, Heat, Roof, Floor Bonding 750,000$ City Services - Generator,A/C, Security System Bonding 125,000$
Everett Stadium - Locker Room Rehab Bonding 100,000$ AC Unit Gym Bonding 125,000$
Connelly Center improvements Bonding 180,000$ -$
Subtotal: Public Buildings and Facilities 7,375,000$ 8,120,000$ 2,600,000$ 5,500,000$ 50,000,000$
Surface EnhancementsFull Depth Repavement Program - Chapter 90
Street and Sidewalk Repairs Bonding 3,000,000$ -$ 3,000,000$ 3,000,000$ 3,000,000$ Full Depth Repavement Program - Chapter 90 Grant 650,000$ 570,477$ 650,000$ 650,000$ 650,000$
Traffic Study CIP Stabilization 50,000$
Subtotal: Surface Enhancements 3,650,000$ 620,477$ 3,650,000$ 3,650,000$ 3,650,000$
Total - General Fund 24,567,500$ 18,825,177$ 19,897,481$ 17,371,500$ 59,676,000$
377
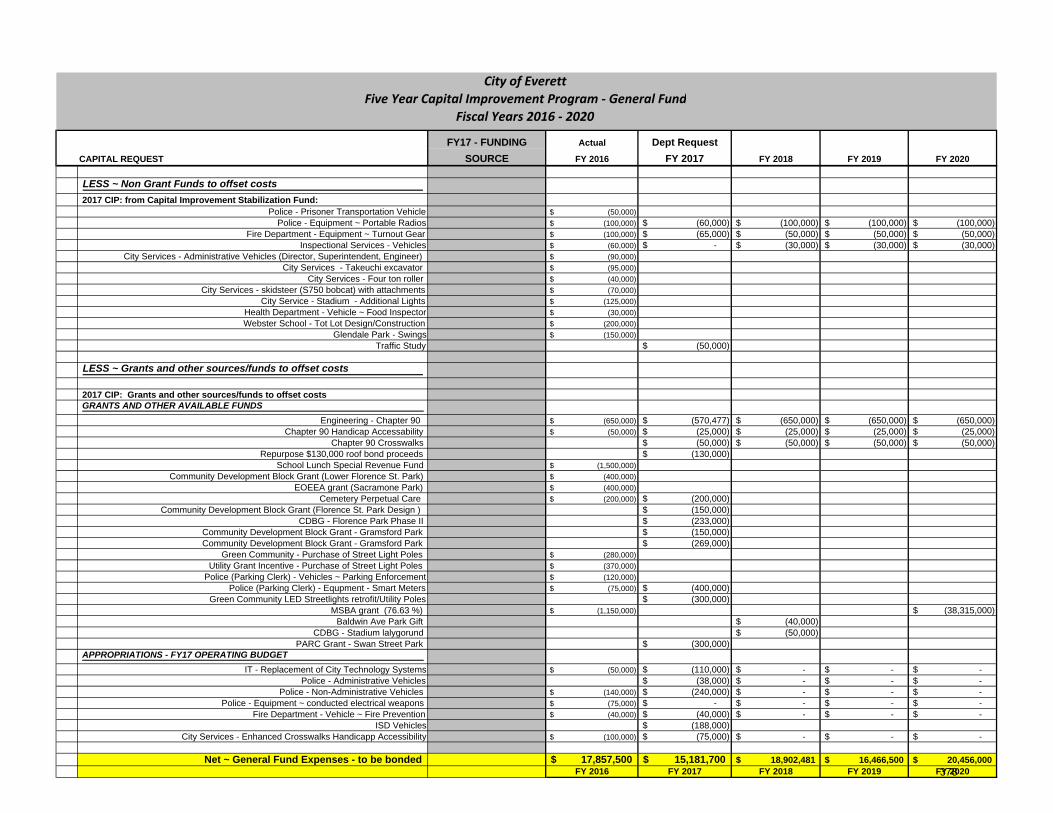
FY17 - FUNDING Actual Dept RequestCAPITAL REQUEST SOURCE FY 2016 FY 2017 FY 2018 FY 2019 FY 2020
City of EverettFive Year Capital Improvement Program ‐ General Fund
Fiscal Years 2016 ‐ 2020
LESS ~ Non Grant Funds to offset costs2017 CIP: from Capital Improvement Stabilization Fund:
Police - Prisoner Transportation Vehicle (50,000)$ Police - Equipment ~ Portable Radios (100,000)$ (60,000)$ (100,000)$ (100,000)$ (100,000)$
Fire Department - Equipment ~ Turnout Gear (100,000)$ (65,000)$ (50,000)$ (50,000)$ (50,000)$ Inspectional Services - Vehicles (60,000)$ -$ (30,000)$ (30,000)$ (30,000)$
City Services - Administrative Vehicles (Director, Superintendent, Engineer) (90,000)$ City Services - Takeuchi excavator (95,000)$
City Services - Four ton roller (40,000)$ City Services - skidsteer (S750 bobcat) with attachments (70,000)$
City Service - Stadium - Additional Lights (125,000)$ Health Department - Vehicle ~ Food Inspector (30,000)$ Webster School - Tot Lot Design/Construction (200,000)$
Glendale Park - Swings (150,000)$ Traffic Study (50,000)$
LESS ~ Grants and other sources/funds to offset costs
2017 CIP: Grants and other sources/funds to offset costsGRANTS AND OTHER AVAILABLE FUNDS
Engineering - Chapter 90 (650,000)$ (570,477)$ (650,000)$ (650,000)$ (650,000)$ Chapter 90 Handicap Accessability (50,000)$ (25,000)$ (25,000)$ (25,000)$ (25,000)$
Chapter 90 Crosswalks (50,000)$ (50,000)$ (50,000)$ (50,000)$ Repurpose $130,000 roof bond proceeds (130,000)$
School Lunch Special Revenue Fund (1,500,000)$ Community Development Block Grant (Lower Florence St. Park) (400,000)$
EOEEA grant (Sacramone Park) (400,000)$ Cemetery Perpetual Care (200,000)$ (200,000)$
Community Development Block Grant (Florence St. Park Design ) (150,000)$ CDBG - Florence Park Phase II (233,000)$
Community Development Block Grant - Gramsford Park (150,000)$ Community Development Block Grant - Gramsford Park (269,000)$
Green Community - Purchase of Street Light Poles (280,000)$ Utility Grant Incentive - Purchase of Street Light Poles (370,000)$
Police (Parking Clerk) - Vehicles ~ Parking Enforcement (120,000)$ Police (Parking Clerk) - Equpment - Smart Meters (75,000)$ (400,000)$
Green Community LED Streetlights retrofit/Utility Poles (300,000)$ MSBA grant (76.63 %) (1,150,000)$ (38,315,000)$
Baldwin Ave Park Gift (40,000)$ CDBG - Stadium lalygorund (50,000)$
PARC Grant - Swan Street Park (300,000)$ APPROPRIATIONS - FY17 OPERATING BUDGET
IT - Replacement of City Technology Systems (50,000)$ (110,000)$ -$ -$ -$ Police - Administrative Vehicles (38,000)$ -$ -$ -$
Police - Non-Administrative Vehicles (140,000)$ (240,000)$ -$ -$ -$ Police - Equipment ~ conducted electrical weapons (75,000)$ -$ -$ -$ -$
Fire Department - Vehicle ~ Fire Prevention (40,000)$ (40,000)$ -$ -$ -$ ISD Vehicles (188,000)$
City Services - Enhanced Crosswalks Handicapp Accessibility (100,000)$ (75,000)$ -$ -$ -$
Net ~ General Fund Expenses - to be bonded 17,857,500$ 15,181,700$ 18,902,481$ 16,466,500$ 20,456,000$ FY 2016 FY 2017 FY 2018 FY 2019 FY 2020378
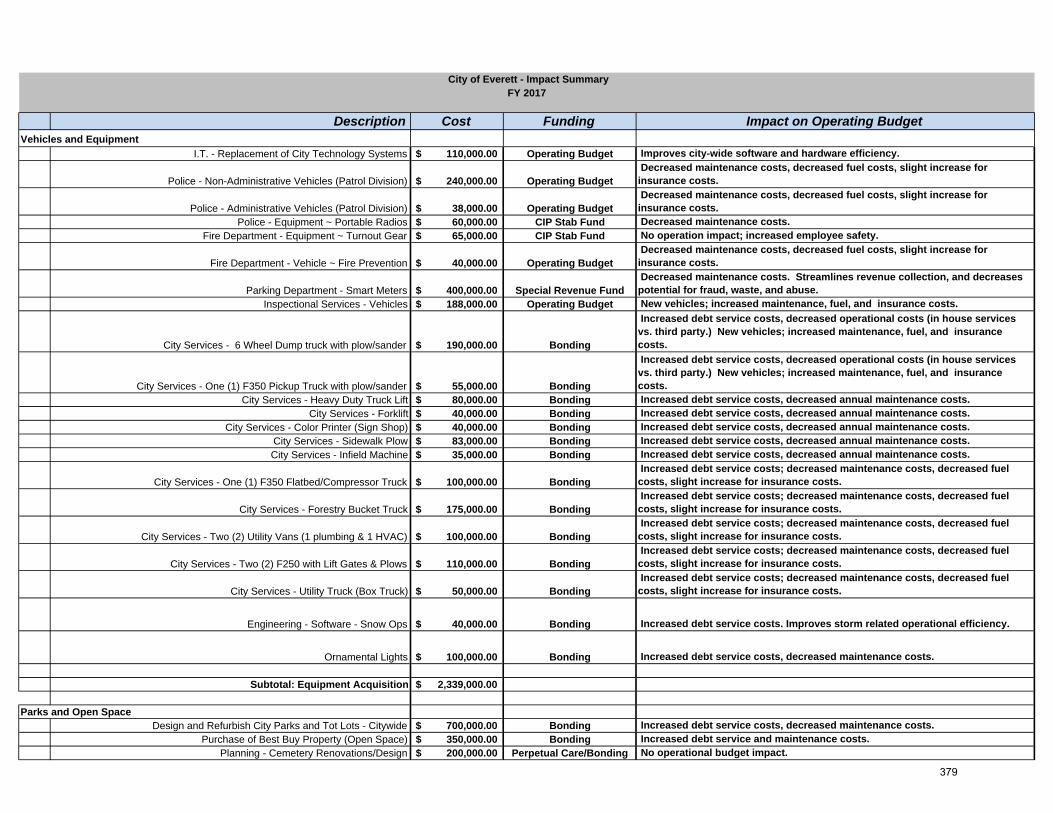
Description Cost Funding Impact on Operating BudgetVehicles and Equipment
I.T. - Replacement of City Technology Systems 110,000.00$ Operating Budget Improves city-wide software and hardware efficiency.
Police - Non-Administrative Vehicles (Patrol Division) 240,000.00$ Operating Budget Decreased maintenance costs, decreased fuel costs, slight increase for insurance costs.
Police - Administrative Vehicles (Patrol Division) 38,000.00$ Operating Budget Decreased maintenance costs, decreased fuel costs, slight increase for insurance costs.
Police - Equipment ~ Portable Radios 60,000.00$ CIP Stab Fund Decreased maintenance costs. Fire Department - Equipment ~ Turnout Gear 65,000.00$ CIP Stab Fund No operation impact; increased employee safety.
Fire Department - Vehicle ~ Fire Prevention 40,000.00$ Operating Budget Decreased maintenance costs, decreased fuel costs, slight increase for insurance costs.
Parking Department - Smart Meters 400,000.00$ Special Revenue Fund Decreased maintenance costs. Streamlines revenue collection, and decreases potential for fraud, waste, and abuse.
Inspectional Services - Vehicles 188,000.00$ Operating Budget New vehicles; increased maintenance, fuel, and insurance costs.
City Services - 6 Wheel Dump truck with plow/sander 190,000.00$ Bonding
Increased debt service costs, decreased operational costs (in house services vs. third party.) New vehicles; increased maintenance, fuel, and insurance costs.
City Services - One (1) F350 Pickup Truck with plow/sander 55,000.00$ Bonding
Increased debt service costs, decreased operational costs (in house services vs. third party.) New vehicles; increased maintenance, fuel, and insurance costs.
City Services - Heavy Duty Truck Lift 80,000.00$ Bonding Increased debt service costs, decreased annual maintenance costs. City Services - Forklift 40,000.00$ Bonding Increased debt service costs, decreased annual maintenance costs.
City Services - Color Printer (Sign Shop) 40,000.00$ Bonding Increased debt service costs, decreased annual maintenance costs. City Services - Sidewalk Plow 83,000.00$ Bonding Increased debt service costs, decreased annual maintenance costs. City Services - Infield Machine 35,000.00$ Bonding Increased debt service costs, decreased annual maintenance costs.
City Services - One (1) F350 Flatbed/Compressor Truck 100,000.00$ Bonding Increased debt service costs; decreased maintenance costs, decreased fuel costs, slight increase for insurance costs.
City Services - Forestry Bucket Truck 175,000.00$ Bonding Increased debt service costs; decreased maintenance costs, decreased fuel costs, slight increase for insurance costs.
City Services - Two (2) Utility Vans (1 plumbing & 1 HVAC) 100,000.00$ Bonding Increased debt service costs; decreased maintenance costs, decreased fuel costs, slight increase for insurance costs.
City Services - Two (2) F250 with Lift Gates & Plows 110,000.00$ Bonding Increased debt service costs; decreased maintenance costs, decreased fuel costs, slight increase for insurance costs.
City Services - Utility Truck (Box Truck) 50,000.00$ Bonding Increased debt service costs; decreased maintenance costs, decreased fuel costs, slight increase for insurance costs.
Engineering - Software - Snow Ops 40,000.00$ Bonding Increased debt service costs. Improves storm related operational efficiency.
Ornamental Lights 100,000.00$ Bonding Increased debt service costs, decreased maintenance costs.
Subtotal: Equipment Acquisition 2,339,000.00$
Parks and Open SpaceDesign and Refurbish City Parks and Tot Lots - Citywide 700,000.00$ Bonding Increased debt service costs, decreased maintenance costs.
Purchase of Best Buy Property (Open Space) 350,000.00$ Bonding Increased debt service and maintenance costs. Planning - Cemetery Renovations/Design 200,000.00$ Perpetual Care/Bonding No operational budget impact.
City of Everett - Impact SummaryFY 2017
379
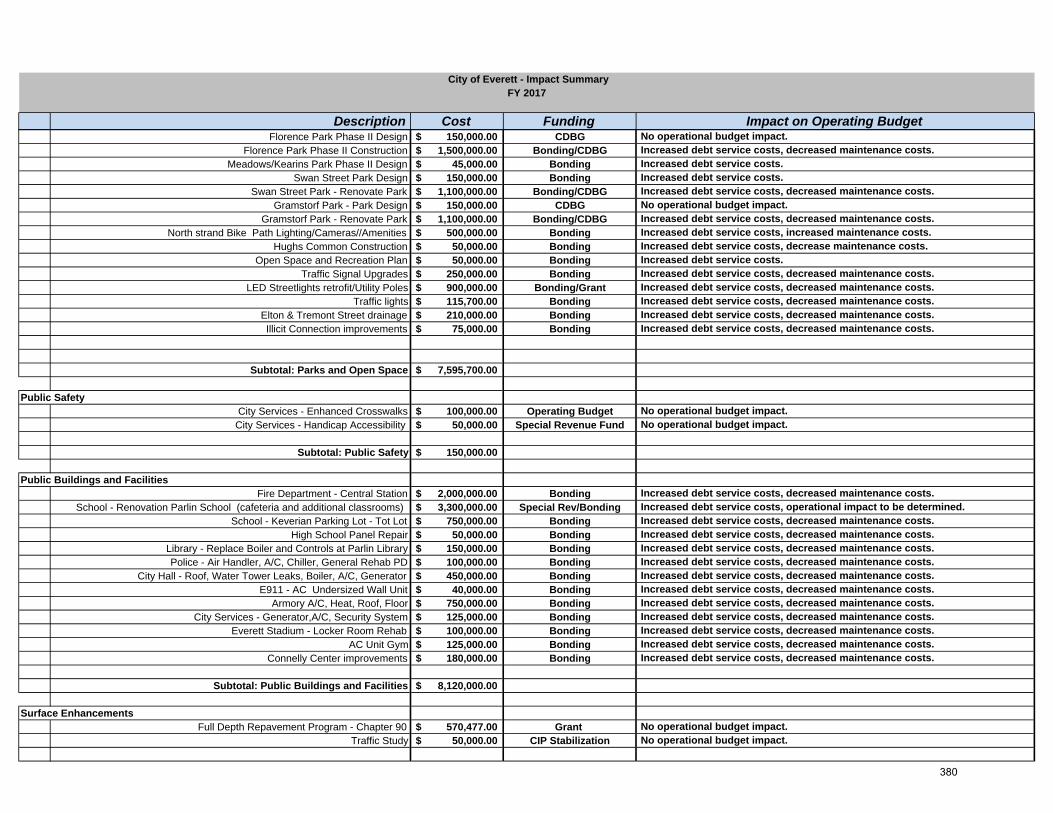
Description Cost Funding Impact on Operating Budget
City of Everett - Impact SummaryFY 2017
Florence Park Phase II Design 150,000.00$ CDBG No operational budget impact. Florence Park Phase II Construction 1,500,000.00$ Bonding/CDBG Increased debt service costs, decreased maintenance costs.
Meadows/Kearins Park Phase II Design 45,000.00$ Bonding Increased debt service costs. Swan Street Park Design 150,000.00$ Bonding Increased debt service costs.
Swan Street Park - Renovate Park 1,100,000.00$ Bonding/CDBG Increased debt service costs, decreased maintenance costs. Gramstorf Park - Park Design 150,000.00$ CDBG No operational budget impact.
Gramstorf Park - Renovate Park 1,100,000.00$ Bonding/CDBG Increased debt service costs, decreased maintenance costs. North strand Bike Path Lighting/Cameras//Amenities 500,000.00$ Bonding Increased debt service costs, increased maintenance costs.
Hughs Common Construction 50,000.00$ Bonding Increased debt service costs, decrease maintenance costs. Open Space and Recreation Plan 50,000.00$ Bonding Increased debt service costs.
Traffic Signal Upgrades 250,000.00$ Bonding Increased debt service costs, decreased maintenance costs. LED Streetlights retrofit/Utility Poles 900,000.00$ Bonding/Grant Increased debt service costs, decreased maintenance costs.
Traffic lights 115,700.00$ Bonding Increased debt service costs, decreased maintenance costs. Elton & Tremont Street drainage 210,000.00$ Bonding Increased debt service costs, decreased maintenance costs. Illicit Connection improvements 75,000.00$ Bonding Increased debt service costs, decreased maintenance costs.
Subtotal: Parks and Open Space 7,595,700.00$
Public SafetyCity Services - Enhanced Crosswalks 100,000.00$ Operating Budget No operational budget impact.
City Services - Handicap Accessibility 50,000.00$ Special Revenue Fund No operational budget impact.
Subtotal: Public Safety 150,000.00$
Public Buildings and FacilitiesFire Department - Central Station 2,000,000.00$ Bonding Increased debt service costs, decreased maintenance costs.
School - Renovation Parlin School (cafeteria and additional classrooms) 3,300,000.00$ Special Rev/Bonding Increased debt service costs, operational impact to be determined. School - Keverian Parking Lot - Tot Lot 750,000.00$ Bonding Increased debt service costs, decreased maintenance costs.
High School Panel Repair 50,000.00$ Bonding Increased debt service costs, decreased maintenance costs. Library - Replace Boiler and Controls at Parlin Library 150,000.00$ Bonding Increased debt service costs, decreased maintenance costs. Police - Air Handler, A/C, Chiller, General Rehab PD 100,000.00$ Bonding Increased debt service costs, decreased maintenance costs.
City Hall - Roof, Water Tower Leaks, Boiler, A/C, Generator 450,000.00$ Bonding Increased debt service costs, decreased maintenance costs. E911 - AC Undersized Wall Unit 40,000.00$ Bonding Increased debt service costs, decreased maintenance costs.
Armory A/C, Heat, Roof, Floor 750,000.00$ Bonding Increased debt service costs, decreased maintenance costs. City Services - Generator,A/C, Security System 125,000.00$ Bonding Increased debt service costs, decreased maintenance costs.
Everett Stadium - Locker Room Rehab 100,000.00$ Bonding Increased debt service costs, decreased maintenance costs. AC Unit Gym 125,000.00$ Bonding Increased debt service costs, decreased maintenance costs.
Connelly Center improvements 180,000.00$ Bonding Increased debt service costs, decreased maintenance costs.
Subtotal: Public Buildings and Facilities 8,120,000.00$
Surface EnhancementsFull Depth Repavement Program - Chapter 90 570,477.00$ Grant No operational budget impact.
Traffic Study 50,000.00$ CIP Stabilization No operational budget impact.
380
Description Cost Funding Impact on Operating Budget
City of Everett - Impact SummaryFY 2017
Subtotal: Surface Enhancements 620,477.00$
381
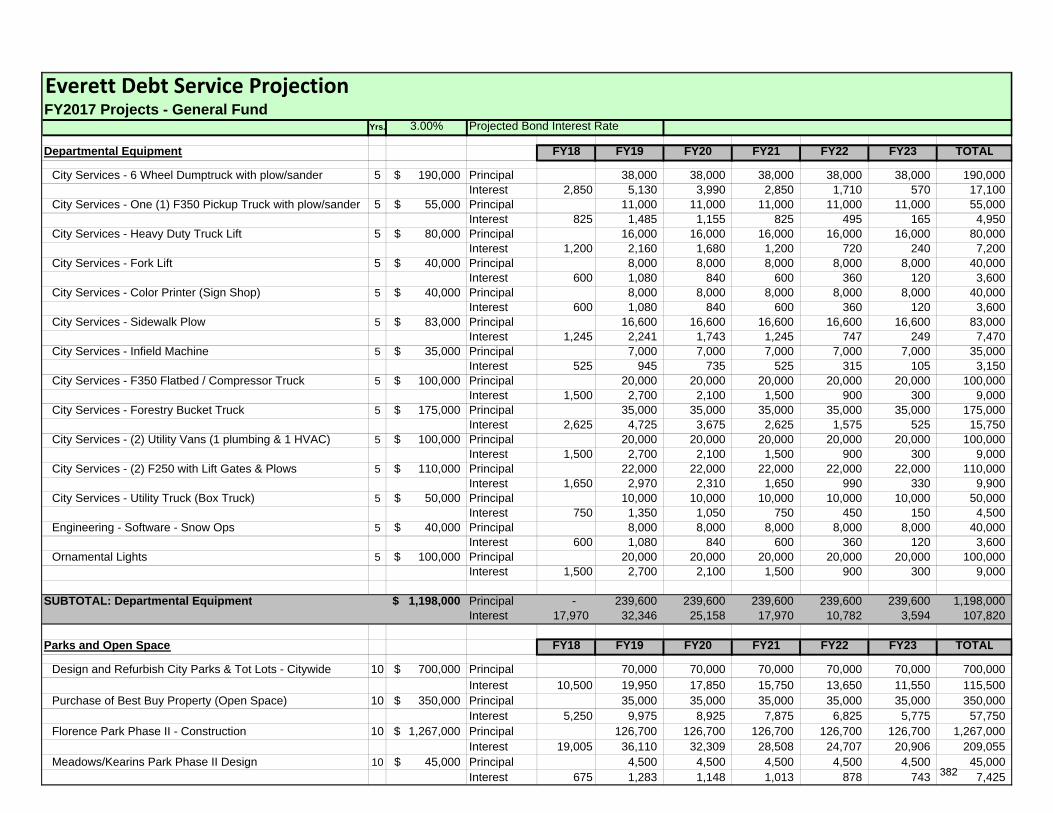
Everett Debt Service Projection FY2017 Projects - General Fund
Yrs. 3.00% Projected Bond Interest Rate
Departmental Equipment FY18 FY19 FY20 FY21 FY22 FY23 TOTAL
City Services - 6 Wheel Dumptruck with plow/sander 5 190,000$ Principal 38,000 38,000 38,000 38,000 38,000 190,000 Interest 2,850 5,130 3,990 2,850 1,710 570 17,100
City Services - One (1) F350 Pickup Truck with plow/sander 5 55,000$ Principal 11,000 11,000 11,000 11,000 11,000 55,000 Interest 825 1,485 1,155 825 495 165 4,950
City Services - Heavy Duty Truck Lift 5 80,000$ Principal 16,000 16,000 16,000 16,000 16,000 80,000 Interest 1,200 2,160 1,680 1,200 720 240 7,200
City Services - Fork Lift 5 40,000$ Principal 8,000 8,000 8,000 8,000 8,000 40,000 Interest 600 1,080 840 600 360 120 3,600
City Services - Color Printer (Sign Shop) 5 40,000$ Principal 8,000 8,000 8,000 8,000 8,000 40,000 Interest 600 1,080 840 600 360 120 3,600
City Services - Sidewalk Plow 5 83,000$ Principal 16,600 16,600 16,600 16,600 16,600 83,000 Interest 1,245 2,241 1,743 1,245 747 249 7,470
City Services - Infield Machine 5 35,000$ Principal 7,000 7,000 7,000 7,000 7,000 35,000 Interest 525 945 735 525 315 105 3,150
City Services - F350 Flatbed / Compressor Truck 5 100,000$ Principal 20,000 20,000 20,000 20,000 20,000 100,000 Interest 1,500 2,700 2,100 1,500 900 300 9,000
City Services - Forestry Bucket Truck 5 175,000$ Principal 35,000 35,000 35,000 35,000 35,000 175,000 Interest 2,625 4,725 3,675 2,625 1,575 525 15,750
City Services - (2) Utility Vans (1 plumbing & 1 HVAC) 5 100,000$ Principal 20,000 20,000 20,000 20,000 20,000 100,000 Interest 1,500 2,700 2,100 1,500 900 300 9,000
City Services - (2) F250 with Lift Gates & Plows 5 110,000$ Principal 22,000 22,000 22,000 22,000 22,000 110,000 Interest 1,650 2,970 2,310 1,650 990 330 9,900
City Services - Utility Truck (Box Truck) 5 50,000$ Principal 10,000 10,000 10,000 10,000 10,000 50,000 Interest 750 1,350 1,050 750 450 150 4,500
Engineering - Software - Snow Ops 5 40,000$ Principal 8,000 8,000 8,000 8,000 8,000 40,000 Interest 600 1,080 840 600 360 120 3,600
Ornamental Lights 5 100,000$ Principal 20,000 20,000 20,000 20,000 20,000 100,000 Interest 1,500 2,700 2,100 1,500 900 300 9,000
SUBTOTAL: Departmental Equipment 1,198,000$ Principal - 239,600 239,600 239,600 239,600 239,600 1,198,000 Interest 17,970 32,346 25,158 17,970 10,782 3,594 107,820
Parks and Open Space FY18 FY19 FY20 FY21 FY22 FY23 TOTAL
Design and Refurbish City Parks & Tot Lots - Citywide 10 700,000$ Principal 70,000 70,000 70,000 70,000 70,000 700,000 Interest 10,500 19,950 17,850 15,750 13,650 11,550 115,500
Purchase of Best Buy Property (Open Space) 10 350,000$ Principal 35,000 35,000 35,000 35,000 35,000 350,000 Interest 5,250 9,975 8,925 7,875 6,825 5,775 57,750
Florence Park Phase II - Construction 10 1,267,000$ Principal 126,700 126,700 126,700 126,700 126,700 1,267,000 Interest 19,005 36,110 32,309 28,508 24,707 20,906 209,055
Meadows/Kearins Park Phase II Design 10 45,000$ Principal 4,500 4,500 4,500 4,500 4,500 45,000 Interest 675 1,283 1,148 1,013 878 743 7,425 382
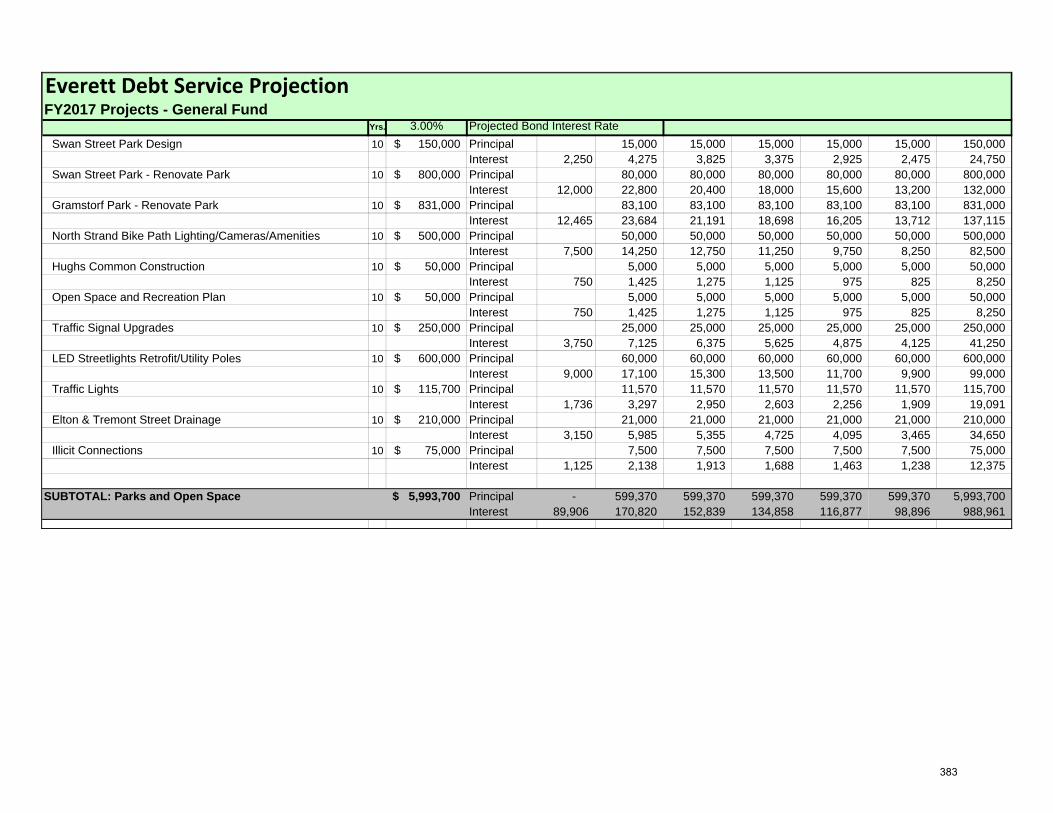
Everett Debt Service Projection FY2017 Projects - General Fund
Yrs. 3.00% Projected Bond Interest RateSwan Street Park Design 10 150,000$ Principal 15,000 15,000 15,000 15,000 15,000 150,000
Interest 2,250 4,275 3,825 3,375 2,925 2,475 24,750 Swan Street Park - Renovate Park 10 800,000$ Principal 80,000 80,000 80,000 80,000 80,000 800,000
Interest 12,000 22,800 20,400 18,000 15,600 13,200 132,000 Gramstorf Park - Renovate Park 10 831,000$ Principal 83,100 83,100 83,100 83,100 83,100 831,000
Interest 12,465 23,684 21,191 18,698 16,205 13,712 137,115 North Strand Bike Path Lighting/Cameras/Amenities 10 500,000$ Principal 50,000 50,000 50,000 50,000 50,000 500,000
Interest 7,500 14,250 12,750 11,250 9,750 8,250 82,500 Hughs Common Construction 10 50,000$ Principal 5,000 5,000 5,000 5,000 5,000 50,000
Interest 750 1,425 1,275 1,125 975 825 8,250 Open Space and Recreation Plan 10 50,000$ Principal 5,000 5,000 5,000 5,000 5,000 50,000
Interest 750 1,425 1,275 1,125 975 825 8,250 Traffic Signal Upgrades 10 250,000$ Principal 25,000 25,000 25,000 25,000 25,000 250,000
Interest 3,750 7,125 6,375 5,625 4,875 4,125 41,250 LED Streetlights Retrofit/Utility Poles 10 600,000$ Principal 60,000 60,000 60,000 60,000 60,000 600,000
Interest 9,000 17,100 15,300 13,500 11,700 9,900 99,000 Traffic Lights 10 115,700$ Principal 11,570 11,570 11,570 11,570 11,570 115,700
Interest 1,736 3,297 2,950 2,603 2,256 1,909 19,091 Elton & Tremont Street Drainage 10 210,000$ Principal 21,000 21,000 21,000 21,000 21,000 210,000
Interest 3,150 5,985 5,355 4,725 4,095 3,465 34,650 Illicit Connections 10 75,000$ Principal 7,500 7,500 7,500 7,500 7,500 75,000
Interest 1,125 2,138 1,913 1,688 1,463 1,238 12,375
SUBTOTAL: Parks and Open Space 5,993,700$ Principal - 599,370 599,370 599,370 599,370 599,370 5,993,700 Interest 89,906 170,820 152,839 134,858 116,877 98,896 988,961
383
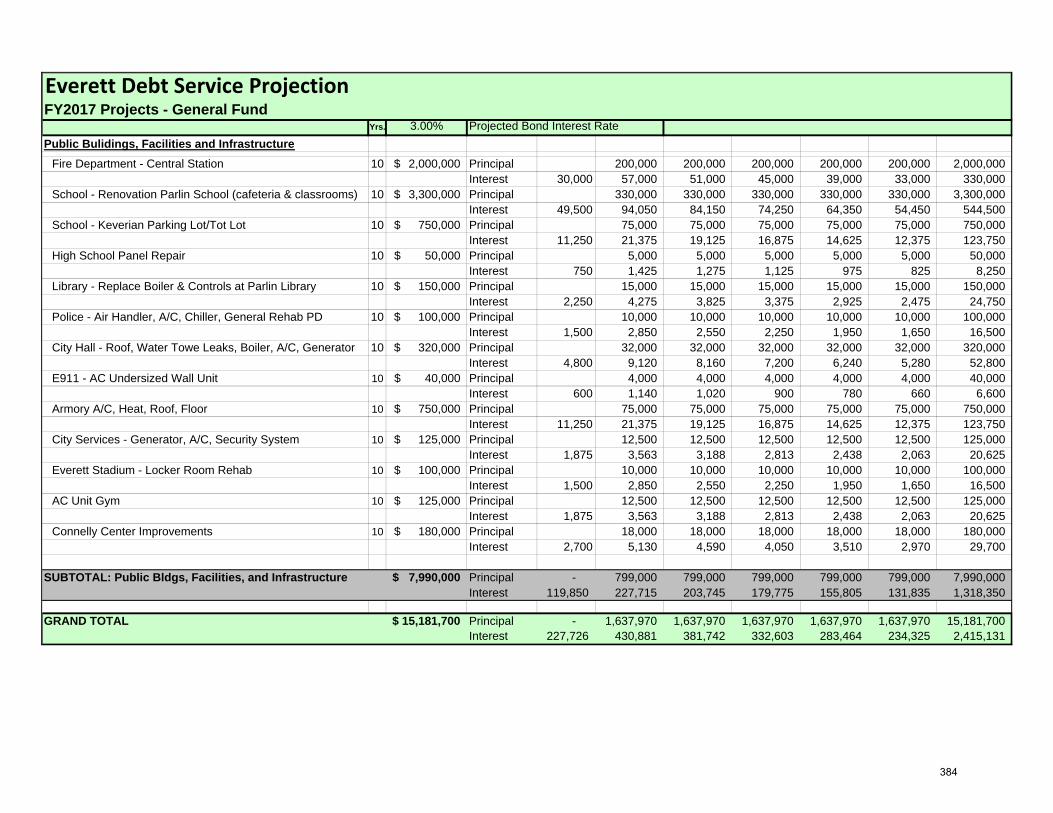
Everett Debt Service Projection FY2017 Projects - General Fund
Yrs. 3.00% Projected Bond Interest RatePublic Bulidings, Facilities and Infrastructure
Fire Department - Central Station 10 2,000,000$ Principal 200,000 200,000 200,000 200,000 200,000 2,000,000 Interest 30,000 57,000 51,000 45,000 39,000 33,000 330,000
School - Renovation Parlin School (cafeteria & classrooms) 10 3,300,000$ Principal 330,000 330,000 330,000 330,000 330,000 3,300,000 Interest 49,500 94,050 84,150 74,250 64,350 54,450 544,500
School - Keverian Parking Lot/Tot Lot 10 750,000$ Principal 75,000 75,000 75,000 75,000 75,000 750,000 Interest 11,250 21,375 19,125 16,875 14,625 12,375 123,750
High School Panel Repair 10 50,000$ Principal 5,000 5,000 5,000 5,000 5,000 50,000 Interest 750 1,425 1,275 1,125 975 825 8,250
Library - Replace Boiler & Controls at Parlin Library 10 150,000$ Principal 15,000 15,000 15,000 15,000 15,000 150,000 Interest 2,250 4,275 3,825 3,375 2,925 2,475 24,750
Police - Air Handler, A/C, Chiller, General Rehab PD 10 100,000$ Principal 10,000 10,000 10,000 10,000 10,000 100,000 Interest 1,500 2,850 2,550 2,250 1,950 1,650 16,500
City Hall - Roof, Water Towe Leaks, Boiler, A/C, Generator 10 320,000$ Principal 32,000 32,000 32,000 32,000 32,000 320,000 Interest 4,800 9,120 8,160 7,200 6,240 5,280 52,800
E911 - AC Undersized Wall Unit 10 40,000$ Principal 4,000 4,000 4,000 4,000 4,000 40,000 Interest 600 1,140 1,020 900 780 660 6,600
Armory A/C, Heat, Roof, Floor 10 750,000$ Principal 75,000 75,000 75,000 75,000 75,000 750,000 Interest 11,250 21,375 19,125 16,875 14,625 12,375 123,750
City Services - Generator, A/C, Security System 10 125,000$ Principal 12,500 12,500 12,500 12,500 12,500 125,000 Interest 1,875 3,563 3,188 2,813 2,438 2,063 20,625
Everett Stadium - Locker Room Rehab 10 100,000$ Principal 10,000 10,000 10,000 10,000 10,000 100,000 Interest 1,500 2,850 2,550 2,250 1,950 1,650 16,500
AC Unit Gym 10 125,000$ Principal 12,500 12,500 12,500 12,500 12,500 125,000 Interest 1,875 3,563 3,188 2,813 2,438 2,063 20,625
Connelly Center Improvements 10 180,000$ Principal 18,000 18,000 18,000 18,000 18,000 180,000 Interest 2,700 5,130 4,590 4,050 3,510 2,970 29,700
SUBTOTAL: Public Bldgs, Facilities, and Infrastructure 7,990,000$ Principal - 799,000 799,000 799,000 799,000 799,000 7,990,000 Interest 119,850 227,715 203,745 179,775 155,805 131,835 1,318,350
GRAND TOTAL 15,181,700$ Principal - 1,637,970 1,637,970 1,637,970 1,637,970 1,637,970 15,181,700 Interest 227,726 430,881 381,742 332,603 283,464 234,325 2,415,131
384
Capital Improvement Policies and Debt Policies
Budget Policies
The city will make all capital purchases and improvements in accordance with the adopted capital improvement program. The city will develop a multi‐year plan for capital improvements and update it annually. The city will enact an annual capital budget based on the multi‐year capital improvement plan. Future capital expenditures
necessitated by changes in population, changes in real estate development or changes in economic base will be calculated and included in capital budget projections.
The city will coordinate development of the capital improvement budget with the development of the operating budget.
Future operating costs associated with new capital improvement will be projected and included in operating budget forecasts.
The city will use intergovernmental assistance to finance only those capital improvements that are consistent with the capital
improvement plan and priorities, and who’s operating and maintenance costs have been included in operating budget forecasts.
The city will maintain all its assets at a level adequate to protect the city’s capital investment and to minimize future
maintenance and replacement costs.
The city, as part of its capital planning process, will project its equipment replacement and maintenance needs for the next several years and will update this projection each year. From this projection, a maintenance and replacement schedule will be developed and followed.
The city will identify the estimated costs and potential funding sources for each capital project proposal before it is submitted
to the City Council for approval.
385
The city will determine the least costly financing method for all new projects.
Debt Policies
The city will confine long‐term borrowing to capital improvements or projects/equipment that cannot be finance from current revenues.
When the city finances capital projects by issuing bonds, it will pay back the bonds within a period not to exceed the
expected useful life of the project.
Total net debt service from general obligation debt will not exceed five (5) percent of total annual operating budget as listed on part 1a of the annual tax rate recapitulation as submitted to the Department of Revenue.
Debt will only be issued for capital that is valued greater than $35,000, and has a depreciable life of five (5) or more years.
Total general obligation debt will not exceed that provided in the state statues.
Whenever possible, the city will use special revenue funds, special assessments, or other self‐supporting bonds, instead of
general obligation bonds.
The city will not use long‐term debt for current operations unless otherwise allowed via special legislation.
The city will retire bond anticipation debt within six months after completion of the project.
The city will maintain good communications with bond rating agencies about its financial condition.
The city will follow a policy of full disclosure on every financial report and bond prospectus. Source: “Handbook 4, Financial Performance Goals”, Evaluating Local Government Financial Condition, International City Management Association
386
City of Everett Fixed Costs – Debt
Debt Administration: Outstanding long‐term debt of the general government, as of June 30, 2016, totaled $95 million. The Commonwealth has approved school construction assistance to the city. The assistance program, administered by the Massachusetts School Building Authority, provides resources for future debt service of the general obligation school bonds. During FY2016, $1,882,459 of such assistance was received and $7,529,836 will be received in future years. The balance of outstanding debt will be supported by general fund revenues of the city. Bond Rating: On February 8, 2016, Standard and Poor’s rating services assigned its “AA” rating to the city’s 2014 general obligation (GO) municipal purpose loan bonds. The city’s full‐faith‐and‐credit pledge secures the bonds. This rating reflects several factors of the city, including:
Strong budgetary flexibility Strong budgetary performance, and a diverse revenue stream Very strong liquidity, providing very strong cash to cover debt service and expenditures Strong debt and contingent liabilities profile, due to low net debt and rapid amortization. Strong institutional framework
A full copy of Standard and Poor’s summary is included as part of this section of the budget.
387
Understanding Municipal Debt
The decision to borrow money can be intimidating. To make matters more uncertain, the mechanics of issuing debt may be the least understood financial process among citizens, local officials and even some professional staff. Generally known is the statutory requirement that a town meeting, or a city council, can authorize borrowing only by two‐thirds vote. State law also specifies what expenditure purposes may be funded through debt and the allowed duration of the borrowing term (M.G.L. Ch. 44). The terms of a borrowing are made final when a majority of the board of selectmen, or the mayor, affixes their signature to required documentation. However, between authorization and issuance much more occurs with little notice outside the treasurer’s office. In the narrative that follows, we hope to provide some clarity. Discussed will be typical reasons why municipalities borrow and the borrowing vehicles that are available. The players who are a part of the process are described, as well as the process itself. Communities in Massachusetts have an ongoing responsibility to create and maintain capital assets. Hopefully, decisions of this nature are based on a capital improvement plan developed through analysis and prioritization of the community’s needs. Beyond a role in funding capital improvements related to buildings, infrastructure and equipment, it is the treasurer’s responsibility to maintain sufficient cash balances to meet the spending demands of departments, within the limits of appropriations. Occasionally, some communities also find themselves in need of a short‐term infusion of cash for either capital or operating purposes. For these and other reasons, Massachusetts General Law authorizes cities and towns to issue debt under certain circumstances and for various durations. Often, the reasons for borrowing will dictate the type of debt a community chooses to take on. This is because some vehicles are better suited than others, depending on the nature of the need for funds. To make the discussion simpler, we can conceive of municipal debt as essentially falling into two categories: short‐term and long‐term. Short‐term Debt Short‐term debt can be classified best as borrowing through the issue of notes in anticipation of either paying them off or permanently financing the debt. Short‐term borrowing also allows communities to make interest‐only payments. However, such debt usually has a maturity date of no more than two years and, in some cases, statute dictates a shorter timeframe. Additionally, a community might choose to re‐issue short‐term debt and/or make principal payments under certain circumstances. The various types of short‐term debt vehicles used in Massachusetts include the following:
388
Revenue Anticipation Notes (RANs) – These notes, issued for a maximum of one‐year, are used to stabilize cash flow when the treasurer’s cash balances are low or forecast to go negative (M.G.L. Ch. 44, §4). The notes are issued to fill a cash need, usually until quarterly/semi‐annual tax payments or local aid distributions from the Commonwealth are received. Federal and State Aid Anticipation Notes (FAANs and SAANs) – These notes are issued to fund spending in anticipation of grant receipts, with the expectation that the note will be paid‐off upon receiving federal, state or other funds (e.g. Chapter 90 highway project reimbursements). Bond Anticipation Notes (BANs) – These notes are issued to provide funding for capital improvements. BANs are usually paid‐off with the proceeds of long‐term financing instruments such as general obligation bonds. However, state law allows for BANs to be re‐issued for up to five years if principle payments are made in accordance with an amortization schedule that would be required if the outstanding balance had been financed as long‐term debt (M.G.L. Ch. 44, §17). Since short‐term debt normally carries a lower interest rate than permanent, this strategy may make sense under certain circumstances. Long‐term Debt Permanent financing vehicles, i.e. municipal bonds, are typically issued when market conditions make it advantageous to lock‐in a fixed interest rate or when further refunding of short‐term debt is no longer an option due to statutory time limits. The various purposes for which borrowing is permitted are expressly outlined by M.G.L. Ch. 44, §§7 & 8. Nationwide, general obligation (GO) bonds are by far the most prevalent form of long‐term municipal debt. This is especially true in Massachusetts. GO bonds are backed by the full faith and credit of a municipality. They are issued for periods ranging from five to thirty years depending on limitations established by state law. Additional vehicles for long‐term debt do exist. Examples include pension obligation, revenue, conduit, special tax, and limited obligation bonds. However, these complex options, while more common in other states, are almost never issued by communities in Massachusetts. Such debt vehicles are suited to very specific or unique financing purposes that would require special legislation or state approval in most instances.
389
Available State Programs State Qualified Bonds – A financing alternative unique to Massachusetts, qualified bonds are for municipalities that have marginal credit ratings. The State Treasurer pays the debt service for GO bonds directly from a community’s local aid, reinforcing the security of the bond and improving its marketability, thus reducing the cost of borrowing. Qualified bonds are only authorized by the Municipal Finance Oversight Board upon application by a city, town or regional school district under M.G.L. Ch. 44A. State House Notes Program – State House Notes are certified by the Director of Accounts and payable annually. They are usually limited to maturities of five years and principal amounts of $1 million. The notes are attractive, more often to smaller communities, because certification fees are low, neither an official statement nor full disclosure is required, and they are issued in a short period of time. Information about the State House Notes Program can be obtained by contacting the Public Finance Section at the Division of Local Services. Financial Advisor The intricacies and nuances of borrowing options available to cities and towns can give rise to many questions and decisions for municipal officials. For this reason, it makes sense for communities to utilize the services of a Massachusetts‐based financial advisor. While helpful at any phase of the borrowing process, the expertise of an advisor is most useful in considering the various options available to a community for structuring debt and navigating procedures associated with the sale. A financial advisor can assist communities in considering the following:
Choosing between the various debt instruments available.
Deciding between a competitive vs. negotiated sale.
Determining the short and long‐term costs of purchasing bond insurance.
Communicating information to bond rating agencies.
Analyzing the debt service impacts of various repayment schedules.
390
In addition to the number of specialized firms which provide financial advisory services to large and mid‐size municipalities, for smaller communities, the Public Finance Section at the Division of Local Services can also provide guidance on the debt issuance process. Credit Rating Agencies In Massachusetts, nearly all communities that carry bond ratings are evaluated by at least one of two rating agencies (Moody’s Investors Service and Standard & Poor’s). Some communities will seek ratings from both firms. While the ratings process tends to appear shrouded in mystery for some, it is important to remember that the city or town is a client of the rating agencies who, for their part, render a third party opinion on the municipality’s likelihood of default. In conducting their assessment, rating agencies will perform analyses of financial statements, management capability, fiscal stability, economic condition and other data. The process will often include an in‐person or telephone interview with municipal finance officials. On less frequent occasions, ratings analysts will make a site visit to a city or town in an effort to gain a more substantial understanding of community assets and management’s capabilities. Later, the rating will be assigned and published in a concise written report describing the community’s financial position. Those who purchase municipal bonds and notes will use this rating when considering their bids. Typically, the better rated credits will garner lower interest rate charges. Bond Counsel Another participant in the issuance phase is the community’s bond counsel. Bond counsel is an attorney or law firm engaged to review and submit an opinion on the legal aspects of a municipal bond or note issue. Bond counsel confirms that a borrowing has met all legal prerequisites before it is put to bid on the open market by examining required documentation (e.g. signed and sealed copies of city council or town meeting votes). If bond counsel determines that a debt issue does not meet legal sufficiency, corrective action needs to be taken by city or town officials. This may include going back to town meeting or the city council for debt authorization or other cumbersome, not to mention embarrassing, requirements. Therefore, it is helpful to consult bond counsel throughout the authorization phase, as well as prior to issuance.
391
Typical Chronology After authority to raise money through debt is granted by city council or town meeting, actual issuance of notes or bonds may occur months, or even years, later. For this reason, it is good practice for local finance officials to meet periodically to review borrowings that have been authorized, but not issued, to make sure that the debt position of the community is understood by all. Once the structure of a borrowing has been determined, a preliminary official statement (POS) is developed under direction of the treasurer and disseminated to the bond market community. The POS will also be used by rating agencies in their analysis of credit worthiness. Both the POS and the final Official Statement (OS) are documents prepared for potential investors that contain information about a prospective bond or note issue and financial data about the city or town. The OS is sometimes referred to as an offering circular or prospectus. After all of the preliminary work has been done and the various experts (e.g. bond counsel, rating agencies) have weighed‐in on the sale, the bonds or notes are sold to underwriters or broker syndicates and, ultimately, to investors. Once payment on the purchase has been made, the community has the funds for the specified capital improvement or operating expenditures. To minimize interest costs, or more efficiently assemble borrowing packages, treasurers should always communicate with the department head, who will oversee a project or purchase, to better understand when funds will be needed. By taking a deliberate and thoughtful approach toward debt, cities and towns can optimize their borrowing practices to better maintain capital assets and minimize costs. Having a basic understanding of the process and making use of the knowledge of investment professionals improves a community’s odds of success.
392
General Information on Debt Authorization and Legal Limit Notes and notes including refunding notes are generally authorized on behalf of the City by vote of two‐thirds of all the members of the City Council with the approval of the Mayor. Provision is made for a referendum on the filing of a petition bearing the requisite number of signatures. Borrowings for certain purposes require state administrative approval. When serial bonds or notes have been authorized, bond anticipation notes may be issued by the officers authorized to issue the serial bonds or notes. Temporary loans in anticipation of certain state and county reimbursements are generally authorized by majority vote but provision is made for temporary loans in anticipation of current revenues and federal grants and for other purposes in certain circumstances without City Council authorization.
The general debt limit of the city consists of a normal debt limit and a double debt limit. The normal debt limit is 5% of the valuation of taxable property as last equalized by the State Department of Revenue. The City can authorize debt up to this amount without State approval. It can authorize debt up to twice this amount (the double debt limit) with the approval of the State’s Municipal Finance Oversight Board. Based on the City’s proposed equalized valuation (EQV) of $4,498,331,100, its normal debt limit is $224,916,555 and its double debt limit is $449,833,110.
There are many categories of general obligation debt which are exempt from and do not count against the general debt limit. Among others, these exempt categories include revenues anticipation notes and grant anticipation notes; emergency loans exempted by special laws, bonds for water (limited to 10% of equalized valuation), housing, urban renewal and economic development (subject to various debt limits) and electric, gas, community antenna television systems, and telecommunication systems (subject to separate limits). Revenue bonds and water pollution abatement revenue bonds are not subject to these debt limits. The general debt limit and the special debt limit for water bonds apply at the time debt is authorized. The other special debt limits generally apply at the time the debt is incurred.
The amount borrowed in each fiscal year by the issue of revenue anticipation notes is limited to the tax levy of the prior fiscal year, together with the net receipts in the prior fiscal year from the motor vehicle excise and certain payments made by the Commonwealth in lieu of taxes. The fiscal year ends on June 30th. Notes may mature in the following fiscal year, and notes may be refunded into the following fiscal year to the extent of the uncollected, unabated current tax levy and certain other items, including
393
revenue deficits, overlay deficits, final judgments and lawful un‐appropriated expenditures, which are to be added to the next tax levy, but excluding deficits arising from a failure to collect taxes of earlier years. In any event, the period from an original borrowing to its final maturity cannot exceed one year.
Types of Obligations
General Obligations – Massachusetts cities and towns are authorized to issue general obligation indebtedness of the following types:
Serial Bonds and Notes – These are generally required to be payable in equal or diminishing annual principal amounts beginning no later than the end of the next fiscal year commencing after the date of issue and ending within the terms permitted by law. Level debt service is permitted for bonds and notes issued for certain purposes including self‐supporting enterprise purposes, certain state aided school projects and for projects for which debt service has been exempted from property tax limitations. The maximum terms vary from one year to 40 years, depending on the purpose of the issue. Most of the purposes are capital projects. Bonds or notes may be made callable and redeemed prior to their maturity, and a redemption premium may be paid. Refunding bonds or notes may be issued subject to the maximum term measured from the date of the original bonds or notes. Serial bonds may be issued as “qualified bonds” with the approval of the state Municipal Finance Oversight Board consisting of the Attorney General, the State Treasurer, the State Auditor and the Director of Accounts, subject to such conditions and limitations (including restrictions on future indebtedness) as may be required by the Board. Qualified bonds may mature in not less than 10 or more than 30 years from their dates and are not subject to the amortization requirements described above. The State Treasurer is required to pay the debt service on qualified bonds and thereafter to withhold the amount of the debt service from state aid or other state payments. Administrative costs and any loss of interest income to the State area are to be assessed upon the city or town.
Bond Anticipation Notes (BAN) – These generally must mature within two years of their original dates of issuance but may be refunded from time to time for a period not to exceed five years from their original dates of issuances, provided that (except for notes issued for certain school projects that have been approved for state school construction aid) for each year that the notes are refunded beyond the second year they must be paid in part from revenue funds in an amount at least equal to the minimum annual payment that would have been required if the bonds had been issued at the end of the s second year. The maximum term of bonds
394
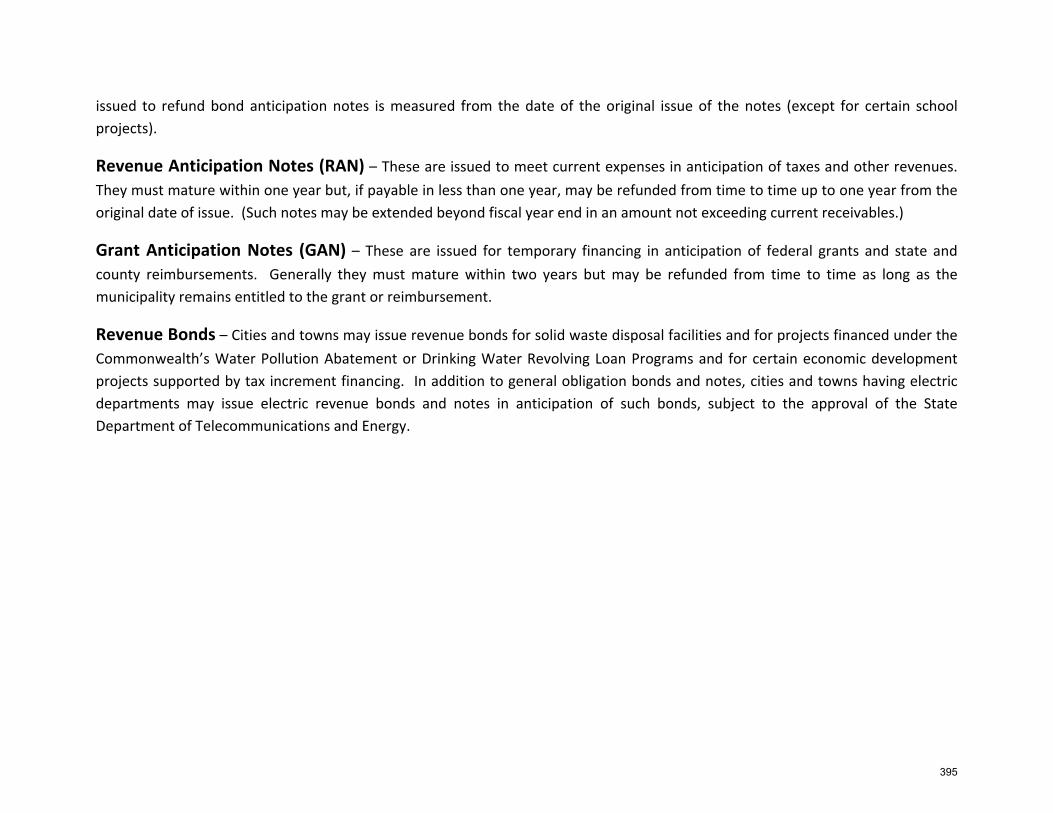
issued to refund bond anticipation notes is measured from the date of the original issue of the notes (except for certain school projects).
Revenue Anticipation Notes (RAN) – These are issued to meet current expenses in anticipation of taxes and other revenues. They must mature within one year but, if payable in less than one year, may be refunded from time to time up to one year from the original date of issue. (Such notes may be extended beyond fiscal year end in an amount not exceeding current receivables.)
Grant Anticipation Notes (GAN) – These are issued for temporary financing in anticipation of federal grants and state and county reimbursements. Generally they must mature within two years but may be refunded from time to time as long as the municipality remains entitled to the grant or reimbursement.
Revenue Bonds – Cities and towns may issue revenue bonds for solid waste disposal facilities and for projects financed under the Commonwealth’s Water Pollution Abatement or Drinking Water Revolving Loan Programs and for certain economic development projects supported by tax increment financing. In addition to general obligation bonds and notes, cities and towns having electric departments may issue electric revenue bonds and notes in anticipation of such bonds, subject to the approval of the State Department of Telecommunications and Energy.
395
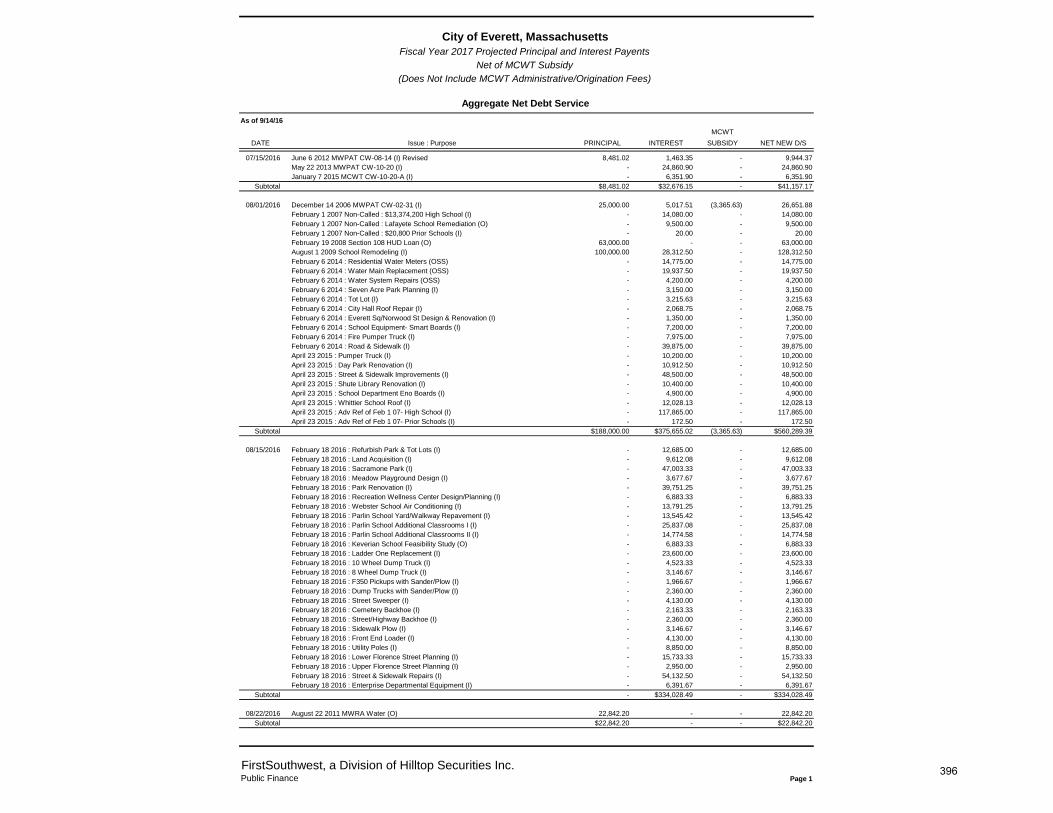
City of Everett, MassachusettsFiscal Year 2017 Projected Principal and Interest Payents
Net of MCWT Subsidy
(Does Not Include MCWT Administrative/Origination Fees)
Aggregate Net Debt ServiceAs of 9/14/16
MCWTDATE Issue : Purpose PRINCIPAL INTEREST SUBSIDY NET NEW D/S
07/15/2016 June 6 2012 MWPAT CW-08-14 (I) Revised 8,481.02 1,463.35 - 9,944.37May 22 2013 MWPAT CW-10-20 (I) - 24,860.90 - 24,860.90January 7 2015 MCWT CW-10-20-A (I) - 6,351.90 - 6,351.90
Subtotal $8,481.02 $32,676.15 - $41,157.17
08/01/2016 December 14 2006 MWPAT CW-02-31 (I) 25,000.00 5,017.51 (3,365.63) 26,651.88February 1 2007 Non-Called : $13,374,200 High School (I) - 14,080.00 - 14,080.00February 1 2007 Non-Called : Lafayete School Remediation (O) - 9,500.00 - 9,500.00February 1 2007 Non-Called : $20,800 Prior Schools (I) - 20.00 - 20.00February 19 2008 Section 108 HUD Loan (O) 63,000.00 - - 63,000.00August 1 2009 School Remodeling (I) 100,000.00 28,312.50 - 128,312.50February 6 2014 : Residential Water Meters (OSS) - 14,775.00 - 14,775.00February 6 2014 : Water Main Replacement (OSS) - 19,937.50 - 19,937.50February 6 2014 : Water System Repairs (OSS) - 4,200.00 - 4,200.00February 6 2014 : Seven Acre Park Planning (I) - 3,150.00 - 3,150.00February 6 2014 : Tot Lot (I) - 3,215.63 - 3,215.63February 6 2014 : City Hall Roof Repair (I) - 2,068.75 - 2,068.75February 6 2014 : Everett Sq/Norwood St Design & Renovation (I) - 1,350.00 - 1,350.00February 6 2014 : School Equipment- Smart Boards (I) - 7,200.00 - 7,200.00February 6 2014 : Fire Pumper Truck (I) - 7,975.00 - 7,975.00February 6 2014 : Road & Sidewalk (I) - 39,875.00 - 39,875.00April 23 2015 : Pumper Truck (I) - 10,200.00 - 10,200.00April 23 2015 : Day Park Renovation (I) - 10,912.50 - 10,912.50April 23 2015 : Street & Sidewalk Improvements (I) - 48,500.00 - 48,500.00April 23 2015 : Shute Library Renovation (I) - 10,400.00 - 10,400.00April 23 2015 : School Department Eno Boards (I) - 4,900.00 - 4,900.00April 23 2015 : Whittier School Roof (I) - 12,028.13 - 12,028.13April 23 2015 : Adv Ref of Feb 1 07- High School (I) - 117,865.00 - 117,865.00April 23 2015 : Adv Ref of Feb 1 07- Prior Schools (I) - 172.50 - 172.50
Subtotal $188,000.00 $375,655.02 (3,365.63) $560,289.39
08/15/2016 February 18 2016 : Refurbish Park & Tot Lots (I) - 12,685.00 - 12,685.00February 18 2016 : Land Acquisition (I) - 9,612.08 - 9,612.08February 18 2016 : Sacramone Park (I) - 47,003.33 - 47,003.33February 18 2016 : Meadow Playground Design (I) - 3,677.67 - 3,677.67February 18 2016 : Park Renovation (I) - 39,751.25 - 39,751.25February 18 2016 : Recreation Wellness Center Design/Planning (I) - 6,883.33 - 6,883.33February 18 2016 : Webster School Air Conditioning (I) - 13,791.25 - 13,791.25February 18 2016 : Parlin School Yard/Walkway Repavement (I) - 13,545.42 - 13,545.42February 18 2016 : Parlin School Additional Classrooms I (I) - 25,837.08 - 25,837.08February 18 2016 : Parlin School Additional Classrooms II (I) - 14,774.58 - 14,774.58February 18 2016 : Keverian School Feasibility Study (O) - 6,883.33 - 6,883.33February 18 2016 : Ladder One Replacement (I) - 23,600.00 - 23,600.00February 18 2016 : 10 Wheel Dump Truck (I) - 4,523.33 - 4,523.33February 18 2016 : 8 Wheel Dump Truck (I) - 3,146.67 - 3,146.67February 18 2016 : F350 Pickups with Sander/Plow (I) - 1,966.67 - 1,966.67February 18 2016 : Dump Trucks with Sander/Plow (I) - 2,360.00 - 2,360.00February 18 2016 : Street Sweeper (I) - 4,130.00 - 4,130.00February 18 2016 : Cemetery Backhoe (I) - 2,163.33 - 2,163.33February 18 2016 : Street/Highway Backhoe (I) - 2,360.00 - 2,360.00February 18 2016 : Sidewalk Plow (I) - 3,146.67 - 3,146.67February 18 2016 : Front End Loader (I) - 4,130.00 - 4,130.00February 18 2016 : Utility Poles (I) - 8,850.00 - 8,850.00February 18 2016 : Lower Florence Street Planning (I) - 15,733.33 - 15,733.33February 18 2016 : Upper Florence Street Planning (I) - 2,950.00 - 2,950.00February 18 2016 : Street & Sidewalk Repairs (I) - 54,132.50 - 54,132.50February 18 2016 : Enterprise Departmental Equipment (I) - 6,391.67 - 6,391.67
Subtotal - $334,028.49 - $334,028.49
08/22/2016 August 22 2011 MWRA Water (O) 22,842.20 - - 22,842.20Subtotal $22,842.20 - - $22,842.20
Aggregate | 7/19/2016 | 10:04 AM
FirstSouthwest, a Division of Hilltop Securities Inc.Public Finance Page 1
396
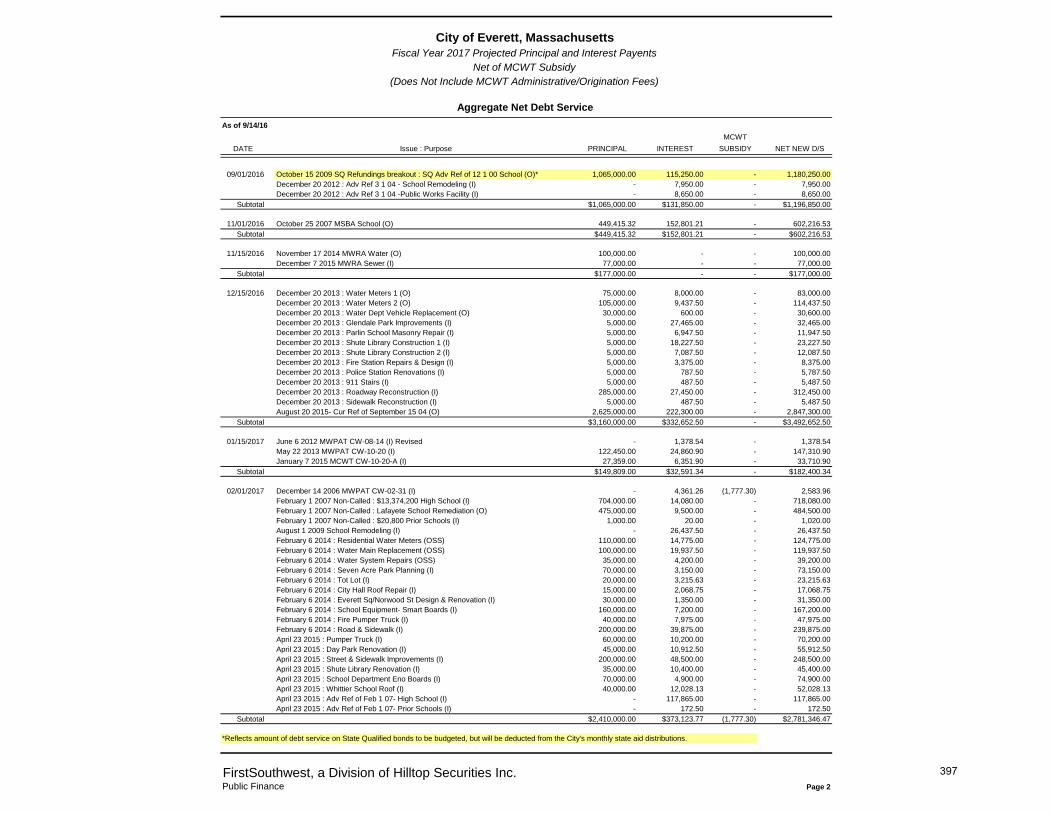
City of Everett, MassachusettsFiscal Year 2017 Projected Principal and Interest Payents
Net of MCWT Subsidy
(Does Not Include MCWT Administrative/Origination Fees)
Aggregate Net Debt ServiceAs of 9/14/16
MCWTDATE Issue : Purpose PRINCIPAL INTEREST SUBSIDY NET NEW D/S
09/01/2016 October 15 2009 SQ Refundings breakout : SQ Adv Ref of 12 1 00 School (O)* 1,065,000.00 115,250.00 - 1,180,250.00December 20 2012 : Adv Ref 3 1 04 - School Remodeling (I) - 7,950.00 - 7,950.00December 20 2012 : Adv Ref 3 1 04 -Public Works Facility (I) - 8,650.00 - 8,650.00
Subtotal $1,065,000.00 $131,850.00 - $1,196,850.00
11/01/2016 October 25 2007 MSBA School (O) 449,415.32 152,801.21 - 602,216.53Subtotal $449,415.32 $152,801.21 - $602,216.53
11/15/2016 November 17 2014 MWRA Water (O) 100,000.00 - - 100,000.00December 7 2015 MWRA Sewer (I) 77,000.00 - - 77,000.00
Subtotal $177,000.00 - - $177,000.00
12/15/2016 December 20 2013 : Water Meters 1 (O) 75,000.00 8,000.00 - 83,000.00December 20 2013 : Water Meters 2 (O) 105,000.00 9,437.50 - 114,437.50December 20 2013 : Water Dept Vehicle Replacement (O) 30,000.00 600.00 - 30,600.00December 20 2013 : Glendale Park Improvements (I) 5,000.00 27,465.00 - 32,465.00December 20 2013 : Parlin School Masonry Repair (I) 5,000.00 6,947.50 - 11,947.50December 20 2013 : Shute Library Construction 1 (I) 5,000.00 18,227.50 - 23,227.50December 20 2013 : Shute Library Construction 2 (I) 5,000.00 7,087.50 - 12,087.50December 20 2013 : Fire Station Repairs & Design (I) 5,000.00 3,375.00 - 8,375.00December 20 2013 : Police Station Renovations (I) 5,000.00 787.50 - 5,787.50December 20 2013 : 911 Stairs (I) 5,000.00 487.50 - 5,487.50December 20 2013 : Roadway Reconstruction (I) 285,000.00 27,450.00 - 312,450.00December 20 2013 : Sidewalk Reconstruction (I) 5,000.00 487.50 - 5,487.50August 20 2015- Cur Ref of September 15 04 (O) 2,625,000.00 222,300.00 - 2,847,300.00
Subtotal $3,160,000.00 $332,652.50 - $3,492,652.50
01/15/2017 June 6 2012 MWPAT CW-08-14 (I) Revised - 1,378.54 - 1,378.54May 22 2013 MWPAT CW-10-20 (I) 122,450.00 24,860.90 - 147,310.90January 7 2015 MCWT CW-10-20-A (I) 27,359.00 6,351.90 - 33,710.90
Subtotal $149,809.00 $32,591.34 - $182,400.34
02/01/2017 December 14 2006 MWPAT CW-02-31 (I) - 4,361.26 (1,777.30) 2,583.96February 1 2007 Non-Called : $13,374,200 High School (I) 704,000.00 14,080.00 - 718,080.00February 1 2007 Non-Called : Lafayete School Remediation (O) 475,000.00 9,500.00 - 484,500.00February 1 2007 Non-Called : $20,800 Prior Schools (I) 1,000.00 20.00 - 1,020.00August 1 2009 School Remodeling (I) - 26,437.50 - 26,437.50February 6 2014 : Residential Water Meters (OSS) 110,000.00 14,775.00 - 124,775.00February 6 2014 : Water Main Replacement (OSS) 100,000.00 19,937.50 - 119,937.50February 6 2014 : Water System Repairs (OSS) 35,000.00 4,200.00 - 39,200.00February 6 2014 : Seven Acre Park Planning (I) 70,000.00 3,150.00 - 73,150.00February 6 2014 : Tot Lot (I) 20,000.00 3,215.63 - 23,215.63February 6 2014 : City Hall Roof Repair (I) 15,000.00 2,068.75 - 17,068.75February 6 2014 : Everett Sq/Norwood St Design & Renovation (I) 30,000.00 1,350.00 - 31,350.00February 6 2014 : School Equipment- Smart Boards (I) 160,000.00 7,200.00 - 167,200.00February 6 2014 : Fire Pumper Truck (I) 40,000.00 7,975.00 - 47,975.00February 6 2014 : Road & Sidewalk (I) 200,000.00 39,875.00 - 239,875.00April 23 2015 : Pumper Truck (I) 60,000.00 10,200.00 - 70,200.00April 23 2015 : Day Park Renovation (I) 45,000.00 10,912.50 - 55,912.50April 23 2015 : Street & Sidewalk Improvements (I) 200,000.00 48,500.00 - 248,500.00April 23 2015 : Shute Library Renovation (I) 35,000.00 10,400.00 - 45,400.00April 23 2015 : School Department Eno Boards (I) 70,000.00 4,900.00 - 74,900.00April 23 2015 : Whittier School Roof (I) 40,000.00 12,028.13 - 52,028.13April 23 2015 : Adv Ref of Feb 1 07- High School (I) - 117,865.00 - 117,865.00April 23 2015 : Adv Ref of Feb 1 07- Prior Schools (I) - 172.50 - 172.50
Subtotal $2,410,000.00 $373,123.77 (1,777.30) $2,781,346.47
*Reflects amount of debt service on State Qualified bonds to be budgeted, but will be deducted from the City's monthly state aid distributions.Aggregate | 7/19/2016 | 10:04 AM
FirstSouthwest, a Division of Hilltop Securities Inc.Public Finance Page 2
397
City of Everett, MassachusettsFiscal Year 2017 Projected Principal and Interest Payents
Net of MCWT Subsidy
(Does Not Include MCWT Administrative/Origination Fees)
Aggregate Net Debt ServiceAs of 9/14/16
MCWTDATE Issue : Purpose PRINCIPAL INTEREST SUBSIDY NET NEW D/S
02/15/2017 March 15 2011 MWRA Water (O) 50,000.00 - - 50,000.00February 18 2016 : Refurbish Park & Tot Lots (I) 35,000.00 12,900.00 - 47,900.00February 18 2016 : Land Acquisition (I) 20,000.00 9,775.00 - 29,775.00February 18 2016 : Sacramone Park (I) 130,000.00 47,800.00 - 177,800.00February 18 2016 : Meadow Playground Design (I) 32,000.00 3,740.00 - 35,740.00February 18 2016 : Park Renovation (I) 110,000.00 40,425.00 - 150,425.00February 18 2016 : Recreation Wellness Center Design/Planning (I) 65,000.00 7,000.00 - 72,000.00February 18 2016 : Webster School Air Conditioning (I) 30,000.00 14,025.00 - 44,025.00February 18 2016 : Parlin School Yard/Walkway Repavement (I) 40,000.00 13,775.00 - 53,775.00February 18 2016 : Parlin School Additional Classrooms I (I) 50,000.00 26,275.00 - 76,275.00February 18 2016 : Parlin School Additional Classrooms II (I) 30,000.00 15,025.00 - 45,025.00February 18 2016 : Keverian School Feasibility Study (O) 65,000.00 7,000.00 - 72,000.00February 18 2016 : Ladder One Replacement (I) 100,000.00 24,000.00 - 124,000.00February 18 2016 : 10 Wheel Dump Truck (I) 40,000.00 4,600.00 - 44,600.00February 18 2016 : 8 Wheel Dump Truck (I) 30,000.00 3,200.00 - 33,200.00February 18 2016 : F350 Pickups with Sander/Plow (I) 20,000.00 2,000.00 - 22,000.00February 18 2016 : Dump Trucks with Sander/Plow (I) 20,000.00 2,400.00 - 22,400.00February 18 2016 : Street Sweeper (I) 40,000.00 4,200.00 - 44,200.00February 18 2016 : Cemetery Backhoe (I) 20,000.00 2,200.00 - 22,200.00February 18 2016 : Street/Highway Backhoe (I) 20,000.00 2,400.00 - 22,400.00February 18 2016 : Sidewalk Plow (I) 30,000.00 3,200.00 - 33,200.00February 18 2016 : Front End Loader (I) 40,000.00 4,200.00 - 44,200.00February 18 2016 : Utility Poles (I) 85,000.00 9,000.00 - 94,000.00February 18 2016 : Lower Florence Street Planning (I) 150,000.00 16,000.00 - 166,000.00February 18 2016 : Upper Florence Street Planning (I) 30,000.00 3,000.00 - 33,000.00February 18 2016 : Street & Sidewalk Repairs (I) 150,000.00 55,050.00 - 205,050.00February 18 2016 : Enterprise Departmental Equipment (I) 35,000.00 6,500.00 - 41,500.00February 22 2016 MWRA Sewer (I) 152,680.00 - - 152,680.00
Subtotal $1,619,680.00 $339,690.00 - $1,959,370.00
03/01/2017 October 15 2009 SQ Refundings breakout : SQ Adv Ref of 12 1 00 School (O)* - 88,625.00 - 88,625.00December 20 2012 : Adv Ref 3 1 04 - School Remodeling (I) 145,000.00 7,950.00 - 152,950.00December 20 2012 : Adv Ref 3 1 04 -Public Works Facility (I) 225,000.00 8,650.00 - 233,650.00
Subtotal $370,000.00 $105,225.00 - $475,225.00
05/15/2017 May 22 2008 MWRA Water (O) 30,400.00 - - 30,400.00May 21 2009 MWRA Water (O) 154,805.60 - - 154,805.60May 20 2013 MWRA Water (O) 165,344.10 - - 165,344.10
Subtotal $350,549.70 - - $350,549.70
06/15/2017 December 20 2013 : Water Meters 1 (O) - 7,250.00 - 7,250.00December 20 2013 : Water Meters 2 (O) - 8,387.50 - 8,387.50December 20 2013 : Water Dept Vehicle Replacement (O) - 300.00 - 300.00December 20 2013 : Glendale Park Improvements (I) - 27,415.00 - 27,415.00December 20 2013 : Parlin School Masonry Repair (I) - 6,897.50 - 6,897.50December 20 2013 : Shute Library Construction 1 (I) - 18,177.50 - 18,177.50December 20 2013 : Shute Library Construction 2 (I) - 7,037.50 - 7,037.50December 20 2013 : Fire Station Repairs & Design (I) - 3,325.00 - 3,325.00December 20 2013 : Police Station Renovations (I) - 737.50 - 737.50December 20 2013 : 911 Stairs (I) - 437.50 - 437.50December 20 2013 : Roadway Reconstruction (I) - 24,600.00 - 24,600.00December 20 2013 : Sidewalk Reconstruction (I) - 437.50 - 437.50August 20 2015- Cur Ref of September 15 04 (O) - 169,800.00 - 169,800.00
Subtotal - $274,802.50 - $274,802.50
Total $9,970,777.24 $2,485,095.98 (5,142.93) $12,450,730.29
*Reflects amount of debt service on State Qualified bonds to be budgeted, but will be deducted from the City's monthly state aid distributions.Aggregate | 7/19/2016 | 10:04 AM
FirstSouthwestPublic Finance Page 3
398
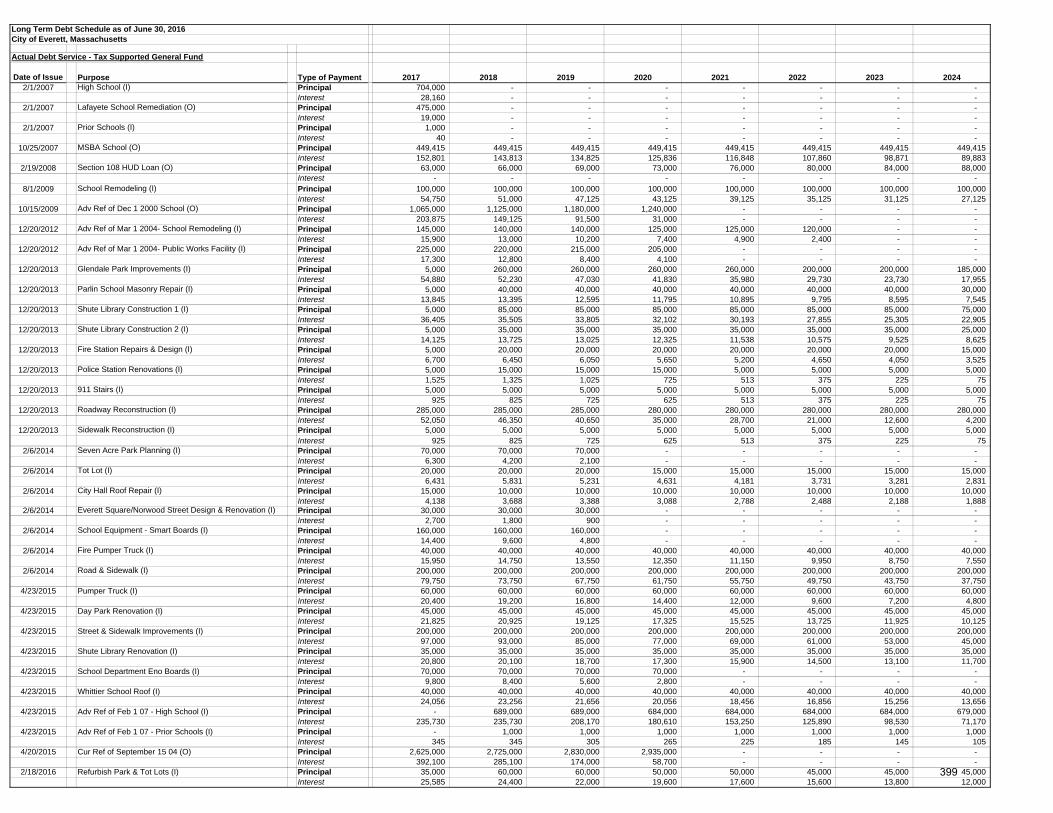
Date of Issue Purpose Type of Payment 2017 2018 2019 2020 2021 2022 2023 20242/1/2007 High School (I) Principal 704,000 - - - - - - -
Interest 28,160 - - - - - - - 2/1/2007 Lafayete School Remediation (O) Principal 475,000 - - - - - - -
Interest 19,000 - - - - - - - 2/1/2007 Prior Schools (I) Principal 1,000 - - - - - - -
Interest 40 - - - - - - - 10/25/2007 MSBA School (O) Principal 449,415 449,415 449,415 449,415 449,415 449,415 449,415 449,415
Interest 152,801 143,813 134,825 125,836 116,848 107,860 98,871 89,883 2/19/2008 Section 108 HUD Loan (O) Principal 63,000 66,000 69,000 73,000 76,000 80,000 84,000 88,000
Interest - - - - - - - - 8/1/2009 School Remodeling (I) Principal 100,000 100,000 100,000 100,000 100,000 100,000 100,000 100,000
Interest 54,750 51,000 47,125 43,125 39,125 35,125 31,125 27,125 10/15/2009 Adv Ref of Dec 1 2000 School (O) Principal 1,065,000 1,125,000 1,180,000 1,240,000 - - - -
Interest 203,875 149,125 91,500 31,000 - - - - 12/20/2012 Adv Ref of Mar 1 2004- School Remodeling (I) Principal 145,000 140,000 140,000 125,000 125,000 120,000 - -
Interest 15,900 13,000 10,200 7,400 4,900 2,400 - - 12/20/2012 Adv Ref of Mar 1 2004- Public Works Facility (I) Principal 225,000 220,000 215,000 205,000 - - - -
Interest 17,300 12,800 8,400 4,100 - - - - 12/20/2013 Glendale Park Improvements (I) Principal 5,000 260,000 260,000 260,000 260,000 200,000 200,000 185,000
Interest 54,880 52,230 47,030 41,830 35,980 29,730 23,730 17,955 12/20/2013 Parlin School Masonry Repair (I) Principal 5,000 40,000 40,000 40,000 40,000 40,000 40,000 30,000
Interest 13,845 13,395 12,595 11,795 10,895 9,795 8,595 7,545 12/20/2013 Shute Library Construction 1 (I) Principal 5,000 85,000 85,000 85,000 85,000 85,000 85,000 75,000
Interest 36,405 35,505 33,805 32,102 30,193 27,855 25,305 22,905 12/20/2013 Shute Library Construction 2 (I) Principal 5,000 35,000 35,000 35,000 35,000 35,000 35,000 25,000
Interest 14,125 13,725 13,025 12,325 11,538 10,575 9,525 8,625 12/20/2013 Fire Station Repairs & Design (I) Principal 5,000 20,000 20,000 20,000 20,000 20,000 20,000 15,000
Interest 6,700 6,450 6,050 5,650 5,200 4,650 4,050 3,525 12/20/2013 Police Station Renovations (I) Principal 5,000 15,000 15,000 15,000 5,000 5,000 5,000 5,000
Interest 1,525 1,325 1,025 725 513 375 225 75 12/20/2013 911 Stairs (I) Principal 5,000 5,000 5,000 5,000 5,000 5,000 5,000 5,000
Interest 925 825 725 625 513 375 225 75 12/20/2013 Roadway Reconstruction (I) Principal 285,000 285,000 285,000 280,000 280,000 280,000 280,000 280,000
Interest 52,050 46,350 40,650 35,000 28,700 21,000 12,600 4,200 12/20/2013 Sidewalk Reconstruction (I) Principal 5,000 5,000 5,000 5,000 5,000 5,000 5,000 5,000
Interest 925 825 725 625 513 375 225 75 2/6/2014 Seven Acre Park Planning (I) Principal 70,000 70,000 70,000 - - - - -
Interest 6,300 4,200 2,100 - - - - - 2/6/2014 Tot Lot (I) Principal 20,000 20,000 20,000 15,000 15,000 15,000 15,000 15,000
Interest 6,431 5,831 5,231 4,631 4,181 3,731 3,281 2,831 2/6/2014 City Hall Roof Repair (I) Principal 15,000 10,000 10,000 10,000 10,000 10,000 10,000 10,000
Interest 4,138 3,688 3,388 3,088 2,788 2,488 2,188 1,888 2/6/2014 Everett Square/Norwood Street Design & Renovation (I) Principal 30,000 30,000 30,000 - - - - -
Interest 2,700 1,800 900 - - - - - 2/6/2014 School Equipment - Smart Boards (I) Principal 160,000 160,000 160,000 - - - - -
Interest 14,400 9,600 4,800 - - - - - 2/6/2014 Fire Pumper Truck (I) Principal 40,000 40,000 40,000 40,000 40,000 40,000 40,000 40,000
Interest 15,950 14,750 13,550 12,350 11,150 9,950 8,750 7,550 2/6/2014 Road & Sidewalk (I) Principal 200,000 200,000 200,000 200,000 200,000 200,000 200,000 200,000
Interest 79,750 73,750 67,750 61,750 55,750 49,750 43,750 37,750 4/23/2015 Pumper Truck (I) Principal 60,000 60,000 60,000 60,000 60,000 60,000 60,000 60,000
Interest 20,400 19,200 16,800 14,400 12,000 9,600 7,200 4,800 4/23/2015 Day Park Renovation (I) Principal 45,000 45,000 45,000 45,000 45,000 45,000 45,000 45,000
Interest 21,825 20,925 19,125 17,325 15,525 13,725 11,925 10,125 4/23/2015 Street & Sidewalk Improvements (I) Principal 200,000 200,000 200,000 200,000 200,000 200,000 200,000 200,000
Interest 97,000 93,000 85,000 77,000 69,000 61,000 53,000 45,000 4/23/2015 Shute Library Renovation (I) Principal 35,000 35,000 35,000 35,000 35,000 35,000 35,000 35,000
Interest 20,800 20,100 18,700 17,300 15,900 14,500 13,100 11,700 4/23/2015 School Department Eno Boards (I) Principal 70,000 70,000 70,000 70,000 - - - -
Interest 9,800 8,400 5,600 2,800 - - - - 4/23/2015 Whittier School Roof (I) Principal 40,000 40,000 40,000 40,000 40,000 40,000 40,000 40,000
Interest 24,056 23,256 21,656 20,056 18,456 16,856 15,256 13,656 4/23/2015 Adv Ref of Feb 1 07 - High School (I) Principal - 689,000 689,000 684,000 684,000 684,000 684,000 679,000
Interest 235,730 235,730 208,170 180,610 153,250 125,890 98,530 71,170 4/23/2015 Adv Ref of Feb 1 07 - Prior Schools (I) Principal - 1,000 1,000 1,000 1,000 1,000 1,000 1,000
Interest 345 345 305 265 225 185 145 105 4/20/2015 Cur Ref of September 15 04 (O) Principal 2,625,000 2,725,000 2,830,000 2,935,000 - - - -
Interest 392,100 285,100 174,000 58,700 - - - - 2/18/2016 Refurbish Park & Tot Lots (I) Principal 35,000 60,000 60,000 50,000 50,000 45,000 45,000 45,000
Interest 25,585 24,400 22,000 19,600 17,600 15,600 13,800 12,000
Long Term Debt Schedule as of June 30, 2016City of Everett, Massachusetts
Actual Debt Service - Tax Supported General Fund
399
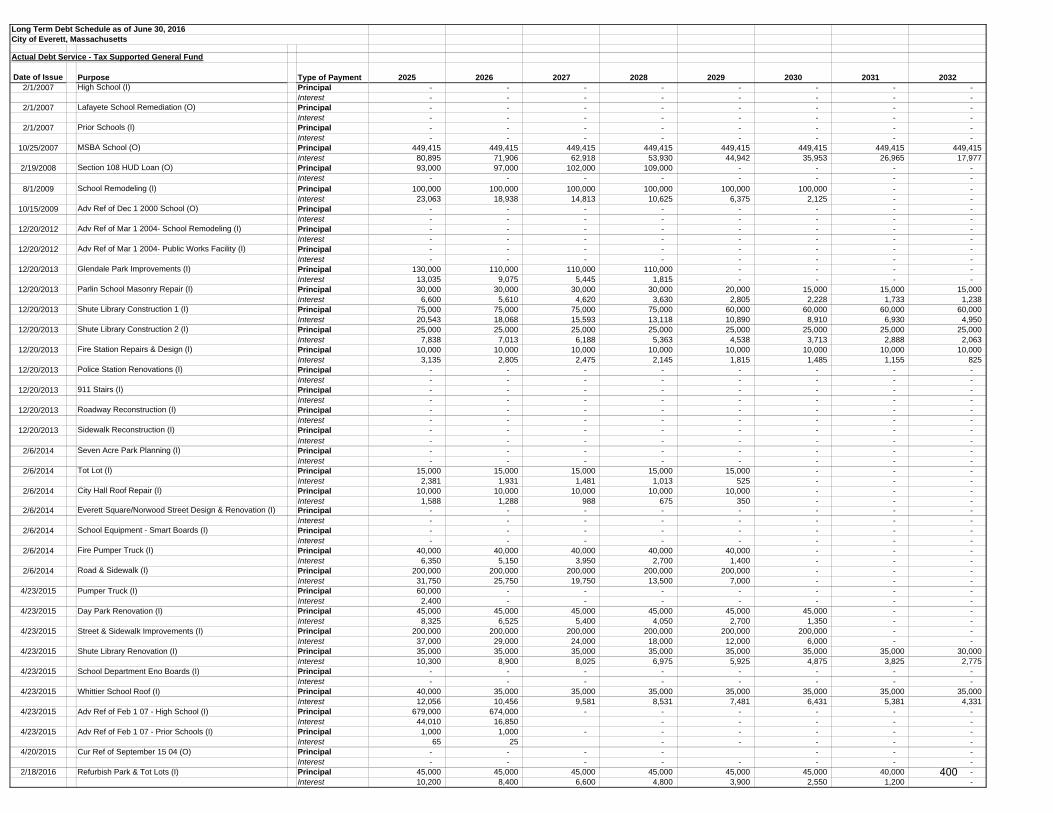
Date of Issue Purpose Type of Payment2/1/2007 High School (I) Principal
Interest2/1/2007 Lafayete School Remediation (O) Principal
Interest2/1/2007 Prior Schools (I) Principal
Interest10/25/2007 MSBA School (O) Principal
Interest2/19/2008 Section 108 HUD Loan (O) Principal
Interest8/1/2009 School Remodeling (I) Principal
Interest10/15/2009 Adv Ref of Dec 1 2000 School (O) Principal
Interest12/20/2012 Adv Ref of Mar 1 2004- School Remodeling (I) Principal
Interest12/20/2012 Adv Ref of Mar 1 2004- Public Works Facility (I) Principal
Interest12/20/2013 Glendale Park Improvements (I) Principal
Interest12/20/2013 Parlin School Masonry Repair (I) Principal
Interest12/20/2013 Shute Library Construction 1 (I) Principal
Interest12/20/2013 Shute Library Construction 2 (I) Principal
Interest12/20/2013 Fire Station Repairs & Design (I) Principal
Interest12/20/2013 Police Station Renovations (I) Principal
Interest12/20/2013 911 Stairs (I) Principal
Interest12/20/2013 Roadway Reconstruction (I) Principal
Interest12/20/2013 Sidewalk Reconstruction (I) Principal
Interest2/6/2014 Seven Acre Park Planning (I) Principal
Interest2/6/2014 Tot Lot (I) Principal
Interest2/6/2014 City Hall Roof Repair (I) Principal
Interest2/6/2014 Everett Square/Norwood Street Design & Renovation (I) Principal
Interest2/6/2014 School Equipment - Smart Boards (I) Principal
Interest2/6/2014 Fire Pumper Truck (I) Principal
Interest2/6/2014 Road & Sidewalk (I) Principal
Interest4/23/2015 Pumper Truck (I) Principal
Interest4/23/2015 Day Park Renovation (I) Principal
Interest4/23/2015 Street & Sidewalk Improvements (I) Principal
Interest4/23/2015 Shute Library Renovation (I) Principal
Interest4/23/2015 School Department Eno Boards (I) Principal
Interest4/23/2015 Whittier School Roof (I) Principal
Interest4/23/2015 Adv Ref of Feb 1 07 - High School (I) Principal
Interest4/23/2015 Adv Ref of Feb 1 07 - Prior Schools (I) Principal
Interest4/20/2015 Cur Ref of September 15 04 (O) Principal
Interest2/18/2016 Refurbish Park & Tot Lots (I) Principal
Interest
Long Term Debt Schedule as of June 30, 2016City of Everett, Massachusetts
Actual Debt Service - Tax Supported General Fund
2025 2026 2027 2028 2029 2030 2031 2032- - - - - - - - - - - - - - - - - - - - - - - - - - - - - - - - - - - - - - - - - - - - - - - -
449,415 449,415 449,415 449,415 449,415 449,415 449,415 449,415 80,895 71,906 62,918 53,930 44,942 35,953 26,965 17,977 93,000 97,000 102,000 109,000 - - - -
- - - - - - - - 100,000 100,000 100,000 100,000 100,000 100,000 - -
23,063 18,938 14,813 10,625 6,375 2,125 - - - - - - - - - - - - - - - - - - - - - - - - - - - - - - - - - - - - - - - - - - - - - - - - - -
130,000 110,000 110,000 110,000 - - - - 13,035 9,075 5,445 1,815 - - - - 30,000 30,000 30,000 30,000 20,000 15,000 15,000 15,000
6,600 5,610 4,620 3,630 2,805 2,228 1,733 1,238 75,000 75,000 75,000 75,000 60,000 60,000 60,000 60,000 20,543 18,068 15,593 13,118 10,890 8,910 6,930 4,950 25,000 25,000 25,000 25,000 25,000 25,000 25,000 25,000
7,838 7,013 6,188 5,363 4,538 3,713 2,888 2,063 10,000 10,000 10,000 10,000 10,000 10,000 10,000 10,000
3,135 2,805 2,475 2,145 1,815 1,485 1,155 825 - - - - - - - - - - - - - - - - - - - - - - - - - - - - - - - - - - - - - - - - - - - - - - - - - - - - - - - - - - - - - - - - - - - - - - - - - - - - - - - -
15,000 15,000 15,000 15,000 15,000 - - - 2,381 1,931 1,481 1,013 525 - - -
10,000 10,000 10,000 10,000 10,000 - - - 1,588 1,288 988 675 350 - - -
- - - - - - - - - - - - - - - - - - - - - - - - - - - - - - - -
40,000 40,000 40,000 40,000 40,000 - - - 6,350 5,150 3,950 2,700 1,400 - - -
200,000 200,000 200,000 200,000 200,000 - - - 31,750 25,750 19,750 13,500 7,000 - - - 60,000 - - - - - - -
2,400 - - - - - - - 45,000 45,000 45,000 45,000 45,000 45,000 - -
8,325 6,525 5,400 4,050 2,700 1,350 - - 200,000 200,000 200,000 200,000 200,000 200,000 - -
37,000 29,000 24,000 18,000 12,000 6,000 - - 35,000 35,000 35,000 35,000 35,000 35,000 35,000 30,000 10,300 8,900 8,025 6,975 5,925 4,875 3,825 2,775
- - - - - - - - - - - - - - - -
40,000 35,000 35,000 35,000 35,000 35,000 35,000 35,000 12,056 10,456 9,581 8,531 7,481 6,431 5,381 4,331
679,000 674,000 - - - - - - 44,010 16,850 - - - - -
1,000 1,000 - - - - - - 65 25 - - - - -
- - - - - - - - - - - - - - -
45,000 45,000 45,000 45,000 45,000 45,000 40,000 - 10,200 8,400 6,600 4,800 3,900 2,550 1,200 -
400
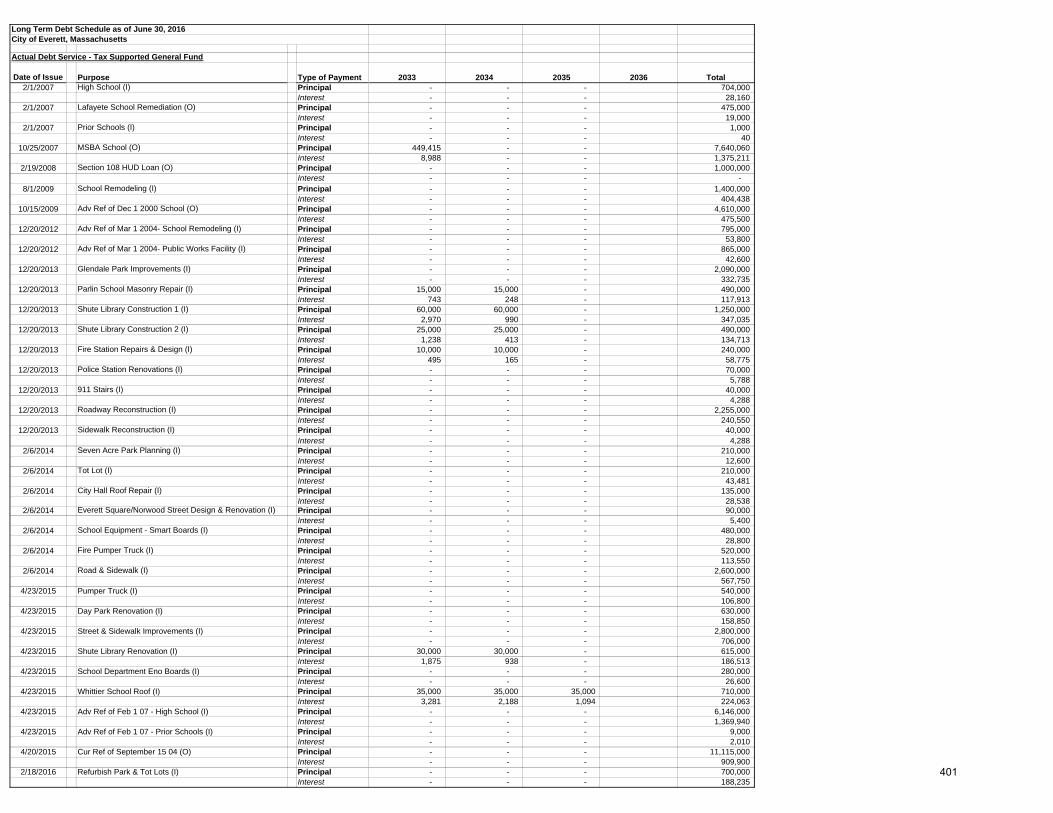
Date of Issue Purpose Type of Payment2/1/2007 High School (I) Principal
Interest2/1/2007 Lafayete School Remediation (O) Principal
Interest2/1/2007 Prior Schools (I) Principal
Interest10/25/2007 MSBA School (O) Principal
Interest2/19/2008 Section 108 HUD Loan (O) Principal
Interest8/1/2009 School Remodeling (I) Principal
Interest10/15/2009 Adv Ref of Dec 1 2000 School (O) Principal
Interest12/20/2012 Adv Ref of Mar 1 2004- School Remodeling (I) Principal
Interest12/20/2012 Adv Ref of Mar 1 2004- Public Works Facility (I) Principal
Interest12/20/2013 Glendale Park Improvements (I) Principal
Interest12/20/2013 Parlin School Masonry Repair (I) Principal
Interest12/20/2013 Shute Library Construction 1 (I) Principal
Interest12/20/2013 Shute Library Construction 2 (I) Principal
Interest12/20/2013 Fire Station Repairs & Design (I) Principal
Interest12/20/2013 Police Station Renovations (I) Principal
Interest12/20/2013 911 Stairs (I) Principal
Interest12/20/2013 Roadway Reconstruction (I) Principal
Interest12/20/2013 Sidewalk Reconstruction (I) Principal
Interest2/6/2014 Seven Acre Park Planning (I) Principal
Interest2/6/2014 Tot Lot (I) Principal
Interest2/6/2014 City Hall Roof Repair (I) Principal
Interest2/6/2014 Everett Square/Norwood Street Design & Renovation (I) Principal
Interest2/6/2014 School Equipment - Smart Boards (I) Principal
Interest2/6/2014 Fire Pumper Truck (I) Principal
Interest2/6/2014 Road & Sidewalk (I) Principal
Interest4/23/2015 Pumper Truck (I) Principal
Interest4/23/2015 Day Park Renovation (I) Principal
Interest4/23/2015 Street & Sidewalk Improvements (I) Principal
Interest4/23/2015 Shute Library Renovation (I) Principal
Interest4/23/2015 School Department Eno Boards (I) Principal
Interest4/23/2015 Whittier School Roof (I) Principal
Interest4/23/2015 Adv Ref of Feb 1 07 - High School (I) Principal
Interest4/23/2015 Adv Ref of Feb 1 07 - Prior Schools (I) Principal
Interest4/20/2015 Cur Ref of September 15 04 (O) Principal
Interest2/18/2016 Refurbish Park & Tot Lots (I) Principal
Interest
Long Term Debt Schedule as of June 30, 2016City of Everett, Massachusetts
Actual Debt Service - Tax Supported General Fund
2033 2034 2035 2036 Total- - - 704,000 - - - 28,160 - - - 475,000 - - - 19,000 - - - 1,000 - - - 40
449,415 - - 7,640,060 8,988 - - 1,375,211
- - - 1,000,000 - - - - - - - 1,400,000 - - - 404,438 - - - 4,610,000 - - - 475,500 - - - 795,000 - - - 53,800 - - - 865,000 - - - 42,600 - - - 2,090,000 - - - 332,735
15,000 15,000 - 490,000 743 248 - 117,913
60,000 60,000 - 1,250,000 2,970 990 - 347,035
25,000 25,000 - 490,000 1,238 413 - 134,713
10,000 10,000 - 240,000 495 165 - 58,775 - - - 70,000 - - - 5,788 - - - 40,000 - - - 4,288 - - - 2,255,000 - - - 240,550 - - - 40,000 - - - 4,288 - - - 210,000 - - - 12,600 - - - 210,000 - - - 43,481 - - - 135,000 - - - 28,538 - - - 90,000 - - - 5,400 - - - 480,000 - - - 28,800 - - - 520,000 - - - 113,550 - - - 2,600,000 - - - 567,750 - - - 540,000 - - - 106,800 - - - 630,000 - - - 158,850 - - - 2,800,000 - - - 706,000
30,000 30,000 - 615,000 1,875 938 - 186,513
- - - 280,000 - - - 26,600
35,000 35,000 35,000 710,000 3,281 2,188 1,094 224,063
- - - 6,146,000 - - - 1,369,940 - - - 9,000 - - - 2,010 - - - 11,115,000 - - - 909,900 - - - 700,000 - - - 188,235
401
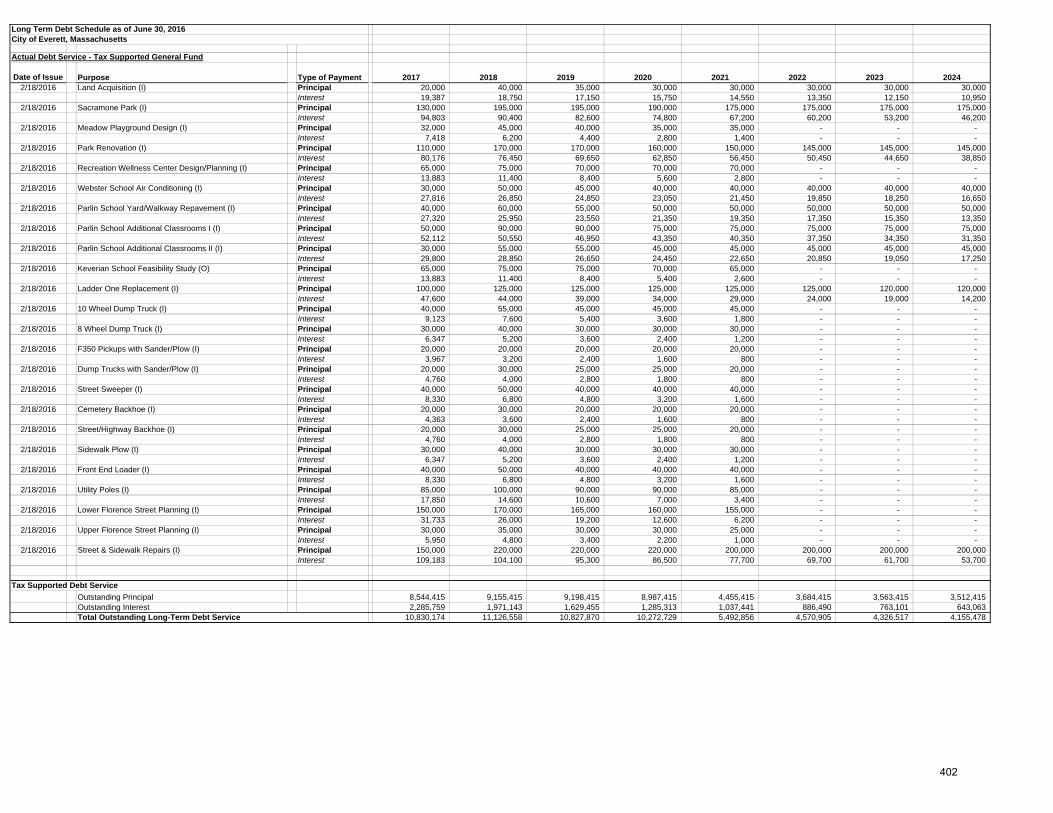
Date of Issue Purpose Type of Payment 2017 2018 2019 2020 2021 2022 2023 2024
Long Term Debt Schedule as of June 30, 2016City of Everett, Massachusetts
Actual Debt Service - Tax Supported General Fund
2/18/2016 Land Acquisition (I) Principal 20,000 40,000 35,000 30,000 30,000 30,000 30,000 30,000 Interest 19,387 18,750 17,150 15,750 14,550 13,350 12,150 10,950
2/18/2016 Sacramone Park (I) Principal 130,000 195,000 195,000 190,000 175,000 175,000 175,000 175,000 Interest 94,803 90,400 82,600 74,800 67,200 60,200 53,200 46,200
2/18/2016 Meadow Playground Design (I) Principal 32,000 45,000 40,000 35,000 35,000 - - - Interest 7,418 6,200 4,400 2,800 1,400 - - -
2/18/2016 Park Renovation (I) Principal 110,000 170,000 170,000 160,000 150,000 145,000 145,000 145,000 Interest 80,176 76,450 69,650 62,850 56,450 50,450 44,650 38,850
2/18/2016 Recreation Wellness Center Design/Planning (I) Principal 65,000 75,000 70,000 70,000 70,000 - - - Interest 13,883 11,400 8,400 5,600 2,800 - - -
2/18/2016 Webster School Air Conditioning (I) Principal 30,000 50,000 45,000 40,000 40,000 40,000 40,000 40,000 Interest 27,816 26,850 24,850 23,050 21,450 19,850 18,250 16,650
2/18/2016 Parlin School Yard/Walkway Repavement (I) Principal 40,000 60,000 55,000 50,000 50,000 50,000 50,000 50,000 Interest 27,320 25,950 23,550 21,350 19,350 17,350 15,350 13,350
2/18/2016 Parlin School Additional Classrooms I (I) Principal 50,000 90,000 90,000 75,000 75,000 75,000 75,000 75,000 Interest 52,112 50,550 46,950 43,350 40,350 37,350 34,350 31,350
2/18/2016 Parlin School Additional Classrooms II (I) Principal 30,000 55,000 55,000 45,000 45,000 45,000 45,000 45,000 Interest 29,800 28,850 26,650 24,450 22,650 20,850 19,050 17,250
2/18/2016 Keverian School Feasibility Study (O) Principal 65,000 75,000 75,000 70,000 65,000 - - - Interest 13,883 11,400 8,400 5,400 2,600 - - -
2/18/2016 Ladder One Replacement (I) Principal 100,000 125,000 125,000 125,000 125,000 125,000 120,000 120,000 Interest 47,600 44,000 39,000 34,000 29,000 24,000 19,000 14,200
2/18/2016 10 Wheel Dump Truck (I) Principal 40,000 55,000 45,000 45,000 45,000 - - - Interest 9,123 7,600 5,400 3,600 1,800 - - -
2/18/2016 8 Wheel Dump Truck (I) Principal 30,000 40,000 30,000 30,000 30,000 - - - Interest 6,347 5,200 3,600 2,400 1,200 - - -
2/18/2016 F350 Pickups with Sander/Plow (I) Principal 20,000 20,000 20,000 20,000 20,000 - - - Interest 3,967 3,200 2,400 1,600 800 - - -
2/18/2016 Dump Trucks with Sander/Plow (I) Principal 20,000 30,000 25,000 25,000 20,000 - - - Interest 4,760 4,000 2,800 1,800 800 - - -
2/18/2016 Street Sweeper (I) Principal 40,000 50,000 40,000 40,000 40,000 - - - Interest 8,330 6,800 4,800 3,200 1,600 - - -
2/18/2016 Cemetery Backhoe (I) Principal 20,000 30,000 20,000 20,000 20,000 - - - Interest 4,363 3,600 2,400 1,600 800 - - -
2/18/2016 Street/Highway Backhoe (I) Principal 20,000 30,000 25,000 25,000 20,000 - - - Interest 4,760 4,000 2,800 1,800 800 - - -
2/18/2016 Sidewalk Plow (I) Principal 30,000 40,000 30,000 30,000 30,000 - - - Interest 6,347 5,200 3,600 2,400 1,200 - - -
2/18/2016 Front End Loader (I) Principal 40,000 50,000 40,000 40,000 40,000 - - - Interest 8,330 6,800 4,800 3,200 1,600 - - -
2/18/2016 Utility Poles (I) Principal 85,000 100,000 90,000 90,000 85,000 - - - Interest 17,850 14,600 10,600 7,000 3,400 - - -
2/18/2016 Lower Florence Street Planning (I) Principal 150,000 170,000 165,000 160,000 155,000 - - - Interest 31,733 26,000 19,200 12,600 6,200 - - -
2/18/2016 Upper Florence Street Planning (I) Principal 30,000 35,000 30,000 30,000 25,000 - - - Interest 5,950 4,800 3,400 2,200 1,000 - - -
2/18/2016 Street & Sidewalk Repairs (I) Principal 150,000 220,000 220,000 220,000 200,000 200,000 200,000 200,000 Interest 109,183 104,100 95,300 86,500 77,700 69,700 61,700 53,700
Tax Supported Debt ServiceOutstanding Principal 8,544,415 9,155,415 9,198,415 8,987,415 4,455,415 3,684,415 3,563,415 3,512,415 Outstanding Interest 2,285,759 1,971,143 1,629,455 1,285,313 1,037,441 886,490 763,101 643,063
10,830,174 11,126,558 10,827,870 10,272,729 5,492,856 4,570,905 4,326,517 4,155,478 Total Outstanding Long-Term Debt Service
402
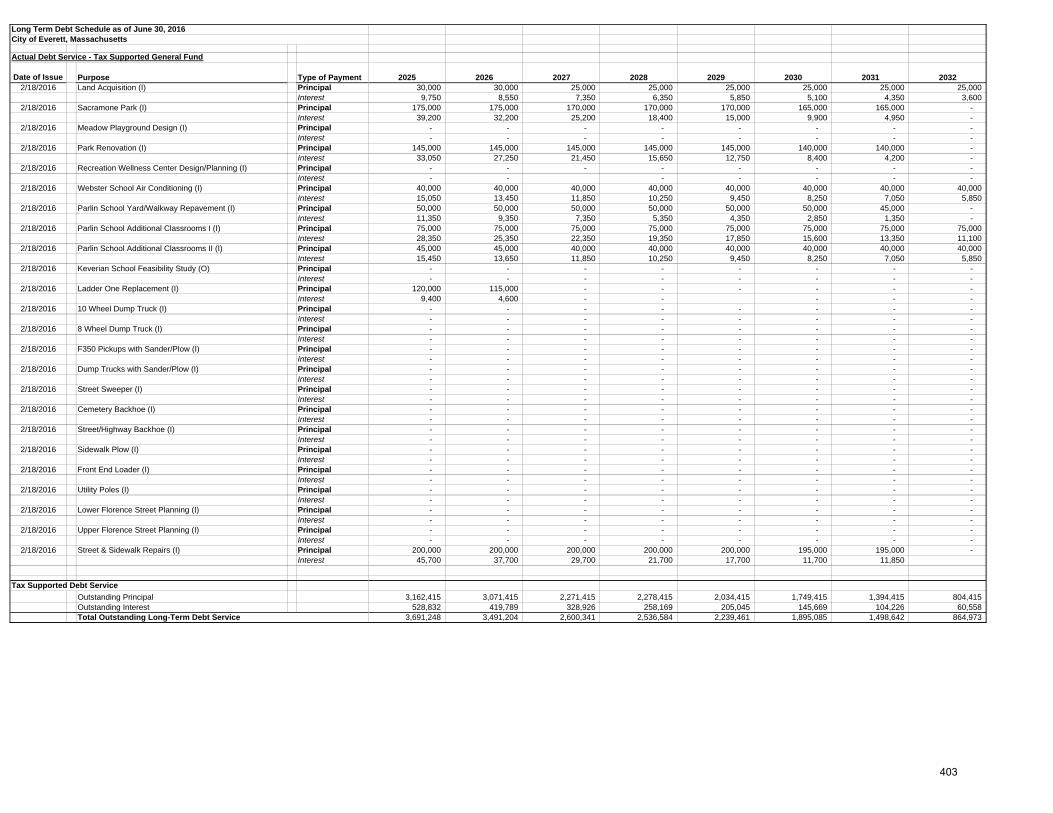
Date of Issue Purpose Type of Payment
Long Term Debt Schedule as of June 30, 2016City of Everett, Massachusetts
Actual Debt Service - Tax Supported General Fund
2/18/2016 Land Acquisition (I) PrincipalInterest
2/18/2016 Sacramone Park (I) PrincipalInterest
2/18/2016 Meadow Playground Design (I) PrincipalInterest
2/18/2016 Park Renovation (I) PrincipalInterest
2/18/2016 Recreation Wellness Center Design/Planning (I) PrincipalInterest
2/18/2016 Webster School Air Conditioning (I) PrincipalInterest
2/18/2016 Parlin School Yard/Walkway Repavement (I) PrincipalInterest
2/18/2016 Parlin School Additional Classrooms I (I) PrincipalInterest
2/18/2016 Parlin School Additional Classrooms II (I) PrincipalInterest
2/18/2016 Keverian School Feasibility Study (O) PrincipalInterest
2/18/2016 Ladder One Replacement (I) PrincipalInterest
2/18/2016 10 Wheel Dump Truck (I) PrincipalInterest
2/18/2016 8 Wheel Dump Truck (I) PrincipalInterest
2/18/2016 F350 Pickups with Sander/Plow (I) PrincipalInterest
2/18/2016 Dump Trucks with Sander/Plow (I) PrincipalInterest
2/18/2016 Street Sweeper (I) PrincipalInterest
2/18/2016 Cemetery Backhoe (I) PrincipalInterest
2/18/2016 Street/Highway Backhoe (I) PrincipalInterest
2/18/2016 Sidewalk Plow (I) PrincipalInterest
2/18/2016 Front End Loader (I) PrincipalInterest
2/18/2016 Utility Poles (I) PrincipalInterest
2/18/2016 Lower Florence Street Planning (I) PrincipalInterest
2/18/2016 Upper Florence Street Planning (I) PrincipalInterest
2/18/2016 Street & Sidewalk Repairs (I) PrincipalInterest
Tax Supported Debt ServiceOutstanding PrincipalOutstanding InterestTotal Outstanding Long-Term Debt Service
2025 2026 2027 2028 2029 2030 2031 203230,000 30,000 25,000 25,000 25,000 25,000 25,000 25,000
9,750 8,550 7,350 6,350 5,850 5,100 4,350 3,600 175,000 175,000 170,000 170,000 170,000 165,000 165,000 -
39,200 32,200 25,200 18,400 15,000 9,900 4,950 - - - - - - - - - - - - - - - - -
145,000 145,000 145,000 145,000 145,000 140,000 140,000 - 33,050 27,250 21,450 15,650 12,750 8,400 4,200 -
- - - - - - - - - - - - - - -
40,000 40,000 40,000 40,000 40,000 40,000 40,000 40,000 15,050 13,450 11,850 10,250 9,450 8,250 7,050 5,850 50,000 50,000 50,000 50,000 50,000 50,000 45,000 - 11,350 9,350 7,350 5,350 4,350 2,850 1,350 - 75,000 75,000 75,000 75,000 75,000 75,000 75,000 75,000 28,350 25,350 22,350 19,350 17,850 15,600 13,350 11,100 45,000 45,000 40,000 40,000 40,000 40,000 40,000 40,000 15,450 13,650 11,850 10,250 9,450 8,250 7,050 5,850
- - - - - - - - - - - - - - - -
120,000 115,000 - - - - - - 9,400 4,600 - - - - -
- - - - - - - - - - - - - - - - - - - - - - - - - - - - - - - - - - - - - - - - - - - - - - - - - - - - - - - - - - - - - - - - - - - - - - - - - - - - - - - - - - - - - - - - - - - - - - - - - - - - - - - - - - - - - - - - - - - - - - - - - - - - - - - - - - - - - - - - - - - - - - - - - - - - - - - - - - - - - - - - - - - - - - - - - - - - - - - - - - - - - - - - - - - - - - - -
200,000 200,000 200,000 200,000 200,000 195,000 195,000 - 45,700 37,700 29,700 21,700 17,700 11,700 11,850
3,162,415 3,071,415 2,271,415 2,278,415 2,034,415 1,749,415 1,394,415 804,415 528,832 419,789 328,926 258,169 205,045 145,669 104,226 60,558
3,691,248 3,491,204 2,600,341 2,536,584 2,239,461 1,895,085 1,498,642 864,973
403
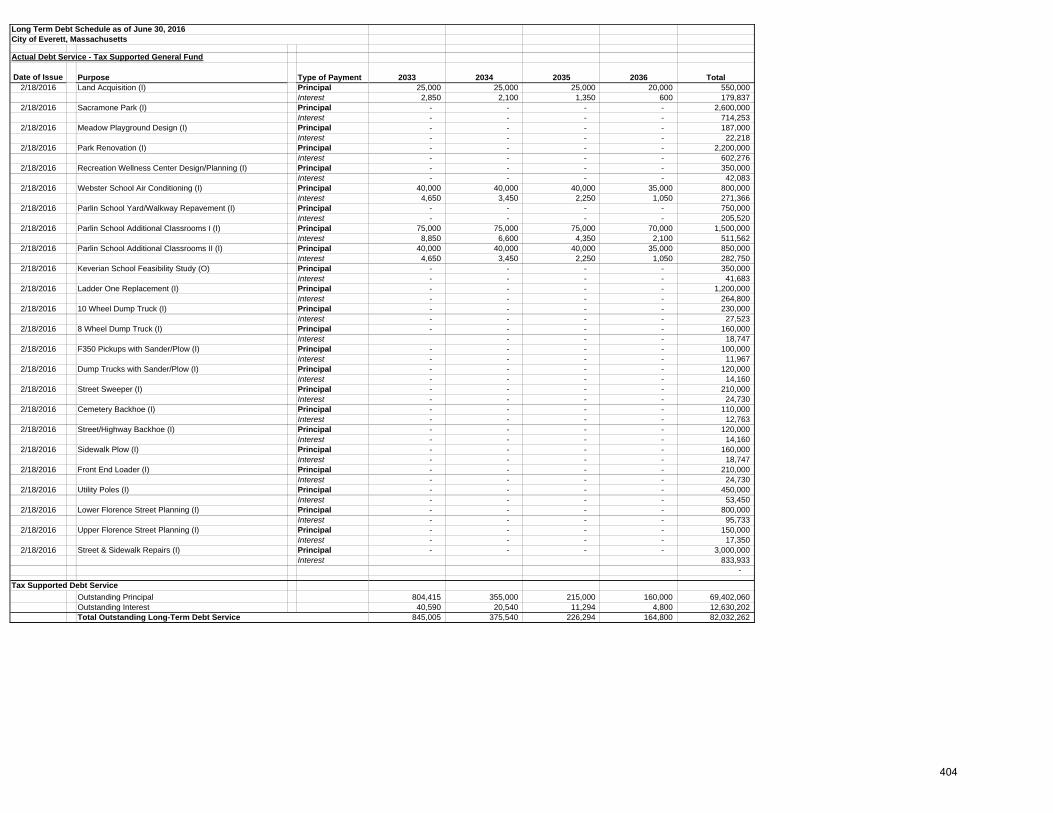
Date of Issue Purpose Type of Payment
Long Term Debt Schedule as of June 30, 2016City of Everett, Massachusetts
Actual Debt Service - Tax Supported General Fund
2/18/2016 Land Acquisition (I) PrincipalInterest
2/18/2016 Sacramone Park (I) PrincipalInterest
2/18/2016 Meadow Playground Design (I) PrincipalInterest
2/18/2016 Park Renovation (I) PrincipalInterest
2/18/2016 Recreation Wellness Center Design/Planning (I) PrincipalInterest
2/18/2016 Webster School Air Conditioning (I) PrincipalInterest
2/18/2016 Parlin School Yard/Walkway Repavement (I) PrincipalInterest
2/18/2016 Parlin School Additional Classrooms I (I) PrincipalInterest
2/18/2016 Parlin School Additional Classrooms II (I) PrincipalInterest
2/18/2016 Keverian School Feasibility Study (O) PrincipalInterest
2/18/2016 Ladder One Replacement (I) PrincipalInterest
2/18/2016 10 Wheel Dump Truck (I) PrincipalInterest
2/18/2016 8 Wheel Dump Truck (I) PrincipalInterest
2/18/2016 F350 Pickups with Sander/Plow (I) PrincipalInterest
2/18/2016 Dump Trucks with Sander/Plow (I) PrincipalInterest
2/18/2016 Street Sweeper (I) PrincipalInterest
2/18/2016 Cemetery Backhoe (I) PrincipalInterest
2/18/2016 Street/Highway Backhoe (I) PrincipalInterest
2/18/2016 Sidewalk Plow (I) PrincipalInterest
2/18/2016 Front End Loader (I) PrincipalInterest
2/18/2016 Utility Poles (I) PrincipalInterest
2/18/2016 Lower Florence Street Planning (I) PrincipalInterest
2/18/2016 Upper Florence Street Planning (I) PrincipalInterest
2/18/2016 Street & Sidewalk Repairs (I) PrincipalInterest
Tax Supported Debt ServiceOutstanding PrincipalOutstanding InterestTotal Outstanding Long-Term Debt Service
2033 2034 2035 2036 Total25,000 25,000 25,000 20,000 550,000
2,850 2,100 1,350 600 179,837 - - - - 2,600,000 - - - - 714,253 - - - - 187,000 - - - - 22,218 - - - - 2,200,000 - - - - 602,276 - - - - 350,000 - - - - 42,083
40,000 40,000 40,000 35,000 800,000 4,650 3,450 2,250 1,050 271,366
- - - - 750,000 - - - - 205,520
75,000 75,000 75,000 70,000 1,500,000 8,850 6,600 4,350 2,100 511,562
40,000 40,000 40,000 35,000 850,000 4,650 3,450 2,250 1,050 282,750
- - - - 350,000 - - - - 41,683 - - - - 1,200,000 - - - - 264,800 - - - - 230,000 - - - - 27,523 - - - - 160,000
- - - 18,747 - - - - 100,000 - - - - 11,967 - - - - 120,000 - - - - 14,160 - - - - 210,000 - - - - 24,730 - - - - 110,000 - - - - 12,763 - - - - 120,000 - - - - 14,160 - - - - 160,000 - - - - 18,747 - - - - 210,000 - - - - 24,730 - - - - 450,000 - - - - 53,450 - - - - 800,000 - - - - 95,733 - - - - 150,000 - - - - 17,350 - - - - 3,000,000
833,933 -
804,415 355,000 215,000 160,000 69,402,060 40,590 20,540 11,294 4,800 12,630,202
845,005 375,540 226,294 164,800 82,032,262
404
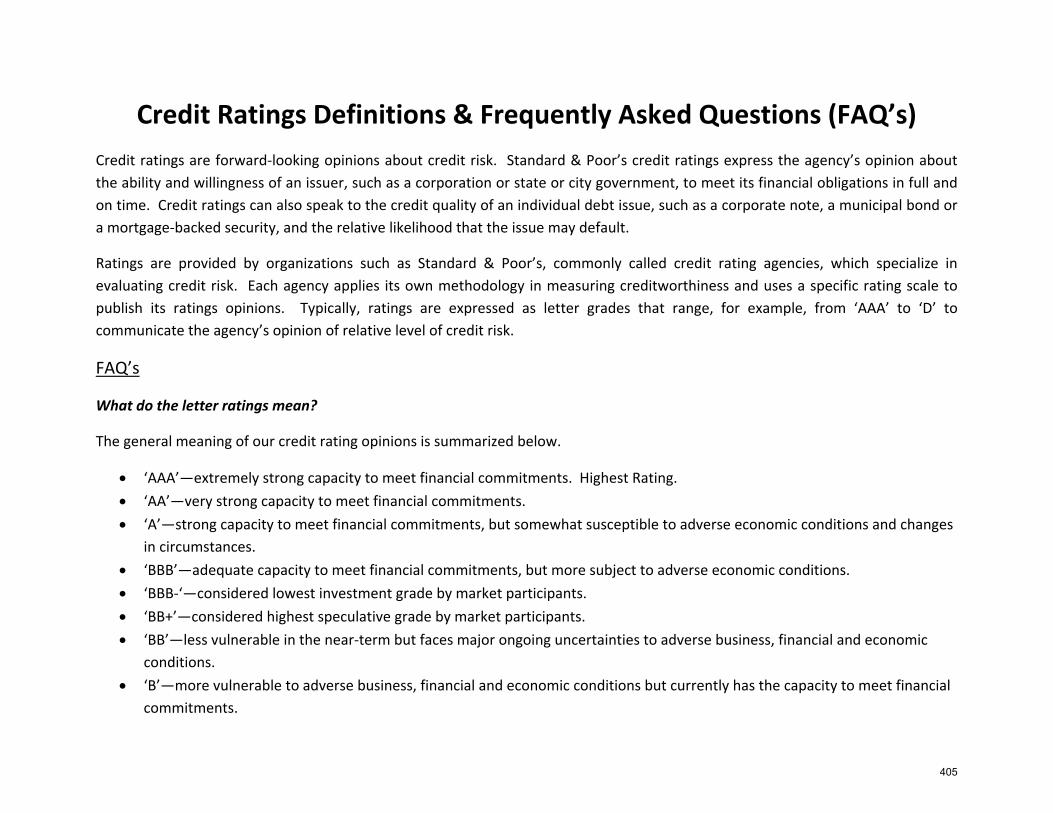
Credit Ratings Definitions & Frequently Asked Questions (FAQ’s) Credit ratings are forward‐looking opinions about credit risk. Standard & Poor’s credit ratings express the agency’s opinion about the ability and willingness of an issuer, such as a corporation or state or city government, to meet its financial obligations in full and on time. Credit ratings can also speak to the credit quality of an individual debt issue, such as a corporate note, a municipal bond or a mortgage‐backed security, and the relative likelihood that the issue may default.
Ratings are provided by organizations such as Standard & Poor’s, commonly called credit rating agencies, which specialize in evaluating credit risk. Each agency applies its own methodology in measuring creditworthiness and uses a specific rating scale to publish its ratings opinions. Typically, ratings are expressed as letter grades that range, for example, from ‘AAA’ to ‘D’ to communicate the agency’s opinion of relative level of credit risk.
FAQ’s
What do the letter ratings mean?
The general meaning of our credit rating opinions is summarized below.
‘AAA’—extremely strong capacity to meet financial commitments. Highest Rating. ‘AA’—very strong capacity to meet financial commitments. ‘A’—strong capacity to meet financial commitments, but somewhat susceptible to adverse economic conditions and changes
in circumstances. ‘BBB’—adequate capacity to meet financial commitments, but more subject to adverse economic conditions. ‘BBB‐‘—considered lowest investment grade by market participants. ‘BB+’—considered highest speculative grade by market participants. ‘BB’—less vulnerable in the near‐term but faces major ongoing uncertainties to adverse business, financial and economic
conditions. ‘B’—more vulnerable to adverse business, financial and economic conditions but currently has the capacity to meet financial
commitments.
405
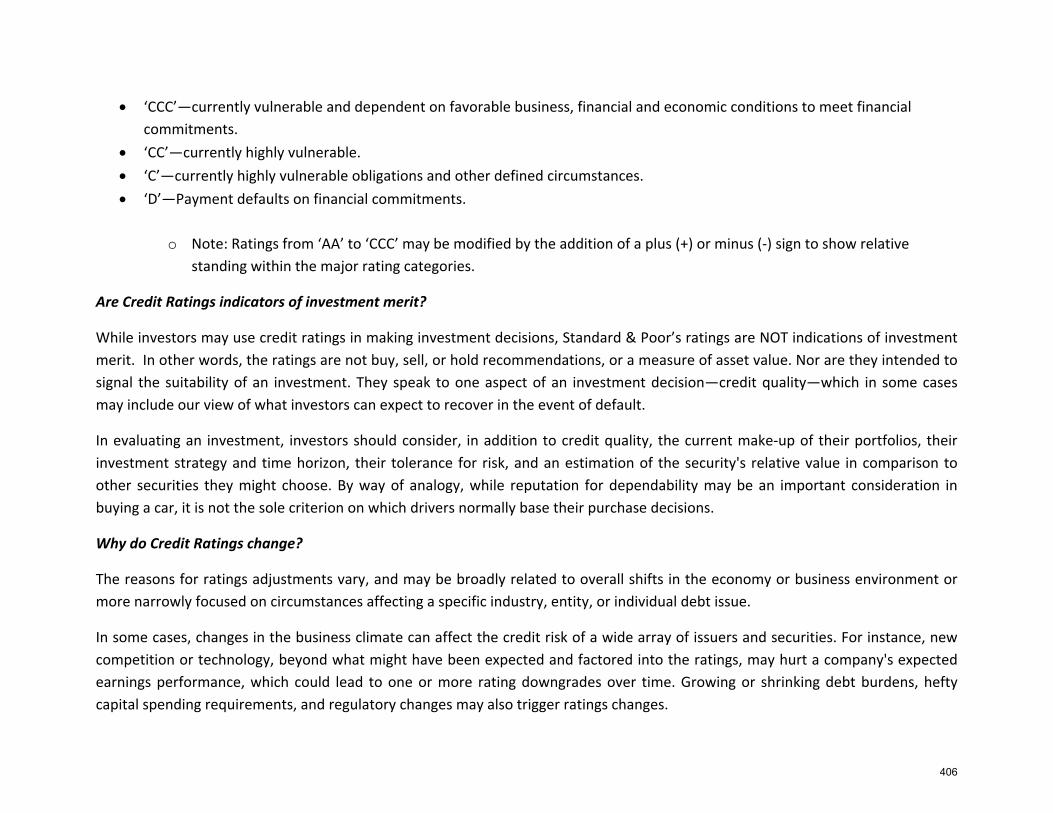
‘CCC’—currently vulnerable and dependent on favorable business, financial and economic conditions to meet financial commitments.
‘CC’—currently highly vulnerable. ‘C’—currently highly vulnerable obligations and other defined circumstances. ‘D’—Payment defaults on financial commitments.
o Note: Ratings from ‘AA’ to ‘CCC’ may be modified by the addition of a plus (+) or minus (‐) sign to show relative
standing within the major rating categories.
Are Credit Ratings indicators of investment merit?
While investors may use credit ratings in making investment decisions, Standard & Poor’s ratings are NOT indications of investment merit. In other words, the ratings are not buy, sell, or hold recommendations, or a measure of asset value. Nor are they intended to signal the suitability of an investment. They speak to one aspect of an investment decision—credit quality—which in some cases may include our view of what investors can expect to recover in the event of default.
In evaluating an investment, investors should consider, in addition to credit quality, the current make‐up of their portfolios, their investment strategy and time horizon, their tolerance for risk, and an estimation of the security's relative value in comparison to other securities they might choose. By way of analogy, while reputation for dependability may be an important consideration in buying a car, it is not the sole criterion on which drivers normally base their purchase decisions.
Why do Credit Ratings change?
The reasons for ratings adjustments vary, and may be broadly related to overall shifts in the economy or business environment or more narrowly focused on circumstances affecting a specific industry, entity, or individual debt issue.
In some cases, changes in the business climate can affect the credit risk of a wide array of issuers and securities. For instance, new competition or technology, beyond what might have been expected and factored into the ratings, may hurt a company's expected earnings performance, which could lead to one or more rating downgrades over time. Growing or shrinking debt burdens, hefty capital spending requirements, and regulatory changes may also trigger ratings changes.
406
While some risk factors tend to affect all issuers—an example would be growing inflation that affects interest rate levels and the cost of capital—other risk factors may pertain only to a narrow group of issuers and debt issues. For instance, the creditworthiness of a state or municipality may be impacted by population shifts or lower incomes of taxpayers, which reduce tax receipts and ability to repay debt.
Are Credit Ratings absolute measures of default probability?
Since there are future events and developments that cannot be foreseen, the assignment of credit ratings is not an exact science. For this reason, Standard & Poor’s ratings opinions are not intended as guarantees of credit quality or as exact measures of the probability that a particular issuer or particular debt issue will default.
Instead, ratings express relative opinions about the creditworthiness of an issuer or credit quality of an individual debt issue, from strongest to weakest, within a universe of credit risk. The likelihood of default is the single most important factor in our assessment of creditworthiness.
For example, a corporate bond that is rated ‘AA’ is viewed by Standard & Poor’s as having a higher credit quality than a corporate bond with a ‘BBB’ rating. But the ‘AA’ rating isn’t a guarantee that it will not default, only that, in our opinion, it is less likely to default than the ‘BBB’ bond.
407
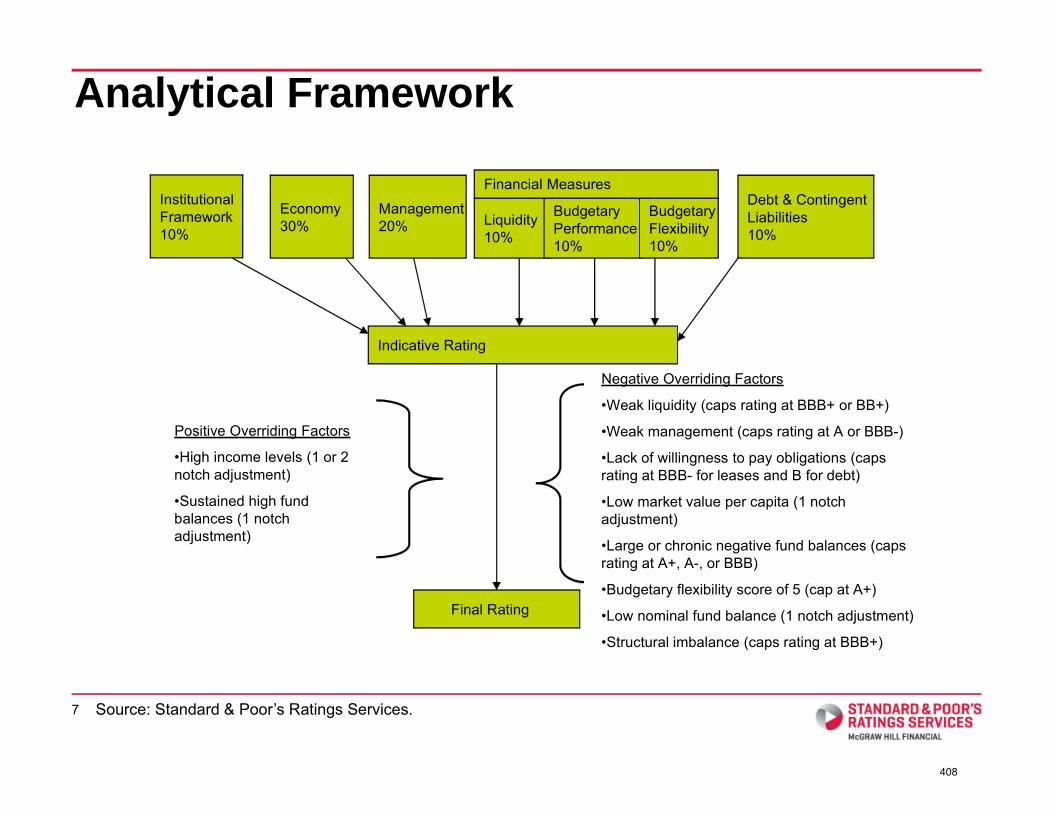
Economy30%
Management20% Liquidity
10%
BudgetaryPerformance10%
BudgetaryFlexibility10%
Debt & ContingentLiabilities10%
Financial Measures
Indicative Rating
Positive Overriding Factors
•High income levels (1 or 2notch adjustment)
•Sustained high fundbalances (1 notchadjustment)
Negative Overriding Factors
•Weak liquidity (caps rating at BBB+ or BB+)
•Weak management (caps rating at A or BBB-)
•Lack of willingness to pay obligations (capsrating at BBB- for leases and B for debt)
•Low market value per capita (1 notchadjustment)
•Large or chronic negative fund balances (capsrating at A+, A-, or BBB)
•Budgetary flexibility score of 5 (cap at A+)
•Low nominal fund balance (1 notch adjustment)
•Structural imbalance (caps rating at BBB+)
Final Rating
InstitutionalFramework10%
Analytical Framework
Source: Standard & Poor’s Ratings Services.7
408
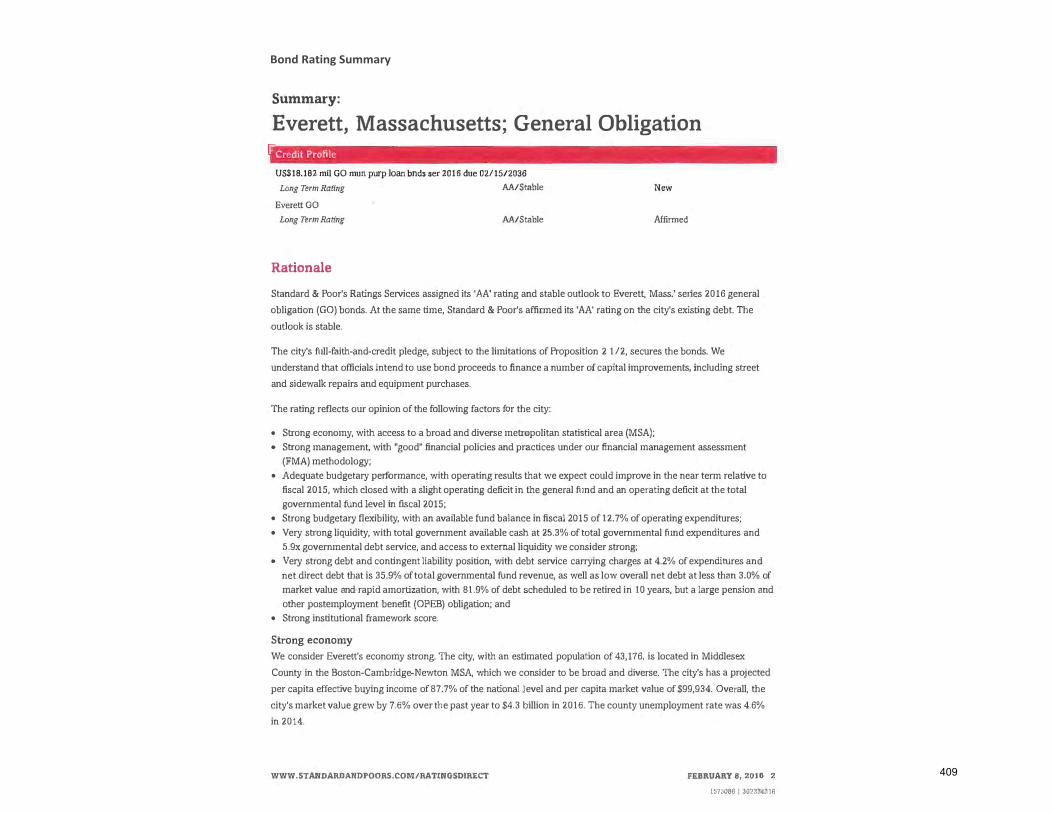
409
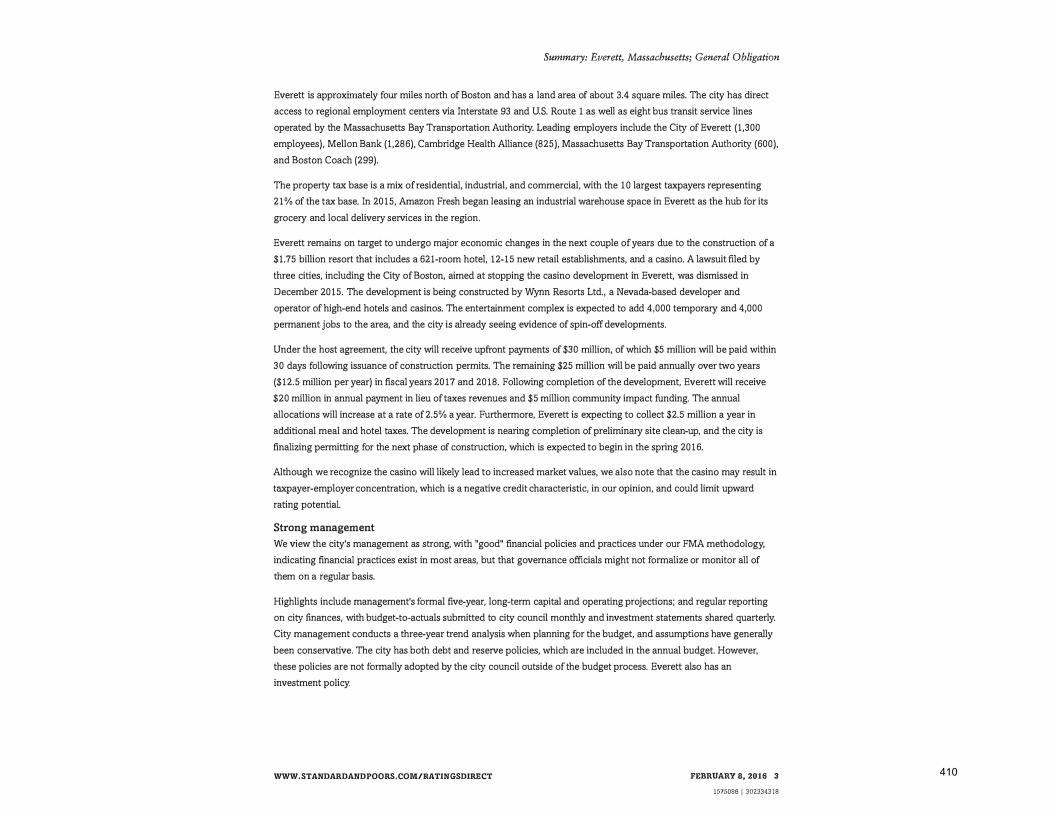
410
411
412
413
414
Budgeting and Accounting Practices The basic financial statements of the City of Everett, Massachusetts are prepared in accordance with Generally Accepted Accounting Principles (GAAP) in the United States of America. The Governmental Accounting Standards Board (GASB) is the recognized standard‐setting body for establishing governmental accounting and financial reporting principles. The significant accounting policies are described herein.
For budgetary financial reporting purposes, the Uniform Municipal Accounting System (UMAS) basis of accounting (established by the Commonwealth of Massachusetts) is followed, which differs from the GAAP basis of accounting and are listed below. A reconciliation of budgetary‐basis to GAAP‐basis results for the general fund for the fiscal year ended June 30th can be found in the City’s Comprehensive Annual Financial Statement (CAFR) at the following website: http://www.ci.everett.ma.us.
BASIS OF BUDGETING
Budgetary basis departs from GAAP as follows:
1. Real and personal property taxes are recorded as revenue when levied (budgetary), as opposed to when susceptible to accrual (GAAP).
2. Encumbrances are recorded as the equivalent of expenditures (budgetary), as opposed to a reservation of fund balance (GAAP).
3. Certain activities and transactions are presented as components of the general fund (budgetary), rather than as separate funds (GAAP).
4. Prior years’ deficits and available funds from prior year’s surpluses are recorded as expenditure and revenue items (budgetary), but have no effect on GAAP expenditures and revenues.
415
BASIS OF ACCOUNTING
Fund Accounting
Fund accounting is an accounting system organized on the basis of funds, each of which is considered a separate accounting entity. The operations of each fund are accounted for with a separate set of self‐balancing accounts that comprise its assets, liabilities, fund equity, revenues and expenditures, or expenses as appropriate. Resources are allocated to and accounted for in individual funds based upon purpose for which they are to be spent and the means by which spending activities are controlled. Fund accounting is used by states and local governments and by not‐for‐profit organizations that need to account for resources the use of which is restricted by donors or grantors.
Types of Funds
There are seven types of funds that can be used, as needed, by state and local governments, both general purpose and limited purpose. The types of funds are as follows:
Governmental Funds
1. The General Fund – The General Fund is the major operating fund of municipal governments and it accounts for the vast majority of municipal operations. The General Fund is supported by revenues from real estate and personal property taxes, state and federal aid, excise taxes, investment income, fines and forfeitures and fees and charges. Most of the municipal departments, including the schools, are supported in whole or in part by the General Fund.
2. Special Revenue Funds – To account for the proceeds of specific revenue sources (other than expendable trust or for major capital projects) that are legally restricted to expenditures for specific purposed. These funds are used mostly for donations, state, federal and other intergovernmental revenue and expenditures.
3. Capital Projects Funds – To account for financial resources to be used for the acquisition or construction of major capital facilities – other than those financed by proprietary funds and trust funds.
4. Debt Service Funds – To account for the accumulation of resources for, and the payment of, general long‐term debt principal and interest.
416
Proprietary Funds
5. Enterprise Funds – To account for operations (a) that are financed and operated in a manner similar to private business enterprises – where the intent of the governing body is that the costs (expenses, including depreciation)of providing goods or services to the general public on a continuing basis be financed or recovered primarily through user charges; or (b) where the governing body has decided the periodic determination of revenues earned, expenses incurred, and/or net income is appropriate for capital maintenance, public policy, management control, accountability or other purposes.
6. Internal Service Funds – To account for the financing of goods or services provided by one department or agency to other departments or agencies of the governmental unit, or to other governmental units, on a cost‐reimbursement basis.
Fiduciary Funds
7. Trust and Agency Funds – To account for assets held by a governmental unit in a trustee capacity or as an agent for individuals, private organizations, other governmental units, and/or other funds. These include (a) expendable trust funds, (b) nonexpendable trust funds, (c) pension trust funds and (d) agency funds.
Accrual Basis in Governmental Accounting – The modified accrual basis of accounting, as appropriate, should be utilized in measuring financial position and operating results.
Governmental fund revenues and expenditures should be recognized on the modified accrual basis. Revenues should be recognized in the accounting period in which they become available and measurable. Expenditures should be recognized in the accounting period in which the fund liability is incurred, if measurable, except for unmatured interest on general long‐term debt, which should be recognized when due.
Proprietary fund revenues and expenses should be recognized on the accrual basis. Revenues should be recognized in the accounting period in which they are earned and become measurable; expense should be recognized in the period incurred, if measurable.
Fiduciary fund revenues and expense or expenditures (as appropriate) should be recognized on the basis consistent with the fund’s accounting measurement objective. Nonexpendable trust and pension trust funds (and investment trust funds) should be
417
accounted for on the accrual basis; expendable trust funds should be accounted for on the modified accrual basis. Agency fund assets and liabilities should be accounted for on the modified accrual basis.
Transfers should be recognized in the accounting period in which the inter‐fund receivable and payable arise.
Fund Balance & Fund Equity
The arithmetic difference between the amount of financial resources and the amount of liabilities recorded in the fund is the FUND EQUITY. Residents of the governmental unit have no legal claim on any excess of liquid assets over current liabilities; therefore, the Fund Equity is not analogous to the capital accounts of an investor‐owned entity. Accounts in the Fund Equity category of the General Fund and special revenue funds consist of reserve accounts established to disclose that portions of the equity are not available for appropriation (reserved or designated); the portion of equity available for appropriation is disclosed in an account called FUND BALANCE.
Annual Audits
At the close of each fiscal year, state law requires the City of Everett to publish a complete set of financial statements in conformity with accounting principles generally accepted in the United States of America (GAAP), and that are audited in accordance with generally accepted auditing standards by a firm of licensed certified public accountants. Pursuant to that requirement, the City of Everett has been audited by the Firm of Powers & Sullivan, Certified Public Accountants of Wakefield, Massachusetts.
Reporting Entity
For financial reporting purposes, the city has included all funds, organizations, agencies, boards, commissions and institutions. The city has also considered all potential component units for which it is financially accountable as well as other organizations for which the nature and significance of their relationship with the city are such that exclusion would cause the basic financial statements to be misleading or incomplete. As required by GAAP, these basic financial statements present the city (the preliminary government) and its component units. One entity has been included as a component unit in the reporting entity, because of the significance of its operational and/or financial relationship.
418
Blended Component Units – Blended component units are entities that are legally separate from the city, but are so related that they are, in substance, the same as the city, or entities providing services entirely or almost entirely for the benefit of the city. The following component unit is blended within the Fiduciary Funds of the primary government:
The Everett Contributory Retirement System was established to provide retirement benefits to city employees, the Everett Housing Authority employees and their beneficiaries. The System is governed by a five‐member board comprised of the City Auditor (ex‐officio), two members elected by the System’s participants, one member appointed by the Mayor and one member appointed by the their board members. The CRS is presented using the accrual basis of accounting and is reported as a pension trust fund in the fiduciary fund financial statements.
Availability of Financial Information for Component Unit
The Everett Contributory Retirement System does not issue separate audited financial statement. The CRS issues a publicly available unaudited financial report in accordance with guidelines established by the Commonwealth of Massachusetts (Commonwealth) Public Employee Retirement Administration Commission (PERAC). That report may be obtained by contacting the CRS located at 484 Broadway, Everett, Massachusetts.
Government‐Wide Financial Statements
The government‐wide financial statements (i.e., statement of net assets and the statement of changes in net assets) report information on all of the non‐fiduciary activities of the primary government and its component units. Governmental activities, which are primarily supported by taxes and intergovernmental revenues, are reported separately from business‐type activities, which are supported primarily by user fees and charges.
419

Government‐Wide and Fund Financial Statements
Government‐Wide Financial Statements
The government‐wide financial statements (i.e., statement of net assets and the statement of changes in net assets) report information on all of the non‐fiduciary activities of the primary government and its component units. Governmental activities, which are primarily supported by taxes and intergovernmental revenues, are reported separately from business‐type activities, which are supported primarily by user fees and charges.
Fund Financial Statements
Separate financial statements are provided for governmental funds, propriety funds, and fiduciary funds, even though fiduciary funds are excluded from the government‐wide financial statements. Major individual governmental funds and major individual enterprise funds are reported as separate columns in the fund financial statements. Non‐major funds are aggregated and displayed in a single column.
Major Fund Criteria
Major funds must be reported if the following criteria are met:
● If the total assets, liabilities, revenues, or expenditures/expenses of an individual governmental or enterprise fund are at least 10% of the corresponding element (assets, liabilities, etc.) for all funds of that category or type (total governmental or total enterprise funds), and
● If the total assets, liabili es, revenues, or expenditures/expenses of the individual governmental fund or enterprise fund are at least 5% of the corresponding element for all governmental and enterprise funds combined.
Additionally, any other governmental or enterprise fund that management believes is particularly significant to the basic financial statements may be reported as a major fund.
420
Internal service funds and fiduciary funds are reported by fund type.
Measurement Focus, Basis of Accounting and Financial Statement Presentation
Government‐Wide Financial Statements
The government‐wide financial statements are reported using the economic resources measurement focus and the accrual basis of accounting. Under this method, revenues are recorded when earned and expenses are recorded when the liabilities are incurred. Real estate and personal property taxes are recognized as revenues in the fiscal year for which they are levied. Grants and similar items are recognized as revenue as soon as all eligibility requirements imposed by the provider have been met.
The statement of activities demonstrates the degree to which the direct expenses of a particular function or segment are offset by program revenues. Direct expenses are those that are clearly identifiable with a specific function or segment. Program revenues include the following:
● Charges to customers or applicants who purchase, use, or directly benefit from goods, services, or privileges provided by a given function or segment.
● Grants and contributions are restricted to meeting the operational requirements of a particular function or segment.
● Grants and contributions are restricted to meeting the capital requirements of a particular function or segment.
Taxes and other items not identifiable as program revenues are reported as general revenues.
For the most part, the effect of inter‐fund activity has been removed from the government‐wide financial statements. However, the effect of inter‐fund services provided and used between functions is not eliminated as the elimination of these charges would distort the direct costs and program revenues reported for the functions affected.
421
Fund Financial Statements
Governmental fund financial statements are reported using the flow of current financial resources measurement focus and the modified accrual basis of accounting. Under the modified accrual basis of accounting, revenues are recognized when susceptible to accrual (i.e., measurable and available). Measurable means the amount of the transaction can be determined and available means collectible within the current period or soon enough thereafter to pay liabilities of the current period. Expenditures are recorded when the related fund liability is incurred, except for un‐matured interest on general long‐term debt which is recognized when due, and certain compensated absences, claims and judgments which are recognized when the obligations are expected to be liquidated with current expendable available resources.
Real estate and personal property tax revenues are considered available if they are collected within 60 days after fiscal year‐end. Investment income is susceptible to accrual. Other receipts and tax revenues become measurable and available when the cash is received and are recognized as revenue at that time.
Entitlements and shared revenues are recorded at the time of receipt or earlier if the susceptible to accrual criteria is met. Expenditure driven grants recognize revenue when the qualifying expenditures are incurred and all other grant requirements are met.
The following major governmental funds are reported:
The general fund is the primary operating fund. It is used to account for all financial resources, except those that are required to be accounted for in another fund.
The stabilization fund is a special revenue fund used to account for the accumulation of resources to be used for general and/or capital purposes upon approval of City Council.
The school capital projects fund is used to account for the ongoing construction and renovations of the City’s school buildings.
422
The non‐major governmental funds consist of other special revenue, capital projects and permanent funds that are aggregated and presented in the non‐major governmental funds column on the governmental funds financial statements. The following describes the general use of these fund types:
The special revenue fund is used to account for the proceeds of specific revenue sources (other than permanent funds or capital projects funds) that are restricted by law or administrative action to expenditures for specified purposes.
The capital projects fund is used to account for financial resources to be used for the acquisition or construction of major capital facilities (other than those financed by Enterprise Funds).
The permanent fund is used to account for financial resources that are legally restricted to the extent that only earnings, not principal, may be used for purposes that support the governmental programs.
Proprietary fund financial statements are reported using the flow of economic resources measurement focus and use the accrual basis of accounting. Under this method, revenues are recorded when earned and expenses are recorded when the liabilities are incurred.
Proprietary funds distinguish operating revenues and expenses from non‐operating items. Operating revenues and expenses generally result from providing services and producing and delivering goods in connection with the proprietary funds principal ongoing operations. All revenues and expenses not meeting this definition are reported as non‐operating revenues and expenses.
The following major proprietary funds are reported:
The sewer enterprise fund is used to account for the sewer activities.
The water enterprise fund is used to account for the water activities.
The parking activities enterprise fund is used to account for parking activities.
The trash enterprise fund is used to account for the solid waste disposal activities.
Additionally, the following proprietary fund type is reported:
423
The internal service fund is used to account for the financing of services provided by one department to other departments or governmental units. This fund is used to account for risk financing activities related to retirees’ health insurance.
Fiduciary fund financial statements are reported using the flow of economic resources measurement focus and use the accrual basis of accounting except for the Agency Fund, which has no measurement focus. Fiduciary funds are used to account for assets held in a trustee capacity for others that cannot be used to support the governmental programs.
The following fiduciary fund types are reported:
The pension trust fund is used to account for the activities of the System, which accumulates resources to provide pension benefits to eligible retirees and their beneficiaries.
The private‐purpose trust fund is used to account for trust arrangements that exclusively benefit individuals, private organizations, or other governments. Some of these trusts have donor restrictions and trustee policies that do not allow the endowment portion and any unrealized appreciation to be spent. The donor restrictions and trustee policies only allow the trustees to authorize spending of the realized investment earnings. The City’s educational scholarships and housing subsidy trust funds are accounted for in this fund.
The agency fund is used to account for assets held in a purely custodial capacity. The City’s agency funds consist primarily of payroll withholdings, police and fire details, escrow deposits and unclaimed property.
Government‐Wide and Fund Financial Statements
Private‐sector standards of accounting and financial reporting issued prior to December 1, 1989, generally are followed in both the government‐wide and proprietary fund financial statements to the extent that those standards do not conflict with or contradict guidance of the Governmental Accounting Standards Board. Governments also have the option of following subsequent private‐sector guidance for their business‐type activities and enterprise funds, subject to this same limitation. The government has elected not to follow subsequent private‐sector guidance.
424
Performance Management and Measurers
The Government Finance Officers Association (GFOA) Distinguished Budget Presentation Award program requires all submitting agencies to incorporate Performance Management and Performance Measurers into their budget. The City of Everett is continuing to incorporate those ideas and strategies as part of the overall operation and management of the City.
Long and Short Term Strategic Goals
The City of Everett’s Long and Short Term Strategic Plan Summary is a listing of the Mayor’s top priorities for the City of Everett for the current fiscal year and beyond.
Each department will be required to include a table of Outcomes and Performance measurers in their mission statements. They will also be required to include a description of “How Fiscal Year Department Goals relate to the City’s Overall Long & Short Term Goals”. This information defines how each department’s goals tie in to the overall goals of the City and is included for each department in their mission statements throughout Section 5. Though some departments have not included this information in their FY17 submissions, we are working towards the goal of 100% participation by FY18.
What is Performance Management?
Performance management is a logical and integrated approach to all aspects of the cycle of planning, budgeting, operations and evaluations that is based on data and analysis, for the purpose of continuously improving results. Performance management is:
● Data driven ‐ using reliable, verifiable and relevant data.
● Outcome oriented ‐ focused primarily on results, less on inputs and outputs.
● Ci zen focused‐based on community needs.
● Logically aligned ‐ mission, goals, objectives, measurers, responsibilities are integrated.
● Transparent‐information is available and understandable by outsiders and insiders alike.
425
● Sustainable ‐ survives leadership changes.
● Learning, improvement and accountability driven.
Performance measurement has become increasingly prevalent in local government, yet most government managers still struggle with the fundamental question of what to do with performance measurement data when they have it. Management teams want to know how they can incorporate performance measurement into their management and decision making processes. Rather than simply reporting performance results, performance based management focuses on linking performance measurement to strategic planning and using it as a lever for cultural change. By creating a learning environment in which performance measures are regularly reviewed and discussed, organization can improve the pace of learning and decision making, improve performance, and facilitate broader cultural change.
Where to get more information
The information above was obtained from the GFOA website (www.gfoa.org) and more information on performance management and measurers is available on that website.
GFOA Recommended Practices:
Budgeting for Results and Outcome (2007): http://www.gfoa.org/downloads/budgetingforresults.pdf
Performance Management: Using Performance Measurement for Decision Making (2002 and 2007): http://www.gfoa.org/downloads/budgetperfmanagement.pdf
426
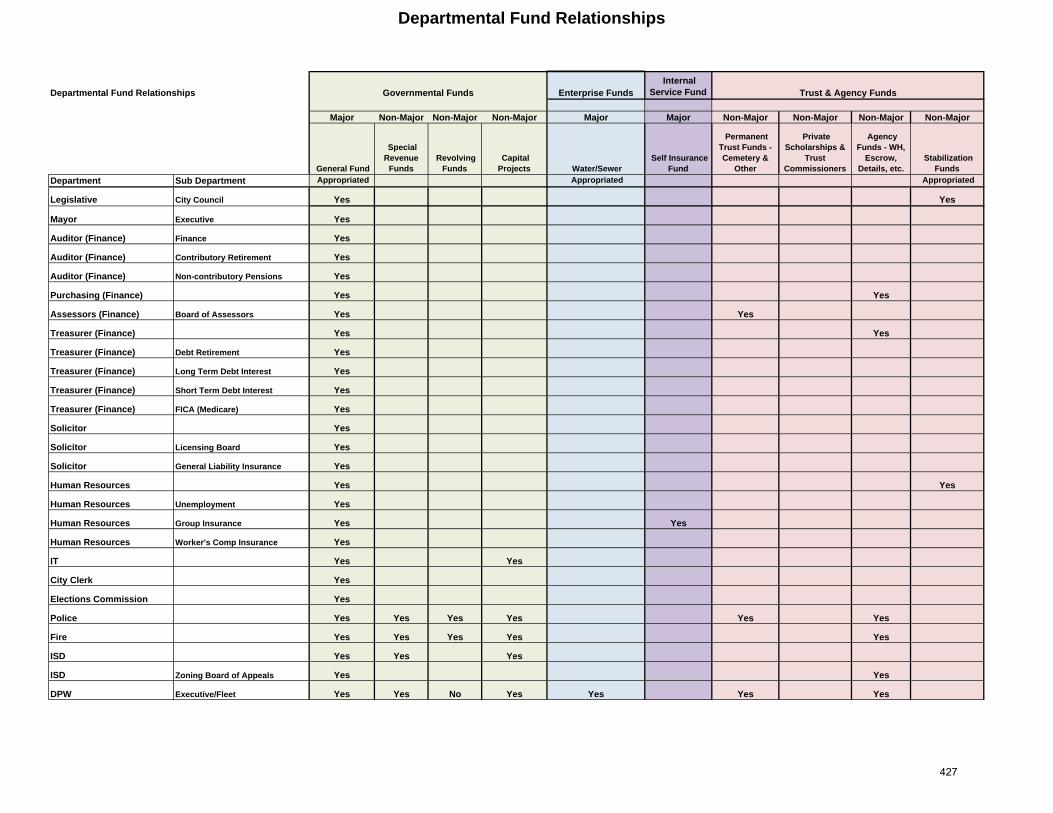
Departmental Fund Relationships
Departmental Fund Relationships Enterprise Funds Internal
Service Fund
Major Non-Major Non-Major Non-Major Major Major Non-Major Non-Major Non-Major Non-Major
General Fund
Special Revenue
Funds Revolving
Funds Capital Projects Water/Sewer
Self Insurance Fund
Permanent Trust Funds - Cemetery &
Other
Private Scholarships &
Trust Commissioners
Agency Funds - WH,
Escrow, Details, etc.
Stabilization Funds
Department Sub Department Appropriated Appropriated Appropriated
Legislative City Council Yes Yes
Mayor Executive Yes
Auditor (Finance) Finance Yes
Auditor (Finance) Contributory Retirement Yes
Auditor (Finance) Non-contributory Pensions Yes
Purchasing (Finance) Yes Yes
Assessors (Finance) Board of Assessors Yes Yes
Treasurer (Finance) Yes Yes
Treasurer (Finance) Debt Retirement Yes
Treasurer (Finance) Long Term Debt Interest Yes
Treasurer (Finance) Short Term Debt Interest Yes
Treasurer (Finance) FICA (Medicare) Yes
Solicitor Yes
Solicitor Licensing Board Yes
Solicitor General Liability Insurance Yes
Human Resources Yes Yes
Human Resources Unemployment Yes
Human Resources Group Insurance Yes Yes
Human Resources Worker's Comp Insurance Yes
IT Yes Yes
City Clerk Yes
Elections Commission Yes
Police Yes Yes Yes Yes Yes Yes
Fire Yes Yes Yes Yes Yes
ISD Yes Yes Yes
ISD Zoning Board of Appeals Yes Yes
DPW Executive/Fleet Yes Yes No Yes Yes Yes Yes
Governmental Funds Trust & Agency Funds
427
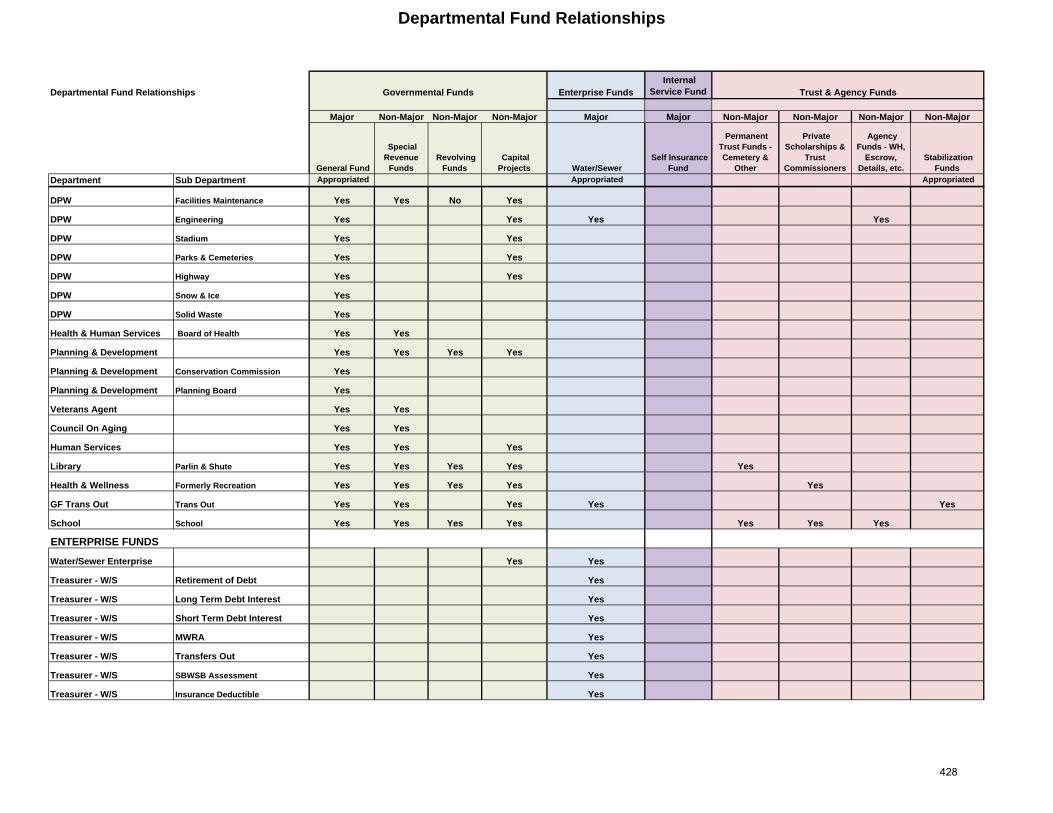
Departmental Fund Relationships
Departmental Fund Relationships Enterprise Funds Internal
Service Fund
Major Non-Major Non-Major Non-Major Major Major Non-Major Non-Major Non-Major Non-Major
General Fund
Special Revenue
Funds Revolving
Funds Capital Projects Water/Sewer
Self Insurance Fund
Permanent Trust Funds - Cemetery &
Other
Private Scholarships &
Trust Commissioners
Agency Funds - WH,
Escrow, Details, etc.
Stabilization Funds
Department Sub Department Appropriated Appropriated Appropriated
Governmental Funds Trust & Agency Funds
DPW Facilities Maintenance Yes Yes No Yes
DPW Engineering Yes Yes Yes Yes
DPW Stadium Yes Yes
DPW Parks & Cemeteries Yes Yes
DPW Highway Yes Yes
DPW Snow & Ice Yes
DPW Solid Waste Yes
Health & Human Services Board of Health Yes Yes
Planning & Development Yes Yes Yes Yes
Planning & Development Conservation Commission Yes
Planning & Development Planning Board Yes
Veterans Agent Yes Yes
Council On Aging Yes Yes
Human Services Yes Yes Yes
Library Parlin & Shute Yes Yes Yes Yes Yes
Health & Wellness Formerly Recreation Yes Yes Yes Yes Yes
GF Trans Out Trans Out Yes Yes Yes Yes Yes
School School Yes Yes Yes Yes Yes Yes Yes
ENTERPRISE FUNDS
Water/Sewer Enterprise Yes Yes
Treasurer - W/S Retirement of Debt Yes
Treasurer - W/S Long Term Debt Interest Yes
Treasurer - W/S Short Term Debt Interest Yes
Treasurer - W/S MWRA Yes
Treasurer - W/S Transfers Out Yes
Treasurer - W/S SBWSB Assessment Yes
Treasurer - W/S Insurance Deductible Yes
428
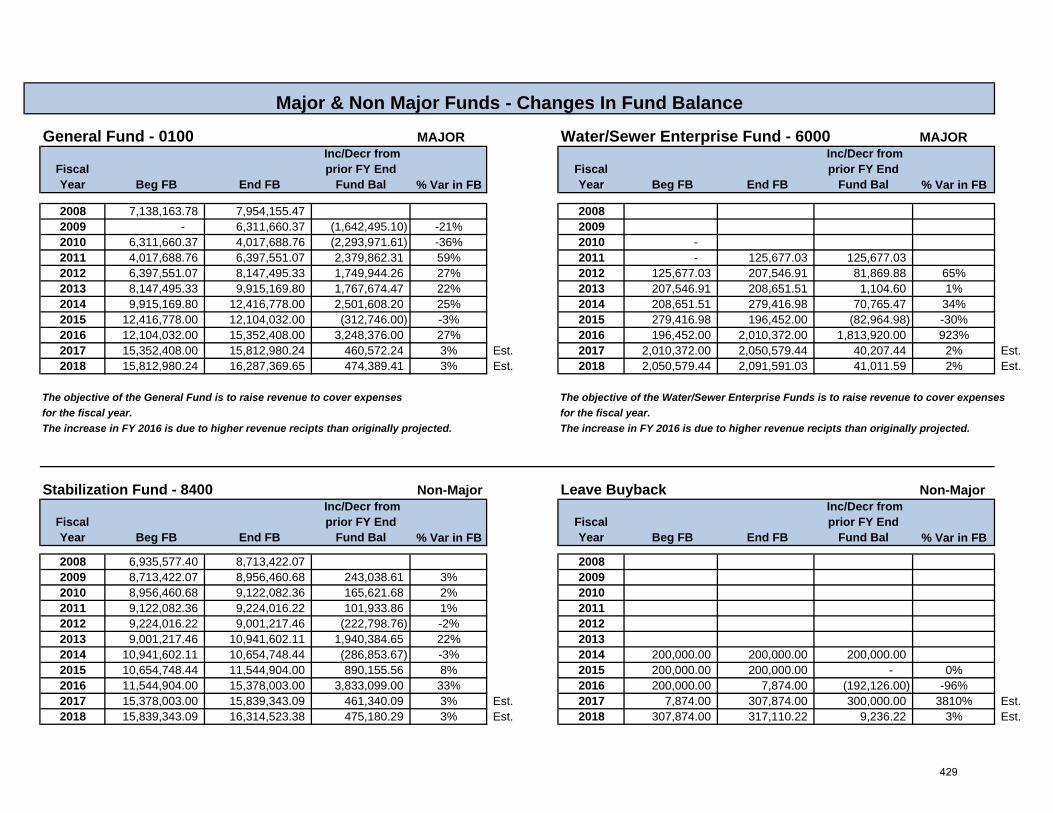
General Fund - 0100 MAJOR Water/Sewer Enterprise Fund - 6000 MAJOR
Fiscal Year Beg FB End FB
Inc/Decr from prior FY End
Fund Bal % Var in FBFiscal Year Beg FB End FB
Inc/Decr from prior FY End
Fund Bal % Var in FB
2008 7,138,163.78 7,954,155.47 20082009 - 6,311,660.37 (1,642,495.10) -21% 20092010 6,311,660.37 4,017,688.76 (2,293,971.61) -36% 2010 - 2011 4,017,688.76 6,397,551.07 2,379,862.31 59% 2011 - 125,677.03 125,677.03 2012 6,397,551.07 8,147,495.33 1,749,944.26 27% 2012 125,677.03 207,546.91 81,869.88 65%2013 8,147,495.33 9,915,169.80 1,767,674.47 22% 2013 207,546.91 208,651.51 1,104.60 1%2014 9,915,169.80 12,416,778.00 2,501,608.20 25% 2014 208,651.51 279,416.98 70,765.47 34%2015 12,416,778.00 12,104,032.00 (312,746.00) -3% 2015 279,416.98 196,452.00 (82,964.98) -30%2016 12,104,032.00 15,352,408.00 3,248,376.00 27% 2016 196,452.00 2,010,372.00 1,813,920.00 923%2017 15,352,408.00 15,812,980.24 460,572.24 3% Est. 2017 2,010,372.00 2,050,579.44 40,207.44 2% Est.2018 15,812,980.24 16,287,369.65 474,389.41 3% Est. 2018 2,050,579.44 2,091,591.03 41,011.59 2% Est.
The objective of the General Fund is to raise revenue to cover expenses The objective of the Water/Sewer Enterprise Funds is to raise revenue to cover expensesfor the fiscal year. for the fiscal year. The increase in FY 2016 is due to higher revenue recipts than originally projected. The increase in FY 2016 is due to higher revenue recipts than originally projected.
Stabilization Fund - 8400 Non-Major Leave Buyback Non-Major
Fiscal Year Beg FB End FB
Inc/Decr from prior FY End
Fund Bal % Var in FBFiscal Year Beg FB End FB
Inc/Decr from prior FY End
Fund Bal % Var in FB
2008 6,935,577.40 8,713,422.07 20082009 8,713,422.07 8,956,460.68 243,038.61 3% 20092010 8,956,460.68 9,122,082.36 165,621.68 2% 20102011 9,122,082.36 9,224,016.22 101,933.86 1% 20112012 9,224,016.22 9,001,217.46 (222,798.76) -2% 20122013 9,001,217.46 10,941,602.11 1,940,384.65 22% 20132014 10,941,602.11 10,654,748.44 (286,853.67) -3% 2014 200,000.00 200,000.00 200,000.00 2015 10,654,748.44 11,544,904.00 890,155.56 8% 2015 200,000.00 200,000.00 - 0%2016 11,544,904.00 15,378,003.00 3,833,099.00 33% 2016 200,000.00 7,874.00 (192,126.00) -96%2017 15,378,003.00 15,839,343.09 461,340.09 3% Est. 2017 7,874.00 307,874.00 300,000.00 3810% Est.2018 15,839,343.09 16,314,523.38 475,180.29 3% Est. 2018 307,874.00 317,110.22 9,236.22 3% Est.
Major & Non Major Funds - Changes In Fund Balance
429
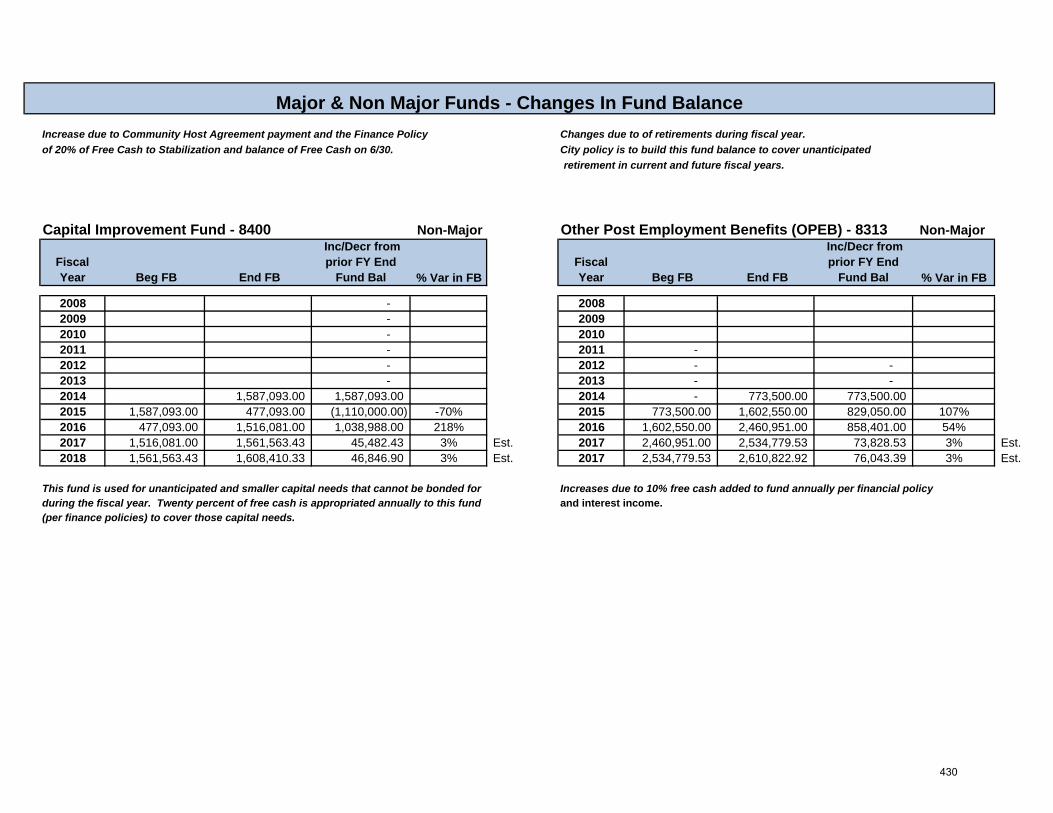
Major & Non Major Funds - Changes In Fund BalanceIncrease due to Community Host Agreement payment and the Finance Policy Changes due to of retirements during fiscal year.of 20% of Free Cash to Stabilization and balance of Free Cash on 6/30. City policy is to build this fund balance to cover unanticipated
retirement in current and future fiscal years.
Capital Improvement Fund - 8400 Non-Major Other Post Employment Benefits (OPEB) - 8313 Non-Major
Fiscal Year Beg FB End FB
Inc/Decr from prior FY End
Fund Bal % Var in FBFiscal Year Beg FB End FB
Inc/Decr from prior FY End
Fund Bal % Var in FB
2008 - 20082009 - 20092010 - 20102011 - 2011 - 2012 - 2012 - - 2013 - 2013 - - 2014 1,587,093.00 1,587,093.00 2014 - 773,500.00 773,500.00 2015 1,587,093.00 477,093.00 (1,110,000.00) -70% 2015 773,500.00 1,602,550.00 829,050.00 107%2016 477,093.00 1,516,081.00 1,038,988.00 218% 2016 1,602,550.00 2,460,951.00 858,401.00 54%2017 1,516,081.00 1,561,563.43 45,482.43 3% Est. 2017 2,460,951.00 2,534,779.53 73,828.53 3% Est.2018 1,561,563.43 1,608,410.33 46,846.90 3% Est. 2017 2,534,779.53 2,610,822.92 76,043.39 3% Est.
This fund is used for unanticipated and smaller capital needs that cannot be bonded for Increases due to 10% free cash added to fund annually per financial policyduring the fiscal year. Twenty percent of free cash is appropriated annually to this fund and interest income.(per finance policies) to cover those capital needs.
430
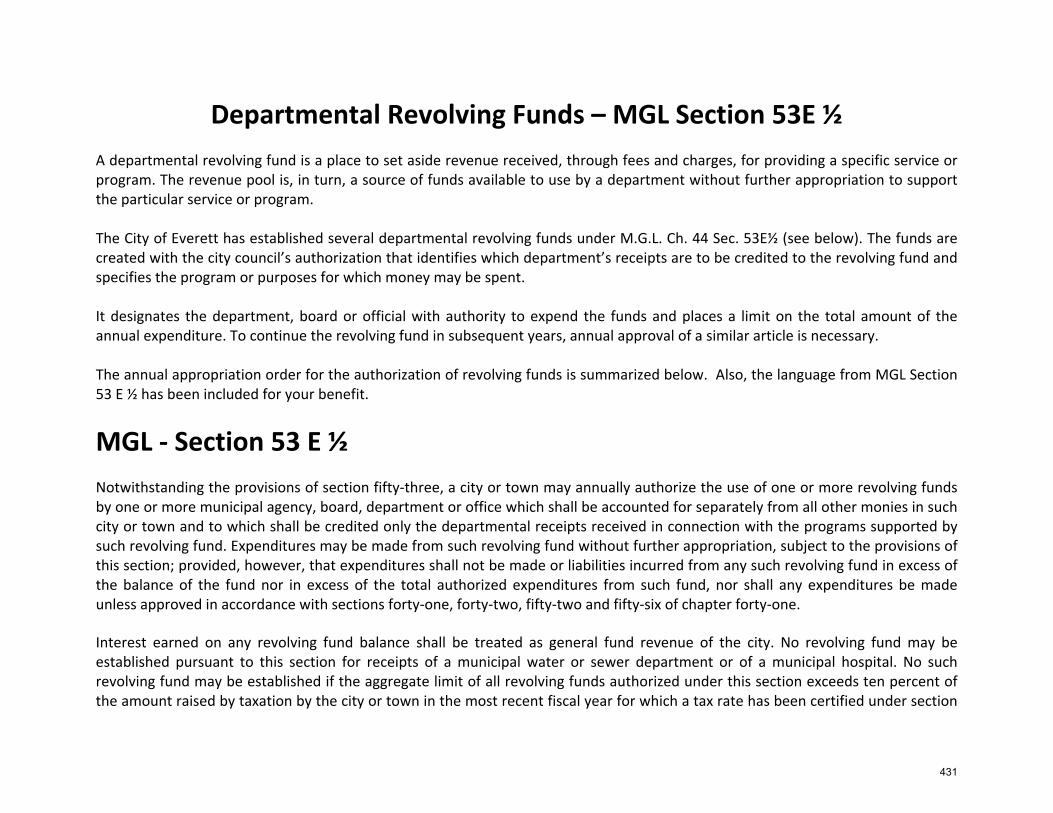
Departmental Revolving Funds – MGL Section 53E ½ A departmental revolving fund is a place to set aside revenue received, through fees and charges, for providing a specific service or program. The revenue pool is, in turn, a source of funds available to use by a department without further appropriation to support the particular service or program. The City of Everett has established several departmental revolving funds under M.G.L. Ch. 44 Sec. 53E½ (see below). The funds are created with the city council’s authorization that identifies which department’s receipts are to be credited to the revolving fund and specifies the program or purposes for which money may be spent. It designates the department, board or official with authority to expend the funds and places a limit on the total amount of the annual expenditure. To continue the revolving fund in subsequent years, annual approval of a similar article is necessary. The annual appropriation order for the authorization of revolving funds is summarized below. Also, the language from MGL Section 53 E ½ has been included for your benefit.
MGL ‐ Section 53 E ½ Notwithstanding the provisions of section fifty‐three, a city or town may annually authorize the use of one or more revolving funds by one or more municipal agency, board, department or office which shall be accounted for separately from all other monies in such city or town and to which shall be credited only the departmental receipts received in connection with the programs supported by such revolving fund. Expenditures may be made from such revolving fund without further appropriation, subject to the provisions of this section; provided, however, that expenditures shall not be made or liabilities incurred from any such revolving fund in excess of the balance of the fund nor in excess of the total authorized expenditures from such fund, nor shall any expenditures be made unless approved in accordance with sections forty‐one, forty‐two, fifty‐two and fifty‐six of chapter forty‐one.
Interest earned on any revolving fund balance shall be treated as general fund revenue of the city. No revolving fund may be established pursuant to this section for receipts of a municipal water or sewer department or of a municipal hospital. No such revolving fund may be established if the aggregate limit of all revolving funds authorized under this section exceeds ten percent of the amount raised by taxation by the city or town in the most recent fiscal year for which a tax rate has been certified under section
431
twenty‐three of chapter fifty‐nine. No revolving fund expenditures shall be made for the purpose of paying any wages or salaries for full time employees unless such revolving fund is also charged for the costs of fringe benefits associated with the wages or salaries so paid; provided, however, that such prohibition shall not apply to wages or salaries paid to full or part‐time employees who are employed as drivers providing transportation for public school students; provided further, that only that portion of a revolving fund which is attributable to transportation fees may be used to pay such wages or salaries and provided, further, that any such wages or salaries so paid shall be reported in the budget submitted for the next fiscal year.
A revolving fund established under the provisions of this section shall be by vote of the city council in a city, upon recommendation of the Mayor, in Plan E cities. Such authorization shall be made annually prior to each respective fiscal year; provided, however, that each authorization for a revolving fund shall specify: (1) the programs and purposes for which the revolving fund may be expended; (2) the departmental receipts which shall be credited to the revolving fund; (3) the board, department or officer authorized to expend from such fund; (4) a limit on the total amount which may be expended from such fund in the ensuing fiscal year.
Provided, further, that no board, department or officer shall be authorized to expend in any one fiscal year from all revolving funds under its direct control more than one percent of the amount raised by taxation by the city or town in the most recent fiscal year for which a tax rate has been certified under section twenty‐three of chapter fifty‐nine.
Notwithstanding the provisions of this section, whenever, during the course of any fiscal year, any new revenue source becomes available for the establishment of a revolving fund under this section, such a fund may be established in accordance with this section upon certification by the city auditor that the revenue source was not used in computing the most recent tax levy.
In any fiscal year the limit on the amount that may be spent from a revolving fund may be increased with the approval of the city council and mayor in a city, provided, however, that the one percent limit established by clause (4) of the third paragraph is not exceeded.
The board, department or officer having charge of such revolving fund shall report the city council, the Mayor of a city, the total amount of receipts and expenditures for each revolving fund under its control for the prior fiscal year and for the current fiscal year through December thirty‐first, or such later date as the city council may, by vote determine, and the amount of any increases in spending authority granted during the prior and current fiscal years, together with such other information as the town meeting or city council may by vote require.
432
At the close of a fiscal year in which a revolving fund is not reauthorized for the following year, or in which a city changes the purposes for which money in a revolving fund may be spent in the following year, the balance in the fund at the end of the fiscal year shall revert to surplus revenue unless the city council and Mayor vote to transfer such balance to another revolving fund established under this section.
The director of accounts may issue guidelines further regulating revolving funds established under this section.
433
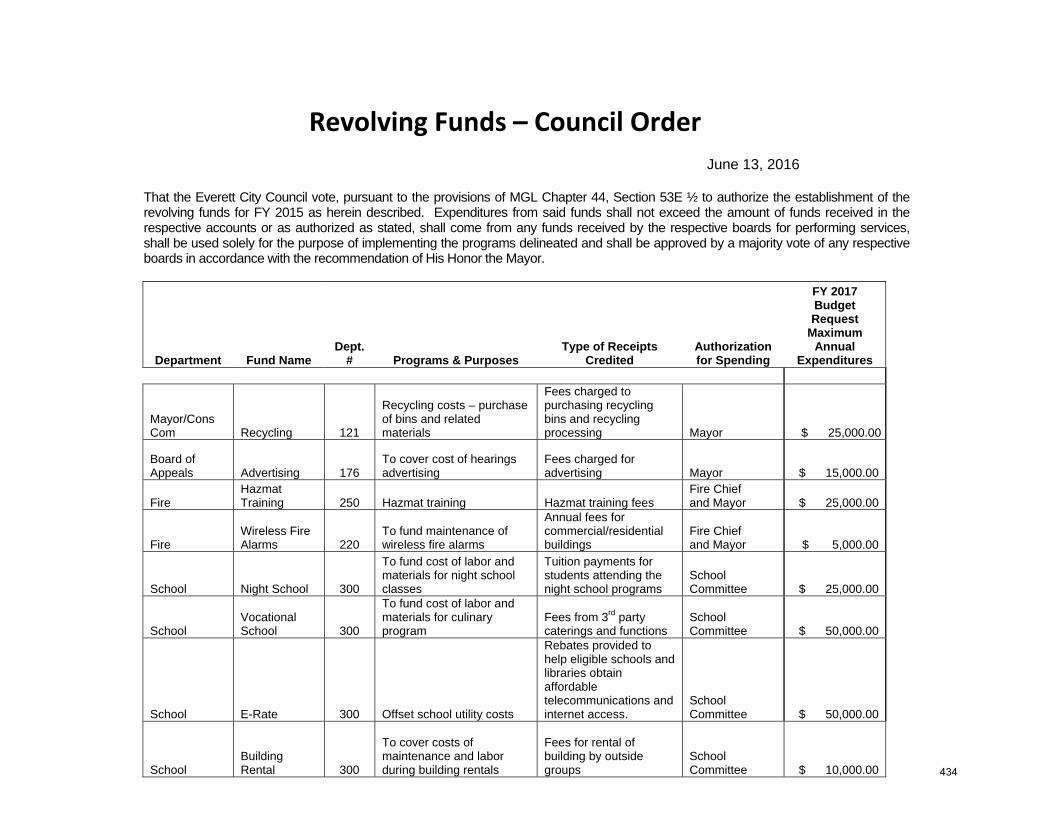
Revolving Funds – Council Order
June 13, 2016 That the Everett City Council vote, pursuant to the provisions of MGL Chapter 44, Section 53E ½ to authorize the establishment of the revolving funds for FY 2015 as herein described. Expenditures from said funds shall not exceed the amount of funds received in the respective accounts or as authorized as stated, shall come from any funds received by the respective boards for performing services, shall be used solely for the purpose of implementing the programs delineated and shall be approved by a majority vote of any respective boards in accordance with the recommendation of His Honor the Mayor.
Department Fund Name Dept.
# Programs & Purposes Type of Receipts
Credited Authorization for Spending
FY 2017 Budget Request
Maximum Annual
Expenditures
Mayor/Cons Com Recycling 121
Recycling costs – purchase of bins and related materials
Fees charged to purchasing recycling bins and recycling processing Mayor $ 25,000.00 0
Board of Appeals Advertising 176
To cover cost of hearings advertising
Fees charged for advertising Mayor $ 15,000.00
Fire Hazmat Training 250 Hazmat training Hazmat training fees
Fire Chief and Mayor $ 25,000.00
Fire Wireless Fire Alarms 220
To fund maintenance of wireless fire alarms
Annual fees for commercial/residential buildings
Fire Chief and Mayor $ 5,000.00
School Night School 300
To fund cost of labor and materials for night school classes
Tuition payments for students attending the night school programs
School Committee $ 25,000.00
School Vocational School 300
To fund cost of labor and materials for culinary program
Fees from 3rd party caterings and functions
School Committee $ 50,000.00
School E-Rate 300 Offset school utility costs
Rebates provided to help eligible schools and libraries obtain affordable telecommunications and internet access.
School Committee $ 50,000.00
School Building Rental 300
To cover costs of maintenance and labor during building rentals
Fees for rental of building by outside groups
School Committee $ 10,000.00 434
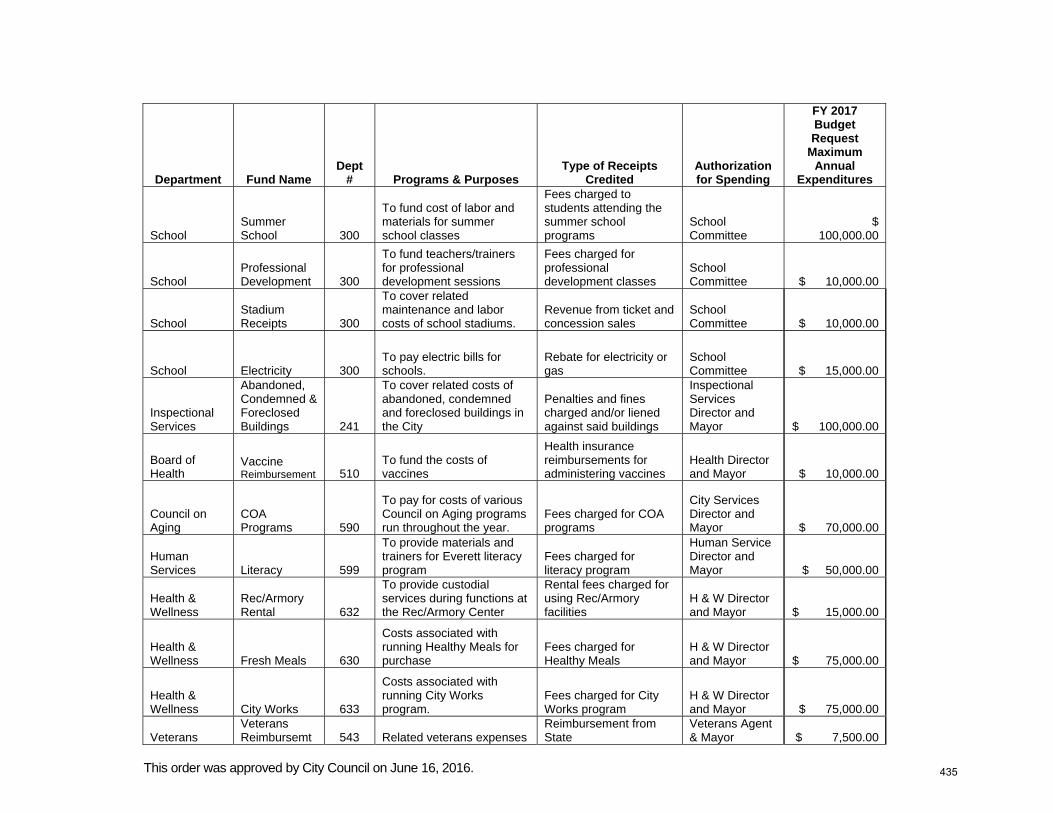
Department Fund Name Dept
# Programs & Purposes Type of Receipts
Credited Authorization for Spending
FY 2017 Budget Request
Maximum Annual
Expenditures
School Summer School 300
To fund cost of labor and materials for summer school classes
Fees charged to students attending the summer school programs
School Committee
$ 100,000.00
School Professional Development 300
To fund teachers/trainers for professional development sessions
Fees charged for professional development classes
School Committee $ 10,000.00
School Stadium Receipts 300
To cover related maintenance and labor costs of school stadiums.
Revenue from ticket and concession sales
School Committee $ 10,000.00
School Electricity 300 To pay electric bills for schools.
Rebate for electricity or gas
School Committee $ 15,000.00
Inspectional Services
Abandoned, Condemned & Foreclosed Buildings 241
To cover related costs of abandoned, condemned and foreclosed buildings in the City
Penalties and fines charged and/or liened against said buildings
Inspectional Services Director and Mayor $ 100,000.00
Board of Health
Vaccine Reimbursement 510
To fund the costs of vaccines
Health insurance reimbursements for administering vaccines
Health Director and Mayor $ 10,000.00
Council on Aging
COA Programs 590
To pay for costs of various Council on Aging programs run throughout the year.
Fees charged for COA programs
City Services Director and Mayor $ 70,000.00
Human Services Literacy 599
To provide materials and trainers for Everett literacy program
Fees charged for literacy program
Human Service Director and Mayor $ 50,000.00
Health & Wellness
Rec/Armory Rental 632
To provide custodial services during functions at the Rec/Armory Center
Rental fees charged for using Rec/Armory facilities
H & W Director and Mayor $ 15,000.00
Health & Wellness Fresh Meals 630
Costs associated with running Healthy Meals for purchase
Fees charged for Healthy Meals
H & W Director and Mayor $ 75,000.00
Health & Wellness City Works 633
Costs associated with running City Works program.
Fees charged for City Works program
H & W Director and Mayor $ 75,000.00
Veterans Veterans Reimbursemt 543 Related veterans expenses
Reimbursement from State
Veterans Agent & Mayor $ 7,500.00
This order was approved by City Council on June 16, 2016. 435
Organizational Structure
Departments and Functions The City’s revised organizational structure for FY 2017 provides the citizenry a visual of the overall structure of the organization. Organization responsibility codes (see below) are used in the organizational structure and in the organization chart to clearly identify the department, board, or committee (organizational unit) responsible for the management, oversight, and financial controls (functions). ORGANIZATIONAL UNIT RESPONSIBILITY CODES Organization department codes group departments in a series of numbers as follows:
100’s (General Government) 200’s (Public Safety) 300’s (Schools) 400’s (DPW) 500’s (Health and Human Services) 600’s (Library and Health & Wellness) 700’s (Debt) 800’s (Intergovernmental) 900’s (Unclassified)
ORGANIZATIONAL UNIT FUNCTIONS Functions are normally used to classify revenues and expenditures for external financial reporting. Classification of expenditures by organizational unit is essential to responsible accounting. The classification corresponds with the government unit's organizational structure.
436
GENERAL GOVERNMENT (100’s) Organization Responsibility codes 100‐199 are reserved for general government: 110 Legislative ‐ Expenditures related to the legislative operations of the community. Reporting units in this category include:
City Council (111) 120 Executive ‐ Expenditures related to the executive operations of the community. Reporting units in this category include:
Executive Office of Mayor (121)
130 Financial Administration ‐ Expenditures related to the financial administration of the community. Reporting units in this category include:
Office of the City Auditor (135), Office of Budgeting (137), Office of Purchasing & Procurement (138), Office of Assessing (141), Office of Treasurer/Collector (145)
150 Operations Support ‐ Expenditures related to the non‐financial administration of the community. Reporting units in this category include:
Office of the City Solicitor (151), Department of Human Resources (152), Department of Information Technology (155)
160 Licensing And Registration ‐ Expenditures related to the licensing and registration operations of the community. Reporting units in this category include:
City Clerk (161), Elections Commission (162), Voter Registrations (163), Licensing Commission (165)
170 Land Use ‐ Expenditures related to the management and control of land use within the community. Reporting units in this category include:
Conservation Commission (171), Planning Board/Department (175), Zoning/Board of Appeals (176)
437
PUBLIC SAFETY (200’s) Organization Responsibility codes 200‐299 are reserved for public safety: 210 Police ‐ Expenditures for law enforcement.
Police (210) 220 Fire ‐ Expenditures for preventing and fighting fires.
Fire (220) 240 Protective Inspection ‐ Expenditures related to the protective inspection operations of the community. Reporting units in this category include:
Department of Inspectional Services (242)
290 Other ‐ Expenditures related to public safety which doesn’t fall readily into one of the previous categories. Reporting units in this category include:
Parking (297) – Now rolled into the Police Department budget Emergency 911 (299)
D P W (400’s) Organizational Responsibility codes 400‐499 are reserved for the DPW (public works): 490 Department of Public Works ‐ Expenditures related to the construction, maintenance, and repair of highways and streets in the community. Reporting units in this category include:
Executive Division (490) Facilities Maintenance Division (491) Engineering Division (492)
438
Parks & Cemeteries Division (493) Stadium Division (494) Highway Division(495) Snow and Ice Division(496) Solid Waste Collection and Disposal (497)
HEALTH and HUMAN SERVICES (500’s) Organization Responsibility codes 500‐599 are reserved for health and human services: 510 Health Inspection Services ‐ Expenditures related to inspection and regulatory activities which contribute to the conservation and improvement of public health. Reporting units in this category include:
Department of Health and Human Services (510)
520 Planning and Community Development ‐ Expenditures related to activities which contribute to planning and community development. Reporting units in this category include:
Department of Planning & Development (521) 540 Special Programs ‐ Expenditures related to the provision of services to specific target groups within the general population. Reporting units in this category include:
Council on Aging (541) Office of Veterans' Services (543) Disability Commission (544)
590 Other ‐ Expenditures for human services which do not readily fall into one of the previous categories. Reporting units in this category include: Office of Human Services (599)
439
CULTURE AND RECREATION (600’s) Organization Responsibility codes 600‐699 are reserved for this subheading. 610 Library ‐ Expenditures related to the operation of a public library.
Department of Libraries (610) 630 Health & Wellness ‐ Expenditures related to the provision of recreational activities or the operation of recreational facilities.
Office of Health & Wellness (630)
690 Gaming Accountability & Development – Expenditures related to the costs associated with the statutory and regulatory requirements related to the City of Everett’s Host agreement with the Wynn Everett project and to oversee implementation and execution of provisions of the Host Community Agreement.
Gaming Accountability & Development (690) – No longer budgeted DEBT SERVICE (700’s) Organization Responsibility codes 700‐799 are reserved for this subheading. 710 Retirement Of Debt ‐ Principal ‐ Expenditures for periodic payments of principal amounts on local long term debt.
Long‐term Principal (710) 751 Interest ‐ Expenditures for periodic payments of interest amounts on local debt. Reporting units in this category include:
Long‐term Interest (751) Short‐term Interest (752)
440
UNCLASSIFIED (900’s) Organizational Responsibility codes 900‐999 and Intergovernmental Assessments are reserved for this subheading. 910 Employee Benefits ‐ Expenditures related to employee benefits not made directly to employee, but which are allocated to specific functions or organizations. Reporting units in this category include:
Retirement and Pension Contributions (911) Retirement and Pension Contributions ‐ Non‐Contributory (911) Worker's Compensation (912) Unemployment Compensation (913) Health, Life and AD&D Insurance (914) Medicare (916)
940 Other Miscellaneous ‐ Expenditures for miscellaneous items not allocated directly to specific functions or organizations. Reporting units in this category include:
Liability Insurance (945)
441
Glossary of Terms
Abatement – A complete or partial cancellation of a tax levy imposed by a governmental unit. Administered by the local board of assessors.
Accounting Period – A period at the end of which, and for which, financial statements are prepared. Also known as a fiscal period.
Accounting System – A system of financial record keeping that record, classify and report information on the financial status and operation of an organization.
Activity – A specific and distinguishable line of work performed by one or more organization components of a governmental unit for the purpose of accomplishing a function for which the governmental unit is responsible.
Adopted Budget – The resulting budget that has been approved by the City Council.
Allocation – The distribution of available monies, personnel, buildings and equipment among various City departments, divisions or cost centers.
Annual Budget – An estimate of expenditures for specific purposes during the fiscal year (July 1 – June 30) and the proposed means (estimated revenues) for financing those activities.
Appropriation – An authorization granted by the City Council to incur liabilities for purposes specified in the appropriation act.
Arbitrage – Investing funds borrowed at a lower interest cost in investments providing a higher rate of return.
Assessed Valuation – A valuation set upon real or personal property by the local board of assessors as a basis for levying taxes.
Audit – An examination of documents, records, reports, system of internal control, accounting and financial procedures to ensure that financial records are fairly presented and in compliance with all legal requirements for handling of public funds, including state and federal laws and the City charter.
442
Balanced Budget – A budget in which receipts are greater than (or equal to) expenditures. A requirement for all Massachusetts cities and towns.
Bond Anticipation Notes (BAN) – Notes issued in anticipation of later issuance of bonds, usually payable from the proceeds of the sale of the bonds or renewal notes.
Budget – A plan of financial operation embodying an estimate of proposed expenditures for a given time period and the proposed means of financing them. The term usually indicates a financial plan for a single fiscal year.
Budget Calendar – A schedule of certain steps to be followed in the budgeting process and the dates by which each step must be complete.
Budget Document – The instrument used by the Mayor to present a comprehensive financial program to the appropriating body.
Budget Message – A general discussion of the submitted budget presented in writing by the Mayor to the legislative body as part of the budget document.
Capital Budget – A plan of proposed outlays for acquiring long‐term assets and the means of financing those acquisitions during the current fiscal period.
Capital Improvement Program (CIP) – A plan for capital expenditure to be incurred each year over a fixed period of years to meet capital needs arising from the long term work program. It sets forth each project and specifies the full resources estimated to be available to finance the projected expenditures.
Charges for Service (Also called User Charges or Fees) – The charges levied on the users of particular goods or services provided by local government requiring individuals to pay for the private benefits they receive. Such charges reduce the reliance on property tax funding.
Cherry Sheet – A form showing all state and county charges and reimbursements to the City as certified by the state director of accounts. Years ago this document was printed on cherry colored paper, hence the name. A copy of this manual can be found at the following online address: http://www.mass.gov/Ador/docs/dls/cherry/CSManual.pdf
443
Community Preservation Act (CPA) – The CPA allows communities to create a local Community Preservation Fund to raise money through a surcharge of up to 3% of the real estate tax levy on real property for open space protections, historic preservation and the provision of affordable housing. The act also creates a significant state matching fund, which serves as an incentive to communities to pass the CPA.
Cost Center – The lowest hierarchical level of allocating monies. Often referred to as a program, project or operation.
Debt Limits – The general debt limit of a City consists of normal debt limit, which is 2 ½ percent of the valuation of taxable property and a double debt limit which is 5% of that valuation. Cities and towns may authorize debt up to the normal limit without state approval. It should be noted that there are certain categories of debt which are exempt from these limits.
Debt Service – Payment of interest and repayment of principal to holders of a government’s debt instruments.
Deficit or Budget Deficit – The excess of budget expenditures over receipts. City and State laws require a balanced budget.
Department – A principal, functional and administrative entity, created by statute and the mayor to carry out specified public services.
Encumbrance – An account used to record the estimated amount of purchase orders, contract, or salary commitments chargeable to an appropriation. The account is credited when goods or services are received and the actual expenditure of the appropriation is known.
Enterprise Fund – A fund established to account for operations that are financed and operated in a manner similar to private business enterprises. The intent is that the full costs of providing the goods or services be financed primarily through charges and fees thus removing the expenses from the tax rate. Governmentally owned utilities and hospitals are ordinarily accounted for by enterprise funds.
Equalized Value (EQV) – The commissioner of revenue, in accordance with MGL CH. 58 Section 10C, is charged with the responsibility of biannually determining an equalized valuation for each city and town in the Commonwealth. EQVs present an estimate of fair cash value of all taxable property in each city and town as of January 1 of each year (MGL CH. 58, Sections 9 & 10C). The EQV is a measure of the relative property wealth in each municipality. Its purpose is to allow for comparisons of municipal
444
property values at one point in time, adjusting for differences in local assessing practices and revaluation schedules. EQVs have historically been used as a variable in the allocation of certain state aid distributions, the calculation of various state and county assessments to municipalities, and the determination of municipal debt limits. EQVs are used in some distribution formulas to that communities with lower property values receive proportionately more aid than those with higher property values. In some assessment formulas they are used so that those with lower property values assume proportionately less of the cost than communities with higher property values. The local aid receipt programs using EQV are: Public Libraries, Chapter 70, and School Construction Aid. The assessments using EQV are: Boston’s Metropolitan Transit Districts, the Count Tax, Mosquito Control Projects and Air pollution Control Districts. A municipality’s annual EQV is the sum of estimated fair market value for each property class plus an estimate of new growth, resulting in values indicative of January 1.
Exemptions – A statutory reduction in the assessed valuation of taxable property accorded to certain taxpayers, such as senior citizens, widows, and war veterans.
Expenditures – The amount of money, cash or checks, actually paid or obligated for payment from the treasury when liabilities are incurred pursuant to authority given in an appropriation.
Financial Accountability – The obligation of government to justify the raising of public resources and what those resources were expended for.
Financial Condition – The probability that a government will meet its financial obligations as they become due and its service obligations to constituencies, both currently and in the future.
Financing Plan – The estimate of revenues and their sources that will pay for the service programs outlined in the annual budget.
Fiscal Period – Any period at the end of which a governmental unit determines its financial position and the results of its operations.
Fiscal Year – The 12 month financial period used by all Massachusetts municipalities which begins July 1st and ends June 30th of the following calendar year. The year is represented by the date on which it ends. Example: July 1, 2016 to June 30, 2017 would be FY 17.
445
Fixed Asset – Assets of a long‐terms character that are intended to continue to be held or used, such as land, buildings, machinery, furniture and other equipment.
Full and Fair Market Valuation – The requirement, by State Law, that all real and personal property be assessed at 100% of market value for taxation purposes. “Proposition 2 ½” laws set the City’s tax levy limit at 2 ½% of the full market (assessed) value of all taxable property.
Fund – A fiscal and accounting entity with a self‐balancing set of accounts recording cash and other financial resources, together with all related liabilities, and residual equities or balances, and changes therein, which are segregated for the purpose of carrying on specific activities or attaining certain objectives in accordance with special regulations, restrictions or limitations.
Fund Balance – The portion of Fund Equity available for appropriation.
Fund Equity – The excess of fund assets and resources over fund liabilities. A [portion of the equity of a governmental fund may be reserved or designated; the remainder is referred to as Fund Balance.
General Fund – A fund used to account for all transactions of a governmental unit that are not accounted for in another fund. The General Fund is used to account for the ordinary operations of a governmental unit that are financed from taxes and other general revenues.
Government Accounting Standards Board (GASB) – The Governmental Accounting Standards Board (GASB) was organized in 1984 as an operating entity of the Financial Accounting Foundation (FAF) to establish standards of financial accounting and reporting for state and local governmental entities. Its standards guide the preparation of external financial reports of those entities. The Foundation’s Trustees are responsible for selecting the members of the GASB and its Advisory Council, funding their activities and exercising general oversight, with the exception of the GASB resolution of technical issues. The GASB function is important because external financial reporting can demonstrate financial accountability to the public and is the basis for investment, credit and many legislative and regulatory decisions. The mission of the Governmental Accounting Standards Board is to establish and improve standards of state and local governmental accounting and financial reporting that will result in useful information for users of financial reports and guide and educate the public, including issuers, auditors, and users of those financial reports. More information, including all statements, can be found at www.gasb.org.
446
Grant – A contribution of assets by one governmental unit to another unit. Typically, these contributions are made to local governments from the state and federal government. The contribution is usually made to aid in the support of a specified function (for example, education), but it is sometimes also for general purposes, or for the acquisition or construction of fixed assets.
Group Insurance Commission (GIC) – The group insurance commission was established by the Legislature in 1955 to provide and administer health insurance and other benefits to the Commonwealth of Massachusetts employees and retirees, and their dependents and survivors. The GIC also covers housing and redevelopment authorities’ personnel, participating municipalities and retired municipal employees and teachers in certain governmental units.
Inter‐fund Transactions – Payments from one administrative budget fund to another or from one trust fund to another, which result in the recording of a receipt and an expenditure.
Intra‐fund Transactions – Financial transactions between activities within the same fund. An example would be a budget transfer.
Levy – The amount of taxes, special assessments, or service charges imposed by a governmental unit.
Levy Ceiling – The limit imposed by Proposition 2 ½ that equals 2 ½% of the total full and fair cash value of all taxable property.
Levy Limit – The amount that a municipality may raise in taxes each year which is based on the prior year’s limit plus 2 1.2 % increase on that amount plus the amount certified by the State that results from “new growth”.
License and Permit Fees – The charges related to regulatory activities and privileges granted by government in connections with regulations.
Line‐item Budget – A format of budgeting which organizes costs by object of expenditure such as supplies, equipment, maintenance or salaries.
MBTA‐Massachusetts Bay Transportation Authority – The Massachusetts Bay Transportation Authority is the state authority responsible for all aspects of transportation throughout the Commonwealth of Massachusetts. A description of the assessment charged to municipalities can be found in the cherry sheet manual located online at: http://www.mass.gov/Ador/docs/dls/cherry/CSManual.pdf.
447
MGL‐Massachusetts General Law – The General Laws of the Commonwealth of Massachusetts. These laws can be found at http://www.mass.gov/legis/.
MSBA‐Massachusetts School Building Authority – The MSBA is the state authority that oversees all school building projects and funding. The web site is www.mass.gov/msba.
Modified Accrual Basis – Under the modified accrual basis of accounting, required for use by governmental funds, revenue are recognized in the period in which they become available and measurable, and expenditures are recognized at the time a liability is incurred pursuant to appropriation authority.
New Growth – The additional tax revenue generated by new construction, renovations, and other increases in the property tax base during a calendar year.
Non‐expendable Trust Fund – A fund, the principal, and sometimes also the earnings, of which may not be expended.
Non‐Tax Revenue – All revenue coming from non‐tax sources including licenses and permits, intergovernmental revenue, charges for service, fines and forfeits and various other miscellaneous revenue.
Other Financing Sources (OFS) – An operating statement classification in which financial inflows other than revenues are reported, for example, proceeds of long‐term debt and operating transfers‐in.
Other Financing Uses (OFU) – An Operating statement classification in which financial outflows other than expenditures are reported, for example, operating transfers‐out.
Operating Budget – A budget that applies to all outlays other than capital outlays. See Budget.
Overlay – The amount raised by the assessors in excess of appropriation and other charges for the purpose of creating a fund to cover abatements and exemptions.
Overlay Surplus – Any balance in the overlay account of a given year in excess of the amount remaining to be collected or abated can be transferred into this account. Overlay surplus may be appropriated for any lawful purpose.
448
Performance Indicator – Variables measuring the degree of goal and objective fulfillment achieved by programs.
Performance Standard – A statement of the conditions that will exist when a job is well done.
PILOT‐Payment in Lieu of Taxes – Money received from exempt (non‐profit) organizations who are otherwise not obligated to pay property taxes. Federal, state, municipal facilities, hospitals, churches and colleges are examples of tax exempt properties.
Policy – A definite course of action adopted after a review of information and directed at the realization of goals.
Priority – A value that ranks goals and objectives in order of importance relative to one another.
Procedure – A method used in carrying out a policy or plan of action.
Program – Collections of work related activities initiated to accomplish a desired end.
Program Budget – A budget format which organizes expenditures and revenues around the type of activity or service provided and specifies the extent or scope of service to be provided, stated whenever possible in precise unites of measure.
Proposition 2 ½ ‐ A law which became effective on December 4, 1980. The two main components of the tax law relating to property taxes are: 1) the tax levy cannot exceed 2 ½% of the full and fair cash value, and 2) for cities and towns at or below the above limit, the tax levy cannot exceed the maximum tax levy allowed for the prior by more than 2 ½% (except in cases of property added to the tax rolls and for valuation increases of at least 50% other than as part of a general revaluation).
Purchase Order – A document issued to authorize a vendor or vendors to deliver specified merchandise or render a specified service for a stated estimated price. Outstanding purchase orders are called encumbrances.
Rating Agencies – This term usually refers to Moody’s Investors Service and Standard and Poor’s Corporation. These services are the two major agencies which issue credit ratings on municipal bonds.
Registered Bonds – Bonds that are registered on the books of the issuer as to ownership; the transfer of ownership must also be recorded on the books of the issuer. Recent changes in federal tax laws mandate that all municipal bonds be registered if their tax exempt status is to be retained.
449
Reserves – An account used to indicate that portion of fund equity which is legally restricted for a specific purpose or not available for appropriation and subsequent spending.
Reserve for Contingencies – A budgetary reserve set aside for emergencies or unforeseen expenditures not otherwise budgeted for.
Retained Earnings – The accumulated earnings of an Enterprise or Internal Service Fund that have been retained in the fund and are not reserved for any specific purpose.
Revenue – Additions to the City’s financial assets (such as taxes and grants) other than from interfund transfers and debt issue proceeds.
Revolving Fund – A fund established to finance a continuing cycle of operations in which receipts are available for expenditure without further action by the City Council.
RMV‐Registry of Motor Vehicles – The Registry of Motor Vehicles in Massachusetts is responsible for all aspects of motor vehicles including but not limited to registration, sales tax, and licensing.
Service Level – The extent or scope of the City’s service to be provided in a given budget year. Whenever possible, service levels should be stated in precise units of measure.
Special Revenue Fund (SRF) – A fund used to account for revenues from specific revenue sources that by law are designed to finance particular functions or activities of government.
Submitted Budget – The proposed budget that has been approved by the mayor and forwarded to the City Council for their approval. The City Council must act upon the submitted budget within prescribed guidelines and limitations according to statute and the City Charter.
Supplemental Appropriations – Appropriation’s requested by the Mayor and approved by the City Council after an initial appropriation to cover expenditures beyond original estimates.
450
Tax Anticipation Notes (TAN) – Notes issued in anticipation of collection of taxes, usually retired only from tax collections, and only from the proceeds of the tax levy whose collection they anticipate.
Tax Levy – The amount of taxes, special assessments, or service charges imposed by a governmental unit.
Tax Rate – The amount of tax stated in terms of a unit of the tax base. Prior to a 1978 amendment to the Massachusetts Constitution, a single tax rate applied to all of the taxable real and personal property in a city or town. The 1978 amendment allowed the legislature to create three classes of taxable property: 1) residential real property, 2) open space land and 3) all other (commercial, industrial and personal property). Within limits, cities and towns are given the option of determining the share of the levy to be borne by the different classes of property. The share borne by residential real property must be at least 65% of the full rate. The share of commercial, industrial, and personal property must not exceed 150% of the full rate. Property may not be classified until the State Department of Revenue has certified that all property has been assessed at its full value.
Unit Cost – A term used in cost accounting to denote the cost of producing a unit of product or rendering a unit of service, for example, the cost of treating and purifying a thousand gallons of sewage.
Valuation (100%) – Requirement that the assessed valuation must be the same as the market value for all properties.
Warrant – An order drawn by a municipal officer directing the treasurer of the municipality to pay a specified amount to the bearer, either after the current or some future date.
Warrant Payable – The amount of warrants outstanding and unpaid.
451


