Embed Size (px)
Citation preview

Frustrated Crystallization in the Coupled Viscoelastic Phase SeparationWeichao Shi,† Xu-Ming Xie,‡ and Charles C. Han*,†
†Beijing National Laboratory for Molecular Sciences, Joint Laboratory of Polymer Science and Materials, Institute of Chemistry,Chinese Academy of Sciences, Beijing 100190, China‡Department of Chemical Engineering, Tsinghua University, Beijing 100084, China
ABSTRACT: The interplay between crystallization and phase separation has been intensively studied recently. In this study, weextended the research into a dynamically asymmetric blend composed of amorphous poly(methyl methacrylate) (PMMA) andcrystalline poly(ethylene oxide) (PEO). The large dynamic asymmetry induces network stress in concentration growth. We findthat crystallization is seriously frustrated when it couples with a simultaneous viscoelastic phase separation. In a single quenchexperiment, normal spherulites grew in a limited temperature range when crystallization was faster, while crystallization wasfrustrated at deep quenches when phase separation was faster. In a double quench experiment, crystallization was more difficultto occur after the prior phase separation at a higher temperature. The calorimetric results indicated that both meltingtemperatures and enthalpies of crystallization decreased in the coupled viscoelastic phase separation. We propose that it is thenetwork stress in the concentration growth that leads to the frustration of crystallization.
■ INTRODUCTION
Crystalline materials cover a large portion of polymer family, andthe phase transition of crystallization has been intensivelystudied.1−7 For polymer blends, since most polymer mixturesare thermodynamically immiscible, therefore the dual transitionsof crystallization and phase separation often occurs interactively.Revealing the mechanism of the coupled two competing phasetransitions could help controlling the morphology of the materialsand may lead to optimized structures and properties.For the liquid−liquid phase separation, polymer systems are
usually difficult to reach the final equilibrium state because of largeviscosity. For the liquid−solid phase transition of crystallization, themorphology is frozen as soon as the liquid/melt crystallizes. Whenthese two transitions take place simultaneously, there couldpossibly be a large variety of pattern formations.8−12 Here we notethat the competing dynamic pathway plays the key role in the finalpattern formation.As a prerequisite, all phase transitions proceed in the frame-
work of thermodynamics. When phase separation (with anupper critical solution temperature, for example) couples withcrystallization, there are typically two kinds of phase diagrams.The type 1 phase diagram is that phase separation region locatesfully beneath the equilibrium melting line of crystallization. Thistype of phase diagram has rarely been investigated and lacks aquantitative determination of the phase boundary.13−15 The type 2
phase diagram is that phase separation region locates partiallyabove and partially below the equilibrium melting line of cry-stallization. The upper part of the phase diagram can be welldetermined, and some typical systems (PEH/PEB, PS/PCL,PCL/PEG) have been reported before.8,16,17
Versatile morphologies are determined under the combinedeffect of thermodynamics and dynamic pathway. We may givea short review of the current research in the framework of thetype 2 phase diagram (Figure 1).2,16 It should be pointed outthat this schematic phase diagram is drawn based on an implicitassumption: crystallization and phase separation occur individuallynot interactively. Strictly speaking from a thermodynamic pointof view, the phase diagram of the coupled phase transitions inpolymer blends should not be different from that in metals orsmall molecules. There are several good calculation papers on thistopic.18−22 However, the compromise has to be made because ofdynamic factors in practical experiment, as will be illustrated later.There are typically three dynamic lines: line BCD indicates
the melting line of crystallization, line HAG is the phase separationbinodal line, and the cyan curve is the spinodal line whichrepresents the thermodynamic unstable limit. Point A corresponds
Received: July 29, 2012Revised: September 26, 2012Published: October 11, 2012
Article
pubs.acs.org/Macromolecules
© 2012 American Chemical Society 8336 dx.doi.org/10.1021/ma301592a | Macromolecules 2012, 45, 8336−8346
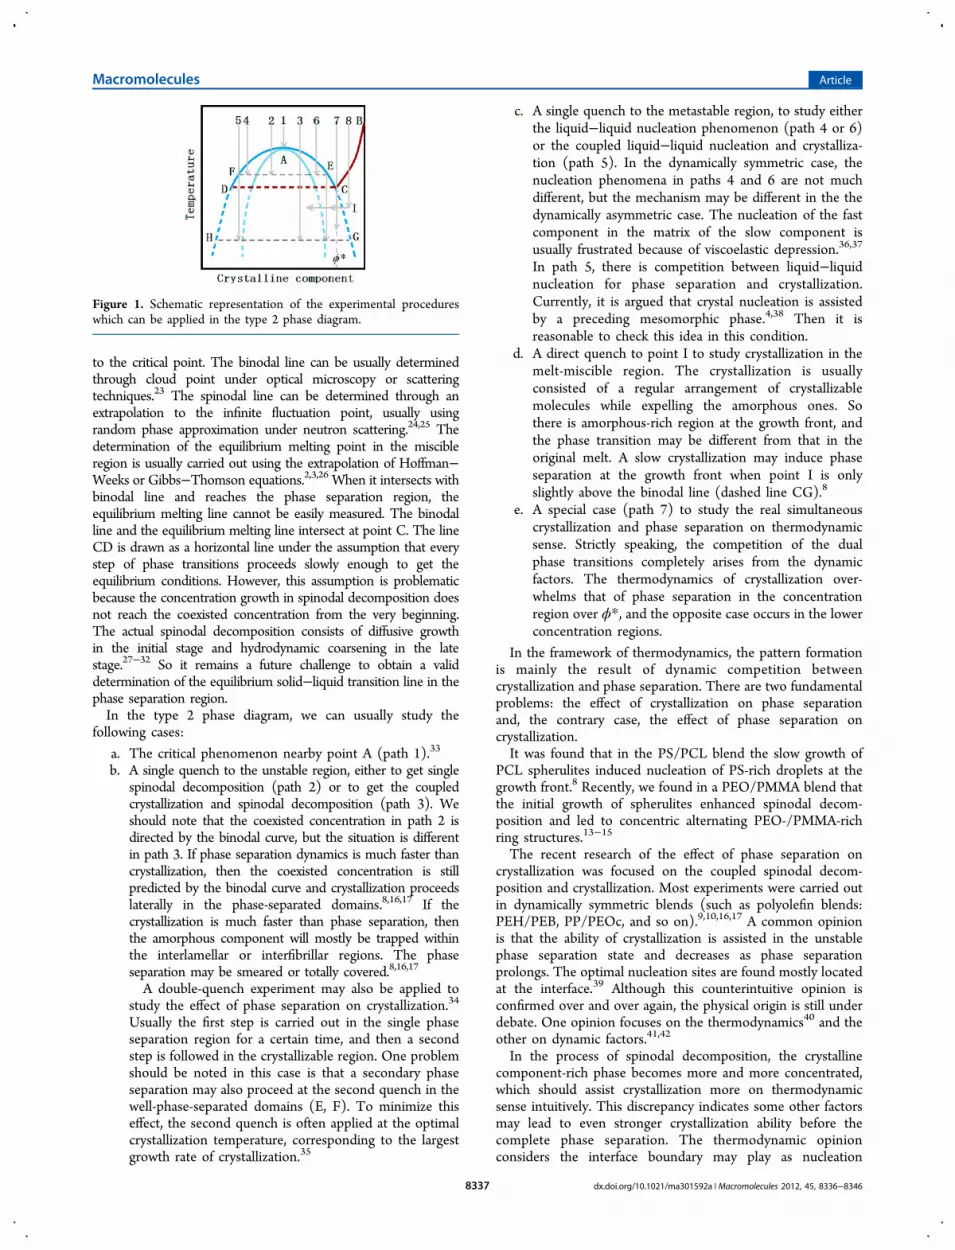
to the critical point. The binodal line can be usually determinedthrough cloud point under optical microscopy or scatteringtechniques.23 The spinodal line can be determined through anextrapolation to the infinite fluctuation point, usually usingrandom phase approximation under neutron scattering.24,25 Thedetermination of the equilibrium melting point in the miscibleregion is usually carried out using the extrapolation of Hoffman−Weeks or Gibbs−Thomson equations.2,3,26 When it intersects withbinodal line and reaches the phase separation region, theequilibrium melting line cannot be easily measured. The binodalline and the equilibrium melting line intersect at point C. The lineCD is drawn as a horizontal line under the assumption that everystep of phase transitions proceeds slowly enough to get theequilibrium conditions. However, this assumption is problematicbecause the concentration growth in spinodal decomposition doesnot reach the coexisted concentration from the very beginning.The actual spinodal decomposition consists of diffusive growthin the initial stage and hydrodynamic coarsening in the latestage.27−32 So it remains a future challenge to obtain a validdetermination of the equilibrium solid−liquid transition line in thephase separation region.In the type 2 phase diagram, we can usually study the
following cases:
a. The critical phenomenon nearby point A (path 1).33
b. A single quench to the unstable region, either to get singlespinodal decomposition (path 2) or to get the coupledcrystallization and spinodal decomposition (path 3). Weshould note that the coexisted concentration in path 2 isdirected by the binodal curve, but the situation is differentin path 3. If phase separation dynamics is much faster thancrystallization, then the coexisted concentration is stillpredicted by the binodal curve and crystallization proceedslaterally in the phase-separated domains.8,16,17 If thecrystallization is much faster than phase separation, thenthe amorphous component will mostly be trapped withinthe interlamellar or interfibrillar regions. The phaseseparation may be smeared or totally covered.8,16,17
A double-quench experiment may also be applied tostudy the effect of phase separation on crystallization.34
Usually the first step is carried out in the single phaseseparation region for a certain time, and then a secondstep is followed in the crystallizable region. One problemshould be noted in this case is that a secondary phaseseparation may also proceed at the second quench in thewell-phase-separated domains (E, F). To minimize thiseffect, the second quench is often applied at the optimalcrystallization temperature, corresponding to the largestgrowth rate of crystallization.35
c. A single quench to the metastable region, to study eitherthe liquid−liquid nucleation phenomenon (path 4 or 6)or the coupled liquid−liquid nucleation and crystalliza-tion (path 5). In the dynamically symmetric case, thenucleation phenomena in paths 4 and 6 are not muchdifferent, but the mechanism may be different in the thedynamically asymmetric case. The nucleation of the fastcomponent in the matrix of the slow component isusually frustrated because of viscoelastic depression.36,37
In path 5, there is competition between liquid−liquidnucleation for phase separation and crystallization.Currently, it is argued that crystal nucleation is assistedby a preceding mesomorphic phase.4,38 Then it isreasonable to check this idea in this condition.
d. A direct quench to point I to study crystallization in themelt-miscible region. The crystallization is usuallyconsisted of a regular arrangement of crystallizablemolecules while expelling the amorphous ones. Sothere is amorphous-rich region at the growth front, andthe phase transition may be different from that in theoriginal melt. A slow crystallization may induce phaseseparation at the growth front when point I is onlyslightly above the binodal line (dashed line CG).8
e. A special case (path 7) to study the real simultaneouscrystallization and phase separation on thermodynamicsense. Strictly speaking, the competition of the dualphase transitions completely arises from the dynamicfactors. The thermodynamics of crystallization over-whelms that of phase separation in the concentrationregion over ϕ*, and the opposite case occurs in the lowerconcentration regions.
In the framework of thermodynamics, the pattern formationis mainly the result of dynamic competition betweencrystallization and phase separation. There are two fundamentalproblems: the effect of crystallization on phase separationand, the contrary case, the effect of phase separation oncrystallization.It was found that in the PS/PCL blend the slow growth of
PCL spherulites induced nucleation of PS-rich droplets at thegrowth front.8 Recently, we found in a PEO/PMMA blend thatthe initial growth of spherulites enhanced spinodal decom-position and led to concentric alternating PEO-/PMMA-richring structures.13−15
The recent research of the effect of phase separation oncrystallization was focused on the coupled spinodal decom-position and crystallization. Most experiments were carried outin dynamically symmetric blends (such as polyolefin blends:PEH/PEB, PP/PEOc, and so on).9,10,16,17 A common opinionis that the ability of crystallization is assisted in the unstablephase separation state and decreases as phase separationprolongs. The optimal nucleation sites are found mostly locatedat the interface.39 Although this counterintuitive opinion isconfirmed over and over again, the physical origin is still underdebate. One opinion focuses on the thermodynamics40 and theother on dynamic factors.41,42
In the process of spinodal decomposition, the crystallinecomponent-rich phase becomes more and more concentrated,which should assist crystallization more on thermodynamicsense intuitively. This discrepancy indicates some other factorsmay lead to even stronger crystallization ability before thecomplete phase separation. The thermodynamic opinionconsiders the interface boundary may play as nucleation
Figure 1. Schematic representation of the experimental procedureswhich can be applied in the type 2 phase diagram.
Macromolecules Article
dx.doi.org/10.1021/ma301592a | Macromolecules 2012, 45, 8336−83468337

substrate to induce heterogeneous crystallization. Although thecrystalline component-rich phase becomes concentrated, theheterogeneous effect becomes less as interfacial area decreases.The dynamic opinion postulates concentration fluctuationmay induce local conformational ordering to assist crystal-lization. The fluctuation strength decreases as phase separationprolongs.In the conventional studies of phase separation, component
molecules have nearly equal mobility and usually relax muchfaster than concentration growth. However, the more typicalcase is that the component molecules have unmatcheddynamics, that is, the dynamic asymmetry. The fast componentresponses to a perturbation immediately, while the slowcomponent falls behind. This induces an internal networkstress mainly sustained by the slow component and the networkstress will feed back to mediate the molecular diffusion. Thisis known as stress-diffusion coupling.33,43−45 So it leads to thecentral issue of the present study that how crystallization willproceed when it is coupled with the viscoelastic phase separa-tion in dynamically asymmetric blends?We deliberately build up dynamic asymmetry by employing
a slow amorphous component of poly(methyl methacrylate)(PMMA) and a fast crystalline component of poly(ethyleneoxide) (PEO). The large dynamic asymmetry arises from about180 °C apart of glass transition temperatures.
■ THEORETICAL BACKGROUNDPolymer crystals usually grow into stacked layers. The growth inthe extensional direction is limited because of chemicalconnection, which leads to melting point depression of crystals.The Gibbs−Thomson equation gives the classical description:1−3
σ= −Δ
⎛⎝⎜
⎞⎠⎟T T
L H1
1 2m m
0
c m0
(1)
Lc is the lamellar thickness, ΔHm0 the melting enthalpy, and σ the
interfacial energy. Tm corresponds to the melting temperature ofcrystal with finite size and Tm
0 the equilibrium melting temperaturewith infinite size.If the lateral crystal thickness Lc is β times (β > 1) of the
primary critical nuclei Lmin, then
β βσ
= =Δ −
⎡⎣⎢
⎤⎦⎥L L
TH T T
2 1c min
m0
m0
m0
c (2)
Combine eq 1 with eq 2; then it leads to Hoffman−Weeksequation:26
β β= − +
⎛⎝⎜
⎞⎠⎟
⎛⎝⎜
⎞⎠⎟T T T1
1 1m m
0c
(3)
For constant β, there is a linear relationship between Tm and Tc.Tm0 is usually obtained through extrapolation when Tm = Tc.Thermodynamics of crystallization is different for the
crystalline component in polymer blends and in neat melt.By considering Flory−Huggins description of free energy, thethermodynamic contribution to melting point depression isrevealed by Nishi−Wang equation:46
ϕϕ χϕ
χϕ
− = −Δ
+ − +
≅ −Δ
⎡⎣⎢⎢
⎛⎝⎜
⎞⎠⎟
⎤⎦⎥⎥T T
RH
VV N N N
RH
VV
1 1 ln 1 1
m,b0
m0
m0
2u
1u
2
2 2 11 1
2
m0
2u
1u1
2
(4)
Tm,b0 is the equilibrium melting temperature of a given blend,
Tm0 is the equilibrium melting temperature of the neat
crystalline polymer, Ni (i = 1 corresponds to the amorphouscomponent and i = 2 the crystalline one) is the degree ofpolymerization, Viu is the molar volume of the repeating units,ϕi is the volume fraction, and χ is the interaction parameter.The contribution from the entropy is very small and is usuallyneglected. So the melting point depression is mainly the resultof attractive interaction between crystalline polymer anddiluents in miscible conditions. In immiscible conditionswhere χ > 0, the melting point should be even higher thanthe equilibrium temperature, which is quite questionable. Wenote that the application of Nishi−Wang equation inimmiscible conditions is implicitly under the prerequisite thatcrystallization should be much faster than phase separation.The usual procedure to obtain melting point depression inmiscible blend is to consider limited lamellar thickness via theHoffman−Weeks extrapolation before considering thermody-namic effects in the Nishi−Wang equation. In addition, a verycrude estimation on interaction parameter can be achieved inthis procedure.Of course, the relationship between melting temperature Tm,b
and equilibrium melting temperature Tm,b0 in polymer blends
also follows the Gibbs−Thomson relationship:
σ= −Δ
⎛⎝⎜⎜
⎞⎠⎟⎟T T
L H1
1 2m,b m,b
0
c,b m0
(5)
Suppose the interfacial energy does not alter upon blending;then melting temperature decrease in blends from purepolymer is expressed like47
σΔ = − = − +Δ
−⎛⎝⎜⎜
⎞⎠⎟⎟T T T T T
H
T
LTL
( )2
m m m,b m0
m,b0
m0
m,b0
c,b
m0
c
(6)
Accordingly, the difference in melting point is composed of twoparts: one arises from thermodynamic depression (the firstterm) and the other mainly lamellar thickness.
■ EXPERIMENTAL SECTIONMaterials. PMMA and PEO were purchased from Aladdin Reagent
Inc. and Alfa-Aesar Chemcal Co., respectively. The weight-averagemolecular weight for PMMA and PEO are 100 and 24 kg/mol, whichwere determined by gel permeation chromatography. The polydisper-sity for PMMA and PEO are 1.78 and 1.52, respectively. The materialswere used after purification. The glass transition temperatures ofPMMA and PEO were found to be about 116 and −60 °C,respectively, using a differential scanning calorimeter (DSC, TAQ2000) at a heating rate of 10 °C/min.
Film Preparation. PMMA and PEO were dissolved in chloroformwith 5% of polymer by total weight. The solution was stirred at roomtemperature over 24 h and then casted on a clean glass plate. Thesolvent was quickly evaporated at 60 °C (humidity <5%), and thesample was further dried at 140 °C for 30 min. The film thickness waskept at about 5 μm. To be consistent, all calorimetric samples wereprepared by exfoliating the film from glass plates after annealing.
Optical Microscopy. The phase contrast optical microscopy(PCOM) and polarized optical microscopy (POM) were carried outusing an Olympus (BX51) optical microscope, and the data wererecorded with an Olympus (C-5050ZOOM) camera. The opticalmicroscopy was schematically illustrated in a previous paper.15 Theexperimental temperature was controlled by a Linkam (LTS350) hotstage.
Scanning Electron Microscopy. Samples were observed underSEM (JEOL JSM 6700F) after coating with platinum.
Macromolecules Article
dx.doi.org/10.1021/ma301592a | Macromolecules 2012, 45, 8336−83468338

■ RESULTS AND DISCUSSION
Phase Diagram and Dynamic Melting Line. The phasediagram is presented in Figure 2. The glass transition
temperatures were measured by DSC with a heating rate of10 °C/min. Because of nearly 180 °C apart of glass transitiontemperatures between PMMA and PEO, the glass transitioncurve has strong concentration dependence.The phase separation binodal line was measured under
optical microscopy. Because of the large contrast in molecularweights, the phase boundary is highly asymmetric. The criticalweight fraction is estimated around 0.2 and critical temperatureabout 135 °C.The phase separation dynamics can be largely mediated
with respect to concentration and temperature. By decreasingthe content of PEO, the phase transition dynamics slowsdown drastically. For a certain composition (PEO content at0.9, for example), the phase separation dynamics is anomalousat different temperatures. Phase separation dynamics is fastat high temperatures (above 100 °C) while there is a long“frozen” period before fast concentration growth at inter-mediate temperatures (near room temperatures). At very deepquenches (−30 to −50 °C), the phase separation returns tobe fast again because of the thermodynamic dominance. Thedetailed phase separation dynamics was reported in details in arecent paper.48
Strictly speaking, a thermodynamic equilibrium melting linefor PEO cannot be obtained in this study because crystallizationand phase separation overlap in a large temperature range.Instead, we determined a dynamic melting line by DSC(Figure 3). The samples were quenched from the miscible stateto −70 °C with a cooling rate of 10 °C/min and then followedby a heating rate of 10 °C/min in a reversed procedure. Wecan monitor the heat flow in the crystallization and meltingprocesses. The ability of crystallization was strong for neatPEO, corresponding to high crystallization/melting temper-ature and large enthalpy. But crystallization became difficult assoon as PMMA was introduced into the system. When PMMAcontent reached 7%, there was no apparent crystallization in thecooling run but a cold crystallization emerged in the heatingrun. We note that crystallization/melting temperature as well asenthalpy decreased dramatically as PMMA content increased.
When PMMA content was over 10%, we cannot observe anycrystallization indication in the dynamic calorimetric measure-ment. Therefore, we present the crystallization is confined intoa very small region in the phase diagram.In the previous studies, a type 1 phase diagram was obtained
by employing a small molecular weight of PMMA (Mw =15 kg/mol) and PEO (Mw = 20 kg/mol).14 We reported veryslight melting point depression which lied between 65 and70 °C in the large melt-miscible region. As the molecularweight of PEO is not much different in this study, the meltingphenomenon should not be different under the assumption thatthere is no interaction between crystallization and phase separa-tion. However, the experimental results actually indicate thatviscoelastic phase separation does strongly affect crystallization.We will give detailed investigations and explanation oncrystallization in the following sections.
Single Quench Experiment. To start with, we will showthe strong crystallization ability of a neat PEO. We preparedPEO melt on a hot stage and then quickly transferred it toanother hot stage which was kept at −60 °C. Although theglass transition of PEO is about −60 °C, we observed a veryquick growth of PEO spherulites and regular Maltese cross(Figure 4). The strong ability of crystallization led PEOcrystallize quickly before the sample reached −60 °C under thelimitation of heat transfer.When only 2% of PMMA was introduced into the system, in
contrast, the situation became different (Figure 5). At 40 °C,crystallization took place slowly with irregular shapes and finallystopped growing when phase separation occurred in the outerregions. Crystals cannot fill the whole space, and we note thatcrystallization cannot occur in the phase-separated regions evenafter a long time of annealing. At the intermediate temperatures(−40 to 30 °C), regular spherulites with Maltese cross grewquickly in the sample and covered the whole space. At −50 °C,crystallization and phase separation occurred simultaneously.Regular spherulites only covered a part of the space, andsmall irregular crystallites emerged in the phase-separateddomains. Even at −60 °C, we still observed the dual phasetransitions because of slow heat transfer. Phase separationoccurred first with all crystallites growing in the well-phase-separated domains. Here we show that the crystallization ofPEO is seriously affected by even such a minor introduction ofPMMA of 2%.When the PMMA content was increased to 5%, more
variations of patterns can be formed under the interplaybetween crystallization and phase separation.At a shallow quench (40 °C), crystallization dominated the
initial stage and the role of phase separation emerged laterally(Figure 6). Compact spherulites grew initially with longfibrillars in the radial direction. As spherulites grew larger,there was apparent concentration growth in other regions.Then, small crystal stacks grew at the growth front and finallystopped growing. Spherulites cannot cover the full space at last.Phase transition dynamics became fast at lower temperatures,
and morphology can be fixed in a short time. At 30 °C,compact spherulites grew with smooth surface (Figure 7a).Between −20 and 20 °C, we got compact sperulites withrippling surfaces (Figure 7b,c). We will discuss this structurelater. At −30 °C, crystallization and phase separation occurredsimultaneously (Figure 7d). Compact spherulites with wavysurfaces cannot cover the whole sight, and the other regionswere occupied by phase-separated domains (similar toFigure 6d). At −40 °C, phase separation became dominating,
Figure 2. Phase diagram of the PEO/PMMA blend in this study. Theblue squares indicate the phase separation boundary; the gray circlesindicate the glass transition temperatures; the red triangles indicate thedynamic melting points of PEO.
Macromolecules Article
dx.doi.org/10.1021/ma301592a | Macromolecules 2012, 45, 8336−83468339

and small crystallites grew in the well-phase-separated domains(Figure 7e). At −50 °C, however, we observed phase separationin the phase-contrast optical microscopy but did not getmacroscopic information on crystallization (Figure 7f). At evenlower temperatures (below −60 °C), the sample seems in theglassy state already.In this set of experiments, crystallization dominates in the
higher temperature regions and phase separation overwhelmsunder deep quenches at lower temperatures. We find cry-stallization is seriously frustrated as soon as phase separationintervenes.There were concentric-like structures in the intermediate
temperature region (between −20 and 20 °C). Under polarizedoptical microscopy, there were alternating bright and darkbands, which was very similar to banded spherulites.49,50
However, it has nothing to do with screwed lamellar growth butonly a surface phenomenon. We observed undulating surfacesdirectly under SEM (Figure 8). But flat surfaces appeared when
the samples were etched by acetone to remove amorphousPMMA on the surface.We should stress that this kind of pattern is different from the
concentric alternating structure which has been reported in ourprevious studies.13−15 The latter was the result of crystallization-enhanced phase separation at the growth interface, which led toalternating crystalline-/amorphous-rich rings. The undulatingsurfaces in this study are the result of fast interior mass transportand slow surface relaxation. Quick growth of spherulites is in needof fast transport of PEO at the growth front. The high mobility ofPEO chains ensures the continuous growth of spherulites. But theslow entangled PMMA chains may not respond fast enough in thePEO-poor region near the growth front. The internal networkstress may lead to mechanical instability of the surface.51,52 Thisinterpretation is supported by a continuous capture of the growthkinetics under optical microscopy (Figure 9). We noticed thatthere were already folded surfaces ahead of the growth front. If thegrowth of spherulites is slow (at higher temperatures) or theinternal network stress is small enough (with smaller amount ofPMMA), the undulation of the surface is not induced with crystalgrowth.When the content of PMMA is increased to 10% in the
blend, crystallization cannot take place easily. We did notcapture any crystallization when the sample was kept at 30 °Cfor as long as 6 days (Figure 10). Only phase separation tookplace slowly as revealed by phase-contrast optical microscopy.At even deeper quenches (−40 °C), still only phase separationtook place without macroscopic crystallization.In the single quench experiment, crystallization and concen-
tration growth are both slow at high temperatures; crystallizationdominates the whole process at intermediate temperatures, whilephase separation dominates the low-temperature region. We note
Figure 3. Calorimetric measurements of the crystallization/melting behavior in PEO/PMMA blends with 10 °C/min cooling/heating rate.
Figure 4. Crystallization of neat PEO when the melt was transferred toa hot stage which was kept at −60 °C. Picture (a) was taken underphase-contrast optical microscopy and (b) under polarized opticalmicroscopy.
Macromolecules Article
dx.doi.org/10.1021/ma301592a | Macromolecules 2012, 45, 8336−83468340

crystallization is seriously frustrated as soon as phase separationoccurs.
Double Quench Experiment. Here we would like tocheck whether it is really true that crystallization is frustrated byviscoelastic phase separation. We employed a double quenchmethod to test this idea. The PMMA/PEO blend (PEOcontent 0.95) was first annealed at 70 °C for 20 h to obtain awell-phase-separated structure, and then the sample wasquenched to lower temperatures to crystallize. Phase transitionswere monitored by optical microscopy (Figure 11).After 20 h of annealing at 70 °C, we found well-phase-
separated structures in the blend. When the second quench wasapplied to the sample at higher temperatures (above 30 °C), wedid not observe the occurrence of crystallization. At 30 °C,dendritic crystals were observed growing slowly in the blend.The crystal cannot cover the full space and was finally trappedby a very bright region at the growth front. At 0 °C, very loosespherulites were observed growing in the phase-separated PEO-rich domains. The bright PMMA-rich phase was totallyintercalated within the spherulites. The growth rate ofspherulites was estimated about 20 μm/min. At −30 °C,spherulites cannot grow but small crystallites appeared in thewell-phase-separated domains. At −50 °C, the contrast betweenphase-separated domains were enhanced under phase-contrastoptical microscopy, while there was no indication of macro-scopic crystallization under polarized optical microscopy.At 30 °C, we found there was a bright region trapping the
crystal growth. We would like to investigate the kinetic processto reveal the nature of this bright region. In Figure 12, adendritic crystal grew irregularly in the sample with faster ratesat four arms. As crystal grew, some regions became turbid whiteand depressed crystal growth in those directions. Finally, thewhole crystal was totally trapped by the white layer. Thisphenomenon is quite similar to a predicted result in asimulation work.21
The crystal growth is normally consisted by a regulararrangement of crystallizable molecules at the growth front anda repulsion of amorphous ones to outside regions. As crystalsgrow larger, the amorphous region becomes even thicker at thegrowth front. In this case, the bright region in Figure 12 was nodoubt the PMMA-rich phase. In addition, we think that therelaxation of PMMA molecules is not fast enough and may leadto some internal stress. Therefore, we propose that thebrightness was more or less under the effect of stress-opticalcoupling as in a cross-linked rubber.53
Figure 5. Phase transition of PEO/PMMA blend (PEO weightfraction 0.98) after annealing at (a) 40, (b) 0, (c) −30, (d) −50, and(e) −60 °C. Pictures in the left column were taken under phase-contrast optical microscopy and the right column under polarizedoptical microscopy.
Figure 6. Phase transition of PEO/PMMA blend (PEO weight fraction 0.95) annealed at 40 °C. Pictures in the upper row were focused on thecenter of a growing spherulite and the bottom row on the growth front. Pictures (a) (d) were taken under phase-contrast optical microscopy,(b) and (e) under polarized optical microscopy, and (c) and (f) were observed under SEM with amorphous PMMA etched by xylene.
Macromolecules Article
dx.doi.org/10.1021/ma301592a | Macromolecules 2012, 45, 8336−83468341

In this set of experiment, we validate our hypothesis thatcrystallization is frustrated by the coupled viscoelastic phaseseparation using double quench experiment. In comparisonwith the single quench experiment, the crystallization abilitybecomes even more frustrated in the well-phase-separated
conditions. We will further investigate the frustration usingcalorimetric measurements.
Calorimetric Measurement. In the single quench experi-ment, the PMMA/PEO blend (PEO content 0.95) wasannealed at each crystallization temperature for 1 h before
Figure 7. Phase transition of PEO/PMMA blend (PEO weight fraction 0.95) annealed at (a) 30, (b) 0, (c) −20, (d) −30, (e) −40, and (f) −50 °C.Pictures in the first and third columns were taken under phase-contrast optical microscopy and second and fourth columns under polarized opticalmicroscopy.
Figure 8. Surface morphology in PEO/PMMA blend (PEO weightfraction 0.95) observed under scanning electron microscopy. Thesamples were annealed at 0 °C. (b) was etched by acetone beforeobservation.
Figure 9. Crystallization of PEO/PMMA blend (PEO weight fraction0.95) annealed at 0 °C. The pictures were taken consequently within1 min under phase-contrast optical microscopy.
Figure 10. Phase transition of PEO/PMMA blend (PEO weightfraction 0.9) after annealing at 30 °C for 6 days. Picture (a) was takenunder phase-contrast optical microscopy and (b) under polarizedoptical microscopy.
Figure 11. Double quench experiment of PEO/PMMA blend (PEOweight fraction 0.95). The sample was annealed at (a) 70 °C for 20 hand then quenched to (b) 30, (c) 0, (d) −30, and (e) −50 °C. Picturesin the left column were taken under phase-contrast optical microscopyand right column under polarized optical microscopy.
Macromolecules Article
dx.doi.org/10.1021/ma301592a | Macromolecules 2012, 45, 8336−83468342

the heating process in DSC (Figure 13). There was nearly nomelting enthalpy for nucleation-controlled crystallization at50 °C. In the intermediate temperature region for crystal-lization (between 40 and −10 °C), the melting temperatureand enthalpy did not decrease too much. For crystallization at−30 °C, there were double peaks in the melting curve: onelocated at about 20 °C and the other at 40 °C. Forcrystallization at −50 °C, there was first a cold crystallizationat about −30 °C and then followed by two small melting peaksat higher temperatures. Compared with direct morphologyobservations under optical microscopy (Figure 7), we proposethat the higher melting peak corresponds to the melting ofcompact spherulites and the lower peak to the melting of smallirregular crystallites in phase-separated domains.In the double quench experiment, the melting temperature and
enthalpy showed sharp decrease (Figure 14), in contrast to thesingle quench experiment. For 1 h of annealing above 30 °C, therewas no indication of crystal melting in the heating process. Forcrystallization at even lower temperatures (between −30 and20 °C), there were double melting peaks which indicated twokinds of crystals with different stability. As crystallizationtemperature lowered, more crystal melted at lower temperatures.For crystallization at −50 °C, there was apparent cold cry-stallization in the heating process before the subsequent doublemelting peaks. By comparing the exothermic and endothermicheat, we found they were nearly equal. This indicated that there
was almost no crystallization at −50 °C, and the melting peakscorresponded to the cold crystallization in the heatingprocedure.Furthermore, we can compare the calorimetric results in this
study with two more polymer systems (Figure 15). For meltingof crystallization in neat PEO, the melting temperatures werehigh and enthalpies large. When PEO was blended with 5% ofsmall molecular weight of PMMA (Mw = 15 kg/mol), the blendshowed thermodynamic miscibility in a large temperaturerange. We found that there was only slight drop of meltingtemperatures and enthalpies. In comparison, there weredramatic drop of calorimetric property in the current study.At the lower temperature crystallization took place, the largerdrop was observed in the melting process.
Frustrated Crystallization and Melting Depression. Indynamically symmetric blends, there are possibly three factorsin phase separation that affect the coupled crystallization:fluctuation, interfacial area, and concentration.40−42 Fluctuationand interfacial area enhance crystallization ability, and the effectdecreases as phase separation proceeds. In the very late stageof phase separation, crystallization is mainly determined by theconcentration in the well-phase-separated crystalline-richdomains. In this dynamically asymmetric PEO/PMMA blend,we confirm that crystallization is frustrated when it couples withviscoelastic phase separation. Now we come to the essentialquestion: what leads to the frustration?
Figure 12. Double quench experiment of PEO/PMMA blend (PEO weight fraction 0.95). The sample was annealed first at 70 °C for 20 h and thenquenched to 30 °C for (a) 100, (b) 180, (c) 320, and (d) 600 min.
Figure 13. Calorimetric measurements of PEO crystal melting inPEO/PMMA blend (PEO content 0.95) for single quench experi-ments. The samples were annealed at given temperatures for 1 hbefore heating with a rate of 10 °C/min.
Figure 14. Calorimetric measurements of PEO crystal melting inPEO/PMMA blend (PEO content 0.95) for double quenchexperiments. The samples were annealed at different temperaturesfor 1 h after phase separation at 70 °C for 20 h.
Macromolecules Article
dx.doi.org/10.1021/ma301592a | Macromolecules 2012, 45, 8336−83468343

In conventional systems with dynamic symmetry, componentmolecules show high mobility and response immediately to adriving force. So there is concentration fluctuation, diffusivegrowth, and coarsening in the phase separation process. Indynamically asymmetric blends, an internal stress can beproduced by even a small perturbation if the stress relaxationtime of one component is long.33,43−45 This transient stressmainly arises from entanglements of the slow component,which acts like a transient network. In the viscoelastic phaseseparation, the internal network stress is closely coupled withconcentration growth. So we propose that the frustratedcrystallization also results from the network stress inviscoelastic phase separation.To verify our postulation, we first consider an ultimate case in
cross-linked gels.33 The crystallization ability of crystallizablesolvent in a gel is usually frustrated.54 Also, the crystallization isdramatically depressed if the crystalline polymer is cross-linked.55
If the cross-linking density is very high in the network, thecrystallization may be totally prohibited.56 These phenomenaindicate that crystallization is frustrated by random stress.The network stress in gels usually results from permanent
junction points. In contrast, the network stress in viscoelastic
phase separation is the result of transient entanglement of theslow component. To consider nucleation and growth indynamically asymmetric blends, Onuki proposed that theGibbs−Thomson equation should be modified by including thenetwork stress at the interface.37 We follow his approach andapply it within the kinetic crystallization theory. Then theequilibrium condition at the melting point of crystallization is
σ σ+ + =g L g L2c c n a c (7)
where gc and ga are Gibbs free energies of a monomer in theperfect crystal and in the melt, Lc corresponds to the thicknessof the equilibrium crystal at the temperature, and σn is thenormal component of network stress at the interface.In the viscoelastic model for phase separation in dynamically
asymmetric blends, Tanaka proposed the network stresscoupled with concentration growth for component k shouldbe43,57
∫σ κ
υ δ
= ′ − ′ ′
+ − ′ ∇· ′−∞
t t G t t t
G t t t
( ) d [ ( ) ( )
( )( ( )) ]
ijk
tk
ijk
kk ij
( )S( ) ( )
B( )
(8)
where κij(k) = ∇iυj
(k) + ∇jυi(k) − 2/3δij∇·υk and GS and GB are
shear modulus and bulk modulus, respectively. In the veryasymmetric blends (gels or polymer solutions), the networkstress is mainly sustained by the slow component.The σn associated with the network stress in eq 7 is37
∑σ σ= · · =
n nk
kn
1,2
( )
(9)
With a linear approximation, the driving force for crystallizationis ga − gc ≅ (Tm
0 − Tm)ΔHm0 /Tm
0 . So the modified Gibbs−Thomson equation yields the melting point as
σ σ= −
+Δ
⎛⎝⎜
⎞⎠⎟T T
L H1
2m m
0 n
c m0
(10)
The network stress applied onto the crystal plays the same roleas additional surface tension. The situation returns to usualGibbs−Thomson relationship when the effect of network stressvanishes. Provided that crystallization is independent and underthe assumption that Lc = β′Lmin (β′ is a constant), then theHoffman−Weeks relationship is still available with somemodifications
σ σσβ
σ σσβ
= −+
′+
+′
⎛⎝⎜
⎞⎠⎟
⎛⎝⎜
⎞⎠⎟T T T1
22
22m m
0 nc
n
(11)
We can still get an equilibrium melting temperature when Tm =Tc. But the modified relation shows a larger slope when thenetwork stress intervenes. The experimental data seem tofollow the tendency in this crude interpretation. In anotherpoint of view, the equilibrium melting temperature seems toshow drastic drop in the presence of network stress. Similar toeq 6, we can attribute the melting point depression to threefactors: thermodynamic depression, lamellar thickness, andnetwork stress in addition.Then, we consider the kinetics of nucleation and crystal
growth. Because of the larger interfacial energy, the nucleationbarrier becomes larger. Accordingly, the nucleation rate dropswith an exponential factor exp[(−2σnσlTm
0 )/(kTcΔHm0 (Tm
0 −Tc))], where σl associates with lateral surface energy. The
Figure 15. Calorimetric measurements of PEO crystal melting atdifferent conditions. One corresponds to the melting of neat PEO.PEO/PMMA (M) corresponds to the blends of PEO with smallmolecular weight of PMMA (Mw = 15 kg/mol), which is in miscibleconditions. PEO/PMMA (I) corresponds to the direct quench in thisstudy, which is in the immiscible condition. PEO/PMMA (I, DQ)corresponds to the double quench in this study.
Macromolecules Article
dx.doi.org/10.1021/ma301592a | Macromolecules 2012, 45, 8336−83468344

growth rate under network stress expressed in a simplified formis then
τσ σ
∼−
−+
− Δ
⎛⎝⎜
⎞⎠⎟G
T TT
TT T H
1exp
(2 )( )c0
m0
c n m0
m0
c m0
(12)
There are two factors leading to the depression of growth rate.The thermodynamic reason is closely related with networkstress and the induced shifting of equilibrium meltingtemperature. The other lies in the mobility. In eq 12, theVogel−Fulcher relation gives τ0 ∼ exp[B/(ϕg − ϕ)], where Bis a positive constant and ϕg the glassy fraction.
58 So we pointout that growth rate in dynamically asymmetric blends isseverely affected by the unmatched glass transition temper-atures between two components.By considering the network stress, the frustrated crystal-
lization in this study can be explained qualitatively. First, weconsider concentration dependence. We found crystallizationwas difficult to take place when the amount of PMMA was over10%. Larger PMMA concentration indicates larger networkstress under even a small perturbation. In addition, the uprisingglass transition curve impedes the mobility even more.Together, they give the concentration-dependent frustrationon crystallization.Second, we consider the temperature dependence. As
network stress is initiated by concentration growth in phaseseparation, the dynamic path way has a large effect oncrystallization ability. If crystallization takes place prior to phaseseparation, the effect from network stress is small. The role ofthe network stress is important in the contrary case. We showthe competition between crystal growth and initial phaseseparation with respect to temperature in a schematic picture(Figure 16).
The growth rate in the initial stage of viscoelastic phaseseparation can be expressed as33
χ χ κ ξ= − − + + −R q q M q q( ) 2 [( ) ](1 )2s
2 2 2 1(13)
where q is the wave vector, M the mobility, χ the interactionparameter, κ the interfacial tension, and ξ the viscoelastic length.Under shallow quenches, the concentration growth is usuallydepressed in the viscoelastic length so that the dynamics is slow inthe initial stage. However, the growth rate is dominated bythermodynamics at very deep quenches. This part of work has beengiven in a separate paper.48 The growth rate of crystallization is
usually shown like a “bell”-shaped curve between meltingtemperature and glass transition temperature. Nucleation dominatesthe high-temperature region, and diffusion dominates at lowtemperatures. Then there are two types of relationship betweencrystal growth and concentration growth. If the concentrationgrowth rate is faster than crystal growth in the full temperaturerange, then crystallization proceeds laterally in the phase-separateddomains. This case often appears when the upper critical solutiontemperature is very high beyond the melting curve. In this study, itseems that crystallization is faster in a temperature range betweenT1 and T2, while phase separation dominates the higher and lowertemperature regions so that crystallization is frustrated by networkstress. Compared with experimental data, T1 is near around 40 °Cand T2 −30 °C for the blend with 5 wt % of PMMA.Here we should point out that the network stress stays only
transiently (although relatively long in the study). It is usually builtup by molecular diffusion in the early stage of phase separationand relaxes slowly in the late stage. So the effect of network stresson crystallization changes as phase separation proceeds. Whencrystallization is much faster than phase separation, thecrystallization is less affected before network stress is induced.Under a single deep quench or a double quench, the effect fromthe network stress is remarkable for a certain period. In someconditions, crystallization seems to be fully prohibited. After asufficiently long time, however, the internal network stress may berelaxed so that crystallization can take place slowly. For example,when PMMA weight fraction is 10%, we did not observe apparentcrystallization after 6 days of annealing (Figure 10), but we didcapture crystallization after 4 months.Until present, one essential problem still leaves unsettled in
viscoelastic phase separation: the network stress cannot bedetermined experimentally. Quantitative description of thenetwork stress is only given in simulation works.59,60 Wepropose that the network stress may be estimated indirectlywith eqs 10 and 11. In addition, the molecular dynamics isanother challenging problem.61,62 In an intuitive picture, thereare typically three kinds of interactions in the this blend:PMMA−PMMA, PMMA−PEO, and PEO−PEO. What is theexact motion of the molecular dynamics for each component,especially when there is large dynamic asymmetry?63,64 Webelieve that much more experimental and theoretical effort isneeded on these topics.
■ CONCLUSIONIn this study, we investigated the interplay betweencrystallization and phase separation in a dynamically asym-metric blend. In contrast to the assisted crystallization indynamically symmetric blends, crystallization seems to befrustrated by the coupled viscoelastic phase separation withlarge dynamic asymmetry. After detailed investigations in singlequench, double quench, and calorimetric experiments, wepropose that the frustration is the result of network stressproduced by the concentration growth. The effect of thenetwork stress is more important when viscoelastic phaseseparation dynamics is ahead of crystallization.
■ AUTHOR INFORMATIONCorresponding Author*Phone +86 10 82618089; Fax +86 10 62521519; [email protected].
NotesThe authors declare no competing financial interest.
Figure 16. Schematic representation of competition between crystalgrowth rate (bell-like curve) and concentration growth rate from phaseseparation (curves 1 and 2).
Macromolecules Article
dx.doi.org/10.1021/ma301592a | Macromolecules 2012, 45, 8336−83468345

■ ACKNOWLEDGMENTS
This work is supported by the National Basic Research Programof China (973 Program, 2012CB821503) and National NaturalScience Foundation of China (No. 50930003).
■ REFERENCES(1) Wunderlich, B. Macromolecular Physics; Academic Press: NewYork, 1973.(2) Cheng, S. Z. D. Phase Transitions in Polymers: The Role ofMetastable States; Elsevier: Amsterdam, 2008.(3) Strobl, G. R. The Physics of Polymers: Concepts for UnderstandingTheir Structures and Behavior; Springer: New York, 1997.(4) Strobl, G. R. Rev. Mod. Phys. 2009, 81, 1287.(5) Lorenzo, M. L. D. Prog. Polym. Sci. 2003, 28, 663.(6) Cheng, S. Z. D.; Lotz, B. Polymer 2005, 46, 8662.(7) Muthukumar, M. Adv. Polym. Sci. 2005, 191, 241.(8) Tanaka, H.; Nishi, T. Phys. Rev. Lett. 1985, 55, 1102.(9) Zhang, X.; Wang, Z.; Han, C. C. Macromolecules 2006, 39, 7441.(10) Du, J.; Niu, H.; Dong, J.-Y.; Dong, X.; Wang, D.; He, A.; Han,C. C. Macromolecules 2008, 41, 1421.(11) Wang, W.; Schultz, J. M.; Hsiao, B. S. Macromolecules 1997, 30,4544.(12) Wang, S.; Wu, C.; Ren, M.-Q.; Horn, R. M. V.; Graham, M. J.;Han, C. C.; Chen, E.; Cheng, S. Z. D. Polymer 2009, 50, 1025.(13) Shi, W.; Cheng, H.; Chen, F.; Liang, Y.; Xie, X.; Han, C. C.Macromol. Rapid Commun. 2011, 32, 1886.(14) Shi, W.; Han, C. C. Macromolecules 2012, 45, 336.(15) Shi, W.; Yang, J.; Zhang, Y.; Luo, J.; Liang, Y.; Han, C. C.Macromolecules 2012, 45, 941.(16) Wang, H.; Shimizu, K.; Hobbie, E. K.; Wang, Z.-G.; Meredith, J.C.; Karim, A.; Amis, E. J.; Hsiao, B. S.; Hsieh, E. T.; Han, C. C.Macromolecules 2002, 35, 1072.(17) Chuang, W.-T.; Jeng, U.-S.; Hong, P.-D.; Sheu, H.-S.; Lai, Y.-H.;Shih, K.-S. Polymer 2007, 48, 2919.(18) Matkar, R. A.; Kyu, T. J. Phys. Chem. B 2006, 110, 12728.(19) Matkar, R. A.; Kyu, T. J. Phys. Chem. B 2006, 110, 16059.(20) Chiu, H.-W.; Kyu, T. J. Chem. Phys. 1995, 103, 7471.(21) Kyu, T.; Xu, H.; Guo, T.; Wang, G. Encyclopedia of PolymerBlends; Wiley-VCH Verlag: Weinheim, 2010; Chapter 4.(22) Matsuyama, A.; Kato, T. J. Chem. Phys. 1996, 105, 1654.(23) Lefebvre, A. A.; Lee, J. H.; Balsara, N. P.; Vaidyanathan, C. J.Chem. Phys. 2002, 117, 9063.(24) Jinnai, H.; Hasegawa, H.; Hashimoto, T.; Han, C. C.Macromolecules 1992, 25, 6078.(25) Lin, C. C.; Jeon, H. S.; Balsara, N. P.; Hammouda, B. J. Chem.Phys. 1995, 103, 1957.(26) Hoffman, J. D.; Weeks, J. J. J. Res. Natl. Bur. Stand. A 1962, 66A,13.(27) de Gennes, P. G. J. Chem. Phys. 1980, 72, 4756.(28) Pincus. J. Chem. Phys. 1981, 75, 1996.(29) Binder, K. J. Chem. Phys. 1983, 79, 6387.(30) Bates, F. S.; Wiltzius, P. J. Chem. Phys. 1989, 91, 3258.(31) Hashimoto, T. Phase Transitions 1988, 12, 47.(32) Han, C. C.; Akcasu, A. Z. Annu. Rev. Phys. Chem. 1992, 43, 61.(33) Onuki, A. Phase Transition Dynamics; Cambridge UniversityPress: New York, 2002.(34) Zhang, X.; Wang, Z.; Zhang, R.; Han, C. C. Macromolecules2006, 39, 9285.(35) Wang, H.; Shimizu, K.; Kim, H.; Hobbie, E. K.; Wang, Z.-G.;Han, C, C. J. Chem. Phys. 2002, 116, 7311.(36) Krishnamurthy, S.; Bansil, R. Phys. Rev. Lett. 1983, 50, 2010.(37) Onuki, A. J. Phys. II 1992, 2, 1505.(38) Olmsted, P. D.; Poon, W. C. K.; McLeish, T. C. B.; Terrill, J.;Ryan, A. J. Phys. Rev. Lett. 1998, 81, 373.(39) Shi, W.; Chen, F.; Zhang, Y.; Han, C. C. ACS Macro Lett. 2012,1, 1086.(40) Mitra, M. K.; Muthukumar, M. J. Chem. Phys. 2010, 132,184908.
(41) Zhang, X.; Wang, Z.; Muthukumar, M.; Han, C. C. Macromol.Rapid Commun. 2005, 26, 1285.(42) Zhang, X.; Wang, Z.; Dong, X.; Dong, J.; Han, C. C. J. Chem.Phys. 2006, 125, 024907.(43) Tanaka, H. J. Phys.: Condens. Matter 2000, 12, R207.(44) Doi, M.; Onuki, A. J. Phys. II 1992, 2, 1631.(45) Onuki, A.; Taniguchi, T. J. Chem. Phys. 1997, 106, 5761.(46) Nishi, T.; Wang, T. T. Macromolecules 1975, 8, 909.(47) Rim, P. B.; Runt, J. P. Macromolecules 1984, 17, 1520.(48) Shi, W.; Han, C. C., submitted for publication.(49) Lotz, B.; Cheng, S. Z. D. Polymer 2005, 46, 577.(50) Kyu, T.; Chiu, H.-W.; Guenthner, A. J.; Okabe, Y.; Saito, H.;Inoue, T. Phys. Rev. Lett. 1999, 83, 2749.(51) Kim, P.; Abkarian, M.; Stone, H. A. Nat. Mater. 2011, 10, 952.(52) Sakurai, S.; Wang, Y.; Kushiro, T.; Nambu, T.; Nomura, S.Chem. Phys. Lett. 2001, 348, 242.(53) Doi, M. Introduction to Polymer Physics; Clarendon Press:Oxford, 1996.(54) Hoei, Y.; Ikeda, Y.; Sasaki, M. J. Phys. Chem. B 2003, 107, 1483.(55) Kusy, R. P.; Turner, D. T. Macromolecules 1971, 4, 337.(56) Ji, J.; Li, B.; Zhong, W.-H. Macromolecules 2012, 45, 602.(57) Tanaka, H. Phys. Rev. E 1997, 56, 4451.(58) Sappelt, D.; Jackle, J. Europhys. Lett. 1997, 37, 13.(59) Tanaka, H.; Araki, T. Phys. Rev. Lett. 1997, 78, 4966.(60) Araki, T.; Tanaka, H. Macromolecules 2001, 34, 1953.(61) Doi, M.; Graessley, W. W.; Helfand, E.; Pearson, D. S.Macromolecules 1987, 20, 1900.(62) Viovy, J. L.; Rubinstein, M.; Colby, R. H. Macromolecules 1991,24, 3587.(63) Watanabe, H.; Chen, Q.; Kawasaki, Y.; Matsumiya, Y.; Inoue,T.; Urakawa, O. Macromolecules 2011, 44, 1570.(64) Arrese-Igor, S.; Alegría, A.; Moreno, A. J.; Colmenero, J. SoftMatter 2012, 8, 3739.
Macromolecules Article
dx.doi.org/10.1021/ma301592a | Macromolecules 2012, 45, 8336−83468346


