Embed Size (px)
Citation preview
Efficient protein crystallization
Lawrence J. DeLucas,a,* Terry L. Bray,a Lisa Nagy,a Debbie McCombs,a
Nikolai Chernov,b David Hamrick,c Larry Cosenza,c Alexander Belgovskiy,d Brad Stoops,d
and Arnon Chaitd
a Center for Biophysical Sciences and Engineering, University of Alabama at Birmingham, Birmingham, AL 35294-4400, USAb Natural Sciences and Mathematics, University of Alabama at Birmingham, Birmingham, AL 35294-4400, USA
c Diversified Scientific, Inc., Birmingham, AL, USAd ANALIZA, Inc., Bay Village, OH, USA
Received 5 February 2003
Abstract
High-throughput molecular biology and crystallography advances have placed an increasing demand on crystallization, the one
remaining bottleneck in macromolecular crystallography. This paper describes three experimental approaches, an incomplete fac-
torial crystallization screen, a high-throughput nanoliter crystallization system, and the use of a neural net to predict crystallization
conditions via a small sample (�0.1%) of screening results. The use of these technologies has the potential to reduce time and samplerequirements. Initial experimental results indicate that the incomplete factorial design detects initial crystallization conditions not
previously discovered using commercial screens. This may be due to the ability of the incomplete factorial screen to sample a
broader portion of ‘‘crystallization space,’’ using a multidimensional set of components, concentrations, and physical conditions.
The incomplete factorial screen is complemented by a neural network program used to model crystallization. This capability is used
to help predict new crystallization conditions. An automated, nanoliter crystallization system, with a throughput of up to 400
conditions/h in 40-nl droplets (total volume), accommodates microbatch or traditional ‘‘sitting-drop’’ vapor diffusion experiments.
The goal of this research is to develop a fully-automated high-throughput crystallization system that integrates incomplete factorial
screen and neural net capabilities.
� 2003 Elsevier Science (USA). All rights reserved.
Keywords: High-throughput nanocrystallization; Incomplete factorial screen; Neural-net
1. Introduction
The promise of high-throughput structural genomics
(HTX) as an enabling technology for rapid drug dis-
covery is becoming a reality. Advances in experimentaland computational technologies have made it possible
for pharmaceutical and drug discovery companies to
apply HTX to the multitude of new targets available
from high-throughput genomics efforts. Successful HTX
application will require flexible systems that allow for
efficient development and usage of experimental data for
iterative optimization.
A number of techniques have been employed for de-
termining protein structures, including X-ray crystal-
lography, nuclear magnetic resonance spectroscopy, and
mass spectrometry. Of these, X-ray crystallography re-
mains the only method routinely used to determinestructures of large biomolecules (i.e., MW in excess of
20 000Da). The elucidation of complete genome se-
quences for a large number of vertebrate and inverte-
brate species (Roses, 2002) has accelerated international
efforts to develop high-throughput methods/technologies
that enable rapid three-dimensional protein structure
determination (Kuhn et al., 2002; Lamzin and Perrakis,
2000). The National Institutes of Health (NIH) estab-lished a structural genomics program with the goal of
‘‘encouraging research on the development of method-
ology and technology underpinning the emerging field of
Journal of Structural Biology 142 (2003) 188–206
www.elsevier.com/locate/yjsbi
Journal of
StructuralBiology
* Corresponding author. Fax: +205-934-2659.
E-mail address: [email protected] (L.J. DeLucas).
1047-8477/03/$ - see front matter � 2003 Elsevier Science (USA). All rights reserved.
doi:10.1016/S1047-8477(03)00050-9
structural genomics, whose goal is the understanding ofprotein structural families, structural folds, and the re-
lation of structure and function.’’ One such program
(P50-GM62407), the ‘‘Southeastern Collaboratory for
Structural Genomics’’ (SECSG), involves researchers
from a consortium of universities, including the Uni-
versity of Georgia (UGA; P.I. B.C. Wang), Georgia
State University, the University of Alabama at Bir-
mingham (UAB), the University of Alabama in Hunts-ville, and Duke University. The complete genomes from
Caenorhabditis elegans and Pyrococcus furiosis, plus se-
lected genes from the human genome, were chosen for
this collaborative program. At UAB, the Center for
Biophysical Sciences and Engineering (CBSE) has been
involved in fundamental studies of macromolecular
crystal growth since 1985. The CBSE previously devel-
oped an automated crystallization system that providesreal-time control of pre- and postnucleation vapor
equilibration kinetics, in an effort to enhance crystal size
and diffraction resolution (Bray et al., 1997, 1998; Col-
lingsworth et al., 2000). More recently, the CBSE and
two collaborating companies, ANALIZA, Inc., and Di-
versified Scientific, Inc., have developed novel technol-
ogies that have the potential to increase the efficiency of
protein crystal screening and optimization. Screening forpotential crystallization conditions often requires large
quantities (25–100mg) of purified protein. Unfortu-
nately, even with the recent advances in cloning and
protein expression, many proteins can be produced in
only submilligram or low-milligram quantities without
enormous expenditures of resources to produce larger
quantities. The recent efforts in genomics, and subse-
quently proteomics, have produced thousands of newproteins for study in structural biology and drug design
projects. The number of new proteins available will
continue to increase significantly in the next several years
as additional investigators become involved in this im-
portant research. As a result, there is a significant need
for more efficient and effective methods for determining
protein structures. Since X-ray crystallography will likely
remain the primary technique for determining structuresof large proteins for the foreseeable future, the limita-
tions associated with this method must be overcome.
There are two primary approaches to solving the limi-
tations of X-ray crystallography: (1) develop more ef-
fective methods for large-scale protein production and
(2) reduce the scale and number of individual screening
experiments so that less protein is needed to perform
screening experiments.A holistic HTX approach is presented, combining
with a thorough understanding of the physical phe-
nomena underlying important problem areas and novel,
automated technology platforms that are modular, effi-
cient, and flexible.
A critical component of X-ray crystallography is ob-
taining well-ordered crystals of the target protein. This
effort traditionally requires screening thousands of so-lutions with varying chemical compositions. In an effort
to minimize the total amount of protein required to
discover suitable crystallization conditions, the CBSE,
ANALIZA, Inc., and Diversified Scientific, Inc., have
explored three different complementary approaches: an
incomplete factorial screen with response surface opti-
mization, a high-throughput nanoliter crystallization
robot, and a neural net software program capable ofusing initial screening results to predict future conditions
that are likely to yield crystals. The incomplete factorial
screen with response surface optimization allows a small
number of experiments to be performed that, sampling
the extremely large experiment space in a statistically
robust manner. This approach allows for efficient de-
termination of solution conditions suitable for crystal-
lizing proteins by performing experiments that take intoaccount the independent and interdependent influences
of each experimental parameter. Hits obtained in the
initial screening process are used to design an optimiza-
tion screen to further improve the initial crystallization
results. To enable a comprehensive search in a large
parameter space for optimal crystallization conditions
using submilligram protein quantities, a modular line of
high-throughput crystallization and inspection work-stations has been developed. The process begins with a
statistically based screen optimization that directs the
production of specialized libraries of crystallization
conditions. The libraries and the proteins are subse-
quently combined using a novel nanoliter-range crystal-
lization screening system (NanoScreenTM). An
automated intelligent high-resolution inspection system
(CrystalScoreTM) is then deployed to periodically exam-ine and classify the optimal starting conditions for the
subsequent scale-up crystallization experiments. This
system is currently being upgraded to include a neural
net crystallization prediction program.
The high-throughput nanoliter crystallization ro-
bot significantly reduces the scale of each experi-
ment, allowing the use of as little as 0.1 lg of protein
per screening experiment condition. The use of neuralnetwork software programs facilitates prediction of
probable crystallization conditions based on results
from a small number of experiments. This can fur-
ther improve the efficiency of protein crystallization
screening experiments by learning from prior experi-
mental results and predicting new conditions that
should produce crystals. The three technologies work
in tandem to facilitate highly efficient and effectivescreening of protein crystallization conditions. The
ultimate goal is to develop an automated system that
combines all three approaches, yielding a more effi-
cient and successful method for macromolecular
crystallization. The following provides our strategy
and preliminary investigations for each of these ap-
proaches.
L.J. DeLucas et al. / Journal of Structural Biology 142 (2003) 188–206 189
2. Incomplete factorial screen
The crystallization of biological molecules is a pro-
cess in which large, complex molecules in solution as-
sociate with one another to form a regular lattice in the
solid phase. This process is accomplished by changing
the physical and chemical environment such that the
formation of this lattice is more favorable thermody-
namically than remaining in the solution state. Thethermodynamics can be rationalized in terms of several
factors.
The Gibb�s free energy, DG, is given by the equation
DG ¼ DH � TDS:
The energy released by crystallization is the difference
between the changes in enthalpic and entropic energy.
The energetic cost of order (negative entropy) increases
with temperature.
The macromolecule itself has a favorable (positive)
entropy in solution due to its translational and rotationaldisorder. It is surrounded by an ordered shell (or shells) of
water molecules that have negative entropy. The charged
macromolecular surface forms hydrogen bonds with the
water with favorable (negative) enthalpy. In the crystal-
line form, water is released as a portion of those hydrogen
bonds are sacrificed in favor of stronger intramolecular
hydrogen and ionic bonds. The order of the lattice de-
creases the entropy of the molecules. The exclusion of thewater from the lattice releases thewatermolecules into the
bulk solution, however, raising their entropy. In solution,
hydrophobic patches on the surface of themacromolecule
are also surrounded by (unfavorably) ordered water
molecules, but lack the favorable hydrogen bonds. In the
crystalline form, these hydrophobic patches are often
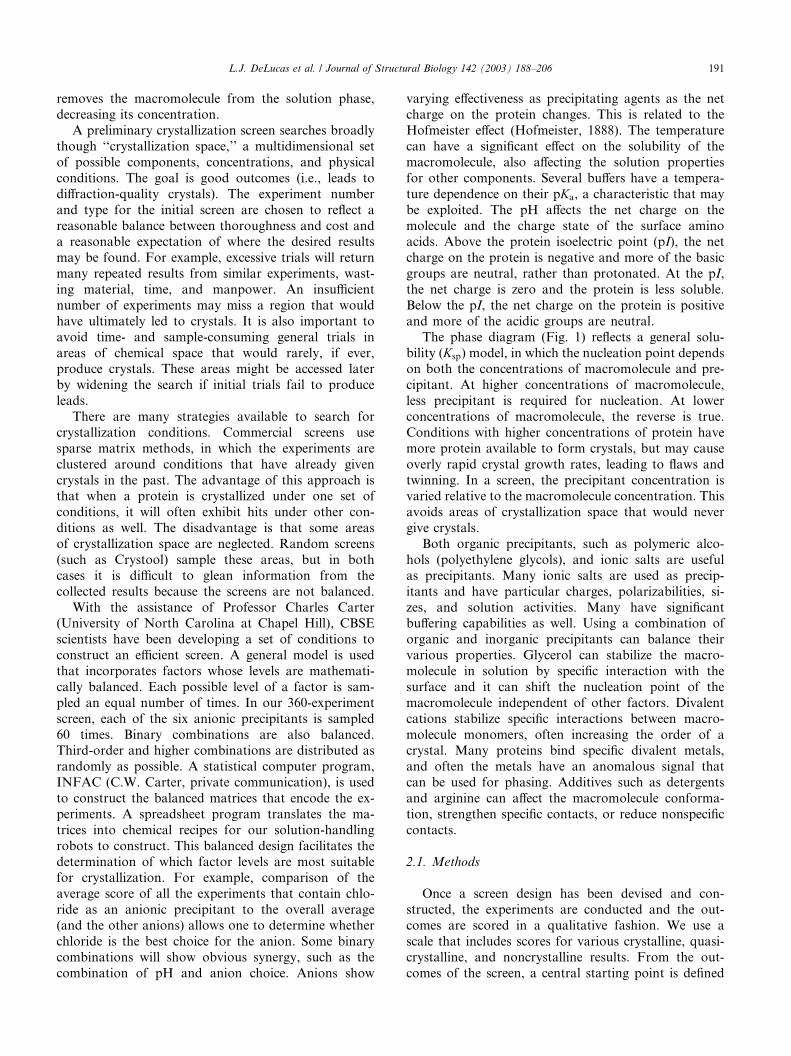
buried by intermolecular interactions. These energetic
conditions are summarized in Table 1.The conditions chosen to crystallize a macromole-
cule exploit and control these energetic differences. The
pH, for example, determines the charge on the mole-
cule, directly influencing the energetics of its interactionwith the bulk solvent. The addition of counterions
shields surface charges and changes the chemical po-
tential of the solvent. Polymeric alcohols sequester
water away from the macromolecule and may interact
with it as well. Certain other components, such as di-
valent cations and metals, may interact directly with
the macromolecules and moderate lattice contacts.
Although some macromolecules are crystallized solelyby temperature change, in most cases the buffers that
stabilize the solution and crystalline states have differ-
ent compositions. This is often accomplished either by
evaporation or by dialysis. The rate of change can be
controlled by the physical form of the experiment, such
as vapor diffusion, dialysis, or controlled evaporation.
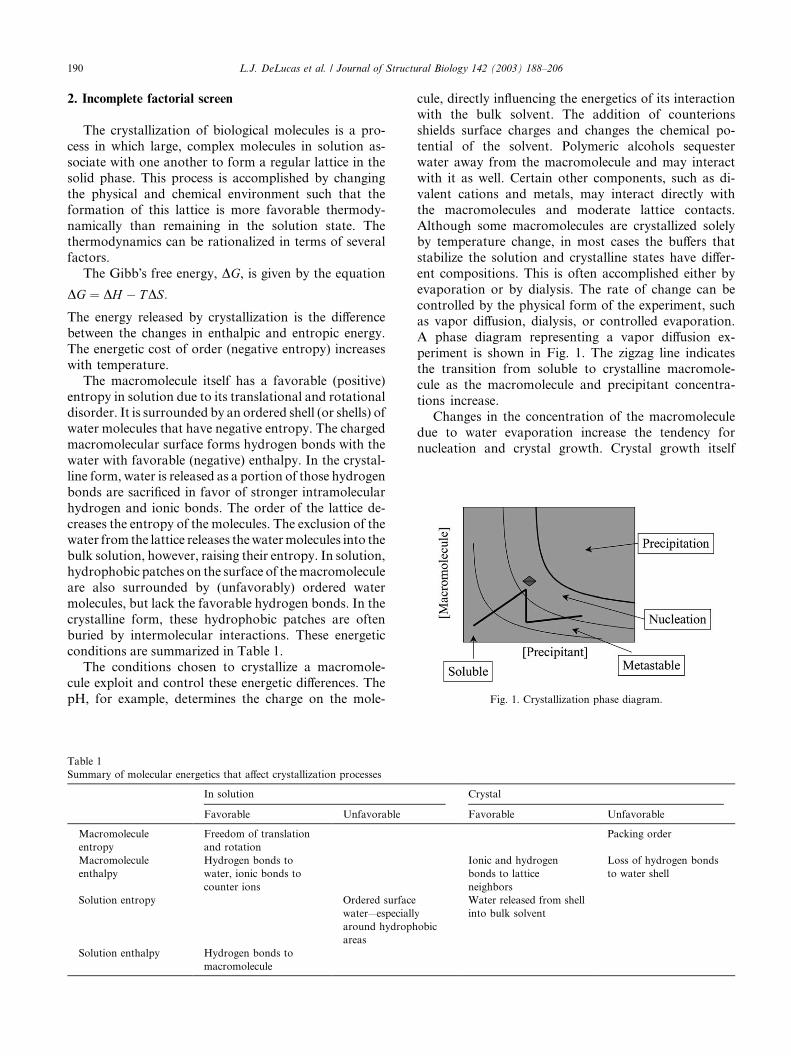
A phase diagram representing a vapor diffusion ex-
periment is shown in Fig. 1. The zigzag line indicatesthe transition from soluble to crystalline macromole-
cule as the macromolecule and precipitant concentra-
tions increase.
Changes in the concentration of the macromolecule
due to water evaporation increase the tendency for
nucleation and crystal growth. Crystal growth itself
Table 1
Summary of molecular energetics that affect crystallization processes
In solution Crystal
Favorable Unfavorable Favorable Unfavorable
Macromolecule
entropy
Freedom of translation
and rotation
Packing order
Macromolecule
enthalpy
Hydrogen bonds to
water, ionic bonds to
counter ions
Ionic and hydrogen
bonds to lattice
neighbors
Loss of hydrogen bonds
to water shell
Solution entropy Ordered surface
water—especially
around hydrophobic
areas
Water released from shell
into bulk solvent
Solution enthalpy Hydrogen bonds to
macromolecule
Fig. 1. Crystallization phase diagram.
190 L.J. DeLucas et al. / Journal of Structural Biology 142 (2003) 188–206
removes the macromolecule from the solution phase,decreasing its concentration.
A preliminary crystallization screen searches broadly
though ‘‘crystallization space,’’ a multidimensional set
of possible components, concentrations, and physical
conditions. The goal is good outcomes (i.e., leads to
diffraction-quality crystals). The experiment number
and type for the initial screen are chosen to reflect a
reasonable balance between thoroughness and cost anda reasonable expectation of where the desired results
may be found. For example, excessive trials will return
many repeated results from similar experiments, wast-
ing material, time, and manpower. An insufficient
number of experiments may miss a region that would
have ultimately led to crystals. It is also important to
avoid time- and sample-consuming general trials in
areas of chemical space that would rarely, if ever,produce crystals. These areas might be accessed later
by widening the search if initial trials fail to produce
leads.
There are many strategies available to search for
crystallization conditions. Commercial screens use
sparse matrix methods, in which the experiments are
clustered around conditions that have already given
crystals in the past. The advantage of this approach isthat when a protein is crystallized under one set of
conditions, it will often exhibit hits under other con-
ditions as well. The disadvantage is that some areas
of crystallization space are neglected. Random screens
(such as Crystool) sample these areas, but in both
cases it is difficult to glean information from the
collected results because the screens are not balanced.
With the assistance of Professor Charles Carter(University of North Carolina at Chapel Hill), CBSE
scientists have been developing a set of conditions to
construct an efficient screen. A general model is used
that incorporates factors whose levels are mathemati-
cally balanced. Each possible level of a factor is sam-
pled an equal number of times. In our 360-experiment
screen, each of the six anionic precipitants is sampled
60 times. Binary combinations are also balanced.Third-order and higher combinations are distributed as
randomly as possible. A statistical computer program,
INFAC (C.W. Carter, private communication), is used
to construct the balanced matrices that encode the ex-
periments. A spreadsheet program translates the ma-
trices into chemical recipes for our solution-handling
robots to construct. This balanced design facilitates the
determination of which factor levels are most suitablefor crystallization. For example, comparison of the
average score of all the experiments that contain chlo-
ride as an anionic precipitant to the overall average
(and the other anions) allows one to determine whether
chloride is the best choice for the anion. Some binary
combinations will show obvious synergy, such as the
combination of pH and anion choice. Anions show
varying effectiveness as precipitating agents as the netcharge on the protein changes. This is related to the
Hofmeister effect (Hofmeister, 1888). The temperature
can have a significant effect on the solubility of the
macromolecule, also affecting the solution properties
for other components. Several buffers have a tempera-
ture dependence on their pKa, a characteristic that may
be exploited. The pH affects the net charge on the
molecule and the charge state of the surface aminoacids. Above the protein isoelectric point (pI), the net
charge on the protein is negative and more of the basic
groups are neutral, rather than protonated. At the pI,
the net charge is zero and the protein is less soluble.
Below the pI, the net charge on the protein is positive
and more of the acidic groups are neutral.
The phase diagram (Fig. 1) reflects a general solu-
bility (Ksp) model, in which the nucleation point dependson both the concentrations of macromolecule and pre-
cipitant. At higher concentrations of macromolecule,
less precipitant is required for nucleation. At lower
concentrations of macromolecule, the reverse is true.
Conditions with higher concentrations of protein have
more protein available to form crystals, but may cause
overly rapid crystal growth rates, leading to flaws and
twinning. In a screen, the precipitant concentration isvaried relative to the macromolecule concentration. This
avoids areas of crystallization space that would never
give crystals.
Both organic precipitants, such as polymeric alco-
hols (polyethylene glycols), and ionic salts are useful
as precipitants. Many ionic salts are used as precip-
itants and have particular charges, polarizabilities, si-
zes, and solution activities. Many have significantbuffering capabilities as well. Using a combination of
organic and inorganic precipitants can balance their
various properties. Glycerol can stabilize the macro-
molecule in solution by specific interaction with the
surface and it can shift the nucleation point of the
macromolecule independent of other factors. Divalent
cations stabilize specific interactions between macro-
molecule monomers, often increasing the order of acrystal. Many proteins bind specific divalent metals,
and often the metals have an anomalous signal that
can be used for phasing. Additives such as detergents
and arginine can affect the macromolecule conforma-
tion, strengthen specific contacts, or reduce nonspecific
contacts.
2.1. Methods
Once a screen design has been devised and con-
structed, the experiments are conducted and the out-
comes are scored in a qualitative fashion. We use a
scale that includes scores for various crystalline, quasi-
crystalline, and noncrystalline results. From the out-
comes of the screen, a central starting point is defined
L.J. DeLucas et al. / Journal of Structural Biology 142 (2003) 188–206 191
for a fine search of the physical and chemical param-eters. This optimization step is important because at the
optimum, small unavoidable statistical variations in
the experimental conditions have negligible effects on
the outcome. The experiment is more robust and re-
producible at the optimum than at the extremes. In the
case in which a trial has given crystalline material, it
may serve as the center point for a multidimensional
search. A starting point may also be inferred by astatistical treatment (least-squares and/or nonlinear
methods) of the variation of noncrystalline results. In
our optimization model, four or five numerical vari-
ables (protein concentration, pH, total amount of pre-
cipitant, relative amounts of organic and ionic
precipitant, and if used, concentration of glycerol or
polyol) are varied simultaneously to explore the vicinity
of the hit for improved results. The particular param-eters are defined to minimize their synergistic effects.
For example, the concentration of precipitant necessary
to crystallize a protein at 10mg/ml would be insufficient
to crystallize that same protein at 5mg/ml and would
precipitate the protein at 20mg/ml. For this reason, as
the concentration of the protein is varied in the opti-
mization, the relative rather than the absolute concen-
tration of precipitant is varied.A grid search at three levels in five dimensions
would entail 243 experiments. To reduce that number
to a manageable level without sacrificing too much
data, we have used the Design of Experiments–Re-
sponse Surface method (Carter, 1997). Many industrial
processes are optimized using this method. We use
previously published matrices (Carter, 1977) to define
the variation about the center point. These matrices arearrays of numbers from )1 to +1, with repetitions at
the center point. The desired spread of variation for
each dimension is multiplied by the matrix value and
added to the center point for that variable. The out-
comes of the experiments are scored using a size
measurement, such as the ratio of width to length. The
results of the experiments are then fed into the statis-
tical analysis package JMP (SAS Institute, Cary, NC,USA), which has built-in methods to construct and
analyze a model from response surface data. The
program fits the data to a multidimensional quadratic
model and either predicts an optimum within the
bounds of the experiments or suggests a direction in
which to locate a new center point. Full statistical
calculations are presented to allow the researcher to
assess the goodness of fit of the model. An iterativeapproach is then used to refine about the optimum,
leading to higher quality crystals.
A matrix to encode the variables for the screen was
calculated using the program INFAC. The screen size
was chosen to be 360 experiments with 10 variables at
six or three levels each. The most balanced matrix was
chosen from the 10 000 numerical seeds tested. Screen
variables were chosen according to previously publishedwork (Carter and Carter, 1979).
The matrix was translated into a set of recipes using a
spreadsheet program. The stock components were
mixed using the RecipeMaker robot, a custom-config-
ured Hamilton ML 4000 liquid-handling robot capable
of mixing up to 48 different stocks and water. Recipes
were prepared in 2-ml block plates and reformatted into
standard 384-well plates. For comparison, the proteinswere also subjected to a group of commercial screens
consisting of Hampton Crystal Screens I and II,
MembFac, Natrix, and Emerald Wizards I and II (290
experiments). Comparison of crystallization success
rates for incomplete and sparse matrix screens suggests
that the incomplete factorial method may be more ef-
fective. A set of five proteins (two from C. elegans and
three from P. furiosis), 2G1.1, 9c9, UGA 214, UGA 220,and UGA 222, was subjected to crystallization screening
using both incomplete factorial and sparse matrix
models. For this limited sample size, the incomplete
factorial method of screening identified a greater num-
ber of crystallization conditions for each protein. Each
of the five protein samples was crystallized using the
incomplete factorial method, whereas only two proteins,
2G1.1 and UGA 214, crystallized using the sparse ma-trix set. Interestingly, the incomplete factorial method
identified conditions that appear disparate compared to
the results from the sparse matrix screens.
2.2. Screening results
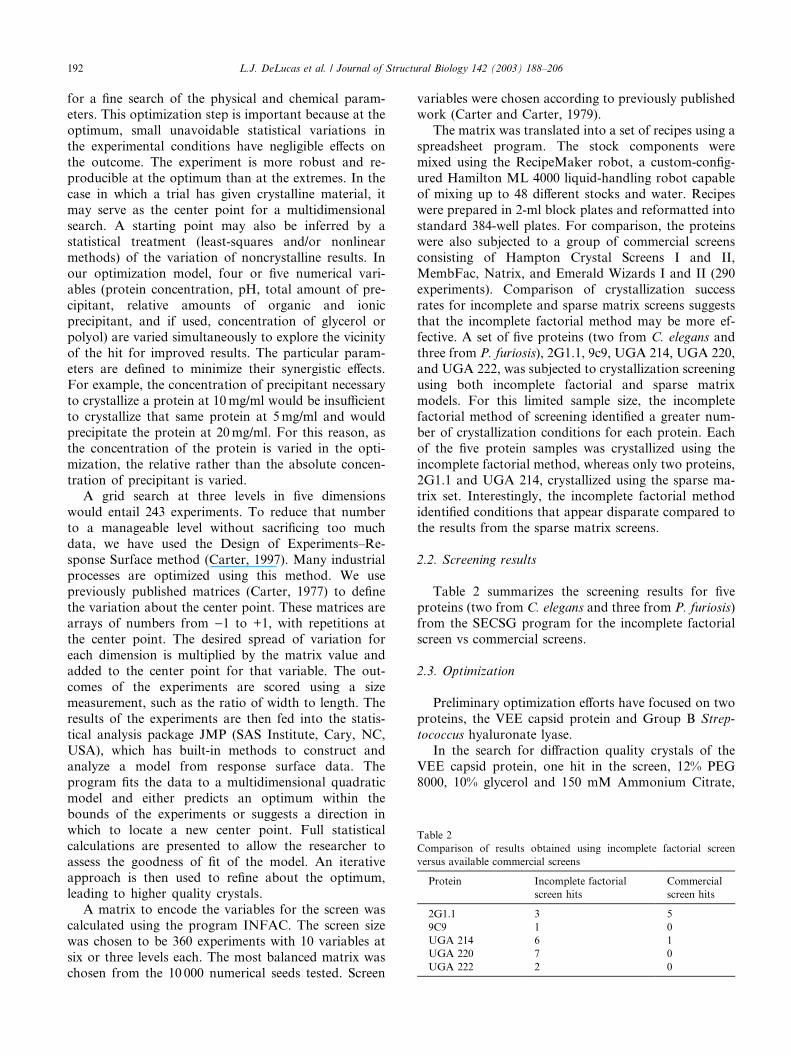
Table 2 summarizes the screening results for five
proteins (two from C. elegans and three from P. furiosis)from the SECSG program for the incomplete factorial
screen vs commercial screens.
2.3. Optimization
Preliminary optimization efforts have focused on two
proteins, the VEE capsid protein and Group B Strep-
tococcus hyaluronate lyase.In the search for diffraction quality crystals of the
VEE capsid protein, one hit in the screen, 12% PEG
8000, 10% glycerol and 150 mM Ammonium Citrate,
Table 2
Comparison of results obtained using incomplete factorial screen
versus available commercial screens
Protein Incomplete factorial
screen hits
Commercial
screen hits
2G1.1 3 5
9C9 1 0
UGA 214 6 1
UGA 220 7 0
UGA 222 2 0
192 L.J. DeLucas et al. / Journal of Structural Biology 142 (2003) 188–206
pH 7.2, gave very small crystals that appeared to betetragonal. The normal form, which is orthorhombic,
tended to grow as needles or prisms. A response surface
optimization experiment was constructed such that the
pH, protein concentration, glycerol concentration, and
precipitant concentrations were varied simultaneously.
Thirty optimization experiments were performed using
the response surface methodology to search for im-
proved conditions for VEE capsid crystallization. Theresults can be inferred from the width and length mea-
surements of the crystals obtained. Most conditions
gave small to large blocky tetragonal crystals, while
other conditions produced needles or a mixture of the
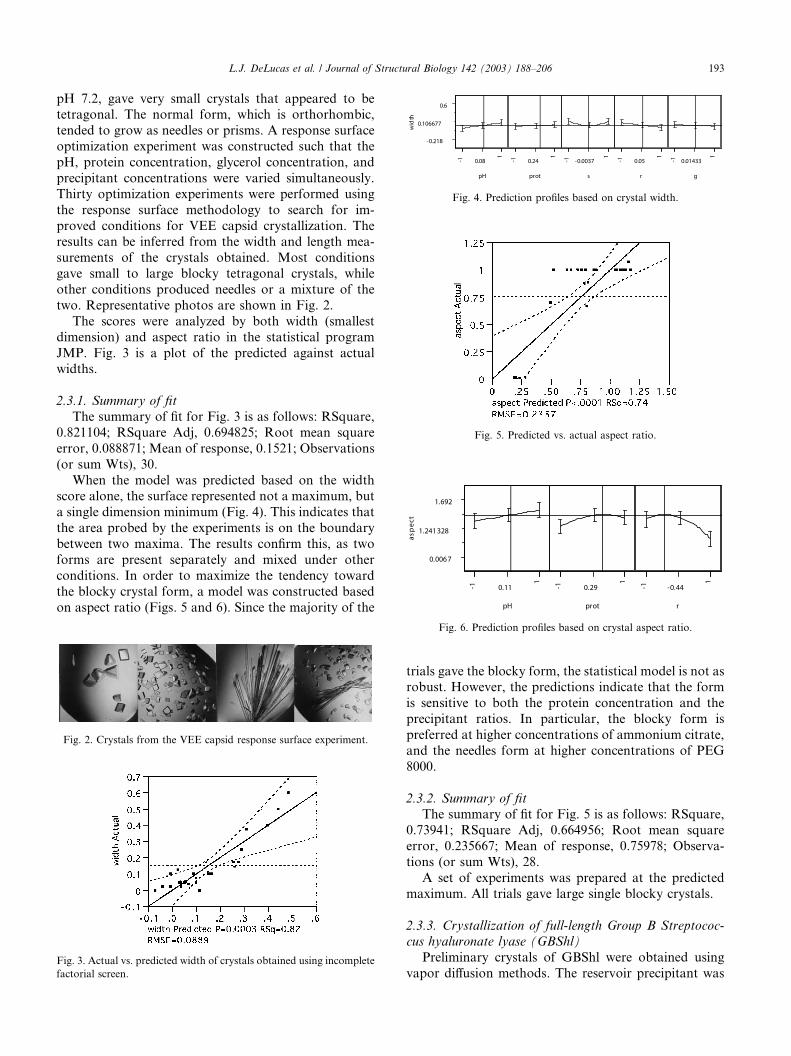
two. Representative photos are shown in Fig. 2.
The scores were analyzed by both width (smallest
dimension) and aspect ratio in the statistical program
JMP. Fig. 3 is a plot of the predicted against actualwidths.
2.3.1. Summary of fit
The summary of fit for Fig. 3 is as follows: RSquare,
0.821104; RSquare Adj, 0.694825; Root mean square
error, 0.088871; Mean of response, 0.1521; Observations
(or sum Wts), 30.
When the model was predicted based on the widthscore alone, the surface represented not a maximum, but
a single dimension minimum (Fig. 4). This indicates that
the area probed by the experiments is on the boundary
between two maxima. The results confirm this, as two
forms are present separately and mixed under other
conditions. In order to maximize the tendency toward
the blocky crystal form, a model was constructed based
on aspect ratio (Figs. 5 and 6). Since the majority of the
trials gave the blocky form, the statistical model is not asrobust. However, the predictions indicate that the form
is sensitive to both the protein concentration and the
precipitant ratios. In particular, the blocky form is
preferred at higher concentrations of ammonium citrate,
and the needles form at higher concentrations of PEG
8000.
2.3.2. Summary of fit
The summary of fit for Fig. 5 is as follows: RSquare,
0.73941; RSquare Adj, 0.664956; Root mean square
error, 0.235667; Mean of response, 0.75978; Observa-
tions (or sum Wts), 28.
A set of experiments was prepared at the predicted
maximum. All trials gave large single blocky crystals.
2.3.3. Crystallization of full-length Group B Streptococ-
cus hyaluronate lyase (GBShl)
Preliminary crystals of GBShl were obtained using
vapor diffusion methods. The reservoir precipitant was
Fig. 2. Crystals from the VEE capsid response surface experiment.
Fig. 3. Actual vs. predicted width of crystals obtained using incomplete
factorial screen.
Fig. 4. Prediction profiles based on crystal width.
Fig. 5. Predicted vs. actual aspect ratio.
Fig. 6. Prediction profiles based on crystal aspect ratio.
L.J. DeLucas et al. / Journal of Structural Biology 142 (2003) 188–206 193
chosen based on the crystallization conditions reportedfor the 92-kDa fragment of S. agalactiae hyaluronate
lyase and included polyethylene glycol monomethyl
ether 5000 (PEG-MME 5000), potassium thiocyanate,
and 100mM Hepes buffer, pH 7. The protein solution
contained 20mM Hepes, pH 7, and 10mM calcium
chloride. In a typical experiment, 2 ll of protein so-
lution was mixed with 2 ll of the reservoir solution.
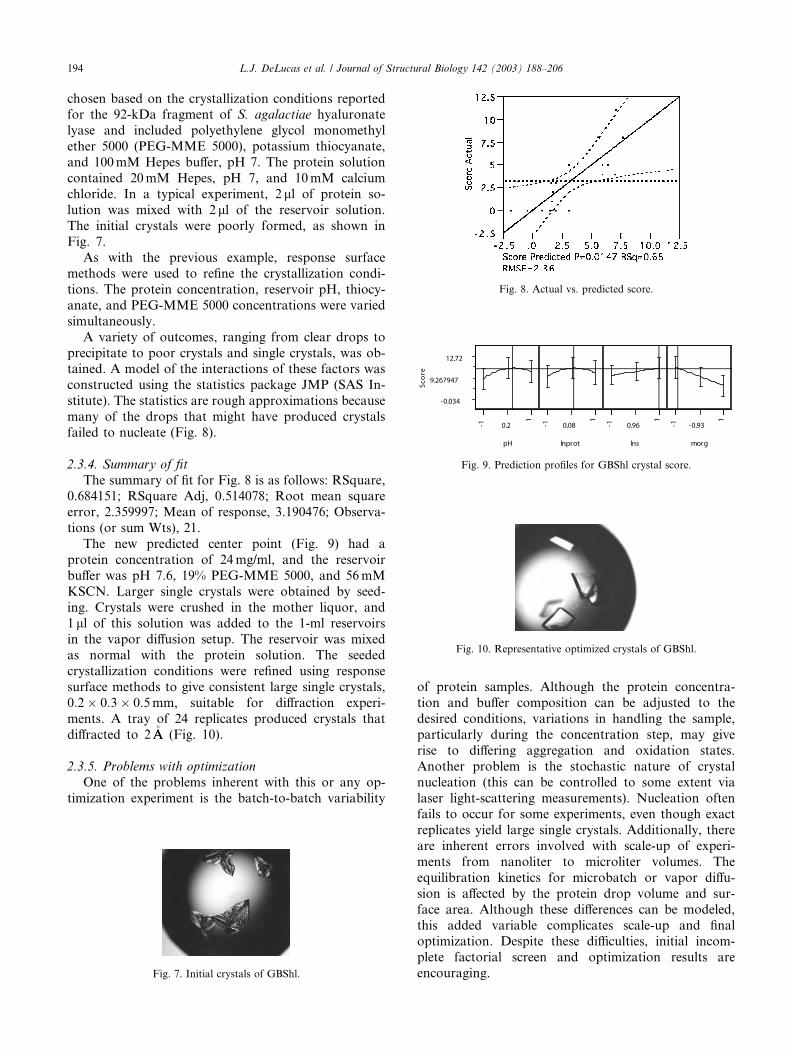
The initial crystals were poorly formed, as shown inFig. 7.
As with the previous example, response surface
methods were used to refine the crystallization condi-
tions. The protein concentration, reservoir pH, thiocy-
anate, and PEG-MME 5000 concentrations were varied
simultaneously.
A variety of outcomes, ranging from clear drops to
precipitate to poor crystals and single crystals, was ob-tained. A model of the interactions of these factors was
constructed using the statistics package JMP (SAS In-
stitute). The statistics are rough approximations because
many of the drops that might have produced crystals
failed to nucleate (Fig. 8).
2.3.4. Summary of fit
The summary of fit for Fig. 8 is as follows: RSquare,0.684151; RSquare Adj, 0.514078; Root mean square
error, 2.359997; Mean of response, 3.190476; Observa-
tions (or sum Wts), 21.
The new predicted center point (Fig. 9) had a
protein concentration of 24mg/ml, and the reservoir
buffer was pH 7.6, 19% PEG-MME 5000, and 56mM
KSCN. Larger single crystals were obtained by seed-
ing. Crystals were crushed in the mother liquor, and1 ll of this solution was added to the 1-ml reservoirs
in the vapor diffusion setup. The reservoir was mixed
as normal with the protein solution. The seeded
crystallization conditions were refined using response
surface methods to give consistent large single crystals,
0:2� 0:3� 0:5mm, suitable for diffraction experi-
ments. A tray of 24 replicates produced crystals that
diffracted to 2�AA (Fig. 10).
2.3.5. Problems with optimization
One of the problems inherent with this or any op-
timization experiment is the batch-to-batch variability
of protein samples. Although the protein concentra-
tion and buffer composition can be adjusted to the
desired conditions, variations in handling the sample,
particularly during the concentration step, may give
rise to differing aggregation and oxidation states.
Another problem is the stochastic nature of crystal
nucleation (this can be controlled to some extent via
laser light-scattering measurements). Nucleation oftenfails to occur for some experiments, even though exact
replicates yield large single crystals. Additionally, there
are inherent errors involved with scale-up of experi-
ments from nanoliter to microliter volumes. The
equilibration kinetics for microbatch or vapor diffu-
sion is affected by the protein drop volume and sur-
face area. Although these differences can be modeled,
this added variable complicates scale-up and finaloptimization. Despite these difficulties, initial incom-
plete factorial screen and optimization results are
encouraging.Fig. 7. Initial crystals of GBShl.
Fig. 8. Actual vs. predicted score.
Fig. 9. Prediction profiles for GBShl crystal score.
Fig. 10. Representative optimized crystals of GBShl.
194 L.J. DeLucas et al. / Journal of Structural Biology 142 (2003) 188–206
3. High-throughput nanoliter protein crystallization
CBSE scientists recognized several years ago that the
demand for a significant quantity of protein for crystal
screening would inhibit the ability of researchers to de-
termine structures for a significant percentage of the
targeted proteins. In 1997, the CBSE began developing
concepts for reducing the scale of protein crystallization
experiments. New technologies that would support au-tomated, reduced-scale crystallization screening were
also developed. Indeed, several companies, academic
laboratories, and government laboratories are now ac-
tively pursuing reduced-scale crystallization, both with
internally developed technologies and with commer-
cially available systems (Syrrx, Inc., 10410 Science
Center Drive, San Diego, CA 92121, USA; DeTitta
et al., 2001; Luft et al., 2001; Mueller et al., 2001; San-tarsiero et al., 2002; Segelke et al., 2002). This approach
has proven to be an enabling methodology for high-
throughput crystallization screening and structure de-
termination.
3.1. Fundamental vs practical considerations
Macromolecular crystallization is characterized byextremely low and highly anisotropic molecular at-
tachment kinetics. Large molecules require a longer
time (compared with small molecules) to assemble into
a highly ordered crystalline lattice. Critical variables
include the solvent structure, the presence of various
crystallization agents that modify solvent structure,
and the rate at which protein molecules are trans-
ported to the crystalline surface. In large-scale crystalgrowth it is possible to handle highly viscous solutions
and mix and prepare screening solutions containing
minor ingredients in very low proportions. Reduced-
scale crystallization places constraints on these three
requirements.
Our approach to reduced-scale crystallization ex-
plicitly separates preparation of screening solutions
from the screening experiments. Libraries of crystalli-zation solutions are prepared according to previously
described statistical design methodologies, using con-
ventional liquid handlers in large volumes (ca. 1ml).
Rather viscous bulk ingredients can be dispensed at
proper proportions and completely mixed in advance of
the actual screening experiment. Different screening li-
braries specific for each class of proteins are prepared
and stored in sealed 96-deep-well plates for further re-formatting and subsequent use. The actual experiment is
reduced to aspiration/dispension of the screening and
protein solutions for the specific crystallization tech-
nique chosen.
There are three fundamental approaches to deliver-
ing submicroliter volumes. The simplest approach is the
spotting method, whereby a pin with an extremely fine
point is dipped into a solution and removed. A smallamount of solution clings to the tip of the pin and can
be transferred to a microarray or slide by touching the
pin to the target surface. This method is easy to im-
plement but it is difficult to control the accuracy and
precision of the delivered volume. A second approach
involves using chambers of defined dimensions to
control the volumes delivered. A common application
of this method is in microfluidic devices, which utilizefabrication techniques from the computer chip industry
to create channels and chambers in silicon that can
contain nanoliter volumes. However, controlling fluid
movement in this format has proved difficult primarily
due to limitations of valve fabrication. Only recently
has effective valve fabrication technology been achieved
in soft polymeric material devices (Fluidigm Corp.,
7100 Shoreline Court, South San Francisco, CA 94080,USA). A third method for delivering small volumes
involves dispensing technologies. At the outset, the
CBSE and ANALIZA determined that the use of active
dispensing technologies was most feasible for success-
fully performing high-throughput nanoliter crystalliza-
tion. Fundamental technologies capable of dispensing
nanoliter volumes, and adaptable for our application,
were available in the ink-jet printing industry. Otherapproaches were judged to have limitations not easily
overcome in a reasonable time frame. Although the
active dispensing approach was judged to be the most
feasible, there remained several hurdles. One of the
most challenging problems encountered was the deliv-
ery of nanoliter volumes of solutions with widely
varying physicochemical properties. This problem is
solved by the choice of active dispensing method andby tailoring the dispense rate to the solution viscosity.
These two approaches resulted in a system capable of
dispensing solutions exhibiting a wide range of physi-
cochemical properties with high precision and accuracy.
Other practical problems included dispensing multiple
nanoliter volumes simultaneously with similar precision
and accuracy, eliminating cross-contamination between
solutions, and controlling unintended water loss duringexperiment preparation. Dispensing of multiple-nano-
liter solutions was accomplished using a hybrid mi-
crofluidic valve (Innovadyne Technologies, Inc., 2835
Duke Court, P.O. Box 7329, Santa Rosa, CA 95407-
7329, USA) that controlled the fluid flow at each dis-
pensing tip. Cross-contamination was eliminated by use
of custom wash stations that rinsed the dispensing tips
thoroughly before sets of new solution conditions wereaspirated. Water loss during experiment preparation
was virtually eliminated via an automated oil (micro-
batch) dispense system or by using a humidity chamber
(vapor diffusion) to retard evaporation.
Dispensing of viscous screening solutions in very
small volumes (e.g., low nanoliter quantities) is a
vexing problem that rapidly reduces the choice of
L.J. DeLucas et al. / Journal of Structural Biology 142 (2003) 188–206 195
dispensing technologies. Techniques relying on surfacewave excitation and instability, such as piezo capillar-
ies, are inherently limited since they typically rely on
small variations in surface tension and viscosity to
achieve quantitative accuracy. Screening solutions vary
in all of their physicochemical parameters thus re-
quiring a robust dispensing technique to achieve re-
producible and quantitative screens. Fast solenoid
(a.k.a. drop-on-demand) techniques were chosen be-cause they rely on fluid inertia for dispensing and
typically result in accurate results across a large oper-
ating range.
Low-volume screening experiments can be executed
in multiple ways. Our initial work concentrated on mi-
crobatch (under-oil) crystallization (Chayen, 1997), in
which the screening and protein droplet is quickly cov-
ered with a mixture of water-impermeable and water-permeable oils, offering the desired kinetic profile (e.g., 1
or 2 weeks for complete drying). Crystallization under
oil is particularly suitable for low-volume screening in
which crystal recovery is not required. Also, rapid
evaporation of prepared droplets is a serious issue when
using small volumes and typical techniques such as base-
plate cooling and humidity control are not optimal since
every droplet (screen) has different colligative properties.For example, base-plate cooling below the dew point of
water can result in droplets continuing to dry while
others, on the same multiwell plate, actually experience
hydration. Rapid sealing of individual wells requires
sophisticated automation, a level of complexity that was
omitted from initial prototypes. Other crystallization
techniques such as sitting drops are easily accommo-
dated, and new miniaturized crystallization plates fa-cilitate such experiments. It should be noted that a thin
layer of silicon oil can be used to slow the rapid initial
evaporation, thereby allowing an entire plate to be
prepared before covering the individual experiment
chambers.
As discussed previously, a preferred method for
conducting reduced-scale crystallization screening is
through the use of technologies, similar to those em-ployed in ink-jet printing devices, which allow small
volumes to be dispensed with high accuracy and pre-
cision. The CBSE partnered with ANALIZA, Inc. (a
Cleveland-based biotechnology company) to develop
NanoScreen, an automated crystallization system that
can dispense 20 nl of solution with �10% accuracy.
This system can prepare 3000 crystallization experi-
ments with less than 350 lg of protein. A wide rangeof solution viscosities can be accommodated while
maintaining accurate dispensing. Twenty-nanoliter
droplets consisting of up to 15% PEG 8000 can be
rapidly dispensed with less than 10% error. Higher
PEG concentrations are achieved by dispensing four-
fold diluted PEG solutions (making the solutions more
water-like with similar chemical contents) or by de-
creasing the dispense rate. The microbatch method canbe adjusted so that water is continually drawn from
the diluted crystallization droplet until the desired
percentage of PEG is obtained. The dilution effect can
be accounted for in our statistical experiment design
strategy.
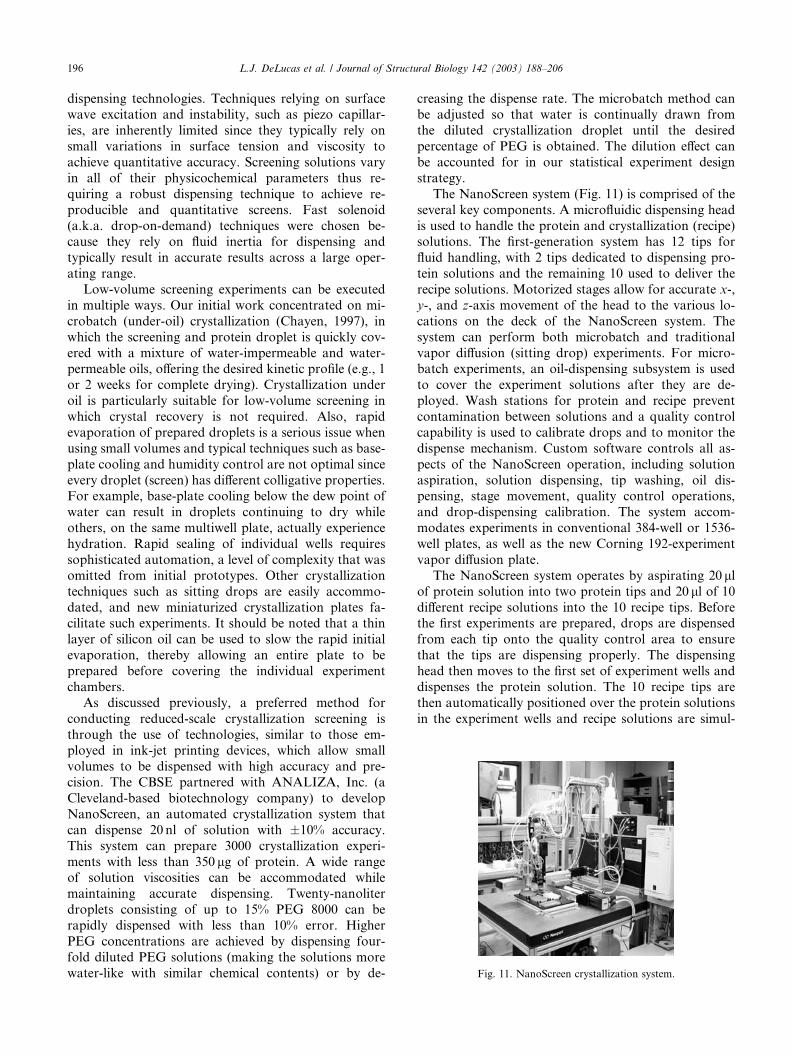
The NanoScreen system (Fig. 11) is comprised of the
several key components. A microfluidic dispensing head
is used to handle the protein and crystallization (recipe)solutions. The first-generation system has 12 tips for
fluid handling, with 2 tips dedicated to dispensing pro-
tein solutions and the remaining 10 used to deliver the
recipe solutions. Motorized stages allow for accurate x-,
y-, and z-axis movement of the head to the various lo-
cations on the deck of the NanoScreen system. The
system can perform both microbatch and traditional
vapor diffusion (sitting drop) experiments. For micro-batch experiments, an oil-dispensing subsystem is used
to cover the experiment solutions after they are de-
ployed. Wash stations for protein and recipe prevent
contamination between solutions and a quality control
capability is used to calibrate drops and to monitor the
dispense mechanism. Custom software controls all as-
pects of the NanoScreen operation, including solution
aspiration, solution dispensing, tip washing, oil dis-pensing, stage movement, quality control operations,
and drop-dispensing calibration. The system accom-
modates experiments in conventional 384-well or 1536-
well plates, as well as the new Corning 192-experiment
vapor diffusion plate.
The NanoScreen system operates by aspirating 20 llof protein solution into two protein tips and 20 ll of 10different recipe solutions into the 10 recipe tips. Beforethe first experiments are prepared, drops are dispensed
from each tip onto the quality control area to ensure
that the tips are dispensing properly. The dispensing
head then moves to the first set of experiment wells and
dispenses the protein solution. The 10 recipe tips are
then automatically positioned over the protein solutions
in the experiment wells and recipe solutions are simul-
Fig. 11. NanoScreen crystallization system.
196 L.J. DeLucas et al. / Journal of Structural Biology 142 (2003) 188–206
taneously dispensed. For microbatch experiments, an oilmixture is immediately dispensed over the experiment
solutions to prevent unintended water loss. For vapor
diffusion experiments, the experiments are prepared
within a constant-humidity chamber to minimize unin-
tended evaporation, but coverage with permeable oil
also offers an option to arrest the initial rapid evapo-
ration while not interfering with the slow approach to
supersaturation. With each set of 10 experiments pre-pared, the recipe tips are washed, followed by aspiration
of the next set of 10 different recipe solutions for sub-
sequent experiments. This process is repeated until all
experiments on a tray have been prepared. The experi-
ment tray is then manually sealed with Crystal Clear
Sealing Tape (MANCO HP260) and placed in a con-
stant-temperature incubator. The NanoScreen system
has a throughput of 400 experiments/h. While approxi-mately 40 ll of protein solution is needed as a total
working volume, very little of this initial solution is
actually consumed. Most of the aspirated protein solu-
tion is returned, after preparation of all experiments is
completed, where it can be recovered and used for future
experiments. It should be noted that the first-generation
NanoScreen system is a prototype, with improvementsalready under development to increase throughput by a
factor of 10.
3.2. Experimental results
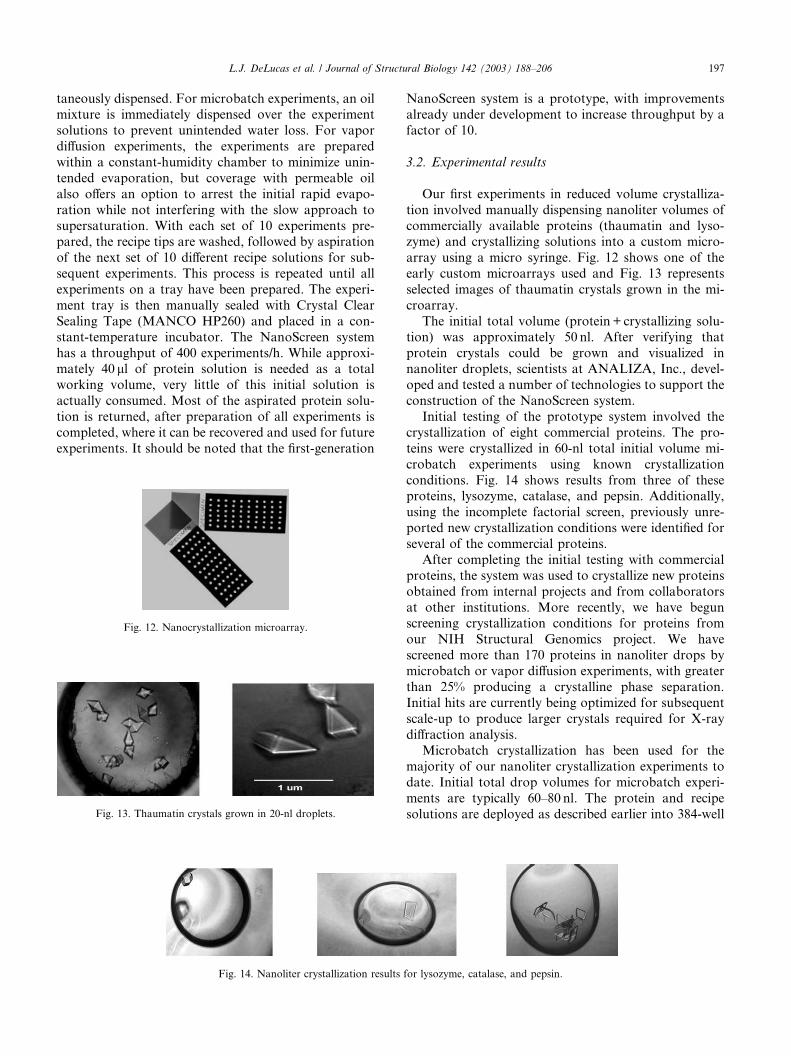
Our first experiments in reduced volume crystalliza-
tion involved manually dispensing nanoliter volumes of
commercially available proteins (thaumatin and lyso-zyme) and crystallizing solutions into a custom micro-
array using a micro syringe. Fig. 12 shows one of the
early custom microarrays used and Fig. 13 represents
selected images of thaumatin crystals grown in the mi-
croarray.
The initial total volume (protein + crystallizing solu-
tion) was approximately 50 nl. After verifying that
protein crystals could be grown and visualized innanoliter droplets, scientists at ANALIZA, Inc., devel-
oped and tested a number of technologies to support the
construction of the NanoScreen system.
Initial testing of the prototype system involved the
crystallization of eight commercial proteins. The pro-
teins were crystallized in 60-nl total initial volume mi-
crobatch experiments using known crystallization
conditions. Fig. 14 shows results from three of theseproteins, lysozyme, catalase, and pepsin. Additionally,
using the incomplete factorial screen, previously unre-
ported new crystallization conditions were identified for
several of the commercial proteins.
After completing the initial testing with commercial
proteins, the system was used to crystallize new proteins
obtained from internal projects and from collaborators
at other institutions. More recently, we have begunscreening crystallization conditions for proteins from
our NIH Structural Genomics project. We have
screened more than 170 proteins in nanoliter drops by
microbatch or vapor diffusion experiments, with greater
than 25% producing a crystalline phase separation.
Initial hits are currently being optimized for subsequent
scale-up to produce larger crystals required for X-ray
diffraction analysis.Microbatch crystallization has been used for the
majority of our nanoliter crystallization experiments to
date. Initial total drop volumes for microbatch experi-
ments are typically 60–80 nl. The protein and recipe
solutions are deployed as described earlier into 384-well
Fig. 12. Nanocrystallization microarray.
Fig. 13. Thaumatin crystals grown in 20-nl droplets.
Fig. 14. Nanoliter crystallization results for lysozyme, catalase, and pepsin.
L.J. DeLucas et al. / Journal of Structural Biology 142 (2003) 188–206 197
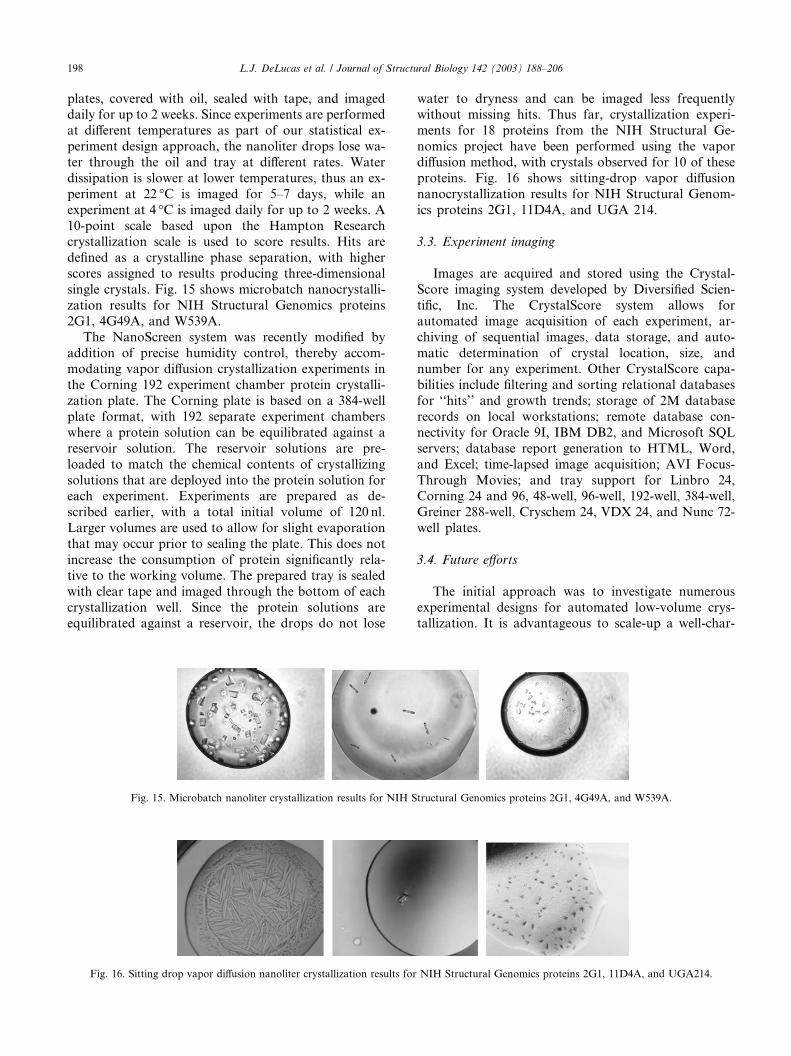
plates, covered with oil, sealed with tape, and imageddaily for up to 2 weeks. Since experiments are performed
at different temperatures as part of our statistical ex-
periment design approach, the nanoliter drops lose wa-
ter through the oil and tray at different rates. Water
dissipation is slower at lower temperatures, thus an ex-
periment at 22 �C is imaged for 5–7 days, while an
experiment at 4 �C is imaged daily for up to 2 weeks. A
10-point scale based upon the Hampton Researchcrystallization scale is used to score results. Hits are
defined as a crystalline phase separation, with higher
scores assigned to results producing three-dimensional
single crystals. Fig. 15 shows microbatch nanocrystalli-
zation results for NIH Structural Genomics proteins
2G1, 4G49A, and W539A.
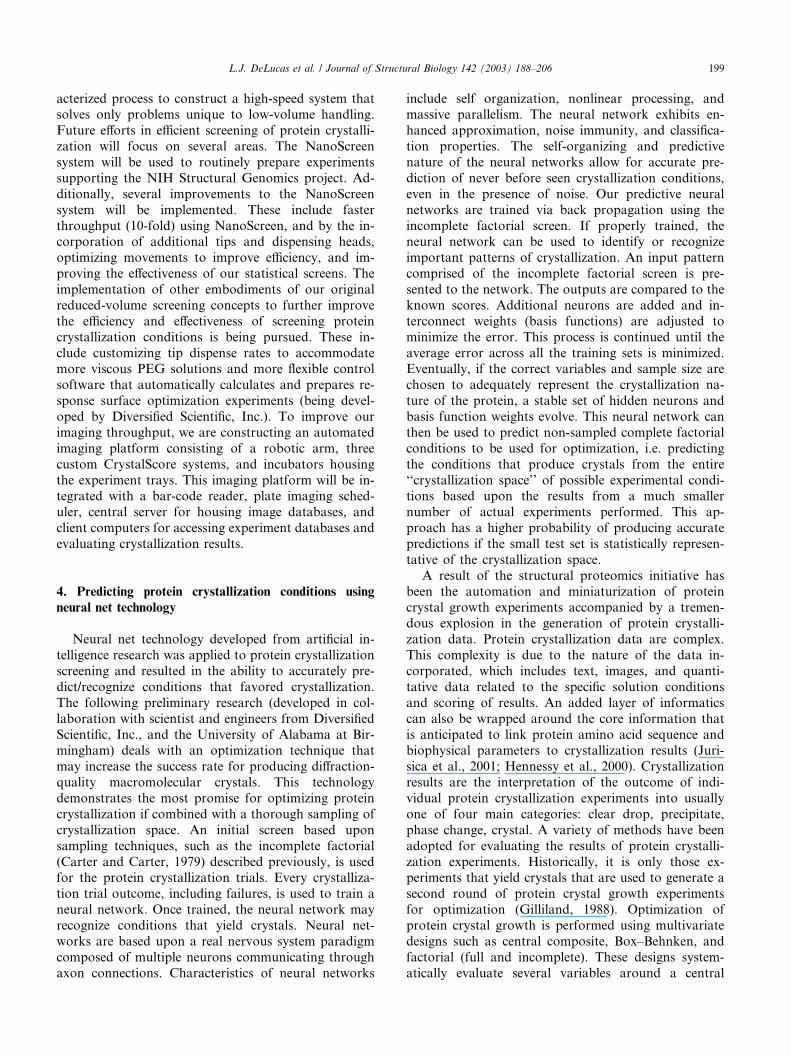
The NanoScreen system was recently modified by
addition of precise humidity control, thereby accom-modating vapor diffusion crystallization experiments in
the Corning 192 experiment chamber protein crystalli-
zation plate. The Corning plate is based on a 384-well
plate format, with 192 separate experiment chambers
where a protein solution can be equilibrated against a
reservoir solution. The reservoir solutions are pre-
loaded to match the chemical contents of crystallizing
solutions that are deployed into the protein solution foreach experiment. Experiments are prepared as de-
scribed earlier, with a total initial volume of 120 nl.
Larger volumes are used to allow for slight evaporation
that may occur prior to sealing the plate. This does not
increase the consumption of protein significantly rela-
tive to the working volume. The prepared tray is sealed
with clear tape and imaged through the bottom of each
crystallization well. Since the protein solutions areequilibrated against a reservoir, the drops do not lose
water to dryness and can be imaged less frequentlywithout missing hits. Thus far, crystallization experi-
ments for 18 proteins from the NIH Structural Ge-
nomics project have been performed using the vapor
diffusion method, with crystals observed for 10 of these
proteins. Fig. 16 shows sitting-drop vapor diffusion
nanocrystallization results for NIH Structural Genom-
ics proteins 2G1, 11D4A, and UGA 214.
3.3. Experiment imaging
Images are acquired and stored using the Crystal-
Score imaging system developed by Diversified Scien-
tific, Inc. The CrystalScore system allows for
automated image acquisition of each experiment, ar-
chiving of sequential images, data storage, and auto-
matic determination of crystal location, size, andnumber for any experiment. Other CrystalScore capa-
bilities include filtering and sorting relational databases
for ‘‘hits’’ and growth trends; storage of 2M database
records on local workstations; remote database con-
nectivity for Oracle 9I, IBM DB2, and Microsoft SQL
servers; database report generation to HTML, Word,
and Excel; time-lapsed image acquisition; AVI Focus-
Through Movies; and tray support for Linbro 24,Corning 24 and 96, 48-well, 96-well, 192-well, 384-well,
Greiner 288-well, Cryschem 24, VDX 24, and Nunc 72-
well plates.
3.4. Future efforts
The initial approach was to investigate numerous
experimental designs for automated low-volume crys-tallization. It is advantageous to scale-up a well-char-
Fig. 15. Microbatch nanoliter crystallization results for NIH Structural Genomics proteins 2G1, 4G49A, and W539A.
Fig. 16. Sitting drop vapor diffusion nanoliter crystallization results for NIH Structural Genomics proteins 2G1, 11D4A, and UGA214.
198 L.J. DeLucas et al. / Journal of Structural Biology 142 (2003) 188–206
acterized process to construct a high-speed system thatsolves only problems unique to low-volume handling.
Future efforts in efficient screening of protein crystalli-
zation will focus on several areas. The NanoScreen
system will be used to routinely prepare experiments
supporting the NIH Structural Genomics project. Ad-
ditionally, several improvements to the NanoScreen
system will be implemented. These include faster
throughput (10-fold) using NanoScreen, and by the in-corporation of additional tips and dispensing heads,
optimizing movements to improve efficiency, and im-
proving the effectiveness of our statistical screens. The
implementation of other embodiments of our original
reduced-volume screening concepts to further improve
the efficiency and effectiveness of screening protein
crystallization conditions is being pursued. These in-
clude customizing tip dispense rates to accommodatemore viscous PEG solutions and more flexible control
software that automatically calculates and prepares re-
sponse surface optimization experiments (being devel-
oped by Diversified Scientific, Inc.). To improve our
imaging throughput, we are constructing an automated
imaging platform consisting of a robotic arm, three
custom CrystalScore systems, and incubators housing
the experiment trays. This imaging platform will be in-tegrated with a bar-code reader, plate imaging sched-
uler, central server for housing image databases, and
client computers for accessing experiment databases and
evaluating crystallization results.
4. Predicting protein crystallization conditions using
neural net technology
Neural net technology developed from artificial in-
telligence research was applied to protein crystallization
screening and resulted in the ability to accurately pre-
dict/recognize conditions that favored crystallization.
The following preliminary research (developed in col-
laboration with scientist and engineers from Diversified
Scientific, Inc., and the University of Alabama at Bir-mingham) deals with an optimization technique that
may increase the success rate for producing diffraction-
quality macromolecular crystals. This technology
demonstrates the most promise for optimizing protein
crystallization if combined with a thorough sampling of
crystallization space. An initial screen based upon
sampling techniques, such as the incomplete factorial
(Carter and Carter, 1979) described previously, is usedfor the protein crystallization trials. Every crystalliza-
tion trial outcome, including failures, is used to train a
neural network. Once trained, the neural network may
recognize conditions that yield crystals. Neural net-
works are based upon a real nervous system paradigm
composed of multiple neurons communicating through
axon connections. Characteristics of neural networks
include self organization, nonlinear processing, andmassive parallelism. The neural network exhibits en-
hanced approximation, noise immunity, and classifica-
tion properties. The self-organizing and predictive
nature of the neural networks allow for accurate pre-
diction of never before seen crystallization conditions,
even in the presence of noise. Our predictive neural
networks are trained via back propagation using the
incomplete factorial screen. If properly trained, theneural network can be used to identify or recognize
important patterns of crystallization. An input pattern
comprised of the incomplete factorial screen is pre-
sented to the network. The outputs are compared to the
known scores. Additional neurons are added and in-
terconnect weights (basis functions) are adjusted to
minimize the error. This process is continued until the
average error across all the training sets is minimized.Eventually, if the correct variables and sample size are
chosen to adequately represent the crystallization na-
ture of the protein, a stable set of hidden neurons and
basis function weights evolve. This neural network can
then be used to predict non-sampled complete factorial
conditions to be used for optimization, i.e. predicting
the conditions that produce crystals from the entire
‘‘crystallization space’’ of possible experimental condi-tions based upon the results from a much smaller
number of actual experiments performed. This ap-
proach has a higher probability of producing accurate
predictions if the small test set is statistically represen-
tative of the crystallization space.
A result of the structural proteomics initiative has
been the automation and miniaturization of protein
crystal growth experiments accompanied by a tremen-dous explosion in the generation of protein crystalli-
zation data. Protein crystallization data are complex.
This complexity is due to the nature of the data in-
corporated, which includes text, images, and quanti-
tative data related to the specific solution conditions
and scoring of results. An added layer of informatics
can also be wrapped around the core information that
is anticipated to link protein amino acid sequence andbiophysical parameters to crystallization results (Juri-
sica et al., 2001; Hennessy et al., 2000). Crystallization
results are the interpretation of the outcome of indi-
vidual protein crystallization experiments into usually
one of four main categories: clear drop, precipitate,
phase change, crystal. A variety of methods have been
adopted for evaluating the results of protein crystalli-
zation experiments. Historically, it is only those ex-periments that yield crystals that are used to generate a
second round of protein crystal growth experiments
for optimization (Gilliland, 1988). Optimization of
protein crystal growth is performed using multivariate
designs such as central composite, Box–Behnken, and
factorial (full and incomplete). These designs system-
atically evaluate several variables around a central
L.J. DeLucas et al. / Journal of Structural Biology 142 (2003) 188–206 199
point or within a range (Box and Behnken, 1960; Boxand Hunter, 1957; Box et al., 1978; Carter, 1997;
Carter and Carter, 1979; Shaw Stewart and Baldock,
1999).
A comprehensive model for protein crystallization
does not exist. The optimization methods identify user-
defined variables in a systematic procedure to deter-
mine those variables most important for the particular
protein sample to be crystallized. There usually arefour variables that are common to all protein crys-
tallization experiments: protein concentration, pre-
cipitant concentration, pH, and temperature. Often
there are additional variables contributing to the suc-
cess or failure of crystallization experiments. If possi-
ble it is wise to select variables that have linearly
independent effects on protein crystal growth (Box
et al., 1978). In order to model the protein crystalli-zation data the results are scored. Hence an investi-
gator�s experience can play an important role in the
crystallization of a protein. If the experience of a
crystallographer could be captured into a model, much
of the subjectivity in protein crystallography could be
eliminated.
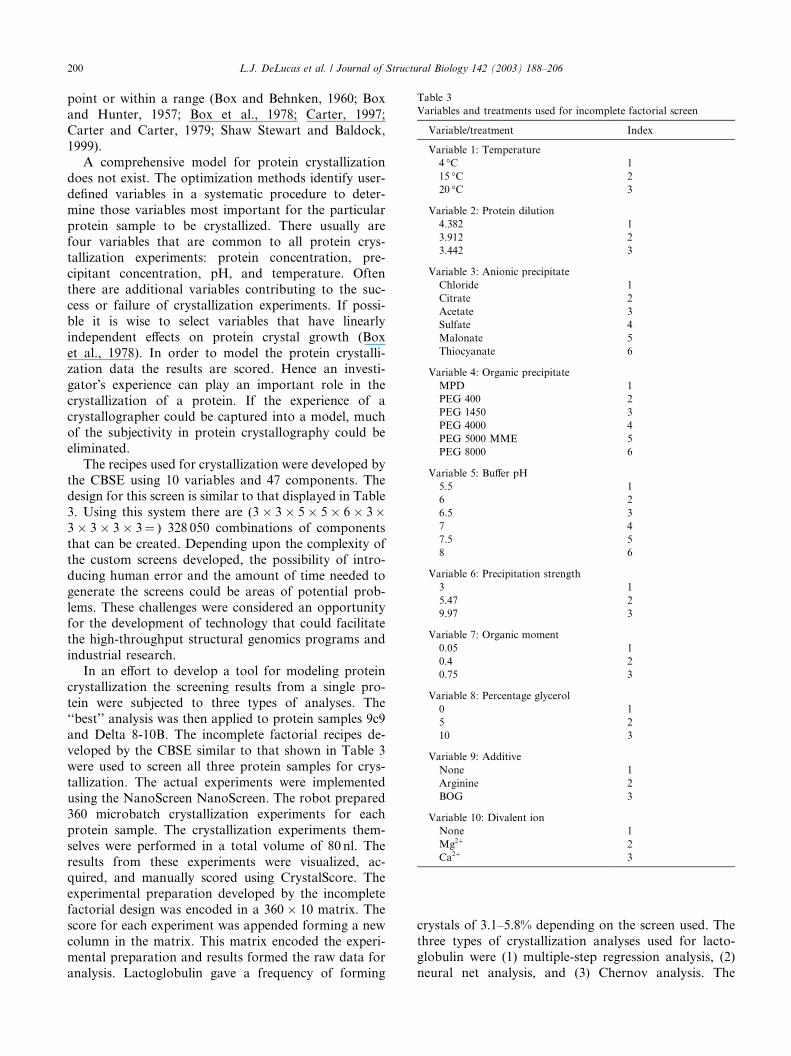
The recipes used for crystallization were developed by
the CBSE using 10 variables and 47 components. Thedesign for this screen is similar to that displayed in Table
3. Using this system there are (3� 3� 5� 5� 6� 3�3� 3� 3� 3¼ ) 328 050 combinations of components
that can be created. Depending upon the complexity of
the custom screens developed, the possibility of intro-
ducing human error and the amount of time needed to
generate the screens could be areas of potential prob-
lems. These challenges were considered an opportunityfor the development of technology that could facilitate
the high-throughput structural genomics programs and
industrial research.
In an effort to develop a tool for modeling protein
crystallization the screening results from a single pro-
tein were subjected to three types of analyses. The
‘‘best’’ analysis was then applied to protein samples 9c9
and Delta 8-10B. The incomplete factorial recipes de-veloped by the CBSE similar to that shown in Table 3
were used to screen all three protein samples for crys-
tallization. The actual experiments were implemented
using the NanoScreen NanoScreen. The robot prepared
360 microbatch crystallization experiments for each
protein sample. The crystallization experiments them-
selves were performed in a total volume of 80 nl. The
results from these experiments were visualized, ac-quired, and manually scored using CrystalScore. The
experimental preparation developed by the incomplete
factorial design was encoded in a 360� 10 matrix. The
score for each experiment was appended forming a new
column in the matrix. This matrix encoded the experi-
mental preparation and results formed the raw data for
analysis. Lactoglobulin gave a frequency of forming
crystals of 3.1–5.8% depending on the screen used. The
three types of crystallization analyses used for lacto-
globulin were (1) multiple-step regression analysis, (2)
neural net analysis, and (3) Chernov analysis. The
Table 3
Variables and treatments used for incomplete factorial screen
Variable/treatment Index
Variable 1: Temperature
4 �C 1
15 �C 2
20 �C 3
Variable 2: Protein dilution
4.382 1
3.912 2
3.442 3
Variable 3: Anionic precipitate
Chloride 1
Citrate 2
Acetate 3
Sulfate 4
Malonate 5
Thiocyanate 6
Variable 4: Organic precipitate
MPD 1
PEG 400 2
PEG 1450 3
PEG 4000 4
PEG 5000 MME 5
PEG 8000 6
Variable 5: Buffer pH
5.5 1
6 2
6.5 3
7 4
7.5 5
8 6
Variable 6: Precipitation strength
3 1
5.47 2
9.97 3
Variable 7: Organic moment
0.05 1
0.4 2
0.75 3
Variable 8: Percentage glycerol
0 1
5 2
10 3
Variable 9: Additive
None 1
Arginine 2
BOG 3
Variable 10: Divalent ion
None 1
Mg2þ 2
Ca2þ 3
200 L.J. DeLucas et al. / Journal of Structural Biology 142 (2003) 188–206
multiple-step regression analysis is an extension of thepublished work of Drs. Carter and Carter, Jr., in which
linear, quadratic, and cross products were used to build
a model based on the screening results. The neural net
analysis was performed using a proprietary neural net
analysis program developed at Diversified Scientific,
Inc. The Chernov analysis was performed in collabo-
ration with the University of Alabama at Birming-
ham Department of Mathematics by Dr. NikolaiChernov. The performances of crystallization analyses
were compared using two metrics, the R2 value and the
ability to correctly identify/predict crystallization out-
come in experimental trials withheld from the training
data set. The best performing crystallization analysis
was then applied to protein 9c9 and Delta 8-10B
screens.
Multiple-step regression analysis of the lactoglobu-lin crystallization screening was inadequate at gener-
ating a model for crystallization. The regression
analysis was performed by Mrs. Shuying Yu, a SAS
programmer employed at the Jefferson County De-
partment of Health in Alabama. The major finding
was a significant lack of fit (R2 ¼ 0:54). This could be
interpreted as requiring further design or additional/
different variables. The regression model responsesurface has a saddle point suggesting that no optimum
response exist. Furthermore, the cross product of the
variables used in designing the screen had a significant
effect on score. The ability of this type of analysis to
model the data for lactoglobulin is still in the inves-
tigative stage. Preliminary research using the Chernov
algorithm and neural network suggested that these
methods produced better R2 values and therefore,more accurately predict the crystallization of Lacto-
globulin.
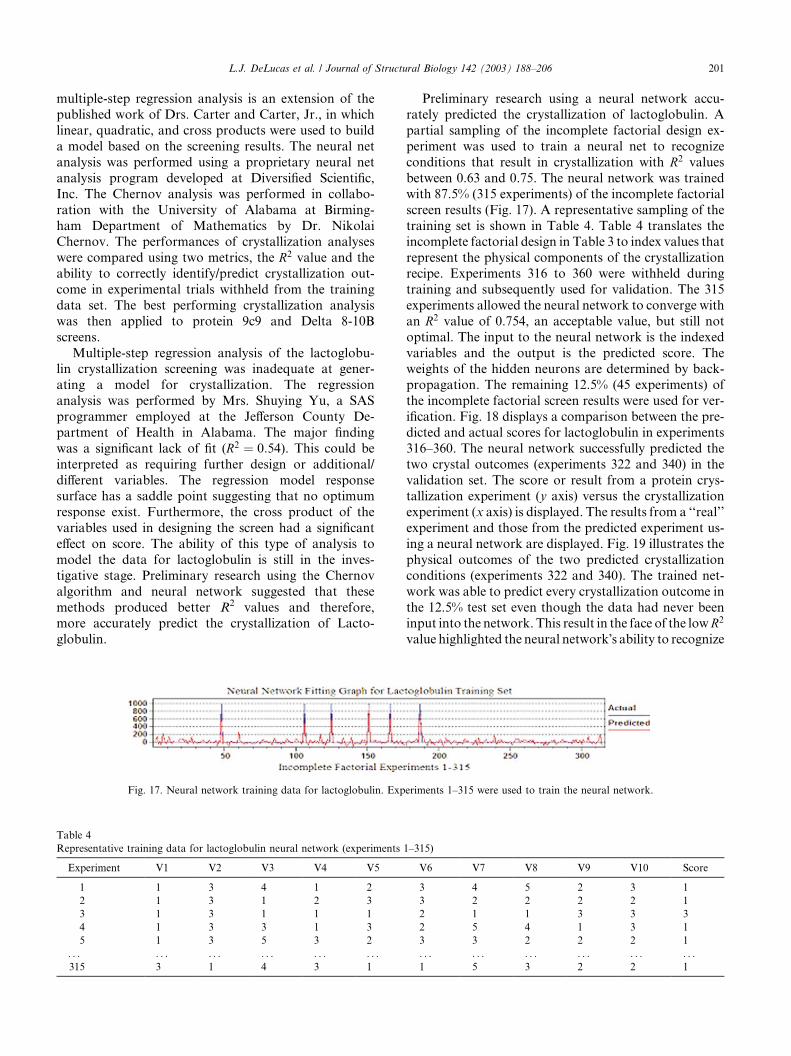
Preliminary research using a neural network accu-rately predicted the crystallization of lactoglobulin. A
partial sampling of the incomplete factorial design ex-
periment was used to train a neural net to recognize
conditions that result in crystallization with R2 values
between 0.63 and 0.75. The neural network was trained
with 87.5% (315 experiments) of the incomplete factorial
screen results (Fig. 17). A representative sampling of the
training set is shown in Table 4. Table 4 translates theincomplete factorial design in Table 3 to index values that
represent the physical components of the crystallization
recipe. Experiments 316 to 360 were withheld during
training and subsequently used for validation. The 315
experiments allowed the neural network to converge with
an R2 value of 0.754, an acceptable value, but still not
optimal. The input to the neural network is the indexed
variables and the output is the predicted score. Theweights of the hidden neurons are determined by back-
propagation. The remaining 12.5% (45 experiments) of
the incomplete factorial screen results were used for ver-
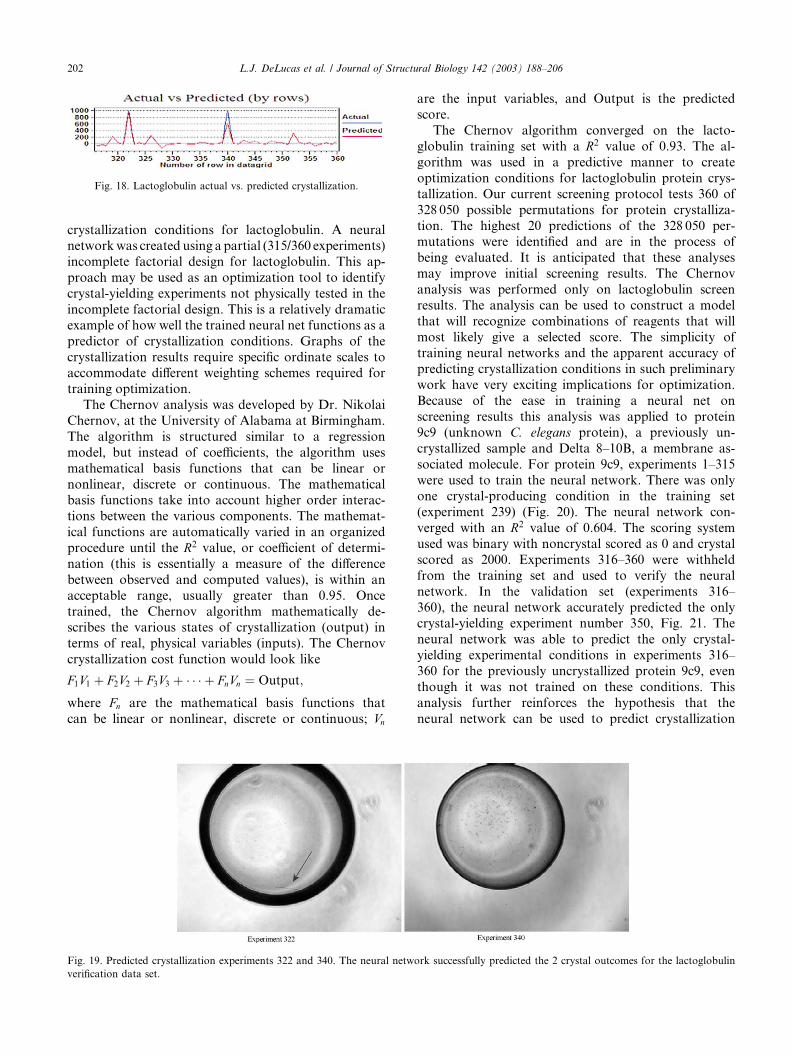
ification. Fig. 18 displays a comparison between the pre-
dicted and actual scores for lactoglobulin in experiments
316–360. The neural network successfully predicted the
two crystal outcomes (experiments 322 and 340) in the
validation set. The score or result from a protein crys-tallization experiment (y axis) versus the crystallization
experiment (x axis) is displayed. The results from a ‘‘real’’
experiment and those from the predicted experiment us-
ing a neural network are displayed. Fig. 19 illustrates the
physical outcomes of the two predicted crystallization
conditions (experiments 322 and 340). The trained net-
work was able to predict every crystallization outcome in
the 12.5% test set even though the data had never beeninput into the network. This result in the face of the lowR2
value highlighted the neural network�s ability to recognize
Fig. 17. Neural network training data for lactoglobulin. Experiments 1–315 were used to train the neural network.
Table 4
Representative training data for lactoglobulin neural network (experiments 1–315)
Experiment V1 V2 V3 V4 V5 V6 V7 V8 V9 V10 Score
1 1 3 4 1 2 3 4 5 2 3 1
2 1 3 1 2 3 3 2 2 2 2 1
3 1 3 1 1 1 2 1 1 3 3 3
4 1 3 3 1 3 2 5 4 1 3 1
5 1 3 5 3 2 3 3 2 2 2 1
. . . . . . . . . . . . . . . . . . . . . . . . . . . . . . . . . . . .315 3 1 4 3 1 1 5 3 2 2 1
L.J. DeLucas et al. / Journal of Structural Biology 142 (2003) 188–206 201
crystallization conditions for lactoglobulin. A neuralnetworkwas created using a partial (315/360 experiments)
incomplete factorial design for lactoglobulin. This ap-
proach may be used as an optimization tool to identify
crystal-yielding experiments not physically tested in the
incomplete factorial design. This is a relatively dramatic
example of how well the trained neural net functions as a
predictor of crystallization conditions. Graphs of the
crystallization results require specific ordinate scales toaccommodate different weighting schemes required for
training optimization.
The Chernov analysis was developed by Dr. Nikolai
Chernov, at the University of Alabama at Birmingham.
The algorithm is structured similar to a regression
model, but instead of coefficients, the algorithm uses
mathematical basis functions that can be linear or
nonlinear, discrete or continuous. The mathematicalbasis functions take into account higher order interac-
tions between the various components. The mathemat-
ical functions are automatically varied in an organized
procedure until the R2 value, or coefficient of determi-
nation (this is essentially a measure of the difference
between observed and computed values), is within an
acceptable range, usually greater than 0.95. Once
trained, the Chernov algorithm mathematically de-scribes the various states of crystallization (output) in
terms of real, physical variables (inputs). The Chernov
crystallization cost function would look like
F1V1 þ F2V2 þ F3V3 þ � � � þ FnVn ¼ Output;
where Fn are the mathematical basis functions that
can be linear or nonlinear, discrete or continuous; Vn
are the input variables, and Output is the predictedscore.
The Chernov algorithm converged on the lacto-
globulin training set with a R2 value of 0.93. The al-
gorithm was used in a predictive manner to create
optimization conditions for lactoglobulin protein crys-
tallization. Our current screening protocol tests 360 of
328 050 possible permutations for protein crystalliza-
tion. The highest 20 predictions of the 328 050 per-mutations were identified and are in the process of
being evaluated. It is anticipated that these analyses
may improve initial screening results. The Chernov
analysis was performed only on lactoglobulin screen
results. The analysis can be used to construct a model
that will recognize combinations of reagents that will
most likely give a selected score. The simplicity of
training neural networks and the apparent accuracy ofpredicting crystallization conditions in such preliminary
work have very exciting implications for optimization.
Because of the ease in training a neural net on
screening results this analysis was applied to protein
9c9 (unknown C. elegans protein), a previously un-
crystallized sample and Delta 8–10B, a membrane as-
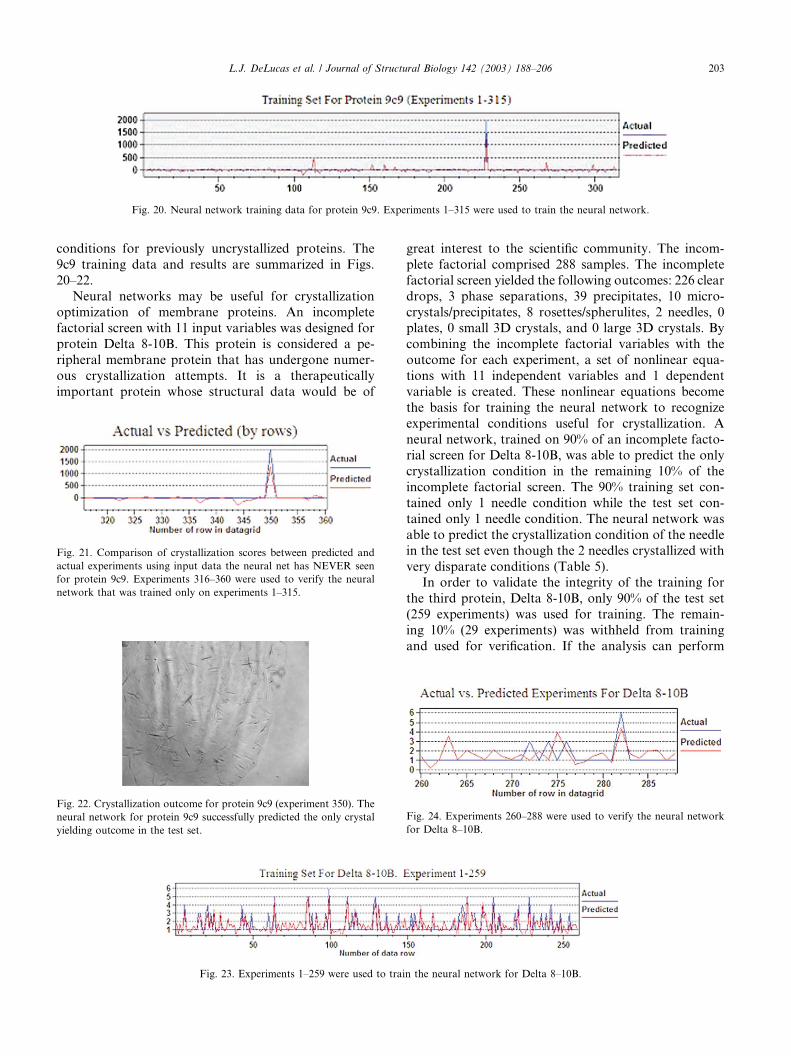
sociated molecule. For protein 9c9, experiments 1–315
were used to train the neural network. There was onlyone crystal-producing condition in the training set
(experiment 239) (Fig. 20). The neural network con-
verged with an R2 value of 0.604. The scoring system
used was binary with noncrystal scored as 0 and crystal
scored as 2000. Experiments 316–360 were withheld
from the training set and used to verify the neural
network. In the validation set (experiments 316–
360), the neural network accurately predicted the onlycrystal-yielding experiment number 350, Fig. 21. The
neural network was able to predict the only crystal-
yielding experimental conditions in experiments 316–
360 for the previously uncrystallized protein 9c9, even
though it was not trained on these conditions. This
analysis further reinforces the hypothesis that the
neural network can be used to predict crystallization
Fig. 19. Predicted crystallization experiments 322 and 340. The neural network successfully predicted the 2 crystal outcomes for the lactoglobulin
verification data set.
Fig. 18. Lactoglobulin actual vs. predicted crystallization.
202 L.J. DeLucas et al. / Journal of Structural Biology 142 (2003) 188–206
conditions for previously uncrystallized proteins. The
9c9 training data and results are summarized in Figs.
20–22.
Neural networks may be useful for crystallization
optimization of membrane proteins. An incompletefactorial screen with 11 input variables was designed for
protein Delta 8-10B. This protein is considered a pe-
ripheral membrane protein that has undergone numer-
ous crystallization attempts. It is a therapeutically
important protein whose structural data would be of
great interest to the scientific community. The incom-
plete factorial comprised 288 samples. The incomplete
factorial screen yielded the following outcomes: 226 clear
drops, 3 phase separations, 39 precipitates, 10 micro-
crystals/precipitates, 8 rosettes/spherulites, 2 needles, 0plates, 0 small 3D crystals, and 0 large 3D crystals. By
combining the incomplete factorial variables with the
outcome for each experiment, a set of nonlinear equa-
tions with 11 independent variables and 1 dependent
variable is created. These nonlinear equations become
the basis for training the neural network to recognize
experimental conditions useful for crystallization. A
neural network, trained on 90% of an incomplete facto-rial screen for Delta 8-10B, was able to predict the only
crystallization condition in the remaining 10% of the
incomplete factorial screen. The 90% training set con-
tained only 1 needle condition while the test set con-
tained only 1 needle condition. The neural network was
able to predict the crystallization condition of the needle
in the test set even though the 2 needles crystallized with
very disparate conditions (Table 5).In order to validate the integrity of the training for
the third protein, Delta 8-10B, only 90% of the test set
(259 experiments) was used for training. The remain-
ing 10% (29 experiments) was withheld from training
and used for verification. If the analysis can perform
Fig. 22. Crystallization outcome for protein 9c9 (experiment 350). The
neural network for protein 9c9 successfully predicted the only crystal
yielding outcome in the test set.
Fig. 23. Experiments 1–259 were used to train the neural network for Delta 8–10B.
Fig. 24. Experiments 260–288 were used to verify the neural network
for Delta 8–10B.
Fig. 21. Comparison of crystallization scores between predicted and
actual experiments using input data the neural net has NEVER seen
for protein 9c9. Experiments 316–360 were used to verify the neural
network that was trained only on experiments 1–315.
Fig. 20. Neural network training data for protein 9c9. Experiments 1–315 were used to train the neural network.
L.J. DeLucas et al. / Journal of Structural Biology 142 (2003) 188–206 203
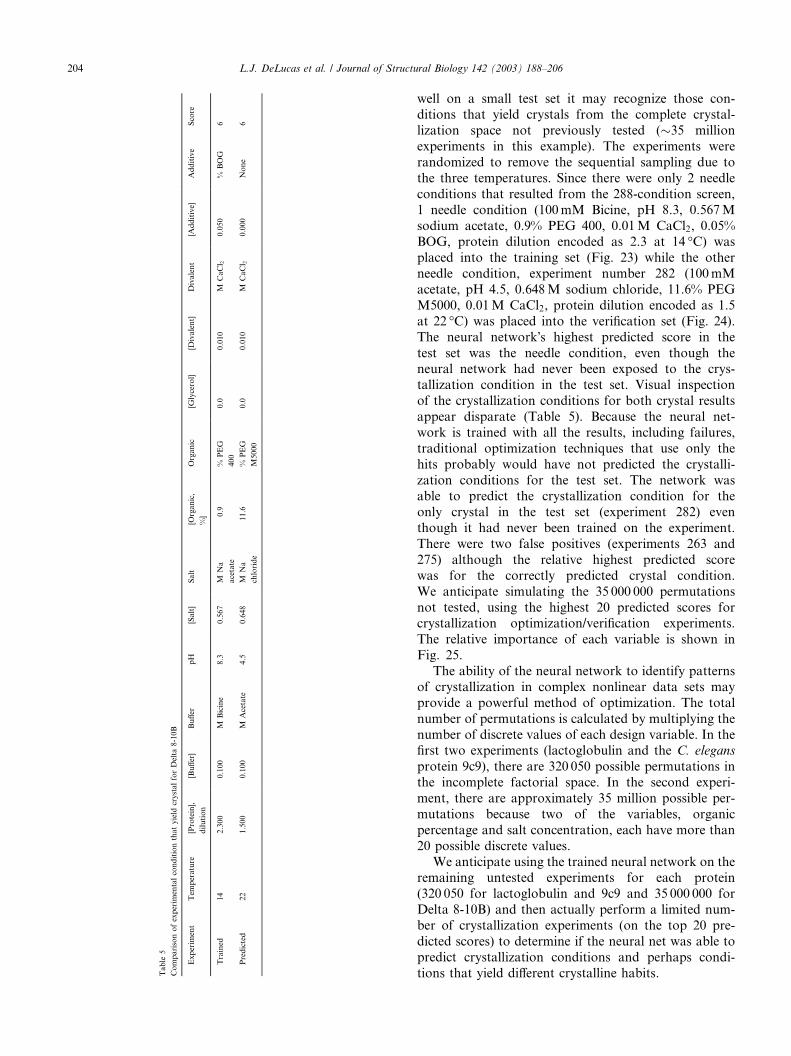
well on a small test set it may recognize those con-ditions that yield crystals from the complete crystal-
lization space not previously tested (�35 million
experiments in this example). The experiments were
randomized to remove the sequential sampling due to
the three temperatures. Since there were only 2 needle
conditions that resulted from the 288-condition screen,
1 needle condition (100mM Bicine, pH 8.3, 0.567M
sodium acetate, 0.9% PEG 400, 0.01M CaCl2, 0.05%BOG, protein dilution encoded as 2.3 at 14 �C) was
placed into the training set (Fig. 23) while the other
needle condition, experiment number 282 (100mM
acetate, pH 4.5, 0.648M sodium chloride, 11.6% PEG
M5000, 0.01M CaCl2, protein dilution encoded as 1.5
at 22 �C) was placed into the verification set (Fig. 24).
The neural network�s highest predicted score in the
test set was the needle condition, even though theneural network had never been exposed to the crys-
tallization condition in the test set. Visual inspection
of the crystallization conditions for both crystal results
appear disparate (Table 5). Because the neural net-
work is trained with all the results, including failures,
traditional optimization techniques that use only the
hits probably would have not predicted the crystalli-
zation conditions for the test set. The network wasable to predict the crystallization condition for the
only crystal in the test set (experiment 282) even
though it had never been trained on the experiment.
There were two false positives (experiments 263 and
275) although the relative highest predicted score
was for the correctly predicted crystal condition.
We anticipate simulating the 35 000 000 permutations
not tested, using the highest 20 predicted scores forcrystallization optimization/verification experiments.
The relative importance of each variable is shown in
Fig. 25.
The ability of the neural network to identify patterns
of crystallization in complex nonlinear data sets may
provide a powerful method of optimization. The total
number of permutations is calculated by multiplying the
number of discrete values of each design variable. In thefirst two experiments (lactoglobulin and the C. elegans
protein 9c9), there are 320 050 possible permutations in
the incomplete factorial space. In the second experi-
ment, there are approximately 35 million possible per-
mutations because two of the variables, organic
percentage and salt concentration, each have more than
20 possible discrete values.
We anticipate using the trained neural network on theremaining untested experiments for each protein
(320 050 for lactoglobulin and 9c9 and 35 000 000 for
Delta 8-10B) and then actually perform a limited num-
ber of crystallization experiments (on the top 20 pre-
dicted scores) to determine if the neural net was able to
predict crystallization conditions and perhaps condi-
tions that yield different crystalline habits.Table5
Comparisonofexperimentalconditionthatyield
crystalforDelta
8-10B
Experiment
Tem
perature
[Protein],
dilution
[Buffer]
Buffer
pH
[Salt]
Salt
[Organic,
%]
Organic
[Glycerol]
[Divalent]
Divalent
[Additive]
Additive
Score
Trained
14
2.300
0.100
MBicine
8.3
0.567
MNa
acetate
0.9
%PEG
400
0.0
0.010
MCaCl 2
0.050
%BOG
6
Predicted
22
1.500
0.100
MAcetate
4.5
0.648
MNa
chloride
11.6
%PEG
M5000
0.0
0.010
MCaCl 2
0.000
None
6
204 L.J. DeLucas et al. / Journal of Structural Biology 142 (2003) 188–206
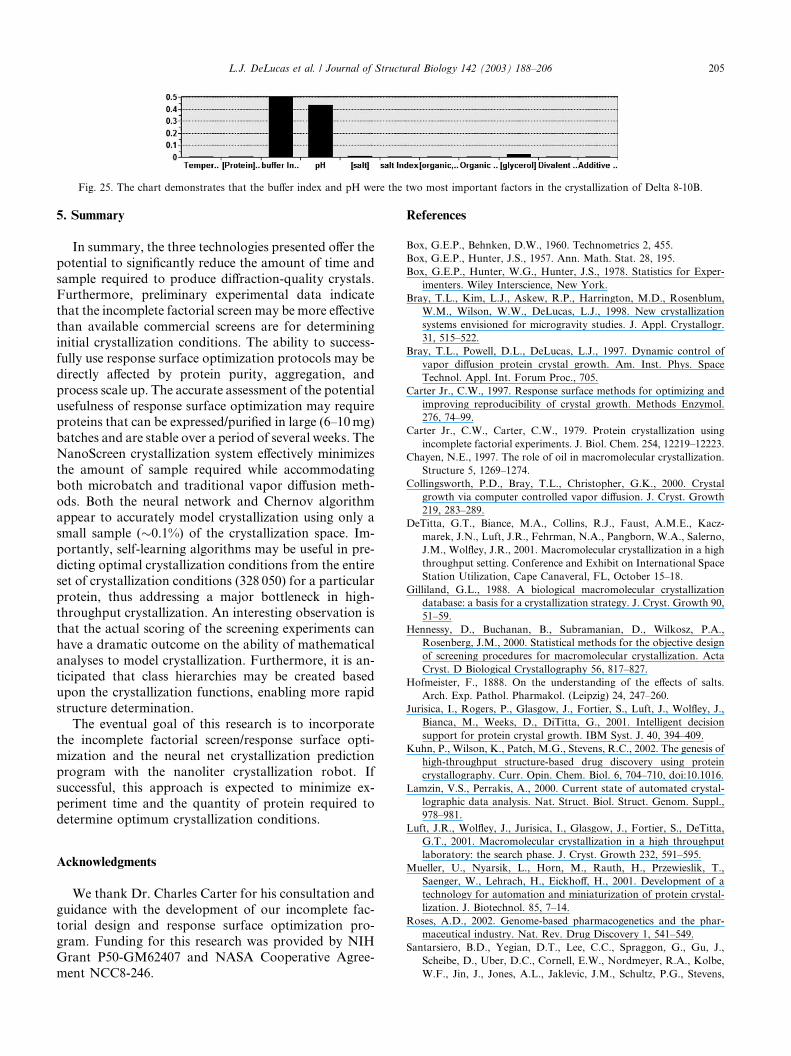
5. Summary
In summary, the three technologies presented offer the
potential to significantly reduce the amount of time and
sample required to produce diffraction-quality crystals.Furthermore, preliminary experimental data indicate
that the incomplete factorial screen may be more effective
than available commercial screens are for determining
initial crystallization conditions. The ability to success-
fully use response surface optimization protocols may be
directly affected by protein purity, aggregation, and
process scale up. The accurate assessment of the potential
usefulness of response surface optimization may requireproteins that can be expressed/purified in large (6–10mg)
batches and are stable over a period of several weeks. The
NanoScreen crystallization system effectively minimizes
the amount of sample required while accommodating
both microbatch and traditional vapor diffusion meth-
ods. Both the neural network and Chernov algorithm
appear to accurately model crystallization using only a
small sample (�0.1%) of the crystallization space. Im-portantly, self-learning algorithms may be useful in pre-
dicting optimal crystallization conditions from the entire
set of crystallization conditions (328 050) for a particular
protein, thus addressing a major bottleneck in high-
throughput crystallization. An interesting observation is
that the actual scoring of the screening experiments can
have a dramatic outcome on the ability of mathematical
analyses to model crystallization. Furthermore, it is an-ticipated that class hierarchies may be created based
upon the crystallization functions, enabling more rapid
structure determination.
The eventual goal of this research is to incorporate
the incomplete factorial screen/response surface opti-
mization and the neural net crystallization prediction
program with the nanoliter crystallization robot. If
successful, this approach is expected to minimize ex-periment time and the quantity of protein required to
determine optimum crystallization conditions.
Acknowledgments
We thank Dr. Charles Carter for his consultation and
guidance with the development of our incomplete fac-torial design and response surface optimization pro-
gram. Funding for this research was provided by NIH
Grant P50-GM62407 and NASA Cooperative Agree-
ment NCC8-246.
References
Box, G.E.P., Behnken, D.W., 1960. Technometrics 2, 455.
Box, G.E.P., Hunter, J.S., 1957. Ann. Math. Stat. 28, 195.
Box, G.E.P., Hunter, W.G., Hunter, J.S., 1978. Statistics for Exper-
imenters. Wiley Interscience, New York.
Bray, T.L., Kim, L.J., Askew, R.P., Harrington, M.D., Rosenblum,
W.M., Wilson, W.W., DeLucas, L.J., 1998. New crystallization
systems envisioned for microgravity studies. J. Appl. Crystallogr.
31, 515–522.
Bray, T.L., Powell, D.L., DeLucas, L.J., 1997. Dynamic control of
vapor diffusion protein crystal growth. Am. Inst. Phys. Space
Technol. Appl. Int. Forum Proc., 705.
Carter Jr., C.W., 1997. Response surface methods for optimizing and
improving reproducibility of crystal growth. Methods Enzymol.
276, 74–99.
Carter Jr., C.W., Carter, C.W., 1979. Protein crystallization using
incomplete factorial experiments. J. Biol. Chem. 254, 12219–12223.
Chayen, N.E., 1997. The role of oil in macromolecular crystallization.
Structure 5, 1269–1274.
Collingsworth, P.D., Bray, T.L., Christopher, G.K., 2000. Crystal
growth via computer controlled vapor diffusion. J. Cryst. Growth
219, 283–289.
DeTitta, G.T., Biance, M.A., Collins, R.J., Faust, A.M.E., Kacz-
marek, J.N., Luft, J.R., Fehrman, N.A., Pangborn, W.A., Salerno,
J.M., Wolfley, J.R., 2001. Macromolecular crystallization in a high
throughput setting. Conference and Exhibit on International Space
Station Utilization, Cape Canaveral, FL, October 15–18.
Gilliland, G.L., 1988. A biological macromolecular crystallization
database: a basis for a crystallization strategy. J. Cryst. Growth 90,
51–59.
Hennessy, D., Buchanan, B., Subramanian, D., Wilkosz, P.A.,
Rosenberg, J.M., 2000. Statistical methods for the objective design
of screening procedures for macromolecular crystallization. Acta
Cryst. D Biological Crystallography 56, 817–827.
Hofmeister, F., 1888. On the understanding of the effects of salts.
Arch. Exp. Pathol. Pharmakol. (Leipzig) 24, 247–260.
Jurisica, I., Rogers, P., Glasgow, J., Fortier, S., Luft, J., Wolfley, J.,
Bianca, M., Weeks, D., DiTitta, G., 2001. Intelligent decision
support for protein crystal growth. IBM Syst. J. 40, 394–409.
Kuhn, P., Wilson, K., Patch, M.G., Stevens, R.C., 2002. The genesis of
high-throughput structure-based drug discovery using protein
crystallography. Curr. Opin. Chem. Biol. 6, 704–710, doi:10.1016.
Lamzin, V.S., Perrakis, A., 2000. Current state of automated crystal-
lographic data analysis. Nat. Struct. Biol. Struct. Genom. Suppl.,
978–981.
Luft, J.R., Wolfley, J., Jurisica, I., Glasgow, J., Fortier, S., DeTitta,
G.T., 2001. Macromolecular crystallization in a high throughput
laboratory: the search phase. J. Cryst. Growth 232, 591–595.
Mueller, U., Nyarsik, L., Horn, M., Rauth, H., Przewieslik, T.,
Saenger, W., Lehrach, H., Eickhoff, H., 2001. Development of a
technology for automation and miniaturization of protein crystal-
lization. J. Biotechnol. 85, 7–14.
Roses, A.D., 2002. Genome-based pharmacogenetics and the phar-
maceutical industry. Nat. Rev. Drug Discovery 1, 541–549.
Santarsiero, B.D., Yegian, D.T., Lee, C.C., Spraggon, G., Gu, J.,
Scheibe, D., Uber, D.C., Cornell, E.W., Nordmeyer, R.A., Kolbe,
W.F., Jin, J., Jones, A.L., Jaklevic, J.M., Schultz, P.G., Stevens,
Fig. 25. The chart demonstrates that the buffer index and pH were the two most important factors in the crystallization of Delta 8-10B.
L.J. DeLucas et al. / Journal of Structural Biology 142 (2003) 188–206 205
R.C., 2002. An approach to rapid protein crystallization using
nanodroplets. J. Appl. Crystallogr. 35, 278–281.
Segelke, B.W., Rupp, B., Lekin, T.P., Krupka, H.I., Azarani, A.,
Todd, P., Wright, D., Wu, H.-C., 2002. The high speed Hydra-
Plus-One system for automated high-throughput protein crystal-
lography. Acta Crystallogr. D 58, 1523–1526.
Shaw Stewart, P.D., Baldock, P.F.M., 1999. Practical experimental
design techniques for automatic and manual protein crystallization.
J. Cryst. Growth 196, 665–673.
Further reading
Nagy, L., 2003. Screen conditions developed by CBSE investigator.
Temperature: 4, 15, and 22 �C. Protein concentration: 100, 65, and
35% of the provided stock. The stock is assumed to be highly
concentrated. Buffer pH: 4.5, 6, 7, 7.5, 8.3, 9. Total precipitant
(supersaturation S): chosen to give high, medium, and low concen-
trations relative to the amount of protein. For each precipitating
agent, an empirical constant, Ks, represents its molar strength as a
precipitating agent. The total amount of precipitant is calculated
using the empirical equation Ks1 ½Precip1 þ Ks2 ½Precip2 ¼ lnðSÞ�ln½macromolecule. Ratio of organic and ionic precipitants: chosen
to be 0.05 (organic precipitant is an additive), 0.4, 0.75. Glycerol
concentration: 0, 3, 6%. Ionic precipitant: chosen to reflect a variety
of basicities and Hofmeister behaviors, sodium acetate, sodium
chloride, sodium citrate, sodium malonate, ammonium sulfate, and
potassium thiocyanate.Where applicable, the salts are titrated to the
desired pH. Organic precipitant: MPD, polyethylene glycol 5000
monomethyl ether, and polyethylene glycols 400, 1450, 4000, and
8000. Divalent cations: none, 10mM calcium chloride and 10mM
magnesium chloride. Additives: none, 50mM arginine HCl, 0.05%
n-octyl-b-DD-glucopyranoside.
206 L.J. DeLucas et al. / Journal of Structural Biology 142 (2003) 188–206


