Embed Size (px)
Citation preview

phys. stat. sol. (b), 241, No. 10, 2268–2278 (2004) / DOI 10.1002/pssb.200404935
© 2004 WILEY-VCH Verlag GmbH & Co. KGaA, Weinheim
Crystallization in hafnia- and zirconia-based systems
S. V. Ushakov1, A. Navrotsky*, 1, Y. Yang2, S. Stemmer2, K. Kukli3, M. Ritala3, M. A. Leskelä3, P. Fejes4, A. Demkov5, C. Wang5, B.-Y. Nguyen5, D. Triyoso5,
and P. Tobin5 1 Thermochemistry Facility and NEAT ORU, University of California at Davis, One Shields Avenue,
Davis, CA 95616, USA 2 Materials Department, University of California at Santa Barbara, CA 93106-5050, USA 3 Department of Chemistry, PO Box 55, University of Helsinki, Helsinki, FIN-00014, Finland 4 Motorola, Inc., 2100 E. Elliot Rd., MD:EL622, Tempe, AZ 85284, USA 5 Motorola, Inc., 3501 Ed Bluestein Blvd., MD:K-10, Austin, TX 78721, USA
Received 20 March 2004, revised 1 May 2004, accepted 31 May 2004 Published online 19 July 2004
PACS 61.10.–i, 61.66.Dk, 65.40.–b, 68.37.Lp
Crystallization of hafnia and zirconia and their alloys with silica and lanthana was studied in bulk and thin film samples by thermal analysis, X-ray diffraction and electron microscopy. Crystallization temperatures of hafnia and zirconia increase by more than 300 °C with increase of surface/interface area of the amor-phous phase. Crystallization temperatures of zirconia and hafnia alloys with silica and lanthana increase with dopant content and exceed 900 °C for 50 mol% SiO2 and LaO1.5. Energies for tetragonal HfO2 and ZrO2 interfaces with amorphous silica were derived from their crystallization enthalpies from silicates as 0.25 ± 0.08 and 0.13 ± 0.07 J/m2, respectively. The crystallization pathways in bulk powders and films of zirconia and hafnia can be interpreted as resulting from thermodynamic stabilization by the surface energy term of tetragonal and amorphous phases over monoclinic.
© 2004 WILEY-VCH Verlag GmbH & Co. KGaA, Weinheim
1 Introduction
In recent years, hafnium and zirconium-based systems are being looked at closely in a quest for a high-permittivity gate dielectric to replace silicon oxide in advanced MOSFET. Though these systems were studied extensively for decades, previous work was concerned primary with material processing and properties relevant to refractory ceramic applications and precursors for synthesis [1, 2]. In contrast, gate dielectric materials will have high surface-to-volume ratio and will not be exposed to temperatures much above 1000 °C. The most stable form for both pure zirconium and hafnium oxides at temperatures below 1000 °C and atmospheric pressure is monoclinic (P21/c) also known as baddeleyite, after the naturally occurring zirconia mineral. However, in as-prepared thin films hafnium and zirconium oxides are often amorphous or nanocrystalline tetragonal. On annealing at processing conditions, crystallization and the tetragonal-to-monoclinic phase transition often take place. These transitions will control the electric properties of the film by affecting film microstructure and dielectric constant [3]. In bulk ZrO2 and HfO2, the monoclinic phase reversibly transforms into tetragonal (P42/nmc) at ~1160 and ~1650 °C, respectively, with a volume decrease of about 3.5% [1]. On further heating, both oxides transform to cubic fluorite-type (Fm3m) phase before melting. Neither glass nor any of the high-temperature phases can be quenched directly. However, amorphous and tetragonal zirconia and hafnia can be prepared as high-surface area materials. Increasing thermal stability of amorphous zirconia and
* Corresponding author: e-mail: [email protected], Phone: 530 752 3292, Fax: 530 752 9307

phys. stat. sol. (b) 241, No. 10 (2004) / www.pss-b.com 2269
© 2004 WILEY-VCH Verlag GmbH & Co. KGaA, Weinheim
hafnia-rich oxides by alloying with silica, alumina or large rare earths is also well known from ceramic-related works [1, 2]. Recently we reported some results of thermal analysis of bulk amorphous silicates and oxides of zirconium and hafnium, pure and doped with La and Y [4, 5]. In this paper new results on these systems are communicated and compared to experiments on crystallization of films prepared by pulsed laser and atomic layer deposition techniques. As will be shown, in the absence of coherent strain effects, phase transitions in these materials are well correlated when surface/interface area and composition are taken into account, implying thermodynamic control when surface/interface energies are not neglected.
2 Experimental
The deposition of hafnium oxide films and their characterization by high resolution transmission electron microscopy (HRTEM) was performed at Motorola, Inc. The sample of zirconium silicate film was de-posited at the University of Helsinki. HRTEM study of bulk hafnium silicate samples was performed at the University of California Santa Barbara. Synthesis of bulk samples, thermal analysis, room- and high temperature X-ray diffraction (XRD and HTXRD), scanning electron microscopy (SEM) and energy dispersive spectroscopy (EDS) were conducted at UC Davis.
2.1 Sample preparation
Amorphous HfO2 powders were prepared by precipitation from oxychlorides and oxynitrates with hydra-zine using a procedure known to produce high-surface area zirconium oxide [6, 7]. Aqueous 0.3 mol/l solution of HfO(NO3)2 (Alfa Aesar 99.9%) or HfOCl2 was added to hydrazine hydrate N2H4 · H2O in a 6:1 volume ratio. The resulting white precipitate either was washed and dried immediately or was di-gested at 100 ± 5 °C for about 150 hours. The digestion produced amorphous powder with high surface area which resulted in increase of crystallization temperature (Fig. 1). The highest crystallization temperature of
200
400
600
800
1000
02.0
exo
SA 2
DSC /µV
SA 180 m /g2
-29 kJ/mol
-15 kJ/mol
85 m /g
20 30 40 50 60
20 30 40 50 60
T
M
T
M
2 theta /deg
860 °C
870 °C
450 °C
500 °C
Fig. 1 (online colour at: www.pss-b.com) DSC traces (on the left, 20 °C/min heating rate) and HTXRD patterns (on the right, CuKα1 radiation, dwell 0.5–2 hours) for crystallization of amorphous HfO2 with varying surface area. Sample M, obtained by precipitation from oxychloride, crystallizes at ~500 °C into monoclinic phase with crystallite size about 6 nm. Sample T, obtained by precipitation from nitrate fol-lowed by digestion at 100 °C for 150 hours, crystallizes at 870 °C largely into tetragonal phase with crys-tallite size about 2.6 nm. The wide endothermic peaks below 300 °C, correspond to water and CO2 re-moval, as follows from TG and FTIR evolved gas analyses (not shown). Surface areas are labelled on the corresponding DSC traces. They were measured on samples quenched in DSC prior to crystallization, from temperatures as indicated on the plot.

2270 S. V. Ushakov et al.: Crystallization in hafnia- and zirconia-based systems
© 2004 WILEY-VCH Verlag GmbH & Co. KGaA, Weinheim
precipitated HfO2 (898 °C in oxygen at 20 °C/min heating rate) was reached when HfO(NO3)2 solution was used. The sample prepared under similar conditions but with HfOCl2 (99.998%, Alfa Aesar), crystal-lized at 819 °C. The sol-gel technique used for preparation of bulk amorphous zirconium and hafnium silicates and precipitation procedure used for preparation of La-doped hafnia have been described else-where [4, 5]. The sol-gel and precipitated samples were washed to remove Cl– and NO3
–. Samples were dried at 140 °C in air. Surface area was measured by nitrogen adsorption using BET technique on a Mi- cromeritics ASAP 2020 instrument. HfO2 PLD films were deposited on a platinum foil at room tempera-ture using oxygen as a background gas (20 Pa). ALD HfO2 film about 190 nm thick was deposited on (100) silicon substrate (SC2 clean). An amorphous about 200 nm thick zirconium silicate film was grown by atomic layer deposition (ALD) at 500 °C on Pt foil in a F120 ALD reactor [8] using 5500 cycles. The Si and Zr precursors used were Si(OC2H5)4 and ZrCl4, respectively, while H2O was applied as a complementary oxygen source after ZrCl4 pulses, analogously to the growth sequences described in the case of hafnium silicate films [9, 10].
2.2 Calorimetry, X-ray diffraction and electron microscopy
Thermal analysis on bulk samples and films deposited on Pt foil was performed on a Netzsch 449 (Selb, Germany) simultaneous thermal analyzer (STA) at 20 °C/min heating rate in platinum crucibles. For material from sol-gel and precipitation, 30 to 100 mg of powdered and pelletized sample were used for each experiment. For thermal analysis of the film deposited on Pt, the foil was pressed into the discs up to 800 mg. A portion of every bulk sample was first heated in STA to the temperature higher than 1100 °C and crystallization temperature and enthalpy was derived from the DSC exotherm. In additional experiments, new portions of sample were heated in the STA to the desired temperature (e.g. just before or after crystallization) and analyzed by XRD and TEM after cooling. Samples were heated in an oxygen flow of 40 ml/min. Using argon flow instead of oxygen for some experiments did not show significant effect on crystallization temperatures and enthalpies. Thermogravimetry (TG) and differential scanning calorimetry (DSC) traces were recorded and evolved gas was analyzed for some samples using a Bruker Equinox 55 IR spectrometer attached to the thermal analyzer. On heating, sol-gel derived and precipitated samples lost up to ~20 wt% from evolved water and CO2, depending on composition and time of exposure to air after drying. Most of the weight loss took place below 500 °C and correlated with wide endothermic peaks on DSC. On further heating weight loss normally did not exceed ~2 wt%. Crystallization onset and enthalpy were determined from the exotherms. Residual sample weight at the temperature after the exo-thermic peak on DSC was taken from TG traces for crystallization enthalpy calculation. Temperature cali-bration was done using the melting points of metal standards and sensitivity calibration was performed using the heat capacity of sapphire standard before each seria of experiments. Film samples deposited on one side of Si substrate were scanned at 5 °C/min from 40 to 800 °C in argon flow in drop transducer in a Setaram HT96 (Lyon, France) calorimeter. Fifty pieces of 1 cm2 substrate were used per experiment. Scintag PAD V and Inel-CPS120 powder diffractometers with CuKα radiation were used for XRD measurements. The latter was also used for HTXRD measurements in air with a heating rate of 10 °C/min and collection time 30 to 90 minutes. Error in temperature measurements was estimated not to exceed ±10 °C. Crystallite size and weight ratios of crystalline phases were refined from XRD patterns using whole profile (Rietveld) fitting routine as implemented in Jade software [11]. For most samples studied, it was not possible to reliably refine strain, thus peak broadening was attributed exclusively to crystallite size effects, unless noted otherwise. Since no atomic positions were reported for tetragonal hafnia phase, structural data for t-ZrO2 [12] were used in the refinements of samples containing tetragonal HfO2. FEI XL30 SEM was used for secondary electron (SE) imaging. HRTEM imaging of sol-gel derived HfO2–SiO2 glasses was performed at University of Santa Barbara using a JEOL 2010 transmission electron mi-croscope operating at 200 kV with a point-to-point resolution of 1.9 Å. TEM bright field (BF) imaging of the films studied were performed at Motorola using a Philips CM200 FEG operating at 200 kV. HRTEM imaging of bulk La-doped hafnia samples was performed at National Center for Electron Microscopy, Lawrence Berkeley National Laboratory on a Topcon 002b instrument (LaB6 filament at 200 kV).

phys. stat. sol. (b) 241, No. 10 (2004) / www.pss-b.com 2271
© 2004 WILEY-VCH Verlag GmbH & Co. KGaA, Weinheim
Table 1 Crystallization temperatures and phases in the film samples studied.
film ID deposition method
substrate thickness Tcr phase technique
HfO2 1 PLD Pt ~700 nm 959 °C T DSC, XRD HfO2 2 PLD Pt ~700 nm 454 °C DSC HfO2 3 ALD Si ~192 nm <600 °C M XRD ZrO2:SiO2 4 ALD Pt ~200 nm 891 °C DSC
3 Results
The crystallization temperatures and phases formed in film samples studied are listed in Table 1. Crystal-lization temperatures, enthalpies and phases formed for amorphous bulk hafnia, hafnium and zirconium silicates and Hf1–xLaxO2–x/2 presented in Table 2 and Figs. 1, 4–6.
3.1 Crystallization of HfO2 in bulk
Thermal analyses and XRD performed on amorphous HfO2 prepared by precipitation indicated that sam-ples with larger surface areas crystallize at higher temperatures (Fig. 1). This is consistent with the re-sults for amorphous zirconia [6, 7]. However, in contrast to zirconia, which always crystallizes into the tetragonal modification from the amorphous precursor, hafnia often crystallized directly into the mono-clinic phase and only amorphous HfO2 with high surface area formed the tetragonal phase on crystalliza-tion. DSC traces for low- and high-surface area samples show very distinct crystallization exotherms, but the enthalpy of crystallization of the tetragonal phase from high surface area hafnia sample (–15 kJ/mol) is almost factor of two smaller than that for crystallization of the monoclinic phase (–29 kJ/mol) in a low-surface area sample. Profile refinement of XRD pattern of tetragonal hafnia (Fig. 1T) indicates that the size of crystallites is smaller than 3 nm. The profile shape suggests the presence of some m-HfO2
Table 2 Crystallization temperatures and enthalpies of HfO2 and ZrO2 from bulk amorphous silicates. The average diameter of crystallites formed is given from XRD measurements.
(MO2)1–x
(SiO2)x mol% SiO2
Tcr, °C
Tend+50, °C
ph. Dcr (Tend+50)
a, nm
calc. SAb, m2/mol
∆Hcrc,
kJ per mole MO2 ph. Dcr (1100 °C)d, nm
M = Zr 10 653 710 t 6.9 19130 –19.8 ± 1.0(3) t 12.7 30 822 885 t 6.1 21640 –16.6 ± 1.1(4) t 8.4 50 890 970 t 4.3 30700 –16.0 ± 2.0(4) t 5.7 70 931 1025 t 2.8 47150 –15.0 ± 1.7(4) t 3.6 M = Hf 10 743 798 t 4.9 26630 –22.1 ± 1.0(3) t 5.8, m 6.4 30 938 1002 t 4.2 31060 –18.8 ± 0.4(3) t 6.5 50 991 1040 t 3.4 38370 –16.1 ± 0.6(4) t 4.1 70 1006 1050 t 2.5 52190 –14.8 ± 0.6(3) t 3.1
a ph. – HfO2(ZrO2) phases from XRD: t – tetragonal, m – monoclinic; Dcr – crystallite size of ZrO2 (HfO2) (±10%) from XRD on samples quenched after crystallization exotherm (Tend + 50 °C). bSurface area calculated assuming spherical single crystal particles and density 9.68 and 5.6 g/cm3, for HfO2 and ZrO2. cThe uncertainty is given as two standard deviations of the mean, the number of experiments is given in parentheses. dHfO2(ZrO2) polymorph and average crystallite size after heating to 1100 °C.

2272 S. V. Ushakov et al.: Crystallization in hafnia- and zirconia-based systems
© 2004 WILEY-VCH Verlag GmbH & Co. KGaA, Weinheim
reflections below 25° 2θ. If this monoclinic phase is included in the refinement, it may account for as much as 30 wt%. However, the results of multi-phase refinement on a pattern with such peak broadening are ambiguous. XRD of high-surface area HfO2 sample quenched in Netzsch 449 from 950, 1000 and 1060 °C indicate that 60–70 wt% of tetragonal phase was retained in the crystallites 4–6 nm in size. The sample quenched from 1200 °C was completely transformed into the monoclinic modification with crys-tallite size about 13 nm.
3.2 Crystallization of HfO2 in ALD and PLD films
As-received ALD film deposited on one side of a Si wafer was mostly amorphous with some tetragonal crystallites present as indicated by TEM and XRD. The average thickness of the film from TEM meas-urements was 192 nm. An interfacial silicon oxide layer 1.4 nm or thinner was detected. After annealing the samples at 600 °C for one hour in air and after heating at 5 °C/min to 800 °C in argon flow in the Setaram HT96 calorimeter, the film crystallized into the monoclinic modification as evident from XRD. It was not possible to reliably observe the crystallization heat effect in these conditions. A quantifiable peak on the heat flow trace was obtained in the same configuration from amorphous ZrO2 powder of about the same mass as the HfO2 film. Thermal analysis was performed on two thick HfO2 films (~700 nm) prepared at Motorola by pulsed laser deposition on a Pt substrate. The two films were of different quality: one was optically transparent and the other was white and opaque. The crystallization onset of the transparent film was 454 °C, which
25 30 35 402-Theta(°)
200
400
600
800
1000
1200
-8-6-4-20DSC /µV
99.299.5100.0
TG /%
T, °C
~4 nm
~20 nm
Exo
1250 °C
EGA - FTIR
Onset
Onset
1100 °C
910 °C959 °C
1154 °C
~300 °C
CO2
t
m m
Fig. 2 (online colour at: www.pss-b.com) Thermal analysis performed on a sample of HfO2 film (#1 in Table 1) prepared by pulsed laser deposition. DSC/TG traces show a weight loss below 500 °C with an endothermic heat effect. CO2 and water were detected by simultaneous analysis of the evolved gas by FTIR (left bottom). From XRD patterns taken at room temperature (left top), the first exothermic peak on the DSC trace (959 °C) corresponds to crystallization of tetragonal HfO2, and the second exothermic peak (1154 °C) is related to the tetragonal-to-monoclinic transformation induced by the increase in crystallite size from 4 to 20 nm. Micrographs on the right show (from bottom to the top): SEM SE image of as-received film, TEM BF images of the film quenched in DSC from 1050 °C and from 1250 °C.

phys. stat. sol. (b) 241, No. 10 (2004) / www.pss-b.com 2273
© 2004 WILEY-VCH Verlag GmbH & Co. KGaA, Weinheim
was consistent with thermal stability of amorphous HfO2 with low surface/interface area, as in thick ALD film and precipitated sample with no ageing. The crystallization onset of the opaque film was ob-served at 959 °C (Fig. 2) what was surprisingly high for such film thickness. HTXRD to ~1100 °C indi- cated that the tetragonal modification was formed first in this sample and it did not transform into mono-clinic on cooling. HfO2 was converted into monoclinic phase either by heating at 1100 °C for fifty hours or by heating to temperatures higher than 1250 °C. In both cases, an increase in crystallite size was ob-served. SEM and TEM images showed that the film had a large number of voids, and had the appearance of a particle agglomerate rather than that of a dense film (Fig. 2). Phase identification from electron dif-fraction agreed with XRD results. Neither XRD nor selected area electron diffraction allowed us to dis-tinguish reliably between cubic and tetragonal HfO2 in the samples. Average particle size from TEM images (Fig. 2) was 3.4 ± 0.7 nm for t-HfO2 in the film quenched after heating to 1050 °C and 29 ± 8 nm for m-HfO2 quenched after heating to 1250 °C.
3.3 Crystallization in sol-gel derived zirconium and hafnium silicates
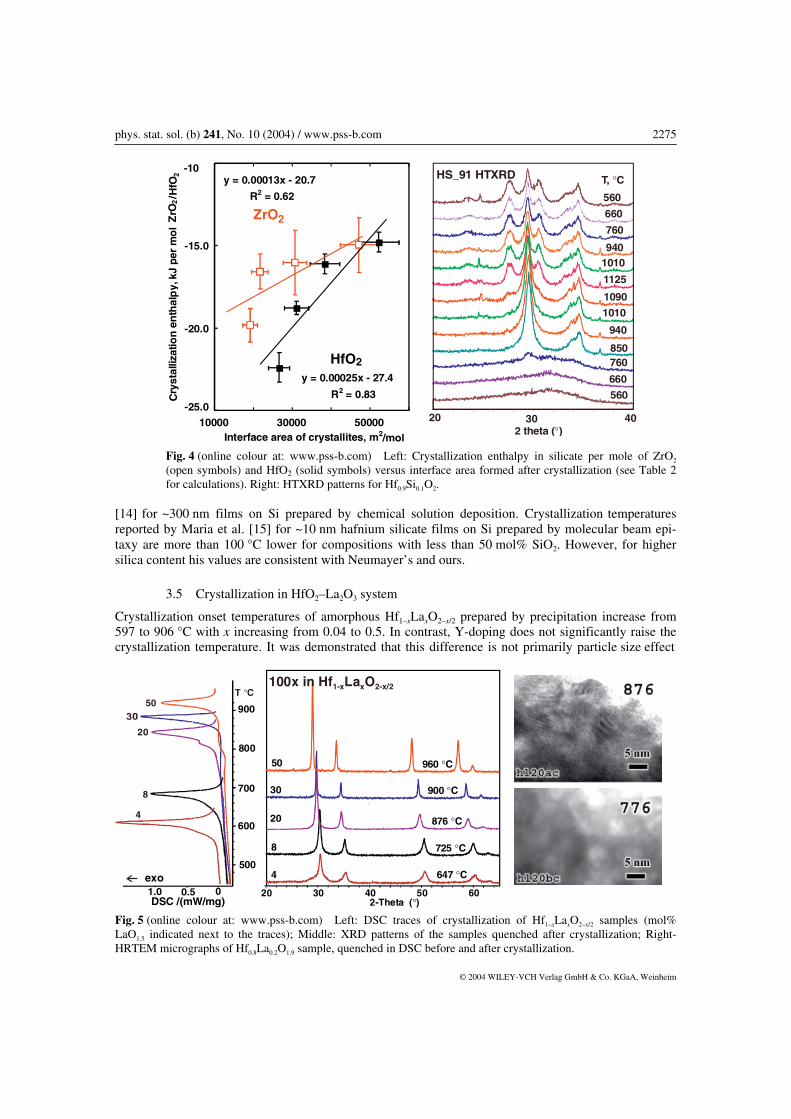
Table 2 summarizes the results of thermal analysis on zirconium and hafnium silicates. DSC traces and XRD patterns for these samples can be found in Ref. [4]. Tetragonal ZrO2 or HfO2 embedded in amor-phous silica was detected in all silicates after the exotherm on DSC. Crystallization onset temperature increases with increase of SiO2 content. Analysis of peak broadening indicates that crystallite size de-creases with increasing silica content. This is confirmed by HRTEM imaging of hafnium silicates with 10, 50 and 70 mol% SiO2 after crystallization (Fig. 3). The crystallization enthalpy per mole of HfO2 and ZrO2 decreases with increase of the silica content in the samples and with decrease of crystallite size after crystallization (Table 2). This confirms that the crystalline phase becomes energetically less stable with decreasing particle size. The average size of crystallites was refined from whole profile fitting of the XRD patterns, assuming no strain contribution to broadening. Interface area between amorphous SiO2 and ZrO2 or HfO2 was calculated assuming spherical crystallite shape. Unaccounted strain induced broadening would result in overestimation of surface area. Unaccounted deviation from spherical shape of crystallites would result in underestimation of surface area. For further calculations, the uncertainty in surface area estimation was taken as ±10%. The least squares fit through the values of crystallization enthalpy per mole of HfO2 or ZrO2 as a lin-ear function of interface area (A) after crystallization (∆Hcr = γA – b) gives correlation factors (R) = 0.9 and 0.8 (Fig. 4). The slope of the line corresponds to the energy of the interface formed, γ = 0.25 ± 0.08 for t-HfO2/am-SiO2 and γ = 0.13 ± 0.07 J/m2 for t-ZrO2/am-SiO2. From DSC traces and XRD patterns [4] crystallization in bulk silicates proceeds in one distinct step. However, HRTEM imaging (Fig. 3) detected some lattice fringes in the samples before crystallization. We were not able to detect unambiguously if these crystallites have identical d-spacing to the t-HfO2 phase, observed after crystallization. It is possible that metastable HfO2–SiO2 solid solutions may form which are energetically closer to amorphous phase than to tetragonal HfO2, and do not give a distinct heat effect in DSC. HRTEM images of bulk hafnium silicates also revealed phase separation prior to crystallization, on a scale similar to that observed in thin films [13]. This effect can be explained based on metastable ZrO2–SiO2 and HfO2–SiO2 phase diagrams and is discussed in detail by Stemmer et al. [13]. After cooling from 1100 °C the tetragonal phase was retained in all samples, except hafnium silicate with 10 mol% SiO2. From HTXRD data shown in Fig. 4, some crystallites of monoclinic modification appear at 1090 °C and the monoclinic fraction increase on sample cooling. Analysis of the selected area electron diffraction pattern of Hf0.9Si0.1O2 after heating to 1100 °C (hs91 in Fig. 3) indicates twinning in m-HfO2. The size of monoclinic and tetragonal crystallites after cooling was refined from XRD data to be 6 ± 2 nm. After heating to 1400 °C in the samples with 30 mol% SiO2, HfO2 and ZrO2 transformed into monoclinic modifications. In zirconium silicate with 70 mol% SiO2, the tetragonal phase was re-tained and the monoclinic phase was detected in trace amounts. In hafnium silicate with 70 mol% SiO2

2274 S. V. Ushakov et al.: Crystallization in hafnia- and zirconia-based systems
© 2004 WILEY-VCH Verlag GmbH & Co. KGaA, Weinheim
Fig. 3 HRTEM images of sol-gel derived (HfO2)1–x (SiO2)x . The samples were heated in oxygen at 20 °C/min to the temperatures indicated (in °C) in right upper corner of the micrographs. The samples quenched 50 °C before onset and 50 °C after the end of DSC exotherm are labelled as **ac and **bc in the lower left corner of the micrographs. and in zirconium silicate with 50 mol% SiO2, both tetragonal and monoclinic phases were found and the average size of retained tetragonal crystallites was refined as 16 ± 4 nm for HfO2 and 46 ± 2 nm for ZrO2. Traces of HfSiO4 (hafnon) were detected by XRD in HfO2:SiO2 only after repeated heating to 1400 °C.
3.4 Crystallization of ZrO2–SiO2 in ALD film
The structure and composition of 200 nm zirconium silicate film on Pt foil was analyzed by XRD and EDS. On the front side of the foil, the film is amorphous with 1.1 ± 0.1 Zr/Si atomic ratio. However, some material deposited on the back side of the foil was rich in zirconia (8:1 Zr/Si atomic ratio) and the ZrO2 was crystalline. Both monoclinic and tetragonal phases were observed with ratios varying with thickness on different analyzed spots. On heating the sample at 30 °C/min, the crystallization exotherm from amorphous zirconium silicate was observed. Crystallization onset, 891 °C, corresponds remarkably well to crystallization temperature of sol-gel derived silicate with the same stoichiometry (Table 2). Crystallization temperatures in our bulk silicates are also consistent with those reported by Neumayer et al.
phys. stat. sol. (b) 241, No. 10 (2004) / www.pss-b.com 2275
© 2004 WILEY-VCH Verlag GmbH & Co. KGaA, Weinheim
20
560
560
660
660
760
760
850
940
940
1010
1010
1090
1125
T, °C
2 theta (°)30 40
HS_91 HTXRD2R
y = 0.00013x - 20.7
= 0.62
y = 0.00025x - 27.4
R2 = 0.83-25.0
-20.0
-15.0
-10
10000 30000 50000Interface area of crystallites, m2/mol
Cry
stal
lizat
ion
enth
alp
y,kJ
per
mo
lr
fZ
O2/ H
O2
ZrO2
HfO2
Fig. 4 (online colour at: www.pss-b.com) Left: Crystallization enthalpy in silicate per mole of ZrO2 (open symbols) and HfO2 (solid symbols) versus interface area formed after crystallization (see Table 2 for calculations). Right: HTXRD patterns for Hf0.9Si0.1O2.
[14] for ~300 nm films on Si prepared by chemical solution deposition. Crystallization temperatures reported by Maria et al. [15] for ~10 nm hafnium silicate films on Si prepared by molecular beam epi-taxy are more than 100 °C lower for compositions with less than 50 mol% SiO2. However, for higher silica content his values are consistent with Neumayer’s and ours.
3.5 Crystallization in HfO2–La2O3 system
Crystallization onset temperatures of amorphous Hf1–xLaxO2–x/2 prepared by precipitation increase from 597 to 906 °C with x increasing from 0.04 to 0.5. In contrast, Y-doping does not significantly raise the crystallization temperature. It was demonstrated that this difference is not primarily particle size effect
20 30 40 50 602-Theta (°)
4
8
20
30
50
647 °C
725 °C
876 °C
900 °C
960 °C
8
20
30
50
500
600
700
800
900
00.51.0DSC /(mW/mg)
4
exo
8
20
50T °C
100x in Hf La O1-x x 2-x/2
Fig. 5 (online colour at: www.pss-b.com) Left: DSC traces of crystallization of Hf1–xLaxO2–x/2 samples (mol% LaO1.5 indicated next to the traces); Middle: XRD patterns of the samples quenched after crystallization; Right- HRTEM micrographs of Hf0.8La0.2O1.9 sample, quenched in DSC before and after crystallization.

2276 S. V. Ushakov et al.: Crystallization in hafnia- and zirconia-based systems
© 2004 WILEY-VCH Verlag GmbH & Co. KGaA, Weinheim
amorphous
mon
oclin
ic
tetra
gonal
mon
oclin
ic
a
b
c
dx
Surface/interface areaE
ntha
lpy
orG
ibbs
free
ener
gy
HfO2
HfO SiO2 2-
HfO -LaO2 1.5
ZrO -LaO2 1.5
mol% SiO or LaO2 1.5
ZrO SiO2 2-
T , °Ccr.
Fig. 6 (online colour at: www.pss-b.com) Left: Crystallization onset temperatures of sol-gel derived Hf1–xSixO2–x/2 and Hf1–xLaxO2–x/2 from precipitation. Right: Schematic energy map for HfO2. Path (ab) corre-sponds to crystallization directly into monoclinic phase (low surface area amorphous hafnia from precipi-tation (Fig 1,M), thick films (Table 1)). Path (cd) corresponds to crystallization directly into tetragonal phase (high surface area amorphous hafnia from precipitation (Fig 1,T), PLD film #1 (Table 1, Fig. 2), crystallization of HfO2 from amorphous Hf1–xSixO2). Path (d–x–b) corresponds to coarsening-induced tetragonal-to-monoclinic transformation, where x-surface/interface area at particle size or film thickness at which monoclinic-tetragonal stability crossover observed.
[5]. No lattice fringes were observed in the sample with 20 at% LaO1.5 prior to crystallization exotherm (Fig. 5). Cubic fluorite-type solid solutions formed first after crystallization with cell parameters increas-ing from ~5.1 to ~5.3 Å with increasing of La content from 4 to 50 at%. On further heating, these solid solutions decompose to pyrochlore Hf2La2O7 and monoclinic hafnia. These metastable solid solutions were also detected in ZrO2–LaO1.5 system [5]. Likewise in zirconium silicates versus hafnium silicates, crystallization temperatures in Zr1–xLaxO2–x/2 are about 100 °C lower than in hafnium samples of the same stoichiometry.
4 Discussion and summary
Crystallization of zirconia, hafnia and their alloys with SiO2 and La2O3 synthesized by precipitation, sol-gel, atomic layer and pulsed laser deposition was studied using thermal analysis, electron microscopy and X-ray diffraction. In pure amorphous zirconia and in high surface area hafnia, tetragonal polymorphs form on crystallization. They may transform to monoclinic after annealing. Crystallization temperatures of bulk ZrO2 and HfO2 increase with increasing surface or interface area. For precipitated HfO2 sample with surface area on the order of 200 m2/g, crystallization can be delayed by more than 300 °C compared to low surface area hafnia and thick films. The crystallization delay for amorphous nano-zirconia is of similar magnitude [6]. This is consistent with data for HfO2 nano-particles from PLD deposition studied here. However, for thin film geometry, the interface area is smaller than that achievable for nanoparticles of comparable dimensions. Gusev [16] reported that crystallization temperature of 5 nm thick HfO2 films on silicon was about 600 °C, which is 170 °C higher than for 40 nm films. The crystallization temperature of hafnia and zirconia in sol-gel derived silicate increases with silica content. Crystallization temperature observed in sol-gel derived samples is in agreement with reported data for ~300 nm films [14] and with the ~200 nm ALD film we studied. Tetragonal HfO2 crystal-

phys. stat. sol. (b) 241, No. 10 (2004) / www.pss-b.com 2277
© 2004 WILEY-VCH Verlag GmbH & Co. KGaA, Weinheim
lites occur in amorphous silica matrix upon crystallization. From decrease in crystallization enthalpy of HfO2 and ZrO2 with decrease in crystallite size formed, tetragonal HfO2-amorphous SiO2 inter- facial energy was derived as 0.25 ± 0.08 J/m2
and tetragonal ZrO2-amorphous SiO2 interface energy as 0.13 ± 0.07 J/m2. Increased thermal stability of the amorphous phase can also be achieved by alloying hafnia and zirco-nia with La2O3. Figure 6 demonstrates similar thermal stability of M0.8A0.2Ox (where M = Zr or Hf, and A = Si or La). Since La2O3 has much higher permittivity than SiO2, Hf1–xLaxO2–x/2 may be superior to silicates as a gate dielectric [5]. Notably, Hf2La2O7 and Zr2La2O7 pyrochlores are the only compounds, in the hafnia and zirconia-based systems, which could be grown epitaxially on silicon [17, 18]. The fluorite type phase, which we detected on crystallization of an amorphous phase of the same stoichiometry, was found to co-exist with pyrochlore in the experiments on epitaxial growth. It is being increasingly recognized, that stabilization in thin films and nanomaterials of the crystal structures that would be metastable in bulk is largely thermodynamic in nature [19–23]. Stabilization of tetragonal structure over monoclinic in ZrO2 samples with high surface area is widely regarded as a re-sult of a surface energy contribution [19]. The critical particle size at which tetragonal-monoclinic en-ergy crossover occurs for ZrO2 was reported to be around 30 nm, but it is strongly dependent on the stresses present at any given temperature. Amorphous zirconia always crystallizes in the tetragonal modi-fication and may partially or completely transform into monoclinic on cooling, depending on the anneal-ing temperature and time. However, in films thinner than 7 nm, where coarsening is restricted, ZrO2 retains the tetragonal modification after annealing [24], indicating thermodynamic nature of stabilization. In 5–15 nm hafnia films, as-grown by ALD at 325 °C, m-HfO2 and t-HfO2 were detected [25], whereas only t-ZrO2 is observed in the zirconia films grown at the same conditions [26]. Recently, high-temperature oxide melt solution calorimetry was used to measure excess enthalpies of nanocrystalline tetragonal, monoclinic and amorphous zirconia with respect to coarse monoclinic zirco-nia and the energy map for nanocrystalline zirconia was constructed [7]. Monoclinic ZrO2 was found to have the largest surface enthalpy and amorphous zirconia the smallest. It is expected, that these relation-ships are generally valid for hafnia. However, t-HfO2 would have stabilized at smaller crystallite size and for narrower range of surface/interface area. This is consistent with the much higher transition tempera-ture for the m-t transition in HfO2 than in ZrO2 [1]. The schematic energy map for hafnia is shown on Fig. 6 with crystallization paths observed for HfO2 particles and films marked. Point x on energetic map for HfO2 in Fig. 6 corresponds to stability crossover between monoclinic and tetragonal polymorphs. It depends on the energetics of the bulk phases (intercepts at zero interface area) and might be different for different interfaces (e.g. HfO2/HfO2, HfO2/vac, HfO2/SiO2), changing with slopes of the lines corresponding to surface/interface energies. From this work, critical particle size for tetragonal to monoclinic transition in HfO2 was in the range 6 ± 2 nm, as observed in precipitated HfO2 (Fig. 1), in deposited by PLD material (Fig. 2), and in HfO2 with 10 mol% SiO2. (Fig. 4). The thickness of the film which would provide similar interface area is about 2 nm. Of course, this stability crossover can only be observed if permitted by the kinetics and presence of strain can affect it significantly. In this work, we observed tetragonal HfO2 crystallites up to 16 nm retained in amorphous silica matrix in silicate with 70 mol% SiO2. This increase in critical size compared with pure and low-silica HfO2 is related to volume increase on tetragonal-to-monoclinic transition and can be classified as a strain, or matrix effect. Direct measurements of surface/interface energies for HfO2 by solution calorimetry can provide independent estimate of critical sizes and such measurements are in pro-gress.
Acknowledgements The work performed at the UC Davis Thermochemistry Facility was supported by the UC-SMART program and Motorola as part of the project “Thermochemistry of gate dielectric films”. We acknowledge the National Center for Electron Microscopy at the Lawrence Berkeley National Laboratory for the use of its facili-ties. We wish to thank Ms. Lorraine Johnston, Motorola Inc. for FIB sample preparation. S. S. and Y. Y. thank SRC and Sematech for support.

2278 S. V. Ushakov et al.: Crystallization in hafnia- and zirconia-based systems
© 2004 WILEY-VCH Verlag GmbH & Co. KGaA, Weinheim
References
[1] H. P. Wang and R. L. Stevens, J. Mater. Sci. 27(20), 5397–5430 (1992). [2] V. B. Glushkova and V. A. Krzhizhanovskaya, Ceram. Int. 11(3), 80 (1985). [3] X. Zhao and D. Vanderbilt, Phys. Rev. B 65, 233106 (2002). [4] S. V. Ushakov, C. E. Brown, A. Navrotsky, A. Demkov, C. Wang, and B. Y. Nguyen, Mater. Res. Soc. Symp.
Proc. 745, 3 (2003). [5] S. V. Ushakov, C. E. Brown, and A. Navrotsky, J. Mater. Res. 19(3), 693 (2004). [6] D. Ciuparu, A. Ensuque, G. Shafeev, and F. Bozon-Verduraz, J. Mater. Sci. Lett. 19, 931 (2000). [7] M. W. Pitcher, S. V. Ushakov, A. Navrotsky, B. F. Woodfield, G. Li, J. Boerio-Goates, and B. M. Tissue,
J. Am. Ceram. Soc., in press (2004). [8] T. Suntola, Thin Solid Films 216(1), 84 (1992). [9] K. Kukli, M. Ritala, M. Leskelä, T. Sajavaara, J. Keinonen, D. C. Gilmer, and P. J. Tobin, Mater. Sci. Eng. B
109(1–3), 2–5 (2004). [10] K. Kukli, M. Ritala, M. Leskelä, T. Sajavaara, J. Keinonen, R. Hegde, D. C. Gilmer, and P. Tobin, J. Electro-
chem. Soc., in press (2004). [11] JADE, Materials Data Inc., 2002. [12] J. Malek, L. Benes, and T. Mitsuhashi, (ICSD 85322) Powder Diffr. 12(2), 96 (1997). [13] S. Stemmer, Z. Chen, C. Levi, P. S. Lysaght, B. Foran, J. A. Gisby, and J. R. Taylor, Jpn. J. Appl. Phys.
42(6A), 3593 (2003). [14] D. A. Neumayer and E. Cartier, J. Appl. Phys. 90(4), 1801 (2001). [15] J.-P. Maria, D. Wickaksana, J. Parrette, and A. I. Kingon, J. Mater. Res. 17(7), 1571 (2002). [16] E. Gusev, C. Cabral, Jr, M. Copel, C. D. Emic, and M. Gribelyuk, Microelectron. Eng. 69, 145 (2003). [17] J. W. Seo, J. Fompeyrine, A. Guiller, G. Norga, C. Marchiori, H. Siegwart, and J.-P. Locquet, Appl. Phys. Lett.
83(25), 5211 (2003). [18] A. Dimoulas, G. Vellianitis, G. Apostolopoulos, G. Mavrou, A. Travlos, J. C. Hooker, and Z. M. Rittersma,
Abstracts Mater. Res. Soc. 2003 Fall Meeting 146 (2003). [19] R. G. Garvie, J. Phys. Chem. 69(4), 1238 (1965); idem. ibid., 82(2) 218 (1978). [20] J. M. McHale, A. Auroux, A. J. Perrota, and A. Navrotsky, Science 277, 788 (1997). [21] S. A. Dregia, R. Banerjee, and H. L. Fraser, Scr. Mater. 39(2), 217 (1998). [22] A. Navrotsky, in: Nanoparticles and the Environment, edited by J. F. Banfield and A. Navrotsky, (Reviews in
Mineralogy & Geochemistry 2001) Vol. 44, pp. 73–103. [23] M. R. Ranade, A. Navrotsky, H. Z. Zhang, J. F. Banfield, S. H. Elder, A. Zaban, P. H. Borse, S. K. Kulkarni,
G. S. Doran, and H. J. Whitfield, Proc. Natl. Acad. Sci. 99 [suppl. 2], 6476 (2002). [24] C. Zhao, V. Cosnier, P. J. Chen, O. Richard, G. Roebben, J. Maes, S. van Elshocht, H. Bender, E. Young,
O. van Der Biest, M. Caymax, W. Vandervorst, S. De Gendt, and M. Heyns, Mat. Res. Soc. Symp. Proc. 745, 9 (2003).
[25] K. Kukli, J. Ihanus, M. Ritala, and M. Leskelä, Appl. Phys. Lett. 68(26), 3737 (1996). [26] K. Kukli, J. Ihanus, M. Ritala, and M. Leskelä, J. Electrochem. Soc. 144, 300 (1997).


