Embed Size (px)
Citation preview

International Journal of Automotive Technology, Vol. 16, No. 5, pp. 849−863 (2015)
DOI 10.1007/s12239−015−0087−1
Copyright © 2015 KSAE/ 086−15
pISSN 1229−9138/ eISSN 1976−3832
849
FRICTIONAL CHARACTERISTICS OF STEEL SHEETS USED IN
AUTOMOTIVE INDUSTRY
T. TRZEPIECI SKI1), A. BAZAN1) and H. G. LEMU2)*
1)Faculty of Mechanical Engineering and Aeronautics, Rzeszow University of Technology, Al. Powstañców Warszawy 12, 35-959 Rzeszów, Poland
2)Faculty of Science and Technology, University of Stavanger, N-4036 Stavanger, Norway
(Received 22 July 2014; Revised 24 September 2014; Accepted 14 November 2014)
ABSTRACT−In this paper the results of experimental tests aimed to determine the friction coefficient in sheet metal forming
operations for various sheet metal materials and at different operative conditions are presented. The research has considered
the frictional characterization of three kinds of drawing quality steels that are commonly used in automotive industry. These
are a drawing quality steel (DQ), a deep drawing quality steel (DDQ), and extra deep drawing quality steel (EDDQ). For
measurement of the sheet surface topography, a 3D stylus instrument Alicona InfiniteFocus was used. To determine the
friction coefficient three tribological tests, i.e. a strip drawing test, a draw bead test and a pin-on-disc tribometer, have been
conducted. The experimental results have ascertained several relationships showing the effect of sheet metal surface
roughness, lubricant conditions and sheet orientation on the value of friction coefficient in sheet metal forming processes. The
results further showed that the surface topography and sample orientation in the rolling direction of the sheet are significant
factors that influence the friction coefficient. It was found that the tested steel sheets, selected from automotive industry
applications, exhibit anisotropic resistance to the friction corresponding to the measured orientation in relation to the rolling
direction of the sheet.
KEY WORDS : Friction, Friction anisotropy, Strip drawing test, Coefficient of friction, Draw-bead test, Sheet metal forming
1. INTRODUCTION
The developments in the automotive industry within the
last decades has demanded the actual vehicle designs to be
innovative and robust (Kim et al., 2014) in order to
achieve, among others, short product development period,
very high safety standards of the body panels and the
overall reduced weight (Park and Dang, 2011). Such
vehicles require stronger and lighter materials (Bae and
Huh, 2012; Cho et al., 2013). One of the new market
requirements in the design of body panels for vehicles and
various other industries is the development of sheet metal
forming technologies that can optimize the performance of
the panels. In this respect, deep drawing process of a sheet
metal is widely used in the automotive industry (Guillon et
al., 2001; Wiklunda et al., 2004). Resistance to friction is
one of the main factors limiting the sheet metal forming
process (Darendeiler et al., 2002). Friction in sheet metal
forming depends on several parameters such as the contact
pressure, sliding velocity, sheet metal and tool surface
roughness, tool and blank material, lubrication, etc.
Moreover, resistance to friction depends on physicochemical
factors acting on the contact surface, dynamics of loads and
temperature (Matuszak, 2000). Friction between the sheet
and tool during the forming process is influenced not only
by the surface topography, but also by several parameters
such as lubricant, surface chemistry, contact pressure, and
sliding speed (Wilhborg and Gunnarsson, 2000). Friction
on contact surface brakes free metal flow that results in
deformed metal of distinguish zones with different
deformation extent. Friction in the deep drawing process,
in particular, increases the inequality of deformation and
loading force value and thus worsens the quality of the
drawpiece surface (Choi et al., 2013). As a result,
clarification of friction is essential for modelling and
analysis of the sheet metal forming processes.
Several kinds of friction tests have been developed to
determine coefficient of friction in different regions of
formed drawpiece (Bay et al., 2008). Among others, the
most often used test methods are the strip drawing test,
drawbead simulator friction test and bending under tension
test. Strip drawing test is one of these techniques and
allows different tool geometry configurations: flat/flat, flat/
cylinder and cylinder/cylinder (Guillon et al., 2001; Roizard
et al., 2009). In this test, the macroscopic coefficient of
friction is easily measured and usually used to characterise
the lubricated contact between tool and metal sheet. The
bending under tension (BUT) test simulates the die radius
Né
*Corresponding author. e-mail: [email protected]
850 T. TRZEPIECI SKI, A. BAZAN and H.G. LEMUNé
conditions in a stamping tool (Lemu and Trzepieci ski,
2013).
The results from the BUT test show that the surface
topography is a significant factor for the frictional behaviour
of uncoated steel sheets (Wiklunda et al., 2004). (Han,
1997) performed both drawing test and stretching under
bending test by changing punch corner radii and investigated
the friction characteristics affected by punch corner radii.
(Azushima et al., 1991) developed a sheet drawing apparatus
characterized by a transparent quartz die and the increase of
friction coefficient at increased drawing speed was
interpreted in terms of the measured volume of the surface
pockets trapping lubricant. (Fratini et al., 2006) evaluated
the coefficient of friction by considering parameters such
as the variation of the contact area during metal flow using
dedicated fixture that was designed and set-up in
accordance with the one proposed by (Wilson, 1978). The
draw bead simulator (DBS) friction test was developed by
(Nine, 1978) to model friction in region of stamping tool
where the metal passes through the drawbead. It is
common in sheet metal forming simulation to use an
equivalent drawbead instead of using the real geometry of
the drawbead (Larrson, 2009).
The nature of interactions between asperities in the near-
surface material in a lubricated contact depends on the
surface roughness and texture, including the lay of waviness
(Ajayi et al., 2009). For anisotropic surface texture, the
interaction between asperities in dry and lubricated
contacts is expected to be non-uniform in all directions.
This condition may produce a directional effect on the
measured friction. This phenomenon may be determined
using the pin-on-disc test (Ajayi et al., 2009; Trzepieciñski
and Lemu, 2012). (Kim et al., 2012) developed the
pressure dependence on the anisotropic friction model
using the draw-bend friction test.
The objective of this article is multi-factoral frictional
study of three grades of deep drawing steel sheets that are
commonly used in automotive industry. To determine the
friction coefficient three tribological tests: a pin-on-disc
tribometer, a strip drawing test and a draw bead test have
been conducted. The several relations between the value of
the friction coefficient and specimen orientation, normal
load, friction measurement orientation in relation to the
rolling direction of the sheet, surface roughness of tools
and lubricant conditions are studied. Furthermore, the
estimation of the changes in the surface roughness of the
steel sheet was done.
2. MATERIALS
In this research conducted to characterise friction in sheet
metal forming for the automotive industry, three kinds of
low carbon steel sheets, namely, a drawing quality steel
(DQ), a deep drawing quality steel (DDQ), and extra deep
drawing quality steel (EDDQ) were examined. A tensile
test in the universal testing machine was carried out to
determine the mechanical properties. The mechanical
properties determined in this test (as given in Table 1) are
yield stress σy, ultimate strength σu, ultimate elongation εu,
anisotropy coefficient r, strain hardening coefficient C and
strain hardening exponent n. The samples for the tensile
tests were cut in two orthogonal directions: along the
rolling direction (0o) and transverse to the rolling direction
(90o).
The measurement of surface roughness parameters was
carried out using the Alicona InfiniteFocus instrument. The
né
Table 1. Mechanical properties of the tested sheets.
MaterialThickness
(mm)Orientation
(o)
Mechanical properties
σy (MPa) σu (MPa) εu C (MPa) n r
DQ 10 193 351 0.36 554 0.166 1.212
90 193 353 0.34 563 0.174 1.410
DDQ 0.80 196 336 0.42 557 0.192 1.464
90 198 311 0.41 526 0.177 1.902
EDDQ 10 151 282 0.44 494 0.221 1.630
90 153 287 0.42 487 0.211 1.638
Table 2. Surface roughness parameters of the tested sheets.
Material
Surface roughness parameters
Sa Sq Sp Sv Ssk Sku Sz Sds* Str Sbi Sci Svi
(µm) (µm) (µm) (µm) (µm) (Peaks/mm2)
DQ 0.302 0.376 2.37 1.39 0.267 3.48 3.26 749 0.029 0.241 1.64 0.110
DDQ 0.340 0.423 2.48 1.62 0.298 3.34 3.3 697 0.036 0.243 1.67 0.094
EDDQ 0.362 0.41 2.98 2.08 0.338 3.67 3.51 685 0.041 0.255 1.58 0.112

FRICTIONAL CHARACTERISTICS OF STEEL SHEETS USED IN AUTOMOTIVE INDUSTRY 851
main standard 3D parameters determined by this
measurement are the roughness average Sa, the root mean
square roughness parameter Sq, the highest peak of the
surface Sp, the maximum pit depth Sv, the surface
skewness Ssk, the surface kurtosis Sku, the 10-point peak-
valley surface roughness Sz, the density of summits Sds,
the texture aspect ratio of the surface Str, the surface
bearing index Sbi, the core fluid retention index Sci and the
valley fluid retention index Svi. The values of these
measured parameters are given in Table 2. The results of
surface roughness measurements clearly show that the used
steel sheets have narrow range of Sa parameter value. It
seems that this allows determination of the effect of
mechanical properties of the sheets on the value of friction
coefficient. The surface topography views of the steel
sheets are shown in Figure 1, where each sample has an
area of 1.0849 mm × 1.0849 mm. The values of roughness
parameters presented in the table are average values from
the three measurements in three places on the sample.
Since the tested sheets are characterised by a similar value
of Sa parameter, the decisive significance of this parameter
may have directionality of surface topography, which was
previousely studied by (Ajayi et al., 2009; Masuko et al.,
2005; Xiao et al., 2004).
3. TEST METHODS
3.1. Tribometer
The friction properties of the low carbon steel sheets used
in the experiments were determined by using the pin-on-
disk tribometer T01-M, strip drawing test and draw bead
simulator (DBS). Thed friction tests were carried out for
two friction conditions: dry and lubricated. Dry friction
was realized by degreasing the surface of the specimens by
using acetone while machine oil L-AN 46 of 44 mm2 s-1
viscosity at 40oC was used for lubricated conditions. The
oil was distributed uniformly on the surface of the samples
using a teflon shaft. This method of application of grease
was used in all tests discussed in the paper. T01-M pin-on-
disk machine is intended for the determination of friction
and wear of engineering materials (Antoszewski et al.,
2008). This machine makes it possible to determine the
wear resistance and friction coefficient for a pair of
materials sliding against each other, depending on sliding
velocity and applied load. The experiment was carried out
in accordance with the ASTM G 99 and DIN 50324
standards described in the machine service manual (Pin-on-
disc tribometer, 1999).
The tribosystem consists of the stationary ball pressed at
the required load FN against the disk rotating at a defined
speed n (Figure 2). The operating parameters defined for
the pin-on-disk CSM® tribometer tester were as follows:
normal load 6 N, 9 N and 12 N; linear slipping speed
1 mm/s and specimen angular velocity 0.045 rad/s. The
ball in bearing steel 100Cr6 has a diameter of 6 mm.
The ball has an isotropic surface finish and texture.
During the tests, the friction force and the slip distance for
the first disk revolution were measured where a computer
program was used to register and control the values of the
friction force as a function of time. The value of friction
coefficient value was determined based on the values of
both normal FN and friction FT forces from the formulae:
μ = FT/FN (1)
3.2. Strip drawing test
Figure 1. Views of surface of steel sheets: (a) DQ, (b) DDQ and (c) EDDQ.
Figure 2. View of measuring station.

852 T. TRZEPIECI SKI, A. BAZAN and H.G. LEMUNé
The strip drawing test and DBS test were previousely
carried out by special friction simulator (Lemu and
Trzepieciñski, 2013) built based on Nine’s concept (1978).
Friction strip drawing tests were conducted by using
friction simulator where the sheet strip was placed between
two fixed cylindrical rolls with equal radii (Figure 3). The
tests were done in such a way that a strip of the sheet was
clamped with specified force between two cylindrical rolls
of equal radii of 20 mm. Values of both forces, the
clamping force FC and the pulling force FP, were constantly
recorded using electric resistance strain gauge technique, 8-
channel universal amplifier of HBM's QuantumX data
acquisition system and a computer (PC). Samples were
prepared as strips having 20 mm width and about 200 mm
length, cut along rolling direction and transverse direction
of the sheet. Four sets of rolls (Figure 4) with different value
of a roughness average Ra measured along generating line of
rolls have been used in the friction tests. The rolls were
made of cold-worked tool steel X165CrV12 heat treated to
58 HRC.
To determine the effect of surface topography of the
tools on the frictional behaviour, four sets of rolls with
different grinding lay were used (Figure 5). All rolls were
made by similar turning setup, such as the feed rate and
cutting speed, to guarantee that the roll roughness measured
along pitch-surface generator are identical. In order to
distinguish four kinds of rolls Ra parameter was found
convenient to use. The tests were performed under the
following conditions:
• Roughness average Ra of rolls denoted as Raw: 0.32;
0.63; 1.25 and 2.5 μm,
• Sliding velocity: 0.001 m/s, which is relatively high
compared with the industrial values,
• Clamping force whose value was increased gradually up
to about 2 kN.
Stereometric parameters of the surface roughness of
rollers are shown in Table 2. In order to distinguish the
change in friction conditions associated with the surface
roughness variation of the rollers, the value of parameter
Ra: 0.32, 0.63, 1.25, 2.5 μm were adopted. To calculate the
friction coefficient from formulae (2) under dry condition,
the pulling FP and clamping FC forces were recorded while
the sheet was drawn for a distance of about 3 mm. Next the
clamping force value was increased simultaneously by
rotating the set bolt (Figure 3 (b)). Typical load-time
dependence is also presented in Figure 6 where the transient
region has been rejected from considerations.
μ = FP/FC (2)
The value of the friction coefficient in the strip drawing
test and using the drawbead simulator was determined as
the mean value for the set of three trials. Samples for
friction test were cut from the same sheet metal. Since the
Figure 3. View (a) and scheme (b) of measuring device: 1 – frame; 2 – working rolls; 3 – load cells; 4 – specimen; 5 –
blocked pin; 6 – grip of testing machine; 7, 8 – tension members; 9 – set bolt.
Figure 4. Four sets of rolls for the strip drawing test.
FRICTIONAL CHARACTERISTICS OF STEEL SHEETS USED IN AUTOMOTIVE INDUSTRY 853
friction was measured for each of the clamping force levels
(steady region in Figure 6), the three independent distribu-
tions of friction coefficient changes with time were
obtained (about 180-220 results). The friction coefficient of
the test was then determined as an average value of the
above-mentioned registered number of changes of the
values. After determining the average value of the test, the
value of the average coefficient of the friction of the three
trials was set.
3.3. Draw Bead Simulator Test
The drawbead simulator tests were carried out using the
aforementioned modified device (Trzepieciñski and Lemu,
2014). In the drawbead simulator, the sheet metal was
pulled to flow between three cylindrical rolls of equal radii
of 20 mm (Figure 7). The test material was cut along the
rolling direction and transverse direction into 200 mm long
and 20 mm wide strips. The surface roughness of the rolls
is the same as that used for strip drawing tests.
The clearance c (Figure 8) between working rolls was
adjusted and maintained at th + th/2 (where th is the sheet
thickness). The main purpose of this clearance is to prevent
locking of the sheet between the rolls, especially during use
of fixed rolls. The high wrap angle may produce a very
high slide resistance and may result in over-increasing of
plastic tension of the sheet and thus fracture. Furthermore,
the test was carried out for middle roll penetrations p
(Figure 8) of 14 mm.
The pulling and clamping forces were controlled using
load cells. To determine the coefficient of friction, it was
found necessary to carry out two tests with two samples.
One specimen was pulled between cylindrical rolls
supported by bearings and then the measured pulling force
(denoted as Droll) and clamping force (Croll) give the bending
and unbending resistance of the sheet under “frictionless”
conditions respectively. The sheet was displaced between
the rotating rolls so that the friction between the sheet and
rolls is minimized, while the second specimen was pulled
between the fixed rolls. Friction opposes the sliding of the
sheet over the fixed rolls. The combined loads required to
slide and to bend/unbend the sheet with the fixed rolls is
then given by the measured pulling force (Dfix) and
clamping force (Cfix). During both tests the supporting roll
was kept free to rotate.
It has been argued in a previous study (Nanayakkara and
Hodgson, 2006) that the wrap angle corresponding to the
actual engagement of the strip with the roller or bead was
not taken into account in the derivation done by (Nine,
1978). Furthermore, (Green, 2001) stated that the tangent-
to-tangent bead wrap assumption becomes approximately
valid only at very deep penetrations. This supports the
argument that the validity of the equation derived by (Nine,
1978) is limited to deep penetrations. In this experimental
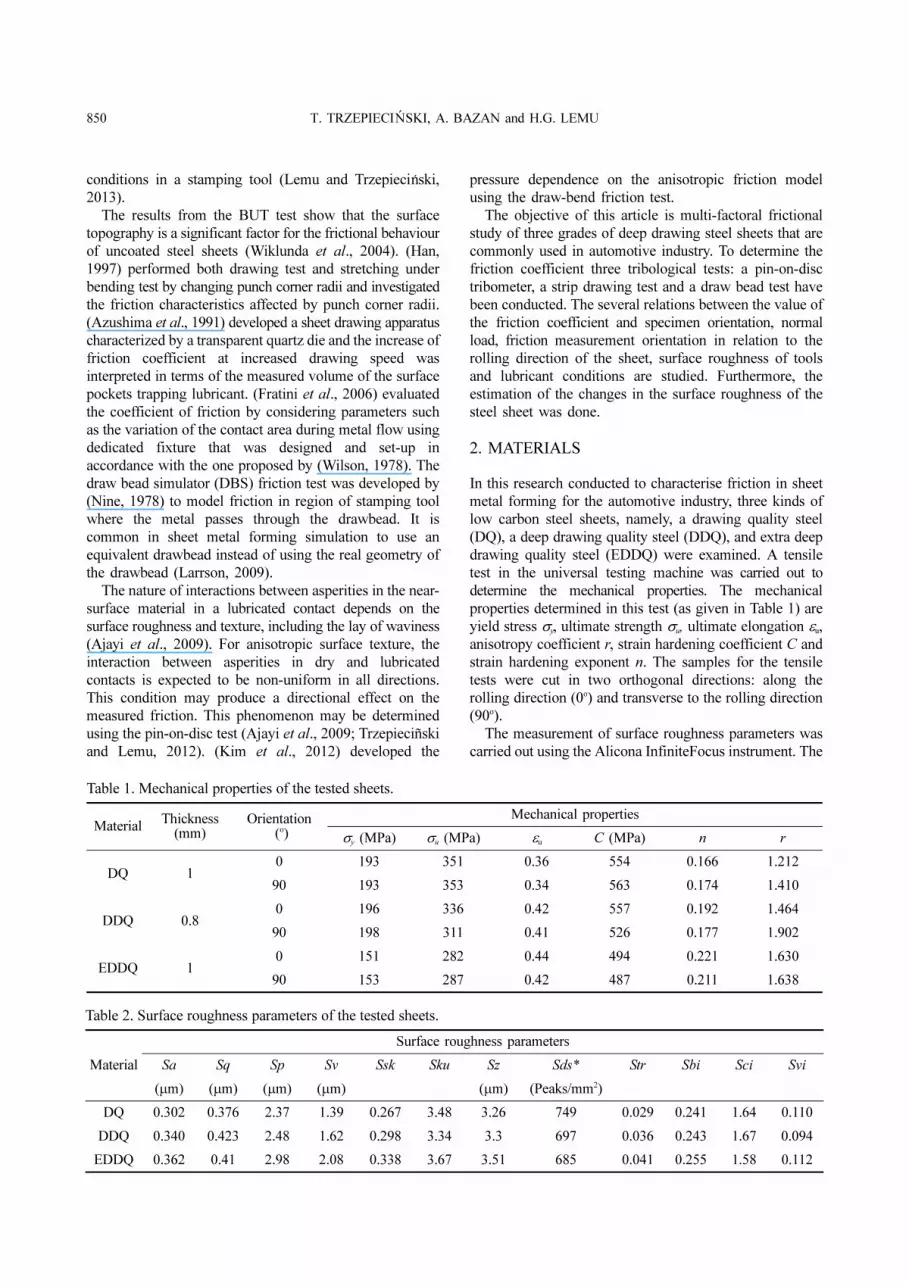
Figure 5. Surface topography of the rolls with Raw
parameter: (a) 0.32 μm; (b) 0.63 μm; (c) 1.25 μm and (d)
2.5 μm.
Figure 6. Load-time curves.
Figure 7. Measurement system used for friction testing
1 – frame; 2 – front roll; 3 – middle roll; 4 – back roll;
5 – specimen; 6 – supporting roll; 7 and 8 – tension
members; 9 and 10 – extensometers; 11 – fixing pin; 12 –
ear nut.

854 T. TRZEPIECI SKI, A. BAZAN and H.G. LEMUNé
setup, all force values were constantly recorded using
electric resistance strain gauge technique, 2-channel
universal amplifier of data acquisition system and a
computer. When the wrap angle is not equal to 180o the
friction coefficient is calculated from (Nanayakkara et al.,
2004):
(3)
where Θ is the quarter contact angle of actual engagement
of the strip over the bead, and a value of Θ = π/2 confirms
a full penetration.
4. RESULTS AND DISCUSSION
4.1. Tribotester
To confirm that steel sheets are characterized by the
anisotropy of tribological properties, friction anisotropy on
a given surface has to be clearly distinguished from friction
anisotropy for different perpendicular orientations between
the pin and the surface. As shown in Figure 9, changes of
friction coefficient value exhibit two maxima for a rotation
through 360o. These points correspond to the measurdn of
friction coefficient value transverse to the rolling direction.
The representative value of friction coefficient should be
determined for first sample revolution. Together with a
number of sample revolutions, the sheet surface wears and
the value of friction coefficient increases. A local plastic
deformation and wear are the sources of increased noise of
friction coefficient, which was also observed by (Ajayi et
al., 2009). After four revolutions of the sample, the
difference between the friction coefficient value measured
at along and transverse to the rolling direction is clearly
decreasing. The noise in the friction measurement system
increases with the number of revolutions so frictional
anisotropy may be then an error. The noise is proportional
to the yield strength of material which was reported by
(Ajayi et al., 2009). The maximal value of friction
coefficient existed every 180o that coincides to the point s
where the ball specimen slides perpendicular to the rolling
direction of the sheet.
The anisotropic friction model was implemented by
specifying different friction coefficients in two orthogonal
directions on the contact surface that coincide with the
defined slip directions. In recent studies (Trzepieciñski,
2013) it was found that the elliptic function is accurate to
describe the anisotropic friction model. The polar plots in
Figure 10 show variation of the friction coefficient through
the first sample revolution. All tested materials exhibit two
maxima on one evolution of the sample. The same effect
was observed for all tested sheets. The highest effect of
lubrication was observed for DQ steel sheet, the lowest for
μDfix Droll–
Cfix
---------------------- θsin
2θ----------=
Figure 8. Geometrical parameters of drawbead simulator
test.
Figure 9. Friction coefficient as a function of disc
revolutions from the rolling direction for DQ sheet, normal
load 12 N, lubricated condition.
Figure 10. Variation of friction coefficient during first
revolution of the sample for: (a) DQ, (b) DDQ and (c)
EDDQ steel sheets; load force 9 N.

FRICTIONAL CHARACTERISTICS OF STEEL SHEETS USED IN AUTOMOTIVE INDUSTRY 855
the EDDQ steel sheet.
Figure 11 shows the variation of the calculated friction
coefficient value observed for the first revolution of the
sample. The figure shows that the value of friction
coefficient is different for all materials. On the other hand,
as given in Table 2, the tested sheets have similar value of
the Ra parameter of the surface roughness. This difference
may coincide with mechanical properties of the sheets and
different material deformation at the contact interface. With
increasing ultimate elongation of the sheets, which
indicates their higher plasticity, the friction coefficient
value increases. The value of the friction coefficient
increases with the ball load for both dry and lubricated
sliding conditions. In the case of dry friction conditions, the
range between minimum and maximum value of friction
coefficient increases with the ball load. As it was
Figure 11. Variation of friction coefficient determined in (a) dry friction and in (b) lubricated conditions.
Figure 12. Friction coefficient vs. clamping force of rolls in dry friction. Plots for Raw of rolls: (a) 0.32 μm; (b) 0.63 μm; (c)
1.25 μm and (d) 2.5 μm.

856 T. TRZEPIECI SKI, A. BAZAN and H.G. LEMUNé
mentioned earlier, the effect of surface wear and noise in
the friction measurement system was emphasized. During
the lubricated sliding test the deviation of the friction
coefficient value was smaller compared to the test results in
dry friction conditions. In the case of dry friction conditions
conducted at the highest ball load, which is 12 N, the value
of friction coefficient considerably increased. Lubrication
allows the range of friction coefficient value variation to
decrease along the friction track.
Increasing the deep-drawability of the sheets (from DQ
through DDQ to EDDQ) for the same pressure increases
the value of friction coefficient value. Increased plastic
properties of the sheet cause that a tester ball penetrates
more into the sheet material and the surface area of contact
increases. The increasing drawability of the sheets can be
related with the increase of ultimate eleongation εu.
The measured friction coefficient under lubrication
conditions is due to shearing of the fluid film and elasto-
plastic deformations of the asperities. As has been reported
by (Ajayi et al., 2009), no frictional anisotropy was
observed for material that does not plastically deform (e.g.,
DLC-coated flat).
4.2. Strip Drawing
According to the present experimental results, the value of
the friction coefficient decreases as the clamping force
increases for both lubricated and dry conditions (Figure
12). In general, the value of friction coefficient decreases
with increasing clamping force of rolls for both lubricated
and dry friction conditions. This may be as a result of the
dependence of friction on the clamping (normal) force
where beyond certain load the relationship between friction
force and clamping force is nonlinear and the value of
friction coefficient is not constant. In other words, it
changes with normal load.
The nonlinear dependence between clamping force and
the value of friction coefficient was previousely studied by
the authors and the results are reported in literature
(Trzepieci ski and Lemu, 2012) where genetic algorithm
and artificial neural networks were applied to forecast the
friction values.
Different results were obtained in the tribometer test
(Figure 11), with increasing clamping force an increase in
the coefficient of friction value was observed. In the
tribometer test exists much smaller contact area and the
increase of the pin pressure causes rapid expansion of the
area of contact. In the strip drawing test sheet contact area
is distributed over the width of the sample (20 mm) and
load is transfered by higer surface than in the tribometer
test. With the increasing deep drawability of the sheets the
friction coefficient value also increases. The highest values
of friction coefficient were observed for EDDQ steel sheet
which may be explained by the highest value of surface
roughness represented by the basic roughness parameter
Sa. During pin-on-disk test, strain hardening of the sheet
material occurs because of plastic deformations of the
né
Figure 13. Mean value of friction coefficient vs. material type.

FRICTIONAL CHARACTERISTICS OF STEEL SHEETS USED IN AUTOMOTIVE INDUSTRY 857
asperities and the increased frictional resistance. The real
area of contact depends on different flattening and
roughening mechanisms of the deforming asperities. Further,
the tested sheets have different surface roughness and
materials properties that make the analysis work difficult.
Figure 13 shows the comparison of mean values of the
friction coefficients determined by the tests. The variation
of friction coefficient as a function of orientation,
lubrication condition and material type are plotted. As
depicted by line 1 in the figure, the value of the friction
coefficient in dry friction conditions is lowest for the DDQ
sheet and highest for EDDQ sheet. This trend is in general
observed for both orientations. However, in the case of
orientation 0o for the lubricated conditions, the above-
mentioned relation is different where the friction coefficient
value increases with sheet plasticity specified by ultimate
elongation εu value. The value of friction coefficient for
both dry friction and lubricated conditions decreases as the
surface roughness (Raw parameter) of the rolls increases
(line 2 in Figure 13). The reduction of friction coefficient
value as a result of lubricant application is smaller in the
case of sample orientation at 0o compared to sample
orientation at 90o.
The lubricant reduced the coefficient of friction and the
intensity of its action is similar for all used rolls. In case of
samples cut transverse to the rolling direction (90o), the
value of friction coefficient is larger. This can be explained
by two facts. Firstly, as it has been found in pin-on-disc
test, the tested sheets exhibit anisotropic frictional
behaviour. Secondly, the different mechanical properties of
the sheet in both rolling and transverse to the rolling
directions may lead to different character of plastic
smoothing of asperities. The friction coefficient value
measured on samples cut transverse to the rolling direction
is higher than for samples cut along the rolling direction of
the sheet.
It is evident that rough surfaces enable lubricant
adhesion to the sheet material. This effect appears to be due
to the manner in which the lubricant is captured by
roughness on the surface of the sheet. To examine
effectiveness of the sheet lubrication the L-index was
introduced, defined as follows:
(4)
As shown in Figure 14, the L-index value has a non-
linear relation with the value of roughness parameter Raw
of rolls. In the case of sample orientation at 0o, the value of
the L-index increases with increasing value of roughness
parameter Raw of rolls. For sample orientation at 90o, on the
other hand, a continuous decreasing trend of the L-index
value is observed. As it was stated earlier, in the case of
higher surface roughness of contact bodies, high volume of
lubricant may be trapped in the surface pits and
consequently the effectiveness of lubrication is higher. But,
as it is shown in Figure 13, sample orientation (surface
texture) has also effect on the effectiveness of lubrication.
4.3. Analysis of Surface Roughness Change
The shape of the contact surface and the roughness of the
bodies in contact affect the contact type and the stress state
in the surface layer as well as the value of the required
tangential force to overcome friction. The increase in the
real contact area occurs gradually from the initial peak
surface roughness contact to full contact after balancing
normal force and the force required to deform roughness.
The change of the contact surface is accompanied by a
continuous change in the geometry of the contact. The
estimation of the changes in the surface roughness was
done for DQ steel sheet destined for difficult drawpieces. It
was assumed that the measured surface topography is
representative for all area of the sample.
The views of sheet surface after the friction process with
roller clamping force of rollers of 0.8 kN and 1.2 kN,
which correspond to normal pressure of 240 and 360 MPa,
are shown in Figures 15 ~ 16, respectively. For the roll
roughness of Raw = 0.63 μm the dominant phenomenon
during friction was the smoothing of roughness peaks
during the test. For both clamping forces the profile height
L index–μdry μoil–
μdry
--------------------=
Figure 14. Effectiveness of lubrication (L-index) as a
function of Raw of rolls oriented at (a) 0o and (b) 90o to the
rolling direction of the sheets.
858 T. TRZEPIECI SKI, A. BAZAN and H.G. LEMUNé
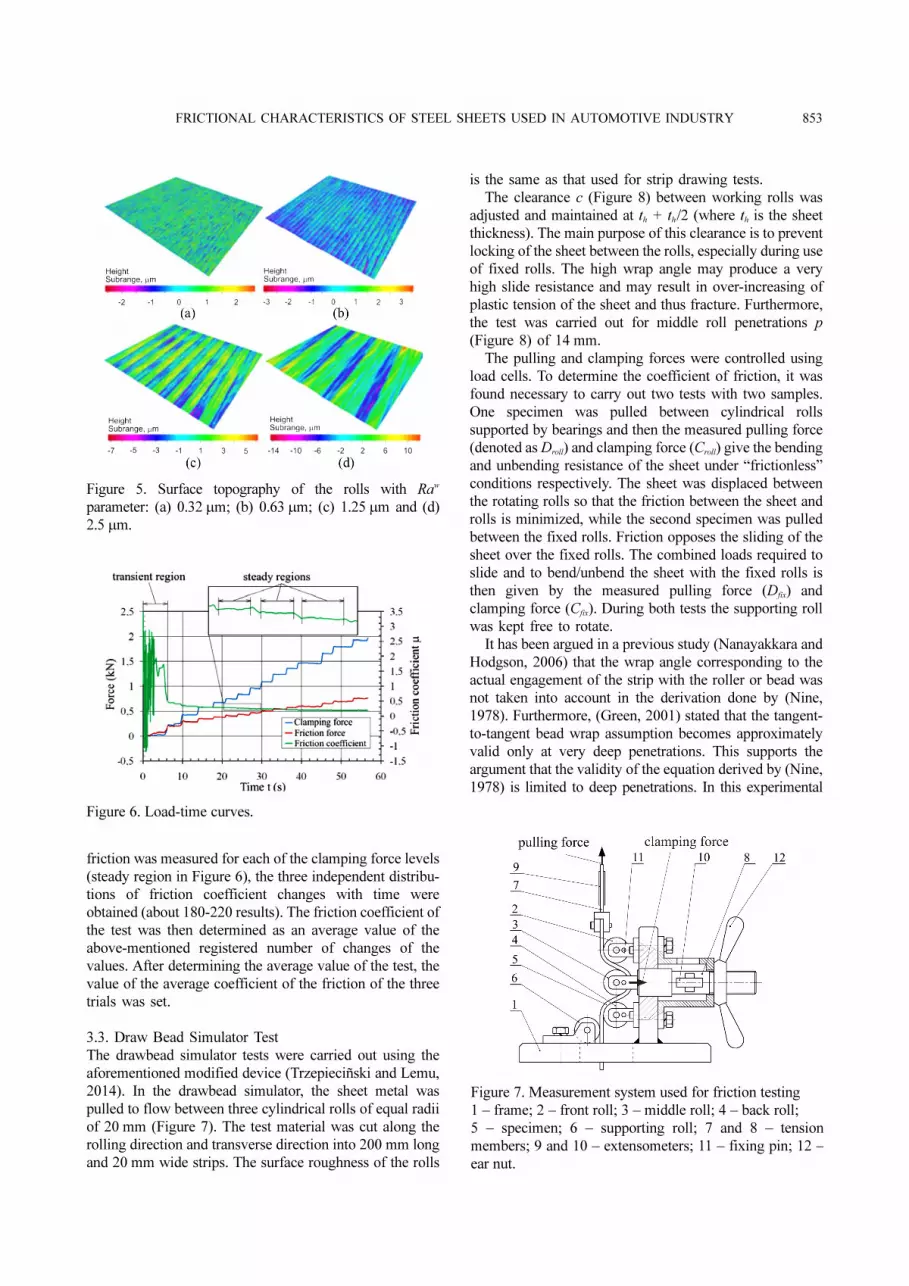
was similar. With increasing value of the surface roughness
of the rollers, clear directional scratches on the surface of
the sheet was observed. This is as a result of the movement
of the counter-specimen surface irregularities across the
sheet surface. However, no significant increase in resistance
to friction has been detected. This may be explained by
reduction of the real contact area during friction tests
performed with rollers of higher roughness Raw.
After friction tests with the reference object, i.e.
roughness of the sheet metal surface which is not subjected
to friction, a comparative analysis of the sheet metal surface
was conducted in Allicona InfiniteFocus optical 3D micro
coordinate system. It was assumed that the measured surface
roughness of the sheet before friction is representative for
Figure 15. Change of surface topography of DQ steel sheet tested under a 0.8 kN clamping force of rollers and for Raw of
rolls parameter value: (a) 0.63 μm; (b) 1.25 μm and (c) 2.5 μm.
Figure 16. Change of surface topography of DDQ steel sheet tested under a 0.8 kN clamping force of rollers and for Raw of
rolls parameter value: (a) 0.63 μm; (b) 1.25 μm and (c) 2.5 μm.

FRICTIONAL CHARACTERISTICS OF STEEL SHEETS USED IN AUTOMOTIVE INDUSTRY 859
the entire surface of the sheet. The results of changes in the
surface topography are shown in Table 3.
In all the analysed cases, friction has reduced the sheet
surface roughness. In the case of rolls with roughness Raw
= 0.63 μm and Raw = 1.25 μm the biggest change in the
roughness volume occurs over a reference surface (peaks
flattening). For rollers roughness Raw = 2.5 μm the greatest
deviation of the test surface in relation to the reference
surface is below the reference surface, which is due to
interaction of high roughness of the tool. With increasing
value of the Raw parameter the penetration of the tool
surface increases causing the increase of both the lower and
upper test surface deviations in relation to the reference
surface.
4.4. Draw Bead Test
The results demonstrate the expected relationship that the
value of the friction coefficient of the tested sheets without
lubrication is higher than in the case of lubricated sheets.
The lubricant reduced the coefficient of friction, but
intensity of its action was dependent on the sheet surface
topography and the value of Raw of rolls. The strips
oriented along the rolling direction demonstrated higher
value of the fiction coefficient compared to the samples cut
transverse to the rolling direction.
For all sheets cut along the rolling direction increasing
Raw of rolls causes that the value of friction coefficient
increases for both lubricated and dry friction conditions
(Figure 17 (a)). In the case of transverse orientation, the
local minimum of the friction coefficient value for Raw of
rolls equals to 1.25 μm is visible (Figure 17 (b)). This
effect is visible for both friction conditions, so it can be
explained by the arising favourable mutual interactions
between sheet metal – tool roughness. As it has been
shown in Figure 17 (b) the high surface roughness of rolls
does not necessarily mean the increase of resistance to
friction. For both friction conditions the values of the
friction coefficient are the highest for EDDQ steel sheet,
and lowest for DQ steel sheet. It may be related with the
value of the strain hardening coefficient whose value
decreases in a similar sequence (for EDDQ, DDQ and DQ
steel sheets). During the DBS test the sheet metal strongly
resists deformation and is subjected to strain hardening
phenomenon. Furthermore, it is stated by (Masters et al.,
2013) that increasing the amount of plastic deformation
increases the surface roughness and friction behaviour
changes as a result of plastic deformation during metal
forming. The influence of initial (original) surface topography
of the sheet is not very significant because during the test
the sheet is subjected to series of local bending,
Table 3. Results of comparative analysis of surfaces before and after friction process.
Clamping force FC,
(kN)
Ra of rollers
Raw (μm)
Deviation of surface after friction process from reference surface, (μm) Volume of positive
deviations, (μm3)Volume of negative
deviations, (μm3)Min Max Average
0.8
0.63 -3.687 5.2309 -0.0309 127783 113020
1.25 -5.5176 4.009 -0.0153 144368 121157
2.5 -6.6996 4.4872 -0.3287 153700 248358
1.2
0.63 -3.7411 5.4508 -0.0064 129493 104458
1.25 -5.122 4.0808 -0.024 155633 135419
2.5 -11.705 6.1676 -0.2785 165294 240747
Figure 17. Friction coefficient value versus Raw of rolls for (a) orientation 0o and (b) 90o, values measured at depth
penetration of 12 mm.
860 T. TRZEPIECI SKI, A. BAZAN and H.G. LEMUNé
straightening and reverse bending deformation on the
sheet. So, the topography is changed as an influence of
plastic deformation of the sheet and flattening of asperities
as a result of the frictional contact between the sheet and
the tool interface.
The draw beads action essentially influences the
springback phenomenon (Figure 18). The highest deviation
of the sheet profile from the drawing direction was
observed for DQ steel sheet. The higher degree of sheet
deep-drawability is responsible for lower value of
springback. Similar dependence was observed for the
samples cut transverse to the rolling direction of the sheet.
Lower values of sheet profile deviation from the drawing
direction were observed in the case of existing higher
resistance to friction.
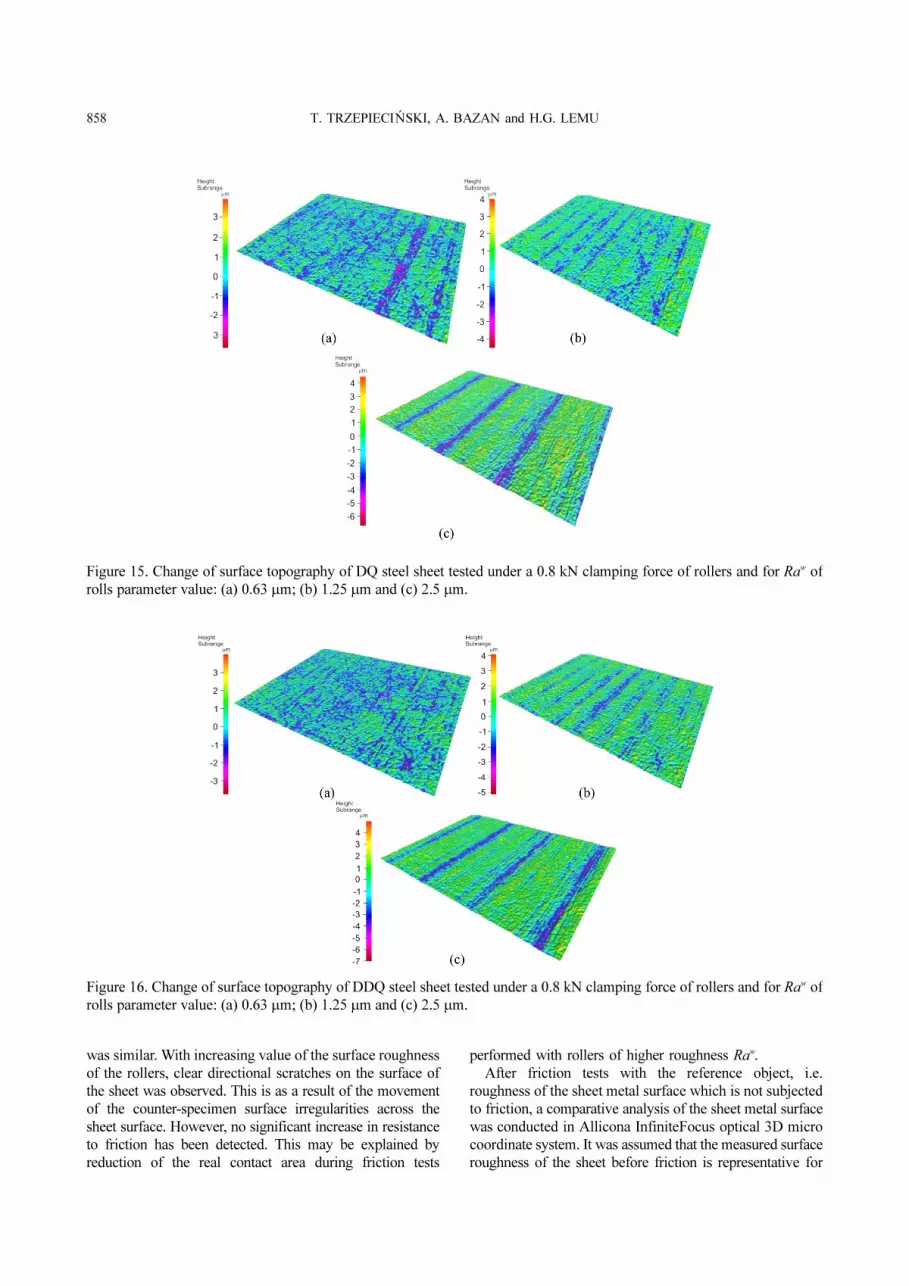
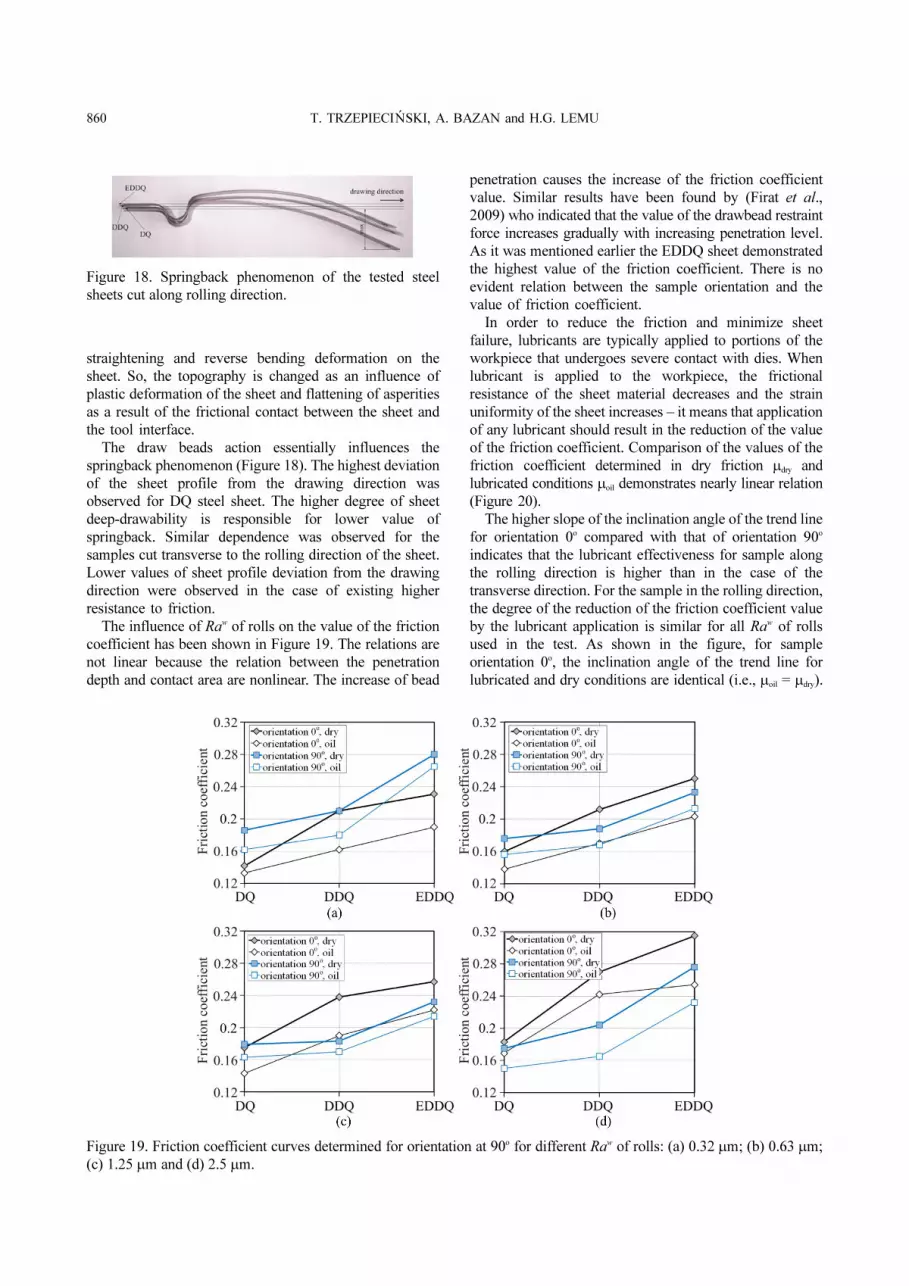
The influence of Raw of rolls on the value of the friction
coefficient has been shown in Figure 19. The relations are
not linear because the relation between the penetration
depth and contact area are nonlinear. The increase of bead
penetration causes the increase of the friction coefficient
value. Similar results have been found by (Firat et al.,
2009) who indicated that the value of the drawbead restraint
force increases gradually with increasing penetration level.
As it was mentioned earlier the EDDQ sheet demonstrated
the highest value of the friction coefficient. There is no
evident relation between the sample orientation and the
value of friction coefficient.
In order to reduce the friction and minimize sheet
failure, lubricants are typically applied to portions of the
workpiece that undergoes severe contact with dies. When
lubricant is applied to the workpiece, the frictional
resistance of the sheet material decreases and the strain
uniformity of the sheet increases – it means that application
of any lubricant should result in the reduction of the value
of the friction coefficient. Comparison of the values of the
friction coefficient determined in dry friction μdry and
lubricated conditions μoil demonstrates nearly linear relation
(Figure 20).
The higher slope of the inclination angle of the trend line
for orientation 0o compared with that of orientation 90o
indicates that the lubricant effectiveness for sample along
the rolling direction is higher than in the case of the
transverse direction. For the sample in the rolling direction,
the degree of the reduction of the friction coefficient value
by the lubricant application is similar for all Raw of rolls
used in the test. As shown in the figure, for sample
orientation 0o, the inclination angle of the trend line for
lubricated and dry conditions are identical (i.e., μoil = μdry).
Figure 18. Springback phenomenon of the tested steel
sheets cut along rolling direction.
Figure 19. Friction coefficient curves determined for orientation at 90o for different Raw of rolls: (a) 0.32 μm; (b) 0.63 μm;
(c) 1.25 μm and (d) 2.5 μm.

FRICTIONAL CHARACTERISTICS OF STEEL SHEETS USED IN AUTOMOTIVE INDUSTRY 861
5. IMPLICATIONS FOR THE AUTOMOTIVE INDUSTRY
As previousely indicated, the friction forces on the contact
surface have a significant impact on the sheet forming
process. The nature of the effect of the friction and
conditions associated with the mechanical properties of
formed sheet metal can be changed by suitable design of
tools. During the forming process of drawpieces, there
exist zones of diverse stress and strain state, displacement
velocity and friction conditions. In the case of complicated
product shapes, sometimes several processes exist during
forming a sheet to obtain the final shape. The most widely
used processes are bending, stretching and deep drawing.
Deep drawing is widely used for production of shell panels
and for car body panels in the automotive industry. In this
process, the occurrence of different strain state is caused by
the action of tools and technological factors that change the
frictional conditions.
The complex shape of tools for the production of car
bodies and constructional components makes it necessary to
use many technological tests and modeling the phenomenon
of the friction in the particular places of stampings. As it is
shown in the paper, according to the modeled area of the
drawpiece, the different values of the coefficient of friction
are determined. Rolled sheets exhibit strong anisotropy of
mechanical properties and different surface topography.
The basic test that allows to determine the anisotropy of the
frictional resistance is tribotester. While forming the sheet
metal, the friction force between the blankholder and the
die has to be sufficiently high in order to obtain required
plastic flow and to avoid wrinkling.
Many tribological problems of sheet metal forming of
car bodies, especially deep drawing, lead to several
experimental friction tests that has a huge impact on the
resulting product. For instance, (Choi et al., 2011) reported
that defects such as fracture and wrinkle occur when hot
stamping is performed using a conventional drawing or
forming method. The implemented modelling approaches,
on the other hand, contribute to better characterization of
steel sheets used for car bodies. The strip drawing test
modelled the friction between the punch and flat surfaces of
the drawpiece, while the drawbead test simulates resistance to
friction during deformation of the sheet in the drawbead
region. The draw bead generates a stable tensile force
opposite to the sheet drawing direction by introducing a
series of local bending, straightening and reverse bending
deformations on the sheet.
6. CONCLUSION
The study of the frictional characteristics of selected steel
sheets used in automotive industry is conducted and
presented in this paper. The research work focused on
determination and comparison of friction coefficients
obtained by three tribological tests: a strip drawing test, a
draw bead test and a pin-on-disc tribometer. The
experimental results allow to draw the following conclusions:
(1) The production method of sheet metals by rolling
process causes form of directional topography that
results in diversification of friction coefficient value
according to the orientation to the rolling direction of
the sheet metal. Furthermore, the plastic properties of
the sheets (e.g. deep-drawability) influence the value of
friction coefficient. The friction coefficient value
increases with the increasing ultimate elongation mu of
the sheets, which indicates their higher plasticity.
During the lubricated sliding tribometer test the
deviation of the friction coefficient value was smaller
compared to the tests realized in dry friction
conditions. Lubrication allows to minimize the effect
of directionality of sheet surface topography on the
friction anisotropy by decreasing the range of friction
coefficient value variation along the friction track.
(2) The friction coefficient value measured on samples cut
transversely to the rolling direction is higher than for
samples cut along the rolling direction of the sheet.
Furthermore, the reduction of friction coefficient value
for lubricated contact is smaller in the case of sample
oriented at 0o compared to sample oriented at 90o to the
rolling direction. Considering the influence of material
properties of the sheet, it is found that the value of
friction coefficient is lowest for the DDQ sheet and
highest for EDDQ sheet. However, this general
conclusion is slightly different for orientation 0o in the
lubrication conditions where the friction coefficient
value tends to increase with the increase of sheet
plasticity specified by ultimate elongation μu value.
The value of friction coefficient for both analysed
lubrication conditions decreases as the Ra surface
roughness parameter value of the sheet of the rolls
increases. The value of L-index characterized lubricant
effectiveness has a non-linear relation with the value of
Figure 20. Relation between the friction coefficients
determined in dry friction conditions (μdry) and in lubricated
conditions (μoil).
862 T. TRZEPIECI SKI, A. BAZAN and H.G. LEMUNé
roughness parameter Raw of rolls. In the case of sample
orientation at 0o, the value of the L-index increases with
increasing the value of roughness parameter Raw of
rolls. For sample orientation at 90o, on the other hand, a
continuous decreasing trend of the L-index value is
observed. In all the analyzed cases, the friction process
has reduced the sheet surface roughness by peaks
flattening.
(3) The results of draw bead simulator tests demonstrate
the expected relationship that the value of friction
coefficient of the sheets tested without lubrication is
higher than in the case of lubricated sheets. The
lubricant reduced the coefficient of friction, but intensity
of its action depends on sheet surface topography and
value of Raw of rolls. In case of Raw values of 1.25 μm
and 2.5 μm, the strips oriented in the rolling direction
demonstrated higher value of fiction coefficient
compared to the samples cut transverse to the rolling
direction. The different interdependence exists for Raw
values of 0.32 μm and 0.63 μm. For sheet strips cut
according to the rolling direction together with
increasing of Raw of rolls the value of friction
coefficient increases for both lubrication and no
lubrication conditions. For both fiction conditions the
value of fiction coefficient are the highest for EDDQ
steel sheet, and decrease for DDQ and DQ steel sheet,
respectively. This may be related with value of strain
hardening coefficient whose value decreases in the
aforementioned order of the sheet grades.
REFERENCES
Ajayi, O. O., Erck, R. A., Lorenzo-Martin, C. and Fenske,
G. R. (2009). Frictional anisotropy under boundary
lubrication: Effect of surface texture. Wear 267, 5−8,
1214−1219.
Antoszewski, B., Evin, E. and Audy, J. (2008). A study of
the effect of type (Cu+Ti) and (Mo+Ti) electro-spark
coatings on fricion in pin-on-disc testing. J. Tribol. 130,
2, 26−31.
Azushima, A., Uda, M. and Kudo, H. (1991). An
interpretation of the speed dependence of the coefficient
of friction under the micro-PHL condition in sheet
drawing. CIRP Ann-Manuf. Techn. 40, 1, 227−230.
Bae, G. H. and Huh, H. (2012). Comparison of optimum
designs of center pillar assembly of an auto-body
between conventional steel and AHSS with a simplified
side impact analysis. Int. J. Automotive Technology 13,
2, 205−213.
Bay, N., Olsson, D. D. and Andreasen J. L. (2008).
Lubricant test methods for sheet metal forming. Tribol
Int 41, 9−10, 844−853.
Cho, J. U., Choi, H. K., Lee, S., Cho, C. and Han, M. S.
(2013). Experimental study of the impact of
characteristics of sandwich composites with aluminum
honeycomb cores. In. J. Automotive Technology 14, 3,
415−421.
Choi, H. S., Kim, B. M., Nam, K. J., Ha, S. Y., Cha, S. H.
and Kang, C. G. (2011). Development of hot stamped
center pillar using form die with channel type indirect
blank holder. Int. J. Automotive Technology 12, 6, 887−
894.
Choi, K. Y., Lee, M. G. and Kim, H. Y. (2013). Sheet metal
forming simulation considering die deformation. Int. J.
Automotive Technology 14, 6, 205−213.
Darendeiler, H., Akkok, M. and Yucesoy, C. A. (2002).
Effect of variable coefficient on sheet metal drawing.
Tribol. Int. 35, 2, 97−104.
Firat, M. Livatyali, H., Cicek, O. and Onhon, M. F. (2009).
Improving the accuracy of contact-type drawbead
elements in panel stamping analysis. Mater Design 30,
10, 4003−4011.
Fratini, L., Casto, S. L. and Valvo, E. L. (2006). A technical
note on an experimental device to measure friction
coefficient in sheet metal forming. J. Mater. Process.
Tech. 172, 1, 16−21.
Green, D. E. (2001). An experimental technique to
determine the behaviour of sheet metal in a drawbead.
SAE Paper No. 2001-0-1136.
Guillon, O., Roizard, X. and Belliard, P. (2001).
Experimental methodology to study tribological aspects
of deep drawing - application to aluminium alloy sheets
and tool coatings. Tribol. Int. 34, 11, 757−766.
Han, S. S. (1997). The influence of tool geometry on
friction behaviour in sheet metal forming. J. Mater.
Process Tech. 63, 1−3, 129−133.
Kim, M. S., Kangi, D. O. and Heo, S. J. (2014), Innovative
design optimization strategy for the automotive industry.
Int. J. Automotive Technology 15, 2, 291−301.
Kim, Y. S., Jain, M. K. and Metzger, D. R. (2012).
Determination of pressure-dependent friction coefficient
from draw-bead test and its application to cup drawing.
Int. J. Mach. Tool. Manu., 56, 69−78.
Larrson, M. (2009). Computational characterization of
drawbeads. A basic modelling method for data
generation. J. Mater. Process Tech. 209, 1, 376−386.
Lemu, H. G. and Trzepieciñski, T. (2013). Numerical and
experimental study of frictional behaviour in bending
under tension test. Stroj. Vest. – J. Mech. Eng. 59, 1, 41−
49.
Masters, I. G., Williams, D. K. and Roy, R. (2013). Friction
behaviour in strip draw test of pre-stretched high
strength automotive aluminium alloys. Int. J. Mach.
Tool. Manu., 73, 17−24.
Masuko, M., Aoki, S. and Suzuki, A. (2005). Influence of
lubricant additive and surface texture on sliding friction
characteristics of steel under varying speeds ranging
from ultralow to moderate. Tribol. T. 48, 3, 289−298.
Matuszak, A. (2000). Factors influencing friction in steel
sheet forming. J. Mater. Process Tech. 106, 1-3, 250−
253.
Nanayakkara, N. K. B. M. P. and Hodgson, P. D. (2006).

FRICTIONAL CHARACTERISTICS OF STEEL SHEETS USED IN AUTOMOTIVE INDUSTRY 863
Determination of drawbead contacts with variable bead
penetration. Comp. Method. Mater. Sc. 6, 3−4, 188−194.
Nanayakkara, N. K .B. M. P., Kelly, G. L. and Hodgson, P.
D. (2004). Determination of the coefficient of friction in
partially penetrated draw beads. Steel Grips, 2, 677−680.
Nine, H. D. (1978). Draw Bead Forces in Sheet Metal
Forming. Koistinen, D. P., Wang, N.-M., edn. Mechanics
of Sheet Metal Forming. Plenum Press. New York. 179−
211.
Park, H. S. and Dang, X. P. (2011). Development of a fiber-
reinforced plastic armrest frame for weight-reduced
automobiles. Int. J. Automotive Technology 12, 1, 83−
92.
Pin-on-disc Tribometer (1999). Pin-on-disc Tribometer T-
01M - Service Manual. Institute for Sustainable
Technologies. Radom.
Roizard, X., Pothiera, J. M., Hihnb, J. Y. and Monteila, G.
(2009). Experimental device for tribological measurement
aspects in deep drawing process. J. Mater. Process Tech.
209, 3, 1220−1230.
Trzepieci ski, T. (2013). Analysis of the friction influence
on change of surface topography in strip drawing test.
Tribologia 44, 1, 125−134.
Trzepieci ski, T. and Lemu, H. G. (2012). Application of
genetic algorithms to optimize neural networks for
selected tribological tests. J. Mech. Eng. Autom. 2, 1,
69−76.
Trzepieci ski, T. and Lemu, H. G. (2014). Frictional
conditions of AA5251 aluminium alloy sheets using
drawbead simulator tests and numerical methods. Stroj.
Vest. – J. Mech. Eng. 60, 1, 51−60.
Wiklunda, D., Wihlborg, A. and Rosén, B.-G. (2004).
Evaluation of surface topography parameters for friction
prediction in stamping. Wear 257, 12, 1296−1300.
Wilhborg, A. and Gunnarsson, L. (2000). A frictional study
of uncoated EBT steel sheets in a bending under tension
friction test. Wear 237, 1, 129−136.
Wilson, W. R. D. (1978). Friction and Lubrication in Sheet
Metal Forming. Koistinen, D. P., Wang, N.-M., (edn).
Mechanics of Sheet Metal Forming. Plenum Press. New
York. 157−177.
Xiao, L., Rosén, B.-G. and Amini, N. (2004). Surface lay
effect on rough friction in roller contact. Wear 257, 12,
1301−1307.
né
né
né


