Embed Size (px)
Citation preview
1
AFRICAN GOVERNANCE AND DEVELOPMENT
INSTITUTE
A G D I Working Paper
WP/14/004
Fresh Patterns of Liberalization, Bank Return and Return Uncertainty in
Africa
Simplice A. Asongu
African Governance and Development Institute,
P.O. Box 18 SOA/ 1365 Yaoundé, Cameroon.
E-mail: [email protected]
2
© 2014 African Governance and Development Institute WP/14/004
AGDI Working Paper
Research Department
Fresh Patterns of Liberalization, Bank Return and Return Uncertainty in
Africa
Simplice A. Asongu1
January 2014
Abstract
This chapter complements exiting African liberalization literature by providing fresh patterns
of two main areas. First, it assesses whether African banking institutions have benefited from
liberalization policies in terms of bank returns. Second, it models bank return and return
uncertainty in the context of openness policies to examine fresh patterns for the feasibility of
common policy initiatives. The empirical evidence is based on 28 African countries for the
period 1999-2010. Varying non-overlapping intervals and autoregressive orders are employed
for robustness purposes. The findings show that, while trade openness has increased bank
returns and return uncertainties, financial openness and institutional liberalization have
decreased bank returns and reduced return uncertainty respectively. But for some scanty
evidence of convergence in return on equity, there is overwhelming absence of catch-up
among sampled countries. Implications for regional integration and portfolio diversification
are discussed.
JEL Classification: D6; F30; F41; F50; O55
Keywords: Liberalization policies; Capital return; Africa
1 Simplice A. Asongu is Lead economist in the Research Department of the AGDI ([email protected]).
3
1. Introduction
The 2008 financial crisis was not a shock that was later accompanied by struggles
from rational actors. Instead, it shows the crucial relevance of social conventions like risk
management models adopted to cope with uncertainty. The failure of economists and political
scientists to predict the crisis is both dismal and embarrassing. The crisis has further reminded
scholars that we live in a world of uncertainty and risk. In a risky world, the hypothesis that
agents adopt rational, instrumental and consistent decision rules is logical. However when
parameters are quite unstable to forecast future events, this hypothesis becomes untenable.
This has prompted policy makers and market players to depend on certain social conventions
that render uncertain environments stable (Nelson & Katzenstein, 2011).
With the recent financial crisis, the appealing ambitions of globalization policies and
their implications for development have been questioned, with more emphasis placed on
developing countries. According to some policy makers, the crisis has substantially exposed
the drawbacks of liberalization policies (Kose et al., 2006; Kose et al., 2011; Asongu, 2014a).
This is essentially because emerging markets which experienced substantial inflows of capital
over the last decade have been faced with the daunting task of managing macroeconomic
shocks resulting from a considerable decline in the same flows. Owing to the theoretical
motivations of financial globalization, the economic downturn has unraveled the debate on the
effects of globalization in developing countries2.
In the 1980s when the current trend of globalization began, developed and developing
countries experienced rising cross-border financial flows. The surges in financial transactions
were followed by a spade of currency crises. These developments reignited the debated
2 According to theoretical postulations, financial globalization is expected to promote international risk sharing
and ease the efficient international allocation of capital. Developing countries should reap higher rewards
because they are relatively labor rich and capital scarce. In addition, developing countries are more volatile in
terms of output than their industrial counterparts which increases investment, growth and the potential welfare
gains resulting from international risk sharing (Asongu, 2013a, b; Kose et al., 2011).
4
among scholars over the benefits of openness, with some affirming that developing countries
which opened their capital accounts have been more adversely affected and increasingly
vulnerable to the shocks than their industrial counterparts (Kose et al., 2011; Henry, 2007;
Asongu, 2014a). Among items of the debate, whereas the concern about the positive rewards
for trade openness have reached a consensus (Kose et al., 2006), the incidence of financial
openness has intensified with more polarization (Asongu, 2014a).
The wave of structural and policy adjustments that began in most African countries in
the 1980s can be classified into two main strands: first generation and second generation
reforms (Janine & Elbadawi, 1992; Batuo & Asongu, 2014a). Adopted policy initiatives in the
first generation of reforms entailed: the abolishment of explicit control on allocation of credit
and pricing, reduction of direct government intervention decisions, allowance of credit to be
determined by market forces and, relaxation of control over international financial flows.
Second generation reforms that focused on institutional and structural constraints included,
inter alia: restoration of bank soundness, financial infrastructure rehabilitation and
amelioration of the institutional, regulatory, legal and supervisor environments (Batuo et al.,
2010; Asongu, 2013a).
Unfortunately, in spite of over two decades of reforms, African banks are still
substantially suffering from surplus liquidity issues that affect profits and returns (Saxegaard,
2006; Fouda, 2009; Coccorese & Pellecchia, 2010; Asongu, 2012a; 2013c, 2014bc; Nguena,
2014). Three natural concerns arise from the bulk of empirical evidence above. (1) The
temptation of inquiring whether African financial institutions have in fact benefited from the
liberalization policies in terms of bank returns. (2) Owing to the uncertainty of the global
financial environment, an analogue concern is how the liberalization policies have affected
uncertainty in bank returns. (3) The issue of patterns on which common policies on bank
return and return uncertainty can be adopted. While a great chunk of the literature has focused
5
on the incidence of reforms on financial development (Cho et al., 1986; Ndikumana, 1999;
2000, 2005; Arestis et al., 2002; Batuo & Kupukile, 2010; Asongu, 2012a; Kose et al., 2006;
Al-Obaidan, 2008; Kiyato, 2009; Kablan, 2010; Kukenova, 2011), as far as we have reviewed
there is yet no study has the investigated the second and third concerns above.
Against this background, the present chapter steers clear of past studies in three
perspectives: effect of liberalization policies on bank return uncertainty; feasibility of
common policies for bank return and return uncertainties and; usage of updated data for more
focused or fresh policies implications. First, given the recent debate on the lofty ambitions of
globalization policies (due to the recent financial crises), we assess the effects of liberalization
policies on return uncertainty. The assessment is important because, financial crises are
characterized by high uncertainties in return and hence, policy makers should be as much
concerned about profitability as uncertainty in profitability. Second, the adoption of common
policy initiatives is feasible when there is some form of convergence in bank return or return
uncertainty. This intuition has theoretical underpinnings in income convergence that has been
substantially documented in catch-up literature (Solow, 1956; Swan, 1956; Baumol, 1986;
Barro, 1991; Mankiw et al., 1992; Barro & Sala-i-Martin, 1992, 1995). Third, the use of very
recent data enables us to provide results with updated policy implications. Accordingly, the
periodicity (1999-2010) is intended to capture second generation reforms for fresh policy
implications.
The rest of the chapter is organized as follows. Section 2 presents the theoretical
highlights and a brief literature. Data and methodology are discussed in Section 3. Section 4
covers the empirical analysis. We conclude with Section 5.
6
2. Brief literature and theoretical highlights
2.1 Allocation efficiency, bank return and uncertainty
The decision to adopt liberalization and achieve the benefits of international risk
sharing, bank return and efficient financial resource allocation has been subject to a lot of
heated debate in academic and policy making circles. Consistent with Asongu (2013b, 2014a),
there are two strands in the literature on the interest of liberalization as a policy initiative for
African countries in their objective to achieve efficient allocation of resources and bank
returns.
The first strand relies on the theoretical underpinnings of the seminal work of Solow
(1956) on the rewards of allocation efficiency and bank return. According to the neoclassical
growth model, liberalization has a lot of positive effects, especially in terms of efficiency and
profitability. In essence, there is a flow of resources from developed countries that are capital
abundant with low capital return to developing countries with high return in capital. Many
developing countries have liberalized their economies with the objective of reaping the
benefits discussed above. They have been motivated by the arguments that the movement of
capital from resource-abundant to resource-poor countries mitigates the cost of capital, raises
return to investment and economic prosperity that ultimately improve living standards
(Obstfeld, 1998; Fischer, 1998; Rogoff, 1999; Summers, 2000; Asongu, 2013ab, 2014a).
On the other hand, the benefits highlighted above are viewed in the second strand as a
fanciful attempt to extend the benefits of international trade in goods to assets. According to
the strand, the appealing sides above find any substance only when economies do not suffer
from distortions apart from the undisturbed flow of capital resources. Hence, in light of the
distortions arising from the recent financial crisis, the second strand sustains that the
theoretical predictions of liberalization policies from the neoclassical growth model are
unrealistic. Before the beginning of the century and a decade later, Rodrik (1998) and Rodrik
7
& Subramanian (2009) supported this strand: respectively writing papers with provocative
titles like “Who Needs Capital Account Convertibility” and “Why did financial globalization
disappoint?” (Asongu, 2013b). From a broad standpoint, the authors sustain that there seems
to be no real correlation between the amount invested in (or the growth rate of an economy)
and capital account openness. In line with this narrative, the rewards of financial openness
are not really visible. However the consistent reoccurrence of crises have evidently confirmed
the costs (Rodrik, 1998). Rodrik & Subramanian (2009) have emphasized that in the wake of
the recent global financial crisis, the thesis that financial engineering has brought about the
gains discussed in the first strand sound less plausible. They have argued that financial
liberalization has failed to improve growth and investment in developing countries.
According to them, countries that have witnessed substantial economic prosperity have been
those that are less reliant on capital inflows. In their view, globalization has not reduced
volatility and smoothened consumption. Asongu (2013b, 2014a) has joined in hypothesizing
that the benefits of liberalization are speculative, indirect and unpersuasive. This further
reflects the uncertain dimension of bank returns in developing countries.
We devote space to briefly discussing risk transfer and insurance. Consistent with
Cummins & Weiss (2009, p. 493), over the past decade, a strand of the economic
development literature has focused on the assessment of convergence in the financial market
industry, especially in reinsurance sectors and capital markets. According to the narrative,
convergence has been facilitated by a plethora of factors: the emergence of enterprise risk
management, increase in the severity and frequency of catastrophic risks, advances in
information and communication technologies (ICTs), (re) insurance underwriting cycles due
to market inefficiencies, inter alia. In this vein, hybrid financial/insurance instruments have
resulted from the developments. The literature on development and evolution of instruments,
8
institutions and risk-transfer markets can be summarized in three main strands: market
inception period, market evolutionary period and market take-off period.
First, on the market inception period, scholarly focus on insurance securities and
reinsurance-financial products has been quite recent. According Cummins & Weiss, it was
triggered by Hurricane Andrew in 1992 and the later the introduction of options and insurance
futures. The interesting literature from D’Arcy & France (1992), Cox & Schwebach (1992)
and Niehaus & Mann (1992) has covered much territory on this strand. However, this early
literature left most of the identified issues unsolved. Such include, inter alia: trade-off
between basis risk and moral hazard, magnitude of risk premia, counterparty credit risk and
insurer acceptance of new contracts. Second, the market evolution period which
approximately varies from 1994 to 2004 is the tolerance during which the market tried
different capital instruments. While a plethora of financial instruments are tried during this
span, a substantial number of them are unsuccessful. Third, the market take-off period spans
from expansion of the market for Cat bonds. An exhaustive literature review on the
development and evolution of instruments, institutions and risk-transfer markets is
documented by Cummins & Weiss (2009).
2.2 Theoretical highlights and intuition
The concept of catch-up sprouted from the demise of Keynesianism and the rise of the
neoclassical revolution in which new theories of economic prosperity predicted absolute
convergence as an extension of market equilibrium or policies of free market competition
(Mayer-Foulkes, 2010; Asongu, 2014d). According to the neoclassical growth model,
convergence occurs to each country’s long-term equilibrium or to a country’s steady state. On
the other hand, another strand of the literature postulates that it is not feasible for income-
convergence to occur for two principal reasons: differences in initial endowments between
9
countries and the possibility of multiple equilibria. In the latter stance, divergence in initial
income studies (Barro, 1991) has been confirmed in the long-run (Pritchett, 1997).
As we have highlighted above, the empirical strategy is in accordance with the
substantial bulk of literature that has focused on cross-country income catch-up (Solow, 1956;
Swan, 1956; Baumol, 1986; Barro, 1991; Mankiw et al., 1992; Barro & Sala-i-Martin, 1992,
1995; Narayan et al., 2011; Asongu, 2013d, 2014d). While this underlying theory has not yet
met some consensus, there is currently a growing body of studies using the theoretical
underpinnings of catch-up literature in many other development fields. According to this
narrative, scholarly reporting of facts is a useful scientific activity even without some formal
theoretical underpinning. In this light, we join the strand in asserting that ‘applied
econometrics’ has other tasks than merely validating or refuting economic theories (Costantini
& Lupi, 2005; Narayan et al., 2011; Asongu, 2013d).
Putting the theoretical underpinnings into context, we postulate that the presence of
catch-up among African countries (in terms of return and return uncertainty) means some
common policies to mitigate the effects of globalization are feasible. On the other hand, full
catch-up implies that such feasible policies can be implemented without distinction of locality
or nationality within sampled countries. This is because in such a scenario where convergence
does not occur, investor can gain by holding portfolios originating from different countries. In
this light, to the degree that convergence occurs, the benefits from international portfolio
diversification are mitigated. Hence, a direct consequence of full convergence is that there are
similar yields for financial assets of similar liquidity and risk, regardless of locality and
nationality. This intuition is in accordance with an interesting bulk of recent literature on the
modeling and timing of intellectual property rights (IPRs) harmonization against software
piracy (Andrés & Asongu, 2013; Asongu, 2013d); common initiatives against African capital
flight (Asongu, 2014g); the future of knowledge economy (Asongu, 2013g,h); health of
10
financial markets (Bruno et al., 2012; Narayan et al., 2011; Asongu, 2013e, 2014e) and
currency areas (Asongu, 2013f, 2014f), inter alia.
3. Data and methodology
3.1 Data
We examine a panel of 28 African countries with annual data from World
Development Indicators (WDI) and the Financial Development and Structure Database
(FDSD) of the World Bank for the period 1999 to 2010. There is a fourfold justification for
this periodicity: (1) variables on institutional liberalization are only available from 1996; (2)
the interest of capturing second generation reforms for fresh policies discussed in the
introduction; (3) data availability constraints in bank returns and; (4) the computation of
uncertainty in returns that is accompanied with losses in degrees of freedom.
The dependent variables are: return on assets (ROA), return on equity (ROE),
uncertainty in ROA (UROA) and uncertainty in ROE (UROE). The computation of return
uncertainties is discussed in Section 3.2.1 below. The main independent variables include:
trade, financial and institutional liberalization measures. These respectively are trade
openness, foreign direct investment (FDI) and institutional quality index. The institutional
index obtained from principal component analysis (PCA) is discussed in Section 3.2.2. We
also control for other macroeconomic and structural characteristics, notably: inflation,
government expenditure and economic prosperity. Inflation can decrease bank returns (if not
well incorporated into interest rates) and increase uncertainty in the returns. Government
expenditure should intuitively have some effect on the dependent variables though the
expected sign remains ambiguous. We expect economic prosperity to increase bank returns as
well as uncertainty in these returns. The expected signs for inflation and economic prosperity
are consistent with Asongu (2011).
11
The intuition for the choice of the control variables is based on the theoretical
underpinnings of conditional convergence. Accordingly, it is possible for conditional
convergence to take place when countries differ in macroeconomic and structural
characteristics that determine bank return and return uncertainty. Consistent with Asongu
(2013b, 2014a), we control for globalization in terms of trade, financial and institutional
liberalization with trade openness, foreign direct investment, and the institutional
liberalization index respectively. From intuition and common sense, bank return naturally
depends on inflation and economic prosperity (GDP growth). We also control for government
intervention in the economy with government’s final consumption expenditure (Norden et al.,
2012).
The definition of variables (and their corresponding sources), presentation of the
sampled countries (with the summary statistics) and correlation analysis are detailed in
Appendix 1, Appendix 2 and Appendix 3 respectively. While Appendix 2 shows that there is
quite some variation in the data employed such that reasonable estimated linkages could
emerge, Appendix 3 serves to control for potential issues of overparametization and
multicollinearity that could substantially bias estimated coefficients.
3.2 Methodology
3.2.1 Computing return uncertainty
When agents are faced with uncertainty, conditional proxies for volatility are better
measures (Kangoye, 2013). Accordingly, GARCH-based approaches are appropriate to model
uncertainty. The variance of return contingent on past information is specified by a GARCH
(p,q) model. Unfortunately, GARCH-based approaches have a better fit with high frequency
data. Since, we are employing annual data; we use first- and second-order autoregressive
processes of the return variables. The uncertainties in the returns are then proxied by the
standard deviation of the corresponding residuals. In the computation of the standard errors
12
(uncertainties) we used three-year and four-year non-overlapping intervals for first-order and
second-order autoregressive processes respectively.
3.2.2 Principal component analysis (PCA)
Consistent with Asongu (2013b), the high degree of substitution (correlation) among
government quality variables means some information will be redundant if all the indicators
were considered simultaneously. Thus we employ PCA to reduce the dimensions and retain
only common factors that reflect much of the information or variability in the initial dataset.
PCA has been substantially used to reduce a set of highly correlated variables into a smaller
set of uncorrelated variables called principal components (PCs). The criteria used to retain
the common factors is from Kaiser (1974) and Jolliffe (2002) who have recommended that
only PCs with an eigenvalue of more than one should be retained. Hence, from Table 1, it can
be noticed that the first PC represents more than 78% of common information and has an
eigenvalue of 4.70. We call this composite indicator the institutional index (instidex).
Table 1: Principal Component Analysis (PCA) for Institutional Index (Instidex) Principal
Components
Component Matrix(Loadings) Proportion Cumulative
Proportion
Eigen
Value
V & A R.L R.Q G.E PS CC
First P.C 0.369 0.435 0.412 0.425 0.388 0.416 0.784 0.784 4.705
Second P.C -0.690 0.103 0.258 0.436 -0.453 0.227 0.083 0.867 0.499
Third P.C 0.591 -0.187 0.299 0.051 -0.724 -0.002 0.054 0.922 0.327 P.C: Principal Component. V& A: Voice & Accountability. R.L: Rule of Law. R.Q: Regulation Quality. GE: Government Effectiveness. PS:
Political Stability. CC: Control of Corruption.
3.2.3 Model specification and estimation technique
As documented in recent literature (Asongu, 2014d) from Islam (2003), there are a
plethora of ways to understand and apply the concept of convergence: convergence across
economies versus (vs) convergence within an economy; convergence in terms of income vs.
convergence in terms of growth rate; sigma-convergence vs. beta-convergence; conditional
convergence vs. unconditional (absolute) convergence; local or club-convergence vs. global-
13
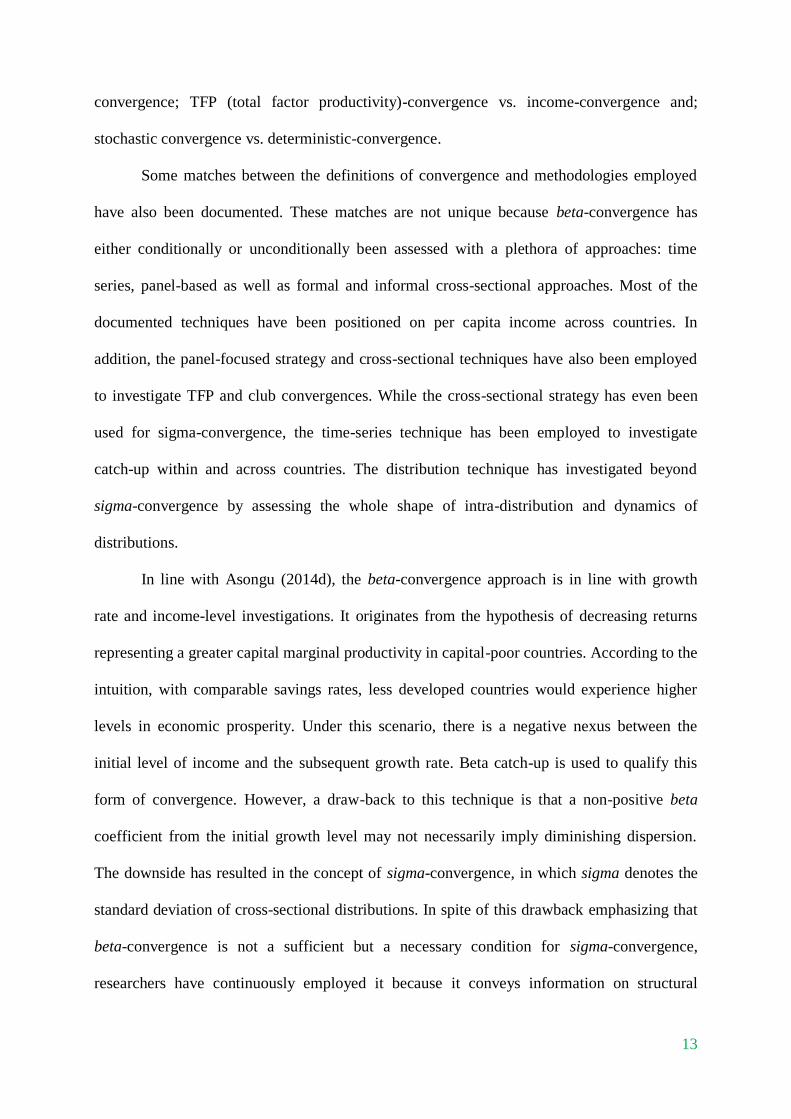
convergence; TFP (total factor productivity)-convergence vs. income-convergence and;
stochastic convergence vs. deterministic-convergence.
Some matches between the definitions of convergence and methodologies employed
have also been documented. These matches are not unique because beta-convergence has
either conditionally or unconditionally been assessed with a plethora of approaches: time
series, panel-based as well as formal and informal cross-sectional approaches. Most of the
documented techniques have been positioned on per capita income across countries. In
addition, the panel-focused strategy and cross-sectional techniques have also been employed
to investigate TFP and club convergences. While the cross-sectional strategy has even been
used for sigma-convergence, the time-series technique has been employed to investigate
catch-up within and across countries. The distribution technique has investigated beyond
sigma-convergence by assessing the whole shape of intra-distribution and dynamics of
distributions.
In line with Asongu (2014d), the beta-convergence approach is in line with growth
rate and income-level investigations. It originates from the hypothesis of decreasing returns
representing a greater capital marginal productivity in capital-poor countries. According to the
intuition, with comparable savings rates, less developed countries would experience higher
levels in economic prosperity. Under this scenario, there is a negative nexus between the
initial level of income and the subsequent growth rate. Beta catch-up is used to qualify this
form of convergence. However, a draw-back to this technique is that a non-positive beta
coefficient from the initial growth level may not necessarily imply diminishing dispersion.
The downside has resulted in the concept of sigma-convergence, in which sigma denotes the
standard deviation of cross-sectional distributions. In spite of this drawback emphasizing that
beta-convergence is not a sufficient but a necessary condition for sigma-convergence,
researchers have continuously employed it because it conveys information on structural
14
parameters of growth models. Accordingly, such information is not usually provided by the
distribution technique.
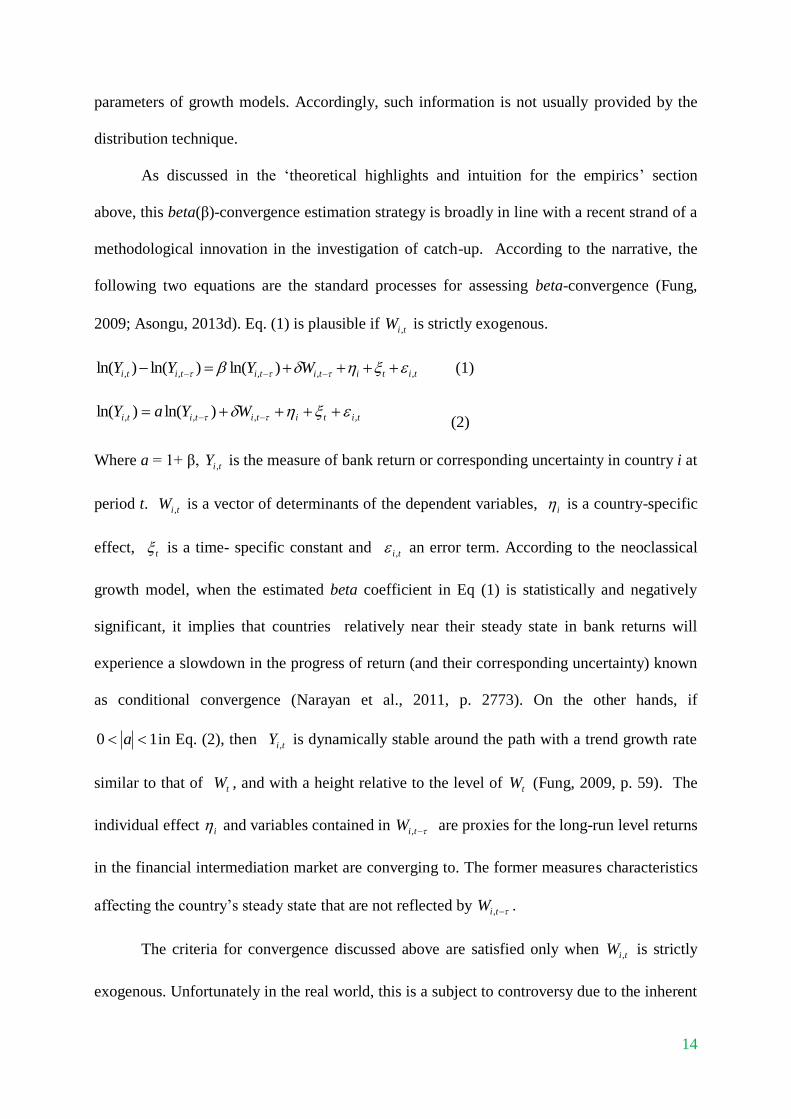
As discussed in the ‘theoretical highlights and intuition for the empirics’ section
above, this beta(β)-convergence estimation strategy is broadly in line with a recent strand of a
methodological innovation in the investigation of catch-up. According to the narrative, the
following two equations are the standard processes for assessing beta-convergence (Fung,
2009; Asongu, 2013d). Eq. (1) is plausible if tiW , is strictly exogenous.
titititititi WYYY ,,,,, )ln()ln()ln( (1)
tititititi WYaY ,,,, )ln()ln( (2)
Where a = 1+ β, tiY , is the measure of bank return or corresponding uncertainty in country i at
period t. tiW , is a vector of determinants of the dependent variables, i is a country-specific
effect, t is a time- specific constant and ti , an error term. According to the neoclassical
growth model, when the estimated beta coefficient in Eq (1) is statistically and negatively
significant, it implies that countries relatively near their steady state in bank returns will
experience a slowdown in the progress of return (and their corresponding uncertainty) known
as conditional convergence (Narayan et al., 2011, p. 2773). On the other hands, if
10 a in Eq. (2), then tiY , is dynamically stable around the path with a trend growth rate
similar to that of tW , and with a height relative to the level of tW (Fung, 2009, p. 59). The
individual effect i and variables contained in tiW , are proxies for the long-run level returns
in the financial intermediation market are converging to. The former measures characteristics
affecting the country’s steady state that are not reflected by tiW , .
The criteria for convergence discussed above are satisfied only when tiW , is strictly
exogenous. Unfortunately in the real world, this is a subject to controversy due to the inherent
15
possibility of reverse-causality. In essence, while liberalization policies could affect bank
returns and their corresponding uncertainties, the reverse effect cannot be ruled-out because
the state of domestic financial institutions also influences openness policies adopted by a
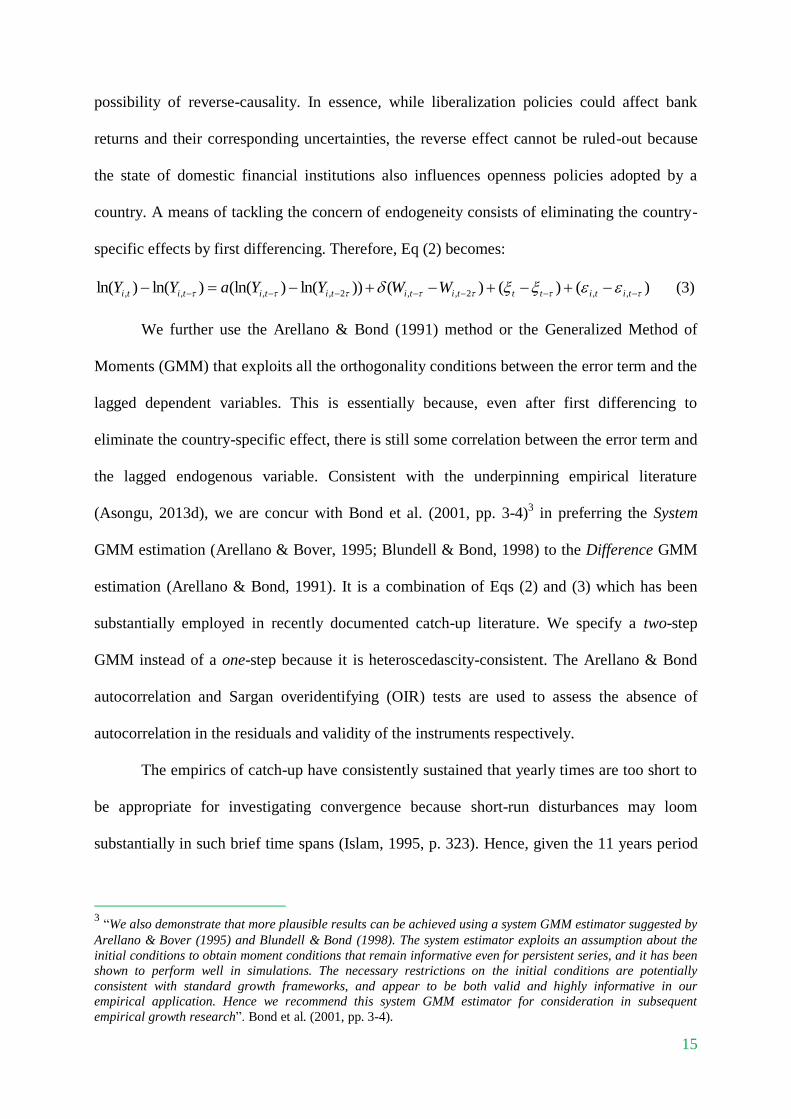
country. A means of tackling the concern of endogeneity consists of eliminating the country-
specific effects by first differencing. Therefore, Eq (2) becomes:
)()()())ln()(ln()ln()ln( ,,2,,2,,,, tititttitititititi WWYYaYY (3)
We further use the Arellano & Bond (1991) method or the Generalized Method of
Moments (GMM) that exploits all the orthogonality conditions between the error term and the
lagged dependent variables. This is essentially because, even after first differencing to
eliminate the country-specific effect, there is still some correlation between the error term and
the lagged endogenous variable. Consistent with the underpinning empirical literature
(Asongu, 2013d), we are concur with Bond et al. (2001, pp. 3-4)3 in preferring the System
GMM estimation (Arellano & Bover, 1995; Blundell & Bond, 1998) to the Difference GMM
estimation (Arellano & Bond, 1991). It is a combination of Eqs (2) and (3) which has been
substantially employed in recently documented catch-up literature. We specify a two-step
GMM instead of a one-step because it is heteroscedascity-consistent. The Arellano & Bond
autocorrelation and Sargan overidentifying (OIR) tests are used to assess the absence of
autocorrelation in the residuals and validity of the instruments respectively.
The empirics of catch-up have consistently sustained that yearly times are too short to
be appropriate for investigating convergence because short-run disturbances may loom
substantially in such brief time spans (Islam, 1995, p. 323). Hence, given the 11 years period
3 “We also demonstrate that more plausible results can be achieved using a system GMM estimator suggested by
Arellano & Bover (1995) and Blundell & Bond (1998). The system estimator exploits an assumption about the
initial conditions to obtain moment conditions that remain informative even for persistent series, and it has been
shown to perform well in simulations. The necessary restrictions on the initial conditions are potentially
consistent with standard growth frameworks, and appear to be both valid and highly informative in our
empirical application. Hence we recommend this system GMM estimator for consideration in subsequent
empirical growth research”. Bond et al. (2001, pp. 3-4).
16
(1999-2010) we use three-year and four-year non-overlapping intervals (NOI)4. We cannot
use two-year NOI because of constraints in computing the standard errors (standard deviation
of the residuals). On the other hand, we cannot employ more than four-year non-overlapping
intervals due to constraints in degrees of freedom required for conditional convergence
modeling. In essence, higher NOI orders have an inverse relationship with degrees of
freedom.
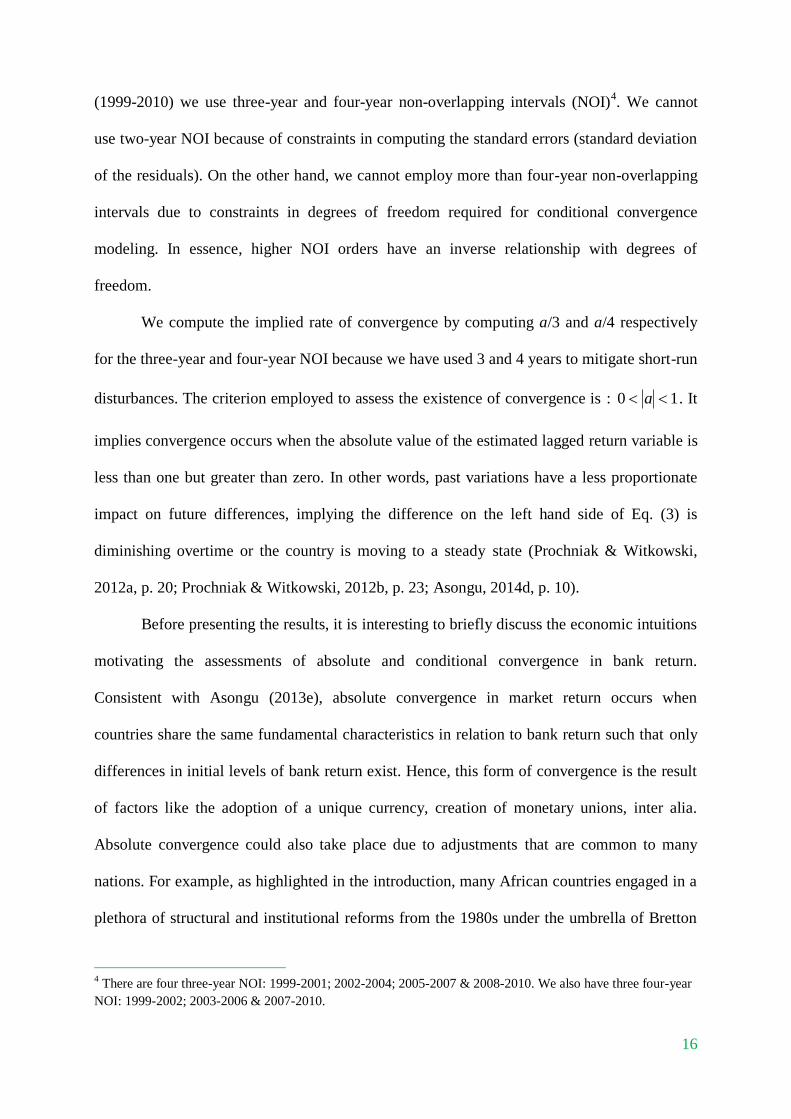
We compute the implied rate of convergence by computing a/3 and a/4 respectively
for the three-year and four-year NOI because we have used 3 and 4 years to mitigate short-run
disturbances. The criterion employed to assess the existence of convergence is : 10 a . It
implies convergence occurs when the absolute value of the estimated lagged return variable is
less than one but greater than zero. In other words, past variations have a less proportionate
impact on future differences, implying the difference on the left hand side of Eq. (3) is
diminishing overtime or the country is moving to a steady state (Prochniak & Witkowski,
2012a, p. 20; Prochniak & Witkowski, 2012b, p. 23; Asongu, 2014d, p. 10).
Before presenting the results, it is interesting to briefly discuss the economic intuitions
motivating the assessments of absolute and conditional convergence in bank return.
Consistent with Asongu (2013e), absolute convergence in market return occurs when
countries share the same fundamental characteristics in relation to bank return such that only
differences in initial levels of bank return exist. Hence, this form of convergence is the result
of factors like the adoption of a unique currency, creation of monetary unions, inter alia.
Absolute convergence could also take place due to adjustments that are common to many
nations. For example, as highlighted in the introduction, many African countries engaged in a
plethora of structural and institutional reforms from the 1980s under the umbrella of Bretton
4 There are four three-year NOI: 1999-2001; 2002-2004; 2005-2007 & 2008-2010. We also have three four-year
NOI: 1999-2002; 2003-2006 & 2007-2010.
17
Woods institutions (International Monetary Fund and World Bank for instance). The
implemented reforms included liberalization policies with the objective to mitigate barriers to
investment and trade. These reforms have been given credit for the impressive performance of
the financial intermediary markets in Africa, essentially because they theoretically obviate the
preferences for specific markets by investors. Other factors that could facilitate absolute
convergence are the improvements in ICTs that have ameliorated synchronization in the
financial intermediary market such that, cross-market shock adjustments are much faster. In
this logic, the speed at which cross-market shocks occur has increased with ICT growth and
hence, eased absolute convergence.
Conversely, as we have already highlighted in the third paragraph of Section 3.1,
conditional convergence is the type of catch-up which is contingent on institutional and
structural characteristics. Hence, in line with theoretical underpinnings, this form of
convergence is one in which a country’s long-term equilibrium (or steady state) is conditional
on fundamentals of the market/economy and structural characteristics (Narayan et al., 2011).
Hence, this form is conditioned on the macroeconomic (institutional and structural) variables
we choose and empirically test.
4. Empirical analysis
4.1 Presentation of results
This section assesses three main issues underlying the motivation of the chapter: (1)
examining catch-up in returns and return uncertainties, (2) computing the rate of catch-up and,
(3) investigating the time needed for full (100%) convergence. While tackling the first-two
concerns informs us on the feasibility of common policies in bank return and uncertainties,
the third concern provides the timeline during which such common policy initiatives can be
implemented without distinction of locality or nationality.
18
Table 2 below summarizes the results presented in Table 3. Absolute (or
unconditional) convergence is computed with only the lagged value of the dependent variable
as independent variable whereas, conditional convergence is modeled with the vector of
determinants ( tiW , ). In order to assess the validity of the estimations and indeed the
convergence hypotheses, we perform two tests. First, the Arellano and Bond test for
autocorrelation which examines the null hypothesis of the absence of autocorrelation. Second,
the Sargan test that investigates the overidentification restrictions. We also report the Wald
test for the joint significance of estimated coefficients. The models are overwhelmingly valid
because for the most part: (1) the null hypotheses for the Sargan and autocorrelation tests are
not rejected and; (2) the null hypothesis of the Wald test is rejected in the presence of
significant coefficients. For some models, the autocorrelation test is not reported because of
issues in degrees of freedom.
We also devote some space to discussing the computation of the values in Table 2:
rate of catch-up and time for full (100%) catch-up. Given an initial value of 0.903 that is
significant with valid instruments and no autocorrelation in the residuals: (1) the catch-up rate
is 30.10% ((0.903/3)*100) and; (2) the length of time required for full catch-up is 9.96 years
(300%/30.10%). Therefore, 9 years (yrs) and about 350 days are needed to achieve 100%
catch-up for a lagged value of 0.903 that is in accordance with the information criterion:
10 a .
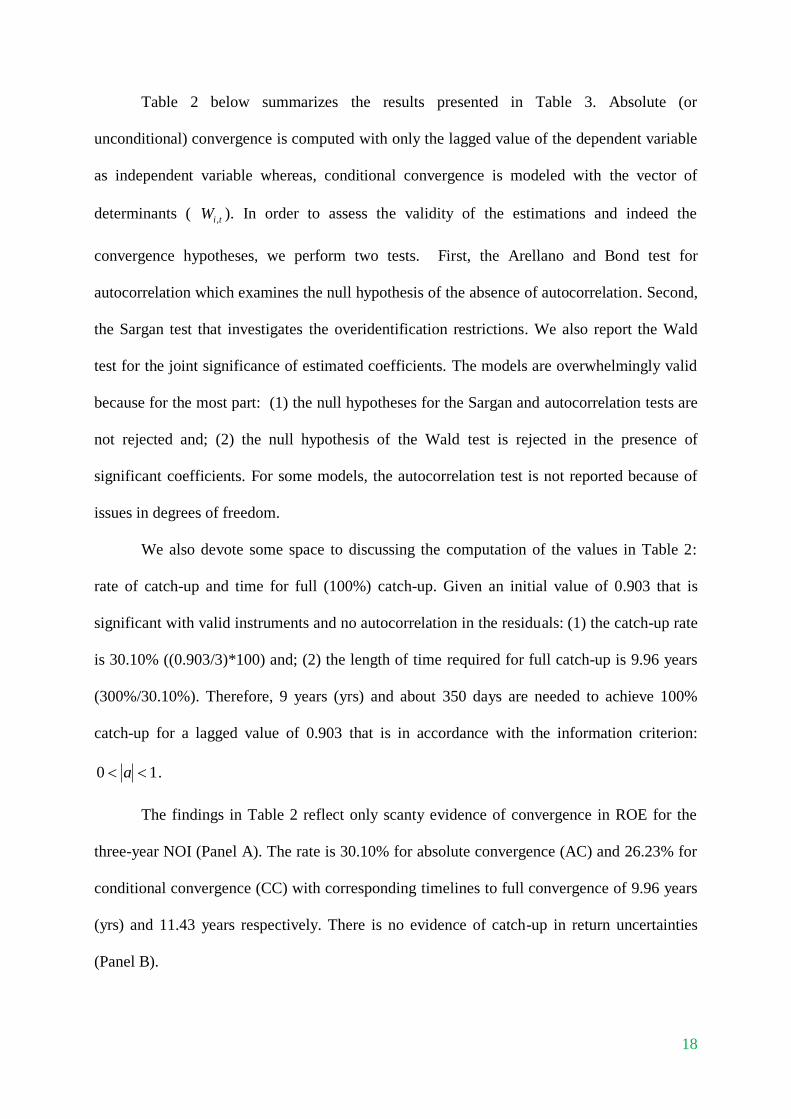
The findings in Table 2 reflect only scanty evidence of convergence in ROE for the
three-year NOI (Panel A). The rate is 30.10% for absolute convergence (AC) and 26.23% for
conditional convergence (CC) with corresponding timelines to full convergence of 9.96 years
(yrs) and 11.43 years respectively. There is no evidence of catch-up in return uncertainties
(Panel B).
19
Table 2: Summary of the results
Panel A: Returns Absolute Convergence Conditional Convergence
Three-Year NOI Four-Year NOI Three-Year NOI Four-Year NOI
ROA ROE ROA ROE ROA ROE ROA ROE
Convergence? No Yes No No No Yes No No
Rate of Convergence n.a 30.10% n.a n.a n.a 26.23% n.a n.a Time to Full Convergence n.a 9.96Yrs n.a n.a n.a 11.43Yrs n.a n.a
Panel B: Uncertainty in Returns
Absolute Convergence Conditional Convergence AR(1) &Three-Year
NOI
AR(2) & Four-
Year NOI
AR(1) &Three-Year
NOI
AR(2) & Four-Year
NOI
UROA UROE UROA UROE UROA UROE UROA UROE
Convergence? No No No No No No No No
Rate of Convergence n.a n.a n.a n.a n.a n.a n.a n.a Time to Full Convergence n.a n.a n.a n.a n.a n.a n.a n.a
ROA: Return on Assets. ROE: Return on Equity. UROA: Uncertainty in ROA. UROE: Uncertainty in ROE. FDI: Foreign Direct Investment.
Trade: Trade Openness. Gov. Exp: Government Expenditure. GDPg: Gross Domestic Growth rate. Instidex: Institutional Index. NOI: Non-
Overlapping Intervals. n.a: not applicable due to the absence of convergence. Yrs: years. AR(1): First Order Autoregression. AR(2): Second
Order Autoregression. Autoregression is on the Return variables (ROA & ROE).
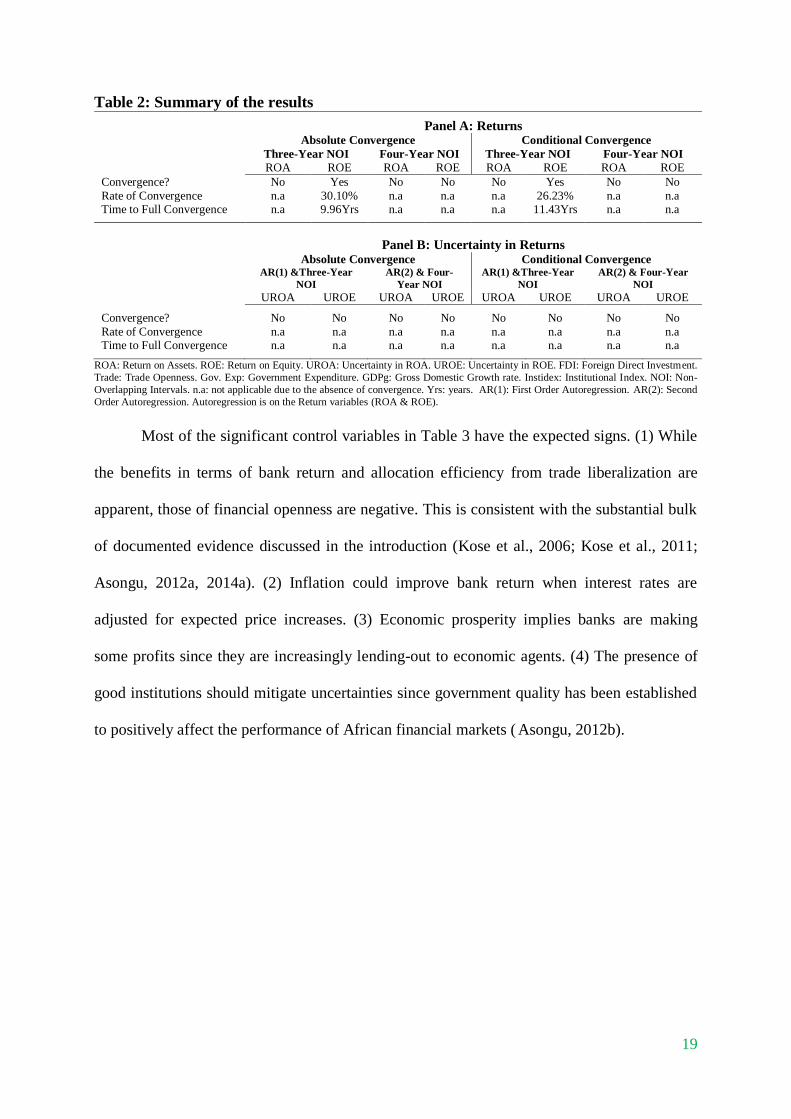
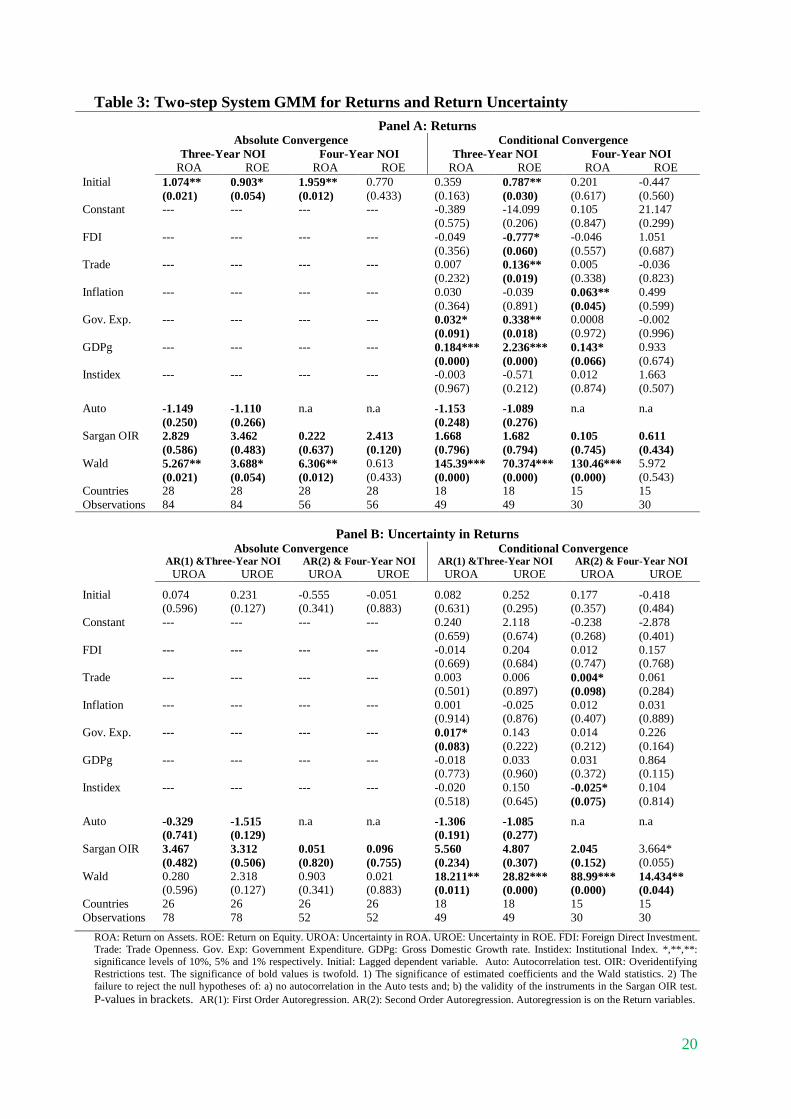
Most of the significant control variables in Table 3 have the expected signs. (1) While
the benefits in terms of bank return and allocation efficiency from trade liberalization are
apparent, those of financial openness are negative. This is consistent with the substantial bulk
of documented evidence discussed in the introduction (Kose et al., 2006; Kose et al., 2011;
Asongu, 2012a, 2014a). (2) Inflation could improve bank return when interest rates are
adjusted for expected price increases. (3) Economic prosperity implies banks are making
some profits since they are increasingly lending-out to economic agents. (4) The presence of
good institutions should mitigate uncertainties since government quality has been established
to positively affect the performance of African financial markets ( Asongu, 2012b).
20
Table 3: Two-step System GMM for Returns and Return Uncertainty
Panel A: Returns Absolute Convergence Conditional Convergence
Three-Year NOI Four-Year NOI Three-Year NOI Four-Year NOI
ROA ROE ROA ROE ROA ROE ROA ROE
Initial 1.074** 0.903* 1.959** 0.770 0.359 0.787** 0.201 -0.447
(0.021) (0.054) (0.012) (0.433) (0.163) (0.030) (0.617) (0.560) Constant --- --- --- --- -0.389 -14.099 0.105 21.147
(0.575) (0.206) (0.847) (0.299)
FDI --- --- --- --- -0.049 -0.777* -0.046 1.051
(0.356) (0.060) (0.557) (0.687) Trade --- --- --- --- 0.007 0.136** 0.005 -0.036
(0.232) (0.019) (0.338) (0.823)
Inflation --- --- --- --- 0.030 -0.039 0.063** 0.499
(0.364) (0.891) (0.045) (0.599) Gov. Exp. --- --- --- --- 0.032* 0.338** 0.0008 -0.002
(0.091) (0.018) (0.972) (0.996)
GDPg --- --- --- --- 0.184*** 2.236*** 0.143* 0.933
(0.000) (0.000) (0.066) (0.674) Instidex --- --- --- --- -0.003 -0.571 0.012 1.663
(0.967) (0.212) (0.874) (0.507)
Auto -1.149 -1.110 n.a n.a -1.153 -1.089 n.a n.a
(0.250) (0.266) (0.248) (0.276) Sargan OIR 2.829 3.462 0.222 2.413 1.668 1.682 0.105 0.611
(0.586) (0.483) (0.637) (0.120) (0.796) (0.794) (0.745) (0.434)
Wald 5.267** 3.688* 6.306** 0.613 145.39*** 70.374*** 130.46*** 5.972
(0.021) (0.054) (0.012) (0.433) (0.000) (0.000) (0.000) (0.543) Countries 28 28 28 28 18 18 15 15
Observations 84 84 56 56 49 49 30 30
Panel B: Uncertainty in Returns
Absolute Convergence Conditional Convergence AR(1) &Three-Year NOI AR(2) & Four-Year NOI AR(1) &Three-Year NOI AR(2) & Four-Year NOI
UROA UROE UROA UROE UROA UROE UROA UROE
Initial 0.074 0.231 -0.555 -0.051 0.082 0.252 0.177 -0.418 (0.596) (0.127) (0.341) (0.883) (0.631) (0.295) (0.357) (0.484)
Constant --- --- --- --- 0.240 2.118 -0.238 -2.878
(0.659) (0.674) (0.268) (0.401)
FDI --- --- --- --- -0.014 0.204 0.012 0.157 (0.669) (0.684) (0.747) (0.768)
Trade --- --- --- --- 0.003 0.006 0.004* 0.061
(0.501) (0.897) (0.098) (0.284)
Inflation --- --- --- --- 0.001 -0.025 0.012 0.031 (0.914) (0.876) (0.407) (0.889)
Gov. Exp. --- --- --- --- 0.017* 0.143 0.014 0.226
(0.083) (0.222) (0.212) (0.164)
GDPg --- --- --- --- -0.018 0.033 0.031 0.864 (0.773) (0.960) (0.372) (0.115)
Instidex --- --- --- --- -0.020 0.150 -0.025* 0.104
(0.518) (0.645) (0.075) (0.814)
Auto -0.329 -1.515 n.a n.a -1.306 -1.085 n.a n.a (0.741) (0.129) (0.191) (0.277)
Sargan OIR 3.467 3.312 0.051 0.096 5.560 4.807 2.045 3.664*
(0.482) (0.506) (0.820) (0.755) (0.234) (0.307) (0.152) (0.055)
Wald 0.280 2.318 0.903 0.021 18.211** 28.82*** 88.99*** 14.434** (0.596) (0.127) (0.341) (0.883) (0.011) (0.000) (0.000) (0.044)
Countries 26 26 26 26 18 18 15 15
Observations 78 78 52 52 49 49 30 30
ROA: Return on Assets. ROE: Return on Equity. UROA: Uncertainty in ROA. UROE: Uncertainty in ROE. FDI: Foreign Direct Investment.
Trade: Trade Openness. Gov. Exp: Government Expenditure. GDPg: Gross Domestic Growth rate. Instidex: Institutional Index. *,**,**:
significance levels of 10%, 5% and 1% respectively. Initial: Lagged dependent variable. Auto: Autocorrelation test. OIR: Overidentifying
Restrictions test. The significance of bold values is twofold. 1) The significance of estimated coefficients and the Wald statistics. 2) The
failure to reject the null hypotheses of: a) no autocorrelation in the Auto tests and; b) the validity of the instruments in the Sargan OIR test.
P-values in brackets. AR(1): First Order Autoregression. AR(2): Second Order Autoregression. Autoregression is on the Return variables.
21
4.2 Discussion of results, policy implications and caveats
4.2.1 Discussion of results
The absence of absolute convergence (AC) implies that there are substantial
differences in initial levels (endowments) of return and return uncertainty. On the other hand,
the presence of AC in ROE means that beyond the possibility of dissimilar initial conditions,
there are some common factors (without the control of the sampled countries) that are
enabling countries with low-levels in ROE to catch-up their counterparts with higher levels.
On the other hand, dissimilarity in initial ROE levels is influenced by various factors such as
leverage and capital requirements, inter alia. It is interesting to understand that AC is
principally the end of common factors, among others: the adoption of monetary unions like
single currency areas.
On the other hand, the presence of conditional convergence (CC) in ROE further
implies that there are substantial differences among countries in factors that determine ROE.
It should also be noted that this form of catch-up is contingent on the variables we choose and
empirically test which may not reflect all the determinants of ROE. We have used six control
variables in the conditioning information set. Liberalization (trade, capital and institutional)
and three other macroeconomic characteristics (inflation, government expenditure and
economic prosperity) have constituted the conditioning information set. However, we could
not constraint the conditional assessment beyond these control variables due to issues in
degrees of freedom. Accordingly, some models in the literature are not conditioned beyond
two macroeconomic variables (Bruno et al., 2012).
4.2.2 Policy implications
4.2.2.1 Implications for regional integration
Consistent with Asongu (2013e), the findings are relevant in terms of regional
integration. The overwhelming absence of catch-up could indicate the existence of non-
22
homogenous financial intermediation markets. Hence, policy makers should reconsider
adopted measures to achieve a higher degree of catch-up in the African banking market. This
invites the question of if policies implemented this far by the sampled countries to promote
financial integration have yielded the desired effects. Within the framework of bank returns
and return expectations, the convergence patterns indicate that such effects are not noticeable.
Whereas from an economic perspective, integration is taking place, it is not yet evident with
respect to the dependent variables used in this chapter. While it would be premature to
conclude that efforts furnished at integrating the African intermediary financial market have
been largely futile, it is nonetheless tempting to infer that geographical proximity is necessary
but not sufficient for integration.
4. 2.2.2 Implications for portfolio diversification
As Asongu (2013e) has emphasized that, the absence of strong nexuses among African
markets provides opportunities for portfolio diversification. Since our findings
overwhelmingly support the absence of convergence, a practical implication for investors in
the African continent is that holding portfolios in different countries will be profitable. Hence,
to the extent that convergence in the banking industry takes place, the rewards from
international portfolio diversification will be mitigated. The countervailing perspective
sustains that certain nations retain their country-specific financial and economic
characteristics which will inhibit the financial intermediary market from full convergence
(Adler & Dumas, 1983). In other words, from an African context the tendencies for home
bias, impediments to the free flow of capital, (inter alia) will preserve the benefits from
international diversification. The absence of catch-up further means that there is no possibility
of similar yields for financial assets of similar liquidity and risk, regardless of locality and
nationality. In this context, portfolio diversification will benefit investors.
23
Accordingly, financial intermediation theories consider integrated markets to be more
efficient relative to divergent ones. This is essentially because markets that are integrated
stimulate the flow of funds across borders and increase liquidity after improving the volume
of trade. In essence, due to the lower transaction cost for investors and lower cost of capital
for firms (Kim et al., 2005), integrated banking markets provide investors with the
opportunity of allocating capital efficiently. Integrated financial intermediary markets have
the appealing rewards to financial stability since they mitigate the possibility of asymmetric
shocks (Umutlu et al., 2010).
The need for convergence in the banking industry could also be explained by the level
of arbitrage activity. Hence, when markets are converging, the implication is that common
forces contained in arbitrage activity attract markets together. A further implication is that the
potential for international diversification and above-normal profits is limited because
supernormal profits are arbitraged away (Von Furstenberg & Jeon, 1989).
In the same light, when potential walls or barriers generating exchange rate premiums
and country risks are absent, the direct consequence is similar yields for financial assets of
similar liquidity and risk regardless of locality and nationality (Von Furstenberg & Jeon,
1989). In summary, the need for convergence in the African financial intermediary industry
has basis in arbitrage and the hypotheses underpinning portfolio theory. Hence, the
motivations for catch-up in the banking sector has basis in the literature of portfolio
diversification and stock market interdependence (Grubel, 1968; Levy & Sarnat, 1970).
4.2.2.3 Other implications
It is worthwhile discussing how convergence can be facilitated. As sustained by
Alagidede (2008) and Asongu (2013e), it could be improved by deregulation and elimination
of restrictions on banking and securities dealings, amelioration of information and
communication technologies (ICTs), relaxation of controls on capital movements and foreign
24
exchange transactions, inter alia. Cummins & Weiss (2009) have recommended the following
drivers of financial market convergence. First, major wheels of financial convergence which
mainly reflect market imperfections are various accounting, regulatory, tax and rating agency
factors (RATs). Second, favoring conditions and circumstances for the reinsurance
underwriting cycle. Third, advances in ICTs. Fourth, developing holistic or enterprise-wide
risk management (ERM) in which traditionally separated functions like the management of
insurable risks, currency risks, commodity risks, interest rate risks and other risks start to
merge under a single risk-management umbrella.
4.2.3 Caveats
Three main caveats have been retained from the study. First, while return on assets
could easily be understood as a measure of bank returns, return on equity may not be a safe
measure because it is influenced by various factors such as capital requirements, leverage,
inter alia. Second, there are risks involved when econometrics is employed beyond testing
theory. However, we have already provided a solid basis for the empirics in the motivation of
the chapter. Moreover, conditional convergence is based on the variables we choice and
empirically test, which may not directly reflect cross-country institutional and structural
differences that could drive bank return and return uncertainty. Third, the possibility of
multiple equilibria and initial endowments may limit the feasibility of convergence (Miller &
Upadhyay, 2002; Apergis et al., 2008; Caporale et al., 2009; Asongu, 2013e).
5. Conclusion
The recent financial crisis has brought about renewed interest in the debate over the
lofty ambitions of globalization and its implications for financial development, with greater
intensity in developing countries. This chapter has complemented exiting African
liberalization literature by providing fresh nexuses and patterns in two main areas. First, it has
25
assessed whether African financial institutions have benefited from liberalization policies in
terms of bank returns. Results from this investigation have shown that, while trade openness
has increased bank returns and return uncertainties, financial openness and institutional
liberalization have decreased bank returns and reduced return uncertainty respectively.
Second, we have modeled bank returns and return uncertainty in the context of liberalization
policies to assess fresh patterns for the feasibility of common policy initiatives. But for some
scanty evidence of convergence in return on equity, there is overwhelming absence of catch-
up among sampled countries. Implications for regional integration and portfolio
diversification have been discussed.
Appendices
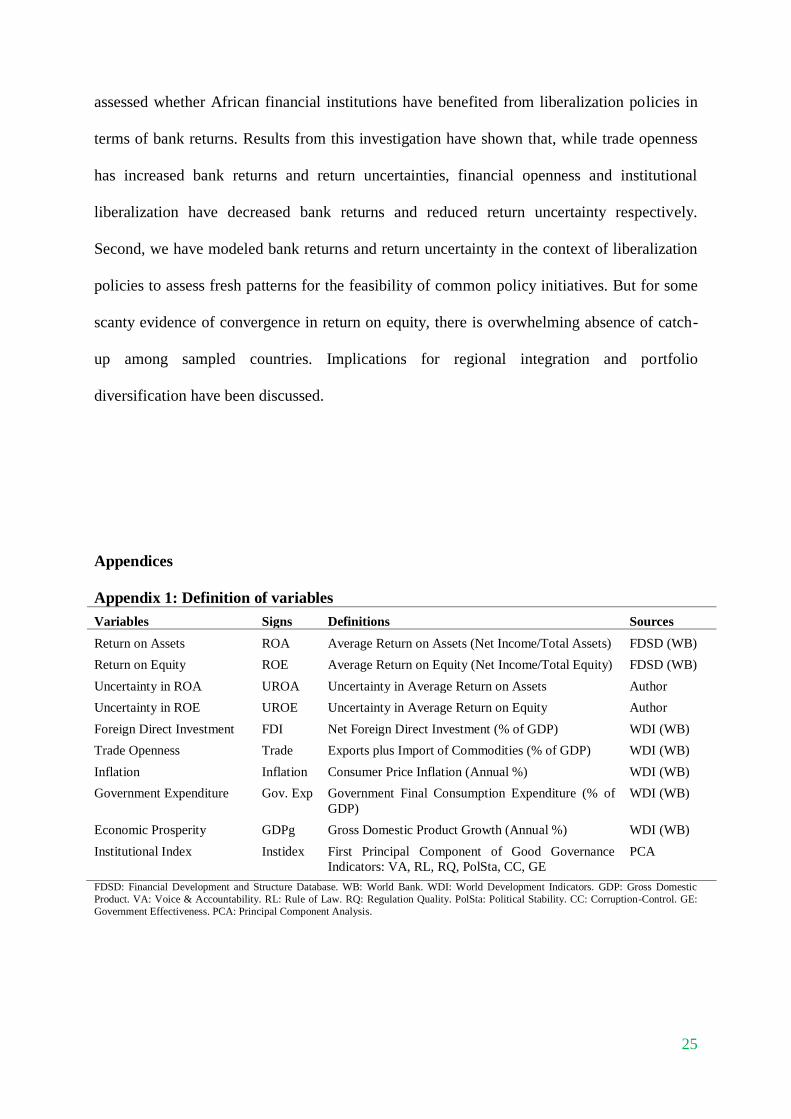
Appendix 1: Definition of variables
Variables Signs Definitions Sources
Return on Assets ROA Average Return on Assets (Net Income/Total Assets) FDSD (WB)
Return on Equity ROE Average Return on Equity (Net Income/Total Equity) FDSD (WB)
Uncertainty in ROA UROA Uncertainty in Average Return on Assets Author
Uncertainty in ROE UROE Uncertainty in Average Return on Equity Author
Foreign Direct Investment FDI Net Foreign Direct Investment (% of GDP) WDI (WB)
Trade Openness Trade Exports plus Import of Commodities (% of GDP) WDI (WB)
Inflation Inflation Consumer Price Inflation (Annual %) WDI (WB)
Government Expenditure Gov. Exp Government Final Consumption Expenditure (% of
GDP)
WDI (WB)
Economic Prosperity GDPg Gross Domestic Product Growth (Annual %) WDI (WB)
Institutional Index Instidex First Principal Component of Good Governance
Indicators: VA, RL, RQ, PolSta, CC, GE
PCA
FDSD: Financial Development and Structure Database. WB: World Bank. WDI: World Development Indicators. GDP: Gross Domestic
Product. VA: Voice & Accountability. RL: Rule of Law. RQ: Regulation Quality. PolSta: Political Stability. CC: Corruption-Control. GE:
Government Effectiveness. PCA: Principal Component Analysis.
26
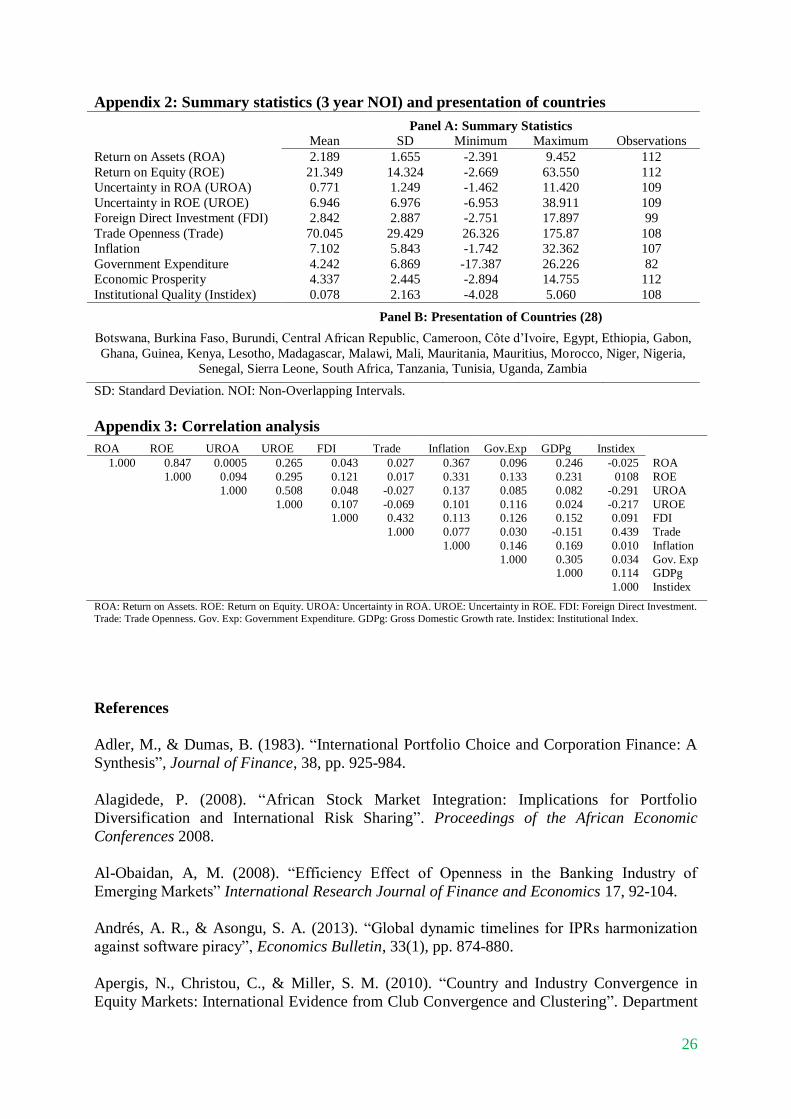
Appendix 2: Summary statistics (3 year NOI) and presentation of countries
Panel A: Summary Statistics
Mean SD Minimum Maximum Observations
Return on Assets (ROA) 2.189 1.655 -2.391 9.452 112
Return on Equity (ROE) 21.349 14.324 -2.669 63.550 112
Uncertainty in ROA (UROA) 0.771 1.249 -1.462 11.420 109
Uncertainty in ROE (UROE) 6.946 6.976 -6.953 38.911 109
Foreign Direct Investment (FDI) 2.842 2.887 -2.751 17.897 99
Trade Openness (Trade) 70.045 29.429 26.326 175.87 108
Inflation 7.102 5.843 -1.742 32.362 107
Government Expenditure 4.242 6.869 -17.387 26.226 82
Economic Prosperity 4.337 2.445 -2.894 14.755 112
Institutional Quality (Instidex) 0.078 2.163 -4.028 5.060 108
Panel B: Presentation of Countries (28)
Botswana, Burkina Faso, Burundi, Central African Republic, Cameroon, Côte d’Ivoire, Egypt, Ethiopia, Gabon,
Ghana, Guinea, Kenya, Lesotho, Madagascar, Malawi, Mali, Mauritania, Mauritius, Morocco, Niger, Nigeria,
Senegal, Sierra Leone, South Africa, Tanzania, Tunisia, Uganda, Zambia
SD: Standard Deviation. NOI: Non-Overlapping Intervals.
Appendix 3: Correlation analysis
ROA ROE UROA UROE FDI Trade Inflation Gov.Exp GDPg Instidex
1.000 0.847 0.0005 0.265 0.043 0.027 0.367 0.096 0.246 -0.025 ROA
1.000 0.094 0.295 0.121 0.017 0.331 0.133 0.231 0108 ROE
1.000 0.508 0.048 -0.027 0.137 0.085 0.082 -0.291 UROA
1.000 0.107 -0.069 0.101 0.116 0.024 -0.217 UROE 1.000 0.432 0.113 0.126 0.152 0.091 FDI
1.000 0.077 0.030 -0.151 0.439 Trade
1.000 0.146 0.169 0.010 Inflation
1.000 0.305 0.034 Gov. Exp 1.000 0.114 GDPg
1.000 Instidex
ROA: Return on Assets. ROE: Return on Equity. UROA: Uncertainty in ROA. UROE: Uncertainty in ROE. FDI: Foreign Direct Investment.
Trade: Trade Openness. Gov. Exp: Government Expenditure. GDPg: Gross Domestic Growth rate. Instidex: Institutional Index.
References
Adler, M., & Dumas, B. (1983). “International Portfolio Choice and Corporation Finance: A
Synthesis”, Journal of Finance, 38, pp. 925-984.
Alagidede, P. (2008). “African Stock Market Integration: Implications for Portfolio
Diversification and International Risk Sharing”. Proceedings of the African Economic
Conferences 2008.
Al-Obaidan, A, M. (2008). “Efficiency Effect of Openness in the Banking Industry of
Emerging Markets” International Research Journal of Finance and Economics 17, 92-104.
Andrés, A. R., & Asongu, S. A. (2013). “Global dynamic timelines for IPRs harmonization
against software piracy”, Economics Bulletin, 33(1), pp. 874-880.
Apergis, N., Christou, C., & Miller, S. M. (2010). “Country and Industry Convergence in
Equity Markets: International Evidence from Club Convergence and Clustering”. Department
27
of Banking and Financial Management, University of Piraeus, Greece.
Arellano, M., and Bond, S. (1991) “Some tests of specification for panel data: Monte Carlo
evidence and an application to employment equations”, The Review of Economic Studies 58,
pp. 277-297.
Arellano, M., and Bover, O. (1995) “Another look at the instrumental variable estimation of
error-components models” Journal of Econometrics 68, pp. 29-52.
Arestis, P., Demetriades, P. O., Fattouh, B., and Mouratidis, K. (2002). “The impact of
financial liberalisation policies on financial development: evidence from developing
countries”, International Journal of Finance and Economics 7(2), pp. 109-121.
Asongu, S. A. (2011). “Why do French civil-law countries have higher levels of financial
efficiency?”, Journal of Advanced Research in Law and Economics 2(2), pp. 94-108.
Asongu, S. A. (2012a). “Bank efficiency and openness in Africa: do income levels matter?”
The Review of Finance and Banking 4(2), pp. 115-122.
Asongu, S. A. (2012b). “Government quality determinants of stock market performance in
African countries”, Journal of African Business, 13(3), pp. 183-199.
Asongu, S. A. (2013a). “How do financial reforms affect inequality through financial sector
competition? Evidence from Africa”, Economics Bulletin, 33(1), pp. 401-414.
Asongu, S. A. (2013b). “How has politico-economic liberalization affected financial
allocation efficiency? Fresh African Evidence”, Economics Bulletin, 33(1), pp. 663-676.
Asongu, S. A. (2013c). “Fighting consumer price inflation in Africa: what do dynamics in
money, credit, efficiency and size tell us?”, Journal of Financial Economic Policy, 5(1), pp.
39-60.
Asongu, S. A. (2013d). “Harmonizing IPRs on Software Piracy: Empirics of Trajectories in
Africa”, Journal of Business Ethics, 118(3), pp. 667-682.
Asongu, S. A. (2013e). “African Stock Market Performance Dynamics: A Multidimensional
Convergence Assessment”, Journal of African Business, 14(3), pp. 186-201.
Asongu, S. A. (2013f). “Real and Monetary Policy Convergence: EMU Crisis to the CFA
Zone”, Journal of Financial Economic Policy, 5(1), pp. 20-38.
Asongu, S. A. (2013g). “Modeling the future of knowledge economy: evidence from SSA and
MENA countries”, Economics Bulletin, 33(1), pp. 612-624.
Asongu, S. A. (2013h). “On the Obituary of Scientific Knowledge Monopoly”, Economics
Bulletin, 33(4), pp. 2718-2731.
Asongu, S. A. (2014a). “Financial development dynamic thresholds of financial globalization:
evidence from Africa”, Journal of Economic Studies, 41(2), pp. 166-195.
28
Asongu, S. A. (2014b). “Correcting inflation with dynamic fundamentals: which adjustments
matter in Africa”, Journal of African Business: Forthcoming.
Asongu, S. A. (2014c). “Does Money Matter in Africa? New Empirics on Long- and Short-
run Effects of Monetary Policy on Output and Prices”, Indian Growth and Development
Review: Forthcoming.
Asongu, S. A. (2014d). “African Development: Beyond Income Convergence”, South African
Journal of Economics, http://onlinelibrary.wiley.com/doi/10.1111/saje.12021/abstract
(accessed: 30/11/2013).
Asongu, S. A. (2014e). “African Financial Development Dynamics: Big Time Convergence”,
African Journal of Economic and Management Studies: Forthcoming.
http://econpapers.repec.org/paper/pramprapa/36053.htm (accessed: 30/11/2013).
Asongu, S. A. (2014f). “Are Proposed African Monetary Unions Optimal Currency Areas?
Real, Monetary and Fiscal Policy Convergence Analysis”, African Journal of Economic and
Management Studies: Forthcoming.
http://econpapers.repec.org/paper/pramprapa/41552.htm (accessed: 30/11/2013).
Asongu, S. A., (2014g). “Fighting African Capital Flight: Empirics on Benchmarking Policy
Harmonization”, European Journal of Comparative Economics: Forthcoming.
Batuo, M. E., & Asongu, S. A., (2014). “The impact of liberalization policies on income
inequality in African countries”, Journal of Economic Studies: Forthcoming.
Batuo, M. E., Guidi, F., & Kupukile, M. (2010, August). “Financial Development and
Income Inequality: Evidence from African countries” African Development Bank.
Batuo, M. E., & Kupukile, M. (2010) “How can economic and political liberalization
improve financial development in African countries?” Journal of Financial Economic Policy,
2(1), pp. 35-59.
Barro, R. (1991). “Economic Growth in a Cross Section of Countries”. Quarterly Journal of
Economics 196 (2/May), pp. 407–443.
Barro, R. J., & Sala-i-Martin, X. (1992). “Convergence”, Journal of Political Economy, 100,
pp. 223-251.
Barro, R. J., & Sala-i-Martin, X. (1995). Economic Growth. The MIT Press, Cambridge, MA.
Baumol, W. J. (1986). “Productivity, growth, convergence and welfare: what the long run
data show”, American Economic Review, 76, pp. 1072-1085.
Blundell, R., & Bond, S. (1998) “Initial conditions and moment restrictions in dynamic panel
data models”, Journal of Econometrics, 87(1), pp. 115-143.
Bruno, G., De Bonis, R., & Silvestrini, A. (2012). “Do financial systems converge? New
evidence from financial assets in OECD countries”, Journal of Comparative Economics;
40(1), pp. 141-155.
29
Bond, S., Hoeffler, A., & Tample, J. (2001). “GMM Estimation of Empirical Growth
Models”, University of Oxford.
Caporale, G. M., Erdogan, B., & Kuzin, V. (2009). “Testing for Convergence in Stock
markets: A Non-Linear Factor Approach”. Discussion Paper No. 932, Deutsches Institut fur
Wirtschaftsforschung, Berlin.
Chen, G-M., Firth, M., & Rui, O. M. (2002). “Stock market linkages: evidence from Latin
America, Journal of Banking and Finance, 26”, pp. 1113-1141.
Cho, Y. J. (1986) “Inefficiencies of financial liberalization in the absence of well-functioning
equity markets” Journal of Money, Credit and Banking 18(2), 191-199.
Coccorese, P., & Pellecchia, A. (2010). “Testing the ‘Quiet Life’ Hypothesis in the Italian
Banking Industry”, Economic Notes by Banca dei Paschi di Siena SpA, 39(3), pp. 173-202.
Costantini, M., & Lupi, C. (2005). “Stochastic Convergence among European Economies”.
Economics Bulletin, 3(38), pp.1-17.
Cox, S. H., & Schwebach, R. G. (1992). “Insurance Futures and Hedging Insurance
Price Risk”, Journal of Risk and Insurance, 59, pp. 628-644.
Cummins, J. D., & Weiss, M. A. (2009). “Convergence of insurance and financial markets:
hybrid and securitized risk-transfer solutions, The Journal of Risk and Insurance, 76(3), 493-
545.
D’Arcy, S. P., & France, V. G. (1992). “Catastrophe Futures: A Better Hedge for Insurers”,
Journal of Risk and Insurance, 59, pp. 575-600.
Fischer, S. (1998). “Capital Account Liberalisation and the Role of the IMF”, in “Should the
IMF Pursue Capital-Account Convertibility?”, Essays in International Finance, Department of
Economics, Princeton University, 207, pp. 1-10.
Fouda, O., J., P. (2009). “La surliquidité des banques en zone franc : Comment expliquer le
paradoxe de la CEMAC ?”, Revue Africaine de l’Intégration 3(2), pp. 43-97.
Fung, M. K. (2009). “Financial development and economic growth: convergence or
divergence?”. Journal of International Money and Finance, 28, pp.56-67.
Grubel, H. (1968). “Internationally diversified portfolio: welfare gains in capital flows”,
American Economic Review, 58, pp. 89-94.
Henry, P. B. (2007) “Capital Account Liberalization: Theory, Evidence and Speculation”
Journal of Economic Literature, XLV, pp. 887-935.
Islam, N. (2003). “What have we learnt from the convergence debate?”, Journal of Economic
Surveys, 17(3), pp. 309-362.
Islam, N. (1995). “Growth Empirics: A Panel Data Approach”. The Quarterly Journal of
Economics, 110, (4), pp. 1127-1170.
30
Janine, A., & Elbadawi, I. A. (1992). “Parallel Markets, the foreign Exchange Auction, and
Exchange Rate Unification in Zambia”, World Bank Policy Working Paper No. 909, The
World Bank.
Jolliffe, I. T. (2002) Principal Component Analysis (2nd
Ed.) New York: Springer.
Kablan, S. (2010). “Banking efficiency and financial development in Sub-Saharan Africa”,
IMF Working Paper 10/136.
Kaiser, H. F. (1974). “An index of factorial simplicity”, Psychometrika 39, pp. 31–36.
Kangoye, T., (2013). “Does Aid Unpredictability Weaken Governance? Evidence from
Developing Countries”, The Developing Economies, 51(2), pp. 121-144.
Kim, S. J., Moshirian, F., & Wu, E. (2005). “Dynamic stock market integration driven by the
European Monetary Union: an empirical analysis”, Journal of Banking and Finance, 29, pp.
2475-2502.
Kiyota, H. (March 2009). “Efficiency of commercial banks in Sub-Saharan Africa: a
comparative analysis of domestic and foreign banks”, Asian Development Bank Institute.
Kose, M. A., Prasad, E. S., & Taylor, A. D. (2011) “Threshold in the process of international
financial integration”, Journal of International Money and Finance 30(1), pp. 147-179.
Kose, M. A., Prasad, E. S., & Rogoff, K., Wei, S. J. (2006). “Financial globalization: a
reappraisal”, IMF Staff Papers 56(1), pp. 8-62.
Kukenova, M. (2011). “Financial liberalization and allocative effective of capital”, World
Bank Policy Research Working Paper No. 5670.
Levy, H., & Sarnat, M. (1970). “International diversification of investment portfolios”,
American Economic Review, 60, pp. 668-675.
Mankiw, N. G., Romer, D., & Weil, D. N. (1992). “A contribution to the empirics of
economic growth”, Quarterly Journal of Economics, 107, pp. 407–437.
Mayer-Foulkes, D. (2010). “Divergences and Convergences in Human Development”. UNDP
Human Development Research Paper 2010/20.
Miller, S. M., & Upadhyay, M. P. (2002). “Total factor productivity and the convergence
hypothesis”, Journal of Macroeconomics 24, pp. 267-286.
Narayan, P.K., Mishra, S., & Narayan, S. (2011). “Do market capitalization and stocks traded
converge? New global evidence”. Journal of Banking and Finance, 35, pp. 2771-2781.
Ndikumana, L. (1999). “Debt service, financing constraints and fixed investment: evidence
from panel data”, Journal of Post Keynesian Economics, 21(3), pp. 455-478.
31
Ndikumana, L. (2000). “Financial determinants of domestic investment in Sub-Saharan
Africa: evidence from panel data”, World Development, 28(2), pp. 381-400.
Ndikumana, L. (2005). “Financial development, financial structure and domestic investment:
international evidence”, Journal of International Money and Finance, 24(4), pp. 651-673.
Nelson, S. C., & Katzenstein, P. J. (2011). “Uncertainty, Risk and Financial Crisis in 2008”,
Department of Political Sciences, Northwestern University.
https://www.princeton.edu/politics/about/file-repository/public/Nelson-and-Katzenstein-
Uncertainty-Risk-and-Crisis-IO-FINAL_07-16-13.pdf (Accessed: 26/01/2014).
Nguena, C. L. (2014). “Banking Activity Sensitivity to Macroeconomic Shocks and Financial
Policies Implications: The Case of CEMAC Sub-region”, African Development Review:
Forthcoming.
Niehaus, G., & Mann, S. V. (1992). “The Trading of Underwriting Risk: An Analysis
of Insurance Futures Contracts and Reinsurance”, Journal of Risk and Insurance, 59:
pp. 601-627.
Norden, L., Roosenboom, P., & Wang, T., (2012). “The Impact of Government Intervention
in Banks on Corporate Borrowers’ Stock Returns”,
http://papers.ssrn.com/sol3/papers.cfm?abstract_id=2021134 (Accessed: 21/02/2014).
Obstfeld, M. (1998) “The Global Capital Market: Benefactor or Menace?” Journal of
Economic Perspectives 12(4), pp. 9-30.
Pritchett, L. (1997). “Divergence, Big Time”. Journal of Economic Perspectives, 11(3), pp. 3-
17.
Rodrik, D. (1998) “Who Needs Capital-Account Convertibility?” Essays in International
Finance, No. 207 (Princeton, New Jersey: Princeton University).
Rodrik, D., & Subramanian, A. (2009). “Why did financial globalization disappoint?”, IMF
Staff Papers, 56(1), pp. 112-138.
Rogoff, K., S. (1999). “International Institutions for Reducing Global Financial Instability”
Journal of Economic Perspectives 13(4), pp. 21-42.
Saxegaard, M. (2006). “Excess liquidity and effectiveness of monetary policy: evidence from
sub-Saharan Africa” IMF Working Paper 06/115.
Solow, R. M. (1956). “A contribution to the theory of economic growth”, Quarterly Journal
of Economics, 70, pp. 65-94.
Summers, L. H. (2000). “International Financial Crises: Causes, Prevention and Cures”,
American Economic Review 90(2), pp. 1-16.
Swan, T. (1956). “Economic growth and capital accumulation”. Economic Record, 32, pp.
334–361.

32
Umutlu, M., Akdeniz, L., & Altag-Salih, A. (2010). “The degree of financial liberalisation
and aggregated stock-return volatility in emerging markets”, Journal of Banking and Finance,
34(3), pp. 509-521.
Von Furstenberg, G. M., & Jeon, B. N. (1989). “International stock price movements: links
and messages”, Brookings Papers on Economic Activity, 1, pp. 125-179.


