Embed Size (px)
Citation preview
Freeze‐drying of pharmaceutical excipients
close to collapse temperature: influence of the process
conditions on process time and product quality.
Antonello A. Barresi, Sabrina Ghio, Davide Fissore*, Roberto Pisano
Dipartimento di Scienza dei Materiali e Ingegneria Chimica, Politecnico di Torino,
C.so Duca degli Abruzzi 24, Torino, 10129, Italy
* Corresponding author:
Dr. Davide Fissore
e‐mail: [email protected]
Tel: +39‐011‐0904693
Fax: +39‐011‐0904699
This is an electronic version (author's version) of an article published in DRYING TECHNOLOGY, Volume 27, Issue 6, pages 805-816 (2009).
DRYING TECHNOLOGY is available online at:
http://www.tandfonline.com/openurl?genre=article&issn=0737-3937&volume=27&issue=6&spage=805
1
Abstract
The aim of this paper is to investigate the characteristics of a vial freeze‐dried
product as a function of the temperature at which the primary drying is carried out.
The effect of the drying temperature and of the composition on the product
appearance and on the final characteristics (apparent density and rehydratability) of
pure substances (mannitol, sucrose and dextran) has been studied: the
rehydratability results to be faster for the product freeze‐dried at lower temperature,
when the structure of the product is more porous and softer; higher rehydration rates
were also observed for samples obtained from lower initial concentration. In case of
binary mixtures (of mannitol and dextran and of sucrose and dextran) the
rehydratability gets worse when higher drying temperatures are used, while the
relative composition has a smaller effect. Nevertheless, high drying temperatures are
required to shorten the process, both in case of pure substances and in case of binary
mixtures; thus, it is important to consider the process time‐product quality
relationship to choose the optimal drying temperature. Finally, we show that the
freeze‐drying of mixtures can be easier and faster than that of one of the components
alone: this is partly a consequence of the higher temperatures allowed, but it is
evident that in some cases the drying kinetics can be higher even with the same
process temperature.
Keywords
Freeze‐drying, Product collapse, Rehydratability, Residual moisture
2
Introduction
Freeze‐drying is a technique used to desiccate many kinds of materials, especially
biological and heat‐sensitive substances, such as pharmaceuticals, due to the low
working temperature and to the possibility of carrying out the process in a sterile
environment (Liapis et al., 1995; Liapis et al., 1996; Sadikoglu and Liapis, 1997). The
process consists of two steps: during primary drying the frozen product is maintained
at low pressure, thus causing the sublimation of the solvent (heat must be supplied,
e.g. using a heating shelf, as the sublimation process in endothermic), while during
secondary drying the residual solvent, strongly bounded to the partially dried product,
is reduced to the target value by desorption (using low pressure and moderate
temperature, e.g. +20‐40°C).
The drying times required for the freeze‐drying process are substantially longer
when compared to the conventional evaporative drying methods. It could take a lot
of additional time (even days) to freeze‐dry a certain product of interest, if the
process is not well‐designed and/or not optimized (Tang and Pikal, 2004; Sadikoglu
et al., 2006). The operating conditions required to obtain a product with the desired
characteristics are found mostly by ʺtrial and errorʺ: this is a consequence of the
impossibility of directly measuring, and thus of controlling, in‐line the parameters of
interest, namely the product temperature and the residual water content. In some
cases the operating conditions are selected by the operator, while in some other cases
they are obtained by means of experimental studies (Hottot et al., 2007) or
mathematical simulation of the process, with the goal to minimize the drying time
(Rene et al., 1993; Lombraña et al., 1993a and 1993b; Boss et al., 2004; Gan et al., 2004;
Gan et al. 2005; Velardi and Barresi, 2008).
Beside choosing the optimal operating conditions, a pharmaceutical product
prepared by freeze‐drying needs to be formulated using adequate excipients to
preserve the active principles. The product resulting after the drying should be shelf‐
stable, good‐looking according to the pharmaceutical practice, and it needs to be
3
almost instantaneously reconstituted in the amount of water required to obtain the
therapeutic dose. Although regarded as a soft dehydration process, lyophilization
can damage the product as in the various stages, namely freezing, primary and
secondary drying, a series of stresses are applied to the molecules of the product,
which can be rather labile. Thus, total or partial inactivation during this multistage
process is not unusual and the loss of properties can be even of one or more orders of
magnitude (in the pharmaceutical world, such activity decay is described in terms of
ʺlog‐decayʺ, as in the case of vaccines).
The traditional approach to solve these stability problems is to add a stabilizer
to the solution containing the active principles. This operation is based on the
identification of a potential stabilizer and on the test of the new formulation. Some
other components ‐ the fillers ‐ can be added to the product to make it much more
resistant to deterioration during the process. Bulking agents, such as mannitol or
glycine, are used for increasing the drug volume so that a mechanically more robust
product is obtained, thus preventing the so‐called ʺblow‐outʺ: this phenomenon may
occur in presence of a solution having a very low content of solute, e.g. less than 1%
by weight. Other excipients can have a cryoprotective action and are used to prevent
the damages caused by the variation of the ionic strength and of the pH of the
solution occurring during freezing (Pikal‐Cleland et al., 2000; Franks, 2007).
The solutes added to the solution may crystallize or not during freezing, thus
remaining in a glassy or amorphous state. The behavior of a solute depends mainly
on its chemical structure, on the initial concentration, on the interaction with the
other solutes and on the procedure used for freezing. During the freezing of an
aqueous solution a complete eutectic phase separation, i.e. solvent and solute that
crystallize thoroughly to form a mixture of ice and solute crystals, is rarely observed,
and it must be considered that in case of eutectic freezing sensitive biomolecules
cannot be adequately protected. Moreover, several solutions tend to supersaturation:
water continues to freeze and the temperature drops below the eutectic value; finally,
the residual mixture (excluding ice) may undergo the so‐called ʺglass transitionʺ
4
when the viscosity increases by many orders of magnitude in a narrow temperature
interval. The product achieves then the structural form of an amorphous solid and is
described according to a glassy phase. The transition from an over‐saturated freeze‐
concentrated aqueous solution of very high viscosity to a glassy solid is characterized
by a glass transition temperature Tgʹ (see, for example, Franks, 2007). Actually, the
transition does not occur at a well‐defined temperature, but in a narrow range of
temperatures, and the observed value depends on the rate of heating or cooling and,
thus, on the measurement procedure adopted; moreover, it may depend also on the
sample history and is characterized by a change in the specific heat (Blanshard, 1995).
If Tgʹ is exceeded during the primary drying, a collapse of the cake structure can
occur: the solute phase next to the frozen layer attains sufficient fluidity to undergo
viscous flow at a significant rate and, when the temperature is high enough (and the
corresponding viscosity is low enough) to allow the phase to flow over distances of
the order of the pore size within the process time scale, the product cake looses its
stiff pore structure and undergoes collapse. The temperature at which this is first
noted by visual observation is the collapse temperature Tc. This temperature and the
Tgʹ are closely related and the collapse temperature is normally a few degrees
centigrade higher than Tgʹ (even if in practical applications the collapse temperature
can be identified precautionarily with the glass transition temperature). Anyway, the
distinction between Tc and Tgʹ is subtle but potentially relevant: in fact, collapse is the
result of a glass transition in the dried region formed during the primary drying,
while Tgʹ refers to a glass transition in the amorphous phase in contact with ice. The
collapse temperature depends both on the residual water content and on the nature
of the solute. It appears to be determined in large part by the molecular weight and
by the structural groups of the solute molecules. For example, as far as sugars are
concerned, sucrose solutions collapse at lower temperature than raffinose solutions
and glucose solutions collapse at even lower temperatures (MacKenzie, 1976).
The collapse causes loss of product neatness, which may vary from moderate
deformation and shrinkage to a complete melt and sticking on the vial walls and
5
bottom. In the extreme case, the vial may appear almost empty. In addition, collapse
can lead to an abnormally high residual moisture and to a prolonged reconstitution
time; moreover, the degradation of the resulting product can occur. To prevent the
occurrence of the collapse, the sublimation interface must be maintained below Tc
throughout the primary drying, thus resulting in a higher drying time. The excipients
added to the formulation can increase the collapse temperature of the formulations
showing a low collapse temperature, but, in some cases, they can make more difficult
the drying process because they may be responsible for the structural collapse of the
product: in these cases the product must be reformulated, by substituting the solutes
with others exhibiting higher values of Tc. Sadikoglu et al. (1998) studied the effect of
excipients on the primary drying stage during the freeze‐drying of skim milk: they
assumed that suitable excipients could be found to increase the collapse temperature
of skim milk when they were used in the solution of skim milk and showed, by
means of mathematical simulations, that if the melting temperature is increased of
2°C by adding some excipients, then the time required to complete the primary
drying stage is reduced by 8.28%, while if the increase of the melting temperature is
of 6°C, then this time is reduced by 19.54%.
Structural collapse may also occur during secondary drying, although this step
is less hazardous; in fact, as the water content of the amorphous phase decreases
during drying, the glass transition temperature increases very sharply.
It is clear that understanding the product response to freezing and drying is
essential for defining both the formulation of the organic product and the parameters
of the lyophilization cycle.
The product structure and, thus, the apparent density and rehydratability,
depend mainly on the freezing step. In fact, freezing determines the shape and the
dimension of the ice crystals that form the structure of the frozen product as it has
been recently observed and investigated (see, among the other, Kochs et al., 1991;
Searles et al., 2001; Nakagawa et al., 2006). The quality of the product must be
maintained at an acceptable level during drying, avoiding viscous flow of the dried
6
product and thus the phenomenon of collapse, and this must be accomplished by
controlling the product temperature during this step. In the case of pharmaceutical
products the requirement about the aspect can be very strict, causing their rejection
even in case of limited deterioration, notwithstanding the activity is not reduced, but
often microcollapse can be acceptable, and in certain cases (this happens especially
for vaccines) even collapsed product can be acceptable. In any case the residual
moisture, that depends both on the original structure and on the drying time, and
that can be strongly affected by structure modifications during drying, can affect
storage stability. For safety reasons, a temperature significantly lower than that at
which collapse can occur is generally set, both for difficulties in process control and
for the uncertainty on the product behavior around Tg’ (and it must be remembered
that also Tg’ and Tc may be known with an uncertainty of few degrees). Any
reduction of the drying temperature has as a consequence a significant increase of the
drying time and, thus, it is very important to find the temperature that optimize the
process considering both product quality and process time. The goal of our study is,
thus, to point out how the temperature at which the process is carried out affects
product characteristics (apparent density, residual moisture, and rehydratability) and
the drying rate (i.e. process duration). As the structure of the product is determined
in the freezing step, in this work we carried out all the tests using the came cooling
rate, as it will be discussed in the following, thus focusing on the product quality
caused by the working temperature. The influence of the composition of the product
composition is also discussed: we considered solutions containing 10% w/w of
sucrose, dextran and mannitol, as well as mixtures of sucrose and dextran, with 10%
w/w total concentration, and of mannitol and dextran, with 20% w/w total
concentration (selected in order to obtain a partly crystalline structure immersed into
an amorphous matrix). The behavior of mixtures in comparison to pure substances
has received up to now little attention in the literature. It can be remembered that the
behavior of low concentration sucrose and mannitol solutions and of a mixture of
sucrose and phenylalanine was investigated by Roth et al. (2001): they used a novel
7
microbalance (Christ) technique to monitor continuously the weight loss of a vial
standing on a shelf of a freeze‐dryer and evidenced different drying behavior for the
sucrose and sucrose/phenylalanine systems, which was attributed to the presence of
crystalline phenylalanine in the amorphous sucrose.
Materials and methods
Solutions of mannitol, sucrose (Riedel de Haën, highest analytical grade) and dextran
(Fluka‐BioChemika, highest analytical grade) and their mixtures in distilled water,
either 10% or 20% by weight total concentration, were investigated. Melting
temperature (Tm), glass transition temperature (Tgʹ), and complete solidification
temperature (Tcs) were measured by Differential Scanning Calorimetry (DSC), using a
Perkin‐Elmer DSC7 with a heating rate of 2 or 10°C/minute. True collapse
temperature, that requires the use of a cryomicroscope, was not measured and Tgʹ
was used as a reference for setting the maximum working temperature in the freeze‐
drying cycles. The details of the solutions considered and the correspondent
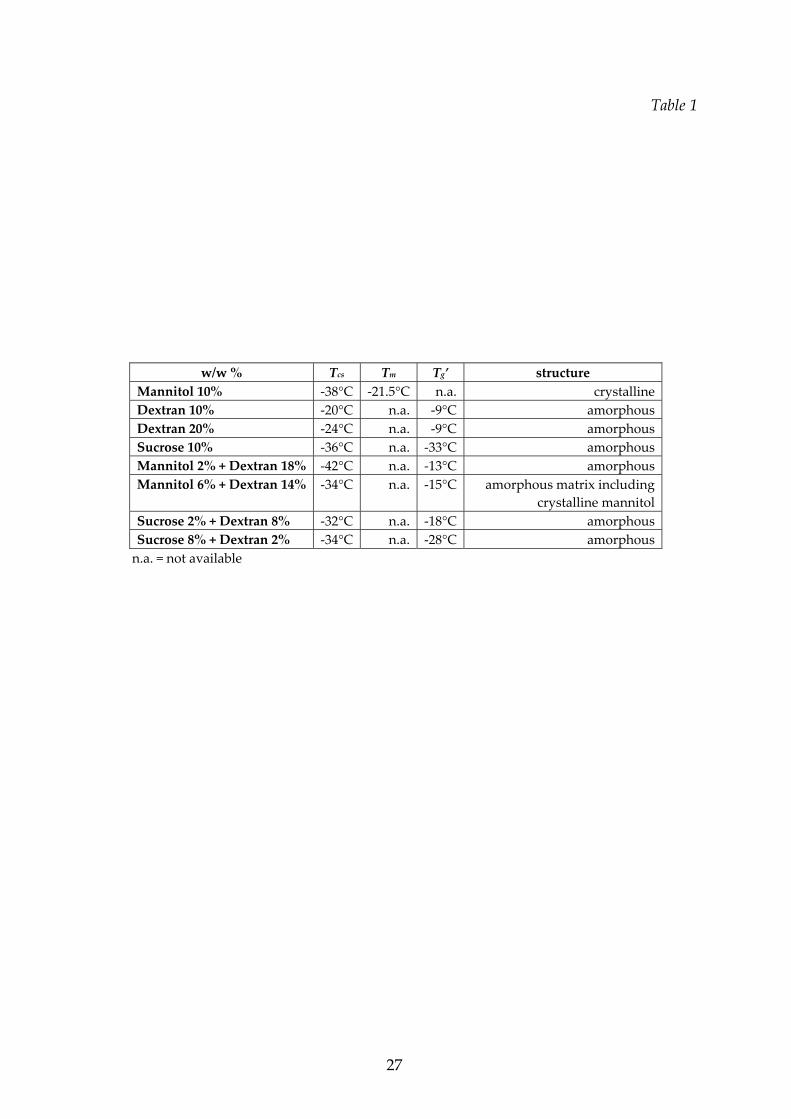
characteristic temperatures are given in Table 1.
Mannitol was investigated because, as a pure substance, it can be freeze‐dried
obtaining a crystalline product, with the only precaution to keep the temperature
below that of incipient melting. The behavior of mixtures of mannitol and dextran is
different: when the concentration of mannitol is low (below 6% w/w of mannitol in a
solution with a total solutes concentration of 20% w/w) Bamba et al. (1995) reported,
on the basis of DSC results, that a glass transition occurs during the heating cycle,
thus indicating that crystallization was inhibited: a stable glassy system can be
obtained up to this limit concentration during the initial freezing and, within this
range, the higher is the mannitol concentration, the lower is the glass transition
temperature. We have investigated the behavior of mixtures of mannitol and dextran
in a wider range of concentration: several aqueous solutions of mannitol‐dextran 10%
8
and 20% w/w total concentration have been prepared and freeze‐dried in vials at
‐30°C and at a total pressure of 10 Pa, after a freezing step using a freezing rate of
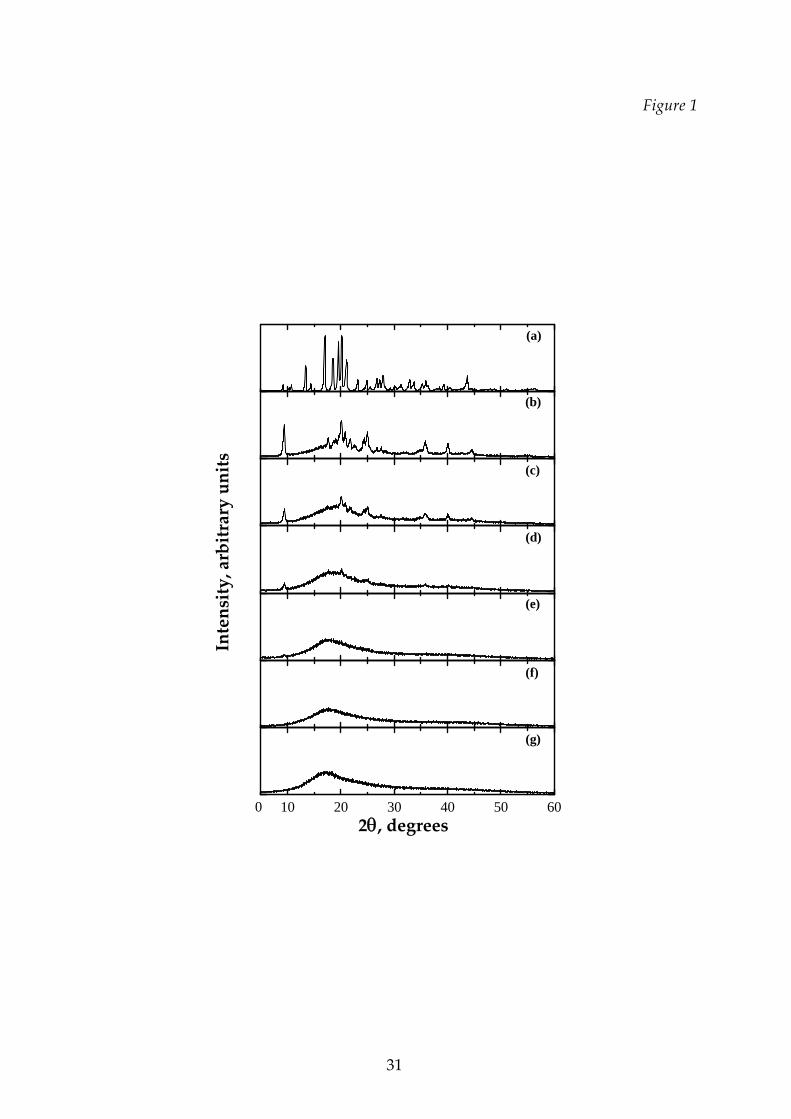
about 1°C/min. The freeze‐dried product has been analyzed by means of X‐Ray
Diffraction (XRD) in order to investigate how the structure of the solid matrix
changes as a function of mannitol fraction; the X‐ray powder diffraction patterns
were collected with a Philips PW1710 diffractometer using CuK radiation and a
graphite secondary monochromator. The different polymorphs were identified by
comparison with reference scans (Burger et al., 2000). The results obtained both at
20% (see Figure 1) and at 10% (not shown) total solute concentration indicate that the
threshold concentration above which crystalline mannitol is consistently detected in
a freeze‐dried solid where a non‐crystallizing sugar (dextran) is present is about 30%
w/w, in agreement with Kim et al. (1998); some of the obtained matrices are shown in
the followings, evidencing the presence of the crystalline structure in the amorphous
phase. It can be observed that the monoclinic δ‐mannitol is the prevailing phase
obtained in case of mixtures with dextran, accompanied by some orthorhombic
polymorph, while in the case of pure mannitol, in the tested conditions (and with no
annealing), a mixture of the two orthorhombic polymorphs, α‐mannitol, that is the
most abundant one, and β‐mannitol, is formed, with no evident traces of the
monoclinic one, in agreement with the results of Kim et al. (1998) and of Hottot et al.
(2008). This result may be a confirm of the cryoprotective effect of hydroxyl
compounds such as dextran: they prevent injurious freezing of biological systems by
trapping the crystallization agent, mannitol, into an highly viscous, or glass‐like,
phase.
Dextran and sucrose were selected because, as pure substances, give
amorphous products, but they have very different glass transition temperatures. The
aim of the experimental investigation is thus to point out the behavior of pure
substances and of binary mixtures of dextran with mannitol and sucrose.
In all the tests the solutions were freeze‐dried in vials (with an internal diameter
of 14∙10‐3 m), each containing 1 ml of product, in a Lyovac GT2 freeze‐drier
9
(Leybold). The freezing step was carried out in situ. Three cycles were generally
carried out for each formulation in order to investigate the influence of the drying
temperature on the freeze‐drying process and on the characteristics of the product. In
the first cycle (coded as Tl in the following paragraphs), after the freezing step, the
temperature set point was chosen in order to maintain always the product
temperature below Tgʹ. Another cycle (T3) was partially performed at a temperature
higher than the glass transition temperature (potentially causing microcollapse or
even collapse): in this case the cryostat set‐point was set at 25°C till the end of the
process. Finally, a cycle (T2) was performed at an intermediate temperature, close to
the glass transition temperature, but slightly lower than that: this should avoid
collapse, even if localized microcollapses are possible if the glass transition
temperature is locally trespassed. The cryostat‐set points for the cycles at Tl and T2
were different for every formulation, depending on the characteristic temperatures,
and were set taking into account the dynamics of the apparatus and the heat transfer
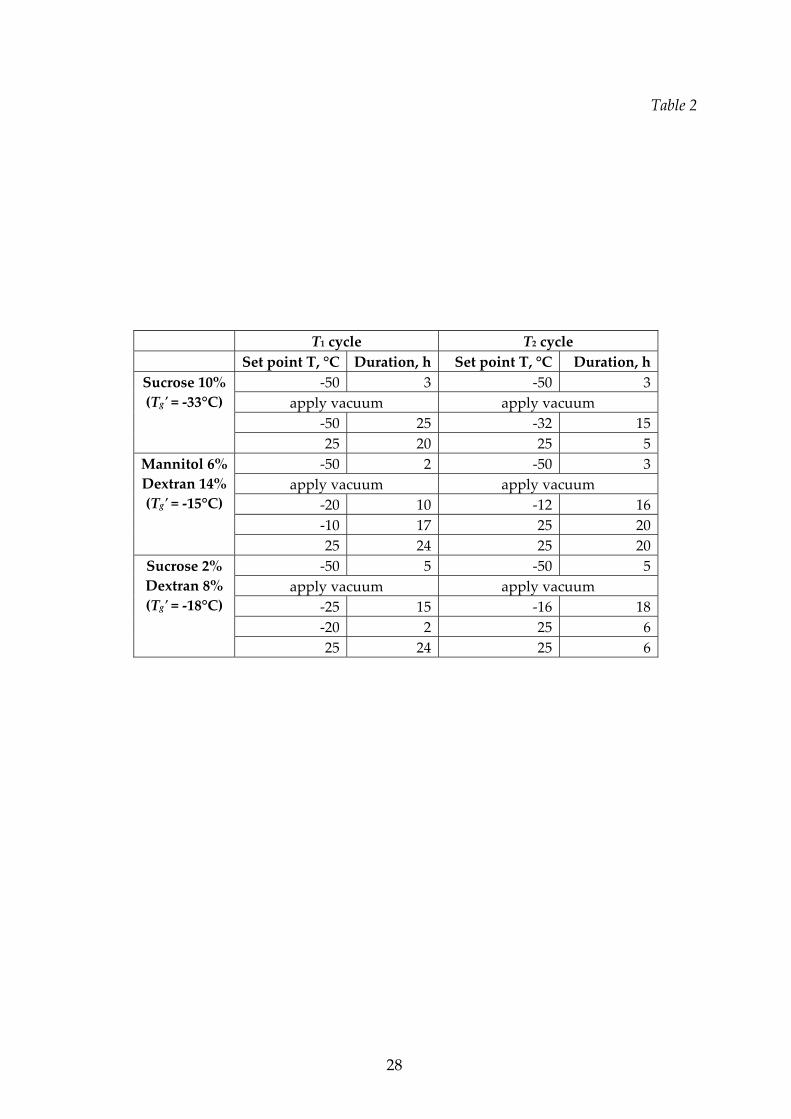
coefficient, on the basis of preliminary runs. Some examples are given in Table 2. In
all cases, at the beginning of the operation the cryostat was set at a low temperature
(‐50°C), thus obtaining a product cooling rate of about 0.5°C/min from 25°C to ‐30°C,
and of about 0.1°C/min from ‐30°C to ‐40°C: good reproducibility of these values in
all the experiments was observed. After the freezing step, the temperature of the
plate was increased. When the collapse temperature was very low, as for the 10%
sucrose solution or for the 8% sucrose ‐ 2% dextran mixture, the whole cycle was
carried out at the lowest possible temperature (setting the temperature of ‐50°C) in
order to be sure to avoid collapse. In some cases, e.g. for the mixture 6% mannitol ‐
14% dextran shown in Table 2, the cryostat set‐point was set higher than Tg’ in order
to speed up the heating, and thus the drying, of the product (the temperature
increase was slow due to the presence of the capacitive balance): in any case the
product temperature never overcame the Tg’.
In all the runs secondary drying was carried out rising the set point
temperature at 25°C (see Table 3 and 4 for the duration of the primary and of the
10
secondary drying stages).
A capacitive balance was used to monitor the variation of the weight of the
samples during the cycle (Carullo et al., 1998; Rovero et al., 2001); the presence of the
balance affects the heat transfer from the shelf to the vials, but this effect is the same
for all the runs and has been taken into account in the selection of the set‐point
temperatures. The balance yields the cumulative water loss as well as the drying rate
vs. time; this allows to detect the endpoint of primary drying: in fact it is possible to
calculate the total value of the sublimated mass and, thus, to detect the time instant
when almost all the water of the frozen product has sublimated and the sublimation
flux is almost constant (at a value of about zero). The use of weighing devices for
monitoring the primary drying has been recently discussed by Barresi et al. (2009).
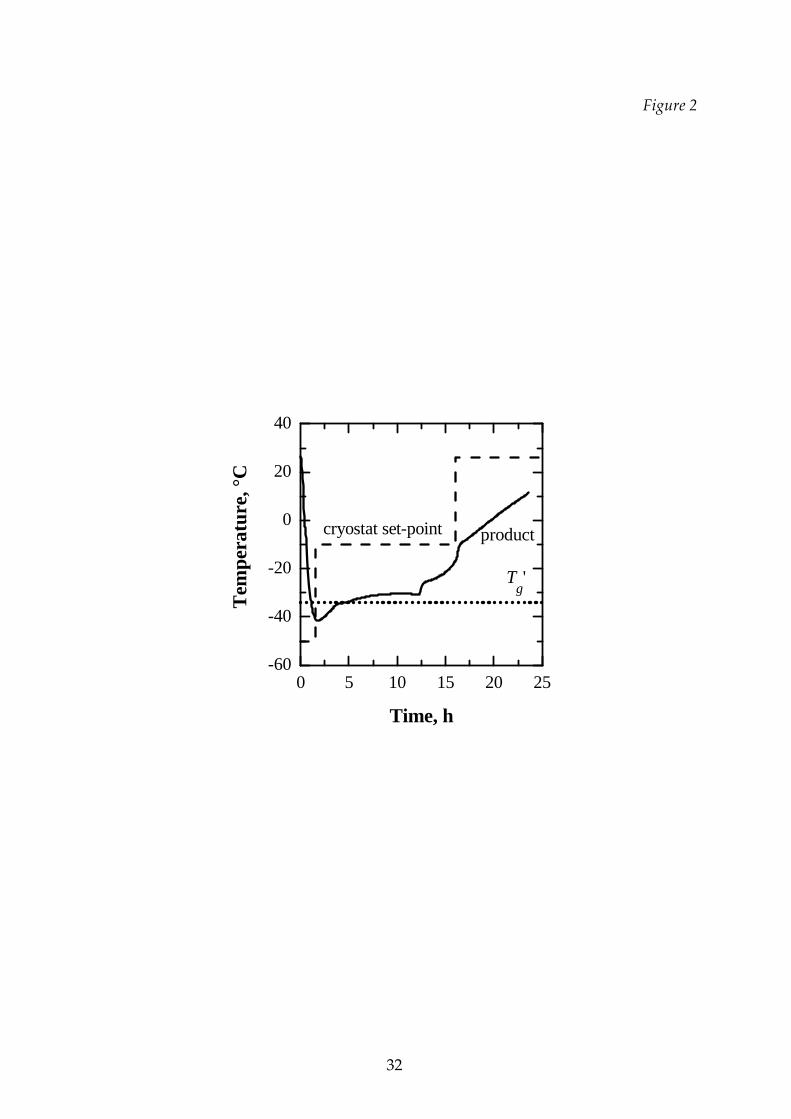
A typical plot of the time evolution of the temperature of the product is shown
in Figure 2. The product was frozen at a temperature lower than its complete
solidification temperature and then the temperature was increased to the value
required for the primary and, then, for the secondary drying. Product temperature is
measured by a thermocouple in close contact with the bottom of the vial and it can be
noted that it rose much less and more slowly than the plate temperature as a
consequence of the presence of the capacitive balance.
The characterization of the freeze‐dried product was carried out by evaluating
the apparent density (by weighing the dried product and estimating the volume with
the caliper), the residual moisture (by weighing the sample before and after the
process) and the crystallinity (by XRD). The aspect of the product (including the
presence of cracking, vitrification, etc.) was also considered and special attention was
paid to shrinkage. The rehydratability is one of the most important properties in
pharmaceutical applications, but the small quantity of product available and its high
solubility ruled out the use of standard methods (McMinn and Magee, 1997). In fact,
the dissolution of the product was very fast if water was added and the vial shaken.
In order to allow for quantitative comparison between the products freeze‐fried in
different conditions, a procedure that allows to slow down the operation was
11
developed. The freeze‐dried product was firstly drawn from the vial (by sectioning
it) and then the product cake was divided into four pieces and weighed; this allowed
to carry out four measurements (each one after a different rehydration time) on each
sample. The exact amount of water required for the rehydratation was added, taking
note of the beginning and of the ending time. Then, at a prefixed time, the liquid
concentration was measured, drawing all the liquid in presence of the solid with a
syringe supporting a 0.02 ppm filter in order to suck the solid. Then the liquid was
shaken and analyzed for concentration. Other procedures were tested, but the one
described was used because it gave the best and more reproducible results. The
possibility of sampling a fraction of the solution was also investigated, but the results
come out to be function of the sampling position and they were quite erratic as the
characteristic diffusion time was longer than the dissolution time, thus resulting in
high concentration gradients in the solution. The concentration was measured by the
Refraction Index (RI), using a refractor‐meter; all the measurements were carried out
at 25°C. Calibration plots were drawn for each component using solutions at various
and known concentrations (4, 6, 8 and 10 % by weight). A linear relationship
resulted, being the correlation for the three substances very similar because of the
close molecular weights. For the binary solutions it was not possible to relate the RI
to the concentration of each component; in this case the refractive index A(t) of the
solution was made dimensionless using the final RI of the solution (once the solid
was completely dissolved). This index was a good indication of the total
concentration vs. time, although it did not provide information on the dissolution
rate of the individual components.
Results and discussion
As it was stated in the Introduction, the occurrence of collapse phenomena depends
on the temperature at which the process is carried out. The effect of the drying
12
temperature on the freeze‐dried product characteristics will be thus discussed in this
paragraph for aqueous solutions containing both single components and mixtures of
two components. Moreover, the effect of the working temperature on the process
duration and on the rate of solvent removal will be investigated.
Effect of the drying temperature on the product appearance.
The products freeze‐dried at the lowest temperature (cycle Tl), showed a very porous
structure; they did not stick to the vial and no shrinkage occurred.
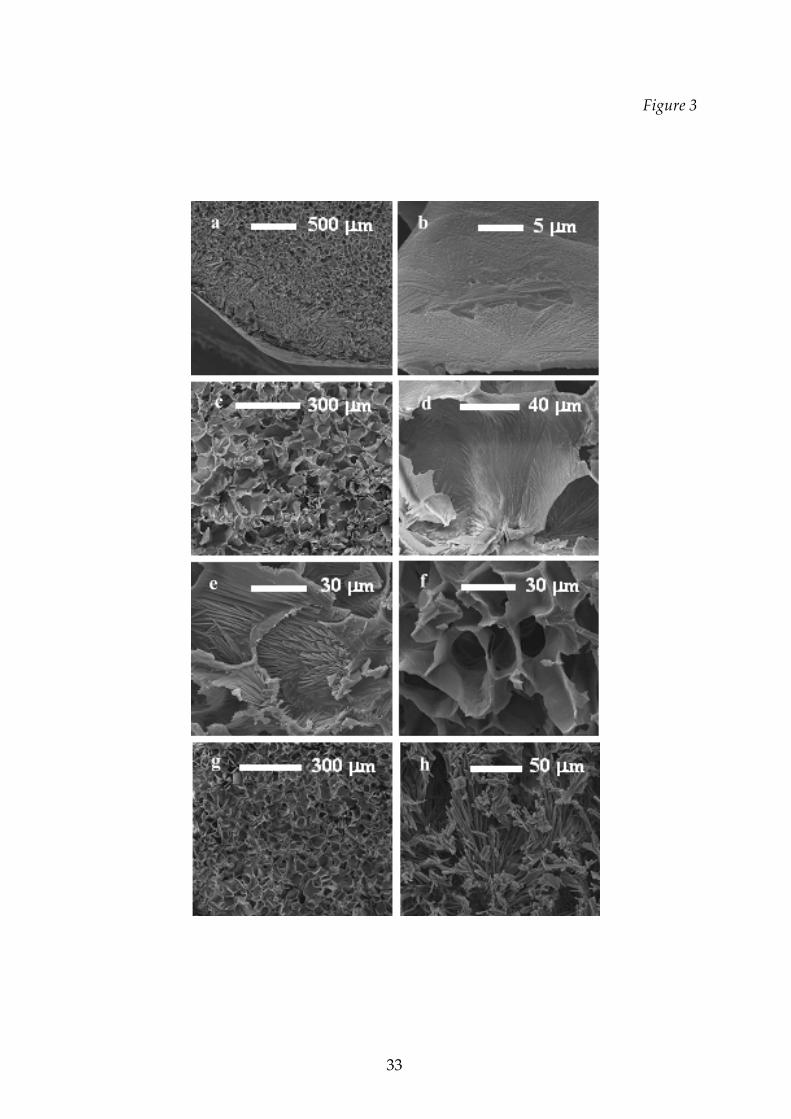
A vitreous layer appeared on the product surface when the collapse
temperature was approached during the cycles carried out at higher temperature (see
an example in Figure 3a): this film can be explained by a partial collapse of the
structure. A typical collapsed structure was generally macroscopically evident in the
product from the runs carried out according to the T3 cycle; some of these samples,
observed at the scanning electron microscope, also showed a particular structure, as
shown for example in Figure 3b.
Some examples of the typical structures observed for the different mixtures in
runs carried out at a safe temperature are also shown in Figure 3: images d), e) and f)
show the detail of the typical crystalline structure of mannitol embedded in the
amorphous phase, for different relative concentrations of the two species, compared
with that of the pure crystalline mannitol (h), while images c) and g) show, at a larger
scale, the pore structure obtained with two different mixtures (completely
amorphous and with crystals in the amorphous matrix).
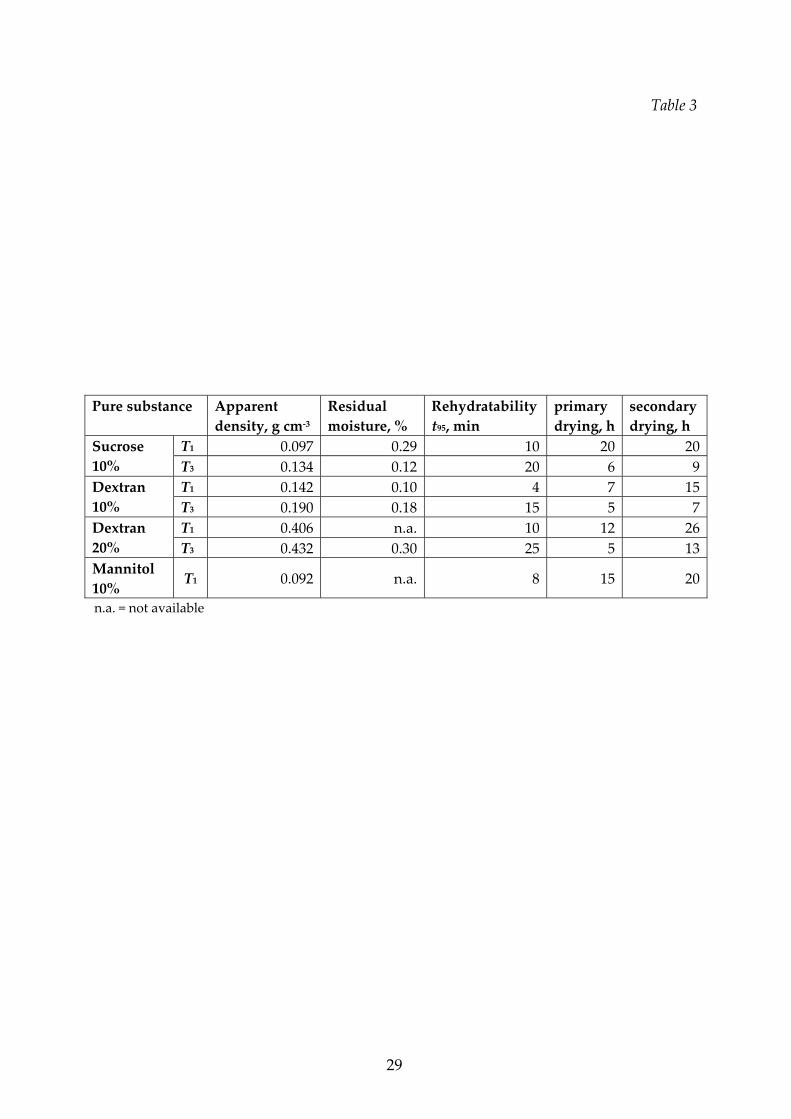
Final characteristics of pure substances.
It was specified that mannitol gives a crystalline structure, while dextran and sucrose
form a stable glassy system which remains amorphous. After freeze‐drying, the
apparent density of the pure substances can vary significantly with the process
temperature as reported in Table 3; this is a consequence of significant shrinkage that
occurs at the highest temperatures as a consequence of product collapse.
13
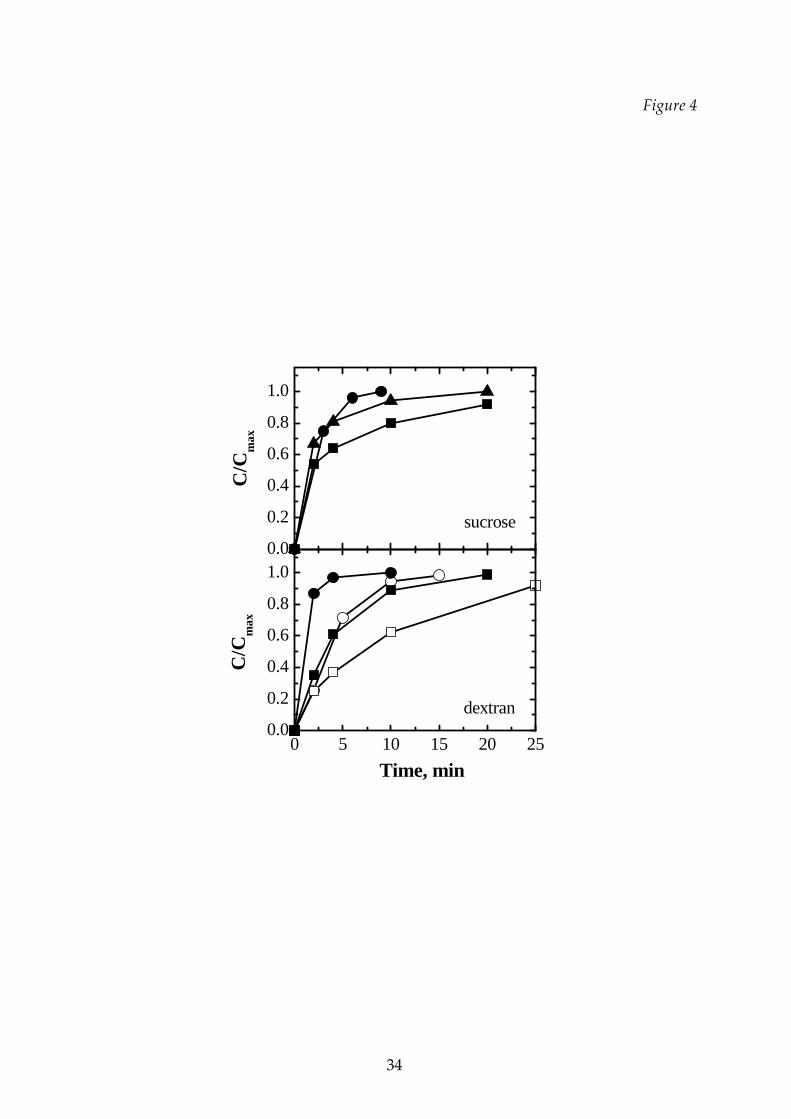
The rehydratability of all the samples, independently of the cycle type actuated,
was always very prompt when the solution was stirred or shacked. Due to the
methodology adopted and previously described, which aimed to evidence
differences between the products, high dissolution time are measured. Figure 4
shows that the rehydratability is faster for the product freeze‐dried at lower
temperature (T1), when the structure resulted to be more porous and softer; higher
rehydration rates were also observed for samples obtained from lower initial
concentration (resulting in a higher porosity and, thus, in a lower apparent density).
For example, in the case of sucrose, at the Tl conditions a complete dissolution was
obtained in about 15 minutes, while the T2 condition originated a product that
required about 20 minutes to be completely dissolved; the T3 conditions gave origin
to a product not completely dissolved in the time interval used for the analysis.
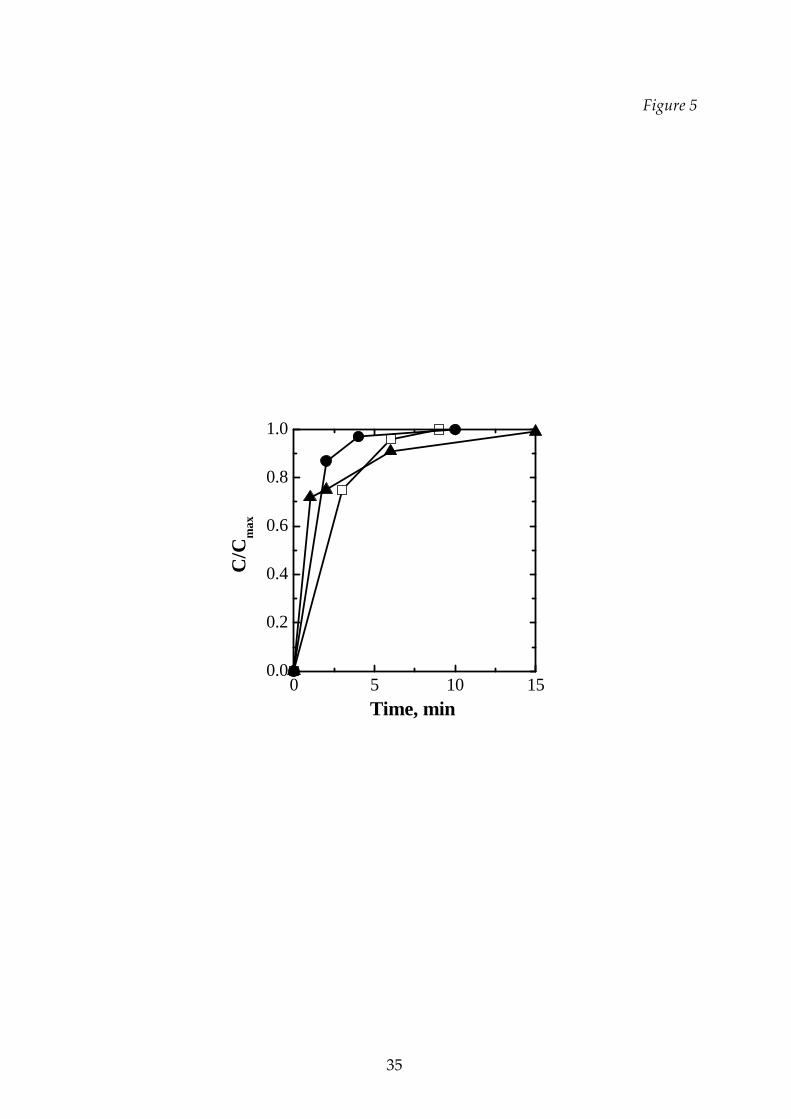
In Figure 5 a comparison of the behavior of different substances is presented.
Even though the differences are rather small, it can be noted that the mannitol
(crystalline structure) dissolved very quickly at the beginning: this is a consequence
of its structure (see Figure 3h), with high surface and fine crystals which accelerate
initial dissolution. On the contrary, an initial more difficult dissolution for sucrose
and dextran is compensated by the bound weakness typical of an amorphous
structure. If the cycle is carried out at higher temperature (T3 cycle, not shown in the
Figure) the dissolution is slower, due to the presence of a collapsed structure.
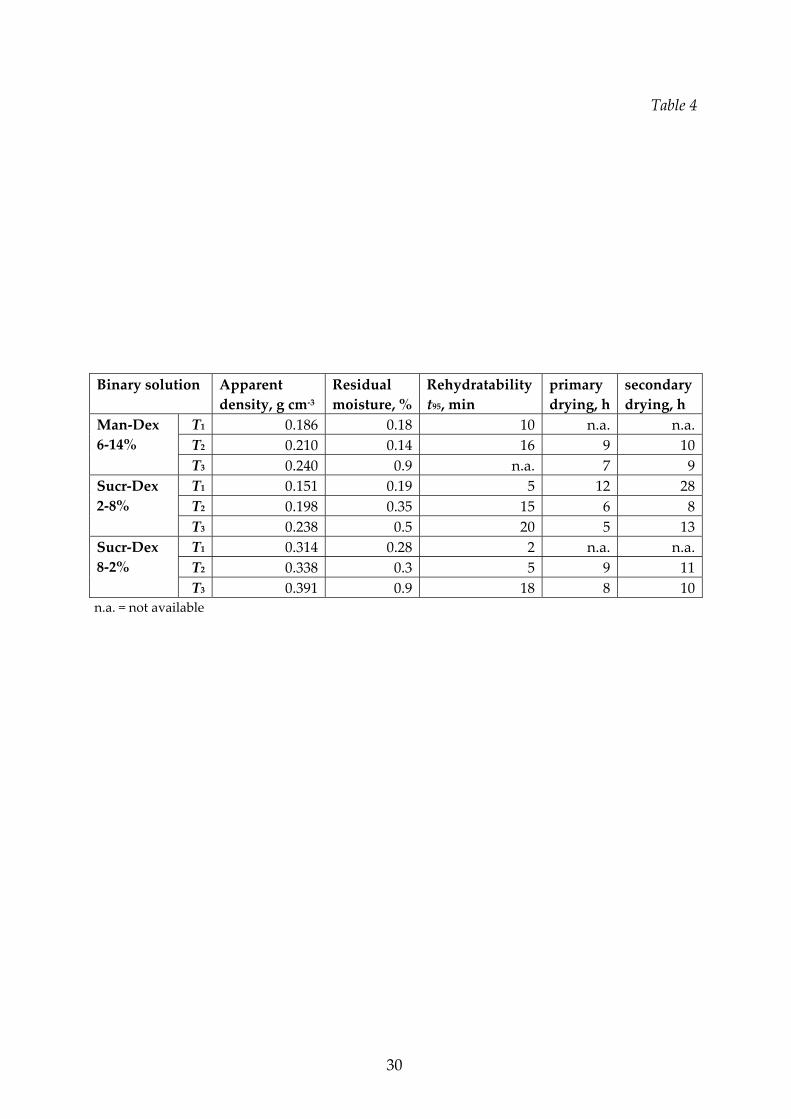
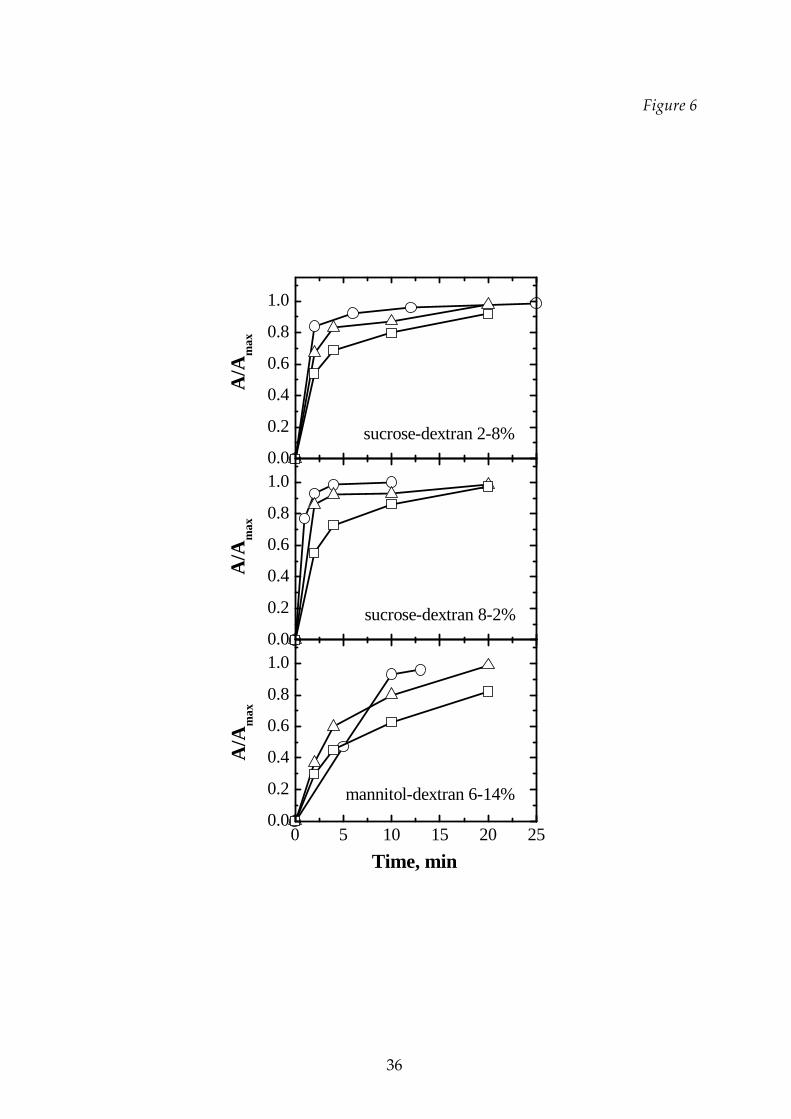
Final characteristics of binary mixtures.
Two different types of mixtures were investigated, namely mannitol‐dextran and
sucrose‐dextran, at different concentrations. In Figure 6 the rehydration curves for
the binary mixtures of sucrose‐dextran and of mannitol‐dextran, freeze‐dried with
the three different cycles previously described, are shown. Generally, the
rehydratability gets worse when higher drying temperatures are used, while the
relative composition has a smaller effect. In the T3 cycle the structure was collapsed:
the apparent density increased and the residual moisture was higher, as reported in
14
Table 4.
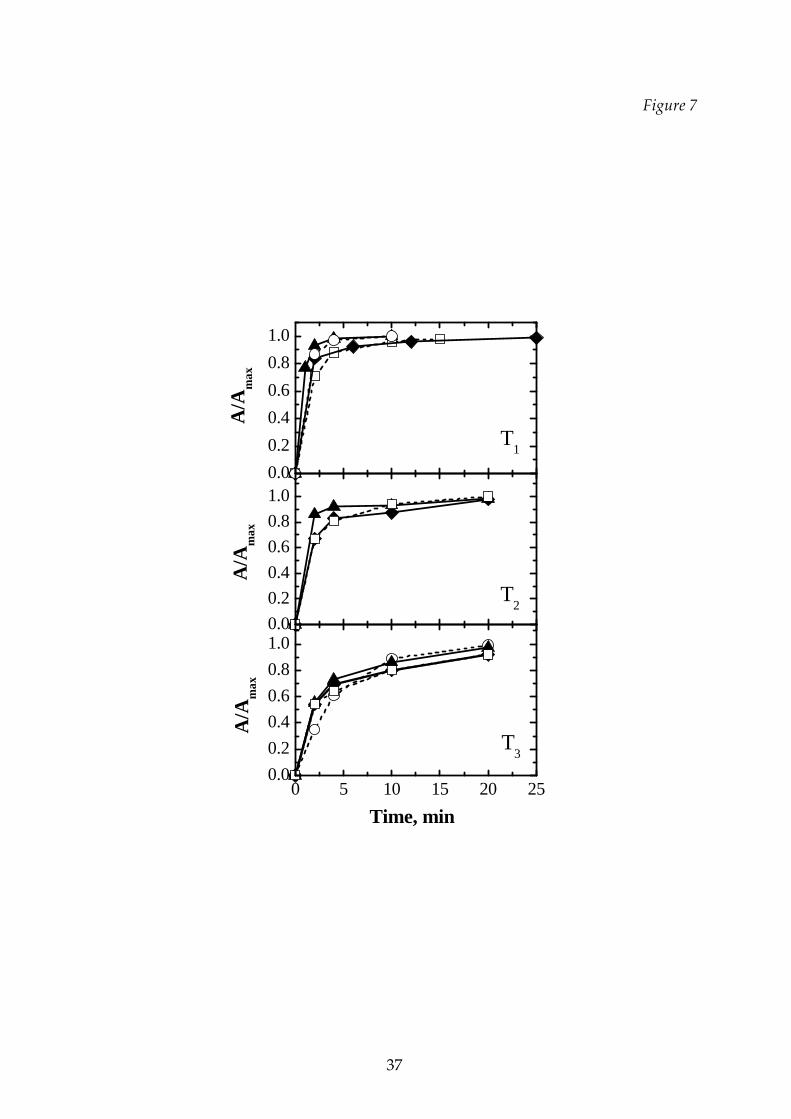
In Figure 7 the effect of the relative concentration of the excipients on the
rehydratability is shown for the sucrose‐dextran mixtures processed with the various
cycles. In some cases the mixture dissolves at a higher rate than the respective
components. This behavior can be explained by considering that a solid constituted
of two amorphous constituents can have more weak bounds than a solid constituted
by the same species: it is, thus, easier to dissolve a mixture of two components than a
pure substance.
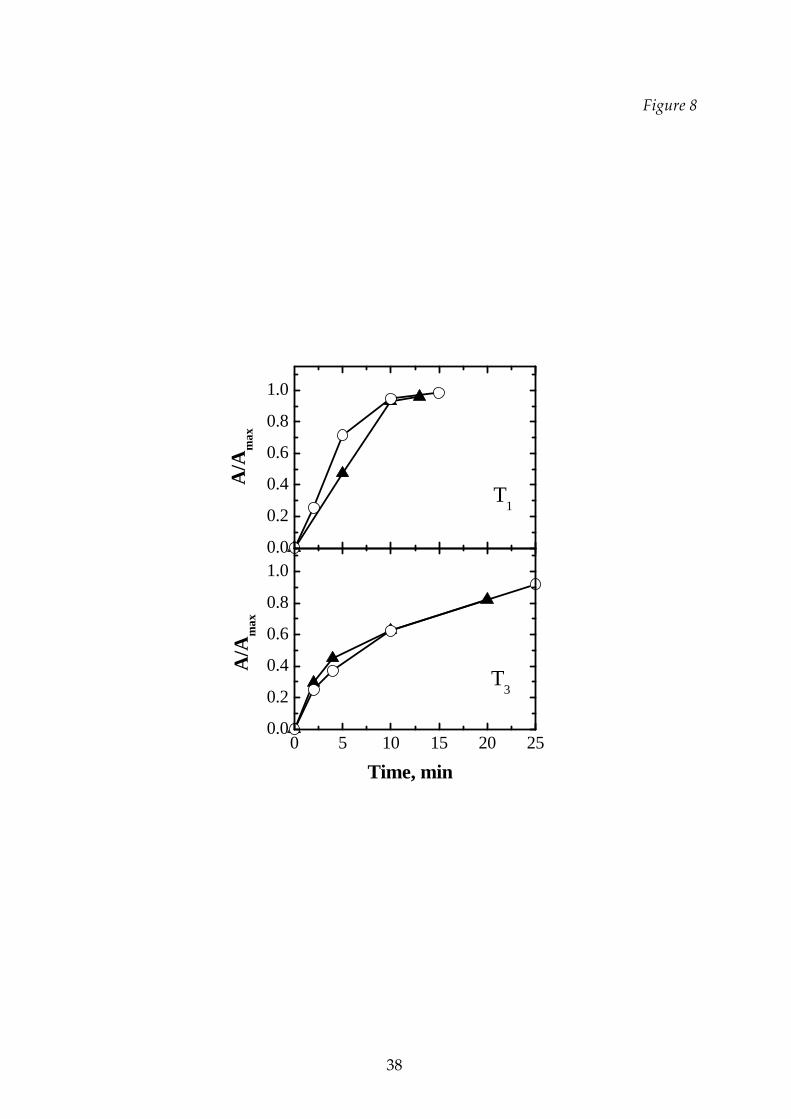
In the case of the mannitol‐dextran mixtures a different behavior is observed for
the samples freeze‐dried at Tl and at T3, as it is shown in Figure 8. At Tl the dextran
has a higher rehydratability than the mixture, while in the case of the cycle T3 the
curves of the mixture and of the dextran are very close (it can be remembered, to this
purpose, what observed before about different rehydration rate of amorphous and
crystalline substances).
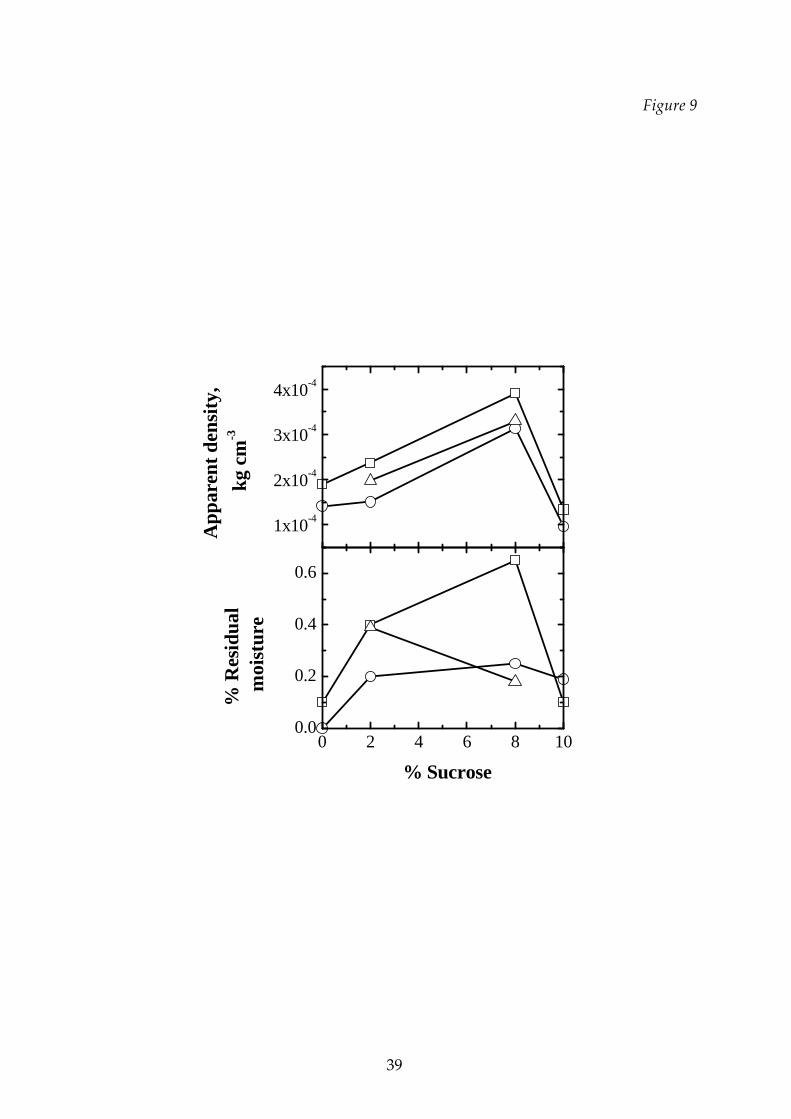
In Figures 9 the effect of the temperature on the apparent density and on the
residual moisture of sucrose‐dextran mixtures at different concentration is shown.
Other data are shown in Tables 3 and 4, together with the duration set for the
secondary drying stage. As concerns the residual moisture, this parameter was not
investigated in detail, but even if the final values are also affected by the total
duration of the cycle, it can be observed that for the conditions investigated the
cycles carried out at higher temperature, i.e. the T3 cycles, where collapse occurred,
have generally higher residual moisture in the product, as it can be expected when
collapse of the dried cake occurs. For both quantities the effect of the temperature is
small, but the properties of the dried product depend on the sucrose fraction in the
mixture in a non‐monotone way.
Effect of the drying temperature on the process duration and drying rates.
The freeze‐drying process is expensive, thus the drying kinetics is very important as
it affects the duration of the process. In general, we have seen that a higher drying

15
temperature means a worse freeze‐dried product, with lower rehydratability and
possibly a bad appearance, but these negative effects are partly compensated by a
shorter process. The occurrence of collapse can be responsible of a strong reduction
of the sublimation flow rate, due to the higher resistance of the collapsed cake; in
some cases microcollapse can occur, resulting in an increase of the sublimation flow
rate. This mechanism was described by Milton et al. (1997) and by Overcashier et al.
(1999): when product starts to collapse, holes appear in the structure of the dried
material, apparently as thin spots, as the surface tension forces become active when
the viscosity of the dried material decreases. If the temperature is further increased
gross collapse of the dried structure occurs, with clearly observable cake shrinkage.
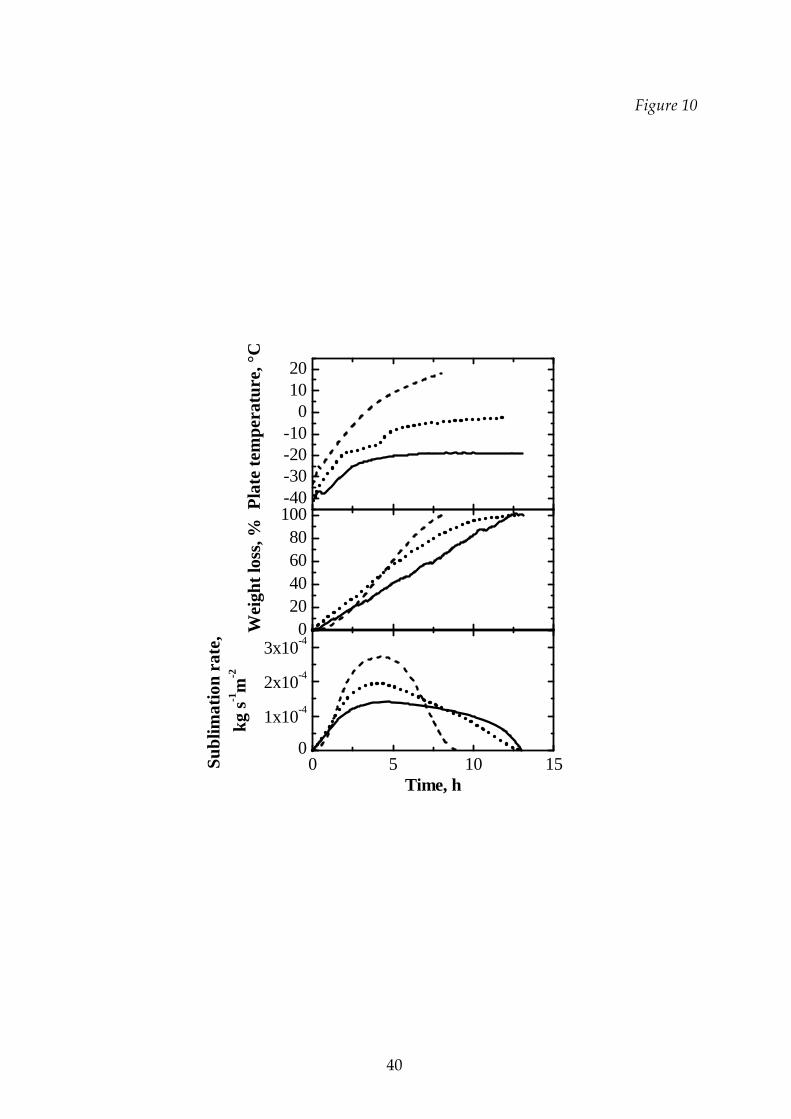
In Figure 10 examples of the weight loss measured by the capacitive balance as
a function of the process time are shown with the values of sublimation rate that can
be calculated from these data. Obviously, the freeze‐drying process is shorter at
higher temperature both for pure substances and for binary solutions; here we
focuses on the primary drying duration (determined by means of the balance) at
different temperatures. Some data are compared in Tables 3 and 4: the higher the
temperature, the lower the time required to complete the drying and, thus, it is of
outmost importance to carry out the cycle at a temperature just below the limit value
to avoid the collapse of the product.
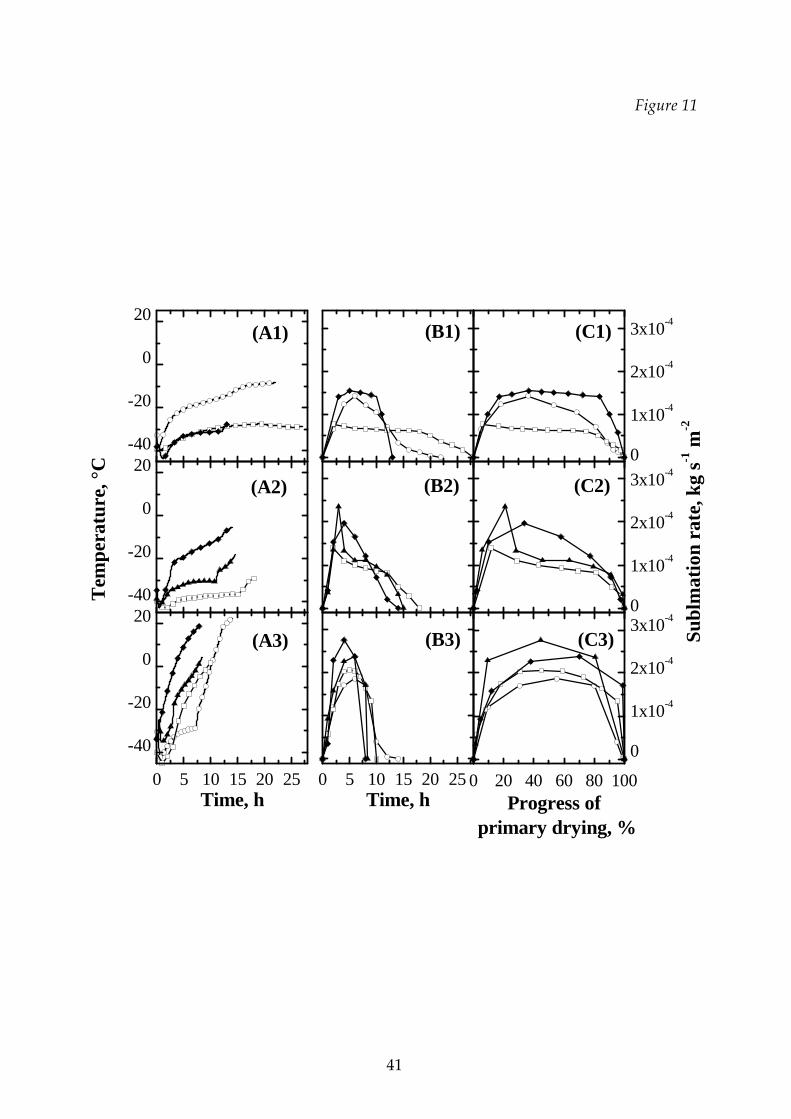
Figure 11 compares the sublimation rates of sucrose‐dextran binary mixtures
and those of the constituents during primary drying for different thermal cycles; the
product temperature measured by a thermocouple in close contact with the bottom
of the vial in the various runs is also shown in the left column. As it can be expected,
the higher is the working temperature the higher is the sublimation rate, thus
decreasing the time required to complete the primary drying. The time evolution of
the sublimation rate as a function of the progress of primary drying, given by the
ratio between the sublimated water and the initial total water content, is also shown
in the l.h.s.: in all the T1 cycles the sublimation rate vs. the progress of the primary
drying is almost constant (or it does not exhibit sharp changes) through all this step;
16
for certain solutions the value of the sublimation rate is higher due to the higher shelf
temperature (compare the left graphs). It can be seen that the freeze‐drying of
mixtures can be easier and faster than that of one of the components alone; this is
partly a consequence of the higher temperatures allowed, but it is evident that even
with the same process temperature the drying kinetics can be higher. At higher
temperature, where collapse can occur during drying, the sublimation rate increases
sharply in the first part of the cycle (due to the high shelf temperature) and then,
when the system approaches the end of the drying, the sublimation rate falls to zero.
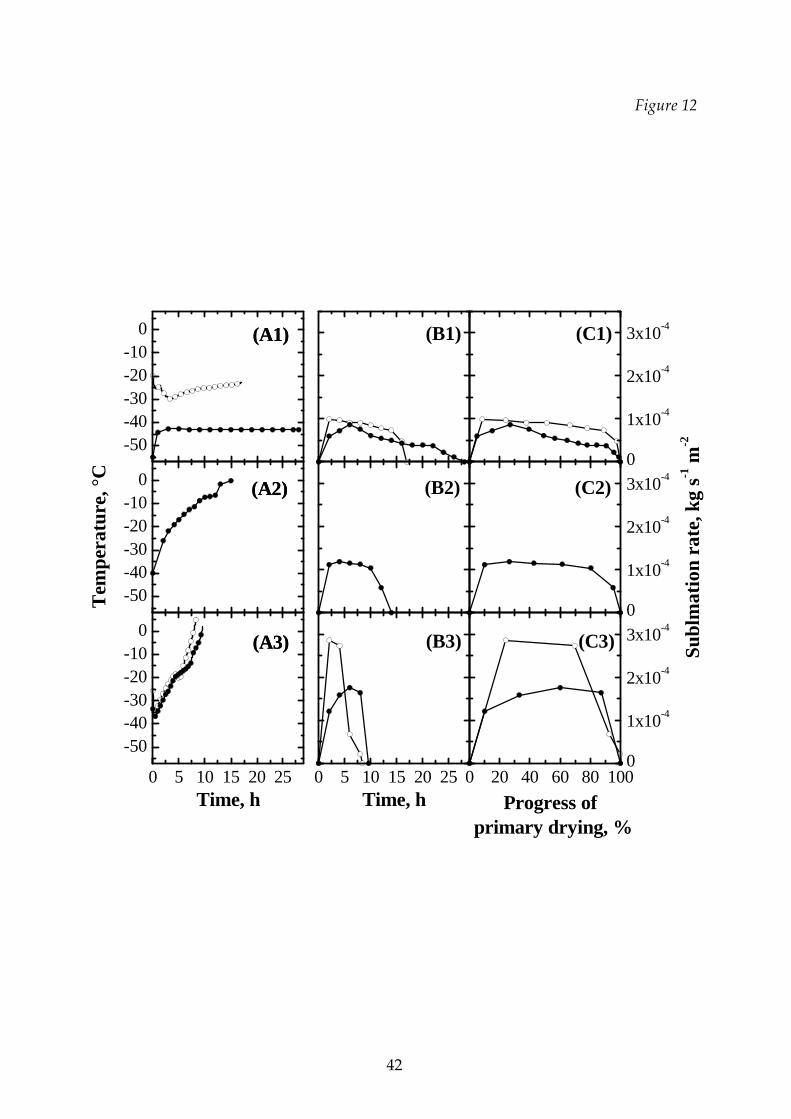
A similar behavior is observed in Figure 12 for the sublimation rate of dextran and a
mannitol‐dextran mixture (at the same concentration) for different thermal cycles.
Conclusions
The influence of the temperature at which the primary drying is carried out on the
process duration and on the product characteristics has been investigated in this
work, as well as the role played by the composition of the solution. Apparent
density, product rehydratability and residual moisture are the properties evaluated
in order to characterize the product obtained, both in the case of one solute and in the
case of binary mixtures of solutes. Results show that primary drying should be
carried out at lower temperature in order to get faster rehydratability and to avoid
collapse of the product; nevertheless, in order to reduce the duration of the process it
is required to work at higher temperature, near to the maximum allowable value. In
case of mixtures (of sucrose and dextran and of mannitol and dextran) the freeze‐
drying results to be easier and faster than that of one of the components alone: this is
a result of the higher temperatures allowed in case of mixtures, but even with the
same process temperature the drying kinetics can be higher. In any case it has been
shown that the reduction of the porosity and rehydration rate is very limited even
when the drying has been carried out at the glass transition temperature or for some
17
time just above it.
Optimal results, in terms of process duration and product quality, can thus be
achieved when the primary drying is carried out as closer as possible to the
maximum temperature allowed by the product: this requires a reliable system to
monitor product temperature and a control system that maintains the product at the
desired temperature. This is also one of the targets of the Guidance for Industry PAT
(Process Analytical Technology) issued by US Food and Drugs Administration in
2004: in fact, it encourages manufacturers to use the latest scientific advances in
pharmaceutical manufacturing and technology so that quality is no longer tested into
products, but is built‐in or is by design.
Acknowledgements.
The contribution of Mauro Raimondo for the SEM photography and of Dario Celi
and of Prof. Giorgio Rovero (Politecnico di Torino) for the experimental runs is
gratefully acknowledged.
18
Notation
A refractive index
C concentration
t95 time for 95% of final concentration in reconstitution test, min
T temperature, °C
Tc collapse temperature, °C
Tcs complete solidification temperature, °C
Tgʹ glass transition temperature, °C
Tm melting temperature, °C
T1, T2, T3 identifier of the set‐point for primary drying temperature
Subscripts and superscripts
max maximum value, corresponding to complete dissolution
Abbreviations
DSC Differential Scanning Calorimetry
XRD X‐Ray Diffraction
19
References
Bamba, J., Tchoreloff, P., Cave, G., Puisieux, F., Courraze, G. (1995). DSC study of the
phase behaviour of aqueous dextran‐mannitol system during freezing step of
freeze‐drying process. Proceedings 1st World Meeting APGI/APV, Budapest, 9‐
11 May, 76‐77.
Barresi A. A., Pisano, R., Fissore, D. Rasetto, V., Velardi, S. A., Vallan, A., Parvis, M.,
Galan, M. (2009). Monitoring of the primary drying of a lyophilization process
in vials. Chemical Engineering & Processing, 48, 408‐423.
Blanshard, J. V. M. (1995). The glass transition, its nature and significance in food
processing. In: Physico‐chemical aspects of food processing (S.T. Beckett ed.).
London: Blakie Academic & Professional, 17‐48.
Boss, E. A., Filho, R. M., Vasco de Toledo, E. C. (2004). Freeze drying process: real
time model and optimization. Chemical Engineering and Processing, 43, 1475‐
1485.
Burger, A., Henck, J.‐O., Hetz, S., Rollinger, J. M., Weissnicht, A. A. Stöttner, H.
(2000). Energy/temperature diagram and compression behavior of the
polymorphs of D‐Mannitol. Journal of Pharmaceutical Sciences, 89, 457‐468.
Carullo, A., Parvis, M., Vallan, A. (1998). An analytical balance for lyophilisation
systems. Proceedings of the Instrumentation and Measurement Technology
Conference (IEEE), vol. 1, 243–248.
Franks, F. (2007). Freeze‐drying of pharmaceuticals and biopharmaceuticals. Royal
Society of Chemistry, Cambridge.
Gan, K. H., Bruttini, R., Crosser, O. K., Liapis, A. I. (2004). Heating policies during the
primary and secondary drying stages of the lyophilization process in vials:
Effects of the arrangement of vials in clusters of square and hexagonal arrays on
trays. Drying Technology, 22, 1539‐1575.
Gan, K. H., Crosser, O. K., Liapis, A. I., Bruttini, R. (2005). Lyophilization in vials on
trays: Effects of tray side. Drying Technology, 23, 341‐363.
20
Hottot, A., Andrieu, J., Vessot, S. (2007). Sublimation kinetics during freeze‐drying of
pharmaceutical protein formulation. Drying Technology, 35, 753‐758.
Hottot, A., Nakagawa, K., Andrieu, J. (2008). Effect of ultrasound‐controlled
nucleation on structural and morphological properties of freeze‐dried mannitol
solutions. Chemical Engineering Research and Design, 86, 193‐200.
Kim, A. I., Akers, M. J., Nail, S. L. (1998). The physical state of mannitol after freeze‐
drying: effect of mannitol concentration, freezing rate, and noncrystallizing
cosolute. Journal of Pharmaceutical Sciences, 87, 931‐935.
Kochs, M., Korber, C. H., Heschel, I., Nunner, B. (1991). The influence of the freezing
process on vapour transport during sublimation in vacuum freeze‐ drying.
International Journal of Heat and Mass Transfer, 34, 2395–2408.
Liapis, A. I., Bruttini, R. (1995). Freeze‐drying of pharmaceutical crystalline and
amorphous solutes in vials: Dynamic multi‐dimensional models of the primary
and secondary drying stages and qualitative features of the moving interface.
Drying Technology, 13, 43–72.
Liapis, A. I., Pikal, M. J., Bruttini, R. (1996). Research and development needs and
opportunities in freeze drying. Drying Technology, 14, 1265–1300.
Lombraña, J. I., De Elvira, C., Villaran, M. C., Izcara, J. (1993a). Simulation and design
of heating profiles in heat controlled freeze‐drying of pharmaceuticals in vials
by the application of a sublimation semispherical model. Drying Technology,
11, 471‐487.
Lombraña, J. I., De Elvira, C., Villaran, M. C. (1993b). Simulation and design of
heating profiles in heat controlled freeze‐drying of pharmaceuticals in vials by
the application of a sublimation cylindrical model. Drying Technology, 11, 85‐
102.
MacKenzie, A. P. (1976). The physico‐chemical basis for the freeze‐drying process.
Development of Biological Standards. International Symposium on Freeze‐
Drying of Biological Products, Washington, D.C., vol. 36.
McMinn, W. A. M., Magee, T. R. A. (1997). Physical characteristics of dehydrated
21
potatoes. Journal of Food Engineering, 33, 37‐48.
Milton, N., Pikal, M. J., Roy, M. L., Nail, S. L. (1997). Evaluation of manometric
temperature measurement as a method of monitoring product temperature
during lyophilization. PDA Journal of Pharmaceutical Science and Technology,
51, 7‐16.
Nakagawa, K., Hottot, A., Vessot, S., Andrieu, J. (2006). Influence of controlled
nucleation by ultrasounds on ice morphology of frozen formulations for
pharmaceutical protein freeze‐drying. Chemical Engineering Processing, 45,
783–791.
Overcashier, D. E., Patapoff, T. W., Hsu, C. H. (1999). Lyophilization of protein
formulations in vials: investigation of the relationship between resistance to
vapor flow during primary drying and small‐scale product collapse. Journal of
Pharmaceutical Science, 88, 688‐695.
Pikal‐Cleland, K. A., Rodrıguez‐Hornedo, N., Amidon, G. L., Carpenter, J. F. (2000).
Protein denaturation during freezing and thawing in phosphate buffer systems:
Monomeric and tetrameric b‐galactosidase. Archives of Biochemistry and
Biophysics, 384(2), 398–406.
Rene, F., Wolff, E., Rodolphe, F. (1993). Vacuum freeze‐drying of a liquid in a vial:
determination of heat and mass‐transfer coefficients and optimisation of
operating pressure. Chemical Engineering and Processing, 32, 245‐251.
Roth, C., Winter, G., Lee, G. W. J. (2001). Continuous measurement of drying rate of
crystalline and amorphous systems during freeze‐drying using an in situ
microbalance technique. Journal of Pharmaceutical Science, 90, 1345‐1355.
Rovero, G., Ghio, S., Barresi, A. A. (2001). Development of a prototype capacitive
balance for freeze‐drying studies. Chemical Engineering Science, 56, 3575‐3584.
Sadikoglu, H., Liapis, A. I. (1997). Mathematical modelling of the primary and
secondary drying stages of bulk solution freeze drying in trays: Parameter
estimation and model discrimination by comparison of theoretical results with
experimental data. Drying Technology, 15, 791–810.
22
Sadikoglu, H., Liapis, A. I., Crosser, O. K. (1998). Optimal control of the primary and
secondary drying stage of bulk solution freeze drying in trays. Drying
Technology, 16, 399–431.
Sadikoglu, H., Ozdemir, M., Seker, M. (2006). Freeze‐drying of pharmaceutical
products: Research and development needs. Drying Technology, 24, 849‐861.
Searles, J. A., Carpenter, J. F., Randolph, T. (2001). The ice nucleation temperature
determines the primary drying rate of lyophilization for samples frozen on a
temperature‐controlled shelf. Journal of Pharmaceutical Science, 90, 860–871.
Tang, X., Pikal, M. J. (2004). Design of freeze‐drying processes for pharmaceuticals:
Practical advice. Pharmaceutical Research, 21, 191–200.
Velardi, S. A., Barresi, A. A. (2008). Development of simplified models for the freeze‐
drying process and investigation of the optimal operating conditions. Chemical
Engineering Research & Design, 86, 9‐22.
23
List of Tables
Table 1 Characteristic temperatures of some aqueous solutions investigated.
Table 2 Operating conditions for some freeze‐drying cycles.
Table 3 Influence of the drying temperature on some characteristics of the
product and on the process time for pure substances.
Table 4 Influence of the drying temperature on some characteristics of the
product and on the process time for binary mixtures.
24
List of Figures
Figure 1 Comparison of XRD spectra of various freeze‐dried solutions of
mannitol‐dextran 20% by weight with variable mannitol
concentration: (a) 20% by weight of mannitol, (b) 10% mannitol +
10% dextran, (c) 8% mannitol + 12% dextran, (d) 6% mannitol + 14
dextran, (e) 4% mannitol +16 dextran, (f) 2% mannitol +18% dextran,
(g) 20% dextran.
Figure 2 Product temperature evolution and cryostat set‐point (dashed line)
in the T2 cycle for the 8% sucrose ‐ 2% dextran mixture. The Tgʹ is
shown (dotted line).
Figure 3 Cake structure for some of the investigated samples (Scanning
Electron Microscope, metallised samples):
a) detail of the top of the sample, with the button and the vitreous
thin layer that appears in the run close to collapse temperature
(mannitol 4% ‐ dextran 6% mixture);
b) detail of the product dried above the collapse temperature
(mannitol 6% ‐ dextran 14% mixture);
c) structure of the 4% mannitol ‐ 6% dextran matrix;
d) detail of previous sample, evidencing the mannitol crystals
embedded in the porous matrix;
e) detail of the 10% mannitol ‐ 10% dextran mixture, with the
mannitol crystal emerging from the amorphous matrix;
f) structure of the 6% mannitol ‐ 14% dextran mixture, in which a
small fraction of crystalline mannitol is present;
g) structure of the 20% dextran solution, amorphous;
h) detail of structure of the crystalline mannitol (20%).
25
Figure 4 Influence of the process temperature on the rehydratability of single
excipients. Upper graph: 10% sucrose solution; lower graph: 10 %
(filled symbols) and 20% (open symbols) dextran solution. , : Tl
cycle; : T2 cycle; ,: T3 cycle.
Figure 5 Rehydratability of pure substances: , sucrose; , mannitol; ,
dextran. T1 cycle, 10% solution.
Figure 6 Rehydratability of binary mixtures of sucrose‐dextran and of
mannitol dextran freeze‐dried with different cycles. : Tl cycle; : T2
cycle; : T3 cycle.
Figure 7 Comparison between the rehydration rate of the sucrose‐dextran
binary mixtures and that of the constituents. Open symbol: pure
components (: dextran 10%; : sucrose 10%); filled symbol:
mixtures (: 2% sucrose – 8% dextran; : 8% sucrose – 2% dextran).
Upper graph: T1 cycle; middle graph: T2 cycle; lower graph: T3 cycle.
Figure 8 Comparison between the rehydration rate of a mannitol‐dextran
mixture and that of pure dextran. : 20% dextran; : 6% mannitol –
14% dextran. Upper graph: Tl cycle; lower graph: T3 cycle.
Figure 9 Variation of the apparent density (upper graph) and of the residual
moisture (lower graph) with the sucrose concentration in the
sucrose‐dextran mixture at different process temperatures : Tl
cycle; : T2 cycle; : T3 cycle.
Figure 10 Plate temperature (upper graph), weight loss (middle graph) and
26
sublimation rate (lower graph) for a binary mixture (2% sucrose – 8%
dextran) with different drying cycles. ____: Tl cycle; ······: T2 cycle; ‐‐‐‐‐:
T3 cycle.
Figure 11 Comparison between the temperatures of the product (graphs A1,
A2 and A3), the sublimation rates of sucrose‐dextran binary mixtures
and those of the pure components as a function of time (graphs B1,
B2 and B3) and as a function of the progress of primary drying
(graphs C1, C2 and C3) for different thermal cycles. Open symbol:
pure components (: dextran 10%; : sucrose 10%); filled symbol:
mixtures (: 2% sucrose – 8% dextran; : 8% sucrose – 2% dextran).
Graphs A1, B1 and C1: T1 cycle; graphs A2, B2 and C2: T2 cycle;
graphs A3, B3 and C3: T3 cycle.
Figure 12 Comparison between the temperatures of the product (graphs A1,
A2 and A3), the sublimation rates of mannitol and mannitol‐dextran
mixture vs. time (graphs B1, B2 and B3) and vs. the progress of
primary drying (graphs C1, C2 and C3) for different thermal cycles
(: dextran 20%, : 6% mannitol – 14% dextran). Graphs A1, B1 and
C1: T1 cycle; graphs A2, B2 and C2: T2 cycle; graphs A3, B3 and C3: T3
cycle.
27
Table 1
w/w % Tcs Tm Tg’ structure
Mannitol 10% ‐38°C ‐21.5°C n.a. crystalline
Dextran 10% ‐20°C n.a. ‐9°C amorphous
Dextran 20% ‐24°C n.a. ‐9°C amorphous
Sucrose 10% ‐36°C n.a. ‐33°C amorphous
Mannitol 2% + Dextran 18% ‐42°C n.a. ‐13°C amorphous
Mannitol 6% + Dextran 14% ‐34°C n.a. ‐15°C amorphous matrix including
crystalline mannitol
Sucrose 2% + Dextran 8% ‐32°C n.a. ‐18°C amorphous
Sucrose 8% + Dextran 2% ‐34°C n.a. ‐28°C amorphous
n.a. = not available
28
Table 2
T1 cycle T2 cycle
Set point T, °C Duration, h Set point T, °C Duration, h
‐50 3 ‐50 3
apply vacuum apply vacuum
‐50 25 ‐32 15
Sucrose 10%
(Tgʹ = ‐33°C)
25 20 25 5
‐50 2 ‐50 3
apply vacuum apply vacuum
‐20 10 ‐12 16
‐10 17 25 20
Mannitol 6%
Dextran 14%
(Tgʹ = ‐15°C)
25 24 25 20
‐50 5 ‐50 5
apply vacuum apply vacuum
‐25 15 ‐16 18
‐20 2 25 6
Sucrose 2%
Dextran 8%
(Tgʹ = ‐18°C)
25 24 25 6
29
Table 3
Pure substance Apparent
density, g cm‐3
Residual
moisture, %
Rehydratability
t95, min
primary
drying, h
secondary
drying, h
T1 0.097 0.29 10 20 20Sucrose
10% T3 0.134 0.12 20 6 9
T1 0.142 0.10 4 7 15Dextran
10% T3 0.190 0.18 15 5 7
T1 0.406 n.a. 10 12 26Dextran
20% T3 0.432 0.30 25 5 13
Mannitol
10% T1 0.092 n.a. 8 15 20
n.a. = not available
30
Table 4
Binary solution Apparent
density, g cm‐3
Residual
moisture, %
Rehydratability
t95, min
primary
drying, h
secondary
drying, h
T1 0.186 0.18 10 n.a. n.a.
T2 0.210 0.14 16 9 10
Man‐Dex
6‐14%
T3 0.240 0.9 n.a. 7 9
T1 0.151 0.19 5 12 28
T2 0.198 0.35 15 6 8
Sucr‐Dex
2‐8%
T3 0.238 0.5 20 5 13
T1 0.314 0.28 2 n.a. n.a.
T2 0.338 0.3 5 9 11
Sucr‐Dex
8‐2%
T3 0.391 0.9 18 8 10
n.a. = not available
31
Figure 1
(c)
(b)
(a)
(d)
10 20 30 40 50 600
(e)
(f)
2, degrees
Intensity, arbitrary units
(g)
32
Figure 2
0 5 10 15 20 25-60
-40
-20
0
20
40
Tg'
productcryostat set-point
Time, h
Tem
pera
ture
, °C
33
Figure 3
34
Figure 4
0.0
0.2
0.4
0.6
0.8
1.0
dextran
sucrose
C/C
max
0 5 10 15 20 250.0
0.2
0.4
0.6
0.8
1.0
Time, min
C/C
max
35
Figure 5
0 5 10 150.0
0.2
0.4
0.6
0.8
1.0
Time, min
C/C
max
36
Figure 6
0.0
0.2
0.4
0.6
0.8
1.0
mannitol-dextran 6-14%
sucrose-dextran 8-2%
sucrose-dextran 2-8%
A
/Am
ax
0.0
0.2
0.4
0.6
0.8
1.0
A/A
max
0 5 10 15 20 250.0
0.2
0.4
0.6
0.8
1.0
Time, min
A/A
max
37
Figure 7
0.0
0.2
0.4
0.6
0.8
1.0
T3
T2
T1
A/A
max
0.0
0.2
0.4
0.6
0.8
1.0
A/A
max
0 5 10 15 20 250.0
0.2
0.4
0.6
0.8
1.0
Time, min
A/A
max
38
Figure 8
0.0
0.2
0.4
0.6
0.8
1.0
T3
T1
A/A
max
0 5 10 15 20 250.0
0.2
0.4
0.6
0.8
1.0
Time, min
A/A
max
39
Figure 9
1x10⁻⁴
2x10⁻⁴
3x10⁻⁴
4x10⁻⁴
Ap
par
ent
den
sity
,
kg c
m-3
0 2 4 6 8 100.0
0.2
0.4
0.6
% Sucrose
% R
esid
ual
m
oist
ure
40
Figure 10
-40-30-20-10
01020
020406080
100
Wei
ght
loss
, %
0 5 10 150
1x10⁻⁴
2x10⁻⁴
3x10⁻⁴
Su
blim
atio
n r
ate,
kg
s-1m
-2
Time, h
Pla
te t
emp
erat
ure
, °C
41
Figure 11
-40
-20
0
20
Tem
per
atu
re, °
C
0
1x10⁻⁴
2x10⁻⁴
3x10⁻⁴
-40
-20
0
20
0
1x10⁻⁴
2x10⁻⁴
3x10⁻⁴
0 5 10 15 20 25
-40
-20
0
20
Time, h0 5 10 15 20 25
Time, h0 20 40 60 80 100
0
1x10⁻⁴
2x10⁻⁴
3x10⁻⁴
Sub
lmat
ion
rate
, kg
s-1 m
-2
Progress of primary drying, %
(A1) (B1) (C1)
(A2) (B2) (C2)
(A3) (B3) (C3)
42
Figure 12
-50-40-30-20-10
0
Tem
per
atur
e, °
C
(A1)(A1)
(A2)
(A3)
(B1)
(B2)
(B3)
0
1x10⁻⁴
2x10⁻⁴
3x10⁻⁴
(C1)
(C2)
(C3)
-50-40-30-20-10
0 (A2)
0
1x10⁻⁴
2x10⁻⁴
3x10⁻⁴
0 5 10 15 20 25
-50-40-30-20-10
0(A3)
Time, h0 5 10 15 20 25
Time, h0 20 40 60 80 100
0
1x10⁻⁴
2x10⁻⁴
3x10⁻⁴
Sub
lmat
ion
rat
e, k
g s-1
m-2
Progress of primary drying, %


